As filed with the Securities and Exchange Commission on January 8, 2015
UNITED STATES
SECURITIES AND EXCHANGE COMMISSION
Washington, D.C. 20549
FORM N-CSR
CERTIFIED SHAREHOLDER REPORT OF REGISTERED
MANAGEMENT INVESTMENT COMPANIES
Investment Company Act file number (811-07168)
Hennessy Funds Trust
(Exact name of registrant as specified in charter)
7250 Redwood Blvd., Suite 200
Novato, CA 94945
(Address of principal executive offices) (Zip code)
Neil J. Hennessy
7250 Redwood Blvd., Suite 200
Novato, CA 94945
(Name and address of agent for service)
800-966-4354
Registrant’s telephone number, including area code
Date of fiscal year end: October 31, 2014
Date of reporting period: October 31, 2014 Item 1. Reports to Stockholders.
ANNUAL REPORT
OCTOBER 31, 2014
HENNESSY CORNERSTONE
GROWTH FUND
Investor Class HFCGX
Institutional Class HICGX
hennessyfunds.com | 1-800-966-4354
(This Page Intentionally Left Blank.)
Contents
| Letter to Shareholders | 2 |
| Performance Overview | 4 |
| Financial Statements | |
| Schedule of Investments | 7 |
| Statement of Assets and Liabilities | 12 |
| Statement of Operations | 13 |
| Statements of Changes in Net Assets | 15 |
| Financial Highlights | 16 |
| Notes to the Financial Statements | 20 |
| Report of Independent Registered Public Accounting Firm | 28 |
| Trustees and Officers of the Fund | 29 |
| Expense Example | 34 |
| Proxy Voting | 36 |
| Quarterly Filings on Form N-Q | 36 |
| Householding | 36 |
| Privacy Policy | 37 |
HENNESSY FUNDS 1-800-966-4354
December 2014
Dear Shareholder:
As I look back at 2014, I realize that in this age of rapidly evolving technology, information is delivered and absorbed so quickly that it is difficult to remember what happened last week, let alone what’s happened over the course of an entire year. That is why I’d like to take a moment to recall some of the year’s highs and lows, economically, politically and socially, here in the U.S. and around the globe. 2014 was scarred by political partisanship, civil unrest in the U.S., Ukraine and many other countries, the arrival of terrorist group ISIS, the tragedies of school shootings and natural disasters, and the frightening outbreak of Ebola. However, there were also positive events this year: we survived a government shutdown over healthcare reform, jobs reports have been consistently, albeit anemically, improving, and home prices remained relatively stable, after recovering significantly in 2013. And, important to us here at Hennessy, our hometown team, the San Francisco Giants, won their third World Series in just five years!
A significant event for the financial industry this past year was the confirmation of Janet Yellen as Chair of the Federal Reserve, which served to calm the nerves of business and political leaders alike. I believe Yellen’s leadership will benefit U.S. business owners, as the Fed continues to be a voice of reason in a sea of political and economic rhetoric. The Fed has also supported the economy and corporate America by helping keep interest rates reasonable and low.
The stock market has continued its determined comeback from the lows of 2009, setting multiple record highs in recent months. The U.S. financial markets have provided strong returns over the past twelve-month period ended October 31, 2014, with the Dow Jones Industrial Average (DJIA) returning over 14% and S&P 500 Index returning over 17% during the period. The DJIA currently has a dividend yield of 2.2%, which is equal to that of a 10-Year U.S. Treasury, which is currently also yielding 2.2%. I continue to believe that investments in high-yielding, high-quality stocks have the potential to not only provide income but also the potential for stock price appreciation as well. Fixed income investing has run its course, in my opinion, and many individuals are currently benefiting from the return to investing in equities that possess strong fundamentals. American investors are slowly migrating from fixed income to equities. Currently, 54% of Americans invest in stocks, and I do expect this percentage to increase, especially if interest rates move higher.
For the past several years, U.S. corporations have been driving shareholder value by making acquisitions, initiating and raising dividends, investing in internal infrastructure and buying back stock. However, this year I began to see a shift from those strategies. I believe the easier to execute acquisitions are a thing of the past, and firms now have to be even more creative to execute accretive deals. I also believe that while firms may continue to initiate dividends, fewer firms will raise their dividends and fewer firms will participate in stock buyback programs going forward. What will these cash-rich companies do with their capital if they are not raising dividends or buying back stock? I believe they may begin to initiate capital expenditure programs that could truly benefit economic growth.
Liquidity and monetary conditions are supportive, causing the cost of capital to be very low. I believe firms will choose to spend capital to expand their sales, and they may even begin to hire in earnest. Once a company begins to move in this way, the cost to
defer becomes real for competitors. With almost $3 trillion in cash and short-term investments sitting on the balance sheets of the S&P 500 companies, a strategic shift by firms to spend their idle capital, while slow, could potentially further economic growth in the U.S. in my opinion.
Economic progress and growth remain slow, yet steady, and unemployment, though improving, remains high. Oil prices have fallen, giving consumers a bit more discretionary income. While the midterm elections may not end all of the gridlock in Washington, hopefully we will receive clarity on the political headwinds of taxes and regulations, which have not improved over the past several years.
The markets have had several quarters without any truly significant downturn. The pullbacks we recently experienced, most notably in July and October, were short-lived, as evidenced by the quick rebound to record high market levels. I firmly believe that we are in a secular bull market, and I continue to tell investors to try to remain calm in the face of volatility and continue to focus on the strong, long-term fundamentals that are evident in the market today. Many companies continue to have strong balance sheets, with record cash flows and profits. With this current bull market in its fifth year, investors should expect some volatility.
I am encouraged by the strong returns for the major U.S. financial market indices and by the performance of the Hennessy Funds over the past year. Thank you for your continued confidence and investment in our products. If you have any questions or would like to speak with us directly, please don’t hesitate to call us at (800) 966-4354.
Best regards,
Neil J. Hennessy
President and Chief Investment Officer
Past performance does not guarantee future results.
Mutual fund investing involves risk. Principal loss is possible.
Opinions expressed are those of Neil Hennessy and are subject to change, are not guaranteed and should not be considered investment advice.
The Dow Jones Industrial Average and S&P 500 Index are unmanaged indices commonly used to measure the performance of U.S. stocks. One cannot invest directly in an index.
Cash flow can be used as an indication of a company’s financial strength. A firm’s cash flow is the movement of cash in and out of the firm in the form of payments to suppliers and collections from customers. Dividend Yield is calculated as the annual dividends paid by a company divided by the price of a share of their stock.
HENNESSY FUNDS 1-800-966-4354
Performance Overview (Unaudited)
The opinions expressed in the following commentary reflect those of the Portfolio Managers as of the date written. Any such opinions are subject to change based on market or other conditions and are not guaranteed. These opinions may not be relied upon as investment advice. Investment decisions for the Fund are based on multiple factors, and may not be relied upon as an indication of trading intent on behalf of the Fund. Security positions can and do change.
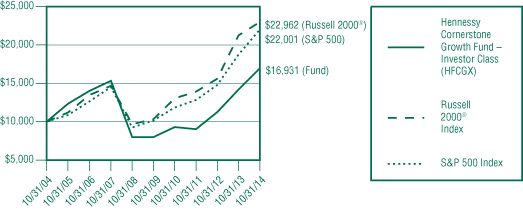
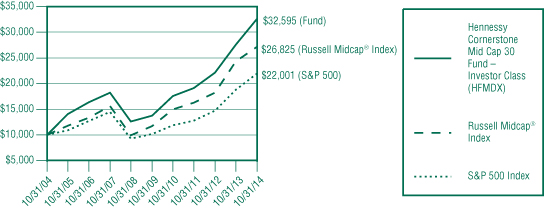
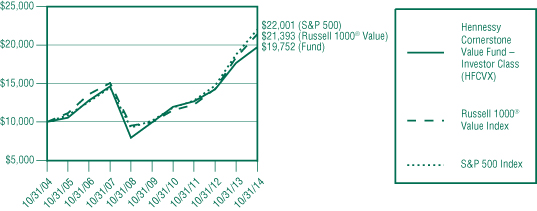
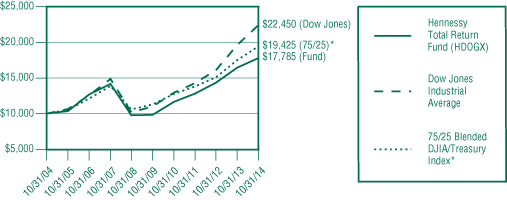
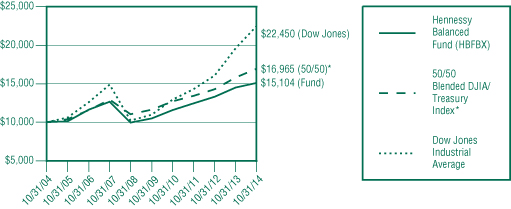
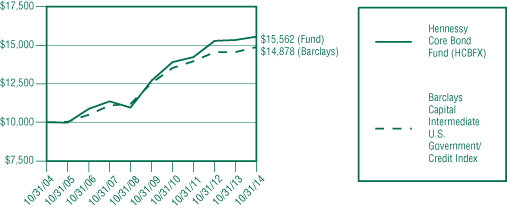
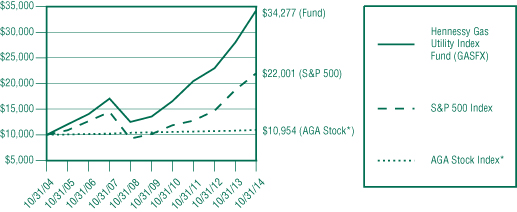
CHANGE IN VALUE OF $10,000 INVESTMENT
This chart assumes an initial gross investment of $10,000 made on October 31, 2004. Returns shown include the reinvestment of all dividends. Returns shown do not reflect the deduction of taxes that a shareholder would pay on Fund distributions or the redemption of Fund shares.
AVERAGE ANNUAL TOTAL RETURN FOR PERIODS ENDED OCTOBER 31, 2014
| | One | Five | Ten |
| | Year | Years | Years |
| Hennessy Cornerstone Growth Fund – | | | |
| Investor Class (HFCGX) | 19.36% | 16.22% | 5.41% |
| Hennessy Cornerstone Growth Fund – | | | |
Institutional Class (HICGX)(1) | 19.70% | 16.58% | 5.63% |
Russell 2000® Index | 8.06% | 17.39% | 8.67% |
| S&P 500 Index | 17.27% | 16.69% | 8.20% |
Expense ratios: 1.29% (Investor Class); Gross 1.11%, Net 0.98%(2) (Institutional Class)
Performance data quoted represents past performance; past performance does not guarantee future results. The investment return and principal value of an investment will fluctuate so that an investor’s shares, when redeemed, may be worth more or less than their original cost. Current performance of the Fund may be lower or higher than the performance quoted. Performance data current to the most recent month end may be obtained by visiting hennessyfunds.com.
The expense ratios presented are from the most recent prospectus.
| (1) | The inception date of the Institutional Class shares is March 3, 2008. Performance shown prior to the inception of the Institutional Class shares reflects the performance of the Investor Class shares and includes expenses that are not applicable to and are higher than those of the Institutional Class shares. |
| (2) | With regard to Institutional Class shares, the Fund’s investment advisor has contractually agreed to waive a portion of its expenses indefinitely. |
PERFORMANCE NARRATIVE
Portfolio Managers Neil Hennessy and Brian Peery
Over the previous twelve months, how did the Fund perform and what factors contributed to this performance?
For the twelve-month period ended October 31, 2014, the Investor Class of the Hennessy Cornerstone Growth Fund returned 19.36%, significantly outperforming the Russell 2000® Index and the Morningstar Small Blend Category Average, which returned 8.06% and 7.66%, respectively, and also outperforming the S&P 500 Index, which returned 17.27% for the same period.
We are very pleased with the overall performance of the Fund during the previous twelve months versus its benchmarks. While the Fund’s relative outperformance was actually hampered by the sector allocation, stock selection more than made up the difference and was the primary driver of the Fund’s performance. The biggest contribution to the Fund’s outperformance versus its benchmarks was in the Industrial sector, where the Fund’s stock selection amounted to roughly half of the outperformance relative to the Russell 2000® Index. The largest detractor to the Fund’s performance was its slight overweighting in the Energy sector.
Additional Portfolio Manager commentary and related investment outlook:
We noted in the most recent semi-annual report that the Russell 2000® Index had dropped below its 200-day moving average, which is a negative if you own momentum stocks in the small-cap arena. Combine that with the general underperformance of small-cap stocks versus large-cap stocks, and the recent market correction and one would surely have thought it would be a difficult time for the portfolio. However, by adhering to our strict investment methodology, which includes keeping only a small portion of the Fund’s assets in cash, the performance of the Fund rebounded quickly, alongside the market. Fortunately, the stocks within the portfolio performed extremely well, in large part due to our “growth at a reasonable price” stock selection approach. By only buying stocks whose price-to-sales ratio is below 1.5, we were able to side step a good deal of the volatility seen in high multiple stocks and deliver strong performance for the year.
We continue to believe that the economy has been progressing nicely and one need only take a quick reflection on the overall economy to see the potential opportunities. As it stands currently, corporate profits are at record highs, companies have been adding over 200,000 jobs a month, the unemployment rate is at its lowest level in over six years, and GDP is improving faster than many expected. Add to that declining oil prices, a healthy housing market and a healthy stock market and there are a lot of positive factors that lead us to believe the five-year bull market we have enjoyed is sustainable for the next couple of years.
We continue to see positive signs in both revenue growth and the all-important corporate capital expenditures levels. Over the last twelve months, we have seen a slight disconnect between earnings and revenues, with earnings showing healthy gains, largely due to cost containment, while revenue growth lagged. With few cost cuts seemingly left to be made, companies appear to be beginning to utilize their healthy balance sheets to focus on organic growth, which we expect will drive corporate spending higher. In fact, we anticipate the U.S. economy will expand nicely over the next 12 to 18 months and that the markets should benefit from this flow of capital. While excess cash has largely been directed toward acquisitions, increasing dividends, and/or stock buybacks recently, we believe this shift in corporate spending has the potential to reward shareholders over the longer term.
We are confident that there are opportunities in the small-cap and mid-cap space, especially in some of the more cyclical sectors. We believe the cyclical companies, which
HENNESSY FUNDS 1-800-966-4354
are those companies most sensitive to economic growth, should do well as the economy continues to improve. The Fund is currently overweight cyclical stocks versus its benchmarks and will remain so until its portfolio is rebalanced and perhaps beyond.
The Russell 2000® Index is an unmanaged index commonly used to measure the performance of U.S. small-cap stocks. The S&P 500 is an index commonly used to measure the performance of U.S. stocks. You cannot invest directly in an index. Performance data for an index does not reflect any deductions for fees, expenses or taxes. The Fund invests in small- and medium-capitalization companies, which may have limited liquidity and greater price volatility than large-capitalization companies. Investments in foreign securities involve greater volatility and political, economic and currency risk and differences in accounting methods. Fund holdings and sector allocations are subject to change. Please refer to the Schedule of Investments included in this report for additional portfolio information.
Price-to-sales ratio is a tool for calculating a stock’s valuation relative to other companies. It is calculated by dividing a stock’s current price by its revenue per share.
Each Morningstar category average represents a universe of funds with similar investment objectives. ©Morningstar, Inc. All Rights Reserved. The information contained herein: 1) is proprietary to Morningstar; 2) may not be copied or distributed and 3) is not warranted to be accurate, complete or timely. Neither Morningstar nor its content providers are responsible for any damages or losses arising from any use of this information. Past performance does not guarantee future results.
Financial Statements
HENNESSY CORNERSTONE GROWTH FUND
As of October 31, 2014
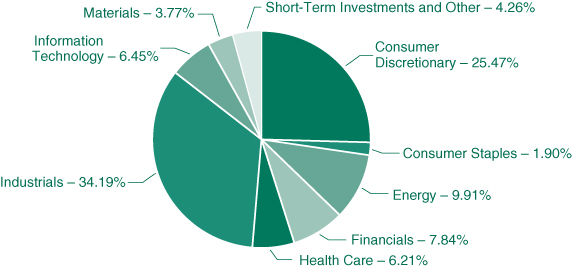
(% of Net Assets)
| TOP TEN HOLDINGS (EXCLUDING CASH/CASH EQUIVALENTS) | % NET ASSETS |
| Southwest Airlines Co. | 2.87% |
| Core-Mark Holding Co., Inc. | 2.66% |
| Universal Insurance Holdings, Inc. | 2.59% |
| Super Micro Computer, Inc. | 2.58% |
| Tuesday Morning Corp. | 2.56% |
| Green Plains Renewable Energy, Inc. | 2.45% |
| Jack In The Box, Inc. | 2.39% |
| Alaska Air Group, Inc. | 2.37% |
| Targa Resources Corp. | 2.36% |
| United Rentals, Inc. | 2.35% |
Note: For presentation purposes, the Fund has grouped some of the industry categories. For purposes of categorizing securities for compliance with Section 8(b)(1) of the Investment Company Act of 1940, the Fund uses more specific industry classifications.
HENNESSY FUNDS 1-800-966-4354
| | COMMON STOCKS – 94.05% | | Number | | | | | | % of | |
| | | | of Shares | | | Value | | | Net Assets | |
| | Consumer Discretionary – 25.47% | | | | | | | | | |
| | Advance Auto Parts, Inc. | | | 35,400 | | | $ | 5,202,384 | | | | 2.05 | % |
| | Carmike Cinemas, Inc. (a) | | | 156,327 | | | | 5,010,281 | | | | 1.98 | % |
| | Core-Mark Holding Co., Inc. | | | 116,044 | | | | 6,734,033 | | | | 2.66 | % |
| | G-III Apparel Group, Ltd. (a) | | | 66,600 | | | | 5,284,710 | | | | 2.09 | % |
| | Jack In The Box, Inc. | | | 85,100 | | | | 6,045,504 | | | | 2.39 | % |
| | Jarden Corp. (a) | | | 74,900 | | | | 4,875,241 | | | | 1.92 | % |
| | La-Z-Boy, Inc. | | | 163,600 | | | | 3,739,896 | | | | 1.48 | % |
| | MDC Partners, Inc. (b) | | | 178,197 | | | | 3,688,678 | | | | 1.46 | % |
| | Papa Johns International, Inc. | | | 92,600 | | | | 4,329,976 | | | | 1.71 | % |
| | The Goodyear Tire & Rubber Co. | | | 166,100 | | | | 4,024,603 | | | | 1.59 | % |
| | The New York Times Co. | | | 310,700 | | | | 3,989,388 | | | | 1.58 | % |
| | Tuesday Morning Corp. (a) | | | 318,011 | | | | 6,484,244 | | | | 2.56 | % |
| | Visteon Corp. (a) | | | 54,000 | | | | 5,070,600 | | | | 2.00 | % |
| | | | | | | | | 64,479,538 | | | | 25.47 | % |
| | | | | | | | | | | | | | |
| | Consumer Staples – 1.90% | | | | | | | | | | | | |
| | Tyson Foods, Inc., Class A | | | 119,400 | | | | 4,817,790 | | | | 1.90 | % |
| | | | | | | | | | | | | | |
| | Energy – 8.22% | | | | | | | | | | | | |
| | Exterran Holdings, Inc. | | | 124,800 | | | | 4,908,384 | | | | 1.94 | % |
| | Green Plains Renewable Energy, Inc. | | | 181,100 | | | | 6,193,620 | | | | 2.45 | % |
| | Matrix Service Co. (a) | | | 148,927 | | | | 3,732,111 | | | | 1.47 | % |
| | Targa Resources Corp. | | | 46,500 | | | | 5,981,295 | | | | 2.36 | % |
| | | | | | | | | 20,815,410 | | | | 8.22 | % |
| | | | | | | | | | | | | | |
| | Financials – 7.84% | | | | | | | | | | | | |
| | BGC Partners, Inc. | | | 639,173 | | | | 5,420,187 | | | | 2.14 | % |
| | CNO Financial Group, Inc. | | | 245,300 | | | | 4,447,289 | | | | 1.76 | % |
| | LPL Financial Holdings, Inc. | | | 82,900 | | | | 3,431,231 | | | | 1.35 | % |
| | Universal Insurance Holdings, Inc. | | | 374,700 | | | | 6,557,250 | | | | 2.59 | % |
| | | | | | | | | 19,855,957 | | | | 7.84 | % |
| | | | | | | | | | | | | | |
| | Health Care – 6.21% | | | | | | | | | | | | |
| | Alere, Inc. (a) | | | 126,600 | | | | 5,060,202 | | | | 2.00 | % |
| | CIGNA Corp. | | | 58,800 | | | | 5,854,716 | | | | 2.31 | % |
| | MWI Veterinary Supply, Inc. (a) | | | 28,300 | | | | 4,801,236 | | | | 1.90 | % |
| | | | | | | | | 15,716,154 | | | | 6.21 | % |
The accompanying notes are an integral part of these financial statements.
| | COMMON STOCKS | | Number | | | | | | % of | |
| | | | of Shares | | | Value | | | Net Assets | |
| | Industrials – 34.19% | | | | | | | | | |
| | Aceto Corp. | | | 236,884 | | | $ | 5,386,742 | | | | 2.13 | % |
| | Alaska Air Group, Inc. | | | 112,600 | | | | 5,993,698 | | | | 2.37 | % |
| | Curtiss Wright Corp. | | | 70,200 | | | | 4,858,542 | | | | 1.92 | % |
| | Delta Air Lines, Inc. | | | 142,700 | | | | 5,740,821 | | | | 2.27 | % |
| | Engility Holdings, Inc. (a) | | | 109,846 | | | | 4,745,347 | | | | 1.87 | % |
| | Huntington Ingalls Industries, Inc. | | | 46,900 | | | | 4,962,958 | | | | 1.96 | % |
| | John Bean Technologies Corp. | | | 152,186 | | | | 4,561,015 | | | | 1.80 | % |
| | L-3 Communications Holdings, Inc. | | | 39,600 | | | | 4,809,816 | | | | 1.90 | % |
| | Lennox International, Inc. | | | 50,600 | | | | 4,499,352 | | | | 1.77 | % |
| | Lockheed Martin Corp. | | | 28,000 | | | | 5,335,960 | | | | 2.11 | % |
| | Northrop Grumman Corp. | | | 37,600 | | | | 5,187,296 | | | | 2.05 | % |
| | Primoris Services Corp. | | | 136,200 | | | | 3,911,664 | | | | 1.54 | % |
| | Raytheon Co. | | | 47,000 | | | | 4,882,360 | | | | 1.93 | % |
| | Southwest Airlines Co. | | | 211,000 | | | | 7,275,280 | | | | 2.87 | % |
| | The Manitowoc Co., Inc. | | | 155,500 | | | | 3,240,620 | | | | 1.28 | % |
| | United Continental Holdings, Inc. (a) | | | 99,200 | | | | 5,238,752 | | | | 2.07 | % |
| | United Rentals, Inc. (a) | | | 54,100 | | | | 5,954,246 | | | | 2.35 | % |
| | | | | | | | | 86,584,469 | | | | 34.19 | % |
| | | | | | | | | | | | | | |
| | Information Technology – 6.45% | | | | | | | | | | | | |
| | CSG Systems International, Inc. | | | 166,600 | | | | 4,416,566 | | | | 1.74 | % |
| | Hewlett-Packard Co. | | | 150,000 | | | | 5,382,000 | | | | 2.13 | % |
| | Super Micro Computer, Inc. (a) | | | 204,700 | | | | 6,542,212 | | | | 2.58 | % |
| | | | | | | | | 16,340,778 | | | | 6.45 | % |
| | | | | | | | | | | | | | |
| | Materials – 3.77% | | | | | | | | | | | | |
| | AK Steel Holding Corp. (a) | | | 653,100 | | | | 4,943,967 | | | | 1.95 | % |
| | PolyOne Corp. | | | 124,300 | | | | 4,600,343 | | | | 1.82 | % |
| | | | | | | | | 9,544,310 | | | | 3.77 | % |
| | | | | | | | | | | | | | |
| | Total Common Stocks | | | | | | | | | | | | |
| | (Cost $193,157,779) | | | | | | | 238,154,406 | | | | 94.05 | % |
| | | | | | | | | | | | | | |
| | RIGHTS – 0.00% | | | | | | | | | | | | |
| | Health Care – 0.00% | | | | | | | | | | | | |
| | Forest Laboratories, Inc. (a)(c) | | | 5,500 | | | | 5,225 | | | | 0.00 | % |
| | | | | | | | | | | | | | |
| | Total Rights | | | | | | | | | | | | |
| | (Cost $0) | | | | | | | 5,225 | | | | 0.00 | % |
The accompanying notes are an integral part of these financial statements.
HENNESSY FUNDS 1-800-966-4354
| | PARTNERSHIPS – 1.69% | | Number | | | | | | % of | |
| | | | of Shares | | | Value | | | Net Assets | |
| | Energy – 1.69% | | | | | | | | | |
| | NGL Energy Partners LP | | | 124,279 | | | $ | 4,270,226 | | | | 1.69 | % |
| | | | | | | | | | | | | | |
| | Total Partnerships | | | | | | | | | | | | |
| | (Cost $4,197,531) | | | | | | | 4,270,226 | | | | 1.69 | % |
| | | | | | | | | | | | | | |
| | SHORT-TERM INVESTMENTS – 4.00% | | | | | | | | | | | | |
| | Money Market Funds – 4.00% | | | | | | | | | | | | |
| | Fidelity Government Portfolio – | | | | | | | | | | | | |
| | Institutional Class, 0.01% (d) | | | 10,129,106 | | | | 10,129,106 | | | | 4.00 | % |
| | | | | | | | | | | | | | |
| | Total Short-Term Investments | | | | | | | | | | | | |
| | (Cost $10,129,106) | | | | | | | 10,129,106 | | | | 4.00 | % |
| | | | | | | | | | | | | | |
| | Total Investments | | | | | | | | | | | | |
| | (Cost $207,484,416) – 99.74% | | | | | | | 252,558,963 | | | | 99.74 | % |
| | Other Assets in | | | | | | | | | | | | |
| | Excess of Liabilities – 0.26% | | | | | | | 666,661 | | | | 0.26 | % |
| | TOTAL NET ASSETS – 100.00% | | | | | | $ | 253,225,624 | | | | 100.00 | % |
Percentages are stated as a percent of net assets.
| (a) | Non-income producing security. |
| (b) | U.S. traded security of a foreign corporation. |
| (c) | Security is fair valued in good faith. |
| (d) | The rate listed is the fund’s 7-day yield as of October 31, 2014. |
The accompanying notes are an integral part of these financial statements.
Summary of Fair Value Exposure at October 31, 2014
The following is a summary of the inputs used to value the Fund’s net assets as of October 31, 2014 (See Note 3 in the accompanying notes to the financial statements):
| Common Stocks | | Level 1 | | | Level 2 | | | Level 3 | | | Total | |
| Consumer Discretionary | | $ | 64,479,538 | | | $ | — | | | $ | — | | | $ | 64,479,538 | |
| Consumer Staples | | | 4,817,790 | | | | — | | | | — | | | | 4,817,790 | |
| Energy | | | 20,815,410 | | | | — | | | | — | | | | 20,815,410 | |
| Financials | | | 19,855,957 | | | | — | | | | — | | | | 19,855,957 | |
| Health Care | | | 15,716,154 | | | | — | | | | — | | | | 15,716,154 | |
| Industrials | | | 86,584,469 | | | | — | | | | — | | | | 86,584,469 | |
| Information Technology | | | 16,340,778 | | | | — | | | | — | | | | 16,340,778 | |
| Materials | | | 9,544,310 | | | | — | | | | — | | | | 9,544,310 | |
| Total Common Stocks | | $ | 238,154,406 | | | $ | — | | | $ | — | | | $ | 238,154,406 | |
| Rights | | | | | | | | | | | | | | | | |
| Health Care | | $ | — | | | $ | — | | | $ | 5,225 | | | $ | 5,225 | |
| Total Rights | | $ | — | | | $ | — | | | $ | 5,225 | * | | $ | 5,225 | |
| Partnerships | | | | | | | | | | | | | | | | |
| Energy | | $ | 4,270,226 | | | $ | — | | | $ | — | | | $ | 4,270,226 | |
| Total Partnerships | | $ | 4,270,226 | | | $ | — | | | $ | — | | | $ | 4,270,226 | |
| Short-Term Investments | | | | | | | | | | | | | | | | |
| Money Market Funds | | $ | 10,129,106 | | | $ | — | | | $ | — | | | $ | 10,129,106 | |
| Total Short-Term Investments | | $ | 10,129,106 | | | $ | — | | | $ | — | | | $ | 10,129,106 | |
| Total Investments | | $ | 252,553,738 | | | $ | — | | | $ | 5,225 | | | $ | 252,558,963 | |
* Acquired in merger.
Transfers between levels are recognized at the end of the reporting period. During the one-year period ended October 31, 2014, the Fund recognized no transfers between levels.
Level 3 Reconciliation Disclosure
Following is a reconciliation of Level 3 assets for which significant unobservable inputs were used to determine fair value.
| | | Rights | |
| Balance as of October 31, 2013 | | $ | 5,225 | |
| Accrued discounts/premiums | | | — | |
| Realized gain (loss) | | | — | |
| Change in unrealized appreciation (depreciation) | | | — | |
| Purchases | | | — | |
| (Sales) | | | — | |
| Transfer in and/or out of Level 3 | | | — | |
| Balance as of October 31, 2014 | | $ | 5,225 | |
| | | | | |
| Change in unrealized appreciation/depreciation during the period for | | | | |
| Level 3 investments held at October 31, 2014 | | $ | — | |
The Level 3 investments as of October 31, 2014 represented 0.00% of net assets and did not warrant a disclosure of significant unobservable valuation inputs.
The accompanying notes are an integral part of these financial statements.
HENNESSY FUNDS 1-800-966-4354
Financial Statements
Statement of Assets and Liabilities as of October 31, 2014 |
| ASSETS: | | | |
| Investments in securities, at value (cost $207,484,416) | | $ | 252,558,963 | |
| Dividends and interest receivable | | | 44,107 | |
| Receivable for fund shares sold | | | 1,024,070 | |
| Return of capital receivable | | | 75,655 | |
| Prepaid expenses and other assets | | | 22,624 | |
| Total Assets | | | 253,725,419 | |
| | | | | |
| LIABILITIES: | | | | |
| Payable for fund shares redeemed | | | 184,957 | |
| Payable to advisor | | | 146,919 | |
| Payable to administrator | | | 58,143 | |
| Payable to auditor | | | 22,919 | |
| Accrued service fees | | | 17,920 | |
| Accrued interest payable | | | 157 | |
| Accrued trustees fees | | | 2,278 | |
| Accrued expenses and other payables | | | 66,502 | |
| Total Liabilities | | | 499,795 | |
| NET ASSETS | | $ | 253,225,624 | |
| | | | | |
| NET ASSETS CONSIST OF: | | | | |
| Capital stock | | $ | 358,228,819 | |
| Accumulated net investment loss | | | (994,593 | ) |
| Accumulated net realized loss on investments | | | (149,083,149 | ) |
| Unrealized net appreciation on investments | | | 45,074,547 | |
| Total Net Assets | | $ | 253,225,624 | |
| | | | | |
| NET ASSETS | | | | |
| Investor Class: | | | | |
| Shares authorized (no par value) | | Unlimited | |
| Net assets applicable to outstanding Investor Class shares | | $ | 227,682,483 | |
| Shares issued and outstanding | | | 12,191,758 | |
| Net asset value, offering price and redemption price per share | | $ | 18.68 | |
| | | | | |
| Institutional Class: | | | | |
| Shares authorized (no par value) | | Unlimited | |
| Net assets applicable to outstanding Institutional Class shares | | $ | 25,543,141 | |
| Shares issued and outstanding | | | 1,338,902 | |
| Net asset value, offering price and redemption price per share | | $ | 19.08 | |
The accompanying notes are an integral part of these financial statements.
Financial Statements
Statement of Operations for the year ended October 31, 2014 |
| INVESTMENT INCOME: | | | |
Dividend income(1) | | $ | 2,616,144 | |
| Interest income | | | 594 | |
| Total investment income | | | 2,616,738 | |
| | | | | |
| EXPENSES: | | | | |
| Investment advisory fees (See Note 5) | | | 1,826,409 | |
| Administration, fund accounting, custody and transfer agent fees | | | 449,986 | |
| Sub-transfer agent expenses – Investor Class (See Note 5) | | | 317,684 | |
| Sub-transfer agent expenses – Institutional Class (See Note 5) | | | 11,691 | |
| Service fees – Investor Class (See Note 5) | | | 221,592 | |
| Federal and state registration fees | | | 38,019 | |
| Reports to shareholders | | | 35,169 | |
| Audit fees | | | 23,555 | |
| Compliance expense | | | 21,488 | |
| Trustees’ fees and expenses | | | 10,997 | |
| Legal fees | | | 7,000 | |
| Other expenses | | | 23,521 | |
| Total expenses before waiver | | | 2,987,111 | |
| Administrative expense waiver (See Note 5) | | | (13,641 | ) |
| Net expenses | | | 2,973,470 | |
| NET INVESTMENT LOSS | | $ | (356,732 | ) |
| | | | | |
| REALIZED AND UNREALIZED GAINS (LOSSES): | | | | |
| Net realized gain on investments | | $ | 44,803,198 | |
| Net change in unrealized depreciation on investments | | | (404,454 | ) |
| Net gain on investments | | | 44,398,744 | |
| NET INCREASE IN NET ASSETS RESULTING FROM OPERATIONS | | $ | 44,042,012 | |
(1) Net of foreign taxes withheld of $15,412.
The accompanying notes are an integral part of these financial statements.
HENNESSY FUNDS 1-800-966-4354
(This Page Intentionally Left Blank.)
Financial Statements
| Statements of Changes in Net Assets |
| | | Year Ended | | | Year Ended | |
| | | October 31, 2014 | | | October 31, 2013 | |
| OPERATIONS: | | | | | | |
| Net investment loss | | $ | (356,732 | ) | | $ | (632,613 | ) |
| Net realized gain on investments | | | 44,803,198 | | | | 51,423,472 | |
| Net change in unrealized appreciation (depreciation) | | | | | | | | |
| on investments | | | (404,454 | ) | | | 16,444,675 | |
| Net increase in net assets resulting from operations | | | 44,042,012 | | | | 67,235,534 | |
| | | | | | | | | |
| CAPITAL SHARE TRANSACTIONS: | | | | | | | | |
| Proceeds from shares subscribed – Investor Class | | | 13,584,680 | | | | 41,940,983 | |
| Proceeds from shares subscribed – Institutional Class | | | 2,181,382 | | | | 3,016,344 | |
| Cost of shares redeemed – Investor Class | | | (46,133,939 | )(1) | | | (147,291,804 | ) |
| Cost of shares redeemed – Institutional Class | | | (7,504,821 | )(1) | | | (20,555,666 | ) |
| Net decrease in net assets derived | | | | | | | | |
| from capital share transactions | | | (37,872,698 | ) | | | (122,890,143 | ) |
| TOTAL INCREASE (DECREASE) IN NET ASSETS | | | 6,169,314 | | | | (55,654,609 | ) |
| | | | | | | | | |
| NET ASSETS: | | | | | | | | |
| Beginning of year | | | 247,056,310 | | | | 302,710,919 | |
| End of year | | $ | 253,225,624 | | | $ | 247,056,310 | |
| Undistributed net investment loss, end of year | | $ | (994,593 | ) | | $ | (650,206 | ) |
| | | | | | | | | |
| CHANGES IN SHARES OUTSTANDING: | | | | | | | | |
| Shares sold – Investor Class | | | 780,130 | | | | 3,204,921 | |
| Shares sold – Institutional Class | | | 122,952 | | | | 216,262 | |
| Shares redeemed – Investor Class | | | (2,701,648 | ) | | | (10,550,825 | ) |
| Shares redeemed – Institutional Class | | | (429,220 | ) | | | (1,522,417 | ) |
| Net decrease in shares outstanding | | | (2,227,786 | ) | | | (8,652,059 | ) |
| (1) | Net of redemption fees of $34 and $46 for the Investor Class and Institutional Class shares, respectively, related to redemption fees imposed by the FBR Small Cap Fund (which was reorganized into the Fund) during a prior year but not received until the year ended October 31, 2014. |
The accompanying notes are an integral part of these financial statements.
HENNESSY FUNDS 1-800-966-4354
For an Investor Class share outstanding throughout each year
PER SHARE DATA:
Net asset value, beginning of year
Income from investment operations:
Net investment loss
Net realized and unrealized gains (losses) on investments
Total from investment operations
Net asset value, end of year
TOTAL RETURN
SUPPLEMENTAL DATA AND RATIOS:
Net assets, end of year (millions)
Ratio of expenses to average net assets
Ratio of net investment loss to average net assets
Portfolio turnover rate(1)
(1) Portfolio turnover is calculated on the basis of the Fund as a whole.
The accompanying notes are an integral part of these financial statements.
| Year Ended October 31, | |
| 2014 | | | 2013 | | | 2012 | | | 2011 | | | 2010 | |
| | | | | | | | | | | | | | |
| $ | 15.65 | | | $ | 12.38 | | | $ | 9.97 | | | $ | 10.28 | | | $ | 8.81 | |
| | | | | | | | | | | | | | | | | | | |
| | | | | | | | | | | | | | | | | | | |
| | (0.04 | ) | | | (0.11 | ) | | | (0.07 | ) | | | (0.08 | ) | | | (0.10 | ) |
| | 3.07 | | | | 3.38 | | | | 2.48 | | | | (0.23 | ) | | | 1.57 | |
| | 3.03 | | | | 3.27 | | | | 2.41 | | | | (0.31 | ) | | | 1.47 | |
| | | | | | | | | | | | | | | | | | | |
| $ | 18.68 | | | $ | 15.65 | | | $ | 12.38 | | | $ | 9.97 | | | $ | 10.28 | |
| | | | | | | | | | | | | | | | | | | |
| | 19.36 | % | | | 26.41 | % | | | 24.17 | % | | | (3.02 | )% | | | 16.69 | % |
| | | | | | | | | | | | | | | | | | | |
| | | | | | | | | | | | | | | | | | | |
| $ | 227.68 | | | $ | 220.83 | | | $ | 265.60 | | | $ | 184.40 | | | $ | 207.11 | |
| | 1.23 | % | | | 1.29 | % | | | 1.34 | % | | | 1.33 | % | | | 1.34 | % |
| | (0.17 | )% | | | (0.26 | )% | | | (0.66 | )% | | | (0.78 | )% | | | (0.89 | )% |
| | 84 | % | | | 105 | % | | | 90 | % | | | 106 | % | | | 103 | % |
The accompanying notes are an integral part of these financial statements.
HENNESSY FUNDS 1-800-966-4354
Financial Statements
For an Institutional Class share outstanding throughout each year
PER SHARE DATA:
Net asset value, beginning of year
Income from investment operations:
Net investment income (loss)
Net realized and unrealized gains (losses) on investments
Total from investment operations
Net asset value, end of year
TOTAL RETURN
SUPPLEMENTAL DATA AND RATIOS:
Net assets, end of year (millions)
Ratio of expenses to average net assets:
Before expense reimbursement
After expense reimbursement
Ratio of net investment income to average net assets:
Before expense reimbursement
After expense reimbursement
Portfolio turnover rate(1)
(1) Portfolio turnover is calculated on the basis of the Fund as a whole.
The accompanying notes are an integral part of these financial statements.
| Year Ended October 31, | |
| 2014 | | | 2013 | | | 2012 | | | 2011 | | | 2010 | |
| | | | | | | | | | | | | | |
| $ | 15.94 | | | $ | 12.57 | | | $ | 10.09 | | | $ | 10.37 | | | $ | 8.86 | |
| | | | | | | | | | | | | | | | | | | |
| | | | | | | | | | | | | | | | | | | |
| | 0.06 | | | | 0.01 | | | | (0.04 | ) | | | (0.05 | ) | | | (0.07 | ) |
| | 3.08 | | | | 3.36 | | | | 2.52 | | | | (0.23 | ) | | | 1.58 | |
| | 3.14 | | | | 3.37 | | | | 2.48 | | | | (0.28 | ) | | | 1.51 | |
| | | | | | | | | | | | | | | | | | | |
| $ | 19.08 | | | $ | 15.94 | | | $ | 12.57 | | | $ | 10.09 | | | $ | 10.37 | |
| | | | | | | | | | | | | | | | | | | |
| | 19.70 | % | | | 26.81 | % | | | 24.58 | % | | | (2.70 | )% | | | 17.04 | % |
| | | | | | | | | | | | | | | | | | | |
| | | | | | | | | | | | | | | | | | | |
| $ | 25.54 | | | $ | 26.23 | | | $ | 37.11 | | | $ | 2.53 | | | $ | 3.12 | |
| | | | | | | | | | | | | | | | | | | |
| | 1.03 | % | | | 1.11 | % | | | 1.11 | % | | | 1.09 | % | | | 1.09 | % |
| | 0.98 | % | | | 0.98 | % | | | 9.98 | % | | | 0.98 | % | | | 0.98 | % |
| | | | | | | | | | | | | | | | | | | |
| | 0.03 | % | | | (0.01 | )% | | | (0.51 | )% | | | (0.55 | )% | | | (0.64 | )% |
| | 0.08 | % | | | 0.12 | % | | | (0.38 | )% | | | (0.44 | )% | | | (0.53 | )% |
| | 84 | % | | | 105 | % | | | 90 | % | | | 106 | % | | | 103 | % |
The accompanying notes are an integral part of these financial statements.
HENNESSY FUNDS 1-800-966-4354
Financial Statements
Notes to Financial Statements October 31, 2014 |
1). ORGANIZATION
The Hennessy Cornerstone Growth Fund (the “Fund”) is a series of Hennessy Funds Trust (the “Trust”), which was organized as a Delaware statutory trust on September 17, 1992. The Fund is an open-end management investment company registered under the Investment Company Act of 1940, as amended. The Fund is a successor to a fund with the same name (the “Predecessor Fund”) that was a series of Hennessy Mutual Funds, Inc., a Maryland corporation, pursuant to a reorganization that took place after the close of business on February 28, 2014. Prior to February 28, 2014, the Fund had no investment operations. As a result of the reorganization, holders of the Investor Class shares of the Predecessor Fund received Investor Class shares of the Fund (the Investor Class shares of the Fund are the successor to the accounting and performance information of the Predecessor Fund), and holders of the Institutional Class shares of the Predecessor Fund received Institutional Class shares of the Fund (the Institutional Class shares of the Fund are the successor to the accounting and performance information of the Predecessor Fund). The investment objective of the Fund is long-term growth of capital. The Fund is a diversified fund.
The Fund offers Investor Class and Institutional Class shares. Prior to October 26, 2012, the Investor Class shares were known as Original Class shares. Each class of shares differs principally in its respective administration, 12b-1 distribution and service fees, shareholder servicing, and transfer agent expenses and sales charges, if any. Each class has identical rights to earnings, assets, and voting privileges, except for class-specific expenses and exclusive rights to vote on matters affecting only an individual class.
2). SIGNIFICANT ACCOUNTING POLICIES
The following is a summary of significant accounting policies consistently followed by the Fund in the preparation of the financial statements. These policies are in conformity with U.S. generally accepted accounting principles (“GAAP”).
| a). | Investment Valuation – All investments in securities are recorded at their estimated fair value, as described in Note 3. |
| b). | Federal Income Taxes – Provision for federal income taxes or excise taxes has not been made since the Fund has elected to be taxed as a “regulated investment company” and intends to distribute substantially all of its taxable income to its shareholders and otherwise comply with the provisions of the Internal Revenue Code of 1986, as amended, applicable to regulated investment companies. Net investment income or loss and realized gains and losses for federal income tax purposes may differ from that reported on the financial statements because of temporary book and tax basis differences. Temporary differences are primarily the result of the treatment of wash sales for tax reporting purposes. Distributions from net realized gains for book purposes may include short-term capital gains, which are included as ordinary income to shareholders for tax purposes. |
| | Due to inherent differences in the recognition of income, expenses, and realized gains/losses under GAAP and federal income tax regulations, permanent differences between book and tax basis reporting for the 2014 fiscal year have been identified |
| | and appropriately reclassified on the Statement of Assets and Liabilities. The adjustments are as follow: |
| Undistributed | Accumulated | |
| Net Investment | Net Realized | |
| Income/(Loss) | Gain/(Loss) | Paid-in Capital |
| $12,345 | $(52,841) | $40,496 |
| c). | Income and Expenses – Dividend income is recognized on the ex-dividend date or as soon as information is available to the Fund. Interest income, which includes the amortization of premium and accretion of discount, is recognized on an accrual basis. The Fund is charged for those expenses that are directly attributable to the portfolio, such as advisory, administration, and certain shareholder service fees. Income, expenses (other than expenses attributable to a specific class), and realized and unrealized gains or losses on investments are allocated to each class of shares based on its respective net assets. |
| d). | Distributions to Shareholders – Dividends from net investment income for the Fund, if any, are declared and paid out annually, usually in December. Distributions of net realized capital gains, if any, are declared and paid annually, usually in November or December. |
| e). | Security Transactions – Investment and shareholder transactions are recorded on the trade date. The Fund determines the gain or loss realized from the investment transactions by comparing the original cost of the security lot sold with the net sale proceeds. Discounts and premiums on securities purchased are accreted/amortized over the life of the respective security. |
| f). | Use of Estimates – The preparation of financial statements in conformity with GAAP requires management to make estimates and assumptions that affect the reported amounts of assets and liabilities and disclosure of contingent assets and liabilities at the date of the financial statements and the reported change in net assets during the reporting period. Actual results could differ from those estimates. |
| g). | Share Valuation – The net asset value (“NAV”) per share of the Fund is calculated by dividing the sum of the value of the securities held by the Fund, plus cash or other assets, minus all liabilities (including estimated accrued expenses) by the total number of shares outstanding for the Fund, rounded to the nearest cent. The Fund’s shares will not be priced on days the New York Stock Exchange is closed for trading. The offering and redemption price per share for the Fund is equal to the Fund’s NAV per share. |
| h). | Foreign Currency – Values of investments denominated in foreign currencies, if any, are converted into U.S. dollars using the spot market rate of exchange at the time of valuation. Purchases and sales of investments and income are translated into U.S. dollars using the spot market rate of exchange prevailing on the respective dates of such transactions. The Fund does not isolate the portion of the results of operations resulting from fluctuations in foreign exchange rates on investments from fluctuations resulting from changes in the market prices of securities held. Such fluctuations are included with the net realized and unrealized gain or loss on investments. Foreign investments present additional risks due to currency fluctuations, economic and political factors, lower liquidity, government regulations, differences in accounting standards, and other factors. |
| i). | Forward Contracts – The Fund may enter into forward currency contracts to reduce its exposure to changes in foreign currency exchange rates on its foreign holdings and to lock in the U.S. dollar cost of firm purchase and sale commitments for |
HENNESSY FUNDS 1-800-966-4354
| | securities denominated in foreign currencies. A forward currency contract is a commitment to purchase or sell a foreign currency at a future date at a negotiated forward rate. The gain or loss arising from the difference between the U.S. dollar cost of the original contract and the value of the foreign currency in U.S. dollars upon closing of such contract is included in net realized gain or loss from foreign currency transactions. During the fiscal year ended October 31, 2014, the Fund did not enter into any forward contracts. |
| j). | Repurchase Agreements – The Fund may enter into repurchase agreements with member banks or security dealers of the Federal Reserve Board whom the investment advisor deems creditworthy. The repurchase price generally equals the price paid by the Fund plus interest negotiated on the basis of current short-term rates. |
| | Securities pledged as collateral for repurchase agreements are held by the custodian bank until the respective agreements mature. Provisions of the repurchase agreements ensure that the market value of the collateral, including accrued interest thereon, is sufficient to cover repurchase amount in the event of default of the counterparty. If the counterparty defaults and the value of the collateral declines or if the counterparty enters an insolvency proceeding, realization of the collateral by the Fund may be delayed or limited. |
| k). | Accounting for Uncertainty in Income Taxes – The Fund has adopted accounting policies regarding recognition and measurement of tax positions taken or expected to be taken on a tax return. The tax returns of the Fund for the prior three fiscal years are open for examination. The Fund has reviewed all open tax years in major jurisdictions and concluded that there is no impact on the Fund’s net assets and no tax liability resulting from unrecognized tax benefits relating to uncertain income tax positions taken or expected to be taken on a tax return. The Fund’s major tax jurisdictions are U.S. federal and Delaware. |
| l). | Derivatives – The Fund may invest in, or enter into, derivatives, such as options, futures contracts, options on futures contracts, and swaps, for a variety of reasons, including to hedge certain risks, to provide a substitute for purchasing or selling particular securities, or to increase potential income gain. Derivatives may provide a cheaper, quicker, or more specifically focused way for a Fund to invest than “traditional” securities would. The main purpose of utilizing these derivative instruments is for hedging purposes. |
| | The Fund has adopted the financial accounting reporting rules as required by the Derivatives and Hedging Topic of the Financial Accounting Standards Board Accounting Standards Codification. Under such rules, the Fund is required to include enhanced disclosure that enables investors to understand how and why an entity uses derivatives, how derivatives are accounted for, and how derivatives instruments affect an entity’s results of operations and financial position. During the fiscal year ended October 31, 2014, the Fund did not hold any derivative instruments. |
| m). | Events Subsequent to the Fiscal Period End – The Fund has adopted financial reporting rules regarding subsequent events that require an entity to recognize in the financial statements the effects of all subsequent events that provide additional evidence about conditions that existed at the date of the balance sheet. Management has evaluated the Fund’s related events and transactions that occurred subsequent to October 31, 2014 through the date of issuance of the Fund’s financial statements. There were no events or transactions that occurred during this period that materially impacted the amounts or disclosures in the Fund’s financial statements. |
3). SECURITIES VALUATION
The Fund has adopted authoritative fair valuation accounting standards that establish an authoritative definition of fair value and set out a hierarchy for measuring fair value. These standards require additional disclosures about the various inputs and valuation techniques used to develop the measurements of fair value and a discussion in changes in valuation techniques and related inputs during the period. These inputs are summarized in the three broad levels listed below:
| | Level 1 – | Quoted unadjusted prices for identical instruments in active markets to which the Fund has access at the date of measurement. |
| | Level 2 – | Quoted prices for similar instruments in active markets; quoted prices for identical or similar instruments in markets that are not active; and model-derived valuations in which all significant inputs and significant value drivers are observable in active markets. Level 2 inputs are those in markets for which there are few transactions, the prices are not current, the prices are fair value adjusted due to post-market close subsequent events (foreign markets), little public information exists, or instances where prices vary substantially over time or among brokered market makers. These inputs may also include interest rates, prepayment speeds, credit risk curves, default rates, and similar data. |
| | Level 3 – | Model-derived valuations in which one or more significant inputs or significant value drivers are unobservable. Unobservable inputs are those inputs that reflect the Fund’s own assumptions about what market participants would use to price the asset or liability based on the best available information. |
Following is a description of the valuation techniques applied to the Fund’s major categories of assets and liabilities measured at fair value on a recurring basis.
Equity Securities – Equity securities, including common stocks, preferred stocks, foreign issued common stocks, exchange traded funds, closed-end mutual funds, partnerships, rights, and real estate investment trusts, that are traded on a securities exchange for which a last-quoted sales price is readily available will generally be valued at the last sales price as reported by the primary exchange on which the securities are listed. Securities listed on The NASDAQ Stock Market (“NASDAQ”) will be valued at the NASDAQ Official Closing Price, which may differ from the last sales price reported. Securities traded on a securities exchange for which a last-quoted sales price is not readily available will generally be valued at the mean between the bid and ask prices. To the extent these securities are actively traded and valuation adjustments are not applied, they are classified in Level 1 of the fair value hierarchy.
Investment Companies – Investments in investment companies (e.g., mutual funds and exchange traded funds) are generally priced at the ending NAV provided by the Fund’s service agent and will be classified in Level 1 of the fair value hierarchy.
Debt Securities – Debt securities, including corporate bonds, asset-backed securities, mortgage-backed securities, municipal bonds, U.S. Treasuries, and U.S. government agency issues, are valued at market on the basis of valuations furnished by an independent pricing service that utilizes both dealer-supplied valuations and formula-based techniques. The pricing service may consider recently executed transactions in securities of the issuer or comparable issuers, market price quotations (where observable), bond spreads, and fundamental data relating to the issuer. In addition, the model may incorporate market observable data such as reported sales of similar securities, broker
HENNESSY FUNDS 1-800-966-4354
quotes, yields, bids, offers, and reference data. Certain securities are valued principally using dealer quotations. These securities are generally classified in Level 2 of the fair value hierarchy.
Short-Term Securities – Short-term equity investments, including money market funds, are valued in the manner specified above. Short-term debt investments are generally valued at amortized cost, which approximates fair market value, if their original maturity was 60 days or less, or by amortizing the values as of the 61st day prior to maturity, if their original term to maturity exceeded 60 days. Amortized cost is not used if its use would be inappropriate due to credit or other impairments of the issuer, in which the security would be fair valued, as described below. Short-term securities are generally classified in Level 1 or Level 2 of the fair market hierarchy depending on the inputs used and market activity levels for specific securities.
The Board of Trustees of the Fund (the “Board”) has adopted fair value pricing procedures that are followed when a price for a security is not readily available or if a significant event has occurred that indicates the closing price of a security no longer represents the true value of that security. Fair value pricing determinations are made in good faith in accordance with these procedures. There are numerous criteria that will be given consideration in determining a fair value of a security. Some of these criteria are trading volume of security and markets, the value of other like securities, and news events with direct bearing to security or market. Fair value pricing results in an estimated price for a security that reflects the amount the Fund might reasonably expect to receive in a current sale. Depending on the relative significance of the valuation inputs, these securities may be classified in either Level 2 or Level 3 of the fair value hierarchy.
Fair valuing of foreign securities may be determined with the assistance of a pricing service using correlations between the movement of prices of such securities and indices of domestic securities and other appropriate indicators, such as closing market prices of relevant American Depositary Receipts or futures contracts. The effect of using fair value pricing is that the Fund’s NAV will reflect the affected portfolio securities’ value as determined in the judgment of the Board or its designee instead of being determined by the market. Using a fair value pricing methodology to price foreign securities may result in a value that is different from a foreign security’s most recent closing price and from the prices used by other investment companies to calculate their NAVs and are generally considered Level 2 prices in the fair valuation hierarchy. Because the Fund may invest in foreign securities, the value of the Fund’s portfolio securities may change on days when you will not be able to purchase or redeem your shares.
The Board has delegated day-to-day valuation matters to a Valuation Committee comprised of one or more representatives from Hennessy Advisors, Inc., the Fund’s investment advisor. The function of the Valuation Committee is to value securities where current and reliable market quotations are not readily available. All actions taken by the Valuation Committee are reviewed by the Board.
The Fund has performed an analysis of all existing investments to determine the significance and character of all inputs to their fair value determination. Various inputs are used in determining the value of the Fund’s investments. The inputs or methodology used for valuing securities are not necessarily an indication of the risk associated with investing in those securities. Details related to the fair valuation hierarchy of the Fund’s securities as of October 31, 2014 are included in the Fund’s Schedule of Investments.
4). INVESTMENT TRANSACTIONS
Purchases and sales of investment securities (excluding government and short-term investments) for the Fund during the fiscal year ended October 31, 2014 were $201,983,345 and $248,423,401, respectively.
There were no purchases or sales/maturities of long-term U.S. Government Securities for the Fund during the fiscal year ended October 31, 2014.
5). INVESTMENT MANAGEMENT FEE AND OTHER TRANSACTIONS WITH AFFILIATES
Hennessy Advisors, Inc. (the “Advisor”) is the investment advisor of the Fund. The Advisor provides the Fund with investment management services under an Investment Advisory Agreement. The Advisor furnishes all investment advice, office space, facilities, and provides most of the personnel needed by the Fund. As compensation for its services, the Advisor is entitled to a monthly fee from the Fund. The fee is based upon the average daily net assets of the Fund at the annual rate of 0.74%. The net investment advisory fees payable for the Fund as of October 31, 2014 were $146,919.
The Advisor has agreed to waive its fees and absorb expenses to the extent that the total annual operating expenses (excluding all Federal, state and local taxes, interest, brokerage commissions, acquired fund fees and expenses and other costs incurred in connection with the purchase and sale of securities and extraordinary items) exceed 0.98% of the Fund’s net assets for the Institutional Class shares of the Fund. The expense limitation agreement for the Institutional Class shares can only be terminated by the Board.
For a period of three years after the year in which the Advisor waives or reimburses expenses, the Advisor may seek reimbursement from the Fund to the extent that total annual fund operating expenses are less than the expense limitation in effect at the time of the reimbursement. During the three years ended October 31, 2014, no Advisor fees were waived and therefore no expenses are subject to potential recovery.
The Board has approved a Shareholder Servicing Agreement for the Investor Class shares of the Fund, which was instituted to compensate the Advisor for the non-investment management services it provides to the Fund. The Shareholder Servicing Agreement provides for a monthly fee paid to the Advisor at an annual rate of 0.10% of the average daily net assets of the Fund attributable to Investor Class shares. Shareholder service fees payable for the Fund as of October 31, 2014 were $17,920.
The Fund has entered into agreements with various brokers, dealers, and financial intermediaries in connection with the sale of shares of the Fund. The agreements provide for periodic payments by the Fund to the brokers, dealers, and financial intermediaries for providing certain shareholder maintenance services (sub-transfer agent expenses). These shareholder services include the pre-processing and quality control of new accounts, shareholder correspondence, answering customer inquiries regarding account status, and facilitating shareholder telephone transactions. Fees paid by the Fund to various brokers, dealers, and financial intermediaries for the fiscal year ended October 31, 2014 were $329,375.
U.S. Bancorp Fund Services, LLC (“USBFS”) provides the Fund with administrative, fund accounting, and transfer agent services, including all regulatory reporting, and necessary office equipment and personnel. As administrator, USBFS prepares various federal and state regulatory filings, reports, and returns for the Fund; prepares reports and materials to be supplied to the Board; monitors the activities of the Fund’s custodian, transfer agent, and accountants; and coordinates the preparation and payment of the Fund’s expenses and reviews the Fund’s expense accruals. Fees paid to USBFS for the fiscal ended October 31, 2014 were $436,345.
HENNESSY FUNDS 1-800-966-4354
USBFS has voluntarily waived all or a portion of its fees allocated to the Institutional Class shares of the Fund. The administration fees voluntarily waived by USBFS during the fiscal year ended October 31, 2014 were $13,641.
U.S. Bank, N.A., an affiliate of USBFS, serves as the Fund’s custodian. Quasar Distributors, LLC acts as the Fund’s principal underwriter in a continuous public offering of the Fund’s shares. Quasar Distributors, LLC is an affiliate of USBFS and U.S. Bank, N.A.
6). LINE OF CREDIT
The Fund has a line of credit with the other funds in the Hennessy Funds family of funds (the “Hennessy Funds”) in the amount of the lesser of (i) $100,000,000 or (ii) 33.33% of each Hennessy Fund’s net assets, or 30% for the Hennessy Gas Utility Index Fund and 10% for the Hennessy Balanced Fund, intended to provide short-term financing, if necessary, subject to certain restrictions, in connection with shareholder redemptions. The credit facility is with the Hennessy Funds’ custodian bank, U.S. Bank, N.A. Borrowings under this arrangement bear interest at the bank’s prime rate. During the fiscal year ended October 31, 2014, the Fund did not have any borrowings outstanding under the line of credit.
7). FEDERAL TAX INFORMATION
As of October 31, 2014, the components of accumulated earnings (losses) for income tax purposes were as follow:
| | Cost of investments for tax purposes | | $ | 207,541,593 | |
| | Gross tax unrealized appreciation | | $ | 49,891,912 | |
| | Gross tax unrealized depreciation | | | (4,874,542 | ) |
| | Net tax unrealized appreciation | | $ | 45,017,370 | |
| | Undistributed ordinary income | | $ | — | |
| | Undistributed long-term capital gains | | | — | |
| | Total distributable earnings | | $ | — | |
| | Other accumulated loss | | $ | (150,020,565 | ) |
| | Total accumulated loss | | $ | (105,003,195 | ) |
The difference between book-basis and tax-basis unrealized appreciation is attributable primarily to wash sales and partnership adjustments.
At October 31, 2014, the Fund had capital loss carryforwards that expire as follows:
| | $ | 2,080,428 | | 10/31/16 | |
| | $ | 146,945,544 | | 10/31/17 | |
During the year ended October 31, 2014, the capital loss carry forwards utilized for the Fund were $45,342,213.
Capital losses sustained in the year ended October 31, 2012 and in future taxable years will not expire and may be carried over by the Fund without limitation; however, they will retain the character of the original loss. Furthermore, any loss incurred during those taxable years will be required to be utilized prior to the losses incurred in taxable years prior to 2012. As a result of this ordering rule, pre-enactment capital loss carryforwards may be more likely to expire unused. Under pre-enactment law, capital losses could be carried forward for eight years, and carried forward as short-term capital losses, irrespective of the character of the original loss.
At October 31, 2014, the Fund deferred, on a tax basis, a post-December late year ordinary loss deferral of $994,593.
The Fund did not pay any distributions during fiscal year 2014 or fiscal year 2013.
8.) AGREEMENT AND PLAN OF REORGANIZATION
On December 11, 2013, the Board approved an Agreement and Plan of Reorganization (the “Agreement”), of the Hennessy Cornerstone Growth Fund (the “New Fund”), pursuant to which the New Fund would be a successor to the corresponding series of the same name of Hennessy Mutual Funds, Inc., a Maryland corporation (the “Predecessor Fund”). The Agreement provided for the transfer of assets of the Predecessor Fund to the New Fund and the assumption of the liabilities of the Predecessor Fund by the New Fund. The New Fund had the same investment objective and substantially similar principal investment strategies as the Predecessor Fund. The reorganization was effective as of the close of business on February 28, 2014. The following table illustrates the specifics of the reorganization:
| | Shares of the New Fund | | | |
| Predecessor Fund | Issued to Shareholders of | New Fund | Combined | Tax Status |
| Net Assets | the Predecessor Fund | Net Assets | Net Assets | of Transfer |
$252,177,309(1) | 14,754,804 | $252,177,309 | $252,177,309 | Non-taxable |
| | (1) | Included accumulated realized losses and unrealized appreciation in the amounts of $(152,482,828) and $24,938,411, respectively. |
HENNESSY FUNDS 1-800-966-4354
Report of Independent Registered Public Accounting Firm
The Board of Trustees and Shareholders
Hennessy Funds Trust:
We have audited the accompanying statement of assets and liabilities of Hennessy Cornerstone Growth Fund (the Fund), a series of Hennessy Funds Trust (formerly a series of Hennessy Mutual Funds, Inc.), including the schedule of investments, as of October 31, 2014, and the related statement of operations for the year then ended, the statements of changes in net assets for each of the years in the two-year period then ended, and the financial highlights for each of the years in the five-year period then ended. These financial statements and financial highlights are the responsibility of the Fund’s management. Our responsibility is to express an opinion on these financial statements and financial highlights based on our audits.
We conducted our audits in accordance with the standards of the Public Company Accounting Oversight Board (United States). Those standards require that we plan and perform the audit to obtain reasonable assurance about whether the financial statements and financial highlights are free of material misstatement. An audit includes examining, on a test basis, evidence supporting the amounts and disclosures in the financial statements. Our procedures included confirmation of investments owned as of October 31, 2014, by correspondence with the custodian and brokers or by other appropriate auditing procedures. An audit also includes assessing the accounting principles used and significant estimates made by management, as well as evaluating the overall financial statement presentation. We believe that our audits provide a reasonable basis for our opinion.
In our opinion, the financial statements and financial highlights referred to above present fairly, in all material respects, the financial position of the Fund as of October 31, 2014, and the results of its operations for the year then ended, the changes in its net assets for each of the years in the two-year period then ended, and the financial highlights for each of the years in the five-year period then ended, in conformity with U.S. generally accepted accounting principles.
Milwaukee, Wisconsin
December 30, 2014
Trustees and Officers of the Fund (Unaudited)
The business and affairs of the Fund are managed under the direction of the Fund’s Board of Trustees. Information pertaining to the Trustees and Officers of the Fund is set forth below. The Fund’s Statement of Additional Information includes additional information about the Fund’s Trustees and Officers and is available, without charge, upon request by calling 1-800-966-4354.
| | | | | Number of | |
| | | Term of | | Portfolios | |
| | | Office | | in the | Other |
| | | and | | Fund | Directorships |
| | Position(s) | Length | Principal | Complex | (During Past |
| Name, Address, | Held with | of Time | Occupation(s) | Overseen | Five Years)(2) |
| and Age | the Fund | Served | During Past Five Years | by Trustee | Held by Trustee |
| | | | |
| Disinterested Trustees (as defined below) | | | |
| | | | | | |
| J. Dennis DeSousa | Trustee | Indefinite, | Mr. DeSousa is a real | 16 | Hennessy SPARX |
| Age: 78 | | until | estate investor. | | Funds Trust; |
| Address: | | successor | | | Hennessy Mutual |
| c/o Hennessy | | elected | | | Funds, Inc.; and |
| Advisors, Inc. | | | | | The Hennessy |
| 7250 Redwood Blvd. | | Served | | | Funds, Inc. |
| Suite 200 | | since | | | |
| Novato, CA 94945 | | January | | | |
| | | 1996 | | | |
| | | for the | | | |
| | | Funds (or | | | |
| | | Predecessor | | | |
| | | Funds) | | | |
| | | | | | |
| Robert T. Doyle | Trustee | Indefinite, | Mr. Doyle has been the | 16 | Hennessy SPARX |
| Age: 67 | | until | Sheriff of Marin County, | | Funds Trust; |
| Address: | | successor | California since 1996. | | Hennessy Mutual |
| c/o Hennessy | | elected | | | Funds, Inc.; and |
| Advisors, Inc. | | | | | The Hennessy |
| 7250 Redwood Blvd. | | Served | | | Funds, Inc. |
| Suite 200 | | since | | | |
| Novato, CA 94945 | | January | | | |
| | | 1996 | | | |
| | | for the | | | |
| | | Funds (or | | | |
| | | Predecessor | | | |
| | | Funds) | | | |
| | | | | | |
| Gerald P. Richardson | Trustee | Indefinite, | Mr. Richardson is an | 16 | Hennessy SPARX |
| Age: 69 | | until | independent consultant | | Funds Trust; |
| Address: | | successor | in the securities industry. | | Hennessy Mutual |
| c/o Hennessy | | elected | | | Funds, Inc.; and |
| Advisors, Inc. | | | | | The Hennessy |
| 7250 Redwood Blvd. | | Served | | | Funds, Inc. |
| Suite 200 | | since | | | |
| Novato, CA 94945 | | May 2004 | | | |
| | | for the | | | |
| | | Funds (or | | | |
| | | Predecessor | | | |
| | | Funds) | | | |
HENNESSY FUNDS 1-800-966-4354
| | | | | Number of | |
| | | Term of | | Portfolios | |
| | | Office | | in the | Other |
| | | and | | Fund | Directorships |
| | Position(s) | Length | Principal | Complex | (During Past |
| Name, Address, | Held with | of Time | Occupation(s) | Overseen | Five Years)(2) |
| and Age | the Fund | Served | During Past Five Years | by Trustee | Held by Trustee |
| | | |
| “Interested Persons” (as defined in the 1940 Act) | | |
| | | | | | |
Neil J. Hennessy(1) | Chief | Trustee: | Mr. Hennessy has been | 16 | Hennessy |
| Age: 58 | Investment | Indefinite, | employed by Hennessy | | Advisors, Inc. |
| Address: | Officer, | until | Advisors, Inc., the Funds’ | | (current); |
| c/o Hennessy | Portfolio | successor | investment advisor, since | | Hennessy SPARX |
| Advisors, Inc. | Manager, | elected | 1989. He currently serves | | Funds Trust; |
| 7250 Redwood Blvd. | President, | | as President, Chairman | | Hennessy Mutual |
| Suite 200 | Trustee | Served | and CEO of Hennessy | | Funds, Inc.; and |
| Novato, CA 94945 | and | since | Advisors, Inc. | | The Hennessy |
| | Chairman | January | | | Funds, Inc. |
| | of the | 1996 | | | |
| | Board | for the | | | |
| | | Funds (or | | | |
| | | Predecessor | | | |
| | | Funds) | | | |
| | | | | | |
| | | Officer: | | | |
| | | 1 year term | | | |
| | | | | | |
| | | Served | | | |
| | | since | | | |
| | | June 2008 | | | |
| | | for the | | | |
| | | Funds (or | | | |
| | | Predecessor | | | |
| | | Funds) | | | |
| | | | | | |
Teresa M. Nilsen(1) | Executive | 1 year term | Ms. Nilsen has been | N/A | N/A |
| Age: 48 | Vice | | employed by Hennessy | | |
| Address: | President | Served | Advisors, Inc., the Funds’ | | |
| c/o Hennessy | and | since | investment advisor, since | | |
| Advisors, Inc. | Treasurer | January | 1989. She currently serves | | |
| 7250 Redwood Blvd. | | 1996 | as Executive Vice President, | | |
| Suite 200 | | for the | Chief Operations Officer, | | |
| Novato, CA 94945 | | Funds (or | Chief Financial Officer, and | | |
| | | Predecessor | Secretary of Hennessy | | |
| | | Funds) | Advisors, Inc. | | |
| (1) | All Officers of the Hennessy Funds and employees of the Manager are Interested Persons of the Funds. |
| (2) | Pursuant to an internal reorganization, the series of Hennessy Mutual Funds, Inc. (“HMFI”), The Hennessy Funds, Inc. (“HFI”) and Hennessy SPARX Funds Trust (“HSFT”) were reorganized into series of Hennessy Funds Trust on February 28, 2014, which mirrored the corresponding series of HFMI, HFI and HSFT. Subsequent to the reorganization, HFMI, HFI and HSFT were dissolved. |
| | | Term of | |
| | | Office | |
| | | and | |
| | Position(s) | Length | Principal |
| Name, Address, | Held with | of Time | Occupation(s) |
| and Age | the Fund | Served | During Past Five Years |
| | | | |
| Interested Persons | | | |
| | | | |
Daniel B. Steadman(1) | Executive | 1 year term | Mr. Steadman has been employed by |
| Age: 58 | Vice President | | Hennessy Advisors, Inc., the Funds’ |
| Address: | and Secretary | Served since | investment advisor, since 2000. |
| c/o Hennessy Advisors, Inc. | | March 2000 | He currently serves as Executive |
| 7250 Redwood Blvd. | | for the Funds (or | Vice President and Chief Compliance |
| Suite 200 | | Predecessor Funds) | Officer of Hennessy Advisors, Inc. |
| Novato, CA 94945 | | | |
| | | | |
Jennifer Cheskiewicz(1) | Senior | 1 year term | Ms. Cheskiewicz has been employed by |
| Age: 37 | Vice President | | Hennessy Advisors, Inc., the Funds’ |
| Address: | and Chief | Served since | investment advisor, since June 2013. |
| c/o Hennessy Advisors, Inc. | Compliance | June 2013 | She previously served as in-house |
| 7250 Redwood Blvd. | Officer | for the Funds (or | counsel to Carlson Capital, L.P., an |
| Suite 200 | | Predecessor Funds) | SEC-registered investment advisor to |
| Novato, CA 94945 | | | several private funds from February |
| | | | 2010 to May 2013. Prior to that, she |
| | | | was an attorney with Gibson, Dunn & |
| | | | Crutcher LLP from September 2005 |
| | | | through February 2010. She currently |
| | | | serves as General Counsel of |
| | | | Hennessy Advisors, Inc. |
| | | | |
Brian Carlson(1) | Senior | 1 year term | Mr. Carlson has been employed by |
| Age: 42 | Vice President | | Hennessy Advisors, Inc., the Funds’ |
| Address: | and Head of | Served since | investment advisor, since |
| c/o Hennessy Advisors, Inc. | Distribution | December 2013 | December 2013. |
| 7250 Redwood Blvd. | | for the Funds (or | |
| Suite 200 | | Predecessor Funds) | Mr. Carlson was previously a |
| Novato, CA 94945 | | | co-founder and principal of Trivium |
| | | | Consultants, LLC from February 2011 |
| | | | through November 2013. Prior to that, |
| | | | he was the Senior Managing Director |
| | | | of NRP Financial, Inc. from August |
| | | | 2007 through February 2011. |
| | | | |
David Ellison(1) | Portfolio Manager | 1 year term | Mr. Ellison has served as Portfolio |
| Age: 56 | and Senior | | Manager of the Large Cap Financial |
| Address: | Vice President | Served since | Fund, the Small Cap Financial Fund, |
| c/o Hennessy Advisors, Inc. | | October 2012 | and the Technology Fund |
| 101 Federal Street | | for the Funds (or | since inception. |
| Suite 1900 | | Predecessor Funds) | |
| Boston, MA 02110 | | | Mr. Ellison previously served as Director, |
| | | | CIO and President of FBR Advisers, Inc. |
| | | | from December 1999 to October 2012. |
(1) All Officers of the Hennessy Funds and employees of the Manager are Interested Persons of the Funds.
HENNESSY FUNDS 1-800-966-4354
| | | Term of | |
| | | Office | |
| | | and | |
| | Position(s) | Length | Principal |
| Name, Address, | Held with | of Time | Occupation(s) |
| and Age | the Fund | Served | During Past Five Years |
| | | | |
| Interested Persons | | | |
| | | | |
Brian Peery(1) | Portfolio Manager | 1 year term | Mr. Peery has been a Portfolio Manager |
| Age: 45 | and | | of the Cornerstone Growth Fund, |
| Address: | Vice President | Served since | the Cornerstone Mid Cap 30 Fund, the |
| c/o Hennessy Advisors, Inc. | | March 2003 | Cornerstone Large Growth Fund, the |
| 7250 Redwood Blvd. | | as Vice President | Cornerstone Value Fund, the Total |
| Suite 200 | | for the Funds (or | Return Fund, and the Balanced Fund |
| Novato, CA 94945 | | Predecessor Funds) | since October 2014. From February |
| | | | 2011 through September 2014, he |
| | | Served since | served as Co-Portfolio Manager of |
| | | February 2011 | the same funds. |
| | | as Co-Portfolio | |
| | | Manager | Mr. Peery has been employed by |
| | | for the Funds (or | Hennessy Advisors, Inc., the Funds’ |
| | | Predecessor Funds) | investment advisor, since 2002. |
| | | | |
Winsor (Skip) Aylesworth(1) | Portfolio Manager | 1 year term | Mr. Aylesworth has been Portfolio |
| Age: 67 | and | | Manager of the Gas Utility Index Fund |
| Address: | Vice President | Served since | since 1998 and Portfolio Manager of |
| c/o Hennessy Advisors, Inc. | | October 2012 | the Technology Fund since inception. |
| 101 Federal Street | | for the Funds (or | |
| Suite 1900 | | Predecessor Funds) | Mr. Aylesworth previously served as |
| Boston, MA 02110 | | | Executive Vice President of The FBR |
| | | | Funds from 1999 to October 2012. |
| | | | |
Ryan Kelley(1) | Portfolio Manager | 1 year term | Mr. Kelley has been a Portfolio Manager |
| Age: 42 | and | | of the Gas Utility Index Fund (formerly |
| Address: | Vice President | Served since | the FBR Gas Utility Index Fund), the |
| c/o Hennessy Advisors, Inc. | | March 2013 | Small Cap Financial Fund (formerly the |
| 1340 Environ Way | | for the Funds (or | FBR Small Cap Financial Fund), and the |
| Chapel Hill, NC 27517 | | Predecessor Funds) | Large Cap Financial Fund (formerly the |
| | | | FBR Large Cap Financial Fund) since |
| | | | October 2014. From March 2013 |
| | | | through September 2014, he served |
| | | | as a Co-Portfolio Manager of the same |
| | | | funds. Prior to that, he was a Portfolio |
| | | | Analyst of the Hennessy Funds. |
| | | | |
| | | | Mr. Kelley previously served as Portfolio |
| | | | Manager of The FBR Funds from |
| | | | January 2008 to October 2012. |
(1) All Officers of the Hennessy Funds and employees of the Manager are Interested Persons of the Funds.
(This Page Intentionally Left Blank.)
HENNESSY FUNDS 1-800-966-4354
Expense Example (Unaudited)
October 31, 2014
As a shareholder of the Fund, you incur two types of costs: (1) transaction costs, including sales charges (loads) on purchase payments, reinvested dividends, or other distributions; redemption fees; and exchange fees; and (2) ongoing costs, including management fees; service fees; and other Fund expenses. This Example is intended to help you understand your ongoing costs (in dollars) of investing in the Fund and to compare these costs with the ongoing costs of investing in other mutual funds. The Example is based on an investment of $1,000 invested at the beginning of the period and held for the entire period from May 1, 2014 through October 31, 2014.
Actual Expenses
The first line of the table below under the “Investor Class” and “Institutional Class” headings provides information about actual account values and actual expenses. Although the Fund charges no sales loads or transaction fees, you will be assessed fees for outgoing wire transfers, returned checks and stop payment orders at prevailing rates charged by U.S. Bancorp Fund Services, LLC, the Fund’s transfer agent. If you request that a redemption be made by wire transfer, currently a $15.00 fee is charged by the Fund’s transfer agent. IRA accounts will be charged a $15.00 annual maintenance fee. The example below includes, but is not limited to, management fees, shareholder servicing fees, fund accounting, custody, and transfer agent fees. However, the example below does not include portfolio trading commissions and related expenses, and other extraordinary expenses as determined under generally accepted accounting principles. You may use the information in this line, together with the amount you invested, to estimate the expenses that you paid over the period. Simply divide your account value by $1,000 (for example, an $8,600 account value divided by $1,000 = 8.6), then multiply the result by the number in the first line of the table under the “Investor Class” and “Institutional Class” headings in the column entitled “Expenses Paid During Period” to estimate the expenses you paid on your account during this period.
Hypothetical Example for Comparison Purposes
The second line of the table below under the “Investor Class” and “Institutional Class” headings provides information about hypothetical account values and hypothetical expenses based on the Fund’s actual expense ratios and an assumed rate of return of 5% per year before expenses, which is not the Fund’s actual return. The hypothetical account values and expenses may not be used to estimate the actual ending account balance or expenses you paid for the period. You may use this information to compare the ongoing costs of investing in the Fund and other funds. To do so, compare this 5% hypothetical example with the 5% hypothetical examples that appear in the shareholder reports of the other funds. Please note that the expenses shown in the table are meant to highlight your ongoing costs only and do not reflect any transactional costs, such as sales charges (loads), or exchange fees. Therefore, the second line of the table under the “Investor Class” and “Institutional Class” headings is useful in comparing ongoing costs only, and will not help you determine the relative total costs of owning different funds. In addition, if these transactional costs were included, your costs would have been higher.
| | Beginning | Ending | Expenses Paid |
| | Account Value | Account Value | During Period(1) |
| | 5/1/14 | 10/31/14 | 5/1/14 – 10/31/14 |
| Investor Class | | | |
| | | | |
| Actual | $1,000.00 | $1,088.60 | $6.32 |
| | | | |
| Hypothetical (5% return | | | |
| before expenses) | $1,000.00 | $1,019.16 | $6.11 |
| | | | |
| Institutional Class | | | |
| | | | |
| Actual | $1,000.00 | $1,089.70 | $5.16 |
| | | | |
| Hypothetical (5% return | | | |
| before expenses) | $1,000.00 | $1,020.27 | $4.99 |
| (1) | Expenses are equal to the Fund’s expense ratio of 1.20% for Investor Class shares or 0.98% for Institutional Class shares, as applicable, multiplied by the average account value over the period, multiplied by 184/365 days (to reflect one-half year period). |
HENNESSY FUNDS 1-800-966-4354
Proxy Voting
A description of the policies and procedures the Fund uses to determine how to vote proxies relating to portfolio securities is available without charge: (1) by calling 1-800-966-4354; (2) on the Hennessy Funds’ website at hennessyfunds.com; or (3) on the U.S. Securities and Exchange Commission’s (the “SEC”) website at www.sec.gov. The Fund’s proxy voting record is available on both the Hennessy Funds’ website at hennessyfunds.com and the SEC’s website at www.sec.gov no later than August 31 for the prior 12 months ending June 30.
Quarterly Filings on Form N-Q
The Fund files its complete schedule of portfolio holdings with the SEC for the first and third quarters of each fiscal year on Form N-Q. The Fund’s Forms N-Q are available on the SEC’s website at www.sec.gov. The Fund’s Forms N-Q may be reviewed and copied at the SEC’s Public Reference Room in Washington, DC and information on the operation of the Public Reference Room may be obtained by calling 1-800-SEC-0330. Information included in the Fund’s Forms N-Q will also be available upon request by calling 1-800-966-4354.
Householding
To help keep the Fund’s costs as low as possible, we generally deliver a single copy of most financial reports and prospectuses to shareholders who share an address, even if the accounts are registered under different names. This process, known as “householding,” does not apply to account statements. You may, of course, request an individual copy of a prospectus or financial report at any time. If you would like to receive separate mailings, please call the Administrator at 1-800-261-6950 or 1-414-765-4124 and we will begin individual delivery within 30 days of your request. If your account is held through a financial institution or other intermediary, please contact them directly to request individual delivery.
Privacy Policy
We collect the following non-public personal information about you:
• information we receive from you on or in applications or other forms, correspondence, or conversations, including, but not limited to, your name, address, phone number, social security number, assets, income and date of birth;
and
• information about your transactions with us, our affiliates, or others, including, but not limited to, your account number and balance, payment history, parties to transactions, cost basis information and other financial information.
We do not disclose any non-public personal information about our current or former shareholders to nonaffiliated third parties, except as permitted by law. For example, we are permitted by law to disclose all of the information we collect, as described above, to our Transfer Agent to process your transactions. Furthermore, we restrict access to your non-public personal information to those persons who require such information to provide products or services to you. We maintain physical, electronic and procedural safeguards that comply with federal standards to guard your non-public personal information.
In the event that you hold shares of the Fund through a financial intermediary, including, but not limited to, a broker-dealer, bank or trust company, the privacy policy of your financial intermediary would govern how your non-public personal information would be shared with nonaffiliated third parties.
HENNESSY FUNDS 1-800-966-4354
For information, questions or assistance, please call
The Hennessy Funds
1-800-966-4354 or 1-415-899-1555
INVESTMENT ADVISOR
Hennessy Advisors, Inc.
7250 Redwood Blvd., Suite 200
Novato, California 94945
ADMINISTRATOR,
TRANSFER AGENT,
DIVIDEND PAYING AGENT &
SHAREHOLDER SERVICING AGENT
U.S. Bancorp Fund Services, LLC
P.O. Box 701
Milwaukee, Wisconsin 53201-0701
CUSTODIAN
U.S. Bank N.A.
Custody Operations
1555 North River Center Dr., Suite 302
Milwaukee, Wisconsin 53212
TRUSTEES
Neil J. Hennessy
Robert T. Doyle
J. Dennis DeSousa
Gerald P. Richardson
COUNSEL
Foley & Lardner LLP
777 East Wisconsin Avenue
Milwaukee, Wisconsin 53202-5306
INDEPENDENT REGISTERED
PUBLIC ACCOUNTING FIRM
KPMG LLP
777 East Wisconsin Avenue
Milwaukee, Wisconsin 53202-5306
DISTRIBUTOR
Quasar Distributors, LLC
615 East Michigan Street
Milwaukee, Wisconsin 53202
hennessyfunds.com | 1-800-966-4354
This report has been prepared for shareholders and may be distributed to
others only if preceded or accompanied by a current prospectus.
ANNUAL REPORT
OCTOBER 31, 2014
HENNESSY FOCUS FUND
Investor Class HFCSX
Institutional Class HFCIX
hennessyfunds.com | 1-800-966-4354
(This Page Intentionally Left Blank.)
Contents
| Letter to Shareholders | | 2 |
| Performance Overview | | 4 |
| Financial Statements | | |
| Schedule of Investments | | 7 |
| Statement of Assets and Liabilities | | 11 |
| Statement of Operations | | 12 |
| Statements of Changes in Net Assets | | 13 |
| Financial Highlights | | 14 |
| Notes to the Financial Statements | | 18 |
| Report of Independent Registered Public Accounting Firm | | 25 |
| Trustees and Officers of the Fund | | 26 |
| Expense Example | | 30 |
| Proxy Voting | | 32 |
| Quarterly Filings on Form N-Q | | 32 |
| Householding | | 32 |
| Privacy Policy | | 33 |
HENNESSY FUNDS 1-800-966-4354
December 2014
Dear Shareholder:
As I look back at 2014, I realize that in this age of rapidly evolving technology, information is delivered and absorbed so quickly that it is difficult to remember what happened last week, let alone what’s happened over the course of an entire year. That is why I’d like to take a moment to recall some of the year’s highs and lows, economically, politically and socially, here in the U.S. and around the globe. 2014 was scarred by political partisanship, civil unrest in the U.S., Ukraine and many other countries, the arrival of terrorist group ISIS, the tragedies of school shootings and natural disasters, and the frightening outbreak of Ebola. However, there were also positive events this year: we survived a government shutdown over healthcare reform, jobs reports have been consistently, albeit anemically, improving, and home prices remained relatively stable, after recovering significantly in 2013. And, important to us here at Hennessy, our hometown team, the San Francisco Giants, won their third World Series in just five years!
A significant event for the financial industry this past year was the confirmation of Janet Yellen as Chair of the Federal Reserve, which served to calm the nerves of business and political leaders alike. I believe Yellen’s leadership will benefit U.S. business owners, as the Fed continues to be a voice of reason in a sea of political and economic rhetoric. The Fed has also supported the economy and corporate America by helping keep interest rates reasonable and low.
The stock market has continued its determined comeback from the lows of 2009, setting multiple record highs in recent months. The U.S. financial markets have provided strong returns over the past twelve-month period ended October 31, 2014, with the Dow Jones Industrial Average (DJIA) returning over 14% and S&P 500 Index returning over 17% during the period. The DJIA currently has a dividend yield of 2.2%, which is equal to that of a 10-Year U.S. Treasury, which is currently also yielding 2.2%. I continue to believe that investments in high-yielding, high-quality stocks have the potential to not only provide income but also the potential for stock price appreciation as well. Fixed income investing has run its course, in my opinion, and many individuals are currently benefiting from the return to investing in equities that possess strong fundamentals. American investors are slowly migrating from fixed income to equities. Currently, 54% of Americans invest in stocks, and I do expect this percentage to increase, especially if interest rates move higher.
For the past several years, U.S. corporations have been driving shareholder value by making acquisitions, initiating and raising dividends, investing in internal infrastructure and buying back stock. However, this year I began to see a shift from those strategies. I believe the easier to execute acquisitions are a thing of the past, and firms now have to be even more creative to execute accretive deals. I also believe that while firms may continue to initiate dividends, fewer firms will raise their dividends and fewer firms will participate in stock buyback programs going forward. What will these cash-rich companies do with their capital if they are not raising dividends or buying back stock? I believe they may begin to initiate capital expenditure programs that could truly benefit economic growth.
Liquidity and monetary conditions are supportive, causing the cost of capital to be very low. I believe firms will choose to spend capital to expand their sales, and they may even begin to hire in earnest. Once a company begins to move in this way, the cost to
defer becomes real for competitors. With almost $3 trillion in cash and short-term investments sitting on the balance sheets of the S&P 500 companies, a strategic shift by firms to spend their idle capital, while slow, could potentially further economic growth in the U.S. in my opinion.
Economic progress and growth remain slow, yet steady, and unemployment, though improving, remains high. Oil prices have fallen, giving consumers a bit more discretionary income. While the midterm elections may not end all of the gridlock in Washington, hopefully we will receive clarity on the political headwinds of taxes and regulations, which have not improved over the past several years.
The markets have had several quarters without any truly significant downturn. The pullbacks we recently experienced, most notably in July and October, were short-lived, as evidenced by the quick rebound to record high market levels. I firmly believe that we are in a secular bull market, and I continue to tell investors to try to remain calm in the face of volatility and continue to focus on the strong, long-term fundamentals that are evident in the market today. Many companies continue to have strong balance sheets, with record cash flows and profits. With this current bull market in its fifth year, investors should expect some volatility.
I am encouraged by the strong returns for the major U.S. financial market indices and by the performance of the Hennessy Funds over the past year. Thank you for your continued confidence and investment in our products. If you have any questions or would like to speak with us directly, please don’t hesitate to call us at (800) 966-4354.
Best regards,
Neil J. Hennessy
President and Chief Investment Officer
Past performance does not guarantee future results.
Mutual fund investing involves risk. Principal loss is possible.
Opinions expressed are those of Neil Hennessy and are subject to change, are not guaranteed and should not be considered investment advice.
The Dow Jones Industrial Average and S&P 500 Index are unmanaged indices commonly used to measure the performance of U.S. stocks. One cannot invest directly in an index.
Cash flow can be used as an indication of a company’s financial strength. A firm’s cash flow is the movement of cash in and out of the firm in the form of payments to suppliers and collections from customers. Dividend Yield is calculated as the annual dividends paid by a company divided by the price of a share of their stock.
HENNESSY FUNDS 1-800-966-4354
Performance Overview (Unaudited)
The opinions expressed in the following commentary reflect those of the Portfolio Managers as of the date written. Any such opinions are subject to change based on market or other conditions and are not guaranteed. These opinions may not be relied upon as investment advice. Investment decisions for the Fund are based on multiple factors, and may not be relied upon as an indication of trading intent on behalf of the Fund. Security positions can and do change.
CHANGE IN VALUE OF $10,000 INVESTMENT
This chart assumes an initial gross investment of $10,000 made on October 31, 2004. Returns shown include the reinvestment of all dividends. Returns shown do not reflect the deduction of taxes that a shareholder would pay on Fund distributions or the redemption of Fund shares.
AVERAGE ANNUAL TOTAL RETURN FOR PERIODS ENDED OCTOBER 31, 2014
| | One | Five | Ten |
| | Year | Years | Years |
| Hennessy Focus Fund – | | | |
| Investor Class (HFCSX) | 11.05% | 18.78% | 11.21% |
| Hennessy Focus Fund – | | | |
| Institutional Class (HFCIX) | 11.40% | 19.15% | 11.44% |
Russell 3000® Index | 16.07% | 17.01% | 8.55% |
Russell MidCap® Growth Index | 14.59% | 18.73% | 10.17% |
Expense ratios: 1.44% (Investor Class); 1.14% (Institutional Class)
Performance data quoted represents past performance; past performance does not guarantee future results. The investment return and principal value of an investment will fluctuate so that an investor’s shares, when redeemed, may be worth more or less than their original cost. Current performance of the Fund may be lower or higher than the performance quoted. Performance data current to the most recent month end may be obtained by visiting hennessyfunds.com. Performance for periods prior to October 26, 2012 is that of the FBR Focus Fund.
The expense ratios presented are from the most recent prospectus.
PERFORMANCE NARRATIVE
BROAD RUN INVESTMENT MANAGEMENT, LLC, SUB-ADVISOR
Portfolio Managers Brian Macauley, CFA, David Rainey, CFA, and Ira Rothberg, CFA, Broad Run Investment Management, LLC (sub-advisor).
Over the previous twelve months, how did the Fund perform and what factors contributed to this performance?
For the twelve-month period ended October 31, 2014, the Investor Class of the Hennessy Focus Fund returned 11.05%, underperforming the Russell 3000® Index and the Russell Midcap® Growth Index, which returned 16.07% and 14.59%, respectively, but outperforming the Morningstar Mid-Cap Growth Category Average, which returned 10.21%, for the same period.
Leading contributors to the Fund’s performance were O’Reilly Automotive, Inc., Markel Corporation and American Tower, Inc., all of which the Fund continues to hold. Each of these companies produced attractive growth in earnings over the period, which helped drive appreciation in their stocks. Leading detractors from the Fund’s performance were Gaming & Leisure Properties, Inc., Dick’s Sporting Goods, Inc. and Roadrunner Transportation Services, Inc. While each of these companies also grew their earnings for the period, the growth was quite modest and well below each company’s potential. Gaming & Leisure Properties, an acquisition oriented business, suffered from a dearth of acquisition deals. Dick’s Sporting Goods suffered from an industry-wide slowdown in golf and hunting product sales. Roadrunner Transportation’s profit margins have been squeezed by a lag in passing through cost inflation. We believe that these challenges are temporary, so the Fund continues to hold these investments.
We invest with a long-term time horizon and encourage shareholders to do the same. Despite the discussion of one-year results referenced above, we encourage fellow shareholders to evaluate the Fund’s performance over five- and ten-year periods since shorter time periods can be influenced by many transitory issues unrelated to the growth in intrinsic value of the Fund’s holdings.
Additional Portfolio Manager commentary and related investment outlook:
Selectivity is a hallmark of the Fund. We focus on holding about two dozen of the best investments we can find from a universe of approximately 2,500 U.S. public companies. At the same time, in choosing these investments we are very mindful to seek to avoid situations that expose the Fund to large permanent capital losses. Our view is that long-term performance is determined just as much by what we choose to avoid as by what we choose to own in the Fund. For example, healthy skepticism and a disciplined valuation overlay enabled the Fund to largely avoid the destruction wrought upon the technology sector during the internet bubble collapse, and also to largely avoid direct exposure to the mortgage debacle that precipitated the Great Recession.
This approach can lead us to heavy investment exposure in some sectors and little or no exposure in other sectors. For example, today the Fund has exposure to just seven of Morningstar’s twelve market sectors, and even then with very different weightings than the overall market. Since the Fund’s portfolio and sector exposure looks so different than the market indices, we inevitably get performance results that deviate from the market.
We accept that our approach may sometimes lead to short-term periods of underperformance relative to the market and the Fund’s benchmark indices, but we believe this has also allowed the Fund to outperform over long periods of time.
We continue to find select opportunities to enhance the Fund’s portfolio. During the first half of the year, we established positions in Brookfield Asset Management, Inc. and
HENNESSY FUNDS 1-800-966-4354
Mistras Group, Inc., and during the second half of the year, we substantially added to each position. We believe that these new portfolio companies were bought at relatively low valuations and have the potential to produce high-teens average annual earnings growth over the next five years. During the year we eliminated positions in T. Rowe Price, Inc., News Corporation, and UTi Worldwide, Inc., due to concern about their fundamental business prospects. We also sold Bally Technologies, Inc. and Micros Systems, Inc. when they received attractive buyout offers.
We continue to have a positive long-term outlook for the Fund. The Fund’s holdings are predominately a collection of what we believe to be secular growth businesses trading at reasonable valuations. Our expectation is that the Fund will own these businesses for five years or longer. Over this long-term time horizon, we expect that the Fund’s returns will likely be determined primarily by the growth in earnings power of these businesses.
The Russell 3000® Index is an unmanaged index commonly used to measure the performance of U.S. stocks. The Russell Midcap® Growth Index is an unmanaged index commonly used to measure the performance of U.S. medium-capitalization growth stocks. You cannot invest directly in an index. Performance data for an index does not reflect any deductions for fees, expenses or taxes. The Fund is non-diversified, meaning it concentrates its assets in fewer holdings than a diversified fund and is therefore more exposed to individual stock volatility than a diversified fund. The Fund may invest in small- and medium-capitalization companies, which may have limited liquidity and greater price volatility than large-capitalization companies. References to specific securities should not be considered a recommendation to buy or sell any security. Fund holdings and sector allocations are subject to change. Please refer to the Schedule of Investments included in this report for additional portfolio information.
Earnings growth is not a measure of the Fund’s future performance.
Each Morningstar category average represents a universe of funds with similar investment objectives. © Morningstar, Inc. All Rights Reserved. The information contained herein: 1) is proprietary to Morningstar; 2) may not be copied or distributed and 3) is not warranted to be accurate, complete or timely. Neither Morningstar nor its content providers are responsible for any damages or losses arising from any use of this information. Past performance does not guarantee future results.
Financial Statements
HENNESSY FOCUS FUND
As of October 31, 2014
(% of Net Assets)
| TOP TEN HOLDINGS (EXCLUDING CASH/CASH EQUIVALENTS) | % NET ASSETS |
| O’Reilly Automotive, Inc. | 10.55% |
| American Tower Corp., Class A | 9.66% |
| Markel Corp. | 9.17% |
| CarMax, Inc. | 7.84% |
| Twenty First Century Fox, Inc. | 6.12% |
| Encore Capital Group, Inc. | 5.01% |
| Brookfield Asset Management, Inc. | 5.01% |
| Aon PLC | 4.89% |
| The Charles Schwab Corp. | 4.50% |
| Gaming & Leisure Properties, Inc. | 4.27% |
Note: For presentation purposes, the Fund has grouped some of the industry categories. For purposes of categorizing securities for compliance with Section 8(b)(1) of the Investment Company Act of 1940, the Fund uses more specific industry classifications.
HENNESSY FUNDS 1-800-966-4354
| | COMMON STOCKS – 75.24% | | Number | | | | | | % of | |
| | | | of Shares | | | Value | | | Net Assets | |
| | Consumer Discretionary – 29.10% | | | | | | | | | |
| | CarMax, Inc. (a) | | | 2,097,740 | | | $ | 117,284,643 | | | | 7.84 | % |
| | Dick’s Sporting Goods, Inc. | | | 1,165,767 | | | | 52,890,849 | | | | 3.54 | % |
| | O’Reilly Automotive, Inc. (a) | | | 897,900 | | | | 157,922,652 | | | | 10.55 | % |
| | Penn National Gaming, Inc. (a) | | | 1,197,772 | | | | 15,678,835 | | | | 1.05 | % |
| | Twenty First Century Fox, Inc. | | | 2,657,204 | | | | 91,620,394 | | | | 6.12 | % |
| | | | | | | | | 435,397,373 | | | | 29.10 | % |
| | | | | | | | | | | | | | |
| | Energy – 3.22% | | | | | | | | | | | | |
| | World Fuel Services Corp. | | | 1,168,204 | | | | 48,176,733 | | | | 3.22 | % |
| | | | | | | | | | | | | | |
| | Financials – 30.78% | | | | | | | | | | | | |
| | Aon PLC (c) | | | 851,000 | | | | 73,186,000 | | | | 4.89 | % |
| | Brookfield Asset Management, Inc. (c) | | | 1,530,035 | | | | 74,925,814 | | | | 5.01 | % |
| | Diamond Hill Investment Group, Inc. | | | 151,439 | | | | 20,291,312 | | | | 1.35 | % |
| | Encore Capital Group, Inc. (a) (d) | | | 1,646,620 | | | | 74,937,676 | | | | 5.01 | % |
| | Markel Corp. (a) | | | 198,637 | | | | 137,236,317 | | | | 9.17 | % |
| | Marlin Business Services Corp. | | | 604,737 | | | | 12,784,140 | | | | 0.85 | % |
| | The Charles Schwab Corp. | | | 2,346,699 | | | | 67,279,860 | | | | 4.50 | % |
| | | | | | | | | 460,641,119 | | | | 30.78 | % |
| | | | | | | | | | | | | | |
| | Health Care – 1.44% | | | | | | | | | | | | |
| | Henry Schein, Inc. (a) | | | 180,000 | | | | 21,605,400 | | | | 1.44 | % |
| | | | | | | | | | | | | | |
| | Industrials – 5.50% | | | | | | | | | | | | |
| | American Woodmark Corp. (a) (d) | | | 817,409 | | | | 33,440,202 | | | | 2.23 | % |
| | Mistras Group, Inc. (a) | | | 643,294 | | | | 10,607,918 | | | | 0.71 | % |
| | Roadrunner Transportation Systems, Inc. (a) | | | 904,200 | | | | 18,635,562 | | | | 1.25 | % |
| | Simpson Manufacturing Company, Inc. | | | 590,832 | | | | 19,544,723 | | | | 1.31 | % |
| | | | | | | | | 82,228,405 | | | | 5.50 | % |
| | | | | | | | | | | | | | |
| | Information Technology – 5.20% | | | | | | | | | | | | |
| | Google, Inc. (a) | | | 68,984 | | | | 38,567,575 | | | | 2.58 | % |
| | Google, Inc., Class A (a) | | | 68,984 | | | | 39,173,944 | | | | 2.62 | % |
| | | | | | | | | 77,741,519 | | | | 5.20 | % |
| | Total Common Stocks | | | | | | | | | | | | |
| | (Cost $622,584,108) | | | | | | | 1,125,790,549 | | | | 75.24 | % |
The accompanying notes are an integral part of these financial statements.
| | REITS – 13.93% | | Number | | | | | | % of | |
| | | | of Shares | | | Value | | | Net Assets | |
| | Financials – 13.93% | | | | | | | | | |
| | American Tower Corp., Class A | | | 1,483,679 | | | $ | 144,658,702 | | | | 9.66 | % |
| | Gaming & Leisure Properties, Inc. | | | 2,043,407 | | | | 63,856,469 | | | | 4.27 | % |
| | | | | | | | | 208,515,171 | | | | 13.93 | % |
| | Total REITS | | | | | | | | | | | | |
| | (Cost $81,851,999) | | | | | | | 208,515,171 | | | | 13.93 | % |
| | | | | | | | | | | | | | |
| | SHORT-TERM INVESTMENTS – 11.00% | | | | | | | | | | | | |
| | Money Market Funds – 11.00% | | | | | | | | | | | | |
| | Federated Government Obligations Fund – Class I, 0.01% (b) | | | 74,000,000 | | | | 74,000,000 | | | | 4.95 | % |
| | Federated Treasury Obligations Fund, 0.01% (b) | | | 16,545,872 | | | | 16,545,872 | | | | 1.11 | % |
| | Fidelity Government Portfolio – Institutional Class, 0.01% (b) | | | 74,000,000 | | | | 74,000,000 | | | | 4.94 | % |
| | | | | | | | | 164,545,872 | | | | 11.00 | % |
| | Total Short-Term Investments | | | | | | | | | | | | |
| | (Cost $164,545,872) | | | | | | | 164,545,872 | | | | 11.00 | % |
| | | | | | | | | | | | | | |
| | Total Investments | | | | | | | | | | | | |
| | (Cost $868,981,979) – 100.17% | | | | | | | 1,498,851,592 | | | | 100.17 | % |
| | Liabilities in Excess | | | | | | | | | | | | |
| | of Other Assets – (0.17)% | | | | | | | (2,511,359 | ) | | | (0.17 | )% |
| | TOTAL NET ASSETS – 100.00% | | | | | | $ | 1,496,340,233 | | | | 100.00 | % |
Percentages are stated as a percent of net assets.
REIT – Real Estate Investment Trust
| | (a) | Non-income producing security. |
| | (b) | The rate listed is the fund’s 7-day yield as of October 31, 2014. |
| | (c) | U.S. traded security of a foreign corporation. |
| | (d) | Investment represents five percent or more of the outstanding voting securities of the issuer, and is or was an affiliate of the Hennessy Focus Fund, as defined in the Investment Company Act of 1940, at or during the year ended October 31, 2014. Details of transactions with these affiliated companies for the year ended October 31, 2014, are as follow: |
| | Issuer | American Woodmark Corp. | | Encore Capital Group, Inc. | |
| | Beginning Cost | | $ | 25,862,840 | | | | $ | 19,557,051 | | |
| | Purchase Cost | | $ | 518,661 | | | | $ | 29,460,269 | | |
| | Sales Cost | | $ | — | | | | $ | — | | |
| | Ending Cost | | $ | 26,381,501 | | | | $ | 49,017,320 | | |
| | Dividend Income | | $ | — | | | | $ | — | | |
| | Shares | | | 817,409 | | | | | 1,646,620 | | |
| | Market Value | | $ | 33,440,202 | | | | $ | 74,937,676 | | |
The accompanying notes are an integral part of these financial statements.
HENNESSY FUNDS 1-800-966-4354
Summary of Fair Value Exposure at October 31, 2014
The following is a summary of the inputs used to value the Fund’s net assets as of October 31, 2014 (See Note 3 in the accompanying notes to the financial statements):
| Common Stocks | | Level 1 | | | Level 2 | | | Level 3 | | | Total | |
| Consumer Discretionary | | $ | 435,397,373 | | | $ | — | | | $ | — | | | $ | 435,397,373 | |
| Energy | | | 48,176,733 | | | | — | | | | — | | | | 48,176,733 | |
| Financials | | | 460,641,119 | | | | — | | | | — | | | | 460,641,119 | |
| Health Care | | | 21,605,400 | | | | — | | | | — | | | | 21,605,400 | |
| Industrials | | | 82,228,405 | | | | — | | | | — | | | | 82,228,405 | |
| Information Technology | | | 77,741,519 | | | | — | | | | — | | | | 77,741,519 | |
| Total Common Stocks | | $ | 1,125,790,549 | | | $ | — | | | $ | — | | | $ | 1,125,790,549 | |
| REITS | | | | | | | | | | | | | | | | |
| Financials | | $ | 208,515,171 | | | $ | — | | | $ | — | | | $ | 208,515,171 | |
| Total REITS | | $ | 208,515,171 | | | $ | — | | | $ | — | | | $ | 208,515,171 | |
| Short-Term Investments | | | | | | | | | | | | | | | | |
| Money Market Funds | | $ | 164,545,872 | | | $ | — | | | $ | — | | | $ | 164,545,872 | |
| Total Short-Term Investments | | $ | 164,545,872 | | | $ | — | | | $ | — | | | $ | 164,545,872 | |
| Total Investments | | $ | 1,498,851,592 | | | $ | — | | | $ | — | | | $ | 1,498,851,592 | |
Transfers between levels are recognized at the end of the reporting period. During the year ended October 31, 2014, the Fund recognized no transfers between levels.
The accompanying notes are an integral part of these financial statements.
Financial Statements
Statement of Assets and Liabilities as of October 31, 2014 |
| ASSETS: | | | |
| Investments in unaffiliated securities, at value (cost $793,583,158) | | $ | 1,390,473,714 | |
| Investments in affiliated securities, at value (cost $75,398,821) | | | 108,377,878 | |
| Dividends and interest receivable | | | 195,815 | |
| Receivable for fund shares sold | | | 1,251,675 | |
| Prepaid expenses and other assets | | | 62,185 | |
| Total Assets | | | 1,500,361,267 | |
| | | | | |
| LIABILITIES: | | | | |
| Payable for fund shares redeemed | | | 2,152,933 | |
| Payable to advisor | | | 1,087,730 | |
| Payable to administrator | | | 254,071 | |
| Payable to auditor | | | 19,104 | |
| Accrued distribution fees | | | 258,812 | |
| Accrued trustees fees | | | 2,250 | |
| Accrued expenses and other payables | | | 246,134 | |
| Total Liabilities | | | 4,021,034 | |
| NET ASSETS | | $ | 1,496,340,233 | |
| | | | | |
| NET ASSETS CONSIST OF: | | | | |
| Capital stock | | $ | 753,170,304 | |
| Accumulated net realized gain on investments | | | 113,300,316 | |
| Unrealized net appreciation on investments | | | 629,869,613 | |
| Total Net Assets | | $ | 1,496,340,233 | |
| | | | | |
| NET ASSETS | | | | |
| Investor Class: | | | | |
| Shares authorized (no par value) | | Unlimited | |
| Net assets applicable to outstanding Investor Class shares | | $ | 1,213,029,559 | |
| Shares issued and outstanding | | | 17,462,884 | |
| Net asset value, offering price and redemption price per share | | $ | 69.46 | |
| | | | | |
| Institutional Class: | | | | |
| Shares authorized (no par value) | | Unlimited | |
| Net assets applicable to outstanding Institutional Class shares | | $ | 283,310,674 | |
| Shares issued and outstanding | | | 4,018,607 | |
| Net asset value, offering price and redemption price per share | | $ | 70.50 | |
The accompanying notes are an integral part of these financial statements.
HENNESSY FUNDS 1-800-966-4354
Financial Statements
Statement of Operations for the year ended October 31, 2014 |
| INVESTMENT INCOME: | | | |
Dividend income(1) | | $ | 26,032,000 | |
| Interest income | | | 16,249 | |
| Total investment income | | | 26,048,249 | |
| | | | | |
| EXPENSES: | | | | |
| Investment advisory fees (See Note 5) | | | 13,038,408 | |
| Distribution fees – Investor Class (See Note 5) | | | 2,996,786 | |
| Administration, fund accounting, custody and transfer agent fees | | | 1,643,287 | |
| Sub-transfer agent expenses – Investor Class (See Note 5) | | | 1,441,830 | |
| Sub-transfer agent expenses – Institutional Class (See Note 5) | | | 155,050 | |
| Reports to shareholders | | | 145,348 | |
| Federal and state registration fees | | | 65,257 | |
| Compliance expense | | | 21,488 | |
| Legal fees | | | 20,972 | |
| Trustees’ fees and expenses | | | 20,355 | |
| Audit fees | | | 19,100 | |
| Other expenses | | | 84,547 | |
| Total expenses | | | 19,652,428 | |
| NET INVESTMENT INCOME | | $ | 6,395,821 | |
| | | | | |
| REALIZED AND UNREALIZED GAINS (LOSSES): | | | | |
| Net realized gain on investments | | $ | 114,548,203 | |
| Net change in unrealized appreciation on investments | | | 28,663,773 | |
| Net gain on investments | | | 143,211,976 | |
| NET INCREASE IN NET ASSETS RESULTING FROM OPERATIONS | | $ | 149,607,797 | |
| (1) | Net of foreign taxes withheld of $39,904. |
The accompanying notes are an integral part of these financial statements.
Financial Statements
| Statements of Changes in Net Assets |
| | | Year Ended | | | Year Ended | |
| | | October 31, 2014 | | | October 31, 2013 | |
| OPERATIONS: | | | | | | |
| Net investment income (loss) | | $ | 6,395,821 | | | $ | (7,900,190 | ) |
| Net realized gain on investments | | | 114,548,203 | | | | 22,730,911 | |
| Net change in unrealized appreciation on investments | | | 28,663,773 | | | | 258,060,122 | |
| Net increase in net assets resulting from operations | | | 149,607,797 | | | | 272,890,843 | |
| | | | | | | | | |
| DISTRIBUTIONS TO SHAREHOLDERS FROM: | | | | | | | | |
| Net realized gains | | | | | | | | |
| Investor Class | | | (19,269,073 | ) | | | (58,291,075 | ) |
| Institutional Class | | | (3,177,442 | ) | | | (5,349,797 | ) |
| Total distributions | | | (22,446,515 | ) | | | (63,640,872 | ) |
| | | | | | | | | |
| CAPITAL SHARE TRANSACTIONS: | | | | | | | | |
| Proceeds from shares subscribed – Investor Class | | | 274,855,822 | | | | 375,206,953 | |
| Proceeds from shares subscribed – Institutional Class | | | 157,637,486 | | | | 127,598,554 | |
| Dividends reinvested – Investor Class | | | 18,773,429 | | | | 56,748,943 | |
| Dividends reinvested – Institutional Class | | | 2,406,086 | | | | 4,791,826 | |
| Cost of shares redeemed – Investor Class | | | (324,511,295 | )(1) | | | (188,842,828 | )(2) |
| Cost of shares redeemed – Institutional Class | | | (79,720,304 | ) | | | (49,900,885 | ) |
| Net increase in net assets derived | | | | | | | | |
| from capital share transactions | | | 49,441,224 | | | | 325,602,563 | |
| TOTAL INCREASE IN NET ASSETS | | | 176,602,506 | | | | 534,852,534 | |
| | | | | | | | | |
| NET ASSETS: | | | | | | | | |
| Beginning of year | | | 1,319,737,727 | | | | 784,885,193 | |
| End of year | | $ | 1,496,340,233 | | | $ | 1,319,737,727 | |
| Undistributed net investment loss, end of year | | $ | — | | | $ | (7,643,708 | ) |
| | | | | | | | | |
| CHANGES IN SHARES OUTSTANDING: | | | | | | | | |
| Shares sold – Investor Class | | | 4,221,654 | | | | 6,493,694 | |
| Shares sold – Institutional Class | | | 2,388,952 | | | | 2,140,491 | |
| Shares issued to holders as | | | | | | | | |
| reinvestment of dividends – Investor Class | | | 291,422 | | | | 1,149,695 | |
| Shares issued to holders as | | | | | | | | |
| reinvestment of dividends – Institutional Class | | | 36,903 | | | | 96,221 | |
| Shares redeemed – Investor Class | | | (4,978,901 | ) | | | (3,380,133 | ) |
| Shares redeemed – Institutional Class | | | (1,204,269 | ) | | | (920,448 | ) |
| Net increase in shares outstanding | | | 755,761 | | | | 5,579,520 | |
| (1) | Net of redemption fees of $949 related to redemption fees imposed by the FBR Focus Fund during a prior year but not received until fiscal year 2014. |
| (2) | Net of redemption fees of $1,716 related to redemption fees imposed by the FBR Focus Fund during a prior year but not received until fiscal year 2013. |
The accompanying notes are an integral part of these financial statements.
HENNESSY FUNDS 1-800-966-4354
Financial Statements
For an Investor Class share outstanding throughout each year
PER SHARE DATA:
Net asset value, beginning of year
Income from investment operations:
Net investment income (loss)
Net realized and unrealized gains on investments
Total from investment operations
Less distributions:
Dividends from net investment income
Dividends from net realized gains
Total distributions
Paid-in capital from redemption fees
Net asset value, end of year
TOTAL RETURN
SUPPLEMENTAL DATA AND RATIOS:
Net assets, end of year (millions)
Ratio of expenses to average net assets
Ratio of net investment income (loss) to average net assets
Portfolio turnover rate(3)
| (1) | Calculated based on average shares outstanding method. |
| (2) | Amount is less than $0.01. |
| (3) | Portfolio turnover is calculated on the basis of the Fund as a whole. |
The accompanying notes are an integral part of these financial statements.
| Year Ended October 31, | |
| 2014 | | | 2013 | | | 2012 | | | 2011 | | | 2010 | |
| | | | | | | | | | | | | | |
| $ | 63.58 | | | $ | 51.78 | | | $ | 49.80 | | | $ | 47.57 | | | $ | 37.56 | |
| | | | | | | | | | | | | | | | | | | |
| | | | | | | | | | | | | | | | | | | |
| | 0.27 | | | | (0.32 | ) | | | (0.39 | ) | | | (0.50 | )(1) | | | (0.64 | ) |
| | 6.68 | | | | 16.44 | | | | 7.61 | | | | 4.44 | | | | 10.65 | |
| | 6.95 | | | | 16.12 | | | | 7.22 | | | | 3.94 | | | | 10.01 | |
| | | | | | | | | | | | | | | | | | | |
| | | | | | | | | | | | | | | | | | | |
| | — | | | | — | | | | — | | | | — | | | | — | |
| | (1.07 | ) | | | (4.32 | ) | | | (5.24 | ) | | | (1.72 | ) | | | — | |
| | (1.07 | ) | | | (4.32 | ) | | | (5.24 | ) | | | (1.72 | ) | | | — | |
| | 0.00 | (2) | | | 0.00 | (2) | | | 0.00 | (2) | | | 0.01 | | | | 0.00 | (2) |
| $ | 69.46 | | | $ | 63.58 | | | $ | 51.78 | | | $ | 49.80 | | | $ | 47.57 | |
| | | | | | | | | | | | | | | | | | | |
| | 11.05 | % | | | 33.54 | % | | | 16.17 | % | | | 8.35 | % | | | 26.65 | % |
| | | | | | | | | | | | | | | | | | | |
| | | | | | | | | | | | | | | | | | | |
| $ | 1,213.03 | | | $ | 1,139.85 | | | $ | 707.61 | | | $ | 611.34 | | | $ | 670.84 | |
| | 1.41 | % | | | 1.43 | % | | | 1.41 | % | | | 1.44 | % | | | 1.51 | % |
| | 0.41 | % | | | (0.85 | )% | | | (0.79 | )% | | | (1.01 | )% | | | (1.31 | )% |
| | 18 | % | | | 4 | % | | | 13 | % | | | 13 | % | | | 5 | % |
The accompanying notes are an integral part of these financial statements.
HENNESSY FUNDS 1-800-966-4354
Financial Statements
For an Institutional Class share outstanding throughout each year*
PER SHARE DATA:
Net asset value, beginning of year
Income from investment operations:
Net investment income (loss)
Net realized and unrealized gains on investments
Total from investment operations
Less distributions:
Dividends from net investment income
Dividends from net realized gains
Total distributions
Paid-in capital from redemption fees
Net asset value, end of year
TOTAL RETURN
SUPPLEMENTAL DATA AND RATIOS:
Net assets, end of year (millions)
Ratio of expenses to average net assets
Ratio of net investment income (loss) to average net assets
Portfolio turnover rate(3)
| * | Per share amounts have been reinstated on a retroactive basis to reflect a 1:18 reverse stock split effective December 10, 2010. |
| (1) | Calculated based on average shares outstanding method. |
| (2) | Amount is less than $0.01. |
| (3) | Portfolio turnover is calculated on the basis of the Fund as a whole. |
The accompanying notes are an integral part of these financial statements.
| Year Ended October 31, | |
| 2014 | | | 2013 | | | 2012 | | | 2011 | | | 2010 | |
| | | | | | | | | | | | | | |
| $ | 64.32 | | | $ | 52.19 | | | $ | 50.02 | | | $ | 47.64 | | | $ | 37.84 | |
| | | | | | | | | | | | | | | | | | | |
| | | | | | | | | | | | | | | | | | | |
| | 0.35 | | | | (0.13 | ) | | | (0.22 | ) | | | (0.37 | )(1) | | | (0.41 | ) |
| | 6.90 | | | | 16.58 | | | | 7.63 | | | | 4.47 | | | | 10.58 | |
| | 7.25 | | | | 16.45 | | | | 7.41 | | | | 4.10 | | | | 10.17 | |
| | | | | | | | | | | | | | | | | | | |
| | | | | | | | | | | | | | | | | | | |
| | — | | | | — | | | | — | | | | — | | | | (0.37 | ) |
| | (1.07 | ) | | | (4.32 | ) | | | (5.24 | ) | | | (1.72 | ) | | | — | |
| | (1.07 | ) | | | (4.32 | ) | | | (5.24 | ) | | | (1.72 | ) | | | (0.37 | ) |
| | — | | | | — | | | | 0.00 | (2) | | | 0.00 | (2) | | | 0.00 | (2) |
| $ | 70.50 | | | $ | 64.32 | | | $ | 52.19 | | | $ | 50.02 | | | $ | 47.64 | |
| | | | | | | | | | | | | | | | | | | |
| | 11.40 | % | | | 33.94 | % | | | 16.51 | % | | | 8.53 | % | | | 27.32 | % |
| | | | | | | | | | | | | | | | | | | |
| | | | | | | | | | | | | | | | | | | |
| $ | 283.31 | | | $ | 179.89 | | | $ | 77.28 | | | $ | 49.01 | | | $ | 36.81 | |
| | 1.10 | % | | | 1.13 | % | | | 1.12 | % | | | 1.15 | % | | | 1.26 | % |
| | 0.59 | % | | | (0.52 | )% | | | (0.52 | )% | | | (0.76 | )% | | | (1.06 | )% |
| | 18 | % | | | 4 | % | | | 13 | % | | | 13 | % | | | 5 | % |
The accompanying notes are an integral part of these financial statements.
HENNESSY FUNDS 1-800-966-4354
Financial Statements
Notes to Financial Statements October 31, 2014 |
1). ORGANIZATION
The Hennessy Focus Fund (the “Fund”) is a series of Hennessy Funds Trust (the “Trust”), which was organized as a Delaware statutory trust on September 17, 1992. The Fund is an open-end management investment company registered under the Investment Company Act of 1940, as amended. The Fund is a successor to the FBR Focus Fund (the “Predecessor FBR Fund”), a series of The FBR Funds, a Delaware statutory trust, pursuant to a reorganization that took place after the close of business on October 26, 2012. Prior to October 26, 2012, the Fund had no investment operations. As a result of the reorganization, holders of the Investor Class shares of the Predecessor FBR Fund received Investor Class shares of the Fund (the Investor Class shares of the Fund are the successor to the accounting and performance information of the Predecessor FBR Fund), and holders of the Institutional Class shares of the Predecessor FBR Fund received Institutional Class shares of the Fund (the Institutional Class shares of the Fund are the successor to the accounting and performance information of the Predecessor FBR Fund). The investment objective of the Fund is capital appreciation. The Fund is a non-diversified fund.
The Fund offers Investor Class and Institutional Class shares. Each class of shares differs principally in its respective administration, 12b-1 distribution and service fees, shareholder servicing, and transfer agent expenses and sales charges, if any. Each class has identical rights to earnings, assets, and voting privileges, except for class-specific expenses and exclusive rights to vote on matters affecting only an individual class.
2). SIGNIFICANT ACCOUNTING POLICIES
The following is a summary of significant accounting policies consistently followed by the Fund in the preparation of the financial statements. These policies are in conformity with U.S. generally accepted accounting principles (“GAAP”).
| a). | Investment Valuation – All investments in securities are recorded at their estimated fair value, as described in Note 3. |
| | |
| b). | Federal Income Taxes – Provision for federal income taxes or excise taxes has not been made since the Fund has elected to be taxed as a “regulated investment company” and intends to distribute substantially all of its taxable income to its shareholders and otherwise comply with the provisions of the Internal Revenue Code of 1986, as amended, applicable to regulated investment companies. Net investment income or loss and realized gains and losses for federal income tax purposes may differ from that reported on the financial statements because of temporary book and tax basis differences. Temporary differences are primarily the result of the treatment of wash sales for tax reporting purposes. Distributions from net realized gains for book purposes may include short-term capital gains, which are included as ordinary income to shareholders for tax purposes. |
| | |
| | Due to inherent differences in the recognition of income, expenses, and realized gains/losses under GAAP and federal income tax regulations, permanent differences between book and tax basis reporting for the 2014 fiscal year have been identified |
| | and appropriately reclassified on the Statement of Assets and Liabilities. The adjustments are as follow: |
| Undistributed | Accumulated | |
| Net Investment | Net Realized | |
| Income/(Loss) | Gain/(Loss) | Paid-in Capital |
| $1,247,887 | $(1,249,041) | $1,154 |
| c). | Income and Expenses – Dividend income is recognized on the ex-dividend date or as soon as information is available to the Fund. Interest income, which includes the amortization of premium and accretion of discount, is recognized on an accrual basis. The Fund is charged for those expenses that are directly attributable to the portfolio, such as advisory, administration, and certain shareholder service fees. Income, expenses (other than expenses attributable to a specific class), and realized and unrealized gains or losses on investments are allocated to each class of shares based on its respective net assets. |
| | |
| d). | Distributions to Shareholders – Dividends from net investment income for the Fund, if any, are declared and paid out annually, usually in December. Distributions of net realized capital gains, if any, are declared and paid annually, usually in November or December. |
| | |
| e). | Security Transactions – Investment and shareholder transactions are recorded on the trade date. The Fund determines the gain or loss realized from the investment transactions by comparing the original cost of the security lot sold with the net sale proceeds. Discounts and premiums on securities purchased are accreted/amortized over the life of the respective security. |
| | |
| f). | Use of Estimates – The preparation of financial statements in conformity with GAAP requires management to make estimates and assumptions that affect the reported amounts of assets and liabilities and disclosure of contingent assets and liabilities at the date of the financial statements and the reported change in net assets during the reporting period. Actual results could differ from those estimates. |
| | |
| g). | Share Valuation – The net asset value (“NAV”) per share of the Fund is calculated by dividing the sum of the value of the securities held by the Fund, plus cash or other assets, minus all liabilities (including estimated accrued expenses) by the total number of shares outstanding for the Fund, rounded to the nearest cent. The Fund’s shares will not be priced on days the New York Stock Exchange is closed for trading. The offering and redemption price per share for the Fund is equal to the Fund’s NAV per share. |
| | |
| h). | Foreign Currency – Values of investments denominated in foreign currencies, if any, are converted into U.S. dollars using the spot market rate of exchange at the time of valuation. Purchases and sales of investments and income are translated into U.S. dollars using the spot market rate of exchange prevailing on the respective dates of such transactions. The Fund does not isolate the portion of the results of operations resulting from fluctuations in foreign exchange rates on investments from fluctuations resulting from changes in the market prices of securities held. Such fluctuations are included with the net realized and unrealized gain or loss on investments. Foreign investments present additional risks due to currency fluctuations, economic and political factors, lower liquidity, government regulations, differences in accounting standards, and other factors. |
| | |
| i). | Forward Contracts – The Fund may enter into forward currency contracts to reduce its exposure to changes in foreign currency exchange rates on its foreign holdings |
HENNESSY FUNDS 1-800-966-4354
| | and to lock in the U.S. dollar cost of firm purchase and sale commitments for securities denominated in foreign currencies. A forward currency contract is a commitment to purchase or sell a foreign currency at a future date at a negotiated forward rate. The gain or loss arising from the difference between the U.S. dollar cost of the original contract and the value of the foreign currency in U.S. dollars upon closing of such contract is included in net realized gain or loss from foreign currency transactions. During the year ended October 31, 2014, the Fund did not enter into any forward contracts. |
| | |
| j). | Repurchase Agreements – The Fund may enter into repurchase agreements with member banks or security dealers of the Federal Reserve Board whom the investment advisor deems creditworthy. The repurchase price generally equals the price paid by the Fund plus interest negotiated on the basis of current short-term rates. |
| | |
| | Securities pledged as collateral for repurchase agreements are held by the custodian bank until the respective agreements mature. Provisions of the repurchase agreements ensure that the market value of the collateral, including accrued interest thereon, is sufficient to cover the repurchase amount in the event of default of the counterparty. If the counterparty defaults and the value of the collateral declines or if the counterparty enters an insolvency proceeding, realization of the collateral by the Fund may be delayed or limited. |
| | |
| k). | Accounting for Uncertainty in Income Taxes – The Fund has adopted accounting policies regarding recognition and measurement of tax positions taken or expected to be taken on a tax return. The tax returns of the Fund for the prior three fiscal years are open for examination. The Fund has reviewed all open tax years in major jurisdictions and concluded that there is no impact on the Fund’s net assets and no tax liability resulting from unrecognized tax benefits relating to uncertain income tax positions taken or expected to be taken on a tax return. The Fund’s major tax jurisdictions are U.S. federal and Delaware. |
| | |
| l). | Derivatives – The Fund may invest in, or enter into, derivatives, such as options, futures contracts, options on futures contracts, and swaps, for a variety of reasons, including to hedge certain risks, to provide a substitute for purchasing or selling particular securities, or to increase potential income gain. Derivatives may provide a cheaper, quicker, or more specifically focused way for a Fund to invest than “traditional” securities would. The main purpose of utilizing these derivative instruments is for hedging purposes. |
| | |
| | The Fund has adopted the financial accounting reporting rules as required by the Derivatives and Hedging Topic of the Financial Accounting Standards Board Accounting Standards Codification. Under such rules, the Fund is required to include enhanced disclosure that enables investors to understand how and why an entity uses derivatives, how derivatives are accounted for, and how derivatives instruments affect an entity’s results of operations and financial position. During the year ended October 31, 2014, the Fund did not hold any derivative instruments. |
| | |
| m). | Events Subsequent to the Fiscal Period End – The Fund has adopted financial reporting rules regarding subsequent events that require an entity to recognize in the financial statements the effects of all subsequent events that provide additional evidence about conditions that existed at the date of the balance sheet. Management has evaluated the Fund’s related events and transactions that occurred subsequent to October 31, 2014 through the date of issuance of the Fund’s financial statements. There were no events or transactions that occurred during this period that materially impacted the amounts or disclosures in the Fund’s financial statements. |
3). SECURITIES VALUATION
The Fund has adopted authoritative fair valuation accounting standards that establish an authoritative definition of fair value and set out a hierarchy for measuring fair value. These standards require additional disclosures about the various inputs and valuation techniques used to develop the measurements of fair value and a discussion in changes in valuation techniques and related inputs during the period. These inputs are summarized in the three broad levels listed below:
| | Level 1 – | Quoted unadjusted prices for identical instruments in active markets to which the Fund has access at the date of measurement. |
| | | |
| | Level 2 – | Quoted prices for similar instruments in active markets; quoted prices for identical or similar instruments in markets that are not active; and model-derived valuations in which all significant inputs and significant value drivers are observable in active markets. Level 2 inputs are those in markets for which there are few transactions, the prices are not current, the prices are fair value adjusted due to post-market close subsequent events (foreign markets), little public information exists, or instances where prices vary substantially over time or among brokered market makers. These inputs may also include interest rates, prepayment speeds, credit risk curves, default rates, and similar data. |
| | | |
| | Level 3 – | Model-derived valuations in which one or more significant inputs or significant value drivers are unobservable. Unobservable inputs are those inputs that reflect the Fund’s own assumptions about what market participants would use to price the asset or liability based on the best available information. |
Following is a description of the valuation techniques applied to the Fund’s major categories of assets and liabilities measured at fair value on a recurring basis.
Equity Securities – Equity securities, including common stocks, preferred stocks, foreign issued common stocks, exchange traded funds, closed-end mutual funds, and real estate investment trusts, that are traded on a securities exchange for which a last-quoted sales price is readily available will generally be valued at the last sales price as reported by the primary exchange on which the securities are listed. Securities listed on The NASDAQ Stock Market (“NASDAQ”) will be valued at the NASDAQ Official Closing Price, which may differ from the last sales price reported. Securities traded on a securities exchange for which a last-quoted sales price is not readily available will generally be valued at the mean between the bid and ask prices. To the extent these securities are actively traded and valuation adjustments are not applied, they are classified in Level 1 of the fair value hierarchy.
Investment Companies – Investments in investment companies (e.g., mutual funds and exchange traded funds) are generally priced at the ending NAV provided by the Fund’s service agent and will be classified in Level 1 of the fair value hierarchy.
Debt Securities – Debt securities, including corporate bonds, asset-backed securities, mortgage-backed securities, municipal bonds, U.S. Treasuries, and U.S. government agency issues, are valued at market on the basis of valuations furnished by an independent pricing service that utilizes both dealer-supplied valuations and formula-based techniques. The pricing service may consider recently executed transactions in securities of the issuer or comparable issuers, market price quotations (where observable), bond spreads, and fundamental data relating to the issuer. In addition, the model may incorporate market observable data such as reported sales of similar securities, broker quotes, yields, bids,
HENNESSY FUNDS 1-800-966-4354
offers, and reference data. Certain securities are valued principally using dealer quotations. These securities are generally classified in Level 2 of the fair value hierarchy.
Short-Term Securities – Short-term equity investments, including money market funds, are valued in the manner specified above. Short-term debt investments are generally valued at amortized cost, which approximates fair market value, if their original maturity was 60 days or less, or by amortizing the values as of the 61st day prior to maturity, if their original term to maturity exceeded 60 days. Amortized cost is not used if its use would be inappropriate due to credit or other impairments of the issuer, in which the security would be fair valued, as described below. Short-term securities are generally classified in Level 1 or Level 2 of the fair market hierarchy depending on the inputs used and market activity levels for specific securities.
The Board of Trustees of the Fund (the “Board”) has adopted fair value pricing procedures that are followed when a price for a security is not readily available or if a significant event has occurred that indicates the closing price of a security no longer represents the true value of that security. Fair value pricing determinations are made in good faith in accordance with these procedures. There are numerous criteria that will be given consideration in determining a fair value of a security. Some of these criteria are trading volume of security and markets, the value of other like securities, and news events with direct bearing to security or market. Fair value pricing results in an estimated price for a security that reflects the amount the Fund might reasonably expect to receive in a current sale. Depending on the relative significance of the valuation inputs, these securities may be classified in either Level 2 or Level 3 of the fair value hierarchy.
Fair valuing of foreign securities may be determined with the assistance of a pricing service using correlations between the movement of prices of such securities and indices of domestic securities and other appropriate indicators, such as closing market prices of relevant American Depositary Receipts or futures contracts. The effect of using fair value pricing is that the Fund’s NAV will reflect the affected portfolio securities’ value as determined in the judgment of the Board or its designee instead of being determined by the market. Using a fair value pricing methodology to price foreign securities may result in a value that is different from a foreign security’s most recent closing price and from the prices used by other investment companies to calculate their NAVs and are generally considered Level 2 prices in the fair valuation hierarchy. Because the Fund may invest in foreign securities, the value of the Fund’s portfolio securities may change on days when you will not be able to purchase or redeem your shares.
The Board has delegated day-to-day valuation matters to a Valuation Committee comprised of one or more representatives from Hennessy Advisors, Inc., the Fund’s investment advisor. The function of the Valuation Committee is to value securities where current and reliable market quotations are not readily available. All actions taken by the Valuation Committee are reviewed by the Board.
The Fund has performed an analysis of all existing investments to determine the significance and character of all inputs to their fair value determination. Various inputs are used in determining the value of the Fund’s investments. The inputs or methodology used for valuing securities are not necessarily an indication of the risk associated with investing in those securities. Details related to the fair valuation hierarchy of the Fund’s securities as of October 31, 2014 are included in the Fund’s Schedule of Investments.
4). INVESTMENT TRANSACTIONS
Purchases and sales of investment securities (excluding government and short-term investments) for the Fund during the year ended October 31, 2014 were $248,951,252 and $227,437,599, respectively.
There were no purchases or sales/maturities of long-term U.S. Government Securities for the Fund during the year ended October 31, 2014.
5). INVESTMENT MANAGEMENT FEE AND OTHER TRANSACTIONS WITH AFFILIATES
Hennessy Advisors, Inc. (the “Advisor”) is the investment advisor of the Fund. The Advisor provides the Fund with investment management services under an Investment Advisory Agreement. The Advisor furnishes all investment advice, office space, facilities, and provides most of the personnel needed by the Fund. As compensation for its services, the Advisor is entitled to a monthly fee from the Fund. The fee is based upon the average daily net assets of the Fund at the annual rate of 0.90%. The net investment advisory fees payable for the Fund as of October 31, 2014 were $1,087,730.
The Advisor has delegated the day-to-day management of the Fund to a sub-advisor, Broad Run Investment Management, LLC. The Advisor pays the sub-advisor fees for the Fund from its own assets and these fees are not an additional expense of the Fund.
The Advisor has contractually agreed to limit the total annual operating expenses of the Fund (excluding interest, taxes, brokerage commissions, dividend expenses, acquired fund fees and expenses, extraordinary legal expenses, or any other extraordinary expenses and, from and after November 1, 2014, 12b-1 fees) to 1.95% and 1.70% of the Fund’s net assets for the Investor Class shares and Institutional Class shares of the Fund, respectively, through February 28, 2015.
For a period of three years after the year in which the Advisor waives or reimburses expenses, the Advisor may seek reimbursement from the Fund to the extent that total annual fund operating expenses are less than the expense limitation in effect at the time of the reimbursement. During the three years ended October 31, 2014, no Advisor fees were waived and therefore no expenses are subject to potential recovery.
The Fund has adopted a plan pursuant to Rule 12b-1 under the Investment Company Act of 1940, as amended, that authorizes payments in connection with the distribution of the Fund’s shares at an annual rate of up to 0.25% of the Fund’s average daily net assets attributable to Investor Class shares. Amounts paid under the plan may be spent on any activities or expenses primarily intended to result in the sale of shares, including but not limited to, advertising, compensation for sales and marketing activities or financial institutions and others such as dealers and distributors, shareholder account servicing, the printing and mailing of prospectuses to other than current shareowners, and the printing and mailing of sales literature.
The Fund has entered into agreements with various brokers, dealers, and financial intermediaries in connection with the sale of shares of the Fund. The agreements provide for periodic payments by the Fund to the brokers, dealers, and financial intermediaries for providing certain shareholder maintenance services (sub-transfer agent expenses). These shareholder services include the pre-processing and quality control of new accounts, shareholder correspondence, answering customer inquiries regarding account status, and facilitating shareholder telephone transactions. Fees paid by the Fund to various brokers, dealers, and financial intermediaries for the year ended October 31, 2014 were $1,596,880.
U.S. Bancorp Fund Services, LLC (“USBFS”) provides the Fund with administrative, fund accounting, and transfer agent services, including all regulatory reporting, and necessary office equipment and personnel. As administrator, USBFS prepares various federal and state regulatory filings, reports, and returns for the Fund; prepares reports and materials to be supplied to the Board; monitors the activities of the Fund’s custodian, transfer agent, and accountants; and coordinates the preparation and payment of the Fund’s expenses and reviews the Fund’s expense accruals. Fees paid to USBFS for the year ended October 31, 2014 were $1,643,287.
HENNESSY FUNDS 1-800-966-4354
U.S. Bank, N.A., an affiliate of USBFS, serves as the Fund’s custodian. Quasar Distributors, LLC acts as the Fund’s principal underwriter in a continuous public offering of the Fund’s shares. Quasar Distributors, LLC is an affiliate of USBFS and U.S. Bank, N.A.
6). LINE OF CREDIT
The Fund has a line of credit with the other funds in the Hennessy Funds family of funds (the “Hennessy Funds”) in the amount of the lesser of (i) $100,000,000 or (ii) 33.33% of each Hennessy Fund’s net assets, or 30% for the Hennessy Gas Utility Index Fund and 10% for the Hennessy Balanced Fund, intended to provide short-term financing, if necessary, subject to certain restrictions, in connection with shareholder redemptions. The credit facility is with the Hennessy Funds’ custodian bank, U.S. Bank, N.A. Borrowings under this arrangement bear interest at the bank’s prime rate. During the year ended October 31, 2014, the Fund did not have any borrowings outstanding under the line of credit.
7). FEDERAL TAX INFORMATION
As of October 31, 2014, the components of accumulated earnings (losses) for income tax purposes for the Fund were as follow:
| | Cost of investments for tax purposes | | $ | 868,981,979 | |
| | Gross tax unrealized appreciation | | $ | 643,041,600 | |
| | Gross tax unrealized depreciation | | | (13,171,987 | ) |
| | Net tax unrealized appreciation | | $ | 629,869,613 | |
| | Undistributed ordinary income | | $ | 2,729,102 | |
| | Undistributed long-term capital gains | | | 110,571,214 | |
| | Total distributable earnings | | $ | 113,300,316 | |
| | Other accumulated gain | | $ | — | |
| | Total accumulated gain | | $ | 743,169,929 | |
At October 31, 2014, the Fund had no tax basis capital losses to offset future capital gains.
At October 31, 2014, the Fund did not defer, on a tax basis, any late year ordinary losses.
The tax character of distributions paid during fiscal year 2014 and fiscal year 2013 for the Fund were as follow:
| | | | Year Ended | | | Year Ended | |
| | | | October 31, 2014 | | | October 31, 2013 | |
| | Ordinary income | | $ | — | | | $ | — | |
| | Long-term capital gain | | | 22,446,515 | | | | 63,640,872 | |
| | | | $ | 22,446,515 | | | $ | 63,640,872 | |
8). EVENTS SUBSEQUENT TO YEAR-END
On December 8, 2014, the following capital gains distributions were declared and paid to shareholders of record on December 5, 2014.
| | Short-term Capital Gains | Rate/Share ($) | |
| | Investor Class | $0.12621 | |
| | Institutional Class | $0.12815 | |
| | | | |
| | Long-term Capital Gains | Rate/Share ($) | |
| | Investor Class | $5.11315 | |
| | Institutional Class | $5.19208 | |
Report of Independent Registered Public Accounting Firm
To the Board of Trustees of Hennessy Funds Trust
And the Shareholders of Hennessy Focus Fund
We have audited the accompanying statement of assets and liabilities, including the schedule of investments, of the Hennessy Focus Fund (the “Fund”), a series of Hennessy Funds Trust (the “Trust”) as of October 31, 2014, and the related statement of operations for the year then ended, the statements of changes in net assets for each of the two years in the period then ended, and the financial highlights for each of the five years in the period then ended. These financial statements and financial highlights are the responsibility of the Funds’ management. Our responsibility is to express an opinion on these financial statements and financial highlights based on our audits.
We conducted our audits in accordance with the standards of the Public Company Accounting Oversight Board (United States). Those standards require that we plan and perform the audits to obtain reasonable assurance about whether the financial statements and financial highlights are free of material misstatement. The Fund is not required to have, nor were we engaged to perform, an audit of its internal control over financial reporting. Our audits included consideration of internal control over financial reporting as a basis for designing audit procedures that are appropriate in the circumstances, but not for the purposes of expressing an opinion on the effectiveness of the Fund’s internal control over financial reporting. Accordingly, we express no such opinion. An audit includes examining, on a test basis, evidence supporting the amounts and disclosures in the financial statements. Our procedures included confirmation of securities owned as of October 31, 2014, by correspondence with the custodian. An audit also includes assessing the accounting principles used and significant estimates made by management, as well as evaluating the overall financial statement presentation. We believe that our audits provide a reasonable basis for our opinion.
In our opinion, the financial statements and financial highlights referred to above present fairly, in all material respects, the financial position of the Hennessy Focus Fund as of October 31, 2014, the results of its operations for the year then ended, the changes in its net assets for each of the two years in the period then ended, and the financial highlights for each of the five years in the period then ended, in conformity with accounting principles generally accepted in the United States of America.
TAIT, WELLER & BAKER LLP
Philadelphia, Pennsylvania
December 30, 2014
HENNESSY FUNDS 1-800-966-4354
Trustees and Officers of the Fund (Unaudited)
The business and affairs of the Fund are managed under the direction of the Fund’s Board of Trustees. Information pertaining to the Trustees and Officers of the Fund is set forth below. The Fund’s Statement of Additional Information includes additional information about the Fund’s Trustees and Officers and is available, without charge, upon request by calling 1-800-966-4354.
| | | | | Number of | |
| | | Term of | | Portfolios | |
| | | Office | | in the | Other |
| | | and | | Fund | Directorships |
| | Position(s) | Length | Principal | Complex | (During Past |
| Name, Address, | Held with | of Time | Occupation(s) | Overseen | Five Years)(2) |
| and Age | the Fund | Served | During Past Five Years | by Trustee | Held by Trustee |
| | | |
| Disinterested Trustees (as defined below) | | |
| | | | | | |
| J. Dennis DeSousa | Trustee | Indefinite, | Mr. DeSousa is a real | 16 | Hennessy SPARX |
| Age: 78 | | until | estate investor. | | Funds Trust; |
| Address: | | successor | | | Hennessy Mutual |
| c/o Hennessy | | elected | | | Funds, Inc.; and |
| Advisors, Inc. | | | | | The Hennessy |
| 7250 Redwood Blvd. | | Served | | | Funds, Inc. |
| Suite 200 | | since | | | |
| Novato, CA 94945 | | January | | | |
| | | 1996 | | | |
| | | for the | | | |
| | | Funds (or | | | |
| | | Predecessor | | | |
| | | Funds) | | | |
| | | | | | |
| Robert T. Doyle | Trustee | Indefinite, | Mr. Doyle has been the | 16 | Hennessy SPARX |
| Age: 67 | | until | Sheriff of Marin County, | | Funds Trust; |
| Address: | | successor | California since 1996. | | Hennessy Mutual |
| c/o Hennessy | | elected | | | Funds, Inc.; and |
| Advisors, Inc. | | | | | The Hennessy |
| 7250 Redwood Blvd. | | Served | | | Funds, Inc. |
| Suite 200 | | since | | | |
| Novato, CA 94945 | | January | | | |
| | | 1996 | | | |
| | | for the | | | |
| | | Funds (or | | | |
| | | Predecessor | | | |
| | | Funds) | | | |
| | | | | | |
| Gerald P. Richardson | Trustee | Indefinite, | Mr. Richardson is an | 16 | Hennessy SPARX |
| Age: 69 | | until | independent consultant | | Funds Trust; |
| Address: | | successor | in the securities industry. | | Hennessy Mutual |
| c/o Hennessy | | elected | | | Funds, Inc.; and |
| Advisors, Inc. | | | | | The Hennessy |
| 7250 Redwood Blvd. | | Served | | | Funds, Inc. |
| Suite 200 | | since | | | |
| Novato, CA 94945 | | May 2004 | | | |
| | | for the | | | |
| | | Funds (or | | | |
| | | Predecessor | | | |
| | | Funds) | | | |
| | | | | Number of | |
| | | Term of | | Portfolios | |
| | | Office | | in the | Other |
| | | and | | Fund | Directorships |
| | Position(s) | Length | Principal | Complex | (During Past |
| Name, Address, | Held with | of Time | Occupation(s) | Overseen | Five Years)(2) |
| and Age | the Fund | Served | During Past Five Years | by Trustee | Held by Trustee |
| | | | | | |
| “Interested Persons” (as defined in the 1940 Act) | | |
| | | |
Neil J. Hennessy(1) | Chief | Trustee: | Mr. Hennessy has been | 16 | Hennessy |
| Age: 58 | Investment | Indefinite, | employed by Hennessy | | Advisors, Inc. |
| Address: | Officer, | until | Advisors, Inc., the Funds’ | | (current); |
| c/o Hennessy | Portfolio | successor | investment advisor, since | | Hennessy SPARX |
| Advisors, Inc. | Manager, | elected | 1989. He currently serves | | Funds Trust; |
| 7250 Redwood Blvd. | President, | | as President, Chairman | | Hennessy Mutual |
| Suite 200 | Trustee | Served | and CEO of Hennessy | | Funds, Inc.; and |
| Novato, CA 94945 | and | since | Advisors, Inc. | | The Hennessy |
| | Chairman | January | | | Funds, Inc. |
| | of the | 1996 | | | |
| | Board | for the | | | |
| | | Funds (or | | | |
| | | Predecessor | | | |
| | | Funds) | | | |
| | | | | | |
| | | Officer: | | | |
| | | 1 year term | | | |
| | | | | | |
| | | Served | | | |
| | | since | | | |
| | | June 2008 | | | |
| | | for the | | | |
| | | Funds (or | | | |
| | | Predecessor | | | |
| | | Funds) | | | |
| | | | | | |
Teresa M. Nilsen(1) | Executive | 1 year term | Ms. Nilsen has been | N/A | N/A |
| Age: 48 | Vice | | employed by Hennessy | | |
| Address: | President | Served | Advisors, Inc., the Funds’ | | |
| c/o Hennessy | and | since | investment advisor, since | | |
| Advisors, Inc. | Treasurer | January | 1989. She currently serves | | |
| 7250 Redwood Blvd. | | 1996 | as Executive Vice President, | | |
| Suite 200 | | for the | Chief Operations Officer, | | |
| Novato, CA 94945 | | Funds (or | Chief Financial Officer, and | | |
| | | Predecessor | Secretary of Hennessy | | |
| | | Funds) | Advisors, Inc. | | |
| (1) | All Officers of the Hennessy Funds and employees of the Manager are Interested Persons of the Funds. |
| (2) | Pursuant to an internal reorganization, the series of Hennessy Mutual Funds, Inc. (“HMFI”), The Hennessy Funds, Inc. (“HFI”) and Hennessy SPARX Funds Trust (“HSFT”) were reorganized into series of Hennessy Funds Trust on February 28, 2014, which mirrored the corresponding series of HFMI, HFI and HSFT. Subsequent to the reorganization, HFMI, HFI and HSFT were dissolved. |
HENNESSY FUNDS 1-800-966-4354
| | | Term of | |
| | | Office | |
| | | and | |
| | Position(s) | Length | Principal |
| Name, Address, | Held with | of Time | Occupation(s) |
| and Age | the Fund | Served | During Past Five Years |
| | | | |
| Interested Persons | | | |
| | | | |
Daniel B. Steadman(1) | Executive | 1 year term | Mr. Steadman has been employed by |
| Age: 58 | Vice President | | Hennessy Advisors, Inc., the Funds’ |
| Address: | and Secretary | Served since | investment advisor, since 2000. |
| c/o Hennessy Advisors, Inc. | | March 2000 | He currently serves as Executive |
| 7250 Redwood Blvd. | | for the Funds (or | Vice President and Chief Compliance |
| Suite 200 | | Predecessor Funds) | Officer of Hennessy Advisors, Inc. |
| Novato, CA 94945 | | | |
| | | | |
Jennifer Cheskiewicz(1) | Senior | 1 year term | Ms. Cheskiewicz has been employed by |
| Age: 37 | Vice President | | Hennessy Advisors, Inc., the Funds’ |
| Address: | and Chief | Served since | investment advisor, since June 2013. |
| c/o Hennessy Advisors, Inc. | Compliance | June 2013 | She previously served as in-house |
| 7250 Redwood Blvd. | Officer | for the Funds (or | counsel to Carlson Capital, L.P., an |
| Suite 200 | | Predecessor Funds) | SEC-registered investment advisor to |
| Novato, CA 94945 | | | several private funds from February |
| | | | 2010 to May 2013. Prior to that, she |
| | | | was an attorney with Gibson, Dunn & |
| | | | Crutcher LLP from September 2005 |
| | | | through February 2010. She currently |
| | | | serves as General Counsel of |
| | | | Hennessy Advisors, Inc. |
| | | | |
Brian Carlson(1) | Senior | 1 year term | Mr. Carlson has been employed by |
| Age: 42 | Vice President | | Hennessy Advisors, Inc., the Funds’ |
| Address: | and Head of | Served since | investment advisor, since |
| c/o Hennessy Advisors, Inc. | Distribution | December 2013 | December 2013. |
| 7250 Redwood Blvd. | | for the Funds (or | |
| Suite 200 | | Predecessor Funds) | Mr. Carlson was previously a |
| Novato, CA 94945 | | | co-founder and principal of Trivium |
| | | | Consultants, LLC from February 2011 |
| | | | through November 2013. Prior to that, |
| | | | he was the Senior Managing Director |
| | | | of NRP Financial, Inc. from August |
| | | | 2007 through February 2011. |
| | | | |
David Ellison(1) | Portfolio Manager | 1 year term | Mr. Ellison has served as Portfolio |
| Age: 56 | and Senior | | Manager of the Large Cap Financial |
| Address: | Vice President | Served since | Fund, the Small Cap Financial Fund, |
| c/o Hennessy Advisors, Inc. | | October 2012 | and the Technology Fund |
| 101 Federal Street | | for the Funds (or | since inception. |
| Suite 1900 | | Predecessor Funds) | |
| Boston, MA 02110 | | | Mr. Ellison previously served as Director, |
| | | | CIO and President of FBR Advisers, Inc. |
| | | | from December 1999 to October 2012. |
| (1) | All Officers of the Hennessy Funds and employees of the Manager are Interested Persons of the Funds. |
| | | Term of | |
| | | Office | |
| | | and | |
| | Position(s) | Length | Principal |
| Name, Address, | Held with | of Time | Occupation(s) |
| and Age | the Fund | Served | During Past Five Years |
| Interested Persons | | | |
Brian Peery(1) | Portfolio Manager | 1 year term | Mr. Peery has been a Portfolio Manager |
| Age: 45 | and | | of the Cornerstone Growth Fund, |
| Address: | Vice President | Served since | the Cornerstone Mid Cap 30 Fund, the |
| c/o Hennessy Advisors, Inc. | | March 2003 | Cornerstone Large Growth Fund, the |
| 7250 Redwood Blvd. | | as Vice President | Cornerstone Value Fund, the Total |
| Suite 200 | | for the Funds (or | Return Fund, and the Balanced Fund |
| Novato, CA 94945 | | Predecessor Funds) | since October 2014. From February |
| | | | 2011 through September 2014, he |
| | | Served since | served as Co-Portfolio Manager of |
| | | February 2011 | the same funds. |
| | | as Co-Portfolio | |
| | | Manager | Mr. Peery has been employed by |
| | | for the Funds (or | Hennessy Advisors, Inc., the Funds’ |
| | | Predecessor Funds) | investment advisor, since 2002. |
| | | | |
Winsor (Skip) Aylesworth(1) | Portfolio Manager | 1 year term | Mr. Aylesworth has been Portfolio |
| Age: 67 | and | | Manager of the Gas Utility Index Fund |
| Address: | Vice President | Served since | since 1998 and Portfolio Manager of |
| c/o Hennessy Advisors, Inc. | | October 2012 | the Technology Fund since inception. |
| 101 Federal Street | | for the Funds (or | |
| Suite 1900 | | Predecessor Funds) | Mr. Aylesworth previously served as |
| Boston, MA 02110 | | | Executive Vice President of The FBR |
| | | | Funds from 1999 to October 2012. |
| | | | |
Ryan Kelley(1) | Portfolio Manager | 1 year term | Mr. Kelley has been a Portfolio Manager |
| Age: 42 | and | | of the Gas Utility Index Fund (formerly |
| Address: | Vice President | Served since | the FBR Gas Utility Index Fund), the |
| c/o Hennessy Advisors, Inc. | | March 2013 | Small Cap Financial Fund (formerly the |
| 1340 Environ Way | | for the Funds (or | FBR Small Cap Financial Fund), and the |
| Chapel Hill, NC 27517 | | Predecessor Funds) | Large Cap Financial Fund (formerly the |
| | | | FBR Large Cap Financial Fund) since |
| | | | October 2014. From March 2013 |
| | | | through September 2014, he served |
| | | | as a Co-Portfolio Manager of the same |
| | | | funds. Prior to that, he was a Portfolio |
| | | | Analyst of the Hennessy Funds. |
| | | | |
| | | | Mr. Kelley previously served as Portfolio |
| | | | Manager of The FBR Funds from |
| | | | January 2008 to October 2012. |
| (1) | All Officers of the Hennessy Funds and employees of the Manager are Interested Persons of the Funds. |
HENNESSY FUNDS 1-800-966-4354
Expense Example (Unaudited)
October 31, 2014
As a shareholder of the Fund, you incur two types of costs: (1) transaction costs, including sales charges (loads) on purchase payments, reinvested dividends, or other distributions; redemption fees; and exchange fees; and (2) ongoing costs, including management fees; service fees; and other Fund expenses. This Example is intended to help you understand your ongoing costs (in dollars) of investing in the Fund and to compare these costs with the ongoing costs of investing in other mutual funds. The Example is based on an investment of $1,000 invested at the beginning of the period and held for the entire period from May 1, 2014 through October 31, 2014.
Actual Expenses
The first line of the table below under the “Investor Class” and “Institutional Class” headings provides information about actual account values and actual expenses. Although the Fund charges no sales loads or transaction fees, you will be assessed fees for outgoing wire transfers, returned checks and stop payment orders at prevailing rates charged by U.S. Bancorp Fund Services, LLC, the Fund’s transfer agent. If you request that a redemption be made by wire transfer, currently a $15.00 fee is charged by the Fund’s transfer agent. IRA accounts will be charged a $15.00 annual maintenance fee. The example below includes, but is not limited to, management fees, shareholder servicing fees, fund accounting, custody, and transfer agent fees. However, the example below does not include portfolio trading commissions and related expenses, and other extraordinary expenses as determined under generally accepted accounting principles. You may use the information in this line, together with the amount you invested, to estimate the expenses that you paid over the period. Simply divide your account value by $1,000 (for example, an $8,600 account value divided by $1,000 = 8.6), then multiply the result by the number in the first line of the table under the “Investor Class” and “Institutional Class” headings in the column entitled “Expenses Paid During Period” to estimate the expenses you paid on your account during this period.
Hypothetical Example for Comparison Purposes
The second line of the table below under the “Investor Class” and “Institutional Class” headings provides information about hypothetical account values and hypothetical expenses based on the Fund’s actual expense ratios and an assumed rate of return of 5% per year before expenses, which is not the Fund’s actual return. The hypothetical account values and expenses may not be used to estimate the actual ending account balance or expenses you paid for the period. You may use this information to compare the ongoing costs of investing in the Fund and other funds. To do so, compare this 5% hypothetical example with the 5% hypothetical examples that appear in the shareholder reports of the other funds. Please note that the expenses shown in the table are meant to highlight your ongoing costs only and do not reflect any transactional costs, such as sales charges (loads), or exchange fees. Therefore, the second line of the table under the “Investor Class” and “Institutional Class” headings is useful in comparing ongoing costs only, and will not help you determine the relative total costs of owning different funds. In addition, if these transactional costs were included, your costs would have been higher.
| | Beginning | Ending | Expenses Paid |
| | Account Value | Account Value | During Period(1) |
| | 5/1/14 | 10/31/14 | 5/1/14 – 10/31/14 |
| Investor Class | | | |
| | | | |
| Actual | $1,000.00 | $1,088.60 | $7.36 |
| | | | |
| Hypothetical (5% return | | | |
| before expenses) | $1,000.00 | $1,018.15 | $7.12 |
| | | | |
| Institutional Class | | | |
| | | | |
| Actual | $1,000.00 | $1,088.80 | $5.74 |
| | | | |
| Hypothetical (5% return | | | |
| before expenses) | $1,000.00 | $1,019.71 | $5.55 |
| (1) | Expenses are equal to the Fund’s expense ratio of 1.40% for Investor Class shares or 1.09% for Institutional Class shares, as applicable, multiplied by the average account value over the period, multiplied by 184/365 days (to reflect one-half year period). |
| | |
HENNESSY FUNDS 1-800-966-4354
Proxy Voting
A description of the policies and procedures the Fund uses to determine how to vote proxies relating to portfolio securities is available without charge: (1) by calling 1-800-966-4354; (2) on the Hennessy Funds’ website at hennessyfunds.com; or (3) on the U.S. Securities and Exchange Commission’s (the “SEC”) website at www.sec.gov. The Fund’s proxy voting record is available on both the Hennessy Funds’ website at hennessyfunds.com and the SEC’s website at www.sec.gov no later than August 31 for the prior 12 months ending June 30.
Quarterly Filings on Form N-Q
The Fund files its complete schedule of portfolio holdings with the SEC for the first and third quarters of each fiscal year on Form N-Q. The Fund’s Forms N-Q are available on the SEC’s website at www.sec.gov. The Fund’s Forms N-Q may be reviewed and copied at the SEC’s Public Reference Room in Washington, DC and information on the operation of the Public Reference Room may be obtained by calling 1-800-SEC-0330. Information included in the Fund’s Forms N-Q will also be available upon request by calling 1-800-966-4354.
Householding
To help keep the Fund’s costs as low as possible, we generally deliver a single copy of most financial reports and prospectuses to shareholders who share an address, even if the accounts are registered under different names. This process, known as “householding,” does not apply to account statements. You may, of course, request an individual copy of a prospectus or financial report at any time. If you would like to receive separate mailings, please call the Administrator at 1-800-261-6950 or 1-414-765-4124 and we will begin individual delivery within 30 days of your request. If your account is held through a financial institution or other intermediary, please contact them directly to request individual delivery.
Privacy Policy
We collect the following non-public personal information about you:
| | • | information we receive from you on or in applications or other forms, correspondence, or conversations, including, but not limited to, your name, address, phone number, social security number, assets, income and date of birth; |
| | | and |
| | • | information about your transactions with us, our affiliates, or others, including, but not limited to, your account number and balance, payment history, parties to transactions, cost basis information and other financial information. |
We do not disclose any non-public personal information about our current or former shareholders to nonaffiliated third parties, except as permitted by law. For example, we are permitted by law to disclose all of the information we collect, as described above, to our Transfer Agent to process your transactions. Furthermore, we restrict access to your non-public personal information to those persons who require such information to provide products or services to you. We maintain physical, electronic and procedural safeguards that comply with federal standards to guard your non-public personal information.
In the event that you hold shares of the Fund through a financial intermediary, including, but not limited to, a broker-dealer, bank or trust company, the privacy policy of your financial intermediary would govern how your non-public personal information would be shared with nonaffiliated third parties.
HENNESSY FUNDS 1-800-966-4354
For information, questions or assistance, please call
The Hennessy Funds
1-800-966-4354 or 1-415-899-1555
INVESTMENT ADVISOR
Hennessy Advisors, Inc.
7250 Redwood Blvd., Suite 200
Novato, California 94945
ADMINISTRATOR,
TRANSFER AGENT,
DIVIDEND PAYING AGENT &
SHAREHOLDER SERVICING AGENT
U.S. Bancorp Fund Services, LLC
P.O. Box 701
Milwaukee, Wisconsin 53201-0701
CUSTODIAN
U.S. Bank N.A.
Custody Operations
1555 North River Center Dr., Suite 302
Milwaukee, Wisconsin 53212
TRUSTEES
Neil J. Hennessy
Robert T. Doyle
J. Dennis DeSousa
Gerald P. Richardson
COUNSEL
Foley & Lardner LLP
777 East Wisconsin Avenue
Milwaukee, Wisconsin 53202-5306
INDEPENDENT REGISTERED
PUBLIC ACCOUNTING FIRM
Tait, Weller & Baker LLP
1818 Market Street, Suite 2400
Philadelphia, Pennsylvania 19103
DISTRIBUTOR
Quasar Distributors, LLC
615 East Michigan Street
Milwaukee, Wisconsin 53202
hennessyfunds.com | 1-800-966-4354
This report has been prepared for shareholders and may be distributed to
others only if preceded or accompanied by a current prospectus.
ANNUAL REPORT
OCTOBER 31, 2014
HENNESSY CORNERSTONE
MID CAP 30 FUND
Investor Class HFMDX
Institutional Class HIMDX
hennessyfunds.com | 1-800-966-4354
(This Page Intentionally Left Blank.)
Contents
| Letter to Shareholders | | 2 |
| Performance Overview | | 4 |
| Financial Statements | | |
| Schedule of Investments | | 7 |
| Statement of Assets and Liabilities | | 11 |
| Statement of Operations | | 12 |
| Statements of Changes in Net Assets | | 14 |
| Financial Highlights | | 16 |
| Notes to the Financial Statements | | 20 |
| Report of Independent Registered Public Accounting Firm | | 27 |
| Trustees and Officers of the Fund | | 28 |
| Expense Example | | 32 |
| Proxy Voting | | 34 |
| Quarterly Filings on Form N-Q | | 34 |
| Federal Tax Distribution Information | | 34 |
| Householding | | 34 |
| Privacy Policy | | 35 |
HENNESSY FUNDS 1-800-966-4354
December 2014
Dear Shareholder:
As I look back at 2014, I realize that in this age of rapidly evolving technology, information is delivered and absorbed so quickly that it is difficult to remember what happened last week, let alone what’s happened over the course of an entire year. That is why I’d like to take a moment to recall some of the year’s highs and lows, economically, politically and socially, here in the U.S. and around the globe. 2014 was scarred by political partisanship, civil unrest in the U.S., Ukraine and many other countries, the arrival of terrorist group ISIS, the tragedies of school shootings and natural disasters, and the frightening outbreak of Ebola. However, there were also positive events this year: we survived a government shutdown over healthcare reform, jobs reports have been consistently, albeit anemically, improving, and home prices remained relatively stable, after recovering significantly in 2013. And, important to us here at Hennessy, our hometown team, the San Francisco Giants, won their third World Series in just five years!
A significant event for the financial industry this past year was the confirmation of Janet Yellen as Chair of the Federal Reserve, which served to calm the nerves of business and political leaders alike. I believe Yellen’s leadership will benefit U.S. business owners, as the Fed continues to be a voice of reason in a sea of political and economic rhetoric. The Fed has also supported the economy and corporate America by helping keep interest rates reasonable and low.
The stock market has continued its determined comeback from the lows of 2009, setting multiple record highs in recent months. The U.S. financial markets have provided strong returns over the past twelve-month period ended October 31, 2014, with the Dow Jones Industrial Average (DJIA) returning over 14% and S&P 500 Index returning over 17% during the period. The DJIA currently has a dividend yield of 2.2%, which is equal to that of a 10-Year U.S. Treasury, which is currently also yielding 2.2%. I continue to believe that investments in high-yielding, high-quality stocks have the potential to not only provide income but also the potential for stock price appreciation as well. Fixed income investing has run its course, in my opinion, and many individuals are currently benefiting from the return to investing in equities that possess strong fundamentals. American investors are slowly migrating from fixed income to equities. Currently, 54% of Americans invest in stocks, and I do expect this percentage to increase, especially if interest rates move higher.
For the past several years, U.S. corporations have been driving shareholder value by making acquisitions, initiating and raising dividends, investing in internal infrastructure and buying back stock. However, this year I began to see a shift from those strategies. I believe the easier to execute acquisitions are a thing of the past, and firms now have to be even more creative to execute accretive deals. I also believe that while firms may continue to initiate dividends, fewer firms will raise their dividends and fewer firms will participate in stock buyback programs going forward. What will these cash-rich companies do with their capital if they are not raising dividends or buying back stock? I believe they may begin to initiate capital expenditure programs that could truly benefit economic growth.
Liquidity and monetary conditions are supportive, causing the cost of capital to be very low. I believe firms will choose to spend capital to expand their sales, and they may even begin to hire in earnest. Once a company begins to move in this way, the cost to
defer becomes real for competitors. With almost $3 trillion in cash and short-term investments sitting on the balance sheets of the S&P 500 companies, a strategic shift by firms to spend their idle capital, while slow, could potentially further economic growth in the U.S. in my opinion.
Economic progress and growth remain slow, yet steady, and unemployment, though improving, remains high. Oil prices have fallen, giving consumers a bit more discretionary income. While the midterm elections may not end all of the gridlock in Washington, hopefully we will receive clarity on the political headwinds of taxes and regulations, which have not improved over the past several years.
The markets have had several quarters without any truly significant downturn. The pullbacks we recently experienced, most notably in July and October, were short-lived, as evidenced by the quick rebound to record high market levels. I firmly believe that we are in a secular bull market, and I continue to tell investors to try to remain calm in the face of volatility and continue to focus on the strong, long-term fundamentals that are evident in the market today. Many companies continue to have strong balance sheets, with record cash flows and profits. With this current bull market in its fifth year, investors should expect some volatility.
I am encouraged by the strong returns for the major U.S. financial market indices and by the performance of the Hennessy Funds over the past year. Thank you for your continued confidence and investment in our products. If you have any questions or would like to speak with us directly, please don’t hesitate to call us at (800) 966-4354.
Best regards,
Neil J. Hennessy
President and Chief Investment Officer
Past performance does not guarantee future results.
Mutual fund investing involves risk. Principal loss is possible.
Opinions expressed are those of Neil Hennessy and are subject to change, are not guaranteed and should not be considered investment advice.
The Dow Jones Industrial Average and S&P 500 Index are unmanaged indices commonly used to measure the performance of U.S. stocks. One cannot invest directly in an index.
Cash flow can be used as an indication of a company’s financial strength. A firm’s cash flow is the movement of cash in and out of the firm in the form of payments to suppliers and collections from customers. Dividend Yield is calculated as the annual dividends paid by a company divided by the price of a share of their stock.
HENNESSY FUNDS 1-800-966-4354
Performance Overview (Unaudited)
The opinions expressed in the following commentary reflect those of the Portfolio Managers as of the date written. Any such opinions are subject to change based on market or other conditions and are not guaranteed. These opinions may not be relied upon as investment advice. Investment decisions for the Fund are based on multiple factors, and may not be relied upon as an indication of trading intent on behalf of the Fund. Security positions can and do change.
CHANGE IN VALUE OF $10,000 INVESTMENT
This chart assumes an initial gross investment of $10,000 made on October 31, 2004. Returns shown include the reinvestment of all dividends. Returns shown do not reflect the deduction of taxes that a shareholder would pay on Fund distributions or the redemption of Fund shares.
AVERAGE ANNUAL TOTAL RETURN FOR PERIODS ENDED OCTOBER 31, 2014
| | One | Five | Ten |
| | Year | Years | Years |
| Hennessy Cornerstone Mid Cap 30 Fund – | | | |
| Investor Class (HFMDX) | 18.25% | 18.90% | 12.54% |
| Hennessy Cornerstone Mid Cap 30 Fund – | | | |
Institutional Class (HIMDX)(1) | 18.57% | 19.32% | 12.80% |
Russell Midcap® Index | 15.32% | 18.97% | 10.37% |
| S&P 500 Index | 17.27% | 16.69% | 8.20% |
Expense ratios: 1.31% (Investor Class); Gross 1.11%, Net 0.98%(2) (Institutional Class)
Performance data quoted represents past performance; past performance does not guarantee future results. The investment return and principal value of an investment will fluctuate so that an investor’s shares, when redeemed, may be worth more or less than their original cost. Current performance of the Fund may be lower or higher than the performance quoted. Performance data current to the most recent month end may be obtained by visiting hennessyfunds.com.
The expense ratios presented are from the most recent prospectus.
| (1) | The inception date of the Institutional Class shares is March 3, 2008. Performance shown prior to the inception of the Institutional Class shares reflects the performance of the Investor Class shares and includes expenses that are not applicable to and are higher than those of the Institutional Class shares. |
| (2) | With regard to Institutional Class shares, the Fund’s investment advisor has contractually agreed to waive a portion of its expenses indefinitely. |
PERFORMANCE NARRATIVE
Portfolio Managers Neil Hennessy and Brian Peery
Over the previous twelve months, how did the Fund perform and what factors contributed to this performance?
For the twelve-month period ended October 31, 2014, the Investor Class of the Hennessy Cornerstone Mid Cap 30 Fund returned 18.25%, outperforming the Russell Midcap® Index, the S&P 500 Index and the Morningstar Mid-Cap Blend Category Average, which returned 15.32%, 17.27% and 11.11% for the same period, respectively.
We are very pleased with the overall performance of the Fund during the previous twelve months versus its benchmarks. The Fund’s relative outperformance was driven partly by allocation, with positive attribution in six out of ten sectors, but the primary driver of the Fund’s performance was underlying stock selection. The biggest contribution to the Fund’s outperformance versus its benchmarks was in the Industrial sector, where the Fund’s overweighting and stock selection amounted to roughly half of the outperformance relative to the Russell Midcap® Index. The next largest contributor to Fund performance was stock selection within the Consumer Discretionary sector. The largest detractor to the Fund’s performance was its relative under-allocation and stock selection within the Financials sector, ultimately dragging down performance by 75 basis points, or 0.75% of overall performance.
Additional Portfolio Manager commentary and related investment outlook:
The goal of the Fund is to perform better than its benchmarks over time with a lower risk profile. By having a concentrated portfolio of just 30 stocks, the outperformance of even just a few stocks can have a meaningful impact on the overall performance of the Fund. We believe that having 30 positions in the portfolio provides ample diversification across the Mid-Cap domestic equity market. Modern portfolio theory suggests that a level of approximately 94% diversification can be achieved with exposure to only 30 issuers, and that achieving 100% diversification requires exposure to approximately another 240 issuers.
The stock market recently went through what some would call a much needed correction. It is important to remember that we are in a five-year bull market, and that corrections will happen. The key is to stay the course, not be swayed or allow fear to dictate investment parameters and remain focused on investing for the long-term. By adhering to our strict investment methodology, which includes keeping only a small portion of the Fund’s holdings in cash, the performance of the Fund rebounded quickly alongside the market. We were able to purchase positions during this time, which looking back, appear to be very prescient. Additionally, by employing a strict price-to-sales ratio limit of 1.5, we invest in what we deem to be reasonably valued companies rather than those stocks whose price is predicated on expected future growth. When markets decline, these “expensive” stocks are often the ones leading the downward move. This “growth at a reasonable price” stock selection approach has served us well, and we believe wholeheartedly in utilizing this methodology when investing. We anticipate investors will continue to migrate out of high risk, high multiple stocks and into stocks that will potentially do well as the economy expands.
Although consumer spending has been rather muted over the last year, we firmly believe it will increase as the year progresses. There are many positive factors, including lower oil and gasoline prices, a pickup in job creation, as well as a continuing decline on under-employment, that cause us to believe consumer spending will rise. We do see consumer purchasing habits that are different than prior years, and we feel the current portfolio reflects the change in the consumer’s spending habits and preferences.
HENNESSY FUNDS 1-800-966-4354
We continue to expect that company earnings will likely improve, but more importantly, we are starting to see much more positive news surrounding company revenue growth, and we believe this should continue as well as the strength of the economy improves.
We are seeing positive signs in the all-important corporate capital expenditures levels. Over the last twelve months, we have seen a slight disconnect between earnings and revenues, with earnings showing healthy gains, largely due to cost containment, while revenue growth lagged. With few cost cuts seemingly left to be made, companies appear to be starting to utilize their healthy balance sheets to focus on organic growth, which we expect will drive corporate spending higher. In fact, we anticipate that the U.S. economy will expand nicely over the next 12 to 18 months and that the markets should benefit from this flow of capital. While excess cash has largely been directed toward acquisitions, increasing dividends, and/or stock buybacks recently, we believe this shift in corporate spending has the potential to reward shareholders over the longer term.
We are confident that there are opportunities in the Mid-Cap space (which we define as companies with a market capitalization of $1 billion to $10 billion for Fund), especially in some of the more cyclical sectors. We believe the cyclical companies, which are those companies most sensitive to economic growth, should do well as the economy continues to improve. The Fund is currently overweight cyclical stocks versus its benchmarks and will remain so until its portfolio is rebalanced next year.
The Russell Midcap® Index is an unmanaged index commonly used to measure the performance of U.S. medium-capitalization stocks. The S&P 500 Index is an unmanaged index commonly used to measure the performance of U.S. stocks. You cannot invest directly in an index. Performance data for an index does not reflect any deductions for fees, expenses or taxes. The Fund invests in medium-capitalization companies, which may have limited liquidity and greater price volatility than large-capitalization companies. The Fund’s portfolio is rebalanced annually in accordance with its strategy, which may result in the elimination of better performing assets from the Fund’s investments and increases in investments with relatively lower total return. Fund holdings and sector allocations are subject to change. Please refer to the Schedule of Investments included in this report for additional portfolio information.
Diversification does not assure a profit, nor does it protect against a loss in a declining market. Basis point is a unit equal to 1/100th of 1%. Price-to-sales is a tool for calculating relative valuation and is the market price per share divided by revenue per share.
Each Morningstar category average represents a universe of funds with similar investment objectives. © Morningstar, Inc. All Rights Reserved. The information contained herein: 1) is proprietary to Morningstar; 2) may not be copied or distributed and 3) is not warranted to be accurate, complete or timely. Neither Morningstar nor its content providers are responsible for any damages or losses arising from any use of this information. Past performance does not guarantee future results.
Financial Statements
HENNESSY CORNERSTONE MID CAP 30 FUND
As of October 31, 2014
(% of Net Assets)
| TOP TEN HOLDINGS (EXCLUDING CASH/CASH EQUIVALENTS) | % NET ASSETS |
| | |
| Take-Two Interactive Software, Inc. | 3.61% |
| Centene Corp. | 3.60% |
| UGI Corp. | 3.45% |
| Advance Auto Parts, Inc. | 3.42% |
| Live Nation Entertainment, Inc. | 3.38% |
| Sealed Air Corp. | 3.36% |
| NVR, Inc. | 3.35% |
| Reinsurance Group of America, Inc. | 3.33% |
| JetBlue Airways Corp. | 3.33% |
| Steel Dynamics, Inc. | 3.33% |
Note: For presentation purposes, the Fund has grouped some of the industry categories. For purposes of categorizing securities for compliance with Section 8(b)(1) of the Investment Company Act of 1940, the Fund uses more specific industry classifications.
HENNESSY FUNDS 1-800-966-4354
| | COMMON STOCKS – 96.72% | | Number | | | | | | % of | |
| | | | of Shares | | | Value | | | Net Assets | |
| | Consumer Discretionary – 25.59% | | | | | | | | | |
| | Advance Auto Parts, Inc. | | | 77,700 | | | $ | 11,418,792 | | | | 3.42 | % |
| | Brinker International, Inc. | | | 197,700 | | | | 10,604,628 | | | | 3.18 | % |
| | Foot Locker, Inc. | | | 187,300 | | | | 10,490,673 | | | | 3.15 | % |
| | JC Penney Co., Inc. (a) | | | 1,106,300 | | | | 8,418,943 | | | | 2.52 | % |
| | Live Nation Entertainment, Inc. (a) | | | 433,500 | | | | 11,271,000 | | | | 3.38 | % |
| | Mohawk Industries, Inc. (a) | | | 77,700 | | | | 11,036,508 | | | | 3.31 | % |
| | NVR, Inc. (a) | | | 9,114 | | | | 11,188,164 | | | | 3.35 | % |
| | Skechers USA, Inc. (a) | | | 200,100 | | | | 10,955,475 | | | | 3.28 | % |
| | | | | | | | | 85,384,183 | | | | 25.59 | % |
| | | | | | | | | | | | | | |
| | Consumer Staples – 6.05% | | | | | | | | | | | | |
| | Pilgrim’s Pride Corp. (a) | | | 327,900 | | | | 9,315,639 | | | | 2.79 | % |
| | Pinnacle Foods, Inc. | | | 321,300 | | | | 10,859,940 | | | | 3.26 | % |
| | | | | | | | | 20,175,579 | | | | 6.05 | % |
| | | | | | | | | | | | | | |
| | Financials – 6.48% | | | | | | | | | | | | |
| | Reinsurance Group of America, Inc. | | | 131,900 | | | | 11,112,575 | | | | 3.33 | % |
| | Voya Financial, Inc. | | | 268,000 | | | | 10,519,000 | | | | 3.15 | % |
| | | | | | | | | 21,631,575 | | | | 6.48 | % |
| | | | | | | | | | | | | | |
| | Health Care – 13.04% | | | | | | | | | | | | |
| | Centene Corp. (a) | | | 129,500 | | | | 12,000,765 | | | | 3.60 | % |
| | Health Net, Inc. (a) | | | 227,100 | | | | 10,789,521 | | | | 3.23 | % |
| | LifePoint Hospitals, Inc. (a) | | | 151,020 | | | | 10,571,400 | | | | 3.17 | % |
| | Tenet Healthcare Corp. (a) | | | 181,100 | | | | 10,150,655 | | | | 3.04 | % |
| | | | | | | | | 43,512,341 | | | | 13.04 | % |
| | | | | | | | | | | | | | |
| | Industrials – 15.84% | | | | | | | | | | | | |
| | AECOM Technology Corp. (a) | | | 323,200 | | | | 10,520,160 | | | | 3.15 | % |
| | HD Supply Holdings, Inc. (a) | | | 382,500 | | | | 11,031,300 | | | | 3.30 | % |
| | JetBlue Airways Corp. (a) | | | 962,500 | | | | 11,107,250 | | | | 3.33 | % |
| | Masco Corp. | | | 444,000 | | | | 9,799,080 | | | | 2.94 | % |
| | Ryder System, Inc. | | | 117,600 | | | | 10,404,072 | | | | 3.12 | % |
| | | | | | | | | 52,861,862 | | | | 15.84 | % |
| | | | | | | | | | | | | | |
| | Information Technology – 3.61% | | | | | | | | | | | | |
| | Take-Two Interactive Software, Inc. (a) | | | 456,000 | | | | 12,061,200 | | | | 3.61 | % |
The accompanying notes are an integral part of these financial statements.
| | COMMON STOCKS | | Number | | | | | | % of | |
| | | | of Shares | | | Value | | | Net Assets | |
| | Materials – 16.34% | | | | | | | | | |
| | Ball Corp. | | | 165,500 | | | $ | 10,663,165 | | | | 3.20 | % |
| | RPM International, Inc. | | | 231,700 | | | | 10,496,010 | | | | 3.14 | % |
| | Sealed Air Corp. | | | 309,200 | | | | 11,208,500 | | | | 3.36 | % |
| | Steel Dynamics, Inc. | | | 483,500 | | | | 11,125,335 | | | | 3.33 | % |
| | Valspar Corp. | | | 134,400 | | | | 11,042,304 | | | | 3.31 | % |
| | | | | | | | | 54,535,314 | | | | 16.34 | % |
| | | | | | | | | | | | | | |
| | Telecommunication Services – 6.32% | | | | | | | | | | | | |
| | Frontier Communications Corp. | | | 1,644,600 | | | | 10,755,684 | | | | 3.23 | % |
| | Windstream Holdings, Inc. | | | 984,300 | | | | 10,315,464 | | | | 3.09 | % |
| | | | | | | | | 21,071,148 | | | | 6.32 | % |
| | | | | | | | | | | | | | |
| | Utilities – 3.45% | | | | | | | | | | | | |
| | UGI Corp. | | | 305,600 | | | | 11,518,064 | | | | 3.45 | % |
| | | | | | | | | | | | | | |
| | Total Common Stocks | | | | | | | | | | | | |
| | (Cost $301,008,492) | | | | | | | 322,751,266 | | | | 96.72 | % |
| | | | | | | | | | | | | | |
| | SHORT-TERM INVESTMENTS – 3.25% | | | | | | | | | | | | |
| | Money Market Funds – 3.25% | | | | | | | | | | | | |
| | Fidelity Government Portfolio – | | | | | | | | | | | | |
| | Institutional Class, 0.01% (b) | | | 10,846,083 | | | | 10,846,083 | | | | 3.25 | % |
| | | | | | | | | | | | | | |
| | Total Short-Term Investments | | | | | | | | | | | | |
| | (Cost $10,846,083) | | | | | | | 10,846,083 | | | | 3.25 | % |
| | | | | | | | | | | | | | |
| | Total Investments | | | | | | | | | | | | |
| | (Cost $311,854,575) – 99.97% | | | | | | | 333,597,349 | | | | 99.97 | % |
| | Other Assets in Excess | | | | | | | | | | | | |
| | of Liabilities – 0.03% | | | | | | | 100,113 | | | | 0.03 | % |
| | TOTAL NET ASSETS – 100.00% | | | | | | $ | 333,697,462 | | | | 100.00 | % |
Percentages are stated as a percent of net assets.
| (a) | Non-income producing security. |
| (b) | The rate listed is the fund’s 7-day yield as of October 31, 2014. |
The accompanying notes are an integral part of these financial statements.
HENNESSY FUNDS 1-800-966-4354
Summary of Fair Value Exposure at October 31, 2014
The following is a summary of the inputs used to value the Fund’s net assets as of October 31, 2014 (See Note 3 in the accompanying notes to the financial statements):
| Common Stocks | | Level 1 | | | Level 2 | | | Level 3 | | | Total | |
| Consumer Discretionary | | $ | 85,384,183 | | | $ | — | | | $ | — | | | $ | 85,384,183 | |
| Consumer Staples | | | 20,175,579 | | | | — | | | | — | | | | 20,175,579 | |
| Financials | | | 21,631,575 | | | | — | | | | — | | | | 21,631,575 | |
| Health Care | | | 43,512,341 | | | | — | | | | — | | | | 43,512,341 | |
| Industrials | | | 52,861,862 | | | | — | | | | — | | | | 52,861,862 | |
| Information Technology | | | 12,061,200 | | | | — | | | | — | | | | 12,061,200 | |
| Materials | | | 54,535,314 | | | | — | | | | — | | | | 54,535,314 | |
| Telecommunication Services | | | 21,071,148 | | | | — | | | | — | | | | 21,071,148 | |
| Utilities | | | 11,518,064 | | | | — | | | | — | | | | 11,518,064 | |
| Total Common Stocks | | $ | 322,751,266 | | | $ | — | | | $ | — | | | $ | 322,751,266 | |
| Short-Term Investments | | | | | | | | | | | | | | | | |
| Money Market Funds | | $ | 10,846,083 | | | $ | — | | | $ | — | | | $ | 10,846,083 | |
| Total Short-Term Investments | | $ | 10,846,083 | | | $ | — | | | $ | — | | | $ | 10,846,083 | |
| Total Investments | | $ | 333,597,349 | | | $ | — | | | $ | — | | | $ | 333,597,349 | |
Transfers between levels are recognized at the end of the reporting period. During the one-year period ended October 31, 2014, the Fund recognized no transfers between levels.
The accompanying notes are an integral part of these financial statements.
Statement of Assets and Liabilities as of October 31, 2014 |
| ASSETS: | | | |
| Investments in securities, at value (cost $311,854,575) | | $ | 333,597,349 | |
| Dividends and interest receivable | | | 14,638 | |
| Receivable for fund shares sold | | | 855,567 | |
| Prepaid expenses and other assets | | | 19,281 | |
| Total Assets | | | 334,486,835 | |
| | | | | |
| LIABILITIES: | | | | |
| Payable for fund shares redeemed | | | 391,428 | |
| Payable to advisor | | | 200,234 | |
| Payable to administrator | | | 71,747 | |
| Payable to auditor | | | 19,021 | |
| Accrued service fees | | | 20,996 | |
| Accrued interest payable | | | 703 | |
| Accrued trustees fees | | | 2,538 | |
| Accrued expenses and other payables | | | 82,706 | |
| Total Liabilities | | | 789,373 | |
| NET ASSETS | | $ | 333,697,462 | |
| | | | | |
| NET ASSETS CONSIST OF: | | | | |
| Capital stock | | $ | 293,354,818 | |
| Accumulated net investment loss | | | (1,033,484 | ) |
| Accumulated net realized gain on investments | | | 19,633,354 | |
| Unrealized net appreciation on investments | | | 21,742,774 | |
| Total Net Assets | | $ | 333,697,462 | |
| | | | | |
| NET ASSETS | | | | |
| Investor Class: | | | | |
| Shares authorized (no par value) | | Unlimited | |
| Net assets applicable to outstanding Investor Class shares | | $ | 258,169,476 | |
| Shares issued and outstanding | | | 13,591,296 | |
| Net asset value, offering price and redemption price per share | | $ | 19.00 | |
| | | | | |
| Institutional Class: | | | | |
| Shares authorized (no par value) | | Unlimited | |
| Net assets applicable to outstanding Institutional Class shares | | $ | 75,527,986 | |
| Shares issued and outstanding | | | 3,901,354 | |
| Net asset value, offering price and redemption price per share | | $ | 19.36 | |
The accompanying notes are an integral part of these financial statements.
HENNESSY FUNDS 1-800-966-4354
Financial Statements
Statement of Operations for the year ended October 31, 2014 |
| INVESTMENT INCOME: | | | |
| Dividend income | | $ | 2,010,203 | |
| Interest income | | | 1,040 | |
| Total investment income | | | 2,011,243 | |
| | | | | |
| EXPENSES: | | | | |
| Investment advisory fees (See Note 5) | | | 1,912,346 | |
| Administration, fund accounting, custody and transfer agent fees | | | 461,247 | |
| Sub-transfer agent expenses – Investor Class (See Note 5) | | | 331,358 | |
| Sub-transfer agent expenses – Institutional Class (See Note 5) | | | 57,226 | |
| Service fees – Investor Class (See Note 5) | | | 194,841 | |
| Federal and state registration fees | | | 46,793 | |
| Reports to shareholders | | | 30,781 | |
| Compliance expense | | | 21,487 | |
| Audit fees | | | 19,054 | |
| Trustees’ fees and expenses | | | 11,242 | |
| Legal fees | | | 4,000 | |
| Interest expense (See Note 6) | | | 152 | |
| Other expenses | | | 19,959 | |
| Total expenses before waiver | | | 3,110,486 | |
| Administrative expense waiver (See Note 5) | | | (55,360 | ) |
| Net expenses | | | 3,055,126 | |
| NET INVESTMENT LOSS | | $ | (1,043,883 | ) |
| | | | | |
| REALIZED AND UNREALIZED GAINS (LOSSES): | | | | |
| Net realized gain on investments | | $ | 21,172,663 | |
| Net change in unrealized appreciation on investments | | | 14,300,425 | |
| Net gain on investments | | | 35,473,088 | |
| NET INCREASE IN NET ASSETS RESULTING FROM OPERATIONS | | $ | 34,429,205 | |
The accompanying notes are an integral part of these financial statements.
(This Page Intentionally Left Blank.)
HENNESSY FUNDS 1-800-966-4354
Financial Statements
| Statements of Changes in Net Assets |
| | | Year Ended | | | Year Ended | |
| | | October 31, 2014 | | | October 31, 2013 | |
| OPERATIONS: | | | | | | |
| Net investment income (loss) | | $ | (1,043,883 | ) | | $ | 1,152,317 | |
| Net realized gain on investments | | | 21,172,663 | | | | 59,762,626 | |
| Net change in unrealized appreciation (depreciation) | | | | | | | | |
| on investments | | | 14,300,425 | | | | (20,009,895 | ) |
| Net increase in net assets resulting from operations | | | 34,429,205 | | | | 40,905,048 | |
| | | | | | | | | |
| DISTRIBUTIONS TO SHAREHOLDERS FROM: | | | | | | | | |
| Net investment income | | | | | | | | |
| Investor Class | | | (454,042 | ) | | | (1,650,619 | ) |
| Institutional Class | | | (270,203 | ) | | | (675,237 | ) |
| Net realized gains | | | | | | | | |
| Investor Class | | | (11,623,817 | ) | | | — | |
| Institutional Class | | | (3,628,891 | ) | | | — | |
| Total distributions | | | (15,976,953 | ) | | | (2,325,856 | ) |
| | | | | | | | | |
| CAPITAL SHARE TRANSACTIONS: | | | | | | | | |
| Proceeds from shares subscribed – Investor Class | | | 123,845,765 | | | | 57,117,732 | |
| Proceeds from shares subscribed – Institutional Class | | | 42,799,834 | | | | 22,736,273 | |
| Dividends reinvested – Investor Class | | | 11,873,075 | | | | 1,616,989 | |
| Dividends reinvested – Institutional Class | | | 3,660,618 | | | | 657,114 | |
| Cost of shares redeemed – Investor Class | | | (50,946,355 | ) | | | (74,701,969 | ) |
| Cost of shares redeemed – Institutional Class | | | (26,622,774 | ) | | | (22,841,934 | ) |
| Net increase (decrease) in net assets derived | | | | | | | | |
| from capital share transactions | | | 104,610,163 | | | | (15,415,795 | ) |
| TOTAL INCREASE IN NET ASSETS | | | 123,062,415 | | | | 23,163,397 | |
| | | | | | | | | |
| NET ASSETS: | | | | | | | | |
| Beginning of year | | | 210,635,047 | | | | 187,471,650 | |
| End of year | | $ | 333,697,462 | | | $ | 210,635,047 | |
| Undistributed net investment income (loss), | | | | | | | | |
| end of year | | $ | (1,033,484 | ) | | $ | 724,245 | |
The accompanying notes are an integral part of these financial statements.
| Statements of Changes in Net Assets – Continued |
| | | Year Ended | | | Year Ended | |
| | | October 31, 2014 | | | October 31, 2013 | |
| CHANGES IN SHARES OUTSTANDING: | | | | | | |
| Shares sold – Investor Class | | | 6,500,015 | | | | 3,548,784 | |
| Shares sold – Institutional Class | | | 2,212,501 | | | | 1,394,219 | |
| Shares issued to holders as | | | | | | | | |
| reinvestment of dividends – Investor Class | | | 706,175 | | | | 114,114 | |
| Shares issued to holders as | | | | | | | | |
| reinvestment of dividends – Institutional Class | | | 213,582 | | | | 45,696 | |
| Shares redeemed – Investor Class | | | (2,821,483 | ) | | | (4,826,744 | ) |
| Shares redeemed – Institutional Class | | | (1,429,482 | ) | | | (1,443,416 | ) |
| Net increase (decrease) in shares outstanding | | | 5,381,308 | | | | (1,167,347 | ) |
The accompanying notes are an integral part of these financial statements.
HENNESSY FUNDS 1-800-966-4354
Financial Statements
For an Investor Class share outstanding throughout each year
| PER SHARE DATA: |
| Net asset value, beginning of year |
| |
| |
| Income from investment operations: |
| Net investment income (loss) |
| Net realized and unrealized gains on investments |
| Total from investment operations |
| |
| |
| Less distributions: |
| Dividends from net investment income |
| Dividends from net realized gains |
| Total distributions |
| Net asset value, end of year |
| |
| |
| TOTAL RETURN |
| |
| SUPPLEMENTAL DATA AND RATIOS: |
| Net assets, end of year (millions) |
| Ratio of expenses to average net assets |
| Ratio of net investment income (loss) to average net assets |
Portfolio turnover rate(1) |
(1) Portfolio turnover is calculated on the basis of the Fund as a whole.
The accompanying notes are an integral part of these financial statements.
| Year Ended October 31, | |
| 2014 | | | 2013 | | | 2012 | | | 2011 | | | 2010 | |
| | | | | | | | | | | | | | |
| $ | 17.32 | | | $ | 14.06 | | | $ | 12.15 | | | $ | 11.18 | | | $ | 8.73 | |
| | | | | | | | | | | | | | | | | | | |
| | | | | | | | | | | | | | | | | | | |
| | (0.05 | ) | | | 0.09 | | | | 0.08 | | | | (0.09 | ) | | | (0.03 | ) |
| | 3.04 | | | | 3.35 | | | | 1.83 | | | | 1.06 | | | | 2.48 | |
| | 2.99 | | | | 3.44 | | | | 1.91 | | | | 0.97 | | | | 2.45 | |
| | | | | | | | | | | | | | | | | | | |
| | | | | | | | | | | | | | | | | | | |
| | (0.05 | ) | | | (0.18 | ) | | | — | | | | — | | | | — | |
| | (1.26 | ) | | | — | | | | — | | | | — | | | | — | |
| | (1.31 | ) | | | (0.18 | ) | | | — | | | | — | | | | — | |
| $ | 19.00 | | | $ | 17.32 | | | $ | 14.06 | | | $ | 12.15 | | | $ | 11.18 | |
| | | | | | | | | | | | | | | | | | | |
| | 18.25 | % | | | 24.78 | % | | | 15.72 | % | | | 8.68 | % | | | 28.06 | % |
| | | | | | | | | | | | | | | | | | | |
| | | | | | | | | | | | | | | | | | | |
| $ | 258.17 | | | $ | 159.45 | | | $ | 145.85 | | | $ | 146.23 | | | $ | 123.20 | |
| | 1.25 | % | | | 1.31 | % | | | 1.37 | % | | | 1.36 | % | | | 1.39 | % |
| | (0.47 | )% | | | 0.51 | % | | | 0.59 | % | | | (0.79 | )% | | | (0.26 | )% |
| | 132 | % | | | 212 | % | | | 25 | % | | | 107 | % | | | 87 | % |
The accompanying notes are an integral part of these financial statements.
HENNESSY FUNDS 1-800-966-4354
Financial Statements
For an Institutional Class share outstanding throughout each year
| PER SHARE DATA: |
| Net asset value, beginning of year |
| |
| |
| Income from investment operations: |
| Net investment income (loss) |
| Net realized and unrealized gains on investments |
| Total from investment operations |
| |
| |
| Less distributions: |
| Dividends from net investment income |
| Dividends from net realized gains |
| Total distributions |
| Net asset value, end of year |
| |
| |
| TOTAL RETURN |
| |
| SUPPLEMENTAL DATA AND RATIOS: |
| Net asset value, end of year (millions) |
| Ratio of expenses to average net assets: |
| Before expense reimbursement |
| After expense reimbursement |
| Ratio of net investment income (loss) to average net assets: |
| Before expense reimbursement |
| After expense reimbursement |
Portfolio Turnover(1) |
(1) Portfolio turnover is calculated on the basis of the Fund as a whole.
The accompanying notes are an integral part of these financial statements.
| Year Ended October 31 | |
| 2014 | | | 2013 | | | 2012 | | | 2011 | | | 2010 | |
| | | | | | | | | | | | | | |
| $ | 17.62 | | | $ | 14.31 | | | $ | 12.32 | | | $ | 11.29 | | | $ | 8.78 | |
| | | | | | | | | | | | | | | | | | | |
| | | | | | | | | | | | | | | | | | | |
| | (0.08 | ) | | | 0.14 | | | | 0.09 | | | | (0.05 | ) | | | 0.02 | |
| | 3.17 | | | | 3.41 | | | | 1.90 | | | | 1.08 | | | | 2.49 | |
| | 3.09 | | | | 3.55 | | | | 1.99 | | | | 1.03 | | | | 2.51 | |
| | | | | | | | | | | | | | | | | | | |
| | | | | | | | | | | | | | | | | | | |
| | (0.09 | ) | | | (0.24 | ) | | | — | | | | — | | | | — | |
| | (1.26 | ) | | | — | | | | — | | | | — | | | | — | |
| | (1.35 | ) | | | (0.24 | ) | | | — | | | | — | | | | — | |
| $ | 19.36 | | | $ | 17.62 | | | $ | 14.31 | | | $ | 12.32 | | | $ | 11.29 | |
| | | | | | | | | | | | | | | | | | | |
| | 18.57 | % | | | 25.15 | % | | | 16.15 | % | | | 9.12 | % | | | 28.59 | % |
| | | | | | | | | | | | | | | | | | | |
| | | | | | | | | | | | | | | | | | | |
| $ | 75.53 | | | $ | 51.19 | | | $ | 41.62 | | | $ | 24.06 | | | $ | 21.38 | |
| | | | | | | | | | | | | | | | | | | |
| | 1.07 | % | | | 1.11 | % | | | 1.16 | % | | | 1.14 | % | | | 1.16 | % |
| | 0.98 | % | | | 0.98 | % | | | 0.98 | % | | | 0.98 | % | | | 0.98 | % |
| | | | | | | | | | | | | | | | | | | |
| | (0.29 | )% | | | 0.71 | % | | | 0.90 | % | | | (0.41 | )% | | | (0.03 | )% |
| | (0.20 | )% | | | 0.84 | % | | | 1.08 | % | | | (0.57 | )% | | | 0.15 | % |
| | 132 | % | | | 212 | % | | | 25 | % | | | 107 | % | | | 87 | % |
The accompanying notes are an integral part of these financial statements.
HENNESSY FUNDS 1-800-966-4354
Financial Statements
Notes to Financial Statements October 31, 2014 |
1). ORGANIZATION
The Hennessy Cornerstone Mid Cap 30 Fund (the “Fund”) is a series of Hennessy Funds Trust (the “Trust”), which was organized as a Delaware statutory trust on September 17, 1992. The Fund is an open-end management investment company registered under the Investment Company Act of 1940, as amended. The Fund is a successor to a fund with the same name (the “Predecessor Fund”) that was a series of Hennessy Mutual Funds, Inc., a Maryland corporation, pursuant to a reorganization that took place after the close of business on February 28, 2014. Prior to February 28, 2014, the Fund had no investment operations. As a result of the reorganization, holders of the Investor Class shares of the Predecessor Fund received Investor Class shares of the Fund (the Investor Class shares of the Fund are the successor to the accounting and performance information of the Predecessor Fund), and holders of the Institutional Class shares of the Predecessor Fund received Institutional Class shares of the Fund (the Institutional Class shares of the Fund are the successor to the accounting and performance information of the Predecessor Fund). The investment objective of the Fund is long-term growth of capital. The Fund is a diversified fund.
The Fund offers Investor Class and Institutional Class shares. Prior to October 26, 2012, the Investor Class shares were known as Original Class shares. Each class of shares differs principally in its respective administration, 12b-1 distribution and service fees, shareholder servicing, and transfer agent expenses and sales charges, if any. Each class has identical rights to earnings, assets, and voting privileges, except for class-specific expenses and exclusive rights to vote on matters affecting only an individual class.
2). SIGNIFICANT ACCOUNTING POLICIES
The following is a summary of significant accounting policies consistently followed by the Fund in the preparation of the financial statements. These policies are in conformity with U.S. generally accepted accounting principles (“GAAP”).
| a). | Investment Valuation – All investments in securities are recorded at their estimated fair value, as described in Note 3. |
| | |
| b). | Federal Income Taxes – Provision for federal income taxes or excise taxes has not been made since the Fund has elected to be taxed as a “regulated investment company” and intends to distribute substantially all of its taxable income to its shareholders and otherwise comply with the provisions of the Internal Revenue Code of 1986, as amended, applicable to regulated investment companies. Net investment income or loss and realized gains and losses for federal income tax purposes may differ from that reported on the financial statements because of temporary book and tax basis differences. Temporary differences are primarily the result of the treatment of wash sales for tax reporting purposes. Distributions from net realized gains for book purposes may include short-term capital gains, which are included as ordinary income to shareholders for tax purposes. |
| | Due to inherent differences in the recognition of income, expenses, and realized gains/losses under GAAP and federal income tax regulations, permanent differences between book and tax basis reporting for the 2014 fiscal year have been identified |
| | and appropriately reclassified on the Statement of Assets and Liabilities. The adjustments are as follow: |
| Undistributed | Accumulated | |
| Net Investment | Net Realized | |
| Income/(Loss) | Gain/(Loss) | Paid-in Capital |
| $10,399 | $(58,293) | $47,894 |
| c). | Income and Expenses – Dividend income is recognized on the ex-dividend date or as soon as information is available to the Fund. Interest income, which includes the amortization of premium and accretion of discount, is recognized on an accrual basis. The Fund is charged for those expenses that are directly attributable to the portfolio, such as advisory, administration, and certain shareholder service fees. Income, expenses (other than expenses attributable to a specific class), and realized and unrealized gains or losses on investments are allocated to each class of shares based on its respective net assets. |
| | |
| d). | Distributions to Shareholders – Dividends from net investment income for the Fund, if any, are declared and paid out annually, usually in December. Distributions of net realized capital gains, if any, are declared and paid annually, usually in November or December. |
| | |
| e). | Security Transactions – Investment and shareholder transactions are recorded on the trade date. The Fund determines the gain or loss realized from the investment transactions by comparing the original cost of the security lot sold with the net sale proceeds. Discounts and premiums on securities purchased are accreted/amortized over the life of the respective security. |
| | |
| f). | Use of Estimates – The preparation of financial statements in conformity with GAAP requires management to make estimates and assumptions that affect the reported amounts of assets and liabilities and disclosure of contingent assets and liabilities at the date of the financial statements and the reported change in net assets during the reporting period. Actual results could differ from those estimates. |
| | |
| g). | Share Valuation – The net asset value (“NAV”) per share of the Fund is calculated by dividing the sum of the value of the securities held by the Fund, plus cash or other assets, minus all liabilities (including estimated accrued expenses) by the total number of shares outstanding for the Fund, rounded to the nearest cent. The Fund’s shares will not be priced on days the New York Stock Exchange is closed for trading. The offering and redemption price per share for the Fund is equal to the Fund’s NAV per share. |
| | |
| h). | Repurchase Agreements – The Fund may enter into repurchase agreements with member banks or security dealers of the Federal Reserve Board whom the investment advisor deems creditworthy. The repurchase price generally equals the price paid by the Fund plus interest negotiated on the basis of current short-term rates. |
| | |
| | Securities pledged as collateral for repurchase agreements are held by the custodian bank until the respective agreements mature. Provisions of the repurchase agreements ensure that the market value of the collateral, including accrued interest thereon, is sufficient to cover the repurchase amount in the event of default of the counterparty. If the counterparty defaults and the value of the collateral declines or if the counterparty enters an insolvency proceeding, realization of the collateral by the Fund may be delayed or limited. |
| | |
| i). | Accounting for Uncertainty in Income Taxes – The Fund has adopted accounting policies regarding recognition and measurement of tax positions taken or expected to be taken on a tax return. The tax returns of the Fund for the prior three fiscal years |
HENNESSY FUNDS 1-800-966-4354
| | are open for examination. The Fund has reviewed all open tax years in major jurisdictions and concluded that there is no impact on the Fund’s net assets and no tax liability resulting from unrecognized tax benefits relating to uncertain income tax positions taken or expected to be taken on a tax return. The Fund’s major tax jurisdictions are U.S. federal and Delaware. |
| | |
| j). | Derivatives – The Fund may invest in, or enter into, derivatives, such as options, futures contracts, options on futures contracts, and swaps, for a variety of reasons, including to hedge certain risks, to provide a substitute for purchasing or selling particular securities, or to increase potential income gain. Derivatives may provide a cheaper, quicker, or more specifically focused way for a Fund to invest than “traditional” securities would. The main purpose of utilizing these derivative instruments is for hedging purposes. |
| | |
| | The Fund has adopted the financial accounting reporting rules as required by the Derivatives and Hedging Topic of the Financial Accounting Standards Board Accounting Standards Codification. Under such rules, the Fund is required to include enhanced disclosure that enables investors to understand how and why an entity uses derivatives, how derivatives are accounted for, and how derivatives instruments affect an entity’s results of operations and financial position. During the fiscal year ended October 31, 2014, the Fund did not hold any derivative instruments. |
| | |
| k). | Events Subsequent to the Fiscal Period End – The Fund has adopted financial reporting rules regarding subsequent events that require an entity to recognize in the financial statements the effects of all subsequent events that provide additional evidence about conditions that existed at the date of the balance sheet. Management has evaluated the Fund’s related events and transactions that occurred subsequent to October 31, 2014 through the date of issuance of the Fund’s financial statements. There were no events or transactions that occurred during this period that materially impacted the amounts or disclosures in the Fund’s financial statements. |
3). SECURITIES VALUATION
The Fund has adopted authoritative fair valuation accounting standards that establish an authoritative definition of fair value and set out a hierarchy for measuring fair value. These standards require additional disclosures about the various inputs and valuation techniques used to develop the measurements of fair value and a discussion in changes in valuation techniques and related inputs during the period. These inputs are summarized in the three broad levels listed below:
| | Level 1 – | Quoted unadjusted prices for identical instruments in active markets to which the Fund has access at the date of measurement. |
| | | |
| | Level 2 – | Quoted prices for similar instruments in active markets; quoted prices for identical or similar instruments in markets that are not active; and model-derived valuations in which all significant inputs and significant value drivers are observable in active markets. Level 2 inputs are those in markets for which there are few transactions, the prices are not current, the prices are fair value adjusted due to post-market close subsequent events (foreign markets), little public information exists, or instances where prices vary substantially over time or among brokered market makers. These inputs may also include interest rates, prepayment speeds, credit risk curves, default rates, and similar data. |
| | | |
| | Level 3 – | Model-derived valuations in which one or more significant inputs or significant value drivers are unobservable. Unobservable inputs are those inputs that reflect the Fund’s own assumptions about what market |
| | | participants would use to price the asset or liability based on the best available information. |
Following is a description of the valuation techniques applied to the Fund’s major categories of assets and liabilities measured at fair value on a recurring basis.
Equity Securities – Equity securities, including common stocks, preferred stocks, foreign issued common stocks, exchange traded funds, closed-end mutual funds, and real estate investment trusts, that are traded on a securities exchange for which a last-quoted sales price is readily available will generally be valued at the last sales price as reported by the primary exchange on which the securities are listed. Securities listed on The NASDAQ Stock Market (“NASDAQ”) will be valued at the NASDAQ Official Closing Price, which may differ from the last sales price reported. Securities traded on a securities exchange for which a last-quoted sales price is not readily available will generally be valued at the mean between the bid and ask prices. To the extent these securities are actively traded and valuation adjustments are not applied, they are classified in Level 1 of the fair value hierarchy.
Investment Companies – Investments in investment companies (e.g., mutual funds and exchange traded funds) are generally priced at the ending NAV provided by the Fund’s service agent and will be classified in Level 1 of the fair value hierarchy.
Debt Securities – Debt securities, including corporate bonds, asset-backed securities, mortgage-backed securities, municipal bonds, U.S. Treasuries, and U.S. government agency issues, are valued at market on the basis of valuations furnished by an independent pricing service that utilizes both dealer-supplied valuations and formula-based techniques. The pricing service may consider recently executed transactions in securities of the issuer or comparable issuers, market price quotations (where observable), bond spreads, and fundamental data relating to the issuer. In addition, the model may incorporate market observable data such as reported sales of similar securities, broker quotes, yields, bids, offers, and reference data. Certain securities are valued principally using dealer quotations. These securities are generally classified in Level 2 of the fair value hierarchy.
Short-Term Securities – Short-term equity investments, including money market funds, are valued in the manner specified above. Short-term debt investments are generally valued at amortized cost, which approximates fair market value, if their original maturity was 60 days or less, or by amortizing the values as of the 61st day prior to maturity, if their original term to maturity exceeded 60 days. Amortized cost is not used if its use would be inappropriate due to credit or other impairments of the issuer, in which the security would be fair valued, as described below. Short-term securities are generally classified in Level 1 or Level 2 of the fair market hierarchy depending on the inputs used and market activity levels for specific securities.
The Board of Trustees of the Fund (the “Board”) has adopted fair value pricing procedures that are followed when a price for a security is not readily available or if a significant event has occurred that indicates the closing price of a security no longer represents the true value of that security. Fair value pricing determinations are made in good faith in accordance with these procedures. There are numerous criteria that will be given consideration in determining a fair value of a security. Some of these criteria are trading volume of security and markets, the value of other like securities, and news events with direct bearing to security or market. Fair value pricing results in an estimated price for a security that reflects the amount the Fund might reasonably expect to receive in a current sale. Depending on the relative significance of the valuation inputs, these securities may be classified in either Level 2 or Level 3 of the fair value hierarchy.
The Board has delegated day-to-day valuation matters to a Valuation Committee comprised of one or more representatives from Hennessy Advisors, Inc., the Fund’s
HENNESSY FUNDS 1-800-966-4354
investment advisor. The function of the Valuation Committee is to value securities where current and reliable market quotations are not readily available. All actions taken by the Valuation Committee are reviewed by the Board.
The Fund has performed an analysis of all existing investments to determine the significance and character of all inputs to their fair value determination. Various inputs are used in determining the value of the Fund’s investments. The inputs or methodology used for valuing securities are not necessarily an indication of the risk associated with investing in those securities. Details related to the fair valuation hierarchy of the Fund’s securities as of October 31, 2014 are included in the Fund’s Schedule of Investments.
4). INVESTMENT TRANSACTIONS
Purchases and sales of investment securities (excluding government and short-term investments) for the Fund during the fiscal year ended October 31, 2014 were $414,314,556 and $330,862,353, respectively.
There were no purchases or sales/maturities of long-term U.S. Government Securities for the Fund during the fiscal year ended October 31, 2014.
5). INVESTMENT MANAGEMENT FEE AND OTHER TRANSACTIONS WITH AFFILIATES
Hennessy Advisors, Inc. (the “Advisor”) is the investment advisor of the Fund. The Advisor provides the Fund with investment management services under an Investment Advisory Agreement. The Advisor furnishes all investment advice, office space, facilities, and provides most of the personnel needed by the Fund. As compensation for its services, the Advisor is entitled to a monthly fee from the Fund. The fee is based upon the average daily net assets of the Fund at the annual rate of 0.74%. The net investment advisory fees payable for the Fund as of October 31, 2014 were $200,234.
The Advisor has agreed to waive its fees and absorb expenses to the extent that the total annual operating expenses (excluding all Federal, state and local taxes, interest, brokerage commissions, acquired fund fees and expenses and other costs incurred in connection with the purchase and sale of securities and extraordinary items) exceed 0.98% of the Fund’s net assets for the Institutional Class shares of the Fund. The expense limitation agreement for the Institutional Class shares can only be terminated by the Board.
For a period of three years after the year in which the Advisor waives or reimburses expenses, the Advisor may seek reimbursement from the Fund to the extent that total annual fund operating expenses are less than the expense limitation in effect at the time of the reimbursement. During the three years ended October 31, 2014, no Advisor fees were waived and therefore no expenses are subject to potential recovery.
The Board has approved a Shareholder Servicing Agreement for the Investor Class shares of the Fund, which was instituted to compensate the Advisor for the non-investment management services it provides to the Fund. The Shareholder Servicing Agreement provides for a monthly fee paid to the Advisor at an annual rate of 0.10% of the average daily net assets of the Fund attributable to Investor Class shares. Shareholder service fees payable for the Fund as of October 31, 2014 were $20,996.
The Fund has entered into agreements with various brokers, dealers, and financial intermediaries in connection with the sale of shares of the Fund. The agreements provide for periodic payments by the Fund to the brokers, dealers, and financial intermediaries for providing certain shareholder maintenance services (sub-transfer agent expenses). These shareholder services include the pre-processing and quality control of new accounts, shareholder correspondence, answering customer inquiries regarding account status, and facilitating shareholder telephone transactions. Fees paid by the Fund to various brokers, dealers, and financial intermediaries for the fiscal year ended October 31, 2014 were $388,584.
U.S. Bancorp Fund Services, LLC (“USBFS”) provides the Fund with administrative, fund accounting, and transfer agent services, including all regulatory reporting, and necessary office equipment and personnel. As administrator, USBFS prepares various federal and state regulatory filings, reports, and returns for the Fund; prepares reports and materials to be supplied to the Board; monitors the activities of the Fund’s custodian, transfer agent, and accountants; and coordinates the preparation and payment of the Fund’s expenses and reviews the Fund’s expense accruals. Fees paid to USBFS for the fiscal year ended October 31, 2014 were $405,887.
USBFS has voluntarily waived all or a portion of its fees allocated to the Institutional Class shares of the Fund. The administration fees voluntarily waived by USBFS during the fiscal year ended October 31, 2014 were $55,360.
U.S. Bank, N.A., an affiliate of USBFS, serves as the Fund’s custodian. Quasar Distributors, LLC acts as the Fund’s principal underwriter in a continuous public offering of the Fund’s shares. Quasar Distributors, LLC is an affiliate of USBFS and U.S. Bank, N.A.
6). LINE OF CREDIT
The Fund has a line of credit with the other funds in the Hennessy Funds family of funds (the “Hennessy Funds”) in the amount of the lesser of (i) $100,000,000 or (ii) 33.33% of each Hennessy Fund’s net assets, or 30% for the Hennessy Gas Utility Index Fund and 10% for the Hennessy Balanced Fund, intended to provide short-term financing, if necessary, subject to certain restrictions, in connection with shareholder redemptions. The credit facility is with the Hennessy Funds’ custodian bank, U.S. Bank, N.A. Borrowings under this arrangement bear interest at the bank’s prime rate. During the fiscal year ended October 31, 2014, the Fund had an outstanding average daily balance and a weighted average interest rate of $72,416 and 3.25%, respectively. The maximum amount outstanding for the Fund during the year was $6,608,000. At October 31, 2014, the Fund had a loan payable balance of $0.
7). FEDERAL TAX INFORMATION
As of October 31, 2014, the components of accumulated earnings (losses) for income tax purposes were as follow:
| | Cost of investments for tax purposes | | $ | 311,856,869 | |
| | Gross tax unrealized appreciation | | $ | 23,763,582 | |
| | Gross tax unrealized depreciation | | | (2,023,102 | ) |
| | Net tax unrealized appreciation | | $ | 21,740,480 | |
| | Undistributed ordinary income | | $ | — | |
| | Undistributed long-term capital gains | | | 20,622,992 | |
| | Total distributable earnings | | $ | 20,622,992 | |
| | Other accumulated loss | | $ | (2,020,828 | ) |
| | Total accumulated gain | | $ | 40,342,644 | |
The difference between book-basis and tax-basis unrealized appreciation is attributable primarily to wash sales.
At October 31, 2014, the Fund had capital loss carryforwards of $987,344 that expire on October 31, 2016.
During the year ended October 31, 2014, the capital loss carry forwards utilized for the Fund were $493,673.
Capital losses sustained in the year ended October 31, 2012 and in future taxable years will not expire and may be carried over by the Fund without limitation; however, they will retain the character of the original loss. Furthermore, any loss incurred during those taxable years will be required to be utilized prior to the losses incurred in taxable
HENNESSY FUNDS 1-800-966-4354
At October 31, 2014, the Fund deferred, on a tax basis, a post-December late year ordinary loss deferral of $1,033,484.
The tax character of distributions paid during fiscal year 2014 and fiscal year 2013 for the Fund were as follow:
| | | | Year Ended | | | Year Ended | |
| | | | October 31, 2014 | | | October 31, 2013 | |
| | Ordinary income | | $ | 724,245 | | | $ | 2,325,856 | |
| | Long-term capital gain | | | 15,252,708 | | | | — | |
| | | | $ | 15,976,953 | | | $ | 2,325,856 | |
8). AGREEMENT AND PLAN OF REORGANIZATION
On December 11, 2013, the Board approved an Agreement and Plan of Reorganization (the “Agreement”), of the Hennessy Cornerstone Mid Cap 30 Fund (the “New Fund”), pursuant to which the New Fund would be a successor to the corresponding series of the same name of Hennessy Mutual Funds, Inc., a Maryland corporation (the “Predecessor Fund”). The Agreement provided for the transfer of assets of the Predecessor Fund to the New Fund and the assumption of the liabilities of the Predecessor Fund by the New Fund. The New Fund had the same investment objective and substantially similar principal investment strategies as the Predecessor Fund. The reorganization was effective as of the close of business on February 28, 2014. The following table illustrates the specifics of the reorganization:
| | Shares of the New Fund | | | |
| Predecessor Fund | Issued to Shareholders of | New Fund | Combined | Tax Status |
| Net Assets | the Predecessor Fund | Net Assets | Net Assets | of Transfer |
$223,166,917(1) | 12,549,357 | $223,166,917 | $223,166,917 | Non-taxable |
| | (1) | Included accumulated realized gains and unrealized appreciation in the amounts of $15,487,981 and $27,823,920, respectively. |
9). EVENTS SUBSEQUENT TO YEAR-END
On December 8, 2014, a long-term capital gains distribution of $1.13945 per share for the Investor Class and $1.16167 per share for the Institutional Class were declared and paid to shareholders of record on December 5, 2014.
Report of Independent Registered Public Accounting Firm
The Board of Trustees and Shareholders
Hennessy Funds Trust:
We have audited the accompanying statement of assets and liabilities of Hennessy Cornerstone Mid Cap 30 Fund (the Fund), a series of Hennessy Funds Trust (formerly a series of Hennessy Mutual Funds, Inc.), including the schedule of investments, as of October 31, 2014, and the related statement of operations for the year then ended, the statements of changes in net assets for each of the years in the two-year period then ended, and the financial highlights for each of the years in the five-year period then ended. These financial statements and financial highlights are the responsibility of the Fund’s management. Our responsibility is to express an opinion on these financial statements and financial highlights based on our audits.
We conducted our audits in accordance with the standards of the Public Company Accounting Oversight Board (United States). Those standards require that we plan and perform the audit to obtain reasonable assurance about whether the financial statements and financial highlights are free of material misstatement. An audit includes examining, on a test basis, evidence supporting the amounts and disclosures in the financial statements. Our procedures included confirmation of investments owned as of October 31, 2014, by correspondence with the custodian and brokers or by other appropriate auditing procedures. An audit also includes assessing the accounting principles used and significant estimates made by management, as well as evaluating the overall financial statement presentation. We believe that our audits provide a reasonable basis for our opinion.
In our opinion, the financial statements and financial highlights referred to above present fairly, in all material respects, the financial position of the Fund as of October 31, 2014, and the results of its operations for the year then ended, the changes in its net assets for each of the years in the two-year period then ended, and the financial highlights for each of the years in the five-year period then ended, in conformity with U.S. generally accepted accounting principles.
Milwaukee, Wisconsin
December 30, 2014
HENNESSY FUNDS 1-800-966-4354
Trustees and Officers of the Fund (Unaudited)
The business and affairs of the Fund are managed under the direction of the Fund’s Board of Trustees. Information pertaining to the Trustees and Officers of the Fund is set forth below. The Fund’s Statement of Additional Information includes additional information about the Fund’s Trustees and Officers and is available, without charge, upon request by calling 1-800-966-4354.
| | | | | Number of | |
| | | Term of | | Portfolios | |
| | | Office | | in the | Other |
| | | and | | Fund | Directorships |
| | Position(s) | Length | Principal | Complex | (During Past |
| Name, Address, | Held with | of Time | Occupation(s) | Overseen | Five Years)(2) |
| and Age | the Fund | Served | During Past Five Years | by Trustee | Held by Trustee |
| | | |
| Disinterested Trustees (as defined below) | | |
| | | | | | |
| J. Dennis DeSousa | Trustee | Indefinite, | Mr. DeSousa is a real | 16 | Hennessy SPARX |
| Age: 78 | | until | estate investor. | | Funds Trust; |
| Address: | | successor | | | Hennessy Mutual |
| c/o Hennessy | | elected | | | Funds, Inc.; and |
| Advisors, Inc. | | | | | The Hennessy |
| 7250 Redwood Blvd. | | Served | | | Funds, Inc. |
| Suite 200 | | since | | | |
| Novato, CA 94945 | | January | | | |
| | | 1996 | | | |
| | | for the | | | |
| | | Funds (or | | | |
| | | Predecessor | | | |
| | | Funds) | | | |
| | | | | | |
| Robert T. Doyle | Trustee | Indefinite, | Mr. Doyle has been the | 16 | Hennessy SPARX |
| Age: 67 | | until | Sheriff of Marin County, | | Funds Trust; |
| Address: | | successor | California since 1996. | | Hennessy Mutual |
| c/o Hennessy | | elected | | | Funds, Inc.; and |
| Advisors, Inc. | | | | | The Hennessy |
| 7250 Redwood Blvd. | | Served | | | Funds, Inc. |
| Suite 200 | | since | | | |
| Novato, CA 94945 | | January | | | |
| | | 1996 | | | |
| | | for the | | | |
| | | Funds (or | | | |
| | | Predecessor | | | |
| | | Funds) | | | |
| | | | | | |
| Gerald P. Richardson | Trustee | Indefinite, | Mr. Richardson is an | 16 | Hennessy SPARX |
| Age: 69 | | until | independent consultant | | Funds Trust; |
| Address: | | successor | in the securities industry. | | Hennessy Mutual |
| c/o Hennessy | | elected | | | Funds, Inc.; and |
| Advisors, Inc. | | | | | The Hennessy |
| 7250 Redwood Blvd. | | Served | | | Funds, Inc. |
| Suite 200 | | since | | | |
| Novato, CA 94945 | | May 2004 | | | |
| | | for the | | | |
| | | Funds (or | | | |
| | | Predecessor | | | |
| | | Funds) | | | |
| | | | | Number of | |
| | | Term of | | Portfolios | |
| | | Office | | in the | Other |
| | | and | | Fund | Directorships |
| | Position(s) | Length | Principal | Complex | (During Past |
| Name, Address, | Held with | of Time | Occupation(s) | Overseen | Five Years)(2) |
| and Age | the Fund | Served | During Past Five Years | by Trustee | Held by Trustee |
| | | |
| “Interested Persons” (as defined in the 1940 Act) | | |
| | | | | | |
Neil J. Hennessy(1) | Chief | Trustee: | Mr. Hennessy has been | 16 | Hennessy |
| Age: 58 | Investment | Indefinite, | employed by Hennessy | | Advisors, Inc. |
| Address: | Officer, | until | Advisors, Inc., the Funds’ | | (current); |
| c/o Hennessy | Portfolio | successor | investment advisor, since | | Hennessy SPARX |
| Advisors, Inc. | Manager, | elected | 1989. He currently serves | | Funds Trust; |
| 7250 Redwood Blvd. | President, | | as President, Chairman | | Hennessy Mutual |
| Suite 200 | Trustee | Served | and CEO of Hennessy | | Funds, Inc.; and |
| Novato, CA 94945 | and | since | Advisors, Inc. | | The Hennessy |
| | Chairman | January | | | Funds, Inc. |
| | of the | 1996 | | | |
| | Board | for the | | | |
| | | Funds (or | | | |
| | | Predecessor | | | |
| | | Funds) | | | |
| | | | | | |
| | | Officer: | | | |
| | | 1 year term | | | |
| | | | | | |
| | | Served | | | |
| | | since | | | |
| | | June 2008 | | | |
| | | for the | | | |
| | | Funds (or | | | |
| | | Predecessor | | | |
| | | Funds) | | | |
| | | | | | |
Teresa M. Nilsen(1) | Executive | 1 year term | Ms. Nilsen has been | N/A | N/A |
| Age: 48 | Vice | | employed by Hennessy | | |
| Address: | President | Served | Advisors, Inc., the Funds’ | | |
| c/o Hennessy | and | since | investment advisor, since | | |
| Advisors, Inc. | Treasurer | January | 1989. She currently serves | | |
| 7250 Redwood Blvd. | | 1996 | as Executive Vice President, | | |
| Suite 200 | | for the | Chief Operations Officer, | | |
| Novato, CA 94945 | | Funds (or | Chief Financial Officer, and | | |
| | | Predecessor | Secretary of Hennessy | | |
| | | Funds) | Advisors, Inc. | | |
| (1) | All Officers of the Hennessy Funds and employees of the Manager are Interested Persons of the Funds. |
| (2) | Pursuant to an internal reorganization, the series of Hennessy Mutual Funds, Inc. (“HMFI”), The Hennessy Funds, Inc. (“HFI”) and Hennessy SPARX Funds Trust (“HSFT”) were reorganized into series of Hennessy Funds Trust on February 28, 2014, which mirrored the corresponding series of HFMI, HFI and HSFT. Subsequent to the reorganization, HFMI, HFI and HSFT were dissolved. |
HENNESSY FUNDS 1-800-966-4354
| | | Term of | |
| | | Office | |
| | | and | |
| | Position(s) | Length | Principal |
| Name, Address, | Held with | of Time | Occupation(s) |
| and Age | the Fund | Served | During Past Five Years |
| | | | |
| Interested Persons | | | |
| | | | |
Daniel B. Steadman(1) | Executive | 1 year term | Mr. Steadman has been employed by |
| Age: 58 | Vice President | | Hennessy Advisors, Inc., the Funds’ |
| Address: | and Secretary | Served since | investment advisor, since 2000. |
| c/o Hennessy Advisors, Inc. | | March 2000 | He currently serves as Executive |
| 7250 Redwood Blvd. | | for the Funds (or | Vice President and Chief Compliance |
| Suite 200 | | Predecessor Funds) | Officer of Hennessy Advisors, Inc. |
| Novato, CA 94945 | | | |
| | | | |
Jennifer Cheskiewicz(1) | Senior | 1 year term | Ms. Cheskiewicz has been employed by |
| Age: 37 | Vice President | | Hennessy Advisors, Inc., the Funds’ |
| Address: | and Chief | Served since | investment advisor, since June 2013. |
| c/o Hennessy Advisors, Inc. | Compliance | June 2013 | She previously served as in-house |
| 7250 Redwood Blvd. | Officer | for the Funds (or | counsel to Carlson Capital, L.P., an |
| Suite 200 | | Predecessor Funds) | SEC-registered investment advisor to |
| Novato, CA 94945 | | | several private funds from February |
| | | | 2010 to May 2013. Prior to that, she |
| | | | was an attorney with Gibson, Dunn & |
| | | | Crutcher LLP from September 2005 |
| | | | through February 2010. She currently |
| | | | serves as General Counsel of |
| | | | Hennessy Advisors, Inc. |
| | | | |
Brian Carlson(1) | Senior | 1 year term | Mr. Carlson has been employed by |
| Age: 42 | Vice President | | Hennessy Advisors, Inc., the Funds’ |
| Address: | and Head of | Served since | investment advisor, since |
| c/o Hennessy Advisors, Inc. | Distribution | December 2013 | December 2013. |
| 7250 Redwood Blvd. | | for the Funds (or | |
| Suite 200 | | Predecessor Funds) | Mr. Carlson was previously a |
| Novato, CA 94945 | | | co-founder and principal of Trivium |
| | | | Consultants, LLC from February 2011 |
| | | | through November 2013. Prior to that, |
| | | | he was the Senior Managing Director |
| | | | of NRP Financial, Inc. from August |
| | | | 2007 through February 2011. |
| | | | |
David Ellison(1) | Portfolio Manager | 1 year term | Mr. Ellison has served as Portfolio |
| Age: 56 | and Senior | | Manager of the Large Cap Financial |
| Address: | Vice President | Served since | Fund, the Small Cap Financial Fund, |
| c/o Hennessy Advisors, Inc. | | October 2012 | and the Technology Fund |
| 101 Federal Street | | for the Funds (or | since inception. |
| Suite 1900 | | Predecessor Funds) | |
| Boston, MA 02110 | | | Mr. Ellison previously served as Director, |
| | | | CIO and President of FBR Advisers, Inc. |
| | | | from December 1999 to October 2012. |
| (1) | All Officers of the Hennessy Funds and employees of the Manager are Interested Persons of the Funds. |
| | | Term of | |
| | | Office | |
| | | and | |
| | Position(s) | Length | Principal |
| Name, Address, | Held with | of Time | Occupation(s) |
| and Age | the Fund | Served | During Past Five Years |
| | | | |
| Interested Persons | | | |
| | | | |
Brian Peery(1) | Portfolio Manager | 1 year term | Mr. Peery has been a Portfolio Manager |
| Age: 45 | and | | of the Cornerstone Growth Fund, |
| Address: | Vice President | Served since | the Cornerstone Mid Cap 30 Fund, the |
| c/o Hennessy Advisors, Inc. | | March 2003 | Cornerstone Large Growth Fund, the |
| 7250 Redwood Blvd. | | as Vice President | Cornerstone Value Fund, the Total |
| Suite 200 | | for the Funds (or | Return Fund, and the Balanced Fund |
| Novato, CA 94945 | | Predecessor Funds) | since October 2014. From February |
| | | | 2011 through September 2014, he |
| | | Served since | served as Co-Portfolio Manager of |
| | | February 2011 | the same funds. |
| | | as Co-Portfolio | |
| | | Manager | Mr. Peery has been employed by |
| | | for the Funds (or | Hennessy Advisors, Inc., the Funds’ |
| | | Predecessor Funds) | investment advisor, since 2002. |
| | | | |
Winsor (Skip) Aylesworth(1) | Portfolio Manager | 1 year term | Mr. Aylesworth has been Portfolio |
| Age: 67 | and | | Manager of the Gas Utility Index Fund |
| Address: | Vice President | Served since | since 1998 and Portfolio Manager of |
| c/o Hennessy Advisors, Inc. | | October 2012 | the Technology Fund since inception. |
| 101 Federal Street | | for the Funds (or | |
| Suite 1900 | | Predecessor Funds) | Mr. Aylesworth previously served as |
| Boston, MA 02110 | | | Executive Vice President of The FBR |
| | | | Funds from 1999 to October 2012. |
| | | | |
Ryan Kelley(1) | Portfolio Manager | 1 year term | Mr. Kelley has been a Portfolio Manager |
| Age: 42 | and | | of the Gas Utility Index Fund (formerly |
| Address: | Vice President | Served since | the FBR Gas Utility Index Fund), the |
| c/o Hennessy Advisors, Inc. | | March 2013 | Small Cap Financial Fund (formerly the |
| 1340 Environ Way | | for the Funds (or | FBR Small Cap Financial Fund), and the |
| Chapel Hill, NC 27517 | | Predecessor Funds) | Large Cap Financial Fund (formerly the |
| | | | FBR Large Cap Financial Fund) since |
| | | | October 2014. From March 2013 |
| | | | through September 2014, he served |
| | | | as a Co-Portfolio Manager of the same |
| | | | funds. Prior to that, he was a Portfolio |
| | | | Analyst of the Hennessy Funds. |
| | | | |
| | | | Mr. Kelley previously served as Portfolio |
| | | | Manager of The FBR Funds from |
| | | | January 2008 to October 2012. |
| (1) | All Officers of the Hennessy Funds and employees of the Manager are Interested Persons of the Funds. |
HENNESSY FUNDS 1-800-966-4354
October 31, 2014
As a shareholder of the Fund, you incur two types of costs: (1) transaction costs, including sales charges (loads) on purchase payments, reinvested dividends, or other distributions; redemption fees; and exchange fees; and (2) ongoing costs, including management fees; service fees; and other Fund expenses. This Example is intended to help you understand your ongoing costs (in dollars) of investing in the Fund and to compare these costs with the ongoing costs of investing in other mutual funds. The Example is based on an investment of $1,000 invested at the beginning of the period and held for the entire period from May 1, 2014 through October 31, 2014.
Actual Expenses
The first line of the table below under the “Investor Class” and “Institutional Class” headings provides information about actual account values and actual expenses. Although the Fund charges no sales loads or transaction fees, you will be assessed fees for outgoing wire transfers, returned checks and stop payment orders at prevailing rates charged by U.S. Bancorp Fund Services, LLC, the Fund’s transfer agent. If you request that a redemption be made by wire transfer, currently a $15.00 fee is charged by the Fund’s transfer agent. IRA accounts will be charged a $15.00 annual maintenance fee. The example below includes, but is not limited to, management fees, shareholder servicing fees, fund accounting, custody, and transfer agent fees. However, the example below does not include portfolio trading commissions and related expenses, and other extraordinary expenses as determined under generally accepted accounting principles. You may use the information in this line, together with the amount you invested, to estimate the expenses that you paid over the period. Simply divide your account value by $1,000 (for example, an $8,600 account value divided by $1,000 = 8.6), then multiply the result by the number in the first line of the table under the “Investor Class” and “Institutional Class” headings in the column entitled “Expenses Paid During Period” to estimate the expenses you paid on your account during this period.
Hypothetical Example for Comparison Purposes
The second line of the table below under the “Investor Class” and “Institutional Class” headings provides information about hypothetical account values and hypothetical expenses based on the Fund’s actual expense ratios and an assumed rate of return of 5% per year before expenses, which is not the Fund’s actual return. The hypothetical account values and expenses may not be used to estimate the actual ending account balance or expenses you paid for the period. You may use this information to compare the ongoing costs of investing in the Fund and other funds. To do so, compare this 5% hypothetical example with the 5% hypothetical examples that appear in the shareholder reports of the other funds. Please note that the expenses shown in the table are meant to highlight your ongoing costs only and do not reflect any transactional costs, such as sales charges (loads), or exchange fees. Therefore, the second line of the table under the “Investor Class” and “Institutional Class” headings is useful in comparing ongoing costs only, and will not help you determine the relative total costs of owning different funds. In addition, if these transactional costs were included, your costs would have been higher.
| | Beginning | Ending | Expenses Paid |
| | Account Value | Account Value | During Period(1) |
| | 5/1/14 | 10/31/14 | 5/1/14 – 10/31/14 |
| Investor Class | | | |
| | | | |
| Actual | $1,000.00 | $1,049.70 | $6.30 |
| | | | |
| Hypothetical (5% return | | | |
| before expenses) | $1,000.00 | $1,019.06 | $6.21 |
| | | | |
| Institutional Class | | | |
| | | | |
| Actual | $1,000.00 | $1,051.00 | $5.07 |
| | | | |
| Hypothetical (5% return | | | |
| before expenses) | $1,000.00 | $1,020.27 | $4.99 |
| (1) | Expenses are equal to the Fund’s expense ratio of 1.22% for Investor Class shares or 0.98% for Institutional Class shares, as applicable, multiplied by the average account value over the period, multiplied by 184/365 days (to reflect one-half year period). |
HENNESSY FUNDS 1-800-966-4354
Proxy Voting
A description of the policies and procedures the Fund uses to determine how to vote proxies relating to portfolio securities is available without charge: (1) by calling 1-800-966-4354; (2) on the Hennessy Funds’ website at hennessyfunds.com; or (3) on the U.S. Securities and Exchange Commission’s (the “SEC”) website at www.sec.gov. The Fund’s proxy voting record is available on both the Hennessy Funds’ website at hennessyfunds.com and the SEC’s website at www.sec.gov no later than August 31 for the prior 12 months ending June 30.
Quarterly Filings on Form N-Q
The Fund files its complete schedule of portfolio holdings with the SEC for the first and third quarters of each fiscal year on Form N-Q. The Fund’s Forms N-Q are available on the SEC’s website at www.sec.gov. The Fund’s Forms N-Q may be reviewed and copied at the SEC’s Public Reference Room in Washington, DC and information on the operation of the Public Reference Room may be obtained by calling 1-800-SEC-0330. Information included in the Fund’s Forms N-Q will also be available upon request by calling 1-800-966-4354.
Federal Tax Distribution Information
(Unaudited)
For the fiscal year ended October 31, 2014, certain dividends paid by the Fund may be subject to a maximum tax rate of 20%, as provided for by the Jobs and Growth Tax Relief Reconciliation Act of 2003. The percentage of dividends declared from ordinary income designated as qualified dividend income was 100.00%.
For corporate shareholders, the percent of ordinary income distributions qualifying for the corporate dividends received deduction for the fiscal year ended October 31, 2014 was 100.00%.
The percentage of taxable ordinary income distributions that are designated as short-term capital gain distributions under Section 871(k)(2)(C) of the Internal Revenue Code of 1986, as amended, for the Fund was 0.00%.
Householding
To help keep the Fund’s costs as low as possible, we generally deliver a single copy of most financial reports and prospectuses to shareholders who share an address, even if the accounts are registered under different names. This process, known as “householding,” does not apply to account statements. You may, of course, request an individual copy of a prospectus or financial report at any time. If you would like to receive separate mailings, please call the Administrator at 1-800-261-6950 or 1-414-765-4124 and we will begin individual delivery within 30 days of your request. If your account is held through a financial institution or other intermediary, please contact them directly to request individual delivery.
Privacy Policy
We collect the following non-public personal information about you:
| | • | information we receive from you on or in applications or other forms, correspondence, or conversations, including, but not limited to, your name, address, phone number, social security number, assets, income and date of birth; |
| | | and |
| | • | information about your transactions with us, our affiliates, or others, including, but not limited to, your account number and balance, payment history, parties to transactions, cost basis information and other financial information. |
We do not disclose any non-public personal information about our current or former shareholders to nonaffiliated third parties, except as permitted by law. For example, we are permitted by law to disclose all of the information we collect, as described above, to our Transfer Agent to process your transactions. Furthermore, we restrict access to your non-public personal information to those persons who require such information to provide products or services to you. We maintain physical, electronic and procedural safeguards that comply with federal standards to guard your non-public personal information.
In the event that you hold shares of the Fund through a financial intermediary, including, but not limited to, a broker-dealer, bank or trust company, the privacy policy of your financial intermediary would govern how your non-public personal information would be shared with nonaffiliated third parties.
HENNESSY FUNDS 1-800-966-4354
(This Page Intentionally Left Blank.)
(This Page Intentionally Left Blank.)
For information, questions or assistance, please call
The Hennessy Funds
1-800-966-4354 or 1-415-899-1555
INVESTMENT ADVISOR
Hennessy Advisors, Inc.
7250 Redwood Blvd., Suite 200
Novato, California 94945
ADMINISTRATOR,
TRANSFER AGENT,
DIVIDEND PAYING AGENT &
SHAREHOLDER SERVICING AGENT
U.S. Bancorp Fund Services, LLC
P.O. Box 701
Milwaukee, Wisconsin 53201-0701
CUSTODIAN
U.S. Bank N.A.
Custody Operations
1555 North River Center Dr., Suite 302
Milwaukee, Wisconsin 53212
TRUSTEES
Neil J. Hennessy
Robert T. Doyle
J. Dennis DeSousa
Gerald P. Richardson
COUNSEL
Foley & Lardner LLP
777 East Wisconsin Avenue
Milwaukee, Wisconsin 53202-5306
INDEPENDENT REGISTERED
PUBLIC ACCOUNTING FIRM
KPMG LLP
777 East Wisconsin Avenue
Milwaukee, Wisconsin 53202-5306
DISTRIBUTOR
Quasar Distributors, LLC
615 East Michigan Street
Milwaukee, Wisconsin 53202
hennessyfunds.com | 1-800-966-4354
This report has been prepared for shareholders and may be distributed to
others only if preceded or accompanied by a current prospectus.

ANNUAL REPORT
OCTOBER 31, 2014
HENNESSY CORNERSTONE
LARGE GROWTH FUND
Investor Class HFLGX
Institutional Class HILGX
hennessyfunds.com | 1-800-966-4354
(This Page Intentionally Left Blank.)
Contents
| Letter to Shareholders | | 2 |
| Performance Overview | | 4 |
| Financial Statements | | |
| Schedule of Investments | | 7 |
| Statement of Assets and Liabilities | | 11 |
| Statement of Operations | | 12 |
| Statements of Changes in Net Assets | | 13 |
| Financial Highlights | | 14 |
| Notes to the Financial Statements | | 18 |
| Report of Independent Registered Public Accounting Firm | | 25 |
| Trustees and Officers of the Fund | | 26 |
| Expense Example | | 30 |
| Proxy Voting | | 32 |
| Quarterly Filings on Form N-Q | | 32 |
| Federal Tax Distribution Information | | 32 |
| Householding | | 32 |
| Privacy Policy | | 33 |
HENNESSY FUNDS 1-800-966-4354
December 2014
Dear Shareholder:
As I look back at 2014, I realize that in this age of rapidly evolving technology, information is delivered and absorbed so quickly that it is difficult to remember what happened last week, let alone what’s happened over the course of an entire year. That is why I’d like to take a moment to recall some of the year’s highs and lows, economically, politically and socially, here in the U.S. and around the globe. 2014 was scarred by political partisanship, civil unrest in the U.S., Ukraine and many other countries, the arrival of terrorist group ISIS, the tragedies of school shootings and natural disasters, and the frightening outbreak of Ebola. However, there were also positive events this year: we survived a government shutdown over healthcare reform, jobs reports have been consistently, albeit anemically, improving, and home prices remained relatively stable, after recovering significantly in 2013. And, important to us here at Hennessy, our hometown team, the San Francisco Giants, won their third World Series in just five years!
A significant event for the financial industry this past year was the confirmation of Janet Yellen as Chair of the Federal Reserve, which served to calm the nerves of business and political leaders alike. I believe Yellen’s leadership will benefit U.S. business owners, as the Fed continues to be a voice of reason in a sea of political and economic rhetoric. The Fed has also supported the economy and corporate America by helping keep interest rates reasonable and low.
The stock market has continued its determined comeback from the lows of 2009, setting multiple record highs in recent months. The U.S. financial markets have provided strong returns over the past twelve-month period ended October 31, 2014, with the Dow Jones Industrial Average (DJIA) returning over 14% and S&P 500 Index returning over 17% during the period. The DJIA currently has a dividend yield of 2.2%, which is equal to that of a 10-Year U.S. Treasury, which is currently also yielding 2.2%. I continue to believe that investments in high-yielding, high-quality stocks have the potential to not only provide income but also the potential for stock price appreciation as well. Fixed income investing has run its course, in my opinion, and many individuals are currently benefiting from the return to investing in equities that possess strong fundamentals. American investors are slowly migrating from fixed income to equities. Currently, 54% of Americans invest in stocks, and I do expect this percentage to increase, especially if interest rates move higher.
For the past several years, U.S. corporations have been driving shareholder value by making acquisitions, initiating and raising dividends, investing in internal infrastructure and buying back stock. However, this year I began to see a shift from those strategies. I believe the easier to execute acquisitions are a thing of the past, and firms now have to be even more creative to execute accretive deals. I also believe that while firms may continue to initiate dividends, fewer firms will raise their dividends and fewer firms will participate in stock buyback programs going forward. What will these cash-rich companies do with their capital if they are not raising dividends or buying back stock? I believe they may begin to initiate capital expenditure programs that could truly benefit economic growth.
Liquidity and monetary conditions are supportive, causing the cost of capital to be very low. I believe firms will choose to spend capital to expand their sales, and they may even begin to hire in earnest. Once a company begins to move in this way, the cost to
defer becomes real for competitors. With almost $3 trillion in cash and short-term investments sitting on the balance sheets of the S&P 500 companies, a strategic shift by firms to spend their idle capital, while slow, could potentially further economic growth in the U.S. in my opinion.
Economic progress and growth remain slow, yet steady, and unemployment, though improving, remains high. Oil prices have fallen, giving consumers a bit more discretionary income. While the midterm elections may not end all of the gridlock in Washington, hopefully we will receive clarity on the political headwinds of taxes and regulations, which have not improved over the past several years.
The markets have had several quarters without any truly significant downturn. The pullbacks we recently experienced, most notably in July and October, were short-lived, as evidenced by the quick rebound to record high market levels. I firmly believe that we are in a secular bull market, and I continue to tell investors to try to remain calm in the face of volatility and continue to focus on the strong, long-term fundamentals that are evident in the market today. Many companies continue to have strong balance sheets, with record cash flows and profits. With this current bull market in its fifth year, investors should expect some volatility.
I am encouraged by the strong returns for the major U.S. financial market indices and by the performance of the Hennessy Funds over the past year. Thank you for your continued confidence and investment in our products. If you have any questions or would like to speak with us directly, please don’t hesitate to call us at (800) 966-4354.
Best regards,
Neil J. Hennessy
President and Chief Investment Officer
Past performance does not guarantee future results.
Mutual fund investing involves risk. Principal loss is possible.
Opinions expressed are those of Neil Hennessy and are subject to change, are not guaranteed and should not be considered investment advice.
The Dow Jones Industrial Average and S&P 500 Index are unmanaged indices commonly used to measure the performance of U.S. stocks. One cannot invest directly in an index.
Cash flow can be used as an indication of a company’s financial strength. A firm’s cash flow is the movement of cash in and out of the firm in the form of payments to suppliers and collections from customers. Dividend Yield is calculated as the annual dividends paid by a company divided by the price of a share of their stock.
HENNESSY FUNDS 1-800-966-4354
Performance Overview (Unaudited)
The opinions expressed in the following commentary reflect those of the Portfolio Managers as of the date written. Any such opinions are subject to change based on market or other conditions and are not guaranteed. These opinions may not be relied upon as investment advice. Investment decisions for the Fund are based on multiple factors, and may not be relied upon as an indication of trading intent on behalf of the Fund. Security positions can and do change.
CHANGE IN VALUE OF $10,000 INVESTMENT
This chart assumes an initial gross investment of $10,000 made on March 20, 2009 (inception date of the Fund). Returns shown include the reinvestment of all dividends. Returns shown do not reflect the deduction of taxes that a shareholder would pay on Fund distributions or the redemption of Fund shares.
AVERAGE ANNUAL TOTAL RETURN FOR PERIODS ENDED OCTOBER 31, 2014
| | | | Since |
| | One | Five | Inception |
| | Year | Years | (3/20/09) |
| Hennessy Large Growth Fund – | | | |
| Investor Class (HFLGX) | 18.73% | 16.87% | 22.14% |
| Hennessy Large Growth Fund – | | | |
| Institutional Class (HILGX) | 18.96% | 17.18% | 22.47% |
Russell 1000® Index | 16.78% | 16.98% | 21.68% |
| S&P 500 Index | 17.27% | 16.69% | 21.29% |
Expense ratios: 1.19% (Investor Class); Gross 1.10%, Net 0.98%(1) (Institutional Class)
Performance data quoted represents past performance; past performance does not guarantee future results. The investment return and principal value of an investment will fluctuate so that an investor’s shares, when redeemed, may be worth more or less than their original cost. Current performance of the Fund may be lower or higher than the performance quoted. Performance data current to the most recent month end may be obtained by visiting hennessyfunds.com.
The expense ratios presented are from the most recent prospectus.
| (1) | With regard to Institutional Class shares, the Fund’s investment advisor has contractually agreed to waive a portion of its expenses indefinitely. |
PERFORMANCE NARRATIVE
Portfolio Managers Neil Hennessy and Brian Peery
Over the previous twelve months, how did the Fund perform and what factors contributed to this performance?
For the twelve month period ended October 31, 2014, the Investor Class of the Hennessy Cornerstone Large Growth Fund returned 18.73%, outperforming the Russell 1000® Index, the S&P 500 Index and the Morningstar Large Blend Category Average, which returned 16.78%, 17.27% and 14.33% for the same period, respectively.
We are very pleased with the overall performance of the Fund during the previous twelve months versus its benchmarks. The Fund’s relative outperformance was driven entirely by stock selection, as sector allocation had a slightly negative effect on the portfolio. The biggest contribution to the Fund’s outperformance versus its benchmarks was stock selection in the Industrial and Information Technology sectors, which accounted for most of the outperformance relative to the Russell 1000® Index. The largest detractor to the Fund’s performance was its allocation and stock selection within the Consumer Discretionary sector.
Additional Portfolio Manager commentary and related investment outlook:
During the last twelve months, we saw a continued trend of companies beating earnings expectations, but not quite meeting revenue targets. We believe this trend is abating and that we should see better earnings and revenue numbers in the coming year. While top line revenue growth was muted due to a slow-growth environment, companies are still doing well, and the latest quarter’s results are certainly showing signs of promise. Corporate profits continue to reach new highs due to deferred capital expenditure plans, combined with tempered cost cutting.
We feel, however, that we are in the midst of a change, and an important one for the future of the bull market. We are seeing positive signs in both revenue growth and all-important corporate capital expenditures levels. Over the last twelve months, we have seen a slight disconnect between earnings and revenues, with earnings showing healthy gains, largely due to cost containment, while revenue growth lagged. With few cost cuts seemingly left to be made, companies appear to be beginning to utilize their healthy balance sheets to focus on organic growth, which we expect should drive corporate spending higher. In fact, we anticipate the U.S. economy will expand nicely over the next 12 to 18 months and that the markets should benefit from this flow of capital. While excess cash has largely been directed toward acquisitions, increasing dividends, and/or stock buybacks recently, we believe this shift in corporate spending has the potential to reward shareholders over the longer term. One of the key criteria we use in the stock selection process for the Fund is return on total capital, which is essentially a profitability ratio that measures a return on investment. What it really indicates is how successfully a company turns capital into profits. We believe companies are now shifting towards organic growth via capital expenditure plans and that they are very well positioned to do so. We are pleased that the companies selected for inclusion in the Fund’s portfolio appear to be leading their respective industries in creating value for their shareholders.
We believe the current attractiveness of equity prices, in an extremely low interest rate environment, have many investors seeking high-quality growth companies. Of note, 46 out of the 50 stocks within the portfolio pay a dividend. In our view, investing in dividend-paying growth companies can provide the enticing potential to provide income while also allowing for the potential for stock price appreciation.
HENNESSY FUNDS 1-800-966-4354
The Russell 1000® Index and the S&P 500 Index are unmanaged indices commonly used to measure the performance of U.S. stocks. You cannot invest directly in an index. Performance data for an index does not reflect any deductions for fees, expenses or taxes. The Fund may invest in medium-capitalization companies, which may have more limited liquidity and greater price volatility than large-capitalization companies. Fund holdings and sector allocations are subject to change. Please refer to the Schedule of Investments included in this report for additional portfolio information.
Each Morningstar category average represents a universe of funds with similar investment objectives. © Morningstar, Inc. All Rights Reserved. The information contained herein: 1) is proprietary to Morningstar; 2) may not be copied or distributed and 3) is not warranted to be accurate, complete or timely. Neither Morningstar nor its content providers are responsible for any damages or losses arising from any use of this information. Past performance does not guarantee future results.
Financial Statements
HENNESSY CORNERSTONE LARGE GROWTH FUND
As of October 31, 2014
(% of Net Assets)
| TOP TEN HOLDINGS (EXCLUDING CASH/CASH EQUIVALENTS) | % NET ASSETS |
| | |
| Kroger Co. | 2.60% |
| Union Pacific Corp. | 2.55% |
| Apple, Inc. | 2.55% |
| Delta Air Lines, Inc. | 2.51% |
| SanDisk Corp. | 2.50% |
| Intel Corp. | 2.41% |
| Lockheed Martin Corp. | 2.38% |
| Eli Lilly & Co. | 2.37% |
| Altria Group, Inc. | 2.34% |
| Microsoft Corp. | 2.33% |
Note: For presentation purposes, the Fund has grouped some of the industry categories. For purposes of categorizing securities for compliance with Section 8(b)(1) of the Investment Company Act of 1940, the Fund uses more specific industry classifications.
HENNESSY FUNDS 1-800-966-4354
| | COMMON STOCKS – 97.20% | | Number | | | | | | % of | |
| | | | of Shares | | | Value | | | Net Assets | |
| | Consumer Discretionary – 15.93% | | | | | | | | | |
| | Autozone, Inc. (a) | | | 4,600 | | | $ | 2,546,192 | | | | 2.12 | % |
| | Bed Bath & Beyond, Inc. (a) | | | 27,300 | | | | 1,838,382 | | | | 1.53 | % |
| | Coach, Inc. | | | 39,100 | | | | 1,344,258 | | | | 1.12 | % |
| | Dollar General Corp. (a) | | | 36,100 | | | | 2,262,387 | | | | 1.88 | % |
| | Ford Motor Co. | | | 141,800 | | | | 1,997,962 | | | | 1.66 | % |
| | Lowes Companies, Inc. | | | 44,900 | | | | 2,568,280 | | | | 2.13 | % |
| | Macy’s, Inc. | | | 41,100 | | | | 2,376,402 | | | | 1.97 | % |
| | McDonald’s Corp. | | | 22,800 | | | | 2,137,044 | | | | 1.78 | % |
| | The Gap, Inc. | | | 55,600 | | | | 2,106,684 | | | | 1.75 | % |
| | | | | | | | | 19,177,591 | | | | 15.93 | % |
| | | | | | | | | | | | | | |
| | Consumer Staples – 18.55% | | | | | | | | | | | | |
| | Altria Group, Inc. | | | 58,300 | | | | 2,818,222 | | | | 2.34 | % |
| | General Mills, Inc. | | | 44,600 | | | | 2,317,416 | | | | 1.93 | % |
| | Kimberly Clark Corp. | | | 21,100 | | | | 2,411,097 | | | | 2.00 | % |
| | Kraft Foods Group, Inc. | | | 41,100 | | | | 2,315,985 | | | | 1.92 | % |
| | Kroger Co. | | | 56,200 | | | | 3,130,902 | | | | 2.60 | % |
| | Pepsico, Inc. | | | 26,700 | | | | 2,567,739 | | | | 2.13 | % |
| | Philip Morris International, Inc. | | | 25,700 | | | | 2,287,557 | | | | 1.90 | % |
| | Sysco Corp. | | | 61,000 | | | | 2,350,940 | | | | 1.95 | % |
| | Wal-Mart Stores, Inc. | | | 28,000 | | | | 2,135,560 | | | | 1.78 | % |
| | | | | | | | | 22,335,418 | | | | 18.55 | % |
| | | | | | | | | | | | | | |
| | Energy – 12.86% | | | | | | | | | | | | |
| | Chevron Corp. | | | 17,700 | | | | 2,123,115 | | | | 1.76 | % |
| | ConocoPhillips | | | 31,400 | | | | 2,265,510 | | | | 1.88 | % |
| | Exxon Mobil Corp. | | | 22,100 | | | | 2,137,291 | | | | 1.78 | % |
| | Halliburton Co. | | | 43,900 | | | | 2,420,646 | | | | 2.01 | % |
| | HollyFrontier Corp. | | | 44,500 | | | | 2,019,410 | | | | 1.68 | % |
| | Marathon Oil Corp. | | | 63,700 | | | | 2,254,980 | | | | 1.87 | % |
| | Marathon Petroleum Corp. | | | 24,900 | | | | 2,263,410 | | | | 1.88 | % |
| | | | | | | | | 15,484,362 | | | | 12.86 | % |
| | | | | | | | | | | | | | |
| | Health Care – 6.53% | | | | | | | | | | | | |
| | Baxter International, Inc. | | | 31,775 | | | | 2,228,699 | | | | 1.85 | % |
| | Eli Lilly & Co. | | | 43,000 | | | | 2,852,190 | | | | 2.37 | % |
| | UnitedHealth Group, Inc. | | | 29,300 | | | | 2,783,793 | | | | 2.31 | % |
| | | | | | | | | 7,864,682 | | | | 6.53 | % |
The accompanying notes are an integral part of these financial statements.
| | COMMON STOCKS | | Number | | | | | | % of | |
| | | | of Shares | | | Value | | | Net Assets | |
| | Industrials – 23.52% | | | | | | | | | |
| | Caterpillar, Inc. | | | 24,500 | | | $ | 2,484,545 | | | | 2.06 | % |
| | CSX Corp. | | | 77,300 | | | | 2,754,199 | | | | 2.29 | % |
| | Cummins, Inc. | | | 15,800 | | | | 2,309,644 | | | | 1.92 | % |
| | Deere & Co. | | | 24,300 | | | | 2,078,622 | | | | 1.73 | % |
| | Delta Air Lines, Inc. | | | 75,200 | | | | 3,025,296 | | | | 2.51 | % |
| | Illinois Tool Works, Inc. | | | 26,300 | | | | 2,394,615 | | | | 1.99 | % |
| | Lockheed Martin Corp. | | | 15,000 | | | | 2,858,550 | | | | 2.38 | % |
| | Northrop Grumman Corp. | | | 19,400 | | | | 2,676,424 | | | | 2.22 | % |
| | Raytheon Co. | | | 24,800 | | | | 2,576,224 | | | | 2.14 | % |
| | Union Pacific Corp. | | | 26,400 | | | | 3,074,280 | | | | 2.55 | % |
| | United Technologies Corp. | | | 19,500 | | | | 2,086,500 | | | | 1.73 | % |
| | | | | | | | | 28,318,899 | | | | 23.52 | % |
| | | | | | | | | | | | | | |
| | Information Technology – 17.76% | | | | | | | | | | | | |
| | Apple, Inc. | | | 28,450 | | | | 3,072,600 | | | | 2.55 | % |
| | Hewlett-Packard Co. | | | 77,600 | | | | 2,784,288 | | | | 2.31 | % |
| | Intel Corp. | | | 85,300 | | | | 2,901,053 | | | | 2.41 | % |
| | International Business Machines Corp. | | | 11,800 | | | | 1,939,920 | | | | 1.61 | % |
| | Microsoft Corp. | | | 59,600 | | | | 2,798,220 | | | | 2.33 | % |
| | Oracle Corp. | | | 58,400 | | | | 2,280,520 | | | | 1.89 | % |
| | SanDisk Corp. | | | 31,900 | | | | 3,003,066 | | | | 2.50 | % |
| | Western Digital Corp. | | | 26,400 | | | | 2,596,968 | | | | 2.16 | % |
| | | | | | | | | 21,376,635 | | | | 17.76 | % |
| | | | | | | | | | | | | | |
| | Materials – 2.05% | | | | | | | | | | | | |
| | CF Industries Holdings, Inc. | | | 9,500 | | | | 2,470,000 | | | | 2.05 | % |
| | | | | | | | | | | | | | |
| | Total Common Stocks | | | | | | | | | | | | |
| | (Cost $91,738,368) | | | | | | | 117,027,587 | | | | 97.20 | % |
The accompanying notes are an integral part of these financial statements.
HENNESSY FUNDS 1-800-966-4354
| | SHORT-TERM INVESTMENTS – 2.87% | | Number | | | | | | % of | |
| | | | of Shares | | | Value | | | Net Assets | |
| | Money Market Funds – 2.87% | | | | | | | | | |
| | Fidelity Government Portfolio – Institutional Class, 0.01% (b) | | | 3,451,622 | | | $ | 3,451,622 | | | | 2.87 | % |
| | | | | | | | | | | | | | |
| | Total Short-Term Investments | | | | | | | | | | | | |
| | (Cost $3,451,622) | | | | | | | 3,451,622 | | | | 2.87 | % |
| | | | | | | | | | | | | | |
| | Total Investments | | | | | | | | | | | | |
| | (Cost $95,189,990) – 100.07% | | | | | | | 120,479,209 | | | | 100.07 | % |
| | Liabilities in Excess | | | | | | | | | | | | |
| | of Other Assets – (0.07)% | | | | | | | (90,723 | ) | | | (0.07 | )% |
| | TOTAL NET ASSETS – 100.00% | | | | | | $ | 120,388,486 | | | | 100.00 | % |
Percentages are stated as a percent of net assets.
| | (a) | Non-income producing security. |
| | (b) | The rate listed is the fund’s 7-day yield as of October 31, 2014. |
Summary of Fair Value Exposure at October 31, 2014
The following is a summary of the inputs used to value the Fund’s net assets as of October 31, 2014 (See Note 3 in the accompanying notes to the financial statements):
| | Common Stocks | | Level 1 | | | Level 2 | | | Level 3 | | | Total | |
| | Consumer Discretionary | | $ | 19,177,591 | | | $ | — | | | $ | — | | | $ | 19,177,591 | |
| | Consumer Staples | | | 22,335,418 | | | | — | | | | — | | | | 22,335,418 | |
| | Energy | | | 15,484,362 | | | | — | | | | — | | | | 15,484,362 | |
| | Health Care | | | 7,864,682 | | | | — | | | | — | | | | 7,864,682 | |
| | Industrials | | | 28,318,899 | | | | — | | | | — | | | | 28,318,899 | |
| | Information Technology | | | 21,376,635 | | | | — | | | | — | | | | 21,376,635 | |
| | Materials | | | 2,470,000 | | | | — | | | | — | | | | 2,470,000 | |
| | Total Common Stocks | | $ | 117,027,587 | | | $ | — | | | $ | — | | | $ | 117,027,587 | |
| | Short-Term Investments | | | | | | | | | | | | | | | | |
| | Money Market Funds | | $ | 3,451,622 | | | $ | — | | | $ | — | | | $ | 3,451,622 | |
| | Total Short-Term Investments | | $ | 3,451,622 | | | $ | — | | | $ | — | | | $ | 3,451,622 | |
| | Total Investments | | $ | 120,479,209 | | | $ | — | | | $ | — | | | $ | 120,479,209 | |
Transfers between levels are recognized at the end of the reporting period. During the one-year period ended October 31, 2014, the Fund recognized no transfers between levels.
The accompanying notes are an integral part of these financial statements.
Financial Statements
Statement of Assets and Liabilities as of October 31, 2014 |
| ASSETS: | | | |
| Investments in securities, at value (cost $95,189,990) | | $ | 120,479,209 | |
| Dividends and interest receivable | | | 110,591 | |
| Receivable for fund shares sold | | | 6,740 | |
| Prepaid expenses and other assets | | | 13,463 | |
| Total Assets | | | 120,610,003 | |
| | | | | |
| LIABILITIES: | | | | |
| Payable for fund shares redeemed | | | 75,647 | |
| Payable to advisor | | | 73,035 | |
| Payable to administrator | | | 26,765 | |
| Payable to auditor | | | 17,724 | |
| Accrued service fees | | | 8,648 | |
| Accrued interest payable | | | 70 | |
| Accrued trustees fees | | | 2,318 | |
| Accrued expenses and other payables | | | 17,310 | |
| Total Liabilities | | | 221,517 | |
| NET ASSETS | | $ | 120,388,486 | |
| | | | | |
| NET ASSETS CONSIST OF: | | | | |
| Capital stock | | $ | 78,151,194 | |
| Accumulated net investment income | | | 1,313,651 | |
| Accumulated net realized gain on investments | | | 15,634,422 | |
| Unrealized net appreciation on investments | | | 25,289,219 | |
| Total Net Assets | | $ | 120,388,486 | |
| | | | | |
| NET ASSETS | | | | |
| Investor Class: | | | | |
| Shares authorized (no par value) | | Unlimited | |
| Net assets applicable to outstanding Investor Class shares | | $ | 105,507,323 | |
| Shares issued and outstanding | | | 6,958,995 | |
| Net asset value, offering price and redemption price per share | | $ | 15.16 | |
| | | | | |
| Institutional Class: | | | | |
| Shares authorized (no par value) | | Unlimited | |
| Net assets applicable to outstanding Institutional Class shares | | $ | 14,881,163 | |
| Shares issued and outstanding | | | 972,624 | |
| Net asset value, offering price and redemption price per share | | $ | 15.30 | |
The accompanying notes are an integral part of these financial statements.
HENNESSY FUNDS 1-800-966-4354
Statement of Operations for the year ended October 31, 2014 |
| INVESTMENT INCOME: | | | |
| Dividend income | | $ | 2,608,449 | |
| Interest income | | | 395 | |
| Total investment income | | | 2,608,844 | |
| | | | | |
| EXPENSES: | | | | |
| Investment advisory fees (See Note 5) | | | 850,623 | |
| Administration, fund accounting, custody and transfer agent fees | | | 204,095 | |
| Service fees – Investor Class (See Note 5) | | | 98,700 | |
| Sub-transfer agent expenses – Investor Class (See Note 5) | | | 39,712 | |
| Sub-transfer agent expenses – Institutional Class (See Note 5) | | | 7,497 | |
| Federal and state registration fees | | | 33,123 | |
| Compliance expense | | | 21,487 | |
| Audit fees | | | 16,736 | |
| Reports to shareholders | | | 12,800 | |
| Trustees’ fees and expenses | | | 9,821 | |
| Legal fees | | | 2,248 | |
| Other expenses | | | 11,357 | |
| Total expenses before waiver | | | 1,308,199 | |
| Administrative expense waiver (See Note 5) | | | (13,018 | ) |
| Net expenses | | | 1,295,181 | |
| NET INVESTMENT INCOME | | $ | 1,313,663 | |
| | | | | |
| REALIZED AND UNREALIZED GAINS (LOSSES): | | | | |
| Net realized gain on investments | | $ | 18,680,208 | |
| Net change in unrealized depreciation on investments | | | (586,375 | ) |
| Net gain on investments | | | 18,093,833 | |
| NET INCREASE IN NET ASSETS RESULTING FROM OPERATIONS | | $ | 19,407,496 | |
The accompanying notes are an integral part of these financial statements.
Financial Statements
| Statements of Changes in Net Assets |
| | | Year Ended | | | Year Ended | |
| | | October 31, 2014 | | | October 31, 2013 | |
| OPERATIONS: | | | | | | |
| Net investment income | | $ | 1,313,663 | | | $ | 1,194,449 | |
| Net realized gain on investments | | | 18,680,208 | | | | 6,201,807 | |
| Net change in unrealized | | | | | | | | |
| appreciation (depreciation) on investments | | | (586,375 | ) | | | 17,304,019 | |
| Net increase in net assets resulting from operations | | | 19,407,496 | | | | 24,700,275 | |
| | | | | | | | | |
| DISTRIBUTIONS TO SHAREHOLDERS FROM: | | | | | | | | |
| Net investment income | | | | | | | | |
| Investor Class | | | (985,143 | ) | | | (719,396 | ) |
| Institutional Class | | | (209,291 | ) | | | (361,073 | ) |
| Net realized gains | | | | | | | | |
| Investor Class | | | (4,397,057 | ) | | | (117,309 | ) |
| Institutional Class | | | (781,019 | ) | | | (52,078 | ) |
| Total distributions | | | (6,372,510 | ) | | | (1,249,856 | ) |
| | | | | | | | | |
| CAPITAL SHARE TRANSACTIONS: | | | | | | | | |
| Proceeds from shares subscribed – Investor Class | | | 11,881,168 | | | | 1,740,370 | |
| Proceeds from shares subscribed – Institutional Class | | | 4,305,238 | | | | 815,827 | |
| Dividends reinvested – Investor Class | | | 5,021,319 | | | | 780,066 | |
| Dividends reinvested – Institutional Class | | | 949,886 | | | | 406,311 | |
| Cost of shares redeemed – Investor Class | | | (11,322,920 | ) | | | (8,522,055 | ) |
| Cost of shares redeemed – Institutional Class | | | (8,441,558 | )(1) | | | (23,485,757 | ) |
| Net increase (decrease) in net assets derived | | | | | | | | |
| from capital share transactions | | | 2,393,133 | | | | (28,265,238 | ) |
| TOTAL INCREASE (DECREASE) IN NET ASSETS | | | 15,428,119 | | | | (4,814,819 | ) |
| | | | | | | | | |
| NET ASSETS: | | | | | | | | |
| Beginning of year | | | 104,960,367 | | | | 109,775,186 | |
| End of year | | $ | 120,388,486 | | | $ | 104,960,367 | |
| Undistributed net investment income, end of year | | $ | 1,313,651 | | | $ | 1,194,434 | |
| | | | | | | | | |
| CHANGES IN SHARES OUTSTANDING: | | | | | | | | |
| Shares sold – Investor Class | | | 822,355 | | | | 149,494 | |
| Shares sold – Institutional Class | | | 298,334 | | | | 68,395 | |
| Shares issued to holders as reinvestment | | | | | | | | |
| of dividends – Investor Class | | | 375,434 | | | | 72,353 | |
| Shares issued to holders as reinvestment | | | | | | | | |
| of dividends – Institutional Class | | | 70,320 | | | | 37,405 | |
| Shares redeemed – Investor Class | | | (783,194 | ) | | | (720,532 | ) |
| Shares redeemed – Institutional Class | | | (579,248 | ) | | | (2,050,571 | ) |
| Net increase (decrease) in shares outstanding | | | 204,001 | | | | (2,443,456 | ) |
| (1) | Net of redemption fees of $3 related to redemption fees imposed by the FBR Large Cap Fund (which was reorganized into the Fund) during a prior year but not received until the year ended October 31, 2014. |
The accompanying notes are an integral part of these financial statements.
HENNESSY FUNDS 1-800-966-4354
Financial Statements
For an Investor Class share outstanding throughout each year
| PER SHARE DATA: |
| Net asset value, beginning of year |
| |
| |
| Income from investment operations: |
| Net investment income |
| Net realized and unrealized gains on investments |
| Total from investment operations |
| |
| |
| Less distributions: |
| Dividends from net investment income |
| Dividends from net realized gains |
| Total distributions |
| Net asset value, end of year |
| |
| |
| TOTAL RETURN |
| |
| SUPPLEMENTAL DATA AND RATIOS: |
| Net assets, end of year (millions) |
| Ratio of expenses to average net assets: |
| Before expense reimbursement |
| After expense reimbursement |
| Ratio of net investment income to average net assets: |
| Before expense reimbursement |
| After expense reimbursement |
Portfolio turnover rate(1) |
| (1) | Portfolio turnover is calculated on the basis of the Fund as a whole. |
The accompanying notes are an integral part of these financial statements.
| Year Ended October 31, | |
| 2014 | | | 2013 | | | 2012 | | | 2011 | | | 2010 | |
| | | | | | | | | | | | | | |
| $ | 13.56 | | | $ | 10.77 | | | $ | 12.37 | | | $ | 11.70 | | | $ | 9.49 | |
| | | | | | | | | | | | | | | | | | | |
| | | | | | | | | | | | | | | | | | | |
| | 0.15 | | | | 0.14 | | | | 0.13 | | | | 0.09 | | | | 0.09 | |
| | 2.28 | | | | 2.77 | | | | 0.80 | | | | 0.69 | | | | 2.17 | |
| | 2.43 | | | | 2.91 | | | | 0.93 | | | | 0.78 | | | | 2.26 | |
| | | | | | | | | | | | | | | | | | | |
| | | | | | | | | | | | | | | | | | | |
| | (0.15 | ) | | | (0.10 | ) | | | (0.07 | ) | | | (0.09 | ) | | | (0.05 | ) |
| | (0.68 | ) | | | (0.02 | ) | | | (2.46 | ) | | | (0.02 | ) | | | — | |
| | (0.83 | ) | | | (0.12 | ) | | | (2.53 | ) | | | (0.11 | ) | | | (0.05 | ) |
| $ | 15.16 | | | $ | 13.56 | | | $ | 10.77 | | | $ | 12.37 | | | $ | 11.70 | |
| | | | | | | | | | | | | | | | | | | |
| | 18.73 | % | | | 27.32 | % | | | 9.14 | % | | | 6.70 | % | | | 23.88 | % |
| | | | | | | | | | | | | | | | | | | |
| | | | | | | | | | | | | | | | | | | |
| $ | 105.51 | | | $ | 88.77 | | | $ | 75.83 | | | $ | 77.88 | | | $ | 78.83 | |
| | | | | | | | | | | | | | | | | | | |
| | 1.15 | % | | | 1.19 | % | | | 1.27 | % | | | 1.26 | % | | | 1.30 | % |
| | 1.15 | % | | | 1.19 | % | | | 1.27 | % | | | 1.30 | % | | | 1.30 | % |
| | | | | | | | | | | | | | | | | | | |
| | 1.12 | % | | | 1.10 | % | | | 1.35 | % | | | 0.72 | % | | | 0.84 | % |
| | 1.12 | % | | | 1.10 | % | | | 1.35 | % | | | 0.68 | % | | | 0.84 | % |
| | 57 | % | | | 73 | % | | | 0 | % | | | 70 | % | | | 83 | % |
The accompanying notes are an integral part of these financial statements.
HENNESSY FUNDS 1-800-966-4354
Financial Statements
For an Institutional Class share outstanding throughout each year
| PER SHARE DATA: |
| Net asset value, beginning of year |
| |
| |
| Income from investment operations: |
| Net investment income |
| Net realized and unrealized gains on investments |
| Total from investment operations |
| |
| |
| Less distributions: |
| Dividends from net investment income |
| Dividends from net realized gains |
| Total distributions |
| Net asset value, end of year |
| |
| |
| TOTAL RETURN |
| |
| SUPPLEMENTAL DATA AND RATIOS: |
| Net assets, end of year (millions) |
| Ratio of expenses to average net assets: |
| Before expense reimbursement |
| After expense reimbursement |
| Ratio of net investment income to average net assets: |
| Before expense reimbursement |
| After expense reimbursement |
Portfolio turnover rate(1) |
(1) Portfolio turnover is calculated on the basis of the Fund as a whole.
The accompanying notes are an integral part of these financial statements.
| Year Ended October 31, | |
| 2014 | | | 2013 | | | 2012 | | | 2011 | | | 2010 | |
| | | | | | | | | | | | | | |
| $ | 13.68 | | | $ | 10.85 | | | $ | 12.44 | | | $ | 11.76 | | | $ | 9.51 | |
| | | | | | | | | | | | | | | | | | | |
| | | | | | | | | | | | | | | | | | | |
| | 0.17 | | | | 0.09 | | | | 0.07 | | | | 0.08 | | | | 0.10 | |
| | 2.30 | | | | 2.88 | | | | 0.89 | | | | 0.74 | | | | 2.20 | |
| | 2.47 | | | | 2.97 | | | | 0.96 | | | | 0.82 | | | | 2.30 | |
| | | | | | | | | | | | | | | | | | | |
| | | | | | | | | | | | | | | | | | | |
| | (0.17 | ) | | | (0.12 | ) | | | (0.09 | ) | | | (0.12 | ) | | | (0.05 | ) |
| | (0.68 | ) | | | (0.02 | ) | | | (2.46 | ) | | | (0.02 | ) | | | — | |
| | (0.85 | ) | | | (0.14 | ) | | | (2.55 | ) | | | (0.14 | ) | | | (0.05 | ) |
| $ | 15.30 | | | $ | 13.68 | | | $ | 10.85 | | | $ | 12.44 | | | $ | 11.76 | |
| | | | | | | | | | | | | | | | | | | |
| | 18.96 | % | | | 27.63 | % | | | 9.43 | % | | | 6.99 | % | | | 24.26 | % |
| | | | | | | | | | | | | | | | | | | |
| | | | | | | | | | | | | | | | | | | |
| $ | 14.88 | | | $ | 16.19 | | | $ | 33.94 | | | $ | 0.14 | | | $ | 0.07 | |
| | | | | | | | | | | | | | | | | | | |
| | 1.06 | % | | | 1.10 | % | | | 1.41 | % | | | 1.14 | % | | | 1.16 | % |
| | 0.98 | % | | | 0.98 | % | | | 0.98 | % | | | 0.98 | % | | | 0.98 | % |
| | | | | | | | | | | | | | | | | | | |
| | 1.21 | % | | | 1.38 | % | | | 6.44 | % | | | 0.81 | % | | | 0.90 | % |
| | 1.30 | % | | | 1.50 | % | | | 6.87 | % | | | 0.97 | % | | | 1.08 | % |
| | 57 | % | | | 73 | % | | | 0 | % | | | 70 | % | | | 83 | % |
The accompanying notes are an integral part of these financial statements.
HENNESSY FUNDS 1-800-966-4354
Financial Statements
Notes to Financial Statements October 31, 2014 |
1). ORGANIZATION
The Hennessy Cornerstone Large Growth Fund (the “Fund”) is a series of Hennessy Funds Trust (the “Trust”), which was organized as a Delaware statutory trust on September 17, 1992. The Fund is an open-end management investment company registered under the Investment Company Act of 1940, as amended. The investment objective of the Fund is long-term growth of capital. The Fund is a diversified fund.
The Fund offers Investor Class and Institutional Class shares. Prior to October 26, 2012, the Investor Class shares were known as Original Class shares. Each class of shares differs principally in its respective administration, 12b-1 distribution and service fees, shareholder servicing, and transfer agent expenses and sales charges, if any. Each class has identical rights to earnings, assets, and voting privileges, except for class-specific expenses and exclusive rights to vote on matters affecting only an individual class.
2). SIGNIFICANT ACCOUNTING POLICIES
The following is a summary of significant accounting policies consistently followed by the Fund in the preparation of the financial statements. These policies are in conformity with U.S. generally accepted accounting principles (“GAAP”).
| a). | Investment Valuation – All investments in securities are recorded at their estimated fair value, as described in Note 3. |
| | |
| b). | Federal Income Taxes – Provision for federal income taxes or excise taxes has not been made since the Fund has elected to be taxed as a “regulated investment company” and intends to distribute substantially all of its taxable income to its shareholders and otherwise comply with the provisions of the Internal Revenue Code of 1986, as amended, applicable to regulated investment companies. Net investment income or loss and realized gains and losses for federal income tax purposes may differ from that reported on the financial statements because of temporary book and tax basis differences. Temporary differences are primarily the result of the treatment of wash sales for tax reporting purposes. Distributions from net realized gains for book purposes may include short-term capital gains, which are included as ordinary income to shareholders for tax purposes. |
| | Due to inherent differences in the recognition of income, expenses, and realized gains/losses under GAAP and federal income tax regulations, permanent differences between book and tax basis reporting for the 2014 fiscal year have been identified and appropriately reclassified on the Statement of Assets and Liabilities. The adjustments are as follow: |
| Undistributed | Accumulated | |
| Net Investment | Net Realized | |
| Income/(Loss) | Gain/(Loss) | Paid-in Capital |
| $(12) | $12 | $ — |
| c). | Income and Expenses – Dividend income is recognized on the ex-dividend date or as soon as information is available to the Fund. Interest income, which includes the amortization of premium and accretion of discount, is recognized on an accrual basis. The Fund is charged for those expenses that are directly attributable to the portfolio, such as advisory, administration, and certain shareholder service fees. Income, |
| | expenses (other than expenses attributable to a specific class), and realized and unrealized gains or losses on investments are allocated to each class of shares based on its respective net assets. |
| | |
| d). | Distributions to Shareholders – Dividends from net investment income for the Fund, if any, are declared and paid out annually, usually in December. Distributions of net realized capital gains, if any, are declared and paid annually, usually in November or December. |
| | |
| e). | Security Transactions – Investment and shareholder transactions are recorded on the trade date. The Fund determines the gain or loss realized from the investment transactions by comparing the original cost of the security lot sold with the net sale proceeds. Discounts and premiums on securities purchased are accreted/amortized over the life of the respective security. |
| | |
| f). | Use of Estimates – The preparation of financial statements in conformity with GAAP requires management to make estimates and assumptions that affect the reported amounts of assets and liabilities and disclosure of contingent assets and liabilities at the date of the financial statements and the reported change in net assets during the reporting period. Actual results could differ from those estimates. |
| | |
| g). | Share Valuation – The net asset value (“NAV”) per share of the Fund is calculated by dividing the sum of the value of the securities held by the Fund, plus cash or other assets, minus all liabilities (including estimated accrued expenses) by the total number of shares outstanding for the Fund, rounded to the nearest cent. The Fund’s shares will not be priced on days the New York Stock Exchange is closed for trading. The offering and redemption price per share for the Fund is equal to the Fund’s NAV per share. |
| | |
| h). | Repurchase Agreements – The Fund may enter into repurchase agreements with member banks or security dealers of the Federal Reserve Board whom the investment advisor deems creditworthy. The repurchase price generally equals the price paid by the Fund plus interest negotiated on the basis of current short-term rates. |
| | |
| | Securities pledged as collateral for repurchase agreements are held by the custodian bank until the respective agreements mature. Provisions of the repurchase agreements ensure that the market value of the collateral, including accrued interest thereon, is sufficient to cover the repurchase amount in the event of default of the counterparty. If the counterparty defaults and the value of the collateral declines or if the counterparty enters an insolvency proceeding, realization of the collateral by the Fund may be delayed or limited. |
| | |
| i). | Accounting for Uncertainty in Income Taxes – The Fund has adopted accounting policies regarding recognition and measurement of tax positions taken or expected to be taken on a tax return. The tax returns of the Fund for the prior three fiscal years are open for examination. The Fund has reviewed all open tax years in major jurisdictions and concluded that there is no impact on the Fund’s net assets and no tax liability resulting from unrecognized tax benefits relating to uncertain income tax positions taken or expected to be taken on a tax return. The Fund’s major tax jurisdictions are U.S. federal and Delaware. |
| | |
| j). | Derivatives – The Fund may invest in, or enter into, derivatives, such as options, futures contracts, options on futures contracts, and swaps, for a variety of reasons, including to hedge certain risks, to provide a substitute for purchasing or selling particular securities, or to increase potential income gain. Derivatives may provide a cheaper, quicker, or more specifically focused way for a Fund to invest than |
HENNESSY FUNDS 1-800-966-4354
| | “traditional” securities would. The main purpose of utilizing these derivative instruments is for hedging purposes. |
| | |
| | The Fund has adopted the financial accounting reporting rules as required by the Derivatives and Hedging Topic of the Financial Accounting Standards Board Accounting Standards Codification. Under such rules, the Fund is required to include enhanced disclosure that enables investors to understand how and why an entity uses derivatives, how derivatives are accounted for, and how derivatives instruments affect an entity’s results of operations and financial position. During the fiscal year ended October 31, 2014, the Fund did not hold any derivative instruments. |
| | |
| k). | Events Subsequent to the Fiscal Period End – The Fund has adopted financial reporting rules regarding subsequent events that require an entity to recognize in the financial statements the effects of all subsequent events that provide additional evidence about conditions that existed at the date of the balance sheet. Management has evaluated the Fund’s related events and transactions that occurred subsequent to October 31, 2014 through the date of issuance of the Fund’s financial statements. There were no events or transactions that occurred during this period that materially impacted the amounts or disclosures in the Fund’s financial statements. |
3). SECURITIES VALUATION
The Fund has adopted authoritative fair valuation accounting standards that establish an authoritative definition of fair value and set out a hierarchy for measuring fair value. These standards require additional disclosures about the various inputs and valuation techniques used to develop the measurements of fair value and a discussion in changes in valuation techniques and related inputs during the period. These inputs are summarized in the three broad levels listed below:
| | Level 1 – | Quoted unadjusted prices for identical instruments in active markets to which the Fund has access at the date of measurement. |
| | | |
| | Level 2 – | Quoted prices for similar instruments in active markets; quoted prices for identical or similar instruments in markets that are not active; and model-derived valuations in which all significant inputs and significant value drivers are observable in active markets. Level 2 inputs are those in markets for which there are few transactions, the prices are not current, the prices are fair value adjusted due to post-market close subsequent events (foreign markets), little public information exists, or instances where prices vary substantially over time or among brokered market makers. These inputs may also include interest rates, prepayment speeds, credit risk curves, default rates, and similar data. |
| | | |
| | Level 3 – | Model-derived valuations in which one or more significant inputs or significant value drivers are unobservable. Unobservable inputs are those inputs that reflect the Fund’s own assumptions about what market participants would use to price the asset or liability based on the best available information. |
Following is a description of the valuation techniques applied to the Fund’s major categories of assets and liabilities measured at fair value on a recurring basis.
Equity Securities – Equity securities, including common stocks, preferred stocks, foreign issued common stocks, exchange traded funds, closed-end mutual funds, and real estate investment trusts, that are traded on a securities exchange for which a last-quoted sales price is readily available will generally be valued at the last sales price as reported by the primary exchange on which the securities are listed. Securities listed on The
NASDAQ Stock Market (“NASDAQ”) will be valued at the NASDAQ Official Closing Price, which may differ from the last sales price reported. Securities traded on a securities exchange for which a last-quoted sales price is not readily available will generally be valued at the mean between the bid and ask prices. To the extent these securities are actively traded and valuation adjustments are not applied, they are classified in Level 1 of the fair value hierarchy.
Investment Companies – Investments in investment companies (e.g., mutual funds and exchange traded funds) are generally priced at the ending NAV provided by the Fund’s service agent and will be classified in Level 1 of the fair value hierarchy.
Debt Securities – Debt securities, including corporate bonds, asset-backed securities, mortgage-backed securities, municipal bonds, U.S. Treasuries, and U.S. government agency issues, are valued at market on the basis of valuations furnished by an independent pricing service that utilizes both dealer-supplied valuations and formula-based techniques. The pricing service may consider recently executed transactions in securities of the issuer or comparable issuers, market price quotations (where observable), bond spreads, and fundamental data relating to the issuer. In addition, the model may incorporate market observable data such as reported sales of similar securities, broker quotes, yields, bids, offers, and reference data. Certain securities are valued principally using dealer quotations. These securities are generally classified in Level 2 of the fair value hierarchy.
Short-Term Securities – Short-term equity investments, including money market funds, are valued in the manner specified above. Short-term debt investments are generally valued at amortized cost, which approximates fair market value, if their original maturity was 60 days or less, or by amortizing the values as of the 61st day prior to maturity, if their original term to maturity exceeded 60 days. Amortized cost is not used if its use would be inappropriate due to credit or other impairments of the issuer, in which the security would be fair valued, as described below. Short-term securities are generally classified in Level 1 or Level 2 of the fair market hierarchy depending on the inputs used and market activity levels for specific securities.
The Board of Trustees of the Fund (the “Board”) has adopted fair value pricing procedures that are followed when a price for a security is not readily available or if a significant event has occurred that indicates the closing price of a security no longer represents the true value of that security. Fair value pricing determinations are made in good faith in accordance with these procedures. There are numerous criteria that will be given consideration in determining a fair value of a security. Some of these criteria are trading volume of security and markets, the value of other like securities, and news events with direct bearing to security or market. Fair value pricing results in an estimated price for a security that reflects amount the Fund might reasonably expect to receive in a current sale. Depending on the relative significance of the valuation inputs, these securities may be classified in either Level 2 or Level 3 of the fair value hierarchy.
The Board has delegated day-to-day valuation matters to a Valuation Committee comprised of one or more representatives from Hennessy Advisors, Inc., the Fund’s investment advisor. The function of the Valuation Committee is to value securities where current and reliable market quotations are not readily available. All actions taken by the Valuation Committee are reviewed by the Board.
The Fund has performed an analysis of all existing investments to determine the significance and character of all inputs to their fair value determination. Various inputs are used in determining the value of the Fund’s investments. The inputs or methodology used for valuing securities are not necessarily an indication of the risk associated with
HENNESSY FUNDS 1-800-966-4354
investing in those securities. Details related to the fair valuation hierarchy of the Fund’s securities as of October 31, 2014 are included in the Fund’s Schedule of Investments.
4). INVESTMENT TRANSACTIONS
Purchases and sales of investment securities (excluding government and short-term investments) for the Fund during the fiscal year ended October 31, 2014 were $63,590,504 and $68,256,488, respectively.
There were no purchases or sales/maturities of long-term U.S. Government Securities for the Fund during the fiscal year ended October 31, 2014.
5). INVESTMENT MANAGEMENT FEE AND OTHER TRANSACTIONS WITH AFFILIATES
Hennessy Advisors, Inc. (the “Advisor”) is the investment advisor of the Fund. The Advisor provides the Fund with investment management services under an Investment Advisory Agreement. The Advisor furnishes all investment advice, office space, facilities, and provides most of the personnel needed by the Fund. As compensation for its services, the Advisor is entitled to a monthly fee from the Fund. The fee is based upon the average daily net assets of the Fund at the annual rate of 0.74%. The net investment advisory fees payable for the Fund as of October 31, 2014 were $73,035.
The Advisor has agreed to waive its fees and absorb expenses to the extent that the total annual operating expenses (excluding all Federal, state and local taxes, interest, brokerage commissions, acquired fund fees and expenses and other costs incurred in connection with the purchase and sale of securities and extraordinary items) exceed 0.98% of the Fund’s net assets for the Institutional Class shares of the Fund. The expense limitation agreement for the Institutional Class shares can only be terminated by the Board.
For a period of three years after the year in which the Advisor waives or reimburses expenses, the Advisor may seek reimbursement from the Fund to the extent that total annual fund operating expenses are less than the expense limitation in effect at the time of the reimbursement. During the three years ended October 31, 2014, no Advisor fees were waived and therefore no expenses are subject to potential recovery.
The Board has approved a Shareholder Servicing Agreement for the Investor Class shares of the Fund, which was instituted to compensate the Advisor for the non-investment management services it provides to the Fund. The Shareholder Servicing Agreement provides for a monthly fee paid to the Advisor at an annual rate of 0.10% of the average daily net assets of the Fund attributable to Investor Class shares. Shareholder service fees payable for the Fund as of October 31, 2014 were $8,648.
The Fund has entered into agreements with various brokers, dealers, and financial intermediaries in connection with the sale of shares of the Fund. The agreements provide for periodic payments by the Fund to the brokers, dealers, and financial intermediaries for providing certain shareholder maintenance services (sub-transfer agent expenses). These shareholder services include the pre-processing and quality control of new accounts, shareholder correspondence, answering customer inquiries regarding account status, and facilitating shareholder telephone transactions. Fees paid by the Fund to various brokers, dealers, and financial intermediaries for the fiscal year ended October 31, 2014 were $47,209.
U.S. Bancorp Fund Services, LLC (“USBFS”) provides the Fund with administrative, fund accounting, and transfer agent services, including all regulatory reporting, and necessary office equipment and personnel. As administrator, USBFS prepares various federal and state regulatory filings, reports, and returns for the Fund; prepares reports and materials to be supplied to the Board; monitors the activities of the Fund’s custodian,
transfer agent, and accountants; and coordinates the preparation and payment of the Fund’s expenses and reviews the Fund’s expense accruals. Fees paid to USBFS for the fiscal year ended October 31, 2014 were $191,077.
USBFS has voluntarily waived all or a portion of its fees allocated to the Institutional Class shares of the Fund. The administration fees voluntarily waived by USBFS during the fiscal year ended October 31, 2014 were $13,018.
U.S. Bank, N.A., an affiliate of USBFS, serves as the Fund’s custodian. Quasar Distributors, LLC acts as the Fund’s principal underwriter in a continuous public offering of the Fund’s shares. Quasar Distributors, LLC is an affiliate of USBFS and U.S. Bank, N.A.
6). LINE OF CREDIT
The Fund has a line of credit with the other funds in the Hennessy Funds family of funds (the “Hennessy Funds”) in the amount of the lesser of (i) $100,000,000 or (ii) 33.33% of each Hennessy Fund’s net assets, or 30% for the Hennessy Gas Utility Index Fund and 10% for the Hennessy Balanced Fund, intended to provide short-term financing, if necessary, subject to certain restrictions, in connection with shareholder redemptions. The credit facility is with the Hennessy Funds’ custodian bank, U.S. Bank, N.A. Borrowings under this arrangement bear interest at the bank’s prime rate. During the fiscal year ended October 31, 2014, the Fund did not have any borrowings outstanding under the line of credit.
7). FEDERAL TAX INFORMATION
As of October 31, 2014, the components of accumulated earnings (losses) for income tax purposes were as follow:
| | Cost of investments for tax purposes | | $ | 95,240,010 | |
| | Gross tax unrealized appreciation | | $ | 26,854,958 | |
| | Gross tax unrealized depreciation | | | (1,615,759 | ) |
| | Net tax unrealized appreciation | | $ | 25,239,199 | |
| | Undistributed ordinary income | | $ | 1,313,651 | |
| | Undistributed long-term capital gains | | | 17,714,948 | |
| | Total distributable earnings | | $ | 19,028,599 | |
| | Other accumulated loss | | $ | (2,030,506 | ) |
| | Total accumulated gain | | $ | 42,237,292 | |
The difference between book-basis and tax-basis unrealized appreciation is attributable primarily to wash sales.
At October 31, 2014, the Fund had capital loss carryforwards of $2,030,506 that expire on October 31, 2016.
During the year ended October 31, 2014, the capital loss carry forwards utilized for the Fund were $1,015,253.
Capital losses sustained in the year ended October 31, 2012 and in future taxable years will not expire and may be carried over by the Fund without limitation; however, they will retain the character of the original loss. Furthermore, any loss incurred during those taxable years will be required to be utilized prior to the losses incurred in taxable years prior to 2012. As a result of this ordering rule, pre-enactment capital loss carryforwards may be more likely to expire unused. Under pre-enactment law, capital losses could be carried forward for eight years, and carried forward as short-term capital losses, irrespective of the character of the original loss.
HENNESSY FUNDS 1-800-966-4354
At October 31, 2014, the Fund did not defer, on a tax basis, any post-December late year ordinary loss deferrals.
The tax character of distributions paid during fiscal year 2014 and fiscal year 2013 for the Fund were as follow:
| | | | Year Ended | | | Year Ended | |
| | | | October 31, 2014 | | | October 31, 2013 | |
| | Ordinary income | | $ | 1,205,688 | | | $ | 1,080,469 | |
| | Long-term capital gain | | | 5,166,822 | | | | 169,387 | |
| | | | $ | 6,372,510 | | | $ | 1,249,856 | |
8). EVENTS SUBSEQUENT TO YEAR-END
On December 8, 2014, a long-term capital gains distribution of $2.23720 per share for the Investor Class and $2.25762 per share for the Institutional Class were declared and paid to shareholders of record on December 5, 2014.
Report of Independent Registered Public Accounting Firm
The Board of Trustees and Shareholders
Hennessy Funds Trust:
We have audited the accompanying statement of assets and liabilities of Hennessy Cornerstone Large Growth Fund (the Fund), a series of Hennessy Funds Trust, including the schedule of investments, as of October 31, 2014, and the related statement of operations for the year then ended, the statements of changes in net assets for each of the years in the two-year period then ended, and the financial highlights for each of the years in the five-year period then ended. These financial statements and financial highlights are the responsibility of the Fund’s management. Our responsibility is to express an opinion on these financial statements and financial highlights based on our audits.
We conducted our audits in accordance with the standards of the Public Company Accounting Oversight Board (United States). Those standards require that we plan and perform the audit to obtain reasonable assurance about whether the financial statements and financial highlights are free of material misstatement. An audit includes examining, on a test basis, evidence supporting the amounts and disclosures in the financial statements. Our procedures included confirmation of investments owned as of October 31, 2014, by correspondence with the custodian and brokers or by other appropriate auditing procedures. An audit also includes assessing the accounting principles used and significant estimates made by management, as well as evaluating the overall financial statement presentation. We believe that our audits provide a reasonable basis for our opinion.
In our opinion, the financial statements and financial highlights referred to above present fairly, in all material respects, the financial position of the Fund as of October 31, 2014, and the results of its operations for the year then ended, the changes in its net assets for each of the years in the two-year period then ended, and the financial highlights for each of the years in the five-year period then ended, in conformity with U.S. generally accepted accounting principles.
Milwaukee, Wisconsin
December 30, 2014
HENNESSY FUNDS 1-800-966-4354
Trustees and Officers of the Fund (Unaudited)
The business and affairs of the Fund are managed under the direction of the Fund’s Board of Trustees. Information pertaining to the Trustees and Officers of the Fund is set forth below. The Fund’s Statement of Additional Information includes additional information about the Fund’s Trustees and Officers and is available, without charge, upon request by calling 1-800-966-4354.
| | | | | Number of | |
| | | Term of | | Portfolios | |
| | | Office | | in the | Other |
| | | and | | Fund | Directorships |
| | Position(s) | Length | Principal | Complex | (During Past |
| Name, Address, | Held with | of Time | Occupation(s) | Overseen | Five Years)(2) |
| and Age | the Fund | Served | During Past Five Years | by Trustee | Held by Trustee |
| | | | |
| Disinterested Trustees (as defined below) | | | |
| | | | | | |
| J. Dennis DeSousa | Trustee | Indefinite, | Mr. DeSousa is a real | 16 | Hennessy SPARX |
| Age: 78 | | until | estate investor. | | Funds Trust; |
| Address: | | successor | | | Hennessy Mutual |
| c/o Hennessy | | elected | | | Funds, Inc.; and |
| Advisors, Inc. | | | | | The Hennessy |
| 7250 Redwood Blvd. | | Served | | | Funds, Inc. |
| Suite 200 | | since | | | |
| Novato, CA 94945 | | January | | | |
| | | 1996 | | | |
| | | for the | | | |
| | | Funds (or | | | |
| | | Predecessor | | | |
| | | Funds) | | | |
| | | | | | |
| Robert T. Doyle | Trustee | Indefinite, | Mr. Doyle has been the | 16 | Hennessy SPARX |
| Age: 67 | | until | Sheriff of Marin County, | | Funds Trust; |
| Address: | | successor | California since 1996. | | Hennessy Mutual |
| c/o Hennessy | | elected | | | Funds, Inc.; and |
| Advisors, Inc. | | | | | The Hennessy |
| 7250 Redwood Blvd. | | Served | | | Funds, Inc. |
| Suite 200 | | since | | | |
| Novato, CA 94945 | | January | | | |
| | | 1996 | | | |
| | | for the | | | |
| | | Funds (or | | | |
| | | Predecessor | | | |
| | | Funds) | | | |
| | | | | | |
| Gerald P. Richardson | Trustee | Indefinite, | Mr. Richardson is an | 16 | Hennessy SPARX |
| Age: 69 | | until | independent consultant | | Funds Trust; |
| Address: | | successor | in the securities industry. | | Hennessy Mutual |
| c/o Hennessy | | elected | | | Funds, Inc.; and |
| Advisors, Inc. | | | | | The Hennessy |
| 7250 Redwood Blvd. | | Served | | | Funds, Inc. |
| Suite 200 | | since | | | |
| Novato, CA 94945 | | May 2004 | | | |
| | | for the | | | |
| | | Funds (or | | | |
| | | Predecessor | | | |
| | | Funds) | | | |
| | | | | Number of | |
| | | Term of | | Portfolios | |
| | | Office | | in the | Other |
| | | and | | Fund | Directorships |
| | Position(s) | Length | Principal | Complex | (During Past |
| Name, Address, | Held with | of Time | Occupation(s) | Overseen | Five Years)(2) |
| and Age | the Fund | Served | During Past Five Years | by Trustee | Held by Trustee |
| | | | | | |
| “Interested Persons” (as defined in the 1940 Act) | | |
| | | |
Neil J. Hennessy(1) | Chief | Trustee: | Mr. Hennessy has been | 16 | Hennessy |
| Age: 58 | Investment | Indefinite, | employed by Hennessy | | Advisors, Inc. |
| Address: | Officer, | until | Advisors, Inc., the Funds’ | | (current); |
| c/o Hennessy | Portfolio | successor | investment advisor, since | | Hennessy SPARX |
| Advisors, Inc. | Manager, | elected | 1989. He currently serves | | Funds Trust; |
| 7250 Redwood Blvd. | President, | | as President, Chairman | | Hennessy Mutual |
| Suite 200 | Trustee | Served | and CEO of Hennessy | | Funds, Inc.; and |
| Novato, CA 94945 | and | since | Advisors, Inc. | | The Hennessy |
| | Chairman | January | | | Funds, Inc. |
| | of the | 1996 | | | |
| | Board | for the | | | |
| | | Funds (or | | | |
| | | Predecessor | | | |
| | | Funds) | | | |
| | | | | | |
| | | Officer: | | | |
| | | 1 year term | | | |
| | | | | | |
| | | Served | | | |
| | | since | | | |
| | | June 2008 | | | |
| | | for the | | | |
| | | Funds (or | | | |
| | | Predecessor | | | |
| | | Funds) | | | |
| | | | | | |
Teresa M. Nilsen(1) | Executive | 1 year term | Ms. Nilsen has been | N/A | N/A |
| Age: 48 | Vice | | employed by Hennessy | | |
| Address: | President | Served | Advisors, Inc., the Funds’ | | |
| c/o Hennessy | and | since | investment advisor, since | | |
| Advisors, Inc. | Treasurer | January | 1989. She currently serves | | |
| 7250 Redwood Blvd. | | 1996 | as Executive Vice President, | | |
| Suite 200 | | for the | Chief Operations Officer, | | |
| Novato, CA 94945 | | Funds (or | Chief Financial Officer, and | | |
| | | Predecessor | Secretary of Hennessy | | |
| | | Funds) | Advisors, Inc. | | |
| (1) | All Officers of the Hennessy Funds and employees of the Manager are Interested Persons of the Funds. |
| (2) | Pursuant to an internal reorganization, the series of Hennessy Mutual Funds, Inc. (“HMFI”), The Hennessy Funds, Inc. (“HFI”) and Hennessy SPARX Funds Trust (“HSFT”) were reorganized into series of Hennessy Funds Trust on February 28, 2014, which mirrored the corresponding series of HFMI, HFI and HSFT. Subsequent to the reorganization, HFMI, HFI and HSFT were dissolved. |
HENNESSY FUNDS 1-800-966-4354
| | | Term of | |
| | | Office | |
| | | and | |
| | Position(s) | Length | Principal |
| Name, Address, | Held with | of Time | Occupation(s) |
| and Age | the Fund | Served | During Past Five Years |
| | | | |
| Interested Persons | | | |
| | | | |
Daniel B. Steadman(1) | Executive | 1 year term | Mr. Steadman has been employed by |
| Age: 58 | Vice President | | Hennessy Advisors, Inc., the Funds’ |
| Address: | and Secretary | Served since | investment advisor, since 2000. |
| c/o Hennessy Advisors, Inc. | | March 2000 | He currently serves as Executive |
| 7250 Redwood Blvd. | | for the Funds (or | Vice President and Chief Compliance |
| Suite 200 | | Predecessor Funds) | Officer of Hennessy Advisors, Inc. |
| Novato, CA 94945 | | | |
| | | | |
Jennifer Cheskiewicz(1) | Senior | 1 year term | Ms. Cheskiewicz has been employed by |
| Age: 37 | Vice President | | Hennessy Advisors, Inc., the Funds’ |
| Address: | and Chief | Served since | investment advisor, since June 2013. |
| c/o Hennessy Advisors, Inc. | Compliance | June 2013 | She previously served as in-house |
| 7250 Redwood Blvd. | Officer | for the Funds (or | counsel to Carlson Capital, L.P., an |
| Suite 200 | | Predecessor Funds) | SEC-registered investment advisor to |
| Novato, CA 94945 | | | several private funds from February |
| | | | 2010 to May 2013. Prior to that, she |
| | | | was an attorney with Gibson, Dunn & |
| | | | Crutcher LLP from September 2005 |
| | | | through February 2010. She currently |
| | | | serves as General Counsel of |
| | | | Hennessy Advisors, Inc. |
| | | | |
Brian Carlson(1) | Senior | 1 year term | Mr. Carlson has been employed by |
| Age: 42 | Vice President | | Hennessy Advisors, Inc., the Funds’ |
| Address: | and Head of | Served since | investment advisor, since |
| c/o Hennessy Advisors, Inc. | Distribution | December 2013 | December 2013. |
| 7250 Redwood Blvd. | | for the Funds (or | |
| Suite 200 | | Predecessor Funds) | Mr. Carlson was previously a |
| Novato, CA 94945 | | | co-founder and principal of Trivium |
| | | | Consultants, LLC from February 2011 |
| | | | through November 2013. Prior to that, |
| | | | he was the Senior Managing Director |
| | | | of NRP Financial, Inc. from August |
| | | | 2007 through February 2011. |
| | | | |
David Ellison(1) | Portfolio Manager | 1 year term | Mr. Ellison has served as Portfolio |
| Age: 56 | and Senior | | Manager of the Large Cap Financial |
| Address: | Vice President | Served since | Fund, the Small Cap Financial Fund, |
| c/o Hennessy Advisors, Inc. | | October 2012 | and the Technology Fund |
| 101 Federal Street | | for the Funds (or | since inception. |
| Suite 1900 | | Predecessor Funds) | |
| Boston, MA 02110 | | | Mr. Ellison previously served as Director, |
| | | | CIO and President of FBR Advisers, Inc. |
| | | | from December 1999 to October 2012. |
| (1) | All Officers of the Hennessy Funds and employees of the Manager are Interested Persons of the Funds. |
| | | Term of | |
| | | Office | |
| | | and | |
| | Position(s) | Length | Principal |
| Name, Address, | Held with | of Time | Occupation(s) |
| and Age | the Fund | Served | During Past Five Years |
| | | | |
| Interested Persons | | | |
| | | | |
Brian Peery(1) | Portfolio Manager | 1 year term | Mr. Peery has been a Portfolio Manager |
| Age: 45 | and | | of the Cornerstone Growth Fund, |
| Address: | Vice President | Served since | the Cornerstone Mid Cap 30 Fund, the |
| c/o Hennessy Advisors, Inc. | | March 2003 | Cornerstone Large Growth Fund, the |
| 7250 Redwood Blvd. | | as Vice President | Cornerstone Value Fund, the Total |
| Suite 200 | | for the Funds (or | Return Fund, and the Balanced Fund |
| Novato, CA 94945 | | Predecessor Funds) | since October 2014. From February |
| | | | 2011 through September 2014, he |
| | | Served since | served as Co-Portfolio Manager of |
| | | February 2011 | the same funds. |
| | | as Co-Portfolio | |
| | | Manager | Mr. Peery has been employed by |
| | | for the Funds (or | Hennessy Advisors, Inc., the Funds’ |
| | | Predecessor Funds) | investment advisor, since 2002. |
| | | | |
Winsor (Skip) Aylesworth(1) | Portfolio Manager | 1 year term | Mr. Aylesworth has been Portfolio |
| Age: 67 | and | | Manager of the Gas Utility Index Fund |
| Address: | Vice President | Served since | since 1998 and Portfolio Manager of |
| c/o Hennessy Advisors, Inc. | | October 2012 | the Technology Fund since inception. |
| 101 Federal Street | | for the Funds (or | |
| Suite 1900 | | Predecessor Funds) | Mr. Aylesworth previously served as |
| Boston, MA 02110 | | | Executive Vice President of The FBR |
| | | | Funds from 1999 to October 2012. |
| | | | |
Ryan Kelley(1) | Portfolio Manager | 1 year term | Mr. Kelley has been a Portfolio Manager |
| Age: 42 | and | | of the Gas Utility Index Fund (formerly |
| Address: | Vice President | Served since | the FBR Gas Utility Index Fund), the |
| c/o Hennessy Advisors, Inc. | | March 2013 | Small Cap Financial Fund (formerly the |
| 1340 Environ Way | | for the Funds (or | FBR Small Cap Financial Fund), and the |
| Chapel Hill, NC 27517 | | Predecessor Funds) | Large Cap Financial Fund (formerly the |
| | | | FBR Large Cap Financial Fund) since |
| | | | October 2014. From March 2013 |
| | | | through September 2014, he served |
| | | | as a Co-Portfolio Manager of the same |
| | | | funds. Prior to that, he was a Portfolio |
| | | | Analyst of the Hennessy Funds. |
| | | | |
| | | | Mr. Kelley previously served as Portfolio |
| | | | Manager of The FBR Funds from |
| | | | January 2008 to October 2012. |
| (1) | All Officers of the Hennessy Funds and employees of the Manager are Interested Persons of the Funds. |
HENNESSY FUNDS 1-800-966-4354
Expense Example (Unaudited)
October 31, 2014
As a shareholder of the Fund, you incur two types of costs: (1) transaction costs, including sales charges (loads) on purchase payments, reinvested dividends, or other distributions; redemption fees; and exchange fees; and (2) ongoing costs, including management fees; service fees; and other Fund expenses. This Example is intended to help you understand your ongoing costs (in dollars) of investing in the Fund and to compare these costs with the ongoing costs of investing in other mutual funds. The Example is based on an investment of $1,000 invested at the beginning of the period and held for the entire period from May 1, 2014 through October 31, 2014.
Actual Expenses
The first line of the table below under the “Investor Class” and “Institutional Class” headings provides information about actual account values and actual expenses. Although the Fund charges no sales loads or transaction fees, you will be assessed fees for outgoing wire transfers, returned checks and stop payment orders at prevailing rates charged by U.S. Bancorp Fund Services, LLC, the Fund’s transfer agent. If you request that a redemption be made by wire transfer, currently a $15.00 fee is charged by the Fund’s transfer agent. IRA accounts will be charged a $15.00 annual maintenance fee. The example below includes, but is not limited to, management fees, shareholder servicing fees, fund accounting, custody, and transfer agent fees. However, the example below does not include portfolio trading commissions and related expenses, and other extraordinary expenses as determined under generally accepted accounting principles. You may use the information in this line, together with the amount you invested, to estimate the expenses that you paid over the period. Simply divide your account value by $1,000 (for example, an $8,600 account value divided by $1,000 = 8.6), then multiply the result by the number in the first line of the table under the “Investor Class” and “Institutional Class” headings in the column entitled “Expenses Paid During Period” to estimate the expenses you paid on your account during this period.
Hypothetical Example for Comparison Purposes
The second line of the table below under the “Investor Class” and “Institutional Class” headings provides information about hypothetical account values and hypothetical expenses based on the Fund’s actual expense ratios and an assumed rate of return of 5% per year before expenses, which is not the Fund’s actual return. The hypothetical account values and expenses may not be used to estimate the actual ending account balance or expenses you paid for the period. You may use this information to compare the ongoing costs of investing in the Fund and other funds. To do so, compare this 5% hypothetical example with the 5% hypothetical examples that appear in the shareholder reports of the other funds. Please note that the expenses shown in the table are meant to highlight your ongoing costs only and do not reflect any transactional costs, such as sales charges (loads), or exchange fees. Therefore, the second line of the table under the “Investor Class” and “Institutional Class” headings is useful in comparing ongoing costs only, and will not help you determine the relative total costs of owning different funds. In addition, if these transactional costs were included, your costs would have been higher.
| | Beginning | Ending | Expenses Paid |
| | Account Value | Account Value | During Period(1) |
| | 5/1/14 | 10/31/14 | 5/1/14 – 10/31/14 |
| Investor Class | | | |
| | | | |
| Actual | $1,000.00 | $1,053.50 | $5.80 |
| | | | |
| Hypothetical (5% return | | | |
| before expenses) | $1,000.00 | $1,019.56 | $5.70 |
| | | | |
| Institutional Class | | | |
| | | | |
| Actual | $1,000.00 | $1,054.40 | $5.07 |
| | | | |
| Hypothetical (5% return | | | |
| before expenses) | $1,000.00 | $1,020.27 | $4.99 |
| (1) | Expenses are equal to the Fund's expense ratio of 1.12% for Investor Class shares or 0.98% for Institutional Class shares, as applicable, multiplied by the average account value over the period, multiplied by 184/365 days (to reflect one-half year period). |
HENNESSY FUNDS 1-800-966-4354
Proxy Voting
A description of the policies and procedures the Fund uses to determine how to vote proxies relating to portfolio securities is available without charge: (1) by calling 1-800-966-4354; (2) on the Hennessy Funds’ website at hennessyfunds.com; or (3) on the U.S. Securities and Exchange Commission’s (the “SEC”) website at www.sec.gov. The Fund’s proxy voting record is available on both the Hennessy Funds’ website at hennessyfunds.com and the SEC’s website at www.sec.gov no later than August 31 for the prior 12 months ending June 30.
Quarterly Filings on Form N-Q
The Fund files its complete schedule of portfolio holdings with the SEC for the first and third quarters of each fiscal year on Form N-Q. The Fund’s Forms N-Q are available on the SEC’s website at www.sec.gov. The Fund’s Forms N-Q may be reviewed and copied at the SEC’s Public Reference Room in Washington, DC and information on the operation of the Public Reference Room may be obtained by calling 1-800-SEC-0330. Information included in the Fund’s Forms N-Q will also be available upon request by calling 1-800-966-4354.
Federal Tax Distribution Information
(Unaudited)
For the fiscal year ended October 31, 2014, certain dividends paid by the Fund may be subject to a maximum tax rate of 20%, as provided for by the Jobs and Growth Tax Relief Reconciliation Act of 2003. The percentage of dividends declared from ordinary income designated as qualified dividend income was 100.00%.
For corporate shareholders, the percent of ordinary income distributions qualifying for the corporate dividends received deduction for the fiscal year ended October 31, 2014 was 100.00%.
The percentage of taxable ordinary income distributions that are designated as short-term capital gain distributions under Section 871(k)(2)(C) of the Internal Revenue Code of 1986, as amended, for the Fund was 0.00%.
Householding
To help keep the Fund’s costs as low as possible, we generally deliver a single copy of most financial reports and prospectuses to shareholders who share an address, even if the accounts are registered under different names. This process, known as “householding,” does not apply to account statements. You may, of course, request an individual copy of a prospectus or financial report at any time. If you would like to receive separate mailings, please call the Administrator at 1-800-261-6950 or 1-414-765-4124 and we will begin individual delivery within 30 days of your request. If your account is held through a financial institution or other intermediary, please contact them directly to request individual delivery.
Privacy Policy
We collect the following non-public personal information about you:
| | • | information we receive from you on or in applications or other forms, correspondence, or conversations, including, but not limited to, your name, address, phone number, social security number, assets, income and date of birth; |
| | | and |
| | • | information about your transactions with us, our affiliates, or others, including, but not limited to, your account number and balance, payment history, parties to transactions, cost basis information and other financial information. |
We do not disclose any non-public personal information about our current or former shareholders to nonaffiliated third parties, except as permitted by law. For example, we are permitted by law to disclose all of the information we collect, as described above, to our Transfer Agent to process your transactions. Furthermore, we restrict access to your non-public personal information to those persons who require such information to provide products or services to you. We maintain physical, electronic and procedural safeguards that comply with federal standards to guard your non-public personal information.
In the event that you hold shares of the Fund through a financial intermediary, including, but not limited to, a broker-dealer, bank or trust company, the privacy policy of your financial intermediary would govern how your non-public personal information would be shared with nonaffiliated third parties.
HENNESSY FUNDS 1-800-966-4354
For information, questions or assistance, please call
The Hennessy Funds
1-800-966-4354 or 1-415-899-1555
INVESTMENT ADVISOR
Hennessy Advisors, Inc.
7250 Redwood Blvd., Suite 200
Novato, California 94945
ADMINISTRATOR,
TRANSFER AGENT,
DIVIDEND PAYING AGENT &
SHAREHOLDER SERVICING AGENT
U.S. Bancorp Fund Services, LLC
P.O. Box 701
Milwaukee, Wisconsin 53201-0701
CUSTODIAN
U.S. Bank N.A.
Custody Operations
1555 North River Center Dr., Suite 302
Milwaukee, Wisconsin 53212
TRUSTEES
Neil J. Hennessy
Robert T. Doyle
J. Dennis DeSousa
Gerald P. Richardson
COUNSEL
Foley & Lardner LLP
777 East Wisconsin Avenue
Milwaukee, Wisconsin 53202-5306
INDEPENDENT REGISTERED
PUBLIC ACCOUNTING FIRM
KPMG LLP
777 East Wisconsin Avenue
Milwaukee, Wisconsin 53202-5306
DISTRIBUTOR
Quasar Distributors, LLC
615 East Michigan Street
Milwaukee, Wisconsin 53202
hennessyfunds.com | 1-800-966-4354
This report has been prepared for shareholders and may be distributed to
others only if preceded or accompanied by a current prospectus.
ANNUAL REPORT
OCTOBER 31, 2014
HENNESSY CORNERSTONE
VALUE FUND
Investor Class HFCVX
Institutional Class HICVX
hennessyfunds.com | 1-800-966-4354
(This Page Intentionally Left Blank.)
Contents
| Letter to Shareholders | 2 |
| Performance Overview | 4 |
| Financial Statements | |
| Schedule of Investments | 7 |
| Statement of Assets and Liabilities | 11 |
| Statement of Operations | 12 |
| Statements of Changes in Net Assets | 13 |
| Financial Highlights | 14 |
| Notes to the Financial Statements | 18 |
| Report of Independent Registered Public Accounting Firm | 26 |
| Trustees and Officers of the Fund | 27 |
| Expense Example | 32 |
| Proxy Voting | 34 |
| Quarterly Filings on Form N-Q | 34 |
| Federal Tax Distribution Information | 34 |
| Householding | 34 |
| Privacy Policy | 35 |
HENNESSY FUNDS 1-800-966-4354
December 2014
Dear Shareholder:
As I look back at 2014, I realize that in this age of rapidly evolving technology, information is delivered and absorbed so quickly that it is difficult to remember what happened last week, let alone what’s happened over the course of an entire year. That is why I’d like to take a moment to recall some of the year’s highs and lows, economically, politically and socially, here in the U.S. and around the globe. 2014 was scarred by political partisanship, civil unrest in the U.S., Ukraine and many other countries, the arrival of terrorist group ISIS, the tragedies of school shootings and natural disasters, and the frightening outbreak of Ebola. However, there were also positive events this year: we survived a government shutdown over healthcare reform, jobs reports have been consistently, albeit anemically, improving, and home prices remained relatively stable, after recovering significantly in 2013. And, important to us here at Hennessy, our hometown team, the San Francisco Giants, won their third World Series in just five years!
A significant event for the financial industry this past year was the confirmation of Janet Yellen as Chair of the Federal Reserve, which served to calm the nerves of business and political leaders alike. I believe Yellen’s leadership will benefit U.S. business owners, as the Fed continues to be a voice of reason in a sea of political and economic rhetoric. The Fed has also supported the economy and corporate America by helping keep interest rates reasonable and low.
The stock market has continued its determined comeback from the lows of 2009, setting multiple record highs in recent months. The U.S. financial markets have provided strong returns over the past twelve-month period ended October 31, 2014, with the Dow Jones Industrial Average (DJIA) returning over 14% and S&P 500 Index returning over 17% during the period. The DJIA currently has a dividend yield of 2.2%, which is equal to that of a 10-Year U.S. Treasury, which is currently also yielding 2.2%. I continue to believe that investments in high-yielding, high-quality stocks have the potential to not only provide income but also the potential for stock price appreciation as well. Fixed income investing has run its course, in my opinion, and many individuals are currently benefiting from the return to investing in equities that possess strong fundamentals. American investors are slowly migrating from fixed income to equities. Currently, 54% of Americans invest in stocks, and I do expect this percentage to increase, especially if interest rates move higher.
For the past several years, U.S. corporations have been driving shareholder value by making acquisitions, initiating and raising dividends, investing in internal infrastructure and buying back stock. However, this year I began to see a shift from those strategies. I believe the easier to execute acquisitions are a thing of the past, and firms now have to be even more creative to execute accretive deals. I also believe that while firms may continue to initiate dividends, fewer firms will raise their dividends and fewer firms will participate in stock buyback programs going forward. What will these cash-rich companies do with their capital if they are not raising dividends or buying back stock? I believe they may begin to initiate capital expenditure programs that could truly benefit economic growth.
Liquidity and monetary conditions are supportive, causing the cost of capital to be very low. I believe firms will choose to spend capital to expand their sales, and they may even begin to hire in earnest. Once a company begins to move in this way, the cost to
defer becomes real for competitors. With almost $3 trillion in cash and short-term investments sitting on the balance sheets of the S&P 500 companies, a strategic shift by firms to spend their idle capital, while slow, could potentially further economic growth in the U.S. in my opinion.
Economic progress and growth remain slow, yet steady, and unemployment, though improving, remains high. Oil prices have fallen, giving consumers a bit more discretionary income. While the midterm elections may not end all of the gridlock in Washington, hopefully we will receive clarity on the political headwinds of taxes and regulations, which have not improved over the past several years.
The markets have had several quarters without any truly significant downturn. The pullbacks we recently experienced, most notably in July and October, were short-lived, as evidenced by the quick rebound to record high market levels. I firmly believe that we are in a secular bull market, and I continue to tell investors to try to remain calm in the face of volatility and continue to focus on the strong, long-term fundamentals that are evident in the market today. Many companies continue to have strong balance sheets, with record cash flows and profits. With this current bull market in its fifth year, investors should expect some volatility.
I am encouraged by the strong returns for the major U.S. financial market indices and by the performance of the Hennessy Funds over the past year. Thank you for your continued confidence and investment in our products. If you have any questions or would like to speak with us directly, please don’t hesitate to call us at (800) 966-4354.
Best regards,
Neil J. Hennessy
President and Chief Investment Officer
Past performance does not guarantee future results.
Mutual fund investing involves risk. Principal loss is possible.
Opinions expressed are those of Neil Hennessy and are subject to change, are not guaranteed and should not be considered investment advice.
The Dow Jones Industrial Average and S&P 500 Index are unmanaged indices commonly used to measure the performance of U.S. stocks. One cannot invest directly in an index.
Cash flow can be used as an indication of a company’s financial strength. A firm’s cash flow is the movement of cash in and out of the firm in the form of payments to suppliers and collections from customers. Dividend Yield is calculated as the annual dividends paid by a company divided by the price of a share of their stock.
HENNESSY FUNDS 1-800-966-4354
Performance Overview (Unaudited)
The opinions expressed in the following commentary reflect those of the Portfolio Managers as of the date written. Any such opinions are subject to change based on market or other conditions and are not guaranteed. These opinions may not be relied upon as investment advice. Investment decisions for the Fund are based on multiple factors, and may not be relied upon as an indication of trading intent on behalf of the Fund. Security positions can and do change.
CHANGE IN VALUE OF $10,000 INVESTMENT
This chart assumes an initial gross investment of $10,000 made on October 31, 2004. Returns shown include the reinvestment of all dividends. Returns shown do not reflect the deduction of taxes that a shareholder would pay on Fund distributions or the redemption of Fund shares.
AVERAGE ANNUAL TOTAL RETURN FOR PERIODS ENDED OCTOBER 31, 2014
| | One | Five | Ten |
| | Year | Years | Years |
| Hennessy Cornerstone Value Fund – | | | |
| Investor Class (HFCVX) | 11.69% | 14.59% | 7.04% |
| Hennessy Cornerstone Value Fund – | | | |
Institutional Class (HICVX)(1) | 11.82% | 14.90% | 7.23% |
Russell 1000® Value Index | 16.46% | 16.49% | 7.90% |
| S&P 500 Index | 17.27% | 16.69% | 8.20% |
Expense ratios: 1.22% (Investor Class); Gross 1.10%, Net 0.98%(2) (Institutional Class)
Performance data quoted represents past performance; past performance does not guarantee future results. The investment return and principal value of an investment will fluctuate so that an investor’s shares, when redeemed, may be worth more or less than their original cost. Current performance of the Fund may be lower or higher than the performance quoted. Performance data current to the most recent month end may be obtained by visiting hennessyfunds.com.
The expense ratios presented are from the most recent prospectus.
| (1) | The inception date of the Institutional Class shares is March 3, 2008. Performance shown prior to the inception of the Institutional Class shares reflects the performance of the Investor Class shares and includes expenses that are not applicable to and are higher than those of the Institutional Class shares. |
| (2) | With regard to Institutional Class shares, the Funds’ investment advisor has contractually agreed to waive a portion of its expenses indefinitely. |
PERFORMANCE NARRATIVE
Portfolio Manager, Neil Hennessy, and Portfolio Manager, Brian Peery
Over the previous twelve months, how did the Fund perform and what factors contributed to this performance?
For the twelve-month period ended October 31, 2014, the Investor Class of the Hennessy Cornerstone Value Fund returned 11.69%, underperforming the Russell 1000® Value Index, the S&P 500 Index and the Morningstar Large Value Category Average, which returned 16.46%, 17.27% and 13.60% for the same period, respectively.
While the Fund had good absolute performance for the twelve-month period, its performance versus the Russell 1000® Value Index was hampered by both asset allocation and stock selection. Relative overweighting in the Consumer Discretionary sector, combined with stock selection within the sector, attributed to all of the Fund’s relative underperformance versus the Russell 1000® Value Index. Specifically, significant detractors to relative underperformance were Ford Motor Co. and General Motors Co., both of which performed poorly during the period.
Additional Portfolio Manager commentary and related investment outlook:
The financial markets continue to appear to favor companies that place a high emphasis on shareholder value, specifically those companies that reward shareholders with higher dividends, and we expect this trend to continue as investors look to replace income streams from fixed income to high-yielding equities. As of the end of October, the Fund’s 30-Day SEC Yield for Investor Class shares was 2.45% (as a reference point, the U.S. Treasury 10-year and 5-year yields at the end of October were 2.34% and 1.61%, respectively). As investors continue to seek opportunities to generate income, while maintaining exposure to the upside potential of the equity markets, we believe that large capitalization, dividend-paying companies should continue to do well.
The stock market recently went through what some would call a much needed correction. It is important to remember that we are in a five-year bull market and that corrections will happen. The key is to stay the course, not be swayed or allow fear to dictate investment parameters, and remain focused on investing for the long-term. By adhering to our strict stock selection methodology, which includes keeping only a small portion of the Fund’s assets in cash, the performance of the Fund rebounded quickly alongside the market.
With the market’s quick rebound to new highs and recent spike in volatility, we anticipate that investors will continue to migrate out of high-risk, high-multiple stocks and into stocks that should do well as the economy expands. With interest rates expected to remain low for quite some time, we would expect investors to continue to shift assets towards high-quality, dividend-paying companies as a means of income generation, especially after taking into consideration the favorable tax rates of income from dividends versus ordinary income. While the equation for high-dividend stocks might not be as obvious today as it was just a few years ago, when dividend yields were even higher, we still believe they offer an excellent means of potentially generating income while maintaining exposure to potential appreciation of the underlying asset in the form of a higher stock price.
The Russell 1000® Value Index is an unmanaged index commonly used to measure the performance of U.S. large-capitalization value stocks. The S&P 500 Index is an unmanaged index commonly used to measure the performance of U.S. stocks. You cannot invest directly in an index. Performance data for an index does not reflect any deductions for fees, expenses or taxes. The Fund may invest in medium-capitalization companies, which may have more limited liquidity and greater price volatility than
HENNESSY FUNDS 1-800-966-4354
large-capitalization companies. Investments in foreign securities involve greater volatility and political, economic and currency risk and differences in accounting methods. The Fund’s portfolio is rebalanced annually in accordance with its strategy, which may result in the elimination of better performing assets from the Fund’s investments and increases in investments with relatively lower total return. References to specific securities should not be considered a recommendation to buy or sell any security. Fund holdings and sector allocations are subject to change. Please refer to the Schedule of Investments included in this report for additional portfolio information. Any tax or legal information provided is not exhaustive. Investors must consult their tax advisor or legal counsel for advice and information concerning their particular situation. Neither the Fund nor any of its representatives may give legal or tax advice.
30-Day SEC Yield is a standardized yield computed by dividing the net investment income per share earned during the past 30-day period by the share price at the end of the period, expressed as an annual percentage rate.
Each Morningstar category average represents a universe of funds with similar investment objectives. © Morningstar, Inc. All Rights Reserved. The information contained herein: 1) is proprietary to Morningstar; 2) may not be copied or distributed and 3) is not warranted to be accurate, complete or timely. Neither Morningstar nor its content providers are responsible for any damages or losses arising from any use of this information. Past performance does not guarantee future results.
Financial Statements
HENNESSY CORNERSTONE VALUE FUND
As of October 31, 2014
(% of Net Assets)
| TOP TEN HOLDINGS (EXCLUDING CASH/CASH EQUIVALENTS) | % NET ASSETS |
| | |
| CenturyLink, Inc. | 2.58% |
| Altria Group, Inc. | 2.48% |
| Intel Corp. | 2.48% |
| AbbVie, Inc. | 2.34% |
| Lockheed Martin Corp. | 2.25% |
| Microsoft Corp. | 2.25% |
| Eli Lilly & Co. | 2.20% |
| Johnson & Johnson | 2.18% |
| 3M Co. | 2.17% |
| Pepsico, Inc. | 2.14% |
Note: For presentation purposes, the Fund has grouped some of the industry categories. For purposes of categorizing securities for compliance with Section 8(b)(1) of the Investment Company Act of 1940, the Fund uses more specific industry classifications.
HENNESSY FUNDS 1-800-966-4354
| | COMMON STOCKS – 98.49% | | Number | | | | | | % of | |
| | | | of Shares | | | Value | | | Net Assets | |
| | Consumer Discretionary – 8.80% | | | | | | | | | |
| | Ford Motor Co. | | | 187,100 | | | $ | 2,636,239 | | | | 1.69 | % |
| | General Motors Co. | | | 77,200 | | | | 2,424,080 | | | | 1.56 | % |
| | McDonald’s Corp. | | | 29,300 | | | | 2,746,289 | | | | 1.77 | % |
| | Target Corp. | | | 49,100 | | | | 3,035,362 | | | | 1.95 | % |
| | Thomson Reuters Corp. (a) | | | 76,600 | | | | 2,851,052 | | | | 1.83 | % |
| | | | | | | | | 13,693,022 | | | | 8.80 | % |
| | | | | | | | | | | | | | |
| | Consumer Staples – 24.16% | | | | | | | | | | | | |
| | Altria Group, Inc. | | | 79,800 | | | | 3,857,532 | | | | 2.48 | % |
| | ConAgra Foods, Inc. | | | 88,700 | | | | 3,046,845 | | | | 1.96 | % |
| | General Mills, Inc. | | | 58,100 | | | | 3,018,876 | | | | 1.94 | % |
| | Kellogg Co. | | | 47,800 | | | | 3,057,288 | | | | 1.96 | % |
| | Kimberly Clark Corp. | | | 25,800 | | | | 2,948,166 | | | | 1.89 | % |
| | Kraft Foods Group, Inc. | | | 53,300 | | | | 3,003,455 | | | | 1.93 | % |
| | Pepsico, Inc. | | | 34,700 | | | | 3,337,099 | | | | 2.14 | % |
| | Philip Morris International, Inc. | | | 36,100 | | | | 3,213,261 | | | | 2.07 | % |
| | Procter & Gamble Co. | | | 36,000 | | | | 3,141,720 | | | | 2.02 | % |
| | Sysco Corp. | | | 78,900 | | | | 3,040,806 | | | | 1.95 | % |
| | The Coca-Cola Co. | | | 73,200 | | | | 3,065,616 | | | | 1.97 | % |
| | Unilever PLC – ADR (a) | | | 71,600 | | | | 2,880,468 | | | | 1.85 | % |
| | | | | | | | | 37,611,132 | | | | 24.16 | % |
| | | | | | | | | | | | | | |
| | Energy – 12.86% | | | | | | | | | | | | |
| | BP PLC – ADR | | | 59,000 | | | | 2,564,140 | | | | 1.65 | % |
| | Chevron Corp. | | | 24,500 | | | | 2,938,775 | | | | 1.89 | % |
| | ConocoPhillips | | | 42,600 | | | | 3,073,590 | | | | 1.97 | % |
| | Exxon Mobil Corp. | | | 30,200 | | | | 2,920,642 | | | | 1.88 | % |
| | Occidental Petroleum Corp. | | | 31,200 | | | | 2,774,616 | | | | 1.78 | % |
| | Royal Dutch Shell PLC – ADR (a) | | | 38,100 | | | | 2,844,927 | | | | 1.83 | % |
| | Total SA – ADR (a) | | | 48,400 | | | | 2,898,676 | | | | 1.86 | % |
| | | | | | | | | 20,015,366 | | | | 12.86 | % |
| | | | | | | | | | | | | | |
| | Financials – 3.78% | | | | | | | | | | | | |
| | Banco Santander SA – ADR (a) | | | 325,700 | | | | 2,856,389 | | | | 1.83 | % |
| | J.P. Morgan Chase & Co. | | | 50,100 | | | | 3,030,048 | | | | 1.95 | % |
| | | | | | | | | 5,886,437 | | | | 3.78 | % |
The accompanying notes are an integral part of these financial statements.
| | COMMON STOCKS | | Number | | | | | | % of | |
| | | | of Shares | | | Value | | | Net Assets | |
| | Health Care – 15.87% | | | | | | | | | |
| | AbbVie, Inc. | | | 57,500 | | | $ | 3,648,950 | | | | 2.34 | % |
| | Baxter International, Inc. | | | 40,900 | | | | 2,868,726 | | | | 1.84 | % |
| | Bristol-Myers Squibb Co. | | | 56,000 | | | | 3,258,640 | | | | 2.09 | % |
| | Eli Lilly & Co. | | | 51,700 | | | | 3,429,261 | | | | 2.20 | % |
| | GlaxoSmithKline PLC – ADR (a) | | | 53,400 | | | | 2,429,166 | | | | 1.56 | % |
| | Johnson & Johnson | | | 31,400 | | | | 3,384,292 | | | | 2.18 | % |
| | Merck & Co., Inc. | | | 52,300 | | | | 3,030,262 | | | | 1.95 | % |
| | Pfizer, Inc. | | | 89,000 | | | | 2,665,550 | | | | 1.71 | % |
| | | | | | | | | 24,714,847 | | | | 15.87 | % |
| | | | | | | | | | | | | | |
| | Industrials – 8.36% | | | | | | | | | | | | |
| | 3M Co. | | | 22,000 | | | | 3,382,940 | | | | 2.17 | % |
| | General Electric Co. | | | 111,800 | | | | 2,885,558 | | | | 1.85 | % |
| | Lockheed Martin Corp. | | | 18,400 | | | | 3,506,488 | | | | 2.25 | % |
| | Waste Management, Inc. | | | 66,400 | | | | 3,246,296 | | | | 2.09 | % |
| | | | | | | | | 13,021,282 | | | | 8.36 | % |
| | | | | | | | | | | | | | |
| | Information Technology – 8.81% | | | | | | | | | | | | |
| | Cisco Systems, Inc. | | | 126,300 | | | | 3,090,561 | | | | 1.99 | % |
| | Intel Corp. | | | 113,700 | | | | 3,866,937 | | | | 2.48 | % |
| | Microsoft Corp. | | | 74,600 | | | | 3,502,470 | | | | 2.25 | % |
| | Texas Instruments, Inc. | | | 65,600 | | | | 3,257,696 | | | | 2.09 | % |
| | | | | | | | | 13,717,664 | | | | 8.81 | % |
| | | | | | | | | | | | | | |
| | Materials – 9.47% | | | | | | | | | | | | |
| | EI Du Pont de Nemours & Co. | | | 45,400 | | | | 3,139,410 | | | | 2.02 | % |
| | Freeport-McMoRan Copper & Gold, Inc. | | | 87,600 | | | | 2,496,600 | | | | 1.60 | % |
| | International Paper Co. | | | 58,000 | | | | 2,935,960 | | | | 1.89 | % |
| | Nucor Corp. | | | 58,400 | | | | 3,157,104 | | | | 2.03 | % |
| | The Dow Chemical Co. | | | 60,900 | | | | 3,008,460 | | | | 1.93 | % |
| | | | | | | | | 14,737,534 | | | | 9.47 | % |
| | | | | | | | | | | | | | |
| | Telecommunication Services – 6.38% | | | | | | | | | | | | |
| | AT&T, Inc. | | | 85,200 | | | | 2,968,368 | | | | 1.91 | % |
| | CenturyLink, Inc. | | | 96,800 | | | | 4,015,264 | | | | 2.58 | % |
| | Verizon Communications, Inc. | | | 58,700 | | | | 2,949,675 | | | | 1.89 | % |
| | | | | | | | | 9,933,307 | | | | 6.38 | % |
| | | | | | | | | | | | | | |
| | Total Common Stocks | | | | | | | | | | | | |
| | (Cost $116,424,205) | | | | | | | 153,330,591 | | | | 98.49 | % |
The accompanying notes are an integral part of these financial statements.
HENNESSY FUNDS 1-800-966-4354
| | SHORT-TERM INVESTMENTS – 1.38% | | Number | | | | | | % of | |
| | | | of Shares | | | Value | | | Net Assets | |
| | Money Market Funds – 1.38% | | | | | | | | | |
| | Fidelity Government Portfolio – Institutional Class, 0.01% (b) | | | 2,148,308 | | | $ | 2,148,308 | | | | 1.38 | % |
| | | | | | | | | | | | | | |
| | Total Short-Term Investments | | | | | | | | | | | | |
| | (Cost $2,148,308) | | | | | | | 2,148,308 | | | | 1.38 | % |
| | | | | | | | | | | | | | |
| | Total Investments | | | | | | | | | | | | |
| | (Cost $118,572,513) – 99.87% | | | | | | | 155,478,899 | | | | 99.87 | % |
| | Other Assets in | | | | | | | | | | | | |
| | Excess of Liabilities – 0.13% | | | | | | | 208,566 | | | | 0.13 | % |
| | TOTAL NET ASSETS – 100.00% | | | | | | $ | 155,687,465 | | | | 100.00 | % |
Percentages are stated as a percent of net assets.
ADR – American Depositary Receipt
| | (a) | U.S. traded security of a foreign corporation. |
| | (b) | The rate listed is the fund’s 7-day yield as of October 31, 2014. |
Summary of Fair Value Exposure at October 31, 2014
The following is a summary of the inputs used to value the Fund’s net assets as of October 31, 2014 (See Note 3 in the accompanying notes to the financial statements):
| | Common Stocks | | Level 1 | | | Level 2 | | | Level 3 | | | Total | |
| | Consumer Discretionary | | $ | 13,693,022 | | | $ | — | | | $ | — | | | $ | 13,693,022 | |
| | Consumer Staples | | | 37,611,132 | | | | — | | | | — | | | | 37,611,132 | |
| | Energy | | | 20,015,366 | | | | — | | | | — | | | | 20,015,366 | |
| | Financials | | | 5,886,437 | | | | — | | | | — | | | | 5,886,437 | |
| | Health Care | | | 24,714,847 | | | | — | | | | — | | | | 24,714,847 | |
| | Industrials | | | 13,021,282 | | | | — | | | | — | | | | 13,021,282 | |
| | Information Technology | | | 13,717,664 | | | | — | | | | — | | | | 13,717,664 | |
| | Materials | | | 14,737,534 | | | | — | | | | — | | | | 14,737,534 | |
| | Telecommunication Services | | | 9,933,307 | | | | — | | | | — | | | | 9,933,307 | |
| | Total Common Stocks | | $ | 153,330,591 | | | $ | — | | | $ | — | | | $ | 153,330,591 | |
| | Short-Term Investments | | | | | | | | | | | | | | | | |
| | Money Market Funds | | $ | 2,148,308 | | | $ | — | | | $ | — | | | $ | 2,148,308 | |
| | Total Short-Term Investments | | $ | 2,148,308 | | | $ | — | | | $ | — | | | $ | 2,148,308 | |
| | Total Investments | | $ | 155,478,899 | | | $ | — | | | $ | — | | | $ | 155,478,899 | |
Transfers between levels are recognized at the end of the reporting period. During the one-year period ended October 31, 2014, the Fund recognized no transfers between levels.
The accompanying notes are an integral part of these financial statements.
Financial Statements
Statement of Assets and Liabilities as of October 31, 2014 |
| ASSETS: | | | |
| Investments in securities, at value (cost $118,572,513) | | $ | 155,478,899 | |
| Dividends and interest receivable | | | 391,047 | |
| Receivable for fund shares sold | | | 37,802 | |
| Prepaid expenses and other assets | | | 17,407 | |
| Total Assets | | | 155,925,155 | |
| | | | | |
| LIABILITIES: | | | | |
| Payable for fund shares redeemed | | | 47,123 | |
| Payable to advisor | | | 95,254 | |
| Payable to administrator | | | 35,074 | |
| Payable to auditor | | | 20,322 | |
| Accrued service fees | | | 11,988 | |
| Accrued interest payable | | | 143 | |
| Accrued trustees fees | | | 2,238 | |
| Accrued expenses and other payables | | | 25,548 | |
| Total Liabilities | | | 237,690 | |
| NET ASSETS | | $ | 155,687,465 | |
| | | | | |
| NET ASSETS CONSIST OF: | | | | |
| Capital stock | | $ | 139,836,515 | |
| Accumulated net investment income | | | 2,764,012 | |
| Accumulated net realized loss on investments | | | (23,819,448 | ) |
| Unrealized net appreciation on investments | | | 36,906,386 | |
| Total Net Assets | | $ | 155,687,465 | |
| | | | | |
| NET ASSETS | | | | |
| Investor Class: | | | | |
| Shares authorized (no par value) | | Unlimited | |
| Net assets applicable to outstanding Investor Class shares | | $ | 145,040,271 | |
| Shares issued and outstanding | | | 7,880,203 | |
| Net asset value, offering price and redemption price per share | | $ | 18.41 | |
| | | | | |
| Institutional Class: | | | | |
| Shares authorized (no par value) | | Unlimited | |
| Net assets applicable to outstanding Institutional Class shares | | $ | 10,647,194 | |
| Shares issued and outstanding | | | 578,323 | |
| Net asset value, offering price and redemption price per share | | $ | 18.41 | |
The accompanying notes are an integral part of these financial statements.
HENNESSY FUNDS 1-800-966-4354
Financial Statements
Statement of Operations for the year ended October 31, 2014 |
| INVESTMENT INCOME: | | | |
Dividend income(1) | | $ | 5,066,911 | |
| Interest income | | | 470 | |
| Total investment income | | | 5,067,381 | |
| | | | | |
| EXPENSES: | | | | |
| Investment advisory fees (See Note 5) | | | 1,122,438 | |
| Administration, fund accounting, custody and transfer agent fees | | | 272,463 | |
| Service fees – Investor Class (See Note 5) | | | 142,812 | |
| Sub-transfer agent expenses – Investor Class (See Note 5) | | | 94,494 | |
| Sub-transfer agent expenses – Institutional Class (See Note 5) | | | 3,294 | |
| Federal and state registration fees | | | 31,457 | |
| Audit fees | | | 23,056 | |
| Compliance expense | | | 21,488 | |
| Reports to shareholders | | | 18,199 | |
| Trustees’ fees and expenses | | | 9,694 | |
| Legal fees | | | 2,501 | |
| Interest expense (See Note 6) | | | 608 | |
| Other expenses | | | 13,314 | |
| Total expenses before waiver | | | 1,755,818 | |
| Administrative expense waiver (See Note 5) | | | (4,237 | ) |
| Net expenses | | | 1,751,581 | |
| NET INVESTMENT INCOME | | $ | 3,315,800 | |
| | | | | |
| REALIZED AND UNREALIZED GAINS: | | | | |
| Net realized gain on investments | | $ | 8,660,346 | |
| Net change in unrealized appreciation on investments | | | 4,550,966 | |
| Net gain on investments | | | 13,211,312 | |
| NET INCREASE IN NET ASSETS RESULTING FROM OPERATIONS | | $ | 16,527,112 | |
(1) Net of foreign taxes withheld and issuance fees of $89,375.
The accompanying notes are an integral part of these financial statements.
Financial Statements
| Statements of Changes in Net Assets |
| | | Year Ended | | | Year Ended | |
| | | October 31, 2014 | | | October 31, 2013 | |
| OPERATIONS: | | | | | | |
| Net investment income | | $ | 3,315,800 | | | $ | 3,507,085 | |
| Net realized gain on investments | | | 8,660,346 | | | | 12,225,964 | |
| Net change in unrealized appreciation on investments | | | 4,550,966 | | | | 13,004,866 | |
| Net increase in net assets resulting from operations | | | 16,527,112 | | | | 28,737,915 | |
| | | | | | | | | |
| DISTRIBUTIONS TO SHAREHOLDERS FROM: | | | | | | | | |
| Net investment income | | | | | | | | |
| Investor Class | | | (3,513,687 | ) | | | (3,262,318 | ) |
| Institutional Class | | | (87,011 | ) | | | (77,674 | ) |
| Total distributions | | | (3,600,698 | ) | | | (3,339,992 | ) |
| | | | | | | | | |
| CAPITAL SHARE TRANSACTIONS: | | | | | | | | |
| Proceeds from shares subscribed – Investor Class | | | 3,491,144 | | | | 5,921,525 | |
| Proceeds from shares subscribed – Institutional Class | | | 14,793,692 | | | | 2,126,066 | |
| Dividends reinvested – Investor Class | | | 3,144,019 | | | | 2,900,074 | |
| Dividends reinvested – Institutional Class | | | 73,379 | | | | 66,521 | |
| Cost of shares redeemed – Investor Class | | | (12,672,806 | )(1) | | | (19,568,045 | ) |
| Cost of shares redeemed – Institutional Class | | | (9,101,431 | ) | | | (1,332,315 | ) |
| Net decrease in net assets | | | | | | | | |
| derived from capital share transactions | | | (272,003 | ) | | | (9,886,174 | ) |
| TOTAL INCREASE IN NET ASSETS | | | 12,654,411 | | | | 15,511,749 | |
| | | | | | | | | |
| NET ASSETS: | | | | | | | | |
| Beginning of year | | | 143,033,054 | | | | 127,521,305 | |
| End of year | | $ | 155,687,465 | | | $ | 143,033,054 | |
| Undistributed net investment income, end of year | | $ | 2,764,012 | | | $ | 3,048,910 | |
| | | | | | | | | |
| CHANGES IN SHARES OUTSTANDING: | | | | | | | | |
| Shares sold – Investor Class | | | 198,545 | | | | 395,919 | |
| Shares sold – Institutional Class | | | 838,952 | | | | 140,683 | |
| Shares issued to holders as reinvestment | | | | | | | | |
| of dividends – Investor Class | | | 183,861 | | | | 209,090 | |
| Shares issued to holders as reinvestment | | | | | | | | |
| of dividends – Institutional Class | | | 4,296 | | | | 4,803 | |
| Shares redeemed – Investor Class | | | (721,925 | ) | | | (1,299,056 | ) |
| Shares redeemed – Institutional Class | | | (506,582 | ) | | | (84,166 | ) |
| Net decrease in shares outstanding | | | (2,853 | ) | | | (632,727 | ) |
| (1) | Net of redemption fees of $2,165 related to redemption fees imposed by the Fund during a prior year but not received until the year ended October 31, 2014. |
The accompanying notes are an integral part of these financial statements.
HENNESSY FUNDS 1-800-966-4354
Financial Statements
For an Investor Class share outstanding throughout each year
PER SHARE DATA:
Net asset value, beginning of year
Income from investment operations:
Net investment income
Net realized and unrealized gains on investments
Total from investment operations
Less distributions:
Dividends from net investment income
Total distributions
Net asset value, end of year
TOTAL RETURN
SUPPLEMENTAL DATA AND RATIOS:
Net assets, end of year (millions)
Ratio of expenses to average net assets
Ratio of net investment income to average net assets
Portfolio turnover rate(1)
(1) Portfolio turnover is calculated on the basis of the Fund as a whole.
The accompanying notes are an integral part of these financial statements.
| Year Ended October 31, | |
| 2014 | | | 2013 | | | 2012 | | | 2011 | | | 2010 | |
| | | | | | | | | | | | | | |
| $ | 16.90 | | | $ | 14.02 | | | $ | 12.84 | | | $ | 12.53 | | | $ | 10.63 | |
| | | | | | | | | | | | | | | | | | | |
| | | | | | | | | | | | | | | | | | | |
| | 0.39 | | | | 0.42 | | | | 0.37 | | | | 0.45 | | | | 0.29 | |
| | 1.55 | | | | 2.84 | | | | 1.23 | | | | 0.23 | | | | 1.81 | |
| | 1.94 | | | | 3.26 | | | | 1.60 | | | | 0.68 | | | | 2.10 | |
| | | | | | | | | | | | | | | | | | | |
| | | | | | | | | | | | | | | | | | | |
| | (0.43 | ) | | | (0.38 | ) | | | (0.42 | ) | | | (0.37 | ) | | | (0.20 | ) |
| | (0.43 | ) | | | (0.38 | ) | | | (0.42 | ) | | | (0.37 | ) | | | (0.20 | ) |
| $ | 18.41 | | | $ | 16.90 | | | $ | 14.02 | | | $ | 12.84 | | | $ | 12.53 | |
| | | | | | | | | | | | | | | | | | | |
| | 11.69 | % | | | 23.84 | % | | | 12.79 | % | | | 5.58 | % | | | 19.98 | % |
| | | | | | | | | | | | | | | | | | | |
| | | | | | | | | | | | | | | | | | | |
| $ | 145.04 | | | $ | 138.94 | | | $ | 124.99 | | | $ | 116.41 | | | $ | 155.87 | |
| | 1.17 | % | | | 1.22 | % | | | 1.26 | % | | | 1.31 | % | | | 1.29 | % |
| | 2.18 | % | | | 2.60 | % | | | 2.67 | % | | | 2.94 | % | | | 2.33 | % |
| | 34 | % | | | 41 | % | | | 47 | % | | | 40 | % | | | 91 | % |
The accompanying notes are an integral part of these financial statements.
HENNESSY FUNDS 1-800-966-4354
Financial Statements
For an Institutional Class share outstanding throughout each year
PER SHARE DATA:
Net asset value, beginning of year
Income from investment operations:
Net investment income
Net realized and unrealized gains on investments
Total from investment operations
Less distributions:
Dividends from net investment income
Total distributions
Net asset value, end of year
TOTAL RETURN
SUPPLEMENTAL DATA AND RATIOS:
Net assets, end of year (millions)
Ratio of expenses to average net assets:
Before expense reimbursement
After expense reimbursement
Ratio of net investment income to average net assets:
Before expense reimbursement
After expense reimbursement
Portfolio turnover rate(1)
(1) Portfolio turnover is calculated on the basis of the Fund as a whole.
The accompanying notes are an integral part of these financial statements.
| Year Ended October 31, | |
| 2014 | | | 2013 | | | 2012 | | | 2011 | | | 2010 | |
| | | | | | | | | | | | | | |
| $ | 16.92 | | | $ | 14.04 | | | $ | 12.86 | | | $ | 12.54 | | | $ | 10.63 | |
| | | | | | | | | | | | | | | | | | | |
| | | | | | | | | | | | | | | | | | | |
| | 0.59 | | | | 0.50 | | | | 0.45 | | | | 0.36 | | | | 0.30 | |
| | 1.37 | | | | 2.80 | | | | 1.19 | | | | 0.37 | | | | 1.83 | |
| | 1.96 | | | | 3.30 | | | | 1.64 | | | | 0.73 | | | | 2.13 | |
| | | | | | | | | | | | | | | | | | | |
| | | | | | | | | | | | | | | | | | | |
| | (0.47 | ) | | | (0.42 | ) | | | (0.46 | ) | | | (0.41 | ) | | | (0.22 | ) |
| | (0.47 | ) | | | (0.42 | ) | | | (0.46 | ) | | | (0.41 | ) | | | (0.22 | ) |
| $ | 18.41 | | | $ | 16.92 | | | $ | 14.04 | | | $ | 12.86 | | | $ | 12.54 | |
| | | | | | | | | | | | | | | | | | | |
| | 11.82 | % | | | 24.13 | % | | | 13.13 | % | | | 6.00 | % | | | 20.31 | % |
| | | | | | | | | | | | | | | | | | | |
| | | | | | | | | | | | | | | | | | | |
| $ | 10.65 | | | $ | 4.09 | | | $ | 2.53 | | | $ | 1.17 | | | $ | 1.35 | |
| | | | | | | | | | | | | | | | | | | |
| | 1.03 | % | | | 1.10 | % | | | 1.20 | % | | | 1.14 | % | | | 1.10 | % |
| | 0.98 | % | | | 0.98 | % | | | 0.98 | % | | | 0.98 | % | | | 0.98 | % |
| | | | | | | | | | | | | | | | | | | |
| | 2.30 | % | | | 2.64 | % | | | 2.72 | % | | | 3.04 | % | | | 2.52 | % |
| | 2.35 | % | | | 2.76 | % | | | 2.94 | % | | | 3.20 | % | | | 2.64 | % |
| | 34 | % | | | 41 | % | | | 47 | % | | | 40 | % | | | 91 | % |
The accompanying notes are an integral part of these financial statements.
HENNESSY FUNDS 1-800-966-4354
Financial Statements
Notes to Financial Statements October 31, 2014 |
1). ORGANIZATION
The Hennessy Cornerstone Value Fund (the “Fund”) is a series of Hennessy Funds Trust (the “Trust”), which was organized as a Delaware statutory trust on September 17, 1992. The Fund is an open-end management investment company registered under the Investment Company Act of 1940, as amended. The Fund is a successor to a fund with the same name (the “Predecessor Fund”) that was a series of Hennessy Mutual Funds, Inc., a Maryland corporation, pursuant to a reorganization that took place after the close of business on February 28, 2014. Prior to February 28, 2014, the Fund had no investment operations. As a result of the reorganization, holders of the Investor Class shares of the Predecessor Fund received Investor Class shares of the Fund (the Investor Class shares of the Fund are the successor to the accounting and performance information of the Predecessor Fund), and holders of the Institutional Class shares of the Predecessor Fund received Institutional Class shares of the Fund (the Institutional Class shares of the Fund are the successor to the accounting and performance information of the Predecessor Fund). The investment objective of the Fund is total return, consisting of capital appreciation and current income. The Fund is a diversified fund.
The Fund offers Investor Class and Institutional Class shares. Prior to October 26, 2012, the Investor Class shares were known as Original Class shares. Each class of shares differs principally in its respective administration, 12b-1 distribution and service fees, shareholder servicing, and transfer agent expenses and sales charges, if any. Each class has identical rights to earnings, assets, and voting privileges, except for class-specific expenses and exclusive rights to vote on matters affecting only an individual class.
2). SIGNIFICANT ACCOUNTING POLICIES
The following is a summary of significant accounting policies consistently followed by the Fund in the preparation of the financial statements. These policies are in conformity with U.S. generally accepted accounting principles (“GAAP”).
| a). | Investment Valuation – All investments in securities are recorded at their estimated fair value, as described in Note 3. |
| b). | Federal Income Taxes – Provision for federal income taxes or excise taxes has not been made since the Fund has elected to be taxed as a “regulated investment company” and intends to distribute substantially all of its taxable income to its shareholders and otherwise comply with the provisions of the Internal Revenue Code of 1986, as amended, applicable to regulated investment companies. Net investment income or loss and realized gains and losses for federal income tax purposes may differ from that reported on the financial statements because of temporary book and tax basis differences. Temporary differences are primarily the result of the treatment of wash sales for tax reporting purposes. Distributions from net realized gains for book purposes may include short-term capital gains, which are included as ordinary income to shareholders for tax purposes. |
| c). | Income and Expenses – Dividend income is recognized on the ex-dividend date or as soon as information is available to the Fund. Interest income, which includes the amortization of premium and accretion of discount, is recognized on an accrual basis. The Fund is charged for those expenses that are directly attributable to the portfolio, such as advisory, administration, and certain shareholder service fees. Income, |
| | expenses (other than expenses attributable to a specific class), and realized and unrealized gains or losses on investments are allocated to each class of shares based on its respective net assets. |
| d). | Distributions to Shareholders – Dividends from net investment income for the Fund, if any, are declared and paid out annually, usually in December. Distributions of net realized capital gains, if any, are declared and paid annually, usually in November or December. |
| e). | Security Transactions – Investment and shareholder transactions are recorded on the trade date. The Fund determines the gain or loss realized from the investment transactions by comparing the original cost of the security lot sold with the net sale proceeds. Discounts and premiums on securities purchased are accreted/amortized over the life of the respective security. |
| f). | Use of Estimates – The preparation of financial statements in conformity with GAAP requires management to make estimates and assumptions that affect the reported amounts of assets and liabilities and disclosure of contingent assets and liabilities at the date of the financial statements and the reported change in net assets during the reporting period. Actual results could differ from those estimates. |
| g). | Share Valuation – The net asset value (“NAV”) per share of the Fund is calculated by dividing the sum of the value of the securities held by the Fund, plus cash or other assets, minus all liabilities (including estimated accrued expenses) by the total number of shares outstanding for the Fund, rounded to the nearest cent. The Fund’s shares will not be priced on days the New York Stock Exchange is closed for trading. The offering and redemption price per share for the Fund is equal to the Fund’s NAV per share. |
| h). | Foreign Currency – Values of investments denominated in foreign currencies, if any, are converted into U.S. dollars using the spot market rate of exchange at the time of valuation. Purchases and sales of investments and income are translated into U.S. dollars using the spot market rate of exchange prevailing on the respective dates of such transactions. The Fund does not isolate the portion of the results of operations resulting from fluctuations in foreign exchange rates on investments from fluctuations resulting from changes in the market prices of securities held. Such fluctuations are included with the net realized and unrealized gain or loss on investments. Foreign investments present additional risks due to currency fluctuations, economic and political factors, lower liquidity, government regulations, differences in accounting standards, and other factors. |
| i). | Forward Contracts – The Fund may enter into forward currency contracts to reduce its exposure to changes in foreign currency exchange rates on its foreign holdings and to lock in the U.S. dollar cost of firm purchase and sale commitments for securities denominated in foreign currencies. A forward currency contract is a commitment to purchase or sell a foreign currency at a future date at a negotiated forward rate. The gain or loss arising from the difference between the U.S. dollar cost of the original contract and the value of the foreign currency in U.S. dollars upon closing of such contract is included in net realized gain or loss from foreign currency transactions. During the fiscal year ended October 31, 2014, the Fund did not enter into any forward contracts. |
| j). | Repurchase Agreements – The Fund may enter into repurchase agreements with member banks or security dealers of the Federal Reserve Board whom the investment advisor deems creditworthy. The repurchase price generally equals the price paid by the Fund plus interest negotiated on the basis of current short-term rates. |
HENNESSY FUNDS 1-800-966-4354
| | Securities pledged as collateral for repurchase agreements are held by the custodian bank until the respective agreements mature. Provisions of the repurchase agreements ensure that the market value of the collateral, including accrued interest thereon, is sufficient to cover the repurchase amount in the event of default of the counterparty. If the counterparty defaults and the value of the collateral declines or if the counterparty enters an insolvency proceeding, realization of the collateral by the Fund may be delayed or limited. |
| k). | Accounting for Uncertainty in Income Taxes – The Fund has adopted accounting policies regarding recognition and measurement of tax positions taken or expected to be taken on a tax return. The tax returns of the Fund for the prior three fiscal years are open for examination. The Fund has reviewed all open tax years in major jurisdictions and concluded that there is no impact on the Fund’s net assets and no tax liability resulting from unrecognized tax benefits relating to uncertain income tax positions taken or expected to be taken on a tax return. The Fund’s major tax jurisdictions are U.S. federal and Delaware. |
| l). | Derivatives – The Fund may invest in, or enter into, derivatives, such as options, futures contracts, options on futures contracts, and swaps, for a variety of reasons, including to hedge certain risks, to provide a substitute for purchasing or selling particular securities, or to increase potential income gain. Derivatives may provide a cheaper, quicker, or more specifically focused way for a Fund to invest than “traditional” securities would. The main purpose of utilizing these derivative instruments is for hedging purposes. |
| | The Fund has adopted the financial accounting reporting rules as required by the Derivatives and Hedging Topic of the Financial Accounting Standards Board Accounting Standards Codification. Under such rules, the Fund is required to include enhanced disclosure that enables investors to understand how and why an entity uses derivatives, how derivatives are accounted for, and how derivatives instruments affect an entity’s results of operations and financial position. During the fiscal year ended October 31, 2014, the Fund did not hold any derivative instruments. |
| m). | Events Subsequent to the Fiscal Period End – The Fund has adopted financial reporting rules regarding subsequent events that require an entity to recognize in the financial statements the effects of all subsequent events that provide additional evidence about conditions that existed at the date of the balance sheet. Management has evaluated the Fund’s related events and transactions that occurred subsequent to October 31, 2014 through the date of issuance of the Fund’s financial statements. There were no events or transactions that occurred during this period that materially impacted the amounts or disclosures in the Fund’s financial statements. |
3). SECURITIES VALUATION
The Fund has adopted authoritative fair valuation accounting standards that establish an authoritative definition of fair value and set out a hierarchy for measuring fair value. These standards require additional disclosures about the various inputs and valuation techniques used to develop the measurements of fair value and a discussion in changes in valuation techniques and related inputs during the period. These inputs are summarized in the three broad levels listed below:
| | Level 1 – | Quoted unadjusted prices for identical instruments in active markets to which the Fund has access at the date of measurement. |
| | Level 2 – | Quoted prices for similar instruments in active markets; quoted prices for identical or similar instruments in markets that are not active; and model- |
| | | derived valuations in which all significant inputs and significant value drivers are observable in active markets. Level 2 inputs are those in markets for which there are few transactions, the prices are not current, the prices are fair value adjusted due to post-market close subsequent events (foreign markets), little public information exists, or instances where prices vary substantially over time or among brokered market makers. These inputs may also include interest rates, prepayment speeds, credit risk curves, default rates, and similar data. |
| | Level 3 – | Model-derived valuations in which one or more significant inputs or significant value drivers are unobservable. Unobservable inputs are those inputs that reflect the Fund’s own assumptions about what market participants would use to price the asset or liability based on the best available information. |
Following is a description of the valuation techniques applied to the Fund’s major categories of assets and liabilities measured at fair value on a recurring basis.
Equity Securities – Equity securities, including common stocks, preferred stocks, foreign issued common stocks, exchange traded funds, closed-end mutual funds, and real estate investment trusts, that are traded on a securities exchange for which a last-quoted sales price is readily available will generally be valued at the last sales price as reported by the primary exchange on which the securities are listed. Securities listed on The NASDAQ Stock Market (“NASDAQ”) will be valued at the NASDAQ Official Closing Price, which may differ from the last sales price reported. Securities traded on a securities exchange for which a last-quoted sales price is not readily available will generally be valued at the mean between the bid and ask prices. To the extent these securities are actively traded and valuation adjustments are not applied, they are classified in Level 1 of the fair value hierarchy.
Investment Companies – Investments in investment companies (e.g., mutual funds and exchange traded funds) are generally priced at the ending NAV provided by the Fund’s service agent and will be classified in Level 1 of the fair value hierarchy.
Debt Securities – Debt securities, including corporate bonds, asset-backed securities, mortgage-backed securities, municipal bonds, U.S. Treasuries, and U.S. government agency issues, are valued at market on the basis of valuations furnished by an independent pricing service that utilizes both dealer-supplied valuations and formula-based techniques. The pricing service may consider recently executed transactions in securities of the issuer or comparable issuers, market price quotations (where observable), bond spreads, and fundamental data relating to the issuer. In addition, the model may incorporate market observable data such as reported sales of similar securities, broker quotes, yields, bids, offers, and reference data. Certain securities are valued principally using dealer quotations. These securities are generally classified in Level 2 of the fair value hierarchy.
Short-Term Securities – Short-term equity investments, including money market funds, are valued in the manner specified above. Short-term debt investments are generally valued at amortized cost, which approximates fair market value, if their original maturity was 60 days or less, or by amortizing the values as of the 61st day prior to maturity, if their original term to maturity exceeded 60 days. Amortized cost is not used if its use would be inappropriate due to credit or other impairments of the issuer, in which the security would be fair valued, as described below. Short-term securities are generally classified in Level 1 or Level 2 of the fair market hierarchy depending on the inputs used and market activity levels for specific securities.
HENNESSY FUNDS 1-800-966-4354
The Board of Trustees of the Fund (the “Board”) has adopted fair value pricing procedures that are followed when a price for a security is not readily available or if a significant event has occurred that indicates the closing price of a security no longer represents the true value of that security. Fair value pricing determinations are made in good faith in accordance with these procedures. There are numerous criteria that will be given consideration in determining a fair value of a security. Some of these criteria are trading volume of security and markets, the value of other like securities, and news events with direct bearing to security or market. Fair value pricing results in an estimated price for a security that reflects the amount the Fund might reasonably expect to receive in a current sale. Depending on the relative significance of the valuation inputs, these securities may be classified in either Level 2 or Level 3 of the fair value hierarchy.
Fair valuing of foreign securities may be determined with the assistance of a pricing service using correlations between the movement of prices of such securities and indices of domestic securities and other appropriate indicators, such as closing market prices of relevant American Depositary Receipts or futures contracts. The effect of using fair value pricing is that the Fund’s NAV will reflect the affected portfolio securities’ value as determined in the judgment of the Board or its designee instead of being determined by the market. Using a fair value pricing methodology to price foreign securities may result in a value that is different from a foreign security’s most recent closing price and from the prices used by other investment companies to calculate their net asset values and are generally considered Level 2 prices in the fair valuation hierarchy. Because the Fund may invest in foreign securities, the value of the Fund’s portfolio securities may change on days when you will not be able to purchase or redeem your shares.
The Board has delegated day-to-day valuation matters to a Valuation Committee comprised of one or more representatives from Hennessy Advisors, Inc., the Fund’s investment advisor. The function of the Valuation Committee is to value securities where current and reliable market quotations are not readily available. All actions taken by the Valuation Committee are reviewed by the Board.
The Fund has performed an analysis of all existing investments to determine the significance and character of all inputs to their fair value determination. Various inputs are used in determining the value of the Fund’s investments. The inputs or methodology used for valuing securities are not necessarily an indication of the risk associated with investing in those securities. Details related to the fair valuation hierarchy of the Fund’s securities as of October 31, 2014 are included in the Fund’s Schedule of Investments.
4). INVESTMENT TRANSACTIONS
Purchases and sales of investment securities (excluding government and short-term investments) for the Fund during the fiscal year ended October 31, 2014 were $49,495,336 and $50,796,999, respectively.
There were no purchases or sales/maturities of long-term U.S. Government Securities for the Fund during the fiscal year ended October 31, 2014.
5). INVESTMENT MANAGEMENT FEE AND OTHER TRANSACTIONS WITH AFFILIATES
Hennessy Advisors, Inc. (the “Advisor”) is the investment advisor of the Fund. The Advisor provides the Fund with investment management services under an Investment Advisory Agreement. The Advisor furnishes all investment advice, office space, facilities, and provides most of the personnel needed by the Fund. As compensation for its services, the Advisor is entitled to a monthly fee from the Fund. The fee is based upon the average daily net assets of the Fund at the annual rate of 0.74%. The net investment advisory fees payable for the Fund as of October 31, 2014 were $95,254.
The Advisor has agreed to waive its fees and absorb expenses to the extent that the total annual operating expenses (excluding all Federal, state and local taxes, interest, brokerage commissions, acquired fund fees and expenses and other costs incurred in connection with the purchase and sale of securities and extraordinary items) exceed 0.98% of the Fund’s net assets for the Institutional Class shares of the Fund. The expense limitation agreement for the Institutional Class shares can only be terminated by the Board.
For a period of three years after the year in which the Advisor waives or reimburses expenses, the Advisor may seek reimbursement from the Fund to the extent that total annual fund operating expenses are less than the expense limitation in effect at the time of the reimbursement. During the three years ended October 31, 2014, no Advisor fees were waived and therefore no expenses are subject to potential recovery.
The Board has approved a Shareholder Servicing Agreement for the Investor Class shares of the Fund, which was instituted to compensate the Advisor for the non-investment management services it provides to the Fund. The Shareholder Servicing Agreement provides for a monthly fee paid to the Advisor at an annual rate of 0.10% of the average daily net assets of the Fund attributable to Investor Class shares. Shareholder service fees payable for the Fund as of October 31, 2014 were $11,988.
The Fund has entered into agreements with various brokers, dealers, and financial intermediaries in connection with the sale of shares of the Fund. The agreements provide for periodic payments by the Fund to the brokers, dealers, and financial intermediaries for providing certain shareholder maintenance services (sub-transfer agent expenses). These shareholder services include the pre-processing and quality control of new accounts, shareholder correspondence, answering customer inquiries regarding account status, and facilitating shareholder telephone transactions. Fees paid by the Fund to various brokers, dealers, and financial intermediaries for the fiscal year ended October 31, 2014 were $97,788.
U.S. Bancorp Fund Services, LLC (“USBFS”) provides the Fund with administrative, fund accounting, and transfer agent services, including all regulatory reporting, and necessary office equipment and personnel. As administrator, USBFS prepares various federal and state regulatory filings, reports, and returns for the Fund; prepares reports and materials to be supplied to the Board; monitors the activities of the Fund’s custodian, transfer agent, and accountants; and coordinates the preparation and payment of the Fund’s expenses and reviews the Fund’s expense accruals. Fees paid to USBFS for the fiscal year ended October 31, 2014 were $268,226.
USBFS has voluntarily waived all or a portion of its fees allocated to the Institutional Class shares of the Fund. The administration fees voluntarily waived by USBFS during the fiscal year ended October 31, 2014 were $4,237.
U.S. Bank, N.A., an affiliate of USBFS, serves as the Fund’s custodian. Quasar Distributors, LLC acts as the Fund’s principal underwriter in a continuous public offering of the Fund’s shares. Quasar Distributors, LLC is an affiliate of USBFS and U.S. Bank, N.A.
6). LINE OF CREDIT
The Fund has a line of credit with the other funds in the Hennessy Funds family of funds (the “Hennessy Funds”) in the amount of the lesser of (i) $100,000,000 or (ii) 33.33% of each Hennessy Fund’s net assets, or 30% for the Hennessy Gas Utility Index Fund and 10% for the Hennessy Balanced Fund, intended to provide short-term financing, if necessary, subject to certain restrictions, in connection with shareholder redemptions. The credit facility is with the Hennessy Funds’ custodian bank, U.S. Bank, N.A. Borrowings under this arrangement bear interest at the bank’s prime rate. During the fiscal year ended
HENNESSY FUNDS 1-800-966-4354
October 31, 2014, the Fund had an outstanding average daily balance and a weighted average interest rate of $13,707 and 3.25%, respectively. The maximum amount outstanding for the Fund during the period was $1,759,000. At October 31, 2014, the Fund had a loan payable balance of $0.
7). FEDERAL TAX INFORMATION
As of October 31, 2014, the components of accumulated earnings (losses) for income tax purposes were as follow:
| | Cost of investments for tax purposes | | $ | 118,984,864 | |
| | Gross tax unrealized appreciation | | $ | 38,089,071 | |
| | Gross tax unrealized depreciation | | | (1,595,036 | ) |
| | Net tax unrealized appreciation | | $ | 36,494,035 | |
| | Undistributed ordinary income | | $ | 2,764,012 | |
| | Undistributed long-term capital gains | | | — | |
| | Total distributable earnings | | $ | 2,764,012 | |
| | Other accumulated loss | | $ | (23,407,097 | ) |
| | Total accumulated gain | | $ | 15,850,950 | |
The difference between book-basis and tax-basis unrealized appreciation is attributable primarily to wash sales.
At October 31, 2014, the Fund had capital loss carryforwards of $23,407,097 that expire on October 31, 2017.
During the year ended October 31, 2014, the capital loss carry forwards utilized for the Fund were $8,659,648.
Capital losses sustained in the year ended October 31, 2012 and in future taxable years will not expire and may be carried over by the Fund without limitation; however, they will retain the character of the original loss. Furthermore, any loss incurred during those taxable years will be required to be utilized prior to the losses incurred in taxable years prior to 2012. As a result of this ordering rule, pre-enactment capital loss carryforwards may be more likely to expire unused. Under pre-enactment law, capital losses could be carried forward for eight years, and carried forward as short-term capital losses, irrespective of the character of the original loss.
At October 31, 2014, the Fund did not defer, on a tax basis, any post-December late year ordinary loss deferrals.
The tax character of distributions paid during fiscal year 2014 and fiscal year 2013 for the Fund were as follow:
| | | | Year Ended | | | Year Ended | |
| | | | October 31, 2014 | | | October 31, 2013 | |
| | Ordinary income | | $ | 3,600,698 | | | $ | 3,339,992 | |
| | Long-term capital gain | | | — | | | | — | |
| | | | $ | 3,600,698 | | | $ | 3,339,992 | |
8). AGREEMENT AND PLAN OF REORGANIZATION
On December 11, 2013, the Board approved an Agreement and Plan of Reorganization (the “Agreement”), of the Hennessy Cornerstone Value Fund (the “New Fund”), pursuant to which the New Fund would be a successor to the corresponding series of the same name of Hennessy Mutual Funds, Inc., a Maryland corporation (the “Predecessor Fund”). The Agreement provided for the transfer of assets of the Predecessor Fund to the New Fund and the assumption of the liabilities of the Predecessor Fund by the New Fund. The
New Fund had the same investment objective and substantially similar principal investment strategies as the Predecessor Fund. The reorganization was effective as of the close of business on February 28, 2014. The following table illustrates the specifics of the reorganization:
| | Shares of the New Fund | | | |
| Predecessor Fund | Issued to Shareholders of | New Fund | Combined | Tax Status |
| Net Assets | the Predecessor Fund | Net Assets | Net Assets | of Transfer |
$143,051,399(1) | 8,349,070 | $143,051,399 | $143,051,399 | Non-taxable |
| | (1) | Included accumulated realized losses and unrealized appreciation in the amounts of $(23,524,673) and $28,156,692, respectively. |
HENNESSY FUNDS 1-800-966-4354
Report of Independent Registered Public Accounting Firm
The Board of Trustees and Shareholders
Hennessy Funds Trust:
We have audited the accompanying statement of assets and liabilities of Hennessy Cornerstone Value Fund (the Fund), a series of Hennessy Funds Trust (formerly a series of Hennessy Mutual Funds, Inc.), including the schedule of investments, as of October 31, 2014, and the related statement of operations for the year then ended, the statements of changes in net assets for each of the years in the two-year period then ended, and the financial highlights for each of the years in the five-year period then ended. These financial statements and financial highlights are the responsibility of the Fund’s management. Our responsibility is to express an opinion on these financial statements and financial highlights based on our audits.
We conducted our audits in accordance with the standards of the Public Company Accounting Oversight Board (United States). Those standards require that we plan and perform the audit to obtain reasonable assurance about whether the financial statements and financial highlights are free of material misstatement. An audit includes examining, on a test basis, evidence supporting the amounts and disclosures in the financial statements. Our procedures included confirmation of investments owned as of October 31, 2014, by correspondence with the custodian and brokers or by other appropriate auditing procedures. An audit also includes assessing the accounting principles used and significant estimates made by management, as well as evaluating the overall financial statement presentation. We believe that our audits provide a reasonable basis for our opinion.
In our opinion, the financial statements and financial highlights referred to above present fairly, in all material respects, the financial position of the Fund as of October 31, 2014, and the results of its operations for the year then ended, the changes in its net assets for each of the years in the two-year period then ended, and the financial highlights for each of the years in the five-year period then ended, in conformity with U.S. generally accepted accounting principles.
Milwaukee, Wisconsin
December 30, 2014
Trustees and Officers of the Fund (Unaudited)
The business and affairs of the Fund are managed under the direction of the Fund’s Board of Trustees. Information pertaining to the Trustees and Officers of the Fund is set forth below. The Fund’s Statement of Additional Information includes additional information about the Fund’s Trustees and Officers and is available, without charge, upon request by calling 1-800-966-4354.
| | | | | Number of | |
| | | Term of | | Portfolios | |
| | | Office | | in the | Other |
| | | and | | Fund | Directorships |
| | Position(s) | Length | Principal | Complex | (During Past |
| Name, Address, | Held with | of Time | Occupation(s) | Overseen | Five Years)(2) |
| and Age | the Fund | Served | During Past Five Years | by Trustee | Held by Trustee |
| | | |
| Disinterested Trustees (as defined below) | | |
| | | | | | |
| J. Dennis DeSousa | Trustee | Indefinite, | Mr. DeSousa is a real | 16 | Hennessy SPARX |
| Age: 78 | | until | estate investor. | | Funds Trust; |
| Address: | | successor | | | Hennessy Mutual |
| c/o Hennessy | | elected | | | Funds, Inc.; and |
| Advisors, Inc. | | | | | The Hennessy |
| 7250 Redwood Blvd. | | Served | | | Funds, Inc. |
| Suite 200 | | since | | | |
| Novato, CA 94945 | | January | | | |
| | | 1996 | | | |
| | | for the | | | |
| | | Funds (or | | | |
| | | Predecessor | | | |
| | | Funds) | | | |
| | | | | | |
| Robert T. Doyle | Trustee | Indefinite, | Mr. Doyle has been the | 16 | Hennessy SPARX |
| Age: 67 | | until | Sheriff of Marin County, | | Funds Trust; |
| Address: | | successor | California since 1996. | | Hennessy Mutual |
| c/o Hennessy | | elected | | | Funds, Inc.; and |
| Advisors, Inc. | | | | | The Hennessy |
| 7250 Redwood Blvd. | | Served | | | Funds, Inc. |
| Suite 200 | | since | | | |
| Novato, CA 94945 | | January | | | |
| | | 1996 | | | |
| | | for the | | | |
| | | Funds (or | | | |
| | | Predecessor | | | |
| | | Funds) | | | |
| | | | | | |
| Gerald P. Richardson | Trustee | Indefinite, | Mr. Richardson is an | 16 | Hennessy SPARX |
| Age: 69 | | until | independent consultant | | Funds Trust; |
| Address: | | successor | in the securities industry. | | Hennessy Mutual |
| c/o Hennessy | | elected | | | Funds, Inc.; and |
| Advisors, Inc. | | | | | The Hennessy |
| 7250 Redwood Blvd. | | Served | | | Funds, Inc. |
| Suite 200 | | since | | | |
| Novato, CA 94945 | | May 2004 | | | |
| | | for the | | | |
| | | Funds (or | | | |
| | | Predecessor | | | |
| | | Funds) | | | |
HENNESSY FUNDS 1-800-966-4354
| | | | | Number of | |
| | | Term of | | Portfolios | |
| | | Office | | in the | Other |
| | | and | | Fund | Directorships |
| | Position(s) | Length | Principal | Complex | (During Past |
| Name, Address, | Held with | of Time | Occupation(s) | Overseen | Five Years)(2) |
| and Age | the Fund | Served | During Past Five Years | by Trustee | Held by Trustee |
| | | |
| “Interested Persons” (as defined in the 1940 Act) | | |
| | | | | | |
Neil J. Hennessy(1) | Chief | Trustee: | Mr. Hennessy has been | 16 | Hennessy |
| Age: 58 | Investment | Indefinite, | employed by Hennessy | | Advisors, Inc. |
| Address: | Officer, | until | Advisors, Inc., the Funds’ | | (current); |
| c/o Hennessy | Portfolio | successor | investment advisor, since | | Hennessy SPARX |
| Advisors, Inc. | Manager, | elected | 1989. He currently serves | | Funds Trust; |
| 7250 Redwood Blvd. | President, | | as President, Chairman | | Hennessy Mutual |
| Suite 200 | Trustee | Served | and CEO of Hennessy | | Funds, Inc.; and |
| Novato, CA 94945 | and | since | Advisors, Inc. | | The Hennessy |
| | Chairman | January | | | Funds, Inc. |
| | of the | 1996 | | | |
| | Board | for the | | | |
| | | Funds (or | | | |
| | | Predecessor | | | |
| | | Funds) | | | |
| | | | | | |
| | | Officer: | | | |
| | | 1 year term | | | |
| | | | | | |
| | | Served | | | |
| | | since | | | |
| | | June 2008 | | | |
| | | for the | | | |
| | | Funds (or | | | |
| | | Predecessor | | | |
| | | Funds) | | | |
| | | | | | |
Teresa M. Nilsen(1) | Executive | 1 year term | Ms. Nilsen has been | N/A | N/A |
| Age: 48 | Vice | | employed by Hennessy | | |
| Address: | President | Served | Advisors, Inc., the Funds’ | | |
| c/o Hennessy | and | since | investment advisor, since | | |
| Advisors, Inc. | Treasurer | January | 1989. She currently serves | | |
| 7250 Redwood Blvd. | | 1996 | as Executive Vice President, | | |
| Suite 200 | | for the | Chief Operations Officer, | | |
| Novato, CA 94945 | | Funds (or | Chief Financial Officer, and | | |
| | | Predecessor | Secretary of Hennessy | | |
| | | Funds) | Advisors, Inc. | | |
| (1) | All Officers of the Hennessy Funds and employees of the Manager are Interested Persons of the Funds. |
| (2) | Pursuant to an internal reorganization, the series of Hennessy Mutual Funds, Inc. (“HMFI”), The Hennessy Funds, Inc. (“HFI”) and Hennessy SPARX Funds Trust (“HSFT”) were reorganized into series of Hennessy Funds Trust on February 28, 2014, which mirrored the corresponding series of HFMI, HFI and HSFT. Subsequent to the reorganization, HFMI, HFI and HSFT were dissolved. |
| | | Term of | |
| | | Office | |
| | | and | |
| | Position(s) | Length | Principal |
| Name, Address, | Held with | of Time | Occupation(s) |
| and Age | the Fund | Served | During Past Five Years |
| | | | |
| Interested Persons | | | |
| | | | |
Daniel B. Steadman(1) | Executive | 1 year term | Mr. Steadman has been employed by |
| Age: 58 | Vice President | | Hennessy Advisors, Inc., the Funds’ |
| Address: | and Secretary | Served since | investment advisor, since 2000. |
| c/o Hennessy Advisors, Inc. | | March 2000 | He currently serves as Executive |
| 7250 Redwood Blvd. | | for the Funds (or | Vice President and Chief Compliance |
| Suite 200 | | Predecessor Funds) | Officer of Hennessy Advisors, Inc. |
| Novato, CA 94945 | | | |
| | | | |
Jennifer Cheskiewicz(1) | Senior | 1 year term | Ms. Cheskiewicz has been employed by |
| Age: 37 | Vice President | | Hennessy Advisors, Inc., the Funds’ |
| Address: | and Chief | Served since | investment advisor, since June 2013. |
| c/o Hennessy Advisors, Inc. | Compliance | June 2013 | She previously served as in-house |
| 7250 Redwood Blvd. | Officer | for the Funds (or | counsel to Carlson Capital, L.P., an |
| Suite 200 | | Predecessor Funds) | SEC-registered investment advisor to |
| Novato, CA 94945 | | | several private funds from February |
| | | | 2010 to May 2013. Prior to that, she |
| | | | was an attorney with Gibson, Dunn & |
| | | | Crutcher LLP from September 2005 |
| | | | through February 2010. She currently |
| | | | serves as General Counsel of |
| | | | Hennessy Advisors, Inc. |
| | | | |
Brian Carlson(1) | Senior | 1 year term | Mr. Carlson has been employed by |
| Age: 42 | Vice President | | Hennessy Advisors, Inc., the Funds’ |
| Address: | and Head of | Served since | investment advisor, since |
| c/o Hennessy Advisors, Inc. | Distribution | December 2013 | December 2013. |
| 7250 Redwood Blvd. | | for the Funds (or | |
| Suite 200 | | Predecessor Funds) | Mr. Carlson was previously a |
| Novato, CA 94945 | | | co-founder and principal of Trivium |
| | | | Consultants, LLC from February 2011 |
| | | | through November 2013. Prior to that, |
| | | | he was the Senior Managing Director |
| | | | of NRP Financial, Inc. from August |
| | | | 2007 through February 2011. |
| | | | |
David Ellison(1) | Portfolio Manager | 1 year term | Mr. Ellison has served as Portfolio |
| Age: 56 | and Senior | | Manager of the Large Cap Financial |
| Address: | Vice President | Served since | Fund, the Small Cap Financial Fund, |
| c/o Hennessy Advisors, Inc. | | October 2012 | and the Technology Fund |
| 101 Federal Street | | for the Funds (or | since inception. |
| Suite 1900 | | Predecessor Funds) | |
| Boston, MA 02110 | | | Mr. Ellison previously served as Director, |
| | | | CIO and President of FBR Advisers, Inc. |
| | | | from December 1999 to October 2012. |
(1) All Officers of the Hennessy Funds and employees of the Manager are Interested Persons of the Funds.
HENNESSY FUNDS 1-800-966-4354
| | | Term of | |
| | | Office | |
| | | and | |
| | Position(s) | Length | Principal |
| Name, Address, | Held with | of Time | Occupation(s) |
| and Age | the Fund | Served | During Past Five Years |
| | | | |
| Interested Persons | | | |
| | | | |
Brian Peery(1) | Portfolio Manager | 1 year term | Mr. Peery has been a Portfolio Manager |
| Age: 45 | and | | of the Cornerstone Growth Fund, |
| Address: | Vice President | Served since | the Cornerstone Mid Cap 30 Fund, the |
| c/o Hennessy Advisors, Inc. | | March 2003 | Cornerstone Large Growth Fund, the |
| 7250 Redwood Blvd. | | as Vice President | Cornerstone Value Fund, the Total |
| Suite 200 | | for the Funds (or | Return Fund, and the Balanced Fund |
| Novato, CA 94945 | | Predecessor Funds) | since October 2014. From February |
| | | | 2011 through September 2014, he |
| | | Served since | served as Co-Portfolio Manager of |
| | | February 2011 | the same funds. |
| | | as Co-Portfolio | |
| | | Manager | Mr. Peery has been employed by |
| | | for the Funds (or | Hennessy Advisors, Inc., the Funds’ |
| | | Predecessor Funds) | investment advisor, since 2002. |
| | | | |
Winsor (Skip) Aylesworth(1) | Portfolio Manager | 1 year term | Mr. Aylesworth has been Portfolio |
| Age: 67 | and | | Manager of the Gas Utility Index Fund |
| Address: | Vice President | Served since | since 1998 and Portfolio Manager of |
| c/o Hennessy Advisors, Inc. | | October 2012 | the Technology Fund since inception. |
| 101 Federal Street | | for the Funds (or | |
| Suite 1900 | | Predecessor Funds) | Mr. Aylesworth previously served as |
| Boston, MA 02110 | | | Executive Vice President of The FBR |
| | | | Funds from 1999 to October 2012. |
| | | | |
Ryan Kelley(1) | Portfolio Manager | 1 year term | Mr. Kelley has been a Portfolio Manager |
| Age: 42 | and | | of the Gas Utility Index Fund (formerly |
| Address: | Vice President | Served since | the FBR Gas Utility Index Fund), the |
| c/o Hennessy Advisors, Inc. | | March 2013 | Small Cap Financial Fund (formerly the |
| 1340 Environ Way | | for the Funds (or | FBR Small Cap Financial Fund), and the |
| Chapel Hill, NC 27517 | | Predecessor Funds) | Large Cap Financial Fund (formerly the |
| | | | FBR Large Cap Financial Fund) since |
| | | | October 2014. From March 2013 |
| | | | through September 2014, he served |
| | | | as a Co-Portfolio Manager of the same |
| | | | funds. Prior to that, he was a Portfolio |
| | | | Analyst of the Hennessy Funds. |
| | | | |
| | | | Mr. Kelley previously served as Portfolio |
| | | | Manager of The FBR Funds from |
| | | | January 2008 to October 2012. |
(1) All Officers of the Hennessy Funds and employees of the Manager are Interested Persons of the Funds.
(This Page Intentionally Left Blank.)
HENNESSY FUNDS 1-800-966-4354
Expense Example (Unaudited)
October 31, 2014
As a shareholder of the Fund, you incur two types of costs: (1) transaction costs, including sales charges (loads) on purchase payments, reinvested dividends, or other distributions; redemption fees; and exchange fees; and (2) ongoing costs, including management fees; service fees; and other Fund expenses. This Example is intended to help you understand your ongoing costs (in dollars) of investing in the Fund and to compare these costs with the ongoing costs of investing in other mutual funds. The Example is based on an investment of $1,000 invested at the beginning of the period and held for the entire period from May 1, 2014 through October 31, 2014.
Actual Expenses
The first line of the table below under the “Investor Class” and “Institutional Class” headings provides information about actual account values and actual expenses. Although the Fund charges no sales loads or transaction fees, you will be assessed fees for outgoing wire transfers, returned checks and stop payment orders at prevailing rates charged by U.S. Bancorp Fund Services, LLC, the Fund’s transfer agent. If you request that a redemption be made by wire transfer, currently a $15.00 fee is charged by the Fund’s transfer agent. IRA accounts will be charged a $15.00 annual maintenance fee. The example below includes, but is not limited to, management fees, shareholder servicing fees, fund accounting, custody, and transfer agent fees. However, the example below does not include portfolio trading commissions and related expenses, and other extraordinary expenses as determined under generally accepted accounting principles. You may use the information in this line, together with the amount you invested, to estimate the expenses that you paid over the period. Simply divide your account value by $1,000 (for example, an $8,600 account value divided by $1,000 = 8.6), then multiply the result by the number in the first line of the table under the “Investor Class” and “Institutional Class” headings in the column entitled “Expenses Paid During Period” to estimate the expenses you paid on your account during this period.
Hypothetical Example for Comparison Purposes
The second line of the table below under the “Investor Class” and “Institutional Class” headings provides information about hypothetical account values and hypothetical expenses based on the Fund’s actual expense ratios and an assumed rate of return of 5% per year before expenses, which is not the Fund’s actual return. The hypothetical account values and expenses may not be used to estimate the actual ending account balance or expenses you paid for the period. You may use this information to compare the ongoing costs of investing in the Fund and other funds. To do so, compare this 5% hypothetical example with the 5% hypothetical examples that appear in the shareholder reports of the other funds. Please note that the expenses shown in the table are meant to highlight your ongoing costs only and do not reflect any transactional costs, such as sales charges (loads), or exchange fees. Therefore, the second line of the table under the “Investor Class” and “Institutional Class” headings is useful in comparing ongoing costs only, and will not help you determine the relative total costs of owning different funds. In addition, if these transactional costs were included, your costs would have been higher.
| | Beginning | Ending | Expenses Paid |
| | Account Value | Account Value | During Period(1) |
| | 5/1/14 | 10/31/14 | 5/1/14 – 10/31/14 |
| Investor Class | | | |
| | | | |
| Actual | $1,000.00 | $1,030.20 | $5.78 |
| | | | |
| Hypothetical (5% return | | | |
| before expenses) | $1,000.00 | $1,019.51 | $5.75 |
| | | | |
| Institutional Class | | | |
| | | | |
| Actual | $1,000.00 | $1,030.80 | $5.02 |
| | | | |
| Hypothetical (5% return | | | |
| before expenses) | $1,000.00 | $1,020.27 | $4.99 |
| (1) | Expenses are equal to the Fund's expense ratio of 1.13% for Investor Class shares or 0.98% for Institutional Class shares, as applicable, multiplied by the average account value over the period, multiplied by 184/365 days (to reflect one-half year period). |
HENNESSY FUNDS 1-800-966-4354
Proxy Voting
A description of the policies and procedures the Fund uses to determine how to vote proxies relating to portfolio securities is available without charge: (1) by calling 1-800-966-4354; (2) on the Hennessy Funds’ website at hennessyfunds.com; or (3) on the U.S. Securities and Exchange Commission’s (the “SEC”) website at www.sec.gov. The Fund’s proxy voting record is available on both the Hennessy Funds’ website at hennessyfunds.com and the SEC’s website at www.sec.gov no later than August 31 for the prior 12 months ending June 30.
Quarterly Filings on Form N-Q
The Fund files its complete schedule of portfolio holdings with the SEC for the first and third quarters of each fiscal year on Form N-Q. The Fund’s Forms N-Q will be available on the SEC’s website at www.sec.gov. The Fund’s Forms N-Q may be reviewed and copied at the SEC’s Public Reference Room in Washington, DC and information on the operation of the Public Reference Room may be obtained by calling 1-800-SEC-0330. Information included in the Fund’s Forms N-Q will also be available upon request by calling 1-800-966-4354.
Federal Tax Distribution Information
(Unaudited)
For the fiscal year ended October 31, 2014, certain dividends paid by the Fund may be subject to a maximum tax rate of 20%, as provided for by the Jobs and Growth Tax Relief Reconciliation Act of 2003. The percentage of dividends declared from ordinary income designated as qualified dividend income was 100.00%.
For corporate shareholders, the percent of ordinary income distributions qualifying for the corporate dividends received deduction for the fiscal year ended October 31, 2014 was 100.00%.
The percentage of taxable ordinary income distributions that are designated as short-term capital gain distributions under Section 871(k)(2)(C) of the Internal Revenue Code of 1986, as amended, for the Fund was 0.00%.
Householding
To help keep the Fund’s costs as low as possible, we generally deliver a single copy of most financial reports and prospectuses to shareholders who share an address, even if the accounts are registered under different names. This process, known as “householding,” does not apply to account statements. You may, of course, request an individual copy of a prospectus or financial report at any time. If you would like to receive separate mailings, please call the Administrator at 1-800-261-6950 or 1-414-765-4124 and we will begin individual delivery within 30 days of your request. If your account is held through a financial institution or other intermediary, please contact them directly to request individual delivery.
Privacy Policy
We collect the following non-public personal information about you:
• information we receive from you on or in applications or other forms, correspondence, or conversations, including, but not limited to, your name, address, phone number, social security number, assets, income and date of birth;
and
• information about your transactions with us, our affiliates, or others, including, but not limited to, your account number and balance, payment history, parties to transactions, cost basis information and other financial information.
We do not disclose any non-public personal information about our current or former shareholders to nonaffiliated third parties, except as permitted by law. For example, we are permitted by law to disclose all of the information we collect, as described above, to our Transfer Agent to process your transactions. Furthermore, we restrict access to your non-public personal information to those persons who require such information to provide products or services to you. We maintain physical, electronic and procedural safeguards that comply with federal standards to guard your non-public personal information.
In the event that you hold shares of the Fund through a financial intermediary, including, but not limited to, a broker-dealer, bank or trust company, the privacy policy of your financial intermediary would govern how your non-public personal information would be shared with nonaffiliated third parties.
HENNESSY FUNDS 1-800-966-4354
(This Page Intentionally Left Blank.)
(This Page Intentionally Left Blank.)
For information, questions or assistance, please call
The Hennessy Funds
1-800-966-4354 or 1-415-899-1555
INVESTMENT ADVISOR
Hennessy Advisors, Inc.
7250 Redwood Blvd., Suite 200
Novato, California 94945
ADMINISTRATOR,
TRANSFER AGENT,
DIVIDEND PAYING AGENT &
SHAREHOLDER SERVICING AGENT
U.S. Bancorp Fund Services, LLC
P.O. Box 701
Milwaukee, Wisconsin 53201-0701
CUSTODIAN
U.S. Bank N.A.
Custody Operations
1555 North River Center Dr., Suite 302
Milwaukee, Wisconsin 53212
TRUSTEES
Neil J. Hennessy
Robert T. Doyle
J. Dennis DeSousa
Gerald P. Richardson
COUNSEL
Foley & Lardner LLP
777 East Wisconsin Avenue
Milwaukee, Wisconsin 53202-5306
INDEPENDENT REGISTERED
PUBLIC ACCOUNTING FIRM
KPMG LLP
777 East Wisconsin Avenue
Milwaukee, Wisconsin 53202-5306
DISTRIBUTOR
Quasar Distributors, LLC
615 East Michigan Street
Milwaukee, Wisconsin 53202
hennessyfunds.com | 1-800-966-4354
This report has been prepared for shareholders and may be distributed to
others only if preceded or accompanied by a current prospectus.
ANNUAL REPORT
OCTOBER 31, 2014
HENNESSY LARGE VALUE FUND
Investor Class HLVFX
Institutional Class HLVIX
hennessyfunds.com | 1-800-966-4354
(This Page Intentionally Left Blank.)
Contents
| Letter to Shareholders | | 2 |
| Performance Overview | | 4 |
| Financial Statements | | |
| Schedule of Investments | | 8 |
| Statement of Assets and Liabilities | | 14 |
| Statement of Operations | | 15 |
| Statements of Changes in Net Assets | | 17 |
| Financial Highlights | | 18 |
| Notes to the Financial Statements | | 22 |
| Report of Independent Registered Public Accounting Firm | | 29 |
| Trustees and Officers of the Fund | | 30 |
| Expense Example | | 34 |
| Proxy Voting | | 36 |
| Quarterly Filings on Form N-Q | | 36 |
| Federal Tax Distribution Information | | 36 |
| Householding | | 36 |
| Privacy Policy | | 37 |
HENNESSY FUNDS 1-800-966-4354
December 2014
Dear Shareholder:
As I look back at 2014, I realize that in this age of rapidly evolving technology, information is delivered and absorbed so quickly that it is difficult to remember what happened last week, let alone what’s happened over the course of an entire year. That is why I’d like to take a moment to recall some of the year’s highs and lows, economically, politically and socially, here in the U.S. and around the globe. 2014 was scarred by political partisanship, civil unrest in the U.S., Ukraine and many other countries, the arrival of terrorist group ISIS, the tragedies of school shootings and natural disasters, and the frightening outbreak of Ebola. However, there were also positive events this year: we survived a government shutdown over healthcare reform, jobs reports have been consistently, albeit anemically, improving, and home prices remained relatively stable, after recovering significantly in 2013. And, important to us here at Hennessy, our hometown team, the San Francisco Giants, won their third World Series in just five years!
A significant event for the financial industry this past year was the confirmation of Janet Yellen as Chair of the Federal Reserve, which served to calm the nerves of business and political leaders alike. I believe Yellen’s leadership will benefit U.S. business owners, as the Fed continues to be a voice of reason in a sea of political and economic rhetoric. The Fed has also supported the economy and corporate America by helping keep interest rates reasonable and low.
The stock market has continued its determined comeback from the lows of 2009, setting multiple record highs in recent months. The U.S. financial markets have provided strong returns over the past twelve-month period ended October 31, 2014, with the Dow Jones Industrial Average (DJIA) returning over 14% and S&P 500 Index returning over 17% during the period. The DJIA currently has a dividend yield of 2.2%, which is equal to that of a 10-Year U.S. Treasury, which is currently also yielding 2.2%. I continue to believe that investments in high-yielding, high-quality stocks have the potential to not only provide income but also the potential for stock price appreciation as well. Fixed income investing has run its course, in my opinion, and many individuals are currently benefiting from the return to investing in equities that possess strong fundamentals. American investors are slowly migrating from fixed income to equities. Currently, 54% of Americans invest in stocks, and I do expect this percentage to increase, especially if interest rates move higher.
For the past several years, U.S. corporations have been driving shareholder value by making acquisitions, initiating and raising dividends, investing in internal infrastructure and buying back stock. However, this year I began to see a shift from those strategies. I believe the easier to execute acquisitions are a thing of the past, and firms now have to be even more creative to execute accretive deals. I also believe that while firms may continue to initiate dividends, fewer firms will raise their dividends and fewer firms will participate in stock buyback programs going forward. What will these cash-rich companies do with their capital if they are not raising dividends or buying back stock? I believe they may begin to initiate capital expenditure programs that could truly benefit economic growth.
Liquidity and monetary conditions are supportive, causing the cost of capital to be very low. I believe firms will choose to spend capital to expand their sales, and they may even begin to hire in earnest. Once a company begins to move in this way, the cost to
defer becomes real for competitors. With almost $3 trillion in cash and short-term investments sitting on the balance sheets of the S&P 500 companies, a strategic shift by firms to spend their idle capital, while slow, could potentially further economic growth in the U.S. in my opinion.
Economic progress and growth remain slow, yet steady, and unemployment, though improving, remains high. Oil prices have fallen, giving consumers a bit more discretionary income. While the midterm elections may not end all of the gridlock in Washington, hopefully we will receive clarity on the political headwinds of taxes and regulations, which have not improved over the past several years.
The markets have had several quarters without any truly significant downturn. The pullbacks we recently experienced, most notably in July and October, were short-lived, as evidenced by the quick rebound to record high market levels. I firmly believe that we are in a secular bull market, and I continue to tell investors to try to remain calm in the face of volatility and continue to focus on the strong, long-term fundamentals that are evident in the market today. Many companies continue to have strong balance sheets, with record cash flows and profits. With this current bull market in its fifth year, investors should expect some volatility.
I am encouraged by the strong returns for the major U.S. financial market indices and by the performance of the Hennessy Funds over the past year. Thank you for your continued confidence and investment in our products. If you have any questions or would like to speak with us directly, please don’t hesitate to call us at (800) 966-4354.
Best regards,
Neil J. Hennessy
President and Chief Investment Officer
Past performance does not guarantee future results.
Mutual fund investing involves risk. Principal loss is possible.
Opinions expressed are those of Neil Hennessy and are subject to change, are not guaranteed and should not be considered investment advice.
The Dow Jones Industrial Average and S&P 500 Index are unmanaged indices commonly used to measure the performance of U.S. stocks. One cannot invest directly in an index.
Cash flow can be used as an indication of a company’s financial strength. A firm’s cash flow is the movement of cash in and out of the firm in the form of payments to suppliers and collections from customers. Dividend Yield is calculated as the annual dividends paid by a company divided by the price of a share of their stock.
HENNESSY FUNDS 1-800-966-4354
Performance Overview (Unaudited)
The opinions expressed in the following commentary reflect those of the Portfolio Managers as of the date written. Any such opinions are subject to change based on market or other conditions and are not guaranteed. These opinions may not be relied upon as investment advice. Investment decisions for the Fund are based on multiple factors, and may not be relied upon as an indication of trading intent on behalf of the Fund. Security positions can and do change.
CHANGE IN VALUE OF $10,000 INVESTMENT
This chart assumes an initial gross investment of $10,000 made on October 31, 2004. Returns shown include the reinvestment of all dividends. Returns shown do not reflect the deduction of taxes that a shareholder would pay on Fund distributions or the redemption of Fund shares.
AVERAGE ANNUAL TOTAL RETURN FOR PERIODS ENDED OCTOBER 31, 2014
| | One | Five | Ten |
| | Year | Years | Years |
| Hennessy Large Value Fund – | | | |
| Investor Class (HLVFX) | 14.20% | 14.10% | 6.04% |
| Hennessy Large Value Fund – | | | |
Institutional Class (HLVIX)(1) | 14.55% | 14.53% | 6.26% |
Russell 1000® Value Index | 16.46% | 16.49% | 7.90% |
| S&P 500 Index | 17.27% | 16.69% | 8.20% |
Expense ratios: 1.33% (Investor Class); Gross 1.14%, Net 0.98%(2) (Institutional Class)
Performance data quoted represents past performance; past performance does not guarantee future results. The investment return and principal value of an investment will fluctuate so that an investor’s shares, when redeemed, may be worth more or less than their original cost. Current performance of the Fund may be lower or higher than the performance quoted. Performance for periods prior to March 20, 2009 reflects the performance of the Tamarack Value Fund, the predecessor to the Hennessy Large Value Fund. Performance data current to the most recent month end may be obtained by visiting hennessyfunds.com.
The expense ratios presented are from the most recent prospectus.
| (1) | The inception date of the Institutional Class shares is March 20, 2009. Performance shown prior to the inception of the Institutional Class shares reflects the performance of the Tamarack Value Fund’s Class S shares and includes expenses that are not applicable to and are different than those of the Investor Class and Institutional Class shares. |
| (2) | With regard to Institutional Class shares, the Fund’s investment advisor has contractually agreed to waive a portion of its expenses indefinitely. |
PERFORMANCE NARRATIVE
RBC GLOBAL ASSET MANAGEMENT (U.S.) INC., SUB-ADVISOR
Portfolio Managers Stuart Lippe, Barbara Browning, CFA, and Adam Scheiner, CFA, RBC Global Asset Management (U.S.) Inc. (sub-advisor)
Over the previous twelve months, how did the Fund perform and what factors contributed to this performance?
For the twelve-month period ended October 31, 2014, the Investor Class of the Hennessy Large Value Fund returned 14.20%, underperforming the Russell 1000® Value Index and S&P 500 Index, which returned 16.46% and 17.27%, respectively, but outperforming the Morningstar Large Value Category Average, which returned 13.60%, for the same period.
The fund’s relative underperformance was due primarily to adverse stock selection in the Health Care, Materials, and Financials sectors. Conversely, performance benefitted from favorable stock selection across a number of sectors, led by Industrials, Information Technology, and Consumer Staples. Performance due to sector allocation decisions was essentially flat, as the Fund’s sector neutral mandate, by design, limits the impact of sector weighting decisions, with the Fund’s managers instead making bets at the industry level. The positive effect of the modest overweight position in the Information Technology sector was partially offset by the adverse effects of a modest overweight position in Materials and the slight underweight in the Health Care sector.
Within the Industrials sector, Lockheed Martin Corp. (+34%), a global security and aerospace company, and General Dynamics Corp. (+65%), an aerospace and defense company, were both strong performers. Lockheed Martin has benefitted from the ramp-up of U.S. airstrikes against ISIS in the Middle East. We do have some concern about oversupply going forward, and if the U.S. strategy shifts to ground troops, that might hurt the stock. Therefore, we have recently taken profits and trimmed the position in favor of General Dynamics, which should benefit more from troops being deployed in Syria, if that were to occur. Positions in Delta Airlines, Inc. (+54%) and Ryder System, Inc. (+37%) also added to performance within the Industrials sector.
The Information Technology sector was also a significant contributor to relative performance. Skyworks Solutions, Inc. (+127%), a proprietary semiconductor manufacturer, was the largest contributor to performance within the sector by far. We have owned the stock for some time, and the company continues to be a dominant player in their space. The company reported strong second quarter earnings, with higher earnings per share and revenue than analysts expected. Skyworks Solutions also supplied chips for the Apple iPhone 6 and iPhone 6 Plus smartphones, which had a record launch, in terms of sales, in September 2014.
Our stock selection within the Consumer Staples sector positively contributed to performance as well. CVS Health Corp. (+40%), an integrated pharmacy health care provider in the U.S., was the top performer for the portfolio within this sector, as the company benefitted from terminating the sale of cigarettes and tobacco-related products (which investors believed will improve long term growth) and changed its name from CVS Caremark to CVS Health to better reflect its focus on health care services. The company reported strong third quarter earnings, with revenue increasing nearly 10%.
On the negative side of the ledger, stock selection and a slight underweight to the Health Care sector detracted from relative performance. The portfolio was hurt by stocks it did not own, including Merck & Co., Inc. (+33%) and UnitedHealth Group, Inc. (+41%), both of which are in the portfolio’s benchmark. Merck benefitted from the news that the FDA granted a breakthrough therapy designation for its Keytruda drug, a treatment for metastatic melanoma and non-small cell lung cancer. Our weak relative
HENNESSY FUNDS 1-800-966-4354
performance in the sector was partially offset by our overweight position in Covidien Ltd. (+47%), a health care products developer and manufacturer. Medtronic, Inc. (+21%), a medical technology company, is set to acquire Covidien at a 30% premium, creating the second largest medical device company in the world. Covidien also beat earnings in a tough environment prior to the takeover announcement.
Within the Materials sector, holdings within the chemicals industry hurt relative performance the most. Eastman Chemical Co. (-7%) was the largest detractor from performance, partially due to its exposure to Europe. However, the company has solid fundamentals and still generates strong free cash flow which allows them to continue to pursue accretive bolt-on acquisitions as they continue to become a more specialized company, so we continue to hold the stock. An underweight position in Dow Chemical Co. (+29%) was also a headwind for the portfolio. The company has several potential catalysts with several growth projects coming online, which have the potential for increased capital return and future retirement of high-cost preferred stock. We continue to believe in the longer term prospects of both companies and maintain their positions in the Fund.
While the geopolitical risks from earlier in the year continue to represent potential impediments to further market advancement, there remains much to be optimistic about heading into the home stretch of 2014. The U.S. economic recovery appears to be entering an acceleration stage with the most recent data showing improvements from an already strong third quarter. Most notably, in just the first week of the fourth quarter investors saw the economy add 248,000 new jobs in September (+68,000 vs. the prior month) bringing the unemployment rate to just 5.9%, the lowest level since July 2008. The improved labor market represents opportunities for significant advancement in other consumer driven segments of the market, such as the housing market, where August’s new home sales surged to a six year best of 18%, far outpacing expectations and indicating a potential rebound in this important segment of the market. Finally, as investors’ concern over the potential for increasing interest rates remains elevated, particularly as increased economic recovery traction supports the Federal Reserve’s re-evaluation of its dovish policy, chairwoman Janet Yellen’s commentary at the recent Jackson Hole Symposium did not represent a significant move towards increasing interest rates considerably ahead of the previously indicated 2015 timetable. In general, equity valuations remain elevated; however, with small and microcap stocks having sold off significantly, valuations broadly are more attractive and we believe that there are numerous opportunities for market advancement. As the market transitions from the largely momentum-driven results of 2013 to more sustainable returns, rooted in earnings growth and strong fundamentals (and barring any unforeseen macro event that significantly roils markets), we believe equity markets should continue their ascent over the next 12-18 months.
We remain confident in our stock selection-driven process and our ability to find special situation stocks that have the potential to outperform, regardless of the market environment. While investment decisions are the result of bottom-up stock selection within our sector-neutral mandate, which requires investment in all 10 major sectors, there are a number of industry-based themes that we believe could lead to outperformance as we head into the end of 2014 and the first half of 2015. We remain overweight media, as media spending and advertising remains strong, and the companies are generating strong cash flows and returning cash to shareholders. We continue to be overweight aerospace and defense companies, as government defense spending remains strong and concerns over sequestration and potential negative effects on the industry were overblown. In regard to Technology, trends in the industry continue to favor companies exposed to the secular growth areas of mobile content, cloud, and IT as a service. We
continue to look for attractively valued opportunities in these areas rather than the legacy enterprise IT names. We are overweight semiconductors, as we look for exposure to the Internet of Things (IoT). Essentially, IoT is the idea of everyday things becoming “connected” or “smart.” This transition is occurring in autos through infotainment offerings, safety features and fuel efficiency mechanisms, which all require integrated circuits and sensors to communicate, measure, and process data. The theme is also accelerating in industrial automation, appliances, and fitness wearables to name a few. While IoT is still in its infancy, we are seeing strong penetration in autos and other industrial end markets. In Financials, we favor regional banks due to strong loan growth, which is coming on the back of a stronger U.S. economy. In Health Care, we are seeing an increased utilization within the industry prompted by health care reform, specifically with regard to managed care, to support our overweight position in health care providers and services.
The Russell 1000® Value Index is an unmanaged index commonly used to measure the performance of U.S. large-capitalization value stocks. The S&P 500 Index is an unmanaged index commonly used to measure the performance of U.S. stocks. You cannot invest directly in an index. Performance data for an index does not reflect any deductions for fees, expenses or taxes. The Fund may invest in medium-capitalization companies, which may have more limited liquidity and greater price volatility than large-capitalization companies. References to specific securities should not be considered a recommendation to buy or sell any security. Fund holdings and sector allocations are subject to change. Please refer to the Schedule of Investments included in this report for additional portfolio information.
Earnings per share is the portion of a company’s profit allocated to each outstanding share of common stock. It serves as an indicator of a company’s profitability.
Free cash flow represents the cash that a company is able to generate after laying out the money required to maintain or expand its asset base.
Each Morningstar category average represents a universe of funds with similar investment objectives. © Morningstar, Inc. All Rights Reserved. The information contained herein: 1) is proprietary to Morningstar; 2) may not be copied or distributed and 3) is not warranted to be accurate, complete or timely. Neither Morningstar nor its content providers are responsible for any damages or losses arising from any use of this information. Past performance does not guarantee future results.
HENNESSY FUNDS 1-800-966-4354
Financial Statements
HENNESSY LARGE VALUE FUND
As of October 31, 2014
(% of Net Assets)
| TOP TEN HOLDINGS (EXCLUDING CASH/CASH EQUIVALENTS) | % NET ASSETS |
| | |
| Johnson & Johnson | 3.80% |
| J.P. Morgan Chase & Co. | 3.47% |
| Wells Fargo & Co. | 3.36% |
| Exxon Mobil Corp. | 3.35% |
| Pfizer, Inc. | 3.20% |
| CVS Health Corp. | 2.45% |
| Medtronic, Inc. | 2.42% |
| CIGNA Corp. | 2.32% |
| Citigroup, Inc. | 2.28% |
| Kroger Co. | 2.18% |
Note: For presentation purposes, the Fund has grouped some of the industry categories. For purposes of categorizing securities for compliance with Section 8(b)(1) of the Investment Company Act of 1940, the Fund uses more specific industry classifications.
| | COMMON STOCKS – 94.63% | | Number | | | | | | % of | |
| | | | of Shares | | | Value | | | Net Assets | |
| | Consumer Discretionary – 7.02% | | | | | | | | | |
| | Comcast Corp. | | | 30,445 | | | $ | 1,685,131 | | | | 1.11 | % |
| | Dish Network Corp. (a) | | | 16,200 | | | | 1,031,130 | | | | 0.68 | % |
| | Ford Motor Co. | | | 122,975 | | | | 1,732,718 | | | | 1.14 | % |
| | Lowes Companies, Inc. | | | 21,920 | | | | 1,253,824 | | | | 0.83 | % |
| | Macy’s, Inc. | | | 17,430 | | | | 1,007,803 | | | | 0.66 | % |
| | Target Corp. | | | 19,070 | | | | 1,178,907 | | | | 0.78 | % |
| | The Walt Disney Co. | | | 21,875 | | | | 1,998,937 | | | | 1.32 | % |
| | Viacom, Inc. | | | 10,410 | | | | 756,599 | | | | 0.50 | % |
| | | | | | | | | 10,645,049 | | | | 7.02 | % |
| | | | | | | | | | | | | | |
| | Consumer Staples – 6.60% | | | | | | | | | | | | |
| | CVS Health Corp. | | | 43,305 | | | | 3,716,002 | | | | 2.45 | % |
| | Kraft Foods Group, Inc. | | | 28,360 | | | | 1,598,086 | | | | 1.06 | % |
| | Kroger Co. | | | 59,400 | | | | 3,309,174 | | | | 2.18 | % |
| | Procter & Gamble Co. | | | 15,825 | | | | 1,381,048 | | | | 0.91 | % |
| | | | | | | | | 10,004,310 | | | | 6.60 | % |
| | | | | | | | | | | | | | |
| | Energy – 11.69% | | | | | | | | | | | | |
| | Anadarko Petroleum Corp. | | | 15,365 | | | | 1,410,200 | | | | 0.93 | % |
| | Chevron Corp. | | | 14,835 | | | | 1,779,458 | | | | 1.17 | % |
| | ConocoPhillips | | | 36,370 | | | | 2,624,096 | | | | 1.73 | % |
| | Exxon Mobil Corp. | | | 52,580 | | | | 5,085,012 | | | | 3.35 | % |
| | Helmerich & Payne, Inc. | | | 20,255 | | | | 1,758,539 | | | | 1.16 | % |
| | Marathon Oil Corp. | | | 58,485 | | | | 2,070,369 | | | | 1.37 | % |
| | Valero Energy Corp. | | | 21,905 | | | | 1,097,221 | | | | 0.73 | % |
| | Whiting Petroleum Corp. (a) | | | 30,980 | | | | 1,897,215 | | | | 1.25 | % |
| | | | | | | | | 17,722,110 | | | | 11.69 | % |
| | | | | | | | | | | | | | |
| | Financials – 24.19% | | | | | | | | | | | | |
| | Affiliated Managers Group, Inc. (a) | | | 1,670 | | | | 333,649 | | | | 0.22 | % |
| | Allstate Corp. | | | 44,585 | | | | 2,891,337 | | | | 1.91 | % |
| | American International Group, Inc. | | | 35,965 | | | | 1,926,645 | | | | 1.27 | % |
| | BlackRock, Inc. | | | 6,550 | | | | 2,234,271 | | | | 1.47 | % |
| | Capital One Financial Corp. | | | 23,025 | | | | 1,905,779 | | | | 1.26 | % |
| | Citigroup, Inc. | | | 64,705 | | | | 3,463,659 | | | | 2.28 | % |
| | E*TRADE Financial Corp. (a) | | | 58,465 | | | | 1,303,770 | | | | 0.86 | % |
| | Hartford Financial Services Group, Inc. | | | 53,240 | | | | 2,107,239 | | | | 1.39 | % |
The accompanying notes are an integral part of these financial statements.
HENNESSY FUNDS 1-800-966-4354
| | COMMON STOCKS | | Number | | | | | | % of | |
| | | | of Shares | | | Value | | | Net Assets | |
| | Financials (Continued) | | | | | | | | | |
| | J.P. Morgan Chase & Co. | | | 86,955 | | | $ | 5,259,039 | | | | 3.47 | % |
| | KeyCorp | | | 95,225 | | | | 1,256,970 | | | | 0.83 | % |
| | Marsh & McLennan Companies, Inc. | | | 42,425 | | | | 2,306,647 | | | | 1.52 | % |
| | MetLife, Inc. | | | 30,075 | | | | 1,631,268 | | | | 1.08 | % |
| | Morgan Stanley | | | 56,120 | | | | 1,961,394 | | | | 1.29 | % |
| | Regions Financial Corp. | | | 85,625 | | | | 850,256 | | | | 0.56 | % |
| | SunTrust Banks, Inc. | | | 55,115 | | | | 2,157,201 | | | | 1.42 | % |
| | Wells Fargo & Co. | | | 96,000 | | | | 5,096,640 | | | | 3.36 | % |
| | | | | | | | | 36,685,764 | | | | 24.19 | % |
| | | | | | | | | | | | | | |
| | Health Care – 13.10% | | | | | | | | | | | | |
| | CIGNA Corp. | | | 35,340 | | | | 3,518,804 | | | | 2.32 | % |
| | Johnson & Johnson | | | 53,535 | | | | 5,770,002 | | | | 3.80 | % |
| | McKesson Corp. | | | 10,145 | | | | 2,063,594 | | | | 1.36 | % |
| | Medtronic, Inc. | | | 53,755 | | | | 3,663,941 | | | | 2.42 | % |
| | Pfizer, Inc. | | | 161,825 | | | | 4,846,659 | | | | 3.20 | % |
| | | | | | | | | 19,863,000 | | | | 13.10 | % |
| | | | | | | | | | | | | | |
| | Industrials – 10.22% | | | | | | | | | | | | |
| | Caterpillar, Inc. | | | 14,900 | | | | 1,511,009 | | | | 1.00 | % |
| | Danaher Corp. | | | 25,405 | | | | 2,042,562 | | | | 1.35 | % |
| | General Dynamics Corp. | | | 20,015 | | | | 2,797,296 | | | | 1.85 | % |
| | General Electric Co. | | | 66,045 | | | | 1,704,621 | | | | 1.12 | % |
| | Honeywell International, Inc. | | | 23,455 | | | | 2,254,495 | | | | 1.49 | % |
| | Ingersoll-Rand PLC (b) | | | 27,225 | | | | 1,704,829 | | | | 1.12 | % |
| | Norfolk Southern Corp. | | | 5,370 | | | | 594,137 | | | | 0.39 | % |
| | Ryder System, Inc. | | | 18,404 | | | | 1,628,202 | | | | 1.07 | % |
| | Southwest Airlines Co. | | | 36,485 | | | | 1,258,003 | | | | 0.83 | % |
| | | | | | | | | 15,495,154 | | | | 10.22 | % |
| | | | | | | | | | | | | | |
| | Information Technology – 10.88% | | | | | | | | | | | | |
| | Apple, Inc. | | | 9,880 | | | | 1,067,040 | | | | 0.70 | % |
| | Autodesk, Inc. (a) | | | 18,635 | | | | 1,072,258 | | | | 0.71 | % |
| | Cisco Systems, Inc. | | | 28,710 | | | | 702,534 | | | | 0.46 | % |
| | Citrix Systems, Inc. (a) | | | 13,750 | | | | 883,162 | | | | 0.58 | % |
| | EMC Corp. | | | 31,570 | | | | 907,006 | | | | 0.60 | % |
| | Hewlett-Packard Co. | | | 51,625 | | | | 1,852,305 | | | | 1.22 | % |
The accompanying notes are an integral part of these financial statements.
| | COMMON STOCKS | | Number | | | | | | % of | |
| | | | of Shares | | | Value | | | Net Assets | |
| | Information Technology (Continued) | | | | | | | | | |
| | Intel Corp. | | | 87,215 | | | $ | 2,966,182 | | | | 1.96 | % |
| | Microsoft Corp. | | | 63,640 | | | | 2,987,898 | | | | 1.97 | % |
| | NXP Semiconductors NV (a)(b) | | | 23,950 | | | | 1,644,407 | | | | 1.09 | % |
| | Skyworks Solutions, Inc. | | | 21,365 | | | | 1,244,298 | | | | 0.82 | % |
| | Western Digital Corp. | | | 11,905 | | | | 1,171,095 | | | | 0.77 | % |
| | | | | | | | | 16,498,185 | | | | 10.88 | % |
| | | | | | | | | | | | | | |
| | Materials – 3.64% | | | | | | | | | | | | |
| | Eastman Chemical Co. | | | 10,465 | | | | 845,363 | | | | 0.56 | % |
| | Huntsman Corp. | | | 51,355 | | | | 1,253,062 | | | | 0.83 | % |
| | International Paper Co. | | | 28,805 | | | | 1,458,109 | | | | 0.96 | % |
| | Newmont Mining Corp. | | | 10,900 | | | | 204,484 | | | | 0.13 | % |
| | The Dow Chemical Co. | | | 35,650 | | | | 1,761,110 | | | | 1.16 | % |
| | | | | | | | | 5,522,128 | | | | 3.64 | % |
| | | | | | | | | | | | | | |
| | Telecommunication Services – 1.31% | | | | | | | | | | | | |
| | T- Mobile US, Inc. (a) | | | 26,850 | | | | 783,751 | | | | 0.52 | % |
| | Verizon Communications, Inc. | | | 24,010 | | | | 1,206,503 | | | | 0.79 | % |
| | | | | | | | | 1,990,254 | | | | 1.31 | % |
| | | | | | | | | | | | | | |
| | Utilities – 5.98% | | | | | | | | | | | | |
| | American Electric Power, Inc. | | | 41,375 | | | | 2,413,818 | | | | 1.59 | % |
| | DTE Energy Co. | | | 35,345 | | | | 2,903,945 | | | | 1.92 | % |
| | OGE Energy Corp. | | | 31,505 | | | | 1,174,821 | | | | 0.77 | % |
| | Sempra Energy | | | 23,490 | | | | 2,583,900 | | | | 1.70 | % |
| | | | | | | | | 9,076,484 | | | | 5.98 | % |
| | | | | | | | | | | | | | |
| | Total Common Stocks | | | | | | | | | | | | |
| | (Cost $114,117,989) | | | | | | | 143,502,438 | | | | 94.63 | % |
| | | | | | | | | | | | | | |
| | REITS – 4.31% | | | | | | | | | | | | |
| | Financials – 4.31% | | | | | | | | | | | | |
| | Health Care Reit, Inc. | | | 15,410 | | | | 1,095,805 | | | | 0.72 | % |
| | Kilroy Realty Corp. | | | 33,670 | | | | 2,280,806 | | | | 1.51 | % |
| | Simon Property Group, Inc. | | | 17,573 | | | | 3,149,257 | | | | 2.08 | % |
| | | | | | | | | | | | | | |
| | Total REITS | | | | | | | | | | | | |
| | (Cost $4,785,916) | | | | | | | 6,525,868 | | | | 4.31 | % |
The accompanying notes are an integral part of these financial statements.
HENNESSY FUNDS 1-800-966-4354
| | SHORT-TERM INVESTMENTS – 0.64% | | Number | | | | | | % of | |
| | | | of Shares | | | Value | | | Net Assets | |
| | Money Market Funds – 0.64% | | | | | | | | | |
| | Fidelity Government Portfolio – | | | | | | | | | |
| | Institutional Class, 0.01% (c) | | | 975,014 | | | $ | 975,014 | | | | 0.64 | % |
| | | | | | | | | | | | | | |
| | Total Short-Term Investments | | | | | | | | | | | | |
| | (Cost $975,014) | | | | | | | 975,014 | | | | 0.64 | % |
| | | | | | | | | | | | | | |
| | Total Investments | | | | | | | | | | | | |
| | (Cost $119,878,919) – 99.58% | | | | | | | 151,003,320 | | | | 99.58 | % |
| | Other Assets in Excess | | | | | | | | | | | | |
| | of Liabilities – 0.42% | | | | | | | 643,930 | | | | 0.42 | % |
| | TOTAL NET ASSETS – 100.00% | | | | | | $ | 151,647,250 | | | | 100.00 | % |
Percentages are stated as a percent of net assets.
REIT – Real Estate Investment Trust
| | (a) | Non-income producing security. |
| | (b) | U.S. traded security of a foreign corporation. |
| | (c) | The rate listed is the fund’s 7-day yield as of October 31, 2014. |
The accompanying notes are an integral part of these financial statements.
Summary of Fair Value Exposure at October 31, 2014
The following is a summary of the inputs used to value the Fund’s net assets as of October 31, 2014 (See Note 3 in the accompanying notes to the financial statements):
| Common Stocks | | Level 1 | | | Level 2 | | | Level 3 | | | Total | |
| Consumer Discretionary | | $ | 10,645,049 | | | $ | — | | | $ | — | | | $ | 10,645,049 | |
| Consumer Staples | | | 10,004,310 | | | | — | | | | — | | | | 10,004,310 | |
| Energy | | | 17,722,110 | | | | — | | | | — | | | | 17,722,110 | |
| Financials | | | 36,685,764 | | | | — | | | | — | | | | 36,685,764 | |
| Health Care | | | 19,863,000 | | | | — | | | | — | | | | 19,863,000 | |
| Industrials | | | 15,495,154 | | | | — | | | | — | | | | 15,495,154 | |
| Information Technology | | | 16,498,185 | | | | — | | | | — | | | | 16,498,185 | |
| Materials | | | 5,522,128 | | | | — | | | | — | | | | 5,522,128 | |
| Telecommunication Services | | | 1,990,254 | | | | — | | | | — | | | | 1,990,254 | |
| Utilities | | | 9,076,484 | | | | — | | | | — | | | | 9,076,484 | |
| Total Common Stocks | | $ | 143,502,438 | | | $ | — | | | $ | — | | | $ | 143,502,438 | |
| REITS | | | | | | | | | | | | | | | | |
| Financials | | $ | 6,525,868 | | | $ | — | | | $ | — | | | $ | 6,525,868 | |
| Total REITS | | $ | 6,525,868 | | | $ | — | | | $ | — | | | $ | 6,525,868 | |
| Short-Term Investments | | | | | | | | | | | | | | | | |
| Money Market Funds | | $ | 975,014 | | | $ | — | | | $ | — | | | $ | 975,014 | |
| Total Short-Term Investments | | $ | 975,014 | | | $ | — | | | $ | — | | | $ | 975,014 | |
| Total Investments | | $ | 151,003,320 | | | $ | — | | | $ | — | | | $ | 151,003,320 | |
Transfers between levels are recognized at the end of the reporting period. During the one-year period ended October 31, 2014, the Fund recognized no transfers between levels.
The accompanying notes are an integral part of these financial statements.
HENNESSY FUNDS 1-800-966-4354
Financial Statements
Statement of Assets and Liabilities as of October 31, 2014 |
| ASSETS: | | | |
| Investments in securities, at value (cost $119,878,919) | | $ | 151,003,320 | |
| Dividends and interest receivable | | | 138,580 | |
| Receivable for fund shares sold | | | 87,668 | |
| Receivable for securities sold | | | 1,364,603 | |
| Prepaid expenses and other assets | | | 15,207 | |
| Total Assets | | | 152,609,378 | |
| | | | | |
| LIABILITIES: | | | | |
| Payable for securities purchased | | | 755,363 | |
| Payable for fund shares redeemed | | | 7,252 | |
| Payable to advisor | | | 105,002 | |
| Payable to administrator | | | 34,921 | |
| Payable to auditor | | | 19,457 | |
| Accrued service fees | | | 12,325 | |
| Accrued trustees fees | | | 2,578 | |
| Accrued expenses and other payables | | | 25,230 | |
| Total Liabilities | | | 962,128 | |
| NET ASSETS | | $ | 151,647,250 | |
| | | | | |
| NET ASSETS CONSIST OF: | | | | |
| Capital stock | | $ | 113,814,179 | |
| Accumulated net investment income | | | 914,964 | |
| Accumulated net realized gain on investments | | | 5,793,706 | |
| Unrealized net appreciation on investments | | | 31,124,401 | |
| Total Net Assets | | $ | 151,647,250 | |
| | | | | |
| NET ASSETS | | | | |
| Investor Class: | | | | |
| Shares authorized (no par value) | | Unlimited | |
| Net assets applicable to outstanding Investor Class shares | | $ | 151,248,717 | |
| Shares issued and outstanding | | | 4,347,489 | |
| Net asset value, offering price and redemption price per share | | $ | 34.79 | |
| | | | | |
| Institutional Class: | | | | |
| Shares authorized (no par value) | | Unlimited | |
| Net assets applicable to outstanding Institutional Class shares | | $ | 398,533 | |
| Shares issued and outstanding | | | 11,406 | |
| Net asset value, offering price and redemption price per share | | $ | 34.94 | |
The accompanying notes are an integral part of these financial statements.
Statement of Operations for the year ended October 31, 2014 |
| INVESTMENT INCOME: | | | |
| Dividend income | | $ | 3,085,725 | |
| Interest income | | | 133 | |
| Total investment income | | | 3,085,858 | |
| | | | | |
| EXPENSES: | | | | |
| Investment advisory fees (See Note 5) | | | 1,260,210 | |
| Administration, fund accounting, custody and transfer agent fees | | | 267,109 | |
| Service fees – Investor Class (See Note 5) | | | 147,913 | |
| Sub-transfer agent expenses – Investor Class (See Note 5) | | | 100,248 | |
| Sub-transfer agent expenses – Institutional Class (See Note 5) | | | 226 | |
| Federal and state registration fees | | | 31,048 | |
| Audit fees | | | 22,057 | |
| Compliance expense | | | 21,488 | |
| Reports to shareholders | | | 19,199 | |
| Trustees’ fees and expenses | | | 10,397 | |
| Legal fees | | | 3,001 | |
| Other expenses | | | 14,288 | |
| Total expenses before waiver | | | 1,897,184 | |
| Reimbursement by Advisor (See Note 5) | | | (9 | ) |
| Administrative expense waiver (See Note 5) | | | (677 | ) |
| Total waiver | | | (686 | ) |
| Net expenses | | | 1,896,498 | |
| NET INVESTMENT INCOME | | $ | 1,189,360 | |
| | | | | |
| REALIZED AND UNREALIZED GAINS (LOSSES): | | | | |
| Net realized gain on investments | | $ | 18,120,591 | |
| Net change in unrealized appreciation on investments | | | 384,704 | |
| Net gain on investments | | | 18,505,295 | |
| NET INCREASE IN NET ASSETS RESULTING FROM OPERATIONS | | $ | 19,694,655 | |
The accompanying notes are an integral part of these financial statements.
HENNESSY FUNDS 1-800-966-4354
(This Page Intentionally Left Blank.)
Financial Statements
| Statements of Changes in Net Assets |
| | | Year Ended | | | Year Ended | |
| | | October 31, 2014 | | | October 31, 2013 | |
| OPERATIONS: | | | | | | |
| Net investment income | | $ | 1,189,360 | | | $ | 1,323,440 | |
| Net realized gain on investments | | | 18,120,591 | | | | 17,493,521 | |
| Net change in unrealized appreciation on investments | | | 384,704 | | | | 11,896,355 | |
| Net increase in net assets resulting from operations | | | 19,694,655 | | | | 30,713,316 | |
| | | | | | | | | |
| DISTRIBUTIONS TO SHAREHOLDERS FROM: | | | | | | | | |
| Net investment income | | | | | | | | |
| Investor Class | | | (1,140,763 | ) | | | (1,437,942 | ) |
| Institutional Class | | | (3,752 | ) | | | (921 | ) |
| Total distributions | | | (1,144,515 | ) | | | (1,438,863 | ) |
| | | | | | | | | |
| CAPITAL SHARE TRANSACTIONS: | | | | | | | | |
| Proceeds from shares subscribed – Investor Class | | | 1,675,893 | | | | 2,715,396 | |
| Proceeds from shares subscribed – Institutional Class | | | 60,482 | | | | 440,166 | |
| Dividends reinvested – Investor Class | | | 1,092,130 | | | | 1,378,307 | |
| Dividends reinvested – Institutional Class | | | 3,353 | | | | 921 | |
| Cost of shares redeemed – Investor Class | | | (13,509,532 | ) | | | (14,868,801 | ) |
| Cost of shares redeemed – Institutional Class | | | (46,510 | ) | | | (209,593 | ) |
| Net decrease in net assets derived from | | | | | | | | |
| capital share transactions | | | (10,724,184 | ) | | | (10,543,604 | ) |
| TOTAL INCREASE IN NET ASSETS | | | 7,825,956 | | | | 18,730,849 | |
| | | | | | | | | |
| NET ASSETS: | | | | | | | | |
| Beginning of year | | | 143,821,294 | | | | 125,090,445 | |
| End of year | | $ | 151,647,250 | | | $ | 143,821,294 | |
| Undistributed net investment income, end of year | | $ | 914,964 | | | $ | 904,159 | |
| | | | | | | | | |
| CHANGES IN SHARES OUTSTANDING: | | | | | | | | |
| Shares sold – Investor Class | | | 51,293 | | | | 99,185 | |
| Shares sold – Institutional Class | | | 1,784 | | | | 15,876 | |
| Shares issued to holders as reinvestment of dividends – | | | | | | | | |
| Investor Class | | | 34,322 | | | | 55,132 | |
| Shares issued to holders as reinvestment of dividends – | | | | | | | | |
| Institutional Class | | | 105 | | | | 37 | |
| Shares redeemed – Investor Class | | | (412,605 | ) | | | (538,927 | ) |
| Shares redeemed – Institutional Class | | | (1,408 | ) | | | (7,267 | ) |
| Net decrease in shares outstanding | | | (326,509 | ) | | | (375,964 | ) |
The accompanying notes are an integral part of these financial statements.
HENNESSY FUNDS 1-800-966-4354
Financial Statements
For an Investor Class share outstanding throughout each year
PER SHARE DATA:
Net asset value, beginning of year
Income from investment operations:
Net investment income
Net realized and unrealized gains on investments
Total from investment operations
Less distributions:
Dividends from net investment income
Total distributions
Net asset value, end of year
TOTAL RETURN
SUPPLEMENTAL DATA AND RATIOS:
Net assets, end of year (millions)
Ratio of expenses to average net assets:
Before expense reimbursement
After expense reimbursement
Ratio of net investment income to average net assets:
Before expense reimbursement
After expense reimbursement
Portfolio turnover rate(1)
| (1) | Portfolio turnover is calculated on the basis of the Fund as a whole. |
The accompanying notes are an integral part of these financial statements.
| Year Ended October 31, | |
| 2014 | | | 2013 | | | 2012 | | | 2011 | | | 2010 | |
| | | | | | | | | | | | | | |
| $ | 30.70 | | | $ | 24.71 | | | $ | 21.47 | | | $ | 20.57 | | | $ | 18.88 | |
| | | | | | | | | | | | | | | | | | | |
| | | | | | | | | | | | | | | | | | | |
| | 0.28 | | | | 0.28 | | | | 0.28 | | | | 0.22 | | | | 0.14 | |
| | 4.06 | | | | 6.00 | | | | 3.14 | | | | 0.89 | | | | 1.78 | |
| | 4.34 | | | | 6.28 | | | | 3.42 | | | | 1.11 | | | | 1.92 | |
| | | | | | | | | | | | | | | | | | | |
| | | | | | | | | | | | | | | | | | | |
| | (0.25 | ) | | | (0.29 | ) | | | (0.18 | ) | | | (0.21 | ) | | | (0.23 | ) |
| | (0.25 | ) | | | (0.29 | ) | | | (0.18 | ) | | | (0.21 | ) | | | (0.23 | ) |
| $ | 34.79 | | | $ | 30.70 | | | $ | 24.71 | | | $ | 21.47 | | | $ | 20.57 | |
| | | | | | | | | | | | | | | | | | | |
| | 14.20 | % | | | 25.64 | % | | | 16.07 | % | | | 5.36 | % | | | 10.22 | % |
| | | | | | | | | | | | | | | | | | | |
| | | | | | | | | | | | | | | | | | | |
| $ | 151.25 | | | $ | 143.48 | | | $ | 125.00 | | | $ | 123.97 | | | $ | 131.54 | |
| | | | | | | | | | | | | | | | | | | |
| | 1.28 | % | | | 1.33 | % | | | 1.40 | % | | | 1.38 | % | | | 1.41 | % |
| | 1.28 | % | | | 1.33 | % | | | 1.40 | % | | | 1.38 | % | | | 1.38 | % |
| | | | | | | | | | | | | | | | | | | |
| | 0.80 | % | | | 0.98 | % | | | 1.16 | % | | | 0.97 | % | | | 0.64 | % |
| | 0.80 | % | | | 0.98 | % | | | 1.16 | % | | | 0.97 | % | | | 0.67 | % |
| | 85 | % | | | 91 | % | | | 111 | % | | | 149 | % | | | 146 | % |
The accompanying notes are an integral part of these financial statements.
HENNESSY FUNDS 1-800-966-4354
Financial Statements
For an Institutional Class share outstanding throughout each year
PER SHARE DATA:
Net asset value, beginning of year
Income from investment operations:
Net investment income
Net realized and unrealized gains on investments
Total from investment operations
Less distributions:
Dividends from net investment income
Total distributions
Net asset value, end of year
TOTAL RETURN
SUPPLEMENTAL DATA AND RATIOS:
Net assets, end of year (millions)
Ratio of expenses to average net assets:
Before expense reimbursement
After expense reimbursement
Ratio of net investment income to average net assets:
Before expense reimbursement
After expense reimbursement
Portfolio turnover rate(1)
| (1) | Portfolio turnover is calculated on the basis of the Fund as a whole. |
The accompanying notes are an integral part of these financial statements.
| Year Ended October 31, | |
| 2014 | | | 2013 | | | 2012 | | | 2011 | | | 2010 | |
| | | | | | | | | | | | | | |
| $ | 30.83 | | | $ | 24.83 | | | $ | 21.56 | | | $ | 20.65 | | | $ | 18.92 | |
| | | | | | | | | | | | | | | | | | | |
| | | | | | | | | | | | | �� | | | | | | |
| | 0.34 | | | | 0.49 | | | | 0.39 | | | | 0.27 | | | | 0.21 | |
| | 4.11 | | | | 5.90 | | | | 3.15 | | | | 0.92 | | | | 1.80 | |
| | 4.45 | | | | 6.39 | | | | 3.54 | | | | 1.19 | | | | 2.01 | |
| | | | | | | | | | | | | | | | | | | |
| | | | | | | | | | | | | | | | | | | |
| | (0.34 | ) | | | (0.39 | ) | | | (0.27 | ) | | | (0.28 | ) | | | (0.28 | ) |
| | (0.34 | ) | | | (0.39 | ) | | | (0.27 | ) | | | (0.28 | ) | | | (0.28 | ) |
| $ | 34.94 | | | $ | 30.83 | | | $ | 24.83 | | | $ | 21.56 | | | $ | 20.65 | |
| | | | | | | | | | | | | | | | | | | |
| | 14.55 | % | | | 26.08 | % | | | 16.58 | % | | | 5.76 | % | | | 10.65 | % |
| | | | | | | | | | | | | | | | | | | |
| | | | | | | | | | | | | | | | | | | |
| $ | 0.40 | | | $ | 0.34 | | | $ | 0.06 | | | $ | 0.04 | | | $ | 0.04 | |
| | | | | | | | | | | | | | | | | | | |
| | 1.18 | % | | | 1.14 | % | | | 1.22 | % | | | 1.21 | % | | | 1.22 | % |
| | 0.98 | % | | | 0.98 | % | | | 0.98 | % | | | 0.98 | % | | | 0.98 | % |
| | | | | | | | | | | | | | | | | | | |
| | 0.91 | % | | | 1.07 | % | | | 1.29 | % | | | 1.13 | % | | | 0.80 | % |
| | 1.11 | % | | | 1.23 | % | | | 1.53 | % | | | 1.36 | % | | | 1.04 | % |
| | 85 | % | | | 91 | % | | | 111 | % | | | 149 | % | | | 146 | % |
The accompanying notes are an integral part of these financial statements.
HENNESSY FUNDS 1-800-966-4354
Notes to Financial Statements October 31, 2014 |
1). ORGANIZATION
The Hennessy Large Value Fund (the “Fund”) is a series of Hennessy Funds Trust (the “Trust”), which was organized as a Delaware statutory trust on September 17, 1992. The Fund is an open-end management investment company registered under the Investment Company Act of 1940, as amended. The investment objective of the Fund is long-term growth of capital and current income. The Fund is a diversified fund.
The Fund offers Investor Class and Institutional Class shares. Prior to October 26, 2012, the Investor Class shares were known as Original Class shares. Each class of shares differs principally in its respective administration, 12b-1 distribution and service fees, shareholder servicing, and transfer agent expenses and sales charges, if any. Each class has identical rights to earnings, assets, and voting privileges, except for class-specific expenses and exclusive rights to vote on matters affecting only an individual class.
2). SIGNIFICANT ACCOUNTING POLICIES
The following is a summary of significant accounting policies consistently followed by the Fund in the preparation of the financial statements. These policies are in conformity with U.S. generally accepted accounting principles (“GAAP”).
| a). | Investment Valuation – All investments in securities are recorded at their estimated fair value, as described in Note 3. |
| | |
| b). | Federal Income Taxes – Provision for federal income taxes or excise taxes has not been made since the Fund has elected to be taxed as a “regulated investment company” and intends to distribute substantially all of its taxable income to its shareholders and otherwise comply with the provisions of the Internal Revenue Code of 1986, as amended, applicable to regulated investment companies. Net investment income or loss and realized gains and losses for federal income tax purposes may differ from that reported on the financial statements because of temporary book and tax basis differences. Temporary differences are primarily the result of the treatment of wash sales for tax reporting purposes. Distributions from net realized gains for book purposes may include short-term capital gains, which are included as ordinary income to shareholders for tax purposes. |
| | |
| | Due to inherent differences in the recognition of income, expenses, and realized gains/losses under GAAP and federal income tax regulations, permanent differences between book and tax basis reporting for the 2014 fiscal year have been identified and appropriately reclassified on the Statement of Assets and Liabilities. The adjustments are as follow: |
| Undistributed | Accumulated | |
| Net Investment | Net Realized | |
| Income/(Loss) | Gain/(Loss) | Paid-in Capital |
| $(34,040) | $34,040 | $— |
| c). | Income and Expenses – Dividend income is recognized on the ex-dividend date or as soon as information is available to the Fund. Interest income, which includes the amortization of premium and accretion of discount, is recognized on an accrual basis. The Fund is charged for those expenses that are directly attributable to the portfolio, such as advisory, administration, and certain shareholder service fees. Income, |
| | expenses (other than expenses attributable to a specific class), and realized and unrealized gains or losses on investments are allocated to each class of shares based on its respective net assets. |
| | |
| d). | Distributions to Shareholders – Dividends from net investment income for the Fund, if any, are declared and paid out annually, usually in December. Distributions of net realized capital gains, if any, are declared and paid annually, usually in November or December. |
| | |
| e). | Security Transactions – Investment and shareholder transactions are recorded on the trade date. The Fund determines the gain or loss realized from the investment transactions by comparing the original cost of the security lot sold with the net sale proceeds. Discounts and premiums on securities purchased are accreted/amortized over the life of the respective security. |
| | |
| f). | Use of Estimates – The preparation of financial statements in conformity with GAAP requires management to make estimates and assumptions that affect the reported amounts of assets and liabilities and disclosure of contingent assets and liabilities at the date of the financial statements and the reported change in net assets during the reporting period. Actual results could differ from those estimates. |
| | |
| g). | Share Valuation – The net asset value (“NAV”) per share of the Fund is calculated by dividing the sum of the value of the securities held by the Fund, plus cash or other assets, minus all liabilities (including estimated accrued expenses) by the total number of shares outstanding for the Fund, rounded to the nearest cent. The Fund’s shares will not be priced on days the New York Stock Exchange is closed for trading. The offering and redemption price per share for the Fund is equal to the Fund’s NAV per share. |
| | |
| h). | Foreign Currency – Values of investments denominated in foreign currencies, if any, are converted into U.S. dollars using the spot market rate of exchange at the time of valuation. Purchases and sales of investments and income are translated into U.S. dollars using the spot market rate of exchange prevailing on the respective dates of such transactions. The Fund does not isolate the portion of the results of operations resulting from fluctuations in foreign exchange rates on investments from fluctuations resulting from changes in the market prices of securities held. Such fluctuations are included with the net realized and unrealized gain or loss on investments. Foreign investments present additional risks due to currency fluctuations, economic and political factors, lower liquidity, government regulations, differences in accounting standards, and other factors. |
| | |
| i). | Forward Contracts – The Fund may enter into forward currency contracts to reduce its exposure to changes in foreign currency exchange rates on its foreign holdings and to lock in the U.S. dollar cost of firm purchase and sale commitments for securities denominated in foreign currencies. A forward currency contract is a commitment to purchase or sell a foreign currency at a future date at a negotiated forward rate. The gain or loss arising from the difference between the U.S. dollar cost of the original contract and the value of the foreign currency in U.S. dollars upon closing of such contract is included in net realized gain or loss from foreign currency transactions. During the fiscal year ended October 31, 2014, the Fund did not enter into any forward contracts. |
| | |
| j). | Repurchase Agreements – The Fund may enter into repurchase agreements with member banks or security dealers of the Federal Reserve Board whom the investment advisor deems creditworthy. The repurchase price generally equals the price paid by the Fund plus interest negotiated on the basis of current short-term rates. |
HENNESSY FUNDS 1-800-966-4354
| | Securities pledged as collateral for repurchase agreements are held by the custodian bank until the respective agreements mature. Provisions of the repurchase agreements ensure that the market value of the collateral, including accrued interest thereon, is sufficient to cover the repurchase amount in the event of default of the counterparty. If the counterparty defaults and the value of the collateral declines or if the counterparty enters an insolvency proceeding, realization of the collateral by the Fund may be delayed or limited. |
| | |
| k). | Accounting for Uncertainty in Income Taxes – The Fund has adopted accounting policies regarding recognition and measurement of tax positions taken or expected to be taken on a tax return. The tax returns of the Fund for the prior three fiscal years are open for examination. The Fund has reviewed all open tax years in major jurisdictions and concluded that there is no impact on the Fund’s net assets and no tax liability resulting from unrecognized tax benefits relating to uncertain income tax positions taken or expected to be taken on a tax return. The Fund’s major tax jurisdictions are U.S. federal and Delaware. |
| | |
| l). | Derivatives – The Fund may invest in, or enter into, derivatives, such as options, futures contracts, options on futures contracts, and swaps, for a variety of reasons, including to hedge certain risks, to provide a substitute for purchasing or selling particular securities, or to increase potential income gain. Derivatives may provide a cheaper, quicker, or more specifically focused way for a Fund to invest than “traditional” securities would. The main purpose of utilizing these derivative instruments is for hedging purposes. |
| | |
| | The Fund has adopted the financial accounting reporting rules as required by the Derivatives and Hedging Topic of the Financial Accounting Standards Board Accounting Standards Codification. Under such rules, the Fund is required to include enhanced disclosure that enables investors to understand how and why an entity uses derivatives, how derivatives are accounted for, and how derivatives instruments affect an entity’s results of operations and financial position. During the fiscal year ended October 31, 2014, the Fund did not hold any derivative instruments. |
| | |
| m). | Events Subsequent to the Fiscal Period End – The Fund has adopted financial reporting rules regarding subsequent events that require an entity to recognize in the financial statements the effects of all subsequent events that provide additional evidence about conditions that existed at the date of the balance sheet. Management has evaluated the Fund’s related events and transactions that occurred subsequent to October 31, 2014 through the date of issuance of the Fund’s financial statements. There were no events or transactions that occurred during this period that materially impacted the amounts or disclosures in the Fund’s financial statements. |
3). SECURITIES VALUATION
The Fund has adopted authoritative fair valuation accounting standards that establish an authoritative definition of fair value and set out a hierarchy for measuring fair value. These standards require additional disclosures about the various inputs and valuation techniques used to develop the measurements of fair value and a discussion in changes in valuation techniques and related inputs during the period. These inputs are summarized in the three broad levels listed below:
| | Level 1 – | Quoted unadjusted prices for identical instruments in active markets to which the Fund has access at the date of measurement. |
| | | |
| | Level 2 – | Quoted prices for similar instruments in active markets; quoted prices for identical or similar instruments in markets that are not active; and model- |
| | | derived valuations in which all significant inputs and significant value drivers are observable in active markets. Level 2 inputs are those in markets for which there are few transactions, the prices are not current, the prices are fair value adjusted due to post-market close subsequent events (foreign markets), little public information exists, or instances where prices vary substantially over time or among brokered market makers. These inputs may also include interest rates, prepayment speeds, credit risk curves, default rates, and similar data. |
| | | |
| | Level 3 – | Model-derived valuations in which one or more significant inputs or significant value drivers are unobservable. Unobservable inputs are those inputs that reflect the Fund’s own assumptions about what market participants would use to price the asset or liability based on the best available information. |
Following is a description of the valuation techniques applied to the Fund’s major categories of assets and liabilities measured at fair value on a recurring basis.
Equity Securities – Equity securities, including common stocks, preferred stocks, foreign issued common stocks, exchange traded funds, closed-end mutual funds, and real estate investment trusts, that are traded on a securities exchange for which a last-quoted sales price is readily available will generally be valued at the last sales price as reported by the primary exchange on which the securities are listed. Securities listed on The NASDAQ Stock Market (“NASDAQ”) will be valued at the NASDAQ Official Closing Price, which may differ from the last sales price reported. Securities traded on a securities exchange for which a last-quoted sales price is not readily available will generally be valued at the mean between the bid and ask prices. To the extent these securities are actively traded and valuation adjustments are not applied, they are classified in Level 1 of the fair value hierarchy.
Investment Companies – Investments in investment companies (e.g., mutual funds and exchange traded funds) are generally priced at the ending NAV provided by the Fund’s service agent and will be classified in Level 1 of the fair value hierarchy.
Debt Securities – Debt securities, including corporate bonds, asset-backed securities, mortgage-backed securities, municipal bonds, U.S. Treasuries, and U.S. government agency issues, are valued at market on the basis of valuations furnished by an independent pricing service that utilizes both dealer-supplied valuations and formula-based techniques. The pricing service may consider recently executed transactions in securities of the issuer or comparable issuers, market price quotations (where observable), bond spreads, and fundamental data relating to the issuer. In addition, the model may incorporate market observable data such as reported sales of similar securities, broker quotes, yields, bids, offers, and reference data. Certain securities are valued principally using dealer quotations. These securities are generally classified in Level 2 of the fair value hierarchy.
Short-Term Securities – Short-term equity investments, including money market funds, are valued in the manner specified above. Short-term debt investments are generally valued at amortized cost, which approximates fair market value, if their original maturity was 60 days or less, or by amortizing the values as of the 61st day prior to maturity, if their original term to maturity exceeded 60 days. Amortized cost is not used if its use would be inappropriate due to credit or other impairments of the issuer, in which the security would be fair valued, as described below. Short-term securities are generally classified in Level 1 or Level 2 of the fair market hierarchy depending on the inputs used and market activity levels for specific securities.
HENNESSY FUNDS 1-800-966-4354
The Board of Trustees of the Fund (the “Board”) has adopted fair value pricing procedures that are followed when a price for a security is not readily available or if a significant event has occurred that indicates the closing price of a security no longer represents the true value of that security. Fair value pricing determinations are made in good faith in accordance with these procedures. There are numerous criteria that will be given consideration in determining a fair value of a security. Some of these criteria are trading volume of security and markets, the value of other like securities, and news events with direct bearing to security or market. Fair value pricing results in an estimated price for a security that reflects the amount the Fund might reasonably expect to receive in a current sale. Depending on the relative significance of the valuation inputs, these securities may be classified in either Level 2 or Level 3 of the fair value hierarchy.
Fair valuing of foreign securities may be determined with the assistance of a pricing service using correlations between the movement of prices of such securities and indices of domestic securities and other appropriate indicators, such as closing market prices of relevant American Depositary Receipts or futures contracts. The effect of using fair value pricing is that the Fund’s NAV will reflect the affected portfolio securities’ value as determined in the judgment of the Board or its designee instead of being determined by the market. Using a fair value pricing methodology to price foreign securities may result in a value that is different from a foreign security’s most recent closing price and from the prices used by other investment companies to calculate their NAVs and are generally considered Level 2 prices in the fair valuation hierarchy. Because the Fund may invest in foreign securities, the value of the Fund’s portfolio securities may change on days when you will not be able to purchase or redeem your shares.
The Board has delegated day-to-day valuation matters to a Valuation Committee comprised of one or more representatives from Hennessy Advisors, Inc., the Fund’s investment advisor. The function of the Valuation Committee is to value securities where current and reliable market quotations are not readily available. All actions taken by the Valuation Committee are reviewed by the Board.
The Fund has performed an analysis of all existing investments to determine the significance and character of all inputs to their fair value determination. Various inputs are used in determining the value of the Fund’s investments. The inputs or methodology used for valuing securities are not necessarily an indication of the risk associated with investing in those securities. Details related to the fair valuation hierarchy of the Fund’s securities as of October 31, 2014 are included in the Fund’s Schedule of Investments.
4). INVESTMENT TRANSACTIONS
Purchases and sales of investment securities (excluding government and short-term investments) for the Fund during the fiscal year ended October 31, 2014 were $125,864,555 and $136,976,112, respectively.
There were no purchases or sales/maturities of long-term U.S. Government Securities for the Fund during the fiscal year ended October 31, 2014.
5). INVESTMENT MANAGEMENT FEE AND OTHER TRANSACTIONS WITH AFFILIATES
Hennessy Advisors, Inc. (the “Advisor”) is the investment advisor of the Fund. The Advisor provides the Fund with investment management services under an Investment Advisory Agreement. The Advisor furnishes all investment advice, office space, facilities, and provides most of the personnel needed by the Fund. As compensation for its services, the Advisor is entitled to a monthly fee from the Fund. The fee is based upon the average daily net assets of the Fund at the annual rate of 0.85%. The net investment advisory fees payable for the Fund as of October 31, 2014 were $105,002.
The Advisor has delegated the day-to-day management of the Fund to a sub-advisor, RBC Global Asset Management (U.S.) Inc. The Advisor pays the sub-advisor fees for the Fund from its own assets and these fees are not an additional expense of the Fund.
The Advisor has agreed to waive its fees and absorb expenses to the extent that the total annual operating expenses (excluding all Federal, state and local taxes, interest, brokerage commissions, acquired fund fees and expenses and other costs incurred in connection with the purchase and sale of securities and extraordinary items) exceed 0.98% of the Fund’s net assets for the Institutional Class shares of the Fund. The expense limitation agreement for the Institutional Class shares can only be terminated by the Board.
For a period of three years after the year in which the Advisor waives or reimburses expenses, the Advisor may seek reimbursement from the Fund to the extent that total annual fund operating expenses are less than the expense limitation in effect at the time of the reimbursement. The Advisor waived or reimbursed expenses of $9 for the Fund during the fiscal year ended October 31, 2014. As of October 31, 2014, cumulative expenses subject to potential recovery to the aforementioned conditions are $9 for the Institutional Class, which will expire on October 31, 2017.
The Board has approved a Shareholder Servicing Agreement for Investor Class shares of the Fund, which was instituted to compensate the Advisor for the non-investment management services it provides to the Fund. The Shareholder Servicing Agreement provides for a monthly fee paid to the Advisor at an annual rate of 0.10% of the average daily net assets of the Fund attributable to Investor Class shares. Shareholder servicing fees payable for the Fund as of October 31, 2014 were $12,325.
The Fund has entered into agreements with various brokers, dealers, and financial intermediaries in connection with the sale of shares of the Fund. The agreements provide for periodic payments by the Fund to the brokers, dealers, and financial intermediaries for providing certain shareholder maintenance services (sub-transfer agent expenses). These shareholder services include the pre-processing and quality control of new accounts, shareholder correspondence, answering customer inquiries regarding account status, and facilitating shareholder telephone transactions. Fees paid by the Fund to various brokers, dealers, and financial intermediaries for the fiscal year ended October 31, 2014 were $100,474.
U.S. Bancorp Fund Services, LLC (“USBFS”) provides the Fund with administrative, fund accounting, and transfer agent services, including all regulatory reporting, and necessary office equipment and personnel. As administrator, USBFS prepares various federal and state regulatory filings, reports, and returns for the Fund; prepares reports and materials to be supplied to the Board; monitors the activities of the Fund’s custodian, transfer agent, and accountants; and coordinates the preparation and payment of the Fund’s expenses and reviews the Fund’s expense accruals. Fees paid to USBFS for the fiscal year ended October 31, 2014 were $266,432.
USBFS has voluntarily waived all or a portion of its fees allocated to the Institutional Class shares of the Fund. The administration fees voluntarily waived by USBFS during the fiscal year ended October 31, 2014 were $677.
U.S. Bank, N.A., an affiliate of USBFS, serves as the Fund’s custodian. Quasar Distributors, LLC acts as the Fund’s principal underwriter in a continuous public offering of the Fund’s shares. Quasar Distributors, LLC is an affiliate of USBFS and U.S. Bank, N.A.
6). LINE OF CREDIT
The Fund has a line of credit with the other funds in the Hennessy Funds family of funds (the “Hennessy Funds”) in the amount of the lesser of (i) $100,000,000 or (ii) 33.33% of each Hennessy Fund’s net assets, or 30% for the Hennessy Gas Utility Index Fund and 10%
HENNESSY FUNDS 1-800-966-4354
for the Hennessy Balanced Fund, intended to provide short-term financing, if necessary, subject to certain restrictions, in connection with shareholder redemptions. The credit facility is with the Hennessy Funds’ custodian bank, U.S. Bank, N.A. Borrowings under this arrangement bear interest at the bank’s prime rate. During the fiscal year ended October 31, 2014, the Fund did not have any borrowings outstanding under the line of credit.
7). FEDERAL TAX INFORMATION
As of October 31, 2014, the components of accumulated earnings (losses) for income tax purposes were as follow:
| | Cost of investments for tax purposes | | $ | 120,221,801 | |
| | Gross tax unrealized appreciation | | $ | 32,755,766 | |
| | Gross tax unrealized depreciation | | | (1,974,247 | ) |
| | Net tax unrealized appreciation | | $ | 30,781,519 | |
| | Undistributed ordinary income | | $ | 914,964 | |
| | Undistributed long-term capital gains | | | 6,159,647 | |
| | Total distributable earnings | | $ | 7,074,611 | |
| | Other accumulated loss | | $ | (23,059 | ) |
| | Total accumulated gain | | $ | 37,833,071 | |
The difference between book-basis and tax-basis unrealized appreciation is attributable primarily to wash sales.
At October 31, 2014, the Fund had no tax basis capital losses to offset future capital gains.
During the year ended October 31, 2014, the capital loss carry forwards utilized for the Fund were $12,046,824.
At October 31, 2014, the Fund did not defer, on a tax basis, any post-December late year ordinary loss deferrals.
The tax character of distributions paid during fiscal year 2014 and fiscal year 2013 for the Fund were as follow:
| | | | Year Ended | | | Year Ended | |
| | | | October 31, 2014 | | | October 31, 2013 | |
| | Ordinary income | | $ | 1,144,515 | | | $ | 1,438,863 | |
| | Long-term capital gain | | | — | | | | — | |
| | | | $ | 1,144,515 | | | $ | 1,438,863 | |
8). EVENTS SUBSEQUENT TO YEAR-END
On December 8, 2014, a long-term capital gains distribution of $1.42171 per share for the Investor Class and $1.42764 per share for the Institutional Class were declared and paid to shareholders of record on December 5, 2014.
Report of Independent Registered Public Accounting Firm
The Board of Trustees and Shareholders
Hennessy Funds Trust:
We have audited the accompanying statement of assets and liabilities of Hennessy Large Value Fund (the Fund), a series of Hennessy Funds Trust, including the schedule of investments, as of October 31, 2014, and the related statement of operations for the year then ended, the statements of changes in net assets for each of the years in the two-year period then ended, and the financial highlights for each of the years in the five-year period then ended. These financial statements and financial highlights are the responsibility of the Fund’s management. Our responsibility is to express an opinion on these financial statements and financial highlights based on our audits.
We conducted our audits in accordance with the standards of the Public Company Accounting Oversight Board (United States). Those standards require that we plan and perform the audit to obtain reasonable assurance about whether the financial statements and financial highlights are free of material misstatement. An audit includes examining, on a test basis, evidence supporting the amounts and disclosures in the financial statements. Our procedures included confirmation of investments owned as of October 31, 2014, by correspondence with the custodian and brokers or by other appropriate auditing procedures. An audit also includes assessing the accounting principles used and significant estimates made by management, as well as evaluating the overall financial statement presentation. We believe that our audits provide a reasonable basis for our opinion.
In our opinion, the financial statements and financial highlights referred to above present fairly, in all material respects, the financial position of the Fund as of October 31, 2014, and the results of its operations for the year then ended, the changes in its net assets for each of the years in the two-year period then ended, and the financial highlights for each of the years in the five-year period then ended, in conformity with U.S. generally accepted accounting principles.
Milwaukee, Wisconsin
December 30, 2014
HENNESSY FUNDS 1-800-966-4354
Trustees and Officers of the Fund (Unaudited)
The business and affairs of the Fund are managed under the direction of the Fund’s Board of Trustees. Information pertaining to the Trustees and Officers of the Fund is set forth below. The Fund’s Statement of Additional Information includes additional information about the Fund’s Trustees and Officers and is available, without charge, upon request by calling 1-800-966-4354.
| | | | | Number of | |
| | | Term of | | Portfolios | |
| | | Office | | in the | Other |
| | | and | | Fund | Directorships |
| | Position(s) | Length | Principal | Complex | (During Past |
| Name, Address, | Held with | of Time | Occupation(s) | Overseen | Five Years)(2) |
| and Age | the Fund | Served | During Past Five Years | by Trustee | Held by Trustee |
| | | | | | |
| Disinterested Trustees (as defined below) | | |
| | | | | | |
| J. Dennis DeSousa | Trustee | Indefinite, | Mr. DeSousa is a real | 16 | Hennessy SPARX |
| Age: 78 | | until | estate investor. | | Funds Trust; |
| Address: | | successor | | | Hennessy Mutual |
| c/o Hennessy | | elected | | | Funds, Inc.; and |
| Advisors, Inc. | | | | | The Hennessy |
| 7250 Redwood Blvd. | | Served | | | Funds, Inc. |
| Suite 200 | | since | | | |
| Novato, CA 94945 | | January | | | |
| | | 1996 | | | |
| | | for the | | | |
| | | Funds (or | | | |
| | | Predecessor | | | |
| | | Funds) | | | |
| | | | | | |
| Robert T. Doyle | Trustee | Indefinite, | Mr. Doyle has been the | 16 | Hennessy SPARX |
| Age: 67 | | until | Sheriff of Marin County, | | Funds Trust; |
| Address: | | successor | California since 1996. | | Hennessy Mutual |
| c/o Hennessy | | elected | | | Funds, Inc.; and |
| Advisors, Inc. | | | | | The Hennessy |
| 7250 Redwood Blvd. | | Served | | | Funds, Inc. |
| Suite 200 | | since | | | |
| Novato, CA 94945 | | January | | | |
| | | 1996 | | | |
| | | for the | | | |
| | | Funds (or | | | |
| | | Predecessor | | | |
| | | Funds) | | | |
| | | | | | |
| Gerald P. Richardson | Trustee | Indefinite, | Mr. Richardson is an | 16 | Hennessy SPARX |
| Age: 69 | | until | independent consultant | | Funds Trust; |
| Address: | | successor | in the securities industry. | | Hennessy Mutual |
| c/o Hennessy | | elected | | | Funds, Inc.; and |
| Advisors, Inc. | | | | | The Hennessy |
| 7250 Redwood Blvd. | | Served | | | Funds, Inc. |
| Suite 200 | | since | | | |
| Novato, CA 94945 | | May 2004 | | | |
| | | for the | | | |
| | | Funds (or | | | |
| | | Predecessor | | | |
| | | Funds) | | | |
| | | | | Number of | |
| | | Term of | | Portfolios | |
| | | Office | | in the | Other |
| | | and | | Fund | Directorships |
| | Position(s) | Length | Principal | Complex | (During Past |
| Name, Address, | Held with | of Time | Occupation(s) | Overseen | Five Years)(2) |
| and Age | the Fund | Served | During Past Five Years | by Trustee | Held by Trustee |
| | | | | | |
| “Interested Persons” (as defined in the 1940 Act) | | |
| | | | | | |
Neil J. Hennessy(1) | Chief | Trustee: | Mr. Hennessy has been | 16 | Hennessy |
| Age: 58 | Investment | Indefinite, | employed by Hennessy | | Advisors, Inc. |
| Address: | Officer, | until | Advisors, Inc., the Funds’ | | (current); |
| c/o Hennessy | Portfolio | successor | investment advisor, since | | Hennessy SPARX |
| Advisors, Inc. | Manager, | elected | 1989. He currently serves | | Funds Trust; |
| 7250 Redwood Blvd. | President, | | as President, Chairman | | Hennessy Mutual |
| Suite 200 | Trustee | Served | and CEO of Hennessy | | Funds, Inc.; and |
| Novato, CA 94945 | and | since | Advisors, Inc. | | The Hennessy |
| | Chairman | January | | | Funds, Inc. |
| | of the | 1996 | | | |
| | Board | for the | | | |
| | | Funds (or | | | |
| | | Predecessor | | | |
| | | Funds) | | | |
| | | | | | |
| | | Officer: | | | |
| | | 1 year term | | | |
| | | | | | |
| | | Served | | | |
| | | since | | | |
| | | June 2008 | | | |
| | | for the | | | |
| | | Funds (or | | | |
| | | Predecessor | | | |
| | | Funds) | | | |
| | | | | | |
Teresa M. Nilsen(1) | Executive | 1 year term | Ms. Nilsen has been | N/A | N/A |
| Age: 48 | Vice | | employed by Hennessy | | |
| Address: | President | Served | Advisors, Inc., the Funds’ | | |
| c/o Hennessy | and | since | investment advisor, since | | |
| Advisors, Inc. | Treasurer | January | 1989. She currently serves | | |
| 7250 Redwood Blvd. | | 1996 | as Executive Vice President, | | |
| Suite 200 | | for the | Chief Operations Officer, | | |
| Novato, CA 94945 | | Funds (or | Chief Financial Officer, and | | |
| | | Predecessor | Secretary of Hennessy | | |
| | | Funds) | Advisors, Inc. | | |
| (1) | All Officers of the Hennessy Funds and employees of the Manager are Interested Persons of the Funds. |
| (2) | Pursuant to an internal reorganization, the series of Hennessy Mutual Funds, Inc. (“HMFI”), The Hennessy Funds, Inc. (“HFI”) and Hennessy SPARX Funds Trust (“HSFT”) were reorganized into series of Hennessy Funds Trust on February 28, 2014, which mirrored the corresponding series of HFMI, HFI and HSFT. Subsequent to the reorganization, HFMI, HFI and HSFT were dissolved. |
HENNESSY FUNDS 1-800-966-4354
| | | Term of | |
| | | Office | |
| | | and | |
| | Position(s) | Length | Principal |
| Name, Address, | Held with | of Time | Occupation(s) |
| and Age | the Fund | Served | During Past Five Years |
| | | | |
| Interested Persons | | | |
| | | | |
Daniel B. Steadman(1) | Executive | 1 year term | Mr. Steadman has been employed by |
| Age: 58 | Vice President | | Hennessy Advisors, Inc., the Funds’ |
| Address: | and Secretary | Served since | investment advisor, since 2000. |
| c/o Hennessy Advisors, Inc. | | March 2000 | He currently serves as Executive |
| 7250 Redwood Blvd. | | for the Funds (or | Vice President and Chief Compliance |
| Suite 200 | | Predecessor Funds) | Officer of Hennessy Advisors, Inc. |
| Novato, CA 94945 | | | |
| | | | |
Jennifer Cheskiewicz(1) | Senior | 1 year term | Ms. Cheskiewicz has been employed by |
| Age: 37 | Vice President | | Hennessy Advisors, Inc., the Funds’ |
| Address: | and Chief | Served since | investment advisor, since June 2013. |
| c/o Hennessy Advisors, Inc. | Compliance | June 2013 | She previously served as in-house |
| 7250 Redwood Blvd. | Officer | for the Funds (or | counsel to Carlson Capital, L.P., an |
| Suite 200 | | Predecessor Funds) | SEC-registered investment advisor to |
| Novato, CA 94945 | | | several private funds from February |
| | | | 2010 to May 2013. Prior to that, she |
| | | | was an attorney with Gibson, Dunn & |
| | | | Crutcher LLP from September 2005 |
| | | | through February 2010. She currently |
| | | | serves as General Counsel of |
| | | | Hennessy Advisors, Inc. |
| | | | |
Brian Carlson(1) | Senior | 1 year term | Mr. Carlson has been employed by |
| Age: 42 | Vice President | | Hennessy Advisors, Inc., the Funds’ |
| Address: | and Head of | Served since | investment advisor, since |
| c/o Hennessy Advisors, Inc. | Distribution | December 2013 | December 2013. |
| 7250 Redwood Blvd. | | for the Funds (or | |
| Suite 200 | | Predecessor Funds) | Mr. Carlson was previously a |
| Novato, CA 94945 | | | co-founder and principal of Trivium |
| | | | Consultants, LLC from February 2011 |
| | | | through November 2013. Prior to that, |
| | | | he was the Senior Managing Director |
| | | | of NRP Financial, Inc. from August |
| | | | 2007 through February 2011. |
| | | | |
David Ellison(1) | Portfolio Manager | 1 year term | Mr. Ellison has served as Portfolio |
| Age: 56 | and Senior | | Manager of the Large Cap Financial |
| Address: | Vice President | Served since | Fund, the Small Cap Financial Fund, |
| c/o Hennessy Advisors, Inc. | | October 2012 | and the Technology Fund |
| 101 Federal Street | | for the Funds (or | since inception. |
| Suite 1900 | | Predecessor Funds) | |
| Boston, MA 02110 | | | Mr. Ellison previously served as Director, |
| | | | CIO and President of FBR Advisers, Inc. |
| | | | from December 1999 to October 2012. |
| (1) | All Officers of the Hennessy Funds and employees of the Manager are Interested Persons of the Funds. |
| | | Term of | |
| | | Office | |
| | | and | |
| | Position(s) | Length | Principal |
| Name, Address, | Held with | of Time | Occupation(s) |
| and Age | the Fund | Served | During Past Five Years |
| | | | |
| Interested Persons | | | |
| | | | |
Brian Peery(1) | Portfolio Manager | 1 year term | Mr. Peery has been a Portfolio Manager |
| Age: 45 | and | | of the Cornerstone Growth Fund, |
| Address: | Vice President | Served since | the Cornerstone Mid Cap 30 Fund, the |
| c/o Hennessy Advisors, Inc. | | March 2003 | Cornerstone Large Growth Fund, the |
| 7250 Redwood Blvd. | | as Vice President | Cornerstone Value Fund, the Total |
| Suite 200 | | for the Funds (or | Return Fund, and the Balanced Fund |
| Novato, CA 94945 | | Predecessor Funds) | since October 2014. From February |
| | | | 2011 through September 2014, he |
| | | Served since | served as Co-Portfolio Manager of |
| | | February 2011 | the same funds. |
| | | as Co-Portfolio | |
| | | Manager | Mr. Peery has been employed by |
| | | for the Funds (or | Hennessy Advisors, Inc., the Funds’ |
| | | Predecessor Funds) | investment advisor, since 2002. |
| | | | |
Winsor (Skip) Aylesworth(1) | Portfolio Manager | 1 year term | Mr. Aylesworth has been Portfolio |
| Age: 67 | and | | Manager of the Gas Utility Index Fund |
| Address: | Vice President | Served since | since 1998 and Portfolio Manager of |
| c/o Hennessy Advisors, Inc. | | October 2012 | the Technology Fund since inception. |
| 101 Federal Street | | for the Funds (or | |
| Suite 1900 | | Predecessor Funds) | Mr. Aylesworth previously served as |
| Boston, MA 02110 | | | Executive Vice President of The FBR |
| | | | Funds from 1999 to October 2012. |
| | | | |
Ryan Kelley(1) | Portfolio Manager | 1 year term | Mr. Kelley has been a Portfolio Manager |
| Age: 42 | and | | of the Gas Utility Index Fund (formerly |
| Address: | Vice President | Served since | the FBR Gas Utility Index Fund), the |
| c/o Hennessy Advisors, Inc. | | March 2013 | Small Cap Financial Fund (formerly the |
| 1340 Environ Way | | for the Funds (or | FBR Small Cap Financial Fund), and the |
| Chapel Hill, NC 27517 | | Predecessor Funds) | Large Cap Financial Fund (formerly the |
| | | | FBR Large Cap Financial Fund) since |
| | | | October 2014. From March 2013 |
| | | | through September 2014, he served |
| | | | as a Co-Portfolio Manager of the same |
| | | | funds. Prior to that, he was a Portfolio |
| | | | Analyst of the Hennessy Funds. |
| | | | |
| | | | Mr. Kelley previously served as Portfolio |
| | | | Manager of The FBR Funds from |
| | | | January 2008 to October 2012. |
| (1) | All Officers of the Hennessy Funds and employees of the Manager are Interested Persons of the Funds. |
HENNESSY FUNDS 1-800-966-4354
Expense Example (Unaudited)
October 31, 2014
As a shareholder of the Fund, you incur two types of costs: (1) transaction costs, including sales charges (loads) on purchase payments, reinvested dividends, or other distributions; redemption fees; and exchange fees; and (2) ongoing costs, including management fees; service fees; and other Fund expenses. This Example is intended to help you understand your ongoing costs (in dollars) of investing in the Fund and to compare these costs with the ongoing costs of investing in other mutual funds. The Example is based on an investment of $1,000 invested at the beginning of the period and held for the entire period from May 1, 2014 through October 31, 2014.
Actual Expenses
The first line of the table below under the “Investor Class” and “Institutional Class” headings provides information about actual account values and actual expenses. Although the Fund charges no sales loads or transaction fees, you will be assessed fees for outgoing wire transfers, returned checks and stop payment orders at prevailing rates charged by U.S. Bancorp Fund Services, LLC, the Fund’s transfer agent. If you request that a redemption be made by wire transfer, currently a $15.00 fee is charged by the Fund’s transfer agent. IRA accounts will be charged a $15.00 annual maintenance fee. The example below includes, but is not limited to, management fees, shareholder servicing fees, fund accounting, custody, and transfer agent fees. However, the example below does not include portfolio trading commissions and related expenses, and other extraordinary expenses as determined under generally accepted accounting principles. You may use the information in this line, together with the amount you invested, to estimate the expenses that you paid over the period. Simply divide your account value by $1,000 (for example, an $8,600 account value divided by $1,000 = 8.6), then multiply the result by the number in the first line of the table under the “Investor Class” and “Institutional Class” headings in the column entitled “Expenses Paid During Period” to estimate the expenses you paid on your account during this period.
Hypothetical Example for Comparison Purposes
The second line of the table below under the “Investor Class” and “Institutional Class” headings provides information about hypothetical account values and hypothetical expenses based on the Fund’s actual expense ratios and an assumed rate of return of 5% per year before expenses, which is not the Fund’s actual return. The hypothetical account values and expenses may not be used to estimate the actual ending account balance or expenses you paid for the period. You may use this information to compare the ongoing costs of investing in the Fund and other funds. To do so, compare this 5% hypothetical example with the 5% hypothetical examples that appear in the shareholder reports of the other funds. Please note that the expenses shown in the table are meant to highlight your ongoing costs only and do not reflect any transactional costs, such as sales charges (loads), or exchange fees. Therefore, the second line of the table under the “Investor Class” and “Institutional Class” headings is useful in comparing ongoing costs only, and will not help you determine the relative total costs of owning different funds. In addition, if these transactional costs were included, your costs would have been higher.
| | Beginning | Ending | Expenses Paid |
| | Account Value | Account Value | During Period(1) |
| | 5/1/14 | 10/31/14 | 5/1/14 – 10/31/14 |
| Investor Class | | | |
| | | | |
| Actual | $1,000.00 | $1,061.60 | $6.50 |
| | | | |
| Hypothetical (5% return | | | |
| before expenses) | $1,000.00 | $1,018.90 | $6.36 |
| | | | |
| Institutional Class | | | |
| | | | |
| Actual | $1,000.00 | $1,063.00 | $5.10 |
| | | | |
| Hypothetical (5% return | | | |
| before expenses) | $1,000.00 | $1,020.27 | $4.99 |
| (1) | Expenses are equal to the Fund's expense ratio of 1.25% for Investor Class shares or 0.98% for Institutional Class shares, as applicable, multiplied by the average account value over the period, multiplied by 184/365 days (to reflect one-half year period). |
HENNESSY FUNDS 1-800-966-4354
Proxy Voting
A description of the policies and procedures the Fund uses to determine how to vote proxies relating to portfolio securities is available without charge: (1) by calling 1-800-966-4354; (2) on the Hennessy Funds’ website at hennessyfunds.com; or (3) on the U.S. Securities and Exchange Commission’s (the “SEC”) website at www.sec.gov. The Fund’s proxy voting record is available on both the Hennessy Funds’ website at hennessyfunds.com and the SEC’s website at www.sec.gov no later than August 31 for the prior 12 months ending June 30.
Quarterly Filings on Form N-Q
The Fund files its complete schedule of portfolio holdings with the SEC for the first and third quarters of each fiscal year on Form N-Q. The Fund’s Forms N-Q are available on the SEC’s website at www.sec.gov. The Fund’s Forms N-Q may be reviewed and copied at the SEC’s Public Reference Room in Washington, DC and information on the operation of the Public Reference Room may be obtained by calling 1-800-SEC-0330. Information included in the Fund’s Forms N-Q will also be available upon request by calling 1-800-966-4354.
Federal Tax Distribution Information
(Unaudited)
For the fiscal year ended October 31, 2014, certain dividends paid by the Fund may be subject to a maximum tax rate of 20%, as provided for by the Jobs and Growth Tax Relief Reconciliation Act of 2003. The percentage of dividends declared from ordinary income designated as qualified dividend income was 100.00%.
For corporate shareholders, the percent of ordinary income distributions qualifying for the corporate dividends received deduction for the fiscal year ended October 31, 2014 was 100.00%.
The percentage of taxable ordinary income distributions that are designated as short-term capital gain distributions under Section 871(k)(2)(C) of the Internal Revenue Code of 1986, as amended, for the Fund was 0.00%.
Householding
To help keep the Fund’s costs as low as possible, we generally deliver a single copy of most financial reports and prospectuses to shareholders who share an address, even if the accounts are registered under different names. This process, known as “householding,” does not apply to account statements. You may, of course, request an individual copy of a prospectus or financial report at any time. If you would like to receive separate mailings, please call the Administrator at 1-800-261-6950 or 1-414-765-4124 and we will begin individual delivery within 30 days of your request. If your account is held through a financial institution or other intermediary, please contact them directly to request individual delivery.
Privacy Policy
We collect the following non-public personal information about you:
| | • | information we receive from you on or in applications or other forms, correspondence, or conversations, including, but not limited to, your name, address, phone number, social security number, assets, income and date of birth; |
| | | and |
| | • | information about your transactions with us, our affiliates, or others, including, but not limited to, your account number and balance, payment history, parties to transactions, cost basis information and other financial information. |
We do not disclose any non-public personal information about our current or former shareholders to nonaffiliated third parties, except as permitted by law. For example, we are permitted by law to disclose all of the information we collect, as described above, to our Transfer Agent to process your transactions. Furthermore, we restrict access to your non-public personal information to those persons who require such information to provide products or services to you. We maintain physical, electronic and procedural safeguards that comply with federal standards to guard your non-public personal information.
In the event that you hold shares of the Fund through a financial intermediary, including, but not limited to, a broker-dealer, bank or trust company, the privacy policy of your financial intermediary would govern how your non-public personal information would be shared with nonaffiliated third parties.
HENNESSY FUNDS 1-800-966-4354
For information, questions or assistance, please call
The Hennessy Funds
1-800-966-4354 or 1-415-899-1555
INVESTMENT ADVISOR
Hennessy Advisors, Inc.
7250 Redwood Blvd., Suite 200
Novato, California 94945
ADMINISTRATOR,
TRANSFER AGENT,
DIVIDEND PAYING AGENT &
SHAREHOLDER SERVICING AGENT
U.S. Bancorp Fund Services, LLC
P.O. Box 701
Milwaukee, Wisconsin 53201-0701
CUSTODIAN
U.S. Bank N.A.
Custody Operations
1555 North River Center Dr., Suite 302
Milwaukee, Wisconsin 53212
TRUSTEES
Neil J. Hennessy
Robert T. Doyle
J. Dennis DeSousa
Gerald P. Richardson
COUNSEL
Foley & Lardner LLP
777 East Wisconsin Avenue
Milwaukee, Wisconsin 53202-5306
INDEPENDENT REGISTERED
PUBLIC ACCOUNTING FIRM
KPMG LLP
777 East Wisconsin Avenue
Milwaukee, Wisconsin 53202-5306
DISTRIBUTOR
Quasar Distributors, LLC
615 East Michigan Street
Milwaukee, Wisconsin 53202
hennessyfunds.com | 1-800-966-4354
This report has been prepared for shareholders and may be distributed to
others only if preceded or accompanied by a current prospectus.
ANNUAL REPORT
OCTOBER 31, 2014
HENNESSY TOTAL RETURN FUND
Investor Class HDOGX
hennessyfunds.com | 1-800-966-4354
(This Page Intentionally Left Blank.)
Contents
| Letter to Shareholders | | 2 |
| Performance Overview | | 4 |
| Financial Statements | | |
| Schedule of Investments | | 7 |
| Statement of Assets and Liabilities | | 11 |
| Statement of Operations | | 12 |
| Statements of Changes in Net Assets | | 14 |
| Statement of Cash Flows | | 15 |
| Financial Highlights | | 16 |
| Notes to the Financial Statements | | 18 |
| Report of Independent Registered Public Accounting Firm | | 26 |
| Trustees and Officers of the Fund | | 27 |
| Expense Example | | 32 |
| Proxy Voting | | 34 |
| Quarterly Filings on Form N-Q | | 34 |
| Federal Tax Distribution Information | | 34 |
| Householding | | 34 |
| Privacy Policy | | 35 |
HENNESSY FUNDS 1-800-966-4354
December 2014
Dear Shareholder:
As I look back at 2014, I realize that in this age of rapidly evolving technology, information is delivered and absorbed so quickly that it is difficult to remember what happened last week, let alone what’s happened over the course of an entire year. That is why I’d like to take a moment to recall some of the year’s highs and lows, economically, politically and socially, here in the U.S. and around the globe. 2014 was scarred by political partisanship, civil unrest in the U.S., Ukraine and many other countries, the arrival of terrorist group ISIS, the tragedies of school shootings and natural disasters, and the frightening outbreak of Ebola. However, there were also positive events this year: we survived a government shutdown over healthcare reform, jobs reports have been consistently, albeit anemically, improving, and home prices remained relatively stable, after recovering significantly in 2013. And, important to us here at Hennessy, our hometown team, the San Francisco Giants, won their third World Series in just five years!
A significant event for the financial industry this past year was the confirmation of Janet Yellen as Chair of the Federal Reserve, which served to calm the nerves of business and political leaders alike. I believe Yellen’s leadership will benefit U.S. business owners, as the Fed continues to be a voice of reason in a sea of political and economic rhetoric. The Fed has also supported the economy and corporate America by helping keep interest rates reasonable and low.
The stock market has continued its determined comeback from the lows of 2009, setting multiple record highs in recent months. The U.S. financial markets have provided strong returns over the past twelve-month period ended October 31, 2014, with the Dow Jones Industrial Average (DJIA) returning over 14% and S&P 500 Index returning over 17% during the period. The DJIA currently has a dividend yield of 2.2%, which is equal to that of a 10-Year U.S. Treasury, which is currently also yielding 2.2%. I continue to believe that investments in high-yielding, high-quality stocks have the potential to not only provide income but also the potential for stock price appreciation as well. Fixed income investing has run its course, in my opinion, and many individuals are currently benefiting from the return to investing in equities that possess strong fundamentals. American investors are slowly migrating from fixed income to equities. Currently, 54% of Americans invest in stocks, and I do expect this percentage to increase, especially if interest rates move higher.
For the past several years, U.S. corporations have been driving shareholder value by making acquisitions, initiating and raising dividends, investing in internal infrastructure and buying back stock. However, this year I began to see a shift from those strategies. I believe the easier to execute acquisitions are a thing of the past, and firms now have to be even more creative to execute accretive deals. I also believe that while firms may continue to initiate dividends, fewer firms will raise their dividends and fewer firms will participate in stock buyback programs going forward. What will these cash-rich companies do with their capital if they are not raising dividends or buying back stock? I believe they may begin to initiate capital expenditure programs that could truly benefit economic growth.
Liquidity and monetary conditions are supportive, causing the cost of capital to be very low. I believe firms will choose to spend capital to expand their sales, and they may even begin to hire in earnest. Once a company begins to move in this way, the cost to
defer becomes real for competitors. With almost $3 trillion in cash and short-term investments sitting on the balance sheets of the S&P 500 companies, a strategic shift by firms to spend their idle capital, while slow, could potentially further economic growth in the U.S. in my opinion.
Economic progress and growth remain slow, yet steady, and unemployment, though improving, remains high. Oil prices have fallen, giving consumers a bit more discretionary income. While the midterm elections may not end all of the gridlock in Washington, hopefully we will receive clarity on the political headwinds of taxes and regulations, which have not improved over the past several years.
The markets have had several quarters without any truly significant downturn. The pullbacks we recently experienced, most notably in July and October, were short-lived, as evidenced by the quick rebound to record high market levels. I firmly believe that we are in a secular bull market, and I continue to tell investors to try to remain calm in the face of volatility and continue to focus on the strong, long-term fundamentals that are evident in the market today. Many companies continue to have strong balance sheets, with record cash flows and profits. With this current bull market in its fifth year, investors should expect some volatility.
I am encouraged by the strong returns for the major U.S. financial market indices and by the performance of the Hennessy Funds over the past year. Thank you for your continued confidence and investment in our products. If you have any questions or would like to speak with us directly, please don’t hesitate to call us at (800) 966-4354.
Best regards,
Neil J. Hennessy
President and Chief Investment Officer
Past performance does not guarantee future results.
Mutual fund investing involves risk. Principal loss is possible.
Opinions expressed are those of Neil Hennessy and are subject to change, are not guaranteed and should not be considered investment advice.
The Dow Jones Industrial Average and S&P 500 Index are unmanaged indices commonly used to measure the performance of U.S. stocks. One cannot invest directly in an index.
Cash flow can be used as an indication of a company’s financial strength. A firm’s cash flow is the movement of cash in and out of the firm in the form of payments to suppliers and collections from customers. Dividend Yield is calculated as the annual dividends paid by a company divided by the price of a share of their stock.
HENNESSY FUNDS 1-800-966-4354
The opinions expressed in the following commentary reflect those of the Portfolio Managers as of the date written. Any such opinions are subject to change based on market or other conditions and are not guaranteed. These opinions may not be relied upon as investment advice. Investment decisions for the Fund are based on multiple factors, and may not be relied upon as an indication of trading intent on behalf of the Fund. Security positions can and do change.
CHANGE IN VALUE OF $10,000 INVESTMENT
This chart assumes an initial gross investment of $10,000 made on October 31, 2004. Returns shown include the reinvestment of all dividends. Returns shown do not reflect the deduction of taxes that a shareholder would pay on Fund distributions or the redemption of Fund shares.
AVERAGE ANNUAL TOTAL RETURN FOR PERIODS ENDED OCTOBER 31, 2014
| | One | Five | Ten |
| | Year | Years | Years |
| Hennessy Total | | | |
| Return Fund (HDOGX) | 8.15% | 12.49% | 5.93% |
| 75/25 Blended DJIA/Treasury Index* | 10.78% | 11.47% | 6.87% |
| Dow Jones Industrial Average | 14.48% | 15.30% | 8.42% |
Expense ratio: 1.37%
Performance data quoted represents past performance; past performance does not guarantee future results. The investment return and principal value of an investment will fluctuate so that an investor’s shares, when redeemed, may be worth more or less than their original cost. Current performance of the Fund may be lower or higher than the performance quoted. Performance data current to the most recent month end may be obtained by visiting hennessyfunds.com.
The expense ratio presented is from the most recent prospectus.
| * | The 75/25 Blended DJIA/Treasury Index consists of 75% common stocks represented by the Dow Jones Industrial Average and 25% short-duration Treasury securities represented by the BofA Merrill Lynch 90-day U.S. Treasury Bill Index. |
PERFORMANCE NARRATIVE
Portfolio Managers Neil Hennessy and Brian Peery
Over the previous twelve months, how did the Fund perform and what factors contributed to this performance?
For the twelve-month period ended October 31, 2014, the Hennessy Total Return Fund returned 8.15%, underperforming the 75/25 Blended DJIA/Treasury Index*, the Dow Jones Industrial Average and the Morningstar Large Value Category Average, which returned 10.78%, 14.48% and 13.60% for the same period, respectively.
While the Fund’s roughly 25% weighting in U.S. Treasuries was a detriment to overall performance compared to its equity benchmarks, the Fund’s relative underperformance compared to the 75/25 Blended DJIA/Treasury Index was due to stock selection. Four names which added strongly to the overall performance of the Dow Jones Industrial Average were not present in our portfolio due to their low dividend yields: UnitedHealth Group, Inc., Nike, Inc., The Walt Disney Company and Home Depot, Inc., all of which posted returns north of 20% for the year.
During the period, 15 of the Fund’s 19 equity positions had positive returns, with only Pfizer, Hewlett-Packard Company, McDonald’s and Kraft Foods Group, Inc. posting negative returns. Although Hewlett-Packard Company and Kraft Foods Group, Inc. are no longer members of the Dow Jones Industrial Average, both stocks remained in the Fund’s portfolio until the Fund was rebalanced. When the portfolio was rebalanced, the newest “Dogs of the Dow” stocks replaced those stocks no longer in the index.
While the Fund’s portfolio may underperform its benchmarks in periods where equities rise sharply, the strategy attempts to capture near market returns with a lower risk profile, since only approximately 75% of the Fund’s assets are invested in equities. Conversely, if equity markets were to fall sharply, we would expect the Fund to perform better than its equity benchmarks due to its approximately 25% exposure to short-term U.S. Treasuries. Ultimately, the overall goal of this portfolio is to capture near-market upside performance while mitigating some of the potential market downside risk.
Additional Portfolio Manager commentary and related investment outlook:
We continue to believe that the Dow Jones Industrial Average stocks, and in particular the stocks comprising the high dividend- yielding “Dogs of the Dow” (the methodology employed within the Fund), provide an excellent way to gain equity exposure to the markets. With U.S. Treasury yields still trading near historic lows, many investors are seeking high quality, dividend-paying companies as a means of generating current income. We believe that the rotation out of bonds and into equities, where investors have historically received higher yields and have the potential for capital appreciation, will likely continue.
As the market reaches new highs and investors become more wary of a potential pullback, we believe that a trend of moving some money away from more risky asset classes and into the perceived “safety” of very large dividend-paying companies should prevail. We believe the Fund is well positioned for the more moderately conservative investor, as the equity portion of the portfolio holds what we would deem to be high-quality, high dividend-paying companies, while the short duration of the Treasury component (all less than three months) will allow us the ability to roll into higher yielding treasuries in the event yields continue to rise.
| * | The 75/25 Blended DJIA/Treasury Index consists of 75% common stocks represented by the Dow Jones Industrial Average and 25% short-duration Treasury securities represented by the BofA Merrill Lynch 90-day U.S. Treasury Bill Index. The Dow Jones Industrial Average is an unmanaged index commonly used to measure the performance of U.S. stocks. The BofA Merrill Lynch 90-day |
HENNESSY FUNDS 1-800-966-4354
| | U.S. Treasury Bill Index is an unmanaged index of Treasury securities maturing in 90 days. You cannot invest directly in an index. Performance data for an index does not reflect any deductions for fees, expenses or taxes. The Fund is non-diversified, meaning it concentrates its assets in fewer individual holdings than a diversified fund and is therefore more exposed to individual stock volatility than a diversified fund. The Fund’s portfolio is rebalanced annually in accordance with its strategy, which may result in the elimination of better performing assets from the Fund’s investments and increases in investments with relatively lower total return. References to specific securities should not be considered a recommendation to buy or sell any security. Fund holdings and sector allocations are subject to change. Please refer to the Schedule of Investments included in this report for additional portfolio information. |
Each Morningstar category average represents a universe of funds with similar investment objectives. © Morningstar, Inc. All Rights Reserved. The information contained herein: 1) is proprietary to Morningstar; 2) may not be copied or distributed and 3) is not warranted to be accurate, complete or timely. Neither Morningstar nor its content providers are responsible for any damages or losses arising from any use of this information. Past performance does not guarantee future results.
Financial Statements
HENNESSY TOTAL RETURN FUND
As of October 31, 2014
(% of Net Assets)
| TOP TEN HOLDINGS | % NET ASSETS |
| | |
| U.S. Treasury Bill, 0.010%, 01/15/2015 | 27.42% |
| U.S. Treasury Bill, 0.010%, 12/26/2014 | 21.46% |
| U.S. Treasury Bill, 0.030%, 11/20/2014 | 14.30% |
| Merck & Co., Inc. | 7.46% |
| Verizon Communications, Inc. | 7.23% |
| Pfizer, Inc. | 7.03% |
| Chevron Corp. | 6.98% |
| McDonald’s Corp. | 6.92% |
| AT&T, Inc. | 6.91% |
| Procter & Gamble Co. | 6.19% |
Note: For presentation purposes, the Fund has grouped some of the industry categories. For purposes of categorizing securities for compliance with Section 8(b)(1) of the Investment Company Act of 1940, the Fund uses more specific industry classifications.
HENNESSY FUNDS 1-800-966-4354
| | COMMON STOCKS – 73.30% | | Number | | | | | | % of | |
| | | | of Shares | | | Value | | | Net Assets | |
| | Consumer Discretionary – 6.92% | | | | | | | | | |
| | McDonald’s Corp. | | | 61,900 | | | $ | 5,801,887 | | | | 6.92 | % |
| | | | | | | | | | | | | | |
| | Consumer Staples – 9.26% | | | | | | | | | | | | |
| | Procter & Gamble Co. | | | 59,500 | | | | 5,192,565 | | | | 6.19 | % |
| | The Coca-Cola Co. | | | 61,600 | | | | 2,579,808 | | | | 3.07 | % |
| | | | | | | | | 7,772,373 | | | | 9.26 | % |
| | | | | | | | | | | | | | |
| | Energy – 9.10% | | | | | | | | | | | | |
| | Chevron Corp. | | | 48,800 | | | | 5,853,560 | | | | 6.98 | % |
| | Exxon Mobil Corp. | | | 18,400 | | | | 1,779,464 | | | | 2.12 | % |
| | | | | | | | | 7,633,024 | | | | 9.10 | % |
| | | | | | | | | | | | | | |
| | Health Care – 14.49% | | | | | | | | | | | | |
| | Merck & Co., Inc. | | | 108,100 | | | | 6,263,314 | | | | 7.46 | % |
| | Pfizer, Inc. | | | 196,900 | | | | 5,897,155 | | | | 7.03 | % |
| | | | | | | | | 12,160,469 | | | | 14.49 | % |
| | | | | | | | | | | | | | |
| | Industrials – 5.92% | | | | | | | | | | | | |
| | General Electric Co. | | | 192,300 | | | | 4,963,263 | | | | 5.92 | % |
| | | | | | | | | | | | | | |
| | Information Technology – 12.01% | | | | | | | | | | | | |
| | Cisco Systems, Inc. | | | 211,100 | | | | 5,165,617 | | | | 6.16 | % |
| | Intel Corp. | | | 100,700 | | | | 3,424,807 | | | | 4.08 | % |
| | Microsoft Corp. | | | 31,700 | | | | 1,488,315 | | | | 1.77 | % |
| | | | | | | | | 10,078,739 | | | | 12.01 | % |
| | | | | | | | | | | | | | |
| | Materials – 1.46% | | | | | | | | | | | | |
| | EI Du Pont de Nemours & Co. | | | 17,700 | | | | 1,223,955 | | | | 1.46 | % |
| | | | | | | | | | | | | | |
| | Telecommunication Services – 14.14% | | | | | | | | | | | | |
| | AT&T, Inc. | | | 166,400 | | | | 5,797,376 | | | | 6.91 | % |
| | Verizon Communications, Inc. | | | 120,700 | | | | 6,065,175 | | | | 7.23 | % |
| | | | | | | | | 11,862,551 | | | | 14.14 | % |
| | | | | | | | | | | | | | |
| | Total Common Stocks | | | | | | | | | | | | |
| | (Cost $50,493,028) | | | | | | | 61,496,261 | | | | 73.30 | % |
The accompanying notes are an integral part of these financial statements.
| | SHORT-TERM INVESTMENTS – 66.49% | | Number of Shares/ | | | | | | % of | |
| | | | Par Amount | | | Value | | | Net Assets | |
| | Money Market Funds – 3.31% | | | | | | | | | |
| | Fidelity Government Portfolio – | | | | | | | | | |
| | Institutional Class, 0.01% (a) | | | 2,777,460 | | | $ | 2,777,460 | | | | 3.31 | % |
| | | | | | | | | | | | | | |
| | U.S. Treasury Bills (c) – 63.18% | | | | | | | | | | | | |
| | 0.030%, 11/20/2014 (b) | | | 12,000,000 | | | | 11,999,873 | | | | 14.30 | % |
| | 0.010%, 12/26/2014 (b) | | | 18,000,000 | | | | 17,999,972 | | | | 21.46 | % |
| | 0.010%, 01/15/2015 (b) | | | 23,000,000 | | | | 22,999,541 | | | | 27.42 | % |
| | | | | | | | | 52,999,386 | | | | 63.18 | % |
| | | | | | | | | | | | | | |
| | Total Short-Term Investments | | | | | | | | | | | | |
| | (Cost $55,776,827) | | | | | | | 55,776,846 | | | | 66.49 | % |
| | | | | | | | | | | | | | |
| | Total Investments | | | | | | | | | | | | |
| | (Cost $106,269,855) – 139.79% | | | | | | | 117,273,107 | | | | 139.79 | % |
| | Liabilities in Excess | | | | | | | | | | | | |
| | of Other Assets – (39.79)% | | | | | | | (33,378,316 | ) | | | (39.79 | )% |
| | TOTAL NET ASSETS – 100.00% | | | | | | $ | 83,894,791 | | | | 100.00 | % |
Percentages are stated as a percent of net assets.
| | (a) | The rate listed is the fund’s 7-day yield as of October 31, 2014. |
| | (b) | The rate listed is discount rate at issue. |
| | (c) | Collateral or partial collateral for securities sold subject to repurchase. |
The accompanying notes are an integral part of these financial statements.
HENNESSY FUNDS 1-800-966-4354
Summary of Fair Value Exposure at October 31, 2014
The following is a summary of the inputs used to value the Fund’s net assets as of October 31, 2014 (See Note 3 in the accompanying notes to the financial statements):
| Common Stocks | | Level 1 | | | Level 2 | | | Level 3 | | | Total | |
| Consumer Discretionary | | $ | 5,801,887 | | | $ | — | | | $ | — | | | $ | 5,801,887 | |
| Consumer Staples | | | 7,772,373 | | | | — | | | | — | | | | 7,772,373 | |
| Energy | | | 7,633,024 | | | | — | | | | — | | | | 7,633,024 | |
| Health Care | | | 12,160,469 | | | | — | | | | — | | | | 12,160,469 | |
| Industrials | | | 4,963,263 | | | | — | | | | — | | | | 4,963,263 | |
| Information Technology | | | 10,078,739 | | | | — | | | | — | | | | 10,078,739 | |
| Materials | | | 1,223,955 | | | | — | | | | — | | | | 1,223,955 | |
| Telecommunication Services | | | 11,862,551 | | | | — | | | | — | | | | 11,862,551 | |
| Total Common Stocks | | $ | 61,496,261 | | | $ | — | | | $ | — | | | $ | 61,496,261 | |
| Short-Term Investments | | | | | | | | | | | | | | | | |
| Money Market Funds | | $ | 2,777,460 | | | $ | — | | | $ | — | | | $ | 2,777,460 | |
| U.S. Treasury Bills | | | — | | | | 52,999,386 | | | | — | | | | 52,999,386 | |
| Total Short-Term Investments | | $ | 2,777,460 | | | $ | 52,999,386 | | | $ | — | | | $ | 55,776,846 | |
| Total Investments in Securities | | $ | 64,273,721 | | | $ | 52,999,386 | | | $ | — | | | $ | 117,273,107 | |
Transfers between levels are recognized at the end of the reporting period. During the one-year period ended October 31, 2014, the Fund recognized no transfers between levels.
Schedule of Reverse Repurchase Agreements
| | | | | Principal | Maturity | | Maturity | |
| Face Value | | Counterparty | Rate | Trade Date | Date | | Amount | |
| $ | 8,095,500 | | Jefferies LLC | 0.25% | 8/22/14 | 11/20/14 | | $ | 8,100,560 | |
| | 10,794,000 | | Jefferies LLC | 0.25% | 9/26/14 | 12/26/14 | | | 10,800,821 | |
| | 14,392,000 | | Jefferies LLC | 0.25% | 10/17/14 | 1/15/15 | | | 14,400,995 | |
| $ | 33,281,500 | | | | | | | $ | 33,302,376 | |
As of October 31, 2014, the fair value of securities held as collateral for reverse repurchase agreements was $52,999,386 as noted on the Schedule of Investments.
The accompanying notes are an integral part of these financial statements.
Financial Statements
Statement of Assets and Liabilities as of October 31, 2014 |
| ASSETS: | | | |
| Investments in securities, at value (cost $106,269,855) | | $ | 117,273,107 | |
| Cash | | | 570 | |
| Dividends and interest receivable | | | 181,245 | |
| Receivable for fund shares sold | | | 33,150 | |
| Prepaid expenses and other assets | | | 9,830 | |
| Total Assets | | | 117,497,902 | |
| | | | | |
| LIABILITIES: | | | | |
| Payable for fund shares redeemed | | | 124,019 | |
| Payable to advisor | | | 41,899 | |
| Payable to administrator | | | 18,925 | |
| Payable to auditor | | | 18,590 | |
| Accrued distribution fees | | | 62,177 | |
| Accrued service fees | | | 6,983 | |
| Reverse repurchase agreements | | | 33,281,500 | |
| Accrued interest payable | | | 7,958 | |
| Accrued trustees fees | | | 1,732 | |
| Accrued expenses and other payables | | | 39,328 | |
| Total Liabilities | | | 33,603,111 | |
| NET ASSETS | | $ | 83,894,791 | |
| | | | | |
| NET ASSETS CONSIST OF: | | | | |
| Capital stock | | $ | 67,153,473 | |
| Accumulated net investment income | | | 111,389 | |
| Accumulated net realized gain on investments | | | 5,626,677 | |
| Unrealized net appreciation on investments | | | 11,003,252 | |
| Total Net Assets | | $ | 83,894,791 | |
| | | | | |
| NET ASSETS | | | | |
| Investor Class: | | | | |
| Shares authorized (no par value) | | Unlimited | |
| Net assets applicable to outstanding Investor Class shares | | $ | 83,894,791 | |
| Shares issued and outstanding | | | 5,493,576 | |
| Net asset value, offering price and redemption price per share | | $ | 15.27 | |
The accompanying notes are an integral part of these financial statements.
HENNESSY FUNDS 1-800-966-4354
Financial Statements
Statement of Operations for the year ended October 31, 2014 |
| INVESTMENT INCOME: | | | |
| Dividend income | | $ | 2,260,573 | |
| Interest income | | | 15,008 | |
| Total investment income | | | 2,275,581 | |
| | | | | |
| EXPENSES: | | | | |
| Investment advisory fees (See Note 5) | | | 515,887 | |
| Administration, fund accounting, custody and transfer agent fees | | | 155,721 | |
| Distribution fees – Investor Class (See Note 5) | | | 128,971 | |
| Service fees – Investor Class (See Note 5) | | | 85,981 | |
| Interest expense (See Notes 6 and 8) | | | 84,410 | |
| Sub-transfer agent expenses – Investor Class (See Note 5) | | | 74,290 | |
| Federal and state registration fees | | | 27,895 | |
| Compliance expense | | | 21,488 | |
| Audit fees | | | 20,557 | |
| Reports to shareholders | | | 16,655 | |
| Trustees’ fees and expenses | | | 6,682 | |
| Legal fees | | | 1,870 | |
| Other expenses | | | 10,469 | |
| Total expenses | | | 1,150,876 | |
| NET INVESTMENT INCOME | | $ | 1,124,705 | |
| | | | | |
| REALIZED AND UNREALIZED GAINS (LOSSES): | | | | |
| Net realized gain on investments | | $ | 7,876,199 | |
| Net change in unrealized depreciation on investments | | | (2,312,252 | ) |
| Net gain on investments | | | 5,563,947 | |
| NET INCREASE IN NET ASSETS RESULTING FROM OPERATIONS | | $ | 6,688,652 | |
The accompanying notes are an integral part of these financial statements.
(This Page Intentionally Left Blank.)
HENNESSY FUNDS 1-800-966-4354
Financial Statements
| Statements of Changes in Net Assets |
| | | Year Ended | | | Year Ended | |
| | | October 31, 2014 | | | October 31, 2013 | |
| OPERATIONS: | | | | | | |
| Net investment income | | $ | 1,124,705 | | | $ | 945,157 | |
| Net realized gain on investments | | | 7,876,199 | | | | 4,930,184 | |
| Net change in unrealized | | | | | | | | |
| appreciation (depreciation) on investments | | | (2,312,252 | ) | | | 4,920,747 | |
| Net increase in net assets resulting from operations | | | 6,688,652 | | | | 10,796,088 | |
| | | | | | | | | |
| DISTRIBUTIONS TO SHAREHOLDERS FROM: | | | | | | | | |
| Net investment income – Investor Class | | | (1,079,733 | ) | | | (957,145 | ) |
| Total distributions | | | (1,079,733 | ) | | | (957,145 | ) |
| | | | | | | | | |
| CAPITAL SHARE TRANSACTIONS: | | | | | | | | |
| Proceeds from shares subscribed – Investor Class | | | 6,812,637 | | | | 21,431,210 | |
| Dividends reinvested – Investor Class | | | 1,006,867 | | | | 873,732 | |
| Cost of shares redeemed – Investor Class | | | (19,774,754 | ) | | | (19,573,550 | ) |
| Net increase (decrease) in net assets derived | | | | | | | | |
| from capital share transactions | | | (11,955,250 | ) | | | 2,731,392 | |
| TOTAL INCREASE (DECREASE) IN NET ASSETS | | | (6,346,331 | ) | | | 12,570,335 | |
| | | | | | | | | |
| NET ASSETS: | | | | | | | | |
| Beginning of year | | | 90,241,122 | | | | 77,670,787 | |
| End of year | | $ | 83,894,791 | | | $ | 90,241,122 | |
| Undistributed net investment income, end of year | | $ | 111,389 | | | $ | 66,417 | |
| | | | | | | | | |
| CHANGES IN SHARES OUTSTANDING: | | | | | | | | |
| Shares sold – Investor Class | | | 461,575 | | | | 1,551,829 | |
| Shares issued to holders as | | | | | | | | |
| reinvestment of dividends – Investor Class | | | 67,319 | | | | 64,334 | |
| Shares redeemed – Investor Class | | | (1,344,123 | ) | | | (1,451,726 | ) |
| Net increase (decrease) in shares outstanding | | | (815,229 | ) | | | 164,437 | |
The accompanying notes are an integral part of these financial statements.
Financial Statements
Statement of Cash Flows for the Year Ended October 31, 2014 |
| Cash flows from operating activities: | | | |
| Net increase in net assets from operations | | $ | 6,688,652 | |
| Adjustments to reconcile net increase in net assets from | | | | |
| operations to net cash provided by operating activities: | | | | |
| Payments to purchase securities | | | (14,437,534 | ) |
| Proceeds from sale of securities | | | 22,729,643 | |
| Purchase sale of short term investments, net | | | 4,570,835 | |
| Realized gain on investments in securities | | | (7,876,199 | ) |
| Net accretion of discount on securities | | | (14,780 | ) |
| Change in unrealized depreciation on investments in securities | | | 2,312,252 | |
| Increases decreases in operating assets: | | | | |
| Increase in dividends and interest receivable | | | (22,384 | ) |
| Decrease in prepaid expenses and other assets | | | 7,727 | |
| Increases (decreases) in operating liabilities: | | | | |
| Decrease in payable to advisor | | | (3,444 | ) |
| Decrease in payable to administrator | | | (24,621 | ) |
| Increase in accrued distribution fees | | | 9,201 | |
| Decrease in accrued service fees | | | (574 | ) |
| Decrease in accrued interest payable | | | (2,169 | ) |
| Increase in accrued audit fees | | | 1,723 | |
| Decrease in accrued trustee fees | | | (2 | ) |
| Increase in other accrued expenses and payables | | | 3,828 | |
| Net cash provided by operating activities | | | 13,942,154 | |
| | | | | |
| Cash flows from financing activities: | | | | |
| Increase in reverse repurchase agreements | | | (899,500 | ) |
| Proceeds from shares sold | | | 6,806,742 | |
| Payment on shares redeemed | | | (19,775,960 | ) |
| Distributions paid in cash, net of reinvestments | | | (72,866 | ) |
| Net cash used in financing activities | | | (13,941,584 | ) |
| Net increase in cash | | | 570 | |
| | | | | |
| Cash: | | | | |
| Beginning balance | | | — | |
| Ending balance | | $ | 570 | |
| | | | | |
| Supplemental information: | | | | |
| Non-cash financing activities consisting of | | | | |
| reinvestment of dividends and distributions | | $ | 1,006,867 | |
| Proceeds from securities litigation | | | 55,442 | |
| | | | | |
| Cash paid for interest | | $ | 86,579 | |
The accompanying notes are an integral part of these financial statements.
HENNESSY FUNDS 1-800-966-4354
Financial Statements
For an Investor Class share outstanding throughout each year
PER SHARE DATA:
Net asset value, beginning of year
Income from investment operations:
Net investment income
Net realized and unrealized gains on investments
Total from investment operations
Less distributions:
Dividends from net investment income
Total distributions
Net asset value, end of year
TOTAL RETURN
SUPPLEMENTAL DATA AND RATIOS:
Net assets, end of year (millions)
Gross ratio of expenses, including interest expense, to average net assets
Ratio of interest expense to average net assets
Net ratio of expenses, excluding interest expense, to average net assets
Ratio of net investment income to average net assets
Portfolio turnover rate
The accompanying notes are an integral part of these financial statements.
| Year Ended October 31, | |
| 2014 | | | 2013 | | | 2012 | | | 2011 | | | 2010 | |
| | | | | | | | | | | | | | |
| $ | 14.30 | | | $ | 12.64 | | | $ | 11.47 | | | $ | 10.57 | | | $ | 9.10 | |
| | | | | | | | | | | | | | | | | | | |
| | | | | | | | | | | | | | | | | | | |
| | 0.20 | | | | 0.16 | | | | 0.18 | | | | 0.18 | | | | 0.16 | |
| | 0.96 | | | | 1.66 | | | | 1.17 | | | | 0.89 | | | | 1.48 | |
| | 1.16 | | | | 1.82 | | | | 1.35 | | | | 1.07 | | | | 1.64 | |
| | | | | | | | | | | | | | | | | | | |
| | | | | | | | | | | | | | | | | | | |
| | (0.19 | ) | | | (0.16 | ) | | | (0.18 | ) | | | (0.17 | ) | | | (0.17 | ) |
| | (0.19 | ) | | | (0.16 | ) | | | (0.18 | ) | | | (0.17 | ) | | | (0.17 | ) |
| $ | 15.27 | | | $ | 14.30 | | | $ | 12.64 | | | $ | 11.47 | | | $ | 10.57 | |
| | | | | | | | | | | | | | | | | | | |
| | 8.15 | % | | | 14.49 | % | | | 11.78 | % | | | 10.22 | % | | | 18.09 | % |
| | | | | | | | | | | | | | | | | | | |
| | | | | | | | | | | | | | | | | | | |
| $ | 83.89 | | | $ | 90.24 | | | $ | 77.67 | | | $ | 64.13 | | | $ | 69.08 | |
| | 1.34 | % | | | 1.37 | % | | | 1.37 | % | | | 1.34 | % | | | 1.33 | % |
| | 0.10 | % | | | 0.10 | % | | | 0.08 | % | | | 0.10 | % | | | 0.08 | % |
| | 1.24 | % | | | 1.27 | % | | | 1.29 | % | | | 1.24 | % | | | 1.25 | % |
| | 1.31 | % | | | 1.16 | % | | | 1.44 | % | | | 1.56 | % | | | 1.62 | % |
| | 23 | % | | | 31 | % | | | 22 | % | | | 21 | % | | | 41 | % |
The accompanying notes are an integral part of these financial statements.
HENNESSY FUNDS 1-800-966-4354
Notes to Financial Statements October 31, 2014 |
1). ORGANIZATION
The Hennessy Total Return Fund (the “Fund”) is a series of Hennessy Funds Trust (the “Trust”), which was organized as a Delaware statutory trust on September 17, 1992. The Fund is an open-end management investment company registered under the Investment Company Act of 1940, as amended. The Fund is a successor to a fund with the same name (the “Predecessor Fund”) that was a series of The Hennessy Funds, Inc., a Maryland corporation, pursuant to a reorganization that took place after the close of business on February 28, 2014. Prior to February 28, 2014, the Fund had no investment operations. As a result of the reorganization, holders of the Investor Class shares of the Predecessor Fund received Investor Class shares of the Fund (the Investor Class shares of the Fund are the successor to the accounting and performance information of the Predecessor Fund). The investment objective of the Fund is total return, consisting of capital appreciation and current income. The Fund is a non-diversified fund.
The Fund offers Investor Class shares. Prior to October 26, 2012, the Investor Class shares were known as Original Class shares.
2). SIGNIFICANT ACCOUNTING POLICIES
The following is a summary of significant accounting policies consistently followed by the Fund in the preparation of the financial statements. These policies are in conformity with U.S. generally accepted accounting principles (“GAAP”).
| a). | Investment Valuation – All investments in securities are recorded at their estimated fair value, as described in Note 3. |
| | |
| b). | Federal Income Taxes – Provision for federal income taxes or excise taxes has not been made since the Fund has elected to be taxed as a “regulated investment company” and intends to distribute substantially all of its taxable income to its shareholders and otherwise comply with the provisions of the Internal Revenue Code of 1986, as amended, applicable to regulated investment companies. Net investment income or loss and realized gains and losses for federal income tax purposes may differ from that reported on the financial statements because of temporary book and tax basis differences. Temporary differences are primarily the result of the treatment of wash sales for tax reporting purposes. Distributions from net realized gains for book purposes may include short-term capital gains, which are included as ordinary income to shareholders for tax purposes. |
| | |
| c). | Income and Expenses – Dividend income is recognized on the ex-dividend date or as soon as information is available to the Fund. Interest income, which includes the amortization of premium and accretion of discount, is recognized on an accrual basis. The Fund is charged for those expenses that are directly attributable to the portfolio, such as advisory, administration, and certain shareholder service fees. |
| | |
| d). | Distributions to Shareholders – Dividends from net investment income for the Fund, if any, are declared and paid out on a calendar quarter basis. Distributions of net realized capital gains, if any, are declared and paid annually, usually in November or December. |
| | |
| e). | Security Transactions – Investment and shareholder transactions are recorded on the trade date. The Fund determines the gain or loss realized from the investment |
| | transactions by comparing the original cost of the security lot sold with the net sale proceeds. Discounts and premiums on securities purchased are accreted/amortized over the life of the respective security. |
| | |
| f). | Use of Estimates – The preparation of financial statements in conformity with GAAP requires management to make estimates and assumptions that affect the reported amounts of assets and liabilities and disclosure of contingent assets and liabilities at the date of the financial statements and the reported change in net assets during the reporting period. Actual results could differ from those estimates. |
| | |
| g). | Share Valuation – The net asset value (“NAV”) per share of the Fund is calculated by dividing the sum of the value of the securities held by the Fund, plus cash or other assets, minus all liabilities (including estimated accrued expenses) by the total number of shares outstanding for the Fund, rounded to the nearest cent. The Fund’s shares will not be priced on days the New York Stock Exchange is closed for trading. The offering and redemption price per share for the Fund is equal to the Fund’s NAV per share. |
| | |
| h). | Repurchase Agreements – The Fund may enter into repurchase agreements with member banks or security dealers of the Federal Reserve Board whom the investment advisor deems creditworthy. The repurchase price generally equals the price paid by the Fund plus interest negotiated on the basis of current short-term rates. |
| | |
| | Securities pledged as collateral for repurchase agreements are held by the custodian bank until the respective agreements mature. Provisions of the repurchase agreements ensure that the market value of the collateral, including accrued interest thereon, is sufficient to cover the repurchase amount in the event of default of the counterparty. If the counterparty defaults and the value of the collateral declines or if the counterparty enters an insolvency proceeding, realization of the collateral by the Fund may be delayed or limited. |
| | |
| i). | Accounting for Uncertainty in Income Taxes – The Fund has adopted accounting policies regarding recognition and measurement of tax positions taken or expected to be taken on a tax return. The tax returns of the Fund for the prior three fiscal years are open for examination. The Fund has reviewed all open tax years in major jurisdictions and concluded that there is no impact on the Fund’s net assets and no tax liability resulting from unrecognized tax benefits relating to uncertain income tax positions taken or expected to be taken on a tax return. The Fund’s major tax jurisdictions are U.S. federal and Delaware. |
| | |
| j). | Derivatives – The Fund may invest in, or enter into, derivatives, such as options, futures contracts, options on futures contracts, and swaps, for a variety of reasons, including to hedge certain risks, to provide a substitute for purchasing or selling particular securities, or to increase potential income gain. Derivatives may provide a cheaper, quicker, or more specifically focused way for a Fund to invest than “traditional” securities would. The main purpose of utilizing these derivative instruments is for hedging purposes. |
| | |
| | The Fund has adopted the financial accounting reporting rules as required by the Derivatives and Hedging Topic of the Financial Accounting Standards Board Accounting Standards Codification. Under such rules, the Fund is required to include enhanced disclosure that enables investors to understand how and why an entity uses derivatives, how derivatives are accounted for, and how derivatives instruments affect an entity’s results of operations and financial position. During the fiscal year ended October 31, 2014, the Fund did not hold any derivative instruments. |
HENNESSY FUNDS 1-800-966-4354
| k). | Offsetting Assets and Liabilities – The Fund has adopted financial reporting rules regarding offsetting assets and liabilities and related netting arrangements to enable users of its financial statements to understand the effect of those arrangements on its financial position. Reverse repurchase transactions are entered into by the Fund under Master Repurchase Agreements (“MRA”) that permit the Fund, under certain circumstances, including an event of default (such as bankruptcy or insolvency), to offset payables under the MRA with collateral held with the counterparty and create one single net payment from the Fund. Upon a bankruptcy or insolvency of the MRA counterparty, the Fund is considered an unsecured creditor with respect to excess collateral and, as such, the return of excess collateral may be delayed. In the event the buyer of securities under an MRA files for bankruptcy or becomes insolvent, the Fund’s use of the proceeds of the agreement may be restricted while the other party, or its trustee or receiver, determines whether or not to enforce the Fund’s obligation to repurchase the securities. For additional information regarding the offsetting of assets and liabilities at October 31, 2014, please reference the table in Note 8. |
| | |
| l). | Events Subsequent to the Fiscal Period End – The Fund has adopted financial reporting rules regarding subsequent events that require an entity to recognize in the financial statements the effects of all subsequent events that provide additional evidence about conditions that existed at the date of the balance sheet. Management has evaluated the Fund’s related events and transactions that occurred subsequent to October 31, 2014 through the date of issuance of the Fund’s financial statements. There were no events or transactions that occurred during this period that materially impacted the amounts or disclosures in the Fund’s financial statements. |
| | |
| m). | New Accounting Pronouncements – In June 2014, the Financial Accounting Standard Board (“FASB”) issued Accounting Standard Update (“ASU”) No. 2014-11 “Repurchase-to-Maturity Transactions, Repurchase Financings, and Disclosure.” ASU No. 2014-11 makes limited changes to the accounting for repurchase agreements, clarifies when repurchase agreements and securities lending transactions should be accounting for as secured borrowings, and requires additional disclosures regarding these types of transactions. The guidance is effective for fiscal years beginning on or after December 15, 2014, and for interim periods within those fiscal years. Management is currently evaluating the impact ASU No. 2014-11 will have on the financial statement disclosures. |
3). SECURITIES VALUATION
The Fund has adopted authoritative fair valuation accounting standards that establish an authoritative definition of fair value and set out a hierarchy for measuring fair value. These standards require additional disclosures about the various inputs and valuation techniques used to develop the measurements of fair value and a discussion in changes in valuation techniques and related inputs during the period. These inputs are summarized in the three broad levels listed below:
| | Level 1 – | Quoted unadjusted prices for identical instruments in active markets to which the Fund has access at the date of measurement. |
| | | |
| | Level 2 – | Quoted prices for similar instruments in active markets; quoted prices for identical or similar instruments in markets that are not active; and model-derived valuations in which all significant inputs and significant value drivers are observable in active markets. Level 2 inputs are those in markets for which there are few transactions, the prices are not current, the prices are fair value adjusted due to post-market close subsequent events (foreign markets), little public information exists, or instances where prices |
| | | vary substantially over time or among brokered market makers. These inputs may also include interest rates, prepayment speeds, credit risk curves, default rates, and similar data. |
| | | |
| | Level 3 – | Model-derived valuations in which one or more significant inputs or significant value drivers are unobservable. Unobservable inputs are those inputs that reflect the Fund’s own assumptions about what market participants would use to price the asset or liability based on the best available information. |
Following is a description of the valuation techniques applied to the Fund’s major categories of assets and liabilities measured at fair value on a recurring basis.
Equity Securities – Equity securities, including common stocks, preferred stocks, foreign issued common stocks, exchange traded funds, closed-end mutual funds, and real estate investment trusts, that are traded on a securities exchange for which a last-quoted sales price is readily available will generally be valued at the last sales price as reported by the primary exchange on which the securities are listed. Securities listed on The NASDAQ Stock Market (“NASDAQ”) will be valued at the NASDAQ Official Closing Price, which may differ from the last sales price reported. Securities traded on a securities exchange for which a last-quoted sales price is not readily available will generally be valued at the mean between the bid and ask prices. To the extent these securities are actively traded and valuation adjustments are not applied, they are classified in Level 1 of the fair value hierarchy.
Investment Companies – Investments in investment companies (e.g., mutual funds and exchange traded funds) are generally priced at the ending NAV provided by the Fund’s service agent and will be classified in Level 1 of the fair value hierarchy.
Debt Securities – Debt securities, including corporate bonds, asset-backed securities, mortgage-backed securities, municipal bonds, U.S. Treasuries, and U.S. government agency issues, are valued at market on the basis of valuations furnished by an independent pricing service that utilizes both dealer-supplied valuations and formula-based techniques. The pricing service may consider recently executed transactions in securities of the issuer or comparable issuers, market price quotations (where observable), bond spreads, and fundamental data relating to the issuer. In addition, the model may incorporate market observable data such as reported sales of similar securities, broker quotes, yields, bids, offers, and reference data. Certain securities are valued principally using dealer quotations. These securities are generally classified in Level 2 of the fair value hierarchy.
Short-Term Securities – Short-term equity investments, including money market funds, are valued in the manner specified above. Short-term debt investments are generally valued at amortized cost, which approximates fair market value, if their original maturity was 60 days or less, or by amortizing the values as of the 61st day prior to maturity, if their original term to maturity exceeded 60 days. Amortized cost is not used if its use would be inappropriate due to credit or other impairments of the issuer, in which the security would be fair valued, as described below. Short-term securities are generally classified in Level 1 or Level 2 of the fair market hierarchy depending on the inputs used and market activity levels for specific securities.
The Board of Trustees of the Fund (the “Board”) has adopted fair value pricing procedures that are followed when a price for a security is not readily available or if a significant event has occurred that indicates the closing price of a security no longer represents the true value of that security. Fair value pricing determinations are made in good faith in accordance with these procedures. There are numerous criteria that will be
HENNESSY FUNDS 1-800-966-4354
given consideration in determining a fair value of a security. Some of these criteria are trading volume of security and markets, the value of other like securities, and news events with direct bearing to security or market. Fair value pricing results in an estimated price for a security that reflects the amount the Fund might reasonably expect to receive in a current sale. Depending on the relative significance of the valuation inputs, these securities may be classified in either Level 2 or Level 3 of the fair value hierarchy.
The Board has delegated day-to-day valuation matters to a Valuation Committee comprised of one or more representatives from Hennessy Advisors, Inc., the Fund’s investment advisor. The function of the Valuation Committee is to value securities where current and reliable market quotations are not readily available. All actions taken by the Valuation Committee are reviewed by the Board.
The Fund has performed an analysis of all existing investments to determine the significance and character of all inputs to their fair value determination. Various inputs are used in determining the value of the Fund’s investments. The inputs or methodology used for valuing securities are not necessarily an indication of the risk associated with investing in those securities. Details related to the fair valuation hierarchy of the Fund’s securities as of October 31, 2014 are included in the Fund’s Schedule of Investments.
4). INVESTMENT TRANSACTIONS
Purchases and sales of investment securities (excluding government and short-term investments) for the Fund during the fiscal year ended October 31, 2014 were $14,437,534 and $22,674,201, respectively.
There were no purchases or sales/maturities of long-term U.S. Government Securities for the Fund during the fiscal year ended October 31, 2014.
5). INVESTMENT MANAGEMENT FEE AND OTHER TRANSACTIONS WITH AFFILIATES
Hennessy Advisors, Inc. (the “Advisor”) is the investment advisor of the Fund. The Advisor provides the Fund with investment management services under an Investment Advisory Agreement. The Advisor furnishes all investment advice, office space, facilities, and provides most of the personnel needed by the Fund. As compensation for its services, the Advisor is entitled to a monthly fee from the Fund. The fee is based upon the average daily net assets of the Fund at the annual rate of 0.60%. The net investment advisory fees payable for the Fund as of October 31, 2014 were $41,899.
The Board has approved a Shareholder Servicing Agreement for the Fund, which was instituted to compensate the Advisor for the non-investment management services it provides to the Fund. The Shareholder Servicing Agreement provides for a monthly fee paid to the Advisor at an annual rate of 0.10% of the average daily net assets of the Fund. Shareholder service fees payable for the Fund as of October 31, 2014 were $6,983.
The Fund has adopted a plan pursuant to Rule 12b-1 under the Investment Company Act of 1940, as amended, that authorizes payments in connection with the distribution of the Fund’s shares at an annual rate of up to 0.15% of the Fund’s average daily net assets. Amounts paid under the plan may be spent on any activities or expenses primarily intended to result in the sale of shares, including but not limited to, advertising, compensation for sales and marketing activities or financial institutions and others such as dealers and distributors, shareholder account servicing, the printing and mailing of prospectuses to other than current shareowners, and the printing and mailing of sales literature.
The Fund has entered into agreements with various brokers, dealers, and financial intermediaries in connection with the sale of shares of the Fund. The agreements provide for periodic payments by the Fund to the brokers, dealers, and financial
intermediaries for providing certain shareholder maintenance services (sub-transfer agent expenses). These shareholder services include the pre-processing and quality control of new accounts, shareholder correspondence, answering customer inquiries regarding account status, and facilitating shareholder telephone transactions. Fees paid by the Fund to various brokers, dealers, and financial intermediaries for the fiscal year ended October 31, 2014 were $74,290.
U.S. Bancorp Fund Services, LLC (“USBFS”) provides the Fund with administrative, fund accounting, and transfer agent services, including all regulatory reporting, and necessary office equipment and personnel. As administrator, USBFS prepares various federal and state regulatory filings, reports, and returns for the Fund; prepares reports and materials to be supplied to the Board; monitors the activities of the Fund’s custodian, transfer agent, and accountants; and coordinates the preparation and payment of the Fund’s expenses and reviews the Fund’s expense accruals. Fees paid to USBFS for the fiscal year ended October 31, 2014 were $155,721.
U.S. Bank, N.A., an affiliate of USBFS, serves as the Fund’s custodian. Quasar Distributors, LLC acts as the Fund’s principal underwriter in a continuous public offering of the Fund’s shares. Quasar Distributors, LLC is an affiliate of USBFS and U.S. Bank, N.A.
6). LINE OF CREDIT
The Fund has a line of credit with the other funds in the Hennessy Funds family of funds (the “Hennessy Funds”) in the amount of the lesser of (i) $100,000,000 or (ii) 33.33% of each Hennessy Fund’s net assets, or 30% for the Hennessy Gas Utility Index Fund and 10% for the Hennessy Balanced Fund, intended to provide short-term financing, if necessary, subject to certain restrictions, in connection with shareholder redemptions. The credit facility is with the Hennessy Funds’ custodian bank, U.S. Bank, N.A. Borrowings under this arrangement bear interest at the bank’s prime rate. During the fiscal year ended October 31, 2014, the Fund had an outstanding average daily balance and a weighted average interest rate of $735 and 3.25%, respectively. The maximum amount outstanding for the Fund during the year was $133,000. At October 31, 2014, the Fund had a loan payable balance of $0.
7). FEDERAL TAX INFORMATION
As of October 31, 2014, the components of accumulated earnings (losses) for income tax purposes were as follow:
| | Cost of investments for tax purposes | | $ | 106,410,131 | |
| | Gross tax unrealized appreciation | | $ | 11,155,779 | |
| | Gross tax unrealized depreciation | | | (292,803 | ) |
| | Net tax unrealized appreciation | | $ | 10,862,976 | |
| | Undistributed ordinary income | | $ | 111,389 | |
| | Undistributed long-term capital gains | | | 5,766,953 | |
| | Total distributable earnings | | $ | 5,878,342 | |
| | Other accumulated gain | | $ | — | |
| | Total accumulated gain | | $ | 16,741,318 | |
The difference between book-basis and tax-basis unrealized appreciation is attributable primarily to wash sales.
At October 31, 2014, the Fund had no tax basis capital losses to offset future capital gains.
During the year ended October 31, 2014, the capital loss carry forwards utilized for the Fund were $2,084,535.
HENNESSY FUNDS 1-800-966-4354
At October 31, 2014, the Fund did not defer, on a tax basis, any post-December late year ordinary loss deferrals.
The tax character of distributions paid during fiscal year 2014 and fiscal year 2013 for the Fund were as follow:
| | | | Year Ended | | | Year Ended | |
| | | | October 31, 2014 | | | October 31, 2013 | |
| | Ordinary income | | $ | 1,079,733 | | | $ | 957,145 | |
| | Long-term capital gain | | | — | | | | — | |
| | | | $ | 1,079,733 | | | $ | 957,145 | |
8). REVERSE REPURCHASE AGREEMENTS
The Fund may enter into reverse repurchase agreements with the same parties with whom it may enter into repurchase agreements. Under a reverse repurchase agreement, the Fund sells securities and agrees to repurchase them at a mutually agreed upon date and price. Reverse repurchase agreements are regarded as a form of secured borrowing by the Fund. Securities sold under reverse repurchase agreements are reflected as a liability on the Statement of Assets and Liabilities. Interest payments made are recorded as a component of interest expense on the Statement of Operations.
For the fiscal year ended October 31, 2014, the average daily balance and average interest rate in effect for reverse repurchase agreements were $33,951,812 and 0.246%, respectively. At October 31, 2014, the interest rate in effect for the outstanding reverse repurchase agreements scheduled to mature on November 20, 2014 ($8,095,000), December 26, 2014 ($10,794,000), and January 15, 2015 ($14,392,000) was 0.25%, 0.25%, and 0.25%, respectively. Outstanding reverse repurchase agreements at October 31, 2014 were equal to 39.67% of the Fund’s net assets.
Below is the gross and net information about instruments and transactions eligible for offset in the Statement of Assets and Liabilities as well as instruments and transactions subject to an agreement similar to a master netting arrangement:
| | | Gross | Net | | | |
| | | Amounts | Amounts | Gross Amounts Not | |
| | | Offset | Presented | Offset in the Statement | |
| | | in the | in the | of Assets and Liabilities | |
| | Gross | Statement | Statement | | | |
| | Amounts of | of | of | | Collateral | |
| | Recognized | Assets and | Assets and | Financial | Pledged | Net |
| Description | Liabilities | Liabilities | Liabilities | Instruments | (Received) | Amount |
| Reverse | | | | | | |
| Repurchase | | | | | | | | | | | | | | | | | | |
| Agreements | | $ | 33,281,500 | | | $ | — | | | $ | 33,281,500 | | | $ | 33,281,500 | | | $ | — | | | $ | — | |
| | | $ | 33,281,500 | | | $ | — | | | $ | 33,281,500 | | | $ | 33,281,500 | | | $ | — | | | $ | — | |
For additional information, please reference the “Offsetting Assets and Liabilities” section in Note 2.
9). AGREEMENT AND PLAN OF REORGANIZATION
On December 11, 2013, the Board approved an Agreement and Plan of Reorganization (the “Agreement”), of the Hennessy Total Return Fund (the “New Fund”), pursuant to which the New Fund would be a successor to the corresponding series of the same name of The Hennessy Funds, Inc., a Maryland corporation (the “Predecessor Fund”). The
Agreement provided for the transfer of assets of the Predecessor Fund to the New Fund and the assumption of the liabilities of the Predecessor Fund by the New Fund. The New Fund had the same investment objective and substantially similar principal investment strategies as the Predecessor Fund. The reorganization was effective as of the close of business on February 28, 2014. The following table illustrates the specifics of the reorganization:
| | Shares of the New Fund | | | |
| Predecessor Fund | Issued to Shareholders of | New Fund | Combined | Tax Status |
| Net Assets | the Predecessor Fund | Net Assets | Net Assets | of Transfer |
$85,203,249(1) | 5,860,970 | $85,203,249 | $85,203,249 | Non-taxable |
| | (1) | Included accumulated realized gains and unrealized appreciation in the amounts of $221,200 and $11,758,211, respectively. |
10). EVENTS SUBSEQUENT TO YEAR-END
On December 8, 2014, a long-term capital gains distribution of $1.05659 per share was declared for shareholders of record on December 5, 2014. The distribution was paid on December 8, 2014.
HENNESSY FUNDS 1-800-966-4354
Report of Independent Registered Public Accounting Firm
The Board of Trustees and Shareholders
Hennessy Funds Trust:
We have audited the accompanying statement of assets and liabilities of Hennessy Total Return Fund (the Fund), a series of Hennessy Funds Trust (formerly a series of Hennessy Mutual Funds, Inc.), including the schedule of investments, as of October 31, 2014, and the related statement of operations for the year then ended, the statements of changes in net assets for each of the years in the two-year period then ended, the statement of cash flows for the year then ended, and the financial highlights for each of the years in the five-year period then ended. These financial statements and financial highlights are the responsibility of the Fund’s management. Our responsibility is to express an opinion on these financial statements and financial highlights based on our audits.
We conducted our audits in accordance with the standards of the Public Company Accounting Oversight Board (United States). Those standards require that we plan and perform the audit to obtain reasonable assurance about whether the financial statements and financial highlights are free of material misstatement. An audit includes examining, on a test basis, evidence supporting the amounts and disclosures in the financial statements. Our procedures included confirmation of investments owned as of October 31, 2014, by correspondence with the custodian and brokers or by other appropriate auditing procedures. An audit also includes assessing the accounting principles used and significant estimates made by management, as well as evaluating the overall financial statement presentation. We believe that our audits provide a reasonable basis for our opinion.
In our opinion, the financial statements and financial highlights referred to above present fairly, in all material respects, the financial position of the Fund as of October 31, 2014, and the results of its operations and cash flows for the year then ended, the changes in its net assets for each of the years in the two-year period then ended, and the financial highlights for each of the years in the five-year period then ended, in conformity with U.S. generally accepted accounting principles.
Milwaukee, Wisconsin
December 30, 2014
Trustees and Officers of the Fund (Unaudited)
The business and affairs of the Fund are managed under the direction of the Fund’s Board of Trustees. Information pertaining to the Trustees and Officers of the Fund is set forth below. The Fund’s Statement of Additional Information includes additional information about the Fund’s Trustees and Officers and is available, without charge, upon request by calling 1-800-966-4354.
| | | | | Number of | |
| | | Term of | | Portfolios | |
| | | Office | | in the | Other |
| | | and | | Fund | Directorships |
| | Position(s) | Length | Principal | Complex | (During Past |
| Name, Address, | Held with | of Time | Occupation(s) | Overseen | Five Years)(2) |
| and Age | the Fund | Served | During Past Five Years | by Trustee | Held by Trustee |
| | | |
| Disinterested Trustees (as defined below) | | |
| | | | | | |
| J. Dennis DeSousa | Trustee | Indefinite, | Mr. DeSousa is a real | 16 | Hennessy SPARX |
| Age: 78 | | until | estate investor. | | Funds Trust; |
| Address: | | successor | | | Hennessy Mutual |
| c/o Hennessy | | elected | | | Funds, Inc.; and |
| Advisors, Inc. | | | | | The Hennessy |
| 7250 Redwood Blvd. | | Served | | | Funds, Inc. |
| Suite 200 | | since | | | |
| Novato, CA 94945 | | January | | | |
| | | 1996 | | | |
| | | for the | | | |
| | | Funds (or | | | |
| | | Predecessor | | | |
| | | Funds) | | | |
| | | | | | |
| Robert T. Doyle | Trustee | Indefinite, | Mr. Doyle has been the | 16 | Hennessy SPARX |
| Age: 67 | | until | Sheriff of Marin County, | | Funds Trust; |
| Address: | | successor | California since 1996. | | Hennessy Mutual |
| c/o Hennessy | | elected | | | Funds, Inc.; and |
| Advisors, Inc. | | | | | The Hennessy |
| 7250 Redwood Blvd. | | Served | | | Funds, Inc. |
| Suite 200 | | since | | | |
| Novato, CA 94945 | | January | | | |
| | | 1996 | | | |
| | | for the | | | |
| | | Funds (or | | | |
| | | Predecessor | | | |
| | | Funds) | | | |
| | | | | | |
| Gerald P. Richardson | Trustee | Indefinite, | Mr. Richardson is an | 16 | Hennessy SPARX |
| Age: 69 | | until | independent consultant | | Funds Trust; |
| Address: | | successor | in the securities industry. | | Hennessy Mutual |
| c/o Hennessy | | elected | | | Funds, Inc.; and |
| Advisors, Inc. | | | | | The Hennessy |
| 7250 Redwood Blvd. | | Served | | | Funds, Inc. |
| Suite 200 | | since | | | |
| Novato, CA 94945 | | May 2004 | | | |
| | | for the | | | |
| | | Funds (or | | | |
| | | Predecessor | | | |
| | | Funds) | | | |
HENNESSY FUNDS 1-800-966-4354
| | | | | Number of | |
| | | Term of | | Portfolios | |
| | | Office | | in the | Other |
| | | and | | Fund | Directorships |
| | Position(s) | Length | Principal | Complex | (During Past |
| Name, Address, | Held with | of Time | Occupation(s) | Overseen | Five Years)(2) |
| and Age | the Fund | Served | During Past Five Years | by Trustee | Held by Trustee |
| | | |
| “Interested Persons” (as defined in the 1940 Act) | | |
| | | | | | |
Neil J. Hennessy(1) | Chief | Trustee: | Mr. Hennessy has been | 16 | Hennessy |
| Age: 58 | Investment | Indefinite, | employed by Hennessy | | Advisors, Inc. |
| Address: | Officer, | until | Advisors, Inc., the Funds’ | | (current); |
| c/o Hennessy | Portfolio | successor | investment advisor, since | | Hennessy SPARX |
| Advisors, Inc. | Manager, | elected | 1989. He currently serves | | Funds Trust; |
| 7250 Redwood Blvd. | President, | | as President, Chairman | | Hennessy Mutual |
| Suite 200 | Trustee | Served | and CEO of Hennessy | | Funds, Inc.; and |
| Novato, CA 94945 | and | since | Advisors, Inc. | | The Hennessy |
| | Chairman | January | | | Funds, Inc. |
| | of the | 1996 | | | |
| | Board | for the | | | |
| | | Funds (or | | | |
| | | Predecessor | | | |
| | | Funds) | | | |
| | | | | | |
| | | Officer: | | | |
| | | 1 year term | | | |
| | | | | | |
| | | Served | | | |
| | | since | | | |
| | | June 2008 | | | |
| | | for the | | | |
| | | Funds (or | | | |
| | | Predecessor | | | |
| | | Funds) | | | |
| | | | | | |
Teresa M. Nilsen(1) | Executive | 1 year term | Ms. Nilsen has been | N/A | N/A |
| Age: 48 | Vice | | employed by Hennessy | | |
| Address: | President | Served | Advisors, Inc., the Funds’ | | |
| c/o Hennessy | and | since | investment advisor, since | | |
| Advisors, Inc. | Treasurer | January | 1989. She currently serves | | |
| 7250 Redwood Blvd. | | 1996 | as Executive Vice President, | | |
| Suite 200 | | for the | Chief Operations Officer, | | |
| Novato, CA 94945 | | Funds (or | Chief Financial Officer, and | | |
| | | Predecessor | Secretary of Hennessy | | |
| | | Funds) | Advisors, Inc. | | |
| (1) | All Officers of the Hennessy Funds and employees of the Manager are Interested Persons of the Funds. |
| (2) | Pursuant to an internal reorganization, the series of Hennessy Mutual Funds, Inc. (“HMFI”), The Hennessy Funds, Inc. (“HFI”) and Hennessy SPARX Funds Trust (“HSFT”) were reorganized into series of Hennessy Funds Trust on February 28, 2014, which mirrored the corresponding series of HFMI, HFI and HSFT. Subsequent to the reorganization, HFMI, HFI and HSFT were dissolved. |
| | | Term of | |
| | | Office | |
| | | and | |
| | Position(s) | Length | Principal |
| Name, Address, | Held with | of Time | Occupation(s) |
| and Age | the Fund | Served | During Past Five Years |
| | | | |
| Interested Persons | | | |
| | | | |
Daniel B. Steadman(1) | Executive | 1 year term | Mr. Steadman has been employed by |
| Age: 58 | Vice President | | Hennessy Advisors, Inc., the Funds’ |
| Address: | and Secretary | Served since | investment advisor, since 2000. |
| c/o Hennessy Advisors, Inc. | | March 2000 | He currently serves as Executive |
| 7250 Redwood Blvd. | | for the Funds (or | Vice President and Chief Compliance |
| Suite 200 | | Predecessor Funds) | Officer of Hennessy Advisors, Inc. |
| Novato, CA 94945 | | | |
| | | | |
Jennifer Cheskiewicz(1) | Senior | 1 year term | Ms. Cheskiewicz has been employed by |
| Age: 37 | Vice President | | Hennessy Advisors, Inc., the Funds’ |
| Address: | and Chief | Served since | investment advisor, since June 2013. |
| c/o Hennessy Advisors, Inc. | Compliance | June 2013 | She previously served as in-house |
| 7250 Redwood Blvd. | Officer | for the Funds (or | counsel to Carlson Capital, L.P., an |
| Suite 200 | | Predecessor Funds) | SEC-registered investment advisor to |
| Novato, CA 94945 | | | several private funds from February |
| | | | 2010 to May 2013. Prior to that, she |
| | | | was an attorney with Gibson, Dunn & |
| | | | Crutcher LLP from September 2005 |
| | | | through February 2010. She currently |
| | | | serves as General Counsel of |
| | | | Hennessy Advisors, Inc. |
| | | | |
Brian Carlson(1) | Senior | 1 year term | Mr. Carlson has been employed by |
| Age: 42 | Vice President | | Hennessy Advisors, Inc., the Funds’ |
| Address: | and Head of | Served since | investment advisor, since |
| c/o Hennessy Advisors, Inc. | Distribution | December 2013 | December 2013. |
| 7250 Redwood Blvd. | | for the Funds (or | |
| Suite 200 | | Predecessor Funds) | Mr. Carlson was previously a |
| Novato, CA 94945 | | | co-founder and principal of Trivium |
| | | | Consultants, LLC from February 2011 |
| | | | through November 2013. Prior to that, |
| | | | he was the Senior Managing Director |
| | | | of NRP Financial, Inc. from August |
| | | | 2007 through February 2011. |
| | | | |
David Ellison(1) | Portfolio Manager | 1 year term | Mr. Ellison has served as Portfolio |
| Age: 56 | and Senior | | Manager of the Large Cap Financial |
| Address: | Vice President | Served since | Fund, the Small Cap Financial Fund, |
| c/o Hennessy Advisors, Inc. | | October 2012 | and the Technology Fund |
| 101 Federal Street | | for the Funds (or | since inception. |
| Suite 1900 | | Predecessor Funds) | |
| Boston, MA 02110 | | | Mr. Ellison previously served as Director, |
| | | | CIO and President of FBR Advisers, Inc. |
| | | | from December 1999 to October 2012. |
| (1) | All Officers of the Hennessy Funds and employees of the Manager are Interested Persons of the Funds. |
HENNESSY FUNDS 1-800-966-4354
| | | Term of | |
| | | Office | |
| | | and | |
| | Position(s) | Length | Principal |
| Name, Address, | Held with | of Time | Occupation(s) |
| and Age | the Fund | Served | During Past Five Years |
| | | | |
| Interested Persons | | | |
| | | | |
Brian Peery(1) | Portfolio Manager | 1 year term | Mr. Peery has been a Portfolio Manager |
| Age: 45 | and | | of the Cornerstone Growth Fund, |
| Address: | Vice President | Served since | the Cornerstone Mid Cap 30 Fund, the |
| c/o Hennessy Advisors, Inc. | | March 2003 | Cornerstone Large Growth Fund, the |
| 7250 Redwood Blvd. | | as Vice President | Cornerstone Value Fund, the Total |
| Suite 200 | | for the Funds (or | Return Fund, and the Balanced Fund |
| Novato, CA 94945 | | Predecessor Funds) | since October 2014. From February |
| | | | 2011 through September 2014, he |
| | | Served since | served as Co-Portfolio Manager of |
| | | February 2011 | the same funds. |
| | | as Co-Portfolio | |
| | | Manager | Mr. Peery has been employed by |
| | | for the Funds (or | Hennessy Advisors, Inc., the Funds’ |
| | | Predecessor Funds) | investment advisor, since 2002. |
| | | | |
Winsor (Skip) Aylesworth(1) | Portfolio Manager | 1 year term | Mr. Aylesworth has been Portfolio |
| Age: 67 | and | | Manager of the Gas Utility Index Fund |
| Address: | Vice President | Served since | since 1998 and Portfolio Manager of |
| c/o Hennessy Advisors, Inc. | | October 2012 | the Technology Fund since inception. |
| 101 Federal Street | | for the Funds (or | |
| Suite 1900 | | Predecessor Funds) | Mr. Aylesworth previously served as |
| Boston, MA 02110 | | | Executive Vice President of The FBR |
| | | | Funds from 1999 to October 2012. |
| | | | |
Ryan Kelley(1) | Portfolio Manager | 1 year term | Mr. Kelley has been a Portfolio Manager |
| Age: 42 | and | | of the Gas Utility Index Fund (formerly |
| Address: | Vice President | Served since | the FBR Gas Utility Index Fund), the |
| c/o Hennessy Advisors, Inc. | | March 2013 | Small Cap Financial Fund (formerly the |
| 1340 Environ Way | | for the Funds (or | FBR Small Cap Financial Fund), and the |
| Chapel Hill, NC 27517 | | Predecessor Funds) | Large Cap Financial Fund (formerly the |
| | | | FBR Large Cap Financial Fund) since |
| | | | October 2014. From March 2013 |
| | | | through September 2014, he served |
| | | | as a Co-Portfolio Manager of the same |
| | | | funds. Prior to that, he was a Portfolio |
| | | | Analyst of the Hennessy Funds. |
| | | | |
| | | | Mr. Kelley previously served as Portfolio |
| | | | Manager of The FBR Funds from |
| | | | January 2008 to October 2012. |
| (1) | All Officers of the Hennessy Funds and employees of the Manager are Interested Persons of the Funds. |
(This Page Intentionally Left Blank.)
HENNESSY FUNDS 1-800-966-4354
Expense Example (Unaudited)
October 31, 2014
As a shareholder of the Fund, you incur two types of costs: (1) transaction costs, including sales charges (loads) on purchase payments, reinvested dividends, or other distributions; redemption fees; and exchange fees; and (2) ongoing costs, including management fees; service fees; and other Fund expenses. This Example is intended to help you understand your ongoing costs (in dollars) of investing in the Fund and to compare these costs with the ongoing costs of investing in other mutual funds. The Example is based on an investment of $1,000 invested at the beginning of the period and held for the entire period from May 1, 2014 through October 31, 2014.
Actual Expenses
The first line of the table below provides information about actual account values and actual expenses. Although the Fund charges no sales loads or transaction fees, you will be assessed fees for outgoing wire transfers, returned checks and stop payment orders at prevailing rates charged by U.S. Bancorp Fund Services, LLC, the Fund’s transfer agent. If you request that a redemption be made by wire transfer, currently a $15.00 fee is charged by the Fund’s transfer agent. IRA accounts will be charged a $15.00 annual maintenance fee. The example below includes, but is not limited to, management fees, shareholder servicing fees, fund accounting, custody, and transfer agent fees. However, the example below does not include portfolio trading commissions and related expenses, and other extraordinary expenses as determined under generally accepted accounting principles. You may use the information in this line, together with the amount you invested, to estimate the expenses that you paid over the period. Simply divide your account value by $1,000 (for example, an $8,600 account value divided by $1,000 = 8.6), then multiply the result by the number in the first line of the table under the heading entitled “Expenses Paid During Period” to estimate the expenses you paid on your account during this period.
Hypothetical Example for Comparison Purposes
The second line of the table below provides information about hypothetical account values and hypothetical expenses based on the Fund’s actual expense ratios and an assumed rate of return of 5% per year before expenses, which is not the Fund’s actual return. The hypothetical account values and expenses may not be used to estimate the actual ending account balance or expenses you paid for the period. You may use this information to compare the ongoing costs of investing in the Fund and other funds. To do so, compare this 5% hypothetical example with the 5% hypothetical examples that appear in the shareholder reports of the other funds. Please note that the expenses shown in the table are meant to highlight your ongoing costs only and do not reflect any transactional costs, such as sales charges (loads), or exchange fees. Therefore, the second line of the table is useful in comparing ongoing costs only, and will not help you determine the relative total costs of owning different funds. In addition, if these transactional costs were included, your costs would have been higher.
| | Beginning | Ending | Expenses Paid |
| | Account Value | Account Value | During Period(1) |
| | 5/1/14 | 10/31/14 | 5/1/14 – 10/31/14 |
| Investor Class | | | |
| | | | |
| Actual | $1,000.00 | $1,026.60 | $6.74 |
| | | | |
| Hypothetical (5% return | | | |
| before expenses) | $1,000.00 | $1,018.55 | $6.72 |
| (1) | Expenses are equal to the Fund's expense ratio of 1.32%, multiplied by the average account value over the period, multiplied by 184/365 days (to reflect one-half year period). |
HENNESSY FUNDS 1-800-966-4354
Proxy Voting
A description of the policies and procedures the Fund uses to determine how to vote proxies relating to portfolio securities is available without charge: (1) by calling 1-800-966-4354; (2) on the Hennessy Funds’ website at hennessyfunds.com; or (3) on the U.S. Securities and Exchange Commission’s (the “SEC”) website at www.sec.gov. The Fund’s proxy voting record is available on both the Hennessy Funds’ website at hennessyfunds.com and the SEC’s website at www.sec.gov no later than August 31 for the prior 12 months ending June 30.
Quarterly Filings on Form N-Q
The Fund files its complete schedule of portfolio holdings with the SEC for the first and third quarters of each fiscal year on Form N-Q. The Fund’s Forms N-Q are available on the SEC’s website at www.sec.gov. The Fund’s Forms N-Q may be reviewed and copied at the SEC’s Public Reference Room in Washington, DC and information on the operation of the Public Reference Room may be obtained by calling 1-800-SEC-0330. Information included in the Fund’s Forms N-Q will also be available upon request by calling 1-800-966-4354.
Federal Tax Distribution Information
(Unaudited)
For the fiscal year ended October 31, 2014, certain dividends paid by the Fund may be subject to a maximum tax rate of 20%, as provided for by the Jobs and Growth Tax Relief Reconciliation Act of 2003. The percentage of dividends declared from ordinary income designated as qualified dividend income was 100.00%.
For corporate shareholders, the percent of ordinary income distributions qualifying for the corporate dividends received deduction for the fiscal year ended October 31, 2014 was 100.00%.
The percentage of taxable ordinary income distributions that are designated as short-term capital gain distributions under Section 871(k)(2)(C) of the Internal Revenue Code of 1986, as amended, for the Fund was 0.00%.
Householding
To help keep the Fund’s costs as low as possible, we generally deliver a single copy of most financial reports and prospectuses to shareholders who share an address, even if the accounts are registered under different names. This process, known as “householding,” does not apply to account statements. You may, of course, request an individual copy of a prospectus or financial report at any time. If you would like to receive separate mailings, please call the Administrator at 1-800-261-6950 or 1-414-765-4124 and we will begin individual delivery within 30 days of your request. If your account is held through a financial institution or other intermediary, please contact them directly to request individual delivery.
Privacy Policy
We collect the following non-public personal information about you:
| | • | information we receive from you on or in applications or other forms, correspondence, or conversations, including, but not limited to, your name, address, phone number, social security number, assets, income and date of birth; |
| | | and |
| | • | information about your transactions with us, our affiliates, or others, including, but not limited to, your account number and balance, payment history, parties to transactions, cost basis information and other financial information. |
We do not disclose any non-public personal information about our current or former shareholders to nonaffiliated third parties, except as permitted by law. For example, we are permitted by law to disclose all of the information we collect, as described above, to our Transfer Agent to process your transactions. Furthermore, we restrict access to your non-public personal information to those persons who require such information to provide products or services to you. We maintain physical, electronic and procedural safeguards that comply with federal standards to guard your non-public personal information.
In the event that you hold shares of the Fund through a financial intermediary, including, but not limited to, a broker-dealer, bank or trust company, the privacy policy of your financial intermediary would govern how your non-public personal information would be shared with nonaffiliated third parties.
HENNESSY FUNDS 1-800-966-4354
(This Page Intentionally Left Blank.)
(This Page Intentionally Left Blank.)
For information, questions or assistance, please call
The Hennessy Funds
1-800-966-4354 or 1-415-899-1555
INVESTMENT ADVISOR
Hennessy Advisors, Inc.
7250 Redwood Blvd., Suite 200
Novato, California 94945
ADMINISTRATOR,
TRANSFER AGENT,
DIVIDEND PAYING AGENT &
SHAREHOLDER SERVICING AGENT
U.S. Bancorp Fund Services, LLC
P.O. Box 701
Milwaukee, Wisconsin 53201-0701
CUSTODIAN
U.S. Bank N.A.
Custody Operations
1555 North River Center Dr., Suite 302
Milwaukee, Wisconsin 53212
TRUSTEES
Neil J. Hennessy
Robert T. Doyle
J. Dennis DeSousa
Gerald P. Richardson
COUNSEL
Foley & Lardner LLP
777 East Wisconsin Avenue
Milwaukee, Wisconsin 53202-5306
INDEPENDENT REGISTERED
PUBLIC ACCOUNTING FIRM
KPMG LLP
777 East Wisconsin Avenue
Milwaukee, Wisconsin 53202-5306
DISTRIBUTOR
Quasar Distributors, LLC
615 East Michigan Street
Milwaukee, Wisconsin 53202
hennessyfunds.com | 1-800-966-4354
This report has been prepared for shareholders and may be distributed to
others only if preceded or accompanied by a current prospectus.
ANNUAL REPORT
OCTOBER 31, 2014
HENNESSY EQUITY AND
INCOME FUND
Investor Class HEIFX
Institutional Class HEIIX
hennessyfunds.com | 1-800-966-4354
(This Page Intentionally Left Blank.)
Contents
| Letter to Shareholders | | 2 |
| Performance Overview | | 4 |
| Financial Statements | | |
| Schedule of Investments | | 7 |
| Statement of Assets and Liabilities | | 19 |
| Statement of Operations | | 20 |
| Statements of Changes in Net Assets | | 21 |
| Financial Highlights | | 22 |
| Notes to the Financial Statements | | 26 |
| Report of Independent Registered Public Accounting Firm | | 34 |
| Trustees and Officers of the Fund | | 35 |
| Expense Example | | 40 |
| Proxy Voting | | 42 |
| Quarterly Filings on Form N-Q | | 42 |
| Federal Tax Distribution Information | | 42 |
| Householding | | 42 |
| Privacy Policy | | 43 |
HENNESSY FUNDS 1-800-966-4354
December 2014
Dear Shareholder:
As I look back at 2014, I realize that in this age of rapidly evolving technology, information is delivered and absorbed so quickly that it is difficult to remember what happened last week, let alone what’s happened over the course of an entire year. That is why I’d like to take a moment to recall some of the year’s highs and lows, economically, politically and socially, here in the U.S. and around the globe. 2014 was scarred by political partisanship, civil unrest in the U.S., Ukraine and many other countries, the arrival of terrorist group ISIS, the tragedies of school shootings and natural disasters, and the frightening outbreak of Ebola. However, there were also positive events this year: we survived a government shutdown over healthcare reform, jobs reports have been consistently, albeit anemically, improving, and home prices remained relatively stable, after recovering significantly in 2013. And, important to us here at Hennessy, our hometown team, the San Francisco Giants, won their third World Series in just five years!
A significant event for the financial industry this past year was the confirmation of Janet Yellen as Chair of the Federal Reserve, which served to calm the nerves of business and political leaders alike. I believe Yellen’s leadership will benefit U.S. business owners, as the Fed continues to be a voice of reason in a sea of political and economic rhetoric. The Fed has also supported the economy and corporate America by helping keep interest rates reasonable and low.
The stock market has continued its determined comeback from the lows of 2009, setting multiple record highs in recent months. The U.S. financial markets have provided strong returns over the past twelve-month period ended October 31, 2014, with the Dow Jones Industrial Average (DJIA) returning over 14% and S&P 500 Index returning over 17% during the period. The DJIA currently has a dividend yield of 2.2%, which is equal to that of a 10-Year U.S. Treasury, which is currently also yielding 2.2%. I continue to believe that investments in high-yielding, high-quality stocks have the potential to not only provide income but also the potential for stock price appreciation as well. Fixed income investing has run its course, in my opinion, and many individuals are currently benefiting from the return to investing in equities that possess strong fundamentals. American investors are slowly migrating from fixed income to equities. Currently, 54% of Americans invest in stocks, and I do expect this percentage to increase, especially if interest rates move higher.
For the past several years, U.S. corporations have been driving shareholder value by making acquisitions, initiating and raising dividends, investing in internal infrastructure and buying back stock. However, this year I began to see a shift from those strategies. I believe the easier to execute acquisitions are a thing of the past, and firms now have to be even more creative to execute accretive deals. I also believe that while firms may continue to initiate dividends, fewer firms will raise their dividends and fewer firms will participate in stock buyback programs going forward. What will these cash-rich companies do with their capital if they are not raising dividends or buying back stock? I believe they may begin to initiate capital expenditure programs that could truly benefit economic growth.
Liquidity and monetary conditions are supportive, causing the cost of capital to be very low. I believe firms will choose to spend capital to expand their sales, and they may even begin to hire in earnest. Once a company begins to move in this way, the cost to
defer becomes real for competitors. With almost $3 trillion in cash and short-term investments sitting on the balance sheets of the S&P 500 companies, a strategic shift by firms to spend their idle capital, while slow, could potentially further economic growth in the U.S. in my opinion.
Economic progress and growth remain slow, yet steady, and unemployment, though improving, remains high. Oil prices have fallen, giving consumers a bit more discretionary income. While the midterm elections may not end all of the gridlock in Washington, hopefully we will receive clarity on the political headwinds of taxes and regulations, which have not improved over the past several years.
The markets have had several quarters without any truly significant downturn. The pullbacks we recently experienced, most notably in July and October, were short-lived, as evidenced by the quick rebound to record high market levels. I firmly believe that we are in a secular bull market, and I continue to tell investors to try to remain calm in the face of volatility and continue to focus on the strong, long-term fundamentals that are evident in the market today. Many companies continue to have strong balance sheets, with record cash flows and profits. With this current bull market in its fifth year, investors should expect some volatility.
I am encouraged by the strong returns for the major U.S. financial market indices and by the performance of the Hennessy Funds over the past year. Thank you for your continued confidence and investment in our products. If you have any questions or would like to speak with us directly, please don’t hesitate to call us at (800) 966-4354.
Best regards,
Neil J. Hennessy
President and Chief Investment Officer
Past performance does not guarantee future results.
Mutual fund investing involves risk. Principal loss is possible.
Opinions expressed are those of Neil Hennessy and are subject to change, are not guaranteed and should not be considered investment advice.
The Dow Jones Industrial Average and S&P 500 Index are unmanaged indices commonly used to measure the performance of U.S. stocks. One cannot invest directly in an index.
Cash flow can be used as an indication of a company’s financial strength. A firm’s cash flow is the movement of cash in and out of the firm in the form of payments to suppliers and collections from customers. Dividend Yield is calculated as the annual dividends paid by a company divided by the price of a share of their stock.
HENNESSY FUNDS 1-800-966-4354
Performance Overview (Unaudited)
The opinions expressed in the following commentaries reflect those of the Portfolio Managers as of the date written. Any such opinions are subject to change based on market or other conditions and are not guaranteed. These opinions may not be relied upon as investment advice. Investment decisions for the Fund are based on multiple factors, and may not be relied upon as an indication of trading intent on behalf of the Fund. Security positions can and do change.
CHANGE IN VALUE OF $10,000 INVESTMENT
This chart assumes an initial gross investment of $10,000 made on October 31, 2004. Returns shown include the reinvestment of all dividends. Returns shown do not reflect the deduction of taxes that a shareholder would pay on Fund distributions or the redemption of Fund shares.
AVERAGE ANNUAL TOTAL RETURN FOR PERIODS ENDED OCTOBER 31, 2014
| | One | Five | Ten |
| | Year | Years | Years |
| Hennessy Equity and Income Fund – | | | |
| Investor Class (HEIFX) | 10.28% | 11.98% | 8.04% |
| Hennessy Equity and Income Fund – | | | |
| Institutional Class (HEIIX) | 10.60% | 12.26% | 8.31% |
| Blended Balanced Index | 11.13% | 11.47% | 6.82% |
| S&P 500 Index | 17.27% | 16.69% | 8.20% |
| Expense ratios: | Gross 1.39%, Net 1.36%(2) (Investor Class); |
| | Gross 1.09% (Institutional Class) |
Performance data quoted represents past performance; past performance does not guarantee future results. The investment return and principal value of an investment will fluctuate so that an investor’s shares, when redeemed, may be worth more or less than their original cost. Current performance of the fund may be lower or higher than the performance quoted. Performance data current to the most recent month end may be obtained by visiting hennessyfunds.com. Performance for the period from March 12, 2010 to October 26, 2012 is that of the FBR Balanced Fund and for the periods prior to March 12, 2010 is that of the AFBA 5 Star Balanced Fund.
The expense ratios presented are from the most recent prospectus.
| (1) | The Blended Balanced Index consists of 60% common stocks represented by the S&P 500 Index and 40% bonds represented by the Barclays Capital Intermediate U.S. Government/Credit Index. |
| (2) | With regard to Investor Class shares, the Fund’s investment advisor has contractually agreed to waive a portion of its expenses through February 28, 2015. |
PERFORMANCE NARRATIVE
THE LONDON COMPANY OF VIRGINIA, LLC,
SUB-ADVISOR (EQUITY PORTION)
FINANCIAL COUNSELORS, INC., SUB-ADVISOR (FIXED INCOME PORTION)
For the twelve-month period ended October 31, 2014, the Investor Class of the Hennessy Equity and Income Fund returned 10.28%, underperforming the Blended Balanced Index* and the S&P 500 Index which returned 11.13% and 17.27% for the same period, respectively, but outperforming the Morningstar Moderate Allocation Category Average, which returned 8.27% for the same period.
Portfolio Managers: Stephen M. Goddard, CFA (Lead Portfolio Manager for the Fund), Jonathan T. Moody, CFA, J. Brian Campbell, CFA, Mark DeVaul, CFA, CPA, The London Company of Virginia, LLC (sub-advisor of the equity portion of the Fund).
Over the previous twelve months, how did the equity portion of the Fund perform and what factors contributed to this performance?
Domestic equity returns for the period were strong. An improving U.S. economy, driven by low interest rates, a strengthening housing market, rising consumer confidence and steady job growth, all helped drive stocks higher. For the twelve month period, the performance of the equity portion of the Fund was on par with the S&P 500 Index. The market was led higher by the Health Care and Information Technology sectors, while the Energy and Telecommunication sectors lagged the market. Stock selection had a positive impact on the Fund’s relative performance, offset by the negative impact of sector allocation. At the sector level, our underweight position in Health Care and overweight position in Consumer Staples had a negative impact on relative performance, partially offset by the positive impact of our underweight position in Energy.
Additional Portfolio Manager commentary on the equity portion of the Fund and the related investment outlook:
While we do not attempt to forecast the future, we remain fairly optimistic. Corporate America is in good shape with high operating margins and strong balance sheets. The economic recovery continues with improvement in employment, capital investment and a generally benign interest rate and inflation outlook. We expect the slow growth environment to continue and believe stocks could be more volatile in the future.
Our strategy is to focus on stocks from a bottom-up standpoint. We seek to own companies with strong returns on capital and flexibility to enhance shareholder value using the balance sheet. Low interest rates and relatively high equity risk premiums enable companies to increase shareholder value by adjusting the capital structure of the company. Separately, with elevated cash levels on corporate balance sheets and dividend payout ratios near historic lows, we expect investors to reward companies that wisely deploy capital through higher dividends, share repurchases and mergers and acquisition transactions. Our more conservative portfolio is well positioned for a slow growth environment that has the potential to reward strong capital allocation.
Portfolio Managers: Gary B. Cloud, CFA and Peter G. Greig, CFA, Financial Counselors, Inc. (sub-advisor of the fixed income portion of the Fund)
Over the previous twelve months, how did the fixed income portion of the Fund perform and what factors contributed to this performance?
A pro-cyclical asset allocation in the Fund hurt performance relative to its primary benchmark, due to an overweight position in corporate bonds and an underweight position in U.S. Treasury securities. Some higher yielding fixed income securities in the portfolio hurt performance, as their yield component was offset by slight principal
HENNESSY FUNDS 1-800-966-4354
declines. The biggest boost to the Fund’s relative performance came from fixed income sector asset allocation and individual issue selection, while the amortization and roll effect had the largest negative impact on Fund performance.
Additional Portfolio Manager commentary on the fixed income portion of the Fund and the related investment outlook:
Every cessation of quantitative easing has resulted in a corrective phase in the risk markets, and that seems to be what may be happening now. One major unresolved element to the mix of uncertainties has to do with the Fed and their collective view of where the Federal Funds rate will be over the next 15 months. Federal Funds futures maturing in December 2016 reflect a 1.50% rate while the Fed governor average forecast is close to 3.0%. The market has pushed back very hard against the Fed members’ own forecast for the optimal Federal Funds rate and they can’t both be right.
We have positioned our bond portfolios to be market weight-duration and overweight credit, with a yield curve flattening bias. We will be on guard to reduce the interest rate sensitivity of the portfolio when we see more progress on the global economic recovery.
| * | The Blended Balanced Index consists of 60% common stocks represented by the S&P 500 Index and 40% bonds represented by the Barclays Capital Intermediate U.S. Government/Credit Index. The S&P 500 Index is an unmanaged index commonly used to measure the performance of U.S. stocks. The Barclays Capital Intermediate U.S. Government/Credit Index is an unmanaged index commonly used to measure the performance of U.S. bonds. You cannot invest directly in an index. Performance data for an index does not reflect any deductions for fees, expenses or taxes. The Fund may invest in debt securities, which typically decrease in value when interest rates rise. The risk is greater for longer term debt securities. Investments by the Fund in lower-rated and non-rated securities presents a greater risk of loss to principal and interest than higher-rated securities. Investments in Asset-Backed and Mortgage-Backed securities include additional risks that investors should be aware of, including credit risk, prepayment risk, possible illiquidity and default, as well as increased susceptibility to adverse economic developments. Investments in foreign securities may involve greater volatility and political, economic and currency risk and differences in accounting methods. The Fund may invest in IPOs, which may fluctuate considerably due to the absence of a prior public market and may have a magnified impact on the Fund. Fund holdings and sector allocations are subject to change. Please refer to the Schedule of Investments included in this report for additional portfolio information. |
Each Morningstar category average represents a universe of funds with similar investment objectives. © Morningstar, Inc. All Rights Reserved. The information contained herein: 1) is proprietary to Morningstar; 2) may not be copied or distributed and 3) is not warranted to be accurate, complete or timely. Neither Morningstar nor its content providers are responsible for any damages or losses arising from any use of this information. Past performance does not guarantee future results.
Financial Statements
HENNESSY EQUITY AND INCOME FUND
As of October 31, 2014
(% of Net Assets)
| TOP TEN HOLDINGS (EXCLUDING CASH/CASH EQUIVALENTS) | % NET ASSETS |
| | |
| General Dynamics Corp. | 2.90% |
| United State Treasury Note, 2.750%, 02/15/2024 | 2.82% |
| Carmax, Inc. | 2.72% |
| Wells Fargo & Co. | 2.63% |
| Bristol-Myers Sqibb Co. | 2.43% |
| Berkshire Hathaway, Inc., Class B | 2.32% |
| BlackRock, Inc. | 2.28% |
| Eli Lilly & Co. | 2.11% |
| Altria Group, Inc. | 1.98% |
| Lowe’s Companies, Inc. | 1.98% |
Note: For presentation purposes, the Fund has grouped some of the industry categories. For purposes of categorizing securities for compliance with Section 8(b)(1) of the Investment Company Act of 1940, the Fund uses more specific industry classifications.
HENNESSY FUNDS 1-800-966-4354
| | COMMON STOCKS – 59.87% | | Number | | | | | | % of | |
| | | | of Shares | | | Value | | | Net Assets | |
| | Consumer Discretionary – 8.21% | | | | | | | | | |
| | Bed Bath & Beyond, Inc. (a) | | | 102,910 | | | $ | 6,929,959 | | | | 1.79 | % |
| | CarMax, Inc. (a) | | | 188,039 | | | | 10,513,261 | | | | 2.72 | % |
| | Carnival Corp. (c) | | | 165,290 | | | | 6,636,394 | | | | 1.72 | % |
| | Lowe’s Companies, Inc. | | | 133,586 | | | | 7,641,119 | | | | 1.98 | % |
| | | | | | | | | 31,720,733 | | | | 8.21 | % |
| | | | | | | | | | | | | | |
| | Consumer Staples – 9.95% | | | | | | | | | | | | |
| | Altria Group, Inc. | | | 158,359 | | | | 7,655,074 | | | | 1.98 | % |
| | Brown-Forman Corp., Class B | | | 29,936 | | | | 2,774,169 | | | | 0.72 | % |
| | Energizer Holdings, Inc. | | | 62,292 | | | | 7,640,114 | | | | 1.97 | % |
| | Lorillard, Inc. | | | 69,236 | | | | 4,258,014 | | | | 1.10 | % |
| | Reynolds American, Inc. | | | 90,841 | | | | 5,714,808 | | | | 1.48 | % |
| | The Coca-Cola Co. | | | 126,431 | | | | 5,294,930 | | | | 1.37 | % |
| | Wal-Mart Stores, Inc. | | | 67,452 | | | | 5,144,564 | | | | 1.33 | % |
| | | | | | | | | 38,481,673 | | | | 9.95 | % |
| | | | | | | | | | | | | | |
| | Energy – 4.63% | | | | | | | | | | | | |
| | Apache Corp. | | | 59,880 | | | | 4,622,736 | | | | 1.19 | % |
| | Chevron Corp. | | | 59,491 | | | | 7,135,945 | | | | 1.85 | % |
| | ConocoPhillips | | | 85,378 | | | | 6,160,023 | | | | 1.59 | % |
| | | | | | | | | 17,918,704 | | | | 4.63 | % |
| | | | | | | | | | | | | | |
| | Financials – 9.99% | | | | | | | | | | | | |
| | Alleghany Corp. (a) | | | 8,720 | | | | 3,874,122 | | | | 1.00 | % |
| | Bank of America Corp. | | | 397,380 | | | | 6,819,041 | | | | 1.76 | % |
| | Berkshire Hathaway, Inc., Class B (a) | | | 63,909 | | | | 8,957,485 | | | | 2.32 | % |
| | BlackRock, Inc. | | | 25,828 | | | | 8,810,189 | | | | 2.28 | % |
| | Wells Fargo & Co. | | | 191,223 | | | | 10,152,029 | | | | 2.63 | % |
| | | | | | | | | 38,612,866 | | | | 9.99 | % |
| | | | | | | | | | | | | | |
| | Health Care – 5.61% | | | | | | | | | | | | |
| | Bristol-Myers Squibb Co. | | | 161,788 | | | | 9,414,444 | | | | 2.43 | % |
| | Eli Lilly & Co. | | | 122,760 | | | | 8,142,671 | | | | 2.11 | % |
| | Pfizer, Inc. | | | 137,555 | | | | 4,119,772 | | | | 1.07 | % |
| | | | | | | | | 21,676,887 | | | | 5.61 | % |
| | | | | | | | | | | | | | |
| | Industrials – 4.42% | | | | | | | | | | | | |
| | FedEx Corp. | | | 35,078 | | | | 5,872,057 | | | | 1.52 | % |
| | General Dynamics Corp. | | | 80,330 | | | | 11,226,921 | | | | 2.90 | % |
| | | | | | | | | 17,098,978 | | | | 4.42 | % |
The accompanying notes are an integral part of these financial statements.
| | COMMON STOCKS | | Number | | | | | | % of | |
| | | | of Shares | | | Value | | | Net Assets | |
| | Information Technology – 10.63% | | | | | | | | | |
| | Cisco Systems, Inc. | | | 216,456 | | | $ | 5,296,678 | | | | 1.37 | % |
| | Corning, Inc. | | | 357,377 | | | | 7,301,212 | | | | 1.89 | % |
| | EMC Corp. | | | 233,733 | | | | 6,715,149 | | | | 1.74 | % |
| | Intel Corp. | | | 212,199 | | | | 7,216,888 | | | | 1.87 | % |
| | International Business Machines Corp. | | | 18,865 | | | | 3,101,406 | | | | 0.80 | % |
| | Microsoft Corp. | | | 92,183 | | | | 4,327,992 | | | | 1.12 | % |
| | Visa, Inc., Class A | | | 29,529 | | | | 7,129,187 | | | | 1.84 | % |
| | | | | | | | | 41,088,512 | | | | 10.63 | % |
| | | | | | | | | | | | | | |
| | Materials – 5.00% | | | | | | | | | | | | |
| | Albemarle Corp. | | | 113,325 | | | | 6,615,913 | | | | 1.71 | % |
| | NewMarket Corp. | | | 17,300 | | | | 6,712,573 | | | | 1.74 | % |
| | The Mosaic Co. | | | 135,100 | | | | 5,986,281 | | | | 1.55 | % |
| | | | | | | | | 19,314,767 | | | | 5.00 | % |
| | | | | | | | | | | | | | |
| | Telecommunication Services – 1.43% | | | | | | | | | | | | |
| | Verizon Communications, Inc. | | | 110,108 | | | | 5,532,927 | | | | 1.43 | % |
| | | | | | | | | 5,532,927 | | | | 1.43 | % |
| | | | | | | | | | | | | | |
| | Total Common Stocks | | | | | | | | | | | | |
| | (Cost $173,667,014) | | | | | | | 231,446,047 | | | | 59.87 | % |
| | | | | | | | | | | | | | |
| | PREFERRED STOCKS – 0.01% | | | | | | | | | | | | |
| | Financials – 0.01% | | | | | | | | | | | | |
| | Fannie Mae Preferred (a) | | | 10,600 | | | | 45,050 | | | | 0.01 | % |
| | | | | | | | | | | | | | |
| | Total Preferred Stocks | | | | | | | | | | | | |
| | (Cost $265,000) | | | | | | | 45,050 | | | | 0.01 | % |
| | | | | | | | | | | | | | |
| | REITS – 0.08% | | | | | | | | | | | | |
| | Financials – 0.08% | | | | | | | | | | | | |
| | Apollo Commercial Real Estate Finance, Inc. | | | 19,000 | | | | 312,360 | | | | 0.08 | % |
| | | | | | | | | | | | | | |
| | Total REITS | | | | | | | | | | | | |
| | (Cost $318,390) | | | | | | | 312,360 | | | | 0.08 | % |
| | | | | | | | | | | | | | |
| | CORPORATE BONDS – 21.62% | | | | | | | | | | | | |
| | Consumer Discretionary – 0.65% | | | | | | | | | | | | |
| | Amazon.com, Inc. | | | | | | | | | | | | |
| | 0.650%, 11/27/2015 | | | 800,000 | | | | 801,012 | | | | 0.21 | % |
The accompanying notes are an integral part of these financial statements.
HENNESSY FUNDS 1-800-966-4354
| | CORPORATE BONDS | | Par | | | | | | % of | |
| | | | Amount | | | Value | | | Net Assets | |
| | Consumer Discretionary (Continued) | | | | | | | | | |
| | Comcast Corp. | | | | | | | | | |
| | 4.950%, 06/15/2016 | | | 600,000 | | | $ | 640,073 | | | | 0.16 | % |
| | Starbucks Corp. | | | | | | | | | | | | |
| | 6.250%, 08/15/2017 | | | 300,000 | | | | 339,247 | | | | 0.09 | % |
| | The Home Depot, Inc. | | | | | | | | | | | | |
| | 5.400%, 03/01/2016 | | | 700,000 | | | | 744,657 | | | | 0.19 | % |
| | | | | | | | | 2,524,989 | | | | 0.65 | % |
| | | | | | | | | | | | | | |
| | Consumer Staples – 0.31% | | | | | | | | | | | | |
| | Anheuser-Busch InBev Worldwide, Inc. | | | | | | | | | | | | |
| | 7.750%, 01/15/2019 | | | 150,000 | | | | 182,076 | | | | 0.05 | % |
| | CVS Health Corp. | | | | | | | | | | | | |
| | 5.750%, 06/01/2017 | | | 600,000 | | | | 666,377 | | | | 0.17 | % |
| | Wal-Mart Stores, Inc. | | | | | | | | | | | | |
| | 5.000%, 10/25/2040 | | | 300,000 | | | | 346,829 | | | | 0.09 | % |
| | | | | | | | | 1,195,282 | | | | 0.31 | % |
| | | | | | | | | | | | | | |
| | Energy – 0.23% | | | | | | | | | | | | |
| | Encana Corp. (c) | | | | | | | | | | | | |
| | 3.900%, 11/15/2021 | | | 850,000 | | | | 888,542 | | | | 0.23 | % |
| | | | | | | | | 979,669 | | | | 0.25 | % |
| | | | | | | | | | | | | | |
| | Financials – 12.68% | | | | | | | | | | | | |
| | Aflac, Inc. | | | | | | | | | | | | |
| | 8.500%, 05/15/2019 | | | 650,000 | | | | 821,908 | | | | 0.21 | % |
| | American Express Centrurion | | | | | | | | | | | | |
| | 0.875%, 11/13/2015 | | | 700,000 | | | | 702,457 | | | | 0.18 | % |
| | American Express Co. | | | | | | | | | | | | |
| | 6.150%, 08/28/2017 | | | 1,550,000 | | | | 1,747,679 | | | | 0.45 | % |
| | American Express Credit Corp. | | | | | | | | | | | | |
| | 2.750%, 09/15/2015 | | | 1,150,000 | | | | 1,172,801 | | | | 0.30 | % |
| | American International Group, Inc. | | | | | | | | | | | | |
| | 4.875%, 06/01/2022 | | | 600,000 | | | | 670,305 | | | | 0.17 | % |
| | 5.850%, 01/16/2018 | | | 1,075,000 | | | | 1,212,381 | | | | 0.32 | % |
| | Associated Banc-Corp | | | | | | | | | | | | |
| | 5.125%, 03/28/2016 | | | 700,000 | | | | 737,499 | | | | 0.19 | % |
| | Associates Corporation of North America | | | | | | | | | | | | |
| | 6.950%, 11/01/2018 | | | 300,000 | | | | 352,457 | | | | 0.09 | % |
| | Bank New York Mellon Corp. | | | | | | | | | | | | |
| | 1.969%, 06/20/2017 | | | 500,000 | | | | 510,185 | | | | 0.13 | % |
| | Bank of Montreal (c) | | | | | | | | | | | | |
| | 2.500%, 01/11/2017 | | | 400,000 | | | | 412,322 | | | | 0.11 | % |
The accompanying notes are an integral part of these financial statements.
| | CORPORATE BONDS | | Par | | | | | | % of | |
| | | | Amount | | | Value | | | Net Assets | |
| | Financials (Continued) | | | | | | | | | |
| | Bank of Nova Scotia (c) | | | | | | | | | |
| | 2.550%, 01/12/2017 | | | 1,000,000 | | | $ | 1,031,262 | | | | 0.27 | % |
| | BlackRock, Inc. | | | | | | | | | | | | |
| | 3.500%, 03/18/2024 | | | 1,000,000 | | | | 1,018,412 | | | | 0.26 | % |
| | Boston Properties, Inc. | | | | | | | | | | | | |
| | 5.875%, 10/15/2019 | | | 700,000 | | | | 808,397 | | | | 0.21 | % |
| | Capital One Financial Corp. | | | | | | | | | | | | |
| | 4.750%, 07/15/2021 | | | 1,500,000 | | | | 1,653,778 | | | | 0.43 | % |
| | Citigroup, Inc. | | | | | | | | | | | | |
| | 6.125%, 11/21/2017 | | | 1,455,000 | | | | 1,636,985 | | | | 0.42 | % |
| | Credit Suisse USA, Inc. | | | | | | | | | | | | |
| | 5.125%, 08/15/2015 | | | 975,000 | | | | 1,009,718 | | | | 0.26 | % |
| | Discover Financial Services | | | | | | | | | | | | |
| | 5.200%, 04/27/2022 | | | 900,000 | | | | 990,261 | | | | 0.26 | % |
| | Fifth Third Bancorp | | | | | | | | | | | | |
| | 3.625%, 01/25/2016 | | | 700,000 | | | | 723,734 | | | | 0.19 | % |
| | First Niagara Financial Group, Inc. | | | | | | | | | | | | |
| | 6.750%, 03/19/2020 | | | 590,000 | | | | 678,816 | | | | 0.18 | % |
| | Ford Motor Credit Co. LLC | | | | | | | | | | | | |
| | 3.000%, 06/12/2017 | | | 1,750,000 | | | | 1,805,473 | | | | 0.47 | % |
| | Franklin Resources, Inc. | | | | | | | | | | | | |
| | 1.375%, 09/15/2017 | | | 1,080,000 | | | | 1,081,610 | | | | 0.28 | % |
| | General Electric Capital Corp. | | | | | | | | | | | | |
| | 1.625%, 04/02/2018 | | | 500,000 | | | | 500,682 | | | | 0.13 | % |
| | 5.000%, 01/08/2016 | | | 500,000 | | | | 525,169 | | | | 0.13 | % |
| | 5.625%, 05/01/2018 | | | 1,050,000 | | | | 1,188,130 | | | | 0.31 | % |
| | Genworth Financial, Inc. | | | | | | | | | | | | |
| | 6.515%, 05/22/2018 | | | 500,000 | | | | 563,496 | | | | 0.15 | % |
| | Goldman Sachs Group, Inc. | | | | | | | | | | | | |
| | 5.375%, 03/15/2020 | | | 1,100,000 | | | | 1,234,318 | | | | 0.32 | % |
| | HSBC Finance Corp. | | | | | | | | | | | | |
| | 5.000%, 06/30/2015 | | | 1,200,000 | | | | 1,232,297 | | | | 0.32 | % |
| | J.P. Morgan Chase & Co. | | | | | | | | | | | | |
| | 6.000%, 01/15/2018 | | | 1,000,000 | | | | 1,127,669 | | | | 0.29 | % |
| | KeyCorp | | | | | | | | | | | | |
| | 3.750%, 08/13/2015 | | | 900,000 | | | | 921,483 | | | | 0.24 | % |
| | 5.100%, 03/24/2021 | | | 950,000 | | | | 1,068,071 | | | | 0.27 | % |
| | Lazard Group | | | | | | | | | | | | |
| | 6.850%, 06/15/2017 | | | 320,000 | | | | 360,694 | | | | 0.09 | % |
| | Lincoln National Corp. | | | | | | | | | | | | |
| | 6.250%, 02/15/2020 | | | 780,000 | | | | 917,056 | | | | 0.24 | % |
The accompanying notes are an integral part of these financial statements.
HENNESSY FUNDS 1-800-966-4354
| | CORPORATE BONDS | | Par | | | | | | % of | |
| | | | Amount | | | Value | | | Net Assets | |
| | Financials (Continued) | | | | | | | | | |
| | Manulife Financial Corp. (c) | | | | | | | | | |
| | 3.400%, 09/17/2015 | | | 300,000 | | | $ | 307,407 | | | | 0.08 | % |
| | Merrill Lynch & Company, Inc. | | | | | | | | | | | | |
| | 6.875%, 04/25/2018 | | | 955,000 | | | | 1,105,585 | | | | 0.29 | % |
| | Merrill Lynch & Company, Inc., Series MTNC | | | | | | | | | | | | |
| | 0.6906%, 01/15/2015 | | | 250,000 | | | | 250,111 | | | | 0.06 | % |
| | MetLife, Inc., Series A | | | | | | | | | | | | |
| | 6.817%, 08/15/2018 | | | 100,000 | | | | 117,345 | | | | 0.03 | % |
| | Morgan Stanley | | | | | | | | | | | | |
| | 5.375%, 10/15/2015 | | | 500,000 | | | | 522,059 | | | | 0.14 | % |
| | 5.500%, 07/28,2021 | | | 858,000 | | | | 979,669 | | | | 0.25 | % |
| | 6.625%, 04/01/2018 | | | 250,000 | | | | 286,511 | | | | 0.07 | % |
| | National Australia Bank Ltd. (c) | | | | | | | | | | | | |
| | 1.367%, 08/07/2015 | | | 2,000,000 | | | | 2,016,526 | | | | 0.52 | % |
| | Prudential Financial, Inc. | | | | | | | | | | | | |
| | 5.500%, 03/15/2016 | | | 310,000 | | | | 329,381 | | | | 0.09 | % |
| | Qwest Capital Funding, Inc. | | | | | | | | | | | | |
| | 6.500%, 11/15/2018 | | | 700,000 | | | | 778,750 | | | | 0.20 | % |
| | Raymond James Financial, Inc. | | | | | | | | | | | | |
| | 5.625%, 04/01/2024 | | | 700,000 | | | | 796,949 | | | | 0.21 | % |
| | Royal Bank of Canada (c) | | | | | | | | | | | | |
| | 2.200%, 07/27/2018 | | | 1,000,000 | | | | 1,016,029 | | | | 0.26 | % |
| | St. Paul Travelers, Inc. | | | | | | | | | | | | |
| | 5.500%, 12/01/2015 | | | 275,000 | | | | 289,470 | | | | 0.07 | % |
| | SunTrust Banks, Inc. | | | | | | | | | | | | |
| | 3.600%, 04/15/2016 | | | 250,000 | | | | 259,921 | | | | 0.07 | % |
| | 6.000%, 09/11/2017 | | | 250,000 | | | | 281,059 | | | | 0.07 | % |
| | Synchrony Financial | | | | | | | | | | | | |
| | 3.750%, 08/15/2021 | | | 1,200,000 | | | | 1,224,510 | | | | 0.32 | % |
| | The Bear Stearns Companies, Inc. | | | | | | | | | | | | |
| | 6.400%, 10/02/2017 | | | 1,350,000 | | | | 1,527,695 | | | | 0.40 | % |
| | The Charles Schwab Corp. | | | | | | | | | | | | |
| | 0.850%, 12/04/2015 | | | 1,000,000 | | | | 1,003,440 | | | | 0.26 | % |
| | The Goldman Sachs Group, Inc. | | | | | | | | | | | | |
| | 5.350%, 01/15/2016 | | | 500,000 | | | | 527,322 | | | | 0.14 | % |
| | The Hartford Financial Services Group, Inc. | | | | | | | | | | | | |
| | 5.375%, 03/15/2017 | | | 300,000 | | | | 327,615 | | | | 0.08 | % |
| | The Royal Bank of Scotland PLC (c) | | | | | | | | | | | | |
| | 4.375%, 03/16/2016 | | | 400,000 | | | | 417,684 | | | | 0.11 | % |
The accompanying notes are an integral part of these financial statements.
| | CORPORATE BONDS | | Par | | | | | | % of | |
| | | | Amount | | | Value | | | Net Assets | |
| | Financials (Continued) | | | | | | | | | |
| | Toronto Dominion Bank (c) | | | | | | | | | |
| | 2.375%, 10/19/2016 | | | 1,000,000 | | | $ | 1,031,735 | | | | 0.27 | % |
| | Wachovia Corp. | | | | | | | | | | | | |
| | 5.750%, 06/15/2017 | | | 850,000 | | | | 945,660 | | | | 0.24 | % |
| | Wells Fargo & Co. | | | | | | | | | | | | |
| | 5.625%, 12/11/2017 | | | 1,000,000 | | | | 1,122,584 | | | | 0.29 | % |
| | Westpac Banking Corp. (c) | | | | | | | | | | | | |
| | 0.838%, 01/17/2019 | | | 1,075,000 | | | | 1,081,463 | | | | 0.28 | % |
| | 4.200%, 02/27/2015 | | | 500,000 | | | | 505,953 | | | | 0.13 | % |
| | 4.875%, 11/19/2019 | | | 450,000 | | | | 506,574 | | | | 0.13 | % |
| | | | | | | | | 49,976,512 | | | | 12.93 | % |
| | | | | | | | | | | | | | |
| | Health Care – 2.08% | | | | | | | | | | | | |
| | AbbVie, Inc. | | | | | | | | | | | | |
| | 1.200%, 11/06/2015 | | | 1,250,000 | | | | 1,257,375 | | | | 0.33 | % |
| | Agilent Technologies, Inc. | | | | | | | | | | | | |
| | 5.000%, 07/15/2020 | | | 650,000 | | | | 711,967 | | | | 0.18 | % |
| | Amgen, Inc. | | | | | | | | | | | | |
| | 2.500%, 11/15/2016 | | | 1,000,000 | | | | 1,028,195 | | | | 0.27 | % |
| | Celgene Corp. | | | | | | | | | | | | |
| | 2.300%, 08/15/2018 | | | 1,000,000 | | | | 1,007,445 | | | | 0.26 | % |
| | 3.625%, 05/15/2024 | | | 600,000 | | | | 607,578 | | | | 0.16 | % |
| | Express Scripts Holding Co. | | | | | | | | | | | | |
| | 3.500%, 06/15/2024 | | | 700,000 | | | | 695,181 | | | | 0.18 | % |
| | GlaxoSmithKline Capital, Inc. (c) | | | | | | | | | | | | |
| | 1.500%, 05/08/2017 | | | 500,000 | | | | 504,644 | | | | 0.13 | % |
| | Merck and Co., Inc. | | | | | | | | | | | | |
| | 6.000%, 09/15/2017 | | | 850,000 | | | | 963,411 | | | | 0.25 | % |
| | UnitedHealth Group, Inc. | | | | | | | | | | | | |
| | 5.375%, 03/15/2016 | | | 250,000 | | | | 266,282 | | | | 0.07 | % |
| | Wellpoint, Inc. | | | | | | | | | | | | |
| | 2.375%, 02/15/2017 | | | 960,000 | | | | 984,422 | | | | 0.25 | % |
| | | | | | | | | 8,026,500 | | | | 2.08 | % |
| | | | | | | | | | | | | | |
| | Industrials – 0.26% | | | | | | | | | | | | |
| | John Deere Capital Corp. | | | | | | | | | | | | |
| | 1.850%, 09/15/2016 | | | 1,000,000 | | | | 1,019,910 | | | | 0.26 | % |
| | | | | | | | | 1,019,910 | | | | 0.26 | % |
| | | | | | | | | | | | | | |
| | Information Technology – 1.69% | | | | | | | | | | | | |
| | Altera Corp. | | | | | | | | | | | | |
| | 1.750%, 05/15/2017 | | | 1,000,000 | | | | 1,006,340 | | | | 0.26 | % |
| | Applied Materials, Inc. | | | | | | | | | | | | |
| | 4.300%, 06/15/2021 | | | 300,000 | | | | 327,076 | | | | 0.08 | % |
The accompanying notes are an integral part of these financial statements.
HENNESSY FUNDS 1-800-966-4354
| | CORPORATE BONDS | | Par | | | | | | % of | |
| | | | Amount | | | Value | | | Net Assets | |
| | Information Technology (Continued) | | | | | | | | | |
| | Corning, Inc. | | | | | | | | | |
| | 6.850%, 03/01/2029 | | | 275,000 | | | $ | 349,902 | | | | 0.09 | % |
| | eBay, Inc. | | | | | | | | | | | | |
| | 3.250%, 10/15/2020 | | | 1,000,000 | | | | 1,010,470 | | | | 0.26 | % |
| | EMC Corp. | | | | | | | | | | | | |
| | 1.875%, 06/01/2018 | | | 1,000,000 | | | | 994,898 | | | | 0.26 | % |
| | Hewlett Packard Co. | | | | | | | | | | | | |
| | 3.000%, 09/15/2016 | | | 1,000,000 | | | | 1,033,205 | | | | 0.27 | % |
| | Juniper Networks, Inc. | | | | | | | | | | | | |
| | 4.600%, 03/15/2021 | | | 1,000,000 | | | | 1,063,677 | | | | 0.28 | % |
| | KLA-Tencor Corp. | | | | | | | | | | | | |
| | 6.900%, 05/01/2018 | | | 650,000 | | | | 753,157 | | | | 0.19 | % |
| | | | | | | | | 6,538,725 | | | | 1.69 | % |
| | | | | | | | | | | | | | |
| | Materials – 1.63% | | | | | | | | | | | | |
| | Alcoa, Inc. | | | | | | | | | | | | |
| | 6.150%, 08/15/2020 | | | 625,000 | | | | 705,393 | | | | 0.18 | % |
| | AngloGold Ashanti Holdings PLC (c) | | | | | | | | | | | | |
| | 5.125%, 08/01/2022 | | | 1,000,000 | | | | 949,038 | | | | 0.25 | % |
| | El du Pont de Nemours & Co. | | | | | | | | | | | | |
| | 4.750%, 03/15/2015 | | | 315,000 | | | | 320,001 | | | | 0.08 | % |
| | Goldcorp, Inc. (c) | | | | | | | | | | | | |
| | 2.125%, 03/15/2018 | | | 1,250,000 | | | | 1,250,446 | | | | 0.33 | % |
| | International Paper Co. | | | | | | | | | | | | |
| | 9.375%, 05/15/2019 | | | 250,000 | | | | 322,107 | | | | 0.08 | % |
| | Rio Tinto Finance USA PLC (c) | | | | | | | | | | | | |
| | 1.375%, 06/17/2016 | | | 1,000,000 | | | | 1,007,922 | | | | 0.26 | % |
| | 2.000%, 03/22/2017 | | | 640,000 | | | | 649,356 | | | | 0.17 | % |
| | The Dow Chemical Co. | | | | | | | | | | | | |
| | 4.250%, 11/15/2020 | | | 1,000,000 | | | | 1,078,259 | | | | 0.28 | % |
| | | | | | | | | 6,282,522 | | | | 1.63 | % |
| | | | | | | | | | | | | | |
| | Telecommunication Services – 1.76% | | | | | | | | | | | | |
| | AT&T, Inc. | | | | | | | | | | | | |
| | 2.950%, 05/15/2016 | | | 775,000 | | | | 799,647 | | | | 0.21 | % |
| | 3.000%, 02/15/2022 | | | 250,000 | | | | 247,572 | | | | 0.06 | % |
| | 5.350%, 09/01/2040 | | | 200,000 | | | | 214,301 | | | | 0.05 | % |
| | 5.800%, 02/15/2019 | | | 800,000 | | | | 917,162 | | | | 0.24 | % |
| | CenturyLink, Inc. | | | | | | | | | | | | |
| | 5.150%, 06/15/2017 | | | 400,000 | | | | 426,000 | | | | 0.11 | % |
| | Deutsche Telekom AG (c) | | | | | | | | | | | | |
| | 6.000%, 07/08/2019 | | | 1,160,000 | | | | 1,352,886 | | | | 0.35 | % |
The accompanying notes are an integral part of these financial statements.
| | CORPORATE BONDS | | Par | | | | | | % of | |
| | | | Amount | | | Value | | | Net Assets | |
| | Telecommunication Services (Continued) | | | | | | | | | |
| | Verizon Communications, Inc. | | | | | | | | | |
| | 0.700%, 11/02/2015 | | | 800,000 | | | $ | 800,788 | | | | 0.21 | % |
| | 6.350%, 04/01/2019 | | | 600,000 | | | | 700,458 | | | | 0.18 | % |
| | 8.750%, 11/01/2018 | | | 292,000 | | | | 364,738 | | | | 0.09 | % |
| | Vodafone Group PLC (c) | | | | | | | | | | | | |
| | 1.500%, 02/19/2018 | | | 1,000,000 | | | | 987,052 | | | | 0.26 | % |
| | | | | | | | | 6,810,604 | | | | 1.76 | % |
| | | | | | | | | | | | | | |
| | Utilities – 0.08% | | | | | | | | | | | | |
| | Sempra Energy | | | | | | | | | | | | |
| | 6.500%, 06/01/2016 | | | 275,000 | | | | 299,120 | | | | 0.08 | % |
| | | | | | | | | | | | | | |
| | Total Corporate Bonds | | | | | | | | | | | | |
| | (Cost $81,591,857) | | | | | | | 83,562,706 | | | | 21.62 | % |
| | | | | | | | | | | | | | |
| | MORTGAGE BACKED SECURITIES – 3.57% | | | | | | | | | | | | |
| | | | | | | | | | | | | | |
| | Federal Home Loan Mortgage Corp. | | | | | | | | | | | | |
| | 3.000%, 05/01/2042 | | | 1,402,945 | | | | 1,408,265 | | | | 0.36 | % |
| | 3.000%, 09/01/2042 | | | 2,686,534 | | | | 2,696,168 | | | | 0.70 | % |
| | 5.000%, 05/01/2020 | | | 109,240 | | | | 117,319 | | | | 0.03 | % |
| | 5.500%, 04/01/2037 | | | 205,772 | | | | 231,776 | | | | 0.06 | % |
| | | | | | | | | | | | | | |
| | Federal National Mortgage Association | | | | | | | | | | | | |
| | 1.000%, 08/27/2024 | | | 1,400,000 | | | | 1,400,131 | | | | 0.36 | % |
| | 2.000%, 02/27/2032 | | | 980,000 | | | | 978,391 | | | | 0.25 | % |
| | 2.400%, 11/07/2024 | | | 1,000,000 | | | | 950,432 | | | | 0.25 | % |
| | 3.000%, 03/20/2028 | | | 2,200,000 | | | | 2,207,786 | | | | 0.57 | % |
| | 3.500%, 01/01/2042 | | | 892,190 | | | | 925,110 | | | | 0.24 | % |
| | 4.000%, 12/01/2041 | | | 1,145,686 | | | | 1,218,160 | | | | 0.32 | % |
| | 4.000%, 10/01/2041 | | | 1,285,154 | | | | 1,366,450 | | | | 0.35 | % |
| | 4.500%, 08/01/2020 | | | 120,902 | | | | 128,185 | | | | 0.03 | % |
| | 6.000%, 10/01/2037 | | | 165,151 | | | | 187,203 | | | | 0.05 | % |
| | | | | | | | | | | | | | |
| | Total Mortgage Backed Securities | | | | | | | | | | | | |
| | (Cost $13,807,502) | | | | | | | 13,815,376 | | | | 3.57 | % |
| | | | | | | | | | | | | | |
| | U.S. TREASURY OBLIGATIONS – 8.61% | | | | | | | | | | | | |
| | U.S. Treasury Bonds – 0.65% | | | | | | | | | | | | |
| | U.S. Treasury Bonds | | | | | | | | | | | | |
| | 3.625%, 02/15/2044 | | | 2,250,000 | | | | 2,497,325 | | | | 0.64 | % |
| | U.S. Treasury Inflation Index Bond | | | | | | | | | | | | |
| | 0.125%, 07/15/2022 | | | 25,858 | | | | 25,528 | | | | 0.01 | % |
| | | | | | | | | 2,522,853 | | | | 0.65 | % |
| | | | | | | | | | | | | | |
| | U.S. Treasury Notes – 7.96% | | | | | | | | | | | | |
| | U.S. Treasury Notes | | | | | | | | | | | | |
| | 1.625%, 06/30/2019 | | | 4,500,000 | | | | 4,514,765 | | | | 1.17 | % |
The accompanying notes are an integral part of these financial statements.
HENNESSY FUNDS 1-800-966-4354
| | U.S. TREASURY OBLIGATIONS | | Par | | | | | | % of | |
| | | | Amount | | | Value | | | Net Assets | |
| | U.S. Treasury Notes (Continued) | | | | | | | | | |
| | 2.250%, 07/31/2021 | | | 1,750,000 | | | $ | 1,775,704 | | | | 0.46 | % |
| | 2.375%, 03/31/2016 | | | 6,005,000 | | | | 6,179,992 | | | | 1.60 | % |
| | 2.500%, 08/15/2023 | | | 1,100,000 | | | | 1,122,687 | | | | 0.29 | % |
| | 2.750%, 02/15/2024 | | | 10,500,000 | | | | 10,906,056 | | | | 2.82 | % |
| | 3.250%, 03/31/2017 | | | 3,000,000 | | | | 3,182,109 | | | | 0.83 | % |
| | 4.125%, 05/15/2015 | | | 3,000,000 | | | | 3,063,984 | | | | 0.79 | % |
| | | | | | | | | 30,745,297 | | | | 7.96 | % |
| | | | | | | | | | | | | | |
| | Total U.S. Treasury Obligations | | | | | | | | | | | | |
| | (Cost $32,911,170) | | | | | | | 33,268,150 | | | | 8.61 | % |
| | | | | | | | | | | | | | |
| | U.S. GOVERNMENT AGENCY ISSUE – 1.16% | | | | | | | | | | | | |
| | Finance and Insurance – 1.16% | | | | | | | | | | | | |
| | Federal Home Loan Banks | | | | | | | | | | | | |
| | 1.000%, 07/23/2029 | | | 2,000,000 | | | | 1,959,282 | | | | 0.51 | % |
| | 1.500%, 09/30/2024 | | | 650,000 | | | | 651,243 | | | | 0.17 | % |
| | 3.000%, 07/17/2029 | | | 1,200,000 | | | | 1,203,600 | | | | 0.31 | % |
| | 5.750%, 06/15/2037 | | | 600,000 | | | | 667,867 | | | | 0.17 | % |
| | | | | | | | | 4,481,992 | | | | 1.16 | % |
| | | | | | | | | | | | | | |
| | Total U.S. Government Agency Issue | | | | | | | | | | | | |
| | (Cost $4,536,174) | | | | | | | 4,481,992 | | | | 1.16 | % |
| | | | | | | | | | | | | | |
| | INVESTMENT COMPANIES (Excluding | | | | | | | | | | | | |
| | Money Market Funds) – 2.95% | | | | | | | | | | | | |
| | Apollo Investment Corp. | | | 40,000 | | | | 330,000 | | | | 0.08 | % |
| | Ares Capital Corp. | | | 17,500 | | | | 279,825 | | | | 0.07 | % |
| | Calamos Convertible Opportunities and Income Fund | | | 16,000 | | | | 219,040 | | | | 0.06 | % |
| | iShares iBoxx $High Yield Corporation Bond Fund | | | 20,000 | | | | 1,850,600 | | | | 0.48 | % |
| | iShares S&P U.S. Preferred Stock Index Fund | | | 82,500 | | | | 3,279,375 | | | | 0.85 | % |
| | Oha Investment Corp. | | | 8,000 | | | | 51,920 | | | | 0.01 | % |
| | PennantPark Investment Corp. | | | 19,000 | | | | 206,720 | | | | 0.06 | % |
| | PowerShares Senior Loan Portfolio | | | 25,000 | | | | 609,500 | | | | 0.16 | % |
| | SPDR Barclays Capital High Yield Bond | | | 27,000 | | | | 1,089,720 | | | | 0.28 | % |
| | SPDR Barclays Short Term High Yield | | | 99,500 | | | | 2,980,025 | | | | 0.77 | % |
| | Wisdomtree Emerging Markets Local Debt Fund | | | 11,000 | | | | 491,810 | | | | 0.13 | % |
| | | | | | | | | 11,388,535 | | | | 2.95 | % |
| | | | | | | | | | | | | | |
| | Total Investment Companies (Excluding | | | | | | | | | | | | |
| | Money Market Funds) (Cost $11,516,543) | | | | | | | 11,388,535 | | | | 2.95 | % |
The accompanying notes are an integral part of these financial statements.
| | SHORT-TERM INVESTMENTS – 1.72% | | Number | | | | | | % of | |
| | | | of Shares | | | Value | | | Net Assets | |
| | Money Market Funds – 1.72% | | | | | | | | | |
| | Fidelity Government Portfolio – Institutional Class, 0.01% (b) | | | 6,648,848 | | | $ | 6,648,848 | | | | 1.72 | % |
| | | | | | | | | | | | | | |
| | Total Short-Term Investments | | | | | | | | | | | | |
| | (Cost $6,648,848) | | | | | | | 6,648,848 | | | | 1.72 | % |
| | | | | | | | | | | | | | |
| | Total Investments | | | | | | | | | | | | |
| | (Cost $325,262,498) – 99.59% | | | | | | | 384,969,064 | | | | 99.59 | % |
| | Other Assets in Excess | | | | | | | | | | | | |
| | of Liabilities – 0.41% | | | | | | | 1,584,525 | | | | 0.41 | % |
| | TOTAL NET ASSETS – 100.00% | | | | | | $ | 386,553,589 | | | | 100.00 | % |
Percentages are stated as a percent of net assets.
REIT – Real Estate Investment Trust
| | (a) | Non-income producing security. |
| | (b) | The rate listed is the fund’s 7-day yield as of October 31, 2014. |
| | (c) | U.S. traded security of a foreign corporation. |
The accompanying notes are an integral part of these financial statements.
HENNESSY FUNDS 1-800-966-4354
Summary of Fair Value Exposure at October 31, 2014
The following is a summary of the inputs used to value the Fund’s net assets as of October 31, 2014 (See Note 3 in the accompanying notes to the financial statements):
| Common Stocks | | Level 1 | | | Level 2 | | | Level 3 | | | Total | |
| Consumer Discretionary | | $ | 31,720,733 | | | $ | — | | | $ | — | | | $ | 31,720,733 | |
| Consumer Staples | | | 38,481,673 | | | | — | | | | — | | | | 38,481,673 | |
| Energy | | | 17,918,704 | | | | — | | | | — | | | | 17,918,704 | |
| Financials | | | 38,612,866 | | | | — | | | | — | | | | 38,612,866 | |
| Health Care | | | 21,676,887 | | | | — | | | | — | | | | 21,676,887 | |
| Industrials | | | 17,098,978 | | | | — | | | | — | | | | 17,098,978 | |
| Information Technology | | | 41,088,512 | | | | — | | | | — | | | | 41,088,512 | |
| Materials | | | 19,314,767 | | | | — | | | | — | | | | 19,314,767 | |
| Telecommunication Services | | | 5,532,927 | | | | — | | | | — | | | | 5,532,927 | |
| Total Common Stocks | | $ | 231,446,047 | | | $ | — | | | $ | — | | | $ | 231,446,047 | |
| Preferred Stocks | | | | | | | | | | | | | | | | |
| Financials | | $ | 45,050 | | | $ | — | | | $ | — | | | $ | 45,050 | |
| Total Preferred Stocks | | $ | 45,050 | | | $ | — | | | $ | — | | | $ | 45,050 | |
| REITS | | | | | | | | | | | | | | | | |
| Financials | | $ | 312,360 | | | $ | — | | | $ | — | | | $ | 312,360 | |
| Total REITS | | $ | 312,360 | | | $ | — | | | $ | — | | | $ | 312,360 | |
| Corporate Bonds | | | | | | | | | | | | | | | | |
| Consumer Discretionary | | $ | — | | | $ | 2,524,989 | | | $ | — | | | $ | 2,524,989 | |
| Consumer Staples | | | — | | | | 1,195,282 | | | | — | | | | 1,195,282 | |
| Energy | | | — | | | | 888,542 | | | | — | | | | 888,542 | |
| Finances and Insurance | | | — | | | | 979,669 | | | | — | | | | 979,669 | |
| Financials | | | — | | | | 48,996,843 | | | | — | | | | 48,996,843 | |
| Health Care | | | — | | | | 8,026,500 | | | | — | | | | 8,026,500 | |
| Industrials | | | — | | | | 1,019,910 | | | | — | | | | 1,019,910 | |
| Information Technology | | | — | | | | 6,538,725 | | | | — | | | | 6,538,725 | |
| Materials | | | — | | | | 6,282,522 | | | | — | | | | 6,282,522 | |
| Telecommunication Services | | | — | | | | 6,810,604 | | | | — | | | | 6,810,604 | |
| Utilities | | | — | | | | 299,120 | | | | — | | | | 299,120 | |
| Total Corporate Bonds | | $ | — | | | $ | 83,562,706 | | | $ | — | | | $ | 83,562,706 | |
| Mortgage Backed Securities | | $ | — | | | $ | 13,815,376 | | | $ | — | | | $ | 13,815,376 | |
| U.S. Treasury Obligations | | | | | | | | | | | | | | | | |
| U.S. Treasury Bonds | | $ | — | | | $ | 2,522,853 | | | $ | — | | | $ | 2,522,853 | |
| U.S. Treasury Notes | | | — | | | | 30,745,297 | | | | — | | | | 30,745,297 | |
| Total U.S. Treasury Obligations | | $ | — | | | $ | 33,268,150 | | | $ | — | | | $ | 33,268,150 | |
| U.S. Government Agency Issues | | $ | — | | | $ | 4,481,992 | | | $ | — | | | $ | 4,481,992 | |
| Investment Companies (Excluding | | | | | | | | | | | | | | | | |
| Money Market Funds) | | $ | 11,388,535 | | | $ | — | | | $ | — | | | $ | 11,388,535 | |
| Short-Term Investments | | | | | | | | | | | | | | | | |
| Money Market Funds | | $ | 6,648,848 | | | $ | — | | | $ | — | | | $ | 6,648,848 | |
| Total Short-Term Investments | | $ | 6,648,848 | | | $ | — | | | $ | — | | | $ | 6,648,848 | |
| Total Investments | | $ | 249,840,840 | | | $ | 135,128,224 | | | $ | — | | | $ | 384,969,064 | |
Transfers between levels are recognized at the end of the reporting period. During the one-year period ended October 31, 2014, the Fund recognized no transfers between levels.
The accompanying notes are an integral part of these financial statements.
Financial Statements
Statement of Assets and Liabilities as of October 31, 2014 |
| ASSETS: | | | |
| Investments in securities, at value (cost $325,262,498) | | $ | 384,969,064 | |
| Cash | | | 1,980 | |
| Dividends and interest receivable | | | 1,380,961 | |
| Receivable for fund shares sold | | | 1,137,474 | |
| Receivable for securities sold | | | 989,470 | |
| Prepaid expenses and other assets | | | 26,472 | |
| Total Assets | | | 388,505,421 | |
| | | | | |
| LIABILITIES: | | | | |
| Payable for securities purchased | | | 992,658 | |
| Payable for fund shares redeemed | | | 469,470 | |
| Payable to advisor | | | 267,881 | |
| Payable to administrator | | | 63,878 | |
| Payable to auditor | | | 19,106 | |
| Accrued distribution fees | | | 63,615 | |
| Accrued trustees fees | | | 2,272 | |
| Accrued expenses and other payables | | | 72,952 | |
| Total Liabilities | | | 1,951,832 | |
| NET ASSETS | | $ | 386,553,589 | |
| | | | | |
| NET ASSETS CONSIST OF: | | | | |
| Capital stock | | $ | 311,212,890 | |
| Accumulated net investment income | | | 225,718 | |
| Accumulated net realized gain on investments | | | 15,408,415 | |
| Unrealized net appreciation on investments | | | 59,706,566 | |
| Total Net Assets | | $ | 386,553,589 | |
| | | | | |
| NET ASSETS | | | | |
| Investor Class: | | | | |
| Shares authorized (no par value) | | Unlimited | |
| Net assets applicable to outstanding Investor Class shares | | $ | 284,452,031 | |
| Shares issued and outstanding | | | 17,050,284 | |
| Net asset value, offering price and redemption price per share | | $ | 16.68 | |
| | | | | |
| Institutional Class: | | | | |
| Shares authorized (no par value) | | Unlimited | |
| Net assets applicable to outstanding Institutional Class shares | | $ | 102,101,558 | |
| Shares issued and outstanding | | | 6,461,924 | |
| Net asset value, offering price and redemption price per share | | $ | 15.80 | |
The accompanying notes are an integral part of these financial statements.
HENNESSY FUNDS 1-800-966-4354
Financial Statements
Statement of Operations for the year ended October 31, 2014 |
| INVESTMENT INCOME: | | | |
| Dividend income | | $ | 5,175,538 | |
| Interest income | | | 2,768,249 | |
| Total investment income | | | 7,943,787 | |
| | | | | |
| EXPENSES: | | | | |
| Investment advisory fees (See Note 5) | | | 2,717,393 | |
| Distribution fees – Investor Class (See Note 5) | | | 624,882 | |
| Administration, fund accounting, custody and transfer agent fees | | | 383,950 | |
| Sub-transfer agent expenses – Investor Class (See Note 5) | | | 288,976 | |
| Sub-transfer agent expenses – Institutional Class (See Note 5) | | | 78,985 | |
| Federal and state registration fees | | | 46,114 | |
| Reports to shareholders | | | 38,202 | |
| Compliance expense | | | 21,488 | |
| Audit fees | | | 19,100 | |
| Trustees’ fees and expenses | | | 11,622 | |
| Legal fees | | | 5,253 | |
| Other expenses | | | 25,532 | |
| Total expenses before recoupment by advisor | | | 4,261,497 | |
| Expense recoupment by advisor – Investor Class (See Note 5) | | | 5,453 | |
| Total expenses | | | 4,266,950 | |
| NET INVESTMENT INCOME | | $ | 3,676,837 | |
| | | | | |
| REALIZED AND UNREALIZED GAINS (LOSSES): | | | | |
| Net realized gain on investments | | $ | 15,504,616 | |
| Net change in unrealized appreciation on investments | | | 14,585,293 | |
| Net gain on investments | | | 30,089,909 | |
| NET INCREASE IN NET ASSETS RESULTING FROM OPERATIONS | | $ | 33,766,746 | |
The accompanying notes are an integral part of these financial statements.
Financial Statements
| Statements of Changes in Net Assets |
| | | Year Ended | | | Year Ended | |
| | | October 31, 2014 | | | October 31, 2013 | |
| OPERATIONS: | | | | | | |
| Net investment income | | $ | 3,676,837 | | | $ | 4,864,880 | |
| Net realized gain on investments | | | 15,504,616 | | | | 13,272,491 | |
| Net change in unrealized appreciation on investments | | | 14,585,293 | | | | 21,344,922 | |
| Net increase in net assets resulting from operations | | | 33,766,746 | | | | 39,482,293 | |
| | | | | | | | | |
| DISTRIBUTIONS TO SHAREHOLDERS FROM: | | | | | | | | |
| Net investment income – Investor Class | | | (2,501,276 | ) | | | (3,063,016 | ) |
| Net investment income – Institutional Class | | | (1,216,647 | ) | | | (1,937,482 | ) |
| Net realized gains – Investor Class | | | (7,388,837 | ) | | | — | |
| Net realized gains – Institutional Class | | | (2,912,412 | ) | | | — | |
| Total distributions | | | (14,019,172 | ) | | | (5,000,498 | ) |
| | | | | | | | | |
| CAPITAL SHARE TRANSACTIONS: | | | | | | | | |
| Proceeds from shares subscribed – Investor Class | | | 89,438,072 | | | | 99,856,871 | |
| Proceeds from shares subscribed – Institutional Class | | | 33,413,966 | | | | 29,868,131 | |
| Dividends reinvested – Investor Class | | | 9,653,413 | | | | 2,933,613 | |
| Dividends reinvested – Institutional Class | | | 2,948,861 | | | | 1,518,097 | |
| Cost of shares redeemed – Investor Class | | | (62,677,527 | )(1) | | | (90,377,638 | )(2) |
| Cost of shares redeemed – Institutional Class | | | (24,337,024 | ) | | | (65,319,830 | )(2) |
| Net increase (decrease) in net assets derived | | | | | | | | |
| from capital share transactions | | | 48,439,761 | | | | (21,520,756 | ) |
| TOTAL INCREASE IN NET ASSETS | | | 68,187,335 | | | | 12,961,039 | |
| | | | | | | | | |
| NET ASSETS: | | | | | | | | |
| Beginning of year | | | 318,366,254 | | | | 305,405,215 | |
| End of year | | $ | 386,553,589 | | | $ | 318,366,254 | |
| Undistributed net investment income, end of year | | $ | 225,718 | | | $ | 247,147 | |
| | | | | | | | | |
| CHANGES IN SHARES OUTSTANDING: | | | | | | | | |
| Shares sold – Investor Class | | | 5,597,992 | | | | 6,666,051 | |
| Shares sold – Institutional Class | | | 2,204,175 | | | | 2,087,219 | |
| Shares issued to holders as reinvestment | | | | | | | | |
| of dividends – Investor Class | | | 620,329 | | | | 200,342 | |
| Shares issued to holders as reinvestment | | | | | | | | |
| of dividends – Institutional Class | | | 199,624 | | | | 110,506 | |
| Shares redeemed – Investor Class | | | (3,961,896 | ) | | | (6,175,811 | ) |
| Shares redeemed – Institutional Class | | | (1,628,945 | ) | | | (4,674,153 | ) |
| Net increase (decrease) in shares outstanding | | | 3,031,279 | | | | (1,785,846 | ) |
| (1) | Net of redemption fees of $105 related to redemption fees imposed by the FBR Balanced Fund during a prior year but not received until the fiscal year ended October 31, 2014. |
| (2) | Net of redemption fees of $1,077 and $482 for the Investor Class and Institutional Class shares, respectively, related to redemption fees imposed by the FBR Balanced Fund during a prior year but not received until fiscal year 2013. |
The accompanying notes are an integral part of these financial statements.
HENNESSY FUNDS 1-800-966-4354
For an Investor Class share outstanding throughout each period
PER SHARE DATA:
Net asset value, beginning of year
Income from investment operations:
Net investment income
Net realized and unrealized gains on investments
Total from investment operations
Less distributions:
Dividends from net investment income
Dividends from net realized gains
Total distributions
Paid-in capital from redemption fees
Net asset value, end of year
TOTAL RETURN
SUPPLEMENTAL DATA AND RATIOS:
Net assets, end of year (millions)
Ratio of expenses to average net assets:
Before expense reimbursement/recoupment
After expense reimbursement/recoupment
Ratio of net investment income to average net assets:
Before expense reimbursement/recoupment
After expense reimbursement/recoupment
Portfolio turnover rate(6)
| (1) | For the seven-month period ended October 31, 2010. Effective October 31, 2010, the Fund changed its fiscal year end from March 31 to October 31. |
| (2) | Calculated based on average shares outstanding method. |
| (3) | Amount is less than $0.01. |
| (4) | Not annualized. |
| (5) | Annualized. |
| (6) | Portfolio turnover is calculated on the basis of the Fund as a whole. |
The accompanying notes are an integral part of these financial statements.
| | | | | | | | | | | | | For the Period | | | | |
| | | | | | | | | | | | | April 1, 2010 | | | Year Ended | |
| For the Year Ended October 31, | | | to October 31, | | | March 31, | |
| 2014 | | | 2013 | | | 2012 | | | 2011 | | | 2010(1) | | | 2010 | |
| | | | | | | | | | | | | | | | | |
| $ | 15.77 | | | $ | 13.96 | | | $ | 12.99 | | | $ | 11.93 | | | $ | 11.52 | | | $ | 8.92 | |
| | | | | | | | | | | | | | | | | | | | | | | |
| | | | | | | | | | | | | | | | | | | | | | | |
| | 0.16 | | | | 0.23 | | | | 0.18 | | | | 0.29 | (2) | | | 0.17 | (2) | | | 0.29 | (2) |
| | 1.41 | | | | 1.81 | | | | 0.99 | | | | 1.04 | | | | 0.40 | | | | 2.61 | |
| | 1.57 | | | | 2.04 | | | | 1.17 | | | | 1.33 | | | | 0.57 | | | | 2.90 | |
| | | | | | | | | | | | | | | | | | | | | | | |
| | | | | | | | | | | | | | | | | | | | | | | |
| | (0.16 | ) | | | (0.23 | ) | | | (0.20 | ) | | | (0.27 | ) | | | (0.16 | ) | | | (0.30 | ) |
| | (0.50 | ) | | | — | | | | — | | | | — | | | | — | | | | — | |
| | (0.66 | ) | | | (0.23 | ) | | | (0.20 | ) | | | (0.27 | ) | | | (0.16 | ) | | | (0.30 | ) |
| | 0.00 | (3) | | | 0.00 | (3) | | | 0.00 | (3) | | | 0.00 | (3) | | | 0.00 | (3) | | | 0.00 | (3) |
| $ | 16.68 | | | $ | 15.77 | | | $ | 13.96 | | | $ | 12.99 | | | $ | 11.93 | | | $ | 11.52 | |
| | | | | | | | | | | | | | | | | | | | | | | |
| | 10.28 | % | | | 14.72 | % | | | 9.01 | % | | | 11.30 | % | | | 5.04 | %(4) | | | 32.76 | % |
| | | | | | | | | | | | | | | | | | | | | | | |
| | | | | | | | | | | | | | | | | | | | | | | |
| $ | 284.45 | | | $ | 233.25 | | | $ | 196.92 | | | $ | 56.75 | | | $ | 41.50 | | | $ | 46.81 | |
| | | | | | | | | | | | | | | | | | | | | | | |
| | 1.33 | % | | | 1.36 | % | | | 1.33 | % | | | 1.54 | % | | | 1.60 | %(5) | | | 1.69 | % |
| | 1.33 | % | | | 1.33 | % | | | 1.24 | % | | | 1.24 | % | | | 1.24 | %(5) | | | 1.25 | % |
| | | | | | | | | | | | | | | | | | | | | | | |
| | 1.01 | % | | | 1.51 | % | | | 1.37 | % | | | 2.03 | % | | | 2.21 | %(5) | | | 2.26 | % |
| | 1.01 | % | | | 1.54 | % | | | 1.46 | % | | | 2.33 | % | | | 2.56 | %(5) | | | 2.70 | % |
| | 28 | % | | | 52 | % | | | 34 | % | | | 35 | % | | | 27 | %(4) | | | 26 | % |
The accompanying notes are an integral part of these financial statements.
HENNESSY FUNDS 1-800-966-4354
Financial Statements
For an Institutional Class share outstanding throughout each period
PER SHARE DATA:
Net asset value, beginning of year
Income from investment operations:
Net investment income
Net realized and unrealized gains on investments
Total from investment operations
Less distributions:
Dividends from net investment income
Dividends from net realized gains
Total distributions
Paid-in capital from redemption fees
Net asset value, end of year
TOTAL RETURN
SUPPLEMENTAL DATA AND RATIOS:
Net assets, end of year (millions)
Ratio of expenses to average net assets:
Before expense reimbursement
After expense reimbursement
Ratio of net investment income to average net assets:
Before expense reimbursement
After expense reimbursement
Portfolio turnover rate(6)
| (1) | For the seven-month period ended October 31, 2010. Effective October 31, 2010, the Fund changed its fiscal year end from March 31 to October 31. |
| (2) | Calculated based on average shares outstanding method. |
| (3) | Amount is less than $0.01. |
| (4) | Not annualized. |
| (5) | Annualized. |
| (6) | Portfolio turnover is calculated on the basis of the Fund as a whole. |
The accompanying notes are an integral part of these financial statements.
| | | | | | | | | | | | | For the Period | | | | |
| | | | | | | | | | | | | April 1, 2010 | | | Year Ended | |
| For the Year Ended October 31, | | | to October 31, | | | March 31, | |
| 2014 | | | 2013 | | | 2012 | | | 2011 | | | 2010(1) | | | 2010 | |
| | | | | | | | | | | | | | | | | |
| $ | 14.97 | | | $ | 13.29 | | | $ | 12.38 | | | $ | 11.38 | | | $ | 10.99 | | | $ | 8.52 | |
| | | | | | | | | | | | | | | | | | | | | | | |
| | | | | | | | | | | | | | | | | | | | | | | |
| | 0.20 | | | | 0.25 | | | | 0.22 | | | | 0.32 | (2) | | | 0.18 | (2) | | | 0.30 | (2) |
| | 1.33 | | | | 1.72 | | | | 0.92 | | | | 0.99 | | | | 0.38 | | | | 2.50 | |
| | 1.53 | | | | 1.97 | | | | 1.14 | | | | 1.31 | | | | 0.56 | | | | 2.80 | |
| | | | | | | | | | | | | | | | | | | | | | | |
| | | | | | | | | | | | | | | | | | | | | | | |
| | (0.20 | ) | | | (0.29 | ) | | | (0.23 | ) | | | (0.31 | ) | | | (0.17 | ) | | | (0.33 | ) |
| | (0.50 | ) | | | — | | | | — | | | | — | | | | — | | | | — | |
| | (0.70 | ) | | | (0.29 | ) | | | (0.23 | ) | | | (0.31 | ) | | | (0.17 | ) | | | (0.33 | ) |
| | — | | | | 0.00 | (3) | | | 0.00 | (3) | | | 0.00 | (3) | | | 0.00 | (3) | | | 0.00 | (3) |
| $ | 15.80 | | | $ | 14.97 | | | $ | 13.29 | | | $ | 12.38 | | | $ | 11.38 | | | $ | 10.99 | |
| | | | | | | | | | | | | | | | | | | | | | | |
| | 10.60 | % | | | 14.99 | % | | | 9.23 | % | | | 11.62 | % | | | 5.19 | %(4) | | | 33.10 | % |
| | | | | | | | | | | | | | | | | | | | | | | |
| | | | | | | | | | | | | | | | | | | | | | | |
| $ | 102.10 | | | $ | 85.12 | | | $ | 108.49 | | | $ | 55.28 | | | $ | 42.17 | | | $ | 39.40 | |
| | | | | | | | | | | | | | | | | | | | | | | |
| | 1.05 | % | | | 1.06 | % | | | 1.06 | % | | | 1.12 | % | | | 1.20 | %(5) | | | 1.43 | % |
| | 1.05 | % | | | 1.06 | % | | | 0.99 | % | | | 0.99 | % | | | 0.99 | %(5) | | | 0.99 | % |
| | | | | | | | | | | | | | | | | | | | | | | |
| | 1.29 | % | | | 1.95 | % | | | 1.68 | % | | | 2.56 | % | | | 2.60 | %(5) | | | 2.57 | % |
| | 1.29 | % | | | 1.95 | % | | | 1.75 | % | | | 2.69 | % | | | 2.82 | %(5) | | | 3.01 | % |
| | 28 | % | | | 52 | % | | | 34 | % | | | 35 | % | | | 27 | %(4) | | | 26 | % |
The accompanying notes are an integral part of these financial statements.
HENNESSY FUNDS 1-800-966-4354
Financial Statements
Notes to Financial Statements October 31, 2014 |
1). ORGANIZATION
The Hennessy Equity and Income Fund (the “Fund”) is a series of Hennessy Funds Trust (the “Trust”), which was organized as a Delaware statutory trust on September 17, 1992. The Fund is an open-end management investment company registered under the Investment Company Act of 1940, as amended. The Fund is a successor to the FBR Balanced Fund (the “Predecessor FBR Fund”), a series of The FBR Funds, a Delaware statutory trust, pursuant to a reorganization that took place after the close of business on October 26, 2012. Prior to October 26, 2012, the Fund had no investment operations. As a result of the reorganization, holders of the Investor Class shares of the Predecessor FBR Fund received Investor Class shares of the Fund (the Investor Class shares of the Fund are the successor to the accounting and performance information of the Predecessor FBR Fund), and holders of the Institutional Class shares of the Predecessor FBR Fund received Institutional Class shares of the Fund (the Institutional Class shares of the Fund are the successor to the accounting and performance information of the Predecessor FBR Fund). The investment objective of the Fund is long-term capital growth and current income. The Fund is a diversified fund.
The Fund offers Investor Class and Institutional Class shares. Each class of shares differs principally in its respective administration, 12b-1 distribution and service fees, shareholder servicing, and transfer agent expenses and sales charges, if any. Each class has identical rights to earnings, assets, and voting privileges, except for class-specific expenses and exclusive rights to vote on matters affecting only an individual class.
2). SIGNIFICANT ACCOUNTING POLICIES
The following is a summary of significant accounting policies consistently followed by the Fund in the preparation of the financial statements. These policies are in conformity with U.S. generally accepted accounting principles (“GAAP”).
| a). | Investment Valuation – All investments in securities are recorded at their estimated fair value, as described in Note 3. |
| | |
| b). | Federal Income Taxes – Provision for federal income taxes or excise taxes has not been made since the Fund has elected to be taxed as a “regulated investment company” and intends to distribute substantially all of its taxable income to its shareholders and otherwise comply with the provisions of the Internal Revenue Code of 1986, as amended, applicable to regulated investment companies. Net investment income or loss and realized gains and losses for federal income tax purposes may differ from that reported on the financial statements because of temporary book and tax basis differences. Temporary differences are primarily the result of the treatment of wash sales for tax reporting purposes. Distributions from net realized gains for book purposes may include short-term capital gains, which are included as ordinary income to shareholders for tax purposes. |
| | |
| | Due to inherent differences in the recognition of income, expenses, and realized gains/losses under GAAP and federal income tax regulations, permanent differences between book and tax basis reporting for the 2014 fiscal year have been identified |
| | and appropriately reclassified on the Statement of Assets and Liabilities. The adjustments are as follow: |
| Undistributed | Accumulated | |
| Net Investment | Net Realized | |
| Income/(Loss) | Gain/(Loss) | Paid-in Capital |
| $19,657 | $(19,657) | $— |
| c). | Income and Expenses – Dividend income is recognized on the ex-dividend date or as soon as information is available to the Fund. Interest income, which includes the amortization of premium and accretion of discount, is recognized on an accrual basis. The Fund is charged for those expenses that are directly attributable to the portfolio, such as advisory, administration, and certain shareholder service fees. Income, expenses (other than expenses attributable to a specific class), and realized and unrealized gains or losses on investments are allocated to each class of shares based on its respective net assets. |
| | |
| d). | Distributions to Shareholders – Dividends from net investment income for the Fund, if any, are declared and paid out on a calendar quarter basis. Distributions of net realized capital gains, if any, are declared and paid annually, usually in November or December. |
| | |
| e). | Security Transactions – Investment and shareholder transactions are recorded on the trade date. The Fund determines the gain or loss realized from the investment transactions by comparing the original cost of the security lot sold with the net sale proceeds. Discounts and premiums on securities purchased are accreted/amortized over the life of the respective security. |
| | |
| f). | Use of Estimates – The preparation of financial statements in conformity with GAAP requires management to make estimates and assumptions that affect the reported amounts of assets and liabilities and disclosure of contingent assets and liabilities at the date of the financial statements and the reported change in net assets during the reporting period. Actual results could differ from those estimates. |
| | |
| g). | Share Valuation – The net asset value (“NAV”) per share of the Fund is calculated by dividing the sum of the value of the securities held by the Fund, plus cash or other assets, minus all liabilities (including estimated accrued expenses) by the total number of shares outstanding for the Fund, rounded to the nearest cent. The Fund’s shares will not be priced on days the New York Stock Exchange is closed for trading. The offering and redemption price per share for the Fund is equal to the Fund’s NAV per share. |
| | |
| h). | Foreign Currency – Values of investments denominated in foreign currencies are converted into U.S. dollars using the spot market rate of exchange at the time of valuation. Purchases and sales of investments and income are translated into U.S. dollars using the spot market rate of exchange prevailing on the respective dates of such transactions. The Fund does not isolate the portion of the results of operations resulting from fluctuations in foreign exchange rates on investments from fluctuations resulting from changes in the market prices of securities held. Such fluctuations are included with the net realized and unrealized gain or loss on investments. Foreign investments present additional risks due to currency fluctuations, economic and political factors, lower liquidity, government regulations, differences in accounting standards, and other factors. |
| | |
| i). | Forward Contracts – The Fund may enter into forward currency contracts to reduce its exposure to changes in foreign currency exchange rates on its foreign holdings and to lock in the U.S. dollar cost of firm purchase and sale commitments for |
HENNESSY FUNDS 1-800-966-4354
| | securities denominated in foreign currencies. A forward currency contract is a commitment to purchase or sell a foreign currency at a future date at a negotiated forward rate. The gain or loss arising from the difference between the U.S. dollar cost of the original contract and the value of the foreign currency in U.S. dollars upon closing of such contract is included in net realized gain or loss from foreign currency transactions. During the fiscal year ended October 31, 2014, the Fund did not enter into any forward contracts. |
| | |
| j). | Repurchase Agreements – The Fund may enter into repurchase agreements with member banks or security dealers of the Federal Reserve Board whom the investment advisor deems creditworthy. The repurchase price generally equals the price paid by the Fund plus interest negotiated on the basis of current short-term rates. |
| | |
| | Securities pledged as collateral for repurchase agreements are held by the custodian bank until the respective agreements mature. Provisions of the repurchase agreements ensure that the market value of the collateral, including accrued interest thereon, is sufficient to cover the repurchase amount in the event of default of the counterparty. If the counterparty defaults and the value of the collateral declines or if the counterparty enters an insolvency proceeding, realization of the collateral by the Fund may be delayed or limited. |
| | |
| k). | Accounting for Uncertainty in Income Taxes – The Fund has adopted accounting policies regarding recognition and measurement of tax positions taken or expected to be taken on a tax return. The tax returns of the Fund for the prior three fiscal years are open for examination. The Fund has reviewed all open tax years in major jurisdictions and concluded that there is no impact on the Fund’s net assets and no tax liability resulting from unrecognized tax benefits relating to uncertain income tax positions taken or expected to be taken on a tax return. The Fund’s major tax jurisdictions are U.S. federal and Delaware. |
| | |
| l). | Derivatives – The Fund may invest in, or enter into, derivatives, such as options, futures contracts, options on futures contracts, and swaps, for a variety of reasons, including to hedge certain risks, to provide a substitute for purchasing or selling particular securities, or to increase potential income gain. Derivatives may provide a cheaper, quicker, or more specifically focused way for a Fund to invest than “traditional” securities would. The main purpose of utilizing these derivative instruments is for hedging purposes. |
| | |
| | The Fund has adopted the financial accounting reporting rules as required by the Derivatives and Hedging Topic of the Financial Accounting Standards Board Accounting Standards Codification. Under such rules, the Fund is required to include enhanced disclosure that enables investors to understand how and why an entity uses derivatives, how derivatives are accounted for, and how derivatives instruments affect an entity’s results of operations and financial position. During the fiscal year ended October 31, 2014, the Fund did not hold any derivative instruments. |
| | |
| m). | Events Subsequent to the Fiscal Period End – The Fund has adopted financial reporting rules regarding subsequent events that require an entity to recognize in the financial statements the effects of all subsequent events that provide additional evidence about conditions that existed at the date of the balance sheet. Management has evaluated the Fund’s related events and transactions that occurred subsequent to October 31, 2014 through the date of issuance of the Fund’s financial statements. There were no events or transactions that occurred during this period that materially impacted the amounts or disclosures in the Fund’s financial statements. |
3). SECURITIES VALUATION
The Fund has adopted authoritative fair valuation accounting standards that establish an authoritative definition of fair value and set out a hierarchy for measuring fair value. These standards require additional disclosures about the various inputs and valuation techniques used to develop the measurements of fair value and a discussion in changes in valuation techniques and related inputs during the period. These inputs are summarized in the three broad levels listed below:
| | Level 1 – | Quoted unadjusted prices for identical instruments in active markets to which the Fund has access at the date of measurement. |
| | | |
| | Level 2 – | Quoted prices for similar instruments in active markets; quoted prices for identical or similar instruments in markets that are not active; and model-derived valuations in which all significant inputs and significant value drivers are observable in active markets. Level 2 inputs are those in markets for which there are few transactions, the prices are not current, the prices are fair value adjusted due to post-market close subsequent events (foreign markets), little public information exists, or instances where prices vary substantially over time or among brokered market makers. These inputs may also include interest rates, prepayment speeds, credit risk curves, default rates, and similar data. |
| | | |
| | Level 3 – | Model-derived valuations in which one or more significant inputs or significant value drivers are unobservable. Unobservable inputs are those inputs that reflect the Fund’s own assumptions about what market participants would use to price the asset or liability based on the best available information. |
Following is a description of the valuation techniques applied to the Fund’s major categories of assets and liabilities measured at fair value on a recurring basis.
Equity Securities – Equity securities, including common stocks, preferred stocks, foreign issued common stocks, exchange traded funds, closed-end mutual funds, and real estate investment trusts, that are traded on a securities exchange for which a last-quoted sales price is readily available will generally be valued at the last sales price as reported by the primary exchange on which the securities are listed. Securities listed on The NASDAQ Stock Market (“NASDAQ”) will be valued at the NASDAQ Official Closing Price, which may differ from the last sales price reported. Securities traded on a securities exchange for which a last-quoted sales price is not readily available will generally be valued at the mean between the bid and ask prices. To the extent these securities are actively traded and valuation adjustments are not applied, they are classified in Level 1 of the fair value hierarchy.
Investment Companies – Investments in investment companies (e.g., mutual funds and exchange traded funds) are generally priced at the ending NAV provided by the Fund’s service agent and will be classified in Level 1 of the fair value hierarchy.
Debt Securities – Debt securities, including corporate bonds, asset-backed securities, mortgage-backed securities, municipal bonds, U.S. Treasuries, and U.S. government agency issues, are valued at market on the basis of valuations furnished by an independent pricing service that utilizes both dealer-supplied valuations and formula-based techniques. The pricing service may consider recently executed transactions in securities of the issuer or comparable issuers, market price quotations (where observable), bond spreads, and fundamental data relating to the issuer. In addition, the model may incorporate market observable data such as reported sales of similar securities, broker quotes, yields, bids,
HENNESSY FUNDS 1-800-966-4354
offers, and reference data. Certain securities are valued principally using dealer quotations. These securities are generally classified in Level 2 of the fair value hierarchy.
Short-Term Securities – Short-term equity investments, including money market funds, are valued in the manner specified above. Short-term debt investments are generally valued at amortized cost, which approximates fair market value, if their original maturity was 60 days or less, or by amortizing the values as of the 61st day prior to maturity, if their original term to maturity exceeded 60 days. Amortized cost is not used if its use would be inappropriate due to credit or other impairments of the issuer, in which the security would be fair valued, as described below. Short-term securities are generally classified in Level 1 or Level 2 of the fair market hierarchy depending on the inputs used and market activity levels for specific securities.
The Board of Trustees of the Fund (the “Board”) has adopted fair value pricing procedures that are followed when a price for a security is not readily available or if a significant event has occurred that indicates the closing price of a security no longer represents the true value of that security. Fair value pricing determinations are made in good faith in accordance with these procedures. There are numerous criteria that will be given consideration in determining a fair value of a security. Some of these criteria are trading volume of security and markets, the value of other like securities, and news events with direct bearing to security or market. Fair value pricing results in an estimated price for a security that reflects the amount the Fund might reasonably expect to receive in a current sale. Depending on the relative significance of the valuation inputs, these securities may be classified in either Level 2 or Level 3 of the fair value hierarchy.
Fair valuing of foreign securities may be determined with the assistance of a pricing service using correlations between the movement of prices of such securities and indices of domestic securities and other appropriate indicators, such as closing market prices of relevant American Depositary Receipts or futures contracts. The effect of using fair value pricing is that the Fund’s NAV will reflect the affected portfolio securities’ value as determined in the judgment of the Board or its designee instead of being determined by the market. Using a fair value pricing methodology to price foreign securities may result in a value that is different from a foreign security’s most recent closing price and from the prices used by other investment companies to calculate their NAVs and are generally considered Level 2 prices in the fair valuation hierarchy. Because the Fund may invest in foreign securities, the value of the Fund’s portfolio securities may change on days when you will not be able to purchase or redeem your shares.
The Board has delegated day-to-day valuation matters to a Valuation Committee comprised of one or more representatives from Hennessy Advisors, Inc., the Fund’s investment advisor. The function of the Valuation Committee is to value securities where current and reliable market quotations are not readily available. All actions taken by the Valuation Committee are reviewed by the Board.
The Fund has performed an analysis of all existing investments to determine the significance and character of all inputs to their fair value determination. Various inputs are used in determining the value of the Fund’s investments. The inputs or methodology used for valuing securities are not necessarily an indication of the risk associated with investing in those securities. Details related to the fair valuation hierarchy of the Fund’s securities as of October 31, 2014 are included in the Fund’s Schedule of Investments.
4). INVESTMENT TRANSACTIONS
Purchases and sales of investment securities (excluding government and short-term investments) for the Fund during the fiscal year ended October 31, 2014 were $90,494,585 and $71,098,054, respectively.
Purchases and sales/maturities of long-term U.S. Government Securities for the Fund were $35,188,832 and $21,286,609, respectively, during the fiscal year ended October 31, 2014.
5). INVESTMENT MANAGEMENT FEE AND OTHER TRANSACTIONS WITH AFFILIATES
Hennessy Advisors, Inc. (the “Advisor”) is the investment advisor of the Fund. The Advisor provides the Fund with investment management services under an Investment Advisory Agreement. The Advisor furnishes all investment advice, office space, facilities, and provides most of the personnel needed by the Fund. As compensation for its services, the Advisor is entitled to a monthly fee from the Fund. The fee is based upon the average daily net assets of the Fund at the annual rate of 0.80%. The net investment advisory fees payable for the Fund as of October 31, 2014 were $267,881.
The Advisor has delegated the day-to-day management of the equity sleeve of the Fund to The London Company of Virginia, LLC and has delegated the day-to-day management of the fixed income sleeve of the Fund to Financial Counselors, Inc. The Advisor pays the sub-advisor fees for the Fund from its own assets and these fees are not an additional expense of the Fund.
The Advisor has contractually agreed to limit the total annual operating expenses of the Fund (excluding interest, taxes, brokerage commissions, dividend expenses, 12b-1 fees, acquired fund fees and expenses, extraordinary legal expenses, or any other extraordinary expenses) to 1.08% of the Fund’s net assets for both the Investor Class shares and Institutional Class shares of the Fund through February 28, 2015.
For a period of three years after the year in which the Advisor waives or reimburses expenses, the Advisor may seek reimbursement from the Fund to the extent that total annual fund operating expenses are less than the expense limitation in effect at the time of the reimbursement. During the current year, expenses of $5,453 were recouped, and the remaining $62,366 is subject to possible recovery through October 31, 2016. As of October 31, 2014, cumulative expenses subject to potential recovery to the aforementioned conditions are $62,366 for the Investor Class, which will expire on October 31, 2016.
The Fund has adopted a plan pursuant to Rule 12b-1 under the Investment Company Act of 1940, as amended, that authorizes payments in connection with the distribution of the Fund’s shares at an annual rate of up to 0.25% of the average daily net assets of the Fund attributable to Investor Class shares. Amounts paid under the plan may be spent on any activities or expenses primarily intended to result in the sale of shares, including but not limited to, advertising, compensation for sales and marketing activities or financial institutions and others such as dealers and distributors, shareholder account servicing, the printing and mailing of prospectuses to other than current shareowners, and the printing and mailing of sales literature.
The Fund has entered into agreements with various brokers, dealers, and financial intermediaries in connection with the sale of shares of the Fund. The agreements provide for periodic payments by the Fund to the brokers, dealers, and financial intermediaries for providing certain shareholder maintenance services (sub-transfer agent expenses). These shareholder services include the pre-processing and quality control of new accounts, shareholder correspondence, answering customer inquiries regarding account status, and facilitating shareholder telephone transactions. Fees paid by the Fund to various brokers, dealers, and financial intermediaries for the fiscal year ended October 31, 2014 were $367,961.
U.S. Bancorp Fund Services, LLC (“USBFS”) provides the Fund with administrative, fund accounting, and transfer agent services, including all regulatory reporting, and
HENNESSY FUNDS 1-800-966-4354
necessary office equipment and personnel. As administrator, USBFS prepares various federal and state regulatory filings, reports, and returns for the Fund; prepares reports and materials to be supplied to the Board; monitors the activities of the Fund’s custodian, transfer agent, and accountants; and coordinates the preparation and payment of the Fund’s expenses and reviews the Fund’s expense accruals. Fees paid to USBFS for the fiscal year ended October 31, 2014 were $383,950.
U.S. Bank, N.A., an affiliate of USBFS, serves as the Fund’s custodian. Quasar Distributors, LLC acts as the Fund’s principal underwriter in a continuous public offering of the Fund’s shares. Quasar Distributors, LLC is an affiliate of USBFS and U.S. Bank, N.A.
6). LINE OF CREDIT
The Fund has a line of credit with the other funds in the Hennessy Funds family of funds (the “Hennessy Funds”) in the amount of the lesser of (i) $100,000,000 or (ii) 33.33% of each Hennessy Fund’s net assets, or 30% for the Hennessy Gas Utility Index Fund and 10% for the Hennessy Balanced Fund, intended to provide short-term financing, if necessary, subject to certain restrictions, in connection with shareholder redemptions. The credit facility is with the Hennessy Funds’ custodian bank, U.S. Bank, N.A. Borrowings under this arrangement bear interest at the bank’s prime rate. During the fiscal year ended October 31, 2014, the Fund did not have any borrowings outstanding under the line of credit.
7). FEDERAL TAX INFORMATION
As of October 31, 2014, the components of accumulated earnings (losses) for income tax purposes for the Fund were as follow:
| | Cost of investments for tax purposes | | $ | 325,354,199 | |
| | Gross tax unrealized appreciation | | $ | 62,317,355 | |
| | Gross tax unrealized depreciation | | | (2,702,490 | ) |
| | Net tax unrealized appreciation | | $ | 59,614,865 | |
| | Undistributed ordinary income | | $ | 340,092 | |
| | Undistributed long-term capital gains | | | 15,385,741 | |
| | Total distributable earnings | | $ | 15,725,833 | |
| | Other accumulated gain | | $ | — | |
| | Total accumulated gain | | $ | 75,340,698 | |
The difference between book-basis and tax-basis unrealized appreciation is attributable primarily to wash sales.
At October 31, 2014, the Fund had no tax basis capital losses to offset future capital gains.
At October 31, 2014, the Fund did not defer, on a tax basis, any late year ordinary losses.
The tax character of distributions paid during fiscal year 2014 and fiscal year 2013 for the Fund were as follow:
| | | | Year Ended | | | Year Ended | |
| | | | October 31, 2014 | | | October 31, 2013 | |
| | Ordinary income | | $ | 3,317,923 | | | $ | 5,000,498 | |
| | Long-term capital gain | | | 10,301,249 | | | | — | |
| | | | $ | 14,019,172 | | | $ | 5,000,498 | |
8). EVENTS SUBSEQUENT TO YEAR-END
On December 8, 2014, the following capital gains distributions were declared and paid to shareholders of record on December 5, 2014:
| | Short-term Capital Gains | Rate/Share ($) | |
| | Investor Class | $0.00476 | |
| | Institutional Class | $0.00451 | |
| | | | |
| | Long-term Capital Gains | Rate/Share ($) | |
| | Investor Class | $0.63992 | |
| | Institutional Class | $0.60674 | |
HENNESSY FUNDS 1-800-966-4354
Report of Independent Registered Public Accounting Firm
To the Board of Trustees of Hennessy Funds Trust
And the Shareholders of Hennessy Equity and Income Fund
We have audited the accompanying statement of assets and liabilities, including the schedule of investments, of the Hennessy Equity and Income Fund (the “Fund”), a series of Hennessy Funds Trust as of October 31, 2014, and the related statement of operations for the year then ended, the statements of changes in net assets for each of the two years in the period then ended and the financial highlights for each of the four years in the period then ended and the seven month period ended October 31, 2010 and the year ended March 31, 2010. These financial statements and financial highlights are the responsibility of the Fund’s management. Our responsibility is to express an opinion on these financial statements and financial highlights based on our audits.
We conducted our audits in accordance with the standards of the Public Company Accounting Oversight Board (United States). Those standards require that we plan and perform the audits to obtain reasonable assurance about whether the financial statements and financial highlights are free of material misstatement. The Fund is not required to have, nor were we engaged to perform, an audit of the Fund’s internal control over financial reporting. Our audits included consideration of internal control over financial reporting as a basis for designing audit procedures that are appropriate in the circumstances, but not for the purposes of expressing an opinion on the effectiveness of the Fund’s internal control over financial reporting. Accordingly, we express no such opinion. An audit includes examining, on a test basis, evidence supporting the amounts and disclosures in the financial statements. Our procedures included confirmation of securities owned as of October 31, 2014, by correspondence with the custodian and brokers. An audit also includes assessing the accounting principles used and significant estimates made by management, as well as evaluating the overall financial statement presentation. We believe that our audits provide a reasonable basis for our opinion.
In our opinion, the financial statements and financial highlights referred to above present fairly, in all material respects, the financial position of the Hennessy Equity and Income Fund as of October 31, 2014, the results of its operations for the year then ended, the changes in its net assets for each of the two years in the period then ended, and the financial highlights for each of the four years in the period then ended and the seven month period ended October 31, 2010 and the year ended March 31, 2010, in conformity with accounting principles generally accepted in the United States of America.
TAIT, WELLER & BAKER LLP
Philadelphia, Pennsylvania
December 30, 2014
Trustees and Officers of the Fund (Unaudited)
The business and affairs of the Fund are managed under the direction of the Fund’s Board of Trustees. Information pertaining to the Trustees and Officers of the Fund is set forth below. The Fund’s Statement of Additional Information includes additional information about the Fund’s Trustees and Officers and is available, without charge, upon request by calling 1-800-966-4354.
| | | | | Number of | |
| | | Term of | | Portfolios | |
| | | Office | | in the | Other |
| | | and | | Fund | Directorships |
| | Position(s) | Length | Principal | Complex | (During Past |
| Name, Address, | Held with | of Time | Occupation(s) | Overseen | Five Years)(2) |
| and Age | the Fund | Served | During Past Five Years | by Trustee | Held by Trustee |
| | | |
| Disinterested Trustees (as defined below) | | |
| | | | | | |
| J. Dennis DeSousa | Trustee | Indefinite, | Mr. DeSousa is a real | 16 | Hennessy SPARX |
| Age: 78 | | until | estate investor. | | Funds Trust; |
| Address: | | successor | | | Hennessy Mutual |
| c/o Hennessy | | elected | | | Funds, Inc.; and |
| Advisors, Inc. | | | | | The Hennessy |
| 7250 Redwood Blvd. | | Served | | | Funds, Inc. |
| Suite 200 | | since | | | |
| Novato, CA 94945 | | January | | | |
| | | 1996 | | | |
| | | for the | | | |
| | | Funds (or | | | |
| | | Predecessor | | | |
| | | Funds) | | | |
| | | | | | |
| Robert T. Doyle | Trustee | Indefinite, | Mr. Doyle has been the | 16 | Hennessy SPARX |
| Age: 67 | | until | Sheriff of Marin County, | | Funds Trust; |
| Address: | | successor | California since 1996. | | Hennessy Mutual |
| c/o Hennessy | | elected | | | Funds, Inc.; and |
| Advisors, Inc. | | | | | The Hennessy |
| 7250 Redwood Blvd. | | Served | | | Funds, Inc. |
| Suite 200 | | since | | | |
| Novato, CA 94945 | | January | | | |
| | | 1996 | | | |
| | | for the | | | |
| | | Funds (or | | | |
| | | Predecessor | | | |
| | | Funds) | | | |
| | | | | | |
| Gerald P. Richardson | Trustee | Indefinite, | Mr. Richardson is an | 16 | Hennessy SPARX |
| Age: 69 | | until | independent consultant | | Funds Trust; |
| Address: | | successor | in the securities industry. | | Hennessy Mutual |
| c/o Hennessy | | elected | | | Funds, Inc.; and |
| Advisors, Inc. | | | | | The Hennessy |
| 7250 Redwood Blvd. | | Served | | | Funds, Inc. |
| Suite 200 | | since | | | |
| Novato, CA 94945 | | May 2004 | | | |
| | | for the | | | |
| | | Funds (or | | | |
| | | Predecessor | | | |
| | | Funds) | | | |
HENNESSY FUNDS 1-800-966-4354
| | | | | Number of | |
| | | Term of | | Portfolios | |
| | | Office | | in the | Other |
| | | and | | Fund | Directorships |
| | Position(s) | Length | Principal | Complex | (During Past |
| Name, Address, | Held with | of Time | Occupation(s) | Overseen | Five Years)(2) |
| and Age | the Fund | Served | During Past Five Years | by Trustee | Held by Trustee |
| | | |
| “Interested Persons” (as defined in the 1940 Act) | | |
| | | | | | |
Neil J. Hennessy(1) | Chief | Trustee: | Mr. Hennessy has been | 16 | Hennessy |
| Age: 58 | Investment | Indefinite, | employed by Hennessy | | Advisors, Inc. |
| Address: | Officer, | until | Advisors, Inc., the Funds’ | | (current); |
| c/o Hennessy | Portfolio | successor | investment advisor, since | | Hennessy SPARX |
| Advisors, Inc. | Manager, | elected | 1989. He currently serves | | Funds Trust; |
| 7250 Redwood Blvd. | President, | | as President, Chairman | | Hennessy Mutual |
| Suite 200 | Trustee | Served | and CEO of Hennessy | | Funds, Inc.; and |
| Novato, CA 94945 | and | since | Advisors, Inc. | | The Hennessy |
| | Chairman | January | | | Funds, Inc. |
| | of the | 1996 | | | |
| | Board | for the | | | |
| | | Funds (or | | | |
| | | Predecessor | | | |
| | | Funds) | | | |
| | | | | | |
| | | Officer: | | | |
| | | 1 year term | | | |
| | | | | | |
| | | Served | | | |
| | | since | | | |
| | | June 2008 | | | |
| | | for the | | | |
| | | Funds (or | | | |
| | | Predecessor | | | |
| | | Funds) | | | |
| | | | | | |
Teresa M. Nilsen(1) | Executive | 1 year term | Ms. Nilsen has been | N/A | N/A |
| Age: 48 | Vice | | employed by Hennessy | | |
| Address: | President | Served | Advisors, Inc., the Funds’ | | |
| c/o Hennessy | and | since | investment advisor, since | | |
| Advisors, Inc. | Treasurer | January | 1989. She currently serves | | |
| 7250 Redwood Blvd. | | 1996 | as Executive Vice President, | | |
| Suite 200 | | for the | Chief Operations Officer, | | |
| Novato, CA 94945 | | Funds (or | Chief Financial Officer, and | | |
| | | Predecessor | Secretary of Hennessy | | |
| | | Funds) | Advisors, Inc. | | |
| (1) | All Officers of the Hennessy Funds and employees of the Manager are Interested Persons of the Funds. |
| (2) | Pursuant to an internal reorganization, the series of Hennessy Mutual Funds, Inc. (“HMFI”), The Hennessy Funds, Inc. (“HFI”) and Hennessy SPARX Funds Trust (“HSFT”) were reorganized into series of Hennessy Funds Trust on February 28, 2014, which mirrored the corresponding series of HFMI, HFI and HSFT. Subsequent to the reorganization, HFMI, HFI and HSFT were dissolved. |
| | | Term of | |
| | | Office | |
| | | and | |
| | Position(s) | Length | Principal |
| Name, Address, | Held with | of Time | Occupation(s) |
| and Age | the Fund | Served | During Past Five Years |
| | | | |
| Interested Persons | | | |
| | | | |
Daniel B. Steadman(1) | Executive | 1 year term | Mr. Steadman has been employed by |
| Age: 58 | Vice President | | Hennessy Advisors, Inc., the Funds’ |
| Address: | and Secretary | Served since | investment advisor, since 2000. |
| c/o Hennessy Advisors, Inc. | | March 2000 | He currently serves as Executive |
| 7250 Redwood Blvd. | | for the Funds (or | Vice President and Chief Compliance |
| Suite 200 | | Predecessor Funds) | Officer of Hennessy Advisors, Inc. |
| Novato, CA 94945 | | | |
| | | | |
Jennifer Cheskiewicz(1) | Senior | 1 year term | Ms. Cheskiewicz has been employed by |
| Age: 37 | Vice President | | Hennessy Advisors, Inc., the Funds’ |
| Address: | and Chief | Served since | investment advisor, since June 2013. |
| c/o Hennessy Advisors, Inc. | Compliance | June 2013 | She previously served as in-house |
| 7250 Redwood Blvd. | Officer | for the Funds (or | counsel to Carlson Capital, L.P., an |
| Suite 200 | | Predecessor Funds) | SEC-registered investment advisor to |
| Novato, CA 94945 | | | several private funds from February |
| | | | 2010 to May 2013. Prior to that, she |
| | | | was an attorney with Gibson, Dunn & |
| | | | Crutcher LLP from September 2005 |
| | | | through February 2010. She currently |
| | | | serves as General Counsel of |
| | | | Hennessy Advisors, Inc. |
| | | | |
Brian Carlson(1) | Senior | 1 year term | Mr. Carlson has been employed by |
| Age: 42 | Vice President | | Hennessy Advisors, Inc., the Funds’ |
| Address: | and Head of | Served since | investment advisor, since |
| c/o Hennessy Advisors, Inc. | Distribution | December 2013 | December 2013. |
| 7250 Redwood Blvd. | | for the Funds (or | |
| Suite 200 | | Predecessor Funds) | Mr. Carlson was previously a |
| Novato, CA 94945 | | | co-founder and principal of Trivium |
| | | | Consultants, LLC from February 2011 |
| | | | through November 2013. Prior to that, |
| | | | he was the Senior Managing Director |
| | | | of NRP Financial, Inc. from August |
| | | | 2007 through February 2011. |
| | | | |
David Ellison(1) | Portfolio Manager | 1 year term | Mr. Ellison has served as Portfolio |
| Age: 56 | and Senior | | Manager of the Large Cap Financial |
| Address: | Vice President | Served since | Fund, the Small Cap Financial Fund, |
| c/o Hennessy Advisors, Inc. | | October 2012 | and the Technology Fund |
| 101 Federal Street | | for the Funds (or | since inception. |
| Suite 1900 | | Predecessor Funds) | |
| Boston, MA 02110 | | | Mr. Ellison previously served as Director, |
| | | | CIO and President of FBR Advisers, Inc. |
| | | | from December 1999 to October 2012. |
| (1) | All Officers of the Hennessy Funds and employees of the Manager are Interested Persons of the Funds. |
HENNESSY FUNDS 1-800-966-4354
| | | Term of | |
| | | Office | |
| | | and | |
| | Position(s) | Length | Principal |
| Name, Address, | Held with | of Time | Occupation(s) |
| and Age | the Fund | Served | During Past Five Years |
| | | | |
| Interested Persons | | | |
| | | | |
Brian Peery(1) | Portfolio Manager | 1 year term | Mr. Peery has been a Portfolio Manager |
| Age: 45 | and | | of the Cornerstone Growth Fund, |
| Address: | Vice President | Served since | the Cornerstone Mid Cap 30 Fund, the |
| c/o Hennessy Advisors, Inc. | | March 2003 | Cornerstone Large Growth Fund, the |
| 7250 Redwood Blvd. | | as Vice President | Cornerstone Value Fund, the Total |
| Suite 200 | | for the Funds (or | Return Fund, and the Balanced Fund |
| Novato, CA 94945 | | Predecessor Funds) | since October 2014. From February |
| | | | 2011 through September 2014, he |
| | | Served since | served as Co-Portfolio Manager of |
| | | February 2011 | the same funds. |
| | | as Co-Portfolio | |
| | | Manager | Mr. Peery has been employed by |
| | | for the Funds (or | Hennessy Advisors, Inc., the Funds’ |
| | | Predecessor Funds) | investment advisor, since 2002. |
| | | | |
Winsor (Skip) Aylesworth(1) | Portfolio Manager | 1 year term | Mr. Aylesworth has been Portfolio |
| Age: 67 | and | | Manager of the Gas Utility Index Fund |
| Address: | Vice President | Served since | since 1998 and Portfolio Manager of |
| c/o Hennessy Advisors, Inc. | | October 2012 | the Technology Fund since inception. |
| 101 Federal Street | | for the Funds (or | |
| Suite 1900 | | Predecessor Funds) | Mr. Aylesworth previously served as |
| Boston, MA 02110 | | | Executive Vice President of The FBR |
| | | | Funds from 1999 to October 2012. |
| | | | |
Ryan Kelley(1) | Portfolio Manager | 1 year term | Mr. Kelley has been a Portfolio Manager |
| Age: 42 | and | | of the Gas Utility Index Fund (formerly |
| Address: | Vice President | Served since | the FBR Gas Utility Index Fund), the |
| c/o Hennessy Advisors, Inc. | | March 2013 | Small Cap Financial Fund (formerly the |
| 1340 Environ Way | | for the Funds (or | FBR Small Cap Financial Fund), and the |
| Chapel Hill, NC 27517 | | Predecessor Funds) | Large Cap Financial Fund (formerly the |
| | | | FBR Large Cap Financial Fund) since |
| | | | October 2014. From March 2013 |
| | | | through September 2014, he served |
| | | | as a Co-Portfolio Manager of the same |
| | | | funds. Prior to that, he was a Portfolio |
| | | | Analyst of the Hennessy Funds. |
| | | | |
| | | | Mr. Kelley previously served as Portfolio |
| | | | Manager of The FBR Funds from |
| | | | January 2008 to October 2012. |
| (1) | All Officers of the Hennessy Funds and employees of the Manager are Interested Persons of the Funds. |
(This Page Intentionally Left Blank.)
HENNESSY FUNDS 1-800-966-4354
Expense Example (Unaudited)
October 31, 2014
As a shareholder of the Fund, you incur two types of costs: (1) transaction costs, including sales charges (loads) on purchase payments, reinvested dividends, or other distributions; redemption fees; and exchange fees; and (2) ongoing costs, including management fees; service fees; and other Fund expenses. This Example is intended to help you understand your ongoing costs (in dollars) of investing in the Fund and to compare these costs with the ongoing costs of investing in other mutual funds. The Example is based on an investment of $1,000 invested at the beginning of the period and held for the entire period from May 1, 2014 through October 31, 2014.
Actual Expenses
The first line of the table below under the “Investor Class” and “Institutional Class” headings provides information about actual account values and actual expenses. Although the Fund charges no sales loads or transaction fees, you will be assessed fees for outgoing wire transfers, returned checks and stop payment orders at prevailing rates charged by U.S. Bancorp Fund Services, LLC, the Fund’s transfer agent. If you request that a redemption be made by wire transfer, currently a $15.00 fee is charged by the Fund’s transfer agent. IRA accounts will be charged a $15.00 annual maintenance fee. The example below includes, but is not limited to, management fees, shareholder servicing fees, fund accounting, custody, and transfer agent fees. However, the example below does not include portfolio trading commissions and related expenses, and other extraordinary expenses as determined under generally accepted accounting principles. You may use the information in this line, together with the amount you invested, to estimate the expenses that you paid over the period. Simply divide your account value by $1,000 (for example, an $8,600 account value divided by $1,000 = 8.6), then multiply the result by the number in the first line of the table under the “Investor Class” and “Institutional Class” headings in the column entitled “Expenses Paid During Period” to estimate the expenses you paid on your account during this period.
Hypothetical Example for Comparison Purposes
The second line of the table below under the “Investor Class” and “Institutional Class” headings provides information about hypothetical account values and hypothetical expenses based on the Fund’s actual expense ratios and an assumed rate of return of 5% per year before expenses, which is not the Fund’s actual return. The hypothetical account values and expenses may not be used to estimate the actual ending account balance or expenses you paid for the period. You may use this information to compare the ongoing costs of investing in the Fund and other funds. To do so, compare this 5% hypothetical example with the 5% hypothetical examples that appear in the shareholder reports of the other funds. Please note that the expenses shown in the table are meant to highlight your ongoing costs only and do not reflect any transactional costs, such as sales charges (loads), or exchange fees. Therefore, the second line of the table under the “Investor Class” and “Institutional Class” headings is useful in comparing ongoing costs only, and will not help you determine the relative total costs of owning different funds. In addition, if these transactional costs were included, your costs would have been higher.
| | Beginning | Ending | Expenses Paid |
| | Account Value | Account Value | During Period(1) |
| | 5/1/14 | 10/31/14 | 5/1/14 – 10/31/14 |
| Investor Class | | | |
| | | | |
| Actual | $1,000.00 | $1,055.40 | $6.89 |
| | | | |
| Hypothetical (5% return | | | |
| before expenses) | $1,000.00 | $1,018.50 | $6.77 |
| | | | |
| Institutional Class | | | |
| | | | |
| Actual | $1,000.00 | $1,057.30 | $5.39 |
| | | | |
| Hypothetical (5% return | | | |
| before expenses) | $1,000.00 | $1,019.91 | $5.30 |
| (1) | Expenses are equal to the Fund’s expense ratio of 1.33% for Investor Class shares or 1.04% for Institutional Class shares, as applicable, multiplied by the average account value over the period, multiplied by 184/365 days (to reflect one-half year period). |
HENNESSY FUNDS 1-800-966-4354
Proxy Voting
A description of the policies and procedures the Fund uses to determine how to vote proxies relating to portfolio securities is available without charge: (1) by calling 1-800-966-4354; (2) on the Hennessy Funds’ website at hennessyfunds.com; or (3) on the U.S. Securities and Exchange Commission’s (the “SEC”) website at www.sec.gov. The Fund’s proxy voting record is available on both the Hennessy Funds’ website at hennessyfunds.com and the SEC’s website at www.sec.gov no later than August 31 for the prior 12 months ending June 30.
Quarterly Filings on Form N-Q
The Fund files its complete schedule of portfolio holdings with the SEC for the first and third quarters of each fiscal year on Form N-Q. The Fund’s Forms N-Q are available on the SEC’s website at www.sec.gov. The Fund’s Forms N-Q may be reviewed and copied at the SEC’s Public Reference Room in Washington, DC and information on the operation of the Public Reference Room may be obtained by calling 1-800-SEC-0330. Information included in the Fund’s Forms N-Q will also be available upon request by calling 1-800-966-4354.
Federal Tax Distribution Information
(Unaudited)
For the fiscal year ended October 31, 2014, certain dividends paid by the Fund may be subject to a maximum tax rate of 20%, as provided for by the Jobs and Growth Tax Relief Reconciliation Act of 2003. The percentage of dividends declared from ordinary income designated as qualified dividend income was 100%.
For corporate shareholders, the percent of ordinary income distributions qualifying for the corporate dividends received deduction for the fiscal year ended October 31, 2014 was 100%.
The percentage of taxable ordinary income distributions that are designated as short-term capital gain distributions under Section 871(k)(2)(C) of the Internal Revenue Code of 1986, as amended, for the Fund was 0.00%.
Householding
To help keep the Fund’s costs as low as possible, we generally deliver a single copy of most financial reports and prospectuses to shareholders who share an address, even if the accounts are registered under different names. This process, known as “householding,” does not apply to account statements. You may, of course, request an individual copy of a prospectus or financial report at any time. If you would like to receive separate mailings, please call the Administrator at 1-800-261-6950 or 1-414-765-4124 and we will begin individual delivery within 30 days of your request. If your account is held through a financial institution or other intermediary, please contact them directly to request individual delivery.
Privacy Policy
We collect the following non-public personal information about you:
| | • | information we receive from you on or in applications or other forms, correspondence, or conversations, including, but not limited to, your name, address, phone number, social security number, assets, income and date of birth; |
| | | and |
| | • | information about your transactions with us, our affiliates, or others, including, but not limited to, your account number and balance, payment history, parties to transactions, cost basis information and other financial information. |
We do not disclose any non-public personal information about our current or former shareholders to nonaffiliated third parties, except as permitted by law. For example, we are permitted by law to disclose all of the information we collect, as described above, to our Transfer Agent to process your transactions. Furthermore, we restrict access to your non-public personal information to those persons who require such information to provide products or services to you. We maintain physical, electronic and procedural safeguards that comply with federal standards to guard your non-public personal information.
In the event that you hold shares of the Fund through a financial intermediary, including, but not limited to, a broker-dealer, bank or trust company, the privacy policy of your financial intermediary would govern how your non-public personal information would be shared with nonaffiliated third parties.
HENNESSY FUNDS 1-800-966-4354
(This Page Intentionally Left Blank.)
(This Page Intentionally Left Blank.)
For information, questions or assistance, please call
The Hennessy Funds
1-800-966-4354 or 1-415-899-1555
INVESTMENT ADVISOR
Hennessy Advisors, Inc.
7250 Redwood Blvd., Suite 200
Novato, California 94945
ADMINISTRATOR,
TRANSFER AGENT,
DIVIDEND PAYING AGENT &
SHAREHOLDER SERVICING AGENT
U.S. Bancorp Fund Services, LLC
P.O. Box 701
Milwaukee, Wisconsin 53201-0701
CUSTODIAN
U.S. Bank N.A.
Custody Operations
1555 North River Center Dr., Suite 302
Milwaukee, Wisconsin 53212
TRUSTEES
Neil J. Hennessy
Robert T. Doyle
J. Dennis DeSousa
Gerald P. Richardson
COUNSEL
Foley & Lardner LLP
777 East Wisconsin Avenue
Milwaukee, Wisconsin 53202-5306
INDEPENDENT REGISTERED
PUBLIC ACCOUNTING FIRM
Tait, Weller & Baker LLP
1818 Market Street, Suite 2400
Philadelphia, Pennsylvania 19103
DISTRIBUTOR
Quasar Distributors, LLC
615 East Michigan Street
Milwaukee, Wisconsin 53202
hennessyfunds.com | 1-800-966-4354
This report has been prepared for shareholders and may be distributed to
others only if preceded or accompanied by a current prospectus.
ANNUAL REPORT
OCTOBER 31, 2014
HENNESSY BALANCED
FUND
Investor Class HBFBX
hennessyfunds.com | 1-800-966-4354
(This Page Intentionally Left Blank.)
Contents
| Letter to Shareholders | | 2 |
| Performance Overview | | 4 |
| Financial Statements | | |
| Schedule of Investments | | 7 |
| Statement of Assets and Liabilities | | 11 |
| Statement of Operations | | 12 |
| Statements of Changes in Net Assets | | 13 |
| Financial Highlights | | 14 |
| Notes to the Financial Statements | | 16 |
| Report of Independent Registered Public Accounting Firm | | 23 |
| Trustees and Officers of the Fund | | 24 |
| Expense Example | | 28 |
| Proxy Voting | | 30 |
| Quarterly Filings on Form N-Q | | 30 |
| Federal Tax Distribution Information | | 30 |
| Householding | | 30 |
| Privacy Policy | | 31 |
HENNESSY FUNDS 1-800-966-4354
December 2014
Dear Shareholder:
As I look back at 2014, I realize that in this age of rapidly evolving technology, information is delivered and absorbed so quickly that it is difficult to remember what happened last week, let alone what’s happened over the course of an entire year. That is why I’d like to take a moment to recall some of the year’s highs and lows, economically, politically and socially, here in the U.S. and around the globe. 2014 was scarred by political partisanship, civil unrest in the U.S., Ukraine and many other countries, the arrival of terrorist group ISIS, the tragedies of school shootings and natural disasters, and the frightening outbreak of Ebola. However, there were also positive events this year: we survived a government shutdown over healthcare reform, jobs reports have been consistently, albeit anemically, improving, and home prices remained relatively stable, after recovering significantly in 2013. And, important to us here at Hennessy, our hometown team, the San Francisco Giants, won their third World Series in just five years!
A significant event for the financial industry this past year was the confirmation of Janet Yellen as Chair of the Federal Reserve, which served to calm the nerves of business and political leaders alike. I believe Yellen’s leadership will benefit U.S. business owners, as the Fed continues to be a voice of reason in a sea of political and economic rhetoric. The Fed has also supported the economy and corporate America by helping keep interest rates reasonable and low.
The stock market has continued its determined comeback from the lows of 2009, setting multiple record highs in recent months. The U.S. financial markets have provided strong returns over the past twelve-month period ended October 31, 2014, with the Dow Jones Industrial Average (DJIA) returning over 14% and S&P 500 Index returning over 17% during the period. The DJIA currently has a dividend yield of 2.2%, which is equal to that of a 10-Year U.S. Treasury, which is currently also yielding 2.2%. I continue to believe that investments in high-yielding, high-quality stocks have the potential to not only provide income but also the potential for stock price appreciation as well. Fixed income investing has run its course, in my opinion, and many individuals are currently benefiting from the return to investing in equities that possess strong fundamentals. American investors are slowly migrating from fixed income to equities. Currently, 54% of Americans invest in stocks, and I do expect this percentage to increase, especially if interest rates move higher.
For the past several years, U.S. corporations have been driving shareholder value by making acquisitions, initiating and raising dividends, investing in internal infrastructure and buying back stock. However, this year I began to see a shift from those strategies. I believe the easier to execute acquisitions are a thing of the past, and firms now have to be even more creative to execute accretive deals. I also believe that while firms may continue to initiate dividends, fewer firms will raise their dividends and fewer firms will participate in stock buyback programs going forward. What will these cash-rich companies do with their capital if they are not raising dividends or buying back stock? I believe they may begin to initiate capital expenditure programs that could truly benefit economic growth.
Liquidity and monetary conditions are supportive, causing the cost of capital to be very low. I believe firms will choose to spend capital to expand their sales, and they may even begin to hire in earnest. Once a company begins to move in this way, the cost to
defer becomes real for competitors. With almost $3 trillion in cash and short-term investments sitting on the balance sheets of the S&P 500 companies, a strategic shift by firms to spend their idle capital, while slow, could potentially further economic growth in the U.S. in my opinion.
Economic progress and growth remain slow, yet steady, and unemployment, though improving, remains high. Oil prices have fallen, giving consumers a bit more discretionary income. While the midterm elections may not end all of the gridlock in Washington, hopefully we will receive clarity on the political headwinds of taxes and regulations, which have not improved over the past several years.
The markets have had several quarters without any truly significant downturn. The pullbacks we recently experienced, most notably in July and October, were short-lived, as evidenced by the quick rebound to record high market levels. I firmly believe that we are in a secular bull market, and I continue to tell investors to try to remain calm in the face of volatility and continue to focus on the strong, long-term fundamentals that are evident in the market today. Many companies continue to have strong balance sheets, with record cash flows and profits. With this current bull market in its fifth year, investors should expect some volatility.
I am encouraged by the strong returns for the major U.S. financial market indices and by the performance of the Hennessy Funds over the past year. Thank you for your continued confidence and investment in our products. If you have any questions or would like to speak with us directly, please don’t hesitate to call us at (800) 966-4354.
Best regards,
Neil J. Hennessy
President and Chief Investment Officer
Past performance does not guarantee future results.
Mutual fund investing involves risk. Principal loss is possible.
Opinions expressed are those of Neil Hennessy and are subject to change, are not guaranteed and should not be considered investment advice.
The Dow Jones Industrial Average and S&P 500 Index are unmanaged indices commonly used to measure the performance of U.S. stocks. One cannot invest directly in an index.
Cash flow can be used as an indication of a company’s financial strength. A firm’s cash flow is the movement of cash in and out of the firm in the form of payments to suppliers and collections from customers. Dividend Yield is calculated as the annual dividends paid by a company divided by the price of a share of their stock.
HENNESSY FUNDS 1-800-966-4354
Performance Overview (Unaudited)
The opinions expressed in the following commentary reflect those of the Portfolio Managers as of the date written. Any such opinions are subject to change based on market or other conditions and are not guaranteed. These opinions may not be relied upon as investment advice. Investment decisions for the Fund are based on multiple factors, and may not be relied upon as an indication of trading intent on behalf of the Fund. Security positions can and do change.
CHANGE IN VALUE OF $10,000 INVESTMENT
This chart assumes an initial gross investment of $10,000 made on October 31, 2004. Returns shown include the reinvestment of all dividends. Returns shown do not reflect the deduction of taxes that a shareholder would pay on Fund distributions or the redemption of Fund shares.
AVERAGE ANNUAL TOTAL RETURN FOR PERIODS ENDED OCTOBER 31, 2014
| | One | Five | Ten |
| | Year | Years | Years |
| Hennessy Balanced Fund (HBFBX) | 4.26% | 7.55% | 4.21% |
| 50/50 Blended DJIA/Treasury Index* | 7.27% | 7.83% | 5.43% |
| Dow Jones Industrial Average | 14.48% | 15.30% | 8.42% |
Expense ratio: 1.75%
Performance data quoted represents past performance; past performance does not guarantee future results. The investment return and principal value of an investment will fluctuate so that an investor’s shares, when redeemed, may be worth more or less than their original cost. Current performance of the Fund may be lower or higher than the performance quoted. Performance data current to the most recent month end may be obtained by visiting hennessyfunds.com.
The expense ratio presented is from the most recent prospectus.
| * | The 50/50 Blended DJIA/Treasury Index consists of 50% common stocks represented by the Dow Jones Industrial Average and 50% short duration Treasury securities represented by the BofA Merrill Lynch 1-Year U.S. Treasury Note Index. |
PERFORMANCE NARRATIVE
Portfolio Managers Neil Hennessy and Brian Peery
Over the previous twelve months, how did the Fund perform and what factors contributed to this performance?
For the twelve-month period ended October 31, 2014, the Hennessy Balanced Fund returned 4.26%, underperforming the 50/50 Blended DJIA/Treasury Index*, the Dow Jones Industrial Average and the Morningstar Moderate Allocation Category Average, which returned 7.27%, 14.48% and 8.27% for the same period, respectively.
The Fund’s relative underperformance to its benchmarks is due primarily to stock selection versus the benchmark Dow Jones Industrial Average. Because the Fund maintains a position of approximately 50% in U.S. Treasuries, it also did not fully capture the performance of the equity markets over the twelve-month period. While the Fund’s portfolio may underperform its benchmarks in periods where equities rise sharply, the strategy attempts to capture near-market returns with a lower risk profile, since only approximately 50% of the assets of the Fund are invested in equities. Conversely, if equity markets were to fall sharply, we would expect the Fund to perform better than its equity benchmarks due to its approximately 50% exposure to short-term U.S. Treasuries. Ultimately, the overall goal of this portfolio is to capture upside performance while mitigating downside risk.
During the twelve-month period ended October 31, 2014, all but two of the Fund’s 14 equity positions had positive returns, with only Pfizer, Inc. and McDonald’s Corp. posting negative returns. Merck & Co., Inc. and Intel Corp. had the best performance during the period, posting gains of approximately 44% and 33%, respectively. Despite Merck & Co., Inc. being the second largest holding within the Fund, the Fund’s relative underweight positions in UnitedHealth Group, Inc., Nike, Inc., The Walt Disney Company and Home Depot, Inc., all of which posted returns north of 20% for the year, hurt relative overall performance versus its benchmarks.
Additional Portfolio Manager commentary and related investment outlook:
We continue to believe that the Dow Jones Industrial Average stocks, and in particular the stocks comprising the high dividend- yielding “Dogs of the Dow” (the methodology employed within the Hennessy Balanced Fund), provide an excellent way to gain equity exposure to the markets. With U.S. Treasury yields still trading near historic lows, many investors are seeking high quality, dividend-paying companies as a means of generating current income. We believe that the rotation out of bonds and into equities, where investors have historically received higher yields and have the potential for capital appreciation, will likely continue.
As the overall markets reach new highs and investors become more wary of a potential pullback, we believe that a trend of moving some money away from more risky asset classes and into the perceived “safety” of very large, dividend-paying companies should prevail. We believe the Fund is well positioned for the more conservative investor, as the equity portion of the portfolio holds what we would deem to be high quality, high-dividend-paying companies, while the relatively short duration of the U.S. Treasury component (all less than one year) will allow us the ability to roll into higher yielding treasuries in the event yields continue to rise.
_______________
| * | The 50/50 Blended DJIA/Treasury Index consists of 50% common stocks represented by the Dow Jones Industrial Average and 50% short duration Treasury securities represented by the BofA Merrill Lynch 1-Year U.S. Treasury Note Index. The Dow Jones Industrial Average is an unmanaged index commonly used to measure the performance of U.S. stocks. The BofA Merrill
|
HENNESSY FUNDS 1-800-966-4354
Lynch 1-Year U.S. Treasury Note Index is an unmanaged index comprised of Treasury securities maturing in approximately one year. You cannot invest directly in an index. Performance data for an index does not reflect any deductions for fees, expenses or taxes. The Fund is non-diversified, meaning it concentrates its assets in fewer individual holdings than a diversified fund and is therefore more exposed to individual stock volatility than a diversified fund. The Fund’s portfolio is rebalanced annually in accordance with its strategy, which may result in the elimination of better performing assets from the Fund’s investments and increases in investments with relatively lower total return. References to specific securities should not be considered a recommendation to buy or sell any security. Fund holdings and sector allocations are subject to change. Please refer to the Schedule of Investments included in this report for additional portfolio information.
Each Morningstar category average represents a universe of funds with similar investment objectives. © Morningstar, Inc. All Rights Reserved. The information contained herein: 1) is proprietary to Morningstar; 2) may not be copied or distributed and 3) is not warranted to be accurate, complete or timely. Neither Morningstar nor its content providers are responsible for any damages or losses arising from any use of this information. Past performance does not guarantee future results.
Financial Statements
HENNESSY BALANCED FUND
As of October 31, 2014
(% of Net Assets)
| TOP TEN HOLDINGS | % NET ASSETS |
| | |
| U.S. Treasury Bill, 0.020%, 02/05/2015 | 11.96% |
| U.S. Treasury Bill, 0.110%, 06/25/2015 | 7.97% |
| U.S. Treasury Bill, 0.105%, 08/20/2015 | 7.97% |
| U.S. Treasury Bill, 0.120%, 09/17/2015 | 7.97% |
| Procter & Gamble Co. | 5.11% |
| Verizon Communications, Inc. | 5.07% |
| AT&T, Inc. | 4.90% |
| General Electric Co. | 4.87% |
| Cisco Systems, Inc. | 4.83% |
| Merck & Co., Inc. | 4.82% |
Note: For presentation purposes, the Fund has grouped some of the industry categories. For purposes of categorizing securities for compliance with Section 8(b)(1) of the Investment Company Act of 1940, the Fund uses more specific industry classifications.
HENNESSY FUNDS 1-800-966-4354
| | COMMON STOCKS – 49.13% | | Number | | | | | | % of | |
| | | | of Shares | | | Value | | | Net Assets | |
| | Consumer Discretionary – 4.63% | | | | | | | | | |
| | McDonald’s Corp. | | | 6,200 | | | $ | 581,126 | | | | 4.63 | % |
| | | | | | | | | | | | | | |
| | Consumer Staples – 8.95% | | | | | | | | | | | | |
| | Procter & Gamble Co. | | | 7,350 | | | | 641,434 | | | | 5.11 | % |
| | The Coca-Cola Co. | | | 11,500 | | | | 481,620 | | | | 3.84 | % |
| | | | | | | | | 1,123,054 | | | | 8.95 | % |
| | | | | | | | | | | | | | |
| | Energy – 4.64% | | | | | | | | | | | | |
| | Chevron Corp. | | | 4,850 | | | | 581,757 | | | | 4.64 | % |
| | | | | | | | | | | | | | |
| | Health Care – 9.49% | | | | | | | | | | | | |
| | Merck & Co., Inc. | | | 10,450 | | | | 605,473 | | | | 4.82 | % |
| | Pfizer, Inc. | | | 19,550 | | | | 585,523 | | | | 4.67 | % |
| | | | | | | | | 1,190,996 | | | | 9.49 | % |
| | | | | | | | | | | | | | |
| | Industrials – 4.87% | | | | | | | | | | | | |
| | General Electric Co. | | | 23,650 | | | | 610,407 | | | | 4.87 | % |
| | | | | | | | | | | | | | |
| | Information Technology – 6.58% | | | | | | | | | | | | |
| | Cisco Systems, Inc. | | | 24,750 | | | | 605,632 | | | | 4.83 | % |
| | Intel Corp. | | | 6,450 | | | | 219,365 | | | | 1.75 | % |
| | | | | | | | | 824,997 | | | | 6.58 | % |
| | | | | | | | | | | | | | |
| | Telecommunication Services – 9.97% | | | | | | | | | | | | |
| | AT&T, Inc. | | | 17,650 | | | | 614,926 | | | | 4.90 | % |
| | Verizon Communications, Inc. | | | 12,650 | | | | 635,662 | | | | 5.07 | % |
| | | | | | | | | 1,250,588 | | | | 9.97 | % |
| | Total Common Stocks | | | | | | | | | | | | |
| | (Cost $5,299,417) | | | | | | | 6,162,925 | | | | 49.13 | % |
The accompanying notes are an integral part of these financial statements.
| | SHORT-TERM INVESTMENTS – 51.33% | | Number of Shares/ | | | | | | % of | |
| | | | Par Amount | | | Value | | | Net Assets | |
| | Money Market Funds – 4.31% | | | | | | | | | |
| | Fidelity Government Portfolio – | | | | | | | | | |
| | Institutional Class, 0.01% (a) | | | 540,062 | | | $ | 540,062 | | | | 4.31 | % |
| | | | | | | | | | | | | | |
| | U.S. Treasury Bills – 47.02% | | | | | | | | | | | | |
| | 0.020%, 02/05/2015 (b) | | | 1,500,000 | | | | 1,499,942 | | | | 11.96 | % |
| | 0.050%, 03/05/2015 (b) | | | 300,000 | | | | 299,964 | | | | 2.39 | % |
| | 0.040%, 04/02/2015 (b) | | | 500,000 | | | | 499,917 | | | | 3.98 | % |
| | 0.095%, 05/28/2015 (b) | | | 600,000 | | | | 599,845 | | | | 4.78 | % |
| | 0.110%, 06/25/2015 (b) | | | 1,000,000 | | | | 999,561 | | | | 7.97 | % |
| | 0.105%, 08/20/2015 (b) | | | 1,000,000 | | | | 999,376 | | | | 7.97 | % |
| | 0.120%, 09/17/2015 (b) | | | 1,000,000 | | | | 999,293 | | | | 7.97 | % |
| | | | | | | | | 5,897,898 | | | | 47.02 | % |
| | Total Short-Term Investments | | | | | | | | | | | | |
| | (Cost $6,436,600) | | | | | | | 6,437,960 | | | | 51.33 | % |
| | | | | | | | | | | | | | |
| | Total Investments | | | | | | | | | | | | |
| | (Cost $11,736,017) – 100.46% | | | | | | | 12,600,885 | | | | 100.46 | % |
| | Liabilities in Excess of | | | | | | | | | | | | |
| | Other Assets – (0.46)% | | | | | | | (57,870 | ) | | | (0.46 | )% |
| | TOTAL NET ASSETS – 100.00% | | | | | | $ | 12,543,015 | | | | 100.00 | % |
Percentages are stated as a percent of net assets.
| | (a) | The rate listed is the fund’s 7-day yield as of October 31, 2014. |
| | (b) | The rate listed is discount rate at issue. |
The accompanying notes are an integral part of these financial statements.
HENNESSY FUNDS 1-800-966-4354
Summary of Fair Value Exposure at October 31, 2014
The following is a summary of the inputs used to value the Fund’s net assets as of October 31, 2014 (See Note 3 in the accompanying notes to the financial statements):
| Common Stock | | Level 1 | | | Level 2 | | | Level 3 | | | Total | |
| Consumer Discretionary | | $ | 581,126 | | | $ | — | | | $ | — | | | $ | 581,126 | |
| Consumer Staples | | | 1,123,054 | | | | — | | | | — | | | | 1,123,054 | |
| Energy | | | 581,757 | | | | — | | | | — | | | | 581,757 | |
| Health Care | | | 1,190,996 | | | | — | | | | — | | | | 1,190,996 | |
| Industrials | | | 610,407 | | | | — | | | | — | | | | 610,407 | |
| Information Technology | | | 824,997 | | | | — | | | | — | | | | 824,997 | |
| Telecommunication Services | | | 1,250,588 | | | | — | | | | — | | | | 1,250,588 | |
| Total Common Stock | | $ | 6,162,925 | | | $ | — | | | $ | — | | | $ | 6,162,925 | |
| Short-Term Investments | | | | | | | | | | | | | | | | |
| Money Market Funds | | $ | 540,062 | | | $ | — | | | $ | — | | | $ | 540,062 | |
| U.S. Treasury Bills | | | — | | | | 5,897,898 | | | | — | | | | 5,897,898 | |
| Total Short-Term Investments | | $ | 540,062 | | | $ | 5,897,898 | | | $ | — | | | $ | 6,437,960 | |
| Total Investments in Securities | | $ | 6,702,987 | | | $ | 5,897,898 | | | $ | — | | | $ | 12,600,885 | |
Transfers between levels are recognized at the end of the reporting period. During the one-year period ended October 31, 2014, the Fund recognized no transfers between levels.
The accompanying notes are an integral part of these financial statements.
Financial Statements
Statement of Assets and Liabilities as of October 31, 2014 |
| ASSETS: | | | |
| Investments in securities, at value (cost $11,736,017) | | $ | 12,600,885 | |
| Dividends and interest receivable | | | 19,843 | |
| Prepaid expenses and other assets | | | 5,598 | |
| Total Assets | | | 12,626,326 | |
| | | | | |
| LIABILITIES: | | | | |
| Payable for fund shares redeemed | | | 26,149 | |
| Payable to advisor | | | 6,305 | |
| Payable to administrator | | | 2,811 | |
| Payable to auditor | | | 17,301 | |
| Distribution payable | | | 19,062 | |
| Accrued service fees | | | 1,051 | |
| Accrued trustees fees | | | 1,535 | |
| Accrued expenses and other payables | | | 9,097 | |
| Total Liabilities | | | 83,311 | |
| NET ASSETS | | $ | 12,543,015 | |
| | | | | |
| NET ASSETS CONSIST OF: | | | | |
| Capital stock | | $ | 11,106,839 | |
| Accumulated net investment income | | | 8,114 | |
| Accumulated net realized gain on investments | | | 563,194 | |
| Unrealized net appreciation on investments | | | 864,868 | |
| Total Net Assets | | $ | 12,543,015 | |
| | | | | |
| NET ASSETS | | | | |
| Investor Class: | | | | |
| Shares authorized (no par value) | | Unlimited | |
| Net assets applicable to outstanding Investor Class shares | | $ | 12,543,015 | |
| Shares issued and outstanding | | | 966,177 | |
| Net asset value, offering price and redemption price per share | | $ | 12.98 | |
The accompanying notes are an integral part of these financial statements.
HENNESSY FUNDS 1-800-966-4354
Statement of Operations for the year ended October 31, 2014 |
| INVESTMENT INCOME: | | | |
| Dividend income | | $ | 226,947 | |
| Interest income | | | 5,656 | |
| Total investment income | | | 232,603 | |
| | | | | |
| EXPENSES: | | | | |
| Investment advisory fees (See Note 5) | | | 72,744 | |
| Federal and state registration fees | | | 22,441 | |
| Compliance expense | | | 21,488 | |
| Administration, fund accounting, custody and transfer agent fees | | | 21,310 | |
| Audit fees | | | 18,998 | |
| Distribution fees – Investor Class (See Note 5) | | | 18,186 | |
| Service fees – Investor Class (See Note 5) | | | 12,124 | |
| Sub-transfer agent expenses – Investor Class (See Note 5) | | | 7,584 | |
| Trustees’ fees and expenses | | | 5,955 | |
| Reports to shareholders | | | 5,549 | |
| Legal fees | | | 885 | |
| Other expenses | | | 5,206 | |
| Total expenses | | | 212,470 | |
| NET INVESTMENT INCOME | | $ | 20,133 | |
| | | | | |
| REALIZED AND UNREALIZED GAINS (LOSSES): | | | | |
| Net realized gain on investments | | $ | 572,766 | |
| Net change in unrealized depreciation on investments | | | (93,669 | ) |
| Net gain on investments | | | 479,097 | |
| NET INCREASE IN NET ASSETS RESULTING FROM OPERATIONS | | $ | 499,230 | |
The accompanying notes are an integral part of these financial statements.
| Statements of Changes in Net Assets |
| | | Year Ended | | | Year Ended | |
| | | October 31, 2014 | | | October 31, 2013 | |
| OPERATIONS: | | | | | | |
| Net investment income | | $ | 20,133 | | | $ | 19,673 | |
| Net realized gain on investments | | | 572,766 | | | | 1,673,842 | |
| Net change in unrealized depreciation on investments | | | (93,669 | ) | | | (684,183 | ) |
| Net increase in net assets resulting from operations | | | 499,230 | | | | 1,009,332 | |
| | | | | | | | | |
| DISTRIBUTIONS TO SHAREHOLDERS FROM: | | | | | | | | |
| Net investment income – Investor Class | | | (12,019 | ) | | | (23,090 | ) |
| Net realized gains – Investor Class | | | (413,659 | ) | | | — | |
| Total distributions | | | (425,678 | ) | | | (23,090 | ) |
| | | | | | | | | |
| CAPITAL SHARE TRANSACTIONS: | | | | | | | | |
| Proceeds from shares subscribed – Investor Class | | | 1,215,042 | | | | 1,014,696 | |
| Dividends reinvested – Investor Class | | | 413,511 | | | | 21,766 | |
| Cost of shares redeemed – Investor Class | | | (1,369,664 | ) | | | (14,981,906 | ) |
| Net increase (decrease) in net assets derived | | | | | | | | |
| from capital share transactions | | | 258,889 | | | | (13,945,444 | ) |
| TOTAL INCREASE (DECREASE) IN NET ASSETS | | | 332,441 | | | | (12,959,202 | ) |
| | | | | | | | | |
| NET ASSETS: | | | | | | | | |
| Beginning of year | | | 12,210,574 | | | | 25,169,776 | |
| End of year | | $ | 12,543,015 | | | $ | 12,210,574 | |
| Undistributed net investment income, end of year | | $ | 8,114 | | | $ | — | |
| | | | | | | | | |
| CHANGES IN SHARES OUTSTANDING: | | | | | | | | |
| Shares sold – Investor Class | | | 94,444 | | | | 82,345 | |
| Shares issued to holders as reinvestment of dividends – | | | | | | | | |
| Investor Class | | | 32,872 | | | | 1,841 | |
| Shares redeemed – Investor Class | | | (107,426 | ) | | | (1,256,293 | ) |
| Net increase (decrease) in shares outstanding | | | 19,890 | | | | (1,172,107 | ) |
The accompanying notes are an integral part of these financial statements.
HENNESSY FUNDS 1-800-966-4354
Financial Statements
For an Investor Class share outstanding throughout each year
PER SHARE DATA:
Net asset value, beginning of year
Income from investment operations:
Net investment income
Net realized and unrealized gains on investments
Total from investment operations
Less distributions:
Dividends from net investment income
Dividends from net realized gains
Total distributions
Net asset value, end of year
TOTAL RETURN
SUPPLEMENTAL DATA AND RATIOS:
Net assets, end of year (millions)
Ratio of expenses to average net assets
Ratio of net investment income to average net assets
Portfolio turnover rate
The accompanying notes are an integral part of these financial statements.
| Year Ended October 31, | |
| 2014 | | | 2013 | | | 2012 | | | 2011 | | | 2010 | |
| | | | | | | | | | | | | | |
| $ | 12.90 | | | $ | 11.88 | | | $ | 11.13 | | | $ | 10.43 | | | $ | 9.48 | |
| | | | | | | | | | | | | | | | | | | |
| | | | | | | | | | | | | | | | | | | |
| | 0.02 | | | | 0.02 | | | | 0.04 | | | | 0.05 | | | | 0.05 | |
| | 0.51 | | | | 1.02 | | | | 0.75 | | | | 0.70 | | | | 0.95 | |
| | 0.53 | | | | 1.04 | | | | 0.79 | | | | 0.75 | | | | 1.00 | |
| | | | | | | | | | | | | | | | | | | |
| | | | | | | | | | | | | | | | | | | |
| | (0.01 | ) | | | (0.02 | ) | | | (0.04 | ) | | | (0.05 | ) | | | (0.05 | ) |
| | (0.44 | ) | | | — | | | | — | | | | — | | | | — | |
| | (0.45 | ) | | | (0.02 | ) | | | (0.04 | ) | | | (0.05 | ) | | | (0.05 | ) |
| $ | 12.98 | | | $ | 12.90 | | | $ | 11.88 | | | $ | 11.13 | | | $ | 10.43 | |
| | | | | | | | | | | | | | | | | | | |
| | 4.26 | % | | | 8.77 | % | | | 7.13 | % | | | 7.16 | % | | | 10.53 | % |
| | | | | | | | | | | | | | | | | | | |
| | | | | | | | | | | | | | | | | | | |
| $ | 12.54 | | | $ | 12.21 | | | $ | 25.17 | | | $ | 18.02 | | | $ | 12.50 | |
| | 1.75 | % | | | 1.75 | % | | | 1.54 | % | | | 1.61 | % | | | 1.65 | % |
| | 0.17 | % | | | 0.14 | % | | | 0.34 | % | | | 0.42 | % | | | 0.45 | % |
| | 23 | % | | | 22 | % | | | 17 | % | | | 39 | % | | | 57 | % |
The accompanying notes are an integral part of these financial statements.
HENNESSY FUNDS 1-800-966-4354
Financial Statements
Notes to Financial Statements October 31, 2014 |
1). ORGANIZATION
The Hennessy Balanced Fund (the “Fund”) is a series of Hennessy Funds Trust (the “Trust”), which was organized as a Delaware statutory trust on September 17, 1992. The Fund is an open-end management investment company registered under the Investment Company Act of 1940, as amended. The Fund is a successor to a fund with the same name (the “Predecessor Fund”) that was a series of The Hennessy Funds, Inc., a Maryland corporation, pursuant to a reorganization that took place after the close of business on February 28, 2014. Prior to February 28, 2014, the Fund had no investment operations. As a result of the reorganization, holders of the Investor Class shares of the Predecessor Fund received Investor Class shares of the Fund (the Investor Class shares of the Fund are the successor to the accounting and performance information of the Predecessor Fund). The investment objective of the Fund is a combination of capital appreciation and current income. The Fund is a non-diversified fund.
The Fund offers Investor Class shares. Prior to October 26, 2012, the Investor Class shares were known as Original Class shares.
2). SIGNIFICANT ACCOUNTING POLICIES
The following is a summary of significant accounting policies consistently followed by the Fund in the preparation of the financial statements. These policies are in conformity with U.S. generally accepted accounting principles (“GAAP”).
| a). | Investment Valuation – All investments in securities are recorded at their estimated fair value, as described in Note 3. |
| | |
| b). | Federal Income Taxes – Provision for federal income taxes or excise taxes has not been made since the Fund has elected to be taxed as a “regulated investment company” and intends to distribute substantially all of its taxable income to its shareholders and otherwise comply with the provisions of the Internal Revenue Code of 1986, as amended, applicable to regulated investment companies. Net investment income or loss and realized gains and losses for federal income tax purposes may differ from that reported on the financial statements because of temporary book and tax basis differences. Temporary differences are primarily the result of the treatment of wash sales for tax reporting purposes. Distributions from net realized gains for book purposes may include short-term capital gains, which are included as ordinary income to shareholders for tax purposes. |
| | |
| c). | Income and Expenses – Dividend income is recognized on the ex-dividend date or as soon as information is available to the Fund. Interest income, which includes the amortization of premium and accretion of discount, is recognized on an accrual basis. The Fund is charged for those expenses that are directly attributable to the portfolio, such as advisory, administration, and certain shareholder service fees. |
| | |
| d). | Distributions to Shareholders – Dividends from net investment income for the Fund, if any, are declared and paid out on a calendar quarter basis. Distributions of net realized capital gains, if any, are declared and paid annually, usually in November or December. |
| | |
| e). | Security Transactions – Investment and shareholder transactions are recorded on the trade date. The Fund determines the gain or loss realized from the investment |
| | transactions by comparing the original cost of the security lot sold with the net sale proceeds. Discounts and premiums on securities purchased are accreted/amortized over the life of the respective security. |
| | |
| f). | Use of Estimates – The preparation of financial statements in conformity with GAAP requires management to make estimates and assumptions that affect the reported amounts of assets and liabilities and disclosure of contingent assets and liabilities at the date of the financial statements and the reported change in net assets during the reporting period. Actual results could differ from those estimates. |
| | |
| g). | Share Valuation – The net asset value (“NAV”) per share of the Fund is calculated by dividing the sum of the value of the securities held by the Fund, plus cash or other assets, minus all liabilities (including estimated accrued expenses) by the total number of shares outstanding for the Fund, rounded to the nearest cent. The Fund’s shares will not be priced on days the New York Stock Exchange is closed for trading. The offering and redemption price per share for the Fund is equal to the Fund’s NAV per share. |
| | |
| h). | Repurchase Agreements – The Fund may enter into repurchase agreements with member banks or security dealers of the Federal Reserve Board whom the investment advisor deems creditworthy. The repurchase price generally equals the price paid by the Fund plus interest negotiated on the basis of current short-term rates. |
| | |
| | Securities pledged as collateral for repurchase agreements are held by the custodian bank until the respective agreements mature. Provisions of the repurchase agreements ensure that the market value of the collateral, including accrued interest thereon, is sufficient to cover the repurchase amount in the event of default of the counterparty. If the counterparty defaults and the value of the collateral declines or if the counterparty enters an insolvency proceeding, realization of the collateral by the Fund may be delayed or limited. |
| | |
| i). | Accounting for Uncertainty in Income Taxes – The Fund has adopted accounting policies regarding recognition and measurement of tax positions taken or expected to be taken on a tax return. The tax returns of the Fund for the prior three fiscal years are open for examination. The Fund has reviewed all open tax years in major jurisdictions and concluded that there is no impact on the Fund’s net assets and no tax liability resulting from unrecognized tax benefits relating to uncertain income tax positions taken or expected to be taken on a tax return. The Fund’s major tax jurisdictions are U.S. federal and Delaware. |
| | |
| j). | Derivatives – The Fund may invest in, or enter into, derivatives, such as options, futures contracts, options on futures contracts, and swaps, for a variety of reasons, including to hedge certain risks, to provide a substitute for purchasing or selling particular securities, or to increase potential income gain. Derivatives may provide a cheaper, quicker, or more specifically focused way for a Fund to invest than “traditional” securities would. The main purpose of utilizing these derivative instruments is for hedging purposes. |
| | |
| | The Fund has adopted the financial accounting reporting rules as required by the Derivatives and Hedging Topic of the Financial Accounting Standards Board Accounting Standards Codification. Under such rules, the Fund is required to include enhanced disclosure that enables investors to understand how and why an entity uses derivatives, how derivatives are accounted for, and how derivatives instruments affect an entity’s results of operations and financial position. During the fiscal year ended October 31, 2014, the Fund did not hold any derivative instruments. |
HENNESSY FUNDS 1-800-966-4354
| k). | Events Subsequent to the Fiscal Period End – The Fund has adopted financial reporting rules regarding subsequent events that require an entity to recognize in the financial statements the effects of all subsequent events that provide additional evidence about conditions that existed at the date of the balance sheet. Management has evaluated the Fund’s related events and transactions that occurred subsequent to October 31, 2014 through the date of issuance of the Fund’s financial statements. There were no events or transactions that occurred during this period that materially impacted the amounts or disclosures in the Fund’s financial statements. |
3). SECURITIES VALUATION
The Fund has adopted authoritative fair valuation accounting standards that establish an authoritative definition of fair value and set out a hierarchy for measuring fair value. These standards require additional disclosures about the various inputs and valuation techniques used to develop the measurements of fair value and a discussion in changes in valuation techniques and related inputs during the period. These inputs are summarized in the three broad levels listed below:
| | Level 1 – | Quoted unadjusted prices for identical instruments in active markets to which the Fund has access at the date of measurement. |
| | | |
| | Level 2 – | Quoted prices for similar instruments in active markets; quoted prices for identical or similar instruments in markets that are not active; and model-derived valuations in which all significant inputs and significant value drivers are observable in active markets. Level 2 inputs are those in markets for which there are few transactions, the prices are not current, the prices are fair value adjusted due to post-market close subsequent events (foreign markets), little public information exists, or instances where prices vary substantially over time or among brokered market makers. These inputs may also include interest rates, prepayment speeds, credit risk curves, default rates, and similar data. |
| | | |
| | Level 3 – | Model-derived valuations in which one or more significant inputs or significant value drivers are unobservable. Unobservable inputs are those inputs that reflect the Fund’s own assumptions about what market participants would use to price the asset or liability based on the best available information. |
Following is a description of the valuation techniques applied to the Fund’s major categories of assets and liabilities measured at fair value on a recurring basis.
Equity Securities – Equity securities, including common stocks, preferred stocks, foreign issued common stocks, exchange traded funds, closed-end mutual funds, and real estate investment trusts, that are traded on a securities exchange for which a last-quoted sales price is readily available will generally be valued at the last sales price as reported by the primary exchange on which the securities are listed. Securities listed on The NASDAQ Stock Market (“NASDAQ”) will be valued at the NASDAQ Official Closing Price, which may differ from the last sales price reported. Securities traded on a securities exchange for which a last-quoted sales price is not readily available will generally be valued at the mean between the bid and ask prices. To the extent these securities are actively traded and valuation adjustments are not applied, they are classified in Level 1 of the fair value hierarchy.
Investment Companies – Investments in investment companies (e.g., mutual funds and exchange traded funds) are generally priced at the ending NAV provided by the Fund’s service agent and will be classified in Level 1 of the fair value hierarchy.
Debt Securities – Debt securities, including corporate bonds, asset-backed securities, mortgage-backed securities, municipal bonds, U.S. Treasuries, and U.S. government agency issues, are valued at market on the basis of valuations furnished by an independent pricing service that utilizes both dealer-supplied valuations and formula-based techniques. The pricing service may consider recently executed transactions in securities of the issuer or comparable issuers, market price quotations (where observable), bond spreads, and fundamental data relating to the issuer. In addition, the model may incorporate market observable data such as reported sales of similar securities, broker quotes, yields, bids, offers, and reference data. Certain securities are valued principally using dealer quotations. These securities are generally classified in Level 2 of the fair value hierarchy.
Short-Term Securities – Short-term equity investments, including money market funds, are valued in the manner specified above. Short-term debt investments are generally valued at amortized cost, which approximates fair market value, if their original maturity was 60 days or less, or by amortizing the values as of the 61st day prior to maturity, if their original term to maturity exceeded 60 days. Amortized cost is not used if its use would be inappropriate due to credit or other impairments of the issuer, in which the security would be fair valued, as described below. Short-term securities are generally classified in Level 1 or Level 2 of the fair market hierarchy depending on the inputs used and market activity levels for specific securities.
The Board of Trustees of the Fund (the “Board”) has adopted fair value pricing procedures that are followed when a price for a security is not readily available or if a significant event has occurred that indicates the closing price of a security no longer represents the true value of that security. Fair value pricing determinations are made in good faith in accordance with these procedures. There are numerous criteria that will be given consideration in determining a fair value of a security. Some of these criteria are trading volume of security and markets, the value of other like securities, and news events with direct bearing to security or market. Fair value pricing results in an estimated price for a security that reflects the amount the Fund might reasonably expect to receive in a current sale. Depending on the relative significance of the valuation inputs, these securities may be classified in either Level 2 or Level 3 of the fair value hierarchy.
The Board has delegated day-to-day valuation matters to a Valuation Committee comprised of one or more representatives from Hennessy Advisors, Inc., the Fund’s investment advisor. The function of the Valuation Committee is to value securities where current and reliable market quotations are not readily available. All actions taken by the Valuation Committee are reviewed by the Board.
The Fund has performed an analysis of all existing investments to determine the significance and character of all inputs to their fair value determination. Various inputs are used in determining the value of the Fund’s investments. The inputs or methodology used for valuing securities are not necessarily an indication of the risk associated with investing in those securities. Details related to the fair valuation hierarchy of the Fund’s securities as of October 31, 2014 are included in the Fund’s Schedule of Investments.
4). INVESTMENT TRANSACTIONS
Purchases and sales of investment securities (excluding government and short-term investments) for the Fund during the fiscal year ended October 31, 2014 were $1,442,810 and $2,049,934, respectively.
There were no purchases or sales/maturities of long-term U.S. Government Securities for the Fund during the fiscal year ended October 31, 2014.
HENNESSY FUNDS 1-800-966-4354
5). INVESTMENT MANAGEMENT FEE AND OTHER TRANSACTIONS WITH AFFILIATES
Hennessy Advisors, Inc. (the “Advisor”) is the investment advisor of the Fund. The Advisor provides the Fund with investment management services under an Investment Advisory Agreement. The Advisor furnishes all investment advice, office space, facilities, and provides most of the personnel needed by the Fund. As compensation for its services, the Advisor is entitled to a monthly fee from the Fund. The fee is based upon the average daily net assets of the Fund at the annual rate of 0.60%. The net investment advisory fees payable for the Fund as of October 31, 2014 were $6,305.
The Board has approved a Shareholder Servicing Agreement for the Fund, which was instituted to compensate the Advisor for the non-investment management services it provides to the Fund. The Shareholder Servicing Agreement provides for a monthly fee paid to the Advisor at an annual rate of 0.10% of the average daily net assets of the Fund. Shareholder service fees payable for the Fund as of October 31, 2014 were $1,051.
The Fund has adopted a plan pursuant to Rule 12b-1 under the Investment Company Act of 1940, as amended, that authorizes payments in connection with the distribution of the Fund’s shares at an annual rate of up to 0.15% of the Fund’s average daily net assets. Amounts paid under the plan may be spent on any activities or expenses primarily intended to result in the sale of shares, including but not limited to, advertising, compensation for sales and marketing activities or financial institutions and others such as dealers and distributors, shareholder account servicing, the printing and mailing of prospectuses to other than current shareowners, and the printing and mailing of sales literature.
The Fund has entered into agreements with various brokers, dealers, and financial intermediaries in connection with the sale of shares of the Fund. The agreements provide for periodic payments by the Fund to the brokers, dealers, and financial intermediaries for providing certain shareholder maintenance services (sub-transfer agent expenses). These shareholder services include the pre-processing and quality control of new accounts, shareholder correspondence, answering customer inquiries regarding account status, and facilitating shareholder telephone transactions. Fees paid by the Fund to various brokers, dealers, and financial intermediaries for the fiscal year ended October 31, 2014 were $7,584.
U.S. Bancorp Fund Services, LLC (“USBFS”) provides the Fund with administrative, fund accounting, and transfer agent services, including all regulatory reporting, and necessary office equipment and personnel. As administrator, USBFS prepares various federal and state regulatory filings, reports, and returns for the Fund; prepares reports and materials to be supplied to the Board; monitors the activities of the Fund’s custodian, transfer agent, and accountants; and coordinates the preparation and payment of the Fund’s expenses and reviews the Fund’s expense accruals. Fees paid to USBFS for the fiscal year ended October 31, 2014 were $21,310.
U.S. Bank, N.A., an affiliate of USBFS, serves as the Fund’s custodian. Quasar Distributors, LLC acts as the Fund’s principal underwriter in a continuous public offering of the Fund’s shares. Quasar Distributors, LLC is an affiliate of USBFS and U.S. Bank, N.A.
6). LINE OF CREDIT
The Fund has a line of credit with the other funds in the Hennessy Funds family of funds (the “Hennessy Funds”) in the amount of the lesser of (i) $100,000,000 or (ii) 33.33% of each Hennessy Fund’s net assets, or 30% for the Hennessy Gas Utility Index Fund and 10% for the Hennessy Balanced Fund, intended to provide short-term financing, if necessary, subject to certain restrictions, in connection with shareholder redemptions. The credit facility is with the Hennessy Funds’ custodian bank, U.S. Bank, N.A. Borrowings under this
arrangement bear interest at the bank’s prime rate. During the fiscal year ended October 31, 2014, the Fund did not have any borrowings outstanding under the line of credit.
7). FEDERAL TAX INFORMATION
As of October 31, 2014, the components of accumulated earnings (losses) for income tax purposes were as follow:
| | Cost of investments for tax purposes | | $ | 11,744,745 | |
| | Gross tax unrealized appreciation | | $ | 904,022 | |
| | Gross tax unrealized depreciation | | | (47,882 | ) |
| | Net tax unrealized appreciation | | $ | 856,140 | |
| | Undistributed ordinary income | | $ | 17,332 | |
| | Undistributed long-term capital gains | | | 562,704 | |
| | Total distributable earnings | | $ | 580,036 | |
| | Other accumulated gain | | $ | — | |
| | Total accumulated gain | | $ | 1,436,176 | |
The difference between book-basis and tax-basis unrealized appreciation is attributable primarily to wash sales.
At October 31, 2014, the Fund had no tax basis capital losses to offset future capital gains.
At October 31, 2014, the Fund did not defer, on a tax basis, any post-December late year ordinary loss deferrals.
The tax character of distributions paid during fiscal year 2014 and fiscal year 2013 for the Fund were as follow:
| | | | Year Ended | | | Year Ended | |
| | | | October 31, 2014 | | | October 31, 2013 | |
| | Ordinary income | | $ | 12,019 | | | $ | 22,605 | |
| | Long-term capital gain | | | 413,659 | | | | 485 | |
| | | | $ | 425,678 | | | $ | 23,090 | |
8). AGREEMENT AND PLAN OF REORGANIZATION
On December 11, 2013, the Board approved an Agreement and Plan of Reorganization (the “Agreement”), of the Hennessy Balanced Fund (the “New Fund”), pursuant to which the New Fund would be a successor to the corresponding series of the same name of The Hennessy Funds, Inc., a Maryland corporation (the “Predecessor Fund”). The Agreement provided for the transfer of assets of the Predecessor Fund to the New Fund and the assumption of the liabilities of the Predecessor Fund by the New Fund. The New Fund had the same investment objective and substantially similar principal investment strategies as the Predecessor Fund. The reorganization was effective as of the close of business on February 28, 2014. The following table illustrates the specifics of the reorganization:
| | | Shares of the New Fund | | | |
| | Predecessor Fund | Issued to Shareholders of | New Fund | Combined | Tax Status |
| | Net Assets | the Predecessor Fund | Net Assets | Net Assets | of Transfer |
| | $11,886,699(1) | 945,038 | $11,886,699 | $11,886,699 | Non-taxable |
| | (1) | Included accumulated realized gains and unrealized appreciation in the amounts of $426,205 and $1,031,787, respectively. |
HENNESSY FUNDS 1-800-966-4354
9). EVENTS SUBSEQUENT TO YEAR-END
On December 8, 2014, a short-term capital gains distribution of $0.00962 per share and a long-term capital gains distribution of $0.58710 per share were declared and paid to shareholders of record on December 5, 2014.
Report of Independent Registered Public Accounting Firm
The Board of Trustees and Shareholders
Hennessy Funds Trust:
We have audited the accompanying statement of assets and liabilities of Hennessy Balanced Fund (the Fund), a series of Hennessy Funds Trust (formerly a series of Hennessy Mutual Funds, Inc.), including the schedule of investments, as of October 31, 2014, and the related statement of operations for the year then ended, the statements of changes in net assets for each of the years in the two-year period then ended, and the financial highlights for each of the years in the five-year period then ended. These financial statements and financial highlights are the responsibility of the Fund’s management. Our responsibility is to express an opinion on these financial statements and financial highlights based on our audits.
We conducted our audits in accordance with the standards of the Public Company Accounting Oversight Board (United States). Those standards require that we plan and perform the audit to obtain reasonable assurance about whether the financial statements and financial highlights are free of material misstatement. An audit includes examining, on a test basis, evidence supporting the amounts and disclosures in the financial statements. Our procedures included confirmation of investments owned as of October 31, 2014, by correspondence with the custodian and brokers or by other appropriate auditing procedures. An audit also includes assessing the accounting principles used and significant estimates made by management, as well as evaluating the overall financial statement presentation. We believe that our audits provide a reasonable basis for our opinion.
In our opinion, the financial statements and financial highlights referred to above present fairly, in all material respects, the financial position of the Fund as of October 31, 2014, and the results of its operations for the year then ended, the changes in its net assets for each of the years in the two-year period then ended, and the financial highlights for each of the years in the five-year period then ended, in conformity with U.S. generally accepted accounting principles.
Milwaukee, Wisconsin
December 30, 2014
HENNESSY FUNDS 1-800-966-4354
Trustees and Officers of the Fund (Unaudited)
The business and affairs of the Fund are managed under the direction of the Fund’s Board of Trustees. Information pertaining to the Trustees and Officers of the Fund is set forth below. The Fund’s Statement of Additional Information includes additional information about the Fund’s Trustees and Officers and is available, without charge, upon request by calling 1-800-966-4354.
| | | | | Number of | |
| | | Term of | | Portfolios | |
| | | Office | | in the | Other |
| | | and | | Fund | Directorships |
| | Position(s) | Length | Principal | Complex | (During Past |
| Name, Address, | Held with | of Time | Occupation(s) | Overseen | Five Years)(2) |
| and Age | the Fund | Served | During Past Five Years | by Trustee | Held by Trustee |
| | | |
| Disinterested Trustees (as defined below) | | |
| | | | | | |
| J. Dennis DeSousa | Trustee | Indefinite, | Mr. DeSousa is a real | 16 | Hennessy SPARX |
| Age: 78 | | until | estate investor. | | Funds Trust; |
| Address: | | successor | | | Hennessy Mutual |
| c/o Hennessy | | elected | | | Funds, Inc.; and |
| Advisors, Inc. | | | | | The Hennessy |
| 7250 Redwood Blvd. | | Served | | | Funds, Inc. |
| Suite 200 | | since | | | |
| Novato, CA 94945 | | January | | | |
| | | 1996 | | | |
| | | for the | | | |
| | | Funds (or | | | |
| | | Predecessor | | | |
| | | Funds) | | | |
| | | | | | |
| Robert T. Doyle | Trustee | Indefinite, | Mr. Doyle has been the | 16 | Hennessy SPARX |
| Age: 67 | | until | Sheriff of Marin County, | | Funds Trust; |
| Address: | | successor | California since 1996. | | Hennessy Mutual |
| c/o Hennessy | | elected | | | Funds, Inc.; and |
| Advisors, Inc. | | | | | The Hennessy |
| 7250 Redwood Blvd. | | Served | | | Funds, Inc. |
| Suite 200 | | since | | | |
| Novato, CA 94945 | | January | | | |
| | | 1996 | | | |
| | | for the | | | |
| | | Funds (or | | | |
| | | Predecessor | | | |
| | | Funds) | | | |
| | | | | | |
| Gerald P. Richardson | Trustee | Indefinite, | Mr. Richardson is an | 16 | Hennessy SPARX |
| Age: 69 | | until | independent consultant | | Funds Trust; |
| Address: | | successor | in the securities industry. | | Hennessy Mutual |
| c/o Hennessy | | elected | | | Funds, Inc.; and |
| Advisors, Inc. | | | | | The Hennessy |
| 7250 Redwood Blvd. | | Served | | | Funds, Inc. |
| Suite 200 | | since | | | |
| Novato, CA 94945 | | May 2004 | | | |
| | | for the | | | |
| | | Funds (or | | | |
| | | Predecessor | | | |
| | | Funds) | | | |
| | | | | Number of | |
| | | Term of | | Portfolios | |
| | | Office | | in the | Other |
| | | and | | Fund | Directorships |
| | Position(s) | Length | Principal | Complex | (During Past |
| Name, Address, | Held with | of Time | Occupation(s) | Overseen | Five Years)(2) |
| and Age | the Fund | Served | During Past Five Years | by Trustee | Held by Trustee |
| | | |
| “Interested Persons” (as defined in the 1940 Act) | | |
| | | |
Neil J. Hennessy(1) | Chief | Trustee: | Mr. Hennessy has been | 16 | Hennessy |
| Age: 58 | Investment | Indefinite, | employed by Hennessy | | Advisors, Inc. |
| Address: | Officer, | until | Advisors, Inc., the Funds’ | | (current); |
| c/o Hennessy | Portfolio | successor | investment advisor, since | | Hennessy SPARX |
| Advisors, Inc. | Manager, | elected | 1989. He currently serves | | Funds Trust; |
| 7250 Redwood Blvd. | President, | | as President, Chairman | | Hennessy Mutual |
| Suite 200 | Trustee | Served | and CEO of Hennessy | | Funds, Inc.; and |
| Novato, CA 94945 | and | since | Advisors, Inc. | | The Hennessy |
| | Chairman | January | | | Funds, Inc. |
| | of the | 1996 | | | |
| | Board | for the | | | |
| | | Funds (or | | | |
| | | Predecessor | | | |
| | | Funds) | | | |
| | | | | | |
| | | Officer: | | | |
| | | 1 year term | | | |
| | | | | | |
| | | Served | | | |
| | | since | | | |
| | | June 2008 | | | |
| | | for the | | | |
| | | Funds (or | | | |
| | | Predecessor | | | |
| | | Funds) | | | |
| | | | | | |
Teresa M. Nilsen(1) | Executive | 1 year term | Ms. Nilsen has been | N/A | N/A |
| Age: 48 | Vice | | employed by Hennessy | | |
| Address: | President | Served | Advisors, Inc., the Funds’ | | |
| c/o Hennessy | and | since | investment advisor, since | | |
| Advisors, Inc. | Treasurer | January | 1989. She currently serves | | |
| 7250 Redwood Blvd. | | 1996 | as Executive Vice President, | | |
| Suite 200 | | for the | Chief Operations Officer, | | |
| Novato, CA 94945 | | Funds (or | Chief Financial Officer, and | | |
| | | Predecessor | Secretary of Hennessy | | |
| | | Funds) | Advisors, Inc. | | |
| (1) | All Officers of the Hennessy Funds and employees of the Manager are Interested Persons of the Funds. |
| (2) | Pursuant to an internal reorganization, the series of Hennessy Mutual Funds, Inc. (“HMFI”), The Hennessy Funds, Inc. (“HFI”) and Hennessy SPARX Funds Trust (“HSFT”) were reorganized into series of Hennessy Funds Trust on February 28, 2014, which mirrored the corresponding series of HFMI, HFI and HSFT. Subsequent to the reorganization, HFMI, HFI and HSFT were dissolved. |
HENNESSY FUNDS 1-800-966-4354
| | | Term of | |
| | | Office | |
| | | and | |
| | Position(s) | Length | Principal |
| Name, Address, | Held with | of Time | Occupation(s) |
| and Age | the Fund | Served | During Past Five Years |
| | | | |
| Interested Persons | | | |
| | | | |
Daniel B. Steadman(1) | Executive | 1 year term | Mr. Steadman has been employed by |
| Age: 58 | Vice President | | Hennessy Advisors, Inc., the Funds’ |
| Address: | and Secretary | Served since | investment advisor, since 2000. |
| c/o Hennessy Advisors, Inc. | | March 2000 | He currently serves as Executive |
| 7250 Redwood Blvd. | | for the Funds (or | Vice President and Chief Compliance |
| Suite 200 | | Predecessor Funds) | Officer of Hennessy Advisors, Inc. |
| Novato, CA 94945 | | | |
| | | | |
Jennifer Cheskiewicz(1) | Senior | 1 year term | Ms. Cheskiewicz has been employed by |
| Age: 37 | Vice President | | Hennessy Advisors, Inc., the Funds’ |
| Address: | and Chief | Served since | investment advisor, since June 2013. |
| c/o Hennessy Advisors, Inc. | Compliance | June 2013 | She previously served as in-house |
| 7250 Redwood Blvd. | Officer | for the Funds (or | counsel to Carlson Capital, L.P., an |
| Suite 200 | | Predecessor Funds) | SEC-registered investment advisor to |
| Novato, CA 94945 | | | several private funds from February |
| | | | 2010 to May 2013. Prior to that, she |
| | | | was an attorney with Gibson, Dunn & |
| | | | Crutcher LLP from September 2005 |
| | | | through February 2010. She currently |
| | | | serves as General Counsel of |
| | | | Hennessy Advisors, Inc. |
| | | | |
Brian Carlson(1) | Senior | 1 year term | Mr. Carlson has been employed by |
| Age: 42 | Vice President | | Hennessy Advisors, Inc., the Funds’ |
| Address: | and Head of | Served since | investment advisor, since |
| c/o Hennessy Advisors, Inc. | Distribution | December 2013 | December 2013. |
| 7250 Redwood Blvd. | | for the Funds (or | |
| Suite 200 | | Predecessor Funds) | Mr. Carlson was previously a |
| Novato, CA 94945 | | | co-founder and principal of Trivium |
| | | | Consultants, LLC from February 2011 |
| | | | through November 2013. Prior to that, |
| | | | he was the Senior Managing Director |
| | | | of NRP Financial, Inc. from August |
| | | | 2007 through February 2011. |
| | | | |
David Ellison(1) | Portfolio Manager | 1 year term | Mr. Ellison has served as Portfolio |
| Age: 56 | and Senior | | Manager of the Large Cap Financial |
| Address: | Vice President | Served since | Fund, the Small Cap Financial Fund, |
| c/o Hennessy Advisors, Inc. | | October 2012 | and the Technology Fund |
| 101 Federal Street | | for the Funds (or | since inception. |
| Suite 1900 | | Predecessor Funds) | |
| Boston, MA 02110 | | | Mr. Ellison previously served as Director, |
| | | | CIO and President of FBR Advisers, Inc. |
| | | | from December 1999 to October 2012. |
| (1) | All Officers of the Hennessy Funds and employees of the Manager are Interested Persons of the Funds. |
| | | Term of | |
| | | Office | |
| | | and | |
| | Position(s) | Length | Principal |
| Name, Address, | Held with | of Time | Occupation(s) |
| and Age | the Fund | Served | During Past Five Years |
| | | | |
| Interested Persons | | | |
| | | | |
Brian Peery(1) | Portfolio Manager | 1 year term | Mr. Peery has been a Portfolio Manager |
| Age: 45 | and | | of the Cornerstone Growth Fund, |
| Address: | Vice President | Served since | the Cornerstone Mid Cap 30 Fund, the |
| c/o Hennessy Advisors, Inc. | | March 2003 | Cornerstone Large Growth Fund, the |
| 7250 Redwood Blvd. | | as Vice President | Cornerstone Value Fund, the Total |
| Suite 200 | | for the Funds (or | Return Fund, and the Balanced Fund |
| Novato, CA 94945 | | Predecessor Funds) | since October 2014. From February |
| | | | 2011 through September 2014, he |
| | | Served since | served as Co-Portfolio Manager of |
| | | February 2011 | the same funds. |
| | | as Co-Portfolio | |
| | | Manager | Mr. Peery has been employed by |
| | | for the Funds (or | Hennessy Advisors, Inc., the Funds’ |
| | | Predecessor Funds) | investment advisor, since 2002. |
| | | | |
Winsor (Skip) Aylesworth(1) | Portfolio Manager | 1 year term | Mr. Aylesworth has been Portfolio |
| Age: 67 | and | | Manager of the Gas Utility Index Fund |
| Address: | Vice President | Served since | since 1998 and Portfolio Manager of |
| c/o Hennessy Advisors, Inc. | | October 2012 | the Technology Fund since inception. |
| 101 Federal Street | | for the Funds (or | |
| Suite 1900 | | Predecessor Funds) | Mr. Aylesworth previously served as |
| Boston, MA 02110 | | | Executive Vice President of The FBR |
| | | | Funds from 1999 to October 2012. |
| | | | |
Ryan Kelley(1) | Portfolio Manager | 1 year term | Mr. Kelley has been a Portfolio Manager |
| Age: 42 | and | | of the Gas Utility Index Fund (formerly |
| Address: | Vice President | Served since | the FBR Gas Utility Index Fund), the |
| c/o Hennessy Advisors, Inc. | | March 2013 | Small Cap Financial Fund (formerly the |
| 1340 Environ Way | | for the Funds (or | FBR Small Cap Financial Fund), and the |
| Chapel Hill, NC 27517 | | Predecessor Funds) | Large Cap Financial Fund (formerly the |
| | | | FBR Large Cap Financial Fund) since |
| | | | October 2014. From March 2013 |
| | | | through September 2014, he served |
| | | | as a Co-Portfolio Manager of the same |
| | | | funds. Prior to that, he was a Portfolio |
| | | | Analyst of the Hennessy Funds. |
| | | | |
| | | | Mr. Kelley previously served as Portfolio |
| | | | Manager of The FBR Funds from |
| | | | January 2008 to October 2012. |
| (1) | All Officers of the Hennessy Funds and employees of the Manager are Interested Persons of the Funds. |
HENNESSY FUNDS 1-800-966-4354
Expense Example (Unaudited)
October 31, 2014
As a shareholder of the Fund, you incur two types of costs: (1) transaction costs, including sales charges (loads) on purchase payments, reinvested dividends, or other distributions; redemption fees; and exchange fees; and (2) ongoing costs, including management fees; service fees; and other Fund expenses. This Example is intended to help you understand your ongoing costs (in dollars) of investing in the Fund and to compare these costs with the ongoing costs of investing in other mutual funds. The Example is based on an investment of $1,000 invested at the beginning of the period and held for the entire period from May 1, 2014 through October 31, 2014.
Actual Expenses
The first line of the table below provides information about actual account values and actual expenses. Although the Fund charges no sales loads or transaction fees, you will be assessed fees for outgoing wire transfers, returned checks and stop payment orders at prevailing rates charged by U.S. Bancorp Fund Services, LLC, the Fund’s transfer agent. If you request that a redemption be made by wire transfer, currently a $15.00 fee is charged by the Fund’s transfer agent. IRA accounts will be charged a $15.00 annual maintenance fee. The example below includes, but is not limited to, management fees, shareholder servicing fees, fund accounting, custody, and transfer agent fees. However, the example below does not include portfolio trading commissions and related expenses, and other extraordinary expenses as determined under generally accepted accounting principles. You may use the information in this line, together with the amount you invested, to estimate the expenses that you paid over the period. Simply divide your account value by $1,000 (for example, an $8,600 account value divided by $1,000 = 8.6), then multiply the result by the number in the first line of the table under the heading entitled “Expenses Paid During Period” to estimate the expenses you paid on your account during this period.
Hypothetical Example for Comparison Purposes
The second line of the table below provides information about hypothetical account values and hypothetical expenses based on the Fund’s actual expense ratios and an assumed rate of return of 5% per year before expenses, which is not the Fund’s actual return. The hypothetical account values and expenses may not be used to estimate the actual ending account balance or expenses you paid for the period. You may use this information to compare the ongoing costs of investing in the Fund and other funds. To do so, compare this 5% hypothetical example with the 5% hypothetical examples that appear in the shareholder reports of the other funds. Please note that the expenses shown in the table are meant to highlight your ongoing costs only and do not reflect any transactional costs, such as sales charges (loads), or exchange fees. Therefore, the second line of the table is useful in comparing ongoing costs only, and will not help you determine the relative total costs of owning different funds. In addition, if these transactional costs were included, your costs would have been higher.
| | Beginning | Ending | Expenses Paid |
| | Account Value | Account Value | During Period(1) |
| | 5/1/14 | 10/31/14 | 5/1/14 – 10/31/14 |
| Investor Class | | | |
| | | | |
| Actual | $1,000.00 | $1,010.00 | $8.36 |
| | | | |
| Hypothetical (5% return | | | |
| before expenses) | $1,000.00 | $1,016.89 | $8.39 |
| (1) | Expenses are equal to the Fund’s expense ratio of 1.65%, multiplied by the average account value over the period, multiplied by 184/365 days (to reflect one-half year period). |
HENNESSY FUNDS 1-800-966-4354
Proxy Voting
A description of the policies and procedures the Fund uses to determine how to vote proxies relating to portfolio securities is available without charge: (1) by calling 1-800-966-4354; (2) on the Hennessy Funds’ website at hennessyfunds.com; or (3) on the U.S. Securities and Exchange Commission’s (the “SEC”) website at www.sec.gov. The Fund’s proxy voting record is available on both the Hennessy Funds’ website at hennessyfunds.com and the SEC’s website at www.sec.gov no later than August 31 for the prior 12 months ending June 30.
Quarterly Filings on Form N-Q
The Fund files its complete schedule of portfolio holdings with the SEC for the first and third quarters of each fiscal year on Form N-Q. The Fund’s Forms N-Q are available on the SEC’s website at www.sec.gov. The Fund’s Forms N-Q may be reviewed and copied at the SEC’s Public Reference Room in Washington, DC and information on the operation of the Public Reference Room may be obtained by calling 1-800-SEC-0330. Information included in the Fund’s Forms N-Q will also be available upon request by calling 1-800-966-4354.
Federal Tax Distribution Information
(Unaudited)
For the fiscal year ended October 31, 2014, certain dividends paid by the Fund may be subject to a maximum tax rate of 20%, as provided for by the Jobs and Growth Tax Relief Reconciliation Act of 2003. The percentage of dividends declared from ordinary income designated as qualified dividend income was 100.00%.
For corporate shareholders, the percent of ordinary income distributions qualifying for the corporate dividends received deduction for the fiscal year ended October 31, 2014 was 100.00%.
The percentage of taxable ordinary income distributions that are designated as short-term capital gain distributions under Section 871(k)(2)(C) of the Internal Revenue Code of 1986, as amended, for the Fund was 0.00%.
Householding
To help keep the Fund’s costs as low as possible, we generally deliver a single copy of most financial reports and prospectuses to shareholders who share an address, even if the accounts are registered under different names. This process, known as “householding,” does not apply to account statements. You may, of course, request an individual copy of a prospectus or financial report at any time. If you would like to receive separate mailings, please call the Administrator at 1-800-261-6950 or 1-414-765-4124 and we will begin individual delivery within 30 days of your request. If your account is held through a financial institution or other intermediary, please contact them directly to request individual delivery.
Privacy Policy
We collect the following non-public personal information about you:
| | • | information we receive from you on or in applications or other forms, correspondence, or conversations, including, but not limited to, your name, address, phone number, social security number, assets, income and date of birth; |
| | | and |
| | • | information about your transactions with us, our affiliates, or others, including, but not limited to, your account number and balance, payment history, parties to transactions, cost basis information and other financial information. |
We do not disclose any non-public personal information about our current or former shareholders to nonaffiliated third parties, except as permitted by law. For example, we are permitted by law to disclose all of the information we collect, as described above, to our Transfer Agent to process your transactions. Furthermore, we restrict access to your non-public personal information to those persons who require such information to provide products or services to you. We maintain physical, electronic and procedural safeguards that comply with federal standards to guard your non-public personal information.
In the event that you hold shares of the Fund through a financial intermediary, including, but not limited to, a broker-dealer, bank or trust company, the privacy policy of your financial intermediary would govern how your non-public personal information would be shared with nonaffiliated third parties.
HENNESSY FUNDS 1-800-966-4354
(This Page Intentionally Left Blank.)
(This Page Intentionally Left Blank.)
For information, questions or assistance, please call
The Hennessy Funds
1-800-966-4354 or 1-415-899-1555
INVESTMENT ADVISOR
Hennessy Advisors, Inc.
7250 Redwood Blvd., Suite 200
Novato, California 94945
ADMINISTRATOR,
TRANSFER AGENT,
DIVIDEND PAYING AGENT &
SHAREHOLDER SERVICING AGENT
U.S. Bancorp Fund Services, LLC
P.O. Box 701
Milwaukee, Wisconsin 53201-0701
CUSTODIAN
U.S. Bank N.A.
Custody Operations
1555 North River Center Dr., Suite 302
Milwaukee, Wisconsin 53212
TRUSTEES
Neil J. Hennessy
Robert T. Doyle
J. Dennis DeSousa
Gerald P. Richardson
COUNSEL
Foley & Lardner LLP
777 East Wisconsin Avenue
Milwaukee, Wisconsin 53202-5306
INDEPENDENT REGISTERED
PUBLIC ACCOUNTING FIRM
KPMG LLP
777 East Wisconsin Avenue
Milwaukee, Wisconsin 53202-5306
DISTRIBUTOR
Quasar Distributors, LLC
615 East Michigan Street
Milwaukee, Wisconsin 53202
hennessyfunds.com | 1-800-966-4354
This report has been prepared for shareholders and may be distributed to
others only if preceded or accompanied by a current prospectus.
ANNUAL REPORT
OCTOBER 31, 2014
HENNESSY CORE BOND FUND
Investor Class HCBFX
Institutional Class HCBIX
hennessyfunds.com | 1-800-966-4354
(This Page Intentionally Left Blank.)
Contents
| Letter to Shareholders | | 2 |
| Performance Overview | | 4 |
| Financial Statements | | |
| Schedule of Investments | | 6 |
| Statement of Assets and Liabilities | | 11 |
| Statement of Operations | | 12 |
| Statements of Changes in Net Assets | | 14 |
| Financial Highlights | | 16 |
| Notes to the Financial Statements | | 20 |
| Report of Independent Registered Public Accounting Firm | | 27 |
| Trustees and Officers of the Fund | | 28 |
| Expense Example | | 34 |
| Proxy Voting | | 36 |
| Quarterly Filings on Form N-Q | | 36 |
| Federal Tax Distribution Information | | 36 |
| Householding | | 36 |
| Privacy Policy | | 37 |
HENNESSY FUNDS 1-800-966-4354
December 2014
Dear Shareholder:
As I look back at 2014, I realize that in this age of rapidly evolving technology, information is delivered and absorbed so quickly that it is difficult to remember what happened last week, let alone what’s happened over the course of an entire year. That is why I’d like to take a moment to recall some of the year’s highs and lows, economically, politically and socially, here in the U.S. and around the globe. 2014 was scarred by political partisanship, civil unrest in the U.S., Ukraine and many other countries, the arrival of terrorist group ISIS, the tragedies of school shootings and natural disasters, and the frightening outbreak of Ebola. However, there were also positive events this year: we survived a government shutdown over healthcare reform, jobs reports have been consistently, albeit anemically, improving, and home prices remained relatively stable, after recovering significantly in 2013. And, important to us here at Hennessy, our hometown team, the San Francisco Giants, won their third World Series in just five years!
A significant event for the financial industry this past year was the confirmation of Janet Yellen as Chair of the Federal Reserve, which served to calm the nerves of business and political leaders alike. I believe Yellen’s leadership will benefit U.S. business owners, as the Fed continues to be a voice of reason in a sea of political and economic rhetoric. The Fed has also supported the economy and corporate America by helping keep interest rates reasonable and low.
The stock market has continued its determined comeback from the lows of 2009, setting multiple record highs in recent months. The U.S. financial markets have provided strong returns over the past twelve-month period ended October 31, 2014, with the Dow Jones Industrial Average (DJIA) returning over 14% and S&P 500 Index returning over 17% during the period. The DJIA currently has a dividend yield of 2.2%, which is equal to that of a 10-Year U.S. Treasury, which is currently also yielding 2.2%. I continue to believe that investments in high-yielding, high-quality stocks have the potential to not only provide income but also the potential for stock price appreciation as well. Fixed income investing has run its course, in my opinion, and many individuals are currently benefiting from the return to investing in equities that possess strong fundamentals. American investors are slowly migrating from fixed income to equities. Currently, 54% of Americans invest in stocks, and I do expect this percentage to increase, especially if interest rates move higher.
For the past several years, U.S. corporations have been driving shareholder value by making acquisitions, initiating and raising dividends, investing in internal infrastructure and buying back stock. However, this year I began to see a shift from those strategies. I believe the easier to execute acquisitions are a thing of the past, and firms now have to be even more creative to execute accretive deals. I also believe that while firms may continue to initiate dividends, fewer firms will raise their dividends and fewer firms will participate in stock buyback programs going forward. What will these cash-rich companies do with their capital if they are not raising dividends or buying back stock? I believe they may begin to initiate capital expenditure programs that could truly benefit economic growth.
Liquidity and monetary conditions are supportive, causing the cost of capital to be very low. I believe firms will choose to spend capital to expand their sales, and they may even begin to hire in earnest. Once a company begins to move in this way, the cost to
defer becomes real for competitors. With almost $3 trillion in cash and short-term investments sitting on the balance sheets of the S&P 500 companies, a strategic shift by firms to spend their idle capital, while slow, could potentially further economic growth in the U.S. in my opinion.
Economic progress and growth remain slow, yet steady, and unemployment, though improving, remains high. Oil prices have fallen, giving consumers a bit more discretionary income. While the midterm elections may not end all of the gridlock in Washington, hopefully we will receive clarity on the political headwinds of taxes and regulations, which have not improved over the past several years.
The markets have had several quarters without any truly significant downturn. The pullbacks we recently experienced, most notably in July and October, were short-lived, as evidenced by the quick rebound to record high market levels. I firmly believe that we are in a secular bull market, and I continue to tell investors to try to remain calm in the face of volatility and continue to focus on the strong, long-term fundamentals that are evident in the market today. Many companies continue to have strong balance sheets, with record cash flows and profits. With this current bull market in its fifth year, investors should expect some volatility.
I am encouraged by the strong returns for the major U.S. financial market indices and by the performance of the Hennessy Funds over the past year. Thank you for your continued confidence and investment in our products. If you have any questions or would like to speak with us directly, please don’t hesitate to call us at (800) 966-4354.
Best regards,
Neil J. Hennessy
President and Chief Investment Officer
Past performance does not guarantee future results.
Mutual fund investing involves risk. Principal loss is possible.
Opinions expressed are those of Neil Hennessy and are subject to change, are not guaranteed and should not be considered investment advice.
The Dow Jones Industrial Average and S&P 500 Index are unmanaged indices commonly used to measure the performance of U.S. stocks. One cannot invest directly in an index.
Cash flow can be used as an indication of a company’s financial strength. A firm’s cash flow is the movement of cash in and out of the firm in the form of payments to suppliers and collections from customers. Dividend Yield is calculated as the annual dividends paid by a company divided by the price of a share of their stock.
HENNESSY FUNDS 1-800-966-4354
Performance Overview (Unaudited)
The opinions expressed in the following commentary reflect those of the Portfolio Managers as of the date written. Any such opinions are subject to change based on market or other conditions and are not guaranteed. These opinions may not be relied upon as investment advice. Investment decisions for the Fund are based on multiple factors, and may not be relied upon as an indication of trading intent on behalf of the Fund. Security positions can and do change.
CHANGE IN VALUE OF $10,000 INVESTMENT
This chart assumes an initial gross investment of $10,000 made on October 31, 2004. Returns shown include the reinvestment of all dividends. Returns shown do not reflect the deduction of taxes that a shareholder would pay on Fund distributions or the redemption of Fund shares.
AVERAGE ANNUAL TOTAL RETURN FOR PERIODS ENDED OCTOBER 31, 2014
| | One | Five | Ten |
| | Year | Years | Years |
| Hennessy Core Bond Fund – | | | |
| Investor Class (HCBFX) | 1.41% | 4.10% | 4.52% |
| Hennessy Core Bond Fund – | | | |
| Institutional Class (HCBIX) | 1.53% | 4.36% | 4.77% |
| Barclays Capital Intermediate | | | |
| U.S. Government/Credit Index | 2.28% | 3.47% | 4.05% |
Expense ratios: Gross 2.37%, Net 1.41%(1) (Investor Class);
Gross 1.78%, Net 1.16%(1) (Institutional Class)
Performance data quoted represents past performance; past performance does not guarantee future results. The investment return and principal value of an investment will fluctuate so that an investor’s shares, when redeemed, may be worth more or less than their original cost. Current performance of the fund may be lower or higher than the performance quoted. Performance data current to the most recent month end may be obtained by visiting hennessyfunds.com. Performance for the period from March 12, 2010 to October 26, 2012 is that of the FBR Core Bond Fund and for the periods prior to March 12, 2010 is that of the AFBA 5 Star Total Return Bond Fund.
The expense ratios presented are from the most recent prospectus.
(1) The Fund’s investment advisor has contractually agreed to waive a portion of its expenses through February 28, 2015.
PERFORMANCE NARRATIVE
FINANCIAL COUNSELORS, INC., SUB-ADVISOR
Portfolio Managers Gary B. Cloud, CFA, and Peter G. Greig, CFA, Financial Counselors, Inc. (sub-advisor)
Over the previous twelve months, how did the Fund perform and what factors contributed to this performance?
For the twelve-month period ended October 31, 2014, the Investor Class of the Hennessy Core Bond Fund returned 1.41%, underperforming the Barclays Intermediate U.S. Government/Credit Index and the Morningstar Intermediate Term Bond Category Average, which returned 2.28% and 4.09% for the same period, respectively.
A pro-cyclical asset allocation in the Fund hurt performance relative to its primary benchmark, due to an overweight position in corporate bonds and an underweight position in U.S. Treasury securities. Some higher yielding fixed income securities in the portfolio hurt performance, as their yield component was offset by slight principal declines. The biggest boost to the Fund’s relative performance came from fixed income sector asset allocation and individual issue selection, while the amortization and roll effect had the largest negative impact on Fund performance.
Additional Portfolio Manager commentary and related investment outlook:
Every cessation of quantitative easing has resulted in a corrective phase in the risk markets, and that seems to be what may be happening now. One major unresolved element to the mix of uncertainties has to do with the Fed and their collective view of where the Federal Funds rate will be over the next 15 months. Federal Funds futures maturing in December 2016 reflect a 1.50% rate while the Fed governor average forecast is close to 3.0%. The market has pushed back very hard against the Fed members’ own forecast for the optimal Federal Funds rate and they both can’t be right.
We have positioned our bond portfolios to be market weight-duration and overweight credit, with a yield curve flattening bias. We will be on guard to reduce the interest rate sensitivity of the portfolio when we see more progress on the global economic recovery.
The Barclays Capital Intermediate U.S. Government/Credit Index is an unmanaged index commonly used to measure the performance of U.S. bonds. You cannot invest directly in an index. Performance data for an index does not reflect any deductions for fees, expenses or taxes. The Fund may invest in debt securities, which typically decrease in value when interest rates rise. The risk is greater for longer term debt securities. Investments by the Fund in lower-rated and non-rated securities presents a greater risk of loss to principal and interest than higher-rated securities. Investments in Asset-Backed and Mortgage-Backed securities include additional risks that investors should be aware of including credit risk, prepayment risk, possible illiquidity and default, as well as increased susceptibility to adverse economic developments. Investments in foreign securities may involve greater volatility and political, economic and currency risk and differences in accounting methods. The Fund may invest in IPOs, which may fluctuate considerably due to the absence of a prior public market and may have a magnified impact on the Fund. Fund holdings and sector allocations are subject to change. Please refer to the Schedule of Investments included in this report for additional portfolio information.
Each Morningstar category average represents a universe of funds with similar investment objectives. © Morningstar, Inc. All Rights Reserved. The information contained herein: 1) is proprietary to Morningstar; 2) may not be copied or distributed and 3) is not warranted to be accurate, complete or timely. Neither Morningstar nor its content providers are responsible for any damages or losses arising from any use of this information. Past performance does not guarantee future results.
HENNESSY FUNDS 1-800-966-4354
Financial Statements
HENNESSY CORE BOND FUND
As of October 31, 2014
(% of Net Assets)
| TOP TEN HOLDINGS (EXCLUDING CASH/CASH EQUIVALENTS) | % NET ASSETS |
| | |
| U.S. Treasury Note, 2.500%, 08/15/2023 | 7.70% |
| U.S. Treasury Note, 2.750%, 02/15/2024 | 6.10% |
| Federal National Mortgage Association, 3.000%, 08/01/2042 | 6.10% |
| Sempra Energy, 6.500%, 06/01/2016 | 5.33% |
| Associated Banc-Corp, 5.125%, 03/28/2016 | 5.16% |
| Lazard Group, 6.850%, 06/15/2017 | 4.75% |
| Ford Motor Credit Co. LLC, 3.000%, 06/12/2017 | 4.55% |
| Federal National Mortgage Association, 3.000%, 03/20/2028 | 4.42% |
| The Hartford Financial Services Group, Inc., 5.375%, 03/15/2017 | 4.28% |
| U.S. Treasury Note, 3.250%, 03/31/2017 | 4.16% |
Note: For presentation purposes, the Fund has grouped some of the industry categories. For purposes of categorizing securities for compliance with Section 8(b)(1) of the Investment Company Act of 1940, the Fund uses more specific industry classifications.
| | PREFERRED STOCKS – 0.66% | | Number of Shares/ | | | | | | % of | |
| | | | Par Amount | | | Value | | | Net Assets | |
| | Financials – 0.66% | | | | | | | | | |
| | Fannie Mae Preferred (a) | | | 7,900 | | | $ | 33,575 | | | | 0.66 | % |
| | | | | | | | | | | | | | |
| | Total Preferred Stocks | | | | | | | | | | | | |
| | (Cost $197,500) | | | | | | | 33,575 | | | | 0.66 | % |
| | | | | | | | | | | | | | |
| | REITS – 1.93% | | | | | | | | | | | | |
| | Financials – 1.93% | | | | | | | | | | | | |
| | Apollo Commercial Real Estate Finance, Inc. | | | 6,000 | | | | 98,640 | | | | 1.93 | % |
| | | | | | | | | | | | | | |
| | Total REITS | | | | | | | | | | | | |
| | (Cost $98,615) | | | | | | | 98,640 | | | | 1.93 | % |
| | | | | | | | | | | | | | |
| | CORPORATE BONDS – 55.56% | | | | | | | | | | | | |
| | Consumer Discretionary – 3.81% | | | | | | | | | | | | |
| | YUM! Brands, Inc. | | | | | | | | | | | | |
| | 5.300%, 09/15/2019 | | | 175,000 | | | | 194,634 | | | | 3.81 | % |
| | | | | | | | | 194,634 | | | | 3.81 | % |
| | | | | | | | | | | | | | |
| | Financials – 37.73% | | | | | | | | | | | | |
| | Associated Banc-Corp | | | | | | | | | | | | |
| | 5.125%, 03/28/2016 | | | 250,000 | | | | 263,392 | | | | 5.16 | % |
| | Associates Corporation of North America | | | | | | | | | | | | |
| | 6.950%, 11/01/2018 | | | 175,000 | | | | 205,600 | | | | 4.03 | % |
| | Discover Financial Services | | | | | | | | | | | | |
| | 5.200%, 04/27/2022 | | | 175,000 | | | | 192,551 | | | | 3.77 | % |
| | Ford Motor Credit Co. LLC | | | | | | | | | | | | |
| | 3.000%, 06/12/2017 | | | 225,000 | | | | 232,132 | | | | 4.55 | % |
| | Lazard Group | | | | | | | | | | | | |
| | 6.850%, 06/15/2017 | | | 215,000 | | | | 242,341 | | | | 4.75 | % |
| | Manulife Financial Corp. (c) | | | | | | | | | | | | |
| | 3.400%, 09/17/2015 | | | 200,000 | | | | 204,938 | | | | 4.02 | % |
| | Prudential Financial, Inc. | | | | | | | | | | | | |
| | 5.500%, 03/15/2016 | | | 148,000 | | | | 157,253 | | | | 3.08 | % |
| | The Hartford Financial Services Group, Inc. | | | | | | | | | | | | |
| | 5.375%, 03/15/2017 | | | 200,000 | | | | 218,410 | | | | 4.28 | % |
| | The Royal Bank of Scotland PLC (c) | | | | | | | | | | | | |
| | 4.375%, 03/16/2016 | | | 200,000 | | | | 208,842 | | | | 4.09 | % |
| | | | | | | | | 1,925,459 | | | | 37.73 | % |
The accompanying notes are an integral part of these financial statements.
HENNESSY FUNDS 1-800-966-4354
| | CORPORATE BONDS | | Par | | | | | | % of | |
| | | | Amount | | | Value | | | Net Assets | |
| | Health Care – 5.74% | | | | | | | | | |
| | Agilent Technologies, Inc. | | | | | | | | | |
| | 5.000%, 07/15/2020 | | | 175,000 | | | $ | 191,683 | | | | 3.76 | % |
| | Celgene Corp. | | | | | | | | | | | | |
| | 3.625%, 05/15/2024 | | | 100,000 | | | | 101,263 | | | | 1.98 | % |
| | | | | | | | | 292,946 | | | | 5.74 | % |
| | | | | | | | | | | | | | |
| | Information Technology – 2.95% | | | | | | | | | | | | |
| | KLA-Tencor Corp. | | | | | | | | | | | | |
| | 6.900%, 05/01/2018 | | | 130,000 | | | | 150,632 | | | | 2.95 | % |
| | | | | | | | | 150,632 | | | | 2.95 | % |
| | | | | | | | | | | | | | |
| | Utilities – 5.33% | | | | | | | | | | | | |
| | Sempra Energy | | | | | | | | | | | | |
| | 6.500%, 06/01/2016 | | | 250,000 | | | | 271,928 | | | | 5.33 | % |
| | | | | | | | | 271,928 | | | | 5.33 | % |
| | | | | | | | | | | | | | |
| | Total Corporate Bonds | | | | | | | | | | | | |
| | (Cost $2,684,077) | | | | | | | 2,835,599 | | | | 55.56 | % |
| | | | | | | | | | | | | | |
| | MORTGAGE BACKED SECURITIES – 10.52% | | | | | | | | | | | | |
| | Federal National Mortgage Association | | | | | | | | | | | | |
| | 3.000%, 08/01/2042 | | | 310,534 | | | | 311,359 | | | | 6.10 | % |
| | 3.000%, 03/20/2028 | | | 225,000 | | | | 225,796 | | | | 4.42 | % |
| | | | | | | | | | | | | | |
| | Total Mortgage Backed Securities | | | | | | | | | | | | |
| | (Cost $544,027) | | | | | | | 537,155 | | | | 10.52 | % |
| | | | | | | | | | | | | | |
| | U.S. TREASURY OBLIGATIONS – 19.39% | | | | | | | | | | | | |
| | U.S. Treasury Bonds – 1.43% | | | | | | | | | | | | |
| | U.S. Treasury Bonds | | | | | | | | | | | | |
| | 6.250%, 08/15/2023 | | | 55,000 | | | | 72,759 | | | | 1.43 | % |
| | | | | | | | | | | | | | |
| | U.S. Treasury Notes – 17.96% | | | | | | | | | | | | |
| | U.S. Treasury Notes | | | | | | | | | | | | |
| | 2.500%, 08/15/2023 | | | 385,000 | | | | 392,941 | | | | 7.70 | % |
| | 2.750%, 02/15/2024 | | | 300,000 | | | | 311,601 | | | | 6.10 | % |
| | 3.250%, 03/31/2017 | | | 200,000 | | | | 212,141 | | | | 4.16 | % |
| | | | | | | | | 916,683 | | | | 17.96 | % |
| | | | | | | | | | | | | | |
| | Total U.S. Treasury Obligations | | | | | | | | | | | | |
| | (Cost $977,341) | | | | | | | 989,442 | | | | 19.39 | % |
The accompanying notes are an integral part of these financial statements.
| | INVESTMENT COMPANIES (EXCLUDING | | Number | | | | | | % of | |
| | MONEY MARKET FUNDS) – 9.17% | | of Shares | | | Value | | | Net Assets | |
| | iShares iBoxx $High Yield Corporation Bond Fund | | | 1,600 | | | $ | 148,048 | | | | 2.90 | % |
| | iShares S&P U.S. Preferred Stock Index Fund | | | 3,500 | | | | 139,125 | | | | 2.73 | % |
| | SPDR Barclays Short Term High Yield | | | 5,000 | | | | 149,750 | | | | 2.93 | % |
| | Wisdomtree Emerging Markets Local Debt Fund | | | 700 | | | | 31,297 | | | | 0.61 | % |
| | | | | | | | | 468,220 | | | | 9.17 | % |
| | Total Investment Companies (Excluding | | | | | | | | | | | | |
| | Money Market Funds) (Cost $474,053) | | | | | | | 468,220 | | | | 9.17 | % |
| | | | | | | | | | | | | | |
| | SHORT-TERM INVESTMENTS – 2.34% | | | | | | | | | | | | |
| | Money Market Funds – 2.34% | | | | | | | | | | | | |
| | Fidelity Government Portfolio – | | | | | | | | | | | | |
| | Institutional Class, 0.01% (b) | | | 119,450 | | | | 119,450 | | | | 2.34 | % |
| | | | | | | | | | | | | | |
| | Total Short-Term Investments | | | | | | | | | | | | |
| | (Cost $119,450) | | | | | | | 119,450 | | | | 2.34 | % |
| | | | | | | | | | | | | | |
| | Total Investments | | | | | | | | | | | | |
| | (Cost $5,095,063) – 99.57% | | | | | | | 5,082,081 | | | | 99.57 | % |
| | Other Assets in | | | | | | | | | | | | |
| | Excess of Liabilities – 0.43% | | | | | | | 21,778 | | | | 0.43 | % |
| | TOTAL NET ASSETS – 100.00% | | | | | | $ | 5,103,859 | | | | 100.00 | % |
Percentages are stated as a percent of net assets.
REIT – Real Estate Investment Trust
| | (a) | Non-income producing security. |
| | (b) | The rate listed is the fund’s 7-day yield as of October 31, 2014. |
| | (c) | U.S. traded security of a foreign corporation. |
The accompanying notes are an integral part of these financial statements.
HENNESSY FUNDS 1-800-966-4354
Summary of Fair Value Exposure at October 31, 2014
The following is a summary of the inputs used to value the Fund’s net assets as of October 31, 2014 (See Note 3 in the accompanying notes to the financial statements):
| Preferred Stocks | | Level 1 | | | Level 2 | | | Level 3 | | | Total | |
| Financials | | $ | 33,575 | | | $ | — | | | $ | — | | | $ | 33,575 | |
| Total Preferred Stocks | | $ | 33,575 | | | $ | — | | | $ | — | | | $ | 33,575 | |
| REITS | | | | | | | | | | | | | | | | |
| Financials | | $ | 98,640 | | | $ | — | | | $ | — | | | $ | 98,640 | |
| Total REITS | | $ | 98,640 | | | | — | | | $ | — | | | $ | 98,640 | |
| Corporate Bonds | | | | | | | | | | | | | | | | |
| Consumer Discretionary | | $ | — | | | $ | 194,634 | | | $ | — | | | $ | 194,634 | |
| Financials | | | — | | | | 1,925,459 | | | | — | | | | 1,925,459 | |
| Health Care | | | — | | | | 292,946 | | | | — | | | | 292,946 | |
| Information Technology | | | — | | | | 150,632 | | | | — | | | | 150,632 | |
| Utilities | | | — | | | | 271,928 | | | | — | | | | 271,928 | |
| Total Corporate Bonds | | $ | — | | | $ | 2,835,599 | | | $ | — | | | $ | 2,835,599 | |
| Mortgage Backed Securities | | $ | — | | | $ | 537,155 | | | $ | — | | | $ | 537,155 | |
| U.S. Treasury Obligations | | | | | | | | | | | | | | | | |
| U.S. Treasury Bonds | | $ | — | | | $ | 72,759 | | | $ | — | | | $ | 72,759 | |
| U.S. Treasury Notes | | | — | | | | 916,683 | | | | — | | | | 916,683 | |
| Total U.S. Treasury Obligations | | $ | — | | | $ | 989,442 | | | $ | — | | | $ | 989,442 | |
| Investment Companies (Excluding | | | | | | | | | | | | | | | | |
| Money Market Funds) | | $ | 468,220 | | | $ | — | | | $ | — | | | $ | 468,220 | |
| Short-Term Investments | | | | | | | | | | | | | | | | |
| Money Market Funds | | $ | 119,450 | | | $ | — | | | $ | — | | | $ | 119,450 | |
| Total Short-Term Investments | | $ | 119,450 | | | $ | — | | | $ | — | | | $ | 119,450 | |
| Total Investments | | $ | 719,885 | | | $ | 4,362,196 | | | $ | — | | | $ | 5,082,081 | |
Transfers between levels are recognized at the end of the reporting period. During the twelve-month period ended October 31, 2014, the Fund recognized no transfers between levels.
The accompanying notes are an integral part of these financial statements.
Financial Statements
Statement of Assets and Liabilities as of October 31, 2014 |
| ASSETS: | | | |
| Investments in securities, at value (cost $5,095,063) | | $ | 5,082,081 | |
| Cash | | | 126 | |
| Dividends and interest receivable | | | 43,189 | |
| Receivable for fund shares sold | | | 124 | |
| Prepaid expenses and other assets | | | 13,393 | |
| Due from Advisor | | | 2,896 | |
| Total Assets | | | 5,141,809 | |
| | | | | |
| LIABILITIES: | | | | |
| Payable for fund shares redeemed | | | 1,039 | |
| Payable to administrator | | | 937 | |
| Payable to auditor | | | 19,103 | |
| Accrued distribution fees | | | 3,809 | |
| Distribution payable | | | 530 | |
| Accrued trustees fees | | | 2,319 | |
| Accrued expenses and other payables | | | 10,213 | |
| Total Liabilities | | | 37,950 | |
| NET ASSETS | | $ | 5,103,859 | |
| | | | | |
| NET ASSETS CONSIST OF: | | | | |
| Capital stock | | $ | 5,048,982 | |
| Accumulated net investment loss | | | — | |
| Accumulated net realized gain on investments | | | 67,859 | |
| Unrealized net depreciation on investments | | | (12,982 | ) |
| Total Net Assets | | $ | 5,103,859 | |
| | | | | |
| NET ASSETS | | | | |
| Investor Class: | | | | |
| Shares authorized (no par value) | | Unlimited | |
| Net assets applicable to outstanding Investor Class shares | | $ | 2,816,575 | |
| Shares issued and outstanding | | | 370,189 | |
| Net asset value, offering price and redemption price per share | | $ | 7.61 | |
| | | | | |
| Institutional Class: | | | | |
| Shares authorized (no par value) | | Unlimited | |
| Net assets applicable to outstanding Institutional Class shares | | $ | 2,287,284 | |
| Shares issued and outstanding | | | 341,733 | |
| Net asset value, offering price and redemption price per share | | $ | 6.69 | |
The accompanying notes are an integral part of these financial statements.
HENNESSY FUNDS 1-800-966-4354
Financial Statements
Statement of Operations for the year ended October 31, 2014 |
| INVESTMENT INCOME: | | | |
| Dividend income | | $ | 34,319 | |
| Interest income | | | 176,495 | |
| Total investment income | | | 210,814 | |
| | | | | |
| EXPENSES: | | | | |
| Investment advisory fees (See Note 5) | | | 46,991 | |
| Federal and state registration fees | | | 34,353 | |
| Compliance expense | | | 21,488 | |
| Audit fees | | | 19,100 | |
| Trustees’ fees and expenses | | | 8,415 | |
| Distribution fees – Investor Class (See Note 5) | | | 7,462 | |
| Reports to shareholders | | | 5,607 | |
| Administration, fund accounting, custody and transfer agent fees | | | 5,171 | |
| Legal fees | | | 2,070 | |
| Sub-transfer agent expenses – Investor Class (See Note 5) | | | 1,939 | |
| Sub-transfer agent expenses – Institutional Class (See Note 5) | | | 107 | |
| Other expenses | | | 5,396 | |
| Total expenses before reimbursement by advisor | | | 158,099 | |
| Expense reimbursement by advisor – Investor Class (See Note 5) | | | (46,263 | ) |
| Expense reimbursement by advisor – Institutional Class (See Note 5) | | | (42,715 | ) |
| Net expenses | | | 69,121 | |
| NET INVESTMENT INCOME | | $ | 141,693 | |
| | | | | |
| REALIZED AND UNREALIZED GAINS (LOSSES): | | | | |
| Net realized gain on investments | | $ | 70,699 | |
| Net change in unrealized depreciation on investments | | | (120,967 | ) |
| Net loss on investments | | | (50,268 | ) |
| NET INCREASE IN NET ASSETS RESULTING FROM OPERATIONS | | $ | 91,425 | |
The accompanying notes are an integral part of these financial statements.
(This Page Intentionally Left Blank.)
HENNESSY FUNDS 1-800-966-4354
Financial Statements
| Statements of Changes in Net Assets |
| | | Year Ended | | | Year Ended | |
| | | October 31, 2014 | | | October 31, 2013 | |
| OPERATIONS: | | | | | | |
| Net investment income | | $ | 141,693 | | | $ | 451,243 | |
| Net realized gain on investments | | | 70,699 | | | | 1,390,074 | |
| Net change in unrealized depreciation on investments | | | (120,967 | ) | | | (1,718,510 | ) |
| Net increase in net assets resulting from operations | | | 91,425 | | | | 122,807 | |
| | | | | | | | | |
| DISTRIBUTIONS TO SHAREHOLDERS FROM: | | | | | | | | |
| Net investment income | | | | | | | | |
| Investor Class | | | (67,126 | ) | | | (103,816 | ) |
| Institutional Class | | | (76,008 | ) | | | (365,266 | ) |
| Net realized gains | | | | | | | | |
| Investor Class | | | (629,457 | ) | | | (74,517 | ) |
| Institutional Class | | | (734,790 | ) | | | (670,866 | ) |
| Total distributions | | | (1,507,381 | ) | | | (1,214,465 | ) |
| | | | | | | | | |
| CAPITAL SHARE TRANSACTIONS: | | | | | | | | |
| Proceeds from shares subscribed – Investor Class | | | 1,440,996 | | | | 2,098,731 | |
| Proceeds from shares subscribed – Institutional Class | | | 179,145 | | | | 1,200,715 | |
| Dividends reinvested – Investor Class | | | 616,160 | | | | 157,601 | |
| Dividends reinvested – Institutional Class | | | 796,120 | | | | 1,033,843 | |
| Cost of shares redeemed – Investor Class | | | (1,605,535 | ) | | | (2,623,814 | ) |
| Cost of shares redeemed – Institutional Class | | | (1,311,742 | ) | | | (31,279,649 | )(1) |
| Net increase (decrease) in net assets derived | | | | | | | | |
| from capital share transactions | | | 115,144 | | | | (29,412,573 | ) |
| TOTAL DECREASE IN NET ASSETS | | | (1,300,812 | ) | | | (30,504,231 | ) |
| | | | | | | | | |
| NET ASSETS: | | | | | | | | |
| Beginning of year | | | 6,404,671 | | | | 36,908,902 | |
| End of year | | $ | 5,103,859 | | | $ | 6,404,671 | |
| Undistributed net investment loss, end of year | | $ | — | | | $ | — | |
| (1) | Net of redemption fees of $26 related to redemption fees imposed by the FBR Core Bond Fund during a prior year but not received until fiscal year 2013. |
| Statements of Changes in Net Assets – Continued |
| | | Year Ended | | | Year Ended | |
| | | October 31, 2014 | | | October 31, 2013 | |
| CHANGES IN SHARES OUTSTANDING: | | | | | | |
| Shares sold – Investor Class | | | 181,144 | | | | 213,393 | |
| Shares sold – Institutional Class | | | 25,191 | | | | 135,965 | |
| Shares issued to holders as | | | | | | | | |
| reinvestment of dividends – Investor Class | | | 80,291 | | | | 16,225 | |
| Shares issued to holders as | | | | | | | | |
| reinvestment of dividends – Institutional Class | | | 117,695 | | | | 116,531 | |
| Shares redeemed – Investor Class | | | (207,447 | ) | | | (271,391 | ) |
| Shares redeemed – Institutional Class | | | (192,135 | ) | | | (3,540,601 | ) |
| Net increase (decrease) in shares outstanding | | | 4,739 | | | | (3,329,878 | ) |
The accompanying notes are an integral part of these financial statements.
HENNESSY FUNDS 1-800-966-4354
Financial Statements
For an Investor Class share outstanding throughout each period
PER SHARE DATA:
Net asset value, beginning of period
Income from investment operations:
Net investment income
Net realized and unrealized gains (losses) on investments
Total from investment operations
Less distributions:
Dividends from net investment income
Dividends from net realized gains
Total distributions
Paid-in capital from redemption fees
Net asset value, end of period
TOTAL RETURN
SUPPLEMENTAL DATA AND RATIOS:
Net assets, end of period (millions)
Ratio of expenses to average net assets:
Before expense reimbursement
After expense reimbursement
Ratio of net investment income to average net assets:
Before expense reimbursement
After expense reimbursement
Portfolio turnover rate(6)
| (1) | For the seven-month period ended October 31, 2010. Effective October 31, 2010, the Fund changed its fiscal year end from March 31 to October 31. |
| (2) | Calculated based on average shares outstanding method. |
| (3) | Amount is less than $0.01. |
| (4) | Not annualized. |
| (5) | Annualized. |
| (6) | Portfolio turnover is calculated on the basis of the Fund as a whole. |
The accompanying notes are an integral part of these financial statements.
| | | | | | | | | | | | | For the Period | | | For the Year | |
| | | | | | | | | | | | | April 1, 2010 | | | Ended | |
| For the Year Ended October 31, | | | to October 31, | | | March, 31 | |
| 2014 | | | 2013 | | | 2012 | | | 2011 | | | 2010(1) | | | 2010 | |
| | | | | | | | | | | | | | | | | |
| $ | 9.56 | | | $ | 9.97 | | | $ | 9.56 | | | $ | 9.82 | | | $ | 9.39 | | | $ | 8.75 | |
| | | | | | | | | | | | | | | | | | | | | | | |
| | | | | | | | | | | | | | | | | | | | | | | |
| | 0.17 | | | | 0.27 | | | | 0.28 | | | | 0.35 | (2) | | | 0.23 | (2) | | | 0.38 | (2) |
| | (0.06 | ) | | | (0.23 | ) | | | 0.41 | | | | (0.14 | ) | | | 0.42 | | | | 0.69 | |
| | 0.11 | | | | 0.04 | | | | 0.69 | | | | 0.21 | | | | 0.65 | | | | 1.07 | |
| | | | | | | | | | | | | | | | | | | | | | | |
| | | | | | | | | | | | | | | | | | | | | | | |
| | (0.18 | ) | | | (0.27 | ) | | | (0.20 | ) | | | (0.32 | ) | | | (0.22 | ) | | | (0.38 | ) |
| | (1.88 | ) | | | (0.18 | ) | | | (0.08 | ) | | | (0.15 | ) | | | — | | | | (0.05 | ) |
| | (2.06 | ) | | | (0.45 | ) | | | (0.28 | ) | | | (0.47 | ) | | | (0.22 | ) | | | (0.43 | ) |
| | — | | | | — | | | | 0.00 | (3) | | | 0.00 | (3) | | | 0.00 | (3) | | | 0.00 | (3) |
| $ | 7.61 | | | $ | 9.56 | | | $ | 9.97 | | | $ | 9.56 | | | $ | 9.82 | | | $ | 9.39 | |
| | | | | | | | | | | | | | | | | | | | | | | |
| | 1.41 | % | | | 0.41 | % | | | 7.38 | % | | | 2.35 | % | | | 6.98 | %(4) | | | 12.33 | % |
| | | | | | | | | | | | | | | | | | | | | | | |
| | | | | | | | | | | | | | | | | | | | | | | |
| $ | 2.82 | | | $ | 3.02 | | | $ | 3.57 | | | $ | 4.05 | | | $ | 4.45 | | | $ | 4.62 | |
| | | | | | | | | �� | | | | | | | | | | | | | | |
| | 2.85 | % | | | 2.26 | % | | | 2.12 | % | | | 2.38 | % | | | 2.10 | %(5) | | | 1.93 | % |
| | 1.30 | % | | | 1.30 | % | | | 1.30 | % | | | 1.30 | % | | | 1.30 | %(5) | | | 1.31 | % |
| | | | | | | | | | | | | | | | | | | | | | | |
| | 0.74 | % | | | 1.70 | % | | | 2.01 | % | | | 2.58 | % | | | 3.37 | %(5) | | | 3.49 | % |
| | 2.29 | % | | | 2.66 | % | | | 2.83 | % | | | 3.66 | % | | | 4.17 | %(5) | | | 4.11 | % |
| | 54 | % | | | 74 | % | | | 75 | % | | | 57 | % | | | 46 | %(4) | | | 28 | % |
The accompanying notes are an integral part of these financial statements.
HENNESSY FUNDS 1-800-966-4354
Financial Statements
For an Institutional Class share outstanding throughout each period
PER SHARE DATA:
Net asset value, beginning of period
Income from investment operations:
Net investment income
Net realized and unrealized gains (losses) on investments
Total from investment operations
Less distributions:
Dividends from net investment income
Dividends from net realized gains
Total distributions
Paid-in capital from redemption fees
Net asset value, end of period
TOTAL RETURN
SUPPLEMENTAL DATA AND RATIOS:
Net assets, end of period (millions)
Ratio of expenses to average net assets:
Before expense reimbursement
After expense reimbursement
Ratio of net investment income to average net assets:
Before expense reimbursement
After expense reimbursement
Portfolio turnover rate(6)
| (1) | For the seven-month period ended October 31, 2010. Effective October 31, 2010, the Fund changed its fiscal year end from March 31 to October 31. |
| (2) | Calculated based on average shares outstanding method. |
| (3) | Amount is less than $0.01. |
| (4) | Not annualized. |
| (5) | Annualized. |
| (6) | Portfolio turnover is calculated on the basis of the Fund as a whole. |
The accompanying notes are an integral part of these financial statements.
| | | | | | | | | | | | | For the Period | | | For the Year | |
| | | | | | | | | | | | | April 1, 2010 | | | Ended | |
| For the Year Ended October 31, | | | to October 31, | | | March 31, | |
| 2014 | | | 2013 | | | 2012 | | | 2011 | | | 2010(1) | | | 2010 | |
| | | | | | | | | | | | | | | | | |
| $ | 8.65 | | | $ | 9.06 | | | $ | 8.77 | | | $ | 9.05 | | | $ | 8.67 | | | $ | 8.11 | |
| | | | | | | | | | | | | | | | | | | | | | | |
| | | | | | | | | | | | | | | | | | | | | | | |
| | 0.16 | | | | 0.19 | | | | 0.27 | | | | 0.34 | (2) | | | 0.23 | (2) | | | 0.37 | (2) |
| | (0.06 | ) | | | (0.13 | ) | | | 0.38 | | | | (0.12 | ) | | | 0.38 | | | | 0.64 | |
| | 0.10 | | | | 0.06 | | | | 0.65 | | | | 0.22 | | | | 0.61 | | | | 1.01 | |
| | | | | | | | | | | | | | | | | | | | | | | |
| | | | | | | | | | | | | | | | | | | | | | | |
| | (0.18 | ) | | | (0.29 | ) | | | (0.28 | ) | | | (0.35 | ) | | | (0.23 | ) | | | (0.40 | ) |
| | (1.88 | ) | | | (0.18 | ) | | | (0.08 | ) | | | (0.15 | ) | | | — | | | | (0.05 | ) |
| | (2.06 | ) | | | (0.47 | ) | | | (0.36 | ) | | | (0.50 | ) | | | (0.23 | ) | | | (0.45 | ) |
| | — | | | | 0.00 | (3) | | | 0.00 | (3) | | | 0.00 | (3) | | | 0.00 | (3) | | | 0.00 | (3) |
| $ | 6.69 | | | $ | 8.65 | | | $ | 9.06 | | | $ | 8.77 | | | $ | 9.05 | | | $ | 8.67 | |
| | | | | | | | | | | | | | | | | | | | | | | |
| | 1.53 | % | | | 0.69 | % | | | 7.63 | % | | | 2.62 | % | | | 7.15 | %(4) | | | 12.62 | % |
| | | | | | | | | | | | | | | | | | | | | | | |
| | | | | | | | | | | | | | | | | | | | | | | |
| $ | 2.29 | | | $ | 3.38 | | | $ | 33.34 | | | $ | 23.25 | | | $ | 24.25 | | | $ | 23.89 | |
| | | | | | | | | | | | | | | | | | | | | | | |
| | 2.53 | % | | | 1.67 | % | | | 1.31 | % | | | 1.43 | % | | | 1.47 | %(5) | | | 1.69 | % |
| | 1.05 | % | | | 1.05 | % | | | 1.05 | % | | | 1.05 | % | | | 1.05 | %(5) | | | 1.06 | % |
| | | | | | | | | | | | | | | | | | | | | | | |
| | 1.06 | % | | | 2.28 | % | | | 2.74 | % | | | 3.54 | % | | | 4.00 | %(5) | | | 3.74 | % |
| | 2.54 | % | | | 2.90 | % | | | 3.00 | % | | | 3.92 | % | | | 4.41 | %(5) | | | 4.37 | % |
| | 54 | % | | | 74 | % | | | 75 | % | | | 57 | % | | | 46 | %(4) | | | 28 | % |
The accompanying notes are an integral part of these financial statements.
HENNESSY FUNDS 1-800-966-4354
Financial Statements
Notes to Financial Statements October 31, 2014 |
1). ORGANIZATION
The Hennessy Core Bond Fund (the “Fund”) is a series of Hennessy Funds Trust (the “Trust”), which was organized as a Delaware statutory trust on September 17, 1992. The Fund is an open-end management investment company registered under the Investment Company Act of 1940, as amended. The Fund is a successor to the FBR Core Bond Fund (the “Predecessor FBR Fund”), a series of The FBR Funds, a Delaware statutory trust, pursuant to a reorganization that took place after the close of business on October 26, 2012. Prior to October 26, 2012, the Fund had no investment operations. As a result of the reorganization, holders of the Investor Class shares of the Predecessor FBR Fund received Investor Class shares of the Fund (the Investor Class shares of the Fund are the successor to the accounting and performance information of the Predecessor FBR Fund), and holders of the Institutional Class shares of the Predecessor FBR Fund received Institutional Class shares of the Fund (the Institutional Class shares of the Fund are the successor to the accounting and performance information of the Predecessor FBR Fund). The investment objective of the Fund is current income with capital growth as a secondary objective. The Fund is a diversified fund.
The Fund offers Investor Class and Institutional Class shares. Each class of shares differs principally in its respective administration, 12b-1 distribution and service fees, shareholder servicing, and transfer agent expenses and sales charges, if any. Each class has identical rights to earnings, assets, and voting privileges, except for class-specific expenses and exclusive rights to vote on matters affecting only an individual class.
2). SIGNIFICANT ACCOUNTING POLICIES
The following is a summary of significant accounting policies consistently followed by the Fund in the preparation of the financial statements. These policies are in conformity with U.S. generally accepted accounting principles (“GAAP”).
| a). | Investment Valuation – All investments in securities are recorded at their estimated fair value, as described in Note 3. |
| | |
| b). | Federal Income Taxes – Provision for federal income taxes or excise taxes has not been made since the Fund has elected to be taxed as a “regulated investment company” and intends to distribute substantially all of its taxable income to its shareholders and otherwise comply with the provisions of the Internal Revenue Code of 1986, as amended, applicable to regulated investment companies. Net investment income or loss and realized gains and losses for federal income tax purposes may differ from that reported on the financial statements because of temporary book and tax basis differences. Temporary differences are primarily the result of the treatment of wash sales for tax reporting purposes. Distributions from net realized gains for book purposes may include short-term capital gains, which are included as ordinary income to shareholders for tax purposes. |
| | |
| | Due to inherent differences in the recognition of income, expenses, and realized gains/losses under GAAP and federal income tax regulations, permanent differences between book and tax basis reporting for the 2014 fiscal year have been identified |
| | and appropriately reclassified on the Statement of Assets and Liabilities. The adjustments are as follow: |
| Undistributed | Accumulated | |
| Net Investment | Net Realized | |
| Income/(Loss) | Gain/(Loss) | Paid-in Capital |
| $1,441 | $(2,174) | $733 |
| c). | Income and Expenses – Dividend income is recognized on the ex-dividend date or as soon as information is available to the Fund. Interest income, which includes the amortization of premium and accretion of discount, is recognized on an accrual basis. The Fund is charged for those expenses that are directly attributable to the portfolio, such as advisory, administration, and certain shareholder service fees. Income, expenses (other than expenses attributable to a specific class), and realized and unrealized gains or losses on investments are allocated to each class of shares based on its respective net assets. |
| | |
| d). | Distributions to Shareholders – Dividends from net investment income for the Fund, if any, are declared and paid out monthly. Distributions of net realized capital gains, if any, are declared and paid annually, usually in November or December. |
| | |
| e). | Security Transactions – Investment and shareholder transactions are recorded on the trade date. The Fund determines the gain or loss realized from the investment transactions by comparing the original cost of the security lot sold with the net sale proceeds. Discounts and premiums on securities purchased are accreted/amortized over the life of the respective security. |
| | |
| f). | Use of Estimates – The preparation of financial statements in conformity with GAAP requires management to make estimates and assumptions that affect the reported amounts of assets and liabilities and disclosure of contingent assets and liabilities at the date of the financial statements and the reported change in net assets during the reporting period. Actual results could differ from those estimates. |
| | |
| g). | Share Valuation – The net asset value (“NAV”) per share of the Fund is calculated by dividing the sum of the value of the securities held by the Fund, plus cash or other assets, minus all liabilities (including estimated accrued expenses) by the total number of shares outstanding for the Fund, rounded to the nearest cent. The Fund’s shares will not be priced on days the New York Stock Exchange is closed for trading. The offering and redemption price per share for the Fund is equal to the Fund’s NAV per share. |
| | |
| h). | Foreign Currency – Values of investments denominated in foreign currencies are converted into U.S. dollars using the spot market rate of exchange at the time of valuation. Purchases and sales of investments and income are translated into U.S. dollars using the spot market rate of exchange prevailing on the respective dates of such transactions. The Fund does not isolate the portion of the results of operations resulting from fluctuations in foreign exchange rates on investments from fluctuations resulting from changes in the market prices of securities held. Such fluctuations are included with the net realized and unrealized gain or loss on investments. Foreign investments present additional risks due to currency fluctuations, economic and political factors, lower liquidity, government regulations, differences in accounting standards, and other factors. |
| | |
| i). | Forward Contracts – The Fund may enter into forward currency contracts to reduce its exposure to changes in foreign currency exchange rates on its foreign holdings and to lock in the U.S. dollar cost of firm purchase and sale commitments for |
HENNESSY FUNDS 1-800-966-4354
| | securities denominated in foreign currencies. A forward currency contract is a commitment to purchase or sell a foreign currency at a future date at a negotiated forward rate. The gain or loss arising from the difference between the U.S. dollar cost of the original contract and the value of the foreign currency in U.S. dollars upon closing of such contract is included in net realized gain or loss from foreign currency transactions. During the fiscal year ended October 31, 2014, the Fund did not enter into any forward contracts. |
| | |
| j). | Repurchase Agreements – The Fund may enter into repurchase agreements with member banks or security dealers of the Federal Reserve Board whom the investment advisor deems creditworthy. The repurchase price generally equals the price paid by the Fund plus interest negotiated on the basis of current short-term rates. |
| | |
| | Securities pledged as collateral for repurchase agreements are held by the custodian bank until the respective agreements mature. Provisions of the repurchase agreements ensure that the market value of the collateral, including accrued interest thereon, is sufficient to cover the repurchase amount in the event of default of the counterparty. If the counterparty defaults and the value of the collateral declines or if the counterparty enters an insolvency proceeding, realization of the collateral by the Fund may be delayed or limited. |
| | |
| k). | Accounting for Uncertainty in Income Taxes – The Fund has adopted accounting policies regarding recognition and measurement of tax positions taken or expected to be taken on a tax return. The tax returns of the Fund for the prior three fiscal years are open for examination. The Fund has reviewed all open tax years in major jurisdictions and concluded that there is no impact on the Fund’s net assets and no tax liability resulting from unrecognized tax benefits relating to uncertain income tax positions taken or expected to be taken on a tax return. The Fund’s major tax jurisdictions are U.S. federal and Delaware. |
| | |
| l). | Derivatives – The Fund may invest in, or enter into, derivatives, such as options, futures contracts, options on futures contracts, and swaps, for a variety of reasons, including to hedge certain risks, to provide a substitute for purchasing or selling particular securities, or to increase potential income gain. Derivatives may provide a cheaper, quicker, or more specifically focused way for a Fund to invest than “traditional” securities would. The main purpose of utilizing these derivative instruments is for hedging purposes. |
| | |
| | The Fund has adopted the financial accounting reporting rules as required by the Derivatives and Hedging Topic of the Financial Accounting Standards Board Accounting Standards Codification. Under such rules, the Fund is required to include enhanced disclosure that enables investors to understand how and why an entity uses derivatives, how derivatives are accounted for, and how derivatives instruments affect an entity’s results of operations and financial position. During the fiscal year ended October 31, 2014, the Fund did not hold any derivative instruments. |
| m). | Events Subsequent to the Fiscal Period End – The Fund has adopted financial reporting rules regarding subsequent events that require an entity to recognize in the financial statements the effects of all subsequent events that provide additional evidence about conditions that existed at the date of the balance sheet. Management has evaluated the Fund’s related events and transactions that occurred subsequent to October 31, 2014 through the date of issuance of the Fund’s financial statements. There were no events or transactions that occurred during this period that materially impacted the amounts or disclosures in the Fund’s financial statements. |
3). SECURITIES VALUATION
The Fund has adopted authoritative fair valuation accounting standards that establish an authoritative definition of fair value and set out a hierarchy for measuring fair value. These standards require additional disclosures about the various inputs and valuation techniques used to develop the measurements of fair value and a discussion in changes in valuation techniques and related inputs during the period. These inputs are summarized in the three broad levels listed below:
| | Level 1 – | Quoted unadjusted prices for identical instruments in active markets to which the Fund has access at the date of measurement. |
| | | |
| | Level 2 – | Quoted prices for similar instruments in active markets; quoted prices for identical or similar instruments in markets that are not active; and model-derived valuations in which all significant inputs and significant value drivers are observable in active markets. Level 2 inputs are those in markets for which there are few transactions, the prices are not current, the prices are fair value adjusted due to post-market close subsequent events (foreign markets), little public information exists, or instances where prices vary substantially over time or among brokered market makers. These inputs may also include interest rates, prepayment speeds, credit risk curves, default rates, and similar data. |
| | | |
| | Level 3 – | Model-derived valuations in which one or more significant inputs or significant value drivers are unobservable. Unobservable inputs are those inputs that reflect the Fund’s own assumptions about what market participants would use to price the asset or liability based on the best available information. |
Following is a description of the valuation techniques applied to the Fund’s major categories of assets and liabilities measured at fair value on a recurring basis.
Equity Securities – Equity securities, including common stocks, preferred stocks, foreign issued common stocks, exchange traded funds, closed-end mutual funds, and real estate investment trusts, that are traded on a securities exchange for which a last-quoted sales price is readily available will generally be valued at the last sales price as reported by the primary exchange on which the securities are listed. Securities listed on The NASDAQ Stock Market (“NASDAQ”) will be valued at the NASDAQ Official Closing Price, which may differ from the last sales price reported. Securities traded on a securities exchange for which a last-quoted sales price is not readily available will generally be valued at the mean between the bid and ask prices. To the extent these securities are actively traded and valuation adjustments are not applied, they are classified in Level 1 of the fair value hierarchy.
Investment Companies – Investments in investment companies (e.g., mutual funds and exchange traded funds) are generally priced at the ending NAV provided by the Fund’s service agent and will be classified in Level 1 of the fair value hierarchy.
Debt Securities – Debt securities, including corporate bonds, asset-backed securities, mortgage-backed securities, municipal bonds, U.S. Treasuries, and U.S. government agency issues, are valued at market on the basis of valuations furnished by an independent pricing service that utilizes both dealer-supplied valuations and formula-based techniques. The pricing service may consider recently executed transactions in securities of the issuer or comparable issuers, market price quotations (where observable), bond spreads, and fundamental data relating to the issuer. In addition, the model may incorporate market observable data such as reported sales of similar securities, broker
HENNESSY FUNDS 1-800-966-4354
quotes, yields, bids, offers, and reference data. Certain securities are valued principally using dealer quotations. These securities are generally classified in Level 2 of the fair value hierarchy.
Short-Term Securities – Short-term equity investments, including money market funds, are valued in the manner specified above. Short-term debt investments are generally valued at amortized cost, which approximates fair market value, if their original maturity was 60 days or less, or by amortizing the values as of the 61st day prior to maturity, if their original term to maturity exceeded 60 days. Amortized cost is not used if its use would be inappropriate due to credit or other impairments of the issuer, in which the security would be fair valued, as described below. Short-term securities are generally classified in Level 1 or Level 2 of the fair market hierarchy depending on the inputs used and market activity levels for specific securities.
The Board of Trustees of the Fund (the “Board”) has adopted fair value pricing procedures that are followed when a price for a security is not readily available or if a significant event has occurred that indicates the closing price of a security no longer represents the true value of that security. Fair value pricing determinations are made in good faith in accordance with these procedures. There are numerous criteria that will be given consideration in determining a fair value of a security. Some of these criteria are trading volume of security and markets, the value of other like securities, and news events with direct bearing to security or market. Fair value pricing results in an estimated price for a security that reflects the amount the Fund might reasonably expect to receive in a current sale. Depending on the relative significance of the valuation inputs, these securities may be classified in either Level 2 or Level 3 of the fair value hierarchy.
Fair valuing of foreign securities may be determined with the assistance of a pricing service using correlations between the movement of prices of such securities and indices of domestic securities and other appropriate indicators, such as closing market prices of relevant American Depositary Receipts or futures contracts. The effect of using fair value pricing is that the Fund’s NAV will reflect the affected portfolio securities’ value as determined in the judgment of the Board or its designee instead of being determined by the market. Using a fair value pricing methodology to price foreign securities may result in a value that is different from a foreign security’s most recent closing price and from the prices used by other investment companies to calculate their NAVs and are generally considered Level 2 prices in the fair valuation hierarchy. Because the Fund may invest in foreign securities, the value of the Fund’s portfolio securities may change on days when you will not be able to purchase or redeem your shares.
The Board has delegated day-to-day valuation matters to a Valuation Committee comprised of one or more representatives from Hennessy Advisors, Inc., the Fund’s investment advisor. The function of the Valuation Committee is to value securities where current and reliable market quotations are not readily available. All actions taken by the Valuation Committee are reviewed by the Board.
The Fund has performed an analysis of all existing investments to determine the significance and character of all inputs to their fair value determination. Various inputs are used in determining the value of the Fund’s investments. The inputs or methodology used for valuing securities are not necessarily an indication of the risk associated with investing in those securities. Details related to the fair valuation hierarchy of the Fund’s securities as of October 31, 2014 are included in the Fund’s Schedule of Investments.
4). INVESTMENT TRANSACTIONS
Purchases and sales of investment securities (excluding government and short-term investments) for the Fund during the fiscal year ended October 31, 2014 were $1,352,457 and $3,194,924, respectively.
Purchases and sales/maturities of long-term U.S. Government Securities for the Fund during the fiscal year ended October 31, 2014 were $1,679,135 and $1,020,132, respectively.
5). INVESTMENT MANAGEMENT FEE AND OTHER TRANSACTIONS WITH AFFILIATES
Hennessy Advisors, Inc. (the “Advisor”) is the investment advisor of the Fund. The Advisor provides the Fund with investment management services under an Investment Advisory Agreement. The Advisor furnishes all investment advice, office space, facilities, and provides most of the personnel needed by the Fund. As compensation for its services, the Advisor is entitled to a monthly fee from the Fund. The fee is based upon the average daily net assets of the Fund at the annual rate of 0.80%.
The Advisor has delegated the day-to-day management of the Fund to a sub-advisor, Financial Counselors, Inc. The Advisor pays the sub-advisor fees for the Fund from its own assets and these fees are not an additional expense of the Fund.
The Advisor has contractually agreed to limit the total annual operating expenses of the Fund (excluding interest, taxes, brokerage commissions, dividend expenses, 12b-1 fees, acquired fund fees and expenses, extraordinary legal expenses, or any other extraordinary expenses) to 1.05% of the Fund’s net assets for both the Investor Class shares and Institutional Class shares of the Fund through February 28, 2015. The net expense reimbursement receivable for the Fund as of October 31, 2014 was $2,896.
For a period of three years after the year in which the Advisor waives or reimburses expenses, the Advisor may seek reimbursement from the Fund to the extent that total annual fund operating expenses are less than the expense limitation in effect at the time of the reimbursement. The Advisor waived or reimbursed expenses of $88,978 for the Fund during the fiscal year ended October 31, 2014. As of October 31, 2014, cumulative expenses subject to potential recovery to the aforementioned conditions and year of expiration are as follow:
| | | | October 31, 2015 | | | October 31, 2016 | | | October 31, 2017 | | | Total | |
| | Investor Class | | $ | 755 | | | $ | 36,603 | | | $ | 46,263 | | | $ | 83,621 | |
| | Institutional Class | | $ | 4 | | | $ | 74,877 | | | $ | 42,715 | | | $ | 117,596 | |
The Fund has adopted a plan pursuant to Rule 12b-1 under the Investment Company Act of 1940, as amended, that authorizes payments in connection with the distribution of the Fund’s shares at an annual rate of up to 0.25% of the Fund’s average daily net assets attributable to Investor Class shares. Amounts paid under the plan may be spent on any activities or expenses primarily intended to result in the sale of shares, including but not limited to, advertising, compensation for sales and marketing activities or financial institutions and others such as dealers and distributors, shareholder account servicing, the printing and mailing of prospectuses to other than current shareowners, and the printing and mailing of sales literature.
The Fund has entered into agreements with various brokers, dealers, and financial intermediaries in connection with the sale of shares of the Fund. The agreements provide for periodic payments by the Fund to the brokers, dealers, and financial intermediaries for providing certain shareholder maintenance services (sub-transfer agent expenses). These shareholder services include the pre-processing and quality control of new accounts, shareholder correspondence, answering customer inquiries regarding account status, and
HENNESSY FUNDS 1-800-966-4354
facilitating shareholder telephone transactions. Fees paid by the Fund to various brokers, dealers, and financial intermediaries for the fiscal year ended October 31, 2014 were $2,046.
U.S. Bancorp Fund Services, LLC (“USBFS”) provides the Fund with administrative, fund accounting, and transfer agent services, including all regulatory reporting, and necessary office equipment and personnel. As administrator, USBFS prepares various federal and state regulatory filings, reports, and returns for the Fund; prepares reports and materials to be supplied to the Board; monitors the activities of the Fund’s custodian, transfer agent, and accountants; and coordinates the preparation and payment of the Fund’s expenses and reviews the Fund’s expense accruals. Fees paid to USBFS for the fiscal year ended October 31, 2014 were $5,171.
U.S. Bank, N.A., an affiliate of USBFS, serves as the Fund’s custodian. Quasar Distributors, LLC acts as the Fund’s principal underwriter in a continuous public offering of the Fund’s shares. Quasar Distributors, LLC is an affiliate of USBFS and U.S. Bank, N.A.
6). LINE OF CREDIT
The Fund has a line of credit with the other funds in the Hennessy Funds family of funds (the “Hennessy Funds”) in the amount of the lesser of (i) $100,000,000 or (ii) 33.33% of each Hennessy Fund’s net assets, or 30% for the Hennessy Gas Utility Index Fund and 10% for the Hennessy Balanced Fund, intended to provide short-term financing, if necessary, subject to certain restrictions, in connection with shareholder redemptions. The credit facility is with the Hennessy Funds’ custodian bank, U.S. Bank, N.A. Borrowings under this arrangement bear interest at the bank’s prime rate. During the fiscal year ended October 31, 2014, the Fund did not have any borrowings outstanding under the line of credit.
7). FEDERAL TAX INFORMATION
As of October 31, 2014, the components of accumulated earnings (losses) for income tax purposes for the Fund were as follow:
| | Cost of investments for tax purposes | | $ | 5,095,406 | |
| | Gross tax unrealized appreciation | | $ | 171,037 | |
| | Gross tax unrealized depreciation | | | (184,362 | ) |
| | Net tax unrealized depreciation | | $ | (13,325 | ) |
| | Undistributed ordinary income | | $ | — | |
| | Undistributed long-term capital gains | | | 68,202 | |
| | Total distributable earnings | | $ | 68,202 | |
| | Other accumulated gain | | $ | — | |
| | Total accumulated gain | | $ | 54,877 | |
The difference between book-basis and tax-basis unrealized appreciation is attributable primarily to wash sales.
At October 31, 2014, the Fund had no tax basis capital losses to offset future capital gains.
At October 31, 2014, the Fund did not defer, on a tax basis, any late year ordinary losses.
The tax character of distributions paid during fiscal year 2014 and fiscal year 2013 for the Fund were as follow:
| | | | Year Ended | | | Year Ended | |
| | | | October 31, 2014 | | | October 31, 2013 | |
| | Ordinary income | | $ | 156,269 | | | $ | 846,010 | |
| | Long-term capital gain | | | 1,351,112 | | | | 368,455 | |
| | | | $ | 1,507,381 | | | $ | 1,214,465 | |
8). EVENTS SUBSEQUENT TO YEAR-END
On December 8, 2014, a long-term capital gains distribution of $0.10374 per share for the Investor Class and $0.09119 per share for the Institutional Class were declared and paid to shareholders of record on December 5, 2014.
HENNESSY FUNDS 1-800-966-4354
Report of Independent Registered Public Accounting Firm
To the Board of Trustees of Hennessy Funds Trust
And the Shareholders of Hennessy Core Bond Fund
We have audited the accompanying statement of assets and liabilities, including the schedule of investments, of the Hennessy Core Bond Fund (the “Fund”), a series of Hennessy Funds Trust as of October 31, 2014, and the related statement of operations for the year then ended, the statements of changes in net assets for each of the two years in the period then ended and the financial highlights for each of the four years in the period then ended and the seven month period ended October 31, 2010 and the year ended March 31, 2010. These financial statements and financial highlights are the responsibility of the Fund’s management. Our responsibility is to express an opinion on these financial statements and financial highlights based on our audits.
We conducted our audits in accordance with the standards of the Public Company Accounting Oversight Board (United States). Those standards require that we plan and perform the audits to obtain reasonable assurance about whether the financial statements and financial highlights are free of material misstatement. The Fund is not required to have, nor were we engaged to perform, an audit of the Fund’s internal control over financial reporting. Our audits included consideration of internal control over financial reporting as a basis for designing audit procedures that are appropriate in the circumstances, but not for the purposes of expressing an opinion on the effectiveness of the Fund’s internal control over financial reporting. Accordingly, we express no such opinion. An audit includes examining, on a test basis, evidence supporting the amounts and disclosures in the financial statements. Our procedures included confirmation of securities owned as of October 31, 2014, by correspondence with the custodian. An audit also includes assessing the accounting principles used and significant estimates made by management, as well as evaluating the overall financial statement presentation. We believe that our audits provide a reasonable basis for our opinion.
In our opinion, the financial statements and financial highlights referred to above present fairly, in all material respects, the financial position of the Hennessy Core Bond Fund as of October 31, 2014, the results of its operations for the year then ended, the changes in its net assets for each of the two years in the period then ended, and the financial highlights for each of the four years in the period then ended and the seven month period ended October 31, 2010 and the year ended March 31, 2010, in conformity with accounting principles generally accepted in the United States of America.
TAIT, WELLER & BAKER LLP
Philadelphia, Pennsylvania
December 30, 2014
Trustees and Officers of the Fund (Unaudited)
The business and affairs of the Fund are managed under the direction of the Fund’s Board of Trustees. Information pertaining to the Trustees and Officers of the Fund is set forth below. The Fund’s Statement of Additional Information includes additional information about the Fund’s Trustees and Officers and is available, without charge, upon request by calling 1-800-966-4354.
| | | | | Number of | |
| | | Term of | | Portfolios | |
| | | Office | | in the | Other |
| | | and | | Fund | Directorships |
| | Position(s) | Length | Principal | Complex | (During Past |
| Name, Address, | Held with | of Time | Occupation(s) | Overseen | Five Years)(2) |
| and Age | the Fund | Served | During Past Five Years | by Trustee | Held by Trustee |
| | | |
| Disinterested Trustees (as defined below) | | |
| | | | | | |
| J. Dennis DeSousa | Trustee | Indefinite, | Mr. DeSousa is a real | 16 | Hennessy SPARX |
| Age: 78 | | until | estate investor. | | Funds Trust; |
| Address: | | successor | | | Hennessy Mutual |
| c/o Hennessy | | elected | | | Funds, Inc.; and |
| Advisors, Inc. | | | | | The Hennessy |
| 7250 Redwood Blvd. | | Served | | | Funds, Inc. |
| Suite 200 | | since | | | |
| Novato, CA 94945 | | January | | | |
| | | 1996 | | | |
| | | for the | | | |
| | | Funds (or | | | |
| | | Predecessor | | | |
| | | Funds) | | | |
| | | | | | |
| Robert T. Doyle | Trustee | Indefinite, | Mr. Doyle has been the | 16 | Hennessy SPARX |
| Age: 67 | | until | Sheriff of Marin County, | | Funds Trust; |
| Address: | | successor | California since 1996. | | Hennessy Mutual |
| c/o Hennessy | | elected | | | Funds, Inc.; and |
| Advisors, Inc. | | | | | The Hennessy |
| 7250 Redwood Blvd. | | Served | | | Funds, Inc. |
| Suite 200 | | since | | | |
| Novato, CA 94945 | | January | | | |
| | | 1996 | | | |
| | | for the | | | |
| | | Funds (or | | | |
| | | Predecessor | | | |
| | | Funds) | | | |
| | | | | | |
| Gerald P. Richardson | Trustee | Indefinite, | Mr. Richardson is an | 16 | Hennessy SPARX |
| Age: 69 | | until | independent consultant | | Funds Trust; |
| Address: | | successor | in the securities industry. | | Hennessy Mutual |
| c/o Hennessy | | elected | | | Funds, Inc.; and |
| Advisors, Inc. | | | | | The Hennessy |
| 7250 Redwood Blvd. | | Served | | | Funds, Inc. |
| Suite 200 | | since | | | |
| Novato, CA 94945 | | May 2004 | | | |
| | | for the | | | |
| | | Funds (or | | | |
| | | Predecessor | | | |
| | | Funds) | | | |
HENNESSY FUNDS 1-800-966-4354
| | | | | Number of | |
| | | Term of | | Portfolios | |
| | | Office | | in the | Other |
| | | and | | Fund | Directorships |
| | Position(s) | Length | Principal | Complex | (During Past |
| Name, Address, | Held with | of Time | Occupation(s) | Overseen | Five Years)(2) |
| and Age | the Fund | Served | During Past Five Years | by Trustee | Held by Trustee |
| | | |
| “Interested Persons” (as defined in the 1940 Act) | | |
| | | |
Neil J. Hennessy(1) | Chief | Trustee: | Mr. Hennessy has been | 16 | Hennessy |
| Age: 58 | Investment | Indefinite, | employed by Hennessy | | Advisors, Inc. |
| Address: | Officer, | until | Advisors, Inc., the Funds’ | | (current); |
| c/o Hennessy | Portfolio | successor | investment advisor, since | | Hennessy SPARX |
| Advisors, Inc. | Manager, | elected | 1989. He currently serves | | Funds Trust; |
| 7250 Redwood Blvd. | President, | | as President, Chairman | | Hennessy Mutual |
| Suite 200 | Trustee | Served | and CEO of Hennessy | | Funds, Inc.; and |
| Novato, CA 94945 | and | since | Advisors, Inc. | | The Hennessy |
| | Chairman | January | | | Funds, Inc. |
| | of the | 1996 | | | |
| | Board | for the | | | |
| | | Funds (or | | | |
| | | Predecessor | | | |
| | | Funds) | | | |
| | | | | | |
| | | Officer: | | | |
| | | 1 year term | | | |
| | | | | | |
| | | Served | | | |
| | | since | | | |
| | | June 2008 | | | |
| | | for the | | | |
| | | Funds (or | | | |
| | | Predecessor | | | |
| | | Funds) | | | |
| | | | | | |
Teresa M. Nilsen(1) | Executive | 1 year term | Ms. Nilsen has been | N/A | N/A |
| Age: 48 | Vice | | employed by Hennessy | | |
| Address: | President | Served | Advisors, Inc., the Funds’ | | |
| c/o Hennessy | and | since | investment advisor, since | | |
| Advisors, Inc. | Treasurer | January | 1989. She currently serves | | |
| 7250 Redwood Blvd. | | 1996 | as Executive Vice President, | | |
| Suite 200 | | for the | Chief Operations Officer, | | |
| Novato, CA 94945 | | Funds (or | Chief Financial Officer, and | | |
| | | Predecessor | Secretary of Hennessy | | |
| | | Funds) | Advisors, Inc. | | |
| (1) | All Officers of the Hennessy Funds and employees of the Manager are Interested Persons of the Funds. |
| (2) | Pursuant to an internal reorganization, the series of Hennessy Mutual Funds, Inc. (“HMFI”), The Hennessy Funds, Inc. (“HFI”) and Hennessy SPARX Funds Trust (“HSFT”) were reorganized into series of Hennessy Funds Trust on February 28, 2014, which mirrored the corresponding series of HFMI, HFI and HSFT. Subsequent to the reorganization, HFMI, HFI and HSFT were dissolved. |
| | | Term of | |
| | | Office | |
| | | and | |
| | Position(s) | Length | Principal |
| Name, Address, | Held with | of Time | Occupation(s) |
| and Age | the Fund | Served | During Past Five Years |
| | | | |
| Interested Persons | | | |
| | | | |
Daniel B. Steadman(1) | Executive | 1 year term | Mr. Steadman has been employed by |
| Age: 58 | Vice President | | Hennessy Advisors, Inc., the Funds’ |
| Address: | and Secretary | Served since | investment advisor, since 2000. |
| c/o Hennessy Advisors, Inc. | | March 2000 | He currently serves as Executive |
| 7250 Redwood Blvd. | | for the Funds (or | Vice President and Chief Compliance |
| Suite 200 | | Predecessor Funds) | Officer of Hennessy Advisors, Inc. |
| Novato, CA 94945 | | | |
| | | | |
Jennifer Cheskiewicz(1) | Senior | 1 year term | Ms. Cheskiewicz has been employed by |
| Age: 37 | Vice President | | Hennessy Advisors, Inc., the Funds’ |
| Address: | and Chief | Served since | investment advisor, since June 2013. |
| c/o Hennessy Advisors, Inc. | Compliance | June 2013 | She previously served as in-house |
| 7250 Redwood Blvd. | Officer | for the Funds (or | counsel to Carlson Capital, L.P., an |
| Suite 200 | | Predecessor Funds) | SEC-registered investment advisor to |
| Novato, CA 94945 | | | several private funds from February |
| | | | 2010 to May 2013. Prior to that, she |
| | | | was an attorney with Gibson, Dunn & |
| | | | Crutcher LLP from September 2005 |
| | | | through February 2010. She currently |
| | | | serves as General Counsel of |
| | | | Hennessy Advisors, Inc. |
| | | | |
Brian Carlson(1) | Senior | 1 year term | Mr. Carlson has been employed by |
| Age: 42 | Vice President | | Hennessy Advisors, Inc., the Funds’ |
| Address: | and Head of | Served since | investment advisor, since |
| c/o Hennessy Advisors, Inc. | Distribution | December 2013 | December 2013. |
| 7250 Redwood Blvd. | | for the Funds (or | |
| Suite 200 | | Predecessor Funds) | Mr. Carlson was previously a |
| Novato, CA 94945 | | | co-founder and principal of Trivium |
| | | | Consultants, LLC from February 2011 |
| | | | through November 2013. Prior to that, |
| | | | he was the Senior Managing Director |
| | | | of NRP Financial, Inc. from August |
| | | | 2007 through February 2011. |
| | | | |
David Ellison(1) | Portfolio Manager | 1 year term | Mr. Ellison has served as Portfolio |
| Age: 56 | and Senior | | Manager of the Large Cap Financial |
| Address: | Vice President | Served since | Fund, the Small Cap Financial Fund, |
| c/o Hennessy Advisors, Inc. | | October 2012 | and the Technology Fund |
| 101 Federal Street | | for the Funds (or | since inception. |
| Suite 1900 | | Predecessor Funds) | |
| Boston, MA 02110 | | | Mr. Ellison previously served as Director, |
| | | | CIO and President of FBR Advisers, Inc. |
| | | | from December 1999 to October 2012. |
| (1) | All Officers of the Hennessy Funds and employees of the Manager are Interested Persons of the Funds. |
HENNESSY FUNDS 1-800-966-4354
| | | Term of | |
| | | Office | |
| | | and | |
| | Position(s) | Length | Principal |
| Name, Address, | Held with | of Time | Occupation(s) |
| and Age | the Fund | Served | During Past Five Years |
| | | | |
| Interested Persons | | | |
| | | | |
Brian Peery(1) | Portfolio Manager | 1 year term | Mr. Peery has been a Portfolio Manager |
| Age: 45 | and | | of the Cornerstone Growth Fund, |
| Address: | Vice President | Served since | the Cornerstone Mid Cap 30 Fund, the |
| c/o Hennessy Advisors, Inc. | | March 2003 | Cornerstone Large Growth Fund, the |
| 7250 Redwood Blvd. | | as Vice President | Cornerstone Value Fund, the Total |
| Suite 200 | | for the Funds (or | Return Fund, and the Balanced Fund |
| Novato, CA 94945 | | Predecessor Funds) | since October 2014. From February |
| | | | 2011 through September 2014, he |
| | | Served since | served as Co-Portfolio Manager of |
| | | February 2011 | the same funds. |
| | | as Co-Portfolio | |
| | | Manager | Mr. Peery has been employed by |
| | | for the Funds (or | Hennessy Advisors, Inc., the Funds’ |
| | | Predecessor Funds) | investment advisor, since 2002. |
| | | | |
Winsor (Skip) Aylesworth(1) | Portfolio Manager | 1 year term | Mr. Aylesworth has been Portfolio |
| Age: 67 | and | | Manager of the Gas Utility Index Fund |
| Address: | Vice President | Served since | since 1998 and Portfolio Manager of |
| c/o Hennessy Advisors, Inc. | | October 2012 | the Technology Fund since inception. |
| 101 Federal Street | | for the Funds (or | |
| Suite 1900 | | Predecessor Funds) | Mr. Aylesworth previously served as |
| Boston, MA 02110 | | | Executive Vice President of The FBR |
| | | | Funds from 1999 to October 2012. |
| | | | |
Ryan Kelley(1) | Portfolio Manager | 1 year term | Mr. Kelley has been a Portfolio Manager |
| Age: 42 | and | | of the Gas Utility Index Fund (formerly |
| Address: | Vice President | Served since | the FBR Gas Utility Index Fund), the |
| c/o Hennessy Advisors, Inc. | | March 2013 | Small Cap Financial Fund (formerly the |
| 1340 Environ Way | | for the Funds (or | FBR Small Cap Financial Fund), and the |
| Chapel Hill, NC 27517 | | Predecessor Funds) | Large Cap Financial Fund (formerly the |
| | | | FBR Large Cap Financial Fund) since |
| | | | October 2014. From March 2013 |
| | | | through September 2014, he served |
| | | | as a Co-Portfolio Manager of the same |
| | | | funds. Prior to that, he was a Portfolio |
| | | | Analyst of the Hennessy Funds. |
| | | | |
| | | | Mr. Kelley previously served as Portfolio |
| | | | Manager of The FBR Funds from |
| | | | January 2008 to October 2012. |
| (1) | All Officers of the Hennessy Funds and employees of the Manager are Interested Persons of the Funds. |
(This Page Intentionally Left Blank.)
HENNESSY FUNDS 1-800-966-4354
Expense Example (Unaudited)
October 31, 2014
As a shareholder of the Fund, you incur two types of costs: (1) transaction costs, including sales charges (loads) on purchase payments, reinvested dividends, or other distributions; redemption fees; and exchange fees; and (2) ongoing costs, including management fees; service fees; and other Fund expenses. This Example is intended to help you understand your ongoing costs (in dollars) of investing in the Fund and to compare these costs with the ongoing costs of investing in other mutual funds. The Example is based on an investment of $1,000 invested at the beginning of the period and held for the entire period from May 1, 2014 through October 31, 2014.
Actual Expenses
The first line of the table below under the “Investor Class” and “Institutional Class” headings provides information about actual account values and actual expenses. Although the Fund charges no sales loads or transaction fees, you will be assessed fees for outgoing wire transfers, returned checks and stop payment orders at prevailing rates charged by U.S. Bancorp Fund Services, LLC, the Fund’s transfer agent. If you request that a redemption be made by wire transfer, currently a $15.00 fee is charged by the Fund’s transfer agent. IRA accounts will be charged a $15.00 annual maintenance fee. The example below includes, but is not limited to, management fees, shareholder servicing fees, fund accounting, custody, and transfer agent fees. However, the example below does not include portfolio trading commissions and related expenses, and other extraordinary expenses as determined under generally accepted accounting principles. You may use the information in this line, together with the amount you invested, to estimate the expenses that you paid over the period. Simply divide your account value by $1,000 (for example, an $8,600 account value divided by $1,000 = 8.6), then multiply the result by the number in the first line of the table under the “Investor Class” and “Institutional Class” headings in the column entitled “Expenses Paid During Period” to estimate the expenses you paid on your account during this period.
Hypothetical Example for Comparison Purposes
The second line of the table below under the “Investor Class” and “Institutional Class” headings provides information about hypothetical account values and hypothetical expenses based on the Fund’s actual expense ratios and an assumed rate of return of 5% per year before expenses, which is not the Fund’s actual return. The hypothetical account values and expenses may not be used to estimate the actual ending account balance or expenses you paid for the period. You may use this information to compare the ongoing costs of investing in the Fund and other funds. To do so, compare this 5% hypothetical example with the 5% hypothetical examples that appear in the shareholder reports of the other funds. Please note that the expenses shown in the table are meant to highlight your ongoing costs only and do not reflect any transactional costs, such as sales charges (loads), or exchange fees. Therefore, the second line of the table under the “Investor Class” and “Institutional Class” headings is useful in comparing ongoing costs only, and will not help you determine the relative total costs of owning different funds. In addition, if these transactional costs were included, your costs would have been higher.
| | Beginning | Ending | Expenses Paid |
| | Account Value | Account Value | During Period(1) |
| | 5/1/14 | 10/31/14 | 5/1/14 – 10/31/14 |
| Investor Class | | | |
| | | | |
| Actual | $1,000.00 | $1,000.80 | $6.56 |
| | | | |
| Hypothetical (5% return | | | |
| before expenses) | $1,000.00 | $1,018.65 | $6.61 |
| | | | |
| Institutional Class | | | |
| | | | |
| Actual | $1,000.00 | $1,001.40 | $5.30 |
| | | | |
| Hypothetical (5% return | | | |
| before expenses) | $1,000.00 | $1,019.91 | $5.35 |
| (1) | Expenses are equal to the Fund’s expense ratio of 1.30% for Investor Class shares or 1.05% for Institutional Class shares, as applicable, multiplied by the average account value over the period, multiplied by 184/365 days (to reflect one-half year period). |
HENNESSY FUNDS 1-800-966-4354
Proxy Voting
A description of the policies and procedures the Fund uses to determine how to vote proxies relating to portfolio securities is available without charge: (1) by calling 1-800-966-4354; (2) on the Hennessy Funds’ website at hennessyfunds.com; or (3) on the U.S. Securities and Exchange Commission’s (the “SEC”) website at www.sec.gov. The Fund’s proxy voting record is available on both the Hennessy Funds’ website at hennessyfunds.com and the SEC’s website at www.sec.gov no later than August 31 for the prior 12 months ending June 30.
Quarterly Filings on Form N-Q
The Fund files its complete schedule of portfolio holdings with the SEC for the first and third quarters of each fiscal year on Form N-Q. The Fund’s Forms N-Q are available on the SEC’s website at www.sec.gov. The Fund’s Forms N-Q may be reviewed and copied at the SEC’s Public Reference Room in Washington, DC and information on the operation of the Public Reference Room may be obtained by calling 1-800-SEC-0330. Information included in the Fund’s Forms N-Q will also be available upon request by calling 1-800-966-4354.
Federal Tax Distribution Information
(Unaudited)
For the fiscal year ended October 31, 2014, certain dividends paid by the Fund may be subject to a maximum tax rate of 20%, as provided for by the Jobs and Growth Tax Relief Reconciliation Act of 2003. The percentage of dividends declared from ordinary income designated as qualified dividend income was 0.64%.
For corporate shareholders, the percent of ordinary income distributions qualifying for the corporate dividends received deduction for the fiscal year ended October 31, 2014 was 0.64%.
The percentage of taxable ordinary income distributions that are designated as short-term capital gain distributions under Section 871(k)(2)(C) of the Internal Revenue Code of 1986, as amended, for the Fund was 9.02%.
Householding
To help keep the Fund’s costs as low as possible, we generally deliver a single copy of most financial reports and prospectuses to shareholders who share an address, even if the accounts are registered under different names. This process, known as “householding,” does not apply to account statements. You may, of course, request an individual copy of a prospectus or financial report at any time. If you would like to receive separate mailings, please call the Administrator at 1-800-261-6950 or 1-414-765-4124 and we will begin individual delivery within 30 days of your request. If your account is held through a financial institution or other intermediary, please contact them directly to request individual delivery.
Privacy Policy
We collect the following non-public personal information about you:
| | • | information we receive from you on or in applications or other forms, correspondence, or conversations, including, but not limited to, your name, address, phone number, social security number, assets, income and date of birth; |
| | | and |
| | • | information about your transactions with us, our affiliates, or others, including, but not limited to, your account number and balance, payment history, parties to transactions, cost basis information and other financial information. |
We do not disclose any non-public personal information about our current or former shareholders to nonaffiliated third parties, except as permitted by law. For example, we are permitted by law to disclose all of the information we collect, as described above, to our Transfer Agent to process your transactions. Furthermore, we restrict access to your non-public personal information to those persons who require such information to provide products or services to you. We maintain physical, electronic and procedural safeguards that comply with federal standards to guard your non-public personal information.
In the event that you hold shares of the Fund through a financial intermediary, including, but not limited to, a broker-dealer, bank or trust company, the privacy policy of your financial intermediary would govern how your non-public personal information would be shared with nonaffiliated third parties.
HENNESSY FUNDS 1-800-966-4354
For information, questions or assistance, please call
The Hennessy Funds
1-800-966-4354 or 1-415-899-1555
INVESTMENT ADVISOR
Hennessy Advisors, Inc.
7250 Redwood Blvd., Suite 200
Novato, California 94945
ADMINISTRATOR,
TRANSFER AGENT,
DIVIDEND PAYING AGENT &
SHAREHOLDER SERVICING AGENT
U.S. Bancorp Fund Services, LLC
P.O. Box 701
Milwaukee, Wisconsin 53201-0701
CUSTODIAN
U.S. Bank N.A.
Custody Operations
1555 North River Center Dr., Suite 302
Milwaukee, Wisconsin 53212
TRUSTEES
Neil J. Hennessy
Robert T. Doyle
J. Dennis DeSousa
Gerald P. Richardson
COUNSEL
Foley & Lardner LLP
777 East Wisconsin Avenue
Milwaukee, Wisconsin 53202-5306
INDEPENDENT REGISTERED
PUBLIC ACCOUNTING FIRM
Tait, Weller & Baker LLP
1818 Market Street, Suite 2400
Philadelphia, Pennsylvania 19103
DISTRIBUTOR
Quasar Distributors, LLC
615 East Michigan Street
Milwaukee, Wisconsin 53202
hennessyfunds.com | 1-800-966-4354
This report has been prepared for shareholders and may be distributed to
others only if preceded or accompanied by a current prospectus.
ANNUAL REPORT
OCTOBER 31, 2014
HENNESSY GAS UTILITY
INDEX FUND
Investor Class GASFX
hennessyfunds.com | 1-800-966-4354
(This Page Intentionally Left Blank.)
Contents
| Letter to Shareholders | 2 |
| Performance Overview | 4 |
| Financial Statements | |
| Schedule of Investments | 7 |
| Statement of Assets and Liabilities | 12 |
| Statement of Operations | 13 |
| Statements of Changes in Net Assets | 15 |
| Financial Highlights | 16 |
| Notes to the Financial Statements | 18 |
| Report of Independent Registered Public Accounting Firm | 25 |
| Trustees and Officers of the Fund | 26 |
| Expense Example | 30 |
| Proxy Voting | 32 |
| Quarterly Filings on Form N-Q | 32 |
| Federal Tax Distribution Information | 32 |
| Householding | 32 |
| Privacy Policy | 33 |
HENNESSY FUNDS 1-800-966-4354
December 2014
Dear Shareholder:
As I look back at 2014, I realize that in this age of rapidly evolving technology, information is delivered and absorbed so quickly that it is difficult to remember what happened last week, let alone what’s happened over the course of an entire year. That is why I’d like to take a moment to recall some of the year’s highs and lows, economically, politically and socially, here in the U.S. and around the globe. 2014 was scarred by political partisanship, civil unrest in the U.S., Ukraine and many other countries, the arrival of terrorist group ISIS, the tragedies of school shootings and natural disasters, and the frightening outbreak of Ebola. However, there were also positive events this year: we survived a government shutdown over healthcare reform, jobs reports have been consistently, albeit anemically, improving, and home prices remained relatively stable, after recovering significantly in 2013. And, important to us here at Hennessy, our hometown team, the San Francisco Giants, won their third World Series in just five years!
A significant event for the financial industry this past year was the confirmation of Janet Yellen as Chair of the Federal Reserve, which served to calm the nerves of business and political leaders alike. I believe Yellen’s leadership will benefit U.S. business owners, as the Fed continues to be a voice of reason in a sea of political and economic rhetoric. The Fed has also supported the economy and corporate America by helping keep interest rates reasonable and low.
The stock market has continued its determined comeback from the lows of 2009, setting multiple record highs in recent months. The U.S. financial markets have provided strong returns over the past twelve-month period ended October 31, 2014, with the Dow Jones Industrial Average (DJIA) returning over 14% and S&P 500 Index returning over 17% during the period. The DJIA currently has a dividend yield of 2.2%, which is equal to that of a 10-Year U.S. Treasury, which is currently also yielding 2.2%. I continue to believe that investments in high-yielding, high-quality stocks have the potential to not only provide income but also the potential for stock price appreciation as well. Fixed income investing has run its course, in my opinion, and many individuals are currently benefiting from the return to investing in equities that possess strong fundamentals. American investors are slowly migrating from fixed income to equities. Currently, 54% of Americans invest in stocks, and I do expect this percentage to increase, especially if interest rates move higher.
For the past several years, U.S. corporations have been driving shareholder value by making acquisitions, initiating and raising dividends, investing in internal infrastructure and buying back stock. However, this year I began to see a shift from those strategies. I believe the easier to execute acquisitions are a thing of the past, and firms now have to be even more creative to execute accretive deals. I also believe that while firms may continue to initiate dividends, fewer firms will raise their dividends and fewer firms will participate in stock buyback programs going forward. What will these cash-rich companies do with their capital if they are not raising dividends or buying back stock? I believe they may begin to initiate capital expenditure programs that could truly benefit economic growth.
Liquidity and monetary conditions are supportive, causing the cost of capital to be very low. I believe firms will choose to spend capital to expand their sales, and they may even begin to hire in earnest. Once a company begins to move in this way, the cost to
defer becomes real for competitors. With almost $3 trillion in cash and short-term investments sitting on the balance sheets of the S&P 500 companies, a strategic shift by firms to spend their idle capital, while slow, could potentially further economic growth in the U.S. in my opinion.
Economic progress and growth remain slow, yet steady, and unemployment, though improving, remains high. Oil prices have fallen, giving consumers a bit more discretionary income. While the midterm elections may not end all of the gridlock in Washington, hopefully we will receive clarity on the political headwinds of taxes and regulations, which have not improved over the past several years.
The markets have had several quarters without any truly significant downturn. The pullbacks we recently experienced, most notably in July and October, were short-lived, as evidenced by the quick rebound to record high market levels. I firmly believe that we are in a secular bull market, and I continue to tell investors to try to remain calm in the face of volatility and continue to focus on the strong, long-term fundamentals that are evident in the market today. Many companies continue to have strong balance sheets, with record cash flows and profits. With this current bull market in its fifth year, investors should expect some volatility.
I am encouraged by the strong returns for the major U.S. financial market indices and by the performance of the Hennessy Funds over the past year. Thank you for your continued confidence and investment in our products. If you have any questions or would like to speak with us directly, please don’t hesitate to call us at (800) 966-4354.
Best regards,
Neil J. Hennessy
President and Chief Investment Officer
Past performance does not guarantee future results.
Mutual fund investing involves risk. Principal loss is possible.
Opinions expressed are those of Neil Hennessy and are subject to change, are not guaranteed and should not be considered investment advice.
The Dow Jones Industrial Average and S&P 500 Index are unmanaged indices commonly used to measure the performance of U.S. stocks. One cannot invest directly in an index.
Cash flow can be used as an indication of a company’s financial strength. A firm’s cash flow is the movement of cash in and out of the firm in the form of payments to suppliers and collections from customers. Dividend Yield is calculated as the annual dividends paid by a company divided by the price of a share of their stock.
HENNESSY FUNDS 1-800-966-4354
Performance Overview (Unaudited)
The opinions expressed in the following commentary reflect those of the Portfolio Managers as of the date written. Any such opinions are subject to change based on market or other conditions and are not guaranteed. These opinions may not be relied upon as investment advice. Investment decisions for the Fund are based on multiple factors, and may not be relied upon as an indication of trading intent on behalf of the Fund. Security positions can and do change.
CHANGE IN VALUE OF $10,000 INVESTMENT
This chart assumes an initial gross investment of $10,000 made on October 31, 2004. Returns shown include the reinvestment of all dividends. Returns shown do not reflect the deduction of taxes that a shareholder would pay on Fund distributions or the redemption of Fund shares.
AVERAGE ANNUAL TOTAL RETURN FOR PERIODS ENDED OCTOBER 31, 2014
| | One | Five | Ten |
| | Year | Years | Years |
| Hennessy Gas Utility | | | |
| Index Fund (GASFX) | 22.49% | 20.41% | 13.11% |
| AGA Stock Index* | 23.37% | 21.09% | 13.94% |
| S&P 500 Index | 17.27% | 16.69% | 8.20% |
Expense ratio: 0.80%
Performance data quoted represents past performance; past performance does not guarantee future results. The investment return and principal value of an investment will fluctuate so that an investor’s shares, when redeemed, may be worth more or less than their original cost. Current performance of the Fund may be lower or higher than the performance quoted. Performance data current to the most recent month end may be obtained by visiting hennessyfunds.com. Performance for periods prior to October 26, 2012 is that of the FBR Gas Utility Index Fund.
The expense ratio presented is from the most recent prospectus.
| * | The AGA Stock Index is a market capitalization-weighted index, adjusted monthly, consisting of member companies of the AGA. Performance for the AGA Stock Index is provided monthly by the American Gas Association. |
PERFORMANCE NARRATIVE
Portfolio Managers Winsor H. (Skip) Aylesworth and Ryan Kelley
Over the previous twelve months, how did the Fund perform and what factors contributed to this performance?
For the twelve-month period ended October 31, 2014, the Hennessy Gas Utility Index Fund returned 22.49%, slightly underperforming the American Gas Association (AGA) Stock Index*, which returned 23.37% for the same period, but significantly outperforming the S&P 500 Index and the Morningstar Utilities Category Average, which returned 17.27%, and 16.79% for the same period, respectively.
Two of the Fund’s best performers for the period were Cheniere Energy, Inc. and Energy Transfer Equity, L.P., which returned 88% and 78%, respectively, for the period. This is the third straight year that Cheniere has been a top performer, and the second year that Energy Transfer has been a top performer. Cheniere Energy, Inc. focuses on Liquid Natural Gas (LNG) and owns ports along the Gulf Coast that can receive and process imports and is currently constructing LNG export facilities. It is the first company to be granted a license to export LNG from the U.S., with shipments expected to begin in early 2016. Energy Transfer Equity, L.P. is a Master Limited Partnership (MLP) that specializes in the storage and transportation of natural gas. It too has been granted a license to export LNG and has benefited from the interest in this new demand driver for the industry. As an MLP, the company pays the bulk of its cash flow out in distributions to avoid paying taxes at the corporate level, which makes it particularly attractive to income-oriented investors. Both companies have benefited from the interest in LNG exporting due to the geopolitical climate in Eastern Europe. Both companies were two of the Fund’s largest holdings for the twelve-month period, and thus their individual success added greatly to the success of the Fund.
Two holdings that detracted from the Fund’s performance were Energen Corp. and MDU Resources Group, Inc., which returned -13% and -3%, respectively. Energen Corp. is an energy holding company engaged in the development, exploration and production of oil, natural gas and natural gas liquids. MDU Resources Group, Inc. is a diversified company which services the energy and transportation sectors, with one segment that generates and transmits electricity and natural gas. Both companies have been negatively impacted by their exposure to the exploration and production (E&P) sector of the Energy industry. While Energen sold its distribution business to concentrate on E&P, MDU is looking to divest itself of the E&P exposure in order to concentrate on distribution.
There was one addition and two deletions to the AGA Stock Index, and thus the Fund’s portfolio, during the period. The addition was Plains GP Holdings LP, a Houston based holding company engaged in transportation, storage and marketing of crude oil and natural gas liquids. It is the General Partner of Plains All America Pipeline, LP, a pipeline Master Limited Partnership (MLP). The two stocks deleted were Energen Corp. and UNS Energy Corp. In a decision to concentrate on the E&P side of the industry, Energen sold its natural gas distribution subsidiary to The Laclede Group, Inc., another AGA member. As a result of the divestiture, Energen decided to drop its membership in AGA. UNS Energy Corp. left the index as a result of being acquired by a Canadian utility, Fortis, Inc. This is the second acquisition for Fortis of an AGA member in the last two years. Fortis, Inc. is a large electric and gas utility based in British Columbia, Canada. Although an AGA member company, Fortis, Inc. does not trade on an American exchange and hence is not a part of the AGA Stock Index. To be included in the AGA Stock Index, a company must be publicly traded on an American stock exchange and be a member of the AGA.
HENNESSY FUNDS 1-800-966-4354
Additional Portfolio Manager Commentary and related investment outlook:
The natural gas distribution industry continues to thrive in the current environment of ample supply, historically low and stable prices, and the concerns about climate change. As the cleanest of the fossil fuels, natural gas is the energy source of choice as utilities replace aging coal-fired generating facilities.
We are currently seeing the same revolution in the oil industry that we saw in the natural gas industry. By using the same technologies of fracking and horizontal drilling, the U.S. is finding more oil than ever before. We are seeing oil production increasing, while imports are decreasing. The result is a lowering of oil prices. As we see the price difference between oil based energy (gas/diesel) and natural gas narrow, the adoption of natural gas as a mainstream transportation fuel is slowing. If oil prices go up, we could expect a quicker adoption of natural gas-based transportation solutions.
Geopolitics in Europe and Asia have generally resulted in both economies slowing with resultant reductions in energy demand. Price spreads for LNG between Europe, China and the U.S. have narrowed which, if they hold, could slow the LNG export industry.
So having finished another good year for the Fund, what can investors expect going forward with this somewhat mixed outlook? As an index fund, its goal is to provide the return of the index less expenses. We strive to continue our long term record of accomplishing this. Since the members of the AGA Stock Index are all involved in the distribution side of the natural gas industry, their future growth is directly related to the growth of natural gas as an energy source. As long as we continue to have long term supplies of proven reserves and prices remain historically low and relatively stable, prospects should continue to be good for portfolio companies.
| * | The AGA Stock Index is a market capitalization-weighted index, adjusted monthly, consisting of member companies of the AGA. Performance for the AGA Stock Index is provided monthly by the American Gas Association. The S&P 500 Index is an unmanaged index commonly used to measure the performance of U.S. stocks. You cannot invest directly in an index. Performance data for an index does not reflect any deductions for fees, expenses or taxes. |
The Fund is non-diversified, meaning it concentrates its assets in fewer holdings than a diversified fund and is therefore more exposed to individual stock volatility than a diversified fund. Investments are focused in the natural gas distribution and transmission industry, which may be adversely affected by rising interest rates, weather, and the wholesale pricing of alternative fuels. Investments in foreign securities may involve greater volatility and political, economic and currency risk and differences in accounting methods. While the Fund seeks to track the performance of the AGA Stock Index as closely as possible, the Fund’s return may not always be able to match or achieve a high correlation with the return of the AGA Stock Index.
References to specific securities should not be considered a recommendation to buy or sell any security. Fund holdings and sector allocations are subject to change. Please refer to the Schedule of Investments included in this report for additional portfolio information.
Cash flow measures the cash generating capability of a company by adding non-cash charges (e.g. depreciation) and interest expense to pre-tax income.
Each Morningstar category average represents a universe of funds with similar investment objectives. © Morningstar, Inc. All Rights Reserved. The information contained herein: 1) is proprietary to Morningstar; 2) may not be copied or distributed and 3) is not warranted to be accurate, complete or timely. Neither Morningstar nor its content providers are responsible for any damages or losses arising from any use of this information. Past performance does not guarantee future results.
Financial Statements
HENNESSY GAS UTILITY INDEX FUND
As of October 31, 2014
(% of Net Assets)
| TOP TEN HOLDINGS (EXCLUDING CASH/CASH EQUIVALENTS) | % NET ASSETS |
| | |
| Cheniere Energy, Inc. | 4.92% |
| Sempra Energy | 4.91% |
| National Grid PLC | 4.90% |
| Dominion Resources, Inc. | 4.88% |
| Kinder Morgan, Inc. | 4.88% |
| Spectra Energy Corp. | 4.87% |
| TransCanada Corp. | 4.86% |
| Enbridge, Inc. | 4.85% |
| NiSource, Inc. | 4.85% |
| ONEOK, Inc. | 4.26% |
Note: For presentation purposes, the Fund has grouped some of the industry categories. For purposes of categorizing securities for compliance with Section 8(b)(1) of the Investment Company Act of 1940, the Fund uses more specific industry classifications.
HENNESSY FUNDS 1-800-966-4354
| | COMMON STOCKS – 96.05% | | Number | | | | | | % of | |
| | | | of Shares | | | Value | | | Net Assets | |
| | Energy – 26.73% | | | | | | | | | |
| | Cheniere Energy, Inc. (a) | | | 1,479,117 | | | $ | 110,933,775 | | | | 4.92 | % |
| | Enbridge, Inc. (c) | | | 2,310,997 | | | | 109,448,818 | | | | 4.85 | % |
| | EQT Corp. | | | 562,732 | | | | 52,919,317 | | | | 2.35 | % |
| | Kinder Morgan, Inc. | | | 2,844,725 | | | | 110,090,858 | | | | 4.88 | % |
| | Spectra Energy Corp. | | | 2,804,615 | | | | 109,744,585 | | | | 4.87 | % |
| | TransCanada Corp. (c) | | | 2,225,927 | | | | 109,715,942 | | | | 4.86 | % |
| | | | | | | | | 602,853,295 | | | | 26.73 | % |
| | | | | | | | | | | | | | |
| | Financials – 0.53% | | | | | | | | | | | | |
| | Berkshire Hathaway, Inc., Class A (a) | | | 57 | | | | 11,970,000 | | | | 0.53 | % |
| | | | | | | | | | | | | | |
| | Utilities – 68.79% | | | | | | | | | | | | |
| | AGL Resources, Inc. | | | 1,293,116 | | | | 69,711,884 | | | | 3.09 | % |
| | ALLETE, Inc. | | | 3,900 | | | | 203,736 | | | | 0.01 | % |
| | Alliant Energy Corp. | | | 109,154 | | | | 6,757,724 | | | | 0.30 | % |
| | Ameren Corp. | | | 263,890 | | | | 11,173,103 | | | | 0.50 | % |
| | Atmos Energy Corp. | | | 1,334,962 | | | | 70,752,986 | | | | 3.14 | % |
| | Avista Corp. | | | 158,472 | | | | 5,617,832 | | | | 0.25 | % |
| | Black Hills Corp. | | | 119,459 | | | | 6,537,991 | | | | 0.29 | % |
| | Centerpoint Energy, Inc. | | | 1,272,726 | | | | 31,245,423 | | | | 1.39 | % |
| | Chesapeake Utilities Corp. | | | 144,140 | | | | 6,980,700 | | | | 0.31 | % |
| | CMS Energy Corp. | | | 1,092,648 | | | | 35,696,810 | | | | 1.58 | % |
| | Consolidated Edison, Inc. | | | 656,386 | | | | 41,588,617 | | | | 1.84 | % |
| | Corning Natural Gas Holding Corp. | | | 29,687 | | | | 656,825 | | | | 0.03 | % |
| | Delta Natural Gas Company, Inc. | | | 90,047 | | | | 1,865,774 | | | | 0.08 | % |
| | Dominion Resources, Inc. | | | 1,541,896 | | | | 109,937,185 | | | | 4.88 | % |
| | DTE Energy Co. | | | 431,954 | | | | 35,489,341 | | | | 1.57 | % |
| | Duke Energy Corp. | | | 201,837 | | | | 16,580,910 | | | | 0.74 | % |
| | Entergy Corp. | | | 18,050 | | | | 1,516,561 | | | | 0.07 | % |
| | Exelon Corp. | | | 647,881 | | | | 23,705,966 | | | | 1.05 | % |
| | Gas Natural, Inc. | | | 94,250 | | | | 1,069,737 | | | | 0.05 | % |
| | Iberdrola SA- ADR (c) | | | 557,830 | | | | 15,814,480 | | | | 0.70 | % |
| | Integrys Energy Group, Inc. | | | 497,488 | | | | 36,157,428 | | | | 1.60 | % |
| | MDU Resources Group, Inc. | | | 971,407 | | | | 27,374,249 | | | | 1.21 | % |
| | MGE Energy, Inc. | | | 58,496 | | | | 2,601,317 | | | | 0.12 | % |
| | National Fuel Gas Co. | | | 568,824 | | | | 39,379,685 | | | | 1.75 | % |
The accompanying notes are an integral part of these financial statements.
| | COMMON STOCKS | | Number | | | | | | % of | |
| | | | of Shares | | | Value | | | Net Assets | |
| | Utilities (Continued) | | | | | | | | | |
| | National Grid PLC – ADR (c) | | | 1,484,923 | | | $ | 110,463,422 | | | | 4.90 | % |
| | New Jersey Resources Corp. | | | 367,642 | | | | 21,499,704 | | | | 0.95 | % |
| | NiSource, Inc. | | | 2,602,131 | | | | 109,445,630 | | | | 4.85 | % |
| | Northeast Utilities | | | 420,975 | | | | 20,775,116 | | | | 0.92 | % |
| | Northwest Natural Gas Co. | | | 321,865 | | | | 15,105,124 | | | | 0.67 | % |
| | Northwestern Corp. | | | 150,198 | | | | 7,936,462 | | | | 0.35 | % |
| | One Gas, Inc. | | | 613,578 | | | | 23,285,285 | | | | 1.03 | % |
| | ONEOK, Inc. | | | 1,629,098 | | | | 96,019,036 | | | | 4.26 | % |
| | Pepco Holdings, Inc. | | | 114,904 | | | | 3,141,475 | | | | 0.14 | % |
| | PG&E Corp. | | | 1,556,799 | | | | 78,338,126 | | | | 3.47 | % |
| | Piedmont Natural Gas Company, Inc. | | | 1,007,720 | | | | 38,303,437 | | | | 1.70 | % |
| | PPL Corp. | | | 149,535 | | | | 5,232,230 | | | | 0.23 | % |
| | Public Service Enterprise Group, Inc. | | | 1,337,790 | | | | 55,264,105 | | | | 2.45 | % |
| | Questar Corp. | | | 1,719,119 | | | | 41,447,959 | | | | 1.84 | % |
| | RGC Resources, Inc. | | | 58,219 | | | | 1,178,353 | | | | 0.05 | % |
| | SCANA Corp. | | | 310,966 | | | | 17,068,924 | | | | 0.76 | % |
| | Sempra Energy | | | 1,005,940 | | | | 110,653,400 | | | | 4.91 | % |
| | South Jersey Industries, Inc. | | | 263,128 | | | | 15,429,826 | | | | 0.68 | % |
| | Southwest Gas Corp. | | | 581,840 | | | | 33,799,086 | | | | 1.50 | % |
| | TECO Energy, Inc. | | | 432,236 | | | | 8,476,148 | | | | 0.38 | % |
| | The Empire District Electric Co. | | | 31,600 | | | | 898,704 | | | | 0.04 | % |
| | The Laclede Group, Inc. | | | 533,111 | | | | 27,066,045 | | | | 1.20 | % |
| | UGI Corp. | | | 454,402 | | | | 17,126,411 | | | | 0.76 | % |
| | UIL Holdings Corp. | | | 289,133 | | | | 11,894,932 | | | | 0.53 | % |
| | Unitil Corp. | | | 98,868 | | | | 3,444,561 | | | | 0.15 | % |
| | Vectren Corp. | | | 479,416 | | | | 21,549,749 | | | | 0.96 | % |
| | WGL Holdings, Inc. | | | 496,237 | | | | 23,323,139 | | | | 1.03 | % |
| | Wisconsin Energy Corp. | | | 220,460 | | | | 10,948,044 | | | | 0.49 | % |
| | Xcel Energy, Inc. | | | 703,399 | | | | 23,542,765 | | | | 1.04 | % |
| | | | | | | | | 1,551,073,462 | | | | 68.79 | % |
| | Total Common Stocks | | | | | | | | | | | | |
| | (Cost $1,627,542,446) | | | | | | | 2,165,896,757 | | | | 96.05 | % |
The accompanying notes are an integral part of these financial statements.
HENNESSY FUNDS 1-800-966-4354
| | PARTNERSHIPS – 3.10% | | Number | | | | | | % of | |
| | | | of Shares | | | Value | | | Net Assets | |
| | Energy – 3.10% | | | | | | | | | |
| | Energy Transfer Equity LP | | | 746,288 | | | $ | 43,553,368 | | | | 1.93 | % |
| | Plains GP Holdings LP | | | 919,577 | | | | 26,373,468 | | | | 1.17 | % |
| | | | | | | | | 69,926,836 | | | | 3.10 | % |
| | Total Partnerships | | | | | | | | | | | | |
| | (Cost $30,299,238) | | | | | | | 69,926,836 | | | | 3.10 | % |
| | | | | | | | | | | | | | |
| | SHORT-TERM INVESTMENTS – 0.41% | | | | | | | | | | | | |
| | Money Market Funds – 0.41% | | | | | | | | | | | | |
| | Fidelity Government Portfolio – | | | | | | | | | | | | |
| | Institutional Class, 0.01% (b) | | | 9,277,444 | | | | 9,277,444 | | | | 0.41 | % |
| | | | | | | | | | | | | | |
| | Total Short-Term Investments | | | | | | | | | | | | |
| | (Cost $9,277,444) | | | | | | | 9,277,444 | | | | 0.41 | % |
| | | | | | | | | | | | | | |
| | Total Investments | | | | | | | | | | | | |
| | (Cost $1,667,119,128) – 99.56% | | | | | | | 2,245,101,037 | | | | 99.56 | % |
| | Other Assets in Excess | | | | | | | | | | | | |
| | of Liabilities – 0.44% | | | | | | | 9,880,483 | | | | 0.44 | % |
| | TOTAL NET ASSETS – 100.00% | | | | | | $ | 2,254,981,520 | | | | 100.00 | % |
Percentages are stated as a percent of net assets.
ADR – American Depositary Receipt
| | (a) | Non-income producing security. |
| | (b) | The rate listed is the fund’s 7-day yield as of October 31, 2014. |
| | (c) | U.S. traded security of a foreign corporation. |
The accompanying notes are an integral part of these financial statements.
Summary of Fair Value Exposure at October 31, 2014
The following is a summary of the inputs used to value the Fund’s net assets as of October 31, 2014 (See Note 3 in the accompanying notes to the financial statements):
| Common Stocks | | Level 1 | | | Level 2 | | | Level 3 | | | Total | |
| Energy | | $ | 602,853,295 | | | $ | — | | | $ | — | | | $ | 602,853,295 | |
| Financials | | | 11,970,000 | | | | — | | | | — | | | | 11,970,000 | |
| Utilities | | | 1,550,416,637 | | | | 656,825 | | | | — | | | | 1,551,073,462 | |
| Total Common Stocks | | $ | 2,165,239,932 | | | $ | 656,825 | | | $ | — | | | $ | 2,165,896,757 | |
| Partnerships | | | | | | | | | | | | | | | | |
| Energy | | $ | 69,926,836 | | | $ | — | | | $ | — | | | $ | 69,926,836 | |
| Total Partnerships | | $ | 69,926,836 | | | $ | — | | | $ | — | | | $ | 69,926,836 | |
| Short-Term Investments | | | | | | | | | | | | | | | | |
| Money Market Funds | | $ | 9,277,444 | | | $ | — | | | $ | — | | | $ | 9,277,444 | |
| Total Short-Term Investments | | $ | 9,277,444 | | | $ | — | | | $ | — | | | $ | 9,277,444 | |
| Total Investments | | $ | 2,244,444,212 | | | $ | 656,825 | | | $ | — | | | $ | 2,245,101,037 | |
Transfers between levels are recognized at the end of the reporting period. During the year ended October 31, 2014, the Fund recognized no transfers between Levels.
The accompanying notes are an integral part of these financial statements.
HENNESSY FUNDS 1-800-966-4354
Financial Statements
Statement of Assets and Liabilities as of October 31, 2014 |
| ASSETS: | | | |
| Investments in securities, at value (cost $1,667,119,128) | | $ | 2,245,101,037 | |
| Cash | | | 731,365 | |
| Dividends and interest receivable | | | 3,643,015 | |
| Receivable for fund shares sold | | | 6,539,497 | |
| Receivable for securities sold | | | 16,313,564 | |
| Return of capital receivable | | | 371,960 | |
| Prepaid expenses and other assets | | | 61,796 | |
| Total Assets | | | 2,272,762,234 | |
| | | | | |
| LIABILITIES: | | | | |
| Payable for securities purchased | | | 13,755,157 | |
| Payable for fund shares redeemed | | | 2,373,652 | |
| Payable to advisor | | | 730,573 | |
| Payable to administrator | | | 378,188 | |
| Payable to auditor | | | 19,101 | |
| Accrued interest payable | | | 3,888 | |
| Accrued trustees fees | | | 1,748 | |
| Accrued expenses and other payables | | | 518,407 | |
| Total Liabilities | | | 17,780,714 | |
| NET ASSETS | | $ | 2,254,981,520 | |
| | | | | |
| NET ASSETS CONSIST OF: | | | | |
| Capital stock | | $ | 1,644,165,856 | |
| Accumulated net investment income | | | 953,691 | |
| Accumulated net realized gain on investments | | | 31,880,064 | |
| Unrealized net appreciation on investments | | | 577,981,909 | |
| Total Net Assets | | $ | 2,254,981,520 | |
| | | | | |
| NET ASSETS | | | | |
| Investor Class: | | | | |
| Shares authorized (no par value) | | Unlimited | |
| Net assets applicable to outstanding Investor Class shares | | | 2,254,981,520 | |
| Shares issued and outstanding | | | 72,047,128 | |
| Net asset value, offering price and redemption price per share | | $ | 31.30 | |
The accompanying notes are an integral part of these financial statements.
Statement of Operations for the year ended October 31, 2014 |
| INVESTMENT INCOME: | | | |
Dividend income(1) | | $ | 51,183,131 | |
| Interest income | | | 2,324 | |
| Total investment income | | | 51,185,455 | |
| | | | | |
| EXPENSES: | | | | |
| Investment advisory fees (See Note 5) | | | 6,761,138 | |
| Sub-transfer agent expenses – Investor Class (See Note 5) | | | 3,185,943 | |
| Administration, fund accounting, custody and transfer agent fees | | | 1,904,647 | |
| Membership fees | | | 676,114 | |
| Reports to shareholders | | | 179,021 | |
| Federal and state registration fees | | | 57,765 | |
| Compliance expense | | | 21,488 | |
| Legal fees | | | 21,029 | |
| Trustees’ fees and expenses | | | 21,019 | |
| Audit fees | | | 19,100 | |
| Interest expense (See Note 6) | | | 3,889 | |
| Other expenses | | | 83,765 | |
| Total expenses | | | 12,934,918 | |
| NET INVESTMENT INCOME | | $ | 38,250,537 | |
| | | | | |
| REALIZED AND UNREALIZED GAINS: | | | | |
| Net realized gain on investments | | $ | 47,518,015 | |
| Net change in unrealized appreciation on investments | | | 248,176,790 | |
| Net gain on investments | | | 295,694,805 | |
| NET INCREASE IN NET ASSETS RESULTING FROM OPERATIONS | | $ | 333,945,342 | |
| (1) | Net of foreign taxes withheld and issuance fees of $842,582. |
The accompanying notes are an integral part of these financial statements.
HENNESSY FUNDS 1-800-966-4354
(This Page Intentionally Left Blank.)
Financial Statements
| Statements of Changes in Net Assets |
| | | Year Ended | | | Year Ended | |
| | | October 31, 2014 | | | October 31, 2013 | |
| OPERATIONS: | | | | | | |
| Net investment income | | $ | 38,250,537 | | | $ | 23,732,673 | |
| Net realized gain on investments | | | 47,518,015 | | | | 20,377,887 | |
| Net change in unrealized appreciation on investments | | | 248,176,790 | | | | 131,840,690 | |
| Net increase in net assets resulting from operations | | | 333,945,342 | | | | 175,951,250 | |
| | | | | | | | | |
| DISTRIBUTIONS TO SHAREHOLDERS FROM: | | | | | | | | |
| Net investment income – Investor Class | | | (36,086,377 | ) | | | (23,162,526 | ) |
| Net realized gains – Investor Class | | | (27,515,134 | ) | | | (17,562,108 | ) |
| Total distributions | | | (63,601,511 | ) | | | (40,724,634 | ) |
| | | | | | | | | |
| CAPITAL SHARE TRANSACTIONS: | | | | | | | | |
| Proceeds from shares subscribed – Investor Class | | | 1,127,467,551 | | | | 575,374,779 | |
| Dividends reinvested – Investor Class | | | 60,140,074 | | | | 38,473,417 | |
| Cost of shares redeemed – Investor Class | | | (385,760,784 | )(1) | | | (313,104,396 | )(2) |
| Net increase in net assets derived | | | | | | | | |
| from capital share transactions | | | 801,846,841 | | | | 300,743,800 | |
| TOTAL INCREASE IN NET ASSETS | | | 1,072,190,672 | | | | 435,970,416 | |
| | | | | | | | | |
| NET ASSETS: | | | | | | | | |
| Beginning of year | | | 1,182,790,848 | | | | 746,820,432 | |
| End of year | | $ | 2,254,981,520 | | | $ | 1,182,790,848 | |
| Undistributed net investment income, end of year | | $ | 953,691 | | | $ | — | |
| | | | | | | | | |
| CHANGES IN SHARES OUTSTANDING: | | | | | | | | |
| Shares sold – Investor Class | | | 38,906,149 | | | | 23,099,378 | |
| Shares issued to holders as reinvestment | | | | | | | | |
| of dividends – Investor Class | | | 2,174,333 | | | | 1,647,989 | |
| Shares redeemed – Investor Class | | | (13,350,971 | ) | | | (12,830,834 | ) |
| Net increase in shares outstanding | | | 27,729,511 | | | | 11,916,533 | |
| (1) | Net of redemption fees of $6,816 related to redemption fees imposed by the FBR Gas Utility Index Fund during a prior year but not received until the fiscal year 2014. |
| (2) | Net of redemption fees of $4,408 related to redemption fees imposed by the FBR Gas Utility Index Fund during a prior year but not received until the fiscal year 2013. |
The accompanying notes are an integral part of these financial statements.
HENNESSY FUNDS 1-800-966-4354
Financial Statements
For an Investor Class share outstanding throughout each year
PER SHARE DATA:
Net asset value, beginning of year
Income from investment operations:
Net investment income
Net realized and unrealized gains on investments
Total from investment operations
Less distributions:
Dividends from net investment income
Dividends from net realized gains
Total distributions
Paid-in capital from redemption fees
Net asset value, end of year
TOTAL RETURN
SUPPLEMENTAL DATA AND RATIOS:
Net assets, end of year (millions)
Ratio of expenses to average net assets:
Before expense reimbursement
After expense reimbursement
Ratio of net investment income to average net assets:
Before expense reimbursement
After expense reimbursement
Portfolio turnover rate
| (1) | Calculated based on average shares outstanding method. |
| (2) | Amount is less than $0.01. |
The accompanying notes are an integral part of these financial statements.
| Year Ended October 31, | |
| 2014 | | | 2013 | | | 2012 | | | 2011 | | | 2010 | |
| | | | | | | | | | | | | | |
| $ | 26.69 | | | $ | 23.05 | | | $ | 21.21 | | | $ | 17.83 | | | $ | 15.13 | |
| | | | | | | | | | | | | | | | | | | |
| | | | | | | | | | | | | | | | | | | |
| | 0.62 | | | | 0.62 | | | | 0.58 | | | | 0.51 | (1) | | | 0.58 | |
| | 5.18 | | | | 4.18 | | | | 1.99 | | | | 3.59 | | | | 2.72 | |
| | 5.80 | | | | 4.80 | | | | 2.57 | | | | 4.10 | | | | 3.30 | |
| | | | | | | | | | | | | | | | | | | |
| | | | | | | | | | | | | | | | | | | |
| | (0.59 | ) | | | (0.61 | ) | | | (0.58 | ) | | | (0.51 | ) | | | (0.58 | ) |
| | (0.60 | ) | | | (0.55 | ) | | | (0.16 | ) | | | (0.21 | ) | | | (0.02 | ) |
| | (1.19 | ) | | | (1.16 | ) | | | (0.74 | ) | | | (0.72 | ) | | | (0.60 | ) |
| | 0.00 | (2) | | | 0.00 | (2) | | | 0.01 | | | | 0.00 | (2) | | | 0.00 | (2) |
| $ | 31.30 | | | $ | 26.69 | | | $ | 23.05 | | | $ | 21.21 | | | $ | 17.83 | |
| | | | | | | | | | | | | | | | | | | |
| | 22.49 | % | | | 21.70 | % | | | 12.41 | % | | | 23.54 | % | | | 22.25 | % |
| | | | | | | | | | | | | | | | | | | |
| | | | | | | | | | | | | | | | | | | |
| $ | 2,254.98 | | | $ | 1,182.79 | | | $ | 746.82 | | | $ | 433.78 | | | $ | 244.04 | |
| | | | | | | | | | | | | | | | | | | |
| | 0.77 | % | | | 0.80 | % | | | 0.69 | % | | | 0.71 | % | | | 0.77 | % |
| | 0.77 | % | | | 0.80 | % | | | 0.69 | % | | | 0.71 | % | | | 0.76 | % |
| | | | | | | | | | | | | | | | | | | |
| | 2.26 | % | | | 2.56 | % | | | 2.72 | % | | | 2.68 | % | | | 3.50 | % |
| | 2.26 | % | | | 2.56 | % | | | 2.72 | % | | | 2.68 | % | | | 3.51 | % |
| | 20 | % | | | 18 | % | | | 16 | % | | | 17 | % | | | 16 | % |
The accompanying notes are an integral part of these financial statements.
HENNESSY FUNDS 1-800-966-4354
Financial Statements
Notes to Financial Statements October 31, 2014 |
1). ORGANIZATION
The Hennessy Gas Utility Index Fund (the “Fund”) is a series of Hennessy Funds Trust (the “Trust”), which was organized as a Delaware statutory trust on September 17, 1992. The Fund is an open-end management investment company registered under the Investment Company Act of 1940, as amended. The Fund is a successor to the FBR Gas Utility Index Fund (the “Predecessor FBR Fund”), a series of The FBR Funds, a Delaware statutory trust, pursuant to a reorganization that took place after the close of business on October 26, 2012. Prior to October 26, 2012, the Fund had no investment operations. As a result of the reorganization, holders of the Investor Class shares of the Predecessor FBR Fund received Investor Class shares of the Fund (the Investor Class shares of the Fund are the successor to the accounting and performance information of the Predecessor FBR Fund). The investment objective of the Fund is income and capital appreciation. The Fund is a non-diversified fund.
The Fund offers Investor Class shares.
2). SIGNIFICANT ACCOUNTING POLICIES
The following is a summary of significant accounting policies consistently followed by the Fund in the preparation of the financial statements. These policies are in conformity with U.S. generally accepted accounting principles (“GAAP”).
| a). | Investment Valuation – All investments in securities are recorded at their estimated fair value, as described in Note 3. |
| b). | Federal Income Taxes – Provision for federal income taxes or excise taxes has not been made since the Fund has elected to be taxed as a “regulated investment company” and intends to distribute substantially all of its taxable income to its shareholders and otherwise comply with the provisions of the Internal Revenue Code of 1986, as amended, applicable to regulated investment companies. Net investment income or loss and realized gains and losses for federal income tax purposes may differ from that reported on the financial statements because of temporary book and tax basis differences. Temporary differences are primarily the result of the treatment of wash sales for tax reporting purposes. Distributions from net realized gains for book purposes may include short-term capital gains, which are included as ordinary income to shareholders for tax purposes. |
| | Due to inherent differences in the recognition of income, expenses, and realized gains/losses under GAAP and federal income tax regulations, permanent differences between book and tax basis reporting for the 2014 fiscal year have been identified and appropriately reclassified on the Statement of Assets and Liabilities. The adjustments are as follow: |
| Undistributed | Accumulated | |
| Net Investment | Net Realized | |
| Loss | Gain | Paid-in Capital |
| $(1,210,469) | $746,577 | $463,892 |
| c). | Income and Expenses – Dividend income is recognized on the ex-dividend date or as soon as information is available to the Fund. Interest income, which includes the amortization of premium and accretion of discount, is recognized on an accrual basis. |
| | The Fund is charged for those expenses that are directly attributable to the portfolio, such as advisory, administration, and certain shareholder service fees. |
| d). | Distributions to Shareholders – Dividends from net investment income for the Fund, if any, are declared and paid out on a calendar quarter basis. Distributions of net realized capital gains, if any, are declared and paid annually, usually in November or December. |
| e). | Security Transactions – Investment and shareholder transactions are recorded on the trade date. The Fund determines the gain or loss realized from the investment transactions by comparing the original cost of the security lot sold with the net sale proceeds. Discounts and premiums on securities purchased are accreted/amortized over the life of the respective security. |
| f). | Use of Estimates – The preparation of financial statements in conformity with GAAP requires management to make estimates and assumptions that affect the reported amounts of assets and liabilities and disclosure of contingent assets and liabilities at the date of the financial statements and the reported change in net assets during the reporting period. Actual results could differ from those estimates. |
| g). | Share Valuation – The net asset value (“NAV”) per share of the Fund is calculated by dividing the sum of the value of the securities held by the Fund, plus cash or other assets, minus all liabilities (including estimated accrued expenses) by the total number of shares outstanding for the Fund, rounded to the nearest cent. The Fund’s shares will not be priced on days the New York Stock Exchange is closed for trading. The offering and redemption price per share for the Fund is equal to the Fund’s NAV per share. |
| h). | Foreign Currency – Values of investments denominated in foreign currencies are converted into U.S. dollars using the spot market rate of exchange at the time of valuation. Purchases and sales of investments and income are translated into U.S. dollars using the spot market rate of exchange prevailing on the respective dates of such transactions. The Fund does not isolate the portion of the results of operations resulting from fluctuations in foreign exchange rates on investments from fluctuations resulting from changes in the market prices of securities held. Such fluctuations are included with the net realized and unrealized gain or loss on investments. Foreign investments present additional risks due to currency fluctuations, economic and political factors, lower liquidity, government regulations, differences in accounting standards, and other factors. |
| i). | Forward Contracts – The Fund may enter into forward currency contracts to reduce its exposure to changes in foreign currency exchange rates on its foreign holdings and to lock in the U.S. dollar cost of firm purchase and sale commitments for securities denominated in foreign currencies. A forward currency contract is a commitment to purchase or sell a foreign currency at a future date at a negotiated forward rate. The gain or loss arising from the difference between the U.S. dollar cost of the original contract and the value of the foreign currency in U.S. dollars upon closing of such contract is included in net realized gain or loss from foreign currency transactions. During the fiscal year ended October 31, 2014, the Fund did not enter into any forward contracts. |
| j). | Repurchase Agreements – The Fund may enter into repurchase agreements with member banks or security dealers of the Federal Reserve Board whom the investment advisor deems creditworthy. The repurchase price generally equals the price paid by the Fund plus interest negotiated on the basis of current short-term rates. |
HENNESSY FUNDS 1-800-966-4354
| | Securities pledged as collateral for repurchase agreements are held by the custodian bank until the respective agreements mature. Provisions of the repurchase agreements ensure that the market value of the collateral, including accrued interest thereon, is sufficient to cover the repurchase amount in the event of default of the counterparty. If the counterparty defaults and the value of the collateral declines or if the counterparty enters an insolvency proceeding, realization of the collateral by the Fund may be delayed or limited. |
| k). | Accounting for Uncertainty in Income Taxes – The Fund has adopted accounting policies regarding recognition and measurement of tax positions taken or expected to be taken on a tax return. The tax returns of the Fund for the prior three fiscal years are open for examination. The Fund has reviewed all open tax years in major jurisdictions and concluded that there is no impact on the Fund’s net assets and no tax liability resulting from unrecognized tax benefits relating to uncertain income tax positions taken or expected to be taken on a tax return. The Fund’s major tax jurisdictions are U.S. federal and Delaware. |
| l). | Derivatives – The Fund may invest in, or enter into, derivatives, such as options, futures contracts, options on futures contracts, and swaps, for a variety of reasons, including to hedge certain risks, to provide a substitute for purchasing or selling particular securities, or to increase potential income gain. Derivatives may provide a cheaper, quicker, or more specifically focused way for a Fund to invest than “traditional” securities would. The main purpose of utilizing these derivative instruments is for hedging purposes. |
| | The Fund has adopted the financial accounting reporting rules as required by the Derivatives and Hedging Topic of the Financial Accounting Standards Board Accounting Standards Codification. Under such rules, the Fund is required to include enhanced disclosure that enables investors to understand how and why an entity uses derivatives, how derivatives are accounted for, and how derivatives instruments affect an entity’s results of operations and financial position. During the fiscal year ended October 31, 2014, the Fund did not hold any derivative instruments. |
| m). | Events Subsequent to the Fiscal Period End – The Fund has adopted financial reporting rules regarding subsequent events that require an entity to recognize in the financial statements the effects of all subsequent events that provide additional evidence about conditions that existed at the date of the balance sheet. Management has evaluated the Fund’s related events and transactions that occurred subsequent to October 31, 2014 through the date of issuance of the Fund’s financial statements. There were no events or transactions that occurred during this period that materially impacted the amounts or disclosures in the Fund’s financial statements. |
3). SECURITIES VALUATION
The Fund has adopted authoritative fair valuation accounting standards that establish an authoritative definition of fair value and set out a hierarchy for measuring fair value. These standards require additional disclosures about the various inputs and valuation techniques used to develop the measurements of fair value and a discussion in changes in valuation techniques and related inputs during the period. These inputs are summarized in the three broad levels listed below:
| | Level 1 – | Quoted unadjusted prices for identical instruments in active markets to which the Fund has access at the date of measurement. |
| | Level 2 – | Quoted prices for similar instruments in active markets; quoted prices for identical or similar instruments in markets that are not active; and model- |
| | | derived valuations in which all significant inputs and significant value drivers are observable in active markets. Level 2 inputs are those in markets for which there are few transactions, the prices are not current, the prices are fair value adjusted due to post-market close subsequent events (foreign markets), little public information exists, or instances where prices vary substantially over time or among brokered market makers. These inputs may also include interest rates, prepayment speeds, credit risk curves, default rates, and similar data. |
| | Level 3 – | Model-derived valuations in which one or more significant inputs or significant value drivers are unobservable. Unobservable inputs are those inputs that reflect the Fund’s own assumptions about what market participants would use to price the asset or liability based on the best available information. |
Following is a description of the valuation techniques applied to the Fund’s major categories of assets and liabilities measured at fair value on a recurring basis.
Equity Securities – Equity securities, including common stocks, preferred stocks, foreign issued common stocks, exchange traded funds, closed-end mutual funds, and real estate investment trusts, that are traded on a securities exchange for which a last-quoted sales price is readily available will generally be valued at the last sales price as reported by the primary exchange on which the securities are listed. Securities listed on The NASDAQ Stock Market (“NASDAQ”) will be valued at the NASDAQ Official Closing Price, which may differ from the last sales price reported. Securities traded on a securities exchange for which a last-quoted sales price is not readily available will generally be valued at the mean between the bid and ask prices. To the extent these securities are actively traded and valuation adjustments are not applied, they are classified in Level 1 of the fair value hierarchy.
Investment Companies – Investments in investment companies (e.g., mutual funds and exchange traded funds) are generally priced at the ending NAV provided by the Fund’s service agent and will be classified in Level 1 of the fair value hierarchy.
Debt Securities – Debt securities, including corporate bonds, asset-backed securities, mortgage-backed securities, municipal bonds, U.S. Treasuries, and U.S. government agency issues, are valued at market on the basis of valuations furnished by an independent pricing service that utilizes both dealer-supplied valuations and formula-based techniques. The pricing service may consider recently executed transactions in securities of the issuer or comparable issuers, market price quotations (where observable), bond spreads, and fundamental data relating to the issuer. In addition, the model may incorporate market observable data such as reported sales of similar securities, broker quotes, yields, bids, offers, and reference data. Certain securities are valued principally using dealer quotations. These securities are generally classified in Level 2 of the fair value hierarchy.
Short-Term Securities – Short-term equity investments, including money market funds, are valued in the manner specified above. Short-term debt investments are generally valued at amortized cost, which approximates fair market value, if their original maturity was 60 days or less, or by amortizing the values as of the 61st day prior to maturity, if their original term to maturity exceeded 60 days. Amortized cost is not used if its use would be inappropriate due to credit or other impairments of the issuer, in which the security would be fair valued, as described below. Short-term securities are generally classified in Level 1 or Level 2 of the fair market hierarchy depending on the inputs used and market activity levels for specific securities.
HENNESSY FUNDS 1-800-966-4354
The Board of Trustees of the Fund (the “Board”) has adopted fair value pricing procedures that are followed when a price for a security is not readily available or if a significant event has occurred that indicates the closing price of a security no longer represents the true value of that security. Fair value pricing determinations are made in good faith in accordance with these procedures. There are numerous criteria that will be given consideration in determining a fair value of a security. Some of these criteria are trading volume of security and markets, the value of other like securities, and news events with direct bearing to security or market. Fair value pricing results in an estimated price for a security that reflects the amount the Fund might reasonably expect to receive in a current sale. Depending on the relative significance of the valuation inputs, these securities may be classified in either Level 2 or Level 3 of the fair value hierarchy.
Fair valuing of foreign securities may be determined with the assistance of a pricing service using correlations between the movement of prices of such securities and indices of domestic securities and other appropriate indicators, such as closing market prices of relevant American Depositary Receipts or futures contracts. The effect of using fair value pricing is that the Fund’s NAV will reflect the affected portfolio securities’ value as determined in the judgment of the Board or its designee instead of being determined by the market. Using a fair value pricing methodology to price foreign securities may result in a value that is different from a foreign security’s most recent closing price and from the prices used by other investment companies to calculate their NAVs and are generally considered Level 2 prices in the fair valuation hierarchy. Because the Fund may invest in foreign securities, the value of the Fund’s portfolio securities may change on days when you will not be able to purchase or redeem your shares.
The Board has delegated day-to-day valuation matters to a Valuation Committee comprised of one or more representatives from Hennessy Advisors, Inc., the Fund’s investment advisor. The function of the Valuation Committee is to value securities where current and reliable market quotations are not readily available. All actions taken by the Valuation Committee are reviewed by the Board.
The Fund has performed an analysis of all existing investments to determine the significance and character of all inputs to their fair value determination. Various inputs are used in determining the value of the Fund’s investments. The inputs or methodology used for valuing securities are not necessarily an indication of the risk associated with investing in those securities. Details related to the fair valuation hierarchy of the Fund’s securities as of October 31, 2014 are included in the Fund’s Schedule of Investments.
4). INVESTMENT TRANSACTIONS
Purchases and sales of investment securities (excluding government and short-term investments) for the Fund during the fiscal year ended October 31, 2014 were $1,126,259,820 and $343,383,164, respectively.
There were no purchases or sales/maturities of long-term U.S. Government Securities for the Fund during the fiscal year ended October 31, 2014.
5). INVESTMENT MANAGEMENT FEE AND OTHER TRANSACTIONS WITH AFFILIATES
Hennessy Advisors, Inc. (the “Advisor”) is the investment advisor of the Fund. The Advisor provides the Fund with investment management services under an Investment Advisory Agreement. The Advisor furnishes all investment advice, office space, facilities, and provides most of the personnel needed by the Fund. As compensation for its services, the Advisor is entitled to a monthly fee from the Fund. The fee is based upon the average daily net assets of the Fund at the annual rate of 0.40%. The net investment advisory fees payable for the Fund as of October 31, 2014 were $730,573.
The Advisor has contractually agreed to limit the total annual operating expenses of the Fund (excluding interest, taxes, brokerage commissions, dividend expenses, acquired fund fees and expenses, extraordinary legal expenses, or any other extraordinary expenses and, from and after November 1, 2014, 12b-1 fees) to 0.85% of the Fund’s net assets through February 28, 2015.
For a period of three years after the year in which the Advisor waives or reimburses expenses, the Advisor may seek reimbursement from the Fund to the extent that total annual fund operating expenses are less than the expense limitation in effect at the time of the reimbursement. During the three years ended October 31, 2014, no Advisor fees were waived and therefore no expenses are subject to potential recovery.
The Fund has adopted a plan pursuant to Rule 12b-1 under the Investment Company Act of 1940, as amended, that authorizes payments in connection with the distribution of the Fund’s shares at an annual rate of up to 0.25% of the Fund’s average daily net assets, but the plan has not been implemented as of October 31, 2014. Amounts paid under the plan may be spent on any activities or expenses primarily intended to result in the sale of shares, including but not limited to, advertising, compensation for sales and marketing activities or financial institutions and others such as dealers and distributors, shareholder account servicing, the printing and mailing of prospectuses to other than current shareowners, and the printing and mailing of sales literature.
The Fund has entered into agreements with various brokers, dealers, and financial intermediaries in connection with the sale of shares of the Fund. The agreements provide for periodic payments by the Fund to the brokers, dealers, and financial intermediaries for providing certain shareholder maintenance services (sub-transfer agent expenses). These shareholder services include the pre-processing and quality control of new accounts, shareholder correspondence, answering customer inquiries regarding account status, and facilitating shareholder telephone transactions. Fees paid by the Fund to various brokers, dealers, and financial intermediaries for the fiscal year ended October 31, 2014 were $3,185,943.
Membership fees are paid to the American Gas Association ("AGA"), which provides administrative services to the Fund pursuant to an Administrative Services Agreement between the Fund and AGA. These administrative services include overseeing the calculation of the Gas Utility Index. AUS Consultants Utility Services performs the actual computations required to produce the Gas Utility Index and receives a fee for such calculations pursuant to a contractual arrangement with AGA. AGA does not furnish other securities advice to the Gas Utility Index Fund or the Manager or make recommendations regarding the purchase or sale of securities by the Gas Utility Index Fund. Under the terms of an agreement approved by the Board of Trustees, AGA provides the Advisor with current information regarding the common stock composition of the Gas Utility Index no less than quarterly but may supply such information more frequently. In addition, AGA provides the Gas Utility Index Fund with information on the natural gas industry. The Fund pays AGA in its capacity as administrator a fee at an annual rate of 0.04% of the average daily net assets of the Fund.
U.S. Bancorp Fund Services, LLC (“USBFS”) provides the Fund with administrative, fund accounting, and transfer agent services, including all regulatory reporting, and necessary office equipment and personnel. As administrator, USBFS prepares various federal and state regulatory filings, reports, and returns for the Fund; prepares reports and materials to be supplied to the Board; monitors the activities of the Fund’s custodian, transfer agent, and accountants; and coordinates the preparation and payment of the Fund’s expenses and reviews the Fund’s expense accruals. Fees paid to USBFS for the fiscal year ended October 31, 2014 were $1,904,647.
HENNESSY FUNDS 1-800-966-4354
U.S. Bank, N.A., an affiliate of USBFS, serves as the Fund’s custodian. Quasar Distributors, LLC acts as the Fund’s principal underwriter in a continuous public offering of the Fund’s shares. Quasar Distributors, LLC is an affiliate of USBFS and U.S. Bank, N.A.
6). LINE OF CREDIT
The Fund has a line of credit with the other funds in the Hennessy Funds family of funds (the “Hennessy Funds”) in the amount of the lesser of (i) $100,000,000 or (ii) 33.33% of each Hennessy Fund’s net assets, or 30% for the Hennessy Gas Utility Index Fund and 10% for the Hennessy Balanced Fund, intended to provide short-term financing, if necessary, subject to certain restrictions, in connection with shareholder redemptions. The credit facility is with the Hennessy Funds’ custodian bank, U.S. Bank, N.A. Borrowings under this arrangement bear interest at the bank’s prime rate. During the fiscal year ended October 31, 2014, the Fund had an outstanding average daily balance and a weighted average interest rate of $179,167 and 3.25%, respectively. The maximum amount outstanding for the Fund during the period was $18,704,000. At October 31, 2014, the Fund had a loan payable balance of $0.
7). FEDERAL TAX INFORMATION
As of October 31, 2014, the components of accumulated earnings (losses) for income tax purposes for the Fund were as follow:
| | Cost of investments for tax purposes | | $ | 1,701,300,811 | |
| | Gross tax unrealized appreciation | | $ | 589,799,997 | |
| | Gross tax unrealized depreciation | | | (45,999,771 | ) |
| | Net tax unrealized appreciation | | $ | 543,800,226 | |
| | Undistributed ordinary income | | $ | 43,176,035 | |
| | Undistributed long-term capital gains | | | 23,839,403 | |
| | Total distributable earnings | | $ | 67,015,438 | |
| | Other accumulated gain | | $ | — | |
| | Total accumulated gain | | $ | 610,815,664 | |
The difference between book-basis and tax-basis unrealized appreciation is attributable primarily to wash sales and partnership adjustments.
At October 31, 2014, the Fund had no tax basis capital losses to offset future capital gains.
At October 31, 2014, the Fund did not defer, on a tax basis, any late year ordinary losses.
The tax character of distributions paid during fiscal year 2014 and fiscal year 2013 for the Fund were as follow:
| | | | Year Ended | | | Year Ended | |
| | | | October 31, 2014 | | | October 31, 2013 | |
| | Ordinary income | | $ | 46,037,795 | | | $ | 25,896,541 | |
| | Long-term capital gain | | | 17,563,716 | | | | 14,828,093 | |
| | | | $ | 63,601,511 | | | $ | 40,724,634 | |
8). EVENTS SUBSEQUENT TO YEAR-END
On December 8, 2014, a short-term capital gains distribution of $0.57900 per share and long-term capital gains distribution of $0.32673 per share were declared and paid to shareholders of record on December 5, 2014.
Report of Independent Registered Public Accounting Firm
To the Board of Trustees of Hennessy Funds Trust
And the Shareholders of Hennessy Gas Utility Index Fund
We have audited the accompanying statement of assets and liabilities, including the schedule of investments, of the Hennessy Gas Utility Index Fund (the “Fund”), a series of Hennessy Funds Trust (the “Trust”) as of October 31, 2014, and the related statement of operations for the year then ended, the statements of changes in net assets for each of the two years in the period then ended, and the financial highlights for each of the five years in the period then ended. These financial statements and financial highlights are the responsibility of the Funds’ management. Our responsibility is to express an opinion on these financial statements and financial highlights based on our audits.
We conducted our audits in accordance with the standards of the Public Company Accounting Oversight Board (United States). Those standards require that we plan and perform the audits to obtain reasonable assurance about whether the financial statements and financial highlights are free of material misstatement. The Fund is not required to have, nor were we engaged to perform, an audit of its internal control over financial reporting. Our audits included consideration of internal control over financial reporting as a basis for designing audit procedures that are appropriate in the circumstances, but not for the purposes of expressing an opinion on the effectiveness of the Fund’s internal control over financial reporting. Accordingly, we express no such opinion. An audit includes examining, on a test basis, evidence supporting the amounts and disclosures in the financial statements. Our procedures included confirmation of securities owned as of October 31, 2014, by correspondence with the custodian and brokers or by other appropriate auditing procedures where replies from brokers were not received. An audit also includes assessing the accounting principles used and significant estimates made by management, as well as evaluating the overall financial statement presentation. We believe that our audits provide a reasonable basis for our opinion.
In our opinion, the financial statements and financial highlights referred to above present fairly, in all material respects, the financial position of the Hennessy Gas Utility Index Fund as of October 31, 2014, the results of its operations for the year then ended, the changes in its net assets for each of the two years in the period then ended, and the financial highlights for each of the five years in the period then ended, in conformity with accounting principles generally accepted in the United States of America.
TAIT, WELLER & BAKER LLP
Philadelphia, Pennsylvania
December 30, 2014
HENNESSY FUNDS 1-800-966-4354
Trustees and Officers of the Fund (Unaudited)
The business and affairs of the Fund are managed under the direction of the Fund’s Board of Trustees. Information pertaining to the Trustees and Officers of the Fund is set forth below. The Fund’s Statement of Additional Information includes additional information about the Fund’s Trustees and Officers and is available, without charge, upon request by calling 1-800-966-4354.
| | | | | Number of | |
| | | Term of | | Portfolios | |
| | | Office | | in the | Other |
| | | and | | Fund | Directorships |
| | Position(s) | Length | Principal | Complex | (During Past |
| Name, Address, | Held with | of Time | Occupation(s) | Overseen | Five Years)(2) |
| and Age | the Fund | Served | During Past Five Years | by Trustee | Held by Trustee |
| | | |
| Disinterested Trustees (as defined below) | | |
| | | | | | |
| J. Dennis DeSousa | Trustee | Indefinite, | Mr. DeSousa is a real | 16 | Hennessy SPARX |
| Age: 78 | | until | estate investor. | | Funds Trust; |
| Address: | | successor | | | Hennessy Mutual |
| c/o Hennessy | | elected | | | Funds, Inc.; and |
| Advisors, Inc. | | | | | The Hennessy |
| 7250 Redwood Blvd. | | Served | | | Funds, Inc. |
| Suite 200 | | since | | | |
| Novato, CA 94945 | | January | | | |
| | | 1996 | | | |
| | | for the | | | |
| | | Funds (or | | | |
| | | Predecessor | | | |
| | | Funds) | | | |
| | | | | | |
| Robert T. Doyle | Trustee | Indefinite, | Mr. Doyle has been the | 16 | Hennessy SPARX |
| Age: 67 | | until | Sheriff of Marin County, | | Funds Trust; |
| Address: | | successor | California since 1996. | | Hennessy Mutual |
| c/o Hennessy | | elected | | | Funds, Inc.; and |
| Advisors, Inc. | | | | | The Hennessy |
| 7250 Redwood Blvd. | | Served | | | Funds, Inc. |
| Suite 200 | | since | | | |
| Novato, CA 94945 | | January | | | |
| | | 1996 | | | |
| | | for the | | | |
| | | Funds (or | | | |
| | | Predecessor | | | |
| | | Funds) | | | |
| | | | | | |
| Gerald P. Richardson | Trustee | Indefinite, | Mr. Richardson is an | 16 | Hennessy SPARX |
| Age: 69 | | until | independent consultant | | Funds Trust; |
| Address: | | successor | in the securities industry. | | Hennessy Mutual |
| c/o Hennessy | | elected | | | Funds, Inc.; and |
| Advisors, Inc. | | | | | The Hennessy |
| 7250 Redwood Blvd. | | Served | | | Funds, Inc. |
| Suite 200 | | since | | | |
| Novato, CA 94945 | | May 2004 | | | |
| | | for the | | | |
| | | Funds (or | | | |
| | | Predecessor | | | |
| | | Funds) | | | |
| | | | | Number of | |
| | | Term of | | Portfolios | |
| | | Office | | in the | Other |
| | | and | | Fund | Directorships |
| | Position(s) | Length | Principal | Complex | (During Past |
| Name, Address, | Held with | of Time | Occupation(s) | Overseen | Five Years)(2) |
| and Age | the Fund | Served | During Past Five Years | by Trustee | Held by Trustee |
| | | |
| “Interested Persons” (as defined in the 1940 Act) | | |
| | | |
Neil J. Hennessy(1) | Chief | Trustee: | Mr. Hennessy has been | 16 | Hennessy |
| Age: 58 | Investment | Indefinite, | employed by Hennessy | | Advisors, Inc. |
| Address: | Officer, | until | Advisors, Inc., the Funds’ | | (current); |
| c/o Hennessy | Portfolio | successor | investment advisor, since | | Hennessy SPARX |
| Advisors, Inc. | Manager, | elected | 1989. He currently serves | | Funds Trust; |
| 7250 Redwood Blvd. | President, | | as President, Chairman | | Hennessy Mutual |
| Suite 200 | Trustee | Served | and CEO of Hennessy | | Funds, Inc.; and |
| Novato, CA 94945 | and | since | Advisors, Inc. | | The Hennessy |
| | Chairman | January | | | Funds, Inc. |
| | of the | 1996 | | | |
| | Board | for the | | | |
| | | Funds (or | | | |
| | | Predecessor | | | |
| | | Funds) | | | |
| | | | | | |
| | | Officer: | | | |
| | | 1 year term | | | |
| | | | | | |
| | | Served | | | |
| | | since | | | |
| | | June 2008 | | | |
| | | for the | | | |
| | | Funds (or | | | |
| | | Predecessor | | | |
| | | Funds) | | | |
| | | | | | |
Teresa M. Nilsen(1) | Executive | 1 year term | Ms. Nilsen has been | N/A | N/A |
| Age: 48 | Vice | | employed by Hennessy | | |
| Address: | President | Served | Advisors, Inc., the Funds’ | | |
| c/o Hennessy | and | since | investment advisor, since | | |
| Advisors, Inc. | Treasurer | January | 1989. She currently serves | | |
| 7250 Redwood Blvd. | | 1996 | as Executive Vice President, | | |
| Suite 200 | | for the | Chief Operations Officer, | | |
| Novato, CA 94945 | | Funds (or | Chief Financial Officer, and | | |
| | | Predecessor | Secretary of Hennessy | | |
| | | Funds) | Advisors, Inc. | | |
| (1) | All Officers of the Hennessy Funds and employees of the Manager are Interested Persons of the Funds. |
| (2) | Pursuant to an internal reorganization, the series of Hennessy Mutual Funds, Inc. (“HMFI”), The Hennessy Funds, Inc. (“HFI”) and Hennessy SPARX Funds Trust (“HSFT”) were reorganized into series of Hennessy Funds Trust on February 28, 2014, which mirrored the corresponding series of HFMI, HFI and HSFT. Subsequent to the reorganization, HFMI, HFI and HSFT were dissolved. |
HENNESSY FUNDS 1-800-966-4354
| | | Term of | |
| | | Office | |
| | | and | |
| | Position(s) | Length | Principal |
| Name, Address, | Held with | of Time | Occupation(s) |
| and Age | the Fund | Served | During Past Five Years |
| | | | |
| Interested Persons | | | |
| | | | |
Daniel B. Steadman(1) | Executive | 1 year term | Mr. Steadman has been employed by |
| Age: 58 | Vice President | | Hennessy Advisors, Inc., the Funds’ |
| Address: | and Secretary | Served since | investment advisor, since 2000. |
| c/o Hennessy Advisors, Inc. | | March 2000 | He currently serves as Executive |
| 7250 Redwood Blvd. | | for the Funds (or | Vice President and Chief Compliance |
| Suite 200 | | Predecessor Funds) | Officer of Hennessy Advisors, Inc. |
| Novato, CA 94945 | | | |
| | | | |
Jennifer Cheskiewicz(1) | Senior | 1 year term | Ms. Cheskiewicz has been employed by |
| Age: 37 | Vice President | | Hennessy Advisors, Inc., the Funds’ |
| Address: | and Chief | Served since | investment advisor, since June 2013. |
| c/o Hennessy Advisors, Inc. | Compliance | June 2013 | She previously served as in-house |
| 7250 Redwood Blvd. | Officer | for the Funds (or | counsel to Carlson Capital, L.P., an |
| Suite 200 | | Predecessor Funds) | SEC-registered investment advisor to |
| Novato, CA 94945 | | | several private funds from February |
| | | | 2010 to May 2013. Prior to that, she |
| | | | was an attorney with Gibson, Dunn & |
| | | | Crutcher LLP from September 2005 |
| | | | through February 2010. She currently |
| | | | serves as General Counsel of |
| | | | Hennessy Advisors, Inc. |
| | | | |
Brian Carlson(1) | Senior | 1 year term | Mr. Carlson has been employed by |
| Age: 42 | Vice President | | Hennessy Advisors, Inc., the Funds’ |
| Address: | and Head of | Served since | investment advisor, since |
| c/o Hennessy Advisors, Inc. | Distribution | December 2013 | December 2013. |
| 7250 Redwood Blvd. | | for the Funds (or | |
| Suite 200 | | Predecessor Funds) | Mr. Carlson was previously a |
| Novato, CA 94945 | | | co-founder and principal of Trivium |
| | | | Consultants, LLC from February 2011 |
| | | | through November 2013. Prior to that, |
| | | | he was the Senior Managing Director |
| | | | of NRP Financial, Inc. from August |
| | | | 2007 through February 2011. |
| | | | |
David Ellison(1) | Portfolio Manager | 1 year term | Mr. Ellison has served as Portfolio |
| Age: 56 | and Senior | | Manager of the Large Cap Financial |
| Address: | Vice President | Served since | Fund, the Small Cap Financial Fund, |
| c/o Hennessy Advisors, Inc. | | October 2012 | and the Technology Fund |
| 101 Federal Street | | for the Funds (or | since inception. |
| Suite 1900 | | Predecessor Funds) | |
| Boston, MA 02110 | | | Mr. Ellison previously served as Director, |
| | | | CIO and President of FBR Advisers, Inc. |
| | | | from December 1999 to October 2012. |
| (1) | All Officers of the Hennessy Funds and employees of the Manager are Interested Persons of the Funds. |
| | | Term of | |
| | | Office | |
| | | and | |
| | Position(s) | Length | Principal |
| Name, Address, | Held with | of Time | Occupation(s) |
| and Age | the Fund | Served | During Past Five Years |
| | | | |
| Interested Persons | | | |
| | | | |
Brian Peery(1) | Portfolio Manager | 1 year term | Mr. Peery has been a Portfolio Manager |
| Age: 45 | and | | of the Cornerstone Growth Fund, |
| Address: | Vice President | Served since | the Cornerstone Mid Cap 30 Fund, the |
| c/o Hennessy Advisors, Inc. | | March 2003 | Cornerstone Large Growth Fund, the |
| 7250 Redwood Blvd. | | as Vice President | Cornerstone Value Fund, the Total |
| Suite 200 | | for the Funds (or | Return Fund, and the Balanced Fund |
| Novato, CA 94945 | | Predecessor Funds) | since October 2014. From February |
| | | | 2011 through September 2014, he |
| | | Served since | served as Co-Portfolio Manager of |
| | | February 2011 | the same funds. |
| | | as Co-Portfolio | |
| | | Manager | Mr. Peery has been employed by |
| | | for the Funds (or | Hennessy Advisors, Inc., the Funds’ |
| | | Predecessor Funds) | investment advisor, since 2002. |
| | | | |
Winsor (Skip) Aylesworth(1) | Portfolio Manager | 1 year term | Mr. Aylesworth has been Portfolio |
| Age: 67 | and | | Manager of the Gas Utility Index Fund |
| Address: | Vice President | Served since | since 1998 and Portfolio Manager of |
| c/o Hennessy Advisors, Inc. | | October 2012 | the Technology Fund since inception. |
| 101 Federal Street | | for the Funds (or | |
| Suite 1900 | | Predecessor Funds) | Mr. Aylesworth previously served as |
| Boston, MA 02110 | | | Executive Vice President of The FBR |
| | | | Funds from 1999 to October 2012. |
| | | | |
Ryan Kelley(1) | Portfolio Manager | 1 year term | Mr. Kelley has been a Portfolio Manager |
| Age: 42 | and | | of the Gas Utility Index Fund (formerly |
| Address: | Vice President | Served since | the FBR Gas Utility Index Fund), the |
| c/o Hennessy Advisors, Inc. | | March 2013 | Small Cap Financial Fund (formerly the |
| 1340 Environ Way | | for the Funds (or | FBR Small Cap Financial Fund), and the |
| Chapel Hill, NC 27517 | | Predecessor Funds) | Large Cap Financial Fund (formerly the |
| | | | FBR Large Cap Financial Fund) since |
| | | | October 2014. From March 2013 |
| | | | through September 2014, he served |
| | | | as a Co-Portfolio Manager of the same |
| | | | funds. Prior to that, he was a Portfolio |
| | | | Analyst of the Hennessy Funds. |
| | | | |
| | | | Mr. Kelley previously served as Portfolio |
| | | | Manager of The FBR Funds from |
| | | | January 2008 to October 2012. |
| (1) | All Officers of the Hennessy Funds and employees of the Manager are Interested Persons of the Funds. |
HENNESSY FUNDS 1-800-966-4354
Expense Example (Unaudited)
October 31, 2014
As a shareholder of the Fund, you incur two types of costs: (1) transaction costs, including sales charges (loads) on purchase payments, reinvested dividends, or other distributions; redemption fees; and exchange fees; and (2) ongoing costs, including management fees; service fees; and other Fund expenses. This Example is intended to help you understand your ongoing costs (in dollars) of investing in the Fund and to compare these costs with the ongoing costs of investing in other mutual funds. The Example is based on an investment of $1,000 invested at the beginning of the period and held for the entire period from May 1, 2014 through October 31, 2014.
Actual Expenses
The first line of the table below provides information about actual account values and actual expenses. Although the Fund charges no sales loads or transaction fees, you will be assessed fees for outgoing wire transfers, returned checks and stop payment orders at prevailing rates charged by U.S. Bancorp Fund Services, LLC, the Fund’s transfer agent. If you request that a redemption be made by wire transfer, currently a $15.00 fee is charged by the Fund’s transfer agent. IRA accounts will be charged a $15.00 annual maintenance fee. The example below includes, but is not limited to, management fees, shareholder servicing fees, fund accounting, custody, and transfer agent fees. However, the example below does not include portfolio trading commissions and related expenses, and other extraordinary expenses as determined under generally accepted accounting principles. You may use the information in this line, together with the amount you invested, to estimate the expenses that you paid over the period. Simply divide your account value by $1,000 (for example, an $8,600 account value divided by $1,000 = 8.6), then multiply the result by the number in the first line of the table under the heading entitled “Expenses Paid During Period” to estimate the expenses you paid on your account during this period.
Hypothetical Example for Comparison Purposes
The second line of the table below provides information about hypothetical account values and hypothetical expenses based on the Fund’s actual expense ratios and an assumed rate of return of 5% per year before expenses, which is not the Fund’s actual return. The hypothetical account values and expenses may not be used to estimate the actual ending account balance or expenses you paid for the period. You may use this information to compare the ongoing costs of investing in the Fund and other funds. To do so, compare this 5% hypothetical example with the 5% hypothetical examples that appear in the shareholder reports of the other funds. Please note that the expenses shown in the table are meant to highlight your ongoing costs only and do not reflect any transactional costs, such as sales charges (loads), or exchange fees. Therefore, the second line of the table is useful in comparing ongoing costs only, and will not help you determine the relative total costs of owning different funds. In addition, if these transactional costs were included, your costs would have been higher.
| | Beginning | Ending | Expenses Paid |
| | Account Value | Account Value | During Period(1) |
| | 5/1/14 | 10/31/14 | 5/1/14 – 10/31/14 |
| Investor Class | | | |
| | | | |
| Actual | $1,000.00 | $1,079.30 | $3.98 |
| | | | |
| Hypothetical (5% return | | | |
| before expenses) | $1,000.00 | $1,021.37 | $3.87 |
| (1) | Expenses are equal to the Fund’s expense ratio of 0.76% for Investor Class shares, as applicable multiplied by the average account value over the period, multiplied by 184/365 days (to reflect one-half year period). |
HENNESSY FUNDS 1-800-966-4354
Proxy Voting
A description of the policies and procedures the Fund uses to determine how to vote proxies relating to portfolio securities is available without charge: (1) by calling 1-800-966-4354; (2) on the Hennessy Funds’ website at hennessyfunds.com; or (3) on the U.S. Securities and Exchange Commission’s (the “SEC”) website at www.sec.gov. The Fund’s proxy voting record is available on both the Hennessy Funds’ website at hennessyfunds.com and the SEC’s website at www.sec.gov no later than August 31 for the prior 12 months ending June 30.
Quarterly Filings on Form N-Q
The Fund files its complete schedule of portfolio holdings with the SEC for the first and third quarters of each fiscal year on Form N-Q. The Fund’s Forms N-Q are available on the SEC’s website at www.sec.gov. The Fund’s Forms N-Q may be reviewed and copied at the SEC’s Public Reference Room in Washington, DC and information on the operation of the Public Reference Room may be obtained by calling 1-800-SEC-0330. Information included in the Fund’s Forms N-Q will also be available upon request by calling 1-800-966-4354.
Federal Tax Distribution Information
(Unaudited)
For the fiscal year ended October 31, 2014, certain dividends paid by the Fund may be subject to a maximum tax rate of 20%, as provided for by the Jobs and Growth Tax Relief Reconciliation Act of 2003. The percentage of dividends declared from ordinary income designated as qualified dividend income was 72.18%.
For corporate shareholders, the percent of ordinary income distributions qualifying for the corporate dividends received deduction for the fiscal year ended October 31, 2014 was 58.73%.
The percentage of taxable ordinary income distributions that are designated as short-term capital gain distributions under Section 871(k)(2)(C) of the Internal Revenue Code of 1986, as amended, for the Fund was 21.62%.
Householding
To help keep the Fund’s costs as low as possible, we generally deliver a single copy of most financial reports and prospectuses to shareholders who share an address, even if the accounts are registered under different names. This process, known as “householding,” does not apply to account statements. You may, of course, request an individual copy of a prospectus or financial report at any time. If you would like to receive separate mailings, please call the Administrator at 1-800-261-6950 or 1-414-765-4124 and we will begin individual delivery within 30 days of your request. If your account is held through a financial institution or other intermediary, please contact them directly to request individual delivery.
Privacy Policy
We collect the following non-public personal information about you:
| | • | information we receive from you on or in applications or other forms, correspondence, or conversations, including, but not limited to, your name, address, phone number, social security number, assets, income and date of birth; |
| | | and |
| | • | information about your transactions with us, our affiliates, or others, including, but not limited to, your account number and balance, payment history, parties to transactions, cost basis information and other financial information. |
We do not disclose any non-public personal information about our current or former shareholders to nonaffiliated third parties, except as permitted by law. For example, we are permitted by law to disclose all of the information we collect, as described above, to our Transfer Agent to process your transactions. Furthermore, we restrict access to your non-public personal information to those persons who require such information to provide products or services to you. We maintain physical, electronic and procedural safeguards that comply with federal standards to guard your non-public personal information.
In the event that you hold shares of the Fund through a financial intermediary, including, but not limited to, a broker-dealer, bank or trust company, the privacy policy of your financial intermediary would govern how your non-public personal information would be shared with nonaffiliated third parties.
HENNESSY FUNDS 1-800-966-4354
For information, questions or assistance, please call
The Hennessy Funds
1-800-966-4354 or 1-415-899-1555
INVESTMENT ADVISOR
Hennessy Advisors, Inc.
7250 Redwood Blvd., Suite 200
Novato, California 94945
ADMINISTRATOR,
TRANSFER AGENT,
DIVIDEND PAYING AGENT &
SHAREHOLDER SERVICING AGENT
U.S. Bancorp Fund Services, LLC
P.O. Box 701
Milwaukee, Wisconsin 53201-0701
CUSTODIAN
U.S. Bank N.A.
Custody Operations
1555 North River Center Dr., Suite 302
Milwaukee, Wisconsin 53212
TRUSTEES
Neil J. Hennessy
Robert T. Doyle
J. Dennis DeSousa
Gerald P. Richardson
COUNSEL
Foley & Lardner LLP
777 East Wisconsin Avenue
Milwaukee, Wisconsin 53202-5306
INDEPENDENT REGISTERED
PUBLIC ACCOUNTING FIRM
Tait, Weller & Baker LLP
1818 Market Street, Suite 2400
Philadelphia, Pennsylvania 19103
DISTRIBUTOR
Quasar Distributors, LLC
615 East Michigan Street
Milwaukee, Wisconsin 53202
hennessyfunds.com | 1-800-966-4354
This report has been prepared for shareholders and may be distributed to
others only if preceded or accompanied by a current prospectus.
ANNUAL REPORT
OCTOBER 31, 2014
HENNESSY SMALL CAP
FINANCIAL FUND
Investor Class HSFNX
Institutional Class HISFX
hennessyfunds.com | 1-800-966-4354
(This Page Intentionally Left Blank.)
Contents
| Letter to Shareholders | 2 |
| Performance Overview | 4 |
| Financial Statements | |
| Schedule of Investments | 7 |
| Statement of Assets and Liabilities | 10 |
| Statement of Operations | 11 |
| Statements of Changes in Net Assets | 12 |
| Financial Highlights | 14 |
| Notes to the Financial Statements | 18 |
| Report of Independent Registered Public Accounting Firm | 25 |
| Trustees and Officers of the Fund | 26 |
| Expense Example | 30 |
| Proxy Voting | 32 |
| Quarterly Filings on Form N-Q | 32 |
| Federal Tax Distribution Information | 32 |
| Householding | 32 |
| Privacy Policy | 33 |
HENNESSY FUNDS 1-800-966-4354
December 2014
Dear Shareholder:
As I look back at 2014, I realize that in this age of rapidly evolving technology, information is delivered and absorbed so quickly that it is difficult to remember what happened last week, let alone what’s happened over the course of an entire year. That is why I’d like to take a moment to recall some of the year’s highs and lows, economically, politically and socially, here in the U.S. and around the globe. 2014 was scarred by political partisanship, civil unrest in the U.S., Ukraine and many other countries, the arrival of terrorist group ISIS, the tragedies of school shootings and natural disasters, and the frightening outbreak of Ebola. However, there were also positive events this year: we survived a government shutdown over healthcare reform, jobs reports have been consistently, albeit anemically, improving, and home prices remained relatively stable, after recovering significantly in 2013. And, important to us here at Hennessy, our hometown team, the San Francisco Giants, won their third World Series in just five years!
A significant event for the financial industry this past year was the confirmation of Janet Yellen as Chair of the Federal Reserve, which served to calm the nerves of business and political leaders alike. I believe Yellen’s leadership will benefit U.S. business owners, as the Fed continues to be a voice of reason in a sea of political and economic rhetoric. The Fed has also supported the economy and corporate America by helping keep interest rates reasonable and low.
The stock market has continued its determined comeback from the lows of 2009, setting multiple record highs in recent months. The U.S. financial markets have provided strong returns over the past twelve-month period ended October 31, 2014, with the Dow Jones Industrial Average (DJIA) returning over 14% and S&P 500 Index returning over 17% during the period. The DJIA currently has a dividend yield of 2.2%, which is equal to that of a 10-Year U.S. Treasury, which is currently also yielding 2.2%. I continue to believe that investments in high-yielding, high-quality stocks have the potential to not only provide income but also the potential for stock price appreciation as well. Fixed income investing has run its course, in my opinion, and many individuals are currently benefiting from the return to investing in equities that possess strong fundamentals. American investors are slowly migrating from fixed income to equities. Currently, 54% of Americans invest in stocks, and I do expect this percentage to increase, especially if interest rates move higher.
For the past several years, U.S. corporations have been driving shareholder value by making acquisitions, initiating and raising dividends, investing in internal infrastructure and buying back stock. However, this year I began to see a shift from those strategies. I believe the easier to execute acquisitions are a thing of the past, and firms now have to be even more creative to execute accretive deals. I also believe that while firms may continue to initiate dividends, fewer firms will raise their dividends and fewer firms will participate in stock buyback programs going forward. What will these cash-rich companies do with their capital if they are not raising dividends or buying back stock? I believe they may begin to initiate capital expenditure programs that could truly benefit economic growth.
Liquidity and monetary conditions are supportive, causing the cost of capital to be very low. I believe firms will choose to spend capital to expand their sales, and they may even begin to hire in earnest. Once a company begins to move in this way, the cost to
defer becomes real for competitors. With almost $3 trillion in cash and short-term investments sitting on the balance sheets of the S&P 500 companies, a strategic shift by firms to spend their idle capital, while slow, could potentially further economic growth in the U.S. in my opinion.
Economic progress and growth remain slow, yet steady, and unemployment, though improving, remains high. Oil prices have fallen, giving consumers a bit more discretionary income. While the midterm elections may not end all of the gridlock in Washington, hopefully we will receive clarity on the political headwinds of taxes and regulations, which have not improved over the past several years.
The markets have had several quarters without any truly significant downturn. The pullbacks we recently experienced, most notably in July and October, were short-lived, as evidenced by the quick rebound to record high market levels. I firmly believe that we are in a secular bull market, and I continue to tell investors to try to remain calm in the face of volatility and continue to focus on the strong, long-term fundamentals that are evident in the market today. Many companies continue to have strong balance sheets, with record cash flows and profits. With this current bull market in its fifth year, investors should expect some volatility.
I am encouraged by the strong returns for the major U.S. financial market indices and by the performance of the Hennessy Funds over the past year. Thank you for your continued confidence and investment in our products. If you have any questions or would like to speak with us directly, please don’t hesitate to call us at (800) 966-4354.
Best regards,
Neil J. Hennessy
President and Chief Investment Officer
Past performance does not guarantee future results.
Mutual fund investing involves risk. Principal loss is possible.
Opinions expressed are those of Neil Hennessy and are subject to change, are not guaranteed and should not be considered investment advice.
The Dow Jones Industrial Average and S&P 500 Index are unmanaged indices commonly used to measure the performance of U.S. stocks. One cannot invest directly in an index.
Cash flow can be used as an indication of a company’s financial strength. A firm’s cash flow is the movement of cash in and out of the firm in the form of payments to suppliers and collections from customers. Dividend Yield is calculated as the annual dividends paid by a company divided by the price of a share of their stock.
HENNESSY FUNDS 1-800-966-4354
Performance Overview (Unaudited)
The opinions expressed in the following commentary reflect those of the Portfolio Managers as of the date written. Any such opinions are subject to change based on market or other conditions and are not guaranteed. These opinions may not be relied upon as investment advice. Investment decisions for the Fund are based on multiple factors, and may not be relied upon as an indication of trading intent on behalf of the Fund. Security positions can and do change.
CHANGE IN VALUE OF $10,000 INVESTMENT
This chart assumes an initial gross investment of $10,000 made on October 31, 2004. Returns shown include the reinvestment of all dividends. Returns shown do not reflect the deduction of taxes that a shareholder would pay on Fund distributions or the redemption of Fund shares.
AVERAGE ANNUAL TOTAL RETURN FOR PERIODS ENDED OCTOBER 31, 2014
| | One | Five | Ten |
| | Year | Years | Years |
| Hennessy Small Cap Financial Fund – | | | |
| Investor Class (HSFNX) | 1.40% | 10.93% | 4.55% |
| Hennessy Small Cap Financial Fund – | | | |
Institutional Class (HISFX)(1) | 1.70% | 11.20% | 4.72% |
Russell 2000® Financial | | | |
| Services Index | 12.10% | 16.64% | 5.14% |
Russell 2000® Index | 8.06% | 17.39% | 8.67% |
Expense ratios: 1.50% (Investor Class); 1.19% (Institutional Class)
Performance data quoted represents past performance; past performance does not guarantee future results. The investment return and principal value of an investment will fluctuate so that an investor’s shares, when redeemed, may be worth more or less than their original cost. Current performance of the Fund may be lower or higher than the performance quoted. Performance data current to the most recent month end may be obtained by visiting hennessyfunds.com. Performance for periods prior to October 26, 2012 is that of the FBR Small Cap Financial Fund.
The expense ratios presented are from the most recent prospectus.
| (1) | The inception date of the Institutional Class shares is May 30, 2008. Performance shown prior to the inception of the Institutional Class shares reflects the performance of the Investor Class shares and includes expenses that are not applicable to and are higher than those of the Institutional Class shares. |
PERFORMANCE NARRATIVE
Portfolio Managers David H. Ellison and Ryan Kelley
Over the previous twelve months, how did the Fund perform and what factors contributed to this performance?
For the twelve-month period ended October 31, 2014, the Investor Class of the Hennessy Small Cap Financial Fund returned 1.40%, underperforming the Russell 2000® Financial Services Index, the Russell 2000® Index and the Morningstar Financial Category Average, which returned 12.10%, 8.06% and 10.51% for the same period, respectively.
Companies with the strongest performance contributions to the Fund during the period include commercial real estate finance companies and traditional banks. Specific positions that contributed most strongly to the Fund’s performance include NorthStar Realty Finance Corp., Banner Corp. and Popular, Inc. The Fund no longer owns NorthStar Realty.
Companies detracting from the Fund’s performance during the period include mortgage finance and mortgage banking companies. Specific positions that detracted from the Fund’s performance include The Bancorp Inc., Nationstar Mortgage Holdings, Inc., and Ocwen Financial Corp. The Fund no longer holds Nationstar Mortgage Holdings, Inc. or Ocwen Financial Corp.
Additional Portfolio Manager Commentary and related investment outlook:
The banking industry has recovered greatly from the financial crisis in 2008 and 2009, as credit, capital, liquidity and liability structures have improved. During calendar year 2013, housing prices and purchase activity improved, leading to increased loan growth for many banks. However, increased compliance costs, low rates and concerns about the overall strength of the economy have tempered investor interest in financial companies.
The Fund underperformed this year primarily due to its exposure to traditional banks, which rely on loan growth and lending margins. These companies were negatively impacted by the decline in interest rates that began in late Spring and the slowdown in housing demand that had been strong throughout most of calendar year 2013. In a nutshell, many of the fundamental improvements seen in 2013 slowed in 2014. That being said, we believe traditional banks offer the most conservative balance sheet structures and greatest earnings per share upside potential, and we continue to invest in these types of companies.
We believe there is still much opportunity for small financial companies going forward, driven by loan growth, improved spreads, cost containment, fee income growth, reduced credit costs and valuation benefits from increased consolidation in the industry. By focusing on earnings growth, earnings quality, balance sheet stability and valuations, we believe the Fund is well positioned in some of the best potential opportunities within small-cap financials.
The Russell 2000® Financial Services Index is an unmanaged index commonly used to measure the performance of U.S. small-capitalization financial sector stocks. The Russell 2000® Index is an unmanaged index commonly used to measure the performance of U.S. small-capitalization stocks. You cannot invest directly in an index. Performance data for an index does not reflect any deductions for fees, expenses or taxes. The Fund is non-diversified, meaning it concentrates its assets in fewer holdings than a diversified fund and is therefore more exposed to individual stock volatility than a diversified fund. The Fund invests in smaller-capitalization companies, which involves additional risks such as more limited liquidity and greater volatility than large-capitalization companies. Investments are focused in the financial services industry, which may be adversely affected by regulatory or other market conditions such as rising interest rates. References to specific securities
HENNESSY FUNDS 1-800-966-4354
should not be considered a recommendation to buy or sell any security. Fund holdings and sector allocations are subject to change. Please refer to the Schedule of Investments included in this report for additional portfolio information.
Earnings per share is the portion of a company’s profit allocated to each outstanding share of common stock. It serves as an indicator of a company’s profitability. Earnings growth is not a measure of the Fund’s future performance.
Each Morningstar category average represents a universe of funds with similar investment objectives. © Morningstar, Inc. All Rights Reserved. The information contained herein: 1) is proprietary to Morningstar; 2) may not be copied or distributed and 3) is not warranted to be accurate, complete or timely. Neither Morningstar nor its content providers are responsible for any damages or losses arising from any use of this information. Past performance does not guarantee future results.
Financial Statements
HENNESSY SMALL CAP FINANCIAL FUND
As of October 31, 2014
(% of Net Assets)
| TOP TEN HOLDINGS (EXCLUDING CASH/CASH EQUIVALENTS) | % NET ASSETS |
| | |
| Banner Corp. | 4.41% |
| Synovus Financial Corp. | 4.31% |
| Washington Federal, Inc. | 4.27% |
| Provident Financial Services, Inc. | 4.22% |
| Flushing Financial Corp. | 4.11% |
| Zions Bancorporation | 4.06% |
| Astoria Financial Corp. | 4.02% |
| BankUnited, Inc. | 4.00% |
| Investors Bancorp, Inc. | 3.97% |
| Wintrust Financial Corp. | 3.74% |
Note: For presentation purposes, the Fund has grouped some of the industry categories. For purposes of categorizing securities for compliance with Section 8(b)(1) of the Investment Company Act of 1940, the Fund uses more specific industry classifications.
HENNESSY FUNDS 1-800-966-4354
| | COMMON STOCKS – 95.06% | | Number | | | | | | % of | |
| | | | of Shares | | | Value | | | Net Assets | |
| | Financials – 95.06% | | | | | | | | | |
| | Associated Banc-Corp. | | | 405,000 | | | $ | 7,614,000 | | | | 3.24 | % |
| | Astoria Financial Corp. | | | 720,000 | | | | 9,468,000 | | | | 4.02 | % |
| | Bancorp Inc. Del (a) | | | 25,000 | | | | 236,500 | | | | 0.10 | % |
| | BankUnited, Inc. | | | 315,000 | | | | 9,418,500 | | | | 4.00 | % |
| | Banner Corp. | | | 240,000 | | | | 10,372,800 | | | | 4.41 | % |
| | Blue Hills Bancorp, Inc. (a) | | | 305,000 | | | | 4,065,650 | | | | 1.73 | % |
| | Capital Bank Financial Corp. (a) | | | 246,000 | | | | 6,368,940 | | | | 2.71 | % |
| | Clifton Bancorp, Inc. | | | 555,000 | | | | 7,226,100 | | | | 3.07 | % |
| | Customers Bancorp, Inc. (a) | | | 290,000 | | | | 5,539,000 | | | | 2.35 | % |
| | Encore Capital Group, Inc. (a) | | | 125,000 | | | | 5,688,750 | | | | 2.42 | % |
| | First Niagara Financial Group, Inc. | | | 115,000 | | | | 861,350 | | | | 0.37 | % |
| | Flagstar Bancorp, Inc. (a) | | | 195,000 | | | | 3,065,400 | | | | 1.30 | % |
| | Flushing Financial Corp. | | | 480,000 | | | | 9,667,200 | | | | 4.11 | % |
| | Fulton Financial Corp. | | | 410,000 | | | | 4,870,800 | | | | 2.07 | % |
| | Genworth Financial, Inc. (a) | | | 400,000 | | | | 5,596,000 | | | | 2.38 | % |
| | Hingham Institution for Savings | | | 94,000 | | | | 7,775,680 | | | | 3.30 | % |
| | HomeStreet, Inc. | | | 48,283 | | | | 841,090 | | | | 0.36 | % |
| | Independent Bank Corp. | | | 120,000 | | | | 4,896,000 | | | | 2.08 | % |
| | Investors Bancorp, Inc. | | | 870,000 | | | | 9,352,500 | | | | 3.97 | % |
| | MBIA, Inc. (a) | | | 245,000 | | | | 2,391,200 | | | | 1.02 | % |
| | Meridian Bancorp Inc Md (a) | | | 145,000 | | | | 1,644,300 | | | | 0.70 | % |
| | MGIC Investment Corp. (a) | | | 530,000 | | | | 4,727,600 | | | | 2.01 | % |
| | OceanFirst Financial Corp. | | | 221,600 | | | | 3,671,912 | | | | 1.56 | % |
| | Popular, Inc. (a) (b) | | | 160,000 | | | | 5,100,800 | | | | 2.17 | % |
| | Provident Financial Services, Inc. | | | 545,000 | | | | 9,935,350 | | | | 4.22 | % |
| | Radian Group, Inc. | | | 515,000 | | | | 8,677,750 | | | | 3.69 | % |
| | Servisfirst Bancshares, Inc. | | | 92,000 | | | | 2,713,080 | | | | 1.15 | % |
| | Square 1 Financial, Inc. (a) | | | 142,000 | | | | 2,824,380 | | | | 1.20 | % |
| | Stonegate Mortgage Corp. (a) | | | 225,000 | | | | 3,253,500 | | | | 1.38 | % |
| | Susquehanna Bancshares, Inc. | | | 730,000 | | | | 7,161,300 | | | | 3.04 | % |
| | Synovus Financial Corp. | | | 400,000 | | | | 10,144,000 | | | | 4.31 | % |
| | Territorial Bancorp, Inc. | | | 15,000 | | | | 322,200 | | | | 0.14 | % |
| | Umpqua Holdings Corp. | | | 210,000 | | | | 3,696,000 | | | | 1.57 | % |
| | United Financial Bancorp, Inc. | | | 420,000 | | | | 5,892,600 | | | | 2.50 | % |
The accompanying notes are an integral part of these financial statements.
| | COMMON STOCKS | | Number | | | | | | % of | |
| | | | of Shares | | | Value | | | Net Assets | |
| | Financials (Continued) | | | | | | | | | |
| | Washington Federal, Inc. | | | 460,000 | | | $ | 10,041,800 | | | | 4.27 | % |
| | Webster Financial Corp. | | | 120,000 | | | | 3,760,800 | | | | 1.60 | % |
| | Wintrust Financial Corp. | | | 190,000 | | | | 8,800,800 | | | | 3.74 | % |
| | WSFS Financial Corp. | | | 82,000 | | | | 6,449,300 | | | | 2.74 | % |
| | Zions Bancorporation | | | 330,000 | | | | 9,560,100 | | | | 4.06 | % |
| | | | | | | | | 223,693,032 | | | | 95.06 | % |
| | Total Common Stocks | | | | | | | | | | | | |
| | (Cost $188,020,746) | | | | | | | 223,693,032 | | | | 95.06 | % |
| | | | | | | | | | | | | | |
| | SHORT-TERM INVESTMENTS – 4.96% | | | | | | | | | | | | |
| | Money Market Funds – 4.96% | | | | | | | | | | | | |
| | Federated Government Obligations Fund – Class I, 0.01% (c) | | | 68,154 | | | | 68,154 | | | | 0.03 | % |
| | Fidelity Government Portfolio – Institutional Class, 0.01% (c) | | | 11,600,000 | | | | 11,600,000 | | | | 4.93 | % |
| | | | | | | | | 11,668,154 | | | | 4.96 | % |
| | Total Short-Term Investments | | | | | | | | | | | | |
| | (Cost $11,668,154) | | | | | | | 11,668,154 | | | | 4.96 | % |
| | | | | | | | | | | | | | |
| | Total Investments | | | | | | | | | | | | |
| | (Cost $199,688,900) – 100.02% | | | | | | | 235,361,186 | | | | 100.02 | % |
| | Liabilities in Excess | | | | | | | | | | | | |
| | of Other Assets – (0.02)% | | | | | | | (36,516 | ) | | | (0.02 | )% |
| | TOTAL NET ASSETS – 100.00% | | | | | | $ | 235,324,670 | | | | 100.00 | % |
Percentages are stated as a percent of net assets.
| | (a) | Non-income producing security. |
| | (b) | U.S. traded security of a foreign corporation. |
| | (c) | The rate listed is the fund’s 7-day yield as of October 31, 2014. |
Summary of Fair Value Exposure at October 31, 2014
The following is a summary of the inputs used to value the Fund’s net assets as of October 31, 2014 (See Note 3 in the accompanying notes to the financial statements):
| | Common Stocks | | Level 1 | | | Level 2 | | | Level 3 | | | Total | |
| | Financials | | $ | 223,693,032 | | | $ | — | | | $ | — | | | $ | 223,693,032 | |
| | Total Common Stocks | | $ | 223,693,032 | | | $ | — | | | $ | — | | | $ | 223,693,032 | |
| | Short-Term Investments | | | | | | | | | | | | | | | | |
| | Money Market Funds | | $ | 11,668,154 | | | $ | — | | | $ | — | | | $ | 11,668,154 | |
| | Total Short-Term Investments | | $ | 11,668,154 | | | $ | — | | | $ | — | | | $ | 11,668,154 | |
| | Total Investments | | $ | 235,361,186 | | | $ | — | | | $ | — | | | $ | 235,361,186 | |
Transfers between levels are recognized at the end of the reporting period. During the year ended October 31, 2014, the Fund recognized no transfers between levels.
The accompanying notes are an integral part of these financial statements.
HENNESSY FUNDS 1-800-966-4354
Financial Statements
Statement of Assets and Liabilities as of October 31, 2014 |
| ASSETS: | | | |
| Investments in securities, at value (cost $199,688,900) | | $ | 235,361,186 | |
| Dividends and interest receivable | | | 134,352 | |
| Receivable for fund shares sold | | | 30,125 | |
| Receivable for securities sold | | | 914,655 | |
| Prepaid expenses and other assets | | | 17,592 | |
| Total Assets | | | 236,457,910 | |
| | | | | |
| LIABILITIES: | | | | |
| Payable for securities purchased | | | 437,700 | |
| Payable for fund shares redeemed | | | 371,755 | |
| Payable to advisor | | | 172,442 | |
| Payable to administrator | | | 42,854 | |
| Payable to auditor | | | 19,102 | |
| Accrued distribution fees | | | 40,471 | |
| Accrued trustees fees | | | 2,417 | |
| Accrued expenses and other payables | | | 46,499 | |
| Total Liabilities | | | 1,133,240 | |
| NET ASSETS | | $ | 235,324,670 | |
| | | | | |
| NET ASSETS CONSIST OF: | | | | |
| Capital stock | | $ | 169,473,793 | |
| Accumulated net investment loss | | | (483,665 | ) |
| Accumulated net realized gain on investments | | | 30,662,256 | |
| Unrealized net appreciation on investments | | | 35,672,286 | |
| Total Net Assets | | $ | 235,324,670 | |
| | | | | |
| NET ASSETS | | | | |
| Investor Class: | | | | |
| Shares authorized (no par value) | | Unlimited | |
| Net assets applicable to outstanding Investor Class shares | | $ | 193,093,087 | |
| Shares issued and outstanding | | | 8,002,433 | |
| Net asset value, offering price and redemption price per share | | $ | 24.13 | |
| | | | | |
| Institutional Class: | | | | |
| Shares authorized (no par value) | | Unlimited | |
| Net assets applicable to outstanding Institutional Class shares | | $ | 42,231,583 | |
| Shares issued and outstanding | | | 2,906,227 | |
| Net asset value, offering price and redemption price per share | | $ | 14.53 | |
The accompanying notes are an integral part of these financial statements.
Financial Statements
Statement of Operations for the year ended October 31, 2014 |
| INVESTMENT INCOME: | | | |
| Dividend income | | $ | 3,026,045 | |
| Interest income | | | 655 | |
| Total investment income | | | 3,026,700 | |
| | | | | |
EXPENSES: | | | | |
| Investment advisory fees (See Note 5) | | | 2,523,773 | |
| Distribution fees – Investor Class (See Note 5) | | | 554,612 | |
| Administration, fund accounting, custody and transfer agent fees | | | 320,986 | |
| Sub-transfer agent expenses – Investor Class (See Note 5) | | | 270,529 | |
| Sub-transfer agent expenses – Institutional Class (See Note 5) | | | 27,219 | |
| Federal and state registration fees | | | 38,157 | |
| Reports to shareholders | | | 35,294 | |
| Compliance expense | | | 21,488 | |
| Audit fees | | | 19,100 | |
| Trustees’ fees and expenses | | | 11,358 | |
| Legal fees | | | 5,001 | |
| Interest expense (See Note 6) | | | 2,287 | |
| Other expenses | | | 22,273 | |
| Total expenses | | | 3,852,077 | |
| NET INVESTMENT LOSS | | $ | (825,377 | ) |
| | | | | |
| REALIZED AND UNREALIZED GAINS (LOSSES): | | | | |
| Net realized gain on investments | | $ | 34,099,662 | |
| Net change in unrealized depreciation on investments | | | (28,573,406 | ) |
| Net gain on investments | | | 5,526,256 | |
| NET INCREASE IN NET ASSETS RESULTING FROM OPERATIONS | | $ | 4,700,879 | |
The accompanying notes are an integral part of these financial statements.
HENNESSY FUNDS 1-800-966-4354
Financial Statements
| Statements of Changes in Net Assets |
| | | Year Ended | | | Year Ended | |
| | | October 31, 2014 | | | October 31, 2013 | |
| OPERATIONS: | | | | | | |
| Net investment income (loss) | | $ | (825,377 | ) | | $ | 1,386,645 | |
| Net realized gain on investments | | | 34,099,662 | | | | 27,485,214 | |
| Net change in unrealized appreciation (depreciation) | | | | | | | | |
| on investments | | | (28,573,406 | ) | | | 40,111,802 | |
| Net increase in net assets resulting from operations | | | 4,700,879 | | | | 68,983,661 | |
| | | | | | | | | |
| DISTRIBUTIONS TO SHAREHOLDERS FROM: | | | | | | | | |
| Net investment income | | | | | | | | |
| Investor Class | | | (583,882 | ) | | | (1,118,880 | ) |
| Institutional Class | | | (611,323 | ) | | | (520,872 | ) |
| Net realized gains | | | | | | | | |
| Investor Class | | | (15,192,379 | ) | | | — | |
| Institutional Class | | | (6,931,392 | ) | | | — | |
| Total distributions | | | (23,318,976 | ) | | | (1,639,752 | ) |
| | | | | | | | | |
| CAPITAL SHARE TRANSACTIONS: | | | | | | | | |
| Proceeds from shares subscribed – Investor Class | | | 28,573,914 | | | | 91,423,499 | |
| Proceeds from shares subscribed – Institutional Class | | | 6,485,452 | | | | 25,715,806 | |
| Dividends reinvested – Investor Class | | | 15,450,637 | | | | 1,096,037 | |
| Dividends reinvested – Institutional Class | | | 3,238,127 | | | | 123,116 | |
| Cost of shares redeemed – Investor Class | | | (81,963,023 | )(1) | | | (71,541,810 | )(2) |
| Cost of shares redeemed – Institutional Class | | | (30,064,869 | ) | | | (12,933,095 | ) |
| Net increase (decrease) in net assets derived | | | | | | | | |
| from capital share transactions | | | (58,279,762 | ) | | | 33,883,553 | |
| TOTAL INCREASE (DECREASE) IN NET ASSETS | | | (76,897,859 | ) | | | 101,227,462 | |
| | | | | | | | | |
| NET ASSETS: | | | | | | | | |
| Beginning of year | | | 312,222,529 | | | | 210,995,067 | |
| End of year | | $ | 235,324,670 | | | $ | 312,222,529 | |
| Undistributed net investment | | | | | | | | |
| income (loss), end of year | | $ | (483,665 | ) | | $ | 598,791 | |
| (1) | Net of redemption fees of $12,269 related to redemption fees imposed by the FBR Small Cap Financial Fund during a prior year but not received until the fiscal year ended October 31, 2014. |
| (2) | Net of redemption fees of $2,257 related to redemption fees imposed by the FBR Small Cap Financial Fund during a prior year but not received until fiscal year 2013. |
The accompanying notes are an integral part of these financial statements.
| Statements of Changes in Net Assets – Continued |
| | | Year Ended | | | Year Ended | |
| | | October 31, 2014 | | | October 31, 2013 | |
| CHANGES IN SHARES OUTSTANDING: | | | | | | |
| Shares sold – Investor Class | | | 1,158,040 | | | | 4,155,799 | |
| Shares sold – Institutional Class | | | 438,519 | | | | 1,761,812 | |
| Shares issued to holders as reinvestment | | | | | | | | |
| of dividends – Investor Class | | | 624,580 | | | | 55,049 | |
| Shares issued to holders as reinvestment | | | | | | | | |
| of dividends – Institutional Class | | | 216,313 | | | | 9,865 | |
| Shares redeemed – Investor Class | | | (3,361,999 | ) | | | (3,185,460 | ) |
| Shares redeemed – Institutional Class | | | (2,059,169 | ) | | | (1,010,378 | ) |
| Net increase (decrease) in shares outstanding | | | (2,983,716 | ) | | | 1,786,687 | |
The accompanying notes are an integral part of these financial statements.
HENNESSY FUNDS �� 1-800-966-4354
Financial Statements
For an Investor Class share outstanding throughout each year
PER SHARE DATA:
Net asset value, beginning of year
Income from investment operations:
Net investment income (loss)
Net realized and unrealized gains (losses) on investments
Total from investment operations
Less distributions:
Dividends from net investment income
Dividends from net realized gains
Total distributions
Paid-in capital from redemption fees
Net asset value, end of year
TOTAL RETURN
SUPPLEMENTAL DATA AND RATIOS:
Net assets, end of year (millions)
Ratio of expenses to average net assets
Ratio of net investment income (loss) to average net assets
Portfolio turnover rate(3)
| (1) | Calculated based on average shares outstanding method. |
| (2) | Amount is less than $0.01. |
| (3) | Portfolio turnover is calculated on the basis of the Fund as a whole. |
The accompanying notes are an integral part of these financial statements.
| Year Ended October 31, | |
| 2014 | | | 2013 | | | 2012 | | | 2011 | | | 2010 | |
| | | | | | | | | | | | | | |
| $ | 25.40 | | | $ | 19.54 | | | $ | 16.48 | | | $ | 18.11 | | | $ | 15.91 | |
| | | | | | | | | | | | | | | | | | | |
| | | | | | | | | | | | | | | | | | | |
| | (0.10 | ) | | | 0.10 | | | | 0.11 | | | | 0.21 | (1) | | | 0.08 | |
| | 0.49 | | | | 5.88 | | | | 3.24 | | | | (1.66 | ) | | | 2.17 | |
| | 0.39 | | | | 5.98 | | | | 3.35 | | | | (1.45 | ) | | | 2.25 | |
| | | | | | | | | | | | | | | | | | | |
| | | | | | | | | | | | | | | | | | | |
| | (0.06 | ) | | | (0.12 | ) | | | (0.29 | ) | | | (0.06 | ) | | | (0.07 | ) |
| | (1.60 | ) | | | — | | | | — | | | | (0.13 | ) | | | — | |
| | (1.66 | ) | | | (0.12 | ) | | | (0.29 | ) | | | (0.19 | ) | | | (0.07 | ) |
| | 0.00 | (2) | | | 0.00 | (2) | | | 0.00 | (2) | | | 0.01 | | | | 0.02 | |
| $ | 24.13 | | | $ | 25.40 | | | $ | 19.54 | | | $ | 16.48 | | | $ | 18.11 | |
| | | | | | | | | | | | | | | | | | | |
| | 1.40 | % | | | 30.80 | % | | | 20.65 | % | | | (8.12 | )% | | | 14.27 | % |
| | | | | | | | | | | | | | | | | | | |
| | | | | | | | | | | | | | | | | | | |
| $ | 193.09 | | | $ | 243.42 | | | $ | 167.20 | | | $ | 154.21 | | | $ | 216.75 | |
| | 1.44 | % | | | 1.46 | % | | | 1.45 | % | | | 1.52 | % | | | 1.51 | % |
| | (0.36 | )% | | | 0.48 | % | | | 0.56 | % | | | 0.81 | % | | | 0.35 | % |
| | 47 | % | | | 57 | % | | | 43 | % | | | 70 | % | | | 89 | % |
The accompanying notes are an integral part of these financial statements.
HENNESSY FUNDS 1-800-966-4354
Financial Statements
For an Institutional Class share outstanding throughout each year
PER SHARE DATA:
Net asset value, beginning of year
Income from investment operations:
Net investment income (loss)
Net realized and unrealized gains (losses) on investments
Total from investment operations
Less distributions:
Dividends from net investment income
Dividends from net realized gains
Total distributions
Paid-in capital from redemption fees
Net asset value, end of year
TOTAL RETURN
SUPPLEMENTAL DATA AND RATIOS:
Net assets, end of year (millions)
Ratio of expenses to average net assets
Ratio of net investment income (loss) to average net assets
Portfolio turnover rate(3)
| (1) | Calculated based on average shares outstanding method. |
| (2) | Amount is less than $0.01. |
| (3) | Portfolio turnover is calculated on the basis of the Fund as a whole. |
The accompanying notes are an integral part of these financial statements.
| Year Ended October 31, | |
| 2014 | | | 2013 | | | 2012 | | | 2011 | | | 2010 | |
| | | | | | | | | | | | | | |
| $ | 15.96 | | | $ | 12.34 | | | $ | 10.55 | | | $ | 11.70 | | | $ | 10.34 | |
| | | | | | | | | | | | | | | | | | | |
| | | | | | | | | | | | | | | | | | | |
| | (0.09 | ) | | | 0.14 | | | | 0.16 | | | | 0.19 | (1) | | | 0.09 | |
| | 0.40 | | | | 3.66 | | | | 1.98 | | | | (1.09 | ) | | | 1.40 | |
| | 0.31 | | | | 3.80 | | | | 2.14 | | | | (0.90 | ) | | | 1.49 | |
| | | | | | | | | | | | | | | | | | | |
| | | | | | | | | | | | | | | | | | | |
| | (0.14 | ) | | | (0.18 | ) | | | (0.35 | ) | | | (0.12 | ) | | | (0.13 | ) |
| | (1.60 | ) | | | — | | | | — | | | | (0.13 | ) | | | — | |
| | (1.74 | ) | | | (0.18 | ) | | | (0.35 | ) | | | (0.25 | ) | | | (0.13 | ) |
| | — | | | | — | | | | 0.00 | (2) | | | — | | | | 0.00 | (2) |
| $ | 14.53 | | | $ | 15.96 | | | $ | 12.34 | | | $ | 10.55 | | | $ | 11.70 | |
| | | | | | | | | | | | | | | | | | | |
| | 1.70 | % | | | 31.18 | % | | | 20.95 | % | | | (8.00 | )% | | | 14.52 | % |
| | | | | | | | | | | | | | | | | | | |
| | | | | | | | | | | | | | | | | | | |
| $ | 42.23 | | | $ | 68.80 | | | $ | 43.79 | | | $ | 19.89 | | | $ | 25.01 | |
| | 1.12 | % | | | 1.15 | % | | | 1.25 | % | | | 1.34 | % | | | 1.23 | % |
| | (0.04 | )% | | | 0.74 | % | | | 0.72 | % | | | 1.00 | % | | | 0.61 | % |
| | 47 | % | | | 57 | % | | | 43 | % | | | 70 | % | | | 89 | % |
The accompanying notes are an integral part of these financial statements.
HENNESSY FUNDS 1-800-966-4354
Financial Statements
Notes to Financial Statements October 31, 2014 |
1). ORGANIZATION
The Hennessy Small Cap Financial (the “Fund”) is a series of Hennessy Funds Trust (the “Trust”), which was organized as a Delaware statutory trust on September 17, 1992. The Fund is an open-end management investment company registered under the Investment Company Act of 1940, as amended. The Fund is a successor to the FBR Small Cap Financial Fund (the “Predecessor FBR Fund”), a series of The FBR Funds, a Delaware statutory trust, pursuant to a reorganization that took place after the close of business on October 26, 2012. Prior to October 26, 2012, the Fund had no investment operations. As a result of the reorganization, holders of the Investor Class shares of the Predecessor FBR Fund received Investor Class shares of the Fund (the Investor Class shares of the Fund are the successor to the accounting and performance information of the Predecessor FBR Fund), and holders of the Institutional Class shares of the Predecessor FBR Fund received Institutional Class shares of the Fund (the Institutional Class shares of the Fund are the successor to the accounting and performance information of the Predecessor FBR Fund). The investment objective of the Fund is capital appreciation. The Fund is a non-diversified fund.
The Fund offers Investor Class and Institutional Class shares. Each class of shares differs principally in its respective administration, 12b-1 distribution and service fees, shareholder servicing, and transfer agent expenses and sales charges, if any. Each class has identical rights to earnings, assets, and voting privileges, except for class-specific expenses and exclusive rights to vote on matters affecting only an individual class.
2). SIGNIFICANT ACCOUNTING POLICIES
The following is a summary of significant accounting policies consistently followed by the Fund in the preparation of the financial statements. These policies are in conformity with U.S. generally accepted accounting principles (“GAAP”).
| a). | Investment Valuation – All investments in securities are recorded at their estimated fair value, as described in Note 3. |
| b). | Federal Income Taxes – Provision for federal income taxes or excise taxes has not been made since the Fund has elected to be taxed as a “regulated investment company” and intends to distribute substantially all of its taxable income to its shareholders and otherwise comply with the provisions of the Internal Revenue Code of 1986, as amended, applicable to regulated investment companies. Net investment income or loss and realized gains and losses for federal income tax purposes may differ from that reported on the financial statements because of temporary book and tax basis differences. Temporary differences are primarily the result of the treatment of wash sales for tax reporting purposes. Distributions from net realized gains for book purposes may include short-term capital gains, which are included as ordinary income to shareholders for tax purposes. |
| | Due to inherent differences in the recognition of income, expenses, and realized gains/losses under GAAP and federal income tax regulations, permanent differences between book and tax basis reporting for the 2014 fiscal year have been identified |
| | and appropriately reclassified on the Statement of Assets and Liabilities. The adjustments are as follow: |
| Undistributed | Accumulated | |
| Net Investment | Net Realized | |
| Income/(Loss) | Gain/(Loss) | Paid-in Capital |
| $938,126 | $(475,379) | $(462,747) |
| c). | Income and Expenses – Dividend income is recognized on the ex-dividend date or as soon as information is available to the Fund. Interest income, which includes the amortization of premium and accretion of discount, is recognized on an accrual basis. The Fund is charged for those expenses that are directly attributable to the portfolio, such as advisory, administration, and certain shareholder service fees. Income, expenses (other than expenses attributable to a specific class), and realized and unrealized gains or losses on investments are allocated to each class of shares based on its respective net assets. |
| d). | Distributions to Shareholders – Dividends from net investment income for the Fund, if any, are declared and paid out annually, usually in December. Distributions of net realized capital gains, if any, are declared and paid annually, usually in November or December. |
| e). | Security Transactions – Investment and shareholder transactions are recorded on the trade date. The Fund determines the gain or loss realized from the investment transactions by comparing the original cost of the security lot sold with the net sale proceeds. Discounts and premiums on securities purchased are accreted/amortized over the life of the respective security. |
| f). | Use of Estimates – The preparation of financial statements in conformity with GAAP requires management to make estimates and assumptions that affect the reported amounts of assets and liabilities and disclosure of contingent assets and liabilities at the date of the financial statements and the reported change in net assets during the reporting period. Actual results could differ from those estimates. |
| g). | Share Valuation – The net asset value (“NAV”) per share of the Fund is calculated by dividing the sum of the value of the securities held by the Fund, plus cash or other assets, minus all liabilities (including estimated accrued expenses) by the total number of shares outstanding for the Fund, rounded to the nearest cent. The Fund’s shares will not be priced on days the New York Stock Exchange is closed for trading. The offering and redemption price per share for the Fund is equal to the Fund’s NAV per share. |
| h). | Foreign Currency – Values of investments denominated in foreign currencies are converted into U.S. dollars using the spot market rate of exchange at the time of valuation. Purchases and sales of investments and income are translated into U.S. dollars using the spot market rate of exchange prevailing on the respective dates of such transactions. The Fund does not isolate the portion of the results of operations resulting from fluctuations in foreign exchange rates on investments from fluctuations resulting from changes in the market prices of securities held. Such fluctuations are included with the net realized and unrealized gain or loss on investments. Foreign investments present additional risks due to currency fluctuations, economic and political factors, lower liquidity, government regulations, differences in accounting standards, and other factors. |
| i). | Forward Contracts – The Fund may enter into forward currency contracts to reduce its exposure to changes in foreign currency exchange rates on its foreign holdings |
HENNESSY FUNDS 1-800-966-4354
| | and to lock in the U.S. dollar cost of firm purchase and sale commitments for securities denominated in foreign currencies. A forward currency contract is a commitment to purchase or sell a foreign currency at a future date at a negotiated forward rate. The gain or loss arising from the difference between the U.S. dollar cost of the original contract and the value of the foreign currency in U.S. dollars upon closing of such contract is included in net realized gain or loss from foreign currency transactions. During the fiscal year ended October 31, 2014, the Fund did not enter into any forward contracts. |
| j). | Repurchase Agreements – The Fund may enter into repurchase agreements with member banks or security dealers of the Federal Reserve Board whom the investment advisor deems creditworthy. The repurchase price generally equals the price paid by the Fund plus interest negotiated on the basis of current short-term rates. |
| | Securities pledged as collateral for repurchase agreements are held by the custodian bank until the respective agreements mature. Provisions of the repurchase agreements ensure that the market value of the collateral, including accrued interest thereon, is sufficient to cover the repurchase amount in the event of default of the counterparty. If the counterparty defaults and the value of the collateral declines or if the counterparty enters an insolvency proceeding, realization of the collateral by the Fund may be delayed or limited. |
| k). | Accounting for Uncertainty in Income Taxes – The Fund has adopted accounting policies regarding recognition and measurement of tax positions taken or expected to be taken on a tax return. The tax returns of the Fund for the prior three fiscal years are open for examination. The Fund has reviewed all open tax years in major jurisdictions and concluded that there is no impact on the Fund’s net assets and no tax liability resulting from unrecognized tax benefits relating to uncertain income tax positions taken or expected to be taken on a tax return. The Fund’s major tax jurisdictions are U.S. federal and Delaware. |
| l). | Derivatives – The Fund may invest in, or enter into, derivatives, such as options, futures contracts, options on futures contracts, and swaps, for a variety of reasons, including to hedge certain risks, to provide a substitute for purchasing or selling particular securities, or to increase potential income gain. Derivatives may provide a cheaper, quicker, or more specifically focused way for a Fund to invest than “traditional” securities would. The main purpose of utilizing these derivative instruments is for hedging purposes. |
| | The Fund has adopted the financial accounting reporting rules as required by the Derivatives and Hedging Topic of the Financial Accounting Standards Board Accounting Standards Codification. Under such rules, the Fund is required to include enhanced disclosure that enables investors to understand how and why an entity uses derivatives, how derivatives are accounted for, and how derivatives instruments affect an entity’s results of operations and financial position. During the fiscal year ended October 31, 2014, the Fund did not hold any derivative instruments. |
| m). | Events Subsequent to the Fiscal Period End – The Fund has adopted financial reporting rules regarding subsequent events that require an entity to recognize in the financial statements the effects of all subsequent events that provide additional evidence about conditions that existed at the date of the balance sheet. Management has evaluated the Fund’s related events and transactions that occurred subsequent to October 31, 2014 through the date of issuance of the Fund’s financial statements. There were no events or transactions that occurred during this period that materially impacted the amounts or disclosures in the Fund’s financial statements. |
3). SECURITIES VALUATION
The Fund has adopted authoritative fair valuation accounting standards that establish an authoritative definition of fair value and set out a hierarchy for measuring fair value. These standards require additional disclosures about the various inputs and valuation techniques used to develop the measurements of fair value and a discussion in changes in valuation techniques and related inputs during the period. These inputs are summarized in the three broad levels listed below:
| | Level 1 – | Quoted unadjusted prices for identical instruments in active markets to which the Fund has access at the date of measurement. |
| | Level 2 – | Quoted prices for similar instruments in active markets; quoted prices for identical or similar instruments in markets that are not active; and model-derived valuations in which all significant inputs and significant value drivers are observable in active markets. Level 2 inputs are those in markets for which there are few transactions, the prices are not current, the prices are fair value adjusted due to post-market close subsequent events (foreign markets), little public information exists, or instances where prices vary substantially over time or among brokered market makers. These inputs may also include interest rates, prepayment speeds, credit risk curves, default rates, and similar data. |
| | Level 3 – | Model-derived valuations in which one or more significant inputs or significant value drivers are unobservable. Unobservable inputs are those inputs that reflect the Fund’s own assumptions about what market participants would use to price the asset or liability based on the best available information. |
Following is a description of the valuation techniques applied to the Fund’s major categories of assets and liabilities measured at fair value on a recurring basis.
Equity Securities – Equity securities, including common stocks, preferred stocks, foreign issued common stocks, exchange traded funds, closed-end mutual funds, and real estate investment trusts, that are traded on a securities exchange for which a last-quoted sales price is readily available will generally be valued at the last sales price as reported by the primary exchange on which the securities are listed. Securities listed on The NASDAQ Stock Market (“NASDAQ”) will be valued at the NASDAQ Official Closing Price, which may differ from the last sales price reported. Securities traded on a securities exchange for which a last-quoted sales price is not readily available will generally be valued at the mean between the bid and ask prices. To the extent these securities are actively traded and valuation adjustments are not applied, they are classified in Level 1 of the fair value hierarchy.
Investment Companies – Investments in investment companies (e.g., mutual funds and exchange traded funds) are generally priced at the ending NAV provided by the Fund’s service agent and will be classified in Level 1 of the fair value hierarchy.
Debt Securities – Debt securities, including corporate bonds, asset-backed securities, mortgage-backed securities, municipal bonds, U.S. Treasuries, and U.S. government agency issues, are valued at market on the basis of valuations furnished by an independent pricing service that utilizes both dealer-supplied valuations and formula-based techniques. The pricing service may consider recently executed transactions in securities of the issuer or comparable issuers, market price quotations (where observable), bond spreads, and fundamental data relating to the issuer. In addition, the model may incorporate market observable data such as reported sales of similar securities, broker quotes, yields, bids, offers, and reference data. Certain securities are valued principally using dealer quotations. These securities are generally classified in Level 2 of the fair value hierarchy.
HENNESSY FUNDS 1-800-966-4354
Short-Term Securities – Short-term equity investments, including money market funds, are valued in the manner specified above. Short-term debt investments are generally valued at amortized cost, which approximates fair market value, if their original maturity was 60 days or less, or by amortizing the values as of the 61st day prior to maturity, if their original term to maturity exceeded 60 days. Amortized cost is not used if its use would be inappropriate due to credit or other impairments of the issuer, in which the security would be fair valued, as described below. Short-term securities are generally classified in Level 1 or Level 2 of the fair market hierarchy depending on the inputs used and market activity levels for specific securities.
The Board of Trustees of the Fund (the “Board”) has adopted fair value pricing procedures that are followed when a price for a security is not readily available or if a significant event has occurred that indicates the closing price of a security no longer represents the true value of that security. Fair value pricing determinations are made in good faith in accordance with these procedures. There are numerous criteria that will be given consideration in determining a fair value of a security. Some of these criteria are trading volume of security and markets, the value of other like securities, and news events with direct bearing to security or market. Fair value pricing results in an estimated price for a security that reflects the amount the Fund might reasonably expect to receive in a current sale. Depending on the relative significance of the valuation inputs, these securities may be classified in either Level 2 or Level 3 of the fair value hierarchy.
Fair valuing of foreign securities may be determined with the assistance of a pricing service using correlations between the movement of prices of such securities and indices of domestic securities and other appropriate indicators, such as closing market prices of relevant American Depositary Receipts or futures contracts. The effect of using fair value pricing is that the Fund’s NAV will reflect the affected portfolio securities’ value as determined in the judgment of the Board or its designee instead of being determined by the market. Using a fair value pricing methodology to price foreign securities may result in a value that is different from a foreign security’s most recent closing price and from the prices used by other investment companies to calculate their NAVs and are generally considered Level 2 prices in the fair valuation hierarchy. Because the Fund may invest in foreign securities, the value of the Fund’s portfolio securities may change on days when you will not be able to purchase or redeem your shares.
The Board has delegated day-to-day valuation matters to a Valuation Committee comprised of one or more representatives from Hennessy Advisors, Inc., the Fund’s investment advisor. The function of the Valuation Committee is to value securities where current and reliable market quotations are not readily available. All actions taken by the Valuation Committee are reviewed by the Board.
The Fund has performed an analysis of all existing investments to determine the significance and character of all inputs to their fair value determination. Various inputs are used in determining the value of the Fund’s investments. The inputs or methodology used for valuing securities are not necessarily an indication of the risk associated with investing in those securities. Details related to the fair valuation hierarchy of the Fund’s securities as of October 31, 2014 are included in the Fund’s Schedule of Investments.
4). INVESTMENT TRANSACTIONS
Purchases and sales of investment securities (excluding government and short-term investments) for the Fund during the fiscal year ended October 31, 2014 were $128,708,225 and $213,765,374, respectively.
There were no purchases or sales/maturities of long-term U.S. Government Securities for the Fund during the fiscal year ended October 31, 2014.
5). INVESTMENT MANAGEMENT FEE AND OTHER TRANSACTIONS WITH AFFILIATES
Hennessy Advisors, Inc. (the “Advisor”) is the investment advisor of the Fund. The Advisor provides the Fund with investment management services under an Investment Advisory Agreement. The Advisor furnishes all investment advice, office space, facilities, and provides most of the personnel needed by the Fund. As compensation for its services, the Advisor is entitled to a monthly fee from the Fund. The fee is based upon the average daily net assets of the Fund at the annual rate of 0.90%. The net investment advisory fees payable for the Fund as of October 31, 2014 were $172,442.
The Advisor has contractually agreed to limit the total annual operating expenses of the Fund (excluding interest, taxes, brokerage commissions, dividend expenses, acquired fund fees and expenses, extraordinary legal expenses, or any other extraordinary expenses and, from and after November 1, 2014, 12b-1 fees) to 1.95% and 1.70% of the Fund’s net assets for the Investor Class shares and Institutional Class shares of the Fund, respectively, through February 28, 2015.
For a period of three years after the year in which the Advisor waives or reimburses expenses, the Advisor may seek reimbursement from the Fund to the extent that total annual fund operating expenses are less than the expense limitation in effect at the time of the reimbursement. During the three years ended October 31, 2014, no Advisor fees were waived and therefore no expenses are subject to potential recovery.
The Fund has adopted a plan pursuant to Rule 12b-1 under the Investment Company Act of 1940, as amended, that authorizes payments in connection with the distribution of the Fund’s shares at an annual rate of up to 0.25% of the Fund’s average daily net assets. Amounts paid under the plan may be spent on any activities or expenses primarily intended to result in the sale of shares, including but not limited to, advertising, compensation for sales and marketing activities or financial institutions and others such as dealers and distributors, shareholder account servicing, the printing and mailing of prospectuses to other than current shareowners, and the printing and mailing of sales literature.
The Fund has entered into agreements with various brokers, dealers, and financial intermediaries in connection with the sale of shares of the Fund. The agreements provide for periodic payments by the Fund to the brokers, dealers, and financial intermediaries for providing certain shareholder maintenance services (sub-transfer agent expenses). These shareholder services include the pre-processing and quality control of new accounts, shareholder correspondence, answering customer inquiries regarding account status, and facilitating shareholder telephone transactions. Fees paid by the Fund to various brokers, dealers, and financial intermediaries for the fiscal year ended October 31, 2014 were $297,748.
U.S. Bancorp Fund Services, LLC (“USBFS”) provides the Fund with administrative, fund accounting, and transfer agent services, including all regulatory reporting, and necessary office equipment and personnel. As administrator, USBFS prepares various federal and state regulatory filings, reports, and returns for the Fund; prepares reports and materials to be supplied to the Board; monitors the activities of the Fund’s custodian, transfer agent, and accountants; and coordinates the preparation and payment of the Fund’s expenses and reviews the Fund’s expense accruals. Fees paid to USBFS for the fiscal year ended October 31, 2014 were $320,986.
U.S. Bank, N.A., an affiliate of USBFS, serves as the Fund’s custodian. Quasar Distributors, LLC acts as the Fund’s principal underwriter in a continuous public offering of the Fund’s shares. Quasar Distributors, LLC is an affiliate of USBFS and U.S. Bank, N.A.
HENNESSY FUNDS 1-800-966-4354
6). LINE OF CREDIT
The Fund has a line of credit with the other funds in the Hennessy Funds family of funds (the “Hennessy Funds”) in the amount of the lesser of (i) $100,000,000 or (ii) 33.33% of each Hennessy Fund’s net assets, or 30% for the Hennessy Gas Utility Index Fund and 10% for the Hennessy Balanced Fund, intended to provide short-term financing, if necessary, subject to certain restrictions, in connection with shareholder redemptions. The credit facility is with the Hennessy Funds’ custodian bank, U.S. Bank, N.A. Borrowings under this arrangement bear interest at the bank’s prime rate. During the fiscal year ended October 31, 2014, the Fund had an outstanding average daily balance and a weighted average interest rate of $63,060 and 3.25%, respectively. The maximum amount outstanding for the Fund during the period was $3,435,000. At October 31, 2014, the Fund had a loan payable balance of $0.
7). FEDERAL TAX INFORMATION
As of October 31, 2014, the components of accumulated earnings (losses) for income tax purposes for the Fund were as follow:
| | Cost of investments for tax purposes | | $ | 200,580,864 | |
| | Gross tax unrealized appreciation | | $ | 38,229,253 | |
| | Gross tax unrealized depreciation | | | (3,448,931 | ) |
| | Net tax unrealized appreciation | | $ | 34,780,322 | |
| | Undistributed ordinary income | | $ | — | |
| | Undistributed long-term capital gains | | | 31,554,220 | |
| | Total distributable earnings | | $ | 31,554,220 | |
| | Other accumulated loss | | $ | (483,665 | ) |
| | Total accumulated gain | | $ | 65,850,877 | |
The difference between book-basis and tax-basis unrealized appreciation is attributable primarily to wash sales.
At October 31, 2014, the Fund had no tax basis capital losses to offset future capital gains.
At October 31, 2014, the Fund deferred, on a tax basis, a late year ordinary loss of $483,665.
The tax character of distributions paid during fiscal year 2014 and fiscal year 2013 for the Fund were as follow:
| | | | Year Ended | | | Year Ended | |
| | | | October 31, 2014 | | | October 31, 2013 | |
| | Ordinary income | | $ | 2,893,627 | | | $ | 1,639,752 | |
| | Long-term capital gain | | | 20,425,348 | | | | — | |
| | | | $ | 23,318,975 | | | $ | 1,639,752 | |
8). EVENTS SUBSEQUENT TO YEAR-END
On December 8, 2014, a long-term capital gains distribution of $3.34234 per share for the Investor Class and $2.01129 per share for the Institutional Class were declared and paid to shareholders of record on December 5, 2014.
Report of Independent Registered Public Accounting Firm
To the Board of Trustees of Hennessy Funds Trust
And the Shareholders of Hennessy Small Cap Financial Fund
We have audited the accompanying statement of assets and liabilities, including the schedule of investments, of the Hennessy Small Cap Financial Fund (the “Fund”), a series of Hennessy Funds Trust (the “Trust”) as of October 31, 2014, and the related statement of operations for the year then ended, the statements of changes in net assets for each of the two years in the period then ended, and the financial highlights for each of the five years in the period then ended. These financial statements and financial highlights are the responsibility of the Funds’ management. Our responsibility is to express an opinion on these financial statements and financial highlights based on our audits.
We conducted our audits in accordance with the standards of the Public Company Accounting Oversight Board (United States). Those standards require that we plan and perform the audits to obtain reasonable assurance about whether the financial statements and financial highlights are free of material misstatement. The Fund is not required to have, nor were we engaged to perform, an audit of its internal control over financial reporting. Our audits included consideration of internal control over financial reporting as a basis for designing audit procedures that are appropriate in the circumstances, but not for the purposes of expressing an opinion on the effectiveness of the Fund’s internal control over financial reporting. Accordingly, we express no such opinion. An audit includes examining, on a test basis, evidence supporting the amounts and disclosures in the financial statements. Our procedures included confirmation of securities owned as of October 31, 2014, by correspondence with the custodian and brokers or by other appropriate auditing procedures where replies from brokers were not received. An audit also includes assessing the accounting principles used and significant estimates made by management, as well as evaluating the overall financial statement presentation. We believe that our audits provide a reasonable basis for our opinion.
In our opinion, the financial statements and financial highlights referred to above present fairly, in all material respects, the financial position of the Hennessy Small Cap Financial Fund as of October 31, 2014, the results of its operations for the year then ended, the changes in its net assets for each of the two years in the period then ended, and the financial highlights for each of the five years in the period then ended, in conformity with accounting principles generally accepted in the United States of America.
TAIT, WELLER & BAKER LLP
Philadelphia, Pennsylvania
December 30, 2014
HENNESSY FUNDS 1-800-966-4354
Trustees and Officers of the Fund (Unaudited)
The business and affairs of the Fund are managed under the direction of the Fund’s Board of Trustees. Information pertaining to the Trustees and Officers of the Fund is set forth below. The Fund’s Statement of Additional Information includes additional information about the Fund’s Trustees and Officers and is available, without charge, upon request by calling 1-800-966-4354.
| | | | | Number of | |
| | | Term of | | Portfolios | |
| | | Office | | in the | Other |
| | | and | | Fund | Directorships |
| | Position(s) | Length | Principal | Complex | (During Past |
| Name, Address, | Held with | of Time | Occupation(s) | Overseen | Five Years)(2) |
| and Age | the Fund | Served | During Past Five Years | by Trustee | Held by Trustee |
| | | |
| Disinterested Trustees (as defined below) | | |
| | | | | | |
| J. Dennis DeSousa | Trustee | Indefinite, | Mr. DeSousa is a real | 16 | Hennessy SPARX |
| Age: 78 | | until | estate investor. | | Funds Trust; |
| Address: | | successor | | | Hennessy Mutual |
| c/o Hennessy | | elected | | | Funds, Inc.; and |
| Advisors, Inc. | | | | | The Hennessy |
| 7250 Redwood Blvd. | | Served | | | Funds, Inc. |
| Suite 200 | | since | | | |
| Novato, CA 94945 | | January | | | |
| | | 1996 | | | |
| | | for the | | | |
| | | Funds (or | | | |
| | | Predecessor | | | |
| | | Funds) | | | |
| | | | | | |
| Robert T. Doyle | Trustee | Indefinite, | Mr. Doyle has been the | 16 | Hennessy SPARX |
| Age: 67 | | until | Sheriff of Marin County, | | Funds Trust; |
| Address: | | successor | California since 1996. | | Hennessy Mutual |
| c/o Hennessy | | elected | | | Funds, Inc.; and |
| Advisors, Inc. | | | | | The Hennessy |
| 7250 Redwood Blvd. | | Served | | | Funds, Inc. |
| Suite 200 | | since | | | |
| Novato, CA 94945 | | January | | | |
| | | 1996 | | | |
| | | for the | | | |
| | | Funds (or | | | |
| | | Predecessor | | | |
| | | Funds) | | | |
| | | | | | |
| Gerald P. Richardson | Trustee | Indefinite, | Mr. Richardson is an | 16 | Hennessy SPARX |
| Age: 69 | | until | independent consultant | | Funds Trust; |
| Address: | | successor | in the securities industry. | | Hennessy Mutual |
| c/o Hennessy | | elected | | | Funds, Inc.; and |
| Advisors, Inc. | | | | | The Hennessy |
| 7250 Redwood Blvd. | | Served | | | Funds, Inc. |
| Suite 200 | | since | | | |
| Novato, CA 94945 | | May 2004 | | | |
| | | for the | | | |
| | | Funds (or | | | |
| | | Predecessor | | | |
| | | Funds) | | | |
| | | | | Number of | |
| | | Term of | | Portfolios | |
| | | Office | | in the | Other |
| | | and | | Fund | Directorships |
| | Position(s) | Length | Principal | Complex | (During Past |
| Name, Address, | Held with | of Time | Occupation(s) | Overseen | Five Years)(2) |
| and Age | the Fund | Served | During Past Five Years | by Trustee | Held by Trustee |
| | | |
| “Interested Persons” (as defined in the 1940 Act) | | |
| | | |
Neil J. Hennessy(1) | Chief | Trustee: | Mr. Hennessy has been | 16 | Hennessy |
| Age: 58 | Investment | Indefinite, | employed by Hennessy | | Advisors, Inc. |
| Address: | Officer, | until | Advisors, Inc., the Funds’ | | (current); |
| c/o Hennessy | Portfolio | successor | investment advisor, since | | Hennessy SPARX |
| Advisors, Inc. | Manager, | elected | 1989. He currently serves | | Funds Trust; |
| 7250 Redwood Blvd. | President, | | as President, Chairman | | Hennessy Mutual |
| Suite 200 | Trustee | Served | and CEO of Hennessy | | Funds, Inc.; and |
| Novato, CA 94945 | and | since | Advisors, Inc. | | The Hennessy |
| | Chairman | January | | | Funds, Inc. |
| | of the | 1996 | | | |
| | Board | for the | | | |
| | | Funds (or | | | |
| | | Predecessor | | | |
| | | Funds) | | | |
| | | | | | |
| | | Officer: | | | |
| | | 1 year term | | | |
| | | | | | |
| | | Served | | | |
| | | since | | | |
| | | June 2008 | | | |
| | | for the | | | |
| | | Funds (or | | | |
| | | Predecessor | | | |
| | | Funds) | | | |
| | | | | | |
Teresa M. Nilsen(1) | Executive | 1 year term | Ms. Nilsen has been | N/A | N/A |
| Age: 48 | Vice | | employed by Hennessy | | |
| Address: | President | Served | Advisors, Inc., the Funds’ | | |
| c/o Hennessy | and | since | investment advisor, since | | |
| Advisors, Inc. | Treasurer | January | 1989. She currently serves | | |
| 7250 Redwood Blvd. | | 1996 | as Executive Vice President, | | |
| Suite 200 | | for the | Chief Operations Officer, | | |
| Novato, CA 94945 | | Funds (or | Chief Financial Officer, and | | |
| | | Predecessor | Secretary of Hennessy | | |
| | | Funds) | Advisors, Inc. | | |
| (1) | All Officers of the Hennessy Funds and employees of the Manager are Interested Persons of the Funds. |
| (2) | Pursuant to an internal reorganization, the series of Hennessy Mutual Funds, Inc. (“HMFI”), The Hennessy Funds, Inc. (“HFI”) and Hennessy SPARX Funds Trust (“HSFT”) were reorganized into series of Hennessy Funds Trust on February 28, 2014, which mirrored the corresponding series of HFMI, HFI and HSFT. Subsequent to the reorganization, HFMI, HFI and HSFT were dissolved. |
HENNESSY FUNDS 1-800-966-4354
| | | Term of | |
| | | Office | |
| | | and | |
| | Position(s) | Length | Principal |
| Name, Address, | Held with | of Time | Occupation(s) |
| and Age | the Fund | Served | During Past Five Years |
| | | | |
| Interested Persons | | | |
| | | | |
Daniel B. Steadman(1) | Executive | 1 year term | Mr. Steadman has been employed by |
| Age: 58 | Vice President | | Hennessy Advisors, Inc., the Funds’ |
| Address: | and Secretary | Served since | investment advisor, since 2000. |
| c/o Hennessy Advisors, Inc. | | March 2000 | He currently serves as Executive |
| 7250 Redwood Blvd. | | for the Funds (or | Vice President and Chief Compliance |
| Suite 200 | | Predecessor Funds) | Officer of Hennessy Advisors, Inc. |
| Novato, CA 94945 | | | |
| | | | |
Jennifer Cheskiewicz(1) | Senior | 1 year term | Ms. Cheskiewicz has been employed by |
| Age: 37 | Vice President | | Hennessy Advisors, Inc., the Funds’ |
| Address: | and Chief | Served since | investment advisor, since June 2013. |
| c/o Hennessy Advisors, Inc. | Compliance | June 2013 | She previously served as in-house |
| 7250 Redwood Blvd. | Officer | for the Funds (or | counsel to Carlson Capital, L.P., an |
| Suite 200 | | Predecessor Funds) | SEC-registered investment advisor to |
| Novato, CA 94945 | | | several private funds from February |
| | | | 2010 to May 2013. Prior to that, she |
| | | | was an attorney with Gibson, Dunn & |
| | | | Crutcher LLP from September 2005 |
| | | | through February 2010. She currently |
| | | | serves as General Counsel of |
| | | | Hennessy Advisors, Inc. |
| | | | |
Brian Carlson(1) | Senior | 1 year term | Mr. Carlson has been employed by |
| Age: 42 | Vice President | | Hennessy Advisors, Inc., the Funds’ |
| Address: | and Head of | Served since | investment advisor, since |
| c/o Hennessy Advisors, Inc. | Distribution | December 2013 | December 2013. |
| 7250 Redwood Blvd. | | for the Funds (or | |
| Suite 200 | | Predecessor Funds) | Mr. Carlson was previously a |
| Novato, CA 94945 | | | co-founder and principal of Trivium |
| | | | Consultants, LLC from February 2011 |
| | | | through November 2013. Prior to that, |
| | | | he was the Senior Managing Director |
| | | | of NRP Financial, Inc. from August |
| | | | 2007 through February 2011. |
| | | | |
David Ellison(1) | Portfolio Manager | 1 year term | Mr. Ellison has served as Portfolio |
| Age: 56 | and Senior | | Manager of the Large Cap Financial |
| Address: | Vice President | Served since | Fund, the Small Cap Financial Fund, |
| c/o Hennessy Advisors, Inc. | | October 2012 | and the Technology Fund |
| 101 Federal Street | | for the Funds (or | since inception. |
| Suite 1900 | | Predecessor Funds) | |
| Boston, MA 02110 | | | Mr. Ellison previously served as Director, |
| | | | CIO and President of FBR Advisers, Inc. |
| | | | from December 1999 to October 2012. |
| (1) | All Officers of the Hennessy Funds and employees of the Manager are Interested Persons of the Funds. |
| | | Term of | |
| | | Office | |
| | | and | |
| | Position(s) | Length | Principal |
| Name, Address, | Held with | of Time | Occupation(s) |
| and Age | the Fund | Served | During Past Five Years |
| | | | |
| Interested Persons | | | |
| | | | |
Brian Peery(1) | Portfolio Manager | 1 year term | Mr. Peery has been a Portfolio Manager |
| Age: 45 | and | | of the Cornerstone Growth Fund, |
| Address: | Vice President | Served since | the Cornerstone Mid Cap 30 Fund, the |
| c/o Hennessy Advisors, Inc. | | March 2003 | Cornerstone Large Growth Fund, the |
| 7250 Redwood Blvd. | | as Vice President | Cornerstone Value Fund, the Total |
| Suite 200 | | for the Funds (or | Return Fund, and the Balanced Fund |
| Novato, CA 94945 | | Predecessor Funds) | since October 2014. From February |
| | | | 2011 through September 2014, he |
| | | Served since | served as Co-Portfolio Manager of |
| | | February 2011 | the same funds. |
| | | as Co-Portfolio | |
| | | Manager | Mr. Peery has been employed by |
| | | for the Funds (or | Hennessy Advisors, Inc., the Funds’ |
| | | Predecessor Funds) | investment advisor, since 2002. |
| | | | |
Winsor (Skip) Aylesworth(1) | Portfolio Manager | 1 year term | Mr. Aylesworth has been Portfolio |
| Age: 67 | and | | Manager of the Gas Utility Index Fund |
| Address: | Vice President | Served since | since 1998 and Portfolio Manager of |
| c/o Hennessy Advisors, Inc. | | October 2012 | the Technology Fund since inception. |
| 101 Federal Street | | for the Funds (or | |
| Suite 1900 | | Predecessor Funds) | Mr. Aylesworth previously served as |
| Boston, MA 02110 | | | Executive Vice President of The FBR |
| | | | Funds from 1999 to October 2012. |
| | | | |
Ryan Kelley(1) | Portfolio Manager | 1 year term | Mr. Kelley has been a Portfolio Manager |
| Age: 42 | and | | of the Gas Utility Index Fund (formerly |
| Address: | Vice President | Served since | the FBR Gas Utility Index Fund), the |
| c/o Hennessy Advisors, Inc. | | March 2013 | Small Cap Financial Fund (formerly the |
| 1340 Environ Way | | for the Funds (or | FBR Small Cap Financial Fund), and the |
| Chapel Hill, NC 27517 | | Predecessor Funds) | Large Cap Financial Fund (formerly the |
| | | | FBR Large Cap Financial Fund) since |
| | | | October 2014. From March 2013 |
| | | | through September 2014, he served |
| | | | as a Co-Portfolio Manager of the same |
| | | | funds. Prior to that, he was a Portfolio |
| | | | Analyst of the Hennessy Funds. |
| | | | |
| | | | Mr. Kelley previously served as Portfolio |
| | | | Manager of The FBR Funds from |
| | | | January 2008 to October 2012. |
| (1) | All Officers of the Hennessy Funds and employees of the Manager are Interested Persons of the Funds. |
HENNESSY FUNDS 1-800-966-4354
Expense Example (Unaudited)
October 31, 2014
As a shareholder of the Fund, you incur two types of costs: (1) transaction costs, including sales charges (loads) on purchase payments, reinvested dividends, or other distributions; redemption fees; and exchange fees; and (2) ongoing costs, including management fees; service fees; and other Fund expenses. This Example is intended to help you understand your ongoing costs (in dollars) of investing in the Fund and to compare these costs with the ongoing costs of investing in other mutual funds. The Example is based on an investment of $1,000 invested at the beginning of the period and held for the entire period from May 1, 2014 through October 31, 2014.
Actual Expenses
The first line of the table below under the “Investor Class” and “Institutional Class” headings provides information about actual account values and actual expenses. Although the Fund charges no sales loads or transaction fees, you will be assessed fees for outgoing wire transfers, returned checks and stop payment orders at prevailing rates charged by U.S. Bancorp Fund Services, LLC, the Fund’s transfer agent. If you request that a redemption be made by wire transfer, currently a $15.00 fee is charged by the Fund’s transfer agent. IRA accounts will be charged a $15.00 annual maintenance fee. The example below includes, but is not limited to, management fees, shareholder servicing fees, fund accounting, custody, and transfer agent fees. However, the example below does not include portfolio trading commissions and related expenses, and other extraordinary expenses as determined under generally accepted accounting principles. You may use the information in this line, together with the amount you invested, to estimate the expenses that you paid over the period. Simply divide your account value by $1,000 (for example, an $8,600 account value divided by $1,000 = 8.6), then multiply the result by the number in the first line of the table under the “Investor Class” and “Institutional Class” headings in the column entitled “Expenses Paid During Period” to estimate the expenses you paid on your account during this period.
Hypothetical Example for Comparison Purposes
The second line of the table below under the “Investor Class” and “Institutional Class” headings provides information about hypothetical account values and hypothetical expenses based on the Fund’s actual expense ratios and an assumed rate of return of 5% per year before expenses, which is not the Fund’s actual return. The hypothetical account values and expenses may not be used to estimate the actual ending account balance or expenses you paid for the period. You may use this information to compare the ongoing costs of investing in the Fund and other funds. To do so, compare this 5% hypothetical example with the 5% hypothetical examples that appear in the shareholder reports of the other funds. Please note that the expenses shown in the table are meant to highlight your ongoing costs only and do not reflect any transactional costs, such as sales charges (loads), or exchange fees. Therefore, the second line of the table under the “Investor Class” and “Institutional Class” headings is useful in comparing ongoing costs only, and will not help you determine the relative total costs of owning different funds. In addition, if these transactional costs were included, your costs would have been higher.
| | Beginning | Ending | Expenses Paid |
| | Account Value | Account Value | During Period(1) |
| | 5/1/14 | 10/31/14 | 5/1/14 – 10/31/14 |
| Investor Class | | | |
| | | | |
| Actual | $1,000.00 | $1,009.20 | $7.19 |
| | | | |
| Hypothetical (5% return | | | |
| before expenses) | $1,000.00 | $1,018.05 | $7.22 |
| | | | |
| Institutional Class | | | |
| | | | |
| Actual | $1,000.00 | $1,011.10 | $5.53 |
| | | | |
| Hypothetical (5% return | | | |
| before expenses) | $1,000.00 | $1,019.71 | $5.55 |
| (1) | Expenses are equal to the Fund’s expense ratio of 1.42% for Investor Class shares or 1.09% for Institutional Class shares, as applicable, multiplied by the average account value over the period, multiplied by 184/365 days (to reflect one-half year period). |
HENNESSY FUNDS 1-800-966-4354
Proxy Voting
A description of the policies and procedures the Fund uses to determine how to vote proxies relating to portfolio securities is available without charge: (1) by calling 1-800-966-4354; (2) on
the Hennessy Funds’ website at hennessyfunds.com; or (3) on the U.S. Securities and Exchange Commission’s (the “SEC”) website at www.sec.gov. The Fund’s proxy voting record is available on both the Hennessy Funds’ website at hennessyfunds.com and the SEC’s website at www.sec.gov no later than August 31 for the prior 12 months ending June 30.
Quarterly Filings on Form N-Q
The Fund files its complete schedule of portfolio holdings with the SEC for the first and third quarters of each fiscal year on Form N-Q. The Fund’s Forms N-Q are available on the SEC’s website at www.sec.gov. The Fund’s Forms N-Q may be reviewed and copied at the SEC’s Public Reference Room in Washington, DC and information on the operation of the Public Reference Room may be obtained by calling 1-800-SEC-0330. Information included in the Fund’s Forms N-Q will also be available upon request by calling 1-800-966-4354.
Federal Tax Distribution Information
(Unaudited)
For the fiscal year ended October 31, 2014, certain dividends paid by the Fund may be subject to a maximum tax rate of 20%, as provided for by the Jobs and Growth Tax Relief Reconciliation Act of 2003. The percentage of dividends declared from ordinary income designated as qualified dividend income was 93.71%.
For corporate shareholders, the percent of ordinary income distributions qualifying for the corporate dividends received deduction for the fiscal year ended October 31, 2014 was 86.82%.
The percentage of taxable ordinary income distributions that are designated as short-term capital gain distributions under Section 871(k)(2)(C) of the Internal Revenue Code of 1986, as amended, for the Fund was 65.57%.
Householding
To help keep the Fund’s costs as low as possible, we generally deliver a single copy of most financial reports and prospectuses to shareholders who share an address, even if the accounts are registered under different names. This process, known as “householding,” does not apply to account statements. You may, of course, request an individual copy of a prospectus or financial report at any time. If you would like to receive separate mailings, please call the Administrator at 1-800-261-6950 or 1-414-765-4124 and we will begin individual delivery within 30 days of your request. If your account is held through a financial institution or other intermediary, please contact them directly to request individual delivery.
Privacy Policy
We collect the following non-public personal information about you:
| | • | information we receive from you on or in applications or other forms, correspondence, or conversations, including, but not limited to, your name, address, phone number, social security number, assets, income and date of birth; |
| | | and |
| | • | information about your transactions with us, our affiliates, or others, including, but not limited to, your account number and balance, payment history, parties to transactions, cost basis information and other financial information. |
We do not disclose any non-public personal information about our current or former shareholders to nonaffiliated third parties, except as permitted by law. For example, we are permitted by law to disclose all of the information we collect, as described above, to our Transfer Agent to process your transactions. Furthermore, we restrict access to your non-public personal information to those persons who require such information to provide products or services to you. We maintain physical, electronic and procedural safeguards that comply with federal standards to guard your non-public personal information.
In the event that you hold shares of the Fund through a financial intermediary, including, but not limited to, a broker-dealer, bank or trust company, the privacy policy of your financial intermediary would govern how your non-public personal information would be shared with nonaffiliated third parties.
HENNESSY FUNDS 1-800-966-4354
For information, questions or assistance, please call
The Hennessy Funds
1-800-966-4354 or 1-415-899-1555
INVESTMENT ADVISOR
Hennessy Advisors, Inc.
7250 Redwood Blvd., Suite 200
Novato, California 94945
ADMINISTRATOR,
TRANSFER AGENT,
DIVIDEND PAYING AGENT &
SHAREHOLDER SERVICING AGENT
U.S. Bancorp Fund Services, LLC
P.O. Box 701
Milwaukee, Wisconsin 53201-0701
CUSTODIAN
U.S. Bank N.A.
Custody Operations
1555 North River Center Dr., Suite 302
Milwaukee, Wisconsin 53212
TRUSTEES
Neil J. Hennessy
Robert T. Doyle
J. Dennis DeSousa
Gerald P. Richardson
COUNSEL
Foley & Lardner LLP
777 East Wisconsin Avenue
Milwaukee, Wisconsin 53202-5306
INDEPENDENT REGISTERED
PUBLIC ACCOUNTING FIRM
Tait, Weller & Baker LLP
1818 Market Street, Suite 2400
Philadelphia, Pennsylvania 19103
DISTRIBUTOR
Quasar Distributors, LLC
615 East Michigan Street
Milwaukee, Wisconsin 53202
hennessyfunds.com | 1-800-966-4354
This report has been prepared for shareholders and may be distributed to
others only if preceded or accompanied by a current prospectus.
ANNUAL REPORT
OCTOBER 31, 2014
HENNESSY LARGE CAP
FINANCIAL FUND
Investor Class HLFNX
hennessyfunds.com | 1-800-966-4354
(This Page Intentionally Left Blank.)
Contents
| Letter to Shareholders | 2 |
| Performance Overview | 4 |
| Financial Statements | |
| Schedule of Investments | 7 |
| Statement of Assets and Liabilities | 11 |
| Statement of Operations | 12 |
| Statements of Changes in Net Assets | 13 |
| Financial Highlights | 14 |
| Notes to the Financial Statements | 16 |
| Report of Independent Registered Public Accounting Firm | 23 |
| Trustees and Officers of the Fund | 24 |
| Expense Example | 28 |
| Proxy Voting | 30 |
| Quarterly Filings on Form N-Q | 30 |
| Householding | 30 |
| Privacy Policy | 31 |
HENNESSY FUNDS 1-800-966-4354
December 2014
Dear Shareholder:
As I look back at 2014, I realize that in this age of rapidly evolving technology, information is delivered and absorbed so quickly that it is difficult to remember what happened last week, let alone what’s happened over the course of an entire year. That is why I’d like to take a moment to recall some of the year’s highs and lows, economically, politically and socially, here in the U.S. and around the globe. 2014 was scarred by political partisanship, civil unrest in the U.S., Ukraine and many other countries, the arrival of terrorist group ISIS, the tragedies of school shootings and natural disasters, and the frightening outbreak of Ebola. However, there were also positive events this year: we survived a government shutdown over healthcare reform, jobs reports have been consistently, albeit anemically, improving, and home prices remained relatively stable, after recovering significantly in 2013. And, important to us here at Hennessy, our hometown team, the San Francisco Giants, won their third World Series in just five years!
A significant event for the financial industry this past year was the confirmation of Janet Yellen as Chair of the Federal Reserve, which served to calm the nerves of business and political leaders alike. I believe Yellen’s leadership will benefit U.S. business owners, as the Fed continues to be a voice of reason in a sea of political and economic rhetoric. The Fed has also supported the economy and corporate America by helping keep interest rates reasonable and low.
The stock market has continued its determined comeback from the lows of 2009, setting multiple record highs in recent months. The U.S. financial markets have provided strong returns over the past twelve-month period ended October 31, 2014, with the Dow Jones Industrial Average (DJIA) returning over 14% and S&P 500 Index returning over 17% during the period. The DJIA currently has a dividend yield of 2.2%, which is equal to that of a 10-Year U.S. Treasury, which is currently also yielding 2.2%. I continue to believe that investments in high-yielding, high-quality stocks have the potential to not only provide income but also the potential for stock price appreciation as well. Fixed income investing has run its course, in my opinion, and many individuals are currently benefiting from the return to investing in equities that possess strong fundamentals. American investors are slowly migrating from fixed income to equities. Currently, 54% of Americans invest in stocks, and I do expect this percentage to increase, especially if interest rates move higher.
For the past several years, U.S. corporations have been driving shareholder value by making acquisitions, initiating and raising dividends, investing in internal infrastructure and buying back stock. However, this year I began to see a shift from those strategies. I believe the easier to execute acquisitions are a thing of the past, and firms now have to be even more creative to execute accretive deals. I also believe that while firms may continue to initiate dividends, fewer firms will raise their dividends and fewer firms will participate in stock buyback programs going forward. What will these cash-rich companies do with their capital if they are not raising dividends or buying back stock? I believe they may begin to initiate capital expenditure programs that could truly benefit economic growth.
Liquidity and monetary conditions are supportive, causing the cost of capital to be very low. I believe firms will choose to spend capital to expand their sales, and they may even begin to hire in earnest. Once a company begins to move in this way, the cost to
defer becomes real for competitors. With almost $3 trillion in cash and short-term investments sitting on the balance sheets of the S&P 500 companies, a strategic shift by firms to spend their idle capital, while slow, could potentially further economic growth in the U.S. in my opinion.
Economic progress and growth remain slow, yet steady, and unemployment, though improving, remains high. Oil prices have fallen, giving consumers a bit more discretionary income. While the midterm elections may not end all of the gridlock in Washington, hopefully we will receive clarity on the political headwinds of taxes and regulations, which have not improved over the past several years.
The markets have had several quarters without any truly significant downturn. The pullbacks we recently experienced, most notably in July and October, were short-lived, as evidenced by the quick rebound to record high market levels. I firmly believe that we are in a secular bull market, and I continue to tell investors to try to remain calm in the face of volatility and continue to focus on the strong, long-term fundamentals that are evident in the market today. Many companies continue to have strong balance sheets, with record cash flows and profits. With this current bull market in its fifth year, investors should expect some volatility.
I am encouraged by the strong returns for the major U.S. financial market indices and by the performance of the Hennessy Funds over the past year. Thank you for your continued confidence and investment in our products. If you have any questions or would like to speak with us directly, please don’t hesitate to call us at (800) 966-4354.
Best regards,
Neil J. Hennessy
President and Chief Investment Officer
Past performance does not guarantee future results.
Mutual fund investing involves risk. Principal loss is possible.
Opinions expressed are those of Neil Hennessy and are subject to change, are not guaranteed and should not be considered investment advice.
The Dow Jones Industrial Average and S&P 500 Index are unmanaged indices commonly used to measure the performance of U.S. stocks. One cannot invest directly in an index.
Cash flow can be used as an indication of a company’s financial strength. A firm’s cash flow is the movement of cash in and out of the firm in the form of payments to suppliers and collections from customers. Dividend Yield is calculated as the annual dividends paid by a company divided by the price of a share of their stock.
HENNESSY FUNDS 1-800-966-4354
Performance Overview (Unaudited)
The opinions expressed in the following commentary reflect those of the Portfolio Managers as of the date written. Any such opinions are subject to change based on market or other conditions and are not guaranteed. These opinions may not be relied upon as investment advice. Investment decisions for the Fund are based on multiple factors, and may not be relied upon as an indication of trading intent on behalf of the Fund. Security positions can and do change.
CHANGE IN VALUE OF $10,000 INVESTMENT
This chart assumes an initial gross investment of $10,000 made on October 31, 2004. Returns shown include the reinvestment of all dividends. Returns shown do not reflect the deduction of taxes that a shareholder would pay on Fund distributions or the redemption of Fund shares.
AVERAGE ANNUAL TOTAL RETURN FOR PERIODS ENDED OCTOBER 31, 2014
| | One | Five | Ten |
| | Year | Years | Years |
| Hennessy Large Cap | | | |
| Financial Fund (HLFNX) | 13.04% | 11.27% | 5.05% |
Russell 1000® Financial | | | |
| Services Index | 17.24% | 13.84% | 2.20% |
Russell 1000® Index | 16.78% | 16.98% | 8.54% |
Expense ratio: 1.57%
Performance data quoted represents past performance; past performance does not guarantee future results. The investment return and principal value of an investment will fluctuate so that an investor’s shares, when redeemed, may be worth more or less than their original cost. Current performance of the Fund may be lower or higher than the performance quoted. Performance data current to the most recent month end may be obtained by visiting hennessyfunds.com. Performance for periods prior to October 26, 2012 is that of the FBR Large Cap Financial Fund.
The expense ratio presented is that from the most recent prospectus.
PERFORMANCE NARRATIVE
Portfolio Managers David H. Ellison and Ryan Kelley
Over the previous twelve months, how did the Fund perform and what factors contributed to this performance?
For the twelve-month period ended October 31, 2014, the Hennessy Large Cap Financial Fund returned 13.04%, underperforming the Russell 1000® Financial Services Index and the Russell 1000® Index, which returned 17.24% and 16.78% for the same period, respectively, but outperforming the Morningstar Financial Category Average, which returned 10.51% for the same period.
The Fund remains concentrated in the largest U.S. based financial companies. These companies continue to see fundamental improvements as they work to improve earnings quality, balance sheet stability, revenue and expense rationalization, as well as credit quality metrics.
Companies with the strongest performance contributions to the Fund during the period were in the credit card and traditional bank businesses. Specific positions that contributed most strongly to performance included Visa, Inc, Bank of America Corp., Discover Financial Services and Morgan Stanley. The Fund continues to hold all of these positions.
Companies detracting from the Fund’s performance during the period include consumer finance, brokerage, and trading platforms. Specific positions that detracted from the Fund’s performance include CIT Group, Inc., IntercontinentalExchange Group, Inc. and Fortress Investment Group LLC. The Fund no longer holds any of these positions.
Additional Portfolio Manager Commentary and related investment outlook:
Large cap financial institutions performed slightly better than the overall large cap universe and significantly better than small cap financials. Large cap financials have benefitted from a broader range of factors, including investment banking, securities trading, loan growth, commercial service fee increases and improved credit conditions. In addition, large cap financial balance sheets have improved as companies de-lever, de-complicate and de-risk. Despite some variance, general trends have been favorable for large cap financials for the past few years.
Our thesis remains intact in the large cap financial space, as we expect the ongoing improvements to continue as big balance sheets, cost structures and revenue streams are rationalized. With new regulatory structures designed to reduce risk at the largest institutions, we believe the changes in the “big bank” model will be significant over the next three to five years. With a strong, well-structured financial system in place, we believe this should lead to sustained economic growth in the U.S. and abroad.
For large cap financials, we expect that book values and earnings streams will become more stable over time, allowing for potentially higher dividends, increased stock buybacks and higher financial stock valuations. Valuations of certain large cap financials, as measured by price to book and price to earnings, remain below historical averages. We believe that the Fund is well positioned to take advantage of these improving fundamentals and potentially increasing valuations over time.
The Russell 1000® Financial Services Index is an unmanaged index commonly used to measure the performance of large-capitalization financial sector stocks. The Russell 1000® Index is an unmanaged index commonly used to measure the performance of U.S. stocks. You cannot invest directly in an index. Performance data for an index does not reflect any deductions for fees, expenses or taxes. The Fund is non-diversified, meaning it concentrates its assets in fewer holdings that a diversified fund
HENNESSY FUNDS 1-800-966-4354
and is therefore more exposed to individual stock volatility than a diversified fund. Investments are focused in the financial services industry, which may be adversely affected by regulatory or other market conditions such as rising interest rates. The Fund invests in small- and medium-capitalization companies, which involves additional risks such as more limited liquidity and greater volatility than large-capitalization companies. References to specific securities should not be considered a recommendation to buy or sell any security. Fund holdings and sector allocations are subject to change. Please refer to the Schedule of Investments included in this report for additional portfolio information.
Book value is the value at which a company carries an asset on its balance sheet. Price-to-book is a ratio used to compare a stock’s market value to its book value and is calculated by dividing the current closing price of such stock by the most recent quarter’s book value per share. Price-to-earnings is a tool for calculating relative valuation and is the market price per share divided by earnings per share.
Each Morningstar category average represents a universe of funds with similar investment objectives. © Morningstar, Inc. All Rights Reserved. The information contained herein: 1) is proprietary to Morningstar; 2) may not be copied or distributed and 3) is not warranted to be accurate, complete or timely. Neither Morningstar nor its content providers are responsible for any damages or losses arising from any use of this information. Past performance does not guarantee future results.
Financial Statements
HENNESSY LARGE CAP FINANCIAL FUND
As of October 31, 2014
(% of Net Assets)
| TOP TEN HOLDINGS (EXCLUDING CASH/CASH EQUIVALENTS) | % net assets |
| | |
| Citigroup, Inc. | 4.86% |
| The PNC Financial Services Group, Inc. | 4.84% |
| Wells Fargo & Co. | 4.82% |
| J.P. Morgan Chase & Co. | 4.81% |
| Visa, Inc., Class A | 4.80% |
| SunTrust Banks, Inc. | 4.79% |
| MasterCard, Inc., Class A | 4.78% |
| U.S. Bancorp | 4.78% |
| Capital One Financial Corp. | 4.73% |
| Bank of America Corp. | 4.72% |
Note: For presentation purposes, the Fund has grouped some of the industry categories. For purposes of categorizing securities for compliance with Section 8(b)(1) of the Investment Company Act of 1940, the Fund uses more specific industry classifications.
HENNESSY FUNDS 1-800-966-4354
| | COMMON STOCKS – 94.25% | | Number | | | | | | % of | |
| | | | of Shares | | | Value | | | Net Assets | |
| | Financials – 84.67% | | | | | | | | | |
| | American Express Co. | | | 20,000 | | | $ | 1,799,000 | | | | 1.83 | % |
| | American International Group, Inc. | | | 54,000 | | | | 2,892,780 | | | | 2.95 | % |
| | Bank of America Corp. | | | 270,000 | | | | 4,633,200 | | | | 4.72 | % |
| | Berkshire Hathaway, Inc., Class B (a) | | | 30,000 | | | | 4,204,800 | | | | 4.29 | % |
| | Capital One Financial Corp. | | | 56,000 | | | | 4,635,120 | | | | 4.73 | % |
| | Citigroup, Inc. | | | 89,000 | | | | 4,764,170 | | | | 4.86 | % |
| | Comerica, Inc. | | | 86,000 | | | | 4,105,640 | | | | 4.19 | % |
| | Discover Financial Services | | | 69,000 | | | | 4,400,820 | | | | 4.49 | % |
| | Equity Residential | | | 15,000 | | | | 1,043,400 | | | | 1.06 | % |
| | Fifth Third Bancorp | | | 225,000 | | | | 4,497,750 | | | | 4.59 | % |
| | Huntington Bancshares, Inc. | | | 300,000 | | | | 2,973,000 | | | | 3.03 | % |
| | J.P. Morgan Chase & Co. | | | 78,000 | | | | 4,717,440 | | | | 4.81 | % |
| | KeyCorp | | | 285,000 | | | | 3,762,000 | | | | 3.84 | % |
| | MetLife, Inc. | | | 39,000 | | | | 2,115,360 | | | | 2.16 | % |
| | Morgan Stanley | | | 116,000 | | | | 4,054,200 | | | | 4.13 | % |
| | Regions Financial Corp. | | | 433,000 | | | | 4,299,690 | | | | 4.38 | % |
| | Simon Property Group, Inc. | | | 5,500 | | | | 985,655 | | | | 1.00 | % |
| | SunTrust Banks, Inc. | | | 120,000 | | | | 4,696,800 | | | | 4.79 | % |
| | The Goldman Sachs Group, Inc. | | | 12,000 | | | | 2,279,880 | | | | 2.32 | % |
| | The PNC Financial Services Group, Inc. | | | 55,000 | | | | 4,751,450 | | | | 4.84 | % |
| | The Travelers Companies, Inc. | | | 20,000 | | | | 2,016,000 | | | | 2.06 | % |
| | U.S. Bancorp (c) | | | 110,000 | | | | 4,686,000 | | | | 4.78 | % |
| | Wells Fargo & Co. | | | 89,000 | | | | 4,725,010 | | | | 4.82 | % |
| | | | | | | | | 83,039,165 | | | | 84.67 | % |
| | | | | | | | | | | | | | |
| | Information Technology – 9.58% | | | | | | | | | | | | |
| | MasterCard, Inc., Class A | | | 56,000 | | | | 4,690,000 | | | | 4.78 | % |
| | Visa, Inc., Class A | | | 19,500 | | | | 4,707,885 | | | | 4.80 | % |
| | | | | | | | | 9,397,885 | | | | 9.58 | % |
| | | | | | | | | | | | | | |
| | Total Common Stocks | | | | | | | | | | | | |
| | (Cost $74,912,993) | | | | | | | 92,437,050 | | | | 94.25 | % |
The accompanying notes are an integral part of these financial statements.
| | PARTNERSHIPS – 3.29% | | Number | | | | | | % of | |
| | | | of Shares | | | Value | | | Net Assets | |
| | Financials – 3.29% | | | | | | | | | |
| | Blackstone Group L.P. | | | 107,000 | | | $ | 3,222,840 | | | | 3.29 | % |
| | | | | | | | | | | | | | |
| | Total Partnerships | | | | | | | | | | | | |
| | (Cost $1,985,537) | | | | | | | 3,222,840 | | | | 3.29 | % |
| | | | | | | | | | | | | | |
| | SHORT-TERM INVESTMENTS – 2.12% | | | | | | | | | | | | |
| | Money Market Funds – 2.12% | | | | | | | | | | | | |
| | Fidelity Government Portfolio – | | | | | | | | | | | | |
| | Institutional Class, 0.01% (b) | | | 2,082,684 | | | | 2,082,684 | | | | 2.12 | % |
| | | | | | | | | | | | | | |
| | Total Short-Term Investments | | | | | | | | | | | | |
| | (Cost $2,082,684) | | | | | | | 2,082,684 | | | | 2.12 | % |
| | | | | | | | | | | | | | |
| | Total Investments | | | | | | | | | | | | |
| | (Cost $78,981,214) – 99.66% | | | | | | | 97,742,574 | | | | 99.66 | % |
| | Other Assets in | | | | | | | | | | | | |
| | Excess of Liabilities – 0.34% | | | | | | | 332,267 | | | | 0.34 | % |
| | TOTAL NET ASSETS – 100.00% | | | | | | $ | 98,074,841 | | | | 100.00 | % |
Percentages are stated as a percent of net assets.
| | (a) | Non-income producing security. |
| | (b) | The rate listed is the fund’s 7-day yield as of October 31, 2014. |
| | (c) | Investment in affiliated security. Quasar Distributors, LLC, which serves as the Fund’s distributor, is a subsidiary of U.S. Bancorp. Details of transactions with this affiliated company for the year ended October 31, 2014, are as follow: |
| | Issuer | U.S. Bancorp | |
| | Beginning Cost | | $ | 1,739,350 | | |
| | Purchase Cost | | $ | 2,733,061 | | |
| | Sales Cost | | $ | 245,617 | | |
| | Ending Cost | | $ | 4,226,794 | | |
| | Dividend Income | | $ | 86,595 | | |
| | Shares | | | 110,000 | | |
| | Market Value | | $ | 4,686,000 | | |
The accompanying notes are an integral part of these financial statements.
HENNESSY FUNDS 1-800-966-4354
Summary of Fair Value Exposure at October 31, 2014
The following is a summary of the inputs used to value the Fund’s net assets as of October 31, 2014 (See Note 3 in the accompanying notes to the financial statements):
| Common Stocks | | Level 1 | | | Level 2 | | | Level 3 | | | Total | |
| Financials | | $ | 83,039,165 | | | $ | — | | | $ | — | | | $ | 83,039,165 | |
| Information Technology | | | 9,397,885 | | | | — | | | | — | | | | 9,397,885 | |
| Total Common Stocks | | $ | 92,437,050 | | | $ | — | | | $ | — | | | $ | 92,437,050 | |
| Partnerships | | | | | | | | | | | | | | | | |
| Financials | | $ | 3,222,840 | | | $ | — | | | $ | — | | | $ | 3,222,840 | |
| Total Partnerships | | $ | 3,222,840 | | | $ | — | | | $ | — | | | $ | 3,222,840 | |
| Short-Term Investments | | | | | | | | | | | | | | | | |
| Money Market Funds | | $ | 2,082,684 | | | $ | — | | | $ | — | | | $ | 2,082,684 | |
| Total Short-Term Investments | | $ | 2,082,684 | | | $ | — | | | $ | — | | | $ | 2,082,684 | |
| Total Investments | | $ | 97,742,574 | | | $ | — | | | $ | — | | | $ | 97,742,574 | |
Transfers between levels are recognized at the end of the reporting period. During the year ended October 31, 2014, the Fund recognized no transfers between levels.
The accompanying notes are an integral part of these financial statements.
Financial Statements
Statement of Assets and Liabilities as of October 31, 2014 |
| ASSETS: | | | |
| Investments in unaffiliated securities, at value (cost $74,754,420) | | $ | 93,056,574 | |
| Investments in affiliated securities, at value (cost $4,226,794) | | | 4,686,000 | |
| Dividends and interest receivable | | | 43,480 | |
| Receivable for fund shares sold | | | 114,865 | |
| Receivable for securities sold | | | 964,232 | |
| Return of capital receivable | | | 46,200 | |
| Prepaid expenses and other assets | | | 10,912 | |
| Total Assets | | | 98,922,263 | |
| | | | | |
| LIABILITIES: | | | | |
| Payable for securities purchased | | | 661,152 | |
| Payable for fund shares redeemed | | | 34,655 | |
| Payable to advisor | | | 71,870 | |
| Payable to administrator | | | 17,098 | |
| Payable to auditor | | | 19,101 | |
| Accrued distribution fees | | | 20,196 | |
| Accrued trustees fees | | | 2,780 | |
| Accrued expenses and other payables | | | 20,570 | |
| Total Liabilities | | | 847,422 | |
| NET ASSETS | | $ | 98,074,841 | |
| | | | | |
| NET ASSETS CONSIST OF: | | | | |
| Capital stock | | $ | 70,273,805 | |
| Accumulated net realized gain on investments | | | 9,039,676 | |
| Unrealized net appreciation on investments | | | 18,761,360 | |
| Total Net Assets | | $ | 98,074,841 | |
| | | | | |
| NET ASSETS | | | | |
| Investor Class: | | | | |
| Shares authorized (no par value) | | Unlimited | |
| Net assets applicable to outstanding Investor Class shares | | $ | 98,074,841 | |
| Shares issued and outstanding | | | 4,699,119 | |
| Net asset value, offering price and redemption price per share | | $ | 20.87 | |
The accompanying notes are an integral part of these financial statements.
HENNESSY FUNDS 1-800-966-4354
Financial Statements
Statement of Operations for the year ended October 31, 2014 |
| INVESTMENT INCOME: | | | |
| Dividend income from unaffiliated securities | | $ | 1,417,585 | |
| Dividend income from affiliated securities | | | 86,595 | |
| Interest income | | | 293 | |
| Total investment income | | | 1,504,473 | |
| | | | | |
| EXPENSES: | | | | |
| Investment advisory fees (See Note 5) | | | 911,632 | |
| Distribution fees – Investor Class (See Note 5) | | | 253,231 | |
| Sub-transfer agent expenses – Investor Class (See Note 5) | | | 134,383 | |
| Administration, fund accounting, custody and transfer agent fees | | | 115,114 | |
| Federal and state registration fees | | | 21,699 | |
| Compliance expense | | | 21,487 | |
| Audit fees | | | 19,100 | |
| Reports to shareholders | | | 12,736 | |
| Trustees’ fees and expenses | | | 10,102 | |
| Legal fees | | | 2,622 | |
| Interest expense (See Note 6) | | | 1,948 | |
| Other expenses | | | 8,847 | |
| Total expenses | | | 1,512,901 | |
| NET INVESTMENT LOSS | | $ | (8,428 | ) |
| | | | | |
| REALIZED AND UNREALIZED GAINS (LOSSES): | | | | |
| Net realized gain on: | | | | |
| Unaffiliated investments | | $ | 11,310,562 | |
| Affiliated investments | | | 86,497 | |
| Net change in unrealized appreciation on investments | | | 423,324 | |
| Net gain on investments | | | 11,820,383 | |
| NET INCREASE IN NET ASSETS RESULTING FROM OPERATIONS | | $ | 11,811,955 | |
The accompanying notes are an integral part of these financial statements.
Financial Statements
| Statements of Changes in Net Assets |
| | | Year Ended | | | Year Ended | |
| | | October 31, 2014 | | | October 31, 2013 | |
| OPERATIONS: | | | | | | |
| Net investment loss | | $ | (8,428 | ) | | $ | (155,053 | ) |
| Net realized gain on investments | | | 11,397,059 | | | | 8,243,533 | |
| Long-term capital gain distributions | | | | | | | | |
| from regulated investment companies | | | — | | | | 17,820 | |
| Net change in unrealized appreciation on investments | | | 423,324 | | | | 10,739,120 | |
| Net increase in net assets resulting from operations | | | 11,811,955 | | | | 18,845,420 | |
| | | | | | | | | |
| DISTRIBUTIONS TO SHAREHOLDERS FROM: | | | | | | | | |
| Net investment income | | | | | | | | |
| Investor Class | | | — | | | | (50,837 | ) |
| Net realized gains | | | | | | | | |
| Investor Class | | | (2,696,057 | ) | | | — | |
| Total distributions | | | (2,696,057 | ) | | | (50,837 | ) |
| | | | | | | | | |
| CAPITAL SHARE TRANSACTIONS: | | | | | | | | |
| Proceeds from shares subscribed – Investor Class | | | 42,008,535 | | | | 43,711,247 | |
| Dividends reinvested – Investor Class | | | 2,639,350 | | | | 49,255 | |
| Cost of shares redeemed – Investor Class | | | (43,989,911 | )(1) | | | (38,910,007 | )(2) |
| Net increase in net assets derived | | | | | | | | |
| from capital share transactions | | | 657,974 | | | | 4,850,495 | |
| TOTAL INCREASE IN NET ASSETS | | | 9,773,872 | | | | 23,645,078 | |
| | | | | | | | | |
| NET ASSETS: | | | | | | | | |
| Beginning of year | | | 88,300,969 | | | | 64,655,891 | |
| End of year | | $ | 98,074,841 | | | $ | 88,300,969 | |
| Undistributed net investment loss, end of year | | $ | — | | | $ | (161,731 | ) |
| | | | | | | | | |
| CHANGES IN SHARES OUTSTANDING: | | | | | | | | |
| Shares sold – Investor Class | | | 2,098,171 | | | | 2,488,338 | |
| Shares issued to holders as reinvestment | | | | | | | | |
| of dividends – Investor Class | | | 135,909 | | | | 3,367 | |
| Shares redeemed – Investor Class | | | (2,180,579 | ) | | | (2,412,632 | ) |
| Net increase in shares outstanding | | | 53,501 | | | | 79,073 | |
| (1) | Net of redemption fees of $287 related to redemption fees imposed by the FBR Large Cap Financial Fund during a prior year but not received until fiscal year 2014. |
| (2) | Net of redemption fees of $15 related to redemption fees imposed by the FBR Large Cap Financial Fund during a prior year but not received until fiscal year 2013. |
The accompanying notes are an integral part of these financial statements.
HENNESSY FUNDS 1-800-966-4354
Financial Statements
For an Investor Class share outstanding throughout each year
PER SHARE DATA:
Net asset value, beginning of year
Income from investment operations:
Net investment income (loss)
Net realized and unrealized gains (losses) on investments
Total from investment operations
Less distributions:
Dividends from net investment income
Dividends from net realized gains
Total distributions
Paid-in capital from redemption fees
Net asset value, end of year
TOTAL RETURN
Net assets, end of year (millions)
Ratio of expenses to average net assets
Ratio of net investment income to average net assets
Portfolio turnover rate
| (1) | Calculated based on average shares outstanding method. |
| (2) | Amount is less than $0.01. |
The accompanying notes are an integral part of these financial statements.
| Year Ended October 31, | |
| 2014 | | | 2013 | | | 2012 | | | 2011 | | | 2010 | |
| | | | | | | | | | | | | | |
| $ | 19.01 | | | $ | 14.16 | | | $ | 11.91 | | | $ | 12.88 | | | $ | 12.61 | |
| | | | | | | | | | | | | | | | | | | |
| | | | | | | | | | | | | | | | | | | |
| | 0.00 | (2) | | | (0.03 | ) | | | 0.01 | | | | (0.04 | )(1) | | | (0.08 | ) |
| | 2.44 | | | | 4.89 | | | | 2.24 | | | | (0.93 | ) | | | 0.35 | |
| | 2.44 | | | | 4.86 | | | | 2.25 | | | | (0.97 | ) | | | 0.27 | |
| | | | | | | | | | | | | | | | | | | |
| | | | | | | | | | | | | | | | | | | |
| | — | | | | (0.01 | ) | | | — | | | | — | | | | — | |
| | (0.58 | ) | | | — | | | | — | | | | — | | | | — | |
| | (0.58 | ) | | | (0.01 | ) | | | — | | | | — | | | | — | |
| | 0.00 | (2) | | | 0.00 | (2) | | | 0.00 | (2) | | | 0.00 | (2) | | | 0.00 | (2) |
| $ | 20.87 | | | $ | 19.01 | | | $ | 14.16 | | | $ | 11.91 | | | $ | 12.88 | |
| | | | | | | | | | | | | | | | | | | |
| | 13.04 | % | | | 34.37 | % | | | 18.89 | % | | | (7.53 | )% | | | 2.14 | % |
| $ | 98.07 | | | $ | 88.30 | | | $ | 64.66 | | | $ | 55.68 | | | $ | 48.72 | |
| | 1.49 | % | | | 1.57 | % | | | 1.57 | % | | | 1.61 | % | | | 1.78 | % |
| | (0.01 | )% | | | (0.22 | )% | | | 0.09 | % | | | (0.34 | )% | | | (0.73 | )% |
| | 58 | % | | | 75 | % | | | 93 | % | | | 97 | % | | | 150 | % |
The accompanying notes are an integral part of these financial statements.
HENNESSY FUNDS 1-800-966-4354
Financial Statements
Notes to Financial Statements October 31, 2014 |
1). ORGANIZATION
The Hennessy Large Cap Financial Fund (the “Fund”) is a series of Hennessy Funds Trust (the “Trust”), which was organized as a Delaware statutory trust on September 17, 1992. The Fund is an open-end management investment company registered under the Investment Company Act of 1940, as amended. The Fund is a successor to the FBR Large Cap Financial Fund (the “Predecessor FBR Fund”), a series of The FBR Funds, a Delaware statutory trust, pursuant to a reorganization that took place after the close of business on October 26, 2012. Prior to October 26, 2012, the Fund had no investment operations. As a result of the reorganization, holders of the Investor Class shares of the Predecessor FBR Fund received Investor Class shares of the Fund (the Investor Class shares of the Fund are the successor to the accounting and performance information of the Predecessor FBR Fund). The investment objective of the Fund is capital appreciation. The Fund is a non-diversified fund.
The Fund offers Investor Class shares.
2). SIGNIFICANT ACCOUNTING POLICIES
The following is a summary of significant accounting policies consistently followed by the Fund in the preparation of the financial statements. These policies are in conformity with U.S. generally accepted accounting principles (“GAAP”).
| a). | Investment Valuation – All investments in securities are recorded at their estimated fair value, as described in Note 3. |
| b). | Federal Income Taxes – Provision for federal income taxes or excise taxes has not been made since the Fund has elected to be taxed as a “regulated investment company” and intends to distribute substantially all of its taxable income to its shareholders and otherwise comply with the provisions of the Internal Revenue Code of 1986, as amended, applicable to regulated investment companies. Net investment income or loss and realized gains and losses for federal income tax purposes may differ from that reported on the financial statements because of temporary book and tax basis differences. Temporary differences are primarily the result of the treatment of wash sales for tax reporting purposes. Distributions from net realized gains for book purposes may include short-term capital gains, which are included as ordinary income to shareholders for tax purposes. |
| | Due to inherent differences in the recognition of income, expenses, and realized gains/losses under GAAP and federal income tax regulations, permanent differences between book and tax basis reporting for the 2014 fiscal year have been identified and appropriately reclassified on the Statement of Assets and Liabilities. The adjustments are as follow: |
| Undistributed | Accumulated | |
| Net Investment | Net Realized | |
| Income/(Loss) | Gain/(Loss) | Paid-in Capital |
| $170,159 | $(170,159) | $ — |
| c). | Income and Expenses – Dividend income is recognized on the ex-dividend date or as soon as information is available to the Fund. Interest income, which includes the amortization of premium and accretion of discount, is recognized on an accrual basis. |
| | The Fund is charged for those expenses that are directly attributable to the portfolio, such as advisory, administration, and certain shareholder service fees. |
| d). | Distributions to Shareholders – Dividends from net investment income for the Fund, if any, are declared and paid out annually, usually in December. Distributions of net realized capital gains, if any, are declared and paid annually, usually in November or December. |
| e). | Security Transactions – Investment and shareholder transactions are recorded on the trade date. The Fund determines the gain or loss realized from the investment transactions by comparing the original cost of the security lot sold with the net sale proceeds. Discounts and premiums on securities purchased are accreted/amortized over the life of the respective security. |
| f). | Use of Estimates – The preparation of financial statements in conformity with GAAP requires management to make estimates and assumptions that affect the reported amounts of assets and liabilities and disclosure of contingent assets and liabilities at the date of the financial statements and the reported change in net assets during the reporting period. Actual results could differ from those estimates. |
| g). | Share Valuation – The net asset value (“NAV”) per share of the Fund is calculated by dividing the sum of the value of the securities held by the Fund, plus cash or other assets, minus all liabilities (including estimated accrued expenses) by the total number of shares outstanding for the Fund, rounded to the nearest cent. The Fund’s shares will not be priced on days the New York Stock Exchange is closed for trading. The offering and redemption price per share for the Fund is equal to the Fund’s NAV per share. |
| h). | Foreign Currency – Values of investments denominated in foreign currencies are converted into U.S. dollars using the spot market rate of exchange at the time of valuation. Purchases and sales of investments and income are translated into U.S. dollars using the spot market rate of exchange prevailing on the respective dates of such transactions. The Fund does not isolate the portion of the results of operations resulting from fluctuations in foreign exchange rates on investments from fluctuations resulting from changes in the market prices of securities held. Such fluctuations are included with the net realized and unrealized gain or loss on investments. Foreign investments present additional risks due to currency fluctuations, economic and political factors, lower liquidity, government regulations, differences in accounting standards, and other factors. |
| i). | Forward Contracts – The Fund may enter into forward currency contracts to reduce its exposure to changes in foreign currency exchange rates on its foreign holdings and to lock in the U.S. dollar cost of firm purchase and sale commitments for securities denominated in foreign currencies. A forward currency contract is a commitment to purchase or sell a foreign currency at a future date at a negotiated forward rate. The gain or loss arising from the difference between the U.S. dollar cost of the original contract and the value of the foreign currency in U.S. dollars upon closing of such contract is included in net realized gain or loss from foreign currency transactions. During the fiscal year ended October 31, 2014, the Fund did not enter into any forward contracts. |
| j). | Repurchase Agreements – The Fund may enter into repurchase agreements with member banks or security dealers of the Federal Reserve Board whom the investment advisor deems creditworthy. The repurchase price generally equals the price paid by the Fund plus interest negotiated on the basis of current short-term rates. |
HENNESSY FUNDS 1-800-966-4354
| | Securities pledged as collateral for repurchase agreements are held by the custodian bank until the respective agreements mature. Provisions of the repurchase agreements ensure that the market value of the collateral, including accrued interest thereon, is sufficient to cover the repurchase amount in the event of default of the counterparty. If the counterparty defaults and the value of the collateral declines or if the counterparty enters an insolvency proceeding, realization of the collateral by the Fund may be delayed or limited. |
| k). | Accounting for Uncertainty in Income Taxes – The Fund has adopted accounting policies regarding recognition and measurement of tax positions taken or expected to be taken on a tax return. The tax returns of the Fund for the prior three fiscal years are open for examination. The Fund has reviewed all open tax years in major jurisdictions and concluded that there is no impact on the Fund’s net assets and no tax liability resulting from unrecognized tax benefits relating to uncertain income tax positions taken or expected to be taken on a tax return. The Fund’s major tax jurisdictions are U.S. federal and Delaware. |
| l). | Derivatives – The Fund may invest in, or enter into, derivatives, such as options, futures contracts, options on futures contracts, and swaps, for a variety of reasons, including to hedge certain risks, to provide a substitute for purchasing or selling particular securities, or to increase potential income gain. Derivatives may provide a cheaper, quicker, or more specifically focused way for a Fund to invest than “traditional” securities would. The main purpose of utilizing these derivative instruments is for hedging purposes. |
| | The Fund has adopted the financial accounting reporting rules as required by the Derivatives and Hedging Topic of the Financial Accounting Standards Board Accounting Standards Codification. Under such rules, the Fund is required to include enhanced disclosure that enables investors to understand how and why an entity uses derivatives, how derivatives are accounted for, and how derivatives instruments affect an entity’s results of operations and financial position. During the fiscal year ended October 31, 2014, the Fund did not hold any derivative instruments. |
| m). | Events Subsequent to the Fiscal Period End – The Fund has adopted financial reporting rules regarding subsequent events that require an entity to recognize in the financial statements the effects of all subsequent events that provide additional evidence about conditions that existed at the date of the balance sheet. Management has evaluated the Fund’s related events and transactions that occurred subsequent to October 31, 2014 through the date of issuance of the Fund’s financial statements. There were no events or transactions that occurred during this period that materially impacted the amounts or disclosures in the Fund’s financial statements. |
3). SECURITIES VALUATION
The Fund has adopted authoritative fair valuation accounting standards that establish an authoritative definition of fair value and set out a hierarchy for measuring fair value. These standards require additional disclosures about the various inputs and valuation techniques used to develop the measurements of fair value and a discussion in changes in valuation techniques and related inputs during the period. These inputs are summarized in the three broad levels listed below:
| | Level 1 – | Quoted unadjusted prices for identical instruments in active markets to which the Fund has access at the date of measurement. |
| | Level 2 – | Quoted prices for similar instruments in active markets; quoted prices for identical or similar instruments in markets that are not active; and model- |
| | | derived valuations in which all significant inputs and significant value drivers are observable in active markets. Level 2 inputs are those in markets for which there are few transactions, the prices are not current, the prices are fair value adjusted due to post-market close subsequent events (foreign markets), little public information exists, or instances where prices vary substantially over time or among brokered market makers. These inputs may also include interest rates, prepayment speeds, credit risk curves, default rates, and similar data. |
| | Level 3 – | Model-derived valuations in which one or more significant inputs or significant value drivers are unobservable. Unobservable inputs are those inputs that reflect the Fund’s own assumptions about what market participants would use to price the asset or liability based on the best available information. |
Following is a description of the valuation techniques applied to the Fund’s major categories of assets and liabilities measured at fair value on a recurring basis.
Equity Securities – Equity securities, including common stocks, preferred stocks, foreign issued common stocks, exchange traded funds, closed-end mutual funds, and real estate investment trusts, that are traded on a securities exchange for which a last-quoted sales price is readily available will generally be valued at the last sales price as reported by the primary exchange on which the securities are listed. Securities listed on The NASDAQ Stock Market (“NASDAQ”) will be valued at the NASDAQ Official Closing Price, which may differ from the last sales price reported. Securities traded on a securities exchange for which a last-quoted sales price is not readily available will generally be valued at the mean between the bid and ask prices. To the extent these securities are actively traded and valuation adjustments are not applied, they are classified in Level 1 of the fair value hierarchy.
Investment Companies – Investments in investment companies (e.g., mutual funds and exchange traded funds) are generally priced at the ending NAV provided by the Fund’s service agent and will be classified in Level 1 of the fair value hierarchy.
Debt Securities – Debt securities, including corporate bonds, asset-backed securities, mortgage-backed securities, municipal bonds, U.S. Treasuries, and U.S. government agency issues, are valued at market on the basis of valuations furnished by an independent pricing service that utilizes both dealer-supplied valuations and formula-based techniques. The pricing service may consider recently executed transactions in securities of the issuer or comparable issuers, market price quotations (where observable), bond spreads, and fundamental data relating to the issuer. In addition, the model may incorporate market observable data such as reported sales of similar securities, broker quotes, yields, bids, offers, and reference data. Certain securities are valued principally using dealer quotations. These securities are generally classified in Level 2 of the fair value hierarchy.
Short-Term Securities – Short-term equity investments, including money market funds, are valued in the manner specified above. Short-term debt investments are generally valued at amortized cost, which approximates fair market value, if their original maturity was 60 days or less, or by amortizing the values as of the 61st day prior to maturity, if their original term to maturity exceeded 60 days. Amortized cost is not used if its use would be inappropriate due to credit or other impairments of the issuer, in which the security would be fair valued, as described below. Short-term securities are generally classified in Level 1 or Level 2 of the fair market hierarchy depending on the inputs used and market activity levels for specific securities.
HENNESSY FUNDS 1-800-966-4354
The Board of Trustees of the Fund (the “Board”) has adopted fair value pricing procedures that are followed when a price for a security is not readily available or if a significant event has occurred that indicates the closing price of a security no longer represents the true value of that security. Fair value pricing determinations are made in good faith in accordance with these procedures. There are numerous criteria that will be given consideration in determining a fair value of a security. Some of these criteria are trading volume of security and markets, the value of other like securities, and news events with direct bearing to security or market. Fair value pricing results in an estimated price for a security that reflects the amount the Fund might reasonably expect to receive in a current sale.. Depending on the relative significance of the valuation inputs, these securities may be classified in either Level 2 or Level 3 of the fair value hierarchy.
Fair valuing of foreign securities may be determined with the assistance of a pricing service using correlations between the movement of prices of such securities and indices of domestic securities and other appropriate indicators, such as closing market prices of relevant American Depositary Receipts or futures contracts. The effect of using fair value pricing is that the Fund’s NAV will reflect the affected portfolio securities’ value as determined in the judgment of the Board or its designee instead of being determined by the market. Using a fair value pricing methodology to price foreign securities may result in a value that is different from a foreign security’s most recent closing price and from the prices used by other investment companies to calculate their NAVs and are generally considered Level 2 prices in the fair valuation hierarchy. Because the Fund may invest in foreign securities, the value of the Fund’s portfolio securities may change on days when you will not be able to purchase or redeem your shares.
The Board has delegated day-to-day valuation matters to a Valuation Committee comprised of one or more representatives from Hennessy Advisors, Inc., the Fund’s investment advisor. The function of the Valuation Committee is to value securities where current and reliable market quotations are not readily available. All actions taken by the Valuation Committee are reviewed by the Board.
The Fund has performed an analysis of all existing investments to determine the significance and character of all inputs to their fair value determination. Various inputs are used in determining the value of the Fund’s investments. The inputs or methodology used for valuing securities are not necessarily an indication of the risk associated with investing in those securities. Details related to the fair valuation hierarchy of the Fund’s securities as of October 31, 2014 are included in the Fund’s Schedule of Investments.
4). INVESTMENT TRANSACTIONS
Purchases and sales of investment securities (excluding government and short-term investments) for the Fund during the fiscal year ended October 31, 2014 were $59,916,056 and $59,962,689, respectively.
There were no purchases or sales/maturities of long-term U.S. Government Securities for the Fund during the fiscal year ended October 31, 2014.
5). INVESTMENT MANAGEMENT FEE AND OTHER TRANSACTIONS WITH AFFILIATES
Hennessy Advisors, Inc. (the “Advisor”) is the investment advisor of the Fund. The Advisor provides the Fund with investment management services under an Investment Advisory Agreement. The Advisor furnishes all investment advice, office space, facilities, and provides most of the personnel needed by the Fund. As compensation for its services, the Advisor is entitled to a monthly fee from the Fund. The fee is based upon the average daily net assets of the Fund at the annual rate of 0.90%. The net investment advisory fees payable for the Fund as of October 31, 2014 were $71,870.
The Advisor has contractually agreed to limit the total annual operating expenses of the Fund (excluding interest, taxes, brokerage commissions, dividend expenses, acquired fund fees and expenses, extraordinary legal expenses, or any other extraordinary expenses and, from and after November 1, 2014, 12b-1 fees) to 1.95% of the Fund’s net assets through February 28, 2015.
For a period of three years after the year in which the Advisor waives or reimburses expenses, the Advisor may seek reimbursement from the Fund to the extent that total annual fund operating expenses are less than the expense limitation in effect at the time of the reimbursement. During the three years ended October 31, 2014, no Advisor fees were waived and therefore no expenses are subject to potential recovery.
The Fund has adopted a plan pursuant to Rule 12b-1 under the Investment Company Act of 1940, as amended, that authorizes payments in connection with the distribution of the Fund’s shares at an annual rate of up to 0.25% of the Fund’s average daily net assets. Amounts paid under the plan may be spent on any activities or expenses primarily intended to result in the sale of shares, including but not limited to, advertising, compensation for sales and marketing activities or financial institutions and others such as dealers and distributors, shareholder account servicing, the printing and mailing of prospectuses to other than current shareowners, and the printing and mailing of sales literature.
The Fund has entered into agreements with various brokers, dealers, and financial intermediaries in connection with the sale of shares of the Fund. The agreements provide for periodic payments by the Fund to the brokers, dealers, and financial intermediaries for providing certain shareholder maintenance services (sub-transfer agent expenses). These shareholder services include the pre-processing and quality control of new accounts, shareholder correspondence, answering customer inquiries regarding account status, and facilitating shareholder telephone transactions. Fees paid by the Fund to various brokers, dealers, and financial intermediaries for the fiscal year ended October 31, 2014 were $134,383.
U.S. Bancorp Fund Services, LLC (“USBFS”) provides the Fund with administrative, fund accounting, and transfer agent services, including all regulatory reporting, and necessary office equipment and personnel. As administrator, USBFS prepares various federal and state regulatory filings, reports, and returns for the Fund; prepares reports and materials to be supplied to the Board; monitors the activities of the Fund’s custodian, transfer agent, and accountants; and coordinates the preparation and payment of the Fund’s expenses and reviews the Fund’s expense accruals. Fees paid to USBFS for the fiscal year ended October 31, 2014 were $115,114.
U.S. Bank, N.A., an affiliate of USBFS, serves as the Fund’s custodian. Quasar Distributors, LLC acts as the Fund’s principal underwriter in a continuous public offering of the Fund’s shares. Quasar Distributors, LLC is an affiliate of USBFS and U.S. Bank, N.A.
6). LINE OF CREDIT
The Fund has a line of credit with the other funds in the Hennessy Funds family of funds (the “Hennessy Funds”) in the amount of the lesser of (i) $100,000,000 or (ii) 33.33% of each Hennessy Fund’s net assets, or 30% for the Hennessy Gas Utility Index Fund and 10% for the Hennessy Balanced Fund, intended to provide short-term financing, if necessary, subject to certain restrictions, in connection with shareholder redemptions. The credit facility is with the Hennessy Funds’ custodian bank, U.S. Bank, N.A. Borrowings under this arrangement bear interest at the bank’s prime rate. During the fiscal year ended October 31, 2014, the Fund had an outstanding average daily balance and a weighted average interest rate of $95,151 and 3.25%, respectively. The maximum
HENNESSY FUNDS 1-800-966-4354
amount outstanding for the Fund during the period was $6,276,000. At October 31, 2014, the Fund had a loan payable balance of $0.
7). FEDERAL TAX INFORMATION
As of October 31, 2014, the components of accumulated earnings (losses) for income tax purposes for the Fund were as follow:
| | Cost of investments for tax purposes | | $ | 79,895,065 | |
| | Gross tax unrealized appreciation | | $ | 18,973,654 | |
| | Gross tax unrealized depreciation | | | (1,126,145 | ) |
| | Net tax unrealized appreciation | | $ | 17,847,509 | |
| | Undistributed ordinary income | | $ | 484,533 | |
| | Undistributed long-term capital gains | | | 9,468,994 | |
| | Total distributable earnings | | $ | 9,953,527 | |
| | Other accumulated gain | | $ | — | |
| | Total accumulated gain | | $ | 27,801,036 | |
The difference between book-basis and tax-basis unrealized appreciation is attributable primarily to wash sales and partnership adjustments.
At October 31, 2014, the Fund had no tax basis capital losses to offset future capital gains.
At October 31, 2014, the Fund did not defer, on a tax basis, any late year ordinary losses.
The tax character of distributions paid during fiscal year 2014 and fiscal year 2013 for the Fund were as follow:
| | | | Year Ended | | | Year Ended | |
| | | | October 31, 2014 | | | October 31, 2013 | |
| | Ordinary income | | $ | — | | | $ | 50,837 | |
| | Long-term capital gain | | | 2,696,057 | | | | — | |
| | | | $ | 2,696,057 | | | $ | 50,837 | |
8). EVENTS SUBSEQUENT TO YEAR-END
On December 8, 2014, a short-term capital gains distribution of $0.10319 per share and a long-term capital gains distribution of $2.01658 per share were declared and paid to shareholders of record on December 5, 2014.
Report of Independent Registered Public Accounting Firm
To the Board of Trustees of Hennessy Funds Trust
And the Shareholders of Hennessy Large Cap Financial Fund
We have audited the accompanying statement of assets and liabilities, including the schedule of investments, of the Hennessy Large Cap Financial Fund (the “Fund”), a series of Hennessy Funds Trust (the “Trust”) as of October 31, 2014, and the related statement of operations for the year then ended, the statements of changes in net assets for each of the two years in the period then ended, and the financial highlights for each of the five years in the period then ended. These financial statements and financial highlights are the responsibility of the Funds’ management. Our responsibility is to express an opinion on these financial statements and financial highlights based on our audits.
We conducted our audits in accordance with the standards of the Public Company Accounting Oversight Board (United States). Those standards require that we plan and perform the audits to obtain reasonable assurance about whether the financial statements and financial highlights are free of material misstatement. The Fund is not required to have, nor were we engaged to perform, an audit of its internal control over financial reporting. Our audits included consideration of internal control over financial reporting as a basis for designing audit procedures that are appropriate in the circumstances, but not for the purposes of expressing an opinion on the effectiveness of the Fund’s internal control over financial reporting. Accordingly, we express no such opinion. An audit includes examining, on a test basis, evidence supporting the amounts and disclosures in the financial statements. Our procedures included confirmation of securities owned as of October 31, 2014, by correspondence with the custodian and brokers. An audit also includes assessing the accounting principles used and significant estimates made by management, as well as evaluating the overall financial statement presentation. We believe that our audits provide a reasonable basis for our opinion.
In our opinion, the financial statements and financial highlights referred to above present fairly, in all material respects, the financial position of the Hennessy Large Cap Financial Fund as of October 31, 2014, the results of its operations for the year then ended, the changes in its net assets for each of the two years in the period then ended, and the financial highlights for each of the five years in the period then ended, in conformity with accounting principles generally accepted in the United States of America.
TAIT, WELLER & BAKER LLP
Philadelphia, Pennsylvania
December 30, 2014
HENNESSY FUNDS 1-800-966-4354
Trustees and Officers of the Fund (Unaudited)
The business and affairs of the Fund are managed under the direction of the Fund’s Board of Trustees. Information pertaining to the Trustees and Officers of the Fund is set forth below. The Fund’s Statement of Additional Information includes additional information about the Fund’s Trustees and Officers and is available, without charge, upon request by calling 1-800-966-4354.
| | | | | Number of | |
| | | Term of | | Portfolios | |
| | | Office | | in the | Other |
| | | and | | Fund | Directorships |
| | Position(s) | Length | Principal | Complex | (During Past |
| Name, Address, | Held with | of Time | Occupation(s) | Overseen | Five Years)(2) |
| and Age | the Fund | Served | During Past Five Years | by Trustee | Held by Trustee |
| | | |
| Disinterested Trustees (as defined below) | | |
| | | |
| J. Dennis DeSousa | Trustee | Indefinite, | Mr. DeSousa is a real | 16 | Hennessy SPARX |
| Age: 78 | | until | estate investor. | | Funds Trust; |
| Address: | | successor | | | Hennessy Mutual |
| c/o Hennessy | | elected | | | Funds, Inc.; and |
| Advisors, Inc. | | | | | The Hennessy |
| 7250 Redwood Blvd. | | Served | | | Funds, Inc. |
| Suite 200 | | since | | | |
| Novato, CA 94945 | | January | | | |
| | | 1996 | | | |
| | | for the | | | |
| | | Funds (or | | | |
| | | Predecessor | | | |
| | | Funds) | | | |
| | | | | | |
| Robert T. Doyle | Trustee | Indefinite, | Mr. Doyle has been the | 16 | Hennessy SPARX |
| Age: 67 | | until | Sheriff of Marin County, | | Funds Trust; |
| Address: | | successor | California since 1996. | | Hennessy Mutual |
| c/o Hennessy | | elected | | | Funds, Inc.; and |
| Advisors, Inc. | | | | | The Hennessy |
| 7250 Redwood Blvd. | | Served | | | Funds, Inc. |
| Suite 200 | | since | | | |
| Novato, CA 94945 | | January | | | |
| | | 1996 | | | |
| | | for the | | | |
| | | Funds (or | | | |
| | | Predecessor | | | |
| | | Funds) | | | |
| | | | | | |
| Gerald P. Richardson | Trustee | Indefinite, | Mr. Richardson is an | 16 | Hennessy SPARX |
| Age: 69 | | until | independent consultant | | Funds Trust; |
| Address: | | successor | in the securities industry. | | Hennessy Mutual |
| c/o Hennessy | | elected | | | Funds, Inc.; and |
| Advisors, Inc. | | | | | The Hennessy |
| 7250 Redwood Blvd. | | Served | | | Funds, Inc. |
| Suite 200 | | since | | | |
| Novato, CA 94945 | | May 2004 | | | |
| | | for the | | | |
| | | Funds (or | | | |
| | | Predecessor | | | |
| | | Funds) | | | |
| | | | | Number of | |
| | | Term of | | Portfolios | |
| | | Office | | in the | Other |
| | | and | | Fund | Directorships |
| | Position(s) | Length | Principal | Complex | (During Past |
| Name, Address, | Held with | of Time | Occupation(s) | Overseen | Five Years)(2) |
| and Age | the Fund | Served | During Past Five Years | by Trustee | Held by Trustee |
| | | |
| “Interested Persons” (as defined in the 1940 Act) | | |
| | | |
Neil J. Hennessy(1) | Chief | Trustee: | Mr. Hennessy has been | 16 | Hennessy |
| Age: 58 | Investment | Indefinite, | employed by Hennessy | | Advisors, Inc. |
| Address: | Officer, | until | Advisors, Inc., the Funds’ | | (current); |
| c/o Hennessy | Portfolio | successor | investment advisor, since | | Hennessy SPARX |
| Advisors, Inc. | Manager, | elected | 1989. He currently serves | | Funds Trust; |
| 7250 Redwood Blvd. | President, | | as President, Chairman | | Hennessy Mutual |
| Suite 200 | Trustee | Served | and CEO of Hennessy | | Funds, Inc.; and |
| Novato, CA 94945 | and | since | Advisors, Inc. | | The Hennessy |
| | Chairman | January | | | Funds, Inc. |
| | of the | 1996 | | | |
| | Board | for the | | | |
| | | Funds (or | | | |
| | | Predecessor | | | |
| | | Funds) | | | |
| | | | | | |
| | | Officer: | | | |
| | | 1 year term | | | |
| | | | | | |
| | | Served | | | |
| | | since | | | |
| | | June 2008 | | | |
| | | for the | | | |
| | | Funds (or | | | |
| | | Predecessor | | | |
| | | Funds) | | | |
| | | | | | |
Teresa M. Nilsen(1) | Executive | 1 year term | Ms. Nilsen has been | N/A | N/A |
| Age: 48 | Vice | | employed by Hennessy | | |
| Address: | President | Served | Advisors, Inc., the Funds’ | | |
| c/o Hennessy | and | since | investment advisor, since | | |
| Advisors, Inc. | Treasurer | January | 1989. She currently serves | | |
| 7250 Redwood Blvd. | | 1996 | as Executive Vice President, | | |
| Suite 200 | | for the | Chief Operations Officer, | | |
| Novato, CA 94945 | | Funds (or | Chief Financial Officer, and | | |
| | | Predecessor | Secretary of Hennessy | | |
| | | Funds) | Advisors, Inc. | | |
| (1) | All Officers of the Hennessy Funds and employees of the Manager are Interested Persons of the Funds. |
| (2) | Pursuant to an internal reorganization, the series of Hennessy Mutual Funds, Inc. (“HMFI”), The Hennessy Funds, Inc. (“HFI”) and Hennessy SPARX Funds Trust (“HSFT”) were reorganized into series of Hennessy Funds Trust on February 28, 2014, which mirrored the corresponding series of HFMI, HFI and HSFT. Subsequent to the reorganization, HFMI, HFI and HSFT were dissolved. |
HENNESSY FUNDS 1-800-966-4354
| | | Term of | |
| | | Office | |
| | | and | |
| | Position(s) | Length | Principal |
| Name, Address, | Held with | of Time | Occupation(s) |
| and Age | the Fund | Served | During Past Five Years |
| | | | |
| Interested Persons | | | |
| | | | |
Daniel B. Steadman(1) | Executive | 1 year term | Mr. Steadman has been employed by |
| Age: 58 | Vice President | | Hennessy Advisors, Inc., the Funds’ |
| Address: | and Secretary | Served since | investment advisor, since 2000. |
| c/o Hennessy Advisors, Inc. | | March 2000 | He currently serves as Executive |
| 7250 Redwood Blvd. | | for the Funds (or | Vice President and Chief Compliance |
| Suite 200 | | Predecessor Funds) | Officer of Hennessy Advisors, Inc. |
| Novato, CA 94945 | | | |
| | | | |
Jennifer Cheskiewicz(1) | Senior | 1 year term | Ms. Cheskiewicz has been employed by |
| Age: 37 | Vice President | | Hennessy Advisors, Inc., the Funds’ |
| Address: | and Chief | Served since | investment advisor, since June 2013. |
| c/o Hennessy Advisors, Inc. | Compliance | June 2013 | She previously served as in-house |
| 7250 Redwood Blvd. | Officer | for the Funds (or | counsel to Carlson Capital, L.P., an |
| Suite 200 | | Predecessor Funds) | SEC-registered investment advisor to |
| Novato, CA 94945 | | | several private funds from February |
| | | | 2010 to May 2013. Prior to that, she |
| | | | was an attorney with Gibson, Dunn & |
| | | | Crutcher LLP from September 2005 |
| | | | through February 2010. She currently |
| | | | serves as General Counsel of |
| | | | Hennessy Advisors, Inc. |
| | | | |
Brian Carlson(1) | Senior | 1 year term | Mr. Carlson has been employed by |
| Age: 42 | Vice President | | Hennessy Advisors, Inc., the Funds’ |
| Address: | and Head of | Served since | investment advisor, since |
| c/o Hennessy Advisors, Inc. | Distribution | December 2013 | December 2013. |
| 7250 Redwood Blvd. | | for the Funds (or | |
| Suite 200 | | Predecessor Funds) | Mr. Carlson was previously a |
| Novato, CA 94945 | | | co-founder and principal of Trivium |
| | | | Consultants, LLC from February 2011 |
| | | | through November 2013. Prior to that, |
| | | | he was the Senior Managing Director |
| | | | of NRP Financial, Inc. from August |
| | | | 2007 through February 2011. |
| | | | |
David Ellison(1) | Portfolio Manager | 1 year term | Mr. Ellison has served as Portfolio |
| Age: 56 | and Senior | | Manager of the Large Cap Financial |
| Address: | Vice President | Served since | Fund, the Small Cap Financial Fund, |
| c/o Hennessy Advisors, Inc. | | October 2012 | and the Technology Fund |
| 101 Federal Street | | for the Funds (or | since inception. |
| Suite 1900 | | Predecessor Funds) | |
| Boston, MA 02110 | | | Mr. Ellison previously served as Director, |
| | | | CIO and President of FBR Advisers, Inc. |
| | | | from December 1999 to October 2012. |
| (1) | All Officers of the Hennessy Funds and employees of the Manager are Interested Persons of the Funds. |
| | | Term of | |
| | | Office | |
| | | and | |
| | Position(s) | Length | Principal |
| Name, Address, | Held with | of Time | Occupation(s) |
| and Age | the Fund | Served | During Past Five Years |
| | | | |
| Interested Persons | | | |
| | | | |
Brian Peery(1) | Portfolio Manager | 1 year term | Mr. Peery has been a Portfolio Manager |
| Age: 45 | and | | of the Cornerstone Growth Fund, |
| Address: | Vice President | Served since | the Cornerstone Mid Cap 30 Fund, the |
| c/o Hennessy Advisors, Inc. | | March 2003 | Cornerstone Large Growth Fund, the |
| 7250 Redwood Blvd. | | as Vice President | Cornerstone Value Fund, the Total |
| Suite 200 | | for the Funds (or | Return Fund, and the Balanced Fund |
| Novato, CA 94945 | | Predecessor Funds) | since October 2014. From February |
| | | | 2011 through September 2014, he |
| | | Served since | served as Co-Portfolio Manager of |
| | | February 2011 | the same funds. |
| | | as Co-Portfolio | |
| | | Manager | Mr. Peery has been employed by |
| | | for the Funds (or | Hennessy Advisors, Inc., the Funds’ |
| | | Predecessor Funds) | investment advisor, since 2002. |
| | | | |
Winsor (Skip) Aylesworth(1) | Portfolio Manager | 1 year term | Mr. Aylesworth has been Portfolio |
| Age: 67 | and | | Manager of the Gas Utility Index Fund |
| Address: | Vice President | Served since | since 1998 and Portfolio Manager of |
| c/o Hennessy Advisors, Inc. | | October 2012 | the Technology Fund since inception. |
| 101 Federal Street | | for the Funds (or | |
| Suite 1900 | | Predecessor Funds) | Mr. Aylesworth previously served as |
| Boston, MA 02110 | | | Executive Vice President of The FBR |
| | | | Funds from 1999 to October 2012. |
| | | | |
Ryan Kelley(1) | Portfolio Manager | 1 year term | Mr. Kelley has been a Portfolio Manager |
| Age: 42 | and | | of the Gas Utility Index Fund (formerly |
| Address: | Vice President | Served since | the FBR Gas Utility Index Fund), the |
| c/o Hennessy Advisors, Inc. | | March 2013 | Small Cap Financial Fund (formerly the |
| 1340 Environ Way | | for the Funds (or | FBR Small Cap Financial Fund), and the |
| Chapel Hill, NC 27517 | | Predecessor Funds) | Large Cap Financial Fund (formerly the |
| | | | FBR Large Cap Financial Fund) since |
| | | | October 2014. From March 2013 |
| | | | through September 2014, he served |
| | | | as a Co-Portfolio Manager of the same |
| | | | funds. Prior to that, he was a Portfolio |
| | | | Analyst of the Hennessy Funds. |
| | | | |
| | | | Mr. Kelley previously served as Portfolio |
| | | | Manager of The FBR Funds from |
| | | | January 2008 to October 2012. |
| (1) | All Officers of the Hennessy Funds and employees of the Manager are Interested Persons of the Funds. |
HENNESSY FUNDS 1-800-966-4354
Expense Example (Unaudited)
October 31, 2014
As a shareholder of the Fund, you incur two types of costs: (1) transaction costs, including sales charges (loads) on purchase payments, reinvested dividends, or other distributions; redemption fees; and exchange fees; and (2) ongoing costs, including management fees; service fees; and other Fund expenses. This Example is intended to help you understand your ongoing costs (in dollars) of investing in the Fund and to compare these costs with the ongoing costs of investing in other mutual funds. The Example is based on an investment of $1,000 invested at the beginning of the period and held for the entire period from May 1, 2014 through October 31, 2014.
Actual Expenses
The first line of the table below provides information about actual account values and actual expenses. Although the Fund charges no sales loads or transaction fees, you will be assessed fees for outgoing wire transfers, returned checks and stop payment orders at prevailing rates charged by U.S. Bancorp Fund Services, LLC, the Fund’s transfer agent. If you request that a redemption be made by wire transfer, currently a $15.00 fee is charged by the Fund’s transfer agent. IRA accounts will be charged a $15.00 annual maintenance fee. The example below includes, but is not limited to, management fees, shareholder servicing fees, fund accounting, custody, and transfer agent fees. However, the example below does not include portfolio trading commissions and related expenses, and other extraordinary expenses as determined under generally accepted accounting principles. You may use the information in this line, together with the amount you invested, to estimate the expenses that you paid over the period. Simply divide your account value by $1,000 (for example, an $8,600 account value divided by $1,000 = 8.6), then multiply the result by the number in the first line of the table under the heading entitled “Expenses Paid During Period” to estimate the expenses you paid on your account during this period.
Hypothetical Example for Comparison Purposes
The second line of the table below provides information about hypothetical account values and hypothetical expenses based on the Fund’s actual expense ratios and an assumed rate of return of 5% per year before expenses, which is not the Fund’s actual return. The hypothetical account values and expenses may not be used to estimate the actual ending account balance or expenses you paid for the period. You may use this information to compare the ongoing costs of investing in the Fund and other funds. To do so, compare this 5% hypothetical example with the 5% hypothetical examples that appear in the shareholder reports of the other funds. Please note that the expenses shown in the table are meant to highlight your ongoing costs only and do not reflect any transactional costs, such as sales charges (loads), or exchange fees. Therefore, the second line of the table is useful in comparing ongoing costs only, and will not help you determine the relative total costs of owning different funds. In addition, if these transactional costs were included, your costs would have been higher.
| | Beginning | Ending | Expenses Paid |
| | Account Value | Account Value | During Period(1) |
| | 5/1/14 | 10/31/14 | 5/1/14 – 10/31/14 |
| Investor Class | | | |
| | | | |
| Actual | $1,000.00 | $1,065.90 | $7.71 |
| | | | |
| Hypothetical (5% return | | | |
| before expenses) | $1,000.00 | $1,017.74 | $7.53 |
| (1) | Expenses are equal to the Fund’s expense ratio of 1.48% for Investor Class shares, as applicable multiplied by the average account value over the period, multiplied by 184/365 days (to reflect one-half year period). |
HENNESSY FUNDS 1-800-966-4354
Proxy Voting
A description of the policies and procedures the Fund uses to determine how to vote proxies relating to portfolio securities is available without charge: (1) by calling 1-800-966-4354; (2) on the Hennessy Funds’ website at hennessyfunds.com; or (3) on the U.S. Securities and Exchange Commission’s (the “SEC”) website at www.sec.gov. The Fund’s proxy voting record is available on both the Hennessy Funds’ website at hennessyfunds.com and the SEC’s website at www.sec.gov no later than August 31 for the prior 12 months ending June 30.
Quarterly Filings on Form N-Q
The Fund files its complete schedule of portfolio holdings with the SEC for the first and third quarters of each fiscal year on Form N-Q. The Fund’s Forms N-Q are available on the SEC’s website at www.sec.gov. The Fund’s Forms N-Q may be reviewed and copied at the SEC’s Public Reference Room in Washington, DC and information on the operation of the Public Reference Room may be obtained by calling 1-800-SEC-0330. Information included in the Fund’s Forms N-Q will also be available upon request by calling 1-800-966-4354.
Householding
To help keep the Fund’s costs as low as possible, we generally deliver a single copy of most financial reports and prospectuses to shareholders who share an address, even if the accounts are registered under different names. This process, known as “householding,” does not apply to account statements. You may, of course, request an individual copy of a prospectus or financial report at any time. If you would like to receive separate mailings, please call the Administrator at 1-800-261-6950 or 1-414-765-4124 and we will begin individual delivery within 30 days of your request. If your account is held through a financial institution or other intermediary, please contact them directly to request individual delivery.
Privacy Policy
We collect the following non-public personal information about you:
| | • | information we receive from you on or in applications or other forms, correspondence, or conversations, including, but not limited to, your name, address, phone number, social security number, assets, income and date of birth; |
| | | and |
| | • | information about your transactions with us, our affiliates, or others, including, but not limited to, your account number and balance, payment history, parties to transactions, cost basis information and other financial information. |
We do not disclose any non-public personal information about our current or former shareholders to nonaffiliated third parties, except as permitted by law. For example, we are permitted by law to disclose all of the information we collect, as described above, to our Transfer Agent to process your transactions. Furthermore, we restrict access to your non-public personal information to those persons who require such information to provide products or services to you. We maintain physical, electronic and procedural safeguards that comply with federal standards to guard your non-public personal information.
In the event that you hold shares of the Fund through a financial intermediary, including, but not limited to, a broker-dealer, bank or trust company, the privacy policy of your financial intermediary would govern how your non-public personal information would be shared with nonaffiliated third parties.
HENNESSY FUNDS 1-800-966-4354
(This Page Intentionally Left Blank.)
(This Page Intentionally Left Blank.)
For information, questions or assistance, please call
The Hennessy Funds
1-800-966-4354 or 1-415-899-1555
INVESTMENT ADVISOR
Hennessy Advisors, Inc.
7250 Redwood Blvd., Suite 200
Novato, California 94945
ADMINISTRATOR,
TRANSFER AGENT,
DIVIDEND PAYING AGENT &
SHAREHOLDER SERVICING AGENT
U.S. Bancorp Fund Services, LLC
P.O. Box 701
Milwaukee, Wisconsin 53201-0701
CUSTODIAN
U.S. Bank N.A.
Custody Operations
1555 North River Center Dr., Suite 302
Milwaukee, Wisconsin 53212
TRUSTEES
Neil J. Hennessy
Robert T. Doyle
J. Dennis DeSousa
Gerald P. Richardson
COUNSEL
Foley & Lardner LLP
777 East Wisconsin Avenue
Milwaukee, Wisconsin 53202-5306
INDEPENDENT REGISTERED
PUBLIC ACCOUNTING FIRM
Tait, Weller & Baker LLP
1818 Market Street, Suite 2400
Philadelphia, Pennsylvania 19103
DISTRIBUTOR
Quasar Distributors, LLC
615 East Michigan Street
Milwaukee, Wisconsin 53202
hennessyfunds.com | 1-800-966-4354
This report has been prepared for shareholders and may be distributed to
others only if preceded or accompanied by a current prospectus.
ANNUAL REPORT
OCTOBER 31, 2014
HENNESSY TECHNOLOGY FUND
Investor Class HTECX
Institutional Class HTCIX
hennessyfunds.com | 1-800-966-4354
(This Page Intentionally Left Blank.)
Contents
| Letter to Shareholders | 2 |
| Performance Overview | 4 |
| Financial Statements | |
| Schedule of Investments | 7 |
| Statement of Assets and Liabilities | 11 |
| Statement of Operations | 12 |
| Statements of Changes in Net Assets | 13 |
| Financial Highlights | 14 |
| Notes to the Financial Statements | 18 |
| Report of Independent Registered Public Accounting Firm | 25 |
| Trustees and Officers of the Fund | 26 |
| Expense Example | 30 |
| Proxy Voting | 32 |
| Quarterly Filings on Form N-Q | 32 |
| Householding | 32 |
| Privacy Policy | 33 |
HENNESSY FUNDS 1-800-966-4354
December 2014
Dear Shareholder:
As I look back at 2014, I realize that in this age of rapidly evolving technology, information is delivered and absorbed so quickly that it is difficult to remember what happened last week, let alone what’s happened over the course of an entire year. That is why I’d like to take a moment to recall some of the year’s highs and lows, economically, politically and socially, here in the U.S. and around the globe. 2014 was scarred by political partisanship, civil unrest in the U.S., Ukraine and many other countries, the arrival of terrorist group ISIS, the tragedies of school shootings and natural disasters, and the frightening outbreak of Ebola. However, there were also positive events this year: we survived a government shutdown over healthcare reform, jobs reports have been consistently, albeit anemically, improving, and home prices remained relatively stable, after recovering significantly in 2013. And, important to us here at Hennessy, our hometown team, the San Francisco Giants, won their third World Series in just five years!
A significant event for the financial industry this past year was the confirmation of Janet Yellen as Chair of the Federal Reserve, which served to calm the nerves of business and political leaders alike. I believe Yellen’s leadership will benefit U.S. business owners, as the Fed continues to be a voice of reason in a sea of political and economic rhetoric. The Fed has also supported the economy and corporate America by helping keep interest rates reasonable and low.
The stock market has continued its determined comeback from the lows of 2009, setting multiple record highs in recent months. The U.S. financial markets have provided strong returns over the past twelve-month period ended October 31, 2014, with the Dow Jones Industrial Average (DJIA) returning over 14% and S&P 500 Index returning over 17% during the period. The DJIA currently has a dividend yield of 2.2%, which is equal to that of a 10-Year U.S. Treasury, which is currently also yielding 2.2%. I continue to believe that investments in high-yielding, high-quality stocks have the potential to not only provide income but also the potential for stock price appreciation as well. Fixed income investing has run its course, in my opinion, and many individuals are currently benefiting from the return to investing in equities that possess strong fundamentals. American investors are slowly migrating from fixed income to equities. Currently, 54% of Americans invest in stocks, and I do expect this percentage to increase, especially if interest rates move higher.
For the past several years, U.S. corporations have been driving shareholder value by making acquisitions, initiating and raising dividends, investing in internal infrastructure and buying back stock. However, this year I began to see a shift from those strategies. I believe the easier to execute acquisitions are a thing of the past, and firms now have to be even more creative to execute accretive deals. I also believe that while firms may continue to initiate dividends, fewer firms will raise their dividends and fewer firms will participate in stock buyback programs going forward. What will these cash-rich companies do with their capital if they are not raising dividends or buying back stock? I believe they may begin to initiate capital expenditure programs that could truly benefit economic growth.
Liquidity and monetary conditions are supportive, causing the cost of capital to be very low. I believe firms will choose to spend capital to expand their sales, and they may even begin to hire in earnest. Once a company begins to move in this way, the cost to
defer becomes real for competitors. With almost $3 trillion in cash and short-term investments sitting on the balance sheets of the S&P 500 companies, a strategic shift by firms to spend their idle capital, while slow, could potentially further economic growth in the U.S. in my opinion.
Economic progress and growth remain slow, yet steady, and unemployment, though improving, remains high. Oil prices have fallen, giving consumers a bit more discretionary income. While the midterm elections may not end all of the gridlock in Washington, hopefully we will receive clarity on the political headwinds of taxes and regulations, which have not improved over the past several years.
The markets have had several quarters without any truly significant downturn. The pullbacks we recently experienced, most notably in July and October, were short-lived, as evidenced by the quick rebound to record high market levels. I firmly believe that we are in a secular bull market, and I continue to tell investors to try to remain calm in the face of volatility and continue to focus on the strong, long-term fundamentals that are evident in the market today. Many companies continue to have strong balance sheets, with record cash flows and profits. With this current bull market in its fifth year, investors should expect some volatility.
I am encouraged by the strong returns for the major U.S. financial market indices and by the performance of the Hennessy Funds over the past year. Thank you for your continued confidence and investment in our products. If you have any questions or would like to speak with us directly, please don’t hesitate to call us at (800) 966-4354.
Best regards,
Neil J. Hennessy
President and Chief Investment Officer
Past performance does not guarantee future results.
Mutual fund investing involves risk. Principal loss is possible.
Opinions expressed are those of Neil Hennessy and are subject to change, are not guaranteed and should not be considered investment advice.
The Dow Jones Industrial Average and S&P 500 Index are unmanaged indices commonly used to measure the performance of U.S. stocks. One cannot invest directly in an index.
Cash flow can be used as an indication of a company’s financial strength. A firm’s cash flow is the movement of cash in and out of the firm in the form of payments to suppliers and collections from customers. Dividend Yield is calculated as the annual dividends paid by a company divided by the price of a share of their stock.
HENNESSY FUNDS 1-800-966-4354
Performance Overview (Unaudited)
The opinions expressed in the following commentary reflect those of the Portfolio Managers as of the date written. Any such opinions are subject to change based on market or other conditions and are not guaranteed. These opinions may not be relied upon as investment advice. Investment decisions for the Fund are based on multiple factors, and may not be relied upon as an indication of trading intent on behalf of the Fund. Security positions can and do change.
CHANGE IN VALUE OF $10,000 INVESTMENT
This chart assumes an initial gross investment of $10,000 made on October 31, 2004. Returns shown include the reinvestment of all dividends. Returns shown do not reflect the deduction of taxes that a shareholder would pay on Fund distributions or the redemption of Fund shares.
AVERAGE ANNUAL TOTAL RETURN FOR PERIODS ENDED OCTOBER 31, 2014
| | One | Five | Ten |
| | Year | Years | Years |
| Hennessy Technology Fund – | | | |
| Investor Class (HTECX) | 9.51% | 10.43% | 6.58% |
| Hennessy Technology Fund – | | | |
Institutional Class (HTCIX)(1) | 9.80% | 10.66% | 6.69% |
| NASDAQ Composite Index | 19.58% | 19.20% | 10.18% |
| S&P 500 Index | 17.27% | 16.69% | 8.20% |
| Expense ratios: | Gross 3.08%, Net 1.99%(2) (Investor Class); |
| | Gross 2.80%, Net 1.74%(2) (Institutional Class) |
Performance data quoted represents past performance; past performance does not guarantee future results. The investment return and principal value of an investment will fluctuate so that an investor’s shares, when redeemed, may be worth more or less than their original cost. Current performance of the Fund may be lower or higher than the performance quoted. Performance data current to the most recent month end may be obtained by visiting hennessyfunds.com. Performance for periods prior to October 26, 2012 is that of the FBR Technology Fund.
The expense ratios presented are from the most recent prospectus.
| (1) | The inception date of the Institutional Class shares is March 12, 2010. Performance shown prior to the inception of the Institutional Class shares reflects the performance of the Investor Class shares and includes expenses that are not applicable to and are higher than those of the Institutional Class shares. |
| (2) | The Fund’s investment advisor has contractually agreed to waive a portion of its expenses through February 28, 2015. |
PERFORMANCE NARRATIVE
Portfolio Managers Winsor H. (Skip) Aylesworth and David H. Ellison
Over the previous twelve months, how did the Fund perform and what factors contributed to this performance?
For the twelve-month period ended October 31, 2014, the Investor Class of the Hennessy Technology Fund returned 9.51%, underperforming the NASDAQ Composite Index, the S&P 500 Index and the Morningstar Technology Category Average, which returned 19.58%, 17.27%, and 18.28% for the same period, respectively.
After a relatively good start to the year, the Fund lagged its benchmarks for the twelve-month period. Our emphasis on stocks with growing tangible book value, growing revenues and growing profits, did not keep pace with the market and the overall technology sector. In review, the portfolio featured stocks that carried relative high multiples as a result of individual growth. This made the investments particularly vulnerable to market corrections that occurred during the period. A metric that people use to describe this performance action is “beta;” the higher the beta, the higher volatility. The Fund and the underlying stocks we owned had high betas. Owning high beta stocks is not a primary investment objective of the Fund, but it was a result of implementing the investment approach. A goal for next year will be to lower the average beta of the Fund and hence lower the volatility.
Two stocks that did reward us were Illumina, Inc. and Micron Technology, Inc., which returned 106% and 40%, respectively. Illumina manufactures and markets life science tools and integrated systems for the analytics of data to the biotech industry. Illumina concentrates on the genetics and genome part of the biotech industry and has benefited from a growing revenue and profit stream. Micron is one of the largest flash memory makers and benefited from consumer products using more and more flash memory. As Apple, Samsung and others bring out more and more tech products that feature flash memory, Micron should continue to benefit.
Two stocks that were major detractors to the Fund’s performance were Amazon.com, Inc. and Twitter, Inc., with returns of -23% and -20%, respectively. Well known and widely held Amazon is one of the largest online retailers and has an impressive record of revenue, gross profit and tangible book value growth with virtually no leverage. Unfortunately, all these positives have not led to any net income as the company has been investing its cash flow in new ventures, which they hope will flourish in the future. To date, results have been mixed and impatient investors sold the shares. Due to the low leverage nature of the company, we have maintained our investment, believing that these investments should ultimately pay off. Twitter was a new investment this year, as it is one of the leading social media companies. The company is growing rapidly, but it has yet to turn a net profit. The opportunity is that the strong growth will continue as management maximizes revenue opportunities. When combined, these investments comprise approximately 9.0% of the Fund and their underperformance was a major reason the Fund underperformed its benchmarks.
Additional Portfolio Manager Commentary and related investment outlook:
As we head into the important holiday season, Apple and Samsung, among others, have all rolled out next generation technology products to entice the consumer. Corporations continually look to the technology sector to improve their efficiency and bottom line. As a result, we believe the technology industry should continue to entice investors, as it offers potential solutions to the problems of mankind and innovative products for the consumer. As we move forward, we will continue to look for investments with growing
HENNESSY FUNDS 1-800-966-4354
revenues, growing gross profits and growing tangible book value with a more focused eye on their volatility.
The NASDAQ Composite Index is a broad-based capitalization-weighted index of all the NASDAQ National Market and Small Cap stocks. The S&P 500 Index is an unmanaged index commonly used to measure the performance of U.S. stocks. You cannot invest directly in an index. Performance data for an index does not reflect any deductions for fees, expenses or taxes. The Fund is non-diversified, meaning it concentrates its assets in fewer holdings than a diversified fund and is therefore more exposed to individual stock volatility than a diversified fund. Investments are focused in the technology industry, which may be adversely affected by rapidly changing technology, availability of capital, R&D, government regulation and the relatively high risks of obsolescence caused by scientific and technological advances. The Fund may invest in foreign securities, which may involve greater volatility and political, economic and currency risk and differences in accounting methods. The Fund may invest in IPOs, which may fluctuate considerably due to the absence of a prior public market and may have a magnified impact on the Fund. The Fund invests in small- and medium-capitalization companies, which involves additional risks such as more limited liquidity and greater volatility than large-capitalization companies. References to specific securities should not be considered a recommendation to buy or sell any security. Fund holdings and sector allocations are subject to change. Please refer to the Schedule of Investments included in this report for additional portfolio information.
Tangible Book Value is a method of valuing a company by measuring its equity after removing any intangible assets.
Beta measures the volatility of a fund or stock, as compared to that of the overall market or of a benchmark.
Each Morningstar category average represents a universe of funds with similar investment objectives. © Morningstar, Inc. All Rights Reserved. The information contained herein: 1) is proprietary to Morningstar; 2) may not be copied or distributed and 3) is not warranted to be accurate, complete or timely. Neither Morningstar nor its content providers are responsible for any damages or losses arising from any use of this information. Past performance does not guarantee future results.
Financial Statements
HENNESSY TECHNOLOGY FUND
As of October 31, 2014
(% of Net Assets)
| TOP TEN HOLDINGS (EXCLUDING CASH/CASH EQUIVALENTS) | % NET ASSETS |
| | |
| T- Mobile US, Inc. | 4.48% |
| SanDisk Corp. | 4.46% |
| Netflix, Inc. | 4.44% |
| Amazon.com, Inc. | 4.43% |
| Applied Materials, Inc. | 4.40% |
| LinkedIn Corp., Class A | 4.37% |
| salesforce.com, Inc. | 4.35% |
| Corning, Inc. | 4.31% |
| Thermo Fisher Scientific, Inc. | 4.28% |
| Twitter, Inc. | 4.24% |
Note: For presentation purposes, the Fund has grouped some of the industry categories. For purposes of categorizing securities for compliance with Section 8(b)(1) of the Investment Company Act of 1940, the Fund uses more specific industry classifications.
HENNESSY FUNDS 1-800-966-4354
| | COMMON STOCKS – 96.06% | | Number | | | | | | % of | |
| | | | of Shares | | | Value | | | Net Assets | |
| | Consumer Discretionary – 9.73% | | | | | | | | | |
| | Amazon.com, Inc. (a) | | | 860 | | | $ | 262,696 | | | | 4.43 | % |
| | Harman International Industries | | | 475 | | | | 50,986 | | | | 0.86 | % |
| | Netflix, Inc. (a) | | | 670 | | | | 263,156 | | | | 4.44 | % |
| | | | | | | | | 576,838 | | | | 9.73 | % |
| | | | | | | | | | | | | | |
| | Financials – 0.34% | | | | | | | | | | | | |
| | Zillow, Inc. (a) | | | 185 | | | | 20,115 | | | | 0.34 | % |
| | | | | | | | | | | | | | |
| | Health Care – 22.35% | | | | | | | | | | | | |
| | Alexion Pharmaceuticals, Inc. (a) | | | 657 | | | | 125,723 | | | | 2.12 | % |
| | Align Technology, Inc. (a) | | | 1,340 | | | | 70,511 | | | | 1.19 | % |
| | athenahealth, Inc. (a) | | | 90 | | | | 11,025 | | | | 0.19 | % |
| | Biogen Idec, Inc. (a) | | | 595 | | | | 191,043 | | | | 3.22 | % |
| | Gilead Sciences, Inc. (a) | | | 1,088 | | | | 121,856 | | | | 2.06 | % |
| | Illumina, Inc. (a) | | | 303 | | | | 58,352 | | | | 0.98 | % |
| | McKesson Corp. | | | 1,220 | | | | 248,160 | | | | 4.19 | % |
| | Regeneron Pharmaceuticals (a) | | | 620 | | | | 244,106 | | | | 4.12 | % |
| | Thermo Fisher Scientific, Inc. | | | 2,160 | | | | 253,951 | | | | 4.28 | % |
| | | | | | | | | 1,324,727 | | | | 22.35 | % |
| | | | | | | | | | | | | | |
| | Information Technology – 59.16% | | | | | | | | | | | | |
| | 3D Systems Corp. (a) | | | 772 | | | | 29,182 | | | | 0.49 | % |
| | Ambarella, Inc. (a) (c) | | | 390 | | | | 17,273 | | | | 0.29 | % |
| | Applied Materials, Inc. | | | 11,800 | | | | 260,662 | | | | 4.40 | % |
| | Arris Group, Inc. (a) | | | 2,567 | | | | 77,061 | | | | 1.30 | % |
| | Canadian Solar, Inc. (a) (c) | | | 545 | | | | 17,385 | | | | 0.29 | % |
| | Cavium, Inc. (a) | | | 575 | | | | 29,503 | | | | 0.50 | % |
| | Cognex Corp. (a) | | | 1,562 | | | | 61,793 | | | | 1.04 | % |
| | Corning, Inc. | | | 12,495 | | | | 255,273 | | | | 4.31 | % |
| | Dealertrack Technologies, Inc (a) | | | 1,045 | | | | 49,167 | | | | 0.83 | % |
| | Edgewater Technology, Inc. (a) | | | 5,275 | | | | 37,242 | | | | 0.63 | % |
| | Envestnet, Inc. (a) | | | 190 | | | | 8,440 | | | | 0.14 | % |
| | Facebook, Inc. (a) | | | 2,485 | | | | 186,350 | | | | 3.14 | % |
| | First Solar, Inc. (a) | | | 745 | | | | 43,881 | | | | 0.74 | % |
| | Guidewire Software, Inc. (a) | | | 1,235 | | | | 61,676 | | | | 1.04 | % |
| | LAM Research Corp. | | | 2,795 | | | | 217,619 | | | | 3.67 | % |
| | LinkedIn Corp., Class A (a) | | | 1,130 | | | | 258,725 | | | | 4.37 | % |
The accompanying notes are an integral part of these financial statements.
| | COMMON STOCKS | | Number | | | | | | % of | |
| | | | of Shares | | | Value | | | Net Assets | |
| | Information Technology (Continued) | | | | | | | | | |
| | Manhattan Associates, Inc. (a) | | | 1,230 | | | $ | 49,335 | | | | 0.83 | % |
| | Methode Electronics, Inc. | | | 635 | | | | 25,006 | | | | 0.42 | % |
| | Microchip Technology, Inc. | | | 3,509 | | | | 151,273 | | | | 2.55 | % |
| | Micron Technology, Inc. (a) | | | 5,830 | | | | 192,915 | | | | 3.26 | % |
| | NetSuite, Inc. (a) | | | 170 | | | | 18,472 | | | | 0.31 | % |
| | Pandora Media, Inc. (a) | | | 910 | | | | 17,545 | | | | 0.30 | % |
| | Reis, Inc. | | | 1,525 | | | | 35,685 | | | | 0.60 | % |
| | Rf Microdevices, Inc. (a) | | | 4,900 | | | | 63,749 | | | | 1.08 | % |
| | salesforce.com, Inc. (a) | | | 4,030 | | | | 257,880 | | | | 4.35 | % |
| | SanDisk Corp. | | | 2,805 | | | | 264,063 | | | | 4.46 | % |
| | Servicenow, Inc. (a) | | | 330 | | | | 22,417 | | | | 0.38 | % |
| | Skyworks Solutions, Inc. | | | 3,225 | | | | 187,824 | | | | 3.17 | % |
| | Splunk, Inc. (a) | | | 555 | | | | 36,674 | | | | 0.62 | % |
| | Stratasys Ltd. (a) (c) | | | 840 | | | | 101,102 | | | | 1.71 | % |
| | The Ultimate Software Group, Inc. (a) | | | 500 | | | | 75,255 | | | | 1.27 | % |
| | Twitter, Inc. (a) | | | 6,060 | | | | 251,308 | | | | 4.24 | % |
| | Workday, Inc. (a) | | | 1,300 | | | | 124,124 | | | | 2.09 | % |
| | Yelp, Inc. (a) | | | 340 | | | | 20,400 | | | | 0.34 | % |
| | | | | | | | | 3,506,259 | | | | 59.16 | % |
| | | | | | | | | | | | | | |
| | Telecommunication Services – 4.48% | | | | | | | | | | | | |
| | T- Mobile US, Inc. (a) | | | 9,092 | | | | 265,395 | | | | 4.48 | % |
| | | | | | | | | | | | | | |
| | Total Common Stocks | | | | | | | | | | | | |
| | (Cost $5,280,190) | | | | | | | 5,693,334 | | | | 96.06 | % |
The accompanying notes are an integral part of these financial statements.
HENNESSY FUNDS 1-800-966-4354
| | SHORT-TERM INVESTMENTS – 2.75% | | Number | | | | | | % of | |
| | | | of Shares | | | Value | | | Net Assets | |
| | Money Market Funds – 2.75% | | | | | | | | | |
| | Fidelity Government Portfolio – | | | | | | | | | |
| | Institutional Class, 0.01% (b) | | | 162,818 | | | $ | 162,818 | | | | 2.75 | % |
| | | | | | | | | | | | | | |
| | Total Short-Term Investments | | | | | | | | | | | | |
| | (Cost $162,818) | | | | | | | 162,818 | | | | 2.75 | % |
| | | | | | | | | | | | | | |
| | Total Investments | | | | | | | | | | | | |
| | (Cost $5,443,008) – 98.81% | | | | | | | 5,856,152 | | | | 98.81 | % |
| | Other Assets in Excess | | | | | | | | | | | | |
| | of Liabilities – 1.19% | | | | | | | 70,454 | | | | 1.19 | % |
| | TOTAL NET ASSETS – 100.00% | | | | | | $ | 5,926,606 | | | | 100.00 | % |
Percentages are stated as a percent of net assets.
| | (a) | Non-income producing security. |
| | (b) | The rate listed is the fund’s 7-day yield as of October 31, 2014. |
| | (c) | U.S. traded security of a foreign corporation |
| | | |
Summary of Fair Value Exposure at October 31, 2014
The following is a summary of the inputs used to value the Fund’s net assets as of October 31, 2014 (See Note 3 in the accompanying notes to the financial statements):
| | Common Stocks | | Level 1 | | | Level 2 | | | Level 3 | | | Total | |
| | Consumer Discretionary | | $ | 576,838 | | | $ | — | | | $ | — | | | $ | 576,838 | |
| | Financials | | | 20,115 | | | | — | | | | — | | | | 20,115 | |
| | Health Care | | | 1,324,727 | | | | — | | | | — | | | | 1,324,727 | |
| | Information Technology | | | 3,506,259 | | | | — | | | | — | | | | 3,506,259 | |
| | Telecommunication Services | | | 265,395 | | | | — | | | | — | | | | 265,395 | |
| | Total Common Stocks | | $ | 5,693,334 | | | $ | — | | | $ | — | | | $ | 5,693,334 | |
| | Short-Term Investments | | | | | | | | | | | | | | | | |
| | Money Market Funds | | $ | 162,818 | | | $ | — | | | $ | — | | | $ | 162,818 | |
| | Total Short-Term Investments | | $ | 162,818 | | | $ | — | | | $ | — | | | $ | 162,818 | |
| | Total Investments | | $ | 5,856,152 | | | $ | — | | | $ | — | | | $ | 5,856,152 | |
Transfers between levels are recognized at the end of the reporting period. During the twelve-month period ended October 31, 2014, the Fund recognized no transfers between levels.
The accompanying notes are an integral part of these financial statements.
Financial Statements
Statement of Assets and Liabilities as of October 31, 2014 |
| ASSETS: | | | |
| Investments in securities, at value (cost $5,443,008) | | $ | 5,856,152 | |
| Dividends and interest receivable | | | 843 | |
| Receivable for securities sold | | | 155,776 | |
| Prepaid expenses and other assets | | | 14,245 | |
| Due from Advisor | | | 1,674 | |
| Total Assets | | | 6,028,690 | |
| | | | | |
| LIABILITIES: | | | | |
| Payable for securities purchased | | | 61,651 | |
| Payable for fund shares redeemed | | | 2,354 | |
| Payable to administrator | | | 1,291 | |
| Payable to auditor | | | 19,103 | |
| Accrued distribution fees | | | 6,737 | |
| Accrued trustees fees | | | 2,701 | |
| Accrued expenses and other payables | | | 8,247 | |
| Total Liabilities | | | 102,084 | |
| NET ASSETS | | $ | 5,926,606 | |
| | | | | |
| NET ASSETS CONSIST OF: | | | | |
| Capital stock | | $ | 6,314,793 | |
| Accumulated net investment loss | | | (79,279 | ) |
| Accumulated net realized loss on investments | | | (722,052 | ) |
| Unrealized net appreciation on investments | | | 413,144 | |
| Total Net Assets | | $ | 5,926,606 | |
| | | | | |
| NET ASSETS | | | | |
| Investor Class: | | | | |
| Shares authorized (no par value) | | Unlimited | |
| Net assets applicable to outstanding Investor Class shares | | $ | 4,992,735 | |
| Shares issued and outstanding | | | 336,017 | |
| Net asset value, offering price and redemption price per share | | $ | 14.86 | |
| | | | | |
| Institutional Class: | | | | |
| Shares authorized (no par value) | | Unlimited | |
| Net assets applicable to outstanding Institutional Class shares | | $ | 933,871 | |
| Shares issued and outstanding | | | 62,186 | |
| Net asset value, offering price and redemption price per share | | $ | 15.02 | |
The accompanying notes are an integral part of these financial statements.
HENNESSY FUNDS 1-800-966-4354
Financial Statements
Statement of Operations for the year ended October 31, 2014 |
| INVESTMENT INCOME: | | | |
| Dividend income | | $ | 24,060 | |
| Interest income | | | 21 | |
| Total investment income | | | 24,081 | |
| | | | | |
| EXPENSES: | | | | |
| Investment advisory fees (See Note 5) | | | 54,977 | |
| Federal and state registration fees | | | 34,738 | |
| Compliance expense | | | 21,488 | |
| Audit fees | | | 19,100 | |
| Distribution fees – Investor Class (See Note 5) | | | 12,503 | |
| Trustees’ fees and expenses | | | 8,789 | |
| Reports to shareholders | | | 6,743 | |
| Administration, fund accounting, custody and transfer agent fees | | | 5,569 | |
| Sub-transfer agent expenses – Investor Class (See Note 5) | | | 4,609 | |
| Sub-transfer agent expenses – Institutional Class (See Note 5) | | | 149 | |
| Legal fees | | | 1,194 | |
| Interest expense (See Note 6) | | | 60 | |
| Other expenses | | | 5,210 | |
| Total expenses before reimbursement by advisor | | | 175,129 | |
| Expense reimbursement by advisor – Investor Class | | | (48,732 | ) |
| Expense reimbursement by advisor – Institutional Class | | | (9,989 | ) |
| Net expenses | | | 116,408 | |
| NET INVESTMENT LOSS | | $ | (92,327 | ) |
| | | | | |
| REALIZED AND UNREALIZED GAINS (LOSSES): | | | | |
| Net realized gain on investments | | $ | 1,045,681 | |
| Net change in unrealized depreciation on investments | | | (478,710 | ) |
| Net gain on investments | | | 566,971 | |
| NET INCREASE IN NET ASSETS RESULTING FROM OPERATIONS | | $ | 474,644 | |
The accompanying notes are an integral part of these financial statements.
Financial Statements
| Statements of Changes in Net Assets |
| | | Year Ended | | | Year Ended | |
| | | October 31, 2014 | | | October 31, 2013 | |
| OPERATIONS: | | | | | | |
| Net investment loss | | $ | (92,327 | ) | | $ | (66,991 | ) |
| Net realized gain on investments | | | 1,045,681 | | | | 577,798 | |
| Net change in unrealized appreciation (depreciation) | | | | | | | | |
| on investments | | | (478,710 | ) | | | 802,157 | |
| Net increase in net assets resulting from operations | | | 474,644 | | | | 1,312,964 | |
| | | | | | | | | |
| CAPITAL SHARE TRANSACTIONS: | | | | | | | | |
| Proceeds from shares subscribed – Investor Class | | | 1,203,915 | | | | 633,313 | |
| Proceeds from shares subscribed – Institutional Class | | | 118,363 | | | | 199,069 | |
| Cost of shares redeemed – Investor Class | | | (1,088,682 | )(1) | | | (1,642,150 | ) |
| Cost of shares redeemed – Institutional Class | | | (462,083 | ) | | | (196,791 | ) |
| Net decrease in net assets | | | | | | | | |
| derived from capital share transactions | | | (228,487 | ) | | | (1,006,559 | ) |
| TOTAL INCREASE IN NET ASSETS | | | 246,157 | | | | 306,405 | |
| | | | | | | | | |
| NET ASSETS: | | | | | | | | |
| Beginning of year | | | 5,680,449 | | | | 5,374,044 | |
| End of year | | $ | 5,926,606 | | | $ | 5,680,449 | |
| Undistributed net investment loss, end of year | | $ | (79,279 | ) | | $ | (65,889 | ) |
| | | | | | | | | |
| CHANGES IN SHARES OUTSTANDING: | | | | | | | | |
| Shares sold – Investor Class | | | 80,861 | | | | 54,289 | |
| Shares sold – Institutional Class | | | 8,180 | | | | 16,644 | |
| Shares redeemed – Investor Class | | | (75,777 | ) | | | (139,783 | ) |
| Shares redeemed – Institutional Class | | | (33,013 | ) | | | (16,569 | ) |
| Net decrease in shares outstanding | | | (19,749 | ) | | | (85,419 | ) |
| (1) | Net of redemption fees of $15 related to redemption fees imposed by the Fund during a prior year but not received until fiscal year 2014. |
The accompanying notes are an integral part of these financial statements.
HENNESSY FUNDS 1-800-966-4354
Financial Statements
For an Investor Class share outstanding throughout each year
PER SHARE DATA:
Net asset value, beginning of year
Income from investment operations:
Net investment loss
Net realized and unrealized gains (losses) on investments
Total from investment operations
Paid-in capital from redemption fees(1)
Net asset value, end of year
TOTAL RETURN
SUPPLEMENTAL DATA AND RATIOS:
Net assets, end of year (millions)
Ratio of expenses to average net assets:
Before expense reimbursement
After expense reimbursement
Ratio of net investment income to average net assets:
Before expense reimbursement
After expense reimbursement
Portfolio turnover rate(3)
| (1) | Calculated based on average shares outstanding method. |
| (2) | Amount is less than $0.01. |
| (3) | Portfolio turnover is calculated on the basis of the Fund as a whole. |
The accompanying notes are an integral part of these financial statements.
| Year Ended October 31, | |
| 2014 | | | 2013 | | | 2012 | | | 2011 | | | 2010 | |
| | | | | | | | | | | | | | |
| $ | 13.57 | | | $ | 10.67 | | | $ | 10.86 | | | $ | 11.00 | | | $ | 9.05 | |
| | | | | | | | | | | | | | | | | | | |
| | | | | | | | | | | | | | | | | | | |
| | (0.23 | ) | | | (0.20 | ) | | | (0.15 | ) | | | (0.17 | )(1) | | | (0.14 | ) |
| | 1.52 | | | | 3.10 | | | | (0.04 | ) | | | 0.03 | | | | 2.08 | |
| | 1.29 | | | | 2.90 | | | | (0.19 | ) | | | (0.14 | ) | | | 1.94 | |
| | | | | | | | | | | | | | | | | | | |
| | 0.00 | (2) | | | — | | | | 0.00 | (2) | | | 0.00 | (2) | | | 0.01 | |
| $ | 14.86 | | | $ | 13.57 | | | $ | 10.67 | | | $ | 10.86 | | | $ | 11.00 | |
| | | | | | | | | | | | | | | | | | | |
| | 9.51 | % | | | 27.18 | % | | | (1.75 | )% | | | (1.27 | )% | | | 21.55 | % |
| | | | | | | | | | | | | | | | | | | |
| | | | | | | | | | | | | | | | | | | |
| $ | 4.99 | | | $ | 4.49 | | | $ | 4.44 | | | $ | 5.70 | | | $ | 8.21 | |
| | | | | | | | | | | | | | | | | | | |
| | 2.92 | % | | | 3.04 | % | | | 3.20 | % | | | 2.79 | % | | | 2.50 | % |
| | 1.95 | % | | | 1.95 | % | | | 1.95 | % | | | 1.95 | % | | | 1.95 | % |
| | | | | | | | | | | | | | | | | | | |
| | (2.53 | )% | | | (2.36 | )% | | | (2.39 | )% | | | (2.38 | )% | | | (1.64 | )% |
| | (1.55 | )% | | | (1.27 | )% | | | (1.14 | )% | | | (1.54 | )% | | | (1.10 | )% |
| | 204 | % | | | 164 | % | | | 138 | % | | | 141 | % | | | 353 | % |
The accompanying notes are an integral part of these financial statements.
HENNESSY FUNDS 1-800-966-4354
Financial Statements
For an Institutional Class share outstanding throughout each period
PER SHARE DATA:
Net asset value, beginning of period
Income from investment operations:
Net investment loss
Net realized and unrealized gains (losses) on investments
Total from investment operations
Paid-in capital from redemption fees
Net asset value, end of period
TOTAL RETURN
SUPPLEMENTAL DATA AND RATIOS:
Net assets, end of period (millions)
Ratio of expenses to average net assets:
Before expense reimbursement
After expense reimbursement
Ratio of net investment income to average net assets:
Before expense reimbursement
After expense reimbursement
Portfolio turnover rate(6)
| (1) | Institutional Class shares commenced operations on March 12, 2010. |
| (2) | Calculated based on average shares outstanding method. |
| (3) | Amount is less than $0.01. |
| (4) | Not annualized. |
| (5) | Annualized. |
| (6) | Portfolio turnover is calculated on the basis of the Fund as a whole. |
The accompanying notes are an integral part of these financial statements.
| | | | | | | | | | | | | Period Ended | |
| Year Ended October 31, | | | October 31, | |
| 2014 | | | 2013 | | | 2012 | | | 2011 | | | 2010(1) | |
| | | | | | | | | | | | | | |
| $ | 13.68 | | | $ | 10.73 | | | $ | 10.89 | | | $ | 11.00 | | | $ | 10.46 | |
| | | | | | | | | | | | | | | | | | | |
| | | | | | | | | | | | | | | | | | | |
| | (0.26 | ) | | | (0.12 | ) | | | (0.11 | ) | | | (0.14 | )(2) | | | (0.07 | ) |
| | 1.60 | | | | 3.07 | | | | (0.05 | ) | | | 0.03 | | | | 0.61 | |
| | 1.34 | | | | 2.95 | | | | (0.16 | ) | | | (0.11 | ) | | | 0.54 | |
| | | | | | | | | | | | | | | | | | | |
| | — | | | | — | | | | 0.00 | (3) | | | 0.00 | (3) | | | 0.00 | (3) |
| $ | 15.02 | | | $ | 13.68 | | | $ | 10.73 | | | $ | 10.89 | | | $ | 11.00 | |
| | | | | | | | | | | | | | | | | | | |
| | 9.80 | % | | | 27.49 | % | | | (1.47 | )% | | | (1.00 | )% | | | 5.16 | %(4) |
| | | | | | | | | | | | | | | | | | | |
| | | | | | | | | | | | | | | | | | | |
| $ | 0.93 | | | $ | 1.19 | | | $ | 0.93 | | | $ | 1.16 | | | $ | 4.61 | |
| | | | | | | | | | | | | | | | | | | |
| | 2.60 | % | | | 2.76 | % | | | 4.11 | % | | | 3.45 | % | | | 2.34 | %(5) |
| | 1.70 | % | | | 1.70 | % | | | 1.70 | % | | | 1.70 | % | | | 1.70 | %(5) |
| | | | | | | | | | | | | | | | | | | |
| | (2.23 | )% | | | (2.10 | )% | | | (3.31 | )% | | | (2.99 | )% | | | (1.41 | )%(5) |
| | (1.33 | )% | | | (1.04 | )% | | | (0.90 | )% | | | (1.24 | )% | | | (0.77 | )%(5) |
| | 204 | % | | | 164 | % | | | 138 | % | | | 141 | % | | | 353 | %(4) |
The accompanying notes are an integral part of these financial statements.
HENNESSY FUNDS 1-800-966-4354
Financial Statements
Notes to Financial Statements October 31, 2014 |
1). ORGANIZATION
The Hennessy Technology Fund (the “Fund”) is a series of Hennessy Funds Trust (the “Trust”), which was organized as a Delaware statutory trust on September 17, 1992. The Fund is an open-end management investment company registered under the Investment Company Act of 1940, as amended. The Fund is a successor to the FBR Technology Fund (the “Predecessor FBR Fund”), a series of The FBR Funds, a Delaware statutory trust, pursuant to a reorganization that took place after the close of business on October 26, 2012. Prior to October 26, 2012, the Fund had no investment operations. As a result of the reorganization, holders of the Investor Class shares of the Predecessor FBR Fund received Investor Class shares of the Fund (the Investor Class shares of the Fund are the successor to the accounting and performance information of the Predecessor FBR Fund), and holders of the Institutional Class shares of the Predecessor FBR Fund received Institutional Class shares of the Fund (the Institutional Class shares of the Fund are the successor to the accounting and performance information of the Predecessor FBR Fund). The investment objective of the Fund is capital appreciation. The Fund is a non-diversified fund.
The Fund offers Investor Class and Institutional Class shares. Each class of shares differs principally in its respective administration, 12b-1 distribution and service fees, shareholder servicing, and transfer agent expenses and sales charges, if any. Each class has identical rights to earnings, assets, and voting privileges, except for class-specific expenses and exclusive rights to vote on matters affecting only an individual class.
2). SIGNIFICANT ACCOUNTING POLICIES
The following is a summary of significant accounting policies consistently followed by the Fund in the preparation of the financial statements. These policies are in conformity with U.S. generally accepted accounting principles (“GAAP”).
| a). | Investment Valuation – All investments in securities are recorded at their estimated fair value, as described in Note 3. |
| b). | Federal Income Taxes – Provision for federal income taxes or excise taxes has not been made since the Fund has elected to be taxed as a “regulated investment company” and intends to distribute substantially all of its taxable income to its shareholders and otherwise comply with the provisions of the Internal Revenue Code of 1986, as amended, applicable to regulated investment companies. Net investment income or loss and realized gains and losses for federal income tax purposes may differ from that reported on the financial statements because of temporary book and tax basis differences. Temporary differences are primarily the result of the treatment of wash sales for tax reporting purposes. Distributions from net realized gains for book purposes may include short-term capital gains, which are included as ordinary income to shareholders for tax purposes. |
| | Due to inherent differences in the recognition of income, expenses, and realized gains/losses under GAAP and federal income tax regulations, permanent differences between book and tax basis reporting for the 2014 fiscal year have been identified |
| | and appropriately reclassified on the Statement of Assets and Liabilities. The adjustments are as follow: |
| Undistributed | Accumulated | |
| Net Investment | Net Realized | |
| Income/(Loss) | Gain/(Loss) | Paid-in Capital |
| $78,937 | $ — | $(78,937) |
| c). | Income and Expenses – Dividend income is recognized on the ex-dividend date or as soon as information is available to the Fund. Interest income, which includes the amortization of premium and accretion of discount, is recognized on an accrual basis. The Fund is charged for those expenses that are directly attributable to the portfolio, such as advisory, administration, and certain shareholder service fees. Income, expenses (other than expenses attributable to a specific class), and realized and unrealized gains or losses on investments are allocated to each class of shares based on its respective net assets. |
| d). | Distributions to Shareholders – Dividends from net investment income for the Fund, if any, are declared and paid out annually, usually in December. Distributions of net realized capital gains, if any, are declared and paid annually, usually in November or December. |
| e). | Security Transactions – Investment and shareholder transactions are recorded on the trade date. The Fund determines the gain or loss realized from the investment transactions by comparing the original cost of the security lot sold with the net sale proceeds. Discounts and premiums on securities purchased are accreted/amortized over the life of the respective security. |
| f). | Use of Estimates – The preparation of financial statements in conformity with GAAP requires management to make estimates and assumptions that affect the reported amounts of assets and liabilities and disclosure of contingent assets and liabilities at the date of the financial statements and the reported change in net assets during the reporting period. Actual results could differ from those estimates. |
| g). | Share Valuation – The net asset value (“NAV”) per share of the Fund is calculated by dividing the sum of the value of the securities held by the Fund, plus cash or other assets, minus all liabilities (including estimated accrued expenses) by the total number of shares outstanding for the Fund, rounded to the nearest cent. The Fund’s shares will not be priced on days the New York Stock Exchange is closed for trading. The offering and redemption price per share for the Fund is equal to the Fund’s NAV per share. |
| h). | Foreign Currency – Values of investments denominated in foreign currencies are converted into U.S. dollars using the spot market rate of exchange at the time of valuation. Purchases and sales of investments and income are translated into U.S. dollars using the spot market rate of exchange prevailing on the respective dates of such transactions. The Fund does not isolate the portion of the results of operations resulting from fluctuations in foreign exchange rates on investments from fluctuations resulting from changes in the market prices of securities held. Such fluctuations are included with the net realized and unrealized gain or loss on investments. Foreign investments present additional risks due to currency fluctuations, economic and political factors, lower liquidity, government regulations, differences in accounting standards, and other factors. |
| i). | Forward Contracts – The Fund may enter into forward currency contracts to reduce its exposure to changes in foreign currency exchange rates on its foreign holdings |
HENNESSY FUNDS 1-800-966-4354
| | and to lock in the U.S. dollar cost of firm purchase and sale commitments for securities denominated in foreign currencies. A forward currency contract is a commitment to purchase or sell a foreign currency at a future date at a negotiated forward rate. The gain or loss arising from the difference between the U.S. dollar cost of the original contract and the value of the foreign currency in U.S. dollars upon closing of such contract is included in net realized gain or loss from foreign currency transactions. During the fiscal year ended October 31, 2014, the Fund did not enter into any forward contracts. |
| j). | Repurchase Agreements – The Fund may enter into repurchase agreements with member banks or security dealers of the Federal Reserve Board whom the investment advisor deems creditworthy. The repurchase price generally equals the price paid by the Fund plus interest negotiated on the basis of current short-term rates. |
| | Securities pledged as collateral for repurchase agreements are held by the custodian bank until the respective agreements mature. Provisions of the repurchase agreements ensure that the market value of the collateral, including accrued interest thereon, is sufficient to cover the repurchase amount in the event of default of the counterparty. If the counterparty defaults and the value of the collateral declines or if the counterparty enters an insolvency proceeding, realization of the collateral by the Fund may be delayed or limited. |
| k). | Accounting for Uncertainty in Income Taxes – The Fund has adopted accounting policies regarding recognition and measurement of tax positions taken or expected to be taken on a tax return. The tax returns of the Fund for the prior three fiscal years are open for examination. The Fund has reviewed all open tax years in major jurisdictions and concluded that there is no impact on the Fund’s net assets and no tax liability resulting from unrecognized tax benefits relating to uncertain income tax positions taken or expected to be taken on a tax return. The Fund’s major tax jurisdictions are U.S. federal and Delaware. |
| l). | Derivatives – The Fund may invest in, or enter into, derivatives, such as options, futures contracts, options on futures contracts, and swaps, for a variety of reasons, including to hedge certain risks, to provide a substitute for purchasing or selling particular securities, or to increase potential income gain. Derivatives may provide a cheaper, quicker, or more specifically focused way for a Fund to invest than “traditional” securities would. The main purpose of utilizing these derivative instruments is for hedging purposes. |
| | The Fund has adopted the financial accounting reporting rules as required by the Derivatives and Hedging Topic of the Financial Accounting Standards Board Accounting Standards Codification. Under such rules, the Fund is required to include enhanced disclosure that enables investors to understand how and why an entity uses derivatives, how derivatives are accounted for, and how derivatives instruments affect an entity’s results of operations and financial position. During the fiscal year ended October 31, 2014, the Fund did not hold any derivative instruments. |
| m). | Events Subsequent to the Fiscal Period End – The Fund has adopted financial reporting rules regarding subsequent events that require an entity to recognize in the financial statements the effects of all subsequent events that provide additional evidence about conditions that existed at the date of the balance sheet. Management has evaluated the Fund’s related events and transactions that occurred subsequent to October 31, 2014 through the date of issuance of the Fund’s financial statements. There were no events or transactions that occurred during this period that materially impacted the amounts or disclosures in the Fund’s financial statements. |
3). SECURITIES VALUATION
The Fund has adopted authoritative fair valuation accounting standards that establish an authoritative definition of fair value and set out a hierarchy for measuring fair value. These standards require additional disclosures about the various inputs and valuation techniques used to develop the measurements of fair value and a discussion in changes in valuation techniques and related inputs during the period. These inputs are summarized in the three broad levels listed below:
| | Level 1 – | Quoted unadjusted prices for identical instruments in active markets to which the Fund has access at the date of measurement. |
| | Level 2 – | Quoted prices for similar instruments in active markets; quoted prices for identical or similar instruments in markets that are not active; and model-derived valuations in which all significant inputs and significant value drivers are observable in active markets. Level 2 inputs are those in markets for which there are few transactions, the prices are not current, the prices are fair value adjusted due to post-market close subsequent events (foreign markets), little public information exists, or instances where prices vary substantially over time or among brokered market makers. These inputs may also include interest rates, prepayment speeds, credit risk curves, default rates, and similar data. |
| | Level 3 – | Model-derived valuations in which one or more significant inputs or significant value drivers are unobservable. Unobservable inputs are those inputs that reflect the Fund’s own assumptions about what market participants would use to price the asset or liability based on the best available information. |
Following is a description of the valuation techniques applied to the Fund’s major categories of assets and liabilities measured at fair value on a recurring basis.
Equity Securities – Equity securities, including common stocks, preferred stocks, foreign issued common stocks, exchange traded funds, closed-end mutual funds, and real estate investment trusts, that are traded on a securities exchange for which a last-quoted sales price is readily available will generally be valued at the last sales price as reported by the primary exchange on which the securities are listed. Securities listed on The NASDAQ Stock Market (“NASDAQ”) will be valued at the NASDAQ Official Closing Price, which may differ from the last sales price reported. Securities traded on a securities exchange for which a last-quoted sales price is not readily available will generally be valued at the mean between the bid and ask prices. To the extent these securities are actively traded and valuation adjustments are not applied, they are classified in Level 1 of the fair value hierarchy.
Investment Companies – Investments in investment companies (e.g., mutual funds and exchange traded funds) are generally priced at the ending NAV provided by the Fund’s service agent and will be classified in Level 1 of the fair value hierarchy.
Debt Securities – Debt securities, including corporate bonds, asset-backed securities, mortgage-backed securities, municipal bonds, U.S. Treasuries, and U.S. government agency issues, are valued at market on the basis of valuations furnished by an independent pricing service that utilizes both dealer-supplied valuations and formula-based techniques. The pricing service may consider recently executed transactions in securities of the issuer or comparable issuers, market price quotations (where observable), bond spreads, and fundamental data relating to the issuer. In addition, the model may incorporate market observable data such as reported sales of similar securities, broker quotes, yields, bids, offers, and reference data. Certain securities are valued principally using dealer quotations. These securities are generally classified in Level 2 of the fair value hierarchy.
HENNESSY FUNDS 1-800-966-4354
Short-Term Securities – Short-term equity investments, including money market funds, are valued in the manner specified above. Short-term debt investments are generally valued at amortized cost, which approximates fair market value, if their original maturity was 60 days or less, or by amortizing the values as of the 61st day prior to maturity, if their original term to maturity exceeded 60 days. Amortized cost is not used if its use would be inappropriate due to credit or other impairments of the issuer, in which the security would be fair valued, as described below. Short-term securities are generally classified in Level 1 or Level 2 of the fair market hierarchy depending on the inputs used and market activity levels for specific securities.
The Board of Trustees of the Fund (the “Board”) has adopted fair value pricing procedures that are followed when a price for a security is not readily available or if a significant event has occurred that indicates the closing price of a security no longer represents the true value of that security. Fair value pricing determinations are made in good faith in accordance with these procedures. There are numerous criteria that will be given consideration in determining a fair value of a security. Some of these criteria are trading volume of security and markets, the value of other like securities, and news events with direct bearing to security or market. Fair value pricing results in an estimated price for a security that reflects the amount the Fund might reasonably expect to receive in a current sale. Depending on the relative significance of the valuation inputs, these securities may be classified in either Level 2 or Level 3 of the fair value hierarchy.
Fair valuing of foreign securities may be determined with the assistance of a pricing service using correlations between the movement of prices of such securities and indices of domestic securities and other appropriate indicators, such as closing market prices of relevant American Depositary Receipts or futures contracts. The effect of using fair value pricing is that the Fund’s NAV will reflect the affected portfolio securities’ value as determined in the judgment of the Board or its designee instead of being determined by the market. Using a fair value pricing methodology to price foreign securities may result in a value that is different from a foreign security’s most recent closing price and from the prices used by other investment companies to calculate their NAVs and are generally considered Level 2 prices in the fair valuation hierarchy. Because the Fund may invest in foreign securities, the value of the Fund’s portfolio securities may change on days when you will not be able to purchase or redeem your shares.
The Board has delegated day-to-day valuation matters to a Valuation Committee comprised of one or more representatives from Hennessy Advisors, Inc., the Fund’s investment advisor. The function of the Valuation Committee is to value securities where current and reliable market quotations are not readily available. All actions taken by the Valuation Committee are reviewed by the Board.
The Fund has performed an analysis of all existing investments to determine the significance and character of all inputs to their fair value determination. Various inputs are used in determining the value of the Fund’s investments. The inputs or methodology used for valuing securities are not necessarily an indication of the risk associated with investing in those securities. Details related to the fair valuation hierarchy of the Fund’s securities as of October 31, 2014 are included in the Fund’s Schedule of Investments.
4). INVESTMENT TRANSACTIONS
Purchases and sales of investment securities (excluding government and short-term investments) for the Fund during the fiscal year ended October 31, 2014 were $12,157,613 and $12,474,971, respectively.
There were no purchases or sales/maturities of long-term U.S. Government Securities for the Fund during the fiscal year ended October 31, 2014.
5). INVESTMENT MANAGEMENT FEE AND OTHER TRANSACTIONS WITH AFFILIATES
Hennessy Advisors, Inc. (the “Advisor”) is the investment advisor of the Fund. The Advisor provides the Fund with investment management services under an Investment Advisory Agreement. The Advisor furnishes all investment advice, office space, facilities, and provides most of the personnel needed by the Fund. As compensation for its services, the Advisor is entitled to a monthly fee from the Fund. The fee is based upon the average daily net assets of the Fund at the annual rate of 0.90%.
The Advisor has contractually agreed to limit the total annual operating expenses of the Fund (excluding interest, taxes, brokerage commissions, dividend expenses, acquired fund fees and expenses, extraordinary legal expenses, or any other extraordinary expenses and, from and after November 1, 2014, 12b-1 fees) to 1.95% and 1.70% of the Fund’s net assets for the Investor Class shares and Institutional Class shares of the Fund, respectively, through February 28, 2015. The net expense reimbursement for the Fund as of October 31, 2014 was $1,674.
For a period of three years after the year in which the Advisor waives or reimburses expenses, the Advisor may seek reimbursement from the Fund to the extent that total annual fund operating expenses are less than the expense limitation in effect at the time of the reimbursement. The Advisor waived or reimbursed expenses of $58,721 for the Fund during the fiscal year ended October 31, 2014. As of October 31, 2014, cumulative expenses subject to potential recovery to the aforementioned conditions and year of expiration are as follow:
| | | October 31, 2015 | October 31, 2016 | October 31, 2017 | Total |
| | Investor Class | $619 | $48,568 | $48,732 | $97,919 |
| | Institutional Class | $151 | $10,931 | $ 9,989 | $21,071 |
The Fund has adopted a plan pursuant to Rule 12b-1 under the Investment Company Act of 1940, as amended, that authorizes payments in connection with the distribution of the Fund’s shares at an annual rate of up to 0.25% of the Fund’s average daily net assets attributable to Investor Class shares. Amounts paid under the plan may be spent on any activities or expenses primarily intended to result in the sale of shares, including but not limited to, advertising, compensation for sales and marketing activities or financial institutions and others such as dealers and distributors, shareholder account servicing, the printing and mailing of prospectuses to other than current shareowners, and the printing and mailing of sales literature.
The Fund has entered into agreements with various brokers, dealers, and financial intermediaries in connection with the sale of shares of the Fund. The agreements provide for periodic payments by the Fund to the brokers, dealers, and financial intermediaries for providing certain shareholder maintenance services (sub-transfer agent expenses). These shareholder services include the pre-processing and quality control of new accounts, shareholder correspondence, answering customer inquiries regarding account status, and facilitating shareholder telephone transactions. Fees paid by the Fund to various brokers, dealers, and financial intermediaries for the fiscal year ended October 31, 2014 were $4,758.
U.S. Bancorp Fund Services, LLC (“USBFS”) provides the Fund with administrative, fund accounting, and transfer agent services, including all regulatory reporting, and necessary office equipment and personnel. As administrator, USBFS prepares various federal and state regulatory filings, reports, and returns for the Fund; prepares reports and materials to be supplied to the Board; monitors the activities of the Fund’s custodian, transfer agent, and accountants; and coordinates the preparation and payment of the Fund’s expenses and reviews the Fund’s expense accruals. Fees paid to USBFS for the fiscal year ended October 31, 2014 were $5,569.
HENNESSY FUNDS 1-800-966-4354
U.S. Bank, N.A., an affiliate of USBFS, serves as the Fund’s custodian. Quasar Distributors, LLC acts as the Fund’s principal underwriter in a continuous public offering of the Fund’s shares. Quasar Distributors, LLC is an affiliate of USBFS and U.S. Bank, N.A.
6). LINE OF CREDIT
The Fund has a line of credit with the other funds in the Hennessy Funds family of funds (the “Hennessy Funds”) in the amount of the lesser of (i) $100,000,000 or (ii) 33.33% of each Hennessy Fund’s net assets, or 30% for the Hennessy Gas Utility Index Fund and 10% for the Hennessy Balanced Fund, intended to provide short-term financing, if necessary, subject to certain restrictions, in connection with shareholder redemptions. The credit facility is with the Hennessy Funds’ custodian bank, U.S. Bank, N.A. Borrowings under this arrangement bear interest at the bank’s prime rate. During the fiscal year ended October 31, 2014, the Fund had an outstanding average daily balance and a weighted average interest rate of $1,479 and 3.25%, respectively. The maximum amount outstanding for the Fund during the period was $185,000.
7). FEDERAL TAX INFORMATION
As of October 31, 2014, the components of accumulated earnings (losses) for income tax purposes for the Fund were as follow:
| | Cost of investments for tax purposes | | $ | 5,532,501 | |
| | Gross tax unrealized appreciation | | $ | 583,785 | |
| | Gross tax unrealized depreciation | | | (260,134 | ) |
| | Net tax unrealized appreciation | | $ | 323,651 | |
| | Undistributed ordinary income | | $ | — | |
| | Undistributed long-term capital gains | | | — | |
| | Total distributable earnings | | $ | — | |
| | Other accumulated loss | | $ | (711,838 | ) |
| | Total accumulated loss | | $ | (388,187 | ) |
The difference between book-basis and tax-basis unrealized appreciation is attributable primarily to capital loss carry overs, wash sales, and partnership adjustments.
At October 31, 2014, the Fund had capital loss carryforwards of $632,559 that expire October 31, 2017.
During the year ended October 31, 2014, the capital loss carry forwards utilized for the Fund were $1,124,612.
Capital losses sustained in the year ended October 31, 2012 and in future taxable years will not expire and may be carried over by the Fund without limitation; however, they will retain the character of the original loss. Furthermore, any losses incurred during those taxable years will be required to be utilized prior to the losses incurred in taxable years prior to 2012. As a result of this ordering rule, pre-enactment capital loss carryforwards may be more likely to expire unused. Under pre-enactment law, capital losses could be carried forward for eight years, and carried forward as short-term capital losses, irrespective of the character of the original loss.
At October 31, 2014, the Fund deferred, on a tax basis, a late year ordinary loss of $79,279.
The Fund did not pay any distributions during fiscal year 2014 or fiscal year 2013.
Report of Independent Registered Public Accounting Firm
To the Board of Trustees of Hennessy Funds Trust
And the Shareholders of Hennessy Technology Fund
We have audited the accompanying statement of assets and liabilities, including the schedule of investments, of the Hennessy Technology Fund (the “Fund”), a series of Hennessy Funds Trust (the “Trust”) as of October 31, 2014, and the related statement of operations for the year then ended, the statements of changes in net assets for each of the two years in the period then ended, and the financial highlights for each of the five years in the period then ended. These financial statements and financial highlights are the responsibility of the Funds’ management. Our responsibility is to express an opinion on these financial statements and financial highlights based on our audits.
We conducted our audits in accordance with the standards of the Public Company Accounting Oversight Board (United States). Those standards require that we plan and perform the audits to obtain reasonable assurance about whether the financial statements and financial highlights are free of material misstatement. The Fund is not required to have, nor were we engaged to perform, an audit of its internal control over financial reporting. Our audits included consideration of internal control over financial reporting as a basis for designing audit procedures that are appropriate in the circumstances, but not for the purposes of expressing an opinion on the effectiveness of the Fund’s internal control over financial reporting. Accordingly, we express no such opinion. An audit includes examining, on a test basis, evidence supporting the amounts and disclosures in the financial statements. Our procedures included confirmation of securities owned as of October 31, 2014, by correspondence with the custodian and brokers. An audit also includes assessing the accounting principles used and significant estimates made by management, as well as evaluating the overall financial statement presentation. We believe that our audits provide a reasonable basis for our opinion.
In our opinion, the financial statements and financial highlights referred to above present fairly, in all material respects, the financial position of the Hennessy Technology Fund as of October 31, 2014, the results of its operations for the year then ended, the changes in its net assets for each of the two years in the period then ended, and the financial highlights for each of the five years in the period then ended, in conformity with accounting principles generally accepted in the United States of America.
TAIT, WELLER & BAKER LLP
Philadelphia, Pennsylvania
December 30, 2014
HENNESSY FUNDS 1-800-966-4354
Trustees and Officers of the Fund (Unaudited)
The business and affairs of the Fund are managed under the direction of the Fund’s Board of Trustees. Information pertaining to the Trustees and Officers of the Fund is set forth below. The Fund’s Statement of Additional Information includes additional information about the Fund’s Trustees and Officers and is available, without charge, upon request by calling 1-800-966-4354.
| | | | | Number of | |
| | | Term of | | Portfolios | |
| | | Office | | in the | Other |
| | | and | | Fund | Directorships |
| | Position(s) | Length | Principal | Complex | (During Past |
| Name, Address, | Held with | of Time | Occupation(s) | Overseen | Five Years)(2) |
| and Age | the Fund | Served | During Past Five Years | by Trustee | Held by Trustee |
| | | |
| Disinterested Trustees (as defined below) | | |
| | | |
| J. Dennis DeSousa | Trustee | Indefinite, | Mr. DeSousa is a real | 16 | Hennessy SPARX |
| Age: 78 | | until | estate investor. | | Funds Trust; |
| Address: | | successor | | | Hennessy Mutual |
| c/o Hennessy | | elected | | | Funds, Inc.; and |
| Advisors, Inc. | | | | | The Hennessy |
| 7250 Redwood Blvd. | | Served | | | Funds, Inc. |
| Suite 200 | | since | | | |
| Novato, CA 94945 | | January | | | |
| | | 1996 | | | |
| | | for the | | | |
| | | Funds (or | | | |
| | | Predecessor | | | |
| | | Funds) | | | |
| | | | | | |
| Robert T. Doyle | Trustee | Indefinite, | Mr. Doyle has been the | 16 | Hennessy SPARX |
| Age: 67 | | until | Sheriff of Marin County, | | Funds Trust; |
| Address: | | successor | California since 1996. | | Hennessy Mutual |
| c/o Hennessy | | elected | | | Funds, Inc.; and |
| Advisors, Inc. | | | | | The Hennessy |
| 7250 Redwood Blvd. | | Served | | | Funds, Inc. |
| Suite 200 | | since | | | |
| Novato, CA 94945 | | January | | | |
| | | 1996 | | | |
| | | for the | | | |
| | | Funds (or | | | |
| | | Predecessor | | | |
| | | Funds) | | | |
| | | | | | |
| Gerald P. Richardson | Trustee | Indefinite, | Mr. Richardson is an | 16 | Hennessy SPARX |
| Age: 69 | | until | independent consultant | | Funds Trust; |
| Address: | | successor | in the securities industry. | | Hennessy Mutual |
| c/o Hennessy | | elected | | | Funds, Inc.; and |
| Advisors, Inc. | | | | | The Hennessy |
| 7250 Redwood Blvd. | | Served | | | Funds, Inc. |
| Suite 200 | | since | | | |
| Novato, CA 94945 | | May 2004 | | | |
| | | for the | | | |
| | | Funds (or | | | |
| | | Predecessor | | | |
| | | Funds) | | | |
| | | | | Number of | |
| | | Term of | | Portfolios | |
| | | Office | | in the | Other |
| | | and | | Fund | Directorships |
| | Position(s) | Length | Principal | Complex | (During Past |
| Name, Address, | Held with | of Time | Occupation(s) | Overseen | Five Years)(2) |
| and Age | the Fund | Served | During Past Five Years | by Trustee | Held by Trustee |
| | | |
| “Interested Persons” (as defined in the 1940 Act) | | |
| | | |
Neil J. Hennessy(1) | Chief | Trustee: | Mr. Hennessy has been | 16 | Hennessy |
| Age: 58 | Investment | Indefinite, | employed by Hennessy | | Advisors, Inc. |
| Address: | Officer, | until | Advisors, Inc., the Funds’ | | (current); |
| c/o Hennessy | Portfolio | successor | investment advisor, since | | Hennessy SPARX |
| Advisors, Inc. | Manager, | elected | 1989. He currently serves | | Funds Trust; |
| 7250 Redwood Blvd. | President, | | as President, Chairman | | Hennessy Mutual |
| Suite 200 | Trustee | Served | and CEO of Hennessy | | Funds, Inc.; and |
| Novato, CA 94945 | and | since | Advisors, Inc. | | The Hennessy |
| | Chairman | January | | | Funds, Inc. |
| | of the | 1996 | | | |
| | Board | for the | | | |
| | | Funds (or | | | |
| | | Predecessor | | | |
| | | Funds) | | | |
| | | | | | |
| | | Officer: | | | |
| | | 1 year term | | | |
| | | | | | |
| | | Served | | | |
| | | since | | | |
| | | June 2008 | | | |
| | | for the | | | |
| | | Funds (or | | | |
| | | Predecessor | | | |
| | | Funds) | | | |
| | | | | | |
Teresa M. Nilsen(1) | Executive | 1 year term | Ms. Nilsen has been | N/A | N/A |
| Age: 48 | Vice | | employed by Hennessy | | |
| Address: | President | Served | Advisors, Inc., the Funds’ | | |
| c/o Hennessy | and | since | investment advisor, since | | |
| Advisors, Inc. | Treasurer | January | 1989. She currently serves | | |
| 7250 Redwood Blvd. | | 1996 | as Executive Vice President, | | |
| Suite 200 | | for the | Chief Operations Officer, | | |
| Novato, CA 94945 | | Funds (or | Chief Financial Officer, and | | |
| | | Predecessor | Secretary of Hennessy | | |
| | | Funds) | Advisors, Inc. | | |
| (1) | All Officers of the Hennessy Funds and employees of the Manager are Interested Persons of the Funds. |
| (2) | Pursuant to an internal reorganization, the series of Hennessy Mutual Funds, Inc. (“HMFI”), The Hennessy Funds, Inc. (“HFI”) and Hennessy SPARX Funds Trust (“HSFT”) were reorganized into series of Hennessy Funds Trust on February 28, 2014, which mirrored the corresponding series of HFMI, HFI and HSFT. Subsequent to the reorganization, HFMI, HFI and HSFT were dissolved. |
HENNESSY FUNDS 1-800-966-4354
| | | Term of | |
| | | Office | |
| | | and | |
| | Position(s) | Length | Principal |
| Name, Address, | Held with | of Time | Occupation(s) |
| and Age | the Fund | Served | During Past Five Years |
| | | | |
| Interested Persons | | | |
| | | | |
Daniel B. Steadman(1) | Executive | 1 year term | Mr. Steadman has been employed by |
| Age: 58 | Vice President | | Hennessy Advisors, Inc., the Funds’ |
| Address: | and Secretary | Served since | investment advisor, since 2000. |
| c/o Hennessy Advisors, Inc. | | March 2000 | He currently serves as Executive |
| 7250 Redwood Blvd. | | for the Funds (or | Vice President and Chief Compliance |
| Suite 200 | | Predecessor Funds) | Officer of Hennessy Advisors, Inc. |
| Novato, CA 94945 | | | |
| | | | |
Jennifer Cheskiewicz(1) | Senior | 1 year term | Ms. Cheskiewicz has been employed by |
| Age: 37 | Vice President | | Hennessy Advisors, Inc., the Funds’ |
| Address: | and Chief | Served since | investment advisor, since June 2013. |
| c/o Hennessy Advisors, Inc. | Compliance | June 2013 | She previously served as in-house |
| 7250 Redwood Blvd. | Officer | for the Funds (or | counsel to Carlson Capital, L.P., an |
| Suite 200 | | Predecessor Funds) | SEC-registered investment advisor to |
| Novato, CA 94945 | | | several private funds from February |
| | | | 2010 to May 2013. Prior to that, she |
| | | | was an attorney with Gibson, Dunn & |
| | | | Crutcher LLP from September 2005 |
| | | | through February 2010. She currently |
| | | | serves as General Counsel of |
| | | | Hennessy Advisors, Inc. |
| | | | |
Brian Carlson(1) | Senior | 1 year term | Mr. Carlson has been employed by |
| Age: 42 | Vice President | | Hennessy Advisors, Inc., the Funds’ |
| Address: | and Head of | Served since | investment advisor, since |
| c/o Hennessy Advisors, Inc. | Distribution | December 2013 | December 2013. |
| 7250 Redwood Blvd. | | for the Funds (or | |
| Suite 200 | | Predecessor Funds) | Mr. Carlson was previously a |
| Novato, CA 94945 | | | co-founder and principal of Trivium |
| | | | Consultants, LLC from February 2011 |
| | | | through November 2013. Prior to that, |
| | | | he was the Senior Managing Director |
| | | | of NRP Financial, Inc. from August |
| | | | 2007 through February 2011. |
| | | | |
David Ellison(1) | Portfolio Manager | 1 year term | Mr. Ellison has served as Portfolio |
| Age: 56 | and Senior | | Manager of the Large Cap Financial |
| Address: | Vice President | Served since | Fund, the Small Cap Financial Fund, |
| c/o Hennessy Advisors, Inc. | | October 2012 | and the Technology Fund |
| 101 Federal Street | | for the Funds (or | since inception. |
| Suite 1900 | | Predecessor Funds) | |
| Boston, MA 02110 | | | Mr. Ellison previously served as Director, |
| | | | CIO and President of FBR Advisers, Inc. |
| | | | from December 1999 to October 2012. |
| (1) | All Officers of the Hennessy Funds and employees of the Manager are Interested Persons of the Funds. |
| | | Term of | |
| | | Office | |
| | | and | |
| | Position(s) | Length | Principal |
| Name, Address, | Held with | of Time | Occupation(s) |
| and Age | the Fund | Served | During Past Five Years |
| | | | |
| Interested Persons | | | |
| | | | |
Brian Peery(1) | Portfolio Manager | 1 year term | Mr. Peery has been a Portfolio Manager |
| Age: 45 | and | | of the Cornerstone Growth Fund, |
| Address: | Vice President | Served since | the Cornerstone Mid Cap 30 Fund, the |
| c/o Hennessy Advisors, Inc. | | March 2003 | Cornerstone Large Growth Fund, the |
| 7250 Redwood Blvd. | | as Vice President | Cornerstone Value Fund, the Total |
| Suite 200 | | for the Funds (or | Return Fund, and the Balanced Fund |
| Novato, CA 94945 | | Predecessor Funds) | since October 2014. From February |
| | | | 2011 through September 2014, he |
| | | Served since | served as Co-Portfolio Manager of |
| | | February 2011 | the same funds. |
| | | as Co-Portfolio | |
| | | Manager | Mr. Peery has been employed by |
| | | for the Funds (or | Hennessy Advisors, Inc., the Funds’ |
| | | Predecessor Funds) | investment advisor, since 2002. |
| | | | |
Winsor (Skip) Aylesworth(1) | Portfolio Manager | 1 year term | Mr. Aylesworth has been Portfolio |
| Age: 67 | and | | Manager of the Gas Utility Index Fund |
| Address: | Vice President | Served since | since 1998 and Portfolio Manager of |
| c/o Hennessy Advisors, Inc. | | October 2012 | the Technology Fund since inception. |
| 101 Federal Street | | for the Funds (or | |
| Suite 1900 | | Predecessor Funds) | Mr. Aylesworth previously served as |
| Boston, MA 02110 | | | Executive Vice President of The FBR |
| | | | Funds from 1999 to October 2012. |
| | | | |
Ryan Kelley(1) | Portfolio Manager | 1 year term | Mr. Kelley has been a Portfolio Manager |
| Age: 42 | and | | of the Gas Utility Index Fund (formerly |
| Address: | Vice President | Served since | the FBR Gas Utility Index Fund), the |
| c/o Hennessy Advisors, Inc. | | March 2013 | Small Cap Financial Fund (formerly the |
| 1340 Environ Way | | for the Funds (or | FBR Small Cap Financial Fund), and the |
| Chapel Hill, NC 27517 | | Predecessor Funds) | Large Cap Financial Fund (formerly the |
| | | | FBR Large Cap Financial Fund) since |
| | | | October 2014. From March 2013 |
| | | | through September 2014, he served |
| | | | as a Co-Portfolio Manager of the same |
| | | | funds. Prior to that, he was a Portfolio |
| | | | Analyst of the Hennessy Funds. |
| | | | |
| | | | Mr. Kelley previously served as Portfolio |
| | | | Manager of The FBR Funds from |
| | | | January 2008 to October 2012. |
| (1) | All Officers of the Hennessy Funds and employees of the Manager are Interested Persons of the Funds. |
HENNESSY FUNDS 1-800-966-4354
Expense Example (Unaudited)
October 31, 2014
As a shareholder of the Fund, you incur two types of costs: (1) transaction costs, including sales charges (loads) on purchase payments, reinvested dividends, or other distributions; redemption fees; and exchange fees; and (2) ongoing costs, including management fees; service fees; and other Fund expenses. This Example is intended to help you understand your ongoing costs (in dollars) of investing in the Fund and to compare these costs with the ongoing costs of investing in other mutual funds. The Example is based on an investment of $1,000 invested at the beginning of the period and held for the entire period from May 1, 2014 through October 31, 2014.
Actual Expenses
The first line of the table below under the “Investor Class” and “Institutional Class” headings provides information about actual account values and actual expenses. Although the Fund charges no sales loads or transaction fees, you will be assessed fees for outgoing wire transfers, returned checks and stop payment orders at prevailing rates charged by U.S. Bancorp Fund Services, LLC, the Fund’s transfer agent. If you request that a redemption be made by wire transfer, currently a $15.00 fee is charged by the Fund’s transfer agent. IRA accounts will be charged a $15.00 annual maintenance fee. The example below includes, but is not limited to, management fees, shareholder servicing fees, fund accounting, custody, and transfer agent fees. However, the example below does not include portfolio trading commissions and related expenses, and other extraordinary expenses as determined under generally accepted accounting principles. You may use the information in this line, together with the amount you invested, to estimate the expenses that you paid over the period. Simply divide your account value by $1,000 (for example, an $8,600 account value divided by $1,000 = 8.6), then multiply the result by the number in the first line of the table under the “Investor Class” and “Institutional Class” headings in the column entitled “Expenses Paid During Period” to estimate the expenses you paid on your account during this period.
Hypothetical Example for Comparison Purposes
The second line of the table below under the “Investor Class” and “Institutional Class” headings provides information about hypothetical account values and hypothetical expenses based on the Fund’s actual expense ratios and an assumed rate of return of 5% per year before expenses, which is not the Fund’s actual return. The hypothetical account values and expenses may not be used to estimate the actual ending account balance or expenses you paid for the period. You may use this information to compare the ongoing costs of investing in the Fund and other funds. To do so, compare this 5% hypothetical example with the 5% hypothetical examples that appear in the shareholder reports of the other funds. Please note that the expenses shown in the table are meant to highlight your ongoing costs only and do not reflect any transactional costs, such as sales charges (loads), or exchange fees. Therefore, the second line of the table under the “Investor Class” and “Institutional Class” headings is useful in comparing ongoing costs only, and will not help you determine the relative total costs of owning different funds. In addition, if these transactional costs were included, your costs would have been higher.
| | Beginning | Ending | Expenses Paid |
| | Account Value | Account Value | During Period(1) |
| | 5/1/14 | 10/31/14 | 5/1/14 – 10/31/14 |
| Investor Class | | | |
| | | | |
| Actual | $1,000.00 | $1,104.00 | $10.34 |
| | | | |
| Hypothetical (5% return | | | |
| before expenses) | $1,000.00 | $1,015.38 | $9.91 |
| | | | |
| Institutional Class | | | |
| | | | |
| Actual | $1,000.00 | $1,105.20 | $9.02 |
| | | | |
| Hypothetical (5% return | | | |
| before expenses) | $1,000.00 | $1,016.64 | $8.64 |
| (1) | Expenses are equal to the Fund’s expense ratio of 1.95% for Investor Class shares or 1.70% for Institutional Class shares, as applicable, multiplied by the average account value over the period, multiplied by 184/365 days (to reflect one-half year period). |
HENNESSY FUNDS 1-800-966-4354
Proxy Voting
A description of the policies and procedures the Fund uses to determine how to vote proxies relating to portfolio securities is available without charge: (1) by calling 1-800-966-4354; (2) on the Hennessy Funds’ website at hennessyfunds.com; or (3) on the U.S. Securities and Exchange Commission’s (the “SEC”) website at www.sec.gov. The Fund’s proxy voting record is available on both the Hennessy Funds’ website at hennessyfunds.com and the SEC’s website at www.sec.gov no later than August 31 for the prior 12 months ending June 30.
Quarterly Filings on Form N-Q
The Fund files its complete schedule of portfolio holdings with the SEC for the first and third quarters of each fiscal year on Form N-Q. The Fund’s Forms N-Q are available on the SEC’s website at www.sec.gov. The Fund’s Forms N-Q may be reviewed and copied at the SEC’s Public Reference Room in Washington, DC and information on the operation of the Public Reference Room may be obtained by calling 1-800-SEC-0330. Information included in the Fund’s Forms N-Q will also be available upon request by calling 1-800-966-4354.
Householding
To help keep the Fund’s costs as low as possible, we generally deliver a single copy of most financial reports and prospectuses to shareholders who share an address, even if the accounts are registered under different names. This process, known as “householding,” does not apply to account statements. You may, of course, request an individual copy of a prospectus or financial report at any time. If you would like to receive separate mailings, please call the Administrator at 1-800-261-6950 or 1-414-765-4124 and we will begin individual delivery within 30 days of your request. If your account is held through a financial institution or other intermediary, please contact them directly to request individual delivery.
Privacy Policy
We collect the following non-public personal information about you:
| | • | information we receive from you on or in applications or other forms, correspondence, or conversations, including, but not limited to, your name, address, phone number, social security number, assets, income and date of birth; |
| | | and |
| | • | information about your transactions with us, our affiliates, or others, including, but not limited to, your account number and balance, payment history, parties to transactions, cost basis information and other financial information. |
We do not disclose any non-public personal information about our current or former shareholders to nonaffiliated third parties, except as permitted by law. For example, we are permitted by law to disclose all of the information we collect, as described above, to our Transfer Agent to process your transactions. Furthermore, we restrict access to your non-public personal information to those persons who require such information to provide products or services to you. We maintain physical, electronic and procedural safeguards that comply with federal standards to guard your non-public personal information.
In the event that you hold shares of the Fund through a financial intermediary, including, but not limited to, a broker-dealer, bank or trust company, the privacy policy of your financial intermediary would govern how your non-public personal information would be shared with nonaffiliated third parties.
HENNESSY FUNDS 1-800-966-4354
For information, questions or assistance, please call
The Hennessy Funds
1-800-966-4354 or 1-415-899-1555
INVESTMENT ADVISOR
Hennessy Advisors, Inc.
7250 Redwood Blvd., Suite 200
Novato, California 94945
ADMINISTRATOR,
TRANSFER AGENT,
DIVIDEND PAYING AGENT &
SHAREHOLDER SERVICING AGENT
U.S. Bancorp Fund Services, LLC
P.O. Box 701
Milwaukee, Wisconsin 53201-0701
CUSTODIAN
U.S. Bank N.A.
Custody Operations
1555 North River Center Dr., Suite 302
Milwaukee, Wisconsin 53212
TRUSTEES
Neil J. Hennessy
Robert T. Doyle
J. Dennis DeSousa
Gerald P. Richardson
COUNSEL
Foley & Lardner LLP
777 East Wisconsin Avenue
Milwaukee, Wisconsin 53202-5306
INDEPENDENT REGISTERED
PUBLIC ACCOUNTING FIRM
Tait, Weller & Baker LLP
1818 Market Street, Suite 2400
Philadelphia, Pennsylvania 19103
DISTRIBUTOR
Quasar Distributors, LLC
615 East Michigan Street
Milwaukee, Wisconsin 53202
hennessyfunds.com | 1-800-966-4354
This report has been prepared for shareholders and may be distributed to
others only if preceded or accompanied by a current prospectus.
ANNUAL REPORT
OCTOBER 31, 2014
HENNESSY JAPAN FUND
Investor Class HJPNX
Institutional Class HJPIX
hennessyfunds.com | 1-800-966-4354
(This Page Intentionally Left Blank.)
Contents
| Letter to Shareholders | 2 |
| Performance Overview | 4 |
| Financial Statements | |
| Schedule of Investments | 7 |
| Statement of Assets and Liabilities | 11 |
| Statement of Operations | 12 |
| Statements of Changes in Net Assets | 13 |
| Financial Highlights | 14 |
| Notes to the Financial Statements | 18 |
| Report of Independent Registered Public Accounting Firm | 26 |
| Trustees and Officers of the Fund | 27 |
| Expense Example | 32 |
| Proxy Voting | 34 |
| Quarterly Filings on Form N-Q | 34 |
| Householding | 34 |
| Privacy Policy | 35 |
HENNESSY FUNDS 1-800-966-4354
December 2014
Dear Shareholder:
As I look back at 2014, I realize that in this age of rapidly evolving technology, information is delivered and absorbed so quickly that it is difficult to remember what happened last week, let alone what’s happened over the course of an entire year. That is why I’d like to take a moment to recall some of the year’s highs and lows, economically, politically and socially, here in the U.S. and around the globe. 2014 was scarred by political partisanship in Washington, civil unrest in the U.S., Ukraine and many other countries, the arrival of terrorist group ISIS, and the frightening outbreak of Ebola. However, there were also positive events this year: In the U.S., we survived a government shutdown over healthcare reform, jobs reports have been consistently, albeit anemically, improving, and home prices remained relatively stable, after recovering significantly in 2013. The appointment of Janet Yellen as Chair of the Federal Reserve served to calm the nerves of business and political leaders alike. Japan successfully instituted its long-anticipated consumption tax increase, and the Bank of Japan stunned investors at the end of October when it unexpectedly expanded its already massive monetary stimulus.
The Japanese financial markets were volatile during the twelve-month period ended October 31, 2014, and ended roughly flat with the TOPIX returning -0.47% and the Nikkei 225 returning 0.43% (in U.S. Dollar terms). Looking back at the period, the Japanese market was buoyed by positive global economic data and improved corporate profitability, finishing 2013 at a six-year high. However, at the start of 2014, this momentum stalled and Japanese stocks promptly declined and remained range-bound, due to growth in emerging markets slowing and tensions between Ukraine and Russia escalating. In May 2014, the Japanese stock market began to show signs of life when economic data suggested that the impact of April’s consumption tax hike from 5% to 8% was not as severe as anticipated.
Although mixed Japanese macroeconomic indicators pointed to a slow, but positive recovery, Japanese stocks tumbled in the first two weeks of October because of concerns over global growth and a decline in oil prices. However, with two weeks remaining, global equity markets rebounded following the release of better-than-expected U.S. statistics. With Japanese stocks on the rise, the Bank of Japan announced that it would inject 80 trillion Yen ($650 billion) per year, which is an increase of 10-20 trillion Yen over its current policy, in order to support its 2% inflation target. This caused global investors to pile into the Japan market, and as a result, the Nikkei 225 index ended the period at a seven-year high, while the Yen fell to its lowest level in seven years.
While the first two arrows of Abenomics - unprecedented monetary expansion and fiscal stimulus - have garnered the most attention, the Japanese government’s new measures of its “Japan Revitalization Strategy”, better known as the third arrow of Abenomics, have begun to make an impact. The first of the strategy’s three main pillars, “Restoring Japan’s earning power” is not only focused on transforming Japan’s corporate mindset to achieve better performance in the form of higher return on equity, but also on changing citizen’s mindset from saving to investment. In addition to introducing a new index, the JPX-Nikkei Index 400, which was created to include only stocks focused on returning capital to shareholders, the government formulated Japan’s Stewardship Code that encourages institutional investors to promote long-term value creation through dialogue with corporate management.
Prime Minister Abe additionally implemented structural tax and investment changes for Japanese citizens to encourage greater equity ownership. Through the Nippon Individual Savings Accounts program, or NISA, Japanese residents can invest up to 5 million yen (approximately $50,000) on a tax-free basis. Since its introduction in January 2014, NISA has grown to 7.3 million accounts with $16 billion invested as of the end of June. The reform of Japan’s and the world’s largest pension fund, the Government Pension Investment Fund (GPIF) is also expected to spur higher Japanese equity ownership levels. In late October GPIF, which holds $1.2 trillion in assets, announced its new asset mix, which aims to increase Japanese stocks from 12 to 25% of its portfolio. We believe that this shift towards equities could be amplified as other Japanese public and private pension funds, which hold an additional $1.5 trillion in assets, potentially follow GPIF’s lead.
We strongly believe that Abenomics is on the right track, but needs more time for the various programs to work and targets to be met. The outcome of December’s elections, with a landslide victory for Prime Minister Abe’s Liberal Democratic Party, should allow Abe and his Cabinet the time to continue executing these economic policies and growth initiatives. We do not believe that the Japanese is overvalued, with the major indices at 15-16x earnings, and we anticipate that the market will continue to grow in line with earnings growth next year.
I firmly believe that both the U.S. and Japan are in the midst of a secular bull market, and I continue to tell investors to try to remain calm in the face of volatility and continue to focus on the strong, long-term fundamentals that are evident in these markets today.
I am encouraged by the returns for the major financial market indices and by the performance of the Hennessy Funds over the past year. Thank you for your continued confidence and investment in our products. If you have any questions or would like to speak with us directly, please don’t hesitate to call us at (800) 966-4354.
Best regards,
Neil J. Hennessy
President and Chief Investment Officer
Past performance does not guarantee future results.
Mutual fund investing involves risk. Principal loss is possible.
Opinions expressed are those of Neil Hennessy and are subject to change, are not guaranteed and should not be considered investment advice.
Earnings growth is not a measure of the Fund’s future performance.
The TOPIX (Tokyo Price Index) and Nikkei 225 Index are unmanaged indices commonly used to measure the performance of Japanese stocks, and these indices are presented in U.S. Dollar terms. The JPX-Nikkei Index 400 is composed of 400 companies deemed to have high appeal for investors, which meet requirements of global investment standards, such as efficient use of capital and investor-focused management perspectives as determined by the Tokyo Stock Exchange. One cannot invest directly in an index.
HENNESSY FUNDS 1-800-966-4354
Performance Overview (Unaudited)
The opinions expressed in the following commentary reflect those of the Portfolio Managers as of the date written. Any such opinions are subject to change based on market or other conditions and are not guaranteed. These opinions may not be relied upon as investment advice. Investment decisions for the Fund are based on multiple factors, and may not be relied upon as an indication of trading intent on behalf of the Fund. Security positions can and do change.
CHANGE IN VALUE OF $10,000 INVESTMENT
This chart assumes an initial gross investment of $10,000 made on October 31, 2004. Returns shown include the reinvestment of all dividends. Returns shown do not reflect the deduction of taxes that a shareholder would pay on Fund distributions or the redemption of Fund shares.
AVERAGE ANNUAL TOTAL RETURN FOR PERIODS ENDED OCTOBER 31, 2014
| | One | Five | Ten |
| | Year | Years | Years |
| Hennessy Japan Fund – | | | |
| Investor Class (HJPNX) | 10.62% | 13.91% | 6.10% |
| Hennessy Japan Fund – | | | |
| Institutional Class (HJPIX) | 10.86% | 14.19% | 6.28% |
Russell/Nomura Total MarketTM Index | 0.99% | 6.39% | 3.59% |
| Tokyo Price Index (TOPIX) | -0.47% | 5.78% | 3.32% |
Expense ratios: 1.91% (Investor Class); 1.67% (Institutional Class)
Performance data quoted represents past performance; past performance does not guarantee future results. The investment return and principal value of an investment will fluctuate so that an investor’s shares, when redeemed, may be worth more or less than their original cost. Current performance of the Fund may be lower or higher than the performance quoted. Performance data current to the most recent month end may be obtained by visiting hennessyfunds.com.
The expense ratios presented are from the most recent prospectus.
PERFORMANCE NARRATIVE
SPARX ASSET MANAGEMENT CO., LTD, SUB-ADVISOR
Portfolio Managers Masakazu Takeda, CMA, and Yu Shimizu, CMA, SPARX Asset Management Co., Ltd. (sub-advisor)
Over the previous twelve months, how did the Fund perform and what factors contributed to this performance?
For the twelve-month period ended October 31, 2014, the Investor Class of the Hennessy Japan Fund returned 10.62%, significantly outperforming the Russell/Nomura Total Market™ Index, the Tokyo Price Index (TOPIX) and the Morningstar Japan Category Average, which returned 0.99%, -0.47% and 2.02% for the same period, respectively.
The largest positive contributors to the Fund’s performance among the 33 TOPIX sub-industries were shares of auto-related firms, miscellaneous manufacturing firms, and electric appliances makers. Conversely, shares of banks, pharmaceutical makers and wholesalers performed negatively during the 12-month period.
Among the strongest performing stocks in the Fund during the period were the world’s major electric motor manufacturer, Nidec Corporation, the global market share leader in bicycle parts, Shimano, Inc., and high performance running shoe maker, ASICS Corporation. Over the past twelve months, in Yen terms, shares of Nidec rallied +52% as the company continues to undergo a rapid transition to diversify its business portfolio from computer hard disk drive precision motors to a broader range of motors. Solid earnings and strong franchises have led to steady share appreciation of both Shimano (+71%, in Yen terms) and ASICS (+50%, in Yen terms). The Fund continues to hold all of these positions.
Conversely, Japan’s second and third largest financial services groups, Sumitomo Mitsui Financial Group, Inc. and Mizuho Financial Group, Inc., and Japan’s leading general trading company Sumitomo Corporation were among the major detractors from the Fund’s performance. During the period, shares of Sumitomo Mitsui Financial Group, Inc. and Mizuho Financial Group, Inc. dropped -7% and -2%, respectively in Yen terms, as low loan demand and Japan’s zero interest rate environments persist. Meanwhile, weak commodity markets and project write-offs have dampened enthusiasm for Sumitomo Corporation leading to a -8% decline in its share price.
Additional Portfolio Manager commentary and related investment outlook:
The bold, coordinated policy moves of the Bank of Japan (BoJ) and GPIF (Government Pension Investment Fund of Japan), the largest pension fund in the world, certainly took market participants by surprise on October 31. However, despite the ensuing rally, the current TOPIX level continues to lag corporate earnings growth. Moreover, considering corporate profits and market capitalization, we believe that Japanese stocks are not overvalued compared to overseas stocks. With the recovery of economic sentiment in Japan and the progress of Abenomics, we expect the Japanese markets should continue to recover.
The Russell/Nomura Total Market™ Index contains the top 98% of all stocks listed on Japan’s stock exchange and registered on Japan’s OTC market in terms of market capitalization. The Tokyo Price Index (TOPIX) is a market capitalization-weighted index of all companies listed on the First Section of the Tokyo Stock Exchange. The Russell/Nomura Total Market™ and TOPIX indices are presented in U.S. dollar terms and take into account reinvestment of dividends. You cannot invest directly in an index. Performance data for an index does not reflect any deductions for fees, expenses or taxes. The Fund may invest in small- and medium capitalization companies, which may have limited liquidity and greater price volatility than large-capitalization companies. Investments in foreign securities involve greater volatility and political, economic and currency risk and differences in
HENNESSY FUNDS 1-800-966-4354
accounting methods. The Fund may invest in IPOs, which may fluctuate considerably due to the absence of a prior public market and may have a magnified impact on the Fund. References to specific securities should not be considered a recommendation to buy or sell any security. Fund holdings and sector allocations are subject to change. Please refer to the Schedule of Investments included in this report for additional portfolio information.
Each Morningstar category average represents a universe of funds with similar investment objectives. © Morningstar, Inc. All Rights Reserved. The information contained herein: 1) is proprietary to Morningstar; 2) may not be copied or distributed and 3) is not warranted to be accurate, complete or timely. Neither Morningstar nor its content providers are responsible for any damages or losses arising from any use of this information. Past performance does not guarantee future results.
Financial Statements
HENNESSY JAPAN FUND
As of October 31, 2014
(% of Net Assets)
| TOP TEN HOLDINGS (EXCLUDING CASH/CASH EQUIVALENTS) | % NET ASSETS |
| | |
| Misumi Group, Inc. | 6.77% |
| Ryohin Keikaku Co., Ltd. | 6.62% |
| Terumo Corp. | 6.40% |
| ASICS Corp. | 6.35% |
| Keyence Corp. | 6.30% |
| Unicharm Corp. | 5.84% |
| Nidec Corp. | 5.67% |
| Shimano, Inc. | 5.66% |
| Toyota Motor Corp. | 5.62% |
| Kao Corp. | 5.61% |
Note: For presentation purposes, the Fund has grouped some of the industry categories. For purposes of categorizing securities for compliance with Section 8(b)(1) of the Investment Company Act of 1940, the Fund uses more specific industry classifications.
HENNESSY FUNDS 1-800-966-4354
| | COMMON STOCKS – 101.41% | | Number | | | | | | % of | |
| | | | of Shares | | | Value | | | Net Assets | |
| | Consumer Discretionary – 29.49% | | | | | | | | | |
| | ASICS Corp. | | | 143,800 | | | $ | 3,367,356 | | | | 6.35 | % |
| | Isuzu Motors, Ltd. | | | 213,000 | | | | 2,779,092 | | | | 5.24 | % |
| | Ryohin Keikaku Co., Ltd. | | | 26,000 | | | | 3,510,807 | | | | 6.62 | % |
| | Shimano, Inc. | | | 22,600 | | | | 2,996,882 | | | | 5.66 | % |
| | Toyota Motor Corp. | | | 49,500 | | | | 2,978,772 | | | | 5.62 | % |
| | | | | | | | | 15,632,909 | | | | 29.49 | % |
| | | | | | | | | | | | | | |
| | Consumer Staples – 15.36% | | | | | | | | | | | | |
| | Kao Corp. | | | 76,300 | | | | 2,975,250 | | | | 5.61 | % |
| | Pigeon Corp. | | | 33,200 | | | | 2,069,601 | | | | 3.91 | % |
| | Unicharm Corp. | | | 133,200 | | | | 3,097,360 | | | | 5.84 | % |
| | | | | | | | | 8,142,211 | | | | 15.36 | % |
| | | | | | | | | | | | | | |
| | Financials – 5.50% | | | | | | | | | | | | |
| | Mizuho Financial Group | | | 601,200 | | | | 1,095,576 | | | | 2.07 | % |
| | Sumitomo Mitsui Financial Group, Inc. | | | 44,600 | | | | 1,818,918 | | | | 3.43 | % |
| | | | | | | | | 2,914,494 | | | | 5.50 | % |
| | | | | | | | | | | | | | |
| | Health Care – 13.31% | | | | | | | | | | | | |
| | Mani, Inc. | | | 13,800 | | | | 881,998 | | | | 1.66 | % |
| | Rohto Pharmaceutical Co., Ltd. | | | 191,900 | | | | 2,783,646 | | | | 5.25 | % |
| | Terumo Corp. | | | 135,700 | | | | 3,392,311 | | | | 6.40 | % |
| | | | | | | | | 7,057,955 | | | | 13.31 | % |
| | | | | | | | | | | | | | |
| | Industrials – 26.64% | | | | | | | | | | | | |
| | Daikin Industries | | | 17,100 | | | | 1,068,888 | | | | 2.02 | % |
| | Itochu Corp. | | | 47,500 | | | | 574,206 | | | | 1.08 | % |
| | Komatsu, Ltd. | | | 7,500 | | | | 177,070 | | | | 0.34 | % |
| | Kubota Corp. | | | 36,000 | | | | 573,048 | | | | 1.08 | % |
| | Marubeni Corp. | | | 84,000 | | | | 540,074 | | | | 1.02 | % |
| | Misumi Group, Inc. | | | 113,700 | | | | 3,587,677 | | | | 6.77 | % |
| | Mitsubishi Corp. | | | 143,100 | | | | 2,805,955 | | | | 5.29 | % |
| | Nidec Corp. | | | 45,500 | | | | 3,006,305 | | | | 5.67 | % |
| | Sumitomo Corp. | | | 167,600 | | | | 1,788,245 | | | | 3.37 | % |
| | | | | | | | | 14,121,468 | | | | 26.64 | % |
| | | | | | | | | | | | | | |
| | Information Technology – 6.30% | | | | | | | | | | | | |
| | Keyence Corp. | | | 6,900 | | | | 3,343,621 | | | | 6.30 | % |
The accompanying notes are an integral part of these financial statements.
| | COMMON STOCKS | | Number | | | | | | % of | |
| | | | of Shares | | | Value | | | Net Assets | |
| | Materials – 4.81% | | | | | | | | | |
| | Fuji Seal International, Inc. | | | 84,600 | | | $ | 2,550,149 | | | | 4.81 | % |
| | | | | | | | | | | | | | |
| | Total Common Stocks | | | | | | | | | | | | |
| | (Cost $39,751,520) | | | | | | | 53,762,807 | | | | 101.41 | % |
| | | | | | | | | | | | | | |
| | Total Investments | | | | | | | | | | | | |
| | (Cost $39,751,520) – 101.41% | | | | | | | 53,762,807 | | | | 101.41 | % |
| | Liabilities in Excess of | | | | | | | | | | | | |
| | Other Assets – (1.41)% | | | | | | | (749,248 | ) | | | (1.41 | )% |
| | TOTAL NET ASSETS – 100.00% | | | | | | $ | 53,013,559 | | | | 100.00 | % |
Percentages are stated as a percent of net assets.
The accompanying notes are an integral part of these financial statements.
HENNESSY FUNDS 1-800-966-4354
Summary of Fair Value Exposure at October 31, 2014
The following is a summary of the inputs used to value the Fund’s net assets as of October 31, 2014 (See Note 3 in the accompanying notes to the financial statements):
| Common Stocks | | Level 1 | | | Level 2 | | | Level 3 | | | Total | |
| Consumer Discretionary | | $ | — | | | $ | 15,632,909 | | | $ | — | | | $ | 15,632,909 | |
| Consumer Staples | | | — | | | | 8,142,211 | | | | — | | | | 8,142,211 | |
| Financials | | | — | | | | 2,914,494 | | | | — | | | | 2,914,494 | |
| Health Care | | | — | | | | 7,057,955 | | | | — | | | | 7,057,955 | |
| Industrials | | | — | | | | 14,121,468 | | | | — | | | | 14,121,468 | |
| Information Technology | | | — | | | | 3,343,621 | | | | — | | | | 3,343,621 | |
| Materials | | | — | | | | 2,550,149 | | | | — | | | | 2,550,149 | |
| Total Common Stocks | | $ | — | | | $ | 53,762,807 | | | $ | — | | | $ | 53,762,807 | |
| Total Investments | | $ | — | | | $ | 53,762,807 | | | $ | — | | | $ | 53,762,807 | |
Transfers between levels are recognized at the end of the reporting period. During the one-year period ended October 31, 2014, the Fund recognized significant transfers between Levels 1 and 2.
Transfers between Level 1 and Level 2 relate to the use of a fair valuation pricing service. On days when the fair valuation pricing service is used, non-U.S. dollar denominated securities move from a Level 1 to a Level 2 classification. 100% of common stocks held at October 31, 2013 were classified as Level 1. Such securities still held at October 31, 2014 were transferred to Level 2 due to the use of the fair value pricing service as described in Note 3. Other than transfers due to the use of the fair value pricing service, no transfers were recognized.
The accompanying notes are an integral part of these financial statements.
Financial Statements
Statement of Assets and Liabilities as of October 31, 2014 |
| ASSETS: | | | |
| Investments in securities, at value (cost $39,751,520) | | $ | 53,762,807 | |
| Dividends and interest receivable | | | 317,916 | |
| Receivable for fund shares sold | | | 527,388 | |
| Prepaid expenses and other assets | | | 18,663 | |
| Total Assets | | | 54,626,774 | |
| | | | | |
| LIABILITIES: | | | | |
| Loan payable | | | 1,457,846 | |
| Payable for fund shares redeemed | | | 54,360 | |
| Payable to advisor | | | 47,996 | |
| Payable to administrator | | | 12,403 | |
| Payable to auditor | | | 19,144 | |
| Accrued service fees | | | 2,730 | |
| Accrued trustees fees | | | 2,249 | |
| Accrued expenses and other payables | | | 16,487 | |
| Total Liabilities | | | 1,613,215 | |
| NET ASSETS | | $ | 53,013,559 | |
| | | | | |
| NET ASSETS CONSIST OF: | | | | |
| Capital stock | | $ | 72,276,480 | |
| Accumulated net realized loss on investments | | | (33,261,525 | ) |
| Unrealized net appreciation on investments | | | 13,998,604 | |
| Total Net Assets | | $ | 53,013,559 | |
| | | | | |
| NET ASSETS | | | | |
| Investor Class: | | | | |
| Shares authorized (no par value) | | Unlimited | |
| Net assets applicable to outstanding Investor Class shares | | $ | 27,263,994 | |
| Shares issued and outstanding | | | 1,252,387 | |
| Net asset value, offering price and redemption price per share | | $ | 21.77 | |
| | | | | |
| Institutional Class: | | | | |
| Shares authorized (no par value) | | Unlimited | |
| Net assets applicable to outstanding Institutional Class shares | | $ | 25,749,565 | |
| Shares issued and outstanding | | | 1,162,736 | |
| Net asset value, offering price and redemption price per share | | $ | 22.15 | |
The accompanying notes are an integral part of these financial statements.
HENNESSY FUNDS 1-800-966-4354
Financial Statements
Statement of Operations for the year ended October 31, 2014 |
| INVESTMENT INCOME: | | | |
Dividend income(1) | | $ | 730,652 | |
| Interest income | | | 323 | |
| Total investment income | | | 730,975 | |
| | | | | |
| EXPENSES: | | | | |
| Investment advisory fees (See Note 5) | | | 458,458 | |
| Administration, fund accounting, custody and transfer agent fees | | | 81,654 | |
| Sub-transfer agent expenses – Investor Class (See Note 5) | | | 55,742 | |
| Sub-transfer agent expenses – Institutional Class (See Note 5) | | | 9,552 | |
| Federal and state registration fees | | | 35,786 | |
| Service fees – Investor Class (See Note 5) | | | 32,499 | |
| Compliance expense | | | 21,488 | |
| Audit fees | | | 21,301 | |
| Reports to shareholders | | | 12,713 | |
| Trustees’ fees and expenses | | | 8,844 | |
| Interest expense (See Note 6) | | | 5,159 | |
| Legal fees | | | 2,348 | |
| Other expenses | | | 8,084 | |
| Total expenses | | | 753,628 | |
| NET INVESTMENT LOSS | | $ | (22,653 | ) |
| | | | | |
| REALIZED AND UNREALIZED GAINS (LOSSES): | | | | |
| Net realized gain on investments | | $ | 35,041 | |
| Net change in unrealized appreciation on investments | | | 4,120,841 | |
| Net gain on investments | | | 4,155,882 | |
| NET INCREASE IN NET ASSETS RESULTING FROM OPERATIONS | | $ | 4,133,229 | |
| (1) | Net of foreign taxes withheld of $103,949. |
The accompanying notes are an integral part of these financial statements.
Financial Statements
| Statements of Changes in Net Assets |
| | | Year Ended | | | Year Ended | |
| | | October 31, 2014 | | | October 31, 2013 | |
| OPERATIONS: | | | | | | |
| Net investment loss | | $ | (22,653 | ) | | $ | (84,313 | ) |
| Net realized gain on investments | | | 35,041 | | | | 16,814 | |
| Net change in unrealized appreciation on investments | | | 4,120,841 | | | | 6,419,308 | |
| Net increase in net assets resulting from operations | | | 4,133,229 | | | | 6,351,809 | |
| | | | | | | | | |
| DISTRIBUTIONS TO SHAREHOLDERS FROM: | | | | | | | | |
| Return on capital | | | | | | | | |
| Investor Class | | | — | | | | (7,343 | ) |
| Institutional Class | | | — | | | | (5,524 | ) |
| Total distributions | | | — | | | | (12,867 | ) |
| | | | | | | | | |
| CAPITAL SHARE TRANSACTIONS: | | | | | | | | |
| Proceeds from shares subscribed – Investor Class | | | 36,361,617 | | | | 34,783,512 | |
| Proceeds from shares subscribed – Institutional Class | | | 17,108,322 | | | | 2,373,930 | |
| Dividends reinvested – Investor Class | | | — | | | | 7,134 | |
| Dividends reinvested – Institutional Class | | | — | | | | 5,425 | |
| Cost of shares redeemed – Investor Class | | | (42,817,348 | ) | | | (18,430,840 | ) |
| Cost of shares redeemed – Institutional Class | | | (2,165,295 | ) | | | (4,003,290 | ) |
| Net increase in net assets derived | | | | | | | | |
| from capital share transactions | | | 8,487,296 | | | | 14,735,871 | |
| TOTAL INCREASE IN NET ASSETS | | | 12,620,525 | | | | 21,074,813 | |
| | | | | | | | | |
| NET ASSETS: | | | | | | | | |
| Beginning of year | | | 40,393,034 | | | | 19,318,221 | |
| End of year | | $ | 53,013,559 | | | $ | 40,393,034 | |
| Undistributed net investment loss, end of year | | $ | — | | | $ | (120,450 | ) |
| | | | | | | | | |
| CHANGES IN SHARES OUTSTANDING: | | | | | | | | |
| Shares sold – Investor Class | | | 1,798,658 | | | | 1,961,023 | |
| Shares sold – Institutional Class | | | 815,136 | | | | 126,165 | |
| Shares issued to holders as reinvestment | | | | | | | | |
| of dividends – Investor Class | | | — | | | | 459 | |
| Shares issued to holders as reinvestment | | | | | | | | |
| of dividends – Institutional Class | | | — | | | | 344 | |
| Shares redeemed – Investor Class | | | (2,137,867 | ) | | | (1,043,924 | ) |
| Shares redeemed – Institutional Class | | | (106,517 | ) | | | (245,080 | ) |
| Net increase in shares outstanding | | | 369,410 | | | | 798,987 | |
The accompanying notes are an integral part of these financial statements.
HENNESSY FUNDS 1-800-966-4354
Financial Statements
For an Investor Class share outstanding throughout each year
PER SHARE DATA:
Net asset value, beginning of year
Income from investment operations:
Net investment loss
Net realized and unrealized gains on investments
Total from investment operations
Less distributions:
Dividends from net investment income
Dividends from return of capital
Total distributions
Paid-in capital from redemption fees
Net asset value, end of year
TOTAL RETURN
SUPPLEMENTAL DATA AND RATIOS:
Net assets, end of year (millions)
Ratio of expenses to average net assets:
Before expense reimbursement
After expense reimbursement
Ratio of net investment loss to average net assets:
Before expense reimbursement
After expense reimbursement
Portfolio turnover rate(1)
| (1) | Portfolio turnover is calculated on the basis of the Fund as a whole. |
The accompanying notes are an integral part of these financial statements.
| Year Ended October 31, | |
| 2014 | | | 2013 | | | 2012 | | | 2011 | | | 2010 | |
| | | | | | | | | | | | | | |
| $ | 19.68 | | | $ | 15.40 | | | $ | 13.99 | | | $ | 12.58 | | | $ | 11.38 | |
| | | | | | | | | | | | | | | | | | | |
| | | | | | | | | | | | | | | | | | | |
| | (0.06 | ) | | | (0.04 | ) | | | (0.02 | ) | | | (0.10 | ) | | | (0.04 | ) |
| | 2.15 | | | | 4.33 | | | | 1.43 | | | | 1.51 | | | | 1.25 | |
| | 2.09 | | | | 4.29 | | | | 1.41 | | | | 1.41 | | | | 1.21 | |
| | | | | | | | | | | | | | | | | | | |
| | | | | | | | | | | | | | | | | | | |
| | — | | | | — | | | | — | | | | — | | | | (0.01 | ) |
| | — | | | | (0.01 | ) | | | — | | | | — | | | | (0.01 | ) |
| | — | | | | (0.01 | ) | | | — | | | | — | | | | (0.02 | ) |
| | — | | | | — | | | | — | | | | — | | | | 0.01 | |
| $ | 21.77 | | | $ | 19.68 | | | $ | 15.40 | | | $ | 13.99 | | | $ | 12.58 | |
| | | | | | | | | | | | | | | | | | | |
| | 10.62 | % | | | 27.87 | % | | | 10.08 | % | | | 11.21 | % | | | 11.04 | % |
| | | | | | | | | | | | | | | | | | | |
| | | | | | | | | | | | | | | | | | | |
| $ | 27.26 | | | $ | 31.32 | | | $ | 10.38 | | | $ | 14.81 | | | $ | 20.01 | |
| | | | | | | | | | | | | | | | | | | |
| | 1.70 | % | | | 1.90 | % | | | 2.03 | % | | | 1.86 | % | | | 1.71 | % |
| | 1.70 | % | | | 1.90 | % | | | 2.03 | % | | | 1.86 | % | | | 1.59 | % |
| | | | | | | | | | | | | | | | | | | |
| | (0.18 | )% | | | (0.35 | )% | | | (0.09 | )% | | | (0.54 | )% | | | (0.27 | )% |
| | (0.18 | )% | | | (0.35 | )% | | | (0.09 | )% | | | (0.54 | )% | | | (0.15 | )% |
| | 22 | % | | | 6 | % | | | 2 | % | | | 166 | % | | | 8 | % |
The accompanying notes are an integral part of these financial statements.
HENNESSY FUNDS 1-800-966-4354
Financial Statements
For an Institutional Class share outstanding throughout each year
PER SHARE DATA:
Net asset value, beginning of year
Income from investment operations:
Net investment income (loss)
Net realized and unrealized gains on investments
Total from investment operations
Less distributions:
Dividends from net investment income
Dividends from return of capital
Total distributions
Net asset value, end of year
TOTAL RETURN
SUPPLEMENTAL DATA AND RATIOS:
Net assets, end of year (millions)
Ratio of expenses to average net assets:
Before expense reimbursement
After expense reimbursement
Ratio of net investment income (loss) to average net assets:
Before expense reimbursement
After expense reimbursement
Portfolio turnover rate(1)
| (1) | Portfolio turnover is calculated on the basis of the Fund as a whole. |
The accompanying notes are an integral part of these financial statements.
| Year Ended October 31, | |
| 2014 | | | 2013 | | | 2012 | | | 2011 | | | 2010 | |
| | | | | | | | | | | | | | |
| $ | 19.98 | | | $ | 15.60 | | | $ | 14.14 | | | $ | 12.66 | | | $ | 11.44 | |
| | | | | | | | | | | | | | | | | | | |
| | | | | | | | | | | | | | | | | | | |
| | 0.07 | | | | (0.03 | ) | | | 0.02 | | | | 0.03 | | | | 0.01 | |
| | 2.10 | | | | 4.42 | | | | 1.44 | | | | 1.45 | | | | 1.23 | |
| | 2.17 | | | | 4.39 | | | | 1.46 | | | | 1.48 | | | | 1.24 | |
| | | | | | | | | | | | | | | | | | | |
| | | | | | | | | | | | | | | | | | | |
| | — | | | | — | | | | — | | | | — | | | | (0.01 | ) |
| | — | | | | (0.01 | ) | | | — | | | | — | | | | (0.01 | ) |
| | — | | | | (0.01 | ) | | | — | | | | — | | | | (0.02 | ) |
| $ | 22.15 | | | $ | 19.98 | | | $ | 15.60 | | | $ | 14.14 | | | $ | 12.66 | |
| | | | | | | | | | | | | | | | | | | |
| | 10.86 | % | | | 28.19 | % | | | 10.33 | % | | | 11.69 | % | | | 11.07 | % |
| | | | | | | | | | | | | | | | | | | |
| | | | | | | | | | | | | | | | | | | |
| $ | 25.75 | | | $ | 9.07 | | | $ | 8.94 | | | $ | 9.70 | | | $ | 23.57 | |
| | | | | | | | | | | | | | | | | | | |
| | 1.50 | % | | | 1.66 | % | | | 1.85 | % | | | 1.64 | % | | | 1.45 | % |
| | 1.50 | % | | | 1.66 | % | | | 1.85 | % | | | 1.64 | % | | | 1.40 | % |
| | | | | | | | | | | | | | | | | | | |
| | 0.26 | % | | | (0.20 | )% | | | 0.13 | % | | | 0.19 | % | | | 0.02 | % |
| | 0.26 | % | | | (0.20 | )% | | | 0.13 | % | | | 0.19 | % | | | 0.07 | % |
| | 22 | % | | | 6 | % | | | 2 | % | | | 166 | % | | | 8 | % |
The accompanying notes are an integral part of these financial statements.
HENNESSY FUNDS 1-800-966-4354
Financial Statements
Notes to Financial Statements October 31, 2014 |
1). ORGANIZATION
The Hennessy Japan Fund (the “Fund”) is a series of Hennessy Funds Trust (the “Trust”), which was organized as a Delaware statutory trust on September 17, 1992. The Fund is an open-end management investment company registered under the Investment Company Act of 1940, as amended. The Fund is a successor to a fund with the same name (the “Predecessor Fund”) that was a series of Hennessy SPARX Funds Trust, a Massachusetts business trust, pursuant to a reorganization that took place after the close of business on February 28, 2014. Prior to February 28, 2014, the Fund had no investment operations. As a result of the reorganization, holders of the Investor Class shares of the Predecessor Fund received Investor Class shares of the Fund (the Investor Class shares of the Fund are the successor to the accounting and performance information of the Predecessor Fund), and holders of the Institutional Class shares of the Predecessor Fund received Institutional Class shares of the Fund (the Institutional Class shares of the Fund are the successor to the accounting and performance information of the Predecessor Fund). The investment objective of the Fund is long-term capital appreciation. The Fund is a diversified fund, but may employ a relatively focused investment strategy and may hold securities of fewer issuers than other diversified funds.
The Fund offers Investor Class and Institutional Class shares. Prior to October 26, 2012, the Investor Class shares were known as Original Class shares. Each class of shares differs principally in its respective administration, 12b-1 distribution and service fees, shareholder servicing, and transfer agent expenses and sales charges, if any. Each class has identical rights to earnings, assets, and voting privileges, except for class-specific expenses and exclusive rights to vote on matters affecting only an individual class.
2). SIGNIFICANT ACCOUNTING POLICIES
The following is a summary of significant accounting policies consistently followed by the Fund in the preparation of the financial statements. These policies are in conformity with U.S. generally accepted accounting principles (“GAAP”).
| a). | Investment Valuation – All investments in securities are recorded at their estimated fair value, as described in Note 3. |
| b). | Federal Income Taxes – Provision for federal income taxes or excise taxes has not been made since the Fund has elected to be taxed as a “regulated investment company” and intends to distribute substantially all of its taxable income to its shareholders and otherwise comply with the provisions of the Internal Revenue Code of 1986, as amended, applicable to regulated investment companies. Net investment income or loss and realized gains and losses for federal income tax purposes may differ from that reported on the financial statements because of temporary book and tax basis differences. Temporary differences are primarily the result of the treatment of wash sales for tax reporting purposes. Distributions from net realized gains for book purposes may include short-term capital gains, which are included as ordinary income to shareholders for tax purposes. |
| | Due to inherent differences in the recognition of income, expenses, and realized gains/losses under GAAP and federal income tax regulations, permanent differences between book and tax basis reporting for the 2014 fiscal year have been identified |
| | and appropriately reclassified on the Statement of Assets and Liabilities. The adjustments are as follow: |
| Undistributed | Accumulated | |
| Net Investment | Net Realized | |
| Income/(Loss) | Gain/(Loss) | Paid-in Capital |
| $143,103 | $45,220 | $(188,323) |
| c). | Income and Expenses – Dividend income is recognized on the ex-dividend date or as soon as information is available to the Fund. Interest income, which includes the amortization of premium and accretion of discount, is recognized on an accrual basis. The Fund is charged for those expenses that are directly attributable to the portfolio, such as advisory, administration, and certain shareholder service fees. Income, expenses (other than expenses attributable to a specific class), and realized and unrealized gains or losses on investments are allocated to each class of shares based on its respective net assets. |
| d). | Distributions to Shareholders – Dividends from net investment income for the Fund, if any, are declared and paid out annually, usually in December. Distributions of net realized capital gains, if any, are declared and paid annually, usually in November or December. |
| e). | Security Transactions – Investment and shareholder transactions are recorded on the trade date. The Fund determines the gain or loss realized from the investment transactions by comparing the original cost of the security lot sold with the net sale proceeds. Discounts and premiums on securities purchased are accreted/amortized over the life of the respective security. |
| f). | Use of Estimates – The preparation of financial statements in conformity with GAAP requires management to make estimates and assumptions that affect the reported amounts of assets and liabilities and disclosure of contingent assets and liabilities at the date of the financial statements and the reported change in net assets during the reporting period. Actual results could differ from those estimates. |
| g). | Share Valuation – The net asset value (“NAV”) per share of the Fund is calculated by dividing the sum of the value of the securities held by the Fund, plus cash or other assets, minus all liabilities (including estimated accrued expenses) by the total number of shares outstanding for the Fund, rounded to the nearest cent. The Fund’s shares will not be priced on days the New York Stock Exchange is closed for trading. The offering and redemption price per share for the Fund is equal to the Fund’s NAV per share. |
| h). | Foreign Currency – Values of investments denominated in foreign currencies, if any, are converted into U.S. dollars using the spot market rate of exchange at the time of valuation. Purchases and sales of investments and income are translated into U.S. dollars using the spot market rate of exchange prevailing on the respective dates of such transactions. The Fund does not isolate the portion of the results of operations resulting from fluctuations in foreign exchange rates on investments from fluctuations resulting from changes in the market prices of securities held. Such fluctuations are included with the net realized and unrealized gain or loss on investments. Foreign investments present additional risks due to currency fluctuations, economic and political factors, lower liquidity, government regulations, differences in accounting standards, and other factors. |
| i). | Forward Contracts – The Fund may enter into forward currency contracts to reduce its exposure to changes in foreign currency exchange rates on its foreign holdings |
HENNESSY FUNDS 1-800-966-4354
| | and to lock in the U.S. dollar cost of firm purchase and sale commitments for securities denominated in foreign currencies. A forward currency contract is a commitment to purchase or sell a foreign currency at a future date at a negotiated forward rate. The gain or loss arising from the difference between the U.S. dollar cost of the original contract and the value of the foreign currency in U.S. dollars upon closing of such contract is included in net realized gain or loss from foreign currency transactions. During the fiscal year ended October 31, 2014, the Fund did not enter into any forward contracts. |
| j). | Repurchase Agreements – The Fund may enter into repurchase agreements with member banks or security dealers of the Federal Reserve Board whom the investment advisor deems creditworthy. The repurchase price generally equals the price paid by the Fund plus interest negotiated on the basis of current short-term rates. |
| | Securities pledged as collateral for repurchase agreements are held by the custodian bank until the respective agreements mature. Provisions of the repurchase agreements ensure that the market value of the collateral, including accrued interest thereon, is sufficient to cover the repurchase amount in the event of default of the counterparty. If the counterparty defaults and the value of the collateral declines or if the counterparty enters an insolvency proceeding, realization of the collateral by the Fund may be delayed or limited. |
| k). | Accounting for Uncertainty in Income Taxes – The Fund has adopted accounting policies regarding recognition and measurement of tax positions taken or expected to be taken on a tax return. The tax returns of the Fund for the prior three fiscal years are open for examination. The Fund has reviewed all open tax years in major jurisdictions and concluded that there is no impact on the Fund’s net assets and no tax liability resulting from unrecognized tax benefits relating to uncertain income tax positions taken or expected to be taken on a tax return. The Fund’s major tax jurisdictions are U.S. federal and Delaware. |
| l). | Derivatives – The Fund may invest in, or enter into, derivatives, such as options, futures contracts, options on futures contracts, and swaps, for a variety of reasons, including to hedge certain risks, to provide a substitute for purchasing or selling particular securities, or to increase potential income gain. Derivatives may provide a cheaper, quicker, or more specifically focused way for a Fund to invest than “traditional” securities would. The main purpose of utilizing these derivative instruments is for hedging purposes. |
| | The Fund has adopted the financial accounting reporting rules as required by the Derivatives and Hedging Topic of the Financial Accounting Standards Board Accounting Standards Codification. Under such rules, the Fund is required to include enhanced disclosure that enables investors to understand how and why an entity uses derivatives, how derivatives are accounted for, and how derivatives instruments affect an entity’s results of operations and financial position. During the fiscal year ended October 31, 2014, the Fund did not hold any derivative instruments. |
| m). | Events Subsequent to the Fiscal Period End – The Fund has adopted financial reporting rules regarding subsequent events that require an entity to recognize in the financial statements the effects of all subsequent events that provide additional evidence about conditions that existed at the date of the balance sheet. Management has evaluated the Fund’s related events and transactions that occurred subsequent to October 31, 2014 through the date of issuance of the Fund’s financial statements. There were no events or transactions that occurred during this period that materially impacted the amounts or disclosures in the Fund’s financial statements. |
3). SECURITIES VALUATION
The Fund has adopted authoritative fair valuation accounting standards that establish an authoritative definition of fair value and set out a hierarchy for measuring fair value. These standards require additional disclosures about the various inputs and valuation techniques used to develop the measurements of fair value and a discussion in changes in valuation techniques and related inputs during the period. These inputs are summarized in the three broad levels listed below:
| | Level 1 – | Quoted unadjusted prices for identical instruments in active markets to which the Fund has access at the date of measurement. |
| | Level 2 – | Quoted prices for similar instruments in active markets; quoted prices for identical or similar instruments in markets that are not active; and model-derived valuations in which all significant inputs and significant value drivers are observable in active markets. Level 2 inputs are those in markets for which there are few transactions, the prices are not current, the prices are fair value adjusted due to post-market close subsequent events (foreign markets), little public information exists, or instances where prices vary substantially over time or among brokered market makers. These inputs may also include interest rates, prepayment speeds, credit risk curves, default rates, and similar data. |
| | Level 3 – | Model-derived valuations in which one or more significant inputs or significant value drivers are unobservable. Unobservable inputs are those inputs that reflect the Fund’s own assumptions about what market participants would use to price the asset or liability based on the best available information. |
Following is a description of the valuation techniques applied to the Fund’s major categories of assets and liabilities measured at fair value on a recurring basis.
Equity Securities – Equity securities, including common stocks, preferred stocks, foreign issued common stocks, exchange traded funds, closed-end mutual funds, and real estate investment trusts, that are traded on a securities exchange for which a last-quoted sales price is readily available will generally be valued at the last sales price as reported by the primary exchange on which the securities are listed. Securities listed on The NASDAQ Stock Market (“NASDAQ”) will be valued at the NASDAQ Official Closing Price, which may differ from the last sales price reported. Securities traded on a securities exchange for which a last-quoted sales price is not readily available will generally be valued at the mean between the bid and ask prices. To the extent these securities are actively traded and valuation adjustments are not applied, they are classified in Level 1 of the fair value hierarchy.
Investment Companies – Investments in investment companies (e.g., mutual funds and exchange traded funds) are generally priced at the ending NAV provided by the Fund’s service agent and will be classified in Level 1 of the fair value hierarchy.
Debt Securities – Debt securities, including corporate bonds, asset-backed securities, mortgage-backed securities, municipal bonds, U.S. Treasuries, and U.S. government agency issues, are valued at market on the basis of valuations furnished by an independent pricing service that utilizes both dealer-supplied valuations and formula-based techniques. The pricing service may consider recently executed transactions in securities of the issuer or comparable issuers, market price quotations (where observable), bond spreads, and fundamental data relating to the issuer. In addition, the model may incorporate market observable data such as reported sales of similar securities, broker quotes, yields, bids, offers, and reference data. Certain securities are valued principally using dealer quotations. These securities are generally classified in Level 2 of the fair value hierarchy.
HENNESSY FUNDS 1-800-966-4354
Short-Term Securities – Short-term equity investments, including money market funds, are valued in the manner specified above. Short-term debt investments are generally valued at amortized cost, which approximates fair market value, if their original maturity was 60 days or less, or by amortizing the values as of the 61st day prior to maturity, if their original term to maturity exceeded 60 days. Amortized cost is not used if its use would be inappropriate due to credit or other impairments of the issuer, in which the security would be fair valued, as described below. Short-term securities are generally classified in Level 1 or Level 2 of the fair market hierarchy depending on the inputs used and market activity levels for specific securities.
The Board of Trustees of the Fund (the “Board”) has adopted fair value pricing procedures that are followed when a price for a security is not readily available or if a significant event has occurred that indicates the closing price of a security no longer represents the true value of that security. Fair value pricing determinations are made in good faith in accordance with these procedures. There are numerous criteria that will be given consideration in determining a fair value of a security. Some of these criteria are trading volume of security and markets, the value of other like securities, and news events with direct bearing to security or market. Fair value pricing results in an estimated price for a security that reflects the amount the Fund might reasonably expect to receive in a current sale. Depending on the relative significance of the valuation inputs, these securities may be classified in either Level 2 or Level 3 of the fair value hierarchy.
Fair valuing of foreign securities may be determined with the assistance of a pricing service using correlations between the movement of prices of such securities and indices of domestic securities and other appropriate indicators, such as closing market prices of relevant American Depositary Receipts or futures contracts. The effect of using fair value pricing is that the Fund’s NAV will reflect the affected portfolio securities’ value as determined in the judgment of the Board or its designee instead of being determined by the market. Using a fair value pricing methodology to price foreign securities may result in a value that is different from a foreign security’s most recent closing price and from the prices used by other investment companies to calculate their NAVs and are generally considered Level 2 prices in the fair valuation hierarchy. Because the Fund may invest in foreign securities, the value of the Fund’s portfolio securities may change on days when you will not be able to purchase or redeem your shares.
The Board has delegated day-to-day valuation matters to a Valuation Committee comprised of one or more representatives from Hennessy Advisors, Inc., the Fund’s investment advisor. The function of the Valuation Committee is to value securities where current and reliable market quotations are not readily available. All actions taken by the Valuation Committee are reviewed by the Board.
The Fund has performed an analysis of all existing investments to determine the significance and character of all inputs to their fair value determination. Various inputs are used in determining the value of the Fund’s investments. The inputs or methodology used for valuing securities are not necessarily an indication of the risk associated with investing in those securities. Details related to the fair valuation hierarchy of the Fund’s securities as of October 31, 2014 are included in the Fund’s Schedule of Investments.
4). INVESTMENT TRANSACTIONS
Purchases and sales of investment securities (excluding government and short-term investments) for the Fund during the fiscal year ended October 31, 2014 were $20,677,144 and $9,651,499, respectively.
There were no purchases or sales/maturities of long-term U.S. Government Securities for the Fund during the fiscal year ended October 31, 2014.
5). INVESTMENT MANAGEMENT FEE AND OTHER TRANSACTIONS WITH AFFILIATES
Hennessy Advisors, Inc. (the “Advisor”) is the investment advisor of the Fund. The Advisor provides the Fund with investment management services under an Investment Advisory Agreement. The Advisor furnishes all investment advice, office space, facilities, and provides most of the personnel needed by the Fund. As compensation for its services, the Advisor is entitled to a monthly fee from the Fund. The fee is based upon the average daily net assets of the Fund at the annual rate of 1.00%. The net investment advisory fees payable for the Fund as of October 31, 2014 were $47,996.
The Advisor has delegated the day-to-day management of the Fund to a sub-advisor, SPARX Asset Management Co., Ltd. The Advisor pays the sub-advisor fees for the Fund from its own assets and these fees are not an additional expense of the Fund.
The Board has approved a Shareholder Servicing Agreement for the Investor Class shares of the Fund, which was instituted to compensate the Advisor for the non-investment management services it provides to the Fund. The Shareholder Servicing Agreement provides for a monthly fee paid to the Advisor at an annual rate of 0.10% of the average daily net assets of the Fund attributable to Investor Class shares. Shareholder service fees payable for the Fund as of October 31, 2014 were $2,730.
The Fund has entered into agreements with various brokers, dealers, and financial intermediaries in connection with the sale of shares of the Fund. The agreements provide for periodic payments by the Fund to the brokers, dealers, and financial intermediaries for providing certain shareholder maintenance services (sub-transfer agent expenses). These shareholder services include the pre-processing and quality control of new accounts, shareholder correspondence, answering customer inquiries regarding account status, and facilitating shareholder telephone transactions. Fees paid by the Fund to various brokers, dealers, and financial intermediaries for the fiscal year ended October 31, 2014 were $65,294.
U.S. Bancorp Fund Services, LLC (“USBFS”) provides the Fund with administrative, fund accounting, and transfer agent services, including all regulatory reporting, and necessary office equipment and personnel. As administrator, USBFS prepares various federal and state regulatory filings, reports, and returns for the Fund; prepares reports and materials to be supplied to the Board; monitors the activities of the Fund’s custodian, transfer agent, and accountants; and coordinates the preparation and payment of the Fund’s expenses and reviews the Fund’s expense accruals. Fees paid to USBFS for the fiscal year ended October 31, 2014 were $81,654.
U.S. Bank, N.A., an affiliate of USBFS, serves as the Fund’s custodian. Quasar Distributors, LLC acts as the Fund’s principal underwriter in a continuous public offering of the Fund’s shares. Quasar Distributors, LLC is an affiliate of USBFS and U.S. Bank, N.A.
6). LINE OF CREDIT
The Fund has a line of credit with the other funds in the Hennessy Funds family of funds (the “Hennessy Funds”) in the amount of the lesser of (i) $100,000,000 or (ii) 33.33% of each Hennessy Fund’s net assets, or 30% for the Hennessy Gas Utility Index Fund and 10% for the Hennessy Balanced Fund, intended to provide short-term financing, if necessary, subject to certain restrictions, in connection with shareholder redemptions. The credit facility is with the Hennessy Funds’ custodian bank, U.S. Bank, N.A. Borrowings under this arrangement bear interest at the bank’s prime rate. During the fiscal year ended October 31, 2014, the Fund had an outstanding average daily balance and a weighted average interest rate of $157,142 and 3.25%, respectively. The maximum amount outstanding for the Fund during the period was $8,288,000. At October 31, 2014, the Fund had a loan payable of $1,457,846.
HENNESSY FUNDS 1-800-966-4354
7). FEDERAL TAX INFORMATION
As of October 31, 2014, the components of accumulated earnings (losses) for income tax purposes were as follow:
| | Cost of investments for tax purposes | | $ | 39,832,779 | |
| | Gross tax unrealized appreciation | | $ | 14,779,228 | |
| | Gross tax unrealized depreciation | | | (849,200 | ) |
| | Net tax unrealized appreciation | | $ | 13,930,028 | |
| | Undistributed ordinary income | | $ | — | |
| | Undistributed long-term capital gains | | | — | |
| | Total distributable earnings | | $ | — | |
| | Other accumulated loss | | $ | (33,192,949 | ) |
| | Total accumulated loss | | $ | (19,262,921 | ) |
The difference between book-basis and tax-basis unrealized appreciation is attributable primarily to wash sales.
At October 31, 2014, the Fund had capital loss carryforwards that expire as follow:
| | $ | 4,786,618 | | 10/31/15 |
| | $ | 6,231,544 | | 10/31/16 |
| | $ | 15,450,664 | | 10/31/17 |
| | $ | 6,121,138 | | 10/31/18 |
| | $ | 417,070 | | Indefinite ST |
| | $ | 173,232 | | Indefinite LT |
During the year ended October 31, 2014, the capital loss carry forwards utilized for the Fund were $702,536.
Capital losses sustained in the year ended October 31, 2012 and in future taxable years will not expire and may be carried over by the Fund without limitation; however, they will retain the character of the original loss. Furthermore, any loss incurred during those taxable years will be required to be utilized prior to the losses incurred in taxable years prior to 2012. As a result of this ordering rule, pre-enactment capital loss carryforwards may be more likely to expire unused. Under pre-enactment law, capital losses could be carried forward for eight years, and carried forward as short-term capital losses, irrespective of the character of the original loss.
At October 31, 2014, the Fund did not defer, on a tax basis, any post-December late year ordinary loss deferrals.
The tax character of distributions paid during fiscal year 2014 and fiscal year 2013 for the Fund were as follow:
| | | | Year Ended | | | Year Ended | |
| | | | October 31, 2014 | | | October 31, 2013 | |
| | Ordinary income | | $ | — | | | $ | — | |
| | Long-term capital gain | | | — | | | | — | |
| | Return of capital | | | — | | | | 12,867 | |
| | | | $ | — | | | $ | 12,867 | |
8). AGREEMENT AND PLAN OF REORGANIZATION
On December 11, 2013, the Board approved an Agreement and Plan of Reorganization (the “Agreement”), of the Hennessy Japan Fund (the “New Fund”), pursuant to which the New Fund would be a successor to the corresponding series of the same name Hennessy SPARX Funds Trust, a Massachusetts business trust (the “Predecessor Fund”). The Agreement provided for the transfer of assets of the Predecessor Fund to the New Fund and the
assumption of the liabilities of the Predecessor Fund by the New Fund. The New Fund had the same investment objective and substantially similar principal investment strategies as the Predecessor Fund. The reorganization was effective as of the close of business on February 28, 2014. The following table illustrates the specifics of the reorganization:
| | | Shares of the New Fund | | | |
| | Predecessor Fund | Issued to Shareholders of | New Fund | Combined | Tax Status |
| | Net Assets | the Predecessor Fund | Net Assets | Net Assets | of Transfer |
| | $48,645,944(1) | 2,463,074 | $48,645,944 | $48,645,944 | Non-taxable |
| (1) | Included accumulated realized loss and unrealized appreciation in the amounts of $(33,440,043) and $9,954,834, respectively. |
HENNESSY FUNDS 1-800-966-4354
Report of Independent Registered Public Accounting Firm
The Board of Trustees and Shareholders
Hennessy Funds Trust:
We have audited the accompanying statement of assets and liabilities of Hennessy Japan Fund (the Fund), a series of Hennessy Funds Trust (formerly a series of Hennessy SPARX Funds Trust), including the schedule of investments, as of October 31, 2014, and the related statement of operations for the year then ended, the statements of changes in net assets for each of the years in the two-year period then ended, and the financial highlights for each of the years in the five-year period then ended. These financial statements and financial highlights are the responsibility of the Fund’s management. Our responsibility is to express an opinion on these financial statements and financial highlights based on our audits.
We conducted our audits in accordance with the standards of the Public Company Accounting Oversight Board (United States). Those standards require that we plan and perform the audit to obtain reasonable assurance about whether the financial statements and financial highlights are free of material misstatement. An audit includes examining, on a test basis, evidence supporting the amounts and disclosures in the financial statements. Our procedures included confirmation of investments owned as of October 31, 2014, by correspondence with the custodian and brokers or by other appropriate auditing procedures. An audit also includes assessing the accounting principles used and significant estimates made by management, as well as evaluating the overall financial statement presentation. We believe that our audits provide a reasonable basis for our opinion.
In our opinion, the financial statements and financial highlights referred to above present fairly, in all material respects, the financial position of the Fund as of October 31, 2014, and the results of its operations for the year then ended, the changes in its net assets for each of the years in the two-year period then ended, and the financial highlights for each of the years in the five-year period then ended, in conformity with U.S. generally accepted accounting principles.
Milwaukee, Wisconsin
December 30, 2014
Trustees and Officers of the Fund (Unaudited)
The business and affairs of the Fund are managed under the direction of the Fund’s Board of Trustees. Information pertaining to the Trustees and Officers of the Fund is set forth below. The Fund’s Statement of Additional Information includes additional information about the Fund’s Trustees and Officers and is available, without charge, upon request by calling 1-800-966-4354.
| | | | | Number of | |
| | | Term of | | Portfolios | |
| | | Office | | in the | Other |
| | | and | | Fund | Directorships |
| | Position(s) | Length | Principal | Complex | (During Past |
| Name, Address, | Held with | of Time | Occupation(s) | Overseen | Five Years)(2) |
| and Age | the Fund | Served | During Past Five Years | by Trustee | Held by Trustee |
| | | | | | |
| Disinterested Trustees (as defined below) | | |
| | | | | | |
| J. Dennis DeSousa | Trustee | Indefinite, | Mr. DeSousa is a real | 16 | Hennessy SPARX |
| Age: 78 | | until | estate investor. | | Funds Trust; |
| Address: | | successor | | | Hennessy Mutual |
| c/o Hennessy | | elected | | | Funds, Inc.; and |
| Advisors, Inc. | | | | | The Hennessy |
| 7250 Redwood Blvd. | | Served | | | Funds, Inc. |
| Suite 200 | | since | | | |
| Novato, CA 94945 | | January | | | |
| | | 1996 | | | |
| | | for the | | | |
| | | Funds (or | | | |
| | | Predecessor | | | |
| | | Funds) | | | |
| | | | | | |
| Robert T. Doyle | Trustee | Indefinite, | Mr. Doyle has been the | 16 | Hennessy SPARX |
| Age: 67 | | until | Sheriff of Marin County, | | Funds Trust; |
| Address: | | successor | California since 1996. | | Hennessy Mutual |
| c/o Hennessy | | elected | | | Funds, Inc.; and |
| Advisors, Inc. | | | | | The Hennessy |
| 7250 Redwood Blvd. | | Served | | | Funds, Inc. |
| Suite 200 | | since | | | |
| Novato, CA 94945 | | January | | | |
| | | 1996 | | | |
| | | for the | | | |
| | | Funds (or | | | |
| | | Predecessor | | | |
| | | Funds) | | | |
| | | | | | |
| Gerald P. Richardson | Trustee | Indefinite, | Mr. Richardson is an | 16 | Hennessy SPARX |
| Age: 69 | | until | independent consultant | | Funds Trust; |
| Address: | | successor | in the securities industry. | | Hennessy Mutual |
| c/o Hennessy | | elected | | | Funds, Inc.; and |
| Advisors, Inc. | | | | | The Hennessy |
| 7250 Redwood Blvd. | | Served | | | Funds, Inc. |
| Suite 200 | | since | | | |
| Novato, CA 94945 | | May 2004 | | | |
| | | for the | | | |
| | | Funds (or | | | |
| | | Predecessor | | | |
| | | Funds) | | | |
HENNESSY FUNDS 1-800-966-4354
| | | | | Number of | |
| | | Term of | | Portfolios | |
| | | Office | | in the | Other |
| | | and | | Fund | Directorships |
| | Position(s) | Length | Principal | Complex | (During Past |
| Name, Address, | Held with | of Time | Occupation(s) | Overseen | Five Years)(2) |
| and Age | the Fund | Served | During Past Five Years | by Trustee | Held by Trustee |
| | | |
| “Interested Persons” (as defined in the 1940 Act) | | |
| | | | | | |
Neil J. Hennessy(1) | Chief | Trustee: | Mr. Hennessy has been | 16 | Hennessy |
| Age: 58 | Investment | Indefinite, | employed by Hennessy | | Advisors, Inc. |
| Address: | Officer, | until | Advisors, Inc., the Funds’ | | (current); |
| c/o Hennessy | Portfolio | successor | investment advisor, since | | Hennessy SPARX |
| Advisors, Inc. | Manager, | elected | 1989. He currently serves | | Funds Trust; |
| 7250 Redwood Blvd. | President, | | as President, Chairman | | Hennessy Mutual |
| Suite 200 | Trustee | Served | and CEO of Hennessy | | Funds, Inc.; and |
| Novato, CA 94945 | and | since | Advisors, Inc. | | The Hennessy |
| | Chairman | January | | | Funds, Inc. |
| | of the | 1996 | | | |
| | Board | for the | | | |
| | | Funds (or | | | |
| | | Predecessor | | | |
| | | Funds) | | | |
| | | | | | |
| | | Officer: | | | |
| | | 1 year term | | | |
| | | | | | |
| | | Served | | | |
| | | since | | | |
| | | June 2008 | | | |
| | | for the | | | |
| | | Funds (or | | | |
| | | Predecessor | | | |
| | | Funds) | | | |
| | | | | | |
Teresa M. Nilsen(1) | Executive | 1 year term | Ms. Nilsen has been | N/A | N/A |
| Age: 48 | Vice | | employed by Hennessy | | |
| Address: | President | Served | Advisors, Inc., the Funds’ | | |
| c/o Hennessy | and | since | investment advisor, since | | |
| Advisors, Inc. | Treasurer | January | 1989. She currently serves | | |
| 7250 Redwood Blvd. | | 1996 | as Executive Vice President, | | |
| Suite 200 | | for the | Chief Operations Officer, | | |
| Novato, CA 94945 | | Funds (or | Chief Financial Officer, and | | |
| | | Predecessor | Secretary of Hennessy | | |
| | | Funds) | Advisors, Inc. | | |
| (1) | All Officers of the Hennessy Funds and employees of the Manager are Interested Persons of the Funds. |
| (2) | Pursuant to an internal reorganization, the series of Hennessy Mutual Funds, Inc. (“HMFI”), The Hennessy Funds, Inc. (“HFI”) and Hennessy SPARX Funds Trust (“HSFT”) were reorganized into series of Hennessy Funds Trust on February 28, 2014, which mirrored the corresponding series of HFMI, HFI and HSFT. Subsequent to the reorganization, HFMI, HFI and HSFT were dissolved. |
| | | Term of | |
| | | Office | |
| | | and | |
| | Position(s) | Length | Principal |
| Name, Address, | Held with | of Time | Occupation(s) |
| and Age | the Fund | Served | During Past Five Years |
| | | | |
| Interested Persons | | | |
| | | | |
Daniel B. Steadman(1) | Executive | 1 year term | Mr. Steadman has been employed by |
| Age: 58 | Vice President | | Hennessy Advisors, Inc., the Funds’ |
| Address: | and Secretary | Served since | investment advisor, since 2000. |
| c/o Hennessy Advisors, Inc. | | March 2000 | He currently serves as Executive |
| 7250 Redwood Blvd. | | for the Funds (or | Vice President and Chief Compliance |
| Suite 200 | | Predecessor Funds) | Officer of Hennessy Advisors, Inc. |
| Novato, CA 94945 | | | |
| | | | |
Jennifer Cheskiewicz(1) | Senior | 1 year term | Ms. Cheskiewicz has been employed by |
| Age: 37 | Vice President | | Hennessy Advisors, Inc., the Funds’ |
| Address: | and Chief | Served since | investment advisor, since June 2013. |
| c/o Hennessy Advisors, Inc. | Compliance | June 2013 | She previously served as in-house |
| 7250 Redwood Blvd. | Officer | for the Funds (or | counsel to Carlson Capital, L.P., an |
| Suite 200 | | Predecessor Funds) | SEC-registered investment advisor to |
| Novato, CA 94945 | | | several private funds from February |
| | | | 2010 to May 2013. Prior to that, she |
| | | | was an attorney with Gibson, Dunn & |
| | | | Crutcher LLP from September 2005 |
| | | | through February 2010. She currently |
| | | | serves as General Counsel of |
| | | | Hennessy Advisors, Inc. |
| | | | |
Brian Carlson(1) | Senior | 1 year term | Mr. Carlson has been employed by |
| Age: 42 | Vice President | | Hennessy Advisors, Inc., the Funds’ |
| Address: | and Head of | Served since | investment advisor, since |
| c/o Hennessy Advisors, Inc. | Distribution | December 2013 | December 2013. |
| 7250 Redwood Blvd. | | for the Funds (or | |
| Suite 200 | | Predecessor Funds) | Mr. Carlson was previously a |
| Novato, CA 94945 | | | co-founder and principal of Trivium |
| | | | Consultants, LLC from February 2011 |
| | | | through November 2013. Prior to that, |
| | | | he was the Senior Managing Director |
| | | | of NRP Financial, Inc. from August |
| | | | 2007 through February 2011. |
| | | | |
David Ellison(1) | Portfolio Manager | 1 year term | Mr. Ellison has served as Portfolio |
| Age: 56 | and Senior | | Manager of the Large Cap Financial |
| Address: | Vice President | Served since | Fund, the Small Cap Financial Fund, |
| c/o Hennessy Advisors, Inc. | | October 2012 | and the Technology Fund |
| 101 Federal Street | | for the Funds (or | since inception. |
| Suite 1900 | | Predecessor Funds) | |
| Boston, MA 02110 | | | Mr. Ellison previously served as Director, |
| | | | CIO and President of FBR Advisers, Inc. |
| | | | from December 1999 to October 2012. |
| (1) | All Officers of the Hennessy Funds and employees of the Manager are Interested Persons of the Funds. |
HENNESSY FUNDS 1-800-966-4354
| | | Term of | |
| | | Office | |
| | | and | |
| | Position(s) | Length | Principal |
| Name, Address, | Held with | of Time | Occupation(s) |
| and Age | the Fund | Served | During Past Five Years |
| | | | |
| Interested Persons | | | |
| | | | |
Brian Peery(1) | Portfolio Manager | 1 year term | Mr. Peery has been a Portfolio Manager |
| Age: 45 | and | | of the Cornerstone Growth Fund, |
| Address: | Vice President | Served since | the Cornerstone Mid Cap 30 Fund, the |
| c/o Hennessy Advisors, Inc. | | March 2003 | Cornerstone Large Growth Fund, the |
| 7250 Redwood Blvd. | | as Vice President | Cornerstone Value Fund, the Total |
| Suite 200 | | for the Funds (or | Return Fund, and the Balanced Fund |
| Novato, CA 94945 | | Predecessor Funds) | since October 2014. From February |
| | | | 2011 through September 2014, he |
| | | Served since | served as Co-Portfolio Manager of |
| | | February 2011 | the same funds. |
| | | as Co-Portfolio | |
| | | Manager | Mr. Peery has been employed by |
| | | for the Funds (or | Hennessy Advisors, Inc., the Funds’ |
| | | Predecessor Funds) | investment advisor, since 2002. |
| | | | |
Winsor (Skip) Aylesworth(1) | Portfolio Manager | 1 year term | Mr. Aylesworth has been Portfolio |
| Age: 67 | and | | Manager of the Gas Utility Index Fund |
| Address: | Vice President | Served since | since 1998 and Portfolio Manager of |
| c/o Hennessy Advisors, Inc. | | October 2012 | the Technology Fund since inception. |
| 101 Federal Street | | for the Funds (or | |
| Suite 1900 | | Predecessor Funds) | Mr. Aylesworth previously served as |
| Boston, MA 02110 | | | Executive Vice President of The FBR |
| | | | Funds from 1999 to October 2012. |
| | | | |
Ryan Kelley(1) | Portfolio Manager | 1 year term | Mr. Kelley has been a Portfolio Manager |
| Age: 42 | and | | of the Gas Utility Index Fund (formerly |
| Address: | Vice President | Served since | the FBR Gas Utility Index Fund), the |
| c/o Hennessy Advisors, Inc. | | March 2013 | Small Cap Financial Fund (formerly the |
| 1340 Environ Way | | for the Funds (or | FBR Small Cap Financial Fund), and the |
| Chapel Hill, NC 27517 | | Predecessor Funds) | Large Cap Financial Fund (formerly the |
| | | | FBR Large Cap Financial Fund) since |
| | | | October 2014. From March 2013 |
| | | | through September 2014, he served |
| | | | as a Co-Portfolio Manager of the same |
| | | | funds. Prior to that, he was a Portfolio |
| | | | Analyst of the Hennessy Funds. |
| | | | |
| | | | Mr. Kelley previously served as Portfolio |
| | | | Manager of The FBR Funds from |
| | | | January 2008 to October 2012. |
| (1) | All Officers of the Hennessy Funds and employees of the Manager are Interested Persons of the Funds. |
(This Page Intentionally Left Blank.)
HENNESSY FUNDS 1-800-966-4354
Expense Example (Unaudited)
October 31, 2014
As a shareholder of the Fund, you incur two types of costs: (1) transaction costs, including sales charges (loads) on purchase payments, reinvested dividends, or other distributions; redemption fees; and exchange fees; and (2) ongoing costs, including management fees; service fees; and other Fund expenses. This Example is intended to help you understand your ongoing costs (in dollars) of investing in the Fund and to compare these costs with the ongoing costs of investing in other mutual funds. The Example is based on an investment of $1,000 invested at the beginning of the period and held for the entire period from May 1, 2014 through October 31, 2014.
Actual Expenses
The first line of the table below under the “Investor Class” and “Institutional Class” headings provides information about actual account values and actual expenses. Although the Fund charges no sales loads or transaction fees, you will be assessed fees for outgoing wire transfers, returned checks and stop payment orders at prevailing rates charged by U.S. Bancorp Fund Services, LLC, the Fund’s transfer agent. If you request that a redemption be made by wire transfer, currently a $15.00 fee is charged by the Fund’s transfer agent. IRA accounts will be charged a $15.00 annual maintenance fee. The example below includes, but is not limited to, management fees, shareholder servicing fees, fund accounting, custody, and transfer agent fees. However, the example below does not include portfolio trading commissions and related expenses, and other extraordinary expenses as determined under generally accepted accounting principles. You may use the information in this line, together with the amount you invested, to estimate the expenses that you paid over the period. Simply divide your account value by $1,000 (for example, an $8,600 account value divided by $1,000 = 8.6), then multiply the result by the number in the first line of the table under the “Investor Class” and “Institutional Class” headings in the column entitled “Expenses Paid During Period” to estimate the expenses you paid on your account during this period.
Hypothetical Example for Comparison Purposes
The second line of the table below under the “Investor Class” and “Institutional Class” headings provides information about hypothetical account values and hypothetical expenses based on the Fund’s actual expense ratios and an assumed rate of return of 5% per year before expenses, which is not the Fund’s actual return. The hypothetical account values and expenses may not be used to estimate the actual ending account balance or expenses you paid for the period. You may use this information to compare the ongoing costs of investing in the Fund and other funds. To do so, compare this 5% hypothetical example with the 5% hypothetical examples that appear in the shareholder reports of the other funds. Please note that the expenses shown in the table are meant to highlight your ongoing costs only and do not reflect any transactional costs, such as sales charges (loads), or exchange fees. Therefore, the second line of the table under the “Investor Class” and “Institutional Class” headings is useful in comparing ongoing costs only, and will not help you determine the relative total costs of owning different funds. In addition, if these transactional costs were included, your costs would have been higher.
| | Beginning | Ending | Expenses Paid |
| | Account Value | Account Value | During Period(1) |
| | 5/1/14 | 10/31/14 | 5/1/14 – 10/31/14 |
| Investor Class | | | |
| | | | |
| Actual | $1,000.00 | $1,122.70 | $8.77 |
| | | | |
| Hypothetical (5% return | | | |
| before expenses) | $1,000.00 | $1,016.94 | $8.34 |
| | | | |
| Institutional Class | | | |
| | | | |
| Actual | $1,000.00 | $1,123.80 | $7.87 |
| | | | |
| Hypothetical (5% return | | | |
| before expenses) | $1,000.00 | $1,017.80 | $7.48 |
| (1) | Expenses are equal to the Fund’s expense ratio of 1.64% for Investor Class shares or 1.47% for Institutional Class shares, as applicable, multiplied by the average account value over the period, multiplied by 184/365 days (to reflect one-half year period). |
HENNESSY FUNDS 1-800-966-4354
Proxy Voting
A description of the policies and procedures the Fund uses to determine how to vote proxies relating to portfolio securities is available without charge: (1) by calling 1-800-966-4354; (2) on the Hennessy Funds’ website at hennessyfunds.com; or (3) on the U.S. Securities and Exchange Commission’s (the “SEC”) website at www.sec.gov. The Fund’s proxy voting record is available on both the Hennessy Funds’ website at hennessyfunds.com and the SEC’s website at www.sec.gov no later than August 31 for the prior 12 months ending June 30.
Quarterly Filings on Form N-Q
The Fund files its complete schedule of portfolio holdings with the SEC for the first and third quarters of each fiscal year on Form N-Q. The Fund’s Forms N-Q are available on the SEC’s website at www.sec.gov. The Fund’s Forms N-Q may be reviewed and copied at the SEC’s Public Reference Room in Washington, DC and information on the operation of the Public Reference Room may be obtained by calling 1-800-SEC-0330. Information included in the Fund’s Forms N-Q will also be available upon request by calling 1-800-966-4354.
Householding
To help keep the Fund’s costs as low as possible, we generally deliver a single copy of most financial reports and prospectuses to shareholders who share an address, even if the accounts are registered under different names. This process, known as “householding,” does not apply to account statements. You may, of course, request an individual copy of a prospectus or financial report at any time. If you would like to receive separate mailings, please call the Administrator at 1-800-261-6950 or 1-414-765-4124 and we will begin individual delivery within 30 days of your request. If your account is held through a financial institution or other intermediary, please contact them directly to request individual delivery.
Privacy Policy
We collect the following non-public personal information about you:
| | • | information we receive from you on or in applications or other forms, correspondence, or conversations, including, but not limited to, your name, address, phone number, social security number, assets, income and date of birth; |
| | | and |
| | • | information about your transactions with us, our affiliates, or others, including, but not limited to, your account number and balance, payment history, parties to transactions, cost basis information and other financial information. |
We do not disclose any non-public personal information about our current or former shareholders to nonaffiliated third parties, except as permitted by law. For example, we are permitted by law to disclose all of the information we collect, as described above, to our Transfer Agent to process your transactions. Furthermore, we restrict access to your non-public personal information to those persons who require such information to provide products or services to you. We maintain physical, electronic and procedural safeguards that comply with federal standards to guard your non-public personal information.
In the event that you hold shares of the Fund through a financial intermediary, including, but not limited to, a broker-dealer, bank or trust company, the privacy policy of your financial intermediary would govern how your non-public personal information would be shared with nonaffiliated third parties.
HENNESSY FUNDS 1-800-966-4354
(This Page Intentionally Left Blank.)
(This Page Intentionally Left Blank.)
For information, questions or assistance, please call
The Hennessy Funds
1-800-966-4354 or 1-415-899-1555
INVESTMENT ADVISOR
Hennessy Advisors, Inc.
7250 Redwood Blvd., Suite 200
Novato, California 94945
ADMINISTRATOR,
TRANSFER AGENT,
DIVIDEND PAYING AGENT &
SHAREHOLDER SERVICING AGENT
U.S. Bancorp Fund Services, LLC
P.O. Box 701
Milwaukee, Wisconsin 53201-0701
CUSTODIAN
U.S. Bank N.A.
Custody Operations
1555 North River Center Dr., Suite 302
Milwaukee, Wisconsin 53212
TRUSTEES
Neil J. Hennessy
Robert T. Doyle
J. Dennis DeSousa
Gerald P. Richardson
COUNSEL
Foley & Lardner LLP
777 East Wisconsin Avenue
Milwaukee, Wisconsin 53202-5306
INDEPENDENT REGISTERED
PUBLIC ACCOUNTING FIRM
KPMG LLP
777 East Wisconsin Avenue
Milwaukee, Wisconsin 53202-5306
DISTRIBUTOR
Quasar Distributors, LLC
615 East Michigan Street
Milwaukee, Wisconsin 53202
hennessyfunds.com | 1-800-966-4354
This report has been prepared for shareholders and may be distributed to
others only if preceded or accompanied by a current prospectus.
ANNUAL REPORT
OCTOBER 31, 2014
HENNESSY JAPAN SMALL CAP FUND
Investor Class HJPSX
hennessyfunds.com | 1-800-966-4354
(This Page Intentionally Left Blank.)
Contents
| Letter to Shareholders | 2 |
| Performance Overview | 4 |
| Financial Statements | |
| Schedule of Investments | 7 |
| Statement of Assets and Liabilities | 12 |
| Statement of Operations | 13 |
| Statements of Changes in Net Assets | 15 |
| Financial Highlights | 16 |
| Notes to the Financial Statements | 18 |
| Report of Independent Registered Public Accounting Firm | 25 |
| Trustees and Officers of the Fund | 26 |
| Expense Example | 30 |
| Proxy Voting | 32 |
| Quarterly Filings on Form N-Q | 32 |
| Federal Tax Distribution Information | 32 |
| Householding | 32 |
| Privacy Policy | 33 |
HENNESSY FUNDS 1-800-966-4354
December 2014
Dear Shareholder:
As I look back at 2014, I realize that in this age of rapidly evolving technology, information is delivered and absorbed so quickly that it is difficult to remember what happened last week, let alone what’s happened over the course of an entire year. That is why I’d like to take a moment to recall some of the year’s highs and lows, economically, politically and socially, here in the U.S. and around the globe. 2014 was scarred by political partisanship in Washington, civil unrest in the U.S., Ukraine and many other countries, the arrival of terrorist group ISIS, and the frightening outbreak of Ebola. However, there were also positive events this year: In the U.S., we survived a government shutdown over healthcare reform, jobs reports have been consistently, albeit anemically, improving, and home prices remained relatively stable, after recovering significantly in 2013. The appointment of Janet Yellen as Chair of the Federal Reserve served to calm the nerves of business and political leaders alike. Japan successfully instituted its long-anticipated consumption tax increase, and the Bank of Japan stunned investors at the end of October when it unexpectedly expanded its already massive monetary stimulus.
The Japanese financial markets were volatile during the twelve-month period ended October 31, 2014, and ended roughly flat with the TOPIX returning -0.47% and the Nikkei 225 returning 0.43% (in U.S. Dollar terms). Looking back at the period, the Japanese market was buoyed by positive global economic data and improved corporate profitability, finishing 2013 at a six-year high. However, at the start of 2014, this momentum stalled and Japanese stocks promptly declined and remained range-bound, due to growth in emerging markets slowing and tensions between Ukraine and Russia escalating. In May 2014, the Japanese stock market began to show signs of life when economic data suggested that the impact of April’s consumption tax hike from 5% to 8% was not as severe as anticipated.
Although mixed Japanese macroeconomic indicators pointed to a slow, but positive recovery, Japanese stocks tumbled in the first two weeks of October because of concerns over global growth and a decline in oil prices. However, with two weeks remaining, global equity markets rebounded following the release of better-than-expected U.S. statistics. With Japanese stocks on the rise, the Bank of Japan announced that it would inject 80 trillion Yen ($650 billion) per year, which is an increase of 10-20 trillion Yen over its current policy, in order to support its 2% inflation target. This caused global investors to pile into the Japan market, and as a result, the Nikkei 225 index ended the period at a seven-year high, while the Yen fell to its lowest level in seven years.
While the first two arrows of Abenomics - unprecedented monetary expansion and fiscal stimulus - have garnered the most attention, the Japanese government’s new measures of its “Japan Revitalization Strategy”, better known as the third arrow of Abenomics, have begun to make an impact. The first of the strategy’s three main pillars, “Restoring Japan’s earning power” is not only focused on transforming Japan’s corporate mindset to achieve better performance in the form of higher return on equity, but also on changing citizen’s mindset from saving to investment. In addition to introducing a new index, the JPX-Nikkei Index 400, which was created to include only stocks focused on returning capital to shareholders, the government formulated Japan’s Stewardship Code that encourages institutional investors to promote long-term value creation through dialogue with corporate management.
Prime Minister Abe additionally implemented structural tax and investment changes for Japanese citizens to encourage greater equity ownership. Through the Nippon Individual Savings Accounts program, or NISA, Japanese residents can invest up to 5 million yen (approximately $50,000) on a tax-free basis. Since its introduction in January 2014, NISA has grown to 7.3 million accounts with $16 billion invested as of the end of June. The reform of Japan’s and the world’s largest pension fund, the Government Pension Investment Fund (GPIF) is also expected to spur higher Japanese equity ownership levels. In late October GPIF, which holds $1.2 trillion in assets, announced its new asset mix, which aims to increase Japanese stocks from 12 to 25% of its portfolio. We believe that this shift towards equities could be amplified as other Japanese public and private pension funds, which hold an additional $1.5 trillion in assets, potentially follow GPIF’s lead.
We strongly believe that Abenomics is on the right track, but needs more time for the various programs to work and targets to be met. The outcome of December’s elections, with a landslide victory for Prime Minister Abe’s Liberal Democratic Party, should allow Abe and his Cabinet the time to continue executing these economic policies and growth initiatives. We do not believe that the Japanese is overvalued, with the major indices at 15-16x earnings, and we anticipate that the market will continue to grow in line with earnings growth next year.
I firmly believe that both the U.S. and Japan are in the midst of a secular bull market, and I continue to tell investors to try to remain calm in the face of volatility and continue to focus on the strong, long-term fundamentals that are evident in these markets today.
I am encouraged by the returns for the major financial market indices and by the performance of the Hennessy Funds over the past year. Thank you for your continued confidence and investment in our products. If you have any questions or would like to speak with us directly, please don’t hesitate to call us at (800) 966-4354.
Best regards,
Neil J. Hennessy
President and Chief Investment Officer
Past performance does not guarantee future results.
Mutual fund investing involves risk. Principal loss is possible.
Opinions expressed are those of Neil Hennessy and are subject to change, are not guaranteed and should not be considered investment advice.
Earnings growth is not a measure of the Fund’s future performance.
The TOPIX (Tokyo Price Index) and Nikkei 225 Index are unmanaged indices commonly used to measure the performance of Japanese stocks, and these indices are presented in U.S. Dollar terms. The JPX-Nikkei Index 400 is composed of 400 companies deemed to have high appeal for investors, which meet requirements of global investment standards, such as efficient use of capital and investor-focused management perspectives as determined by the Tokyo Stock Exchange. One cannot invest directly in an index.
HENNESSY FUNDS 1-800-966-4354
Performance Overview (Unaudited)
The opinions expressed in the following commentary reflect those of the Portfolio Managers as of the date written. Any such opinions are subject to change based on market or other conditions and are not guaranteed. These opinions may not be relied upon as investment advice. Investment decisions for the Fund are based on multiple factors, and may not be relied upon as an indication of trading intent on behalf of the Fund. Security positions can and do change.
CHANGE IN VALUE OF $10,000 INVESTMENT
This chart assumes an initial gross investment of $10,000 made on August 31, 2007 (inception date of the Fund). Returns shown include the reinvestment of all dividends. Returns shown do not reflect the deduction of taxes that a shareholder would pay on Fund distributions or the redemption of Fund shares.
AVERAGE ANNUAL TOTAL RETURN FOR PERIODS ENDED OCTOBER 30, 2014
| | | | Since |
| | One | Five | Inception |
| | Year | Years | 8/31/2007 |
| Hennessy Japan Small Cap Fund – | | | |
| Investor Class (HJPSX) | 13.99% | 12.78% | 8.46% |
Russell/Nomura Small CapTM Index | 1.13% | 8.29% | 3.51% |
| Tokyo Price Index (TOPIX) | -0.47% | 5.78% | -0.12% |
Expense ratio: 2.40%
Performance data quoted represents past performance; past performance does not guarantee future results. The investment return and principal value of an investment will fluctuate so that an investor’s shares, when redeemed, may be worth more or less than their original cost. Current performance of the Fund may be lower or higher than the performance quoted. Performance data current to the most recent month end may be obtained by visiting hennessyfunds.com.
The expense ratio presented is from the most recent prospectus.
PERFORMANCE NARRATIVE
SPARX ASSET MANAGEMENT CO., LTD, SUB-ADVISOR
Portfolio Managers Tadahiro Fujimura, CFA and CMA, and Hidehiro Moriya, SPARX Asset Management Co., Ltd. (sub-advisor)
Over the previous twelve months, how did the Fund perform and what factors contributed to this performance?
For the twelve-month period ended October 31, 2014, the Hennessy Japan Small Cap Fund returned 13.99%, significantly outperforming the Russell/Nomura Small Cap™ Index, the Tokyo Price Index (TOPIX) and the Morningstar Japan Category Average, which returned 1.13%, -0.47% and 2.02% for the same period, respectively.
The largest positive contributors to the Fund’s performance among the 33 TOPIX sub-industries were shares of electronic appliance makers, machinery manufacturers, and wholesalers. Conversely, shares of nonferrous metal producers, auto-related firms and securities and commodities dealers performed negatively. Stock picking efforts, rather than sector allocation, was the primary driver of the Fund’s relative outperformance. Among the strongest performing stocks in the Fund were shares of Bic Camera, Inc., the second largest consumer electronics retailer, Yamaichi Electronics Co., Ltd., a leading manufacturer of integrated circuit sockets, and S Foods, Inc., a manufacturer and retailer of meat products. During the period, in Yen terms, shares of Bic Camera, Inc. surged +101% due to firm sales, even after the consumption tax hike in April. Shares of Yamaichi Electronics Co., Ltd. climbed +244% on news that its new ultra slim, multi-layer printed circuit board, which will be adopted in smartphones, will be produced in large quantities beginning this fall. Shares of S Foods, Inc. continued to perform well rising +136% since the start of the year. The company benefitted from the removal of restrictions on importing U.S. beef and earnings from its newly-acquired subsidiary, and the firm has also been able to raise prices to offset higher materials costs, due to the weakening Yen. The Fund no longer holds Yamaichi Electronics Co., Ltd.
Conversely, the major detractors from the Fund’s performance were Tokai Tokyo Financial Holdings, Inc., a mid-sized securities firm, T.RAD Co., Ltd., a comprehensive manufacturer of heat exchangers, and Nichicon Corporation, a major global manufacturer of capacitors. Over the previous twelve months, in Yen terms, shares of Tokai Tokyo Financial Holdings, Inc. fell -10% on concerns over the decline in revenues from commissions, as the stock market was sluggish. Shares of T.RAD Co., Ltd. declined -17% after the firm lowered its earnings forecast for its fiscal year ended March 31, 2014. Finally, shares of Nichicon Corporation slumped -28% on concerns over the strong Yen’s negative impact on earnings for its fiscal year ending March 31, 2015. The Fund no longer owns T.RAD Co., Ltd. or Nichicon Corporation.
Additional Portfolio Manager commentary and related investment outlook:
We continue to believe that Japan Inc. will be able to deliver double-digit earnings growth for the current and next fiscal years ending March 2015 and 2016, respectively. However, with the Yen declining below the U.S. Dollar level of 110, domestic companies may face a headwind. At the same time, a weak Yen environment may allow stronger domestic firms to take market share from weaker ones. With this in mind, we will carefully re-assess the portfolio and potentially consider reducing exposure to weaker domestic-oriented companies, seeking to replace them with higher-quality ones and export beneficiaries.
The Russell/Nomura Small Cap™ Index contains the bottom 15% of the Russell/Nomura Total Market™ Index, which contains the top 98% of all stocks listed on Japan’s stock exchange and
HENNESSY FUNDS 1-800-966-4354
registered on Japan’s OTC market in terms of market capitalization. The Tokyo Price Index (TOPIX) is a market capitalization-weighted index of all companies listed on the First Section of the Tokyo Stock Exchange. The Russell/Nomura Small Cap™ and TOPIX indices are presented in U.S. dollar terms and take into account reinvestment of dividends. You cannot invest directly in an index. Performance data for an index does not reflect any deductions for fees, expenses or taxes. The Fund invests in small- and medium-capitalization companies, which may have limited liquidity and greater price volatility than large-capitalization companies. Investments in foreign securities involve greater volatility and political, economic and currency risk and differences in accounting methods. The Fund may invest in IPOs, which may fluctuate considerably due to the absence of a prior public market and may have a magnified impact on the Fund. References to specific securities should not be considered a recommendation to buy or sell any security. Fund holdings and sector allocations are subject to change. Please refer to the Schedule of Investments included in this report for additional portfolio information.
Earnings growth is not a measure of the Fund’s future performance.
Each Morningstar category average represents a universe of funds with similar investment objectives. © Morningstar, Inc. All Rights Reserved. The information contained herein: 1) is proprietary to Morningstar; 2) may not be copied or distributed and 3) is not warranted to be accurate, complete or timely. Neither Morningstar nor its content providers are responsible for any damages or losses arising from any use of this information. Past performance does not guarantee future results.
Financial Statements
HENNESSY JAPAN SMALL CAP FUND
As of October 31, 2014
(% of Net Assets)
| TOP TEN HOLDINGS (EXCLUDING CASH/CASH EQUIVALENTS) | % NET ASSETS |
| S Foods, Inc. | 2.48% |
| Komehyo Co., Ltd. | 2.30% |
| Panasonic Industrial Devices SUNX Co., Ltd. | 2.28% |
| Okamura Corp. | 2.22% |
| Yokowo Co., Ltd. | 2.11% |
| Nakano Corp. | 2.10% |
| New Japan Radio Co., Ltd. | 2.10% |
| Kitz Corp. | 2.09% |
| Sankyo Seiko Co. | 2.08% |
| Anest Iwata Corp. | 2.07% |
Note: For presentation purposes, the Fund has grouped some of the industry categories. For purposes of categorizing securities for compliance with Section 8(b)(1) of the Investment Company Act of 1940, the Fund uses more specific industry classifications.
HENNESSY FUNDS 1-800-966-4354
| | COMMON STOCKS – 98.75% | | Number | | | | | | % of | |
| | | | of Shares | | | Value | | | Net Assets | |
| | Consumer Discretionary – 28.72% | | | | | | | | | |
| | Bic Camera, Inc. | | | 35,300 | | | $ | 309,504 | | | | 1.60 | % |
| | Doshisha Co., Ltd. | | | 23,600 | | | | 390,275 | | | | 2.02 | % |
| | Eagle Industry Co., Ltd. | | | 15,000 | | | | 287,710 | | | | 1.49 | % |
| | Faltec Co., Ltd. | | | 18,000 | | | | 231,664 | | | | 1.20 | % |
| | Fujibo Holdings, Inc. | | | 126,000 | | | | 349,228 | | | | 1.80 | % |
| | Hagihara Industries, Inc. | | | 25,900 | | | | 377,957 | | | | 1.95 | % |
| | Haseko Corp. | | | 29,100 | | | | 213,301 | | | | 1.10 | % |
| | Kawai Musical Instruments Manufacturing Co., Ltd. | | | 20,200 | | | | 379,870 | | | | 1.96 | % |
| | Kinugawa Rubber Industrials Co., Ltd. | | | 87,000 | | | | 368,767 | | | | 1.90 | % |
| | Komehyo Co., Ltd. | | | 19,200 | | | | 445,553 | | | | 2.30 | % |
| | Komeri Co., Ltd. | | | 12,000 | | | | 269,754 | | | | 1.39 | % |
| | Nissei Build Kogyo Co., Ltd. | | | 140,000 | | | | 363,650 | | | | 1.88 | % |
| | Onward Holdings Co., Ltd. | | | 65,000 | | | | 399,411 | | | | 2.06 | % |
| | Sankyo Seiko Co. | | | 108,300 | | | | 402,568 | | | | 2.08 | % |
| | Seiren Co., Ltd. | | | 40,100 | | | | 350,175 | | | | 1.81 | % |
| | SNT Corp. | | | 47,600 | | | | 242,784 | | | | 1.25 | % |
| | Starts Corp., Inc. | | | 12,000 | | | | 179,188 | | | | 0.93 | % |
| | | | | | | | | 5,561,359 | | | | 28.72 | % |
| | | | | | | | | | | | | | |
| | Consumer Staples – 4.80% | | | | | | | | | | | | |
| | Kaneko Seeds Co. | | | 29,600 | | | | 248,620 | | | | 1.29 | % |
| | S Foods, Inc. | | | 23,000 | | | | 480,829 | | | | 2.48 | % |
| | Yamatane Corp. | | | 129,000 | | | | 199,206 | | | | 1.03 | % |
| | | | | | | | | 928,655 | | | | 4.80 | % |
| | | | | | | | | | | | | | |
| | Energy – 0.53% | | | | | | | | | | | | |
| | Itochu Enex Co., Ltd. | | | 15,900 | | | | 101,864 | | | | 0.53 | % |
| | | | | | | | | | | | | | |
| | Financials – 4.11% | | | | | | | | | | | | |
| | GCA Savvian Corp. | | | 11,300 | | | | 121,384 | | | | 0.63 | % |
| | The Tochigi Bank, Inc. | | | 86,000 | | | | 349,578 | | | | 1.80 | % |
| | Tokai Tokyo Financial Holdings, Inc. | | | 48,000 | | | | 325,618 | | | | 1.68 | % |
| | | | | | | | | 796,580 | | | | 4.11 | % |
| | | | | | | | | | | | | | |
| | Health Care – 1.41% | | | | | | | | | | | | |
| | Nichii Gakkan Co. | | | 35,300 | | | | 273,917 | | | | 1.41 | % |
The accompanying notes are an integral part of these financial statements.
| | COMMON STOCKS | | Number | | | | | | % of | |
| | | | of Shares | | | Value | | | Net Assets | |
| | Industrials – 30.20% | | | | | | | | | |
| | Anest Iwata Corp. | | | 55,000 | | | $ | 400,120 | | | | 2.07 | % |
| | Daiichi Jitsugyo, Inc. | | | 71,000 | | | | 365,050 | | | | 1.89 | % |
| | Hanwa Co., Ltd. | | | 91,000 | | | | 328,113 | | | | 1.69 | % |
| | Hitachi Zosen Corp. | | | 75,700 | | | | 401,753 | | | | 2.07 | % |
| | Hito Communication, Inc. | | | 5,800 | | | | 88,711 | | | | 0.46 | % |
| | Kito Corp. | | | 25,200 | | | | 289,140 | | | | 1.49 | % |
| | Kitz Corp. | | | 88,300 | | | | 404,649 | | | | 2.09 | % |
| | Kondotec, Inc. | | | 62,100 | | | | 399,669 | | | | 2.06 | % |
| | Kyosan Electric Manufacturing Co., Ltd. | | | 84,000 | | | | 269,123 | | | | 1.39 | % |
| | Miyaji Engineering Group, Inc. | | | 199,000 | | | | 388,166 | | | | 2.00 | % |
| | Nakano Corp. | | | 120,100 | | | | 406,917 | | | | 2.10 | % |
| | Nittoku Engineering Co., Ltd. | | | 38,100 | | | | 370,817 | | | | 1.92 | % |
| | Okamura Corp. | | | 59,000 | | | | 430,519 | | | | 2.22 | % |
| | Ryobi Ltd. | | | 116,000 | | | | 316,610 | | | | 1.64 | % |
| | Shin Nippon Air Technologies Co., Ltd. | | | 24,700 | | | | 201,124 | | | | 1.04 | % |
| | Tocalo Co., Ltd. | | | 15,300 | | | | 288,617 | | | | 1.49 | % |
| | Tomoe Engineering Co., Ltd. | | | 17,800 | | | | 280,281 | | | | 1.45 | % |
| | Utoc Corp. | | | 47,900 | | | | 218,497 | | | | 1.13 | % |
| | | | | | | | | 5,847,876 | | | | 30.20 | % |
| | | | | | | | | | | | | | |
| | Information Technology – 22.05% | | | | | | | | | | | | |
| | Aichi Tokei Denki Co., Ltd. | | | 116,000 | | | | 333,053 | | | | 1.72 | % |
| | Aiphone Co., Ltd. | | | 22,400 | | | | 388,873 | | | | 2.01 | % |
| | Capcom Co., Ltd. | | | 21,500 | | | | 334,052 | | | | 1.72 | % |
| | Elecom Co., Ltd. | | | 10,000 | | | | 214,813 | | | | 1.11 | % |
| | Information Services International – Dentsu, Ltd. | | | 29,800 | | | | 315,710 | | | | 1.63 | % |
| | Marubun Corp. | | | 35,200 | | | | 225,448 | | | | 1.16 | % |
| | New Japan Radio Co., Ltd. | | | 91,000 | | | | 406,359 | | | | 2.10 | % |
| | Panasonic Industrial Devices SUNX Co., Ltd. | | | 81,900 | | | | 440,697 | | | | 2.28 | % |
| | SIIX Corp. | | | 13,900 | | | | 241,387 | | | | 1.25 | % |
| | Sumida Corp. | | | 46,100 | | | | 326,913 | | | | 1.69 | % |
| | TKC Corp. | | | 15,000 | | | | 294,469 | | | | 1.52 | % |
| | Towa Corp. | | | 58,700 | | | | 338,901 | | | | 1.75 | % |
| | Yokowo Co., Ltd. | | | 78,100 | | | | 408,655 | | | | 2.11 | % |
| | | | | | | | | 4,269,330 | | | | 22.05 | % |
The accompanying notes are an integral part of these financial statements.
HENNESSY FUNDS 1-800-966-4354
| | COMMON STOCKS | | Number | | | | | | % of | |
| | | | of Shares | | | Value | | | Net Assets | |
| | Materials – 6.93% | | | | | | | | | |
| | Hakudo Co., Ltd. | | | 31,200 | | | $ | 293,770 | | | | 1.52 | % |
| | Shinagawa Refract | | | 146,000 | | | | 359,443 | | | | 1.86 | % |
| | UBE Industries, Ltd. | | | 228,000 | | | | 353,016 | | | | 1.82 | % |
| | Yushiro Chemical Industry Co., Ltd. | | | 26,600 | | | | 335,197 | | | | 1.73 | % |
| | | | | | | | | 1,341,426 | | | | 6.93 | % |
| | Total Common Stocks | | | | | | | | | | | | |
| | (Cost $17,542,471) | | | | | | | 19,121,007 | | | | 98.75 | % |
| | | | | | | | | | | | | | |
| | SHORT-TERM INVESTMENTS – 0.04% | | | | | | | | | | | | |
| | Money Market Funds – 0.04% | | | | | | | | | | | | |
| | Fidelity Government Portfolio – | | | | | | | | | | | | |
| | Institutional Class, 0.01% (a) | | | 7,229 | | | | 7,229 | | | | 0.04 | % |
| | Total Short-Term Investments | | | | | | | | | | | | |
| | (Cost $7,229) | | | | | | | 7,229 | | | | 0.04 | % |
| | Total Investments | | | | | | | | | | | | |
| | (Cost $17,549,700) – 98.79% | | | | | | | 19,128,236 | | | | 98.79 | % |
| | Other Assets in Excess | | | | | | | | | | | | |
| | of Liabilities – 1.21% | | | | | | | 235,127 | | | | 1.21 | % |
| | TOTAL NET ASSETS – 100.00% | | | | | | $ | 19,363,363 | | | | 100.00 | % |
Percentages are stated as a percent of net assets.
(a)The rate listed is the fund’s 7-day yield as of October 31, 2014.
The accompanying notes are an integral part of these financial statements.
Summary of Fair Value Exposure at October 31, 2014
The following is a summary of the inputs used to value the Fund's net assets as of October 31, 2014 (See Note 3 in the accompanying notes to the financial statements):
| Common Stocks | | Level 1 | | | Level 2 | | | Level 3 | | | Total | |
| Consumer Discretionary | | $ | — | | | $ | 5,561,359 | | | $ | — | | | $ | 5,561,359 | |
| Consumer Staples | | | — | | | | 928,655 | | | | — | | | | 928,655 | |
| Energy | | | — | | | | 101,864 | | | | — | | | | 101,864 | |
| Financials | | | — | | | | 796,580 | | | | — | | | | 796,580 | |
| Health Care | | | — | | | | 273,917 | | | | — | | | | 273,917 | |
| Industrials | | | — | | | | 5,847,876 | | | | — | | | | 5,847,876 | |
| Information Technology | | | — | | | | 4,269,330 | | | | — | | | | 4,269,330 | |
| Materials | | | — | | | | 1,341,426 | | | | — | | | | 1,341,426 | |
| Total Common Stocks | | $ | — | | | $ | 19,121,007 | | | $ | — | | | $ | 19,121,007 | |
| Short-Term Investments | | | | | | | | | | | | | | | | |
| Money Market Funds | | $ | 7,229 | | | $ | — | | | $ | — | | | $ | 7,229 | |
| Total Short-Term Investments | | $ | 7,229 | | | $ | — | | | $ | — | | | $ | 7,229 | |
| Total Investments | | $ | 7,229 | | | $ | 19,121,007 | | | $ | — | | | $ | 19,128,236 | |
Transfers between levels are recognized at the end of the reporting period. During the one-year period ended October 31, 2014, the Fund recognized significant transfers between Levels 1 and 2.
Transfers between Level 1 and Level 2 relate to the use of a fair valuation pricing service. On days when the fair valuation pricing service is used, non-U.S. dollar denominated securities move from a Level 1 to a Level 2 classification. 100% of common stocks held at October 31, 2013 were classified as Level 1. Such securities still held at October 31, 2014 were transferred to Level 2 due to the use of the fair value pricing service as described in Note 3. Other than transfers due to the use of the fair value pricing service, no transfers were recognized.
The accompanying notes are an integral part of these financial statements.
HENNESSY FUNDS 1-800-966-4354
Financial Statements
Statement of Assets and Liabilities as of October 31, 2014 |
| ASSETS: | | | |
| Investments in securities, at value (cost $17,549,700) | | $ | 19,128,236 | |
| Foreign currencies, at value (cost $2,704) | | | 2,634 | |
| Dividends and interest receivable | | | 122,267 | |
| Receivable for fund shares sold | | | 200,349 | |
| Receivable for securities sold | | | 109,331 | |
| Prepaid expenses and other assets | | | 11,388 | |
| Total Assets | | | 19,574,205 | |
| | | | | |
| LIABILITIES: | | | | |
| Payable for securities purchased | | | 87,053 | |
| Payable for fund shares redeemed | | | 63,960 | |
| Payable to advisor | | | 20,561 | |
| Payable to administrator | | | 4,817 | |
| Payable to auditor | | | 17,436 | |
| Accrued service fees | | | 1,713 | |
| Accrued trustees fees | | | 2,265 | |
| Accrued expenses and other payables | | | 13,037 | |
| Total Liabilities | | | 210,842 | |
| NET ASSETS | | $ | 19,363,363 | |
| | | | | |
| NET ASSETS CONSIST OF: | | | | |
| Capital stock | | $ | 16,493,346 | |
| Accumulated net investment loss | | | (92,011 | ) |
| Accumulated net realized gain on investments | | | 1,388,002 | |
| Unrealized net appreciation on investments | | | 1,574,026 | |
| Total Net Assets | | $ | 19,363,363 | |
| | | | | |
| NET ASSETS | | | | |
| Investor Class: | | | | |
| Shares authorized (no par value) | | Unlimited | |
| Net assets applicable to outstanding Investor Class shares | | $ | 19,363,363 | |
| Shares issued and outstanding | | | 1,841,526 | |
| Net asset value, offering price and redemption price per share | | $ | 10.51 | |
The accompanying notes are an integral part of these financial statements.
Financial Statements
Statement of Operations for the year ended October 31, 2014 |
| INVESTMENT INCOME: | | | |
Dividend income(1) | | $ | 323,047 | |
| Interest income | | | 104 | |
| Total investment income | | | 323,151 | |
| | | | | |
| EXPENSES: | | | | |
| Investment advisory fees (See Note 5) | | | 209,426 | |
| Sub-transfer agent expenses – Investor Class (See Note 5) | | | 40,060 | |
| Administration, fund accounting, custody and transfer agent fees | | | 30,809 | |
| Federal and state registration fees | | | 26,870 | |
| Compliance expense | | | 21,488 | |
| Audit fees | | | 19,301 | |
| Service fees – Investor Class (See Note 5) | | | 17,452 | |
| Trustees’ fees and expenses | | | 8,906 | |
| Reports to shareholders | | | 8,572 | |
| Legal fees | | | 1,246 | |
| Interest expense (See Note 6) | | | 762 | |
| Other expenses | | | 5,821 | |
| Total expenses | | | 390,713 | |
| NET INVESTMENT LOSS | | $ | (67,562 | ) |
| | | | | |
| REALIZED AND UNREALIZED GAINS: | | | | |
| Net realized gain on investments | | $ | 1,539,731 | |
| Net change in unrealized appreciation on investments | | | 326,483 | |
| Net gain on investments | | | 1,866,214 | |
| NET INCREASE IN NET ASSETS RESULTING FROM OPERATIONS | | $ | 1,798,652 | |
(1) Net of foreign taxes withheld of $46,904.
The accompanying notes are an integral part of these financial statements.
HENNESSY FUNDS 1-800-966-4354
(This Page Intentionally Left Blank.)
Financial Statements
| Statements of Changes in Net Assets |
| | | Year Ended | | | Year Ended | |
| | | October 31, 2014 | | | October 31, 2013 | |
| OPERATIONS: | | | | | | |
| Net investment loss | | $ | (67,562 | ) | | $ | (15,072 | ) |
| Net realized gain on investments | | | 1,539,731 | | | | 3,128,752 | |
| Net change in unrealized appreciation on investments | | | 326,483 | | | | 1,109,483 | |
| Net increase in net assets resulting from operations | | | 1,798,652 | | | | 4,223,163 | |
| | | | | | | | | |
| DISTRIBUTIONS TO SHAREHOLDERS FROM: | | | | | | | | |
| Net realized gains | | | | | | | | |
| Investor Class | | | (3,229,364 | ) | | | (1,115,069 | ) |
| Total distributions | | | (3,229,364 | ) | | | (1,115,069 | ) |
| | | | | | | | | |
| CAPITAL SHARE TRANSACTIONS: | | | | | | | | |
| Proceeds from shares subscribed – Investor Class | | | 22,078,882 | | | | 23,641,290 | |
| Dividends reinvested – Investor Class | | | 3,179,599 | | | | 1,067,157 | |
| Cost of shares redeemed – Investor Class | | | (19,287,749 | )(1) | | | (18,099,720 | ) |
| Net increase in net assets derived | | | | | | | | |
| from capital share transactions | | | 5,970,732 | | | | 6,608,727 | |
| TOTAL INCREASE IN NET ASSETS | | | 4,540,020 | | | | 9,716,821 | |
| | | | | | | | | |
| NET ASSETS: | | | | | | | | |
| Beginning of year | | | 14,823,343 | | | | 5,106,522 | |
| End of year | | $ | 19,363,363 | | | $ | 14,823,343 | |
| Undistributed net investment loss, end of year | | $ | (92,011 | ) | | $ | (16,755 | ) |
| | | | | | | | | |
| CHANGES IN SHARES OUTSTANDING: | | | | | | | | |
| Shares sold – Investor Class | | | 2,160,787 | | | | 2,326,376 | |
| Shares issued to holders as reinvestment | | | | | | | | |
| of dividends – Investor Class | | | 340,064 | | | | 121,406 | |
| Shares redeemed – Investor Class | | | (1,926,098 | ) | | | (1,665,417 | ) |
| Net increase in shares outstanding | | | 574,753 | | | | 782,365 | |
| (1) | Net of redemption fees of $47 related to redemption fees imposed by the Fund during a prior year but not received until the year ended October 31, 2014. |
The accompanying notes are an integral part of these financial statements.
HENNESSY FUNDS 1-800-966-4354
Financial Statements
For an Investor Class share outstanding throughout each year
PER SHARE DATA:
Net asset value, beginning of year
Income from investment operations:
Net investment income (loss)
Net realized and unrealized gains (losses) on investments
Total from investment operations
Less distributions:
Dividends from net investment income
Dividends from net realized gains
Total distributions
Paid-in capital from redemption fees
Net asset value, end of year
TOTAL RETURN
SUPPLEMENTAL DATA AND RATIOS:
Net assets, end of year (millions)
Ratio of expenses to average net assets:
Before expense reimbursement
After expense reimbursement
Ratio of net investment income to average net assets:
Before expense reimbursement
After expense reimbursement
Portfolio turnover rate
(1) Amount is less than $0.01 or ($0.01).
The accompanying notes are an integral part of these financial statements.
| Year Ended October 31, | |
| 2014 | | | 2013 | | | 2012 | | | 2011 | | | 2010 | |
| | | | | | | | | | | | | | |
| $ | 11.70 | | | $ | 10.54 | | | $ | 10.09 | | | $ | 9.23 | | | $ | 9.74 | |
| | | | | | | | | | | | | | | | | | | |
| | | | | | | | | | | | | | | | | | | |
| | (0.04 | ) | | | 0.06 | | | | (0.68 | ) | | | 0.06 | | | | 0.00 | (1) |
| | 1.36 | | | | 3.44 | | | | 1.17 | | | | 0.80 | | | | (0.10 | ) |
| | 1.32 | | | | 3.50 | | | | 0.49 | | | | 0.86 | | | | (0.10 | ) |
| | | | | | | | | | | | | | | | | | | |
| | | | | | | | | | | | | | | | | | | |
| | — | | | | — | | | | (0.04 | ) | | | — | | | | (0.42 | ) |
| | (2.51 | ) | | | (2.34 | ) | | | — | | | | — | | | | — | |
| | (2.51 | ) | | | (2.34 | ) | | | (0.04 | ) | | | — | | | | (0.42 | ) |
| | — | | | | — | | | | — | | | | — | | | | 0.01 | |
| $ | 10.51 | | | $ | 11.70 | | | $ | 10.54 | | | $ | 10.09 | | | $ | 9.23 | |
| | | | | | | | | | | | | | | | | | | |
| | 13.99 | % | | | 40.59 | % | | | 4.91 | % | | | 9.32 | % | | | (0.72 | )% |
| | | | | | | | | | | | | | | | | | | |
| | | | | | | | | | | | | | | | | | | |
| $ | 19.36 | | | $ | 14.82 | | | $ | 5.11 | | | $ | 24.08 | | | $ | 15.17 | |
| | | | | | | | | | | | | | | | | | | |
| | 2.24 | % | | | 2.39 | % | | | 2.33 | % | | | 2.10 | % | | | 2.14 | % |
| | 2.24 | % | | | 2.39 | % | | | 2.33 | % | | | 2.10 | % | | | 2.01 | % |
| | | | | | | | | | | | | | | | | | | |
| | (0.39 | )% | | | (0.11 | )% | | | (0.66 | )% | | | 0.17 | % | | | (0.14 | )% |
| | (0.39 | )% | | | (0.11 | )% | | | (0.66 | )% | | | 0.17 | % | | | (0.01 | )% |
| | 63 | % | | | 141 | % | | | 49 | % | | | 61 | % | | | 100 | % |
The accompanying notes are an integral part of these financial statements.
HENNESSY FUNDS 1-800-966-4354
Financial Statements
Notes to Financial Statements October 31, 2014 |
1). ORGANIZATION
The Hennessy Japan Small Cap Fund (the “Fund”) is a series of Hennessy Funds Trust (the “Trust”), which was organized as a Delaware statutory trust on September 17, 1992. The Fund is an open-end management investment company registered under the Investment Company Act of 1940, as amended. The Fund is a successor to a fund with the same name (the “Predecessor Fund”) that was a series Hennessy SPARX Funds Trust, a Massachusetts business trust, pursuant to a reorganization that took place after the close of business on February 28, 2014. Prior to February 28, 2014, the Fund had no investment operations. As a result of the reorganization, holders of the Investor Class shares of the Predecessor Fund received Investor Class shares of the Fund (the Investor Class shares of the Fund are the successor to the accounting and performance information of the Predecessor Fund). The investment objective of the Fund is long-term capital appreciation. The Fund is a diversified fund, but may employ a relatively focused investment strategy and may hold securities of fewer issuers than other diversified funds.
The Fund offers Investor Class shares. Prior to October 26, 2012, the Investor Class shares were known as Original Class shares.
2). SIGNIFICANT ACCOUNTING POLICIES
The following is a summary of significant accounting policies consistently followed by the Fund in the preparation of the financial statements. These policies are in conformity with U.S. generally accepted accounting principles (“GAAP”).
| a). | Investment Valuation – All investments in securities are recorded at their estimated fair value, as described in Note 3. |
| b). | Federal Income Taxes – Provision for federal income taxes or excise taxes has not been made since the Fund has elected to be taxed as a “regulated investment company” and intends to distribute substantially all of its taxable income to its shareholders and otherwise comply with the provisions of the Internal Revenue Code of 1986, as amended, applicable to regulated investment companies. Net investment income or loss and realized gains and losses for federal income tax purposes may differ from that reported on the financial statements because of temporary book and tax basis differences. Temporary differences are primarily the result of the treatment of wash sales for tax reporting purposes. Distributions from net realized gains for book purposes may include short-term capital gains, which are included as ordinary income to shareholders for tax purposes. |
| | Due to inherent differences in the recognition of income, expenses, and realized gains/losses under GAAP and federal income tax regulations, permanent differences between book and tax basis reporting for the 2014 fiscal year have been identified and appropriately reclassified on the Statement of Assets and Liabilities. The adjustments are as follow: |
| Undistributed | Accumulated | |
| Net Investment | Net Realized | |
| Income/(Loss) | Gain/(Loss) | Paid-in Capital |
| $(7,694) | $7,694 | $— |
| c). | Income and Expenses – Dividend income is recognized on the ex-dividend date or as soon as information is available to the Fund. Interest income, which includes the amortization of premium and accretion of discount, is recognized on an accrual basis. The Fund is charged for those expenses that are directly attributable to the portfolio, such as advisory, administration, and certain shareholder service fees. |
| d). | Distributions to Shareholders – Dividends from net investment income for the Fund, if any, are declared and paid out annually, usually in December. Distributions of net realized capital gains, if any, are declared and paid annually, usually in November or December. |
| e). | Security Transactions – Investment and shareholder transactions are recorded on the trade date. The Fund determines the gain or loss realized from the investment transactions by comparing the original cost of the security lot sold with the net sale proceeds. Discounts and premiums on securities purchased are accreted/amortized over the life of the respective security. |
| f). | Use of Estimates – The preparation of financial statements in conformity with GAAP requires management to make estimates and assumptions that affect the reported amounts of assets and liabilities and disclosure of contingent assets and liabilities at the date of the financial statements and the reported change in net assets during the reporting period. Actual results could differ from those estimates. |
| g). | Share Valuation – The net asset value (“NAV”) per share of the Fund is calculated by dividing the sum of the value of the securities held by the Fund, plus cash or other assets, minus all liabilities (including estimated accrued expenses) by the total number of shares outstanding for the Fund, rounded to the nearest cent. The Fund’s shares will not be priced on days the New York Stock Exchange is closed for trading. The offering and redemption price per share for the Fund is equal to the Fund’s NAV per share. |
| h). | Foreign Currency – Values of investments denominated in foreign currencies, if any, are converted into U.S. dollars using the spot market rate of exchange at the time of valuation. Purchases and sales of investments and income are translated into U.S. dollars using the spot market rate of exchange prevailing on the respective dates of such transactions. The Fund does not isolate the portion of the results of operations resulting from fluctuations in foreign exchange rates on investments from fluctuations resulting from changes in the market prices of securities held. Such fluctuations are included with the net realized and unrealized gain or loss on investments. Foreign investments present additional risks due to currency fluctuations, economic and political factors, lower liquidity, government regulations, differences in accounting standards, and other factors. |
| i). | Forward Contracts – The Fund may enter into forward currency contracts to reduce its exposure to changes in foreign currency exchange rates on its foreign holdings and to lock in the U.S. dollar cost of firm purchase and sale commitments for securities denominated in foreign currencies. A forward currency contract is a commitment to purchase or sell a foreign currency at a future date at a negotiated forward rate. The gain or loss arising from the difference between the U.S. dollar cost of the original contract and the value of the foreign currency in U.S. dollars upon closing of such contract is included in net realized gain or loss from foreign currency transactions. During the fiscal year ended October 31, 2014, the Fund did not enter into any forward contracts. |
| j). | Repurchase Agreements – The Fund may enter into repurchase agreements with member banks or security dealers of the Federal Reserve Board whom the investment |
HENNESSY FUNDS 1-800-966-4354
| | advisor deems creditworthy. The repurchase price generally equals the price paid by the Fund plus interest negotiated on the basis of current short-term rates. |
| | Securities pledged as collateral for repurchase agreements are held by the custodian bank until the respective agreements mature. Provisions of the repurchase agreements ensure that the market value of the collateral, including accrued interest thereon, is sufficient to cover the repurchase amount in the event of default of the counterparty. If the counterparty defaults and the value of the collateral declines or if the counterparty enters an insolvency proceeding, realization of the collateral by the Fund may be delayed or limited. |
| k). | Accounting for Uncertainty in Income Taxes – The Fund has adopted accounting policies regarding recognition and measurement of tax positions taken or expected to be taken on a tax return. The tax returns of the Fund for the prior three fiscal years are open for examination. The Fund has reviewed all open tax years in major jurisdictions and concluded that there is no impact on the Fund’s net assets and no tax liability resulting from unrecognized tax benefits relating to uncertain income tax positions taken or expected to be taken on a tax return. The Fund’s major tax jurisdictions are U.S. federal and Delaware. |
| l). | Derivatives – The Fund may invest in, or enter into, derivatives, such as options, futures contracts, options on futures contracts, and swaps, for a variety of reasons, including to hedge certain risks, to provide a substitute for purchasing or selling particular securities, or to increase potential income gain. Derivatives may provide a cheaper, quicker, or more specifically focused way for a Fund to invest than “traditional” securities would. The main purpose of utilizing these derivative instruments is for hedging purposes. |
| | The Fund has adopted the financial accounting reporting rules as required by the Derivatives and Hedging Topic of the Financial Accounting Standards Board Accounting Standards Codification. Under such rules, the Fund is required to include enhanced disclosure that enables investors to understand how and why an entity uses derivatives, how derivatives are accounted for, and how derivatives instruments affect an entity’s results of operations and financial position. During the fiscal year ended October 31, 2014, the Fund did not hold any derivative instruments. |
| m). | Events Subsequent to the Fiscal Period End – The Fund has adopted financial reporting rules regarding subsequent events that require an entity to recognize in the financial statements the effects of all subsequent events that provide additional evidence about conditions that existed at the date of the balance sheet. Management has evaluated the Fund’s related events and transactions that occurred subsequent to October 31, 2014 through the date of issuance of the Fund’s financial statements. There were no events or transactions that occurred during this period that materially impacted the amounts or disclosures in the Fund’s financial statements. |
3). SECURITIES VALUATION
The Fund has adopted authoritative fair valuation accounting standards that establish an authoritative definition of fair value and set out a hierarchy for measuring fair value. These standards require additional disclosures about the various inputs and valuation techniques used to develop the measurements of fair value and a discussion in changes in valuation techniques and related inputs during the period. These inputs are summarized in the three broad levels listed below:
| | Level 1 – | Quoted unadjusted prices for identical instruments in active markets to which the Fund has access at the date of measurement. |
| | Level 2 – | Quoted prices for similar instruments in active markets; quoted prices for identical or similar instruments in markets that are not active; and model-derived valuations in which all significant inputs and significant value drivers are observable in active markets. Level 2 inputs are those in markets for which there are few transactions, the prices are not current, the prices are fair value adjusted due to post-market close subsequent events (foreign markets), little public information exists, or instances where prices vary substantially over time or among brokered market makers. These inputs may also include interest rates, prepayment speeds, credit risk curves, default rates, and similar data. |
| | Level 3 – | Model-derived valuations in which one or more significant inputs or significant value drivers are unobservable. Unobservable inputs are those inputs that reflect the Fund’s own assumptions about what market participants would use to price the asset or liability based on the best available information. |
Following is a description of the valuation techniques applied to the Fund’s major categories of assets and liabilities measured at fair value on a recurring basis.
Equity Securities – Equity securities, including common stocks, preferred stocks, foreign issued common stocks, exchange traded funds, closed-end mutual funds, and real estate investment trusts, that are traded on a securities exchange for which a last-quoted sales price is readily available will be valued at the last sales price as reported by the primary exchange on which the securities are listed. Securities listed on The NASDAQ Stock Market (“NASDAQ”) will be valued generally at the NASDAQ Official Closing Price, which may differ from the last sales price reported. Securities traded on a securities exchange for which a last-quoted sales price is not readily available will generally be valued at the mean between the bid and ask prices. To the extent these securities are actively traded and valuation adjustments are not applied, they are classified in Level 1 of the fair value hierarchy.
Investment Companies – Investments in investment companies (e.g., mutual funds and exchange traded funds) are generally priced at the ending NAV provided by the Fund’s service agent and will be classified in Level 1 of the fair value hierarchy.
Debt Securities – Debt securities, including corporate bonds, asset-backed securities, mortgage-backed securities, municipal bonds, U.S. Treasuries, and U.S. government agency issues, are valued at market on the basis of valuations furnished by an independent pricing service that utilizes both dealer-supplied valuations and formula-based techniques. The pricing service may consider recently executed transactions in securities of the issuer or comparable issuers, market price quotations (where observable), bond spreads, and fundamental data relating to the issuer. In addition, the model may incorporate market observable data such as reported sales of similar securities, broker quotes, yields, bids, offers, and reference data. Certain securities are valued principally using dealer quotations. These securities are generally classified in Level 2 of the fair value hierarchy.
Short-Term Securities – Short-term equity investments, including money market funds, are valued in the manner specified above. Short-term debt investments are generally valued at amortized cost, which approximates fair market value, if their original maturity was 60 days or less, or by amortizing the values as of the 61st day prior to maturity, if their original term to maturity exceeded 60 days. Amortized cost is not used if its use would be inappropriate due to credit or other impairments of the issuer, in which the security would be fair valued, as described below. Short-term securities are generally classified in Level 1 or Level 2 of the fair market hierarchy depending on the inputs used and market activity levels for specific securities.
HENNESSY FUNDS 1-800-966-4354
The Board of Trustees of the Fund (the “Board”) has adopted fair value pricing procedures that are followed when a price for a security is not readily available or if a significant event has occurred that indicates the closing price of a security no longer represents the true value of that security. Fair value pricing determinations are made in good faith in accordance with these procedures. There are numerous criteria that will be given consideration in determining a fair value of a security. Some of these criteria are trading volume of security and markets, the value of other like securities, and news events with direct bearing to security or market. Fair value pricing results in an estimated price for a security that reflects the amount the Fund might reasonably expect to receive in a current sale. Depending on the relative significance of the valuation inputs, these securities may be classified in either Level 2 or Level 3 of the fair value hierarchy.
Fair valuing of foreign securities may be determined with the assistance of a pricing service using correlations between the movement of prices of such securities and indices of domestic securities and other appropriate indicators, such as closing market prices of relevant American Depositary Receipts or futures contracts. The effect of using fair value pricing is that the Fund’s NAV will reflect the affected portfolio securities’ value as determined in the judgment of the Board or its designee instead of being determined by the market. Using a fair value pricing methodology to price foreign securities may result in a value that is different from a foreign security’s most recent closing price and from the prices used by other investment companies to calculate their NAVs and are generally considered Level 2 prices in the fair valuation hierarchy. Because the Fund may invest in foreign securities, the value of the Fund’s portfolio securities may change on days when you will not be able to purchase or redeem your shares.
The Board has delegated day-to-day valuation matters to a Valuation Committee comprised of one or more representatives from Hennessy Advisors, Inc., the Fund’s investment advisor. The function of the Valuation Committee is to value securities where current and reliable market quotations are not readily available. All actions taken by the Valuation Committee are reviewed by the Board.
The Fund has performed an analysis of all existing investments to determine the significance and character of all inputs to their fair value determination. Various inputs are used in determining the value of the Fund’s investments. The inputs or methodology used for valuing securities are not necessarily an indication of the risk associated with investing in those securities. Details related to the fair valuation hierarchy of the Fund’s securities as of October 31, 2014 are included in the Fund’s Schedule of Investments.
4). INVESTMENT TRANSACTIONS
Purchases and sales of investment securities (excluding government and short-term investments) for the Fund during the fiscal year ended October 31, 2014 were $14,129,378 and $10,282,248, respectively.
There were no purchases or sales/maturities of long-term U.S. Government Securities for the Fund during the fiscal year ended October 31, 2014.
5). INVESTMENT MANAGEMENT FEE AND OTHER TRANSACTIONS WITH AFFILIATES
Hennessy Advisors, Inc. (the “Advisor”) is the investment advisor of the Fund. The Advisor provides the Fund with investment management services under an Investment Advisory Agreement. The Advisor furnishes all investment advice, office space, facilities, and provides most of the personnel needed by the Fund. As compensation for its services, the Advisor is entitled to a monthly fee from the Fund. The fee is based upon the average daily net assets of the Fund at the annual rate of 1.20%. The net investment advisory fees payable for the Fund as of October 31, 2014 were $20,561.
The Advisor has delegated the day-to-day management of the Fund to a sub-advisor, SPARX Asset Management Co., Ltd. The Advisor pays the sub-advisor fees for the Fund from its own assets and these fees are not an additional expense of the Fund.
The Board has approved a Shareholder Servicing Agreement for the Fund, which was instituted to compensate the Advisor for the non-investment management services it provides to the Fund. The Shareholder Servicing Agreement provides for a monthly fee paid to the Advisor at an annual rate of 0.10% of the average daily net assets of the Fund. Shareholder service fees payable for the Fund as of October 31, 2014 were $1,713.
The Fund has entered into agreements with various brokers, dealers, and financial intermediaries in connection with the sale of shares of the Fund. The agreements provide for periodic payments by the Fund to the brokers, dealers, and financial intermediaries for providing certain shareholder maintenance services (sub-transfer agent expenses). These shareholder services include the pre-processing and quality control of new accounts, shareholder correspondence, answering customer inquiries regarding account status, and facilitating shareholder telephone transactions. Fees paid by the Fund to various brokers, dealers, and financial intermediaries for the fiscal year ended October 31, 2014 were $40,060.
U.S. Bancorp Fund Services, LLC (“USBFS”) provides the Fund with administrative, fund accounting, and transfer agent services, including all regulatory reporting, and necessary office equipment and personnel. As administrator, USBFS prepares various federal and state regulatory filings, reports, and returns for the Fund; prepares reports and materials to be supplied to the Board; monitors the activities of the Fund’s custodian, transfer agent, and accountants; and coordinates the preparation and payment of the Fund’s expenses and reviews the Fund’s expense accruals. Fees paid to USBFS for the fiscal year ended October 31, 2014 were $30,809.
U.S. Bank, N.A., an affiliate of USBFS, serves as the Fund’s custodian. Quasar Distributors, LLC acts as the Fund’s principal underwriter in a continuous public offering of the Fund’s shares. Quasar Distributors, LLC is an affiliate of USBFS and U.S. Bank, N.A.
6). LINE OF CREDIT
The Fund has a line of credit with the other funds in the Hennessy Funds family of funds (the “Hennessy Funds”) in the amount of the lesser of (i) $100,000,000 or (ii) 33.33% of each Hennessy Fund’s net assets, or 30% for the Hennessy Gas Utility Index Fund and 10% for the Hennessy Balanced Fund, intended to provide short-term financing, if necessary, subject to certain restrictions, in connection with shareholder redemptions. The credit facility is with the Hennessy Funds’ custodian bank, U.S. Bank, N.A. Borrowings under this arrangement bear interest at the bank’s prime rate. During the fiscal year ended October 31, 2014, the Fund had an outstanding average daily balance and a weighted average interest rate of $18,296 and 3.25%, respectively. The maximum amount outstanding for the Fund during the period was $669,000. At October 31, 2014, the Fund had a loan payable balance of $0.
HENNESSY FUNDS 1-800-966-4354
7). FEDERAL TAX INFORMATION
As of October 31, 2014, the components of accumulated earnings (losses) for income tax purposes were as follow:
| | Cost of investments for tax purposes | | $ | 17,790,792 | |
| | Gross tax unrealized appreciation | | $ | 2,330,349 | |
| | Gross tax unrealized depreciation | | | (992,905 | ) |
| | Net tax unrealized appreciation | | $ | 1,337,444 | |
| | Undistributed ordinary income | | $ | 362,445 | |
| | Undistributed long-term capital gains | | | 1,174,638 | |
| | Total distributable earnings | | $ | 1,537,083 | |
| | Other accumulated loss | | $ | (4,510 | ) |
| | Total accumulated gain | | $ | 2,870,017 | |
The difference between book-basis and tax-basis unrealized appreciation is attributable primarily to wash sales and PFICs.
At October 31, 2014, the Fund had no tax basis capital losses to offset future capital gains.
At October 31, 2014, the Fund did not defer, on a tax basis, any post-December late year ordinary loss deferrals.
The tax character of distributions paid during fiscal year 2014 and fiscal year 2013 for the Fund were as follow:
| | | | Year Ended | | | Year Ended | |
| | | | October 31, 2014 | | | October 31, 2013 | |
| | Ordinary income | | $ | 2,248,987 | | | $ | — | |
| | Long-term capital gain | | | 980,377 | | | | 1,115,069 | |
| | | | $ | 3,229,364 | | | $ | 1,115,069 | |
8). AGREEMENT AND PLAN OF REORGANIZATION
On December 11, 2013, the Board approved an Agreement and Plan of Reorganization (the “Agreement”), of the Hennessy Japan Small Cap Fund (the “New Fund”), pursuant to which the New Fund would be a successor to the corresponding series of the same name of Hennessy SPARX Funds Trust, a Massachusetts business trust (the “Predecessor Fund”). The Agreement provided for the transfer of assets of the Predecessor Fund to the New Fund and the assumption of the liabilities of the Predecessor Fund by the New Fund. The New Fund had the same investment objective and substantially similar principal investment strategies as the Predecessor Fund. The reorganization was effective as of the close of business on February 28, 2014. The following table illustrates the specifics of the reorganization:
| | | Shares of the New Fund | | | |
| | Predecessor Fund | Issued to Shareholders of | New Fund | Combined | Tax Status |
| | Net Assets | the Predecessor Fund | Net Assets | Net Assets | of Transfer |
| | $16,456,664(1) | 1,713,726 | $16,456,664 | $16,456,664 | Non-taxable |
| | (1) | Included accumulated realized gains and unrealized appreciation in the amounts of $3,437,805 and $1,625,651, respectively. |
9). EVENTS SUBSEQUENT TO YEAR-END
On December 8, 2014, a short-term capital gains distribution of $0.21469 per share and a long-term capital gains distribution of $0.69576 per share were declared and paid to shareholders of record on December 5, 2014.
Report of Independent Registered Public Accounting Firm
The Board of Trustees and Shareholders
Hennessy Funds Trust:
We have audited the accompanying statement of assets and liabilities of Hennessy Japan Small Cap Fund (the Fund), a series of Hennessy Funds Trust (formerly a series of Hennessy SPARX Funds Trust), including the schedule of investments, as of October 31, 2014, and the related statement of operations for the year then ended, the statements of changes in net assets for each of the years in the two-year period then ended, and the financial highlights for each of the years in the five-year period then ended. These financial statements and financial highlights are the responsibility of the Fund’s management. Our responsibility is to express an opinion on these financial statements and financial highlights based on our audits.
We conducted our audits in accordance with the standards of the Public Company Accounting Oversight Board (United States). Those standards require that we plan and perform the audit to obtain reasonable assurance about whether the financial statements and financial highlights are free of material misstatement. An audit includes examining, on a test basis, evidence supporting the amounts and disclosures in the financial statements. Our procedures included confirmation of investments owned as of October 31, 2014, by correspondence with the custodian and brokers or by other appropriate auditing procedures. An audit also includes assessing the accounting principles used and significant estimates made by management, as well as evaluating the overall financial statement presentation. We believe that our audits provide a reasonable basis for our opinion.
In our opinion, the financial statements and financial highlights referred to above present fairly, in all material respects, the financial position of the Fund as of October 31, 2014, and the results of its operations for the year then ended, the changes in its net assets for each of the years in the two-year period then ended, and the financial highlights for each of the years in the five-year period then ended, in conformity with U.S. generally accepted accounting principles.
Milwaukee, Wisconsin
December 30, 2014
HENNESSY FUNDS 1-800-966-4354
Trustees and Officers of the Fund (Unaudited)
The business and affairs of the Fund are managed under the direction of the Fund’s Board of Trustees. Information pertaining to the Trustees and Officers of the Fund is set forth below. The Fund’s Statement of Additional Information includes additional information about the Fund’s Trustees and Officers and is available, without charge, upon request by calling 1-800-966-4354.
| | | | | Number of | |
| | | Term of | | Portfolios | |
| | | Office | | in the | Other |
| | | and | | Fund | Directorships |
| | Position(s) | Length | Principal | Complex | (During Past |
| Name, Address, | Held with | of Time | Occupation(s) | Overseen | Five Years)(2) |
| and Age | the Fund | Served | During Past Five Years | by Trustee | Held by Trustee |
| | | |
| Disinterested Trustees (as defined below) | | |
| | | | | | |
| J. Dennis DeSousa | Trustee | Indefinite, | Mr. DeSousa is a real | 16 | Hennessy SPARX |
| Age: 78 | | until | estate investor. | | Funds Trust; |
| Address: | | successor | | | Hennessy Mutual |
| c/o Hennessy | | elected | | | Funds, Inc.; and |
| Advisors, Inc. | | | | | The Hennessy |
| 7250 Redwood Blvd. | | Served | | | Funds, Inc. |
| Suite 200 | | since | | | |
| Novato, CA 94945 | | January | | | |
| | | 1996 | | | |
| | | for the | | | |
| | | Funds (or | | | |
| | | Predecessor | | | |
| | | Funds) | | | |
| | | | | | |
| Robert T. Doyle | Trustee | Indefinite, | Mr. Doyle has been the | 16 | Hennessy SPARX |
| Age: 67 | | until | Sheriff of Marin County, | | Funds Trust; |
| Address: | | successor | California since 1996. | | Hennessy Mutual |
| c/o Hennessy | | elected | | | Funds, Inc.; and |
| Advisors, Inc. | | | | | The Hennessy |
| 7250 Redwood Blvd. | | Served | | | Funds, Inc. |
| Suite 200 | | since | | | |
| Novato, CA 94945 | | January | | | |
| | | 1996 | | | |
| | | for the | | | |
| | | Funds (or | | | |
| | | Predecessor | | | |
| | | Funds) | | | |
| | | | | | |
| Gerald P. Richardson | Trustee | Indefinite, | Mr. Richardson is an | 16 | Hennessy SPARX |
| Age: 69 | | until | independent consultant | | Funds Trust; |
| Address: | | successor | in the securities industry. | | Hennessy Mutual |
| c/o Hennessy | | elected | | | Funds, Inc.; and |
| Advisors, Inc. | | | | | The Hennessy |
| 7250 Redwood Blvd. | | Served | | | Funds, Inc. |
| Suite 200 | | since | | | |
| Novato, CA 94945 | | May 2004 | | | |
| | | for the | | | |
| | | Funds (or | | | |
| | | Predecessor | | | |
| | | Funds) | | | |
| | | | | Number of | |
| | | Term of | | Portfolios | |
| | | Office | | in the | Other |
| | | and | | Fund | Directorships |
| | Position(s) | Length | Principal | Complex | (During Past |
| Name, Address, | Held with | of Time | Occupation(s) | Overseen | Five Years)(2) |
| and Age | the Fund | Served | During Past Five Years | by Trustee | Held by Trustee |
| | | |
| “Interested Persons” (as defined in the 1940 Act) | | |
| | | | | | |
Neil J. Hennessy(1) | Chief | Trustee: | Mr. Hennessy has been | 16 | Hennessy |
| Age: 58 | Investment | Indefinite, | employed by Hennessy | | Advisors, Inc. |
| Address: | Officer, | until | Advisors, Inc., the Funds’ | | (current); |
| c/o Hennessy | Portfolio | successor | investment advisor, since | | Hennessy SPARX |
| Advisors, Inc. | Manager, | elected | 1989. He currently serves | | Funds Trust; |
| 7250 Redwood Blvd. | President, | | as President, Chairman | | Hennessy Mutual |
| Suite 200 | Trustee | Served | and CEO of Hennessy | | Funds, Inc.; and |
| Novato, CA 94945 | and | since | Advisors, Inc. | | The Hennessy |
| | Chairman | January | | | Funds, Inc. |
| | of the | 1996 | | | |
| | Board | for the | | | |
| | | Funds (or | | | |
| | | Predecessor | | | |
| | | Funds) | | | |
| | | | | | |
| | | Officer: | | | |
| | | 1 year term | | | |
| | | | | | |
| | | Served | | | |
| | | since | | | |
| | | June 2008 | | | |
| | | for the | | | |
| | | Funds (or | | | |
| | | Predecessor | | | |
| | | Funds) | | | |
| | | | | | |
Teresa M. Nilsen(1) | Executive | 1 year term | Ms. Nilsen has been | N/A | N/A |
| Age: 48 | Vice | | employed by Hennessy | | |
| Address: | President | Served | Advisors, Inc., the Funds’ | | |
| c/o Hennessy | and | since | investment advisor, since | | |
| Advisors, Inc. | Treasurer | January | 1989. She currently serves | | |
| 7250 Redwood Blvd. | | 1996 | as Executive Vice President, | | |
| Suite 200 | | for the | Chief Operations Officer, | | |
| Novato, CA 94945 | | Funds (or | Chief Financial Officer, and | | |
| | | Predecessor | Secretary of Hennessy | | |
| | | Funds) | Advisors, Inc. | | |
| (1) | All Officers of the Hennessy Funds and employees of the Manager are Interested Persons of the Funds. |
| (2) | Pursuant to an internal reorganization, the series of Hennessy Mutual Funds, Inc. (“HMFI”), The Hennessy Funds, Inc. (“HFI”) and Hennessy SPARX Funds Trust (“HSFT”) were reorganized into series of Hennessy Funds Trust on February 28, 2014, which mirrored the corresponding series of HFMI, HFI and HSFT. Subsequent to the reorganization, HFMI, HFI and HSFT were dissolved. |
HENNESSY FUNDS 1-800-966-4354
| | | Term of | |
| | | Office | |
| | | and | |
| | Position(s) | Length | Principal |
| Name, Address, | Held with | of Time | Occupation(s) |
| and Age | the Fund | Served | During Past Five Years |
| | | | |
| Interested Persons | | | |
| | | | |
Daniel B. Steadman(1) | Executive | 1 year term | Mr. Steadman has been employed by |
| Age: 58 | Vice President | | Hennessy Advisors, Inc., the Funds’ |
| Address: | and Secretary | Served since | investment advisor, since 2000. |
| c/o Hennessy Advisors, Inc. | | March 2000 | He currently serves as Executive |
| 7250 Redwood Blvd. | | for the Funds (or | Vice President and Chief Compliance |
| Suite 200 | | Predecessor Funds) | Officer of Hennessy Advisors, Inc. |
| Novato, CA 94945 | | | |
| | | | |
Jennifer Cheskiewicz(1) | Senior | 1 year term | Ms. Cheskiewicz has been employed by |
| Age: 37 | Vice President | | Hennessy Advisors, Inc., the Funds’ |
| Address: | and Chief | Served since | investment advisor, since June 2013. |
| c/o Hennessy Advisors, Inc. | Compliance | June 2013 | She previously served as in-house |
| 7250 Redwood Blvd. | Officer | for the Funds (or | counsel to Carlson Capital, L.P., an |
| Suite 200 | | Predecessor Funds) | SEC-registered investment advisor to |
| Novato, CA 94945 | | | several private funds from February |
| | | | 2010 to May 2013. Prior to that, she |
| | | | was an attorney with Gibson, Dunn & |
| | | | Crutcher LLP from September 2005 |
| | | | through February 2010. She currently |
| | | | serves as General Counsel of |
| | | | Hennessy Advisors, Inc. |
| | | | |
Brian Carlson(1) | Senior | 1 year term | Mr. Carlson has been employed by |
| Age: 42 | Vice President | | Hennessy Advisors, Inc., the Funds’ |
| Address: | and Head of | Served since | investment advisor, since |
| c/o Hennessy Advisors, Inc. | Distribution | December 2013 | December 2013. |
| 7250 Redwood Blvd. | | for the Funds (or | |
| Suite 200 | | Predecessor Funds) | Mr. Carlson was previously a |
| Novato, CA 94945 | | | co-founder and principal of Trivium |
| | | | Consultants, LLC from February 2011 |
| | | | through November 2013. Prior to that, |
| | | | he was the Senior Managing Director |
| | | | of NRP Financial, Inc. from August |
| | | | 2007 through February 2011. |
| | | | |
David Ellison(1) | Portfolio Manager | 1 year term | Mr. Ellison has served as Portfolio |
| Age: 56 | and Senior | | Manager of the Large Cap Financial |
| Address: | Vice President | Served since | Fund, the Small Cap Financial Fund, |
| c/o Hennessy Advisors, Inc. | | October 2012 | and the Technology Fund |
| 101 Federal Street | | for the Funds (or | since inception. |
| Suite 1900 | | Predecessor Funds) | |
| Boston, MA 02110 | | | Mr. Ellison previously served as Director, |
| | | | CIO and President of FBR Advisers, Inc. |
| | | | from December 1999 to October 2012. |
| (1) | All Officers of the Hennessy Funds and employees of the Manager are Interested Persons of the Funds. |
| | | Term of | |
| | | Office | |
| | | and | |
| | Position(s) | Length | Principal |
| Name, Address, | Held with | of Time | Occupation(s) |
| and Age | the Fund | Served | During Past Five Years |
| | | | |
| Interested Persons | | | |
| | | | |
Brian Peery(1) | Portfolio Manager | 1 year term | Mr. Peery has been a Portfolio Manager |
| Age: 45 | and | | of the Cornerstone Growth Fund, |
| Address: | Vice President | Served since | the Cornerstone Mid Cap 30 Fund, the |
| c/o Hennessy Advisors, Inc. | | March 2003 | Cornerstone Large Growth Fund, the |
| 7250 Redwood Blvd. | | as Vice President | Cornerstone Value Fund, the Total |
| Suite 200 | | for the Funds (or | Return Fund, and the Balanced Fund |
| Novato, CA 94945 | | Predecessor Funds) | since October 2014. From February |
| | | | 2011 through September 2014, he |
| | | Served since | served as Co-Portfolio Manager of |
| | | February 2011 | the same funds. |
| | | as Co-Portfolio | |
| | | Manager | Mr. Peery has been employed by |
| | | for the Funds (or | Hennessy Advisors, Inc., the Funds’ |
| | | Predecessor Funds) | investment advisor, since 2002. |
| | | | |
Winsor (Skip) Aylesworth(1) | Portfolio Manager | 1 year term | Mr. Aylesworth has been Portfolio |
| Age: 67 | and | | Manager of the Gas Utility Index Fund |
| Address: | Vice President | Served since | since 1998 and Portfolio Manager of |
| c/o Hennessy Advisors, Inc. | | October 2012 | the Technology Fund since inception. |
| 101 Federal Street | | for the Funds (or | |
| Suite 1900 | | Predecessor Funds) | Mr. Aylesworth previously served as |
| Boston, MA 02110 | | | Executive Vice President of The FBR |
| | | | Funds from 1999 to October 2012. |
| | | | |
Ryan Kelley(1) | Portfolio Manager | 1 year term | Mr. Kelley has been a Portfolio Manager |
| Age: 42 | and | | of the Gas Utility Index Fund (formerly |
| Address: | Vice President | Served since | the FBR Gas Utility Index Fund), the |
| c/o Hennessy Advisors, Inc. | | March 2013 | Small Cap Financial Fund (formerly the |
| 1340 Environ Way | | for the Funds (or | FBR Small Cap Financial Fund), and the |
| Chapel Hill, NC 27517 | | Predecessor Funds) | Large Cap Financial Fund (formerly the |
| | | | FBR Large Cap Financial Fund) since |
| | | | October 2014. From March 2013 |
| | | | through September 2014, he served |
| | | | as a Co-Portfolio Manager of the same |
| | | | funds. Prior to that, he was a Portfolio |
| | | | Analyst of the Hennessy Funds. |
| | | | |
| | | | Mr. Kelley previously served as Portfolio |
| | | | Manager of The FBR Funds from |
| | | | January 2008 to October 2012. |
| (1) | All Officers of the Hennessy Funds and employees of the Manager are Interested Persons of the Funds. |
HENNESSY FUNDS 1-800-966-4354
Expense Example (Unaudited)
October 31, 2014
As a shareholder of the Fund, you incur two types of costs: (1) transaction costs, including sales charges (loads) on purchase payments, reinvested dividends, or other distributions; redemption fees; and exchange fees; and (2) ongoing costs, including management fees; service fees; and other Fund expenses. This Example is intended to help you understand your ongoing costs (in dollars) of investing in the Fund and to compare these costs with the ongoing costs of investing in other mutual funds. The Example is based on an investment of $1,000 invested at the beginning of the period and held for the entire period from May 1, 2014 through October 31, 2014.
Actual Expenses
The first line of the table below provides information about actual account values and actual expenses. Although the Fund charges no sales loads or transaction fees, you will be assessed fees for outgoing wire transfers, returned checks and stop payment orders at prevailing rates charged by U.S. Bancorp Fund Services, LLC, the Fund’s transfer agent. If you request that a redemption be made by wire transfer, currently a $15.00 fee is charged by the Fund’s transfer agent. IRA accounts will be charged a $15.00 annual maintenance fee. The example below includes, but is not limited to, management fees, shareholder servicing fees, fund accounting, custody, and transfer agent fees. However, the example below does not include portfolio trading commissions and related expenses, and other extraordinary expenses as determined under generally accepted accounting principles. You may use the information in this line, together with the amount you invested, to estimate the expenses that you paid over the period. Simply divide your account value by $1,000 (for example, an $8,600 account value divided by $1,000 = 8.6), then multiply the result by the number in the first line of the table under the heading entitled “Expenses Paid During Period” to estimate the expenses you paid on your account during this period.
Hypothetical Example for Comparison Purposes
The second line of the table below provides information about hypothetical account values and hypothetical expenses based on the Fund’s actual expense ratios and an assumed rate of return of 5% per year before expenses, which is not the Fund’s actual return. The hypothetical account values and expenses may not be used to estimate the actual ending account balance or expenses you paid for the period. You may use this information to compare the ongoing costs of investing in the Fund and other funds. To do so, compare this 5% hypothetical example with the 5% hypothetical examples that appear in the shareholder reports of the other funds. Please note that the expenses shown in the table are meant to highlight your ongoing costs only and do not reflect any transactional costs, such as sales charges (loads), or exchange fees. Therefore, the second line of the table is useful in comparing ongoing costs only, and will not help you determine the relative total costs of owning different funds. In addition, if these transactional costs were included, your costs would have been higher.
| | Beginning | Ending | Expenses Paid |
| | Account Value | Account Value | During Period(1) |
| | 5/1/14 | 10/31/14 | 5/1/14 – 10/31/14 |
| Investor Class | | | |
| | | | |
| Actual | $1,000.00 | $1,083.50 | $11.40 |
| | | | |
| Hypothetical (5% return | | | |
| before expenses) | $1,000.00 | $1,014.27 | $11.02 |
| (1) | Expenses are equal to the Fund’s expense ratio of 2.17%, multiplied by the average account value over the period, multiplied by 184/365 days (to reflect one-half year period). |
HENNESSY FUNDS 1-800-966-4354
Proxy Voting
A description of the policies and procedures the Fund uses to determine how to vote proxies relating to portfolio securities is available without charge: (1) by calling 1-800-966-4354; (2) on the Hennessy Funds’ website at hennessyfunds.com; or (3) on the U.S. Securities and Exchange Commission’s (the “SEC”) website at www.sec.gov. The Fund’s proxy voting record is available on both the Hennessy Funds’ website at hennessyfunds.com and the SEC’s website at www.sec.gov no later than August 31 for the prior 12 months ending June 30.
Quarterly Filings on Form N-Q
The Fund files its complete schedule of portfolio holdings with the SEC for the first and third quarters of each fiscal year on Form N-Q. The Fund’s Forms N-Q are available on the SEC’s website at www.sec.gov. The Fund’s Forms N-Q may be reviewed and copied at the SEC’s Public Reference Room in Washington, DC and information on the operation of the Public Reference Room may be obtained by calling 1-800-SEC-0330. Information included in the Fund’s Forms N-Q will also be available upon request by calling 1-800-966-4354.
Federal Tax Distribution Information
(Unaudited)
For the fiscal year ended October 31, 2014, certain dividends paid by the Fund may be subject to a maximum tax rate of 20%, as provided for by the Jobs and Growth Tax Relief Reconciliation Act of 2003. The percentage of dividends declared from ordinary income designated as qualified dividend income was 15.55%.
For corporate shareholders, the percent of ordinary income distributions qualifying for the corporate dividends received deduction for the fiscal year ended October 31, 2014 was 0.00%.
The percentage of taxable ordinary income distributions that are designated as short-term capital gain distributions under Section 871(k)(2)(C) of the Internal Revenue Code of 1986, as amended, for the Fund was 100.00%.
For the Year Ended October 31, 2014, the Fund earned foreign source income and paid foreign taxes, as noted below, which it intends to pass through to its shareholders pursuant to Section 853 of the Internal Revenue Code.
| | | Gross Foreign Income | Foreign Tax Paid | |
| | Japan | 366,966 | 36,697 | |
| | | 366,966 | 36,697 | |
Householding
To help keep the Fund’s costs as low as possible, we generally deliver a single copy of most financial reports and prospectuses to shareholders who share an address, even if the accounts are registered under different names. This process, known as “householding,” does not apply to account statements. You may, of course, request an individual copy of a prospectus or financial report at any time. If you would like to receive separate mailings, please call the Administrator at 1-800-261-6950 or 1-414-765-4124 and we will begin individual delivery within 30 days of your request. If your account is held through a financial institution or other intermediary, please contact them directly to request individual delivery.
Privacy Policy
We collect the following non-public personal information about you:
• information we receive from you on or in applications or other forms, correspondence, or conversations, including, but not limited to, your name, address, phone number, social security number, assets, income and date of birth;
and
• information about your transactions with us, our affiliates, or others, including, but not limited to, your account number and balance, payment history, parties to transactions, cost basis information and other financial information.
We do not disclose any non-public personal information about our current or former shareholders to nonaffiliated third parties, except as permitted by law. For example, we are permitted by law to disclose all of the information we collect, as described above, to our Transfer Agent to process your transactions. Furthermore, we restrict access to your non-public personal information to those persons who require such information to provide products or services to you. We maintain physical, electronic and procedural safeguards that comply with federal standards to guard your non-public personal information.
In the event that you hold shares of the Fund through a financial intermediary, including, but not limited to, a broker-dealer, bank or trust company, the privacy policy of your financial intermediary would govern how your non-public personal information would be shared with nonaffiliated third parties.
HENNESSY FUNDS 1-800-966-4354
For information, questions or assistance, please call
The Hennessy Funds
1-800-966-4354 or 1-415-899-1555
INVESTMENT ADVISOR
Hennessy Advisors, Inc.
7250 Redwood Blvd., Suite 200
Novato, California 94945
ADMINISTRATOR,
TRANSFER AGENT,
DIVIDEND PAYING AGENT &
SHAREHOLDER SERVICING AGENT
U.S. Bancorp Fund Services, LLC
P.O. Box 701
Milwaukee, Wisconsin 53201-0701
CUSTODIAN
U.S. Bank N.A.
Custody Operations
1555 North River Center Dr., Suite 302
Milwaukee, Wisconsin 53212
TRUSTEES
Neil J. Hennessy
Robert T. Doyle
J. Dennis DeSousa
Gerald P. Richardson
COUNSEL
Foley & Lardner LLP
777 East Wisconsin Avenue
Milwaukee, Wisconsin 53202-5306
INDEPENDENT REGISTERED
PUBLIC ACCOUNTING FIRM
KPMG LLP
777 East Wisconsin Avenue
Milwaukee, Wisconsin 53202-5306
DISTRIBUTOR
Quasar Distributors, LLC
615 East Michigan Street
Milwaukee, Wisconsin 53202
hennessyfunds.com | 1-800-966-4354
This report has been prepared for shareholders and may be distributed to
others only if preceded or accompanied by a current prospectus.
Item 2. Code of Ethics.
The registrant has adopted a code of ethics that applies to the registrant’s principal executive officer and principal financial officer. In August, the registrant amended its code of ethics to (1) revise certain procedural items related to the personal securities transactions template and (2) to remove the pre-clearance requirement for transactions in the Hennessy Funds within employees’ 401(k) accounts. Then in December, the registrant amended its code of ethics to permit participants in any equity incentive plan of Hennessy Advisors, Inc. to elect to have Hennessy Advisors withhold shares of its common stock otherwise deliverable or vesting under an award to satisfy any tax obligations, even if the election occurs during a quiet period. The registrant has not granted any waivers from any provisions of the code of ethics during the period covered by this report.
A copy of the registrant’s Code of Ethics, as amended to date, is filed herewith, along with an exhibit that shows the portions of the Code of Ethics that were amended, as discussed above.
Item 3. Audit Committee Financial Expert.
The registrant’s board of directors has determined that it does not have an audit committee financial expert serving on its audit committee. At this time, the registrant believes that the financial and business experience provided by each member of the audit committee together offers the registrant adequate oversight for the registrant’s level of financial complexity.
Item 4. Principal Accountant Fees and Services.
The registrant has engaged the principal accountants to the Hennessy Funds, KPMG, LLP and Tait, Weller & Baker, LLP, to perform audit services, audit-related services, tax services and other services during the past two fiscal years. “Audit services” refer to performing an audit of the registrant's annual financial statements or services that are normally provided by the accountants in connection with statutory and regulatory filings or engagements for those fiscal years. “Audit-related services” refer to the assurance and related services by the principal accountants that are reasonably related to the performance of the audit. “Tax services” refer to professional services rendered by the principal accountants for tax compliance, tax advice, and tax planning. The following table details the aggregate fees billed or expected to be billed for each of the last two fiscal years for audit fees, audit-related fees, tax fees and other fees by the principal accountants to the Hennessy Funds.
| | FYE 10/31/2014 | FYE 10/31/2013 |
| Audit Fees | $267,800 | $296,800 |
| Audit-Related Fees | - | - |
| Tax Fees | $58,200 | $63,556 |
| All Other Fees | - | - |
The audit committee has adopted pre-approval policies and procedures that require the audit committee to pre-approve all audit and non-audit services of the registrant, including services provided to any entity affiliated with the registrant. All of the tax services referenced above were pre-approved in accordance with these policies and procedures.
The percentage of fees billed by KPMG, LLP applicable to non-audit services pursuant to waiver of pre-approval requirement were as follows:
| | FYE 10/31/2014 | FYE 10/31/2013 |
| Audit-Related Fees | 0% | 0% |
| Tax Fees | 0% | 0% |
| All Other Fees | 0% | 0% |
| | | |
The percentage of fees billed by Tait, Weller & Baker, LLP applicable to non-audit services pursuant to waiver of pre-approval requirement were as follows:
| | FYE 10/31/2014 | FYE 10/31/2013 |
| Audit-Related Fees | 0% | 0% |
| Tax Fees | 0% | 0% |
| All Other Fees | 0% | 0% |
All of the principal accountants’ hours spent on auditing the registrant’s financial statements were attributed to work performed by full-time permanent employees of the principal accountants.
The following table indicates the non-audit fees billed or expected to be billed by the registrant’s accountants for services to the registrant and to the registrant’s investment adviser (and any other controlling entity, etc.—not sub-adviser) for the last two years. The audit committee of the board of trustees/directors has considered whether the provision of non-audit services that were rendered to the registrant's investment adviser is compatible with maintaining the principal accountants’ independence and has concluded that the provision of such non-audit services by the accountants have not compromised the accountants’ independence.
| Non-Audit Related Fees | FYE 10/31/2014 | FYE 10/31/2013 |
| Registrant | - | - |
| Registrant’s Investment Adviser | - | - |
Item 5. Audit Committee of Listed Registrants.
Not applicable to registrants who are not listed issuers (as defined in Rule 10A-3 under the Securities Exchange Act of 1934).
Item 6. Investments.
Schedule of Investments is included as part of the report to shareholders filed under Item 1 of this Form.
Item 7. Disclosure of Proxy Voting Policies and Procedures for Closed-End Management Investment Companies.
Not applicable to open-end investment companies.
Item 8. Portfolio Managers of Closed-End Management Investment Companies.
Not applicable to open-end investment companies.
Item 9. Purchases of Equity Securities by Closed-End Management Investment Company and Affiliated Purchasers.
Not applicable to open-end investment companies.
Item 10. Submission of Matters to a Vote of Security Holders.
Not Applicable.
Item 11. Controls and Procedures.
| (a) | The Registrant’s President and Treasurer have reviewed the Registrant's disclosure controls and procedures (as defined in Rule 30a-3(c) under the Investment Company Act of 1940 (the “Act”)) as of a date within 90 days of the filing of this report, as required by Rule 30a-3(b) under the Act and Rules 13a-15(b) or 15d-15(b) under the Securities Exchange Act of 1934. Based on their review, such officers have concluded that the disclosure controls and procedures are effective in ensuring that information required to be disclosed in this report is appropriately recorded, processed, summarized and reported and made known to them by others within the Registrant and by the Registrant’s service providers. |
| (b) | There were no changes in the Registrant's internal control over financial reporting (as defined in Rule 30a-3(d) under the Act) that occurred during the second fiscal quarter of the period covered by this report that has materially affected, or is reasonably likely to materially affect, the Registrant's internal control over financial reporting. |
Item 12. Exhibits.
| (a) | (1)(A) Code of ethics that is the subject of the disclosure required by Item 2, to the extent that the registrant intends to satisfy Item 2 requirements through filing of an exhibit. Filed herewith. |
(1)(B) Amendments to code of ethics that is the subject of the disclosure required by Item 2, to the extent that the registrant intends to satisfy Item 2 requirements through filing of an exhibit. Filed herewith, amended pages only.
(2) A separate certification for each principal executive and principal financial officer pursuant to Rule 30a-2(a) under the Act and Section 302 of the Sarbanes-Oxley Act of 2002. Filed herewith.
(3) Any written solicitation to purchase securities under Rule 23c-1 under the Act sent or given during the period covered by the report by or on behalf of the registrant to 10 or more persons. Not applicable to open-end investment companies.
| (b) | Certifications pursuant to Rule 30a-2(b) under the Act and Section 906 of the Sarbanes-Oxley Act of 2002. Furnished herewith. |
SIGNATURES
Pursuant to the requirements of the Securities Exchange Act of 1934 and the Investment Company Act of 1940, the registrant has duly caused this report to be signed on its behalf by the undersigned, thereunto duly authorized.
(Registrant) Hennessy Funds Trust
By (Signature and Title)* /s/Neil J. Hennessy
Neil J. Hennessy, President
Date: January 6, 2015
Pursuant to the requirements of the Securities Exchange Act of 1934 and the Investment Company Act of 1940, this report has been signed below by the following persons on behalf of the registrant and in the capacities and on the dates indicated.
By (Signature and Title)* /s/Neil J. Hennessy
Neil J. Hennessy, President
Date: January 6, 2015
By (Signature and Title)* /s/Teresa M. Nilsen
Teresa M. Nilsen, Treasurer
Date: January 6, 2015