I can hardly believe that we have been navigating through one of the worst pandemics in modern history for more than a year. From the start, our thoughts have been with those affected by COVID-19 and with our frontline healthcare and essential workers. We are encouraged by the rapid rollout of vaccines and the continued reopening of the economy, and we hope this signals a turning point.
This is the first time in over 20 years in this business that I have witnessed volatility as extreme as the volatility that has rocked the financial markets and the economy over the past year. Both the pace of change and the magnitude of change have been staggering. As I reflect on this, I am reminded of a scientific concept called “punctuated equilibrium.” Biologist Stephen Jay Gould revolutionized evolutionary thinking with this theory, which challenged the prevailing belief that biological change happens slowly, consistently, and methodically over time. His theory instead proposed that change happens abruptly and dramatically and that new species pop up and others vanish rapidly, sometimes caused by catastrophic events. In between these explosive periods are much longer intervals of relative stability.
The dramatic market downdraft brought on by the pandemic, followed by the equally dramatic recovery, have been jarring. We witnessed an explosion of IPOs, a plethora of bankruptcies, and a dramatic change in market leadership. Yet unlike in the biological world, we are able to respond to stock market crises and try to dampen their negative impact. There have been numerous and unprecedented fiscal and monetary responses from the Federal Reserve and the U.S. government, and in many ways these measures may have spurred the economic recovery.
For the first six months of our fiscal year through April 30, 2021, the market appeared to be on a relentless march higher, with the S&P 500® Index rising 28.85% on a total return basis, setting new all-time highs 35 times in 124 trading days and closing at its then-highest level ever on April 29, 2021. We saw a dramatic shift back toward value investing, and many of the sectors and individual stocks that had underperformed for most of last year soared. Value outperformed growth, small-caps beat mid-caps, and mid-caps beat large-caps. The Energy and Financials sectors skyrocketed, as evidenced by the S&P 500® Energy Index’s total return of 75.94% and the Russell 1000® Index Financials’ total return of 52.00% during the six-month period. As we begin to move beyond the chaos caused by the pandemic, solid market fundamentals are reappearing, which we believe underscores the health and strength of our economy.
We are pleased with the performance of our mutual funds during the first half of our fiscal year. On an absolute basis, each of our 16 Funds achieved positive performance, and 11 of our 16 funds outperformed their primary benchmark. Ten of our 11 domestic equity-only Funds outperformed the S&P 500® Index, and three of our sector Funds posted total returns of over 50%, due primarily to their focus on the Energy and Financials sectors. We believe this was a favorable period for both our style of high-conviction investing as well as the areas and sectors of the market in which our Funds focus. While performance may wax and wane over a complete market cycle, we remain committed to managing our portfolios for long-term performance, ever mindful of downside risk.
Circling back to Gould’s theory of punctuated equilibrium, we are left with the question, “Where do we go from here?” Are we entering a more stable period in the economy and the market, similar to the periods of relative stasis in the geological record? We are optimistic that this may in fact be the case and that the markets will return to a less volatile part of the cycle. But, with history as our guide, we know that even the greatest bull markets have experienced corrections along the way. While certain individual stock or sector valuations might look stretched, we believe the market as a whole has more room to run. Strong GDP growth and increasing earnings expectations for this year, a potentially lower-for-longer interest rate environment, accommodative fiscal and monetary policies, a healthy and robust financial system, low unemployment and solid wage growth, and a measured reopening of certain parts of the economy all support the market moving higher from here.
We remain committed to our shareholders as we thoughtfully navigate these unprecedented times. We know that you have a multitude of investment options to choose from, and we are grateful for the trust you put in us and your continued interest and investment in our family of Funds. Should you have any questions or would like to speak with us, please don’t hesitate to call us directly at (800) 966-4354.
Mutual fund investing involves risk. Principal loss is possible.
Opinions expressed are those of Ryan C. Kelley and are subject to change, are not guaranteed, and should not be considered investment advice.
Performance data quoted represents past performance; past performance does not guarantee future results. The investment return and principal value of an investment will fluctuate so that an investor’s shares, when redeemed, may be worth more or less than their original cost. The performance table does not reflect the deduction of taxes that a shareholder would pay on Fund distributions or the redemption of Fund shares. Current performance of the Fund may be lower or higher than the performance quoted. Performance data current to the most recent month end may be obtained by visiting www.hennessyfunds.com. Performance shown for periods including or prior to October 26, 2012, is that of the FBR Balanced Fund.
The 60/40 Blended Balanced Index consists of 60% common stocks represented by the S&P 500® Index and 40% bonds represented by the Bloomberg Barclays Intermediate U.S. Government/Credit Index. The 70/30 Blended Balanced Index consists of 70% common stocks represented by the S&P 500® Index and 30% bonds represented by the Bloomberg Barclays Intermediate U.S. Government/Credit Index. The Bloomberg Barclays Intermediate U.S. Government/Credit Index measures the performance of U.S. dollar-denominated Treasury securities and government-related and investment-grade corporate securities that have $250 million or more of outstanding face value, are fixed rate and non-convertible, and have remaining maturities of greater than or equal to one year and less than 10 years. The S&P 500® Index is a capitalization-weighted index that is designed to represent the broad domestic economy through changes in the aggregate market value of 500 stocks across all major industries. One cannot invest directly in an index. These indices are used herein for comparative purposes in accordance with Securities and Exchange Commission regulations.
The expense ratios presented are from the most recent prospectus. The expense ratios for the current reporting period are available in the Financial Highlights section of this report.
Note: For presentation purposes, the Fund has grouped some of the industry categories. For purposes of categorizing securities for compliance with Section 8(b)(1) of the Investment Company Act of 1940, as amended, the Fund uses more specific industry classifications.
The accompanying notes are an integral part of these financial statements.
The accompanying notes are an integral part of these financial statements.
The accompanying notes are an integral part of these financial statements.
The accompanying notes are an integral part of these financial statements.
The accompanying notes are an integral part of these financial statements.
The accompanying notes are an integral part of these financial statements.
The accompanying notes are an integral part of these financial statements.
Percentages are stated as a percent of net assets.
The accompanying notes are an integral part of these financial statements.
The following is a summary of the inputs used to value the Fund’s net assets as of April 30, 2021 (see Note 3 in the accompanying Notes to the Financial Statements):
The accompanying notes are an integral part of these financial statements.
The accompanying notes are an integral part of these financial statements.
The accompanying notes are an integral part of these financial statements.
The accompanying notes are an integral part of these financial statements.
The accompanying notes are an integral part of these financial statements.
The accompanying notes are an integral part of these financial statements.
The accompanying notes are an integral part of these financial statements.
The accompanying notes are an integral part of these financial statements.
The Hennessy Equity and Income Fund (the “Fund”) is a series of Hennessy Funds Trust (the “Trust”), which was organized as a Delaware statutory trust on September 17, 1992. The Fund is an open-end management investment company registered under the Investment Company Act of 1940, as amended. The investment objective of the Fund is long-term capital growth and current income. The Fund is a diversified fund.
The Fund offers Investor Class and Institutional Class shares. Each class of shares differs principally in its respective 12b-1 distribution and service, shareholder servicing, and sub-transfer agent expenses. There are no sales charges. Each class has identical rights to earnings, assets, and voting privileges, except for class-specific expenses and exclusive rights to vote on matters affecting only one class.
As an investment company, the Fund follows the investment company accounting and reporting guidance of the Financial Accounting Standards Board (“FASB”) Accounting Standard Codification Topic 946 “Financial Services—Investment Companies.”
The following is a summary of significant accounting policies consistently followed by the Fund in the preparation of the financial statements. These policies conform to U.S. generally accepted accounting principles (“GAAP”).
The Fund follows its valuation policies and procedures in determining its net asset value and, in preparing these financial statements, the fair value accounting standards that establish an authoritative definition of fair value and set out a hierarchy for measuring fair value. These standards require additional disclosures about the various inputs and valuation techniques used to develop the measurements of fair value and a discussion of changes in valuation techniques and related inputs during the period. These inputs are summarized in the three broad levels listed below:
The following is a description of the valuation techniques applied to the Fund’s major categories of assets and liabilities on a recurring basis:
The Board of Trustees of the Fund (the “Board”) has adopted fair value pricing procedures that are followed when a price for a security is not readily available or if a significant event has occurred that indicates the closing price of a security no longer represents the true value of that security. Fair value pricing determinations are made in good faith in accordance with these procedures. There are numerous criteria considered in determining a fair value of a security, such as the trading volume of a security and markets, the values of other similar securities, and news events with direct bearing on a security or markets. Fair value pricing results in an estimated price for a security that reflects the amount the Fund might reasonably expect to receive in a current sale. Depending on the relative significance of the valuation inputs, these securities may be classified in either Level 2 or Level 3 of the fair value hierarchy.
The fair value of foreign securities may be determined with the assistance of a pricing service using correlations between the movement of prices of such securities and indices of domestic securities and other appropriate indicators, such as closing market prices of relevant American Depositary Receipts or futures contracts. Using fair value pricing means that the Fund’s NAV reflects the affected portfolio securities’ values as determined by the Board or its designee, pursuant to the fair value pricing procedures adopted by the Board, instead of being determined by the market. Using a fair value pricing methodology to price a foreign security may result in a value that is different from such foreign security’s most recent closing price and from the value used by other investment companies to calculate their NAVs. Such securities are generally classified in Level 2 of the fair value hierarchy. Because the Fund may invest in foreign securities, the value of the Fund’s portfolio securities may change on days when a shareholder is unable to purchase or redeem Fund shares.
The Board has delegated day-to-day valuation matters to the Valuation and Liquidity Committee comprising representatives from Hennessy Advisors, Inc., the Fund’s investment advisor (the “Advisor”). The function of the Valuation and Liquidity Committee, among other things, is to value securities where current and reliable market quotations are not readily available. All actions taken by the Valuation and Liquidity Committee are reviewed by the Board.
The Fund has performed an analysis of all existing investments to determine the significance and character of all inputs to their fair value determinations. Various inputs are used to determine the value of the Fund’s investments. The inputs or methodology used for valuing securities are not necessarily an indication of the risk associated with investing in those securities. Details related to the fair value hierarchy of the Fund’s securities as of April 30, 2021, are included in the Schedule of Investments.
Purchases and sales of investment securities (excluding government and short-term investments) for the Fund during the six months ended April 30, 2021, were $15,076,921 and $21,930,339, respectively.
Purchases and sales/maturities of long-term U.S. government securities for the Fund during the six months ended April 30, 2021, were $0 and $1,952,386, respectively.
The Advisor provides the Fund with investment advisory services under an Investment Advisory Agreement. The Advisor oversees the provision of investment advice and furnishes office space, facilities, and most of the personnel needed by the Fund. As compensation for its services, the Advisor is entitled to a monthly fee from the Fund. The fee is based on the average daily net assets of the Fund at an annual rate of 0.80%. The net investment advisory fees expensed by the Fund during the six months ended April 30, 2021, are included in the Statement of Operations.
The Advisor has delegated the day-to-day management of the equity allocation of the Fund to a sub-advisor, The London Company of Virginia, LLC, and has delegated the day-to-day management of the fixed income allocation of the Fund to a sub-advisor, FCI Advisors. The Advisor pays the sub-advisory fees from its own assets, and these fees are not an additional expense of the Fund. During the six months ended April 30, 2021, the Advisor (not the Fund) paid a sub-advisory fee at the rate of 0.33% of the daily net assets of the equity allocation of the Fund and 0.27% of the daily net assets of the fixed income allocation of the Fund.
The Board has approved a Shareholder Servicing Agreement for Investor Class shares of the Fund, which compensates the Advisor for the non-investment advisory services it
provides to the Fund. The Shareholder Servicing Agreement provides for a monthly fee paid to the Advisor at an annual rate of 0.10% of the average daily net assets of the Fund attributable to Investor Class shares. The shareholder service fees expensed by the Fund during the six months ended April 30, 2021, are included in the Statement of Operations.
The Fund has adopted a plan pursuant to Rule 12b-1 under the Investment Company Act of 1940, as amended, that authorizes payments in connection with the distribution of Fund shares at an annual rate of up to 0.25% of the Fund’s average daily net assets attributable to Investor Class shares. Even though the authorized rate is up to 0.25%, the Fund is currently only using up to 0.15% of its average daily net assets attributable to Investor Class shares for such purpose. Amounts paid under the plan may be spent on any activities or expenses primarily intended to result in the sale of shares, including, but not limited to, advertising, shareholder account servicing, printing and mailing of prospectuses to other than current shareholders, printing and mailing of sales literature, and compensation for sales and marketing activities or to financial institutions and others, such as dealers and distributors. The distribution fees expensed by the Fund during the six months ended April 30, 2021, are included in the Statement of Operations.
The Fund has entered into agreements with various brokers, dealers, and financial intermediaries in connection with the sale of Fund shares. The agreements provide for periodic payments of sub-transfer agent expenses by the Fund to the brokers, dealers, and financial intermediaries for providing certain shareholder maintenance services. These shareholder services include the pre-processing and quality control of new accounts, shareholder correspondence, answering customer inquiries regarding account status, and facilitating shareholder telephone transactions. The sub-transfer agent fees expensed by the Fund during the six months ended April 30, 2021, are included in the Statement of Operations.
U.S. Bancorp Fund Services, LLC, d/b/a U.S. Bank Global Fund Services (“Fund Services”) provides the Fund with administrative, accounting, and transfer agent services. As administrator, Fund Services is responsible for activities such as (i) preparing various federal and state regulatory filings, reports, and returns for the Fund, (ii) preparing reports and materials to be supplied to the Board, (iii) monitoring the activities of the Fund’s custodian, transfer agent, and accountants, and (iv) coordinating the preparation and payment of the Fund’s expenses and reviewing the Fund’s expense accruals. U.S. Bank N.A., an affiliate of Fund Services, serves as the Fund’s custodian. The servicing agreements between the Trust, Fund Services, and U.S. Bank N.A. contain a fee schedule that is inclusive of administrative, accounting, custody, and transfer agent fees. The administrative, accounting, custody, and transfer agent fees expensed by the Fund during the six months ended April 30, 2021, are included in the Statement of Operations.
Quasar Distributors, LLC (“Quasar”), a wholly owned broker-dealer subsidiary of Foreside Financial Group, LLC, acts as the Fund’s principal underwriter in a continuous public offering of Fund shares.
The officers of the Fund are affiliated with the Advisor. With the exception of the Chief Compliance Officer and the Senior Compliance Officer, such officers receive no compensation from the Fund for serving in their respective roles. The Fund, along with the other funds in the Hennessy Funds family (collectively, the “Hennessy Funds”), makes reimbursement payments on an equal basis to the Advisor for a portion of the salary and benefits associated with the office of the Chief Compliance Officer and for all of the salary and benefits associated with the office of the Senior Compliance Officer. The compliance fees expensed by the Fund during the six months ended April 30, 2021, are included in the Statement of Operations.
Under the Hennessy Funds’ organizational documents, their officers and trustees are indemnified by the Hennessy Funds against certain liabilities arising out of the performance of their duties to the Hennessy Funds. Additionally, in the normal course of business, the Hennessy Funds enter into contracts with service providers that contain general indemnification clauses. The Fund’s maximum exposure under these arrangements is unknown as this would involve future claims that may be made against the Fund that have not yet occurred. Currently, the Fund expects the risk of loss to be remote.
The Fund has an uncommitted line of credit with the other Hennessy Funds in the amount of the lesser of (i) $100,000,000 or (ii) 33.33% of each Hennessy Fund’s net assets, or 30% for the Hennessy Gas Utility Fund and 10% for the Hennessy Balanced Fund. The line of credit is intended to provide any necessary short-term financing in connection with shareholder redemptions, subject to certain restrictions. The credit facility is with the Hennessy Funds’ custodian bank, U.S. Bank N.A. Borrowings under this arrangement bear interest at the bank’s prime rate and are secured by all of the Fund’s assets (as to its own borrowings only). During the six months ended April 30, 2021, the Fund did not have any borrowings outstanding under the line of credit.
As of October 31, 2020, the Fund’s most recent fiscal year end, the components of accumulated earnings (losses) for income tax purposes were as follows:
The difference between book-basis unrealized appreciation/depreciation and tax-basis unrealized appreciation/depreciation (as shown above) is attributable primarily to wash sales.
As of October 31, 2020, the Fund had no tax-basis capital losses to offset future capital gains.
As of October 31, 2020, the Fund did not defer, on a tax basis, any late-year ordinary losses. Late-year ordinary losses are net ordinary losses incurred after December 31, 2019, but within the taxable year, that are deemed to arise on the first day of the Fund’s next taxable year.
During fiscal year 2021 (year to date) and fiscal year 2020, the tax character of distributions paid by the Fund was as follows:
The Fund invests in financial instruments with payment obligations, financing terms, hedging strategies, or investment values based on, among other floating rates, the London Interbank Offered Rate (“LIBOR”). LIBOR is the offered rate for short-term Eurodollar deposits between major international banks. On July 27, 2017, the UK Financial Conduct Authority, which regulates LIBOR, announced that it would no longer persuade or compel banks to submit rates for the calculation of LIBOR after 2021, meaning that LIBOR cannot continue on its current basis and will not be guaranteed after 2021. Regulators and industry working groups have suggested alternative reference rates, but global consensus is lacking, and the process for amending existing contracts or instruments to transition away from LIBOR remains unclear. The transition away from LIBOR may lead to increased volatility and illiquidity in markets tied to LIBOR, reduce the value of LIBOR-related instruments, and reduce the effectiveness of hedging strategies, which could adversely affect the Fund’s performance. Additionally, any alternative reference rate may be an ineffective substitute, resulting in prolonged adverse market conditions for the Fund’s investments.
Management has evaluated the Fund’s related events and transactions that occurred subsequent to April 30, 2021, through the date of issuance of the Fund’s financial statements. Management has determined that there were no subsequent events requiring recognition or disclosure in the financial statements.
As a shareholder of the Fund, you incur ongoing costs, including management fees, service fees, and other Fund expenses. This Example is intended to help you understand your ongoing costs (in dollars) of investing in the Fund and to compare these costs with the ongoing costs of investing in other mutual funds. The Example is based on an investment of $1,000 invested at the beginning of the period and held for the entire period from November 1, 2020, through April 30, 2021.
In the table below, the first line under each of the “Investor Class” and “Institutional Class” headings provides information about actual account values and actual expenses for each share class. You may use this information, together with the amount you invested, to estimate the expenses that you paid over the period. Simply divide your account value by $1,000 (for example, an $8,600 account value divided by $1,000 = 8.6), then multiply the result by the number in the first line under the heading entitled “Expenses Paid During Period” to estimate the expenses you paid on your account during this period. Although the Fund charges no sales loads or transaction fees, you will be assessed fees for outgoing wire transfers, returned checks, and stop payment orders at prevailing rates charged by U.S. Bank Global Fund Services, the Fund’s transfer agent. If you request that a redemption be made by wire transfer, the Fund’s transfer agent charges a $15 fee. IRAs are charged a $15 annual maintenance fee (up to $30 maximum per shareholder for shareholders with multiple IRAs). The examples below include, but are not limited to, management, shareholder servicing, accounting, custody, and transfer agent fees. However, the examples below do not include portfolio trading commissions and related expenses.
In the table below, the second line under each of the “Investor Class” and “Institutional Class” headings provides information about hypothetical account values and hypothetical expenses based on the Fund’s actual expense ratio for each share class and an assumed rate of return of 5% per year before expenses, which is not the Fund’s actual return for such share class. The hypothetical account values and expenses may not be used to estimate the actual ending account balance or expenses you paid for the period. You may use this information to compare the ongoing costs of investing in the Fund and other funds. To do so, compare these 5% hypothetical examples with the 5% hypothetical examples that appear in the shareholder reports of the other funds. Please note that the expenses shown in the table are meant to highlight your ongoing costs only. Therefore, the second lines under “Investor Class” and “Institutional Class” headings are useful in comparing ongoing costs only and will not help you determine the relative total costs of owning different funds.
A description of the policies and procedures the Fund uses to determine how to vote proxies relating to portfolio securities is available without charge (1) by calling 1-800-966-4354, (2) on the Hennessy Funds’ website at www.hennessyfunds.com/proxy-voting/voting-policy, or (3) on the U.S. Securities and Exchange Commission’s (the “SEC”) website at www.sec.gov. The Fund’s proxy voting record is available without charge on both the Hennessy Funds’ website at www.hennessyfunds.com/proxy-voting/voting-record and the SEC’s website at www.sec.gov no later than August 31 for the prior 12 months ending June 30.
The Fund files a complete schedule of portfolio holdings with the SEC for the first and third quarters of each fiscal year as an exhibit to its reports on Form N-PORT. The Fund’s Form N-PORT reports are available on the SEC’s website at www.sec.gov or on request by calling 1-800-966-4354.
For fiscal year 2020, certain dividends paid by the Fund may be subject to a maximum tax rate of 23.8%, as provided for by the Jobs and Growth Tax Relief Reconciliation Act of 2003. The percentage of dividends declared from ordinary income designated as qualified dividend income was 100.00%.
For corporate shareholders, the percent of ordinary income distributions that qualified for the corporate dividends received deduction for fiscal year 2020 was 100.00%.
The percentage of taxable ordinary income distributions that were designated as short-term capital gain distributions under Section 871(k)(2)(C) of the Internal Revenue Code of 1986, as amended, for the Fund was 0.00%.
To help keep the Fund’s costs as low as possible, we generally deliver a single copy of notices, shareholder reports, proxy statements, and prospectuses to shareholders who share an address and have the same last name. This process does not apply to account statements. You may request an individual copy of a shareholder document at any time. If you would like to receive separate mailings of shareholder documents, please call U.S. Bank Global Fund Services at 1-800-261-6950 or 1-414-765-4124, and individual delivery will begin within 30 days of your request. If your account is held through a financial institution or other intermediary, please contact such intermediary directly to request individual delivery.
As permitted by SEC regulations, the Fund’s shareholder reports are made available on a website, and unless you sign up for eDelivery or elect to receive paper copies as detailed below, you will be notified by mail each time a report is posted and provided with a website link to access the report.
The Fund also offers shareholders the option to receive all notices, account statements, prospectuses, tax forms, and shareholder reports online. To sign up for eDelivery or change your delivery preference, please visit www.hennessyfunds.com/account.
To elect to receive paper copies of all future reports free of charge, please call U.S. Bank Global Fund Services at 1-800-261-6950 or 1-414-765-4124.
Subscribe to receive our team’s unique market and sector insights delivered to your inbox
At its meeting on March 10, 2021, the Board of Trustees of the Fund (the “Board,” and the members thereof, the “Trustees”) unanimously approved the continuation of the investment advisory agreement of the Fund with Hennessy Advisors, Inc. (the “Advisor”) and the sub-advisory agreement for the equity allocation of the Fund between the Advisor and The London Company, LLC, and the sub-advisory agreement for the fixed income allocation of the Fund between the Advisor and Financial Counselors, Inc. (with The London Company, LLC and Financial Counselors, Inc., each herein referred to individually as a “Sub-Advisor” and together as the “Sub-Advisors”). As part of the process, the Trustees reviewed their fiduciary duties and the relevant factors for them to consider with respect to approving the advisory and sub-advisory agreements. In addition, the Trustees who are not deemed “interested persons” (as defined by the Investment Company Act of 1940, as amended) of the Fund (the “Independent Trustees”) met in executive session to discuss the approval of the advisory and sub-advisory agreements.
In advance of the meeting, the Advisor sent detailed information to the Trustees to assist them in their evaluation of the advisory and sub-advisory agreements. This information included, but was not limited to, the following:
All of the factors discussed were considered as a whole by the Trustees and by the Independent Trustees meeting in executive session. The factors were viewed in their totality by the Trustees, with no single factor being the principal or determinative factor in the Trustees’ determination of whether to approve the continuation of the advisory and sub-advisory agreements. The Trustees recognized that the management and fee
arrangements for the Fund are the result of years of review and discussion between the Independent Trustees and the Advisor, that certain aspects of such arrangements may receive greater scrutiny in some years than in others, and that the Trustees’ conclusions may be based, in part, on their consideration of these same arrangements and information received during the course of the year and in prior years.
Prior to approving the continuation of the advisory and sub-advisory agreements, the Trustees, including the Independent Trustees in executive session, considered, among other items:
The material considerations and determinations of the Trustees, including the Independent Trustees, were as follows:
After reviewing the materials and information provided at the meeting, as well as other information regularly provided at the Board’s quarterly meetings throughout the year regarding the quality of services provided by the Advisor and the Sub-Advisors, the performance of the Fund, expense information, brokerage commissions information, the adequacy and efficacy of the Advisor’s and the Sub-Advisors’ written policies and procedures, other regulatory compliance issues, trading information and related matters, and other factors that the Trustees deemed relevant, the Trustees, including the Independent Trustees, approved the continuation of the advisory and sub-advisory agreements.
Hennessy Advisors, Inc.
U.S. Bancorp Fund Services, LLC
d/b/a U.S. Bank Global Fund Services
P.O. Box 701
U.S. Bank N.A.
Neil J. Hennessy
Robert T. Doyle
J. Dennis DeSousa
Gerald P. Richardson
others only if preceded or accompanied by a current prospectus.
SEMI-ANNUAL REPORT
APRIL 30, 2021
HENNESSY BALANCED FUND
Investor Class HBFBX
www.hennessyfunds.com | 1-800-966-4354
(This Page Intentionally Left Blank.)
Contents
| Letter to Shareholders | 2 |
| Performance Overview | 4 |
| Financial Statements | |
| Schedule of Investments | 5 |
| Statement of Assets and Liabilities | 8 |
| Statement of Operations | 9 |
| Statements of Changes in Net Assets | 11 |
| Financial Highlights | 12 |
| Notes to the Financial Statements | 14 |
| Expense Example | 21 |
| Proxy Voting Policy and Proxy Voting Records | 22 |
| Availability of Quarterly Portfolio Schedule | 22 |
| Federal Tax Distribution Information | 22 |
| Important Notice Regarding Delivery of Shareholder Documents | 22 |
| Electronic Delivery | 22 |
| Board Approval of Investment Advisory Agreement | 23 |
| HENNESSY FUNDS | 1-800-966-4354 | |
May 2021
Dear Hennessy Funds Shareholder:
I can hardly believe that we have been navigating through one of the worst pandemics in modern history for more than a year. From the start, our thoughts have been with those affected by COVID-19 and with our frontline healthcare and essential workers. We are encouraged by the rapid rollout of vaccines and the continued reopening of the economy, and we hope this signals a turning point.
This is the first time in over 20 years in this business that I have witnessed volatility as extreme as the volatility that has rocked the financial markets and the economy over the past year. Both the pace of change and the magnitude of change have been staggering. As I reflect on this, I am reminded of a scientific concept called “punctuated equilibrium.” Biologist Stephen Jay Gould revolutionized evolutionary thinking with this theory, which challenged the prevailing belief that biological change happens slowly, consistently, and methodically over time. His theory instead proposed that change happens abruptly and dramatically and that new species pop up and others vanish rapidly, sometimes caused by catastrophic events. In between these explosive periods are much longer intervals of relative stability.
The dramatic market downdraft brought on by the pandemic, followed by the equally dramatic recovery, have been jarring. We witnessed an explosion of IPOs, a plethora of bankruptcies, and a dramatic change in market leadership. Yet unlike in the biological world, we are able to respond to stock market crises and try to dampen their negative impact. There have been numerous and unprecedented fiscal and monetary responses from the Federal Reserve and the U.S. government, and in many ways these measures may have spurred the economic recovery.
For the first six months of our fiscal year through April 30, 2021, the market appeared to be on a relentless march higher, with the S&P 500® Index rising 28.85% on a total return basis, setting new all-time highs 35 times in 124 trading days and closing at its then-highest level ever on April 29, 2021. We saw a dramatic shift back toward value investing, and many of the sectors and individual stocks that had underperformed for most of last year soared. Value outperformed growth, small-caps beat mid-caps, and mid-caps beat large-caps. The Energy and Financials sectors skyrocketed, as evidenced by the S&P 500® Energy Index’s total return of 75.94% and the Russell 1000® Index Financials’ total return of 52.00% during the six-month period. As we begin to move beyond the chaos caused by the pandemic, solid market fundamentals are reappearing, which we believe underscores the health and strength of our economy.
We are pleased with the performance of our mutual funds during the first half of our fiscal year. On an absolute basis, each of our 16 Funds achieved positive performance, and 11 of our 16 funds outperformed their primary benchmark. Ten of our 11 domestic equity-only Funds outperformed the S&P 500® Index, and three of our sector Funds posted total returns of over 50%, due primarily to their focus on the Energy and Financials sectors. We believe this was a favorable period for both our style of high-conviction investing as well as the areas and sectors of the market in which our Funds focus. While performance may wax and wane over a complete market cycle, we remain committed to managing our portfolios for long-term performance, ever mindful of downside risk.
Circling back to Gould’s theory of punctuated equilibrium, we are left with the question, “Where do we go from here?” Are we entering a more stable period in the economy and the market, similar to the periods of relative stasis in the geological record? We are optimistic that this may in fact be the case and that the markets will return to a less volatile part of the cycle. But, with history as our guide, we know that even the greatest bull markets have experienced corrections along the way. While certain individual stock or sector valuations might look stretched, we believe the market as a whole has more room to run. Strong GDP growth and increasing earnings expectations for this year, a potentially lower-for-longer interest rate environment, accommodative fiscal and monetary policies, a healthy and robust financial system, low unemployment and solid wage growth, and a measured reopening of certain parts of the economy all support the market moving higher from here.
We remain committed to our shareholders as we thoughtfully navigate these unprecedented times. We know that you have a multitude of investment options to choose from, and we are grateful for the trust you put in us and your continued interest and investment in our family of Funds. Should you have any questions or would like to speak with us, please don’t hesitate to call us directly at (800) 966-4354.
Best regards,

| |
| |
| |
| |
 |
| Ryan C. Kelley |
| Chief Investment Officer |
Past performance does not guarantee future results. To obtain current standardized performance for the Hennessy Funds, visit https://www.hennessyfunds.com/funds/price-performance.
Mutual fund investing involves risk. Principal loss is possible.
Opinions expressed are those of Ryan C. Kelley and are subject to change, are not guaranteed, and should not be considered investment advice.
The S&P 500® Index is a capitalization-weighted index that is designed to represent the broad domestic economy through changes in aggregate market value of 500 stocks across all major industries. The S&P 500® Energy Index comprises those companies included in the S&P 500® Index that are classified in the Energy sector. The Russell 1000® Index Financials is a subset of the Russell 1000® Index that measures the performance of securities classified in the Financials sector of the large-capitalization U.S. equity market. The indices are used herein for comparative purposes in accordance with SEC regulations. One cannot invest directly in an index. All returns are shown on a total return basis.
| HENNESSY FUNDS | 1-800-966-4354 | |
Performance Overview (Unaudited)
AVERAGE ANNUAL TOTAL RETURN FOR PERIODS ENDED APRIL 30, 2021
| | Six | One | Five | Ten |
| | Months(1) | Year
| Years
| Years
|
| Hennessy Balanced Fund (HBFBX) | 15.16% | 12.94% | 5.37% | 4.98% |
| 50/50 Blended DJIA/Treasury Index | 13.99% | 19.84% | 9.10% | 7.03% |
| Dow Jones Industrial Average | 29.07% | 42.12% | 16.48% | 12.95% |
Expense ratio: 1.89%
(1) | Periods of less than one year are not annualized. |
_______________
Performance data quoted represents past performance; past performance does not guarantee future results. The investment return and principal value of an investment will fluctuate so that an investor’s shares, when redeemed, may be worth more or less than their original cost. The performance table does not reflect the deduction of taxes that a shareholder would pay on Fund distributions or the redemption of Fund shares. Current performance of the Fund may be lower or higher than the performance quoted. Performance data current to the most recent month end may be obtained by visiting www.hennessyfunds.com.
The 50/50 Blended DJIA/Treasury Index consists of 50% common stocks represented by the Dow Jones Industrial Average and 50% short-duration Treasury securities represented by the ICE BofAML 1-Year U.S. Treasury Note Index, which comprises U.S. Treasury securities maturing in approximately one year. The Dow Jones Industrial Average is a price-weighted average of 30 significant stocks traded on the New York Stock Exchange or The NASDAQ Stock Market. One cannot invest directly in an index. These indices are used herein for comparative purposes in accordance with Securities and Exchange Commission regulations.
The expense ratio presented is from the most recent prospectus. The expense ratio for the current reporting period is available in the Financial Highlights section of this report.
| PERFORMANCE OVERVIEW/SCHEDULE OF INVESTMENTS |
Financial Statements
Schedule of Investments as of April 30, 2021 (Unaudited) |
HENNESSY BALANCED FUND
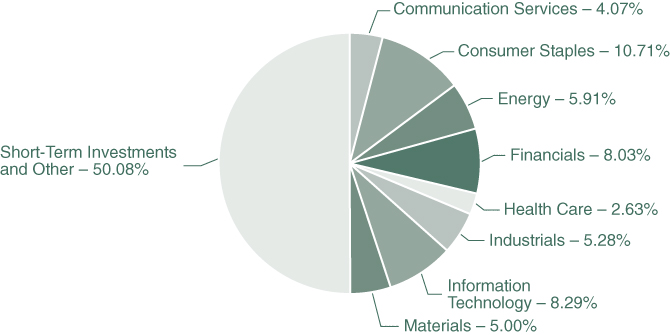
(% of Net Assets)
| TOP TEN HOLDINGS (EXCLUDING MONEY MARKET FUNDS) | % NET ASSETS |
| U.S. Treasury Bill, 0.090%, 01/27/2022 | 19.35% |
| U.S. Treasury Bill, 0.010%, 06/17/2021 | 8.19% |
| U.S. Treasury Bill, 0.110%, 12/02/2021 | 7.44% |
| Walgreens Boots Alliance, Inc. | 5.69% |
| JPMorgan Chase & Co. | 5.32% |
| Chevron Corp. | 5.29% |
| 3M Co. | 5.28% |
| U.S. Treasury Bill, 0.035%, 11/04/2021 | 5.21% |
| The Coca-Cola Co. | 5.02% |
| International Business Machines Corp. | 5.01% |
Note: For presentation purposes, the Fund has grouped some of the industry categories. For purposes of categorizing securities for compliance with Section 8(b)(1) of the Investment Company Act of 1940, as amended, the Fund uses more specific industry classifications.
The Global Industry Classification Standard (GICS®) was developed by and is the exclusive property and a service mark of MSCI, Inc. and Standard & Poor’s Financial Services LLC. It has been licensed for use by the Hennessy Funds.
| HENNESSY FUNDS | 1-800-966-4354 | |
| COMMON STOCKS – 49.92% | | Number | | | | | | % of | |
| | | of Shares | | | Value | | | Net Assets | |
| Communication Services – 4.07% | | | | | | | | | |
| Verizon Communications, Inc. | | | 9,450 | | | $ | 546,116 | | | | 4.07 | % |
| | | | | | | | | | | | | |
| Consumer Staples – 10.71% | | | | | | | | | | | | |
| The Coca-Cola Co. | | | 12,500 | | | | 674,750 | | | | 5.02 | % |
| Walgreens Boots Alliance, Inc. | | | 14,400 | | | | 764,640 | | | | 5.69 | % |
| | | | | | | | 1,439,390 | | | | 10.71 | % |
| | | | | | | | | | | | | |
| Energy – 5.91% | | | | | | | | | | | | |
| Chevron Corp. | | | 6,900 | | | | 711,183 | | | | 5.29 | % |
| Exxon Mobil Corp. | | | 1,450 | | | | 82,998 | | | | 0.62 | % |
| | | | | | | | 794,181 | | | | 5.91 | % |
| | | | | | | | | | | | | |
| Financials – 8.03% | | | | | | | | | | | | |
| JPMorgan Chase & Co. | | | 4,650 | | | | 715,217 | | | | 5.32 | % |
| Travelers Companies, Inc. | | | 2,350 | | | | 363,451 | | | | 2.71 | % |
| | | | | | | | 1,078,668 | | | | 8.03 | % |
| | | | | | | | | | | | | |
| Health Care – 2.63% | | | | | | | | | | | | |
| Amgen, Inc. | | | 350 | | | | 83,874 | | | | 0.62 | % |
| Merck & Co., Inc. | | | 1,100 | | | | 81,950 | | | | 0.61 | % |
| Pfizer, Inc. | | | 4,850 | | | | 187,452 | | | | 1.40 | % |
| | | | | | | | 353,276 | | | | 2.63 | % |
| | | | | | | | | | | | | |
| Industrials – 5.28% | | | | | | | | | | | | |
| 3M Co. | | | 3,600 | | | | 709,704 | | | | 5.28 | % |
| | | | | | | | | | | | | |
| Information Technology – 8.29% | | | | | | | | | | | | |
| Cisco Systems, Inc. | | | 8,650 | | | | 440,371 | | | | 3.28 | % |
| International Business Machines Corp. | | | 4,750 | | | | 673,930 | | | | 5.01 | % |
| | | | | | | | 1,114,301 | | | | 8.29 | % |
| | | | | | | | | | | | | |
| Materials – 5.00% | | | | | | | | | | | | |
| Dow, Inc. | | | 10,750 | | | | 671,875 | | | | 5.00 | % |
| | | | | | | | | | | | | |
| Total Common Stocks | | | | | | | | | | | | |
| (Cost $5,491,084) | | | | | | | 6,707,511 | | | | 49.92 | % |
The accompanying notes are an integral part of these financial statements.
| SHORT-TERM INVESTMENTS – 50.19% | | Number of Shares/ | | | | | | % of | |
| | | Par Amount | | | Value | | | Net Assets | |
| Money Market Funds – 4.05% | | | | | | | | | |
| First American Government Obligations | | | | | | | | | |
| Fund, Institutional Class, 0.03% (a) | | | 543,965 | | | $ | 543,965 | | | | 4.05 | % |
| | | | | | | | | | | | | |
| U.S. Treasury Bills – 46.14% | | | | | | | | | | | | |
| 0.020%, 05/20/2021 (b) | | | 300,000 | | | | 299,977 | | | | 2.23 | % |
| 0.010%, 06/17/2021 (b) | | | 1,100,000 | | | | 1,099,756 | | | | 8.19 | % |
| 0.020%, 07/15/2021 (b) | | | 500,000 | | | | 499,992 | | | | 3.72 | % |
| 0.035%, 11/04/2021 (b) | | | 700,000 | | | | 699,900 | | | | 5.21 | % |
| 0.110%, 12/02/2021 (b) | | | 1,000,000 | | | | 999,852 | | | | 7.44 | % |
| 0.090%, 01/27/2022 (b) | | | 2,600,000 | | | | 2,599,408 | | | | 19.35 | % |
| | | | | | | | 6,198,885 | | | | 46.14 | % |
| | | | | | | | | | | | | |
| Total Short-Term Investments | | | | | | | | | | | | |
| (Cost $6,740,995) | | | | | | | 6,742,850 | | | | 50.19 | % |
| | | | | | | | | | | | | |
| Total Investments | | | | | | | | | | | | |
| (Cost $12,232,079) – 100.11% | | | | | | | 13,450,361 | | | | 100.11 | % |
| Liabilities in Excess of Other Assets – (0.11)% | | | | | | | (14,571 | ) | | | (0.11 | )% |
| | | | | | | | | | | | | |
TOTAL NET ASSETS – 100.00% | | | | | | $ | 13,435,790 | | | | 100.00 | % |
Percentages are stated as a percent of net assets.
| (a) | The rate listed is the fund’s seven-day yield as of April 30, 2021. |
| (b) | The rate listed is the discount rate at issue. |
Summary of Fair Value Exposure as of April 30, 2021
The following is a summary of the inputs used to value the Fund’s net assets as of April 30, 2021 (see Note 3 in the accompanying Notes to the Financial Statements):
| Common Stocks | | Level 1 | | | Level 2 | | | Level 3 | | | Total | |
| Communication Services | | $ | 546,116 | | | $ | — | | | $ | — | | | $ | 546,116 | |
| Consumer Staples | | | 1,439,390 | | | | — | | | | — | | | | 1,439,390 | |
| Energy | | | 794,181 | | | | — | | | | — | | | | 794,181 | |
| Financials | | | 1,078,668 | | | | — | | | | — | | | | 1,078,668 | |
| Health Care | | | 353,276 | | | | — | | | | — | | | | 353,276 | |
| Industrials | | | 709,704 | | | | — | | | | — | | | | 709,704 | |
| Information Technology | | | 1,114,301 | | | | — | | | | — | | | | 1,114,301 | |
| Materials | | | 671,875 | | | | — | | | | — | | | | 671,875 | |
| Total Common Stocks | | $ | 6,707,511 | | | $ | — | | | $ | — | | | $ | 6,707,511 | |
| Short-Term Investments | | | | | | | | | | | | | | | | |
| Money Market Funds | | $ | 543,965 | | | $ | — | | | $ | — | | | $ | 543,965 | |
| U.S. Treasury Bills | | | — | | | | 6,198,885 | | | | — | | | | 6,198,885 | |
| Total Short-Term Investments | | $ | 543,965 | | | $ | 6,198,885 | | | $ | — | | | $ | 6,742,850 | |
| Total Investments | | $ | 7,251,476 | | | $ | 6,198,885 | | | $ | — | | | $ | 13,450,361 | |
The accompanying notes are an integral part of these financial statements.
| HENNESSY FUNDS | 1-800-966-4354 | |
Financial Statements
Statement of Assets and Liabilities as of April 30, 2021 (Unaudited) |
| ASSETS: | | | |
| Investments in securities, at value (cost $12,232,079) | | $ | 13,450,361 | |
| Dividends and interest receivable | | | 5,943 | |
| Prepaid expenses and other assets | | | 13,964 | |
| Total assets | | | 13,470,268 | |
| | | | | |
| LIABILITIES: | | | | |
| Payable to advisor | | | 6,586 | |
| Payable to administrator | | | 4,154 | |
| Payable to auditor | | | 11,227 | |
| Accrued distribution fees | | | 2,222 | |
| Accrued service fees | | | 1,097 | |
| Accrued trustees fees | | | 5,212 | |
| Accrued expenses and other payables | | | 3,980 | |
| Total liabilities | | | 34,478 | |
| NET ASSETS | | $ | 13,435,790 | |
| | | | | |
| NET ASSETS CONSISTS OF: | | | | |
| Capital stock | | $ | 12,166,047 | |
| Total distributable earnings | | | 1,269,743 | |
| Total net assets | | $ | 13,435,790 | |
| | | | | |
| NET ASSETS: | | | | |
| Investor Class | | | | |
| Shares authorized (no par value) | | Unlimited | |
| Net assets applicable to outstanding shares | | $ | 13,435,790 | |
| Shares issued and outstanding | | | 1,078,754 | |
| Net asset value, offering price, and redemption price per share | | $ | 12.45 | |
The accompanying notes are an integral part of these financial statements.
| STATEMENT OF ASSETS AND LIABILITIES/STATEMENT OF OPERATIONS |
Financial Statements
Statement of Operations for the six months ended April 30, 2021 (Unaudited) |
| INVESTMENT INCOME: | | | |
| Dividend income | | $ | 131,027 | |
| Interest income | | | 13,114 | |
| Total investment income | | | 144,141 | |
| | | | | |
| EXPENSES: | | | | |
| Investment advisory fees (See Note 5) | | | 38,484 | |
| Compliance expense (See Note 5) | | | 13,844 | |
| Administration, accounting, custody, and transfer agent fees (See Note 5) | | | 13,061 | |
| Audit fees | | | 11,227 | |
| Federal and state registration fees | | | 10,136 | |
| Distribution fees – Investor Class (See Note 5) | | | 9,621 | |
| Trustees’ fees and expenses | | | 9,231 | |
| Service fees – Investor Class (See Note 5) | | | 6,414 | |
| Sub-transfer agent expenses – Investor Class (See Note 5) | | | 3,384 | |
| Reports to shareholders | | | 2,720 | |
| Legal fees | | | 88 | |
| Interest expense (See Note 7) | | | 29 | |
| Other expenses | | | 2,167 | |
| Total expenses | | | 120,406 | |
| NET INVESTMENT INCOME | | $ | 23,735 | |
| | | | | |
| REALIZED AND UNREALIZED GAINS (LOSSES): | | | | |
| Net realized gain on investments | | $ | 105,022 | |
| Net change in unrealized appreciation/depreciation on investments | | | 1,664,733 | |
| Net gain on investments | | | 1,769,755 | |
| NET INCREASE IN NET ASSETS RESULTING FROM OPERATIONS | | $ | 1,793,490 | |
The accompanying notes are an integral part of these financial statements.
| HENNESSY FUNDS | 1-800-966-4354 | |
(This Page Intentionally Left Blank.)
| STATEMENTS OF CHANGES IN NET ASSETS |
Financial Statements
| Statements of Changes in Net Assets |
| | | Six Months Ended | | | | |
| | | April 30, 2021 | | | Year Ended | |
| | | (Unaudited) | | | October 31, 2020 | |
| OPERATIONS: | | | | | | |
| Net investment income | | $ | 23,735 | | | $ | 128,595 | |
| Net realized gain (loss) on investments | | | 105,022 | | | | (37,345 | ) |
| Net change in unrealized | | | | | | | | |
| appreciation/depreciation on investments | | | 1,664,733 | | | | (1,068,334 | ) |
| Net increase (decrease) in net | | | | | | | | |
| assets resulting from operations | | | 1,793,490 | | | | (977,084 | ) |
| | | | | | | | | |
| DISTRIBUTIONS TO SHAREHOLDERS: | | | | | | | | |
| Distributable earnings – Investor Class | | | (33,666 | ) | | | (623,540 | ) |
| Total distributions | | | (33,666 | ) | | | (623,540 | ) |
| | | | | | | | | |
| CAPITAL SHARE TRANSACTIONS: | | | | | | | | |
| Proceeds from shares subscribed – Investor Class | | | 513,268 | | | | 1,953,092 | |
| Dividends reinvested – Investor Class | | | 33,139 | | | | 613,858 | |
| Cost of shares redeemed – Investor Class | | | (858,648 | ) | | | (1,281,653 | ) |
| Net increase (decrease) in net assets derived | | | | | | | | |
| from capital share transactions | | | (312,241 | ) | | | 1,285,297 | |
| TOTAL INCREASE (DECREASE) IN NET ASSETS | | | 1,447,583 | | | | (315,327 | ) |
| | | | | | | | | |
| NET ASSETS: | | | | | | | | |
| Beginning of period | | | 11,988,207 | | | | 12,303,534 | |
| End of period | | $ | 13,435,790 | | | $ | 11,988,207 | |
| | | | | | | | | |
| CHANGES IN SHARES OUTSTANDING: | | | | | | | | |
| Shares sold – Investor Class | | | 42,502 | | | | 173,324 | |
| Shares issued to holders as reinvestment | | | | | | | | |
| of dividends – Investor Class | | | 2,814 | | | | 51,675 | |
| Shares redeemed – Investor Class | | | (72,705 | ) | | | (112,932 | ) |
| Net increase (decrease) in shares outstanding | | | (27,389 | ) | | | 112,067 | |
The accompanying notes are an integral part of these financial statements.
| HENNESSY FUNDS | 1-800-966-4354 | |
Financial Statements
For an Investor Class share outstanding throughout each period
| | | Six Months Ended | |
| | | April 30, 2021 | |
| | | (Unaudited) | |
| PER SHARE DATA: | | | |
| Net asset value, beginning of period | | $ | 10.84 | |
| | | | | |
| Income from investment operations: | | | | |
| Net investment income | | | 0.02 | (1) |
| Net realized and unrealized gains (losses) on investments | | | 1.62 | |
| Total from investment operations | | | 1.64 | |
| | | | | |
| Less distributions: | | | | |
| Dividends from net investment income | | | (0.03 | ) |
| Dividends from net realized gains | | | — | |
| Total distributions | | | (0.03 | ) |
| Net asset value, end of period | | $ | 12.45 | |
| | | | | |
| TOTAL RETURN | | | 15.16 | %(2) |
| | | | | |
| SUPPLEMENTAL DATA AND RATIOS: | | | | |
| Net assets, end of period (millions) | | $ | 13.44 | |
| Ratio of expenses to average net assets | | | 1.88 | %(3) |
| Ratio of net investment income to average net assets | | | 0.37 | %(3) |
| Portfolio turnover rate | | | 3 | %(2) |
(1) | Calculated using the average shares outstanding method. |
(2) | Not annualized. |
(3) | Annualized. |
The accompanying notes are an integral part of these financial statements.
| FINANCIAL HIGHLIGHTS — INVESTOR CLASS |
| Year Ended October 31, | |
| 2020 | | | 2019 | | | 2018 | | | 2017 | | | 2016 | |
| | | | | | | | | | | | | | |
| $ | 12.38 | | | $ | 12.34 | | | $ | 12.88 | | | $ | 12.68 | | | $ | 12.37 | |
| | | | | | | | | | | | | | | | | | | |
| | | | | | | | | | | | | | | | | | | |
| | 0.12 | (1) | | | 0.13 | (1) | | | 0.09 | | | | 0.06 | | | | 0.04 | |
| | (1.04 | ) | | | 0.59 | | | | 0.33 | | | | 1.09 | | | | 0.58 | |
| | (0.92 | ) | | | 0.72 | | | | 0.42 | | | | 1.15 | | | | 0.62 | |
| | | | | | | | | | | | | | | | | | | |
| | | | | | | | | | | | | | | | | | | |
| | (0.12 | ) | | | (0.13 | ) | | | (0.08 | ) | | | (0.05 | ) | | | (0.04 | ) |
| | (0.50 | ) | | | (0.55 | ) | | | (0.88 | ) | | | (0.90 | ) | | | (0.27 | ) |
| | (0.62 | ) | | | (0.68 | ) | | | (0.96 | ) | | | (0.95 | ) | | | (0.31 | ) |
| $ | 10.84 | | | $ | 12.38 | | | $ | 12.34 | | | $ | 12.88 | | | $ | 12.68 | |
| | | | | | | | | | | | | | | | | | | |
| | -7.84 | % | | | 6.05 | % | | | 3.46 | % | | | 9.56 | % | | | 5.20 | % |
| | | | | | | | | | | | | | | | | | | |
| | | | | | | | | | | | | | | | | | | |
| $ | 11.99 | | | $ | 12.30 | | | $ | 11.62 | | | $ | 12.24 | | | $ | 12.08 | |
| | 1.89 | % | | | 1.88 | % | | | 1.84 | % | | | 1.82 | % | | | 1.68 | % |
| | 1.05 | % | | | 1.04 | % | | | 0.70 | % | | | 0.45 | % | | | 0.33 | % |
| | 42 | % | | | 52 | % | | | 21 | % | | | 31 | % | | | 51 | % |
The accompanying notes are an integral part of these financial statements.
| HENNESSY FUNDS | 1-800-966-4354 | |
Financial Statements
Notes to the Financial Statements April 30, 2021 (Unaudited) |
1). ORGANIZATION
The Hennessy Balanced Fund (the “Fund”) is a series of Hennessy Funds Trust (the “Trust”), which was organized as a Delaware statutory trust on September 17, 1992. The Fund is an open-end management investment company registered under the Investment Company Act of 1940, as amended. The investment objective of the Fund is a combination of capital appreciation and current income. The Fund is a non-diversified fund and offers Investor Class shares.
As an investment company, the Fund follows the investment company accounting and reporting guidance of the Financial Accounting Standards Board (“FASB”) Accounting Standard Codification Topic 946 “Financial Services—Investment Companies.”
2). SIGNIFICANT ACCOUNTING POLICIES
The following is a summary of significant accounting policies consistently followed by the Fund in the preparation of the financial statements. These policies conform to U.S. generally accepted accounting principles (“GAAP”).
| a). | Securities Valuation – All investments in securities are valued in accordance with the Fund’s valuation policies and procedures, as described in Note 3. |
| | |
| b). | Federal Income Taxes – The Fund has elected to be taxed as a regulated investment company and intends to distribute substantially all of its taxable income to its shareholders and otherwise comply with the provisions of the Internal Revenue Code of 1986, as amended, applicable to regulated investment companies. As a result, the Fund has made no provision for federal income taxes or excise taxes. Net investment income/loss and realized gains/losses for federal income tax purposes may differ from those reported in the financial statements because of temporary book-basis and tax-basis differences. Temporary differences are primarily the result of the treatment of wash sales for tax reporting purposes. The Fund recognizes interest and penalties related to income tax benefits, if any, in the Statement of Operations as an income tax expense. Distributions from net realized gains for book purposes may include short-term capital gains, which are included as ordinary income to shareholders for tax purposes. The Fund may utilize equalization accounting for tax purposes and designate earnings and profits, including net realized gains distributed to shareholders on redemption of shares, as part of the dividends paid deduction for income tax purposes. |
| | |
| c). | Accounting for Uncertainty in Income Taxes – The Fund has accounting policies regarding recognition and measurement of tax positions taken or expected to be taken on a tax return. The tax returns of the Fund for the prior three fiscal years are open for examination. The Fund has reviewed all open tax years in major tax jurisdictions and concluded that there is no impact on the Fund’s net assets and no tax liability resulting from unrecognized tax benefits relating to uncertain income tax positions taken or expected to be taken on a tax return. The Fund’s major tax jurisdictions are U.S. federal and Delaware. |
| | |
| d). | Income and Expenses – Dividend income is recognized on the ex-dividend date or as soon as information is available to the Fund. Interest income, which includes the amortization of premium and accretion of discount, is recognized on an accrual basis. |
| NOTES TO THE FINANCIAL STATEMENTS |
| | Market discounts, original issue discounts, and market premiums on debt securities are accreted or amortized to interest income over the life of a security with a corresponding increase or decrease, as applicable, in the cost basis of such security using the yield-to-maturity method or, where applicable, the first call date of the security. Other non-cash dividends are recognized as investment income at the fair value of the property received. The Fund is charged for those expenses that are directly attributable to its portfolio, such as advisory, administration, and certain shareholder service fees. |
| | |
| e). | Distributions to Shareholders – Dividends from net investment income for the Fund, if any, are declared and paid at the end of each calendar quarter. Distributions of net realized capital gains, if any, are declared and paid annually, usually in December. |
| | |
| f). | Security Transactions – Investment and shareholder transactions are recorded on the trade date. The Fund determines the realized gain/loss from an investment transaction by comparing the original cost of the security lot sold with the net sale proceeds. Discounts and premiums on securities purchased are accreted or amortized, respectively, over the life of each such security. |
| | |
| g). | Use of Estimates – Preparing financial statements in accordance with GAAP requires management to make estimates and assumptions that affect the reported amounts of assets and liabilities and disclosure of contingent assets and liabilities at the date of the financial statements, as well as the reported change in net assets during the reporting period. Actual results could differ from those estimates. |
| | |
| h). | Share Valuation – The net asset value (“NAV”) per share of the Fund is calculated by dividing (i) the total value of the securities held by the Fund, plus cash and other assets, minus all liabilities (including estimated accrued expenses) by (ii) the total number of Fund shares outstanding, rounded to the nearest $0.01. Fund shares are not priced on days the New York Stock Exchange is closed for trading. The offering and redemption price per share for the Fund is equal to the Fund’s NAV per share. |
| | |
| i). | New Accounting Pronouncements – In August 2018, the FASB issued Accounting Standards Update No. 2018-13 “Disclosure Framework—Changes to the Disclosure Requirements for Fair Value Measurement” (“ASU 2018-13”). ASU 2018-13 eliminates the requirement to disclose the amount of and reasons for transfers between Level 1 and Level 2 of the fair value hierarchy, the timing of transfers between levels of the fair value hierarchy, and the valuation processes for Level 3 fair value measurements. ASU 2018-13 does not eliminate the requirement to disclose the range and weighted average used to develop significant unobservable inputs for Level 3 fair value measurements or the requirement to disclose the changes in unrealized gains and losses for recurring Level 3 fair value measurements. ASU 2018-13 requires that information is provided about the measurement uncertainty of Level 3 fair value measurements as of the reporting date. The guidance is effective for fiscal years beginning after December 15, 2019, and interim periods within those fiscal years. Management evaluated the impact of this change in guidance and, due to the permissibility of early adoption, modified the Fund’s fair value disclosures beginning with its fiscal year 2019. |
3). SECURITIES VALUATION
The Fund follows its valuation policies and procedures in determining its net asset value and, in preparing these financial statements, the fair value accounting standards that establish an authoritative definition of fair value and set out a hierarchy for measuring fair value. These standards require additional disclosures about the various inputs and
| HENNESSY FUNDS | 1-800-966-4354 | |
valuation techniques used to develop the measurements of fair value and a discussion of changes in valuation techniques and related inputs during the period. These inputs are summarized in the three broad levels listed below:
| | Level 1 – | Unadjusted, quoted prices in active markets for identical instruments that the Fund has the ability to access at the date of measurement. |
| | | |
| | Level 2 – | Other significant observable inputs (including, but not limited to, quoted prices in active markets for similar instruments, quoted prices in markets that are not active for identical or similar instruments, and model-derived valuations in which all significant inputs and significant value drivers are observable in active markets, such as interest rates, prepayment speeds, credit risk curves, default rates, and similar data). |
| | | |
| | Level 3 – | Significant unobservable inputs (including the Fund’s own assumptions about what market participants would use to price the asset or liability based on the best available information) when observable inputs are unavailable. |
The following is a description of the valuation techniques applied to the Fund’s major categories of assets and liabilities on a recurring basis:
| | Equity Securities – Equity securities, including common stocks, preferred stocks, exchange-traded funds, closed-end mutual funds, partnerships, rights, and real estate investment trusts, that are traded on a securities exchange for which a last-quoted sales price is readily available generally are valued at the last sales price as reported by the primary exchange on which the securities are listed. Securities listed on The NASDAQ Stock Market (“NASDAQ”) generally are valued at the NASDAQ Official Closing Price, which may differ from the last sales price reported. Securities traded on a securities exchange for which a last-quoted sales price is not readily available generally are valued at the mean between the bid and ask prices. To the extent these securities are actively traded and valuation adjustments are not applied, they are classified in Level 1 of the fair value hierarchy. |
| | |
| | Registered Investment Companies – Investments in open-end registered investment companies, commonly referred to as mutual funds, generally are priced at the ending NAV provided by the applicable mutual fund’s service agent and are classified in Level 1 of the fair value hierarchy. |
| | |
| | Debt Securities – Debt securities, including corporate bonds, asset-backed securities, mortgage-backed securities, municipal bonds, U.S. Treasuries, and U.S. government agency issues, are generally valued at market on the basis of valuations furnished by an independent pricing service that utilizes both dealer-supplied valuations and formula-based techniques. The pricing service may consider recently executed transactions in securities of the issuer or comparable issuers, market price quotations (where observable), bond spreads, and fundamental data relating to the issuer. In addition, the model may incorporate observable market data, such as reported sales of similar securities, broker quotes, yields, bids, offers, and reference data. Certain securities are valued primarily using dealer quotations. These securities are generally classified in Level 2 of the fair value hierarchy. |
| | |
| | Short-Term Securities – Short-term equity investments, including money market funds, are valued in the manner specified above for equity securities. Short-term debt investments with an original term to maturity of 60 days or less are valued at amortized cost, which approximates fair market value. If the original term to maturity of a short-term debt investment exceeds 60 days, then the values as of the |
| NOTES TO THE FINANCIAL STATEMENTS |
| | 61st day prior to maturity are amortized. Amortized cost is not used if its use would be inappropriate due to credit or other impairments of the issuer, in which case the security’s fair value would be determined as described below. Short-term securities are generally classified in Level 1 or Level 2 of the fair value hierarchy depending on the inputs used and market activity levels for specific securities. |
The Board of Trustees of the Fund (the “Board”) has adopted fair value pricing procedures that are followed when a price for a security is not readily available or if a significant event has occurred that indicates the closing price of a security no longer represents the true value of that security. Fair value pricing determinations are made in good faith in accordance with these procedures. There are numerous criteria considered in determining a fair value of a security, such as the trading volume of a security and markets, the values of other similar securities, and news events with direct bearing on a security or markets. Fair value pricing results in an estimated price for a security that reflects the amount the Fund might reasonably expect to receive in a current sale. Depending on the relative significance of the valuation inputs, these securities may be classified in either Level 2 or Level 3 of the fair value hierarchy.
The Board has delegated day-to-day valuation matters to the Valuation and Liquidity Committee comprising representatives from Hennessy Advisors, Inc., the Fund’s investment advisor (the “Advisor”). The function of the Valuation and Liquidity Committee, among other things, is to value securities where current and reliable market quotations are not readily available. All actions taken by the Valuation and Liquidity Committee are reviewed by the Board.
The Fund has performed an analysis of all existing investments to determine the significance and character of all inputs to their fair value determinations. Various inputs are used to determine the value of the Fund’s investments. The inputs or methodology used for valuing securities are not necessarily an indication of the risk associated with investing in those securities. Details related to the fair value hierarchy of the Fund’s securities as of April 30, 2021, are included in the Schedule of Investments.
4). INVESTMENT TRANSACTIONS
Purchases and sales of investment securities (excluding government and short-term investments) for the Fund during the six months ended April 30, 2021, were $175,602 and $884,364, respectively.
There were no purchases or sales/maturities of long-term U.S. government securities for the Fund during the six months ended April 30, 2021.
5). INVESTMENT ADVISORY FEE AND OTHER TRANSACTIONS WITH AFFILIATES
The Advisor provides the Fund with investment advisory services under an Investment Advisory Agreement. The Advisor furnishes all investment advice, office space, and facilities and most of the personnel needed by the Fund. As compensation for its services, the Advisor is entitled to a monthly fee from the Fund. The fee is based on the average daily net assets of the Fund at an annual rate of 0.60%. The net investment advisory fees expensed by the Fund during the six months ended April 30, 2021, are included in the Statement of Operations.
The Board has approved a Shareholder Servicing Agreement for the Fund, which compensates the Advisor for the non-investment advisory services it provides to the Fund. The Shareholder Servicing Agreement provides for a monthly fee paid to the Advisor at an annual rate of 0.10% of the average daily net assets of the Fund. The shareholder service fees expensed by the Fund during the six months ended April 30, 2021, are included in the Statement of Operations.
| HENNESSY FUNDS | 1-800-966-4354 | |
The Fund has adopted a plan pursuant to Rule 12b-1 under the Investment Company Act of 1940, as amended, that authorizes payments in connection with the distribution of Fund shares at an annual rate of up to 0.25% of the Fund’s average daily net assets. Even though the authorized rate is up to 0.25%, the Fund is currently only using up to 0.15% of its average daily net assets for such purpose. Amounts paid under the plan may be spent on any activities or expenses primarily intended to result in the sale of shares, including, but not limited to, advertising, shareholder account servicing, printing and mailing of prospectuses to other than current shareholders, printing and mailing of sales literature, and compensation for sales and marketing activities or to financial institutions and others, such as dealers and distributors. The distribution fees expensed by the Fund during the six months ended April 30, 2021, are included in the Statement of Operations.
The Fund has entered into agreements with various brokers, dealers, and financial intermediaries in connection with the sale of Fund shares. The agreements provide for periodic payments of sub-transfer agent expenses by the Fund to the brokers, dealers, and financial intermediaries for providing certain shareholder maintenance services. These shareholder services include the pre-processing and quality control of new accounts, shareholder correspondence, answering customer inquiries regarding account status, and facilitating shareholder telephone transactions. The sub-transfer agent fees expensed by the Fund during the six months ended April 30, 2021, are included in the Statement of Operations.
U.S. Bancorp Fund Services, LLC, d/b/a U.S. Bank Global Fund Services (“Fund Services”) provides the Fund with administrative, accounting, and transfer agent services. As administrator, Fund Services is responsible for activities such as (i) preparing various federal and state regulatory filings, reports, and returns for the Fund, (ii) preparing reports and materials to be supplied to the Board, (iii) monitoring the activities of the Fund’s custodian, transfer agent, and accountants, and (iv) coordinating the preparation and payment of the Fund’s expenses and reviewing the Fund’s expense accruals. U.S. Bank N.A., an affiliate of Fund Services, serves as the Fund’s custodian. The servicing agreements between the Trust, Fund Services, and U.S. Bank N.A. contain a fee schedule that is inclusive of administrative, accounting, custody, and transfer agent fees. The administrative, accounting, custody, and transfer agent fees expensed by the Fund during the six months ended April 30, 2021, are included in the Statement of Operations.
Quasar Distributors, LLC (“Quasar”), a wholly owned broker-dealer subsidiary of Foreside Financial Group, LLC, acts as the Fund’s principal underwriter in a continuous public offering of Fund shares.
The officers of the Fund are affiliated with the Advisor. With the exception of the Chief Compliance Officer and the Senior Compliance Officer, such officers receive no compensation from the Fund for serving in their respective roles. The Fund, along with the other funds in the Hennessy Funds family (collectively, the “Hennessy Funds”), makes reimbursement payments on an equal basis to the Advisor for a portion of the salary and benefits associated with the office of the Chief Compliance Officer and for all of the salary and benefits associated with the office of the Senior Compliance Officer. The compliance fees expensed by the Fund during the six months ended April 30, 2021, are included in the Statement of Operations.
6). GUARANTEES AND INDEMNIFICATIONS
Under the Hennessy Funds’ organizational documents, their officers and trustees are indemnified by the Hennessy Funds against certain liabilities arising out of the performance of their duties to the Hennessy Funds. Additionally, in the normal course of
| NOTES TO THE FINANCIAL STATEMENTS |
business, the Hennessy Funds enter into contracts with service providers that contain general indemnification clauses. The Fund’s maximum exposure under these arrangements is unknown as this would involve future claims that may be made against the Fund that have not yet occurred. Currently, the Fund expects the risk of loss to be remote.
7). LINE OF CREDIT
The Fund has an uncommitted line of credit with the other Hennessy Funds in the amount of the lesser of (i) $100,000,000 or (ii) 33.33% of each Hennessy Fund’s net assets, or 30% for the Hennessy Gas Utility Fund and 10% for the Fund. The line of credit is intended to provide any necessary short-term financing in connection with shareholder redemptions, subject to certain restrictions. The credit facility is with the Hennessy Funds’ custodian bank, U.S. Bank N.A. Borrowings under this arrangement bear interest at the bank’s prime rate and are secured by all of the Fund’s assets (as to its own borrowings only). During the six months ended April 30, 2021, the Fund had an outstanding average daily balance and a weighted average interest rate of $1,751 and 3.25%, respectively. The interest expensed by the Fund during the six months ended April 30, 2021, is included in the Statement of Operations. The maximum amount outstanding for the Fund during the period was $53,000. As of April 30, 2021, the Fund did not have any borrowings outstanding under the line of credit.
8). FEDERAL TAX INFORMATION
As of October 31, 2020, the Fund’s most recent fiscal year end, the components of accumulated earnings (losses) for income tax purposes were as follows:
| | | Investments | |
| Cost of investments for tax purposes | | $ | 12,539,947 | |
| Gross tax unrealized appreciation | | $ | 274,863 | |
| Gross tax unrealized depreciation | | | (739,994 | ) |
| Net tax unrealized appreciation/(depreciation) | | $ | (465,131 | ) |
| Undistributed ordinary income | | $ | 2,835 | |
| Undistributed long-term capital gains | | | — | |
| Total distributable earnings | | $ | 2,835 | |
| Other accumulated gain/(loss) | | $ | (27,785 | ) |
| Total accumulated gain/(loss) | | $ | (490,081 | ) |
The difference between book-basis unrealized appreciation/depreciation and tax-basis unrealized appreciation/depreciation (as shown above) is attributable primarily to wash sales.
As of October 31, 2020, the Fund had $27,785 in unlimited short-term capital loss carryforwards.
Capital losses sustained in or after fiscal year 2012 can be carried forward indefinitely, but any such loss retains the character of the original loss and must be utilized prior to any loss incurred before fiscal year 2012. As a result of this ordering rule, capital loss carryforwards incurred prior to fiscal year 2012 may be more likely to expire unused. Capital losses sustained prior to fiscal year 2012 can be carried forward for eight years and can be carried forward as short-term capital losses regardless of the character of the original loss.
As of October 31, 2020, the Fund did not defer, on a tax basis, any late-year ordinary losses. Late-year ordinary losses are net ordinary losses incurred after December 31, 2019, but within the taxable year, that are deemed to arise on the first day of the Fund’s next taxable year.
| HENNESSY FUNDS | 1-800-966-4354 | |
During fiscal year 2021 (year to date) and fiscal year 2020, the tax character of distributions paid by the Fund was as follows:
| | | Six Months Ended | | | Year Ended | |
| | | April 30, 2021 | | | October 31, 2020 | |
Ordinary income(1) | | $ | 33,666 | | | $ | 154,117 | |
| Long-term capital gains | | | — | | | | 469,423 | |
| Total distributions | | $ | 33,666 | | | $ | 623,540 | |
(1) Ordinary income includes short-term capital gains.
9). EVENTS SUBSEQUENT TO PERIOD END
Management has evaluated the Fund’s related events and transactions that occurred subsequent to April 30, 2021, through the date of issuance of the Fund’s financial statements. Management has determined that there were no subsequent events requiring recognition or disclosure in the financial statements.
| NOTES TO THE FINANCIAL STATEMENTS/EXPENSE EXAMPLE |
Expense Example (Unaudited)
April 30, 2021
As a shareholder of the Fund, you incur ongoing costs, including management fees, service fees, and other Fund expenses. This Example is intended to help you understand your ongoing costs (in dollars) of investing in the Fund and to compare these costs with the ongoing costs of investing in other mutual funds. The Example is based on an investment of $1,000 invested at the beginning of the period and held for the entire period from November 1, 2020, through April 30, 2021.
Actual Expenses
The first line of the table below provides information about actual account values and actual expenses. You may use the information in this line, together with the amount you invested, to estimate the expenses that you paid over the period. Simply divide your account value by $1,000 (for example, an $8,600 account value divided by $1,000 = 8.6), then multiply the result by the number in the first line of the table under the heading entitled “Expenses Paid During Period” to estimate the expenses you paid on your account during this period. Although the Fund charges no sales loads or transaction fees, you will be assessed fees for outgoing wire transfers, returned checks, and stop payment orders at prevailing rates charged by U.S. Bank Global Fund Services, the Fund’s transfer agent. If you request that a redemption be made by wire transfer, the Fund’s transfer agent charges a $15 fee. IRAs are charged a $15 annual maintenance fee (up to $30 maximum per shareholder for shareholders with multiple IRAs). The example below includes, but is not limited to, management, shareholder servicing, accounting, custody, and transfer agent fees. However, the example below does not include portfolio trading commissions and related expenses.
Hypothetical Example for Comparison Purposes
The second line of the table below provides information about hypothetical account values and hypothetical expenses based on the Fund’s actual expense ratio and an assumed rate of return of 5% per year before expenses, which is not the Fund’s actual return. The hypothetical account values and expenses may not be used to estimate the actual ending account balance or expenses you paid for the period. You may use this information to compare the ongoing costs of investing in the Fund and other funds. To do so, compare this 5% hypothetical example with the 5% hypothetical examples that appear in the shareholder reports of the other funds. Please note that the expenses shown in the table are meant to highlight your ongoing costs only. Therefore, the second line of the table is useful in comparing ongoing costs only and will not help you determine the relative total costs of owning different funds.
| | Beginning | Ending | |
| | Account Value | Account Value | Expenses Paid |
| | November 1, 2020 | April 30, 2021
| During Period(1) |
| Investor Class | | | |
| Actual | $1,000.00 | $1,151.60 | $10.03 |
| Hypothetical (5% return before expenses) | $1,000.00 | $1,015.47 | $ 9.39 |
(1) | Expenses are equal to the Fund’s annualized expense ratio of 1.88%, multiplied by the average account value over the period, multiplied by 181/365 days (to reflect the half-year period). |
| HENNESSY FUNDS | 1-800-966-4354 | |
How to Obtain a Copy of the Fund’s Proxy
Voting Policy and Proxy Voting Records
A description of the policies and procedures the Fund uses to determine how to vote proxies relating to portfolio securities is available without charge (1) by calling 1-800-966-4354, (2) on the Hennessy Funds’ website at www.hennessyfunds.com/proxy-voting/voting-policy, or (3) on the U.S. Securities and Exchange Commission’s (the “SEC”) website at www.sec.gov. The Fund’s proxy voting record is available without charge on both the Hennessy Funds’ website at www.hennessyfunds.com/proxy-voting/voting-record and the SEC’s website at www.sec.gov no later than August 31 for the prior 12 months ending June 30.
Availability of Quarterly Portfolio Schedule
The Fund files a complete schedule of portfolio holdings with the SEC for the first and third quarters of each fiscal year as an exhibit to its reports on Form N-PORT. The Fund’s Form N-PORT reports are available on the SEC’s website at www.sec.gov or on request by calling 1-800-966-4354.
Federal Tax Distribution Information (Unaudited)
For fiscal year 2020, certain dividends paid by the Fund may be subject to a maximum tax rate of 23.8%, as provided for by the Jobs and Growth Tax Relief Reconciliation Act of 2003. The percentage of dividends declared from ordinary income designated as qualified dividend income was 100.00%.
For corporate shareholders, the percent of ordinary income distributions that qualified for the corporate dividends received deduction for fiscal year 2020 was 100.00%.
The percentage of taxable ordinary income distributions that were designated as short-term capital gain distributions under Section 871(k)(2)(C) of the Internal Revenue Code of 1986, as amended, for the Fund was 15.41%.
Important Notice Regarding Delivery
of Shareholder Documents
To help keep the Fund’s costs as low as possible, we generally deliver a single copy of notices, shareholder reports, proxy statements, and prospectuses to shareholders who share an address and have the same last name. This process does not apply to account statements. You may request an individual copy of a shareholder document at any time. If you would like to receive separate mailings of shareholder documents, please call U.S. Bank Global Fund Services at 1-800-261-6950 or 1-414-765-4124, and individual delivery will begin within 30 days of your request. If your account is held through a financial institution or other intermediary, please contact such intermediary directly to request individual delivery.
Electronic Delivery
As permitted by SEC regulations, the Fund’s shareholder reports are made available on a website, and unless you sign up for eDelivery or elect to receive paper copies as detailed below, you will be notified by mail each time a report is posted and provided with a website link to access the report.
The Fund also offers shareholders the option to receive all notices, account statements, prospectuses, tax forms, and shareholder reports online. To sign up for eDelivery or change your delivery preference, please visit www.hennessyfunds.com/account.
To elect to receive paper copies of all future reports free of charge, please call U.S. Bank Global Fund Services at 1-800-261-6950 or 1-414-765-4124.
Subscribe to receive our team’s unique market and sector insights delivered to your inbox
www.hennessyfunds.com/subscribe
Follow us on social media
| PROXY VOTING — BOARD APPROVAL OF INVESTMENT ADVISORY AGREEMENT |
Board Approval of Investment Advisory
Agreement
At its meeting on March 10, 2021, the Board of Trustees of the Fund (the “Board,” and the members thereof, the “Trustees”) unanimously approved the continuation of the investment advisory agreement of the Fund with Hennessy Advisors, Inc. (the “Advisor”). As part of the process, the Trustees reviewed their fiduciary duties and the relevant factors for them to consider with respect to approving the advisory agreement. In addition, the Trustees who are not deemed “interested persons” (as defined by the Investment Company Act of 1940, as amended) of the Fund (the “Independent Trustees”) met in executive session to discuss the approval of the advisory agreement.
In advance of the meeting, the Advisor sent detailed information to the Trustees to assist them in their evaluation of the advisory agreement. This information included, but was not limited to, the following:
| | (1) | A memorandum from outside legal counsel that described the fiduciary duties of the Board with respect to approving the continuation of the advisory agreement and the relevant factors for consideration; |
| | | |
| | (2) | A memorandum from the Advisor that listed the factors relevant to the Board’s approval of the continuation of the advisory agreement and also referenced the documents that had been provided to help the Board assess each such factor; |
| | | |
| | (3) | The Advisor’s financial statements from its most recent Form 10-K and Form 10-Q; |
| | | |
| | (4) | A summary of the advisory agreement; |
| | | |
| | (5) | A recent Fund fact sheet, which included performance information over various periods; |
| | | |
| | (6) | An description of the range of services provided by the Advisor; |
| | | |
| | (7) | A peer expense comparison of the net expense ratio and investment advisory fee of the Fund; and |
| | | |
| | (8) | A memorandum from the Adviser regarding economies of scale. |
All of the factors discussed were considered as a whole by the Trustees and by the Independent Trustees meeting in executive session. The factors were viewed in their totality by the Trustees, with no single factor being the principal or determinative factor in the Trustees’ determination of whether to approve the continuation of the advisory agreement. The Trustees recognized that the management and fee arrangements for the Fund are the result of years of review and discussion between the Independent Trustees and the Advisor, that certain aspects of such arrangements may receive greater scrutiny in some years than in others, and that the Trustees’ conclusions may be based, in part, on their consideration of these same arrangements and information received during the course of the year and in prior years.
Prior to approving the continuation of the advisory agreement, the Trustees, including the Independent Trustees in executive session, considered, among other items:
| | (1) | The nature and quality of the advisory services provided by the Advisor; |
| | | |
| | (2) | A comparison of the fees and expenses of the Fund to other similar funds; |
| | | |
| | (3) | Whether economies of scale are recognized by the Fund; |
| | | |
| | (4) | The costs and profitability of the Fund to the Advisor; |
| | | |
| | (5) | The performance of the Fund; and |
| HENNESSY FUNDS | 1-800-966-4354 | |
| | (6) | Any benefits to the Advisor from serving as an investment advisor to the Fund (other than the advisory fee). |
The material considerations and determinations of the Trustees, including the Independent Trustees, were as follows:
| | (1) | The Trustees considered the services identified below that are provided by the Advisor. Based on this review, the Trustees concluded that the Advisor provides high-quality services to the Fund and noted that their overall confidence in the Advisor was high. The Trustees also concluded that they were satisfied with the nature, extent, and quality of the advisory services provided to the Fund by the Advisor and that the nature and extent of the services provided by the Advisor were appropriate to assure that the Fund’s operations are conducted in compliance with applicable laws, rules, and regulations. |
| | | (a) | The Advisor acts as the portfolio manager for the Fund. In this capacity, the Advisor does the following: |
| | | | (i) | manages the composition of the Fund’s portfolio, including the purchase, retention, and disposition of portfolio securities in accordance with the Fund’s investment objectives, policies, and restrictions; |
| | | | | |
| | | | (ii) | seeks best execution for the Fund’s portfolio; |
| | | | | |
| | | | (iii) | manages the use of soft dollars for the Fund; and |
| | | | | |
| | | | (iv) | manages proxy voting for the Fund. |
| | | (b) | The Advisor performs a daily reconciliation of portfolio positions and cash for the Fund. |
| | | | |
| | | (c) | The Advisor monitors the liquidity of each Fund. |
| | | | |
| | | (d) | The Advisor monitors the Fund’s compliance with its investment objectives and restrictions and federal securities laws. |
| | | | |
| | | (e) | The Advisor maintains a compliance program (including a code of ethics), conducts ongoing reviews of the compliance programs of the Fund’s service providers (including their codes of ethics, as appropriate), conducts on-site visits to the Fund’s service providers as feasible, monitors incidents of abusive trading practices, reviews Fund expense accruals, payments, and fixed expense ratios, evaluates insurance providers for fidelity bond, D&O/E&O insurance, and cybersecurity insurance coverage, manages regulatory examination compliance and responses, conducts employee compliance training, reviews reports provided by service providers, and maintains books and records. |
| | | | |
| | | (f) | The Advisor oversees service providers that provide accounting, administration, distribution, transfer agency, custodial, sales, marketing, public relations, audit, information technology, and legal services to the Fund. |
| | | | |
| | | (g) | The Advisor maintains in-house marketing and distribution departments on behalf of the Fund. |
| | | | |
| | | (h) | The Advisor prepares or directs the preparation of all regulatory filings for the Fund, including writing and annually updating the Fund’s prospectus and related documents. |
| | | | |
| | | (i) | For each annual report of the Fund, the Advisor prepares a written summary of the Fund’s performance during the most recent 12-month period. |
| BOARD APPROVAL OF INVESTMENT ADVISORY AGREEMENT |
| | | (j) | The Advisor oversees distribution of the Fund through third-party broker/dealers and independent financial institutions such as Charles Schwab, Inc., Fidelity, TD Ameritrade, and Pershing. The Advisor compensates, in part, a number of these third-party providers out of its own revenues. |
| | | | |
| | | (k) | The Advisor pays the incentive compensation of the Fund’s compliance officers and employs other staff, such as legal, marketing, national accounts, distribution, sales, administrative, and trading oversight personnel, as well as management executives. |
| | | | |
| | | (l) | The Advisor provides a quarterly compliance certification to the Board. |
| | | | |
| | | (m) | The Advisor prepares or reviews all Board materials, frequently presents to the Board and leads Board discussions, prepares or reviews all meeting minutes, and arranges for Board training and education. |
| | (2) | The Trustees compared the performance of the Fund to benchmark indices over various periods and also noted that the Trustees review and discuss reports comparing the investment performance of the Fund to various indices at each quarterly Board meeting. Based on such information, the Trustees determined that the Advisor manages the Fund in a manner materially consistent with its stated investment objective and style. The Trustees concluded that the performance of the Fund over various periods warranted continuation of the advisory agreement. |
| | | |
| | (3) | The Trustees reviewed the advisory fees and overall expense ratios of the Fund compared to other funds similar in asset size and investment objective to the Fund using data from Morningstar. As part of the discussion with management, the Trustees ensured that they understood and were comfortable with the criteria used to determine the mutual funds included in the Morningstar categories for purposes of the materials considered at the meeting. The Trustees determined that the advisory fee and overall expense ratio of the Fund falls within the range of the advisory fees and overall expense ratios of other comparable funds and concluded that they are reasonable and warranted continuation of the advisory agreement. |
| | | |
| | (4) | The Trustees also considered whether the Advisor was realizing economies of scale that it should share with the Fund’s shareholders. The Trustees noted that many of the expenses incurred to manage the Fund are asset-based fees, so the Advisor would not realize material economies of scale relating to those expenses as the assets of the Fund increase. For example, third-party platform fees increase as the Fund’s assets grow. The Trustees also considered the Advisor’s significant marketing efforts to promote the Funds and the Advisor’s agreement to waive fees or lower its management fees in certain circumstances. |
| | | |
| | (5) | The Trustees considered the profitability of the Advisor, including the impact of mutual fund platform fees on the Advisor’s profitability, and also considered the resources and revenues that the Advisor has put into managing and distributing the Fund. The Trustees then concluded that the profits of the Advisor are reasonable and not excessive when compared to profitability guidelines set forth in relevant court cases. |
| | | |
| | (6) | The Trustees considered the high level of professionalism and knowledge of the Advisor’s employees, along with a very low level of turnover, and concluded that this was beneficial to the Fund and its shareholders. |
| HENNESSY FUNDS | 1-800-966-4354 | |
| | (7) | The Trustees considered any benefits to the Advisor from serving as an advisor to the Fund (other than the advisory fee). The Trustees noted that the Advisor may derive ancillary benefits from, by way of example, its association with the Fund in the form of proprietary and third-party research products and services received from broker-dealers that execute portfolio trades for the Fund. The Trustees determined that any such products and services have been used for legitimate purposes relating to the Fund by providing assistance in the investment decision-making process. The Trustees concluded that any additional benefits realized by the Advisor from its relationship with the Fund were reasonable, which was based on, among other things, the Trustees’ finding that the research, analytical, statistical, and other information and services provided by brokers are merely supplemental to the Advisor’s own efforts in the performance of its duties under the advisory agreement. |
After reviewing the materials and information provided at the meeting, as well as other information regularly provided at the Board’s quarterly meetings throughout the year regarding the quality of services provided by the Advisor, the performance of the Fund, expense information, brokerage commissions information, the adequacy and efficacy of the Advisor’s written policies and procedures, other regulatory compliance issues, trading information and related matters, and other factors that the Trustees deemed relevant, the Trustees, including the Independent Trustees, approved the continuation of the advisory agreement.
| BOARD APPROVAL OF INVESTMENT ADVISORY AGREEMENT |
(This Page Intentionally Left Blank.)
For information, questions, or assistance, please call
The Hennessy Funds
1-800-966-4354 or 1-415-899-1555
INVESTMENT ADVISOR
Hennessy Advisors, Inc.
7250 Redwood Boulevard, Suite 200
Novato, California 94945
ADMINISTRATOR,
TRANSFER AGENT,
DIVIDEND PAYING AGENT, &
SHAREHOLDER SERVICING AGENT
U.S. Bancorp Fund Services, LLC
d/b/a U.S. Bank Global Fund Services
P.O. Box 701
Milwaukee, Wisconsin 53201-0701
CUSTODIAN
U.S. Bank N.A.
Custody Operations
1555 North River Center Drive, Suite 302
Milwaukee, Wisconsin 53212
TRUSTEES
Neil J. Hennessy
Robert T. Doyle
J. Dennis DeSousa
Gerald P. Richardson
COUNSEL
Foley & Lardner LLP
777 East Wisconsin Avenue
Milwaukee, Wisconsin 53202-5306
INDEPENDENT REGISTERED
PUBLIC ACCOUNTING FIRM
Tait, Weller & Baker LLP
Two Liberty Place
50 South 16th Street, Suite 2900
Philadelphia, Pennsylvania 19102-2529
DISTRIBUTOR
Quasar Distributors, LLC
111 East Kilbourn Avenue, Suite 2200
Milwaukee, Wisconsin 53202
www.hennessyfunds.com | 1-800-966-4354
This report has been prepared for shareholders and may be distributed to
others only if preceded or accompanied by a current prospectus.

SEMI-ANNUAL REPORT
APRIL 30, 2021
HENNESSY BP ENERGY TRANSITION FUND
Investor Class HNRGX
Institutional Class HNRIX
www.hennessyfunds.com | 1-800-966-4354
(This Page Intentionally Left Blank.)
Contents
| Letter to Shareholders | 2 |
| Performance Overview | 4 |
| Financial Statements | |
| Schedule of Investments | 5 |
| Statement of Assets and Liabilities | 9 |
| Statement of Operations | 10 |
| Statements of Changes in Net Assets | 11 |
| Financial Highlights | 12 |
| Notes to the Financial Statements | 16 |
| Expense Example | 24 |
| Proxy Voting Policy and Proxy Voting Records | 26 |
| Availability of Quarterly Portfolio Schedule | 26 |
| Federal Tax Distribution Information | 26 |
| Important Notice Regarding Delivery of Shareholder Documents | 26 |
| Electronic Delivery | 26 |
| Board Approval of Investment Advisory Agreements | 27 |
| HENNESSY FUNDS | 1-800-966-4354 | |
May 2021
Dear Hennessy Funds Shareholder:
I can hardly believe that we have been navigating through one of the worst pandemics in modern history for more than a year. From the start, our thoughts have been with those affected by COVID-19 and with our frontline healthcare and essential workers. We are encouraged by the rapid rollout of vaccines and the continued reopening of the economy, and we hope this signals a turning point.
This is the first time in over 20 years in this business that I have witnessed volatility as extreme as the volatility that has rocked the financial markets and the economy over the past year. Both the pace of change and the magnitude of change have been staggering. As I reflect on this, I am reminded of a scientific concept called “punctuated equilibrium.” Biologist Stephen Jay Gould revolutionized evolutionary thinking with this theory, which challenged the prevailing belief that biological change happens slowly, consistently, and methodically over time. His theory instead proposed that change happens abruptly and dramatically and that new species pop up and others vanish rapidly, sometimes caused by catastrophic events. In between these explosive periods are much longer intervals of relative stability.
The dramatic market downdraft brought on by the pandemic, followed by the equally dramatic recovery, have been jarring. We witnessed an explosion of IPOs, a plethora of bankruptcies, and a dramatic change in market leadership. Yet unlike in the biological world, we are able to respond to stock market crises and try to dampen their negative impact. There have been numerous and unprecedented fiscal and monetary responses from the Federal Reserve and the U.S. government, and in many ways these measures may have spurred the economic recovery.
For the first six months of our fiscal year through April 30, 2021, the market appeared to be on a relentless march higher, with the S&P 500® Index rising 28.85% on a total return basis, setting new all-time highs 35 times in 124 trading days and closing at its then-highest level ever on April 29, 2021. We saw a dramatic shift back toward value investing, and many of the sectors and individual stocks that had underperformed for most of last year soared. Value outperformed growth, small-caps beat mid-caps, and mid-caps beat large-caps. The Energy and Financials sectors skyrocketed, as evidenced by the S&P 500® Energy Index’s total return of 75.94% and the Russell 1000® Index Financials’ total return of 52.00% during the six-month period. As we begin to move beyond the chaos caused by the pandemic, solid market fundamentals are reappearing, which we believe underscores the health and strength of our economy.
We are pleased with the performance of our mutual funds during the first half of our fiscal year. On an absolute basis, each of our 16 Funds achieved positive performance, and 11 of our 16 funds outperformed their primary benchmark. Ten of our 11 domestic equity-only Funds outperformed the S&P 500® Index, and three of our sector Funds posted total returns of over 50%, due primarily to their focus on the Energy and Financials sectors. We believe this was a favorable period for both our style of high-conviction investing as well as the areas and sectors of the market in which our Funds focus. While performance may wax and wane over a complete market cycle, we remain committed to managing our portfolios for long-term performance, ever mindful of downside risk.
Circling back to Gould’s theory of punctuated equilibrium, we are left with the question, “Where do we go from here?” Are we entering a more stable period in the economy and the market, similar to the periods of relative stasis in the geological record? We are optimistic that this may in fact be the case and that the markets will return to a less volatile part of the cycle. But, with history as our guide, we know that even the greatest bull markets have experienced corrections along the way. While certain individual stock or sector valuations might look stretched, we believe the market as a whole has more room to run. Strong GDP growth and increasing earnings expectations for this year, a potentially lower-for-longer interest rate environment, accommodative fiscal and monetary policies, a healthy and robust financial system, low unemployment and solid wage growth, and a measured reopening of certain parts of the economy all support the market moving higher from here.
We remain committed to our shareholders as we thoughtfully navigate these unprecedented times. We know that you have a multitude of investment options to choose from, and we are grateful for the trust you put in us and your continued interest and investment in our family of Funds. Should you have any questions or would like to speak with us, please don’t hesitate to call us directly at (800) 966-4354.
Best regards,
| |
| |
| |
| |
|
| Ryan C. Kelley |
| Chief Investment Officer |
Past performance does not guarantee future results. To obtain current standardized performance for the Hennessy Funds, visit https://www.hennessyfunds.com/funds/price-performance.
Mutual fund investing involves risk. Principal loss is possible.
Opinions expressed are those of Ryan C. Kelley and are subject to change, are not guaranteed, and should not be considered investment advice.
The S&P 500® Index is a capitalization-weighted index that is designed to represent the broad domestic economy through changes in aggregate market value of 500 stocks across all major industries. The S&P 500® Energy Index comprises those companies included in the S&P 500® Index that are classified in the Energy sector. The Russell 1000® Index Financials is a subset of the Russell 1000® Index that measures the performance of securities classified in the Financials sector of the large-capitalization U.S. equity market. The indices are used herein for comparative purposes in accordance with SEC regulations. One cannot invest directly in an index. All returns are shown on a total return basis.
| HENNESSY FUNDS | 1-800-966-4354 | |
Performance Overview (Unaudited)
AVERAGE ANNUAL TOTAL RETURN FOR PERIODS ENDED APRIL 30, 2021
| | Six | One | Five | Since Inception |
| | Months(1) | Year
| Years
| (12/31/13)
|
| Hennessy BP Energy Transition | | | | |
| Fund – Investor Class (HNRGX) | 70.48% | 67.23% | -2.89% | -3.58% |
| Hennessy BP Energy Transition | | | | |
| Fund – Institutional Class (HNRIX) | 70.62% | 67.59% | -2.63% | -3.36% |
S&P 500® Energy Index | 75.94% | 35.76% | -2.27% | -4.15% |
S&P 500® Index | 28.85% | 45.98% | 17.42% | 14.03% |
Expense ratios: 2.59% (Investor Class); 2.01% (Institutional Class)
(1) | Periods of less than one year are not annualized. |
_______________
Performance data quoted represents past performance; past performance does not guarantee future results. The investment return and principal value of an investment will fluctuate so that an investor’s shares, when redeemed, may be worth more or less than their original cost. The performance table does not reflect the deduction of taxes that a shareholder would pay on Fund distributions or the redemption of Fund shares. Current performance of the Fund may be lower or higher than the performance quoted. Performance data current to the most recent month end may be obtained by visiting www.hennessyfunds.com. Performance for periods including or prior to October 26, 2018, is that of the BP Capital TwinLine Energy Fund.
The S&P 500® Energy Index comprises those companies included in the S&P 500® that are classified in the Energy sector. The S&P 500® Index is a capitalization-weighted index that is designed to represent the broad domestic economy through changes in the aggregate market value of 500 stocks across all major industries. One cannot invest directly in an index. These indices are used herein for comparative purposes in accordance with Securities and Exchange Commission regulations.
Standard & Poor’s Financial Services is the source and owner of the S&P® and S&P 500® trademarks.
The expense ratios presented are from the most recent prospectus. The expense ratios for the current reporting period are available in the Financial Highlights section of this report.
| PERFORMANCE OVERVIEW/SCHEDULE OF INVESTMENTS |
Financial Statements
Schedule of Investments as of April 30, 2021 (Unaudited) |
HENNESSY BP ENERGY TRANSITION FUND
(% of Total Assets)
| TOP TEN HOLDINGS (EXCLUDING MONEY MARKET FUNDS) | % TOTAL ASSETS |
| EOG Resources, Inc. | 5.55% |
| Diamondback Energy, Inc. | 5.40% |
| Suncor Energy, Inc. | 5.01% |
| Comstock Resources, Inc. | 4.96% |
| ConocoPhillips | 4.94% |
| Exxon Mobil Corp. | 4.87% |
| Pioneer Natural Resources Co. | 4.87% |
| Freeport-McMoRan, Inc. | 4.85% |
| PDC Energy, Inc. | 4.84% |
| Cheniere Energy, Inc. | 4.71% |
Note: The Fund concentrates its investments in the Energy industry. For presentation purposes, the Fund uses custom categories.
| HENNESSY FUNDS | 1-800-966-4354 | |
| COMMON STOCKS – 87.99% | | Number | | | | | | % of | |
| | | of Shares | | | Value | | | Net Assets | |
| Downstream – 2.40% | | | | | | | | | |
| Valero Energy Corp. | | | 3,000 | | | $ | 221,880 | | | | 2.40 | % |
| | | | | | | | | | | | | |
| Exploration & Production – 44.84% | | | | | | | | | | | | |
| Cabot Oil & Gas Corp. | | | 25,310 | | | | 421,918 | | | | 4.56 | % |
| Comstock Resources, Inc. (a) | | | 84,900 | | | | 466,101 | | | | 5.04 | % |
| ConocoPhillips | | | 9,095 | | | | 465,118 | | | | 5.02 | % |
| Diamondback Energy, Inc. | | | 6,220 | | | | 508,361 | | | | 5.49 | % |
| EOG Resources, Inc. | | | 7,090 | | | | 522,108 | | | | 5.64 | % |
| EQT Corp. (a) | | | 20,000 | | | | 382,000 | | | | 4.13 | % |
| PDC Energy, Inc. (a) | | | 12,480 | | | | 455,645 | | | | 4.92 | % |
| Pioneer Natural Resources Co. | | | 2,980 | | | | 458,413 | | | | 4.95 | % |
| Suncor Energy, Inc. (b) | | | 22,000 | | | | 471,240 | | | | 5.09 | % |
| | | | | | | | 4,150,904 | | | | 44.84 | % |
| | | | | | | | | | | | | |
| Integrated – 4.95% | | | | | | | | | | | | |
| Exxon Mobil Corp. | | | 8,000 | | | | 457,920 | | | | 4.95 | % |
| | | | | | | | | | | | | |
| Midstream – 4.79% | | | | | | | | | | | | |
| Cheniere Energy, Inc. (a) | | | 5,720 | | | | 443,414 | | | | 4.79 | % |
| | | | | | | | | | | | | |
| Oil Services – 18.25% | | | | | | | | | | | | |
| Halliburton Co. | | | 10,000 | | | | 195,600 | | | | 2.11 | % |
| Newpark Resources, Inc. (a) | | | 78,300 | | | | 222,372 | | | | 2.40 | % |
| Schlumberger Ltd. (b) | | | 16,170 | | | | 437,399 | | | | 4.73 | % |
| Select Energy Services, Inc. (a) | | | 59,300 | | | | 286,419 | | | | 3.09 | % |
| Solaris Oilfield Infrastructure, Inc. – Class A | | | 22,300 | | | | 243,962 | | | | 2.64 | % |
| TechnipFMC PLC (a)(b) | | | 41,000 | | | | 303,400 | | | | 3.28 | % |
| | | | | | | | 1,689,152 | | | | 18.25 | % |
| | | | | | | | | | | | | |
| Renewable – 0.77% | | | | | | | | | | | | |
| TPI Composites, Inc. (a) | | | 1,340 | | | | 71,221 | | | | 0.77 | % |
| | | | | | | | | | | | | |
| Utility – 11.99% | | | | | | | | | | | | |
| Freeport-McMoRan, Inc. | | | 12,100 | | | | 456,291 | | | | 4.93 | % |
| NextEra Energy, Inc. | | | 3,240 | | | | 251,132 | | | | 2.71 | % |
| OGE Energy Corp. | | | 12,000 | | | | 402,720 | | | | 4.35 | % |
| | | | | | | | 1,110,143 | | | | 11.99 | % |
| | | | | | | | | | | | | |
| Total Common Stocks | | | | | | | | | | | | |
| (Cost $7,317,651) | | | | | | | 8,144,634 | | | | 87.99 | % |
The accompanying notes are an integral part of these financial statements.
| PARTNERSHIPS & TRUSTS – 11.83% | | Number | | | | | | % of | |
| | | of Shares | | | Value | | | Net Assets | |
| Midstream – 11.83% | | | | | | | | | |
| Enterprise Products Partners LP | | | 11,209 | | | $ | 257,919 | | | | 2.79 | % |
| MPLX LP | | | 14,774 | | | | 398,750 | | | | 4.31 | % |
| Plains All American Pipeline LP | | | 48,240 | | | | 438,019 | | | | 4.73 | % |
| | | | | | | | 1,094,688 | | | | 11.83 | % |
| | | | | | | | | | | | | |
| Total Partnerships & Trusts | | | | | | | | | | | | |
| (Cost $1,450,778) | | | | | | | 1,094,688 | | | | 11.83 | % |
| | | | | | | | | | | | | |
| SHORT-TERM INVESTMENTS – 0.01% | | | | | | | | | | | | |
| | | | | | | | | | | | | |
| Money Market Funds – 0.01% | | | | | | | | | | | | |
| First American Government Obligations Fund, | | | | | | | | | | | | |
| Institutional Class, 0.03% (c) | | | 508 | | | | 508 | | | | 0.01 | % |
| | | | | | | | | | | | | |
| Total Short-Term Investments | | | | | | | | | | | | |
| (Cost $508) | | | | | | | 508 | | | | 0.01 | % |
| | | | | | | | | | | | | |
| Total Investments | | | | | | | | | | | | |
| (Cost $8,768,937) – 99.83% | | | | | | | 9,239,830 | | | | 99.83 | % |
| Other Assets in Excess of Liabilities – 0.17% | | | | | | | 15,939 | | | | 0.17 | % |
| | | | | | | | | | | | | |
TOTAL NET ASSETS – 100.00% | | | | | | $ | 9,255,769 | | | | 100.00 | % |
Percentages are stated as a percent of net assets.
| (a) | Non-income-producing security. |
| (b) | U.S.-traded security of a foreign corporation. |
| (c) | The rate listed is the fund’s seven-day yield as of April 30, 2021. |
The accompanying notes are an integral part of these financial statements.
| HENNESSY FUNDS | 1-800-966-4354 | |
Summary of Fair Value Exposure as of April 30, 2021
The following is a summary of the inputs used to value the Fund’s net assets as of April 30, 2021 (see Note 3 in the accompanying Notes to the Financial Statements):
| Common Stocks | | Level 1 | | | Level 2 | | | Level 3 | | | Total | |
| Downstream | | $ | 221,880 | | | $ | — | | | $ | — | | | $ | 221,880 | |
| Exploration & Production | | | 4,150,904 | | | | — | | | | — | | | | 4,150,904 | |
| Integrated | | | 457,920 | | | | — | | | | — | | | | 457,920 | |
| Midstream | | | 443,414 | | | | — | | | | — | | | | 443,414 | |
| Oil Services | | | 1,689,152 | | | | — | | | | — | | | | 1,689,152 | |
| Renewable | | | 71,221 | | | | — | | | | — | | | | 71,221 | |
| Utility | | | 1,110,143 | | | | — | | | | — | | | | 1,110,143 | |
| Total Common Stocks | | $ | 8,144,634 | | | $ | — | | | $ | — | | | $ | 8,144,634 | |
| Partnerships & Trusts | | | | | | | | | | | | | | | | |
| Midstream | | $ | 1,094,688 | | | $ | — | | | $ | — | | | $ | 1,094,688 | |
| Total Partnerships & Trusts | | $ | 1,094,688 | | | $ | — | | | $ | — | | | $ | 1,094,688 | |
| Short-Term Investments | | | | | | | | | | | | | | | | |
| Money Market Funds | | $ | 508 | | | $ | — | | | $ | — | | | $ | 508 | |
| Total Short-Term Investments | | $ | 508 | | | $ | — | | | $ | — | | | $ | 508 | |
| Total Investments | | $ | 9,239,830 | | | $ | — | | | $ | — | | | $ | 9,239,830 | |
The accompanying notes are an integral part of these financial statements.
| SCHEDULE OF INVESTMENTS/STATEMENT OF ASSETS AND LIABILITIES |
Financial Statements
Statement of Assets and Liabilities as of April 30, 2021 (Unaudited) |
| ASSETS: | | | |
| Investments in securities, at value (cost $8,768,937) | | $ | 9,239,830 | |
| Dividends and interest receivable | | | 1,021 | |
| Receivable for fund shares sold | | | 133,958 | |
| Return of capital receivable | | | 13,727 | |
| Prepaid expenses and other assets | | | 17,432 | |
| Total assets | | | 9,405,968 | |
| | | | | |
| LIABILITIES: | | | | |
| Payable for fund shares redeemed | | | 31,348 | |
| Payable to advisor | | | 9,676 | |
| Payable to auditor | | | 11,403 | |
| Accrued distribution fees | | | 1,159 | |
| Accrued service fees | | | 404 | |
| Loans payable | | | 82,000 | |
| Accrued interest payable | | | 252 | |
| Accrued trustees fees | | | 5,154 | |
| Accrued expenses and other payables | | | 8,803 | |
| Total liabilities | | | 150,199 | |
| NET ASSETS | | $ | 9,255,769 | |
| | | | | |
| NET ASSETS CONSISTS OF: | | | | |
| Capital stock | | $ | 49,859,920 | |
| Accumulated deficit | | | (40,604,151 | ) |
| Total net assets | | $ | 9,255,769 | |
| | | | | |
| NET ASSETS: | | | | |
| Investor Class | | | | |
| Shares authorized (no par value) | | Unlimited | |
| Net assets applicable to outstanding shares | | $ | 4,953,467 | |
| Shares issued and outstanding | | | 332,552 | |
| Net asset value, offering price, and redemption price per share | | $ | 14.90 | |
| | | | | |
| Institutional Class | | | | |
| Shares authorized (no par value) | | Unlimited | |
| Net assets applicable to outstanding shares | | $ | 4,302,302 | |
| Shares issued and outstanding | | | 284,826 | |
| Net asset value, offering price, and redemption price per share | | $ | 15.11 | |
The accompanying notes are an integral part of these financial statements.
| HENNESSY FUNDS | 1-800-966-4354 | |
Financial Statements
Statement of Operations for the six months ended April 30, 2021 (Unaudited) |
| INVESTMENT INCOME: | | | |
| Distributions received from master limited partnerships | | $ | 49,989 | |
| Return of capital on distributions received | | | (49,989 | ) |
Dividend income from common stock(1) | | | 189,195 | |
| Interest income | | | 10 | |
| Total investment income | | | 189,205 | |
| | | | | |
| EXPENSES: | | | | |
| Investment advisory fees (See Note 5) | | | 54,399 | |
| Federal and state registration fees | | | 15,045 | |
| Compliance expense (See Note 5) | | | 13,841 | |
| Audit fees | | | 11,403 | |
| Administration, accounting, custody, and transfer agent fees (See Note 5) | | | 11,081 | |
| Trustees’ fees and expenses | | | 9,146 | |
| Reports to shareholders | | | 4,218 | |
| Distribution fees – Investor Class (See Note 5) | | | 3,040 | |
| Sub-transfer agent expenses – Investor Class (See Note 5) | | | 2,785 | |
| Sub-transfer agent expenses – Institutional Class (See Note 5) | | | 58 | |
| Service fees – Investor Class (See Note 5) | | | 2,026 | |
| Interest expense (See Note 7) | | | 885 | |
| Legal fees | | | 192 | |
| Other expenses | | | 3,228 | |
| Total expenses before waivers | | | 131,347 | |
| Service provider expense waiver (See Note 5) | | | (11,081 | ) |
| Net expenses | | | 120,266 | |
| NET INVESTMENT INCOME | | $ | 68,939 | |
| | | | | |
| REALIZED AND UNREALIZED GAINS (LOSSES): | | | | |
| Net realized gain on investments | | $ | 942,350 | |
| Net change in unrealized appreciation/depreciation on investments | | | 3,118,027 | |
| Net gain on investments | | | 4,060,377 | |
| NET INCREASE IN NET ASSETS RESULTING FROM OPERATIONS | | $ | 4,129,316 | |
(1) | Net of foreign taxes withheld of $614. |
The accompanying notes are an integral part of these financial statements.
| STATEMENT OF OPERATIONS/STATEMENTS OF CHANGES IN NET ASSETS |
Financial Statements
| Statements of Changes in Net Assets |
| | | Six Months Ended | | | | |
| | | April 30, 2021 | | | Year Ended | |
| | | (Unaudited) | | | October 31, 2020 | |
| OPERATIONS: | | | | | | |
| Net investment income | | $ | 68,939 | | | $ | 195,908 | |
| Net realized gain (loss) on investments | | | 942,350 | | | | (19,552,986 | ) |
| Net change in unrealized | | | | | | | | |
| appreciation/depreciation on investments | | | 3,118,027 | | | | 3,844,502 | |
| Net increase (decrease) in net | | | | | | | | |
| assets resulting from operations | | | 4,129,316 | | | | (15,512,576 | ) |
| | | | | | | | | |
| DISTRIBUTIONS TO SHAREHOLDERS: | | | | | | | | |
| Distributable earnings – Institutional Class | | | — | | | | (79,003 | ) |
| Total distributions | | | — | | | | (79,003 | ) |
| | | | | | | | | |
| CAPITAL SHARE TRANSACTIONS: | | | | | | | | |
| Proceeds from shares subscribed – Investor Class | | | 4,426,105 | | | | 2,364,355 | |
| Proceeds from shares subscribed – Institutional Class | | | 278,049 | | | | 2,010,096 | |
| Dividends reinvested – Institutional Class | | | — | | | | 77,299 | |
| Cost of shares redeemed – Investor Class | | | (3,676,902 | ) | | | (4,505,031 | ) |
| Cost of shares redeemed – Institutional Class | | | (2,214,280 | ) | | | (29,242,373 | ) |
| Net decrease in net assets derived | | | | | | | | |
| from capital share transactions | | | (1,187,028 | ) | | | (29,295,654 | ) |
| TOTAL INCREASE (DECREASE) IN NET ASSETS | | | 2,942,288 | | | | (44,887,233 | ) |
| | | | | | | | | |
| NET ASSETS: | | | | | | | | |
| Beginning of period | | | 6,313,481 | | | | 51,200,714 | |
| End of period | | $ | 9,255,769 | | | $ | 6,313,481 | |
| | | | | | | | | |
| CHANGES IN SHARES OUTSTANDING: | | | | | | | | |
| Shares sold – Investor Class | | | 326,341 | | | | 265,356 | |
| Shares sold – Institutional Class | | | 18,980 | | | | 207,448 | |
| Shares issued to holders as reinvestment | | | | | | | | |
| of dividends – Institutional Class | | | — | | | | 5,019 | |
| Shares redeemed – Investor Class | | | (279,442 | ) | | | (464,633 | ) |
| Shares redeemed – Institutional Class | | | (165,369 | ) | | | (2,892,945 | ) |
| Net decrease in shares outstanding | | | (99,490 | ) | | | (2,879,755 | ) |
The accompanying notes are an integral part of these financial statements.
| HENNESSY FUNDS | 1-800-966-4354 | |
Financial Statements
For an Investor Class share outstanding throughout each period
| | | Six Months Ended | |
| | | April 30, 2021 | |
| | | (Unaudited) | |
| PER SHARE DATA: | | | |
| Net asset value, beginning of period | | $ | 8.74 | |
| | | | | |
| Income from investment operations: | | | | |
Net investment income (loss)(2) | | | 0.11 | |
| Net realized and unrealized gains (losses) on investments | | | 6.05 | |
| Total from investment operations | | | 6.16 | |
| | | | | |
| Less distributions: | | | | |
| Dividends from net realized gains | | | — | |
| Total distributions | | | — | |
| Net asset value, end of period | | $ | 14.90 | |
| | | | | |
| TOTAL RETURN | | | 70.48 | %(3) |
| | | | | |
| SUPPLEMENTAL DATA AND RATIOS: | | | | |
| Net assets, end of period (millions) | | $ | 4.95 | |
| Ratio of expenses to average net assets: | | | | |
| Before expense reimbursement | | | 3.21 | %(4) |
| After expense reimbursement | | | 2.95 | %(4) |
| Ratio of net investment income (loss) to average net assets: | | | | |
| Before expense reimbursement | | | 1.37 | %(4) |
| After expense reimbursement | | | 1.63 | %(4) |
Portfolio turnover rate(6) | | | 56 | %(3) |
(1) | The period ended October 31, 2018, consists of 11 months due to the Fund’s fiscal year end change from November 30 to October 31, effective October 26, 2018. |
(2) | Calculated using the average shares outstanding method. |
(3) | Not annualized. |
(4) | Annualized. |
(5) | The Fund had an expense limitation agreement in place through October 25, 2020. |
(6) | Calculated on the basis of the Fund as a whole. |
The accompanying notes are an integral part of these financial statements.
| FINANCIAL HIGHLIGHTS — INVESTOR CLASS |
Year Ended October 31, | | | Period Ended | | | Year Ended November 30, | |
| | | October 31, | | | |
| 2020 | | | 2019 | | | 2018(1) | | | 2017 | | | 2016 | | | 2015 | |
| | | | | | | | | | | | | | | | | |
| $ | 14.08 | | | $ | 18.32 | | | $ | 19.47 | | | $ | 20.54 | | | $ | 16.41 | | | $ | 20.45 | |
| | | | | | | | | | | | | | | | | | | | | | | |
| | | | | | | | | | | | | | | | | | | | | | | |
| | 0.04 | | | | (0.07 | ) | | | (0.20 | ) | | | (0.23 | ) | | | (0.15 | ) | | | (0.10 | ) |
| | (5.38 | ) | | | (4.17 | ) | | | (0.95 | ) | | | (0.84 | ) | | | 4.28 | | | | (3.46 | ) |
| | (5.34 | ) | | | (4.24 | ) | | | (1.15 | ) | | | (1.07 | ) | | | 4.13 | | | | (3.56 | ) |
| | | | | | | | | | | | | | | | | | | | | | | |
| | | | | | | | | | | | | | | | | | | | | | | |
| | — | | | | — | | | | — | | | | — | | | | — | | | | (0.48 | ) |
| | — | | | | — | | | | — | | | | — | | | | — | | | | (0.48 | ) |
| $ | 8.74 | | | $ | 14.08 | | | $ | 18.32 | | | $ | 19.47 | | | $ | 20.54 | | | $ | 16.41 | |
| | | | | | | | | | | | | | | | | | | | | | | |
| | -37.93 | % | | | -23.14 | % | | | -5.91 | %(3) | | | -5.21 | % | | | 25.17 | % | | | -17.57 | % |
| | | | | | | | | | | | | | | | | | | | | | | |
| | | | | | | | | | | | | | | | | | | | | | | |
| $ | 2.50 | | | $ | 6.83 | | | $ | 18.16 | | | $ | 22.66 | | | $ | 19.64 | | | $ | 18.72 | |
| | | | | | | | | | | | | | | | | | | | | | | |
| | 2.59 | % | | | 1.97 | % | | | 1.82 | %(4) | | | 1.87 | % | | | 1.89 | % | | | 1.87 | % |
| | 2.03 | %(5) | | | 1.97 | % | | | 1.82 | %(4) | | | 1.87 | % | | | 1.89 | % | | | 1.87 | % |
| | | | | | | | | | | | | | | | | | | | | | | |
| | (0.18 | )% | | | (0.46 | )% | | | (1.05 | )%(4) | | | (1.21 | )% | | | (0.92 | )% | | | (0.51 | )% |
| | 0.38 | % | | | (0.46 | )% | | | (1.05 | )%(4) | | | (1.21 | )% | | | (0.92 | )% | | | (0.51 | )% |
| | 73 | % | | | 87 | % | | | 72 | %(3) | | | 84 | % | | | 83 | % | | | 79 | % |
The accompanying notes are an integral part of these financial statements.
| HENNESSY FUNDS | 1-800-966-4354 | |
Financial Statements
For an Institutional Class share outstanding throughout each period
| | | Six Months Ended | |
| | | April 30, 2021 | |
| | | (Unaudited) | |
| PER SHARE DATA: | | | |
| Net asset value, beginning of period | | $ | 8.85 | |
| | | | | |
| Income from investment operations: | | | | |
Net investment income (loss)(2) | | | 0.10 | |
| Net realized and unrealized gains (losses) on investments | | | 6.16 | |
| Total from investment operations | | | 6.26 | |
| | | | | |
| Less distributions: | | | | |
| Dividends from net investment income | | | — | |
| Dividends from net realized gains | | | — | |
| Total distributions | | | — | |
| Net asset value, end of period | | $ | 15.11 | |
| | | | | |
| TOTAL RETURN | | | 70.62 | %(3) |
| | | | | |
| SUPPLEMENTAL DATA AND RATIOS: | | | | |
| Net assets, end of period (millions) | | $ | 4.30 | |
| Ratio of expenses to average net assets: | | | | |
| Before expense reimbursement | | | 2.85 | %(4) |
| After expense reimbursement | | | 2.59 | %(4) |
| Ratio of net investment income (loss) to average net assets: | | | | |
| Before expense reimbursement | | | 1.29 | %(4) |
| After expense reimbursement | | | 1.55 | %(4) |
Portfolio turnover rate(6) | | | 56 | %(3) |
(1) | The period ended October 31, 2018, consists of 11 months due to the Fund’s fiscal year end change from November 30 to October 31, effective October 26, 2018. |
(2) | Calculated using the average shares outstanding method. |
(3) | Not annualized. |
(4) | Annualized. |
(5) | The Fund had an expense limitation agreement in place through October 25, 2020. |
(6) | Calculated on the basis of the Fund as a whole. |
The accompanying notes are an integral part of these financial statements.
| FINANCIAL HIGHLIGHTS — INSTITUTIONAL CLASS |
Year Ended October 31, | | | Period Ended | | | Year Ended November 30, | |
| | | October 31, | | | |
| 2020 | | | 2019 | | | 2018(1) | | | 2017 | | | 2016 | | | 2015 | |
| | | | | | | | | | | | | | | | | |
| $ | 14.26 | | | $ | 18.50 | | | $ | 19.61 | | | $ | 20.64 | | | $ | 16.46 | | | $ | 20.45 | |
| | | | | | | | | | | | | | | | | | | | | | | |
| | | | | | | | | | | | | | | | | | | | | | | |
| | 0.12 | | | | (0.02 | ) | | | (0.15 | ) | | | (0.19 | ) | | | (0.11 | ) | | | (0.04 | ) |
| | (5.50 | ) | | | (4.22 | ) | | | (0.96 | ) | | | (0.84 | ) | | | 4.32 | | | | (3.47 | ) |
| | (5.38 | ) | | | (4.24 | ) | | | (1.11 | ) | | | (1.03 | ) | | | 4.21 | | | | (3.51 | ) |
| | | | | | | | | | | | | | | | | | | | | | | |
| | | | | | | | | | | | | | | | | | | | | | | |
| | (0.03 | ) | | | — | | | | — | | | | — | | | | (0.03 | ) | | | — | |
| | — | | | | — | | | | — | | | | — | | | | — | | | | (0.48 | ) |
| | (0.03 | ) | | | — | | | | — | | | | — | | | | (0.03 | ) | | | (0.48 | ) |
| $ | 8.85 | | | $ | 14.26 | | | $ | 18.50 | | | $ | 19.61 | | | $ | 20.64 | | | $ | 16.46 | |
| | | | | | | | | | | | | | | | | | | | | | | |
| | -37.80 | % | | | -22.92 | % | | | -5.66 | %(3) | | | -4.99 | % | | | 25.61 | % | | | -17.32 | % |
| | | | | | | | | | | | | | | | | | | | | | | |
| | | | | | | | | | | | | | | | | | | | | | | |
| $ | 3.82 | | | $ | 44.37 | | | $ | 78.81 | | | $ | 122.45 | | | $ | 126.92 | | | $ | 100.05 | |
| | | | | | | | | | | | | | | | | | | | | | | |
| | 2.01 | % | | | 1.66 | % | | | 1.57 | %(4) | | | 1.62 | % | | | 1.60 | % | | | 1.54 | % |
| | 1.77 | %(5) | | | 1.66 | % | | | 1.57 | %(4) | | | 1.62 | % | | | 1.60 | % | | | 1.54 | % |
| | | | | | | | | | | | | | | | | | | | | | | |
| | 0.79 | % | | | (0.12 | )% | | | (0.79 | )%(4) | | | (0.98 | )% | | | (0.65 | )% | | | (0.20 | )% |
| | 1.03 | % | | | (0.12 | )% | | | (0.79 | )%(4) | | | (0.98 | )% | | | (0.65 | )% | | | (0.20 | )% |
| | 73 | % | | | 87 | % | | | 72 | %(3) | | | 84 | % | | | 83 | % | | | 79 | % |
The accompanying notes are an integral part of these financial statements.
| HENNESSY FUNDS | 1-800-966-4354 | |
Financial Statements
Notes to the Financial Statements April 30, 2021 (Unaudited) |
1). ORGANIZATION
The Hennessy BP Energy Transition Fund (the “Fund”) is a series of Hennessy Funds Trust (the “Trust”), which was organized as a Delaware statutory trust on September 17, 1992. The Fund is an open-end management investment company registered under the Investment Company Act of 1940, as amended. The investment objective of the Fund is to seek total return. The Fund is a diversified fund.
The Fund offers Investor Class and Institutional Class shares. Each class of shares differs principally in its respective 12b-1 distribution and service, shareholder servicing, and sub-transfer agent expenses. There are no sales charges. Each class has identical rights to earnings, assets, and voting privileges, except for class-specific expenses and exclusive rights to vote on matters affecting only one class.
As an investment company, the Fund follows the investment company accounting and reporting guidance of the Financial Accounting Standards Board (“FASB”) Accounting Standard Codification Topic 946 “Financial Services—Investment Companies.”
2). SIGNIFICANT ACCOUNTING POLICIES
The following is a summary of significant accounting policies consistently followed by the Fund in the preparation of the financial statements. These policies conform to U.S. generally accepted accounting principles (“GAAP”).
| a). | Securities Valuation – All investments in securities are valued in accordance with the Fund’s valuation policies and procedures, as described in Note 3. |
| | |
| b). | Federal Income Taxes – The Fund has elected to be taxed as a regulated investment company and intends to distribute substantially all of its taxable income to its shareholders and otherwise comply with the provisions of the Internal Revenue Code of 1986, as amended, applicable to regulated investment companies. As a result, the Fund has made no provision for federal income taxes or excise taxes. Net investment income/loss and realized gains/losses for federal income tax purposes may differ from those reported in the financial statements because of temporary book-basis and tax-basis differences. Temporary differences are primarily the result of the treatment of wash sales for tax reporting purposes and investments in companies organized as partnerships for tax purposes. The Fund recognizes interest and penalties related to income tax benefits, if any, in the Statement of Operations as an income tax expense. Distributions from net realized gains for book purposes may include short-term capital gains, which are included as ordinary income to shareholders for tax purposes. The Fund may utilize equalization accounting for tax purposes and designate earnings and profits, including net realized gains distributed to shareholders on redemption of shares, as part of the dividends paid deduction for income tax purposes. |
| | |
| c). | Accounting for Uncertainty in Income Taxes – The Fund has accounting policies regarding recognition and measurement of tax positions taken or expected to be taken on a tax return. The tax returns of the Fund for the prior three fiscal years are open for examination. The Fund has reviewed all open tax years in major tax jurisdictions and concluded that there is no impact on the Fund’s net assets and no tax liability resulting from unrecognized tax benefits relating to uncertain income tax |
| NOTES TO THE FINANCIAL STATEMENTS |
| | positions taken or expected to be taken on a tax return. The Fund’s major tax jurisdictions are U.S. federal and Delaware. |
| | |
| d). | Income and Expenses – Dividend income is recognized on the ex-dividend date or as soon as information is available to the Fund. Interest income, which includes the amortization of premium and accretion of discount, is recognized on an accrual basis. Market discounts, original issue discounts, and market premiums on debt securities are accreted or amortized to interest income over the life of a security with a corresponding increase or decrease, as applicable, in the cost basis of such security using the yield-to-maturity method or, where applicable, the first call date of the security. Other non-cash dividends are recognized as investment income at the fair value of the property received. The Fund is charged for those expenses that are directly attributable to its portfolio, such as advisory, administration, and certain shareholder service fees. Income, expenses (other than expenses attributable to a specific class), and realized and unrealized gains/losses on investments are allocated to each class of shares based on such class’s net assets. Distributions received from the Fund’s investments in master limited partnerships (“MLPs”) generally consist of ordinary income, capital gains, and return of capital. The Fund records investment income on the ex-date of the distributions. For financial statement purposes, the Fund uses return of capital and income estimates to allocate the dividend income received. Such estimates are based on historical information available from the MLPs and other industry sources. These estimates may subsequently be revised based on information received from the MLPs after their tax reporting periods are concluded, as the actual character of these distributions is not known until after the fiscal year end of the Fund. |
| | |
| e). | Distributions to Shareholders – Dividends from net investment income for the Fund, if any, are declared and paid annually, usually in December. Distributions of net realized capital gains, if any, are declared and paid annually, usually in December. |
| | |
| f). | Security Transactions – Investment and shareholder transactions are recorded on the trade date. The Fund determines the realized gain/loss from an investment transaction by comparing the original cost of the security lot sold with the net sale proceeds. Discounts and premiums on securities purchased are accreted or amortized, respectively, over the life of each such security. |
| | |
| g). | Use of Estimates – Preparing financial statements in accordance with GAAP requires management to make estimates and assumptions that affect the reported amounts of assets and liabilities and disclosure of contingent assets and liabilities at the date of the financial statements, as well as the reported change in net assets during the reporting period. Actual results could differ from those estimates. |
| | |
| h). | Share Valuation – The net asset value (“NAV”) per share of the Fund is calculated by dividing (i) the total value of the securities held by the Fund, plus cash and other assets, minus all liabilities (including estimated accrued expenses) by (ii) the total number of Fund shares outstanding, rounded to the nearest $0.01. Fund shares are not priced on days the New York Stock Exchange is closed for trading. The offering and redemption price per share for the Fund is equal to the Fund’s NAV per share. |
| | |
| i). | Partnership Accounting Policy – To the extent the Fund receives distributions from underlying partnerships in which it invests, the Fund records its pro rata share of income/loss and capital gains/losses and accordingly adjusts the cost basis of the underlying partnerships for return of capital. |
| | |
| j). | New Accounting Pronouncements – In August 2018, the FASB issued Accounting Standards Update No. 2018-13 “Disclosure Framework—Changes to the Disclosure |
| HENNESSY FUNDS | 1-800-966-4354 | |
| | Requirements for Fair Value Measurement” (“ASU 2018-13”). ASU 2018-13 eliminates the requirement to disclose the amount of and reasons for transfers between Level 1 and Level 2 of the fair value hierarchy, the timing of transfers between levels of the fair value hierarchy, and the valuation processes for Level 3 fair value measurements. ASU 2018-13 does not eliminate the requirement to disclose the range and weighted average used to develop significant unobservable inputs for Level 3 fair value measurements or the requirement to disclose the changes in unrealized gains and losses for recurring Level 3 fair value measurements. ASU 2018-13 requires that information is provided about the measurement uncertainty of Level 3 fair value measurements as of the reporting date. The guidance is effective for fiscal years beginning after December 15, 2019, and interim periods within those fiscal years. Management evaluated the impact of this change in guidance and, due to the permissibility of early adoption, modified the Fund’s fair value disclosures beginning with its fiscal year 2019. |
3). SECURITIES VALUATION
The Fund follows its valuation policies and procedures in determining its net asset value and, in preparing these financial statements, the fair value accounting standards that establish an authoritative definition of fair value and set out a hierarchy for measuring fair value. These standards require additional disclosures about the various inputs and valuation techniques used to develop the measurements of fair value and a discussion of changes in valuation techniques and related inputs during the period. These inputs are summarized in the three broad levels listed below:
| | Level 1 – | Unadjusted, quoted prices in active markets for identical instruments that the Fund has the ability to access at the date of measurement. |
| | | |
| | Level 2 – | Other significant observable inputs (including, but not limited to, quoted prices in active markets for similar instruments, quoted prices in markets that are not active for identical or similar instruments, and model-derived valuations in which all significant inputs and significant value drivers are observable in active markets, such as interest rates, prepayment speeds, credit risk curves, default rates, and similar data). |
| | | |
| | Level 3 – | Significant unobservable inputs (including the Fund’s own assumptions about what market participants would use to price the asset or liability based on the best available information) when observable inputs are unavailable. |
The following is a description of the valuation techniques applied to the Fund’s major categories of assets and liabilities on a recurring basis:
| | Equity Securities – Equity securities, including common stocks, preferred stocks, foreign-issued common stocks, exchange-traded funds, closed-end mutual funds, partnerships, rights, MLPs, and real estate investment trusts, that are traded on a securities exchange for which a last-quoted sales price is readily available generally are valued at the last sales price as reported by the primary exchange on which the securities are listed. Securities listed on The NASDAQ Stock Market (“NASDAQ”) generally are valued at the NASDAQ Official Closing Price, which may differ from the last sales price reported. Securities traded on a securities exchange for which a last-quoted sales price is not readily available generally are valued at the mean between the bid and ask prices. To the extent these securities are actively traded and valuation adjustments are not applied, they are classified in Level 1 of the fair value hierarchy. Securities traded on foreign exchanges generally are not valued at the same |
| NOTES TO THE FINANCIAL STATEMENTS |
| | time the Fund calculates its NAV because most foreign markets close well before such time. The earlier close of most foreign markets gives rise to the possibility that significant events, including broad market moves, may have occurred in the interim. In certain circumstances, it may be determined that a foreign security needs to be fair valued because it appears that the value of the security might have been materially affected by events occurring after the close of the market in which the security is principally traded, but before the time the Fund calculates its NAV, such as by a development that affects an entire market or region (e.g., a weather-related event) or a potentially global development (e.g., a terrorist attack that may be expected to have an effect on investor expectations worldwide). |
| | |
| | Registered Investment Companies – Investments in open-end registered investment companies, commonly referred to as mutual funds, generally are priced at the ending NAV provided by the applicable mutual fund’s service agent and are classified in Level 1 of the fair value hierarchy. |
| | |
| | Debt Securities – Debt securities, including corporate bonds, asset-backed securities, mortgage-backed securities, municipal bonds, U.S. Treasuries, and U.S. government agency issues, are generally valued at market on the basis of valuations furnished by an independent pricing service that utilizes both dealer-supplied valuations and formula-based techniques. The pricing service may consider recently executed transactions in securities of the issuer or comparable issuers, market price quotations (where observable), bond spreads, and fundamental data relating to the issuer. In addition, the model may incorporate observable market data, such as reported sales of similar securities, broker quotes, yields, bids, offers, and reference data. Certain securities are valued primarily using dealer quotations. These securities are generally classified in Level 2 of the fair value hierarchy. |
| | |
| | Short-Term Securities – Short-term equity investments, including money market funds, are valued in the manner specified above for equity securities. Short-term debt investments with an original term to maturity of 60 days or less are valued at amortized cost, which approximates fair market value. If the original term to maturity of a short-term debt investment exceeds 60 days, then the values as of the 61st day prior to maturity are amortized. Amortized cost is not used if its use would be inappropriate due to credit or other impairments of the issuer, in which case the security’s fair value would be determined as described below. Short-term securities are generally classified in Level 1 or Level 2 of the fair value hierarchy depending on the inputs used and market activity levels for specific securities. |
The Board of Trustees of the Fund (the “Board”) has adopted fair value pricing procedures that are followed when a price for a security is not readily available or if a significant event has occurred that indicates the closing price of a security no longer represents the true value of that security. Fair value pricing determinations are made in good faith in accordance with these procedures. There are numerous criteria considered in determining a fair value of a security, such as the trading volume of a security and markets, the values of other similar securities, and news events with direct bearing on a security or markets. Fair value pricing results in an estimated price for a security that reflects the amount the Fund might reasonably expect to receive in a current sale. Depending on the relative significance of the valuation inputs, these securities may be classified in either Level 2 or Level 3 of the fair value hierarchy.
The fair value of foreign securities may be determined with the assistance of a pricing service using correlations between the movement of prices of such securities and indices of domestic securities and other appropriate indicators, such as closing market prices of
| HENNESSY FUNDS | 1-800-966-4354 | |
relevant American Depositary Receipts or futures contracts. Using fair value pricing means that the Fund’s NAV reflects the affected portfolio securities’ values as determined by the Board or its designee, pursuant to the fair value pricing procedures adopted by the Board, instead of being determined by the market. Using a fair value pricing methodology to price a foreign security may result in a value that is different from such foreign security’s most recent closing price and from the value used by other investment companies to calculate their NAVs. Such securities are generally classified in Level 2 of the fair value hierarchy. Because the Fund may invest in foreign securities, the value of the Fund’s portfolio securities may change on days when a shareholder is unable to purchase or redeem Fund shares.
The Board has delegated day-to-day valuation matters to the Valuation and Liquidity Committee comprising representatives from Hennessy Advisors, Inc., the Fund’s investment advisor (the “Advisor”). The function of the Valuation and Liquidity Committee, among other things, is to value securities where current and reliable market quotations are not readily available. All actions taken by the Valuation and Liquidity Committee are reviewed by the Board.
The Fund has performed an analysis of all existing investments to determine the significance and character of all inputs to their fair value determinations. Various inputs are used to determine the value of the Fund’s investments. The inputs or methodology used for valuing securities are not necessarily an indication of the risk associated with investing in those securities. Details related to the fair value hierarchy of the Fund’s securities as of April 30, 2021, are included in the Schedule of Investments.
4). INVESTMENT TRANSACTIONS
Purchases and sales of investment securities (excluding government and short-term investments) for the Fund during the six months ended April 30, 2021, were $4,659,171 and $5,741,014, respectively.
There were no purchases or sales/maturities of long-term U.S. government securities for the Fund during the six months ended April 30, 2021.
5). INVESTMENT ADVISORY FEE AND OTHER TRANSACTIONS WITH AFFILIATES
The Advisor provides the Fund with investment advisory services under an Investment Advisory Agreement. The Advisor oversees the provision of investment advice and furnishes office space, facilities, and most of the personnel needed by the Fund. As compensation for its services, the Advisor is entitled to a monthly fee from the Fund. The fee is based on the average daily net assets of the Fund at an annual rate of 1.25 %. The net investment advisory fees expensed by the Fund during the six months ended April 30, 2021, are included in the Statement of Operations.
The Advisor has delegated the day-to-day management of the Fund to a sub-advisor, BP Capital Fund Advisors, LLC. The Advisor pays the sub-advisory fees from its own assets, and these fees are not an additional expense of the Fund. During the six months ended April 30, 2021, the Advisor (not the Fund) paid a sub-advisory fee at the rate of 0.40% of the daily net assets of the Fund.
From October 26, 2018, through October 25, 2020, the Advisor contractually agreed to limit total annual operating expenses to 2.00% of the Fund’s net assets for Investor Class shares and 1.75% of the Fund’s net assets for Institutional Class shares (in each case, excluding all federal, state, and local taxes, interest, brokerage commissions, dividend and interest expenses on short sales, extraordinary items, and acquired fund fees and expenses and other costs incurred in connection with the purchase and sale of securities).
| NOTES TO THE FINANCIAL STATEMENTS |
For three years following the date on which expenses were waived or incurred, the Advisor may recoup waived or reimbursed expenses from the Fund if total operating expenses, including such recoupment, does not exceed the expense limitation in effect (i) at the time the Advisor waived or reimbursed such expenses and (ii) at the time the Advisor recoups such expenses. As of April 30, 2021, expenses subject to potential recovery were $22,749 for Investor Class shares and $38,580 for Institutional Class shares, which expire in fiscal year 2023. The Advisor did not recoup expenses from the Fund during the six months ended April 30, 2021.
The Board has approved a Shareholder Servicing Agreement for Investor Class shares of the Fund, which compensates the Advisor for the non-investment advisory services it provides to the Fund. The Shareholder Servicing Agreement provides for a monthly fee paid to the Advisor at an annual rate of 0.10% of the average daily net assets of the Fund attributable to Investor Class shares. The shareholder service fees expensed by the Fund during the six months ended April 30, 2021, are included in the Statement of Operations.
The Fund has adopted a plan pursuant to Rule 12b-1 under the Investment Company Act of 1940, as amended, that authorizes payments in connection with the distribution of Fund shares at an annual rate of up to 0.25% of the Fund’s average daily net assets attributable to Investor Class shares. Even though the authorized rate is up to 0.25%, the Fund is currently only using up to 0.15% of its average daily net assets attributable to Investor Class shares for such purpose. Amounts paid under the plan may be spent on any activities or expenses primarily intended to result in the sale of shares, including, but not limited to, advertising, shareholder account servicing, printing and mailing of prospectuses to other than current shareholders, printing and mailing of sales literature, and compensation for sales and marketing activities or to financial institutions and others, such as dealers and distributors. The distribution fees expensed by the Fund during the six months ended April 30, 2021, are included in the Statement of Operations.
The Fund has entered into agreements with various brokers, dealers, and financial intermediaries in connection with the sale of Fund shares. The agreements provide for periodic payments of sub-transfer agent expenses by the Fund to the brokers, dealers, and financial intermediaries for providing certain shareholder maintenance services. These shareholder services include the pre-processing and quality control of new accounts, shareholder correspondence, answering customer inquiries regarding account status, and facilitating shareholder telephone transactions. The sub-transfer agent fees expensed by the Fund during the six months ended April 30, 2021, are included in the Statement of Operations.
U.S. Bancorp Fund Services, LLC, d/b/a U.S. Bank Global Fund Services (“Fund Services”) provides the Fund with administrative, accounting, and transfer agent services. As administrator, Fund Services is responsible for activities such as (i) preparing various federal and state regulatory filings, reports, and returns for the Fund, (ii) preparing reports and materials to be supplied to the Board, (iii) monitoring the activities of the Fund’s custodian, transfer agent, and accountants, and (iv) coordinating the preparation and payment of the Fund’s expenses and reviewing the Fund’s expense accruals. U.S. Bank N.A., an affiliate of Fund Services, serves as the Fund’s custodian. The servicing agreements between the Trust, Fund Services, and U.S. Bank N.A. contain a fee schedule that is inclusive of administrative, accounting, custody, and transfer agent fees. The administrative, accounting, custody, and transfer agent fees expensed by the Fund during the six months ended April 30, 2021, are included in the Statement of Operations. Fund Services has voluntarily waived all or a portion of its fees for the Fund. The fees voluntarily waived by Fund Services during the six months ended April 30, 2021, are included in the Statement of Operations.
| HENNESSY FUNDS | 1-800-966-4354 | |
Quasar Distributors, LLC (“Quasar”), a wholly owned broker-dealer subsidiary of Foreside Financial Group, LLC, acts as the Fund’s principal underwriter in a continuous public offering of Fund shares.
The officers of the Fund are affiliated with the Advisor. With the exception of the Chief Compliance Officer and the Senior Compliance Officer, such officers receive no compensation from the Fund for serving in their respective roles. The Fund, along with the other funds in the Hennessy Funds family (collectively, the “Hennessy Funds”), makes reimbursement payments on an equal basis to the Advisor for a portion of the salary and benefits associated with the office of the Chief Compliance Officer and for all of the salary and benefits associated with the office of the Senior Compliance Officer. The compliance fees expensed by the Fund during the six months ended April 30, 2021, are included in the Statement of Operations.
6). GUARANTEES AND INDEMNIFICATIONS
Under the Hennessy Funds’ organizational documents, their officers and trustees are indemnified by the Hennessy Funds against certain liabilities arising out of the performance of their duties to the Hennessy Funds. Additionally, in the normal course of business, the Hennessy Funds enter into contracts with service providers that contain general indemnification clauses. The Fund’s maximum exposure under these arrangements is unknown as this would involve future claims that may be made against the Fund that have not yet occurred. Currently, the Fund expects the risk of loss to be remote.
7). LINE OF CREDIT
The Fund has an uncommitted line of credit with the other Hennessy Funds in the amount of the lesser of (i) $100,000,000 or (ii) 33.33% of each Hennessy Fund’s net assets, or 30% for the Hennessy Gas Utility Fund and 10% for the Hennessy Balanced Fund. The line of credit is intended to provide any necessary short-term financing in connection with shareholder redemptions, subject to certain restrictions. The credit facility is with the Hennessy Funds’ custodian bank, U.S. Bank N.A. Borrowings under this arrangement bear interest at the bank’s prime rate and are secured by all of the Fund’s assets (as to its own borrowings only). During the six months ended April 30, 2021, the Fund had an outstanding average daily balance and a weighted average interest rate of $54,177 and 3.25%, respectively. The interest expensed by the Fund during the six months ended April 30, 2021, is included in the Statement of Operations. The maximum amount outstanding for the Fund during the period was $632,000. As of April 30, 2021, the Fund had a loan payable of $82,000.
8). FEDERAL TAX INFORMATION
As of October 31, 2020, the Fund’s most recent fiscal year end, the components of accumulated earnings (losses) for income tax purposes were as follows:
| | | Investments | |
| Cost of investments for tax purposes | | $ | 9,881,106 | |
| Gross tax unrealized appreciation | | $ | 668,142 | |
| Gross tax unrealized depreciation | | | (4,243,082 | ) |
| Net tax unrealized appreciation/(depreciation) | | $ | (3,574,940 | ) |
| Undistributed ordinary income | | $ | — | |
| Undistributed long-term capital gains | | | — | |
| Total distributable earnings | | $ | — | |
| Other accumulated gain/(loss) | | $ | (41,158,527 | ) |
| Total accumulated gain/(loss) | | $ | (44,733,467 | ) |
| NOTES TO THE FINANCIAL STATEMENTS |
The difference between book-basis unrealized appreciation/depreciation and tax-basis unrealized appreciation/depreciation (as shown above) is attributable primarily to wash sales and partnership adjustments.
As of October 31, 2020, the Fund had $21,071,206 in unlimited long-term and $19,658,006 in unlimited short-term capital loss carryforwards.
Capital losses sustained in or after fiscal year 2012 can be carried forward indefinitely, but any such loss retains the character of the original loss and must be utilized prior to any loss incurred before fiscal year 2012. As a result of this ordering rule, capital loss carryforwards incurred prior to fiscal year 2012 may be more likely to expire unused. Capital losses sustained prior to fiscal year 2012 can be carried forward for eight years and can be carried forward as short-term capital losses regardless of the character of the original loss.
As of October 31, 2020, the Fund deferred, on a tax basis, a late-year ordinary loss of $429,315. Late-year ordinary losses are net ordinary losses incurred after December 31, 2019, but within the taxable year, that are deemed to arise on the first day of the Fund’s next taxable year.
During fiscal year 2021 (year to date) and fiscal year 2020, the tax character of distributions paid by the Fund was as follows:
| | | Six Months Ended | | | Year Ended | |
| | | April 30, 2021 | | | October 31, 2020 | |
Ordinary income(1) | | $ | — | | | $ | 79,003 | |
| Long-term capital gains | | | — | | | | — | |
| Total distributions | | $ | — | | | $ | 79,003 | |
(1) Ordinary income includes short-term capital gains.
9). EVENTS SUBSEQUENT TO PERIOD END
Management has evaluated the Fund’s related events and transactions that occurred subsequent to April 30, 2021, through the date of issuance of the Fund’s financial statements. Management has determined that there were no subsequent events requiring recognition or disclosure in the financial statements.
| HENNESSY FUNDS | 1-800-966-4354 | |
Expense Example (Unaudited)
April 30, 2021
As a shareholder of the Fund, you incur ongoing costs, including management fees, service fees, and other Fund expenses. This Example is intended to help you understand your ongoing costs (in dollars) of investing in the Fund and to compare these costs with the ongoing costs of investing in other mutual funds. The Example is based on an investment of $1,000 invested at the beginning of the period and held for the entire period from November 1, 2020, through April 30, 2021.
Actual Expenses
In the table below, the first line under each of the “Investor Class” and “Institutional Class” headings provides information about actual account values and actual expenses for each share class. You may use this information, together with the amount you invested, to estimate the expenses that you paid over the period. Simply divide your account value by $1,000 (for example, an $8,600 account value divided by $1,000 = 8.6), then multiply the result by the number in the first line under the heading entitled “Expenses Paid During Period” to estimate the expenses you paid on your account during this period. Although the Fund charges no sales loads or transaction fees, you will be assessed fees for outgoing wire transfers, returned checks, and stop payment orders at prevailing rates charged by U.S. Bank Global Fund Services, the Fund’s transfer agent. If you request that a redemption be made by wire transfer, the Fund’s transfer agent charges a $15 fee. IRAs are charged a $15 annual maintenance fee (up to $30 maximum per shareholder for shareholders with multiple IRAs). The examples below include, but are not limited to, management, shareholder servicing, accounting, custody, and transfer agent fees. However, the examples below do not include portfolio trading commissions and related expenses.
Hypothetical Example for Comparison Purposes
In the table below, the second line under each of the “Investor Class” and “Institutional Class” headings provides information about hypothetical account values and hypothetical expenses based on the Fund’s actual expense ratio for each share class and an assumed rate of return of 5% per year before expenses, which is not the Fund’s actual return for such share class. The hypothetical account values and expenses may not be used to estimate the actual ending account balance or expenses you paid for the period. You may use this information to compare the ongoing costs of investing in the Fund and other funds. To do so, compare these 5% hypothetical examples with the 5% hypothetical examples that appear in the shareholder reports of the other funds. Please note that the expenses shown in the table are meant to highlight your ongoing costs only. Therefore, the second lines under “Investor Class” and “Institutional Class” headings are useful in comparing ongoing costs only and will not help you determine the relative total costs of owning different funds.
| | Beginning | Ending | |
| | Account Value | Account Value | Expenses Paid |
| | November 1, 2020 | April 30, 2021
| During Period(1) |
| Investor Class | | | |
| Actual | $1,000.00 | $1,704.80 | $19.78 |
| Hypothetical (5% return before expenses) | $1,000.00 | $1,010.17 | $14.70 |
| | | | |
| Institutional Class | | | |
| Actual | $1,000.00 | $1,706.20 | $17.38 |
| Hypothetical (5% return before expenses) | $1,000.00 | $1,011.95 | $12.92 |
(1) | Expenses are equal to the Fund’s annualized expense ratio of 2.95% for Investor Class shares or 2.59% for Institutional Class shares, as applicable, multiplied by the average account value over the period, multiplied by 181/365 days (to reflect the half-year period). |
| HENNESSY FUNDS | 1-800-966-4354 | |
How to Obtain a Copy of the Fund’s Proxy
Voting Policy and Proxy Voting Records
A description of the policies and procedures the Fund uses to determine how to vote proxies relating to portfolio securities is available without charge (1) by calling 1-800-966-4354, (2) on the Hennessy Funds’ website at www.hennessyfunds.com/proxy-voting/voting-policy, or (3) on the U.S. Securities and Exchange Commission’s (the “SEC”) website at www.sec.gov. The Fund’s proxy voting record is available without charge on both the Hennessy Funds’ website at www.hennessyfunds.com/proxy-voting/voting-record and the SEC’s website at www.sec.gov no later than August 31 for the prior 12 months ending June 30.
Availability of Quarterly Portfolio Schedule
The Fund files a complete schedule of portfolio holdings with the SEC for the first and third quarters of each fiscal year as an exhibit to its reports on Form N-PORT. The Fund’s Form N-PORT reports are available on the SEC’s website at www.sec.gov or on request by calling 1-800-966-4354.
Federal Tax Distribution Information (Unaudited)
For fiscal year 2020, certain dividends paid by the Fund may be subject to a maximum tax rate of 23.8%, as provided for by the Jobs and Growth Tax Relief Reconciliation Act of 2003. The percentage of dividends declared from ordinary income designated as qualified dividend income was 0.00%.
For corporate shareholders, the percent of ordinary income distributions that qualified for the corporate dividends received deduction for fiscal year 2020 was 0.00%.
The percentage of taxable ordinary income distributions that were designated as short-term capital gain distributions under Section 871(k)(2)(C) of the Internal Revenue Code of 1986, as amended, for the Fund was 0.00%.
Important Notice Regarding Delivery
of Shareholder Documents
To help keep the Fund’s costs as low as possible, we generally deliver a single copy of notices, shareholder reports, proxy statements, and prospectuses to shareholders who share an address and have the same last name. This process does not apply to account statements. You may request an individual copy of a shareholder document at any time. If you would like to receive separate mailings of shareholder documents, please call U.S. Bank Global Fund Services at 1-800-261-6950 or 1-414-765-4124, and individual delivery will begin within 30 days of your request. If your account is held through a financial institution or other intermediary, please contact such intermediary directly to request individual delivery.
Electronic Delivery
As permitted by SEC regulations, the Fund’s shareholder reports are made available on a website, and unless you sign up for eDelivery or elect to receive paper copies as detailed below, you will be notified by mail each time a report is posted and provided with a website link to access the report.
The Fund also offers shareholders the option to receive all notices, account statements, prospectuses, tax forms, and shareholder reports online. To sign up for eDelivery or change your delivery preference, please visit www.hennessyfunds.com/account.
To elect to receive paper copies of all future reports free of charge, please call U.S. Bank Global Fund Services at 1-800-261-6950 or 1-414-765-4124.
Subscribe to receive our team’s unique market and sector insights delivered to your inbox
www.hennessyfunds.com/subscribe
Follow us on social media
| PROXY VOTING — BOARD APPROVAL OF INVESTMENT ADVISORY AGREEMENTS |
Board Approval of Investment Advisory
Agreements
At its meeting on March 10, 2021, the Board of Trustees of the Fund (the “Board,” and the members thereof, the “Trustees”) unanimously approved the continuation of the investment advisory agreement of the Fund with Hennessy Advisors, Inc. (the “Advisor”) and the sub-advisory agreement for the Fund between the Advisor and BP Capital Fund Advisors, LLC (the “Sub-Advisor”). As part of the process, the Trustees reviewed their fiduciary duties and the relevant factors for them to consider with respect to approving the advisory and sub-advisory agreements. In addition, the Trustees who are not deemed “interested persons” (as defined by the Investment Company Act of 1940, as amended) of the Fund (the “Independent Trustees”) met in executive session to discuss the approval of the advisory and sub-advisory agreements.
In advance of the meeting, the Advisor sent detailed information to the Trustees to assist them in their evaluation of the advisory and sub-advisory agreements. This information included, but was not limited to, the following:
| | (1) | A memorandum from outside legal counsel that described the fiduciary duties of the Board with respect to approving the continuation of the advisory and sub-advisory agreements and the relevant factors for consideration; |
| | | |
| | (2) | A memorandum from the Advisor that listed the factors relevant to the Board’s approval of the continuation of the advisory and sub-advisory agreements and also referenced the documents that had been provided to help the Board assess each such factor; |
| | | |
| | (3) | The Advisor’s financial statements from its most recent Form 10-K and Form 10-Q; |
| | | |
| | (4) | Summaries of the advisory and sub-advisory agreements; |
| | | |
| | (5) | A recent Fund fact sheet, which included performance information over various periods; |
| | | |
| | (6) | An description of the range of services provided by the Advisor and the Sub-Advisor and the distinction between the Advisor-provided services and the Sub-Advisor-provided services; |
| | | |
| | (7) | A peer expense comparison of the net expense ratio and investment advisory fee of the Fund; |
| | | |
| | (8) | A memorandum from the Adviser regarding economies of scale; |
| | | |
| | (9) | A completed questionnaire from the Sub-Advisor; |
| | | |
| | (10) | A summary of the Sub-Advisor’s responses to the questionnaire, as well as relevant information from the Sub-Advisor’s Form ADVs Parts 1 and 2 and the certifications submitted the Sub-Advisor each quarter; |
| | | |
| | (11) | Financial information of the Sub-Advisor; and |
| | | |
| | (12) | The Sub-Advisor’s Code of Ethics. |
All of the factors discussed were considered as a whole by the Trustees and by the Independent Trustees meeting in executive session. The factors were viewed in their totality by the Trustees, with no single factor being the principal or determinative factor in the Trustees’ determination of whether to approve the continuation of the advisory and sub-advisory agreements. The Trustees recognized that the management and fee arrangements for the Fund are the result of years of review and discussion between the Independent Trustees and the Advisor, that certain aspects of such arrangements may
| HENNESSY FUNDS | 1-800-966-4354 | |
receive greater scrutiny in some years than in others, and that the Trustees’ conclusions may be based, in part, on their consideration of these same arrangements and information received during the course of the year and in prior years.
Prior to approving the continuation of the advisory and sub-advisory agreements, the Trustees, including the Independent Trustees in executive session, considered, among other items:
| | (1) | The nature and quality of the advisory services provided by the Advisor and the Sub-Advisor; |
| | | |
| | (2) | A comparison of the fees and expenses of the Fund to other similar funds; |
| | | |
| | (3) | Whether economies of scale are recognized by the Fund; |
| | | |
| | (4) | The costs and profitability of the Fund to the Advisor and the Sub-Advisor; |
| | | |
| | (5) | The performance of the Fund; and |
| | | |
| | (6) | Any benefits to the Advisor and the Sub-Advisor from serving as an investment advisor to the Fund (other than the advisory and sub-advisory fees). |
The material considerations and determinations of the Trustees, including the Independent Trustees, were as follows:
| | (1) | The Trustees considered the services identified below that are provided by the Advisor. Based on this review, the Trustees concluded that the Advisor provides high-quality services to the Fund and noted that their overall confidence in the Advisor was high. The Trustees also concluded that they were satisfied with the nature, extent, and quality of the advisory services provided to the Fund by the Advisor and that the nature and extent of the services provided by the Advisor were appropriate to assure that the Fund’s operations are conducted in compliance with applicable laws, rules, and regulations. |
| | | (a) | The Advisor oversees the Sub-Advisor for the Fund, and the Sub-Advisor acts as the portfolio manager for the Fund by providing portfolio management services. |
| | | | |
| | | (b) | The Advisor performs a daily reconciliation of portfolio positions and cash for the Fund. |
| | | | |
| | | (c) | The Advisor monitors the liquidity of each Fund. |
| | | | |
| | | (d) | The Advisor monitors the Fund’s compliance with its investment objectives and restrictions and federal securities laws. |
| | | | |
| | | (e) | The Advisor maintains a compliance program (including a code of ethics), conducts ongoing reviews of the compliance programs of the Sub-Advisor and the Fund’s other service providers (including their codes of ethics, as appropriate), conducts on-site visits to the Sub-Advisor and the Fund’s other service providers as feasible, monitors incidents of abusive trading practices, reviews Fund expense accruals, payments, and fixed expense ratios, evaluates insurance providers for fidelity bond, D&O/E&O insurance, and cybersecurity insurance coverage, manages regulatory examination compliance and responses, conducts employee compliance training, reviews reports provided by service providers, and maintains books and records. |
| | | | |
| | | (f) | The Advisor oversees the selection and continued employment of the Sub-Advisor, reviews the Fund’s investment performance, and monitors the Sub-Advisor’s adherence to the Fund’s investment objectives, policies, and restrictions. |
| BOARD APPROVAL OF INVESTMENT ADVISORY AGREEMENTS |
| | | (g) | The Advisor oversees service providers that provide accounting, administration, distribution, transfer agency, custodial, sales, marketing, public relations, audit, information technology, and legal services to the Fund. |
| | | | |
| | | (h) | The Advisor maintains in-house marketing and distribution departments on behalf of the Fund. |
| | | | |
| | | (i) | The Advisor prepares or directs the preparation of all regulatory filings for the Fund, including writing and annually updating the Fund’s prospectus and related documents. |
| | | | |
| | | (j) | For each annual report of the Fund, the Advisor reviews the written summary prepared by the Sub-Advisor of the Fund’s performance during the most recent 12-month period. |
| | | | |
| | | (k) | The Advisor oversees distribution of the Fund through third-party broker/dealers and independent financial institutions such as Charles Schwab, Inc., Fidelity, TD Ameritrade, and Pershing. The Advisor compensates, in part, a number of these third-party providers out of its own revenues. |
| | | | |
| | | (l) | The Advisor pays the incentive compensation of the Fund’s compliance officers and employs other staff, such as legal, marketing, national accounts, distribution, sales, administrative, and trading oversight personnel, as well as management executives. |
| | | | |
| | | (m) | The Advisor provides a quarterly compliance certification to the Board. |
| | | | |
| | | (n) | The Advisor prepares or reviews all Board materials, frequently presents to the Board and leads Board discussions, prepares or reviews all meeting minutes, and arranges for Board training and education. |
| | (2) | The Trustees considered the services identified below that are provided by the Sub-Advisor. Based on this review and an assessment of the Sub-Advisor’s performance, the Trustees concluded that the Sub-Advisor provides high-quality services to the Fund. The Trustees also concluded that they were satisfied with the nature, extent, and quality of the advisory services provided to the Fund by the Sub-Advisor and that the nature and extent of the services provided by the Sub-Advisor were appropriate to assure that the Fund’s portfolio aligns properly with its investment objective and principal investment strategies. |
| | | (a) | The Sub-Advisor acts as the portfolio manager for the Fund. In this capacity, the Sub-Advisor does the following: |
| | | | (i) | manages the composition of the Fund’s portfolio, including the purchase, retention, and disposition of portfolio securities in accordance with the Fund’s investment objectives, policies, and restrictions; |
| | | | | |
| | | | (ii) | seeks best execution for the Fund’s portfolio; |
| | | | | |
| | | | (iii) | manages the use of soft dollars for the Fund; and |
| | | | | |
| | | | (iv) | manages proxy voting for the Fund. |
| | | (b) | The Sub-Advisor ensures that its compliance program includes policies and procedures relevant to the Fund and the Sub-Advisor’s duties as a portfolio manager to the Fund. |
| | | | |
| | | (c) | For each annual report of the Fund, the Sub-Advisor prepares a written summary of the Fund’s performance during the most recent 12-month period. |
| HENNESSY FUNDS | 1-800-966-4354 | |
| | | (d) | The Sub-Advisor provides a quarterly compliance certification to the Board regarding trading and allocation practices, supervisory matters, the Sub-Advisor’s compliance program (including its code of ethics), compliance with the Fund’s policies, and general firm updates. |
| | (3) | The Trustees considered the distinction between the services performed by the Advisor and the Sub-Advisor. The Trustees noted that the management of the Fund, including the oversight of the Sub-Advisor, involves more comprehensive and substantive duties than the duties of the Sub-Advisor. Specifically, the Trustees considered the lists of services identified above and concluded that the services performed by the Advisor for the Fund require a higher level of service and oversight than the services performed by the Sub-Advisor. Based on this determination, the Trustees concluded that the differential in advisory fees between the Advisor and the Sub-Advisor is reasonable. |
| | | |
| | (4) | The Trustees compared the performance of the Fund to benchmark indices over various periods and also noted that the Trustees review and discuss reports comparing the investment performance of the Fund to various indices at each quarterly Board meeting. Based on such information, the Trustees determined that the Advisor and the Sub-Advisor manage the Fund in a manner materially consistent with its stated investment objective and style. The Trustees concluded that the performance of the Fund over various periods warranted continuation of the advisory and sub-advisory agreements. |
| | | |
| | (5) | The Trustees reviewed the advisory fees and overall expense ratios of the Fund compared to other funds similar in asset size and investment objective to the Fund using data from Morningstar. As part of the discussion with management, the Trustees ensured that they understood and were comfortable with the criteria used to determine the mutual funds included in the Morningstar categories for purposes of the materials considered at the meeting. The Trustees determined that the advisory fee and overall expense ratio of the Fund falls within the range of the advisory fees and overall expense ratios of other comparable funds and concluded that they are reasonable and warranted continuation of the advisory and sub-advisory agreements. |
| | | |
| | (6) | The Trustees also considered whether the Advisor was realizing economies of scale that it should share with the Fund’s shareholders. The Trustees noted that many of the expenses incurred to manage the Fund are asset-based fees, so the Advisor would not realize material economies of scale relating to those expenses as the assets of the Fund increase. For example, third-party platform fees and sub-advisory fees increase as the Fund’s assets grow. The Trustees also considered the Advisor’s significant marketing efforts to promote the Funds and the Advisor’s agreement to waive fees or lower its management fees in certain circumstances. |
| | | |
| | (7) | The Trustees considered the profitability of the Advisor and the Sub-Advisor, including the impact of mutual fund platform fees on the Advisor’s profitability, and also considered the resources and revenues that the Advisor has put into managing and distributing the Fund. The Trustees then concluded that the profits of the Advisor and the Sub-Advisor are reasonable and not excessive when compared to profitability guidelines set forth in relevant court cases. |
| | | |
| | (8) | The Trustees considered the high level of professionalism and knowledge of the Advisor’s employees, along with a very low level of turnover, and concluded that this was beneficial to the Fund and its shareholders. |
| BOARD APPROVAL OF INVESTMENT ADVISORY AGREEMENTS |
| | (9) | The Trustees considered any benefits to the Advisor and the Sub-Advisor from serving as an advisor to the Fund (other than the advisory and sub-advisory fees). The Trustees noted that the Advisor and the Sub-Advisor may derive ancillary benefits from, by way of example, their association with the Fund in the form of proprietary and third-party research products and services received from broker-dealers that execute portfolio trades for the Fund. The Trustees determined that any such products and services have been used for legitimate purposes relating to the Fund by providing assistance in the investment decision-making process. The Trustees concluded that any additional benefits realized by the Advisor and the Sub-Advisor from their relationship with the Fund were reasonable, which was based on, among other things, the Trustees’ findings that (i) the research, analytical, statistical, and other information and services provided by brokers are merely supplemental to the Advisor’s and the Sub-Advisor’s own efforts in the performance of their duties under the advisory and sub-advisory agreements and (ii) although the Sub-Advisor could derive benefits from the conversion of Fund shareholders into separate account clients, the Fund also could benefit from potential institutional shareholders who might choose to invest in the Fund. |
After reviewing the materials and information provided at the meeting, as well as other information regularly provided at the Board’s quarterly meetings throughout the year regarding the quality of services provided by the Advisor and the Sub-Advisor, the performance of the Fund, expense information, brokerage commissions information, the adequacy and efficacy of the Advisor’s and the Sub-Advisor’s written policies and procedures, other regulatory compliance issues, trading information and related matters, and other factors that the Trustees deemed relevant, the Trustees, including the Independent Trustees, approved the continuation of the advisory and sub-advisory agreements.
| HENNESSY FUNDS | 1-800-966-4354 | |
(This Page Intentionally Left Blank.)
For information, questions, or assistance, please call
The Hennessy Funds
1-800-966-4354 or 1-415-899-1555
INVESTMENT ADVISOR
Hennessy Advisors, Inc.
7250 Redwood Boulevard, Suite 200
Novato, California 94945
ADMINISTRATOR,
TRANSFER AGENT,
DIVIDEND PAYING AGENT, &
SHAREHOLDER SERVICING AGENT
U.S. Bancorp Fund Services, LLC
d/b/a U.S. Bank Global Fund Services
P.O. Box 701
Milwaukee, Wisconsin 53201-0701
CUSTODIAN
U.S. Bank N.A.
Custody Operations
1555 North River Center Drive, Suite 302
Milwaukee, Wisconsin 53212
TRUSTEES
Neil J. Hennessy
Robert T. Doyle
J. Dennis DeSousa
Gerald P. Richardson
COUNSEL
Foley & Lardner LLP
777 East Wisconsin Avenue
Milwaukee, Wisconsin 53202-5306
INDEPENDENT REGISTERED
PUBLIC ACCOUNTING FIRM
Tait, Weller & Baker LLP
Two Liberty Place
50 South 16th Street, Suite 2900
Philadelphia, Pennsylvania 19102-2529
DISTRIBUTOR
Quasar Distributors, LLC
111 East Kilbourn Avenue, Suite 2200
Milwaukee, Wisconsin 53202
www.hennessyfunds.com | 1-800-966-4354
This report has been prepared for shareholders and may be distributed to
others only if preceded or accompanied by a current prospectus.
SEMI-ANNUAL REPORT
APRIL 30, 2021
HENNESSY BP MIDSTREAM FUND
Investor Class HMSFX
Institutional Class HMSIX
www.hennessyfunds.com | 1-800-966-4354
(This Page Intentionally Left Blank.)
Contents
| Letter to Shareholders | 2 |
| Performance Overview | 4 |
| Financial Statements | |
| Schedule of Investments | 5 |
| Statement of Assets and Liabilities | 8 |
| Statement of Operations | 9 |
| Statements of Changes in Net Assets | 11 |
| Financial Highlights | 12 |
| Notes to the Financial Statements | 16 |
| Expense Example | 26 |
| Proxy Voting Policy and Proxy Voting Records | 28 |
| Availability of Quarterly Portfolio Schedule | 28 |
| Federal Tax Distribution Information | 28 |
| Important Notice Regarding Delivery of Shareholder Documents | 28 |
| Electronic Delivery | 28 |
| Board Approval of Investment Advisory Agreements | 29 |
| HENNESSY FUNDS | 1-800-966-4354 | |
May 2021
Dear Hennessy Funds Shareholder:
I can hardly believe that we have been navigating through one of the worst pandemics in modern history for more than a year. From the start, our thoughts have been with those affected by COVID-19 and with our frontline healthcare and essential workers. We are encouraged by the rapid rollout of vaccines and the continued reopening of the economy, and we hope this signals a turning point.
This is the first time in over 20 years in this business that I have witnessed volatility as extreme as the volatility that has rocked the financial markets and the economy over the past year. Both the pace of change and the magnitude of change have been staggering. As I reflect on this, I am reminded of a scientific concept called “punctuated equilibrium.” Biologist Stephen Jay Gould revolutionized evolutionary thinking with this theory, which challenged the prevailing belief that biological change happens slowly, consistently, and methodically over time. His theory instead proposed that change happens abruptly and dramatically and that new species pop up and others vanish rapidly, sometimes caused by catastrophic events. In between these explosive periods are much longer intervals of relative stability.
The dramatic market downdraft brought on by the pandemic, followed by the equally dramatic recovery, have been jarring. We witnessed an explosion of IPOs, a plethora of bankruptcies, and a dramatic change in market leadership. Yet unlike in the biological world, we are able to respond to stock market crises and try to dampen their negative impact. There have been numerous and unprecedented fiscal and monetary responses from the Federal Reserve and the U.S. government, and in many ways these measures may have spurred the economic recovery.
For the first six months of our fiscal year through April 30, 2021, the market appeared to be on a relentless march higher, with the S&P 500® Index rising 28.85% on a total return basis, setting new all-time highs 35 times in 124 trading days and closing at its then-highest level ever on April 29, 2021. We saw a dramatic shift back toward value investing, and many of the sectors and individual stocks that had underperformed for most of last year soared. Value outperformed growth, small-caps beat mid-caps, and mid-caps beat large-caps. The Energy and Financials sectors skyrocketed, as evidenced by the S&P 500® Energy Index’s total return of 75.94% and the Russell 1000® Index Financials’ total return of 52.00% during the six-month period. As we begin to move beyond the chaos caused by the pandemic, solid market fundamentals are reappearing, which we believe underscores the health and strength of our economy.
We are pleased with the performance of our mutual funds during the first half of our fiscal year. On an absolute basis, each of our 16 Funds achieved positive performance, and 11 of our 16 funds outperformed their primary benchmark. Ten of our 11 domestic equity-only Funds outperformed the S&P 500® Index, and three of our sector Funds posted total returns of over 50%, due primarily to their focus on the Energy and Financials sectors. We believe this was a favorable period for both our style of high-conviction investing as well as the areas and sectors of the market in which our Funds focus. While performance may wax and wane over a complete market cycle, we remain committed to managing our portfolios for long-term performance, ever mindful of downside risk.
Circling back to Gould’s theory of punctuated equilibrium, we are left with the question, “Where do we go from here?” Are we entering a more stable period in the economy and the market, similar to the periods of relative stasis in the geological record? We are optimistic that this may in fact be the case and that the markets will return to a less volatile part of the cycle. But, with history as our guide, we know that even the greatest bull markets have experienced corrections along the way. While certain individual stock or sector valuations might look stretched, we believe the market as a whole has more room to run. Strong GDP growth and increasing earnings expectations for this year, a potentially lower-for-longer interest rate environment, accommodative fiscal and monetary policies, a healthy and robust financial system, low unemployment and solid wage growth, and a measured reopening of certain parts of the economy all support the market moving higher from here.
We remain committed to our shareholders as we thoughtfully navigate these unprecedented times. We know that you have a multitude of investment options to choose from, and we are grateful for the trust you put in us and your continued interest and investment in our family of Funds. Should you have any questions or would like to speak with us, please don’t hesitate to call us directly at (800) 966-4354.
Best regards,
| |
| |
| |
| |
|
| Ryan C. Kelley |
| Chief Investment Officer |
Past performance does not guarantee future results. To obtain current standardized performance for the Hennessy Funds, visit https://www.hennessyfunds.com/funds/price-performance.
Mutual fund investing involves risk. Principal loss is possible.
Opinions expressed are those of Ryan C. Kelley and are subject to change, are not guaranteed, and should not be considered investment advice.
The S&P 500® Index is a capitalization-weighted index that is designed to represent the broad domestic economy through changes in aggregate market value of 500 stocks across all major industries. The S&P 500® Energy Index comprises those companies included in the S&P 500® Index that are classified in the Energy sector. The Russell 1000® Index Financials is a subset of the Russell 1000® Index that measures the performance of securities classified in the Financials sector of the large-capitalization U.S. equity market. The indices are used herein for comparative purposes in accordance with SEC regulations. One cannot invest directly in an index. All returns are shown on a total return basis.
| HENNESSY FUNDS | 1-800-966-4354 | |
Performance Overview (Unaudited)
AVERAGE ANNUAL TOTAL RETURN FOR PERIODS ENDED APRIL 30, 2021
| | Six | One | Five | Since Inception |
| | Months(1) | Year
| Years
| (12/31/13)
|
| Hennessy BP Midstream Fund – | | | | |
| Investor Class (HMSFX) | 55.20% | 31.82% | -3.52% | -4.75% |
| Hennessy BP Midstream Fund – | | | | |
| Institutional Class (HMSIX) | 55.17% | 32.06% | -3.29% | -4.52% |
Alerian US Midstream Energy Index(2) | 60.96% | 49.77% | 2.71% | -1.29% |
S&P 500® Index | 28.85% | 45.98% | 17.42% | 14.03% |
| Expense ratios: | Gross 2.12%, Net 1.78%(3) (Investor Class); |
| | Gross 1.79%, Net 1.53%(3) (Institutional Class) |
(1) | Periods of less than one year are not annualized. |
(2) | The Fund’s primary index has changed from the Alerian MLP Index to the Alerian US Midstream Energy Index, which better reflects the underlying holdings of the Fund. Each such index comprises energy infrastructure companies that earn a majority of their cash flows from midstream activities involving energy commodities. The Alerian US Midstream Energy Index includes a broad range of types of energy companies, and the Alerian MLP Index focuses solely on master limited partnerships. The average annual total returns of the Alerian MLP Index for the six months, one-year, five-year, and since inception periods ended April 30, 2021, were 65.81%, 45.47%, -2.00%, and -5.14%, respectively. |
(3) | The Fund’s investment advisor has contractually agreed to limit expenses until February 28, 2022. |
_______________
Performance data quoted represents past performance; past performance does not guarantee future results. The investment return and principal value of an investment will fluctuate so that an investor’s shares, when redeemed, may be worth more or less than their original cost. The performance table does not reflect the deduction of taxes that a shareholder would pay on Fund distributions or the redemption of Fund shares. Current performance of the Fund may be lower or higher than the performance quoted. Performance data current to the most recent month end may be obtained by visiting www.hennessyfunds.com. Performance for periods including or prior to October 26, 2018, is that of the BP Capital TwinLine MLP Fund.
The Alerian US Midstream Energy Index and the Alerian MLP Index each comprise companies that earn a majority of their cash flows from midstream activities involving energy commodities. The S&P 500® Index is a capitalization-weighted index that is designed to represent the broad domestic economy through changes in the aggregate market value of 500 stocks across all major industries. One cannot invest directly in an index. These indices are used herein for comparative purposes in accordance with Securities and Exchange Commission regulations.
Standard & Poor’s Financial Services is the source and owner of the S&P® and S&P 500® trademarks.
The Alerian US Midstream Energy Index and the Alerian MLP Index are servicemarks of GKD Index Partners, LLC d/b/a Alerian (“Alerian”), and their use is granted under a license from Alerian. Alerian makes no express or implied warranties, representations, or promises regarding the originality, merchantability, suitability, or fitness for a particular purpose or use with respect to the Alerian indices. No party may rely on, and Alerian does not accept any liability for any errors, omissions, interruptions, or defects in, the Alerian indices or underlying data. In no event shall Alerian have any liability for any direct, indirect, special, incidental, punitive, consequential, or other damages (including lost profits), even if notified of the possibility of such damages.
The expense ratios presented are from the most recent prospectus. The expense ratios for the current reporting period are available in the Financial Highlights section of this report.
| PERFORMANCE OVERVIEW/SCHEDULE OF INVESTMENTS |
Financial Statements
Schedule of Investments as of April 30, 2021 (Unaudited) |
HENNESSY BP MIDSTREAM FUND
(% of Total Assets)
| TOP TEN HOLDINGS (EXCLUDING MONEY MARKET FUNDS) | % TOTAL ASSETS |
| MPLX LP | 12.00% |
| Enterprise Products Partners LP | 11.66% |
| Energy Transfer LP | 11.38% |
| The Williams Companies, Inc. | 9.12% |
| Targa Resources Corp. | 7.54% |
| Plains All American Pipeline LP | 6.75% |
| ONEOK, Inc. | 6.55% |
| Kinder Morgan, Inc. | 6.25% |
| Magellan Midstream Partners LP | 6.11% |
| Western Midstream Partners LP | 4.91% |
Note: The Fund concentrates its investments in the Energy industry. For presentation purposes, the Fund uses custom categories.
| HENNESSY FUNDS | 1-800-966-4354 | |
| COMMON STOCKS – 38.84% | | Number | | | | | | % of | |
| | | of Shares | | | Value | | | Net Assets | |
| Crude Oil & Refined Products – 3.97% | | | | | | | | | |
| Enbridge, Inc. (a) | | | 34,500 | | | $ | 1,330,665 | | | | 3.97 | % |
| | | | | | | | | | | | | |
| Gathering & Processing – 9.42% | | | | | | | | | | | | |
| Antero Midstream Corp. | | | 72,000 | | | | 622,080 | | | | 1.86 | % |
| Targa Resources Corp. | | | 73,000 | | | | 2,532,370 | | | | 7.56 | % |
| | | | | | | | 3,154,450 | | | | 9.42 | % |
| | | | | | | | | | | | | |
| Natural Gas/NGL Transportation – 25.45% | | | | | | | | | | | | |
| Equitrans Midstream Corp. | | | 70,800 | | | | 577,728 | | | | 1.72 | % |
| Kinder Morgan, Inc. | | | 123,090 | | | | 2,098,684 | | | | 6.26 | % |
| ONEOK, Inc. | | | 42,026 | | | | 2,199,641 | | | | 6.57 | % |
| TC Energy Corp. (a) | | | 11,942 | | | | 590,771 | | | | 1.76 | % |
| The Williams Companies, Inc. | | | 125,652 | | | | 3,060,883 | | | | 9.14 | % |
| | | | | | | | 8,527,707 | | | | 25.45 | % |
| | | | | | | | | | | | | |
| Total Common Stocks | | | | | | | | | | | | |
| (Cost $9,343,031) | | | | | | | 13,012,822 | | | | 38.84 | % |
| | | | | | | | | | | | | |
| PARTNERSHIPS & TRUSTS – 59.18% | | | | | | | | | | | | |
| | | | | | | | | | | | | |
| Crude Oil & Refined Products – 27.22% | | | | | | | | | | | | |
| Holly Energy Partners LP | | | 37,700 | | | | 771,719 | | | | 2.31 | % |
| Magellan Midstream Partners LP | | | 43,900 | | | | 2,053,203 | | | | 6.13 | % |
| MPLX LP | | | 149,249 | | | | 4,028,230 | | | | 12.02 | % |
| Plains All American Pipeline LP | | | 249,526 | | | | 2,265,696 | | | | 6.76 | % |
| | | | | | | | 9,118,848 | | | | 27.22 | % |
| | | | | | | | | | | | | |
| Gathering & Processing – 4.92% | | | | | | | | | | | | |
| Western Midstream Partners LP | | | 84,000 | | | | 1,649,760 | | | | 4.92 | % |
| | | | | | | | | | | | | |
| Natural Gas/NGL Transportation – 27.04% | | | | | | | | | | | | |
| DCP Midstream LP | | | 59,000 | | | | 1,327,500 | | | | 3.96 | % |
| Energy Transfer LP | | | 443,700 | | | | 3,820,257 | | | | 11.40 | % |
| Enterprise Products Partners LP | | | 170,100 | | | | 3,914,001 | | | | 11.68 | % |
| | | | | | | | 9,061,758 | | | | 27.04 | % |
| | | | | | | | | | | | | |
| Total Partnerships & Trusts | | | | | | | | | | | | |
| (Cost $16,631,538) | | | | | | | 19,830,366 | | | | 59.18 | % |
The accompanying notes are an integral part of these financial statements.
| SHORT-TERM INVESTMENTS – 1.29% | | Number | | | | | | % of | |
| | | of Shares | | | Value | | | Net Assets | |
| Money Market Funds – 1.29% | | | | | | | | | |
| First American Government Obligations Fund, | | | | | | | | | |
| Institutional Class, 0.03% (b) | | | 431,843 | | | $ | 431,843 | | | | 1.29 | % |
| | | | | | | | | | | | | |
| Total Short-Term Investments | | | | | | | | | | | | |
| (Cost $431,843) | | | | | | | 431,843 | | | | 1.29 | % |
| | | | | | | | | | | | | |
| Total Investments | | | | | | | | | | | | |
| (Cost $26,406,412) – 99.31% | | | | | | | 33,275,031 | | | | 99.31 | % |
| Other Assets in Excess of Liabilities – 0.69% | | | | | | | 229,635 | | | | 0.69 | % |
| | | | | | | | | | | | | |
TOTAL NET ASSETS – 100.00% | | | | | | $ | 33,504,666 | | | | 100.00 | % |
Percentages are stated as a percent of net assets.
| (a) | U.S.-traded security of a foreign corporation. |
| (b) | The rate listed is the fund’s seven-day yield as of April 30, 2021. |
Summary of Fair Value Exposure as of April 30, 2021
The following is a summary of the inputs used to value the Fund’s net assets as of April 30, 2021 (see Note 3 in the accompanying Notes to the Financial Statements):
| Common Stocks | | Level 1 | | | Level 2 | | | Level 3 | | | Total | |
| Crude Oil & Refined Products | | $ | 1,330,665 | | | $ | — | | | $ | — | | | $ | 1,330,665 | |
| Gathering & Processing | | | 3,154,450 | | | | — | | | | — | | | | 3,154,450 | |
| Natural Gas/NGL Transportation | | | 8,527,707 | | | | — | | | | — | | | | 8,527,707 | |
| Total Common Stocks | | $ | 13,012,822 | | | $ | — | | | $ | — | | | $ | 13,012,822 | |
| Partnerships & Trusts | | | | | | | | | | | | | | | | |
| Crude Oil & Refined Products | | $ | 9,118,848 | | | $ | — | | | $ | — | | | $ | 9,118,848 | |
| Gathering & Processing | | | 1,649,760 | | | | — | | | | — | | | | 1,649,760 | |
| Natural Gas/NGL Transportation | | | 9,061,758 | | | | — | | | | — | | | | 9,061,758 | |
| Total Partnerships & Trusts | | $ | 19,830,366 | | | $ | — | | | $ | — | | | $ | 19,830,366 | |
| Short-Term Investments | | | | | | | | | | | | | | | | |
| Money Market Funds | | $ | 431,843 | | | $ | — | | | $ | — | | | $ | 431,843 | |
| Total Short-Term Investments | | $ | 431,843 | | | $ | — | | | $ | — | | | $ | 431,843 | |
| Total Investments | | $ | 33,275,031 | | | $ | — | | | $ | — | | | $ | 33,275,031 | |
The accompanying notes are an integral part of these financial statements.
| HENNESSY FUNDS | 1-800-966-4354 | |
Financial Statements
Statement of Assets and Liabilities as of April 30, 2021 (Unaudited) |
| ASSETS: | | | |
| Investments in securities, at value (cost $26,406,412) | | $ | 33,275,031 | |
| Dividends and interest receivable | | | 40,992 | |
| Receivable for fund shares sold | | | 8,505 | |
| Return of capital receivable | | | 239,174 | |
| Deferred income tax | | | — | |
| Prepaid expenses and other assets | | | 15,327 | |
| Total assets | | | 33,579,029 | |
| | | | | |
| LIABILITIES: | | | | |
| Payable for fund shares redeemed | | | 2,110 | |
| Payable to advisor | | | 25,173 | |
| Payable to auditor | | | 20,266 | |
| Accrued distribution fees | | | 1,111 | |
| Accrued service fees | | | 488 | |
| Accrued trustees fees | | | 5,112 | |
| Accrued expenses and other payables | | | 20,103 | |
| Total liabilities | | | 74,363 | |
| NET ASSETS | | $ | 33,504,666 | |
| | | | | |
| NET ASSETS CONSISTS OF: | | | | |
| Capital stock | | $ | 53,772,768 | |
| Accumulated deficit | | | (20,268,102 | ) |
| Total net assets | | $ | 33,504,666 | |
| | | | | |
| NET ASSETS: | | | | |
| Investor Class | | | | |
| Shares authorized (no par value) | | Unlimited | |
| Net assets applicable to outstanding shares | | $ | 6,151,228 | |
| Shares issued and outstanding | | | 768,219 | |
| Net asset value, offering price, and redemption price per share | | $ | 8.01 | |
| | | | | |
| Institutional Class | | | | |
| Shares authorized (no par value) | | Unlimited | |
| Net assets applicable to outstanding shares | | $ | 27,353,438 | |
| Shares issued and outstanding | | | 3,332,482 | |
| Net asset value, offering price, and redemption price per share | | $ | 8.21 | |
The accompanying notes are an integral part of these financial statements.
| STATEMENT OF ASSETS AND LIABILITIES/STATEMENT OF OPERATIONS |
Financial Statements
Statement of Operations for the six months ended April 30, 2021 (Unaudited) |
| INVESTMENT INCOME: | | | |
| Distributions received from master limited partnerships | | $ | 780,738 | |
| Return of capital on distributions received | | | (780,738 | ) |
Dividend income(1) | | | 148,175 | |
| Interest income | | | 94 | |
| Total investment income | | | 148,269 | |
| | | | | |
| EXPENSES: | | | | |
| Investment advisory fees (See Note 5) | | | 160,806 | |
| Administration, accounting, custody, and transfer agent fees (See Note 5) | | | 22,468 | |
| Audit fees | | | 20,272 | |
| Sub-transfer agent expenses – Investor Class (See Note 5) | | | 4,843 | |
| Sub-transfer agent expenses – Institutional Class (See Note 5) | | | 9,315 | |
| Federal and state registration fees | | | 14,119 | |
| Compliance expense (See Note 5) | | | 13,841 | |
| Trustees’ fees and expenses | | | 9,231 | |
| Reports to shareholders | | | 4,247 | |
| Distribution fees – Investor Class (See Note 5) | | | 3,818 | |
| Service fees – Investor Class (See Note 5) | | | 2,545 | |
| Income tax expense | | | 1,520 | |
| Legal fees | | | 192 | |
| Interest expense (See Note 7) | | | 8 | |
| Other expenses | | | 4,858 | |
| Total expenses before waivers and reimbursements | | | 272,083 | |
| Service provider expense waiver (See Note 5) | | | (22,468 | ) |
| Expense reimbursement by advisor – Investor Class (See Note 5) | | | (6,283 | ) |
| Expense reimbursement by advisor – Institutional Class (See Note 5) | | | (16,267 | ) |
| Net expenses | | | 227,065 | |
| NET INVESTMENT LOSS | | $ | (78,796 | ) |
| | | | | |
| REALIZED AND UNREALIZED GAINS (LOSSES): | | | | |
| Net realized loss on investments | | $ | (1,265,628 | ) |
| Net change in unrealized appreciation/depreciation on investments | | | 13,496,131 | |
| Net gain on investments | | | 12,230,503 | |
| NET INCREASE IN NET ASSETS RESULTING FROM OPERATIONS | | $ | 12,151,707 | |
(1) | Net of foreign taxes withheld of $7,843. |
The accompanying notes are an integral part of these financial statements.
| HENNESSY FUNDS | 1-800-966-4354 | |
(This Page Intentionally Left Blank.)
| STATEMENTS OF CHANGES IN NET ASSETS |
Financial Statements
| Statements of Changes in Net Assets |
| | | Six Months Ended | | | | |
| | | April 30, 2021 | | | Year Ended | |
| | | (Unaudited) | | | October 31, 2020 | |
| OPERATIONS: | | | | | | |
| Net investment loss | | $ | (78,796 | ) | | $ | (398,916 | ) |
| Net realized loss on investments | | | (1,265,628 | ) | | | (7,697,287 | ) |
| Net change in unrealized | | | | | | | | |
| appreciation/deprecation on investments | | | 13,496,131 | | | | (5,793,719 | ) |
| Net increase (decrease) in net | | | | | | | | |
| assets resulting from operations | | | 12,151,707 | | | | (13,889,922 | ) |
| | | | | | | | | |
| DISTRIBUTIONS TO SHAREHOLDERS FROM: | | | | | | | | |
| Return of capital – Investor Class | | | (358,134 | ) | | | (901,142 | ) |
| Return of capital – Institutional Class | | | (1,695,068 | ) | | | (3,075,804 | ) |
| Total distributions | | | (2,053,202 | ) | | | (3,976,946 | ) |
| | | | | | | | | |
| CAPITAL SHARE TRANSACTIONS: | | | | | | | | |
| Proceeds from shares subscribed – Investor Class | | | 1,232,870 | | | | 1,902,264 | |
| Proceeds from shares subscribed – Institutional Class | | | 1,982,204 | | | | 9,560,813 | |
| Dividends reinvested – Investor Class | | | 328,522 | | | | 876,530 | |
| Dividends reinvested – Institutional Class | | | 1,577,837 | | | | 2,999,051 | |
| Cost of shares redeemed – Investor Class | | | (949,562 | ) | | | (3,867,332 | ) |
| Cost of shares redeemed – Institutional Class | | | (2,911,993 | ) | | | (12,434,812 | ) |
| Net increase (decrease) in net assets derived | | | | | | | | |
| from capital share transactions | | | 1,259,878 | | | | (963,486 | ) |
| TOTAL INCREASE (DECREASE) IN NET ASSETS | | | 11,358,383 | | | | (18,830,354 | ) |
| | | | | | | | | |
| NET ASSETS: | | | | | | | | |
| Beginning of period | | | 22,146,283 | | | | 40,976,637 | |
| End of period | | $ | 33,504,666 | | | $ | 22,146,283 | |
| | | | | | | | | |
| CHANGES IN SHARES OUTSTANDING: | | | | | | | | |
| Shares sold – Investor Class | | | 170,549 | | | | 312,671 | |
| Shares sold – Institutional Class | | | 282,287 | | | | 1,568,094 | |
| Shares issued to holders as reinvestment | | | | | | | | |
| of dividends – Investor Class | | | 47,183 | | | | 112,216 | |
| Shares issued to holders as reinvestment | | | | | | | | |
| of dividends – Institutional Class | | | 221,164 | | | | 380,829 | |
| Shares redeemed – Investor Class | | | (135,811 | ) | | | (582,063 | ) |
| Shares redeemed – Institutional Class | | | (400,676 | ) | | | (1,585,605 | ) |
| Net increase in shares outstanding | | | 184,696 | | | | 206,142 | |
The accompanying notes are an integral part of these financial statements.
| HENNESSY FUNDS | 1-800-966-4354 | |
Financial Statements
For an Investor Class share outstanding throughout each period
| | | Six Months Ended | |
| | | April 30, 2021 | |
| | | (Unaudited) | |
| PER SHARE DATA: | | | |
| Net asset value, beginning of period | | $ | 5.55 | |
| | | | | |
| Income from investment operations: | | | | |
Net investment loss(2)(3) | | | (0.03 | ) |
| Net realized and unrealized gains (losses) on investments | | | 3.00 | |
| Total from investment operations | | | 2.97 | |
| | | | | |
| Less distributions: | | | | |
| Dividends from return of capital | | | (0.51 | ) |
| Total distributions | | | (0.51 | ) |
| Net asset value, end of period | | $ | 8.01 | |
| | | | | |
| TOTAL RETURN | | | 55.20 | %(4) |
| | | | | |
| SUPPLEMENTAL DATA AND RATIOS: | | | | |
| Net assets, end of period (millions) | | $ | 6.15 | |
| Ratio of expenses to average net assets: | | | | |
| Before expense reimbursement | | | 2.16 | %(5) |
| After expense reimbursement | | | 1.76 | %(5) |
| Ratio of net investment loss to average net assets: | | | | |
Before expense reimbursement(3) | | | (1.13 | )%(5) |
After expense reimbursement(3) | | | (0.73 | )%(5) |
Portfolio turnover rate(7) | | | 22 | %(4) |
(1) | The period ended October 31, 2018, consists of 11 months due to the Fund’s fiscal year end change from November 30 to October 31, effective October 26, 2018. |
(2) | Calculated using the average shares outstanding method. |
(3) | Includes current and deferred tax benefit/expense from net investment income/loss only. |
(4) | Not annualized. |
(5) | Annualized. |
(6) | Includes an estimated deferred tax expense/benefit of -1.32%. See Note 2.b in the Notes to the Financial Statements. |
(7) | Calculated on the basis of the Fund as a whole. |
The accompanying notes are an integral part of these financial statements.
| FINANCIAL HIGHLIGHTS — INVESTOR CLASS |
Year Ended October 31, | | | Period Ended | | | Year Ended November 30, | |
| | | October 31, | | | |
| 2020 | | | 2019 | | | 2018(1) | | | 2017 | | | 2016 | | | 2015 | |
| | | | | | | | | | | | | | | | | |
| $ | 10.90 | | | $ | 12.66 | | | $ | 14.51 | | | $ | 16.54 | | | $ | 15.45 | | | $ | 22.25 | |
| | | | | | | | | | | | | | | | | | | | | | | |
| | | | | | | | | | | | | | | | | | | | | | | |
| | (0.10 | ) | | | (0.10 | ) | | | (0.16 | ) | | | (0.22 | ) | | | (0.17 | ) | | | (0.20 | ) |
| | (4.22 | ) | | | (0.63 | ) | | | (0.66 | ) | | | (0.78 | ) | | | 2.29 | | | | (5.60 | ) |
| | (4.32 | ) | | | (0.73 | ) | | | (0.82 | ) | | | (1.00 | ) | | | 2.12 | | | | (5.80 | ) |
| | | | | | | | | | | | | | | | | | | | | | | |
| | | | | | | | | | | | | | | | | | | | | | | |
| | (1.03 | ) | | | (1.03 | ) | | | (1.03 | ) | | | (1.03 | ) | | | (1.03 | ) | | | (1.00 | ) |
| | (1.03 | ) | | | (1.03 | ) | | | (1.03 | ) | | | (1.03 | ) | | | (1.03 | ) | | | (1.00 | ) |
| $ | 5.55 | | | $ | 10.90 | | | $ | 12.66 | | | $ | 14.51 | | | $ | 16.54 | | | $ | 15.45 | |
| | | | | | | | | | | | | | | | | | | | | | | |
| | -42.13 | % | | | -6.28 | % | | | -6.15 | %(4) | | | -6.49 | % | | | 14.78 | % | | | -27.17 | % |
| | | | | | | | | | | | | | | | | | | | | | | |
| | | | | | | | | | | | | | | | | | | | | | | |
| $ | 3.81 | | | $ | 9.20 | | | $ | 20.07 | | | $ | 16.86 | | | $ | 13.43 | | | $ | 8.76 | |
| | | | | | | | | | | | | | | | | | | | | | | |
| | 2.12 | % | | | 1.89 | % | | | 1.86 | %(5) | | | 1.91 | % | | | 2.21 | % | | | 1.38 | %(6) |
| | 1.76 | % | | | 1.76 | % | | | 1.78 | %(5) | | | 1.77 | % | | | 1.74 | % | | | 0.42 | %(6) |
| | | | | | | | | | | | | | | | | | | | | | | |
| | (1.63 | )% | | | (0.92 | )% | | | (1.34 | )%(5) | | | (1.50 | )% | | | (1.60 | )% | | | (1.97 | )% |
| | (1.27 | )% | | | (0.79 | )% | | | (1.26 | )%(5) | | | (1.36 | )% | | | (1.13 | )% | | | (1.01 | )% |
| | 53 | % | | | 41 | % | | | 64 | %(4) | | | 63 | % | | | 139 | % | | | 96 | % |
The accompanying notes are an integral part of these financial statements.
| HENNESSY FUNDS | 1-800-966-4354 | |
Financial Statements
For an Institutional Class share outstanding throughout each period
| | | Six Months Ended | |
| | | April 30, 2021 | |
| | | (Unaudited) | |
| PER SHARE DATA: | | | |
| Net asset value, beginning of period | | $ | 5.68 | |
| | | | | |
| Income from investment operations: | | | | |
Net investment loss(2)(3) | | | (0.02 | ) |
| Net realized and unrealized gains (losses) on investments | | | 3.06 | |
| Total from investment operations | | | 3.04 | |
| | | | | |
| Less distributions: | | | | |
| Dividends from return of capital | | | (0.51 | ) |
| Total distributions | | | (0.51 | ) |
| Net asset value, end of period | | $ | 8.21 | |
| | | | | |
| TOTAL RETURN | | | 55.17 | %(4) |
| | | | | |
| SUPPLEMENTAL DATA AND RATIOS: | | | | |
| Net assets, end of period (millions) | | $ | 27.35 | |
| Ratio of expenses to average net assets: | | | | |
| Before expense reimbursement | | | 1.80 | %(5) |
| After expense reimbursement | | | 1.51 | %(5) |
| Ratio of net investment loss to average net assets: | | | | |
Before expense reimbursement(3) | | | (0.79 | )%(5) |
After expense reimbursement(3) | | | (0.50 | )%(5) |
Portfolio turnover rate(7) | | | 22 | %(4) |
(1) | The period ended October 31, 2018, consists of 11 months due to the Fund’s fiscal year end change from November 30 to October 31, effective October 26, 2018. |
(2) | Calculated using the average shares outstanding method. |
(3) | Includes current and deferred tax benefit/expense from net investment income/loss only. |
(4) | Not annualized. |
(5) | Annualized. |
(6) | Includes an estimated deferred tax expense/benefit of -1.32%. See Note 2.b in the Notes to the Financial Statements. |
(7) | Calculated on the basis of the Fund as a whole. |
The accompanying notes are an integral part of these financial statements.
| FINANCIAL HIGHLIGHTS — INSTITUTIONAL CLASS |
Year Ended October 31, | | | Period Ended | | | Year Ended November 30, | |
| | | October 31, | | | |
| 2020 | | | 2019 | | | 2018(1) | | | 2017 | | | 2016 | | | 2015 | |
| | | | | | | | | | | | | | | | | |
| $ | 11.09 | | | $ | 12.83 | | | $ | 14.66 | | | $ | 16.66 | | | $ | 15.53 | | | $ | 22.28 | |
| | | | | | | | | | | | | | | | | | | | | | | |
| | | | | | | | | | | | | | | | | | | | | | | |
| | (0.10 | ) | | | (0.09 | ) | | | (0.14 | ) | | | (0.18 | ) | | | (0.12 | ) | | | (0.14 | ) |
| | (4.28 | ) | | | (0.62 | ) | | | (0.66 | ) | | | (0.79 | ) | | | 2.28 | | | | (5.61 | ) |
| | (4.38 | ) | | | (0.71 | ) | | | (0.80 | ) | | | (0.97 | ) | | | 2.16 | | | | (5.75 | ) |
| | | | | | | | | | | | | | | | | | | | | | | |
| | | | | | | | | | | | | | | | | | | | | | | |
| | (1.03 | ) | | | (1.03 | ) | | | (1.03 | ) | | | (1.03 | ) | | | (1.03 | ) | | | (1.00 | ) |
| | (1.03 | ) | | | (1.03 | ) | | | (1.03 | ) | | | (1.03 | ) | | | (1.03 | ) | | | (1.00 | ) |
| $ | 5.68 | | | $ | 11.09 | | | $ | 12.83 | | | $ | 14.66 | | | $ | 16.66 | | | $ | 15.53 | |
| | | | | | | | | | | | | | | | | | | | | | | |
| | -41.93 | % | | | -6.10 | % | | | -5.94 | %(4) | | | -6.25 | % | | | 14.97 | % | | | -26.90 | % |
| | | | | | | | | | | | | | | | | | | | | | | |
| | | | | | | | | | | | | | | | | | | | | | | |
| $ | 18.33 | | | $ | 31.78 | | | $ | 61.92 | | | $ | 82.59 | | | $ | 33.22 | | | $ | 15.72 | |
| | | | | | | | | | | | | | | | | | | | | | | |
| | 1.79 | % | | | 1.56 | % | | | 1.58 | %(5) | | | 1.66 | % | | | 1.95 | % | | | 1.10 | %(6) |
| | 1.51 | % | | | 1.51 | % | | | 1.52 | %(5) | | | 1.52 | % | | | 1.48 | % | | | 0.18 | %(6) |
| | | | | | | | | | | | | | | | | | | | | | | |
| | (1.55 | )% | | | (0.76 | )% | | | (1.15 | )%(5) | | | (1.28 | )% | | | (1.28 | )% | | | (1.63 | )% |
| | (1.27 | )% | | | (0.71 | )% | | | (1.09 | )%(5) | | | (1.14 | )% | | | (0.81 | )% | | | (0.71 | )% |
| | 53 | % | | | 41 | % | | | 64 | %(4) | | | 63 | % | | | 139 | % | | | 96 | % |
The accompanying notes are an integral part of these financial statements.
| HENNESSY FUNDS | 1-800-966-4354 | |
Financial Statements
Notes to the Financial Statements April 30, 2021 (Unaudited) |
1). ORGANIZATION
The Hennessy BP Midstream Fund (the “Fund”) is a series of Hennessy Funds Trust (the “Trust”), which was organized as a Delaware statutory trust on September 17, 1992. The Fund is an open-end management investment company registered under the Investment Company Act of 1940, as amended. The investment objective of the Fund is to seek capital appreciation through distribution growth along with current income. The Fund is treated as a regular corporation, or “C” corporation, for U.S. federal income tax purposes. Because the Fund is treated as a “C” corporation, it is not taxed as a regulated investment company under Subchapter M of the Code and is not required to comply with the diversification requirements applicable to regulated investment companies. The Fund is a non-diversified fund.
The Fund offers Investor Class and Institutional Class shares. Each class of shares differs principally in its respective 12b-1 distribution and service, shareholder servicing, and sub-transfer agent expenses. There are no sales charges. Each class has identical rights to earnings, assets, and voting privileges, except for class-specific expenses and exclusive rights to vote on matters affecting only one class.
As an investment company, the Fund follows the investment company accounting and reporting guidance of the Financial Accounting Standards Board (“FASB”) Accounting Standard Codification Topic 946 “Financial Services—Investment Companies.”
2). SIGNIFICANT ACCOUNTING POLICIES
The following is a summary of significant accounting policies consistently followed by the Fund in the preparation of the financial statements. These policies conform to U.S. generally accepted accounting principles (“GAAP”).
| a). | Securities Valuation – All investments in securities are valued in accordance with the Fund’s valuation policies and procedures, as described in Note 3. |
| | |
| b). | Federal Income Taxes – The Fund is taxed as a corporation and is obligated to pay U.S. federal and state income tax on its taxable income. Currently, the maximum marginal regular federal income tax rate for a corporation is 21%. The Fund invests a substantial portion of its assets in master limited partnerships (“MLPs”), which are treated as partnerships for federal income tax purposes. As a limited partner in MLPs, the Fund reports its allocable share of each MLP’s taxable income in computing its own taxable income. |
| | |
| | The Fund includes any tax expense or benefit in the Statement of Operations based on the component of income or gains/losses to which such expense or benefit relates. Deferred income taxes reflect the net tax effects of temporary differences between the carrying amount of assets and liabilities for financial reporting purposes and the carrying amount of assets and liabilities for income tax purposes. The Fund recognizes a valuation allowance if, based on the weight of available evidence, it is more likely than not that the Fund will not realize some portion or all of the deferred income tax assets. As of April 30, 2021, the Fund has placed a full valuation allowance on its deferred tax assets. |
| | |
| c). | Accounting for Uncertainty in Income Taxes – The Fund has accounting policies regarding recognition and measurement of tax positions taken or expected to be taken on a tax return. The tax returns of the Fund for the prior three fiscal years are |
| NOTES TO THE FINANCIAL STATEMENTS |
| | open for examination. The Fund has reviewed all open tax years in major tax jurisdictions and concluded that there is no impact on the Fund’s net assets and no tax liability resulting from unrecognized tax benefits relating to uncertain income tax positions taken or expected to be taken on a tax return. The Fund files U.S. federal income tax returns and various state income tax returns. |
| | |
| d). | Income and Expenses – Dividend income is recognized on the ex-dividend date or as soon as information is available to the Fund. Interest income, which includes the amortization of premium and accretion of discount, is recognized on an accrual basis. Market discounts, original issue discounts, and market premiums on debt securities are accreted or amortized to interest income over the life of a security with a corresponding increase or decrease, as applicable, in the cost basis of such security using the yield-to-maturity method or, where applicable, the first call date of the security. Other non-cash dividends are recognized as investment income at the fair value of the property received. The Fund is charged for those expenses that are directly attributable to its portfolio, such as advisory, administration, and certain shareholder service fees. Income, expenses (other than expenses attributable to a specific class), and realized and unrealized gains/losses on investments are allocated to each class of shares based on such class’s net assets. Distributions received from the Fund’s investments in MLPs generally consist of ordinary income, capital gains, and return of capital. The Fund records investment income on the ex-date of the distributions. For financial statement purposes, the Fund uses return of capital and income estimates to allocate the dividend income received. Such estimates are based on historical information available from the MLPs and other industry sources. These estimates may subsequently be revised based on information received from the MLPs after their tax reporting periods are concluded, as the actual character of these distributions is not known until after the fiscal year end of the Fund. |
| | |
| e). | Distributions to Shareholders – The Fund typically makes cash distributions to its shareholders quarterly at the beginning of the months of March, June, September, and December. Due to the tax treatment of the Fund’s allocations and distributions from MLPs, a significant portion of the Fund’s distributions to shareholders typically is treated as return of capital to shareholders for U.S. federal income tax purposes (i.e., as distributions in excess of the Fund’s current and accumulated earnings and profits as described below). However, no assurance can be given in this regard; just as the Fund’s corporate income tax liability can fluctuate materially from year to year, the extent to which the Fund is able to make return-of-capital distributions also can vary materially from year to year depending on a number of different factors, including the composition of the Fund’s portfolio, the level of allocations of net income and other tax items for the Fund from its underlying MLP investments, the length of time the Fund has owned the MLP equity securities in its portfolio, and the extent to which the Fund disposes of MLP equity securities during a particular year, including to meet Fund shareholder redemption requests as necessary. |
| | In general, a distribution constitutes a return of capital to a shareholder rather than a dividend to the extent such distribution exceeds the Fund’s current and accumulated earnings and profits. The portion of any distribution treated as a return of capital constitutes a tax-free return of capital to the extent of a shareholder’s cost basis in Fund shares and thereafter generally is taxable to the shareholder as a capital gain. A return-of-capital distribution also reduces the shareholder’s cost basis in Fund shares (but not below zero). A lower cost basis means that a shareholder recognizes more gain or less loss when the shareholder eventually sells Fund shares, which increases the shareholder’s tax liability. |
| HENNESSY FUNDS | 1-800-966-4354 | |
| | The Fund attempts to maintain a stable distribution rate and therefore may distribute more or less than the actual amount of cash it receives from its investments in a particular period. Any undistributed cash would be available to supplement future distributions, and until distributed would increase the Fund’s net asset value (“NAV”). Correspondingly, such amounts, once distributed, decrease the Fund’s NAV. In addition, the Fund may opt not to make distributions in quarters in which the Fund believes that a distribution could cause adverse tax consequences to shareholders, including when the Fund believes that a distribution may not constitute a tax-free return of capital as described above. |
| | |
| f). | Security Transactions – Investment and shareholder transactions are recorded on the trade date. The Fund determines the realized gain/loss from an investment transaction by comparing the original cost of the security lot sold with the net sale proceeds. Discounts and premiums on securities purchased are accreted or amortized, respectively, over the life of each such security. |
| | |
| g). | Use of Estimates – Preparing financial statements in accordance with GAAP requires management to make estimates and assumptions that affect the reported amounts of assets and liabilities and disclosure of contingent assets and liabilities at the date of the financial statements, as well as the reported change in net assets during the reporting period. Actual results could differ from those estimates. |
| | |
| h). | Share Valuation – The NAV per share of the Fund is calculated by dividing (i) the total value of the securities held by the Fund, plus cash and other assets, minus all liabilities (including estimated accrued expenses) by (ii) the total number of Fund shares outstanding, rounded to the nearest $0.01. Fund shares are not priced on days the New York Stock Exchange is closed for trading. The offering and redemption price per share for the Fund is equal to the Fund’s NAV per share. |
| | |
| i). | Partnership Accounting Policy – To the extent the Fund receives distributions from underlying partnerships in which it invests, the Fund records its pro rata share of income/loss and capital gains/losses and accordingly adjusts the cost basis of the underlying partnerships for return of capital. |
| | |
| j). | New Accounting Pronouncements – In August 2018, the FASB issued Accounting Standards Update No. 2018-13 “Disclosure Framework—Changes to the Disclosure Requirements for Fair Value Measurement” (“ASU 2018-13”). ASU 2018-13 eliminates the requirement to disclose the amount of and reasons for transfers between Level 1 and Level 2 of the fair value hierarchy, the timing of transfers between levels of the fair value hierarchy, and the valuation processes for Level 3 fair value measurements. ASU 2018-13 does not eliminate the requirement to disclose the range and weighted average used to develop significant unobservable inputs for Level 3 fair value measurements or the requirement to disclose the changes in unrealized gains and losses for recurring Level 3 fair value measurements. ASU 2018-13 requires that information is provided about the measurement uncertainty of Level 3 fair value measurements as of the reporting date. The guidance is effective for fiscal years beginning after December 15, 2019, and interim periods within those fiscal years. Management evaluated the impact of this change in guidance and, due to the permissibility of early adoption, modified the Fund’s fair value disclosures beginning with its fiscal year 2019. |
3). SECURITIES VALUATION
The Fund follows its valuation policies and procedures in determining its net asset value and, in preparing these financial statements, the fair value accounting standards that establish an authoritative definition of fair value and set out a hierarchy for measuring fair
| NOTES TO THE FINANCIAL STATEMENTS |
value. These standards require additional disclosures about the various inputs and valuation techniques used to develop the measurements of fair value and a discussion of changes in valuation techniques and related inputs during the period. These inputs are summarized in the three broad levels listed below:
| | Level 1 – | Unadjusted, quoted prices in active markets for identical instruments that the Fund has the ability to access at the date of measurement. |
| | | |
| | Level 2 – | Other significant observable inputs (including, but not limited to, quoted prices in active markets for similar instruments, quoted prices in markets that are not active for identical or similar instruments, and model-derived valuations in which all significant inputs and significant value drivers are observable in active markets, such as interest rates, prepayment speeds, credit risk curves, default rates, and similar data). |
| | | |
| | Level 3 – | Significant unobservable inputs (including the Fund’s own assumptions about what market participants would use to price the asset or liability based on the best available information) when observable inputs are unavailable. |
The following is a description of the valuation techniques applied to the Fund’s major categories of assets and liabilities on a recurring basis:
| | Equity Securities – Equity securities, including common stocks, preferred stocks, foreign-issued common stocks, exchange-traded funds, closed-end mutual funds, partnerships, rights, MLPs, and real estate investment trusts, that are traded on a securities exchange for which a last-quoted sales price is readily available generally are valued at the last sales price as reported by the primary exchange on which the securities are listed. Securities listed on The NASDAQ Stock Market (“NASDAQ”) generally are valued at the NASDAQ Official Closing Price, which may differ from the last sales price reported. Securities traded on a securities exchange for which a last-quoted sales price is not readily available generally are valued at the mean between the bid and ask prices. To the extent these securities are actively traded and valuation adjustments are not applied, they are classified in Level 1 of the fair value hierarchy. Securities traded on foreign exchanges generally are not valued at the same time the Fund calculates its NAV because most foreign markets close well before such time. The earlier close of most foreign markets gives rise to the possibility that significant events, including broad market moves, may have occurred in the interim. In certain circumstances, it may be determined that a foreign security needs to be fair valued because it appears that the value of the security might have been materially affected by events occurring after the close of the market in which the security is principally traded, but before the time the Fund calculates its NAV, such as by a development that affects an entire market or region (e.g., a weather-related event) or a potentially global development (e.g., a terrorist attack that may be expected to have an effect on investor expectations worldwide). |
| | |
| | Registered Investment Companies – Investments in open-end registered investment companies, commonly referred to as mutual funds, generally are priced at the ending NAV provided by the applicable mutual fund’s service agent and are classified in Level 1 of the fair value hierarchy. |
| | |
| | Debt Securities – Debt securities, including corporate bonds, asset-backed securities, mortgage-backed securities, municipal bonds, U.S. Treasuries, and U.S. government agency issues, are generally valued at market on the basis of valuations furnished by an independent pricing service that utilizes both dealer-supplied valuations and formula-based techniques. The pricing service may consider recently executed |
| HENNESSY FUNDS | 1-800-966-4354 | |
| | transactions in securities of the issuer or comparable issuers, market price quotations (where observable), bond spreads, and fundamental data relating to the issuer. In addition, the model may incorporate observable market data, such as reported sales of similar securities, broker quotes, yields, bids, offers, and reference data. Certain securities are valued primarily using dealer quotations. These securities are generally classified in Level 2 of the fair value hierarchy. |
| | |
| | Short-Term Securities – Short-term equity investments, including money market funds, are valued in the manner specified above for equity securities. Short-term debt investments with an original term to maturity of 60 days or less are valued at amortized cost, which approximates fair market value. If the original term to maturity of a short-term debt investment exceeds 60 days, then the values as of the 61st day prior to maturity are amortized. Amortized cost is not used if its use would be inappropriate due to credit or other impairments of the issuer, in which case the security’s fair value would be determined as described below. Short-term securities are generally classified in Level 1 or Level 2 of the fair value hierarchy depending on the inputs used and market activity levels for specific securities. |
The Board of Trustees of the Fund (the “Board”) has adopted fair value pricing procedures that are followed when a price for a security is not readily available or if a significant event has occurred that indicates the closing price of a security no longer represents the true value of that security. Fair value pricing determinations are made in good faith in accordance with these procedures. There are numerous criteria considered in determining a fair value of a security, such as the trading volume of a security and markets, the values of other similar securities, and news events with direct bearing on a security or markets. Fair value pricing results in an estimated price for a security that reflects the amount the Fund might reasonably expect to receive in a current sale. Depending on the relative significance of the valuation inputs, these securities may be classified in either Level 2 or Level 3 of the fair value hierarchy.
The fair value of foreign securities may be determined with the assistance of a pricing service using correlations between the movement of prices of such securities and indices of domestic securities and other appropriate indicators, such as closing market prices of relevant American Depositary Receipts or futures contracts. Using fair value pricing means that the Fund’s NAV reflects the affected portfolio securities’ values as determined by the Board or its designee, pursuant to the fair value pricing procedures adopted by the Board, instead of being determined by the market. Using a fair value pricing methodology to price a foreign security may result in a value that is different from such foreign security’s most recent closing price and from the value used by other investment companies to calculate their NAVs. Such securities are generally classified in Level 2 of the fair value hierarchy. Because the Fund may invest in foreign securities, the value of the Fund’s portfolio securities may change on days when a shareholder is unable to purchase or redeem Fund shares.
The Board has delegated day-to-day valuation matters to the Valuation and Liquidity Committee comprising representatives from Hennessy Advisors, Inc., the Fund’s investment advisor (the “Advisor”). The function of the Valuation and Liquidity Committee, among other things, is to value securities where current and reliable market quotations are not readily available. All actions taken by the Valuation and Liquidity Committee are reviewed by the Board.
The Fund has performed an analysis of all existing investments to determine the significance and character of all inputs to their fair value determinations. Various inputs are used to determine the value of the Fund’s investments. The inputs or methodology used for valuing securities are not necessarily an indication of the risk associated with
| NOTES TO THE FINANCIAL STATEMENTS |
investing in those securities. Details related to the fair value hierarchy of the Fund’s securities as of April 30, 2021, are included in the Schedule of Investments.
4). INVESTMENT TRANSACTIONS
Purchases and sales of investment securities (excluding government and short-term investments) for the Fund during the six months ended April 30, 2021, were $6,212,787 and $6,164,232, respectively.
There were no purchases or sales/maturities of long-term U.S. government securities for the Fund during the six months ended April 30, 2021.
5). INVESTMENT ADVISORY FEE AND OTHER TRANSACTIONS WITH AFFILIATES
The Advisor provides the Fund with investment advisory services under an Investment Advisory Agreement. The Advisor oversees the provision of investment advice and furnishes office space, facilities, and most of the personnel needed by the Fund. As compensation for its services, the Advisor is entitled to a monthly fee from the Fund. The fee is based on the average daily net assets of the Fund at an annual rate of 1.10%. The net investment advisory fees expensed by the Fund during the six months ended April 30, 2021, are included in the Statement of Operations.
The Advisor has delegated the day-to-day management of the Fund to a sub-advisor, BP Capital Fund Advisors, LLC. The Advisor pays the sub-advisory fees from its own assets, and these fees are not an additional expense of the Fund. During the six months ended April 30, 2021, the Advisor (not the Fund) paid a sub-advisory fee at the rate of 0.40% of the daily net assets of the Fund.
The Advisor has contractually agreed to limit total annual operating expenses to 1.75% of the Fund’s net assets for Investor Class shares and 1.50% of the Fund’s net assets for Institutional Class shares (in each case, excluding all federal, state, and local taxes, interest, brokerage commissions, dividend and interest expenses on short sales, extraordinary items, and acquired fund fees and expenses and other costs incurred in connection with the purchase and sale of securities) through February 28, 2022.
For three years following the date on which expenses were waived or incurred, the Advisor may recoup waived or reimbursed expenses from the Fund if total operating expenses, including such recoupment, does not exceed the expense limitation in effect (i) at the time the Advisor waived or reimbursed such expenses and (ii) at the time the Advisor recoups such expenses. As of April 30, 2021, expenses subject to potential recovery for Investor Class and Institutional Class shares and the fiscal years in which they expire were as follows:
| | | Fiscal Year | Fiscal Year | Fiscal Year | |
| | | 2022
| 2023
| 2024
| Total |
| | Investor Class | $22,275 | $22,658 | $ 6,283 | $51,216 |
| | Institutional Class | $22,421 | $60,422 | $16,827 | $99,670 |
The amount of the expense reimbursement by the Advisor for Institutional Class shares set forth in the Statement of Operations is net of $560 that the Advisor recouped from the Fund during the six months ended April 30, 2021.
The Board has approved a Shareholder Servicing Agreement for Investor Class shares of the Fund, which compensates the Advisor for the non-investment advisory services it provides to the Fund. The Shareholder Servicing Agreement provides for a monthly fee paid to the Advisor at an annual rate of 0.10% of the average daily net assets of the Fund attributable to Investor Class shares. The shareholder service fees expensed by the Fund during the six months ended April 30, 2021, are included in the Statement of Operations.
| HENNESSY FUNDS | 1-800-966-4354 | |
The Fund has adopted a plan pursuant to Rule 12b-1 under the Investment Company Act of 1940, as amended, that authorizes payments in connection with the distribution of Fund shares at an annual rate of up to 0.25% of the Fund’s average daily net assets attributable to Investor Class shares. Even though the authorized rate is up to 0.25%, the Fund is currently only using up to 0.15% of its average daily net assets attributable to Investor Class shares for such purpose. Amounts paid under the plan may be spent on any activities or expenses primarily intended to result in the sale of shares, including, but not limited to, advertising, shareholder account servicing, printing and mailing of prospectuses to other than current shareholders, printing and mailing of sales literature, and compensation for sales and marketing activities or to financial institutions and others, such as dealers and distributors. The distribution fees expensed by the Fund during the six months ended April 30, 2021, are included in the Statement of Operations.
The Fund has entered into agreements with various brokers, dealers, and financial intermediaries in connection with the sale of Fund shares. The agreements provide for periodic payments of sub-transfer agent expenses by the Fund to the brokers, dealers, and financial intermediaries for providing certain shareholder maintenance services. These shareholder services include the pre-processing and quality control of new accounts, shareholder correspondence, answering customer inquiries regarding account status, and facilitating shareholder telephone transactions. The sub-transfer agent fees expensed by the Fund during the six months ended April 30, 2021, are included in the Statement of Operations.
U.S. Bancorp Fund Services, LLC, d/b/a U.S. Bank Global Fund Services (“Fund Services”) provides the Fund with administrative, accounting, and transfer agent services. As administrator, Fund Services is responsible for activities such as (i) preparing various federal and state regulatory filings, reports, and returns for the Fund, (ii) preparing reports and materials to be supplied to the Board, (iii) monitoring the activities of the Fund’s custodian, transfer agent, and accountants, and (iv) coordinating the preparation and payment of the Fund’s expenses and reviewing the Fund’s expense accruals. U.S. Bank N.A., an affiliate of Fund Services, serves as the Fund’s custodian. The servicing agreements between the Trust, Fund Services, and U.S. Bank N.A. contain a fee schedule that is inclusive of administrative, accounting, custody, and transfer agent fees. The administrative, accounting, custody, and transfer agent fees expensed by the Fund during the six months ended April 30, 2021, are included in the Statement of Operations. Fund Services has voluntarily waived all or a portion of its fees for the Fund. The fees voluntarily waived by Fund Services during the six months ended April 30, 2021, are included in the Statement of Operations.
Quasar Distributors, LLC (“Quasar”), a wholly owned broker-dealer subsidiary of Foreside Financial Group, LLC, acts as the Fund’s principal underwriter in a continuous public offering of Fund shares.
The officers of the Fund are affiliated with the Advisor. With the exception of the Chief Compliance Officer and the Senior Compliance Officer, such officers receive no compensation from the Fund for serving in their respective roles. The Fund, along with the other funds in the Hennessy Funds family (collectively, the “Hennessy Funds”), makes reimbursement payments on an equal basis to the Advisor for a portion of the salary and benefits associated with the office of the Chief Compliance Officer and for all of the salary and benefits associated with the office of the Senior Compliance Officer. The compliance fees expensed by the Fund during the six months ended April 30, 2021, are included in the Statement of Operations.
| NOTES TO THE FINANCIAL STATEMENTS |
6). GUARANTEES AND INDEMNIFICATIONS
Under the Hennessy Funds’ organizational documents, their officers and trustees are indemnified by the Hennessy Funds against certain liabilities arising out of the performance of their duties to the Hennessy Funds. Additionally, in the normal course of business, the Hennessy Funds enter into contracts with service providers that contain general indemnification clauses. The Fund’s maximum exposure under these arrangements is unknown as this would involve future claims that may be made against the Fund that have not yet occurred. Currently, the Fund expects the risk of loss to be remote.
7). LINE OF CREDIT
The Fund has an uncommitted line of credit with the other Hennessy Funds in the amount of the lesser of (i) $100,000,000 or (ii) 33.33% of each Hennessy Fund’s net assets, or 30% for the Hennessy Gas Utility Fund and 10% for the Hennessy Balanced Fund. The line of credit is intended to provide any necessary short-term financing in connection with shareholder redemptions, subject to certain restrictions. The credit facility is with the Hennessy Funds’ custodian bank, U.S. Bank N.A. Borrowings under this arrangement bear interest at the bank’s prime rate and are secured by all of the Fund’s assets (as to its own borrowings only). During the six months ended April 30, 2021, the Fund had an outstanding average daily balance and a weighted average interest rate of $481 and 3.25%, respectively. The interest expensed by the Fund during the six months ended April 30, 2021, is included in the Statement of Operations. The maximum amount outstanding for the Fund during the period was $51,000. As of April 30, 2021, the Fund did not have any borrowings outstanding under the line of credit.
8). FEDERAL TAX INFORMATION
As of April 30, 2021, the components of accumulated earnings (losses) for income tax purposes were as follows:
| | | Investments | |
| Cost of investments for tax purposes | | $ | 22,099,634 | |
| Gross tax unrealized appreciation | | $ | 11,198,678 | |
| Gross tax unrealized depreciation | | | (23,281 | ) |
| Net tax unrealized appreciation/(depreciation) | | $ | 11,175,397 | |
| | | | | |
| As of April 30, 2021, deferred tax assets consisted of the following: | | | | |
| | | | | |
| Deferred tax assets (liabilities): | | | | |
| Net operating losses | | $ | 433,802 | |
| Capital loss | | | 5,709,188 | |
| Unrealized (gain) loss on investments | | | — | |
| Total deferred tax assets, net | | | 6,142,990 | |
| Valuation allowance | | | (4,041,871 | ) |
| Net | | $ | 2,101,119 | |
For the six months ended April 30, 2021, the Fund had an effective tax rate of 0% and a federal statutory rate of 21%, with the difference resulting from a change in the valuation allowance of the deferred tax assets.
Deferred income tax assets and liabilities are recorded for differences between the financial statement and tax basis of the assets and liabilities that will result in taxable or deductible amounts in the future based on enacted laws and rates applicable to the periods in which the differences are expected to affect taxable income. Valuation allowances are established when necessary to reduce deferred tax assets to the amount expected to be realized. The Fund has evaluated the available evidence supporting the
| HENNESSY FUNDS | 1-800-966-4354 | |
realization of its gross deferred tax assets, including the amount and timing of future taxable income, and has determined that, based on net losses to date, it may not utilize all of its deferred tax assets in the future. As of April 30, 2021, the Fund established a valuation allowance in the amount of $4,041,871 against its deferred tax assets.
The Fund may carry forward any net capital loss five years to offset any future realized capital gains. The Fund may carry forward indefinitely any net operating loss arising in a tax year ending after December 31, 2017. As of April 30, 2021, the Fund had capital loss carryforwards of $25,159,541 that expire as follows:
| | Amount
| | Expiration | |
| | $6,130,957
| | 10/31/2023 | |
| | 8,580,676 | | 10/31/2024 | |
| | 8,314,560 | | 10/31/2025 | |
| | 2,133,348 | | 10/31/2026 | |
As of April 30, 2021, the Fund had $1,844,125 in unlimited net operating loss carryforwards.
Total income taxes have been computed by applying the federal statutory income tax rate of 21% plus a blended state income tax rate. The Fund applied this effective rate to net investment income and realized and unrealized gains on investments before taxes in computing its total income taxes.
| Tax expense (benefit) at statutory rates | | $ | 2,551,858 | |
| State income tax expense, net of federal benefit | | | 201,921 | |
Tax expense (benefit) on permanent items(1) | | | (9,436 | ) |
| Tax expense (benefit) on expired carryforwards | | | 826,960 | |
| Tax expense (benefit) due to change in effective state rates | | | — | |
| Total current tax expense (benefit) | | | — | |
| Change in valuation allowance | | | (3,571,303 | ) |
| Total tax expense | | $ | — | |
(1) Permanent items consist of dividends-received deductions.
The Fund recognizes the tax benefits of uncertain tax positions only where the position is “more likely than not” to be sustained assuming examination by tax authorities. Management has analyzed the Fund’s tax positions in all open tax years and has concluded that no liability for unrecognized tax benefits should be recorded related to uncertain tax positions taken on U.S. federal tax returns and state tax returns filed or expected to be filed. No income tax returns are currently under examination. Generally, the tax returns of the Fund for the prior three fiscal years are open for examination. Due to the nature of the Fund’s investments, the Fund may be required to file income tax returns in several states. The Fund is not aware of any tax positions for which it is reasonably possible that the total amounts of unrecognized tax benefits will change materially.
During fiscal year 2021 (year to date) and fiscal year 2020, the tax character of distributions paid by the Fund was as follows:
| | | Six Months Ended | | | Year Ended | |
| | | April 30, 2021 | | | October 31, 2020 | |
Ordinary income(1) | | $ | — | | | $ | — | |
| Long-term capital gains | | | — | | | | — | |
| Return of capital | | | 2,053,202 | | | | 3,976,946 | |
| Total distributions | | $ | 2,053,202 | | | $ | 3,976,946 | |
(1) Ordinary income includes short-term capital gains.
| NOTES TO THE FINANCIAL STATEMENTS |
9). EVENTS SUBSEQUENT TO PERIOD END
Management has evaluated the Fund’s related events and transactions that occurred subsequent to April 30, 2021, through the date of issuance of the Fund’s financial statements. Other than as disclosed below, management has determined that there were no subsequent events requiring recognition or disclosure in the financial statements.
On June 1, 2021, distributions were declared and paid to shareholders of record on May 28, 2021, as follows:
| | | Return of Capital | |
| | Investor Class | $0.2575 | |
| | Institutional Class | $0.2575 | |
| HENNESSY FUNDS | 1-800-966-4354 | |
Expense Example (Unaudited)
April 30, 2021
As a shareholder of the Fund, you incur ongoing costs, including management fees, service fees, and other Fund expenses. This Example is intended to help you understand your ongoing costs (in dollars) of investing in the Fund and to compare these costs with the ongoing costs of investing in other mutual funds. The Example is based on an investment of $1,000 invested at the beginning of the period and held for the entire period from November 1, 2020, through April 30, 2021.
Actual Expenses
In the table below, the first line under each of the “Investor Class” and “Institutional Class” headings provides information about actual account values and actual expenses for each share class. You may use this information, together with the amount you invested, to estimate the expenses that you paid over the period. Simply divide your account value by $1,000 (for example, an $8,600 account value divided by $1,000 = 8.6), then multiply the result by the number in the first line under the heading entitled “Expenses Paid During Period” to estimate the expenses you paid on your account during this period. Although the Fund charges no sales loads or transaction fees, you will be assessed fees for outgoing wire transfers, returned checks, and stop payment orders at prevailing rates charged by U.S. Bank Global Fund Services, the Fund’s transfer agent. If you request that a redemption be made by wire transfer, the Fund’s transfer agent charges a $15 fee. IRAs are charged a $15 annual maintenance fee (up to $30 maximum per shareholder for shareholders with multiple IRAs). The examples below include, but are not limited to, management, shareholder servicing, accounting, custody, and transfer agent fees. However, the examples below do not include portfolio trading commissions and related expenses.
Hypothetical Example for Comparison Purposes
In the table below, the second line under each of the “Investor Class” and “Institutional Class” headings provides information about hypothetical account values and hypothetical expenses based on the Fund’s actual expense ratio for each share class and an assumed rate of return of 5% per year before expenses, which is not the Fund’s actual return for such share class. The hypothetical account values and expenses may not be used to estimate the actual ending account balance or expenses you paid for the period. You may use this information to compare the ongoing costs of investing in the Fund and other funds. To do so, compare these 5% hypothetical examples with the 5% hypothetical examples that appear in the shareholder reports of the other funds. Please note that the expenses shown in the table are meant to highlight your ongoing costs only. Therefore, the second lines under “Investor Class” and “Institutional Class” headings are useful in comparing ongoing costs only and will not help you determine the relative total costs of owning different funds.
| | Beginning | Ending | |
| | Account Value | Account Value | Expenses Paid |
| | November 1, 2020 | April 30, 2021
| During Period(1) |
| Investor Class | | | |
| Actual | $1,000.00 | $1,552.00 | $11.14 |
| Hypothetical (5% return before expenses) | $1,000.00 | $1,016.07 | $ 8.80 |
| | | | |
| Institutional Class | | | |
| Actual | $1,000.00 | $1,551.70 | $ 9.55 |
| Hypothetical (5% return before expenses) | $1,000.00 | $1,017.31 | $ 7.55 |
(1) | Expenses are equal to the Fund’s annualized expense ratio of 1.76% for Investor Class shares or 1.51% for Institutional Class shares, as applicable, multiplied by the average account value over the period, multiplied by 181/365 days (to reflect the half-year period). |
| HENNESSY FUNDS | 1-800-966-4354 | |
How to Obtain a Copy of the Fund’s Proxy
Voting Policy and Proxy Voting Records
A description of the policies and procedures the Fund uses to determine how to vote proxies relating to portfolio securities is available without charge (1) by calling 1-800-966-4354, (2) on the Hennessy Funds’ website at www.hennessyfunds.com/proxy-voting/voting-policy, or (3) on the U.S. Securities and Exchange Commission’s (the “SEC”) website at www.sec.gov. The Fund’s proxy voting record is available without charge on both the Hennessy Funds’ website at www.hennessyfunds.com/proxy-voting/voting-record and the SEC’s website at www.sec.gov no later than August 31 for the prior 12 months ending June 30.
Availability of Quarterly Portfolio Schedule
The Fund files a complete schedule of portfolio holdings with the SEC for the first and third quarters of each fiscal year as an exhibit to its reports on Form N-PORT. The Fund’s Form N-PORT reports are available on the SEC’s website at www.sec.gov or on request by calling 1-800-966-4354.
Federal Tax Distribution Information (Unaudited)
For fiscal year 2020, certain dividends paid by the Fund may be subject to a maximum tax rate of 23.8%, as provided for by the Jobs and Growth Tax Relief Reconciliation Act of 2003. The percentage of dividends declared from ordinary income designated as qualified dividend income was 0.00%.
For corporate shareholders, the percent of ordinary income distributions that qualified for the corporate dividends received deduction for fiscal year 2020 was 0.00%.
The percentage of taxable ordinary income distributions that were designated as short-term capital gain distributions under Section 871(k)(2)(C) of the Internal Revenue Code of 1986, as amended, for the Fund was 0.00%.
Important Notice Regarding Delivery
of Shareholder Documents
To help keep the Fund’s costs as low as possible, we generally deliver a single copy of notices, shareholder reports, proxy statements, and prospectuses to shareholders who share an address and have the same last name. This process does not apply to account statements. You may request an individual copy of a shareholder document at any time. If you would like to receive separate mailings of shareholder documents, please call U.S. Bank Global Fund Services at 1-800-261-6950 or 1-414-765-4124, and individual delivery will begin within 30 days of your request. If your account is held through a financial institution or other intermediary, please contact such intermediary directly to request individual delivery.
Electronic Delivery
As permitted by SEC regulations, the Fund’s shareholder reports are made available on a website, and unless you sign up for eDelivery or elect to receive paper copies as detailed below, you will be notified by mail each time a report is posted and provided with a website link to access the report.
The Fund also offers shareholders the option to receive all notices, account statements, prospectuses, tax forms, and shareholder reports online. To sign up for eDelivery or change your delivery preference, please visit www.hennessyfunds.com/account.
To elect to receive paper copies of all future reports free of charge, please call U.S. Bank Global Fund Services at 1-800-261-6950 or 1-414-765-4124.
Subscribe to receive our team’s unique market and sector insights delivered to your inbox
www.hennessyfunds.com/subscribe
Follow us on social media
| PROXY VOTING — BOARD APPROVAL OF INVESTMENT ADVISORY AGREEMENTS |
Board Approval of Investment Advisory
Agreements
At its meeting on March 10, 2021, the Board of Trustees of the Fund (the “Board,” and the members thereof, the “Trustees”) unanimously approved the continuation of the investment advisory agreement of the Fund with Hennessy Advisors, Inc. (the “Advisor”) and the sub-advisory agreement for the Fund between the Advisor and BP Capital Fund Advisors, LLC (the “Sub-Advisor”). As part of the process, the Trustees reviewed their fiduciary duties and the relevant factors for them to consider with respect to approving the advisory and sub-advisory agreements. In addition, the Trustees who are not deemed “interested persons” (as defined by the Investment Company Act of 1940, as amended) of the Fund (the “Independent Trustees”) met in executive session to discuss the approval of the advisory and sub-advisory agreements.
In advance of the meeting, the Advisor sent detailed information to the Trustees to assist them in their evaluation of the advisory and sub-advisory agreements. This information included, but was not limited to, the following:
| | (1) | A memorandum from outside legal counsel that described the fiduciary duties of the Board with respect to approving the continuation of the advisory and sub-advisory agreements and the relevant factors for consideration; |
| | | |
| | (2) | A memorandum from the Advisor that listed the factors relevant to the Board’s approval of the continuation of the advisory and sub-advisory agreements and also referenced the documents that had been provided to help the Board assess each such factor; |
| | | |
| | (3) | The Advisor’s financial statements from its most recent Form 10-K and Form 10-Q; |
| | | |
| | (4) | Summaries of the advisory and sub-advisory agreements; |
| | | |
| | (5) | A recent Fund fact sheet, which included performance information over various periods; |
| | | |
| | (6) | An description of the range of services provided by the Advisor and the Sub-Advisor and the distinction between the Advisor-provided services and the Sub-Advisor-provided services; |
| | | |
| | (7) | A peer expense comparison of the net expense ratio and investment advisory fee of the Fund; |
| | | |
| | (8) | A memorandum from the Adviser regarding economies of scale; |
| | | |
| | (9) | A completed questionnaire from the Sub-Advisor; |
| | | |
| | (10) | A summary of the Sub-Advisor’s responses to the questionnaire, as well as relevant information from the Sub-Advisor’s Form ADVs Parts 1 and 2 and the certifications submitted the Sub-Advisor each quarter; |
| | | |
| | (11) | Financial information of the Sub-Advisor; and |
| | | |
| | (12) | The Sub-Advisor’s Code of Ethics. |
All of the factors discussed were considered as a whole by the Trustees and by the Independent Trustees meeting in executive session. The factors were viewed in their totality by the Trustees, with no single factor being the principal or determinative factor in the Trustees’ determination of whether to approve the continuation of the advisory and sub-advisory agreements. The Trustees recognized that the management and fee arrangements for the Fund are the result of years of review and discussion between the Independent Trustees and the Advisor, that certain aspects of such arrangements may
| HENNESSY FUNDS | 1-800-966-4354 | |
receive greater scrutiny in some years than in others, and that the Trustees’ conclusions may be based, in part, on their consideration of these same arrangements and information received during the course of the year and in prior years.
Prior to approving the continuation of the advisory and sub-advisory agreements, the Trustees, including the Independent Trustees in executive session, considered, among other items:
| | (1) | The nature and quality of the advisory services provided by the Advisor and the Sub-Advisor; |
| | | |
| | (2) | A comparison of the fees and expenses of the Fund to other similar funds; |
| | | |
| | (3) | Whether economies of scale are recognized by the Fund; |
| | | |
| | (4) | The costs and profitability of the Fund to the Advisor and the Sub-Advisor; |
| | | |
| | (5) | The performance of the Fund; and |
| | | |
| | (6) | Any benefits to the Advisor and the Sub-Advisor from serving as an investment advisor to the Fund (other than the advisory and sub-advisory fees). |
The material considerations and determinations of the Trustees, including the Independent Trustees, were as follows:
| | (1) | The Trustees considered the services identified below that are provided by the Advisor. Based on this review, the Trustees concluded that the Advisor provides high-quality services to the Fund and noted that their overall confidence in the Advisor was high. The Trustees also concluded that they were satisfied with the nature, extent, and quality of the advisory services provided to the Fund by the Advisor and that the nature and extent of the services provided by the Advisor were appropriate to assure that the Fund’s operations are conducted in compliance with applicable laws, rules, and regulations. |
| | | (a) | The Advisor oversees the Sub-Advisor for the Fund, and the Sub-Advisor acts as the portfolio manager for the Fund by providing portfolio management services. |
| | | | |
| | | (b) | The Advisor performs a daily reconciliation of portfolio positions and cash for the Fund. |
| | | | |
| | | (c) | The Advisor monitors the liquidity of each Fund. |
| | | | |
| | | (d) | The Advisor monitors the Fund’s compliance with its investment objectives and restrictions and federal securities laws. |
| | | | |
| | | (e) | The Advisor maintains a compliance program (including a code of ethics), conducts ongoing reviews of the compliance programs of the Sub-Advisor and the Fund’s other service providers (including their codes of ethics, as appropriate), conducts on-site visits to the Sub-Advisor and the Fund’s other service providers as feasible, monitors incidents of abusive trading practices, reviews Fund expense accruals, payments, and fixed expense ratios, evaluates insurance providers for fidelity bond, D&O/E&O insurance, and cybersecurity insurance coverage, manages regulatory examination compliance and responses, conducts employee compliance training, reviews reports provided by service providers, and maintains books and records. |
| | | | |
| | | (f) | The Advisor oversees the selection and continued employment of the Sub-Advisor, reviews the Fund’s investment performance, and monitors the Sub-Advisor’s adherence to the Fund’s investment objectives, policies, and restrictions. |
| BOARD APPROVAL OF INVESTMENT ADVISORY AGREEMENTS |
| | | (g) | The Advisor oversees service providers that provide accounting, administration, distribution, transfer agency, custodial, sales, marketing, public relations, audit, information technology, and legal services to the Fund. |
| | | | |
| | | (h) | The Advisor maintains in-house marketing and distribution departments on behalf of the Fund. |
| | | | |
| | | (i) | The Advisor prepares or directs the preparation of all regulatory filings for the Fund, including writing and annually updating the Fund’s prospectus and related documents. |
| | | | |
| | | (j) | For each annual report of the Fund, the Advisor reviews the written summary prepared by the Sub-Advisor of the Fund’s performance during the most recent 12-month period. |
| | | | |
| | | (k) | The Advisor oversees distribution of the Fund through third-party broker/dealers and independent financial institutions such as Charles Schwab, Inc., Fidelity, TD Ameritrade, and Pershing. The Advisor compensates, in part, a number of these third-party providers out of its own revenues. |
| | | | |
| | | (l) | The Advisor pays the incentive compensation of the Fund’s compliance officers and employs other staff, such as legal, marketing, national accounts, distribution, sales, administrative, and trading oversight personnel, as well as management executives. |
| | | | |
| | | (m) | The Advisor provides a quarterly compliance certification to the Board. |
| | | | |
| | | (n) | The Advisor prepares or reviews all Board materials, frequently presents to the Board and leads Board discussions, prepares or reviews all meeting minutes, and arranges for Board training and education. |
| | (2) | The Trustees considered the services identified below that are provided by the Sub-Advisor. Based on this review and an assessment of the Sub-Advisor’s performance, the Trustees concluded that the Sub-Advisor provides high-quality services to the Fund. The Trustees also concluded that they were satisfied with the nature, extent, and quality of the advisory services provided to the Fund by the Sub-Advisor and that the nature and extent of the services provided by the Sub-Advisor were appropriate to assure that the Fund’s portfolio aligns properly with its investment objective and principal investment strategies. |
| | | (a) | The Sub-Advisor acts as the portfolio manager for the Fund. In this capacity, the Sub-Advisor does the following: |
| | | | (i) | manages the composition of the Fund’s portfolio, including the purchase, retention, and disposition of portfolio securities in accordance with the Fund’s investment objectives, policies, and restrictions; |
| | | | | |
| | | | (ii) | seeks best execution for the Fund’s portfolio; |
| | | | | |
| | | | (iii) | manages the use of soft dollars for the Fund; and |
| | | | | |
| | | | (iv) | manages proxy voting for the Fund. |
| | | (b) | The Sub-Advisor ensures that its compliance program includes policies and procedures relevant to the Fund and the Sub-Advisor’s duties as a portfolio manager to the Fund. |
| | | (c) | For each annual report of the Fund, the Sub-Advisor prepares a written summary of the Fund’s performance during the most recent 12-month period. |
| HENNESSY FUNDS | 1-800-966-4354 | |
| | | (d) | The Sub-Advisor provides a quarterly compliance certification to the Board regarding trading and allocation practices, supervisory matters, the Sub-Advisor’s compliance program (including its code of ethics), compliance with the Fund’s policies, and general firm updates. |
| | (3) | The Trustees considered the distinction between the services performed by the Advisor and the Sub-Advisor. The Trustees noted that the management of the Fund, including the oversight of the Sub-Advisor, involves more comprehensive and substantive duties than the duties of the Sub-Advisor. Specifically, the Trustees considered the lists of services identified above and concluded that the services performed by the Advisor for the Fund require a higher level of service and oversight than the services performed by the Sub-Advisor. Based on this determination, the Trustees concluded that the differential in advisory fees between the Advisor and the Sub-Advisor is reasonable. |
| | | |
| | (4) | The Trustees compared the performance of the Fund to benchmark indices over various periods and also noted that the Trustees review and discuss reports comparing the investment performance of the Fund to various indices at each quarterly Board meeting. Based on such information, the Trustees determined that the Advisor and the Sub-Advisor manage the Fund in a manner materially consistent with its stated investment objective and style. The Trustees concluded that the performance of the Fund over various periods warranted continuation of the advisory and sub-advisory agreements. |
| | | |
| | (5) | The Trustees reviewed the advisory fees and overall expense ratios of the Fund compared to other funds similar in asset size and investment objective to the Fund using data from Morningstar. As part of the discussion with management, the Trustees ensured that they understood and were comfortable with the criteria used to determine the mutual funds included in the Morningstar categories for purposes of the materials considered at the meeting. The Trustees determined that the advisory fee and overall expense ratio of the Fund falls within the range of the advisory fees and overall expense ratios of other comparable funds and concluded that they are reasonable and warranted continuation of the advisory and sub-advisory agreements. |
| | | |
| | (6) | The Trustees also considered whether the Advisor was realizing economies of scale that it should share with the Fund’s shareholders. The Trustees noted that many of the expenses incurred to manage the Fund are asset-based fees, so the Advisor would not realize material economies of scale relating to those expenses as the assets of the Fund increase. For example, third-party platform fees and sub-advisory fees increase as the Fund’s assets grow. The Trustees also considered the Advisor’s significant marketing efforts to promote the Funds and the Advisor’s agreement to waive fees or lower its management fees in certain circumstances. |
| | | |
| | (7) | The Trustees considered the profitability of the Advisor and the Sub-Advisor, including the impact of mutual fund platform fees on the Advisor’s profitability, and also considered the resources and revenues that the Advisor has put into managing and distributing the Fund. The Trustees then concluded that the profits of the Advisor and the Sub-Advisor are reasonable and not excessive when compared to profitability guidelines set forth in relevant court cases. |
| | | |
| | (8) | The Trustees considered the high level of professionalism and knowledge of the Advisor’s employees, along with a very low level of turnover, and concluded that this was beneficial to the Fund and its shareholders. |
| BOARD APPROVAL OF INVESTMENT ADVISORY AGREEMENTS |
| | (9) | The Trustees considered any benefits to the Advisor and the Sub-Advisor from serving as an advisor to the Fund (other than the advisory and sub-advisory fees). The Trustees noted that the Advisor and the Sub-Advisor may derive ancillary benefits from, by way of example, their association with the Fund in the form of proprietary and third-party research products and services received from broker-dealers that execute portfolio trades for the Fund. The Trustees determined that any such products and services have been used for legitimate purposes relating to the Fund by providing assistance in the investment decision-making process. The Trustees concluded that any additional benefits realized by the Advisor and the Sub-Advisor from their relationship with the Fund were reasonable, which was based on, among other things, the Trustees’ findings that (i) the research, analytical, statistical, and other information and services provided by brokers are merely supplemental to the Advisor’s and the Sub-Advisor’s own efforts in the performance of their duties under the advisory and sub-advisory agreements and (ii) although the Sub-Advisor could derive benefits from the conversion of Fund shareholders into separate account clients, the Fund also could benefit from potential institutional shareholders who might choose to invest in the Fund. |
After reviewing the materials and information provided at the meeting, as well as other information regularly provided at the Board’s quarterly meetings throughout the year regarding the quality of services provided by the Advisor and the Sub-Advisor, the performance of the Fund, expense information, brokerage commissions information, the adequacy and efficacy of the Advisor’s and the Sub-Advisor’s written policies and procedures, other regulatory compliance issues, trading information and related matters, and other factors that the Trustees deemed relevant, the Trustees, including the Independent Trustees, approved the continuation of the advisory and sub-advisory agreements.
| HENNESSY FUNDS | 1-800-966-4354 | |
For information, questions, or assistance, please call
The Hennessy Funds
1-800-966-4354 or 1-415-899-1555
INVESTMENT ADVISOR
Hennessy Advisors, Inc.
7250 Redwood Boulevard, Suite 200
Novato, California 94945
ADMINISTRATOR,
TRANSFER AGENT,
DIVIDEND PAYING AGENT, &
SHAREHOLDER SERVICING AGENT
U.S. Bancorp Fund Services, LLC
d/b/a U.S. Bank Global Fund Services
P.O. Box 701
Milwaukee, Wisconsin 53201-0701
CUSTODIAN
U.S. Bank N.A.
Custody Operations
1555 North River Center Drive, Suite 302
Milwaukee, Wisconsin 53212
TRUSTEES
Neil J. Hennessy
Robert T. Doyle
J. Dennis DeSousa
Gerald P. Richardson
COUNSEL
Foley & Lardner LLP
777 East Wisconsin Avenue
Milwaukee, Wisconsin 53202-5306
INDEPENDENT REGISTERED
PUBLIC ACCOUNTING FIRM
Tait, Weller & Baker LLP
Two Liberty Place
50 South 16th Street, Suite 2900
Philadelphia, Pennsylvania 19102-2529
DISTRIBUTOR
Quasar Distributors, LLC
111 East Kilbourn Avenue, Suite 2200
Milwaukee, Wisconsin 53202
www.hennessyfunds.com | 1-800-966-4354
This report has been prepared for shareholders and may be distributed to
others only if preceded or accompanied by a current prospectus.
SEMI-ANNUAL REPORT
APRIL 30, 2021
HENNESSY GAS UTILITY FUND
Investor Class GASFX
Institutional Class HGASX
www.hennessyfunds.com | 1-800-966-4354
(This Page Intentionally Left Blank.)
Contents
| Letter to Shareholders | 2 |
| Performance Overview | 4 |
| Financial Statements | |
| Schedule of Investments | 5 |
| Statement of Assets and Liabilities | 9 |
| Statement of Operations | 10 |
| Statements of Changes in Net Assets | 11 |
| Financial Highlights | 12 |
| Notes to the Financial Statements | 16 |
| Expense Example | 23 |
| Proxy Voting Policy and Proxy Voting Records | 25 |
| Availability of Quarterly Portfolio Schedule | 25 |
| Federal Tax Distribution Information | 25 |
| Important Notice Regarding Delivery of Shareholder Documents | 25 |
| Electronic Delivery | 25 |
| Board Approval of Investment Advisory Agreement | 26 |
| HENNESSY FUNDS | 1-800-966-4354 | |
May 2021
Dear Hennessy Funds Shareholder:
I can hardly believe that we have been navigating through one of the worst pandemics in modern history for more than a year. From the start, our thoughts have been with those affected by COVID-19 and with our frontline healthcare and essential workers. We are encouraged by the rapid rollout of vaccines and the continued reopening of the economy, and we hope this signals a turning point.
This is the first time in over 20 years in this business that I have witnessed volatility as extreme as the volatility that has rocked the financial markets and the economy over the past year. Both the pace of change and the magnitude of change have been staggering. As I reflect on this, I am reminded of a scientific concept called “punctuated equilibrium.” Biologist Stephen Jay Gould revolutionized evolutionary thinking with this theory, which challenged the prevailing belief that biological change happens slowly, consistently, and methodically over time. His theory instead proposed that change happens abruptly and dramatically and that new species pop up and others vanish rapidly, sometimes caused by catastrophic events. In between these explosive periods are much longer intervals of relative stability.
The dramatic market downdraft brought on by the pandemic, followed by the equally dramatic recovery, have been jarring. We witnessed an explosion of IPOs, a plethora of bankruptcies, and a dramatic change in market leadership. Yet unlike in the biological world, we are able to respond to stock market crises and try to dampen their negative impact. There have been numerous and unprecedented fiscal and monetary responses from the Federal Reserve and the U.S. government, and in many ways these measures may have spurred the economic recovery.
For the first six months of our fiscal year through April 30, 2021, the market appeared to be on a relentless march higher, with the S&P 500® Index rising 28.85% on a total return basis, setting new all-time highs 35 times in 124 trading days and closing at its then-highest level ever on April 29, 2021. We saw a dramatic shift back toward value investing, and many of the sectors and individual stocks that had underperformed for most of last year soared. Value outperformed growth, small-caps beat mid-caps, and mid-caps beat large-caps. The Energy and Financials sectors skyrocketed, as evidenced by the S&P 500® Energy Index’s total return of 75.94% and the Russell 1000® Index Financials’ total return of 52.00% during the six-month period. As we begin to move beyond the chaos caused by the pandemic, solid market fundamentals are reappearing, which we believe underscores the health and strength of our economy.
We are pleased with the performance of our mutual funds during the first half of our fiscal year. On an absolute basis, each of our 16 Funds achieved positive performance, and 11 of our 16 funds outperformed their primary benchmark. Ten of our 11 domestic equity-only Funds outperformed the S&P 500® Index, and three of our sector Funds posted total returns of over 50%, due primarily to their focus on the Energy and Financials sectors. We believe this was a favorable period for both our style of high-conviction investing as well as the areas and sectors of the market in which our Funds focus. While performance may wax and wane over a complete market cycle, we remain committed to managing our portfolios for long-term performance, ever mindful of downside risk.
Circling back to Gould’s theory of punctuated equilibrium, we are left with the question, “Where do we go from here?” Are we entering a more stable period in the economy and the market, similar to the periods of relative stasis in the geological record? We are optimistic that this may in fact be the case and that the markets will return to a less volatile part of the cycle. But, with history as our guide, we know that even the greatest bull markets have experienced corrections along the way. While certain individual stock or sector valuations might look stretched, we believe the market as a whole has more room to run. Strong GDP growth and increasing earnings expectations for this year, a potentially lower-for-longer interest rate environment, accommodative fiscal and monetary policies, a healthy and robust financial system, low unemployment and solid wage growth, and a measured reopening of certain parts of the economy all support the market moving higher from here.
We remain committed to our shareholders as we thoughtfully navigate these unprecedented times. We know that you have a multitude of investment options to choose from, and we are grateful for the trust you put in us and your continued interest and investment in our family of Funds. Should you have any questions or would like to speak with us, please don’t hesitate to call us directly at (800) 966-4354.
Best regards,
| |
| |
| |
| |
|
| Ryan C. Kelley |
| Chief Investment Officer |
Past performance does not guarantee future results. To obtain current standardized performance for the Hennessy Funds, visit https://www.hennessyfunds.com/funds/price-performance.
Mutual fund investing involves risk. Principal loss is possible.
Opinions expressed are those of Ryan C. Kelley and are subject to change, are not guaranteed, and should not be considered investment advice.
The S&P 500® Index is a capitalization-weighted index that is designed to represent the broad domestic economy through changes in aggregate market value of 500 stocks across all major industries. The S&P 500® Energy Index comprises those companies included in the S&P 500® Index that are classified in the Energy sector. The Russell 1000® Index Financials is a subset of the Russell 1000® Index that measures the performance of securities classified in the Financials sector of the large-capitalization U.S. equity market. The indices are used herein for comparative purposes in accordance with SEC regulations. One cannot invest directly in an index. All returns are shown on a total return basis.
| HENNESSY FUNDS | 1-800-966-4354 | |
Performance Overview (Unaudited)
AVERAGE ANNUAL TOTAL RETURN FOR PERIODS ENDED APRIL 30, 2021
| | Six | One | Five | Ten |
| | Months(1) | Year
| Years
| Years
|
| Hennessy Gas Utility Fund – | | | | |
| Investor Class (GASFX) | 18.93% | 19.02% | 6.29% | 8.72% |
| Hennessy Gas Utility Fund – | | | | |
Institutional Class (HGASX)(2) | 19.15% | 19.44% | 6.59% | 8.87% |
| AGA Stock Index | 19.78% | 20.75% | 7.61% | 9.75% |
S&P 500® Index | 28.85% | 45.98% | 17.42% | 14.17% |
Expense ratios: 1.02% (Investor Class); 0.70% (Institutional Class)
(1) | Periods of less than one year are not annualized. |
(2) | The inception date of Institutional Class shares is March 1, 2017. Performance shown prior to the inception of Institutional Class shares reflects the performance of Investor Class shares and includes expenses that are not applicable to, and are higher than, those of Institutional Class shares. |
_______________
Performance data quoted represents past performance; past performance does not guarantee future results. The investment return and principal value of an investment will fluctuate so that an investor’s shares, when redeemed, may be worth more or less than their original cost. The performance table does not reflect the deduction of taxes that a shareholder would pay on Fund distributions or the redemption of Fund shares. Current performance of the Fund may be lower or higher than the performance quoted. Performance data current to the most recent month end may be obtained by visiting www.hennessyfunds.com. Performance for periods including or prior to October 26, 2012, is that of the FBR Gas Utility Index Fund.
The AGA Stock Index is a capitalization-weighted index, consisting of publicly traded members of the American Gas Association. The S&P 500® Index is a capitalization-weighted index that is designed to represent the broad domestic economy through changes in the aggregate market value of 500 stocks across all major industries. One cannot invest directly in an index. These indices are used herein for comparative purposes in accordance with Securities and Exchange Commission regulations.
Standard & Poor’s Financial Services is the source and owner of the S&P® and S&P 500® trademarks.
The expense ratios presented are from the most recent prospectus. The expense ratios for the current reporting period are available in the Financial Highlights section of this report.
| PERFORMANCE OVERVIEW/SCHEDULE OF INVESTMENTS |
Financial Statements
Schedule of Investments as of April 30, 2021 (Unaudited) |
HENNESSY GAS UTILITY FUND
(% of Net Assets)
| TOP TEN HOLDINGS (EXCLUDING MONEY MARKET FUNDS) | % NET ASSETS |
| Cheniere Energy, Inc. | 5.14% |
| The Southern Co. | 5.09% |
| Atmos Energy Corp. | 5.05% |
| National Grid PLC – ADR | 5.05% |
| Enbridge, Inc. | 5.04% |
| Dominion Energy, Inc. | 5.01% |
| Sempra Energy | 4.99% |
| Berkshire Hathaway, Inc., Class A | 4.97% |
| WEC Energy Group, Inc. | 4.96% |
| Kinder Morgan, Inc. | 4.88% |
Note: For presentation purposes, the Fund has grouped some of the industry categories. For purposes of categorizing securities for compliance with Section 8(b)(1) of the Investment Company Act of 1940, as amended, the Fund uses more specific industry classifications.
The Global Industry Classification Standard (GICS®) was developed by and is the exclusive property and a service mark of MSCI, Inc. and Standard & Poor’s Financial Services LLC. It has been licensed for use by the Hennessy Funds.
| HENNESSY FUNDS | 1-800-966-4354 | |
| COMMON STOCKS – 99.31% | | Number | | | | | | % of | |
| | | of Shares | | | Value | | | Net Assets | |
| Energy – 15.42% | | | | | | | | | |
| Cheniere Energy, Inc. (a) | | | 363,617 | | | $ | 28,187,590 | | | | 5.14 | % |
| Enbridge, Inc. (b) | | | 715,365 | | | | 27,591,628 | | | | 5.04 | % |
| Kinder Morgan, Inc. | | | 1,569,101 | | | | 26,753,172 | | | | 4.88 | % |
| Tellurian, Inc. (a) | | | 881,690 | | | | 1,952,943 | | | | 0.36 | % |
| | | | | | | | 84,485,333 | | | | 15.42 | % |
| | | | | | | | | | | | | |
| Financials – 4.97% | | | | | | | | | | | | |
| Berkshire Hathaway, Inc., Class A (a) | | | 66 | | | | 27,225,000 | | | | 4.97 | % |
| | | | | | | | | | | | | |
| Utilities – 78.92% | | | | | | | | | | | | |
| Algonquin Power & Utilities Corp. (b) | | | 194,864 | | | | 3,145,105 | | | | 0.57 | % |
| ALLETE, Inc. | | | 525 | | | | 36,939 | | | | 0.01 | % |
| Ameren Corp. | | | 62,840 | | | | 5,331,346 | | | | 0.97 | % |
| Atmos Energy Corp. | | | 267,286 | | | | 27,688,157 | | | | 5.05 | % |
| Avangrid, Inc. | | | 112,200 | | | | 5,710,980 | | | | 1.04 | % |
| Avista Corp. | | | 35,972 | | | | 1,655,431 | | | | 0.30 | % |
| Black Hills Corp. | | | 88,847 | | | | 6,128,666 | | | | 1.12 | % |
| CenterPoint Energy, Inc. | | | 524,028 | | | | 12,833,446 | | | | 2.34 | % |
| Chesapeake Utilities Corp. | | | 32,058 | | | | 3,799,514 | | | | 0.69 | % |
| CMS Energy Corp. | | | 245,098 | | | | 15,781,860 | | | | 2.88 | % |
| Consolidated Edison, Inc. | | | 182,636 | | | | 14,137,853 | | | | 2.58 | % |
| Corning Natural Gas Holding Corp. | | | 6,099 | | | | 144,028 | | | | 0.03 | % |
| Dominion Energy, Inc. | | | 343,477 | | | | 27,443,812 | | | | 5.01 | % |
| DTE Energy Co. | | | 119,704 | | | | 16,760,954 | | | | 3.06 | % |
| Duke Energy Corp. | | | 176,487 | | | | 17,770,476 | | | | 3.24 | % |
| Entergy Corp. | | | 4,960 | | | | 542,078 | | | | 0.10 | % |
| Essential Utilities, Inc. | | | 250,000 | | | | 11,782,500 | | | | 2.15 | % |
| Eversource Energy | | | 63,675 | | | | 5,490,059 | | | | 1.00 | % |
| Exelon Corp. | | | 149,231 | | | | 6,706,441 | | | | 1.22 | % |
| Fortis, Inc. (b) | | | 196,676 | | | | 8,771,750 | | | | 1.60 | % |
| MDU Resources Group, Inc. | | | 225,807 | | | | 7,555,502 | | | | 1.38 | % |
| MGE Energy, Inc. | | | 19,329 | | | | 1,446,003 | | | | 0.26 | % |
| National Fuel Gas Co. | | | 142,824 | | | | 7,092,640 | | | | 1.29 | % |
| National Grid PLC – ADR (b) | | | 439,544 | | | | 27,682,481 | | | | 5.05 | % |
| New Jersey Resources Corp. | | | 191,134 | | | | 8,018,071 | | | | 1.46 | % |
| NiSource, Inc. | | | 636,181 | | | | 16,553,430 | | | | 3.02 | % |
The accompanying notes are an integral part of these financial statements.
| COMMON STOCKS | | Number | | | | | | % of | |
| | | of Shares | | | Value | | | Net Assets | |
| Utilities (Continued) | | | | | | | | | |
| Northwest Natural Holding Co. | | | 76,903 | | | $ | 4,146,610 | | | | 0.76 | % |
| NorthWestern Corp. | | | 27,098 | | | | 1,843,477 | | | | 0.34 | % |
| ONE Gas, Inc. | | | 137,875 | | | | 11,094,801 | | | | 2.03 | % |
| PG&E Corp. (a) | | | 1,323,649 | | | | 14,983,707 | | | | 2.74 | % |
| PPL Corp. | | | 61,719 | | | | 1,797,874 | | | | 0.33 | % |
| Public Service Enterprise Group, Inc. | | | 239,990 | | | | 15,157,768 | | | | 2.77 | % |
| RGC Resources, Inc. | | | 22,254 | | | | 482,689 | | | | 0.09 | % |
| Sempra Energy | | | 198,740 | | | | 27,340,662 | | | | 4.99 | % |
| South Jersey Industries, Inc. | | | 231,771 | | | | 5,736,332 | | | | 1.05 | % |
| Southwest Gas Holdings, Inc. | | | 124,517 | | | | 8,681,325 | | | | 1.58 | % |
| Spire, Inc. | | | 91,591 | | | | 6,900,466 | | | | 1.26 | % |
| The Southern Co. | | | 421,600 | | | | 27,897,272 | | | | 5.09 | % |
| UGI Corp. | | | 141,952 | | | | 6,204,722 | | | | 1.13 | % |
| Unitil Corp. | | | 23,498 | | | | 1,354,190 | | | | 0.25 | % |
| WEC Energy Group, Inc. | | | 279,540 | | | | 27,162,902 | | | | 4.96 | % |
| Xcel Energy, Inc. | | | 163,499 | | | | 11,657,479 | | | | 2.13 | % |
| | | | | | | | 432,451,798 | | | | 78.92 | % |
| | | | | | | | | | | | | |
| Total Common Stocks | | | | | | | | | | | | |
| (Cost $270,763,043) | | | | | | | 544,162,131 | | | | 99.31 | % |
| | | | | | | | | | | | | |
| PARTNERSHIPS – 0.52% | | | | | | | | | | | | |
| | | | | | | | | | | | | |
| Energy – 0.52% | | | | | | | | | | | | |
| Plains GP Holdings LP, Class A | | | 299,255 | | | | 2,807,012 | | | | 0.52 | % |
| | | | | | | | | | | | | |
| Total Partnerships | | | | | | | | | | | | |
| (Cost $5,052,747) | | | | | | | 2,807,012 | | | | 0.52 | % |
The accompanying notes are an integral part of these financial statements.
| HENNESSY FUNDS | 1-800-966-4354 | |
| SHORT-TERM INVESTMENTS – 0.20% | | Number | | | | | | % of | |
| | | of Shares | | | Value | | | Net Assets | |
| Money Market Funds – 0.20% | | | | | | | | | |
| First American Government Obligations Fund, | | | | | | | | | |
| Institutional Class, 0.03% (c) | | | 1,110,017 | | | $ | 1,110,017 | | | | 0.20 | % |
| | | | | | | | | | | | | |
| Total Short-Term Investments | | | | | | | | | | | | |
| (Cost $1,110,017) | | | | | | | 1,110,017 | | | | 0.20 | % |
| | | | | | | | | | | | | |
| Total Investments | | | | | | | | | | | | |
| (Cost $276,925,807) – 100.03% | | | | | | | 548,079,160 | | | | 100.03 | % |
| Liabilities in Excess of Other Assets – (0.03)% | | | | | | | (146,041 | ) | | | (0.03 | )% |
| | | | | | | | | | | | | |
TOTAL NET ASSETS – 100.00% | | | | | | $ | 547,933,119 | | | | 100.00 | % |
Percentages are stated as a percent of net assets.
ADR – American Depositary Receipt
PLC – Public Limited Company
| (a) | Non-income-producing security. |
| (b) | U.S.-traded security of a foreign corporation. |
| (c) | The rate listed is the fund’s seven-day yield as of April 30, 2021. |
Summary of Fair Value Exposure as of April 30, 2021
The following is a summary of the inputs used to value the Fund’s net assets as of April 30, 2021 (see Note 3 in the accompanying Notes to the Financial Statements):
| Common Stocks | | Level 1 | | | Level 2 | | | Level 3 | | | Total | |
| Energy | | $ | 84,485,333 | | | $ | — | | | $ | — | | | $ | 84,485,333 | |
| Financials | | | 27,225,000 | | | | — | | | | — | | | | 27,225,000 | |
| Utilities | | | 432,307,770 | | | | 144,028 | | | | — | | | | 432,451,798 | |
| Total Common Stocks | | $ | 544,018,103 | | | $ | 144,028 | | | $ | — | | | $ | 544,162,131 | |
| Partnerships | | | | | | | | | | | | | | | | |
| Energy | | $ | 2,807,012 | | | $ | — | | | $ | — | | | $ | 2,807,012 | |
| Total Partnerships | | $ | 2,807,012 | | | $ | — | | | $ | — | | | $ | 2,807,012 | |
| Short-Term Investments | | | | | | | | | | | | | | | | |
| Money Market Funds | | $ | 1,110,017 | | | $ | — | | | $ | — | | | $ | 1,110,017 | |
| Total Short-Term Investments | | $ | 1,110,017 | | | $ | — | | | $ | — | | | $ | 1,110,017 | |
| Total Investments | | $ | 547,935,132 | | | $ | 144,028 | | | $ | — | | | $ | 548,079,160 | |
The accompanying notes are an integral part of these financial statements.
| SCHEDULE OF INVESTMENTS/STATEMENT OF ASSETS AND LIABILITIES |
Financial Statements
Statement of Assets and Liabilities as of April 30, 2021 (Unaudited) |
| ASSETS: | | | |
| Investments in securities, at value (cost $276,925,807) | | $ | 548,079,160 | |
| Dividends and interest receivable | | | 604,760 | |
| Receivable for fund shares sold | | | 34,501 | |
| Return of capital receivable | | | 53,866 | |
| Prepaid expenses and other assets | | | 34,432 | |
| Total assets | | | 548,806,719 | |
| | | | | |
| LIABILITIES: | | | | |
| Payable for fund shares redeemed | | | 234,793 | |
| Payable to advisor | | | 177,390 | |
| Payable to sub-transfer agents | | | 174,308 | |
| Payable to administrator | | | 99,074 | |
| Payable to auditor | | | 11,227 | |
| Accrued distribution fees | | | 95,989 | |
| Accrued service fees | | | 39,648 | |
| Accrued trustees fees | | | 3,668 | |
| Accrued expenses and other payables | | | 37,503 | |
| Total liabilities | | | 873,600 | |
| NET ASSETS | | $ | 547,933,119 | |
| | | | | |
| NET ASSETS CONSISTS OF: | | | | |
| Capital stock | | $ | 280,625,870 | |
| Total distributable earnings | | | 267,307,249 | |
| Total net assets | | $ | 547,933,119 | |
| | | | | |
| NET ASSETS: | | | | |
| Investor Class | | | | |
| Shares authorized (no par value) | | Unlimited | |
| Net assets applicable to outstanding shares | | $ | 489,823,448 | |
| Shares issued and outstanding | | | 18,716,230 | |
| Net asset value, offering price, and redemption price per share | | $ | 26.17 | |
| | | | | |
| Institutional Class | | | | |
| Shares authorized (no par value) | | Unlimited | |
| Net assets applicable to outstanding shares | | $ | 58,109,671 | |
| Shares issued and outstanding | | | 2,226,653 | |
| Net asset value, offering price, and redemption price per share | | $ | 26.10 | |
The accompanying notes are an integral part of these financial statements.
| HENNESSY FUNDS | 1-800-966-4354 | |
Financial Statements
Statement of Operations for the six months ended April 30, 2021 (Unaudited) |
| INVESTMENT INCOME: | | | |
Dividend income(1) | | $ | 8,331,079 | |
| Interest income | | | 505 | |
| Total investment income | | | 8,331,584 | |
| | | | | |
| EXPENSES: | | | | |
| Investment advisory fees (See Note 5) | | | 1,067,980 | |
| Sub-transfer agent expenses – Investor Class (See Note 5) | | | 394,435 | |
| Sub-transfer agent expenses – Institutional Class (See Note 5) | | | 29,035 | |
| Distribution fees – Investor Class (See Note 5) | | | 356,362 | |
| Administration, accounting, custody, and transfer agent fees (See Note 5) | | | 299,840 | |
| Service fees – Investor Class (See Note 5) | | | 237,575 | |
| Reports to shareholders | | | 26,903 | |
| Federal and state registration fees | | | 20,624 | |
| Compliance expense (See Note 5) | | | 13,844 | |
| Audit fees | | | 11,227 | |
| Trustees’ fees and expenses | | | 10,958 | |
| Legal fees | | | 4,726 | |
| Interest expense (See Note 7) | | | 4,105 | |
| Other expenses | | | 144,446 | |
| Total expenses | | | 2,622,060 | |
| NET INVESTMENT INCOME | | $ | 5,709,524 | |
| | | | | |
| REALIZED AND UNREALIZED GAINS (LOSSES): | | | | |
| Net realized gain on investments | | $ | 49,769,211 | |
| Net change in unrealized appreciation/depreciation on investments | | | 38,212,301 | |
| Net gain on investments | | | 87,981,512 | |
| NET INCREASE IN NET ASSETS RESULTING FROM OPERATIONS | | $ | 93,691,036 | |
(1) | Net of foreign taxes withheld and issuance fees of $264,601. |
The accompanying notes are an integral part of these financial statements.
| STATEMENT OF OPERATIONS/STATEMENTS OF CHANGES IN NET ASSETS |
Financial Statements
| Statements of Changes in Net Assets |
| | | Six Months Ended | | | | |
| | | April 30, 2021 | | | Year Ended | |
| | | (Unaudited) | | | October 31, 2020 | |
| OPERATIONS: | | | | | | |
| Net investment income | | $ | 5,709,524 | | | $ | 15,702,984 | |
| Net realized gain on investments | | | 49,769,211 | | | | 54,725,195 | |
| Net change in unrealized | | | | | | | | |
| appreciation/depreciation on investments | | | 38,212,301 | | | | (171,354,296 | ) |
| Net increase (decrease) in net | | | | | | | | |
| assets resulting from operations | | | 93,691,036 | | | | (100,926,117 | ) |
| | | | | | | | | |
| DISTRIBUTIONS TO SHAREHOLDERS: | | | | | | | | |
| Distributable earnings – Investor Class | | | (43,449,477 | ) | | | (49,160,002 | ) |
| Distributable earnings – Institutional Class | | | (5,749,334 | ) | | | (7,345,698 | ) |
| Total distributions | | | (49,198,811 | ) | | | (56,505,700 | ) |
| | | | | | | | | |
| CAPITAL SHARE TRANSACTIONS: | | | | | | | | |
| Proceeds from shares subscribed – Investor Class | | | 6,017,798 | | | | 14,476,846 | |
| Proceeds from shares subscribed – Institutional Class | | | 3,551,104 | | | | 14,135,940 | |
| Dividends reinvested – Investor Class | | | 41,230,437 | | | | 46,815,183 | |
| Dividends reinvested – Institutional Class | | | 5,210,951 | | | | 6,501,998 | |
| Cost of shares redeemed – Investor Class | | | (80,710,553 | ) | | | (204,352,983 | ) |
| Cost of shares redeemed – Institutional Class | | | (21,883,082 | ) | | | (41,410,617 | ) |
| Net decrease in net assets derived | | | | | | | | |
| from capital share transactions | | | (46,583,345 | ) | | | (163,833,633 | ) |
| TOTAL DECREASE IN NET ASSETS | | | (2,091,120 | ) | | | (321,265,450 | ) |
| | | | | | | | | |
| NET ASSETS: | | | | | | | | |
| Beginning of period | | | 550,024,239 | | | | 871,289,689 | |
| End of period | | $ | 547,933,119 | | | $ | 550,024,239 | |
| | | | | | | | | |
| CHANGES IN SHARES OUTSTANDING: | | | | | | | | |
| Shares sold – Investor Class | | | 248,895 | | | | 561,691 | |
| Shares sold – Institutional Class | | | 146,134 | | | | 539,370 | |
| Shares issued to holders as reinvestment | | | | | | | | |
| of dividends – Investor Class | | | 1,729,882 | | | | 1,761,437 | |
| Shares issued to holders as reinvestment | | | | | | | | |
| of dividends – Institutional Class | | | 219,222 | | | | 245,860 | |
| Shares redeemed – Investor Class | | | (3,344,058 | ) | | | (8,021,029 | ) |
| Shares redeemed – Institutional Class | | | (906,325 | ) | | | (1,643,216 | ) |
| Net decrease in shares outstanding | | | (1,906,250 | ) | | | (6,555,887 | ) |
The accompanying notes are an integral part of these financial statements.
| HENNESSY FUNDS | 1-800-966-4354 | |
Financial Statements
For an Investor Class share outstanding throughout each period
| | | Six Months Ended | |
| | | April 30, 2021 | |
| | | (Unaudited) | |
| PER SHARE DATA: | | | |
| Net asset value, beginning of period | | $ | 24.08 | |
| | | | | |
| Income from investment operations: | | | | |
| Net investment income | | | 0.26 | (1) |
| Net realized and unrealized gains (losses) on investments | | | 4.06 | |
| Total from investment operations | | | 4.32 | |
| | | | | |
| Less distributions: | | | | |
| Dividends from net investment income | | | (0.29 | ) |
| Dividends from net realized gains | | | (1.94 | ) |
| Total distributions | | | (2.23 | ) |
| Net asset value, end of period | | $ | 26.17 | |
| | | | | |
| TOTAL RETURN | | | 18.93 | %(2) |
| | | | | |
| SUPPLEMENTAL DATA AND RATIOS: | | | | |
| Net assets, end of period (millions) | | $ | 489.82 | |
| Ratio of expenses to average net assets | | | 1.02 | %(3) |
| Ratio of net investment income to average net assets | | | 2.10 | %(3) |
Portfolio turnover rate(4) | | | 10 | %(2) |
(1) | Calculated using the average shares outstanding method. |
(2) | Not annualized. |
(3) | Annualized. |
(4) | Calculated on the basis of the Fund as a whole. |
The accompanying notes are an integral part of these financial statements.
| FINANCIAL HIGHLIGHTS — INVESTOR CLASS |
| Year Ended October 31, | |
| 2020 | | | 2019 | | | 2018 | | | 2017 | | | 2016 | |
| | | | | | | | | | | | | | |
| $ | 29.64 | | | $ | 28.68 | | | $ | 30.35 | | | $ | 28.57 | | | $ | 27.69 | |
| | | | | | | | | | | | | | | | | | | |
| | | | | | | | | | | | | | | | | | | |
| | 0.58 | (1) | | | 0.56 | (1) | | | 0.65 | | | | 0.70 | | | | 0.62 | |
| | (4.14 | ) | | | 3.50 | | | | (1.52 | ) | | | 2.20 | | | | 1.58 | |
| | (3.56 | ) | | | 4.06 | | | | (0.87 | ) | | | 2.90 | | | | 2.20 | |
| | | | | | | | | | | | | | | | | | | |
| | | | | | | | | | | | | | | | | | | |
| | (0.56 | ) | | | (0.62 | ) | | | (0.64 | ) | | | (0.72 | ) | | | (0.69 | ) |
| | (1.44 | ) | | | (2.48 | ) | | | (0.16 | ) | | | (0.40 | ) | | | (0.63 | ) |
| | (2.00 | ) | | | (3.10 | ) | | | (0.80 | ) | | | (1.12 | ) | | | (1.32 | ) |
| $ | 24.08 | | | $ | 29.64 | | | $ | 28.68 | | | $ | 30.35 | | | $ | 28.57 | |
| | | | | | | | | | | | | | | | | | | |
| | -12.49 | % | | | 15.28 | % | | | -2.86 | % | | | 10.39 | % | | | 8.52 | % |
| | | | | | | | | | | | | | | | | | | |
| | | | | | | | | | | | | | | | | | | |
| $ | 483.56 | | | $ | 764.10 | | | $ | 825.18 | | | $ | 1,306.70 | | | $ | 1,454.93 | |
| | 1.02 | % | | | 1.00 | % | | | 1.01 | % | | | 1.01 | % | | | 1.01 | % |
| | 2.24 | % | | | 1.98 | % | | | 2.18 | % | | | 2.34 | % | | | 2.25 | % |
| | 16 | % | | | 12 | % | | | 14 | % | | | 18 | % | | | 38 | % |
The accompanying notes are an integral part of these financial statements.
| HENNESSY FUNDS | 1-800-966-4354 | |
Financial Statements
For an Institutional Class share outstanding throughout each period
| | | Six Months Ended | |
| | | April 30, 2021 | |
| | | (Unaudited) | |
| PER SHARE DATA: | | | |
| Net asset value, beginning of period | | $ | 24.01 | |
| | | | | |
| Income from investment operations: | | | | |
| Net investment income | | | 0.30 | (2) |
| Net realized and unrealized gains (losses) on investments | | | 4.05 | |
| Total from investment operations | | | 4.35 | |
| | | | | |
| Less distributions: | | | | |
| Dividends from net investment income | | | (0.33 | ) |
| Dividends from net realized gains | | | (1.93 | ) |
| Total distributions | | | (2.26 | ) |
| Net asset value, end of period | | $ | 26.10 | |
| | | | | |
| TOTAL RETURN | | | 19.15 | %(4) |
| | | | | |
| SUPPLEMENTAL DATA AND RATIOS: | | | | |
| Net assets, end of period (millions) | | $ | 58.11 | |
| Ratio of expenses to average net assets | | | 0.70 | %(5) |
| Ratio of net investment income to average net assets | | | 2.46 | %(5) |
Portfolio turnover rate(6) | | | 10 | %(4) |
(1) | Institutional Class shares commenced operations on March 1, 2017. |
(2) | Calculated using the average shares outstanding method. |
(3) | Actual return from inception date of March 1, 2017, to the year end of October 31, 2017. |
(4) | Not annualized. |
(5) | Annualized. |
(6) | Calculated on the basis of the Fund as a whole. |
The accompanying notes are an integral part of these financial statements.
| FINANCIAL HIGHLIGHTS — INSTITUTIONAL CLASS |
| Year Ended October 31, | | | Period Ended | |
| | | October 31, | |
| 2020 | | | 2019 | | | 2018 | | | 2017(1) | |
| | | | | | | | | | | |
| $ | 29.56 | | | $ | 28.65 | | | $ | 30.32 | | | $ | 29.68 | |
| | | | | | | | | | | | | | | |
| | | | | | | | | | | | | | | |
| | 0.66 | (2) | | | 0.64 | (2) | | | 0.71 | | | | 0.62 | |
| | (4.13 | ) | | | 3.50 | | | | (1.47 | ) | | | 0.72 | |
| | (3.47 | ) | | | 4.14 | | | | (0.76 | ) | | | 1.34 | |
| | | | | | | | | | | | | | | |
| | | | | | | | | | | | | | | |
| | (0.64 | ) | | | (0.73 | ) | | | (0.75 | ) | | | (0.70 | ) |
| | (1.44 | ) | | | (2.50 | ) | | | (0.16 | ) | | | — | |
| | (2.08 | ) | | | (3.23 | ) | | | (0.91 | ) | | | (0.70 | ) |
| $ | 24.01 | | | $ | 29.56 | | | $ | 28.65 | | | $ | 30.32 | |
| | | | | | | | | | | | | | | |
| | -12.22 | % | | | 15.63 | % | | | -2.51 | % | | | 4.56 | %(3)(4) |
| | | | | | | | | | | | | | | |
| | | | | | | | | | | | | | | |
| $ | 66.46 | | | $ | 107.18 | | | $ | 107.75 | | | $ | 84.62 | |
| | 0.70 | % | | | 0.69 | % | | | 0.65 | % | | | 0.64 | %(5) |
| | 2.57 | % | | | 2.25 | % | | | 2.47 | % | | | 1.23 | %(5) |
| | 16 | % | | | 12 | % | | | 14 | % | | | 18 | %(4) |
The accompanying notes are an integral part of these financial statements.
| HENNESSY FUNDS | 1-800-966-4354 | |
Financial Statements
Notes to the Financial Statements April 30, 2021 (Unaudited) |
1). ORGANIZATION
The Hennessy Gas Utility Fund (the “Fund”) is a series of Hennessy Funds Trust (the “Trust”), which was organized as a Delaware statutory trust on September 17, 1992. The Fund is an open-end management investment company registered under the Investment Company Act of 1940, as amended. The investment objective of the Fund is income and capital appreciation. The Fund is a diversified fund.
The Fund offers Investor Class and Institutional Class shares. Each class of shares differs principally in its respective 12b-1 distribution and service, shareholder servicing, and sub-transfer agent expenses. There are no sales charges. Each class has identical rights to earnings, assets, and voting privileges, except for class-specific expenses and exclusive rights to vote on matters affecting only one class.
As an investment company, the Fund follows the investment company accounting and reporting guidance of the Financial Accounting Standards Board (“FASB”) Accounting Standard Codification Topic 946 “Financial Services—Investment Companies.”
2). SIGNIFICANT ACCOUNTING POLICIES
The following is a summary of significant accounting policies consistently followed by the Fund in the preparation of the financial statements. These policies conform to U.S. generally accepted accounting principles (“GAAP”).
| a). | Securities Valuation – All investments in securities are valued in accordance with the Fund’s valuation policies and procedures, as described in Note 3. |
| | |
| b). | Federal Income Taxes – The Fund has elected to be taxed as a regulated investment company and intends to distribute substantially all of its taxable income to its shareholders and otherwise comply with the provisions of the Internal Revenue Code of 1986, as amended, applicable to regulated investment companies. As a result, the Fund has made no provision for federal income taxes or excise taxes. Net investment income/loss and realized gains/losses for federal income tax purposes may differ from those reported in the financial statements because of temporary book-basis and tax-basis differences. Temporary differences are primarily the result of the treatment of wash sales for tax reporting purposes. The Fund recognizes interest and penalties related to income tax benefits, if any, in the Statement of Operations as an income tax expense. Distributions from net realized gains for book purposes may include short-term capital gains, which are included as ordinary income to shareholders for tax purposes. The Fund may utilize equalization accounting for tax purposes and designate earnings and profits, including net realized gains distributed to shareholders on redemption of shares, as part of the dividends paid deduction for income tax purposes. |
| | |
| c). | Accounting for Uncertainty in Income Taxes – The Fund has accounting policies regarding recognition and measurement of tax positions taken or expected to be taken on a tax return. The tax returns of the Fund for the prior three fiscal years are open for examination. The Fund has reviewed all open tax years in major tax jurisdictions and concluded that there is no impact on the Fund’s net assets and no tax liability resulting from unrecognized tax benefits relating to uncertain income tax positions taken or expected to be taken on a tax return. The Fund’s major tax jurisdictions are U.S. federal and Delaware. |
| NOTES TO THE FINANCIAL STATEMENTS |
| d). | Income and Expenses – Dividend income is recognized on the ex-dividend date or as soon as information is available to the Fund. Interest income, which includes the amortization of premium and accretion of discount, is recognized on an accrual basis. Market discounts, original issue discounts, and market premiums on debt securities are accreted or amortized to interest income over the life of a security with a corresponding increase or decrease, as applicable, in the cost basis of such security using the yield-to-maturity method or, where applicable, the first call date of the security. Other non-cash dividends are recognized as investment income at the fair value of the property received. The Fund is charged for those expenses that are directly attributable to its portfolio, such as advisory, administration, and certain shareholder service fees. Income, expenses (other than expenses attributable to a specific class), and realized and unrealized gains/losses on investments are allocated to each class of shares based on such class’s net assets. |
| | |
| e). | Distributions to Shareholders – Dividends from net investment income for the Fund, if any, are declared and paid at the end of each calendar quarter. Distributions of net realized capital gains, if any, are declared and paid annually, usually in December. |
| | |
| f). | Security Transactions – Investment and shareholder transactions are recorded on the trade date. The Fund determines the realized gain/loss from an investment transaction by comparing the original cost of the security lot sold with the net sale proceeds. Discounts and premiums on securities purchased are accreted or amortized, respectively, over the life of each such security. |
| | |
| g). | Use of Estimates – Preparing financial statements in accordance with GAAP requires management to make estimates and assumptions that affect the reported amounts of assets and liabilities and disclosure of contingent assets and liabilities at the date of the financial statements, as well as the reported change in net assets during the reporting period. Actual results could differ from those estimates. |
| | |
| h). | Share Valuation – The net asset value (“NAV”) per share of the Fund is calculated by dividing (i) the total value of the securities held by the Fund, plus cash and other assets, minus all liabilities (including estimated accrued expenses) by (ii) the total number of Fund shares outstanding, rounded to the nearest $0.01. Fund shares are not priced on days the New York Stock Exchange is closed for trading. The offering and redemption price per share for the Fund is equal to the Fund’s NAV per share. |
| | |
| i). | New Accounting Pronouncements – In August 2018, the FASB issued Accounting Standards Update No. 2018-13 “Disclosure Framework—Changes to the Disclosure Requirements for Fair Value Measurement” (“ASU 2018-13”). ASU 2018-13 eliminates the requirement to disclose the amount of and reasons for transfers between Level 1 and Level 2 of the fair value hierarchy, the timing of transfers between levels of the fair value hierarchy, and the valuation processes for Level 3 fair value measurements. ASU 2018-13 does not eliminate the requirement to disclose the range and weighted average used to develop significant unobservable inputs for Level 3 fair value measurements or the requirement to disclose the changes in unrealized gains and losses for recurring Level 3 fair value measurements. ASU 2018-13 requires that information is provided about the measurement uncertainty of Level 3 fair value measurements as of the reporting date. The guidance is effective for fiscal years beginning after December 15, 2019, and interim periods within those fiscal years. Management evaluated the impact of this change in guidance and, due to the permissibility of early adoption, modified the Fund’s fair value disclosures beginning with its fiscal year 2019. |
| HENNESSY FUNDS | 1-800-966-4354 | |
3). SECURITIES VALUATION
The Fund follows its valuation policies and procedures in determining its net asset value and, in preparing these financial statements, the fair value accounting standards that establish an authoritative definition of fair value and set out a hierarchy for measuring fair value. These standards require additional disclosures about the various inputs and valuation techniques used to develop the measurements of fair value and a discussion of changes in valuation techniques and related inputs during the period. These inputs are summarized in the three broad levels listed below:
| | Level 1 – | Unadjusted, quoted prices in active markets for identical instruments that the Fund has the ability to access at the date of measurement. |
| | | |
| | Level 2 – | Other significant observable inputs (including, but not limited to, quoted prices in active markets for similar instruments, quoted prices in markets that are not active for identical or similar instruments, and model-derived valuations in which all significant inputs and significant value drivers are observable in active markets, such as interest rates, prepayment speeds, credit risk curves, default rates, and similar data). |
| | | |
| | Level 3 – | Significant unobservable inputs (including the Fund’s own assumptions about what market participants would use to price the asset or liability based on the best available information) when observable inputs are unavailable. |
The following is a description of the valuation techniques applied to the Fund’s major categories of assets and liabilities on a recurring basis:
| | Equity Securities – Equity securities, including common stocks, preferred stocks, foreign-issued common stocks, exchange-traded funds, closed-end mutual funds, partnerships, rights, and real estate investment trusts, that are traded on a securities exchange for which a last-quoted sales price is readily available generally are valued at the last sales price as reported by the primary exchange on which the securities are listed. Securities listed on The NASDAQ Stock Market (“NASDAQ”) generally are valued at the NASDAQ Official Closing Price, which may differ from the last sales price reported. Securities traded on a securities exchange for which a last-quoted sales price is not readily available generally are valued at the mean between the bid and ask prices. To the extent these securities are actively traded and valuation adjustments are not applied, they are classified in Level 1 of the fair value hierarchy. Securities traded on foreign exchanges generally are not valued at the same time the Fund calculates its NAV because most foreign markets close well before such time. The earlier close of most foreign markets gives rise to the possibility that significant events, including broad market moves, may have occurred in the interim. In certain circumstances, it may be determined that a foreign security needs to be fair valued because it appears that the value of the security might have been materially affected by events occurring after the close of the market in which the security is principally traded, but before the time the Fund calculates its NAV, such as by a development that affects an entire market or region (e.g., a weather-related event) or a potentially global development (e.g., a terrorist attack that may be expected to have an effect on investor expectations worldwide). |
| | |
| | Registered Investment Companies – Investments in open-end registered investment companies, commonly referred to as mutual funds, generally are priced at the ending NAV provided by the applicable mutual fund’s service agent and are classified in Level 1 of the fair value hierarchy. |
| NOTES TO THE FINANCIAL STATEMENTS |
| | Debt Securities – Debt securities, including corporate bonds, asset-backed securities, mortgage-backed securities, municipal bonds, U.S. Treasuries, and U.S. government agency issues, are generally valued at market on the basis of valuations furnished by an independent pricing service that utilizes both dealer-supplied valuations and formula-based techniques. The pricing service may consider recently executed transactions in securities of the issuer or comparable issuers, market price quotations (where observable), bond spreads, and fundamental data relating to the issuer. In addition, the model may incorporate observable market data, such as reported sales of similar securities, broker quotes, yields, bids, offers, and reference data. Certain securities are valued primarily using dealer quotations. These securities are generally classified in Level 2 of the fair value hierarchy. |
| | |
| | Short-Term Securities – Short-term equity investments, including money market funds, are valued in the manner specified above for equity securities. Short-term debt investments with an original term to maturity of 60 days or less are valued at amortized cost, which approximates fair market value. If the original term to maturity of a short-term debt investment exceeds 60 days, then the values as of the 61st day prior to maturity are amortized. Amortized cost is not used if its use would be inappropriate due to credit or other impairments of the issuer, in which case the security’s fair value would be determined as described below. Short-term securities are generally classified in Level 1 or Level 2 of the fair value hierarchy depending on the inputs used and market activity levels for specific securities. |
The Board of Trustees of the Fund (the “Board”) has adopted fair value pricing procedures that are followed when a price for a security is not readily available or if a significant event has occurred that indicates the closing price of a security no longer represents the true value of that security. Fair value pricing determinations are made in good faith in accordance with these procedures. There are numerous criteria considered in determining a fair value of a security, such as the trading volume of a security and markets, the values of other similar securities, and news events with direct bearing on a security or markets. Fair value pricing results in an estimated price for a security that reflects the amount the Fund might reasonably expect to receive in a current sale. Depending on the relative significance of the valuation inputs, these securities may be classified in either Level 2 or Level 3 of the fair value hierarchy.
The fair value of foreign securities may be determined with the assistance of a pricing service using correlations between the movement of prices of such securities and indices of domestic securities and other appropriate indicators, such as closing market prices of relevant American Depositary Receipts or futures contracts. Using fair value pricing means that the Fund’s NAV reflects the affected portfolio securities’ values as determined by the Board or its designee, pursuant to the fair value pricing procedures adopted by the Board, instead of being determined by the market. Using a fair value pricing methodology to price a foreign security may result in a value that is different from such foreign security’s most recent closing price and from the value used by other investment companies to calculate their NAVs. Such securities are generally classified in Level 2 of the fair value hierarchy. Because the Fund may invest in foreign securities, the value of the Fund’s portfolio securities may change on days when a shareholder is unable to purchase or redeem Fund shares.
The Board has delegated day-to-day valuation matters to the Valuation and Liquidity Committee comprising representatives from Hennessy Advisors, Inc., the Fund’s investment advisor (the “Advisor”). The function of the Valuation and Liquidity Committee, among other things, is to value securities where current and reliable market quotations are not readily available. All actions taken by the Valuation and Liquidity Committee are reviewed by the Board.
| HENNESSY FUNDS | 1-800-966-4354 | |
The Fund has performed an analysis of all existing investments to determine the significance and character of all inputs to their fair value determinations. Various inputs are used to determine the value of the Fund’s investments. The inputs or methodology used for valuing securities are not necessarily an indication of the risk associated with investing in those securities. Details related to the fair value hierarchy of the Fund’s securities as of April 30, 2021, are included in the Schedule of Investments.
4). INVESTMENT TRANSACTIONS
Purchases and sales of investment securities (excluding government and short-term investments) for the Fund during the six months ended April 30, 2021, were $51,851,963 and $138,528,305, respectively.
There were no purchases or sales/maturities of long-term U.S. government securities for the Fund during the six months ended April 30, 2021.
5). INVESTMENT ADVISORY FEE AND OTHER TRANSACTIONS WITH AFFILIATES
The Advisor provides the Fund with investment advisory services under an Investment Advisory Agreement. The Advisor furnishes all investment advice, office space, and facilities and most of the personnel needed by the Fund. As compensation for its services, the Advisor is entitled to a monthly fee from the Fund. The fee is based on the average daily net assets of the Fund at an annual rate of 0.40%. The net investment advisory fees expensed by the Fund during the six months ended April 30, 2021, are included in the Statement of Operations.
The Board has approved a Shareholder Servicing Agreement for Investor Class shares of the Fund, which compensates the Advisor for the non-investment advisory services it provides to the Fund. The Shareholder Servicing Agreement provides for a monthly fee paid to the Advisor at an annual rate of 0.10% of the average daily net assets of the Fund attributable to Investor Class shares. The shareholder service fees expensed by the Fund during the six months ended April 30, 2021, are included in the Statement of Operations.
The Fund has adopted a plan pursuant to Rule 12b-1 under the Investment Company Act of 1940, as amended, that authorizes payments in connection with the distribution of Fund shares at an annual rate of up to 0.25% of the Fund’s average daily net assets attributable to Investor Class shares. Even though the authorized rate is up to 0.25%, the Fund is currently only using up to 0.15% of its average daily net assets attributable to Investor Class shares for such purpose. Amounts paid under the plan may be spent on any activities or expenses primarily intended to result in the sale of shares, including, but not limited to, advertising, shareholder account servicing, printing and mailing of prospectuses to other than current shareholders, printing and mailing of sales literature, and compensation for sales and marketing activities or to financial institutions and others, such as dealers and distributors. The distribution fees expensed by the Fund during the six months ended April 30, 2021, are included in the Statement of Operations.
The Fund has entered into agreements with various brokers, dealers, and financial intermediaries in connection with the sale of Fund shares. The agreements provide for periodic payments of sub-transfer agent expenses by the Fund to the brokers, dealers, and financial intermediaries for providing certain shareholder maintenance services. These shareholder services include the pre-processing and quality control of new accounts, shareholder correspondence, answering customer inquiries regarding account status, and facilitating shareholder telephone transactions. The sub-transfer agent fees expensed by the Fund during the six months ended April 30, 2021, are included in the Statement of Operations.
| NOTES TO THE FINANCIAL STATEMENTS |
The Fund has entered into an Administrative Services Agreement among the Fund, the Advisor, and the American Gas Association (“AGA”), pursuant to which the AGA provides administrative services to the Fund, including overseeing the calculation of the AGA Stock Index. ScottMadden, Inc. performs the actual computations required to produce the AGA Stock Index and receives a fee for such calculations pursuant to a contractual arrangement with AGA. AGA does not furnish other securities advice to the Fund or the Advisor or make recommendations regarding the purchase or sale of securities by the Fund. Under the terms of the Administrative Services Agreement, which has been approved by the Board, AGA provides the Fund with current information regarding the common stock composition of the AGA Stock Index at least monthly. In addition, on request, AGA provides the Fund and the Advisor with information on the natural gas industry. The Fund pays AGA a fee at an annual rate of 0.04% of the average daily net assets of the Fund.
U.S. Bancorp Fund Services, LLC, d/b/a U.S. Bank Global Fund Services (“Fund Services”) provides the Fund with administrative, accounting, and transfer agent services. As administrator, Fund Services is responsible for activities such as (i) preparing various federal and state regulatory filings, reports, and returns for the Fund, (ii) preparing reports and materials to be supplied to the Board, (iii) monitoring the activities of the Fund’s custodian, transfer agent, and accountants, and (iv) coordinating the preparation and payment of the Fund’s expenses and reviewing the Fund’s expense accruals. U.S. Bank N.A., an affiliate of Fund Services, serves as the Fund’s custodian. The servicing agreements between the Trust, Fund Services, and U.S. Bank N.A. contain a fee schedule that is inclusive of administrative, accounting, custody, and transfer agent fees. The administrative, accounting, custody, and transfer agent fees expensed by the Fund during the six months ended April 30, 2021, are included in the Statement of Operations.
Quasar Distributors, LLC (“Quasar”), a wholly owned broker-dealer subsidiary of Foreside Financial Group, LLC, acts as the Fund’s principal underwriter in a continuous public offering of Fund shares.
The officers of the Fund are affiliated with the Advisor. With the exception of the Chief Compliance Officer and the Senior Compliance Officer, such officers receive no compensation from the Fund for serving in their respective roles. The Fund, along with the other funds in the Hennessy Funds family (collectively, the “Hennessy Funds”), makes reimbursement payments on an equal basis to the Advisor for a portion of the salary and benefits associated with the office of the Chief Compliance Officer and for all of the salary and benefits associated with the office of the Senior Compliance Officer. The compliance fees expensed by the Fund during the six months ended April 30, 2021, are included in the Statement of Operations.
6). GUARANTEES AND INDEMNIFICATIONS
Under the Hennessy Funds’ organizational documents, their officers and trustees are indemnified by the Hennessy Funds against certain liabilities arising out of the performance of their duties to the Hennessy Funds. Additionally, in the normal course of business, the Hennessy Funds enter into contracts with service providers that contain general indemnification clauses. The Fund’s maximum exposure under these arrangements is unknown as this would involve future claims that may be made against the Fund that have not yet occurred. Currently, the Fund expects the risk of loss to be remote.
7). LINE OF CREDIT
The Fund has an uncommitted line of credit with the other Hennessy Funds in the amount of the lesser of (i) $100,000,000 or (ii) 33.33% of each Hennessy Fund’s net assets, or 30% for the Fund and 10% for the Hennessy Balanced Fund. The line of credit is
| HENNESSY FUNDS | 1-800-966-4354 | |
intended to provide any necessary short-term financing in connection with shareholder redemptions, subject to certain restrictions. The credit facility is with the Hennessy Funds’ custodian bank, U.S. Bank N.A. Borrowings under this arrangement bear interest at the bank’s prime rate and are secured by all of the Fund’s assets (as to its own borrowings only). During the six months ended April 30, 2021, the Fund had an outstanding average daily balance and a weighted average interest rate of $251,210 and 3.25%, respectively. The interest expensed by the Fund during the six months ended April 30, 2021, is included in the Statement of Operations. The maximum amount outstanding for the Fund during the period was $2,833,000. As of April 30, 2021, the Fund did not have any borrowings outstanding under the line of credit.
8). FEDERAL TAX INFORMATION
As of October 31, 2020, the Fund’s most recent fiscal year end, the components of accumulated earnings (losses) for income tax purposes were as follows:
| | | Investments | |
| Cost of investments for tax purposes | | $ | 371,183,621 | |
| Gross tax unrealized appreciation | | $ | 247,252,665 | |
| Gross tax unrealized depreciation | | | (68,075,758 | ) |
| Net tax unrealized appreciation/(depreciation) | | $ | 179,176,907 | |
| Undistributed ordinary income | | $ | 860,991 | |
| Undistributed long-term capital gains | | | 42,777,126 | |
| Total distributable earnings | | $ | 43,638,117 | |
| Other accumulated gain/(loss) | | $ | — | |
| Total accumulated gain/(loss) | | $ | 222,815,024 | |
The difference between book-basis unrealized appreciation/depreciation and tax-basis unrealized appreciation/depreciation (as shown above) is attributable primarily to wash sales.
As of October 31, 2020, the Fund had no tax-basis capital losses to offset future capital gains.
As of October 31, 2020, the Fund did not defer, on a tax basis, any late-year ordinary losses. Late-year ordinary losses are net ordinary losses incurred after December 31, 2019, but within the taxable year, that are deemed to arise on the first day of the Fund’s next taxable year.
During fiscal year 2021 (year to date) and fiscal year 2020, the tax character of distributions paid by the Fund was as follows:
| | | Six Months Ended | | | Year Ended | |
| | | April 30, 2021 | | | October 31, 2020 | |
Ordinary income(1) | | $ | 6,421,575 | | | $ | 14,868,613 | |
| Long-term capital gains | | | 42,777,236 | | | | 41,637,087 | |
| Total distributions | | $ | 49,198,811 | | | $ | 56,505,700 | |
(1) Ordinary income includes short-term capital gains.
9). EVENTS SUBSEQUENT TO PERIOD END
Management has evaluated the Fund’s related events and transactions that occurred subsequent to April 30, 2021, through the date of issuance of the Fund’s financial statements. Management has determined that there were no subsequent events requiring recognition or disclosure in the financial statements.
| NOTES TO THE FINANCIAL STATEMENTS/EXPENSE EXAMPLE |
Expense Example (Unaudited)
April 30, 2021
As a shareholder of the Fund, you incur ongoing costs, including management fees, service fees, and other Fund expenses. This Example is intended to help you understand your ongoing costs (in dollars) of investing in the Fund and to compare these costs with the ongoing costs of investing in other mutual funds. The Example is based on an investment of $1,000 invested at the beginning of the period and held for the entire period from November 1, 2020, through April 30, 2021.
Actual Expenses
In the table below, the first line under each of the “Investor Class” and “Institutional Class” headings provides information about actual account values and actual expenses for each share class. You may use this information, together with the amount you invested, to estimate the expenses that you paid over the period. Simply divide your account value by $1,000 (for example, an $8,600 account value divided by $1,000 = 8.6), then multiply the result by the number in the first line under the heading entitled “Expenses Paid During Period” to estimate the expenses you paid on your account during this period. Although the Fund charges no sales loads or transaction fees, you will be assessed fees for outgoing wire transfers, returned checks, and stop payment orders at prevailing rates charged by U.S. Bank Global Fund Services, the Fund’s transfer agent. If you request that a redemption be made by wire transfer, the Fund’s transfer agent charges a $15 fee. IRAs are charged a $15 annual maintenance fee (up to $30 maximum per shareholder for shareholders with multiple IRAs). The examples below include, but are not limited to, management, shareholder servicing, accounting, custody, and transfer agent fees. However, the examples below do not include portfolio trading commissions and related expenses.
Hypothetical Example for Comparison Purposes
In the table below, the second line under each of the “Investor Class” and “Institutional Class” headings provides information about hypothetical account values and hypothetical expenses based on the Fund’s actual expense ratio for each share class and an assumed rate of return of 5% per year before expenses, which is not the Fund’s actual return for such share class. The hypothetical account values and expenses may not be used to estimate the actual ending account balance or expenses you paid for the period. You may use this information to compare the ongoing costs of investing in the Fund and other funds. To do so, compare these 5% hypothetical examples with the 5% hypothetical examples that appear in the shareholder reports of the other funds. Please note that the expenses shown in the table are meant to highlight your ongoing costs only. Therefore, the second lines under “Investor Class” and “Institutional Class” headings are useful in comparing ongoing costs only and will not help you determine the relative total costs of owning different funds.
| HENNESSY FUNDS | 1-800-966-4354 | |
| | Beginning | Ending | |
| | Account Value | Account Value | Expenses Paid |
| | November 1, 2020 | April 30, 2021
| During Period(1) |
| Investor Class | | | |
| Actual | $1,000.00 | $1,189.30 | $5.54 |
| Hypothetical (5% return before expenses) | $1,000.00 | $1,019.74 | $5.11 |
| | | | |
| Institutional Class | | | |
| Actual | $1,000.00 | $1,191.50 | $3.80 |
| Hypothetical (5% return before expenses) | $1,000.00 | $1,021.32 | $3.51 |
(1) | Expenses are equal to the Fund’s annualized expense ratio of 1.02% for Investor Class shares or 0.70% for Institutional Class shares, as applicable, multiplied by the average account value over the period, multiplied by 181/365 days (to reflect the half-year period). |
| EXPENSE EXAMPLE — ELECTRONIC DELIVERY |
How to Obtain a Copy of the Fund’s Proxy
Voting Policy and Proxy Voting Records
A description of the policies and procedures the Fund uses to determine how to vote proxies relating to portfolio securities is available without charge (1) by calling 1-800-966-4354, (2) on the Hennessy Funds’ website at www.hennessyfunds.com/proxy-voting/voting-policy, or (3) on the U.S. Securities and Exchange Commission’s (the “SEC”) website at www.sec.gov. The Fund’s proxy voting record is available without charge on both the Hennessy Funds’ website at www.hennessyfunds.com/proxy-voting/voting-record and the SEC’s website at www.sec.gov no later than August 31 for the prior 12 months ending June 30.
Availability of Quarterly Portfolio Schedule
The Fund files a complete schedule of portfolio holdings with the SEC for the first and third quarters of each fiscal year as an exhibit to its reports on Form N-PORT. The Fund’s Form N-PORT reports are available on the SEC’s website at www.sec.gov or on request by calling 1-800-966-4354.
Federal Tax Distribution Information (Unaudited)
For fiscal year 2020, certain dividends paid by the Fund may be subject to a maximum tax rate of 23.8%, as provided for by the Jobs and Growth Tax Relief Reconciliation Act of 2003. The percentage of dividends declared from ordinary income designated as qualified dividend income was 100.00%.
For corporate shareholders, the percent of ordinary income distributions that qualified for the corporate dividends received deduction for fiscal year 2020 was 100.00%.
The percentage of taxable ordinary income distributions that were designated as short-term capital gain distributions under Section 871(k)(2)(C) of the Internal Revenue Code of 1986, as amended, for the Fund was 0.00%.
Important Notice Regarding Delivery
of Shareholder Documents
To help keep the Fund’s costs as low as possible, we generally deliver a single copy of notices, shareholder reports, proxy statements, and prospectuses to shareholders who share an address and have the same last name. This process does not apply to account statements. You may request an individual copy of a shareholder document at any time. If you would like to receive separate mailings of shareholder documents, please call U.S. Bank Global Fund Services at 1-800-261-6950 or 1-414-765-4124, and individual delivery will begin within 30 days of your request. If your account is held through a financial institution or other intermediary, please contact such intermediary directly to request individual delivery.
Electronic Delivery
As permitted by SEC regulations, the Fund’s shareholder reports are made available on a website, and unless you sign up for eDelivery or elect to receive paper copies as detailed below, you will be notified by mail each time a report is posted and provided with a website link to access the report.
The Fund also offers shareholders the option to receive all notices, account statements, prospectuses, tax forms, and shareholder reports online. To sign up for eDelivery or change your delivery preference, please visit www.hennessyfunds.com/account.
To elect to receive paper copies of all future reports free of charge, please call U.S. Bank Global Fund Services at 1-800-261-6950 or 1-414-765-4124.
Subscribe to receive our team’s unique market and sector insights delivered to your inbox
www.hennessyfunds.com/subscribe
Follow us on social media
| HENNESSY FUNDS | 1-800-966-4354 | |
Board Approval of Investment Advisory
Agreement
At its meeting on March 10, 2021, the Board of Trustees of the Fund (the “Board,” and the members thereof, the “Trustees”) unanimously approved the continuation of the investment advisory agreement of the Fund with Hennessy Advisors, Inc. (the “Advisor”). As part of the process, the Trustees reviewed their fiduciary duties and the relevant factors for them to consider with respect to approving the advisory agreement. In addition, the Trustees who are not deemed “interested persons” (as defined by the Investment Company Act of 1940, as amended) of the Fund (the “Independent Trustees”) met in executive session to discuss the approval of the advisory agreement.
In advance of the meeting, the Advisor sent detailed information to the Trustees to assist them in their evaluation of the advisory agreement. This information included, but was not limited to, the following:
| | (1) | A memorandum from outside legal counsel that described the fiduciary duties of the Board with respect to approving the continuation of the advisory agreement and the relevant factors for consideration; |
| | | |
| | (2) | A memorandum from the Advisor that listed the factors relevant to the Board’s approval of the continuation of the advisory agreement and also referenced the documents that had been provided to help the Board assess each such factor; |
| | | |
| | (3) | The Advisor’s financial statements from its most recent Form 10-K and Form 10-Q; |
| | | |
| | (4) | A summary of the advisory agreement; |
| | | |
| | (5) | A recent Fund fact sheet, which included performance information over various periods; |
| | | |
| | (6) | An description of the range of services provided by the Advisor; |
| | | |
| | (7) | A peer expense comparison of the net expense ratio and investment advisory fee of the Fund; and |
| | | |
| | (8) | A memorandum from the Adviser regarding economies of scale. |
All of the factors discussed were considered as a whole by the Trustees and by the Independent Trustees meeting in executive session. The factors were viewed in their totality by the Trustees, with no single factor being the principal or determinative factor in the Trustees’ determination of whether to approve the continuation of the advisory agreement. The Trustees recognized that the management and fee arrangements for the Fund are the result of years of review and discussion between the Independent Trustees and the Advisor, that certain aspects of such arrangements may receive greater scrutiny in some years than in others, and that the Trustees’ conclusions may be based, in part, on their consideration of these same arrangements and information received during the course of the year and in prior years.
Prior to approving the continuation of the advisory agreement, the Trustees, including the Independent Trustees in executive session, considered, among other items:
| | (1) | The nature and quality of the advisory services provided by the Advisor; |
| | | |
| | (2) | A comparison of the fees and expenses of the Fund to other similar funds; |
| | | |
| | (3) | Whether economies of scale are recognized by the Fund; |
| | | |
| | (4) | The costs and profitability of the Fund to the Advisor; |
| | | |
| | (5) | The performance of the Fund; and |
| BOARD APPROVAL OF INVESTMENT ADVISORY AGREEMENT |
| | (6) | Any benefits to the Advisor from serving as an investment advisor to the Fund (other than the advisory fee). |
The material considerations and determinations of the Trustees, including the Independent Trustees, were as follows:
| | (1) | The Trustees considered the services identified below that are provided by the Advisor. Based on this review, the Trustees concluded that the Advisor provides high-quality services to the Fund and noted that their overall confidence in the Advisor was high. The Trustees also concluded that they were satisfied with the nature, extent, and quality of the advisory services provided to the Fund by the Advisor and that the nature and extent of the services provided by the Advisor were appropriate to assure that the Fund’s operations are conducted in compliance with applicable laws, rules, and regulations. |
| | | (a) | The Advisor acts as the portfolio manager for the Fund. In this capacity, the Advisor does the following: |
| | | | (i) | manages the composition of the Fund’s portfolio, including the purchase, retention, and disposition of portfolio securities in accordance with the Fund’s investment objectives, policies, and restrictions; |
| | | | | |
| | | | (ii) | seeks best execution for the Fund’s portfolio; |
| | | | | |
| | | | (iii) | manages the use of soft dollars for the Fund; and |
| | | | | |
| | | | (iv) | manages proxy voting for the Fund. |
| | | (b) | The Advisor performs a daily reconciliation of portfolio positions and cash for the Fund. |
| | | | |
| | | (c) | The Advisor monitors the liquidity of each Fund. |
| | | | |
| | | (d) | The Advisor monitors the Fund’s compliance with its investment objectives and restrictions and federal securities laws. |
| | | | |
| | | (e) | The Advisor maintains a compliance program (including a code of ethics), conducts ongoing reviews of the compliance programs of the Fund’s service providers (including their codes of ethics, as appropriate), conducts on-site visits to the Fund’s service providers as feasible, monitors incidents of abusive trading practices, reviews Fund expense accruals, payments, and fixed expense ratios, evaluates insurance providers for fidelity bond, D&O/E&O insurance, and cybersecurity insurance coverage, manages regulatory examination compliance and responses, conducts employee compliance training, reviews reports provided by service providers, and maintains books and records. |
| | | | |
| | | (f) | The Advisor oversees service providers that provide accounting, administration, distribution, transfer agency, custodial, sales, marketing, public relations, audit, information technology, and legal services to the Fund. |
| | | | |
| | | (g) | The Advisor maintains in-house marketing and distribution departments on behalf of the Fund. |
| | | | |
| | | (h) | The Advisor prepares or directs the preparation of all regulatory filings for the Fund, including writing and annually updating the Fund’s prospectus and related documents. |
| | | | |
| | | (i) | For each annual report of the Fund, the Advisor prepares a written summary of the Fund’s performance during the most recent 12-month period. |
| HENNESSY FUNDS | 1-800-966-4354 | |
| | | (j) | The Advisor oversees distribution of the Fund through third-party broker/dealers and independent financial institutions such as Charles Schwab, Inc., Fidelity, TD Ameritrade, and Pershing. The Advisor compensates, in part, a number of these third-party providers out of its own revenues. |
| | | | |
| | | (k) | The Advisor pays the incentive compensation of the Fund’s compliance officers and employs other staff, such as legal, marketing, national accounts, distribution, sales, administrative, and trading oversight personnel, as well as management executives. |
| | | | |
| | | (l) | The Advisor provides a quarterly compliance certification to the Board. |
| | | | |
| | | (m) | The Advisor prepares or reviews all Board materials, frequently presents to the Board and leads Board discussions, prepares or reviews all meeting minutes, and arranges for Board training and education. |
| | (2) | The Trustees compared the performance of the Fund to benchmark indices over various periods and also noted that the Trustees review and discuss reports comparing the investment performance of the Fund to various indices at each quarterly Board meeting. Based on such information, the Trustees determined that the Advisor manages the Fund in a manner materially consistent with its stated investment objective and style. The Trustees concluded that the performance of the Fund over various periods warranted continuation of the advisory agreement. |
| | | |
| | (3) | The Trustees reviewed the advisory fees and overall expense ratios of the Fund compared to other funds similar in asset size and investment objective to the Fund using data from Morningstar. As part of the discussion with management, the Trustees ensured that they understood and were comfortable with the criteria used to determine the mutual funds included in the Morningstar categories for purposes of the materials considered at the meeting. The Trustees determined that the advisory fee and overall expense ratio of the Fund falls within the range of the advisory fees and overall expense ratios of other comparable funds and concluded that they are reasonable and warranted continuation of the advisory agreement. |
| | | |
| | (4) | The Trustees also considered whether the Advisor was realizing economies of scale that it should share with the Fund’s shareholders. The Trustees noted that many of the expenses incurred to manage the Fund are asset-based fees, so the Advisor would not realize material economies of scale relating to those expenses as the assets of the Fund increase. For example, third-party platform fees increase as the Fund’s assets grow. The Trustees also considered the Advisor’s significant marketing efforts to promote the Funds and the Advisor’s agreement to waive fees or lower its management fees in certain circumstances. |
| | | |
| | (5) | The Trustees considered the profitability of the Advisor, including the impact of mutual fund platform fees on the Advisor’s profitability, and also considered the resources and revenues that the Advisor has put into managing and distributing the Fund. The Trustees then concluded that the profits of the Advisor are reasonable and not excessive when compared to profitability guidelines set forth in relevant court cases. |
| | | |
| | (6) | The Trustees considered the high level of professionalism and knowledge of the Advisor’s employees, along with a very low level of turnover, and concluded that this was beneficial to the Fund and its shareholders. |
| BOARD APPROVAL OF INVESTMENT ADVISORY AGREEMENT |
| | (7) | The Trustees considered any benefits to the Advisor from serving as an advisor to the Fund (other than the advisory fee). The Trustees noted that the Advisor may derive ancillary benefits from, by way of example, its association with the Fund in the form of proprietary and third-party research products and services received from broker-dealers that execute portfolio trades for the Fund. The Trustees determined that any such products and services have been used for legitimate purposes relating to the Fund by providing assistance in the investment decision-making process. The Trustees concluded that any additional benefits realized by the Advisor from its relationship with the Fund were reasonable, which was based on, among other things, the Trustees’ finding that the research, analytical, statistical, and other information and services provided by brokers are merely supplemental to the Advisor’s own efforts in the performance of its duties under the advisory agreement. |
After reviewing the materials and information provided at the meeting, as well as other information regularly provided at the Board’s quarterly meetings throughout the year regarding the quality of services provided by the Advisor, the performance of the Fund, expense information, brokerage commissions information, the adequacy and efficacy of the Advisor’s written policies and procedures, other regulatory compliance issues, trading information and related matters, and other factors that the Trustees deemed relevant, the Trustees, including the Independent Trustees, approved the continuation of the advisory agreement.
| HENNESSY FUNDS | 1-800-966-4354 | |
For information, questions, or assistance, please call
The Hennessy Funds
1-800-966-4354 or 1-415-899-1555
INVESTMENT ADVISOR
Hennessy Advisors, Inc.
7250 Redwood Boulevard, Suite 200
Novato, California 94945
ADMINISTRATOR,
TRANSFER AGENT,
DIVIDEND PAYING AGENT, &
SHAREHOLDER SERVICING AGENT
U.S. Bancorp Fund Services, LLC
d/b/a U.S. Bank Global Fund Services
P.O. Box 701
Milwaukee, Wisconsin 53201-0701
CUSTODIAN
U.S. Bank N.A.
Custody Operations
1555 North River Center Drive, Suite 302
Milwaukee, Wisconsin 53212
TRUSTEES
Neil J. Hennessy
Robert T. Doyle
J. Dennis DeSousa
Gerald P. Richardson
COUNSEL
Foley & Lardner LLP
777 East Wisconsin Avenue
Milwaukee, Wisconsin 53202-5306
INDEPENDENT REGISTERED
PUBLIC ACCOUNTING FIRM
Tait, Weller & Baker LLP
Two Liberty Place
50 South 16th Street, Suite 2900
Philadelphia, Pennsylvania 19102-2529
DISTRIBUTOR
Quasar Distributors, LLC
111 East Kilbourn Avenue, Suite 2200
Milwaukee, Wisconsin 53202
www.hennessyfunds.com | 1-800-966-4354
This report has been prepared for shareholders and may be distributed to
others only if preceded or accompanied by a current prospectus.
SEMI-ANNUAL REPORT
APRIL 30, 2021
HENNESSY JAPAN FUND
Investor Class HJPNX
Institutional Class HJPIX
www.hennessyfunds.com | 1-800-966-4354
(This Page Intentionally Left Blank.)
Contents
| Letter to Shareholders | 2 |
| Performance Overview | 4 |
| Financial Statements | |
| Schedule of Investments | 5 |
| Statement of Assets and Liabilities | 9 |
| Statement of Operations | 10 |
| Statements of Changes in Net Assets | 11 |
| Financial Highlights | 12 |
| Notes to the Financial Statements | 16 |
| Expense Example | 24 |
| Proxy Voting Policy and Proxy Voting Records | 26 |
| Availability of Quarterly Portfolio Schedule | 26 |
| Federal Tax Distribution Information | 26 |
| Important Notice Regarding Delivery of Shareholder Documents | 26 |
| Electronic Delivery | 27 |
| Board Approval of Investment Advisory Agreements | 28 |
| HENNESSY FUNDS | 1-800-966-4354 | |
May 2021
Dear Hennessy Funds Shareholder:
The Japanese stock market gained 16.59% as measured by the Tokyo Stock Price Index (TOPIX) over the six months ended April 30, 2021 (in U.S. dollar terms).
While Japan continued to experience COVID-19 infections during the period, the Japanese stock market marched higher through mid-February, reaching a 30-year high. Among the factors contributing to this rally were proactive countermeasures against COVID-19, including continued monetary easing globally, rising expectations for the development and distribution of vaccines, and hopes for a quick economic recovery. Japan’s vaccine rollout, however, has been slower than that of other countries. This is primarily due to regulations requiring a domestic Japanese clinical trial regardless of foreign regulatory approvals. Nevertheless, the number of cases in Japan remains relatively low when compared to the United States. For example, as of mid-April, there were more than 10 times as many cases in the United States as in Japan, even though the population of the United States is only three times larger.
While the broader market remained strong, rising interest rates and inflation concerns continued to weigh on investors. We believe that the recent rise of interest rates is part of a natural course of a short-term correction in financial markets. Last year’s pandemic prompted central banks around the world to go all out in easing the monetary system, driving down further what had already been historically low rates. If the pandemic turns out to be nearing its end, then we believe this extra dip in rates should at least normalize to pre-pandemic levels relatively soon. With the ongoing rollout of vaccinations and declines in new infection cases, we could be at that very stage. The good news is that the normalization of interest rates validates the recovery in economic activity.
If history is any guide, the next worry will be inflation, which effectively “swindles the equity investor,” as Warren Buffett famously said in his 1977 Fortune column. This notion, however, is somewhat premature in our view. It is worth noting that in the run-up prior to the pandemic, the world economy didn’t have any structural excesses like production capacity overbuild or debt-fueled overconsumption, which are typically a recipe for a deep recession. With the household savings rate climbing high, consumers are eager to spend. As such, it is reasonable to assume that once the pandemic is brought under control, demand for goods and services will likely outstrip supply in the short term, which may result in a temporary pickup in inflation.
Whether inflation will persist is a big question mark, however. Particularly in Japan, even though well over a decade of ultra-loose monetary policy has created abundant liquidity in the financial system, it has not made its way to the real economy. For example, since the end of 2009, Japan’s monetary base has increased sixfold, but the money supply has not grown nearly as much while CPI has struggled to stay in positive territory. Aging demographics and a declining population are perennial problems from which Japan does not seem able to escape. Furthermore, the advancement of technology, such as e-commerce and the digital economy, has been effective at taming upward pressure on prices of goods and services globally. Putting all these things together, our view is that a continuous rise in interest rates beyond the correction territory is unlikely.
As such, it is hard to image inflation taking hold in our domestic economy at this point in time. The Bank of Japan will likely continue with the current monetary policy framework, keeping rates around zero through so-called yield curve control along with other easing measures. We remain optimistic about the long-term prospects for Japan and its stock market.
Thank you for your continued confidence and investment in the Hennessy Funds.
Sincerely,
 |  |
| Tadahiro Fujimura | Masakazu Takeda |
| Portfolio Manager, | Portfolio Manager, |
| Hennessy Japan Small Cap Fund; | Hennessy Japan Fund; |
| Chief Investment Officer | Fund Manager |
| SPARX Asset Management Co., Ltd. | SPARX Asset Management Co., Ltd. |
SPARX Asset Management Co., Ltd., located in Tokyo, Japan, is the sub-advisor to the Hennessy Japan Fund and the Hennessy Japan Small Cap Fund.
Past performance does not guarantee future results.
Mutual fund investing involves risk. Principal loss is possible.
Opinions expressed are those of Tadahiro Fujimura and Masakazu Takeda and are subject to change, are not guaranteed, and should not be considered investment advice.
The Tokyo Stock Price Index (TOPIX) is a capitalization-weighted index of all of the companies listed on the First Section of the Tokyo Stock Exchange. The index is used herein for comparative purposes in accordance with SEC regulations. One cannot invest directly in an index.
| HENNESSY FUNDS | 1-800-966-4354 | |
Performance Overview (Unaudited)
AVERAGE ANNUAL TOTAL RETURN FOR PERIODS ENDED APRIL 30, 2021
| | Six | One | Five | Ten |
| | Months(1) | Year
| Years
| Years
|
| Hennessy Japan Fund – | | | | |
| Investor Class (HJPNX) | 5.21% | 31.79% | 13.07% | 11.76% |
| Hennessy Japan Fund – | | | | |
| Institutional Class (HJPIX) | 5.42% | 32.30% | 13.52% | 12.12% |
| Russell/Nomura | | | | |
Total MarketTM Index | 17.00% | 30.53% | 9.80% | 7.71% |
| Tokyo Price Index (TOPIX) | 16.59% | 29.94% | 9.57% | 7.56% |
Expense ratios: 1.43% (Investor Class); 1.04% (Institutional Class)
(1) | Periods of less than one year are not annualized. |
_______________
Performance data quoted represents past performance; past performance does not guarantee future results. The investment return and principal value of an investment will fluctuate so that an investor’s shares, when redeemed, may be worth more or less than their original cost. The performance table does not reflect the deduction of taxes that a shareholder would pay on Fund distributions or the redemption of Fund shares. Current performance of the Fund may be lower or higher than the performance quoted. Performance data current to the most recent month end may be obtained by visiting www.hennessyfunds.com.
The Russell/Nomura Total Market™ Index contains the top 98% of all stocks listed on Japan’s stock exchanges and registered on Japan’s over-the-counter market based on market capitalization. The Tokyo Price Index (TOPIX) is a capitalization-weighted index of all of the companies listed on the First Section of the Tokyo Stock Exchange. One cannot invest directly in an index. These indices are used herein for comparative purposes in accordance with Securities and Exchange Commission regulations.
Frank Russell Company (“Russell”) is the source and owner of the trademarks, service marks, and copyrights related to the Russell Indexes. Russell® is a trademark of Frank Russell Company. Neither Russell nor its licensors accept any liability for any errors or omissions in the Russell Indexes or Russell ratings or underlying data and no party may rely on any Russell Indexes or Russell ratings or underlying data contained in this communication. No further distribution of Russell data is permitted without Russell’s express written consent. Russell does not promote, sponsor, or endorse the content of this communication.
The expense ratios presented are from the most recent prospectus. The expense ratios for the current reporting period are available in the Financial Highlights section of this report.
PERFORMANCE OVERVIEW/SCHEDULE OF INVESTMENTS |
Financial Statements
Schedule of Investments as of April 30, 2021 (Unaudited) |
HENNESSY JAPAN FUND
(% of Net Assets)
| TOP TEN HOLDINGS (EXCLUDING MONEY MARKET FUNDS) | % NET ASSETS |
| SoftBank Group Corp. | 6.86% |
| Sony Group Corp. | 6.06% |
| Nidec Corp. | 6.02% |
| Daikin Industries, Ltd. | 5.49% |
| Recruit Holdings Co., Ltd. | 5.46% |
| Keyence Corp. | 5.40% |
| Terumo Corp. | 5.09% |
| Shimano, Inc. | 5.08% |
| Mercari, Inc. | 5.07% |
| Fast Retailing Co., Ltd. | 4.57% |
Note: For presentation purposes, the Fund has grouped some of the industry categories. For purposes of categorizing securities for compliance with Section 8(b)(1) of the Investment Company Act of 1940, as amended, the Fund uses more specific industry classifications.
The Global Industry Classification Standard (GICS®) was developed by and is the exclusive property and a service mark of MSCI, Inc. and Standard & Poor’s Financial Services LLC. It has been licensed for use by the Hennessy Funds.
| HENNESSY FUNDS | 1-800-966-4354 | |
| COMMON STOCKS – 97.69% | | Number | | | | | | % of | |
| | | of Shares | | | Value | | | Net Assets | |
| Communication Services – 9.33% | | | | | | | | | |
| SoftBank Group Corp. | | | 650,000 | | | $ | 58,790,832 | | | | 6.86 | % |
| Z Holdings Corp. | | | 4,571,100 | | | | 21,121,836 | | | | 2.47 | % |
| | | | | | | | 79,912,668 | | | | 9.33 | % |
| | | | | | | | | | | | | |
| Consumer Discretionary – 25.04% | | | | | | | | | | | | |
| Asics Corp. | | | 593,800 | | | | 9,426,691 | | | | 1.10 | % |
| Fast Retailing Co., Ltd. | | | 47,700 | | | | 39,154,241 | | | | 4.57 | % |
| Mercari, Inc. (b) | | | 878,100 | | | | 43,386,769 | | | | 5.07 | % |
| Nitori Holdings Co., Ltd. | | | 150,700 | | | | 27,040,232 | | | | 3.16 | % |
| Shimano, Inc. | | | 190,000 | | | | 43,523,195 | | | | 5.08 | % |
| Sony Group Corp. | | | 520,100 | | | | 51,871,992 | | | | 6.06 | % |
| | | | | | | | 214,403,120 | | | | 25.04 | % |
| | | | | | | | | | | | | |
| Consumer Staples – 11.20% | | | | | | | | | | | | |
| Ariake Japan Co., Ltd. | | | 195,700 | | | | 11,334,806 | | | | 1.32 | % |
| Kao Corp. | | | 401,200 | | | | 25,722,467 | | | | 3.00 | % |
| Rohto Pharmaceutical Co., Ltd. | | | 1,053,200 | | | | 27,011,800 | | | | 3.16 | % |
| Unicharm Corp. | | | 819,200 | | | | 31,811,555 | | | | 3.72 | % |
| | | | | | | | 95,880,628 | | | | 11.20 | % |
| | | | | | | | | | | | | |
| Financials – 1.86% | | �� | | | | | | | | | | |
| Anicom Holdings, Inc. | | | 1,714,100 | | | | 15,903,536 | | | | 1.86 | % |
| | | | | | | | | | | | | |
| Health Care – 12.99% | | | | | | | | | | | | |
| Asahi Intecc Co., Ltd. | | | 180,500 | | | | 4,858,916 | | | | 0.57 | % |
| Olympus Corp. | | | 895,600 | | | | 18,417,614 | | | | 2.15 | % |
| PeptiDream, Inc. (b) | | | 136,100 | | | | 5,834,280 | | | | 0.68 | % |
| Takeda Pharmaceutical Co., Ltd. | | | 1,158,400 | | | | 38,528,539 | | | | 4.50 | % |
| Terumo Corp. | | | 1,151,700 | | | | 43,543,091 | | | | 5.09 | % |
| | | | | | | | 111,182,440 | | | | 12.99 | % |
| | | | | | | | | | | | | |
| Industrials – 28.12% | | | | | | | | | | | | |
| Daikin Industries, Ltd. | | | 234,200 | | | | 46,994,290 | | | | 5.49 | % |
| Kubota Corp. | | | 1,514,700 | | | | 35,618,803 | | | | 4.16 | % |
| MISUMI Group, Inc. | | | 1,207,900 | | | | 34,040,919 | | | | 3.98 | % |
| Mitsubishi Corp. | | | 933,900 | | | | 25,806,368 | | | | 3.01 | % |
| Nidec Corp. | | | 445,300 | | | | 51,562,554 | | | | 6.02 | % |
| Recruit Holdings Co., Ltd. | | | 1,033,800 | | | | 46,719,171 | | | | 5.46 | % |
| | | | | | | | 240,742,105 | | | | 28.12 | % |
The accompanying notes are an integral part of these financial statements.
| COMMON STOCKS | | Number | | | | | | % of | |
| | | of Shares | | | Value | | | Net Assets | |
| Information Technology – 8.48% | | | | | | | | | |
| Keyence Corp. | | | 96,200 | | | $ | 46,229,518 | | | | 5.40 | % |
| Murata Manufacturing Co., Ltd. | | | 330,800 | | | | 26,342,322 | | | | 3.08 | % |
| | | | | | | | 72,571,840 | | | | 8.48 | % |
| | | | | | | | | | | | | |
| Real Estate – 0.67% | | | | | | | | | | | | |
| Relo Group, Inc. | | | 280,400 | | | | 5,772,715 | | | | 0.67 | % |
| | | | | | | | | | | | | |
| Total Common Stocks | | | | | | | | | | | | |
| (Cost $563,508,501) | | | | | | | 836,369,052 | | | | 97.69 | % |
| | | | | | | | | | | | | |
| SHORT-TERM INVESTMENTS – 2.03% | | | | | | | | | | | | |
| | | | | | | | | | | | | |
| Money Market Funds – 2.03% | | | | | | | | | | | | |
| First American Government Obligations Fund, | | | | | | | | | | | | |
| Institutional Class, 0.03% (b) | | | 17,417,486 | | | | 17,417,486 | | | | 2.03 | % |
| | | | | | | | | | | | | |
| Total Short-Term Investments | | | | | | | | | | | | |
| (Cost $17,417,486) | | | | | | | 17,417,486 | | | | 2.03 | % |
| | | | | | | | | | | | | |
| Total Investments | | | | | | | | | | | | |
| (Cost $580,925,987) – 99.72% | | | | | | | 853,786,538 | | | | 99.72 | % |
| Other Assets in Excess of Liabilities – 0.28% | | | | | | | 2,399,485 | | | | 0.28 | % |
| | | | | | | | | | | | | |
TOTAL NET ASSETS – 100.00% | | | | | | $ | 856,186,023 | | | | 100.00 | % |
Percentages are stated as a percent of net assets.
| (a) | Non-income-producing security. |
| (b) | The rate listed is the fund’s seven-day yield as of April 30, 2021. |
The accompanying notes are an integral part of these financial statements.
| HENNESSY FUNDS | 1-800-966-4354 | |
Summary of Fair Value Exposure as of April 30, 2021
The following is a summary of the inputs used to value the Fund’s net assets as of April 30, 2021 (see Note 3 in the accompanying Notes to the Financial Statements):
| Common Stocks | | Level 1 | | | Level 2 | | | Level 3 | | | Total | |
| Communication Services | | $ | 79,912,668 | | | $ | — | | | $ | — | | | $ | 79,912,668 | |
| Consumer Discretionary | | | 214,403,120 | | | | — | | | | — | | | | 214,403,120 | |
| Consumer Staples | | | 95,880,628 | | | | — | | | | — | | | | 95,880,628 | |
| Financials | | | 15,903,536 | | | | — | | | | — | | | | 15,903,536 | |
| Health Care | | | 111,182,440 | | | | — | | | | — | | | | 111,182,440 | |
| Industrials | | | 240,742,105 | | | | — | | | | — | | | | 240,742,105 | |
| Information Technology | | | 72,571,840 | | | | — | | | | — | | | | 72,571,840 | |
| Real Estate | | | 5,772,715 | | | | — | | | | — | | | | 5,772,715 | |
| Total Common Stocks | | $ | 836,369,052 | | | $ | — | | | $ | — | | | $ | 836,369,052 | |
| Short-Term Investments | | | | | | | | | | | | | | | | |
| Money Market Funds | | $ | 17,417,486 | | | $ | — | | | $ | — | | | $ | 17,417,486 | |
| Total Short-Term Investments | | $ | 17,417,486 | | | $ | — | | | $ | — | | | $ | 17,417,486 | |
| Total Investments | | $ | 853,786,538 | | | $ | — | | | $ | — | | | $ | 853,786,538 | |
The accompanying notes are an integral part of these financial statements.
| SCHEDULE OF INVESTMENTS/STATEMENT OF ASSETS AND LIABILITIES |
Financial Statements
Statement of Assets and Liabilities as of April 30, 2021 (Unaudited) |
| ASSETS: | | | |
| Investments in securities, at value (cost $580,925,987) | | $ | 853,786,538 | |
| Dividends and interest receivable | | | 3,008,048 | |
| Receivable for fund shares sold | | | 1,523,522 | |
| Prepaid expenses and other assets | | | 63,463 | |
| Total assets | | | 858,381,571 | |
| | | | | |
| LIABILITIES: | | | | |
| Payable for fund shares redeemed | | | 1,159,369 | |
| Payable to advisor | | | 579,643 | |
| Payable to administrator | | | 161,171 | |
| Payable to auditor | | | 10,654 | |
| Accrued distribution fees | | | 24,031 | |
| Accrued service fees | | | 13,634 | |
| Accrued trustees fees | | | 1,756 | |
| Accrued expenses and other payables | | | 245,290 | |
| Total liabilities | | | 2,195,548 | |
| NET ASSETS | | $ | 856,186,023 | |
| | | | | |
| NET ASSETS CONSISTS OF: | | | | |
| Capital stock | | $ | 605,952,830 | |
| Total distributable earnings | | | 250,233,193 | |
| Total net assets | | $ | 856,186,023 | |
| | | | | |
| NET ASSETS: | | | | |
| Investor Class | | | | |
| Shares authorized (no par value) | | Unlimited | |
| Net assets applicable to outstanding shares | | $ | 157,846,829 | |
| Shares issued and outstanding | | | 3,506,519 | |
| Net asset value, offering price, and redemption price per share | | $ | 45.02 | |
| | | | | |
| Institutional Class | | | | |
| Shares authorized (no par value) | | Unlimited | |
| Net assets applicable to outstanding shares | | $ | 698,339,194 | |
| Shares issued and outstanding | | | 14,992,037 | |
| Net asset value, offering price, and redemption price per share | | $ | 46.58 | |
The accompanying notes are an integral part of these financial statements.
| HENNESSY FUNDS | 1-800-966-4354 | |
Financial Statements
Statement of Operations for the six months ended April 30, 2021 (Unaudited) |
| INVESTMENT INCOME: | | | |
Dividend income(1) | | $ | 4,477,160 | |
| Interest income | | | 4,077 | |
| Total investment income | | | 4,481,237 | |
| | | | | |
| EXPENSES: | | | | |
| Investment advisory fees (See Note 5) | | | 3,477,032 | |
| Sub-transfer agent expenses – Investor Class (See Note 5) | | | 188,598 | |
| Sub-transfer agent expenses – Institutional Class (See Note 5) | | | 327,000 | |
| Administration, accounting, custody, and transfer agent fees (See Note 5) | | | 484,933 | |
| Distribution fees – Investor Class (See Note 5) | | | 127,271 | |
| Service fees – Investor Class (See Note 5) | | | 84,848 | |
| Federal and state registration fees | | | 33,645 | |
| Reports to shareholders | | | 18,869 | |
| Compliance expense (See Note 5) | | | 13,844 | |
| Trustees’ fees and expenses | | | 11,476 | |
| Audit fees | | | 10,654 | |
| Legal fees | | | 4,623 | |
| Other expenses | | | 34,571 | |
| Total expenses | | | 4,817,364 | |
| NET INVESTMENT LOSS | | $ | (336,127 | ) |
| | | | | |
| REALIZED AND UNREALIZED GAINS (LOSSES): | | | | |
| Net realized gain on investments | | $ | 4,465,518 | |
| Net change in unrealized appreciation/depreciation on investments | | | 32,552,134 | |
| Net gain on investments | | | 37,017,652 | |
| NET INCREASE IN NET ASSETS RESULTING FROM OPERATIONS | | $ | 36,681,525 | |
(1) | Net of foreign taxes withheld of $497,458. |
The accompanying notes are an integral part of these financial statements.
| STATEMENT OF OPERATIONS/STATEMENTS OF CHANGES IN NET ASSETS |
Financial Statements
| Statements of Changes in Net Assets |
| | | Six Months Ended | | | | |
| | | April 30, 2021 | | | Year Ended | |
| | | (Unaudited) | | | October 31, 2020 | |
| OPERATIONS: | | | | | | |
| Net investment loss | | $ | (336,127 | ) | | $ | (48,348 | ) |
| Net realized gain (loss) on investments | | | 4,465,518 | | | | (26,459,008 | ) |
| Net change in unrealized | | | | | | | | |
| appreciation/depreciation on investments | | | 32,552,134 | | | | 106,104,850 | |
| Net increase in net assets resulting from operations | | | 36,681,525 | | | | 79,597,494 | |
| | | | | | | | | |
| DISTRIBUTIONS TO SHAREHOLDERS: | | | | | | | | |
| Distributable earnings – Investor Class | | | — | | | | (117,483 | ) |
| Distributable earnings – Institutional Class | | | (48,044 | ) | | | (3,035,473 | ) |
| Total distributions | | | (48,044 | ) | | | (3,152,956 | ) |
| | | | | | | | | |
| CAPITAL SHARE TRANSACTIONS: | | | | | | | | |
| Proceeds from shares subscribed – Investor Class | | | 48,599,344 | | | | 83,467,464 | |
| Proceeds from shares subscribed – Institutional Class | | | 144,048,605 | | | | 203,244,073 | |
| Dividends reinvested – Investor Class | | | — | | | | 113,374 | |
| Dividends reinvested – Institutional Class | | | 47,024 | | | | 2,957,410 | |
| Cost of shares redeemed – Investor Class | | | (40,111,311 | ) | | | (37,788,252 | ) |
| Cost of shares redeemed – Institutional Class | | | (83,440,901 | ) | | | (276,664,005 | ) |
| Net increase (decrease) in net assets derived | | | | | | | | |
| from capital share transactions | | | 69,142,761 | | | | (24,669,936 | ) |
| TOTAL INCREASE IN NET ASSETS | | | 105,776,242 | | | | 51,774,602 | |
| | | | | | | | | |
| NET ASSETS: | | | | | | | | |
| Beginning of period | | | 750,409,781 | | | | 698,635,179 | |
| End of period | | $ | 856,186,023 | | | $ | 750,409,781 | |
| | | | | | | | | |
| CHANGES IN SHARES OUTSTANDING: | | | | | | | | |
| Shares sold – Investor Class | | | 1,032,196 | | | | 2,016,527 | |
| Shares sold – Institutional Class | | | 2,943,888 | | | | 5,338,605 | |
| Shares issued to holders as reinvestment | | | | | | | | |
| of dividends – Investor Class | | | — | | | | 2,962 | |
| Shares issued to holders as reinvestment | | | | | | | | |
| of dividends – Institutional Class | | | 944 | | | | 75,037 | |
| Shares redeemed – Investor Class | | | (851,504 | ) | | | (1,040,377 | ) |
| Shares redeemed – Institutional Class | | | (1,712,668 | ) | | | (7,587,792 | ) |
| Net increase (decrease) in shares outstanding | | | 1,412,856 | | | | (1,195,038 | ) |
The accompanying notes are an integral part of these financial statements.
| HENNESSY FUNDS | 1-800-966-4354 | |
Financial Statements
For an Investor Class share outstanding throughout each period
| | | Six Months Ended | |
| | | April 30, 2021 | |
| | | (Unaudited) | |
| PER SHARE DATA: | | | |
| Net asset value, beginning of period | | $ | 42.79 | |
| | | | | |
| Income from investment operations: | | | | |
| Net investment income (loss) | | | (0.09 | )(1) |
| Net realized and unrealized gains on investments | | | 2.32 | |
| Total from investment operations | | | 2.23 | |
| | | | | |
| Less distributions: | | | | |
| Dividends from net investment income | | | — | |
| Dividends from net realized gains | | | — | |
| Total distributions | | | — | |
| Net asset value, end of period | | $ | 45.02 | |
| | | | | |
| TOTAL RETURN | | | 5.21 | %(3) |
| | | | | |
| SUPPLEMENTAL DATA AND RATIOS: | | | | |
| Net assets, end of period (millions) | | $ | 157.85 | |
| Ratio of expenses to average net assets | | | 1.41 | %(4) |
| Ratio of net investment income (loss) to average net assets | | | (0.39 | )%(4) |
Portfolio turnover rate(5) | | | 2 | %(3) |
(1) | Calculated using the average shares outstanding method. |
(2) | Amount is between $(0.005) and $0.005. |
(3) | Not annualized. |
(4) | Annualized. |
(5) | Calculated on the basis of the Fund as a whole. |
The accompanying notes are an integral part of these financial statements.
| FINANCIAL HIGHLIGHTS — INVESTOR CLASS |
| Year Ended October 31, | |
| 2020 | | | 2019 | | | 2018 | | | 2017 | | | 2016 | |
| | | | | | | | | | | | | | |
| $ | 37.17 | | | $ | 33.63 | | | $ | 32.75 | | | $ | 27.81 | | | $ | 24.07 | |
| | | | | | | | | | | | | | | | | | | |
| | | | | | | | | | | | | | | | | | | |
| | (0.14 | )(1) | | | 0.05 | (1) | | | (0.00 | )(2) | | | (0.03 | ) | | | (0.11 | ) |
| | 5.81 | | | | 3.50 | | | | 0.89 | | | | 4.97 | | | | 3.85 | |
| | 5.67 | | | | 3.55 | | | | 0.89 | | | | 4.94 | | | | 3.74 | |
| | | | | | | | | | | | | | | | | | | |
| | | | | | | | | | | | | | | | | | | |
| | (0.02 | ) | | | (0.01 | ) | | | (0.01 | ) | | | — | | | | — | |
| | (0.03 | ) | | | — | | | | — | | | | — | | | | — | |
| | (0.05 | ) | | | (0.01 | ) | | | (0.01 | ) | | | — | | | | — | |
| $ | 42.79 | | | $ | 37.17 | | | $ | 33.63 | | | $ | 32.75 | | | $ | 27.81 | |
| | | | | | | | | | | | | | | | | | | |
| | 15.27 | % | | | 10.60 | % | | | 2.70 | % | | | 17.76 | % | | | 15.54 | % |
| | | | | | | | | | | | | | | | | | | |
| | | | | | | | | | | | | | | | | | | |
| $ | 142.30 | | | $ | 87.22 | | | $ | 103.33 | | | $ | 84.44 | | | $ | 61.85 | |
| | 1.43 | % | | | 1.43 | % | | | 1.43 | % | | | 1.46 | % | | | 1.50 | % |
| | (0.37 | )% | | | 0.14 | % | | | (0.02 | )% | | | (0.15 | )% | | | (0.38 | )% |
| | 23 | % | | | 9 | % | | | 1 | % | | | 0 | % | | | 5 | % |
The accompanying notes are an integral part of these financial statements.
| HENNESSY FUNDS | 1-800-966-4354 | |
Financial Statements
For an Institutional Class share outstanding throughout each period
| | | Six Months Ended | |
| | | April 30, 2021 | |
| | | (Unaudited) | |
| PER SHARE DATA: | | | |
| Net asset value, beginning of period | | $ | 44.19 | |
| | | | | |
| Income from investment operations: | | | | |
| Net investment income (loss) | | | (0.00 | )(1)(2) |
| Net realized and unrealized gains on investments | | | 2.39 | |
| Total from investment operations | | | 2.39 | |
| | | | | |
| Less distributions: | | | | |
| Dividends from net investment income | | | 0.00 | (2) |
| Dividends from net realized gains | | | — | |
| Total distributions | | | 0.00 | (2) |
| Net asset value, end of period | | $ | 46.58 | |
| | | | | |
| TOTAL RETURN | | | 5.42 | %(3) |
| | | | | |
| SUPPLEMENTAL DATA AND RATIOS: | | | | |
| Net assets, end of period (millions) | | $ | 698.34 | |
| Ratio of expenses to average net assets | | | 1.03 | %(4) |
| Ratio of net investment income (loss) to average net assets | | | (0.00 | )%(2)(4) |
Portfolio turnover rate(5) | | | 2 | %(3) |
(1) | Calculated using the average shares outstanding method. |
(2) | Amount is between $(0.005) and $0.005. |
(3) | Not annualized. |
(4) | Annualized. |
(5) | Calculated on the basis of the Fund as a whole. |
The accompanying notes are an integral part of these financial statements.
| FINANCIAL HIGHLIGHTS — INSTITUTIONAL CLASS |
| Year Ended October 31, | |
| 2020 | | | 2019 | | | 2018 | | | 2017 | | | 2016 | |
| | | | | | | | | | | | | | |
| $ | 38.37 | | | $ | 34.67 | | | $ | 33.64 | | | $ | 28.45 | | | $ | 24.55 | |
| | | | | | | | | | | | | | | | | | | |
| | | | | | | | | | | | | | | | | | | |
| | 0.02 | (1) | | | 0.21 | (1) | | | 0.15 | | | | 0.03 | | | | (0.01 | ) |
| | 5.99 | | | | 3.60 | | | | 0.91 | | | | 5.16 | | | | 3.91 | |
| | 6.01 | | | | 3.81 | | | | 1.06 | | | | 5.19 | | | | 3.90 | |
| | | | | | | | | | | | | | | | | | | |
| | | | | | | | | | | | | | | | | | | |
| | (0.16 | ) | | | (0.11 | ) | | | (0.03 | ) | | | — | | | | — | |
| | (0.03 | ) | | | — | | | | — | | | | — | | | | — | |
| | (0.19 | ) | | | (0.11 | ) | | | (0.03 | ) | | | — | | | | — | |
| $ | 44.19 | | | $ | 38.37 | | | $ | 34.67 | | | $ | 33.64 | | | $ | 28.45 | |
| | | | | | | | | | | | | | | | | | | |
| | 15.72 | % | | | 11.02 | % | | | 3.14 | % | | | 18.24 | % | | | 15.89 | % |
| | | | | | | | | | | | | | | | | | | |
| | | | | | | | | | | | | | | | | | | |
| $ | 608.11 | | | $ | 611.41 | | | $ | 399.76 | | | $ | 177.42 | | | $ | 67.78 | |
| | 1.04 | % | | | 1.03 | % | | | 1.01 | % | | | 1.05 | % | | | 1.17 | % |
| | 0.04 | % | | | 0.59 | % | | | 0.49 | % | | | 0.30 | % | | | (0.03 | )% |
| | 23 | % | | | 9 | % | | | 1 | % | | | 0 | % | | | 5 | % |
The accompanying notes are an integral part of these financial statements.
| HENNESSY FUNDS | 1-800-966-4354 | |
Financial Statements
Notes to the Financial Statements April 30, 2021 (Unaudited) |
1). ORGANIZATION
The Hennessy Japan Fund (the “Fund”) is a series of Hennessy Funds Trust (the “Trust”), which was organized as a Delaware statutory trust on September 17, 1992. The Fund is an open-end management investment company registered under the Investment Company Act of 1940, as amended. The investment objective of the Fund is long-term capital appreciation. The Fund is a diversified fund but employs a relatively concentrated investment strategy and may hold securities of fewer issuers than other diversified funds.
The Fund offers Investor Class and Institutional Class shares. Each class of shares differs principally in its respective 12b-1 distribution and service, shareholder servicing, and sub-transfer agent expenses. There are no sales charges. Each class has identical rights to earnings, assets, and voting privileges, except for class-specific expenses and exclusive rights to vote on matters affecting only one class.
As an investment company, the Fund follows the investment company accounting and reporting guidance of the Financial Accounting Standards Board (“FASB”) Accounting Standard Codification Topic 946 “Financial Services—Investment Companies.”
2). SIGNIFICANT ACCOUNTING POLICIES
The following is a summary of significant accounting policies consistently followed by the Fund in the preparation of the financial statements. These policies conform to U.S. generally accepted accounting principles (“GAAP”).
| a). | Securities Valuation – All investments in securities are valued in accordance with the Fund’s valuation policies and procedures, as described in Note 3. |
| | |
| b). | Federal Income Taxes – The Fund has elected to be taxed as a regulated investment company and intends to distribute substantially all of its taxable income to its shareholders and otherwise comply with the provisions of the Internal Revenue Code of 1986, as amended, applicable to regulated investment companies. As a result, the Fund has made no provision for federal income taxes or excise taxes. Net investment income/loss and realized gains/losses for federal income tax purposes may differ from those reported in the financial statements because of temporary book-basis and tax-basis differences. Temporary differences are primarily the result of the treatment of wash sales for tax reporting purposes. The Fund recognizes interest and penalties related to income tax benefits, if any, in the Statement of Operations as an income tax expense. Distributions from net realized gains for book purposes may include short-term capital gains, which are included as ordinary income to shareholders for tax purposes. The Fund may utilize equalization accounting for tax purposes and designate earnings and profits, including net realized gains distributed to shareholders on redemption of shares, as part of the dividends paid deduction for income tax purposes. |
| | |
| c). | Accounting for Uncertainty in Income Taxes – The Fund has accounting policies regarding recognition and measurement of tax positions taken or expected to be taken on a tax return. The tax returns of the Fund for the prior three fiscal years are open for examination. The Fund has reviewed all open tax years in major tax jurisdictions and concluded that there is no impact on the Fund’s net assets and no tax liability resulting from unrecognized tax benefits relating to uncertain income tax |
| NOTES TO THE FINANCIAL STATEMENTS |
| | positions taken or expected to be taken on a tax return. The Fund’s major tax jurisdictions are U.S. federal and Delaware. |
| | |
| d). | Income and Expenses – Dividend income is recognized on the ex-dividend date or as soon as information is available to the Fund. Interest income, which includes the amortization of premium and accretion of discount, is recognized on an accrual basis. Market discounts, original issue discounts, and market premiums on debt securities are accreted or amortized to interest income over the life of a security with a corresponding increase or decrease, as applicable, in the cost basis of such security using the yield-to-maturity method or, where applicable, the first call date of the security. Other non-cash dividends are recognized as investment income at the fair value of the property received. The Fund is charged for those expenses that are directly attributable to its portfolio, such as advisory, administration, and certain shareholder service fees. Income, expenses (other than expenses attributable to a specific class), and realized and unrealized gains/losses on investments are allocated to each class of shares based on such class’s net assets. |
| | |
| e). | Distributions to Shareholders – Dividends from net investment income for the Fund, if any, are declared and paid annually, usually in December. Distributions of net realized capital gains, if any, are declared and paid annually, usually in December. |
| | |
| f). | Security Transactions – Investment and shareholder transactions are recorded on the trade date. The Fund determines the realized gain/loss from an investment transaction by comparing the original cost of the security lot sold with the net sale proceeds. Discounts and premiums on securities purchased are accreted or amortized, respectively, over the life of each such security. |
| | |
| g). | Use of Estimates – Preparing financial statements in accordance with GAAP requires management to make estimates and assumptions that affect the reported amounts of assets and liabilities and disclosure of contingent assets and liabilities at the date of the financial statements, as well as the reported change in net assets during the reporting period. Actual results could differ from those estimates. |
| | |
| h). | Share Valuation – The net asset value (“NAV”) per share of the Fund is calculated by dividing (i) the total value of the securities held by the Fund, plus cash and other assets, minus all liabilities (including estimated accrued expenses) by (ii) the total number of Fund shares outstanding, rounded to the nearest $0.01. Fund shares are not priced on days the New York Stock Exchange is closed for trading. The offering and redemption price per share for the Fund is equal to the Fund’s NAV per share. |
| | |
| i). | Foreign Currency – Values of investments denominated in foreign currencies are converted into U.S. dollars using the spot market exchange rate at the time of valuation. Purchases and sales of investments and income are translated into U.S. dollars using the spot market exchange rate prevailing on the respective dates of such transactions. The Fund does not isolate the portion of the results of operations resulting from fluctuations in foreign exchange rates on investments from fluctuations resulting from changes in the market prices of securities held. Such fluctuations are included with the net realized and unrealized gain/loss on investments. Foreign investments present additional risks due to currency fluctuations, economic and political factors, lower liquidity, government regulations, differences in accounting standards, and other factors. |
| | |
| j). | REIT Equity Securities – Distributions received from real estate investment trusts (“REITs”) may be classified as dividends, capital gains, or return of capital. Investments in REITs may require the Fund to accrue and distribute income not yet received. To generate sufficient cash to make any required distributions, the Fund |
| HENNESSY FUNDS | 1-800-966-4354 | |
| | may be required to sell securities in its portfolio (including when it is not advantageous to do so) that it otherwise would have continued to hold. At other times, investments in a REIT may result in the Fund’s receipt of cash in excess of the REIT’s earnings. If the Fund distributes these amounts, these distributions could constitute a return of capital to Fund shareholders for U.S. federal income tax purposes. Dividends received by the Fund from a REIT generally do not constitute qualified dividend income and do not qualify for the dividends-received deduction. |
| | |
| k). | New Accounting Pronouncements – In August 2018, the FASB issued Accounting Standards Update No. 2018-13 “Disclosure Framework—Changes to the Disclosure Requirements for Fair Value Measurement” (“ASU 2018-13”). ASU 2018-13 eliminates the requirement to disclose the amount of and reasons for transfers between Level 1 and Level 2 of the fair value hierarchy, the timing of transfers between levels of the fair value hierarchy, and the valuation processes for Level 3 fair value measurements. ASU 2018-13 does not eliminate the requirement to disclose the range and weighted average used to develop significant unobservable inputs for Level 3 fair value measurements or the requirement to disclose the changes in unrealized gains and losses for recurring Level 3 fair value measurements. ASU 2018-13 requires that information is provided about the measurement uncertainty of Level 3 fair value measurements as of the reporting date. The guidance is effective for fiscal years beginning after December 15, 2019, and interim periods within those fiscal years. Management evaluated the impact of this change in guidance and, due to the permissibility of early adoption, modified the Fund’s fair value disclosures beginning with its fiscal year 2019. |
3). SECURITIES VALUATION
The Fund follows its valuation policies and procedures in determining its net asset value and, in preparing these financial statements, the fair value accounting standards that establish an authoritative definition of fair value and set out a hierarchy for measuring fair value. These standards require additional disclosures about the various inputs and valuation techniques used to develop the measurements of fair value and a discussion of changes in valuation techniques and related inputs during the period. These inputs are summarized in the three broad levels listed below:
| | Level 1 – | Unadjusted, quoted prices in active markets for identical instruments that the Fund has the ability to access at the date of measurement. |
| | | |
| | Level 2 – | Other significant observable inputs (including, but not limited to, quoted prices in active markets for similar instruments, quoted prices in markets that are not active for identical or similar instruments, and model-derived valuations in which all significant inputs and significant value drivers are observable in active markets, such as interest rates, prepayment speeds, credit risk curves, default rates, and similar data). |
| | | |
| | Level 3 – | Significant unobservable inputs (including the Fund’s own assumptions about what market participants would use to price the asset or liability based on the best available information) when observable inputs are unavailable. |
The following is a description of the valuation techniques applied to the Fund’s major categories of assets and liabilities on a recurring basis:
| | Equity Securities – Equity securities, including common stocks, preferred stocks, foreign-issued common stocks, exchange-traded funds, closed-end mutual funds, partnerships, rights, and real estate investment trusts, that are traded on a securities |
| NOTES TO THE FINANCIAL STATEMENTS |
| | exchange for which a last-quoted sales price is readily available generally are valued at the last sales price as reported by the primary exchange on which the securities are listed. Securities listed on The NASDAQ Stock Market (“NASDAQ”) generally are valued at the NASDAQ Official Closing Price, which may differ from the last sales price reported. Securities traded on a securities exchange for which a last-quoted sales price is not readily available generally are valued at the mean between the bid and ask prices. To the extent these securities are actively traded and valuation adjustments are not applied, they are classified in Level 1 of the fair value hierarchy. Securities traded on foreign exchanges generally are not valued at the same time the Fund calculates its NAV because most foreign markets close well before such time. The earlier close of most foreign markets gives rise to the possibility that significant events, including broad market moves, may have occurred in the interim. In certain circumstances, it may be determined that a foreign security needs to be fair valued because it appears that the value of the security might have been materially affected by events occurring after the close of the market in which the security is principally traded, but before the time the Fund calculates its NAV, such as by a development that affects an entire market or region (e.g., a weather-related event) or a potentially global development (e.g., a terrorist attack that may be expected to have an effect on investor expectations worldwide). |
| | |
| | Registered Investment Companies – Investments in open-end registered investment companies, commonly referred to as mutual funds, generally are priced at the ending NAV provided by the applicable mutual fund’s service agent and are classified in Level 1 of the fair value hierarchy. |
| | |
| | Debt Securities – Debt securities, including corporate bonds, asset-backed securities, mortgage-backed securities, municipal bonds, U.S. Treasuries, and U.S. government agency issues, are generally valued at market on the basis of valuations furnished by an independent pricing service that utilizes both dealer-supplied valuations and formula-based techniques. The pricing service may consider recently executed transactions in securities of the issuer or comparable issuers, market price quotations (where observable), bond spreads, and fundamental data relating to the issuer. In addition, the model may incorporate observable market data, such as reported sales of similar securities, broker quotes, yields, bids, offers, and reference data. Certain securities are valued primarily using dealer quotations. These securities are generally classified in Level 2 of the fair value hierarchy. |
| | |
| | Short-Term Securities – Short-term equity investments, including money market funds, are valued in the manner specified above for equity securities. Short-term debt investments with an original term to maturity of 60 days or less are valued at amortized cost, which approximates fair market value. If the original term to maturity of a short-term debt investment exceeds 60 days, then the values as of the 61st day prior to maturity are amortized. Amortized cost is not used if its use would be inappropriate due to credit or other impairments of the issuer, in which case the security’s fair value would be determined as described below. Short-term securities are generally classified in Level 1 or Level 2 of the fair value hierarchy depending on the inputs used and market activity levels for specific securities. |
The Board of Trustees of the Fund (the “Board”) has adopted fair value pricing procedures that are followed when a price for a security is not readily available or if a significant event has occurred that indicates the closing price of a security no longer represents the true value of that security. Fair value pricing determinations are made in good faith in accordance with these procedures. There are numerous criteria considered in determining a fair value of a security, such as the trading volume of a security and
| HENNESSY FUNDS | 1-800-966-4354 | |
markets, the values of other similar securities, and news events with direct bearing on a security or markets. Fair value pricing results in an estimated price for a security that reflects the amount the Fund might reasonably expect to receive in a current sale. Depending on the relative significance of the valuation inputs, these securities may be classified in either Level 2 or Level 3 of the fair value hierarchy.
The fair value of foreign securities may be determined with the assistance of a pricing service using correlations between the movement of prices of such securities and indices of domestic securities and other appropriate indicators, such as closing market prices of relevant American Depositary Receipts or futures contracts. Using fair value pricing means that the Fund’s NAV reflects the affected portfolio securities’ values as determined by the Board or its designee, pursuant to the fair value pricing procedures adopted by the Board, instead of being determined by the market. Using a fair value pricing methodology to price a foreign security may result in a value that is different from such foreign security’s most recent closing price and from the value used by other investment companies to calculate their NAVs. Such securities are generally classified in Level 2 of the fair value hierarchy. Because the Fund invests in foreign securities, the value of the Fund’s portfolio securities may change on days when a shareholder is unable to purchase or redeem Fund shares.
The Board has delegated day-to-day valuation matters to the Valuation and Liquidity Committee comprising representatives from Hennessy Advisors, Inc., the Fund’s investment advisor (the “Advisor”). The function of the Valuation and Liquidity Committee, among other things, is to value securities where current and reliable market quotations are not readily available. All actions taken by the Valuation and Liquidity Committee are reviewed by the Board.
The Fund has performed an analysis of all existing investments to determine the significance and character of all inputs to their fair value determinations. Various inputs are used to determine the value of the Fund’s investments. The inputs or methodology used for valuing securities are not necessarily an indication of the risk associated with investing in those securities. Details related to the fair value hierarchy of the Fund’s securities as of April 30, 2021, are included in the Schedule of Investments.
4). INVESTMENT TRANSACTIONS
Purchases and sales of investment securities (excluding government and short-term investments) for the Fund during the six months ended April 30, 2021, were $81,290,940 and $15,776,004, respectively.
There were no purchases or sales/maturities of long-term U.S. government securities for the Fund during the six months ended April 30, 2021.
5). INVESTMENT ADVISORY FEE AND OTHER TRANSACTIONS WITH AFFILIATES
The Advisor provides the Fund with investment advisory services under an Investment Advisory Agreement. The Advisor oversees the provision of investment advice and furnishes office space, facilities, and most of the personnel needed by the Fund. As compensation for its services, the Advisor is entitled to a monthly fee from the Fund. The fee is based on the average daily net assets of the Fund at an annual rate of 0.80%. The net investment advisory fees expensed by the Fund during the six months ended April 30, 2021, are included in the Statement of Operations.
The Advisor has delegated the day-to-day management of the Fund to a sub-advisor, SPARX Asset Management Co., Ltd. The Advisor pays the sub-advisory fees from its own assets, and these fees are not an additional expense of the Fund. During the six months ended April 30, 2021, the Advisor (not the Fund) paid a sub-advisory fee at the average rate of 0.37% of the daily net assets of the Fund. Pursuant to the sub-advisory agreement,
| NOTES TO THE FINANCIAL STATEMENTS |
the Advisor pays sub-advisory fees at the rate of 0.35% of the first $500 million of daily net assets, 0.40% of daily net assets between $500 million and $1 billion, and 0.42% of daily net assets over $1 billion.
The Board has approved a Shareholder Servicing Agreement for Investor Class shares of the Fund, which compensates the Advisor for the non-investment advisory services it provides to the Fund. The Shareholder Servicing Agreement provides for a monthly fee paid to the Advisor at an annual rate of 0.10% of the average daily net assets of the Fund attributable to Investor Class shares. The shareholder service fees expensed by the Fund during the six months ended April 30, 2021, are included in the Statement of Operations.
The Fund has adopted a plan pursuant to Rule 12b-1 under the Investment Company Act of 1940, as amended, that authorizes payments in connection with the distribution of Fund shares at an annual rate of up to 0.25% of the Fund’s average daily net assets attributable to Investor Class shares. Even though the authorized rate is up to 0.25%, the Fund is currently only using up to 0.15% of its average daily net assets attributable to Investor Class shares for such purpose. Amounts paid under the plan may be spent on any activities or expenses primarily intended to result in the sale of shares, including, but not limited to, advertising, shareholder account servicing, printing and mailing of prospectuses to other than current shareholders, printing and mailing of sales literature, and compensation for sales and marketing activities or to financial institutions and others, such as dealers and distributors. The distribution fees expensed by the Fund during the six months ended April 30, 2021, are included in the Statement of Operations.
The Fund has entered into agreements with various brokers, dealers, and financial intermediaries in connection with the sale of Fund shares. The agreements provide for periodic payments of sub-transfer agent expenses by the Fund to the brokers, dealers, and financial intermediaries for providing certain shareholder maintenance services. These shareholder services include the pre-processing and quality control of new accounts, shareholder correspondence, answering customer inquiries regarding account status, and facilitating shareholder telephone transactions. The sub-transfer agent fees expensed by the Fund during the six months ended April 30, 2021, are included in the Statement of Operations.
U.S. Bancorp Fund Services, LLC, d/b/a U.S. Bank Global Fund Services (“Fund Services”) provides the Fund with administrative, accounting, and transfer agent services. As administrator, Fund Services is responsible for activities such as (i) preparing various federal and state regulatory filings, reports, and returns for the Fund, (ii) preparing reports and materials to be supplied to the Board, (iii) monitoring the activities of the Fund’s custodian, transfer agent, and accountants, and (iv) coordinating the preparation and payment of the Fund’s expenses and reviewing the Fund’s expense accruals. U.S. Bank N.A., an affiliate of Fund Services, serves as the Fund’s custodian. The servicing agreements between the Trust, Fund Services, and U.S. Bank N.A. contain a fee schedule that is inclusive of administrative, accounting, custody, and transfer agent fees. The administrative, accounting, custody, and transfer agent fees expensed by the Fund during the six months ended April 30, 2021, are included in the Statement of Operations.
Quasar Distributors, LLC (“Quasar”), a wholly owned broker-dealer subsidiary of Foreside Financial Group, LLC, acts as the Fund’s principal underwriter in a continuous public offering of Fund shares.
The officers of the Fund are affiliated with the Advisor. With the exception of the Chief Compliance Officer and the Senior Compliance Officer, such officers receive no compensation from the Fund for serving in their respective roles. The Fund, along with the other funds in the Hennessy Funds family (collectively, the “Hennessy Funds”),
| HENNESSY FUNDS | 1-800-966-4354 | |
makes reimbursement payments on an equal basis to the Advisor for a portion of the salary and benefits associated with the office of the Chief Compliance Officer and for all of the salary and benefits associated with the office of the Senior Compliance Officer. The compliance fees expensed by the Fund during the six months ended April 30, 2021, are included in the Statement of Operations.
6). GUARANTEES AND INDEMNIFICATIONS
Under the Hennessy Funds’ organizational documents, their officers and trustees are indemnified by the Hennessy Funds against certain liabilities arising out of the performance of their duties to the Hennessy Funds. Additionally, in the normal course of business, the Hennessy Funds enter into contracts with service providers that contain general indemnification clauses. The Fund’s maximum exposure under these arrangements is unknown as this would involve future claims that may be made against the Fund that have not yet occurred. Currently, the Fund expects the risk of loss to be remote.
7). LINE OF CREDIT
The Fund has an uncommitted line of credit with the other Hennessy Funds in the amount of the lesser of (i) $100,000,000 or (ii) 33.33% of each Hennessy Fund’s net assets, or 30% for the Hennessy Gas Utility Fund and 10% for the Hennessy Balanced Fund. The line of credit is intended to provide any necessary short-term financing in connection with shareholder redemptions, subject to certain restrictions. The credit facility is with the Hennessy Funds’ custodian bank, U.S. Bank N.A. Borrowings under this arrangement bear interest at the bank’s prime rate and are secured by all of the Fund’s assets (as to its own borrowings only). During the six months ended April 30, 2021, the Fund did not have any borrowings outstanding under the line of credit.
8). FEDERAL TAX INFORMATION
As of October 31, 2020, the Fund’s most recent fiscal year end, the components of accumulated earnings (losses) for income tax purposes were as follows:
| | | Investments | |
| Cost of investments for tax purposes | | $ | 513,053,167 | |
| Gross tax unrealized appreciation | | $ | 251,274,283 | |
| Gross tax unrealized depreciation | | | (11,393,482 | ) |
| Net tax unrealized appreciation/(depreciation) | | $ | 239,880,801 | |
| Undistributed ordinary income | | $ | — | |
| Undistributed long-term capital gains | | | — | |
| Total distributable earnings | | $ | — | |
| Other accumulated gain/(loss) | | $ | (26,281,089 | ) |
| Total accumulated gain/(loss) | | $ | 213,599,712 | |
The difference between book-basis unrealized appreciation/depreciation and tax-basis unrealized appreciation/depreciation (as shown above) is attributable primarily to wash sales.
As of October 31, 2020, the Fund had $22,090,536 in unlimited long-term and $3,684,715 in unlimited short-term capital loss carryforwards.
Capital losses sustained in or after fiscal year 2012 can be carried forward indefinitely, but any such loss retains the character of the original loss and must be utilized prior to any loss incurred before fiscal year 2012. As a result of this ordering rule, capital loss carryforwards incurred prior to fiscal year 2012 may be more likely to expire unused. Capital losses sustained prior to fiscal year 2012 can be carried forward for eight years and can be carried forward as short-term capital losses regardless of the character of the original loss.
| NOTES TO THE FINANCIAL STATEMENTS |
As of October 31, 2020, the Fund deferred, on a tax basis, a late-year ordinary loss of $505,838. Late-year ordinary losses are net ordinary losses incurred after December 31, 2019, but within the taxable year, that are deemed to arise on the first day of the Fund’s next taxable year.
During fiscal year 2021 (year to date) and fiscal year 2020, the tax character of distributions paid by the Fund was as follows:
| | | Six Months Ended | | | Year Ended | |
| | | April 30, 2021 | | | October 31, 2020 | |
Ordinary income(1) | | $ | 48,044 | | | $ | 2,630,335 | |
| Long-term capital gains | | | — | | | | 522,621 | |
| Total distributions | | $ | 48,044 | | | $ | 3,152,956 | |
(1) Ordinary income includes short-term capital gains.
9). EVENTS SUBSEQUENT TO PERIOD END
Management has evaluated the Fund’s related events and transactions that occurred subsequent to April 30, 2021, through the date of issuance of the Fund’s financial statements. Management has determined that there were no subsequent events requiring recognition or disclosure in the financial statements.
| HENNESSY FUNDS | 1-800-966-4354 | |
Expense Example (Unaudited)
April 30, 2021
As a shareholder of the Fund, you incur ongoing costs, including management fees, service fees, and other Fund expenses. This Example is intended to help you understand your ongoing costs (in dollars) of investing in the Fund and to compare these costs with the ongoing costs of investing in other mutual funds. The Example is based on an investment of $1,000 invested at the beginning of the period and held for the entire period from November 1, 2020, through April 30, 2021.
Actual Expenses
In the table below, the first line under each of the “Investor Class” and “Institutional Class” headings provides information about actual account values and actual expenses for each share class. You may use this information, together with the amount you invested, to estimate the expenses that you paid over the period. Simply divide your account value by $1,000 (for example, an $8,600 account value divided by $1,000 = 8.6), then multiply the result by the number in the first line under the heading entitled “Expenses Paid During Period” to estimate the expenses you paid on your account during this period. Although the Fund charges no sales loads or transaction fees, you will be assessed fees for outgoing wire transfers, returned checks, and stop payment orders at prevailing rates charged by U.S. Bank Global Fund Services, the Fund’s transfer agent. If you request that a redemption be made by wire transfer, the Fund’s transfer agent charges a $15 fee. IRAs are charged a $15 annual maintenance fee (up to $30 maximum per shareholder for shareholders with multiple IRAs). The examples below include, but are not limited to, management, shareholder servicing, accounting, custody, and transfer agent fees. However, the examples below do not include portfolio trading commissions and related expenses.
Hypothetical Example for Comparison Purposes
In the table below, the second line under each of the “Investor Class” and “Institutional Class” headings provides information about hypothetical account values and hypothetical expenses based on the Fund’s actual expense ratio for each share class and an assumed rate of return of 5% per year before expenses, which is not the Fund’s actual return for such share class. The hypothetical account values and expenses may not be used to estimate the actual ending account balance or expenses you paid for the period. You may use this information to compare the ongoing costs of investing in the Fund and other funds. To do so, compare these 5% hypothetical examples with the 5% hypothetical examples that appear in the shareholder reports of the other funds. Please note that the expenses shown in the table are meant to highlight your ongoing costs only. Therefore, the second lines under “Investor Class” and “Institutional Class” headings are useful in comparing ongoing costs only and will not help you determine the relative total costs of owning different funds.
| | Beginning | Ending | |
| | Account Value | Account Value | Expenses Paid |
| | November 1, 2020 | April 30, 2021
| During Period(1) |
| Investor Class | | | |
| Actual | $1,000.00 | $1,052.10 | $7.17 |
| Hypothetical (5% return before expenses) | $1,000.00 | $1,017.80 | $7.05 |
| | | | |
| Institutional Class | | | |
| Actual | $1,000.00 | $1,054.20 | $5.25 |
| Hypothetical (5% return before expenses) | $1,000.00 | $1,019.69 | $5.16 |
(1) | Expenses are equal to the Fund’s annualized expense ratio of 1.41% for Investor Class shares or 1.03% for Institutional Class shares, as applicable, multiplied by the average account value over the period, multiplied by 181/365 days (to reflect the half-year period). |
| HENNESSY FUNDS | 1-800-966-4354 | |
How to Obtain a Copy of the Fund’s Proxy
Voting Policy and Proxy Voting Records
A description of the policies and procedures the Fund uses to determine how to vote proxies relating to portfolio securities is available without charge (1) by calling 1-800-966-4354, (2)on the Hennessy Funds’ website at www.hennessyfunds.com/proxy-voting/voting-policy, or (3) on the U.S. Securities and Exchange Commission’s (the “SEC”) website at www.sec.gov. The Fund’s proxy voting record is available without charge on both the Hennessy Funds’ website at www.hennessyfunds.com/proxy-voting/voting-record and the SEC’s website at www.sec.gov no later than August 31 for the prior 12 months ending June 30.
Availability of Quarterly Portfolio Schedule
The Fund files a complete schedule of portfolio holdings with the SEC for the first and third quarters of each fiscal year as an exhibit to its reports on Form N-PORT. The Fund’s Form N-PORT reports are available on the SEC’s website at www.sec.gov or on request by calling 1-800-966-4354.
Federal Tax Distribution Information (Unaudited)
For fiscal year 2020, certain dividends paid by the Fund may be subject to a maximum tax rate of 23.8%, as provided for by the Jobs and Growth Tax Relief Reconciliation Act of 2003. The percentage of dividends declared from ordinary income designated as qualified dividend income was 100.00%.
For corporate shareholders, the percent of ordinary income distributions that qualified for the corporate dividends received deduction for fiscal year 2020 was 0.00%.
The percentage of taxable ordinary income distributions that were designated as short-term capital gain distributions under Section 871(k)(2)(C) of the Internal Revenue Code of 1986, as amended, for the Fund was 0.00%.
For the year ended October 31, 2020, the Fund earned no foreign-source income and paid no foreign taxes.
Important Notice Regarding Delivery
of Shareholder Documents
To help keep the Fund’s costs as low as possible, we generally deliver a single copy of notices, shareholder reports, proxy statements, and prospectuses to shareholders who share an address and have the same last name. This process does not apply to account statements. You may request an individual copy of a shareholder document at any time. If you would like to receive separate mailings of shareholder documents, please call U.S. Bank Global Fund Services at 1-800-261-6950 or 1-414-765-4124, and individual delivery will begin within 30 days of your request. If your account is held through a financial institution or other intermediary, please contact such intermediary directly to request individual delivery.
| PROXY VOTING — ELECTRONIC DELIVERY |
Electronic Delivery
As permitted by SEC regulations, the Fund’s shareholder reports are made available on a website, and unless you sign up for eDelivery or elect to receive paper copies as detailed below, you will be notified by mail each time a report is posted and provided with a website link to access the report.
The Fund also offers shareholders the option to receive all notices, account statements, prospectuses, tax forms, and shareholder reports online. To sign up for eDelivery or change your delivery preference, please visit www.hennessyfunds.com/account.
To elect to receive paper copies of all future reports free of charge, please call U.S. Bank Global Fund Services at 1-800-261-6950 or 1-414-765-4124.
Subscribe to receive our team’s unique market and sector insights delivered to your inbox
www.hennessyfunds.com/subscribe
Follow us on social media
| HENNESSY FUNDS | 1-800-966-4354 | |
Board Approval of Investment Advisory
Agreements
At its meeting on March 10, 2021, the Board of Trustees of the Fund (the “Board,” and the members thereof, the “Trustees”) unanimously approved the continuation of the investment advisory agreement of the Fund with Hennessy Advisors, Inc. (the “Advisor”) and the sub-advisory agreement for the Fund between the Advisor and SPARX Asset Management Co., Ltd. (the “Sub-Advisor”). As part of the process, the Trustees reviewed their fiduciary duties and the relevant factors for them to consider with respect to approving the advisory and sub-advisory agreements. In addition, the Trustees who are not deemed “interested persons” (as defined by the Investment Company Act of 1940, as amended) of the Fund (the “Independent Trustees”) met in executive session to discuss the approval of the advisory and sub-advisory agreements.
In advance of the meeting, the Advisor sent detailed information to the Trustees to assist them in their evaluation of the advisory and sub-advisory agreements. This information included, but was not limited to, the following:
| | (1) | A memorandum from outside legal counsel that described the fiduciary duties of the Board with respect to approving the continuation of the advisory and sub-advisory agreements and the relevant factors for consideration; |
| | | |
| | (2) | A memorandum from the Advisor that listed the factors relevant to the Board’s approval of the continuation of the advisory and sub-advisory agreements and also referenced the documents that had been provided to help the Board assess each such factor; |
| | | |
| | (3) | The Advisor’s financial statements from its most recent Form 10-K and Form 10-Q; |
| | | |
| | (4) | Summaries of the advisory and sub-advisory agreements; |
| | | |
| | (5) | A recent Fund fact sheet, which included performance information over various periods; |
| | | |
| | (6) | An description of the range of services provided by the Advisor and the Sub-Advisor and the distinction between the Advisor-provided services and the Sub-Advisor-provided services; |
| | | |
| | (7) | A peer expense comparison of the net expense ratio and investment advisory fee of the Fund; |
| | | |
| | (8) | A memorandum from the Adviser regarding economies of scale; |
| | | |
| | (9) | A completed questionnaire from the Sub-Advisor; |
| | | |
| | (10) | A summary of the Sub-Advisor’s responses to the questionnaire, as well as relevant information from the Sub-Advisor’s Form ADVs Parts 1 and 2 and the certifications submitted the Sub-Advisor each quarter; |
| | | |
| | (11) | Financial information of the Sub-Advisor’s parent company; and |
| | | |
| | (12) | The Sub-Advisor’s Code of Ethics. |
All of the factors discussed were considered as a whole by the Trustees and by the Independent Trustees meeting in executive session. The factors were viewed in their totality by the Trustees, with no single factor being the principal or determinative factor in the Trustees’ determination of whether to approve the continuation of the advisory and sub-advisory agreements. The Trustees recognized that the management and fee arrangements for the Fund are the result of years of review and discussion between the Independent Trustees and the Advisor, that certain aspects of such arrangements may
| BOARD APPROVAL OF INVESTMENT ADVISORY AGREEMENTS |
receive greater scrutiny in some years than in others, and that the Trustees’ conclusions may be based, in part, on their consideration of these same arrangements and information received during the course of the year and in prior years.
Prior to approving the continuation of the advisory and sub-advisory agreements, the Trustees, including the Independent Trustees in executive session, considered, among other items:
| | (1) | The nature and quality of the advisory services provided by the Advisor and the Sub-Advisor; |
| | | |
| | (2) | A comparison of the fees and expenses of the Fund to other similar funds; |
| | | |
| | (3) | Whether economies of scale are recognized by the Fund; |
| | | |
| | (4) | The costs and profitability of the Fund to the Advisor and the Sub-Advisor; |
| | | |
| | (5) | The performance of the Fund; and |
| | | |
| | (6) | Any benefits to the Advisor and the Sub-Advisor from serving as an investment advisor to the Fund (other than the advisory and sub-advisory fees). |
The material considerations and determinations of the Trustees, including the Independent Trustees, were as follows:
| | (1) | The Trustees considered the services identified below that are provided by the Advisor. Based on this review, the Trustees concluded that the Advisor provides high-quality services to the Fund and noted that their overall confidence in the Advisor was high. The Trustees also concluded that they were satisfied with the nature, extent, and quality of the advisory services provided to the Fund by the Advisor and that the nature and extent of the services provided by the Advisor were appropriate to assure that the Fund’s operations are conducted in compliance with applicable laws, rules, and regulations. |
| | | (a) | The Advisor oversees the Sub-Advisor for the Fund, and the Sub-Advisor acts as the portfolio manager for the Fund by providing portfolio management services. |
| | | | |
| | | (b) | The Advisor performs a daily reconciliation of portfolio positions and cash for the Fund. |
| | | | |
| | | (c) | The Advisor monitors the liquidity of each Fund. |
| | | | |
| | | (d) | The Advisor monitors the Fund’s compliance with its investment objectives and restrictions and federal securities laws. |
| | | | |
| | | (e) | The Advisor maintains a compliance program (including a code of ethics), conducts ongoing reviews of the compliance programs of the Sub-Advisor and the Fund’s other service providers (including their codes of ethics, as appropriate), conducts on-site visits to the Sub-Advisor and the Fund’s other service providers as feasible, monitors incidents of abusive trading practices, reviews Fund expense accruals, payments, and fixed expense ratios, evaluates insurance providers for fidelity bond, D&O/E&O insurance, and cybersecurity insurance coverage, manages regulatory examination compliance and responses, conducts employee compliance training, reviews reports provided by service providers, and maintains books and records. |
| | | | |
| | | (f) | The Advisor oversees the selection and continued employment of the Sub-Advisor, reviews the Fund’s investment performance, and monitors the Sub-Advisor’s adherence to the Fund’s investment objectives, policies, and restrictions. |
| HENNESSY FUNDS | 1-800-966-4354 | |
| | | (g) | The Advisor oversees service providers that provide accounting, administration, distribution, transfer agency, custodial, sales, marketing, public relations, audit, information technology, and legal services to the Fund. |
| | | | |
| | | (h) | The Advisor maintains in-house marketing and distribution departments on behalf of the Fund. |
| | | | |
| | | (i) | The Advisor prepares or directs the preparation of all regulatory filings for the Fund, including writing and annually updating the Fund’s prospectus and related documents. |
| | | | |
| | | (j) | For each annual report of the Fund, the Advisor reviews the written summary prepared by the Sub-Advisor of the Fund’s performance during the most recent 12-month period. |
| | | | |
| | | (k) | The Advisor oversees distribution of the Fund through third-party broker/dealers and independent financial institutions such as Charles Schwab, Inc., Fidelity, TD Ameritrade, and Pershing. The Advisor compensates, in part, a number of these third-party providers out of its own revenues. |
| | | | |
| | | (l) | The Advisor pays the incentive compensation of the Fund’s compliance officers and employs other staff, such as legal, marketing, national accounts, distribution, sales, administrative, and trading oversight personnel, as well as management executives. |
| | | | |
| | | (m) | The Advisor provides a quarterly compliance certification to the Board. |
| | | | |
| | | (n) | The Advisor prepares or reviews all Board materials, frequently presents to the Board and leads Board discussions, prepares or reviews all meeting minutes, and arranges for Board training and education. |
| | (2) | The Trustees considered the services identified below that are provided by the Sub-Advisor. Based on this review and an assessment of the Sub-Advisor’s performance, the Trustees concluded that the Sub-Advisor provides high-quality services to the Fund. The Trustees also concluded that they were satisfied with the nature, extent, and quality of the advisory services provided to the Fund by the Sub-Advisor and that the nature and extent of the services provided by the Sub-Advisor were appropriate to assure that the Fund’s portfolio aligns properly with its investment objective and principal investment strategies. |
| | | (a) | The Sub-Advisor acts as the portfolio manager for the Fund. In this capacity, the Sub-Advisor does the following: |
| | | | (i) | manages the composition of the Fund’s portfolio, including the purchase, retention, and disposition of portfolio securities in accordance with the Fund’s investment objectives, policies, and restrictions; |
| | | | | |
| | | | (ii) | seeks best execution for the Fund’s portfolio; and |
| | | | | |
| | | | (iii) | manages proxy voting for the Fund. |
| | | (b) | The Sub-Advisor ensures that its compliance program includes policies and procedures relevant to the Fund and the Sub-Advisor’s duties as a portfolio manager to the Fund. |
| | | | |
| | | (c) | For each annual report of the Fund, the Sub-Advisor prepares a written summary of the Fund’s performance during the most recent 12-month period. |
| BOARD APPROVAL OF INVESTMENT ADVISORY AGREEMENTS |
| | | (d) | The Sub-Advisor provides a quarterly compliance certification to the Board regarding trading and allocation practices, supervisory matters, the Sub-Advisor’s compliance program (including its code of ethics), compliance with the Fund’s policies, and general firm updates. |
| | (3) | The Trustees considered the distinction between the services performed by the Advisor and the Sub-Advisor. The Trustees noted that the management of the Fund, including the oversight of the Sub-Advisor, involves more comprehensive and substantive duties than the duties of the Sub-Advisor. Specifically, the Trustees considered the lists of services identified above and concluded that the services performed by the Advisor for the Fund require a higher level of service and oversight than the services performed by the Sub-Advisor. Based on this determination, the Trustees concluded that the differential in advisory fees between the Advisor and the Sub-Advisor is reasonable. |
| | | |
| | (4) | The Trustees compared the performance of the Fund to benchmark indices over various periods and also noted that the Trustees review and discuss reports comparing the investment performance of the Fund to various indices at each quarterly Board meeting. Based on such information, the Trustees determined that the Advisor and the Sub-Advisor manage the Fund in a manner materially consistent with its stated investment objective and style. The Trustees concluded that the performance of the Fund over various periods warranted continuation of the advisory and sub-advisory agreements. |
| | | |
| | (5) | The Trustees reviewed the advisory fees and overall expense ratios of the Fund compared to other funds similar in asset size and investment objective to the Fund using data from Morningstar. As part of the discussion with management, the Trustees ensured that they understood and were comfortable with the criteria used to determine the mutual funds included in the Morningstar categories for purposes of the materials considered at the meeting. The Trustees determined that the advisory fee and overall expense ratio of the Fund falls within the range of the advisory fees and overall expense ratios of other comparable funds and concluded that they are reasonable and warranted continuation of the advisory and sub-advisory agreements. |
| | | |
| | (6) | The Trustees also considered whether the Advisor was realizing economies of scale that it should share with the Fund’s shareholders. The Trustees noted that many of the expenses incurred to manage the Fund are asset-based fees, so the Advisor would not realize material economies of scale relating to those expenses as the assets of the Fund increase. For example, third-party platform fees and sub-advisory fees increase as the Fund’s assets grow. The Trustees also considered the Advisor’s significant marketing efforts to promote the Funds and the Advisor’s agreement to waive fees or lower its management fees in certain circumstances. |
| | | |
| | (7) | The Trustees considered the profitability of the Advisor and the Sub-Advisor, including the impact of mutual fund platform fees on the Advisor’s profitability, and also considered the resources and revenues that the Advisor has put into managing and distributing the Fund. The Trustees then concluded that the profits of the Advisor and the Sub-Advisor are reasonable and not excessive when compared to profitability guidelines set forth in relevant court cases. |
| | | |
| | (8) | The Trustees considered the high level of professionalism and knowledge of the Advisor’s employees, along with a very low level of turnover, and concluded that this was beneficial to the Fund and its shareholders. |
| HENNESSY FUNDS | 1-800-966-4354 | |
| | (9) | The Trustees considered any benefits to the Advisor and the Sub-Advisor from serving as an advisor to the Fund (other than the advisory and sub-advisory fees). The Trustees noted that the Advisor and the Sub-Advisor may derive ancillary benefits from, by way of example, their association with the Fund in the form of proprietary and third-party research products and services received from broker-dealers that execute portfolio trades for the Fund. The Trustees determined that any such products and services have been used for legitimate purposes relating to the Fund by providing assistance in the investment decision-making process. The Trustees concluded that any additional benefits realized by the Advisor and the Sub-Advisor from their relationship with the Fund were reasonable, which was based on, among other things, the Trustees’ findings that (i) the research, analytical, statistical, and other information and services provided by brokers are merely supplemental to the Advisor’s and the Sub-Advisor’s own efforts in the performance of their duties under the advisory and sub-advisory agreements and (ii) although the Sub-Advisor could derive benefits from the conversion of Fund shareholders into separate account clients, the Fund also could benefit from potential institutional shareholders who might choose to invest in the Fund. |
After reviewing the materials and information provided at the meeting, as well as other information regularly provided at the Board’s quarterly meetings throughout the year regarding the quality of services provided by the Advisor and the Sub-Advisor, the performance of the Fund, expense information, brokerage commissions information, the adequacy and efficacy of the Advisor’s and the Sub-Advisor’s written policies and procedures, other regulatory compliance issues, trading information and related matters, and other factors that the Trustees deemed relevant, the Trustees, including the Independent Trustees, approved the continuation of the advisory and sub-advisory agreements.
| BOARD APPROVAL OF INVESTMENT ADVISORY AGREEMENTS |
(This Page Intentionally Left Blank.)
For information, questions, or assistance, please call
The Hennessy Funds
1-800-966-4354 or 1-415-899-1555
INVESTMENT ADVISOR
Hennessy Advisors, Inc.
7250 Redwood Boulevard, Suite 200
Novato, California 94945
ADMINISTRATOR,
TRANSFER AGENT,
DIVIDEND PAYING AGENT, &
SHAREHOLDER SERVICING AGENT
U.S. Bancorp Fund Services, LLC
d/b/a U.S. Bank Global Fund Services
P.O. Box 701
Milwaukee, Wisconsin 53201-0701
CUSTODIAN
U.S. Bank N.A.
Custody Operations
1555 North River Center Drive, Suite 302
Milwaukee, Wisconsin 53212
TRUSTEES
Neil J. Hennessy
Robert T. Doyle
J. Dennis DeSousa
Gerald P. Richardson
COUNSEL
Foley & Lardner LLP
777 East Wisconsin Avenue
Milwaukee, Wisconsin 53202-5306
INDEPENDENT REGISTERED
PUBLIC ACCOUNTING FIRM
Tait, Weller & Baker LLP
Two Liberty Place
50 South 16th Street, Suite 2900
Philadelphia, Pennsylvania 19102-2529
DISTRIBUTOR
Quasar Distributors, LLC
111 East Kilbourn Avenue, Suite 2200
Milwaukee, Wisconsin 53202
www.hennessyfunds.com | 1-800-966-4354
This report has been prepared for shareholders and may be distributed to
others only if preceded or accompanied by a current prospectus.
SEMI-ANNUAL REPORT
APRIL 30, 2021
HENNESSY JAPAN SMALL CAP FUND
Investor Class HJPSX
Institutional Class HJSIX
www.hennessyfunds.com | 1-800-966-4354
(This Page Intentionally Left Blank.)
Contents
| Letter to Shareholders | 2 |
| Performance Overview | 4 |
| Financial Statements | |
| Schedule of Investments | 5 |
| Statement of Assets and Liabilities | 10 |
| Statement of Operations | 11 |
| Statements of Changes in Net Assets | 13 |
| Financial Highlights | 14 |
| Notes to the Financial Statements | 18 |
| Expense Example | 26 |
| Proxy Voting Policy and Proxy Voting Records | 28 |
| Availability of Quarterly Portfolio Schedule | 28 |
| Federal Tax Distribution Information | 28 |
| Important Notice Regarding Delivery of Shareholder Documents | 28 |
| Electronic Delivery | 29 |
| Board Approval of Investment Advisory Agreements | 30 |
| HENNESSY FUNDS | 1-800-966-4354 | |
May 2021
Dear Hennessy Funds Shareholder:
The Japanese stock market gained 16.59% as measured by the Tokyo Stock Price Index (TOPIX) over the six months ended April 30, 2021 (in U.S. dollar terms).
While Japan continued to experience COVID-19 infections during the period, the Japanese stock market marched higher through mid-February, reaching a 30-year high. Among the factors contributing to this rally were proactive countermeasures against COVID-19, including continued monetary easing globally, rising expectations for the development and distribution of vaccines, and hopes for a quick economic recovery. Japan’s vaccine rollout, however, has been slower than that of other countries. This is primarily due to regulations requiring a domestic Japanese clinical trial regardless of foreign regulatory approvals. Nevertheless, the number of cases in Japan remains relatively low when compared to the United States. For example, as of mid-April, there were more than 10 times as many cases in the United States as in Japan, even though the population of the United States is only three times larger.
While the broader market remained strong, rising interest rates and inflation concerns continued to weigh on investors. We believe that the recent rise of interest rates is part of a natural course of a short-term correction in financial markets. Last year’s pandemic prompted central banks around the world to go all out in easing the monetary system, driving down further what had already been historically low rates. If the pandemic turns out to be nearing its end, then we believe this extra dip in rates should at least normalize to pre-pandemic levels relatively soon. With the ongoing rollout of vaccinations and declines in new infection cases, we could be at that very stage. The good news is that the normalization of interest rates validates the recovery in economic activity.
If history is any guide, the next worry will be inflation, which effectively “swindles the equity investor,” as Warren Buffett famously said in his 1977 Fortune column. This notion, however, is somewhat premature in our view. It is worth noting that in the run-up prior to the pandemic, the world economy didn’t have any structural excesses like production capacity overbuild or debt-fueled overconsumption, which are typically a recipe for a deep recession. With the household savings rate climbing high, consumers are eager to spend. As such, it is reasonable to assume that once the pandemic is brought under control, demand for goods and services will likely outstrip supply in the short term, which may result in a temporary pickup in inflation.
Whether inflation will persist is a big question mark, however. Particularly in Japan, even though well over a decade of ultra-loose monetary policy has created abundant liquidity in the financial system, it has not made its way to the real economy. For example, since the end of 2009, Japan’s monetary base has increased sixfold, but the money supply has not grown nearly as much while CPI has struggled to stay in positive territory. Aging demographics and a declining population are perennial problems from which Japan does not seem able to escape. Furthermore, the advancement of technology, such as e-commerce and the digital economy, has been effective at taming upward pressure on prices of goods and services globally. Putting all these things together, our view is that a continuous rise in interest rates beyond the correction territory is unlikely.
As such, it is hard to image inflation taking hold in our domestic economy at this point in time. The Bank of Japan will likely continue with the current monetary policy framework, keeping rates around zero through so-called yield curve control along with other easing measures. We remain optimistic about the long-term prospects for Japan and its stock market.
Thank you for your continued confidence and investment in the Hennessy Funds.
Sincerely,
| |
| Tadahiro Fujimura | Masakazu Takeda |
| Portfolio Manager, | Portfolio Manager, |
| Hennessy Japan Small Cap Fund; | Hennessy Japan Fund; |
| Chief Investment Officer | Fund Manager |
| SPARX Asset Management Co., Ltd. | SPARX Asset Management Co., Ltd. |
SPARX Asset Management Co., Ltd., located in Tokyo, Japan, is the sub-advisor to the Hennessy Japan Fund and the Hennessy Japan Small Cap Fund.
Past performance does not guarantee future results.
Mutual fund investing involves risk. Principal loss is possible.
Opinions expressed are those of Tadahiro Fujimura and Masakazu Takeda and are subject to change, are not guaranteed, and should not be considered investment advice.
The Tokyo Stock Price Index (TOPIX) is a capitalization-weighted index of all of the companies listed on the First Section of the Tokyo Stock Exchange. The index is used herein for comparative purposes in accordance with SEC regulations. One cannot invest directly in an index.
| HENNESSY FUNDS | 1-800-966-4354 | |
Performance Overview (Unaudited)
AVERAGE ANNUAL TOTAL RETURN FOR PERIODS ENDED APRIL 30, 2021
| | Six | One | Five | Ten |
| | Months(1) | Year
| Years
| Years
|
| Hennessy Japan Small Cap Fund – | | | | |
| Investor Class (HJPSX) | 12.79% | 34.40% | 13.59% | 12.86% |
| Hennessy Japan Small Cap Fund – | | | | |
Institutional Class (HJSIX)(2) | 12.99% | 34.90% | 14.01% | 13.09% |
| Russell/Nomura | | | | |
Small CapTM Index | 11.29% | 25.84% | 8.38% | 8.59% |
| Tokyo Price Index (TOPIX) | 16.59% | 29.94% | 9.57% | 7.56% |
Expense ratios: 1.55% (Investor Class); 1.13% (Institutional Class)
(1) | Periods of less than one year are not annualized. |
(2) | The inception date of Institutional Class shares is June 15, 2015. Performance shown prior to the inception of Institutional Class shares reflects the performance of Investor Class shares and includes expenses that are not applicable to, and are higher than, those of Institutional Class shares. |
_______________
Performance data quoted represents past performance; past performance does not guarantee future results. The investment return and principal value of an investment will fluctuate so that an investor’s shares, when redeemed, may be worth more or less than their original cost. The performance table does not reflect the deduction of taxes that a shareholder would pay on Fund distributions or the redemption of Fund shares. Current performance of the Fund may be lower or higher than the performance quoted. Performance data current to the most recent month end may be obtained by visiting www.hennessyfunds.com.
The Russell/Nomura Small Cap™ Index contains the bottom 15% of the Russell/Nomura Total Market™ Index based on market capitalization. The Tokyo Price Index (TOPIX) is a capitalization-weighted index of all of the companies listed on the First Section of the Tokyo Stock Exchange. One cannot invest directly in an index. These indices are used herein for comparative purposes in accordance with Securities and Exchange Commission regulations.
Frank Russell Company (“Russell”) is the source and owner of the trademarks, service marks, and copyrights related to the Russell Indexes. Russell® is a trademark of Frank Russell Company. Neither Russell nor its licensors accept any liability for any errors or omissions in the Russell Indexes or Russell ratings or underlying data and no party may rely on any Russell Indexes or Russell ratings or underlying data contained in this communication. No further distribution of Russell data is permitted without Russell’s express written consent. Russell does not promote, sponsor, or endorse the content of this communication.
The expense ratios presented are from the most recent prospectus. The expense ratios for the current reporting period are available in the Financial Highlights section of this report.
| PERFORMANCE OVERVIEW/SCHEDULE OF INVESTMENTS |
Financial Statements
Schedule of Investments as of April 30, 2021 (Unaudited) |
HENNESSY JAPAN SMALL CAP FUND
(% of Net Assets)
| TOP TEN HOLDINGS (EXCLUDING MONEY MARKET FUNDS) | % NET ASSETS |
| Iwatani Corp. | 2.41% |
| Fugi Corp. | 2.24% |
| Digital Garage, Inc. | 2.06% |
| Hanwa Co., Ltd. | 2.06% |
| Tocalo Co., Ltd. | 2.06% |
| Kito Corp. | 2.00% |
| MIRAIT Holdings Corp. | 2.00% |
| Mitsubishi Logisnext Co., Ltd. | 1.99% |
| Ship Healthcare Holdings, Inc. | 1.97% |
| Musashi Seimitsu Industry Co., Ltd. | 1.95% |
Note: For presentation purposes, the Fund has grouped some of the industry categories. For purposes of categorizing securities for compliance with Section 8(b)(1) of the Investment Company Act of 1940, as amended, the Fund uses more specific industry classifications.
The Global Industry Classification Standard (GICS®) was developed by and is the exclusive property and a service mark of MSCI, Inc. and Standard & Poor’s Financial Services LLC. It has been licensed for use by the Hennessy Funds.
| HENNESSY FUNDS | 1-800-966-4354 | |
| COMMON STOCKS – 90.01% | | Number | | | | | | % of | |
| | | of Shares | | | Value | | | Net Assets | |
| Communication Services – 1.05% | | | | | | | | | |
| Septeni Holdings Co., Ltd. | | | 226,300 | | | $ | 1,041,531 | | | | 1.05 | % |
| | | | | | | | | | | | | |
| Consumer Discretionary – 11.44% | | | | | | | | | | | | |
| Benesse Holdings, Inc. | | | 50,000 | | | | 1,103,944 | | | | 1.11 | % |
| Matsuoka Corp. | | | 59,200 | | | | 986,937 | | | | 0.99 | % |
| Musashi Seimitsu Industry Co., Ltd. | | | 111,000 | | | | 1,938,869 | | | | 1.95 | % |
| NGK Spark Plug Co., Ltd. | | | 98,500 | | | | 1,643,920 | | | | 1.66 | % |
| Nojima Corp. | | | 32,400 | | | | 808,147 | | | | 0.81 | % |
| Pacific Industrial Co., Ltd. | | | 126,300 | | | | 1,355,567 | | | | 1.37 | % |
| Saizeriya Co., Ltd. | | | 76,700 | | | | 1,681,519 | | | | 1.69 | % |
| Seiren Co., Ltd. | | | 106,400 | | | | 1,841,969 | | | | 1.86 | % |
| | | | | | | | 11,360,872 | | | | 11.44 | % |
| | | | | | | | | | | | | |
| Consumer Staples – 4.40% | | | | | | | | | | | | |
| Cosmos Pharmaceutical Corp. | | | 7,200 | | | | 1,033,654 | | | | 1.04 | % |
| Nippn Corp. | | | 68,700 | | | | 980,620 | | | | 0.99 | % |
| Nishimoto Co., Ltd. | | | 61,700 | | | | 1,441,868 | | | | 1.45 | % |
| Yoshimura Food Holdings KK (a) | | | 118,900 | | | | 909,511 | | | | 0.92 | % |
| | | | | | | | 4,365,653 | | | | 4.40 | % |
| | | | | | | | | | | | | |
| Energy – 2.41% | | | | | | | | | | | | |
| Iwatani Corp. | | | 38,100 | | | | 2,388,005 | | | | 2.41 | % |
| | | | | | | | | | | | | |
| Financials – 4.63% | | | | | | | | | | | | |
| AEON Financial Service Co., Ltd. | | | 137,600 | | | | 1,561,204 | | | | 1.57 | % |
| Aruhi Corp. | | | 50,000 | | | | 805,197 | | | | 0.81 | % |
| Lifenet Insurance Co. (a) | | | 82,200 | | | | 983,783 | | | | 0.99 | % |
| Musashino Bank Ltd. | | | 83,700 | | | | 1,244,510 | | | | 1.26 | % |
| | | | | | | | 4,594,694 | | | | 4.63 | % |
| | | | | | | | | | | | | |
| Health Care – 2.77% | | | | | | | | | | | | |
| CYBERDYNE, Inc. (a) | | | 138,100 | | | | 791,020 | | | | 0.80 | % |
| Ship Healthcare Holdings, Inc. | | | 74,600 | | | | 1,954,931 | | | | 1.97 | % |
| | | | | | | | 2,745,951 | | | | 2.77 | % |
| | | | | | | | | | | | | |
| Industrials – 36.11% | | | | | | | | | | | | |
| Bell System24 Holdings, Inc. | | | 102,400 | | | | 1,545,042 | | | | 1.56 | % |
| Benefit One, Inc. | | | 63,200 | | | | 1,586,217 | | | | 1.60 | % |
| Creek & River Co., Ltd. | | | 103,300 | | | | 1,471,664 | | | | 1.48 | % |
| Daihen Corp. | | | 40,900 | | | | 1,788,837 | | | | 1.80 | % |
The accompanying notes are an integral part of these financial statements.
| COMMON STOCKS | | Number | | | | | | % of | |
| | | of Shares | | | Value | | | Net Assets | |
| Industrials (Continued) | | | | | | | | | |
| Fugi Corp. | | | 83,600 | | | $ | 2,226,733 | | | | 2.24 | % |
| Hanwa Co., Ltd. | | | 68,700 | | | | 2,039,816 | | | | 2.06 | % |
| Hito Communications Holdings, Inc. | | | 100,400 | | | | 1,899,782 | | | | 1.91 | % |
| Kawada Technologies, Inc. | | | 33,900 | | | | 1,361,707 | | | | 1.37 | % |
| Kito Corp. | | | 121,700 | | | | 1,986,575 | | | | 2.00 | % |
| METAWATER Co., Ltd. | | | 75,900 | | | | 1,475,775 | | | | 1.49 | % |
| MIRAIT Holdings Corp. | | | 122,700 | | | | 1,982,690 | | | | 2.00 | % |
| Mitsubishi Logisnext Co., Ltd. | | | 165,800 | | | | 1,970,667 | | | | 1.99 | % |
| Nichiha Corp. | | | 35,800 | | | | 1,038,393 | | | | 1.05 | % |
| Nihon Flush Co., Ltd. | | | 110,600 | | | | 1,261,947 | | | | 1.27 | % |
| Nippon Koei Co., Ltd. | | | 69,700 | | | | 1,880,095 | | | | 1.89 | % |
| Sato Holdings Corp. | | | 74,300 | | | | 1,820,619 | | | | 1.83 | % |
| SBS Holdings, Inc. | | | 78,400 | | | | 1,925,388 | | | | 1.94 | % |
| Senko Group Holdings Co., Ltd. | | | 191,200 | | | | 1,758,221 | | | | 1.77 | % |
| Takeei Corp. | | | 157,000 | | | | 1,782,752 | | | | 1.80 | % |
| Tanseisha Co., Ltd. | | | 130,400 | | | | 989,126 | | | | 1.00 | % |
| Tocalo Co., Ltd. | | | 150,700 | | | | 2,047,667 | | | | 2.06 | % |
| | | | | | | | 35,839,713 | | | | 36.11 | % |
| | | | | | | | | | | | | |
| Information Technology – 17.01% | | | | | | | | | | | | |
| Digital Garage, Inc. | | | 49,600 | | | | 2,044,542 | | | | 2.06 | % |
| Elecom Co., Ltd. | | | 66,400 | | | | 1,397,383 | | | | 1.41 | % |
| Macnica Fuji Electronics Holdings, Inc. | | | 77,200 | | | | 1,558,975 | | | | 1.57 | % |
| Mimaki Engineering Co., Ltd. | | | 232,500 | | | | 1,370,025 | | | | 1.38 | % |
| Nihon Unisys Ltd. | | | 42,700 | | | | 1,353,788 | | | | 1.36 | % |
| Nippon Signal Company, Ltd. | | | 130,600 | | | | 1,107,752 | | | | 1.11 | % |
| Poletowin Pitcrew Holdings, Inc. | | | 105,400 | | | | 1,089,779 | | | | 1.10 | % |
| Rorze Corp. | | | 14,600 | | | | 1,323,872 | | | | 1.33 | % |
| SIIX Corp. | | | 73,500 | | | | 981,211 | | | | 0.99 | % |
| Towa Corp. | | | 74,400 | | | | 1,468,394 | | | | 1.48 | % |
| Transcosmos, Inc. | | | 57,300 | | | | 1,635,795 | | | | 1.65 | % |
| Yamaichi Electronics Co., Ltd. | | | 105,000 | | | | 1,558,331 | | | | 1.57 | % |
| | | | | | | | 16,889,847 | | | | 17.01 | % |
The accompanying notes are an integral part of these financial statements.
| HENNESSY FUNDS | 1-800-966-4354 | |
| COMMON STOCKS | | Number | | | | | | % of | |
| | | of Shares | | | Value | | | Net Assets | |
| Materials – 6.08% | | | | | | | | | |
| Asia Pile Holdings Corp. | | | 370,700 | | | $ | 1,726,474 | | | | 1.74 | % |
| Rengo Co., Ltd. | | | 154,100 | | | | 1,278,879 | | | | 1.29 | % |
| Sanyo Chemical Industries Ltd. | | | 34,800 | | | | 1,652,594 | | | | 1.66 | % |
| Tokyo Ohka Kogyo Co., Ltd. | | | 20,700 | | | | 1,375,075 | | | | 1.39 | % |
| | | | | | | | 6,033,022 | | | | 6.08 | % |
| | | | | | | | | | | | | |
| Real Estate – 2.17% | | | | | | | | | | | | |
| Star Mica Holdings Co., Ltd. | | | 115,400 | | | | 1,162,553 | | | | 1.17 | % |
| Tosei Corp. | | | 100,300 | | | | 992,079 | | | | 1.00 | % |
| | | | | | | | 2,154,632 | | | | 2.17 | % |
| | | | | | | | | | | | | |
| Utilities – 1.94% | | | | | | | | | | | | |
| EF-ON, Inc. | | | 204,900 | | | | 1,931,073 | | | | 1.94 | % |
| | | | | | | | | | | | | |
| Total Common Stocks | | | | | | | | | | | | |
| (Cost $73,726,758) | | | | | | | 89,344,993 | | | | 90.01 | % |
| | | | | | | | | | | | | |
| SHORT-TERM INVESTMENTS – 10.17% | | | | | | | | | | | | |
| | | | | | | | | | | | | |
| Money Market Funds – 10.17% | | | | | | | | | | | | |
| Fidelity Government Portfolio, Institutional Class, 0.01% (b) | | | 179,867 | | | | 179,867 | | | | 0.17 | % |
| First American Government Obligations Fund, | | | | | | | | | | | | |
| Institutional Class, 0.03% (b) | | | 4,960,000 | | | | 4,960,000 | | | | 5.00 | % |
| First American Treasury Obligations Fund, | | | | | | | | | | | | |
| Institutional Class, 0.03% (b) | | | 4,960,000 | | | | 4,960,000 | | | | 5.00 | % |
| | | | | | | | | | | | | |
| Total Short-Term Investments | | | | | | | | | | | | |
| (Cost $10,099,867) | | | | | | | 10,099,867 | | | | 10.17 | % |
| | | | | | | | | | | | | |
| Total Investments | | | | | | | | | | | | |
| (Cost $83,826,625) – 100.18% | | | | | | | 99,444,860 | | | | 100.18 | % |
| Liabilities in Excess of Other Assets – (0.18)% | | | | | | | (182,310 | ) | | | (0.18 | )% |
| | | | | | | | | | | | | |
TOTAL NET ASSETS – 100.00% | | | | | | $ | 99,262,550 | | | | 100.00 | % |
Percentages are stated as a percent of net assets.
| (a) | Non-income-producing security. |
| (b) | The rate listed is the fund’s seven-day yield as of April 30, 2021. |
The accompanying notes are an integral part of these financial statements.
Summary of Fair Value Exposure as of April 30, 2021
The following is a summary of the inputs used to value the Fund’s net assets as of April 30, 2021 (see Note 3 in the accompanying Notes to the Financial Statements):
| Common Stocks | | Level 1 | | | Level 2 | | | Level 3 | | | Total | |
| Communication Services | | $ | 1,041,531 | | | $ | — | | | $ | — | | | $ | 1,041,531 | |
| Consumer Discretionary | | | 11,360,872 | | | | — | | | | — | | | | 11,360,872 | |
| Consumer Staples | | | 4,365,653 | | | | — | | | | — | | | | 4,365,653 | |
| Energy | | | 2,388,005 | | | | — | | | | — | | | | 2,388,005 | |
| Financials | | | 4,594,694 | | | | — | | | | — | | | | 4,594,694 | |
| Health Care | | | 2,745,951 | | | | — | | | | — | | | | 2,745,951 | |
| Industrials | | | 35,839,713 | | | | — | | | | — | | | | 35,839,713 | |
| Information Technology | | | 16,889,847 | | | | — | | | | — | | | | 16,889,847 | |
| Materials | | | 6,033,022 | | | | — | | | | — | | | | 6,033,022 | |
| Real Estate | | | 2,154,632 | | | | — | | | | — | | | | 2,154,632 | |
| Utilities | | | 1,931,073 | | | | — | | | | — | | | | 1,931,073 | |
| Total Common Stocks | | $ | 89,344,993 | | | $ | — | | | $ | — | | | $ | 89,344,993 | |
| Short-Term Investments | | | | | | | | | | | | | | | | |
| Money Market Funds | | $ | 10,099,867 | | | $ | — | | | $ | — | | | $ | 10,099,867 | |
| Total Short-Term Investments | | $ | 10,099,867 | | | $ | — | | | $ | — | | | $ | 10,099,867 | |
| Total Investments | | $ | 99,444,860 | | | $ | — | | | $ | — | | | $ | 99,444,860 | |
The accompanying notes are an integral part of these financial statements.
| HENNESSY FUNDS | 1-800-966-4354 | |
Financial Statements
Statement of Assets and Liabilities as of April 30, 2021 (Unaudited) |
| ASSETS: | | | |
| Investments in securities, at value (cost $83,826,625) | | $ | 99,444,860 | |
| Dividends and interest receivable | | | 734,233 | |
| Receivable for fund shares sold | | | 136,078 | |
| Prepaid expenses and other assets | | | 14,049 | |
| Total assets | | | 100,329,220 | |
| | | | | |
| LIABILITIES: | | | | |
| Payable for securities purchased | | | 449,605 | |
| Payable for fund shares redeemed | | | 467,312 | |
| Payable to advisor | | | 66,075 | |
| Payable to sub-transfer agents | | | 29,175 | |
| Payable to administrator | | | 19,572 | |
| Payable to auditor | | | 11,227 | |
| Accrued distribution fees | | | 8,870 | |
| Accrued service fees | | | 4,222 | |
| Accrued trustees fees | | | 4,868 | |
| Accrued expenses and other payables | | | 5,744 | |
| Total liabilities | | | 1,066,670 | |
| NET ASSETS | | $ | 99,262,550 | |
| | | | | |
| NET ASSETS CONSISTS OF: | | | | |
| Capital stock | | $ | 83,235,469 | |
| Total distributable earnings | | | 16,027,081 | |
| Total net assets | | $ | 99,262,550 | |
| | | | | |
| NET ASSETS: | | | | |
| Investor Class | | | | |
| Shares authorized (no par value) | | Unlimited | |
| Net assets applicable to outstanding shares | | $ | 49,890,705 | |
| Shares issued and outstanding | | | 2,819,068 | |
| Net asset value, offering price, and redemption price per share | | $ | 17.70 | |
| | | | | |
| Institutional Class | | | | |
| Shares authorized (no par value) | | Unlimited | |
| Net assets applicable to outstanding shares | | $ | 49,371,845 | |
| Shares issued and outstanding | | | 2,822,471 | |
| Net asset value, offering price, and redemption price per share | | $ | 17.49 | |
The accompanying notes are an integral part of these financial statements.
| STATEMENT OF ASSETS AND LIABILITIES/STATEMENT OF OPERATIONS |
Financial Statements
Statement of Operations for the six months ended April 30, 2021 (Unaudited) |
| INVESTMENT INCOME: | | | |
Dividend income(1) | | $ | 877,973 | |
| Interest income | | | 861 | |
| Total investment income | | | 878,834 | |
| | | | | |
| EXPENSES: | | | | |
| Investment advisory fees (See Note 5) | | | 371,833 | |
| Sub-transfer agent expenses – Investor Class (See Note 5) | | | 56,525 | |
| Sub-transfer agent expenses – Institutional Class (See Note 5) | | | 17,882 | |
| Administration, accounting, custody, and transfer agent fees (See Note 5) | | | 57,069 | |
| Distribution fees – Investor Class (See Note 5) | | | 38,351 | |
| Service fees – Investor Class (See Note 5) | | | 25,568 | |
| Federal and state registration fees | | | 15,078 | |
| Compliance expense (See Note 5) | | | 13,844 | |
| Audit fees | | | 11,227 | |
| Trustees’ fees and expenses | | | 9,412 | |
| Reports to shareholders | | | 7,270 | |
| Legal fees | | | 636 | |
| Other expenses | | | 6,878 | |
| Total expenses | | | 631,573 | |
| NET INVESTMENT INCOME | | $ | 247,261 | |
| | | | | |
| REALIZED AND UNREALIZED GAINS (LOSSES): | | | | |
| Net realized gain on investments | | $ | 1,113,205 | |
| Net change in unrealized appreciation/depreciation on investments | | | 8,843,050 | |
| Net gain on investments | | | 9,956,255 | |
| NET INCREASE IN NET ASSETS RESULTING FROM OPERATIONS | | $ | 10,203,516 | |
(1) | Net of foreign taxes withheld of $97,552. |
The accompanying notes are an integral part of these financial statements.
| HENNESSY FUNDS | 1-800-966-4354 | |
(This Page Intentionally Left Blank.)
| STATEMENTS OF CHANGES IN NET ASSETS |
Financial Statements
| Statements of Changes in Net Assets |
| | | Six Months Ended | | | | |
| | | April 30, 2021 | | | Year Ended | |
| | | (Unaudited) | | | October 31, 2020 | |
| OPERATIONS: | | | | | | |
| Net investment income | | $ | 247,261 | | | $ | 250,103 | |
| Net realized gain on investments | | | 1,113,205 | | | | 4,449,101 | |
| Net change in unrealized | | | | | | | | |
| appreciation/depreciation on investments | | | 8,843,050 | | | | (6,227,200 | ) |
| Net increase (decrease) in net | | | | | | | | |
| assets resulting from operations | | | 10,203,516 | | | | (1,527,996 | ) |
| | | | | | | | | |
| DISTRIBUTIONS TO SHAREHOLDERS: | | | | | | | | |
| Distributable earnings – Investor Class | | | (121,857 | ) | | | (876,351 | ) |
| Distributable earnings – Institutional Class | | | (260,753 | ) | | | (1,083,137 | ) |
| Total distributions | | | (382,610 | ) | | | (1,959,488 | ) |
| | | | | | | | | |
| CAPITAL SHARE TRANSACTIONS: | | | | | | | | |
| Proceeds from shares subscribed – Investor Class | | | 6,065,336 | | | | 10,928,761 | |
| Proceeds from shares subscribed – Institutional Class | | | 19,347,078 | | | | 17,157,226 | |
| Dividends reinvested – Investor Class | | | 116,988 | | | | 843,742 | |
| Dividends reinvested – Institutional Class | | | 246,865 | | | | 990,566 | |
| Cost of shares redeemed – Investor Class | | | (8,544,329 | ) | | | (30,850,983 | ) |
| Cost of shares redeemed – Institutional Class | | | (8,788,312 | ) | | | (44,670,336 | ) |
| Net increase (decrease) in net assets derived | | | | | | | | |
| from capital share transactions | | | 8,443,626 | | | | (45,601,024 | ) |
| TOTAL INCREASE (DECREASE) IN NET ASSETS | | | 18,264,532 | | | | (49,088,508 | ) |
| | | | | | | | | |
| NET ASSETS: | | | | | | | | |
| Beginning of period | | | 80,998,018 | | | | 130,086,526 | |
| End of period | | $ | 99,262,550 | | | $ | 80,998,018 | |
| | | | | | | | | |
| CHANGES IN SHARES OUTSTANDING: | | | | | | | | |
| Shares sold – Investor Class | | | 342,806 | | | | 740,416 | |
| Shares sold – Institutional Class | | | 1,087,463 | | | | 1,237,542 | |
| Shares issued to holders as reinvestment | | | | | | | | |
| of dividends – Investor Class | | | 6,496 | | | | 52,999 | |
| Shares issued to holders as reinvestment | | | | | | | | |
| of dividends – Institutional Class | | | 13,884 | | | | 63,013 | |
| Shares redeemed – Investor Class | | | (481,525 | ) | | | (2,138,457 | ) |
| Shares redeemed – Institutional Class | | | (498,819 | ) | | | (3,253,564 | ) |
| Net increase (decrease) in shares outstanding | | | 470,305 | | | | (3,298,051 | ) |
The accompanying notes are an integral part of these financial statements.
| HENNESSY FUNDS | 1-800-966-4354 | |
Financial Statements
For an Investor Class share outstanding throughout each period
| | | Six Months Ended | |
| | | April 30, 2021 | |
| | | (Unaudited) | |
| PER SHARE DATA: | | | |
| Net asset value, beginning of period | | $ | 15.73 | |
| | | | | |
| Income from investment operations: | | | | |
| Net investment income | | | 0.03 | (1) |
| Net realized and unrealized gains on investments | | | 1.98 | |
| Total from investment operations | | | 2.01 | |
| | | | | |
| Less distributions: | | | | |
| Dividends from net investment income | | | (0.04 | ) |
| Dividends from net realized gains | | | — | |
| Total distributions | | | (0.04 | ) |
| Net asset value, end of period | | $ | 17.70 | |
| | | | | |
| TOTAL RETURN | | | 12.79 | %(2) |
| | | | | |
| SUPPLEMENTAL DATA AND RATIOS: | | | | |
| Net assets, end of period (millions) | | $ | 49.89 | |
| Ratio of expenses to average net assets | | | 1.53 | %(3) |
| Ratio of net investment income to average net assets | | | 0.32 | %(3) |
Portfolio turnover rate(4) | | | 15 | %(2) |
(1) | Calculated using the average shares outstanding method. |
(2) | Not annualized. |
(3) | Annualized. |
(4) | Calculated on the basis of the Fund as a whole. |
The accompanying notes are an integral part of these financial statements.
| FINANCIAL HIGHLIGHTS — INVESTOR CLASS |
| Year Ended October 31, | |
| 2020 | | | 2019 | | | 2018 | | | 2017 | | | 2016 | |
| | | | | | | | | | | | | | |
| $ | 15.43 | | | $ | 14.99 | | | $ | 14.92 | | | $ | 11.29 | | | $ | 10.29 | |
| | | | | | | | | | | | | | | | | | | |
| | | | | | | | | | | | | | | | | | | |
| | 0.01 | (1) | | | 0.03 | (1) | | | 0.05 | | | | 0.08 | | | | 0.03 | |
| | 0.50 | | | | 0.88 | | | | 0.35 | | | | 3.77 | | | | 1.31 | |
| | 0.51 | | | | 0.91 | | | | 0.40 | | | | 3.85 | | | | 1.34 | |
| | | | | | | | | | | | | | | | | | | |
| | | | | | | | | | | | | | | | | | | |
| | (0.21 | ) | | | — | | | | (0.05 | ) | | | (0.12 | ) | | | — | |
| | — | | | | (0.47 | ) | | | (0.28 | ) | | | (0.10 | ) | | | (0.34 | ) |
| | (0.21 | ) | | | (0.47 | ) | | | (0.33 | ) | | | (0.22 | ) | | | (0.34 | ) |
| $ | 15.73 | | | $ | 15.43 | | | $ | 14.99 | | | $ | 14.92 | | | $ | 11.29 | |
| | | | | | | | | | | | | | | | | | | |
| | 3.27 | % | | | 6.30 | % | | | 2.64 | % | | | 34.82 | % | | | 13.44 | % |
| | | | | | | | | | | | | | | | | | | |
| | | | | | | | | | | | | | | | | | | |
| $ | 46.41 | | | $ | 66.30 | | | $ | 100.93 | | | $ | 69.86 | | | $ | 26.23 | |
| | 1.55 | % | | | 1.52 | % | | | 1.46 | % | | | 1.60 | % | | | 1.91 | % |
| | 0.09 | % | | | 0.23 | % | | | 0.21 | % | | | 0.26 | % | | | 0.25 | % |
| | 17 | % | | | 21 | % | | | 35 | % | | | 41 | % | | | 22 | % |
The accompanying notes are an integral part of these financial statements.
| HENNESSY FUNDS | 1-800-966-4354 | |
Financial Statements
For an Institutional Class share outstanding throughout each period
| | | Six Months Ended | |
| | | April 30, 2021 | |
| | | (Unaudited) | |
| PER SHARE DATA: | | | |
| Net asset value, beginning of period | | $ | 15.58 | |
| | | | | |
| Income from investment operations: | | | | |
| Net investment income | | | 0.07 | (1) |
| Net realized and unrealized gains on investments | | | 1.96 | |
| Total from investment operations | | | 2.03 | |
| | | | | |
| Less distributions: | | | | |
| Dividends from net investment income | | | (0.12 | ) |
| Dividends from net realized gains | | | — | |
| Total distributions | | | (0.12 | ) |
| Net asset value, end of period | | $ | 17.49 | |
| | | | | |
| TOTAL RETURN | | | 12.99 | %(2) |
| | | | | |
| SUPPLEMENTAL DATA AND RATIOS: | | | | |
| Net assets, end of period (millions) | | $ | 49.37 | |
| Ratio of expenses to average net assets | | | 1.15 | %(3) |
| Ratio of net investment income to average net assets | | | 0.80 | %(3) |
Portfolio turnover rate(4) | | | 15 | %(2) |
(1) | Calculated using the average shares outstanding method. |
(2) | Not annualized. |
(3) | Annualized. |
(4) | Calculated on the basis of the Fund as a whole. |
The accompanying notes are an integral part of these financial statements.
| FINANCIAL HIGHLIGHTS — INSTITUTIONAL CLASS |
| Year Ended October 31, | |
| 2020 | | | 2019 | | | 2018 | | | 2017 | | | 2016 | |
| | | | | | | | | | | | | | |
| $ | 15.28 | | | $ | 14.83 | | | $ | 14.72 | | | $ | 11.33 | | | $ | 10.30 | |
| | | | | | | | | | | | | | | | | | | |
| | | | | | | | | | | | | | | | | | | |
| | 0.07 | (1) | | | 0.09 | (1) | | | 0.11 | | | | 0.05 | | | | 0.06 | |
| | 0.50 | | | | 0.86 | | | | 0.36 | | | | 3.78 | | | | 1.31 | |
| | 0.57 | | | | 0.95 | | | | 0.47 | | | | 3.83 | | | | 1.37 | |
| | | | | | | | | | | | | | | | | | | |
| | | | | | | | | | | | | | | | | | | |
| | (0.27 | ) | | | (0.04 | ) | | | (0.08 | ) | | | (0.10 | ) | | | — | |
| | — | | | | (0.46 | ) | | | (0.28 | ) | | | (0.34 | ) | | | (0.34 | ) |
| | (0.27 | ) | | | (0.50 | ) | | | (0.36 | ) | | | (0.44 | ) | | | (0.34 | ) |
| $ | 15.58 | | | $ | 15.28 | | | $ | 14.83 | | | $ | 14.72 | | | $ | 11.33 | |
| | | | | | | | | | | | | | | | | | | |
| | 3.69 | % | | | 6.73 | % | | | 3.12 | % | | | 35.17 | % | | | 13.73 | % |
| | | | | | | | | | | | | | | | | | | |
| | | | | | | | | | | | | | | | | | | |
| $ | 34.58 | | | $ | 63.78 | | | $ | 98.42 | | | $ | 28.71 | | | $ | 3.42 | |
| | 1.13 | % | | | 1.12 | % | | | 1.04 | % | | | 1.19 | % | | | 1.63 | % |
| | 0.45 | % | | | 0.61 | % | | | 0.77 | % | | | 0.80 | % | | | 0.63 | % |
| | 17 | % | | | 21 | % | | | 35 | % | | | 41 | % | | | 22 | % |
The accompanying notes are an integral part of these financial statements.
| HENNESSY FUNDS | 1-800-966-4354 | |
Financial Statements
Notes to the Financial Statements April 30, 2021 (Unaudited) |
1). ORGANIZATION
The Hennessy Japan Small Cap Fund (the “Fund”) is a series of Hennessy Funds Trust (the “Trust”), which was organized as a Delaware statutory trust on September 17, 1992. The Fund is an open-end management investment company registered under the Investment Company Act of 1940, as amended. The investment objective of the Fund is long-term capital appreciation. The Fund is a diversified fund.
The Fund offers Investor Class and Institutional Class shares. Each class of shares differs principally in its respective 12b-1 distribution and service, shareholder servicing, and sub-transfer agent expenses. There are no sales charges. Each class has identical rights to earnings, assets, and voting privileges, except for class-specific expenses and exclusive rights to vote on matters affecting only one class.
As an investment company, the Fund follows the investment company accounting and reporting guidance of the Financial Accounting Standards Board (“FASB”) Accounting Standard Codification Topic 946 “Financial Services—Investment Companies.”
2). SIGNIFICANT ACCOUNTING POLICIES
The following is a summary of significant accounting policies consistently followed by the Fund in the preparation of the financial statements. These policies conform to U.S. generally accepted accounting principles (“GAAP”).
| a). | Securities Valuation – All investments in securities are valued in accordance with the Fund’s valuation policies and procedures, as described in Note 3. |
| | |
| b). | Federal Income Taxes – The Fund has elected to be taxed as a regulated investment company and intends to distribute substantially all of its taxable income to its shareholders and otherwise comply with the provisions of the Internal Revenue Code of 1986, as amended, applicable to regulated investment companies. As a result, the Fund has made no provision for federal income taxes or excise taxes. Net investment income/loss and realized gains/losses for federal income tax purposes may differ from those reported in the financial statements because of temporary book-basis and tax-basis differences. Temporary differences are primarily the result of the treatment of wash sales for tax reporting purposes. The Fund recognizes interest and penalties related to income tax benefits, if any, in the Statement of Operations as an income tax expense. Distributions from net realized gains for book purposes may include short-term capital gains, which are included as ordinary income to shareholders for tax purposes. The Fund may utilize equalization accounting for tax purposes and designate earnings and profits, including net realized gains distributed to shareholders on redemption of shares, as part of the dividends paid deduction for income tax purposes. |
| | |
| c). | Accounting for Uncertainty in Income Taxes – The Fund has accounting policies regarding recognition and measurement of tax positions taken or expected to be taken on a tax return. The tax returns of the Fund for the prior three fiscal years are open for examination. The Fund has reviewed all open tax years in major tax jurisdictions and concluded that there is no impact on the Fund’s net assets and no tax liability resulting from unrecognized tax benefits relating to uncertain income tax positions taken or expected to be taken on a tax return. The Fund’s major tax jurisdictions are U.S. federal and Delaware. |
| NOTES TO THE FINANCIAL STATEMENTS |
| d). | Income and Expenses – Dividend income is recognized on the ex-dividend date or as soon as information is available to the Fund. Interest income, which includes the amortization of premium and accretion of discount, is recognized on an accrual basis. Market discounts, original issue discounts, and market premiums on debt securities are accreted or amortized to interest income over the life of a security with a corresponding increase or decrease, as applicable, in the cost basis of such security using the yield-to-maturity method or, where applicable, the first call date of the security. Other non-cash dividends are recognized as investment income at the fair value of the property received. The Fund is charged for those expenses that are directly attributable to its portfolio, such as advisory, administration, and certain shareholder service fees. Income, expenses (other than expenses attributable to a specific class), and realized and unrealized gains/losses on investments are allocated to each class of shares based on such class’s net assets. |
| | |
| e). | Distributions to Shareholders – Dividends from net investment income for the Fund, if any, are declared and paid annually, usually in December. Distributions of net realized capital gains, if any, are declared and paid annually, usually in December. |
| | |
| f). | Security Transactions – Investment and shareholder transactions are recorded on the trade date. The Fund determines the realized gain/loss from an investment transaction by comparing the original cost of the security lot sold with the net sale proceeds. Discounts and premiums on securities purchased are accreted or amortized, respectively, over the life of each such security. |
| | |
| g). | Use of Estimates – Preparing financial statements in accordance with GAAP requires management to make estimates and assumptions that affect the reported amounts of assets and liabilities and disclosure of contingent assets and liabilities at the date of the financial statements, as well as the reported change in net assets during the reporting period. Actual results could differ from those estimates. |
| | |
| h). | Share Valuation – The net asset value (“NAV”) per share of the Fund is calculated by dividing (i) the total value of the securities held by the Fund, plus cash and other assets, minus all liabilities (including estimated accrued expenses) by (ii) the total number of Fund shares outstanding, rounded to the nearest $0.01. Fund shares are not priced on days the New York Stock Exchange is closed for trading. The offering and redemption price per share for the Fund is equal to the Fund’s NAV per share. |
| | |
| i). | Foreign Currency – Values of investments denominated in foreign currencies are converted into U.S. dollars using the spot market exchange rate at the time of valuation. Purchases and sales of investments and income are translated into U.S. dollars using the spot market exchange rate prevailing on the respective dates of such transactions. The Fund does not isolate the portion of the results of operations resulting from fluctuations in foreign exchange rates on investments from fluctuations resulting from changes in the market prices of securities held. Such fluctuations are included with the net realized and unrealized gain/loss on investments. Foreign investments present additional risks due to currency fluctuations, economic and political factors, lower liquidity, government regulations, differences in accounting standards, and other factors. |
| | |
| j). | REIT Equity Securities – Distributions received from real estate investment trusts (“REITs”) may be classified as dividends, capital gains, or return of capital. Investments in REITs may require the Fund to accrue and distribute income not yet received. To generate sufficient cash to make any required distributions, the Fund may be required to sell securities in its portfolio (including when it is not advantageous to do so) that it otherwise would have continued to hold. At other |
| HENNESSY FUNDS | 1-800-966-4354 | |
| | times, investments in a REIT may result in the Fund’s receipt of cash in excess of the REIT’s earnings. If the Fund distributes these amounts, these distributions could constitute a return of capital to Fund shareholders for U.S. federal income tax purposes. Dividends received by the Fund from a REIT generally do not constitute qualified dividend income and do not qualify for the dividends-received deduction. |
| | |
| k). | New Accounting Pronouncements – In August 2018, the FASB issued Accounting Standards Update No. 2018-13 “Disclosure Framework—Changes to the Disclosure Requirements for Fair Value Measurement” (“ASU 2018-13”). ASU 2018-13 eliminates the requirement to disclose the amount of and reasons for transfers between Level 1 and Level 2 of the fair value hierarchy, the timing of transfers between levels of the fair value hierarchy, and the valuation processes for Level 3 fair value measurements. ASU 2018-13 does not eliminate the requirement to disclose the range and weighted average used to develop significant unobservable inputs for Level 3 fair value measurements or the requirement to disclose the changes in unrealized gains and losses for recurring Level 3 fair value measurements. ASU 2018-13 requires that information is provided about the measurement uncertainty of Level 3 fair value measurements as of the reporting date. The guidance is effective for fiscal years beginning after December 15, 2019, and interim periods within those fiscal years. Management evaluated the impact of this change in guidance and, due to the permissibility of early adoption, modified the Fund’s fair value disclosures beginning with its fiscal year 2019. |
3). SECURITIES VALUATION
The Fund follows its valuation policies and procedures in determining its net asset value and, in preparing these financial statements, the fair value accounting standards that establish an authoritative definition of fair value and set out a hierarchy for measuring fair value. These standards require additional disclosures about the various inputs and valuation techniques used to develop the measurements of fair value and a discussion of changes in valuation techniques and related inputs during the period. These inputs are summarized in the three broad levels listed below:
| | Level 1 – | Unadjusted, quoted prices in active markets for identical instruments that the Fund has the ability to access at the date of measurement. |
| | | |
| | Level 2 – | Other significant observable inputs (including, but not limited to, quoted prices in active markets for similar instruments, quoted prices in markets that are not active for identical or similar instruments, and model-derived valuations in which all significant inputs and significant value drivers are observable in active markets, such as interest rates, prepayment speeds, credit risk curves, default rates, and similar data). |
| | | |
| | Level 3 – | Significant unobservable inputs (including the Fund’s own assumptions about what market participants would use to price the asset or liability based on the best available information) when observable inputs are unavailable. |
The following is a description of the valuation techniques applied to the Fund’s major categories of assets and liabilities on a recurring basis:
| | Equity Securities – Equity securities, including common stocks, preferred stocks, foreign-issued common stocks, exchange-traded funds, closed-end mutual funds, partnerships, rights, and real estate investment trusts, that are traded on a securities exchange for which a last-quoted sales price is readily available generally are valued at the last sales price as reported by the primary exchange on which the securities are listed. Securities listed on The NASDAQ Stock Market (“NASDAQ”) generally are |
| NOTES TO THE FINANCIAL STATEMENTS |
| | valued at the NASDAQ Official Closing Price, which may differ from the last sales price reported. Securities traded on a securities exchange for which a last-quoted sales price is not readily available generally are valued at the mean between the bid and ask prices. To the extent these securities are actively traded and valuation adjustments are not applied, they are classified in Level 1 of the fair value hierarchy. Securities traded on foreign exchanges generally are not valued at the same time the Fund calculates its NAV because most foreign markets close well before such time. The earlier close of most foreign markets gives rise to the possibility that significant events, including broad market moves, may have occurred in the interim. In certain circumstances, it may be determined that a foreign security needs to be fair valued because it appears that the value of the security might have been materially affected by events occurring after the close of the market in which the security is principally traded, but before the time the Fund calculates its NAV, such as by a development that affects an entire market or region (e.g., a weather-related event) or a potentially global development (e.g., a terrorist attack that may be expected to have an effect on investor expectations worldwide). |
| | |
| | Registered Investment Companies – Investments in open-end registered investment companies, commonly referred to as mutual funds, generally are priced at the ending NAV provided by the applicable mutual fund’s service agent and are classified in Level 1 of the fair value hierarchy. |
| | |
| | Debt Securities – Debt securities, including corporate bonds, asset-backed securities, mortgage-backed securities, municipal bonds, U.S. Treasuries, and U.S. government agency issues, are generally valued at market on the basis of valuations furnished by an independent pricing service that utilizes both dealer-supplied valuations and formula-based techniques. The pricing service may consider recently executed transactions in securities of the issuer or comparable issuers, market price quotations (where observable), bond spreads, and fundamental data relating to the issuer. In addition, the model may incorporate observable market data, such as reported sales of similar securities, broker quotes, yields, bids, offers, and reference data. Certain securities are valued primarily using dealer quotations. These securities are generally classified in Level 2 of the fair value hierarchy. |
| | |
| | Short-Term Securities – Short-term equity investments, including money market funds, are valued in the manner specified above for equity securities. Short-term debt investments with an original term to maturity of 60 days or less are valued at amortized cost, which approximates fair market value. If the original term to maturity of a short-term debt investment exceeds 60 days, then the values as of the 61st day prior to maturity are amortized. Amortized cost is not used if its use would be inappropriate due to credit or other impairments of the issuer, in which case the security’s fair value would be determined as described below. Short-term securities are generally classified in Level 1 or Level 2 of the fair value hierarchy depending on the inputs used and market activity levels for specific securities. |
The Board of Trustees of the Fund (the “Board”) has adopted fair value pricing procedures that are followed when a price for a security is not readily available or if a significant event has occurred that indicates the closing price of a security no longer represents the true value of that security. Fair value pricing determinations are made in good faith in accordance with these procedures. There are numerous criteria considered in determining a fair value of a security, such as the trading volume of a security and markets, the values of other similar securities, and news events with direct bearing on a security or markets. Fair value pricing results in an estimated price for a security that reflects the amount the Fund might reasonably expect to receive in a current sale.
| HENNESSY FUNDS | 1-800-966-4354 | |
Depending on the relative significance of the valuation inputs, these securities may be classified in either Level 2 or Level 3 of the fair value hierarchy.
The fair value of foreign securities may be determined with the assistance of a pricing service using correlations between the movement of prices of such securities and indices of domestic securities and other appropriate indicators, such as closing market prices of relevant American Depositary Receipts or futures contracts. Using fair value pricing means that the Fund’s NAV reflects the affected portfolio securities’ values as determined by the Board or its designee, pursuant to the fair value pricing procedures adopted by the Board, instead of being determined by the market. Using a fair value pricing methodology to price a foreign security may result in a value that is different from such foreign security’s most recent closing price and from the value used by other investment companies to calculate their NAVs. Such securities are generally classified in Level 2 of the fair value hierarchy. Because the Fund invests in foreign securities, the value of the Fund’s portfolio securities may change on days when a shareholder is unable to purchase or redeem Fund shares.
The Board has delegated day-to-day valuation matters to the Valuation and Liquidity Committee comprising representatives from Hennessy Advisors, Inc., the Fund’s investment advisor (the “Advisor”). The function of the Valuation and Liquidity Committee, among other things, is to value securities where current and reliable market quotations are not readily available. All actions taken by the Valuation and Liquidity Committee are reviewed by the Board.
The Fund has performed an analysis of all existing investments to determine the significance and character of all inputs to their fair value determinations. Various inputs are used to determine the value of the Fund’s investments. The inputs or methodology used for valuing securities are not necessarily an indication of the risk associated with investing in those securities. Details related to the fair value hierarchy of the Fund’s securities as of April 30, 2021, are included in the Schedule of Investments.
4). INVESTMENT TRANSACTIONS
Purchases and sales of investment securities (excluding government and short-term investments) for the Fund during the six months ended April 30, 2021, were $12,707,450 and $12,577,018, respectively.
There were no purchases or sales/maturities of long-term U.S. government securities for the Fund during the six months ended April 30, 2021.
5). INVESTMENT ADVISORY FEE AND OTHER TRANSACTIONS WITH AFFILIATES
The Advisor provides the Fund with investment advisory services under an Investment Advisory Agreement. The Advisor oversees the provision of investment advice and furnishes office space, facilities, and most of the personnel needed by the Fund. As compensation for its services, the Advisor is entitled to a monthly fee from the Fund. The fee is based on the average daily net assets of the Fund at an annual rate of 0.80%. The net investment advisory fees expensed by the Fund during the six months ended April 30, 2021, are included in the Statement of Operations.
The Advisor has delegated the day-to-day management of the Fund to a sub-advisor, SPARX Asset Management Co., Ltd. The Advisor pays the sub-advisory fees from its own assets, and these fees are not an additional expense of the Fund. During the six months ended April 30, 2021, the Advisor (not the Fund) paid a sub-advisory fee at the average rate of 0.35% of the daily net assets of the Fund. Pursuant to the sub-advisory agreement, the Advisor pays sub-advisory fees at the rate of 0.35% of the first $500 million of daily net assets, 0.40% of daily net assets between $500 million and $1 billion, and 0.42% of daily net assets over $1 billion.
| NOTES TO THE FINANCIAL STATEMENTS |
The Board has approved a Shareholder Servicing Agreement for Investor Class shares of the Fund, which compensates the Advisor for the non-investment advisory services it provides to the Fund. The Shareholder Servicing Agreement provides for a monthly fee paid to the Advisor at an annual rate of 0.10% of the average daily net assets of the Fund attributable to Investor Class shares. The shareholder service fees expensed by the Fund during the six months ended April 30, 2021, are included in the Statement of Operations.
The Fund has adopted a plan pursuant to Rule 12b-1 under the Investment Company Act of 1940, as amended, that authorizes payments in connection with the distribution of Fund shares at an annual rate of up to 0.25% of the Fund’s average daily net assets attributable to Investor Class shares. Even though the authorized rate is up to 0.25%, the Fund is currently only using up to 0.15% of its average daily net assets attributable to Investor Class shares for such purpose. Amounts paid under the plan may be spent on any activities or expenses primarily intended to result in the sale of shares, including, but not limited to, advertising, shareholder account servicing, printing and mailing of prospectuses to other than current shareholders, printing and mailing of sales literature, and compensation for sales and marketing activities or to financial institutions and others, such as dealers and distributors. The distribution fees expensed by the Fund during the six months ended April 30, 2021, are included in the Statement of Operations.
The Fund has entered into agreements with various brokers, dealers, and financial intermediaries in connection with the sale of Fund shares. The agreements provide for periodic payments of sub-transfer agent expenses by the Fund to the brokers, dealers, and financial intermediaries for providing certain shareholder maintenance services. These shareholder services include the pre-processing and quality control of new accounts, shareholder correspondence, answering customer inquiries regarding account status, and facilitating shareholder telephone transactions. The sub-transfer agent fees expensed by the Fund during the six months ended April 30, 2021, are included in the Statement of Operations.
U.S. Bancorp Fund Services, LLC, d/b/a U.S. Bank Global Fund Services (“Fund Services”) provides the Fund with administrative, accounting, and transfer agent services. As administrator, Fund Services is responsible for activities such as (i) preparing various federal and state regulatory filings, reports, and returns for the Fund, (ii) preparing reports and materials to be supplied to the Board, (iii) monitoring the activities of the Fund’s custodian, transfer agent, and accountants, and (iv) coordinating the preparation and payment of the Fund’s expenses and reviewing the Fund’s expense accruals. U.S. Bank N.A., an affiliate of Fund Services, serves as the Fund’s custodian. The servicing agreements between the Trust, Fund Services, and U.S. Bank N.A. contain a fee schedule that is inclusive of administrative, accounting, custody, and transfer agent fees. The administrative, accounting, custody, and transfer agent fees expensed by the Fund during the six months ended April 30, 2021, are included in the Statement of Operations.
Quasar Distributors, LLC (“Quasar”), a wholly owned broker-dealer subsidiary of Foreside Financial Group, LLC, acts as the Fund’s principal underwriter in a continuous public offering of Fund shares.
The officers of the Fund are affiliated with the Advisor. With the exception of the Chief Compliance Officer and the Senior Compliance Officer, such officers receive no compensation from the Fund for serving in their respective roles. The Fund, along with the other funds in the Hennessy Funds family (collectively, the “Hennessy Funds”), makes reimbursement payments on an equal basis to the Advisor for a portion of the salary and benefits associated with the office of the Chief Compliance Officer and for all of the salary and benefits associated with the office of the Senior Compliance Officer. The compliance fees expensed by the Fund during the six months ended April 30, 2021, are included in the Statement of Operations.
| HENNESSY FUNDS | 1-800-966-4354 | |
6). GUARANTEES AND INDEMNIFICATIONS
Under the Hennessy Funds’ organizational documents, their officers and trustees are indemnified by the Hennessy Funds against certain liabilities arising out of the performance of their duties to the Hennessy Funds. Additionally, in the normal course of business, the Hennessy Funds enter into contracts with service providers that contain general indemnification clauses. The Fund’s maximum exposure under these arrangements is unknown as this would involve future claims that may be made against the Fund that have not yet occurred. Currently, the Fund expects the risk of loss to be remote.
7). LINE OF CREDIT
The Fund has an uncommitted line of credit with the other Hennessy Funds in the amount of the lesser of (i) $100,000,000 or (ii) 33.33% of each Hennessy Fund’s net assets, or 30% for the Hennessy Gas Utility Fund and 10% for the Hennessy Balanced Fund. The line of credit is intended to provide any necessary short-term financing in connection with shareholder redemptions, subject to certain restrictions. The credit facility is with the Hennessy Funds’ custodian bank, U.S. Bank N.A. Borrowings under this arrangement bear interest at the bank’s prime rate and are secured by all of the Fund’s assets (as to its own borrowings only). During the six months ended April 30, 2021, the Fund did not have any borrowings outstanding under the line of credit.
8). FEDERAL TAX INFORMATION
As of October 31, 2020, the Fund’s most recent fiscal year end, the components of accumulated earnings (losses) for income tax purposes were as follows:
| | | Investments | |
| Cost of investments for tax purposes | | $ | 74,114,181 | |
| Gross tax unrealized appreciation | | $ | 17,412,208 | |
| Gross tax unrealized depreciation | | | (10,717,076 | ) |
| Net tax unrealized appreciation/(depreciation) | | $ | 6,695,132 | |
| Undistributed ordinary income | | $ | 382,610 | |
| Undistributed long-term capital gains | | | — | |
| Total distributable earnings | | $ | 382,610 | |
| Other accumulated gain/(loss) | | $ | (871,567 | ) |
| Total accumulated gain/(loss) | | $ | 6,206,175 | |
The difference between book-basis unrealized appreciation/depreciation and tax-basis unrealized appreciation/depreciation (as shown above) is attributable primarily to wash sales and investments in passive foreign investment companies.
As of October 31, 2020, the Fund had $871,567 in unlimited short-term capital loss carryforwards.
Capital losses sustained in or after fiscal year 2012 can be carried forward indefinitely, but any such loss retains the character of the original loss and must be utilized prior to any loss incurred before fiscal year 2012. As a result of this ordering rule, capital loss carryforwards incurred prior to fiscal year 2012 may be more likely to expire unused. Capital losses sustained prior to fiscal year 2012 can be carried forward for eight years and can be carried forward as short-term capital losses regardless of the character of the original loss.
As of October 31, 2020, the Fund did not defer, on a tax basis, any late-year ordinary losses. Late-year ordinary losses are net ordinary losses incurred after December 31, 2019, but within the taxable year, that are deemed to arise on the first day of the Fund’s next taxable year.
| NOTES TO THE FINANCIAL STATEMENTS |
During fiscal year 2021 (year to date) and fiscal year 2020, the tax character of distributions paid by the Fund was as follows:
| | | Six Months Ended | | | Year Ended | |
| | | April 30, 2021 | | | October 31, 2020 | |
Ordinary income(1) | | $ | 382,610 | | | $ | 1,959,488 | |
| Long-term capital gains | | | — | | | | — | |
| Total distributions | | $ | 382,610 | | | $ | 1,959,488 | |
(1) Ordinary income includes short-term capital gains.
9). EVENTS SUBSEQUENT TO PERIOD END
Management has evaluated the Fund’s related events and transactions that occurred subsequent to April 30, 2021, through the date of issuance of the Fund’s financial statements. Management has determined that there were no subsequent events requiring recognition or disclosure in the financial statements.
| HENNESSY FUNDS | 1-800-966-4354 | |
Expense Example (Unaudited)
April 30, 2021
As a shareholder of the Fund, you incur ongoing costs, including management fees, service fees, and other Fund expenses. This Example is intended to help you understand your ongoing costs (in dollars) of investing in the Fund and to compare these costs with the ongoing costs of investing in other mutual funds. The Example is based on an investment of $1,000 invested at the beginning of the period and held for the entire period from November 1, 2020, through April 30, 2021.
Actual Expenses
In the table below, the first line under each of the “Investor Class” and “Institutional Class” headings provides information about actual account values and actual expenses for each share class. You may use this information, together with the amount you invested, to estimate the expenses that you paid over the period. Simply divide your account value by $1,000 (for example, an $8,600 account value divided by $1,000 = 8.6), then multiply the result by the number in the first line under the heading entitled “Expenses Paid During Period” to estimate the expenses you paid on your account during this period. Although the Fund charges no sales loads or transaction fees, you will be assessed fees for outgoing wire transfers, returned checks, and stop payment orders at prevailing rates charged by U.S. Bank Global Fund Services, the Fund’s transfer agent. If you request that a redemption be made by wire transfer, the Fund’s transfer agent charges a $15 fee. IRAs are charged a $15 annual maintenance fee (up to $30 maximum per shareholder for shareholders with multiple IRAs). The examples below include, but are not limited to, management, shareholder servicing, accounting, custody, and transfer agent fees. However, the examples below do not include portfolio trading commissions and related expenses.
Hypothetical Example for Comparison Purposes
In the table below, the second line under each of the “Investor Class” and “Institutional Class” headings provides information about hypothetical account values and hypothetical expenses based on the Fund’s actual expense ratio for each share class and an assumed rate of return of 5% per year before expenses, which is not the Fund’s actual return for such share class. The hypothetical account values and expenses may not be used to estimate the actual ending account balance or expenses you paid for the period. You may use this information to compare the ongoing costs of investing in the Fund and other funds. To do so, compare these 5% hypothetical examples with the 5% hypothetical examples that appear in the shareholder reports of the other funds. Please note that the expenses shown in the table are meant to highlight your ongoing costs only. Therefore, the second lines under “Investor Class” and “Institutional Class” headings are useful in comparing ongoing costs only and will not help you determine the relative total costs of owning different funds.
| | Beginning | Ending | |
| | Account Value | Account Value | Expenses Paid |
| | November 1, 2020 | April 30, 2021
| During Period(1) |
| Investor Class | | | |
| Actual | $1,000.00 | $1,127.90 | $8.07 |
| Hypothetical (5% return before expenses) | $1,000.00 | $1,017.21 | $7.65 |
| | | | |
| Institutional Class | | | |
| Actual | $1,000.00 | $1,129.90 | $6.07 |
| Hypothetical (5% return before expenses) | $1,000.00 | $1,019.09 | $5.76 |
(1) | Expenses are equal to the Fund’s annualized expense ratio of 1.53% for Investor Class shares or 1.15% for Institutional Class shares, as applicable, multiplied by the average account value over the period, multiplied by 181/365 days (to reflect the half-year period). |
| HENNESSY FUNDS | 1-800-966-4354 | |
How to Obtain a Copy of the Fund’s Proxy
Voting Policy and Proxy Voting Records
A description of the policies and procedures the Fund uses to determine how to vote proxies relating to portfolio securities is available without charge (1) by calling 1-800-966-4354, (2)on the Hennessy Funds’ website at www.hennessyfunds.com/proxy-voting/voting-policy, or (3) on the U.S. Securities and Exchange Commission’s (the “SEC”) website at www.sec.gov. The Fund’s proxy voting record is available without charge on both the Hennessy Funds’ website at www.hennessyfunds.com/proxy-voting/voting-record and the SEC’s website at www.sec.gov no later than August 31 for the prior 12 months ending June 30.
Availability of Quarterly Portfolio Schedule
The Fund files a complete schedule of portfolio holdings with the SEC for the first and third quarters of each fiscal year as an exhibit to its reports on Form N-PORT. The Fund’s Form N-PORT reports are available on the SEC’s website at www.sec.gov or on request by calling 1-800-966-4354.
Federal Tax Distribution Information (Unaudited)
For fiscal year 2020, certain dividends paid by the Fund may be subject to a maximum tax rate of 23.8%, as provided for by the Jobs and Growth Tax Relief Reconciliation Act of 2003. The percentage of dividends declared from ordinary income designated as qualified dividend income was 100.00%.
For corporate shareholders, the percent of ordinary income distributions that qualified for the corporate dividends received deduction for fiscal year 2020 was 0.00%.
The percentage of taxable ordinary income distributions that were designated as short-term capital gain distributions under Section 871(k)(2)(C) of the Internal Revenue Code of 1986, as amended, for the Fund was 0.00%.
For the year ended October 31, 2020, the Fund earned foreign-source income and paid foreign taxes as noted below, which it intends to pass through to its shareholders pursuant to Section 853 of the Internal Revenue Code.
| | | Gross Foreign Income | Foreign Tax Paid | |
| | Japan | $1,727,862 | $172,786 | |
Important Notice Regarding Delivery
of Shareholder Documents
To help keep the Fund’s costs as low as possible, we generally deliver a single copy of notices, shareholder reports, proxy statements, and prospectuses to shareholders who share an address and have the same last name. This process does not apply to account statements. You may request an individual copy of a shareholder document at any time. If you would like to receive separate mailings of shareholder documents, please call U.S. Bank Global Fund Services at 1-800-261-6950 or 1-414-765-4124, and individual delivery will begin within 30 days of your request. If your account is held through a financial institution or other intermediary, please contact such intermediary directly to request individual delivery.
| PROXY VOTING — ELECTRONIC DELIVERY |
Electronic Delivery
As permitted by SEC regulations, the Fund’s shareholder reports are made available on a website, and unless you sign up for eDelivery or elect to receive paper copies as detailed below, you will be notified by mail each time a report is posted and provided with a website link to access the report.
The Fund also offers shareholders the option to receive all notices, account statements, prospectuses, tax forms, and shareholder reports online. To sign up for eDelivery or change your delivery preference, please visit www.hennessyfunds.com/account.
To elect to receive paper copies of all future reports free of charge, please call U.S. Bank Global Fund Services at 1-800-261-6950 or 1-414-765-4124.
Subscribe to receive our team’s unique market and sector insights delivered to your inbox
www.hennessyfunds.com/subscribe
Follow us on social media
| HENNESSY FUNDS | 1-800-966-4354 | |
Board Approval of Investment Advisory
Agreements
At its meeting on March 10, 2021, the Board of Trustees of the Fund (the “Board,” and the members thereof, the “Trustees”) unanimously approved the continuation of the investment advisory agreement of the Fund with Hennessy Advisors, Inc. (the “Advisor”) and the sub-advisory agreement for the Fund between the Advisor and SPARX Asset Management Co., Ltd. (the “Sub-Advisor”). As part of the process, the Trustees reviewed their fiduciary duties and the relevant factors for them to consider with respect to approving the advisory and sub-advisory agreements. In addition, the Trustees who are not deemed “interested persons” (as defined by the Investment Company Act of 1940, as amended) of the Fund (the “Independent Trustees”) met in executive session to discuss the approval of the advisory and sub-advisory agreements.
In advance of the meeting, the Advisor sent detailed information to the Trustees to assist them in their evaluation of the advisory and sub-advisory agreements. This information included, but was not limited to, the following:
| | (1) | A memorandum from outside legal counsel that described the fiduciary duties of the Board with respect to approving the continuation of the advisory and sub-advisory agreements and the relevant factors for consideration; |
| | | |
| | (2) | A memorandum from the Advisor that listed the factors relevant to the Board’s approval of the continuation of the advisory and sub-advisory agreements and also referenced the documents that had been provided to help the Board assess each such factor; |
| | | |
| | (3) | The Advisor’s financial statements from its most recent Form 10-K and Form 10-Q; |
| | | |
| | (4) | Summaries of the advisory and sub-advisory agreements; |
| | | |
| | (5) | A recent Fund fact sheet, which included performance information over various periods; |
| | | |
| | (6) | An description of the range of services provided by the Advisor and the Sub-Advisor and the distinction between the Advisor-provided services and the Sub-Advisor-provided services; |
| | | |
| | (7) | A peer expense comparison of the net expense ratio and investment advisory fee of the Fund; |
| | | |
| | (8) | A memorandum from the Adviser regarding economies of scale; |
| | | |
| | (9) | A completed questionnaire from the Sub-Advisor; |
| | | |
| | (10) | A summary of the Sub-Advisor’s responses to the questionnaire, as well as relevant information from the Sub-Advisor’s Form ADVs Parts 1 and 2 and the certifications submitted the Sub-Advisor each quarter; |
| | | |
| | (11) | Financial information of the Sub-Advisor’s parent company; and |
| | | |
| | (12) | The Sub-Advisor’s Code of Ethics. |
All of the factors discussed were considered as a whole by the Trustees and by the Independent Trustees meeting in executive session. The factors were viewed in their totality by the Trustees, with no single factor being the principal or determinative factor in the Trustees’ determination of whether to approve the continuation of the advisory and sub-advisory agreements. The Trustees recognized that the management and fee arrangements for the Fund are the result of years of review and discussion between the Independent Trustees and the Advisor, that certain aspects of such arrangements may
| BOARD APPROVAL OF INVESTMENT ADVISORY AGREEMENTS |
receive greater scrutiny in some years than in others, and that the Trustees’ conclusions may be based, in part, on their consideration of these same arrangements and information received during the course of the year and in prior years.
Prior to approving the continuation of the advisory and sub-advisory agreements, the Trustees, including the Independent Trustees in executive session, considered, among other items:
| | (1) | The nature and quality of the advisory services provided by the Advisor and the Sub-Advisor; |
| | | |
| | (2) | A comparison of the fees and expenses of the Fund to other similar funds; |
| | | |
| | (3) | Whether economies of scale are recognized by the Fund; |
| | | |
| | (4) | The costs and profitability of the Fund to the Advisor and the Sub-Advisor; |
| | | |
| | (5) | The performance of the Fund; and |
| | | |
| | (6) | Any benefits to the Advisor and the Sub-Advisor from serving as an investment advisor to the Fund (other than the advisory and sub-advisory fees). |
The material considerations and determinations of the Trustees, including the Independent Trustees, were as follows:
| | (1) | The Trustees considered the services identified below that are provided by the Advisor. Based on this review, the Trustees concluded that the Advisor provides high-quality services to the Fund and noted that their overall confidence in the Advisor was high. The Trustees also concluded that they were satisfied with the nature, extent, and quality of the advisory services provided to the Fund by the Advisor and that the nature and extent of the services provided by the Advisor were appropriate to assure that the Fund’s operations are conducted in compliance with applicable laws, rules, and regulations. |
| | | (a) | The Advisor oversees the Sub-Advisor for the Fund, and the Sub-Advisor acts as the portfolio manager for the Fund by providing portfolio management services. |
| | | | |
| | | (b) | The Advisor performs a daily reconciliation of portfolio positions and cash for the Fund. |
| | | | |
| | | (c) | The Advisor monitors the liquidity of each Fund. |
| | | | |
| | | (d) | The Advisor monitors the Fund’s compliance with its investment objectives and restrictions and federal securities laws. |
| | | | |
| | | (e) | The Advisor maintains a compliance program (including a code of ethics), conducts ongoing reviews of the compliance programs of the Sub-Advisor and the Fund’s other service providers (including their codes of ethics, as appropriate), conducts on-site visits to the Sub-Advisor and the Fund’s other service providers as feasible, monitors incidents of abusive trading practices, reviews Fund expense accruals, payments, and fixed expense ratios, evaluates insurance providers for fidelity bond, D&O/E&O insurance, and cybersecurity insurance coverage, manages regulatory examination compliance and responses, conducts employee compliance training, reviews reports provided by service providers, and maintains books and records. |
| | | | |
| | | (f) | The Advisor oversees the selection and continued employment of the Sub-Advisor, reviews the Fund’s investment performance, and monitors the Sub-Advisor’s adherence to the Fund’s investment objectives, policies, and restrictions. |
| HENNESSY FUNDS | 1-800-966-4354 | |
| | | (g) | The Advisor oversees service providers that provide accounting, administration, distribution, transfer agency, custodial, sales, marketing, public relations, audit, information technology, and legal services to the Fund. |
| | | | |
| | | (h) | The Advisor maintains in-house marketing and distribution departments on behalf of the Fund. |
| | | | |
| | | (i) | The Advisor prepares or directs the preparation of all regulatory filings for the Fund, including writing and annually updating the Fund’s prospectus and related documents. |
| | | | |
| | | (j) | For each annual report of the Fund, the Advisor reviews the written summary prepared by the Sub-Advisor of the Fund’s performance during the most recent 12-month period. |
| | | | |
| | | (k) | The Advisor oversees distribution of the Fund through third-party broker/dealers and independent financial institutions such as Charles Schwab, Inc., Fidelity, TD Ameritrade, and Pershing. The Advisor compensates, in part, a number of these third-party providers out of its own revenues. |
| | | | |
| | | (l) | The Advisor pays the incentive compensation of the Fund’s compliance officers and employs other staff, such as legal, marketing, national accounts, distribution, sales, administrative, and trading oversight personnel, as well as management executives. |
| | | | |
| | | (m) | The Advisor provides a quarterly compliance certification to the Board. |
| | | | |
| | | (n) | The Advisor prepares or reviews all Board materials, frequently presents to the Board and leads Board discussions, prepares or reviews all meeting minutes, and arranges for Board training and education. |
| | (2) | The Trustees considered the services identified below that are provided by the Sub-Advisor. Based on this review and an assessment of the Sub-Advisor’s performance, the Trustees concluded that the Sub-Advisor provides high-quality services to the Fund. The Trustees also concluded that they were satisfied with the nature, extent, and quality of the advisory services provided to the Fund by the Sub-Advisor and that the nature and extent of the services provided by the Sub-Advisor were appropriate to assure that the Fund’s portfolio aligns properly with its investment objective and principal investment strategies. |
| | | (a) | The Sub-Advisor acts as the portfolio manager for the Fund. In this capacity, the Sub-Advisor does the following: |
| | | | (i) | manages the composition of the Fund’s portfolio, including the purchase, retention, and disposition of portfolio securities in accordance with the Fund’s investment objectives, policies, and restrictions; |
| | | | | |
| | | | (ii) | seeks best execution for the Fund’s portfolio; and |
| | | | | |
| | | | (iii) | manages proxy voting for the Fund. |
| | | (b) | The Sub-Advisor ensures that its compliance program includes policies and procedures relevant to the Fund and the Sub-Advisor’s duties as a portfolio manager to the Fund. |
| | | | |
| | | (c) | For each annual report of the Fund, the Sub-Advisor prepares a written summary of the Fund’s performance during the most recent 12-month period. |
| BOARD APPROVAL OF INVESTMENT ADVISORY AGREEMENTS |
| | | (d) | The Sub-Advisor provides a quarterly compliance certification to the Board regarding trading and allocation practices, supervisory matters, the Sub-Advisor’s compliance program (including its code of ethics), compliance with the Fund’s policies, and general firm updates. |
| | (3) | The Trustees considered the distinction between the services performed by the Advisor and the Sub-Advisor. The Trustees noted that the management of the Fund, including the oversight of the Sub-Advisor, involves more comprehensive and substantive duties than the duties of the Sub-Advisor. Specifically, the Trustees considered the lists of services identified above and concluded that the services performed by the Advisor for the Fund require a higher level of service and oversight than the services performed by the Sub-Advisor. Based on this determination, the Trustees concluded that the differential in advisory fees between the Advisor and the Sub-Advisor is reasonable. |
| | | |
| | (4) | The Trustees compared the performance of the Fund to benchmark indices over various periods and also noted that the Trustees review and discuss reports comparing the investment performance of the Fund to various indices at each quarterly Board meeting. Based on such information, the Trustees determined that the Advisor and the Sub-Advisor manage the Fund in a manner materially consistent with its stated investment objective and style. The Trustees concluded that the performance of the Fund over various periods warranted continuation of the advisory and sub-advisory agreements. |
| | | |
| | (5) | The Trustees reviewed the advisory fees and overall expense ratios of the Fund compared to other funds similar in asset size and investment objective to the Fund using data from Morningstar. As part of the discussion with management, the Trustees ensured that they understood and were comfortable with the criteria used to determine the mutual funds included in the Morningstar categories for purposes of the materials considered at the meeting. The Trustees determined that the advisory fee and overall expense ratio of the Fund falls within the range of the advisory fees and overall expense ratios of other comparable funds and concluded that they are reasonable and warranted continuation of the advisory and sub-advisory agreements. |
| | | |
| | (6) | The Trustees also considered whether the Advisor was realizing economies of scale that it should share with the Fund’s shareholders. The Trustees noted that many of the expenses incurred to manage the Fund are asset-based fees, so the Advisor would not realize material economies of scale relating to those expenses as the assets of the Fund increase. For example, third-party platform fees and sub-advisory fees increase as the Fund’s assets grow. The Trustees also considered the Advisor’s significant marketing efforts to promote the Funds and the Advisor’s agreement to waive fees or lower its management fees in certain circumstances. |
| | | |
| | (7) | The Trustees considered the profitability of the Advisor and the Sub-Advisor, including the impact of mutual fund platform fees on the Advisor’s profitability, and also considered the resources and revenues that the Advisor has put into managing and distributing the Fund. The Trustees then concluded that the profits of the Advisor and the Sub-Advisor are reasonable and not excessive when compared to profitability guidelines set forth in relevant court cases. |
| | | |
| | (8) | The Trustees considered the high level of professionalism and knowledge of the Advisor’s employees, along with a very low level of turnover, and concluded that this was beneficial to the Fund and its shareholders. |
| HENNESSY FUNDS | 1-800-966-4354 | |
| | (9) | The Trustees considered any benefits to the Advisor and the Sub-Advisor from serving as an advisor to the Fund (other than the advisory and sub-advisory fees). The Trustees noted that the Advisor and the Sub-Advisor may derive ancillary benefits from, by way of example, their association with the Fund in the form of proprietary and third-party research products and services received from broker-dealers that execute portfolio trades for the Fund. The Trustees determined that any such products and services have been used for legitimate purposes relating to the Fund by providing assistance in the investment decision-making process. The Trustees concluded that any additional benefits realized by the Advisor and the Sub-Advisor from their relationship with the Fund were reasonable, which was based on, among other things, the Trustees’ findings that (i) the research, analytical, statistical, and other information and services provided by brokers are merely supplemental to the Advisor’s and the Sub-Advisor’s own efforts in the performance of their duties under the advisory and sub-advisory agreements and (ii) although the Sub-Advisor could derive benefits from the conversion of Fund shareholders into separate account clients, the Fund also could benefit from potential institutional shareholders who might choose to invest in the Fund. |
After reviewing the materials and information provided at the meeting, as well as other information regularly provided at the Board’s quarterly meetings throughout the year regarding the quality of services provided by the Advisor and the Sub-Advisor, the performance of the Fund, expense information, brokerage commissions information, the adequacy and efficacy of the Advisor’s and the Sub-Advisor’s written policies and procedures, other regulatory compliance issues, trading information and related matters, and other factors that the Trustees deemed relevant, the Trustees, including the Independent Trustees, approved the continuation of the advisory and sub-advisory agreements.
| BOARD APPROVAL OF INVESTMENT ADVISORY AGREEMENTS |
(This Page Intentionally Left Blank.)
For information, questions, or assistance, please call
The Hennessy Funds
1-800-966-4354 or 1-415-899-1555
INVESTMENT ADVISOR
Hennessy Advisors, Inc.
7250 Redwood Boulevard, Suite 200
Novato, California 94945
ADMINISTRATOR,
TRANSFER AGENT,
DIVIDEND PAYING AGENT, &
SHAREHOLDER SERVICING AGENT
U.S. Bancorp Fund Services, LLC
d/b/a U.S. Bank Global Fund Services
P.O. Box 701
Milwaukee, Wisconsin 53201-0701
CUSTODIAN
U.S. Bank N.A.
Custody Operations
1555 North River Center Drive, Suite 302
Milwaukee, Wisconsin 53212
TRUSTEES
Neil J. Hennessy
Robert T. Doyle
J. Dennis DeSousa
Gerald P. Richardson
COUNSEL
Foley & Lardner LLP
777 East Wisconsin Avenue
Milwaukee, Wisconsin 53202-5306
INDEPENDENT REGISTERED
PUBLIC ACCOUNTING FIRM
Tait, Weller & Baker LLP
Two Liberty Place
50 South 16th Street, Suite 2900
Philadelphia, Pennsylvania 19102-2529
DISTRIBUTOR
Quasar Distributors, LLC
111 East Kilbourn Avenue, Suite 2200
Milwaukee, Wisconsin 53202
www.hennessyfunds.com | 1-800-966-4354
This report has been prepared for shareholders and may be distributed to
others only if preceded or accompanied by a current prospectus.
SEMI-ANNUAL REPORT
APRIL 30, 2021
HENNESSY LARGE CAP FINANCIAL FUND
Investor Class HLFNX
Institutional Class HILFX
www.hennessyfunds.com | 1-800-966-4354
(This Page Intentionally Left Blank.)
Contents
| Letter to Shareholders | 2 |
| Performance Overview | 4 |
| Financial Statements | |
| Schedule of Investments | 5 |
| Statement of Assets and Liabilities | 8 |
| Statement of Operations | 9 |
| Statements of Changes in Net Assets | 11 |
| Financial Highlights | 12 |
| Notes to the Financial Statements | 16 |
| Expense Example | 24 |
| Proxy Voting Policy and Proxy Voting Records | 26 |
| Availability of Quarterly Portfolio Schedule | 26 |
| Important Notice Regarding Delivery of Shareholder Documents | 26 |
| Electronic Delivery | 26 |
| Board Approval of Investment Advisory Agreement | 27 |
| HENNESSY FUNDS | 1-800-966-4354 | |
May 2021
Dear Hennessy Funds Shareholder:
I can hardly believe that we have been navigating through one of the worst pandemics in modern history for more than a year. From the start, our thoughts have been with those affected by COVID-19 and with our frontline healthcare and essential workers. We are encouraged by the rapid rollout of vaccines and the continued reopening of the economy, and we hope this signals a turning point.
This is the first time in over 20 years in this business that I have witnessed volatility as extreme as the volatility that has rocked the financial markets and the economy over the past year. Both the pace of change and the magnitude of change have been staggering. As I reflect on this, I am reminded of a scientific concept called “punctuated equilibrium.” Biologist Stephen Jay Gould revolutionized evolutionary thinking with this theory, which challenged the prevailing belief that biological change happens slowly, consistently, and methodically over time. His theory instead proposed that change happens abruptly and dramatically and that new species pop up and others vanish rapidly, sometimes caused by catastrophic events. In between these explosive periods are much longer intervals of relative stability.
The dramatic market downdraft brought on by the pandemic, followed by the equally dramatic recovery, have been jarring. We witnessed an explosion of IPOs, a plethora of bankruptcies, and a dramatic change in market leadership. Yet unlike in the biological world, we are able to respond to stock market crises and try to dampen their negative impact. There have been numerous and unprecedented fiscal and monetary responses from the Federal Reserve and the U.S. government, and in many ways these measures may have spurred the economic recovery.
For the first six months of our fiscal year through April 30, 2021, the market appeared to be on a relentless march higher, with the S&P 500® Index rising 28.85% on a total return basis, setting new all-time highs 35 times in 124 trading days and closing at its then-highest level ever on April 29, 2021. We saw a dramatic shift back toward value investing, and many of the sectors and individual stocks that had underperformed for most of last year soared. Value outperformed growth, small-caps beat mid-caps, and mid-caps beat large-caps. The Energy and Financials sectors skyrocketed, as evidenced by the S&P 500® Energy Index’s total return of 75.94% and the Russell 1000® Index Financials’ total return of 52.00% during the six-month period. As we begin to move beyond the chaos caused by the pandemic, solid market fundamentals are reappearing, which we believe underscores the health and strength of our economy.
We are pleased with the performance of our mutual funds during the first half of our fiscal year. On an absolute basis, each of our 16 Funds achieved positive performance, and 11 of our 16 funds outperformed their primary benchmark. Ten of our 11 domestic equity-only Funds outperformed the S&P 500® Index, and three of our sector Funds posted total returns of over 50%, due primarily to their focus on the Energy and Financials sectors. We believe this was a favorable period for both our style of high-conviction investing as well as the areas and sectors of the market in which our Funds focus. While performance may wax and wane over a complete market cycle, we remain committed to managing our portfolios for long-term performance, ever mindful of downside risk.
Circling back to Gould’s theory of punctuated equilibrium, we are left with the question, “Where do we go from here?” Are we entering a more stable period in the economy and the market, similar to the periods of relative stasis in the geological record? We are optimistic that this may in fact be the case and that the markets will return to a less volatile part of the cycle. But, with history as our guide, we know that even the greatest bull markets have experienced corrections along the way. While certain individual stock or sector valuations might look stretched, we believe the market as a whole has more room to run. Strong GDP growth and increasing earnings expectations for this year, a potentially lower-for-longer interest rate environment, accommodative fiscal and monetary policies, a healthy and robust financial system, low unemployment and solid wage growth, and a measured reopening of certain parts of the economy all support the market moving higher from here.
We remain committed to our shareholders as we thoughtfully navigate these unprecedented times. We know that you have a multitude of investment options to choose from, and we are grateful for the trust you put in us and your continued interest and investment in our family of Funds. Should you have any questions or would like to speak with us, please don’t hesitate to call us directly at (800) 966-4354.
Best regards,
| |
| |
| |
| |
|
| Ryan C. Kelley |
| Chief Investment Officer |
Past performance does not guarantee future results. To obtain current standardized performance for the Hennessy Funds, visit https://www.hennessyfunds.com/funds/price-performance.
Mutual fund investing involves risk. Principal loss is possible.
Opinions expressed are those of Ryan C. Kelley and are subject to change, are not guaranteed, and should not be considered investment advice.
The S&P 500® Index is a capitalization-weighted index that is designed to represent the broad domestic economy through changes in aggregate market value of 500 stocks across all major industries. The S&P 500® Energy Index comprises those companies included in the S&P 500® Index that are classified in the Energy sector. The Russell 1000® Index Financials is a subset of the Russell 1000® Index that measures the performance of securities classified in the Financials sector of the large-capitalization U.S. equity market. The indices are used herein for comparative purposes in accordance with SEC regulations. One cannot invest directly in an index. All returns are shown on a total return basis.
| HENNESSY FUNDS | 1-800-966-4354 | |
Performance Overview (Unaudited)
AVERAGE ANNUAL TOTAL RETURN FOR PERIODS ENDED APRIL 30, 2021
| | Six | One | Five | Ten |
| | Months(1) | Year
| Years
| Years
|
| Hennessy Large Cap Financial Fund – | | | | |
| Investor Class (HLFNX) | 46.84% | 60.58% | 17.86% | 12.23% |
| Hennessy Large Cap Financial Fund – | | | | |
Institutional Class (HILFX)(2) | 47.15% | 61.15% | 18.28% | 12.48% |
Russell 1000® Index Financials | 52.00% | 65.94% | 18.36% | 14.27% |
Russell 1000® Index | 30.03% | 49.48% | 17.76% | 14.23% |
Expense ratios: 1.75% (Investor Class); 1.45% (Institutional Class)
(1) | Periods of less than one year are not annualized. |
(2) | The inception date of Institutional Class shares is June 15, 2015. Performance shown prior to the inception of Institutional Class shares reflects the performance of Investor Class shares and includes expenses that are not applicable to, and are higher than, those of Institutional Class shares. |
_______________
Performance data quoted represents past performance; past performance does not guarantee future results. The investment return and principal value of an investment will fluctuate so that an investor’s shares, when redeemed, may be worth more or less than their original cost. The performance table does not reflect the deduction of taxes that a shareholder would pay on Fund distributions or the redemption of Fund shares. Current performance of the Fund may be lower or higher than the performance quoted. Performance data current to the most recent month end may be obtained by visiting www.hennessyfunds.com. Performance for periods including or prior to October 26, 2012, is that of the FBR Large Cap Financial Fund.
The Russell 1000® Index Financials is a subset of the Russell 1000® Index that measures the performance of the securities classified in the financials sector of the large-capitalization U.S. equity market. The Russell 1000® Index comprises the 1,000 largest companies in the Russell 3000® Index based on market capitalization. One cannot invest directly in an index. These indices are used herein for comparative purposes in accordance with Securities and Exchange Commission regulations.
Frank Russell Company (“Russell”) is the source and owner of the trademarks, service marks, and copyrights related to the Russell Indexes. Russell® is a trademark of Frank Russell Company. Neither Russell nor its licensors accept any liability for any errors or omissions in the Russell Indexes or Russell ratings or underlying data and no party may rely on any Russell Indexes or Russell ratings or underlying data contained in this communication. No further distribution of Russell data is permitted without Russell’s express written consent. Russell does not promote, sponsor, or endorse the content of this communication.
The expense ratios presented are from the most recent prospectus. The expense ratios for the current reporting period are available in the Financial Highlights section of this report.
| PERFORMANCE OVERVIEW/SCHEDULE OF INVESTMENTS |
Financial Statements
Schedule of Investments as of April 30, 2021 (Unaudited) |
HENNESSY LARGE CAP FINANCIAL FUND
(% of Net Assets)
| TOP TEN HOLDINGS (EXCLUDING MONEY MARKET FUNDS) | % NET ASSETS |
| Wells Fargo & Co. | 5.92% |
| Bank of America Corp. | 5.71% |
| Capital One Financial Corp. | 5.66% |
| Mastercard, Inc., Class A | 5.32% |
| Visa, Inc., Class A | 5.32% |
| PayPal Holdings, Inc. | 4.98% |
| The Goldman Sachs Group, Inc. | 4.96% |
| Citigroup, Inc. | 4.79% |
| Tradeweb Markets, Inc. | 4.76% |
| Morgan Stanley | 4.70% |
Note: For presentation purposes, the Fund has grouped some of the industry categories. For purposes of categorizing securities for compliance with Section 8(b)(1) of the Investment Company Act of 1940, as amended, the Fund uses more specific industry classifications.
The Global Industry Classification Standard (GICS®) was developed by and is the exclusive property and a service mark of MSCI, Inc. and Standard & Poor’s Financial Services LLC. It has been licensed for use by the Hennessy Funds.
| HENNESSY FUNDS | 1-800-966-4354 | |
| COMMON STOCKS – 96.10% | | Number | | | | | | % of | |
| | | of Shares | | | Value | | | Net Assets | |
| Financials – 61.52% | | | | | | | | | |
| Ally Financial, Inc. | | | 30,000 | | | $ | 1,543,500 | | | | 2.44 | % |
| Bank of America Corp. | | | 89,000 | | | | 3,607,170 | | | | 5.71 | % |
| Capital One Financial Corp. | | | 24,000 | | | | 3,577,920 | | | | 5.66 | % |
| Citigroup, Inc. | | | 42,500 | | | | 3,027,700 | | | | 4.79 | % |
| Huntington Bancshares, Inc. | | | 175,000 | | | | 2,681,000 | | | | 4.24 | % |
| JPMorgan Chase & Co. | | | 18,000 | | | | 2,768,580 | | | | 4.38 | % |
| Moody’s Corp. | | | 8,000 | | | | 2,613,680 | | | | 4.14 | % |
| Morgan Stanley | | | 36,000 | | | | 2,971,800 | | | | 4.70 | % |
| SelectQuote, Inc. (a) | | | 35,000 | | | | 1,089,550 | | | | 1.72 | % |
| Signature Bank | | | 7,000 | | | | 1,760,570 | | | | 2.79 | % |
| The Blackstone Group, Inc. | | | 30,000 | | | | 2,654,700 | | | | 4.20 | % |
| The Charles Schwab Corp. | | | 10,000 | | | | 704,000 | | | | 1.11 | % |
| The Goldman Sachs Group, Inc. | | | 9,000 | | | | 3,136,050 | | | | 4.96 | % |
| Tradeweb Markets, Inc. | | | 37,000 | | | | 3,007,360 | | | | 4.76 | % |
| Wells Fargo & Co. | | | 83,000 | | | | 3,739,150 | | | | 5.92 | % |
| | | | | | | | 38,882,730 | | | | 61.52 | % |
| | | | | | | | | | | | | |
| Information Technology – 34.58% | | | | | | | | | | | | |
| Adyen NV – ADR (a)(b) | | | 60,000 | | | | 2,958,000 | | | | 4.68 | % |
| Apple, Inc. | | | 22,000 | | | | 2,892,120 | | | | 4.58 | % |
| Global Payments, Inc. | | | 13,000 | | | | 2,790,190 | | | | 4.41 | % |
| Mastercard, Inc., Class A | | | 8,800 | | | | 3,362,128 | | | | 5.32 | % |
| PayPal Holdings, Inc. (a) | | | 12,000 | | | | 3,147,480 | | | | 4.98 | % |
| Paysafe Ltd. (a)(b) | | | 65,000 | | | | 897,000 | | | | 1.42 | % |
| Square, Inc., Class A (a) | | | 10,000 | | | | 2,448,200 | | | | 3.87 | % |
| Visa, Inc., Class A | | | 14,400 | | | | 3,363,264 | | | | 5.32 | % |
| | | | | | | | 21,858,382 | | | | 34.58 | % |
| | | | | | | | | | | | | |
| Total Common Stocks | | | | | | | | | | | | |
| (Cost $35,193,022) | | | | | | | 60,741,112 | | | | 96.10 | % |
| | | | | | | | | | | | | |
| SPECIAL PURPOSE ACQUISITION VEHICLES – 1.59% | | | | | | | | | | | | |
| Social Capital Hedosophia Holdings Corp. V (a)(b) | | | 59,000 | | | | 1,003,000 | | | | 1.59 | % |
| | | | | | | | | | | | | |
| Total Special Purpose Acquisition Vehicles | | | | | | | | | | | | |
| (Cost $1,157,431) | | | | | | | 1,003,000 | | | | 1.59 | % |
The accompanying notes are an integral part of these financial statements.
| SHORT-TERM INVESTMENTS – 1.83% | | Number | | | | | | % of | |
| | | of Shares | | | Value | | | Net Assets | |
| Money Market Funds – 1.83% | | | | | | | | | |
| First American Government Obligations Fund, | | | | | | | | | |
| Institutional Class, 0.03% (c) | | | 1,158,583 | | | $ | 1,158,583 | | | | 1.83 | % |
| | | | | | | | | | | | | |
| Total Short-Term Investments | | | | | | | | | | | | |
| (Cost $1,158,583) | | | | | | | 1,158,583 | | | | 1.83 | % |
| | | | | | | | | | | | | |
| Total Investments | | | | | | | | | | | | |
| (Cost $37,509,036) – 99.52% | | | | | | | 62,902,695 | | | | 99.52 | % |
| Other Assets in Excess of Liabilities – 0.48% | | | | | | | 303,064 | | | | 0.48 | % |
| | | | | | | | | | | | | |
TOTAL NET ASSETS – 100.00% | | | | | | $ | 63,205,759 | | | | 100.00 | % |
Percentages are stated as a percent of net assets.
ADR – American Depositary Receipt
NV – Naamloze Vennootschap is a Dutch term for publicly traded companies.
| (a) | Non-income-producing security. |
| (b) | U.S.-traded security of a foreign corporation. |
| (c) | The rate listed is the fund’s seven-day yield as of April 30, 2021. |
Summary of Fair Value Exposure as of April 30, 2021
The following is a summary of the inputs used to value the Fund’s net assets as of April 30, 2021 (see Note 3 in the accompanying Notes to the Financial Statements):
| Common Stocks | | Level 1 | | | Level 2 | | | Level 3 | | | Total | |
| Financials | | $ | 38,882,730 | | | $ | — | | | $ | — | | | $ | 38,882,730 | |
| Information Technology | | | 21,858,382 | | | | — | | | | — | | | | 21,858,382 | |
| Total Common Stocks | | $ | 60,741,112 | | | $ | — | | | $ | — | | | $ | 60,741,112 | |
| Special Purpose Acquisition Vehicles | | $ | 1,003,000 | | | $ | — | | | $ | — | | | $ | 1,003,000 | |
| Short-Term Investments | | | | | | | | | | | | | | | | |
| Money Market Funds | | $ | 1,158,583 | | | $ | — | | | $ | — | | | $ | 1,158,583 | |
| Total Short-Term Investments | | $ | 1,158,583 | | | $ | — | | | $ | — | | | $ | 1,158,583 | |
| Total Investments | | $ | 62,902,695 | | | $ | — | | | $ | — | | | $ | 62,902,695 | |
The accompanying notes are an integral part of these financial statements.
| HENNESSY FUNDS | 1-800-966-4354 | |
Financial Statements
Statement of Assets and Liabilities as of April 30, 2021 (Unaudited) |
| ASSETS: | | | |
| Investments in securities, at value (cost $37,509,036) | | $ | 62,902,695 | |
| Dividends and interest receivable | | | 60,107 | |
| Receivable for fund shares sold | | | 332,417 | |
| Return of capital receivable | | | 12,300 | |
| Prepaid expenses and other assets | | | 23,299 | |
| Total assets | | | 63,330,818 | |
| | | | | |
| LIABILITIES: | | | | |
| Payable for fund shares redeemed | | | 22,135 | |
| Payable to advisor | | | 44,871 | |
| Payable to sub-transfer agents | | | 18,392 | |
| Payable to administrator | | | 12,705 | |
| Payable to auditor | | | 11,227 | |
| Accrued distribution fees | | | 6,094 | |
| Accrued service fees | | | 3,007 | |
| Accrued trustees fees | | | 4,987 | |
| Accrued expenses and other payables | | | 1,641 | |
| Total liabilities | | | 125,059 | |
| NET ASSETS | | $ | 63,205,759 | |
| | | | | |
| NET ASSETS CONSISTS OF: | | | | |
| Capital stock | | $ | 36,678,534 | |
| Total distributable earnings | | | 26,527,225 | |
| Total net assets | | $ | 63,205,759 | |
| | | | | |
| NET ASSETS: | | | | |
| Investor Class | | | | |
| Shares authorized (no par value) | | Unlimited | |
| Net assets applicable to outstanding shares | | $ | 37,453,078 | |
| Shares issued and outstanding | | | 1,142,337 | |
| Net asset value, offering price, and redemption price per share | | $ | 32.79 | |
| | | | | |
| Institutional Class | | | | |
| Shares authorized (no par value) | | Unlimited | |
| Net assets applicable to outstanding shares | | $ | 25,752,681 | |
| Shares issued and outstanding | | | 779,970 | |
| Net asset value, offering price, and redemption price per share | | $ | 33.02 | |
The accompanying notes are an integral part of these financial statements.
| STATEMENT OF ASSETS AND LIABILITIES/STATEMENT OF OPERATIONS |
Financial Statements
Statement of Operations for the six months ended April 30, 2021 (Unaudited) |
| INVESTMENT INCOME: | | | |
| Dividend income | | $ | 331,212 | |
| Interest income | | | 187 | |
| Total investment income | | | 331,399 | |
| | | | | |
| EXPENSES: | | | | |
| Investment advisory fees (See Note 5) | | | 266,659 | |
| Administration, accounting, custody, and transfer agent fees (See Note 5) | | | 38,620 | |
| Sub-transfer agent expenses – Investor Class (See Note 5) | | | 30,122 | |
| Sub-transfer agent expenses – Institutional Class (See Note 5) | | | 4,003 | |
| Distribution fees – Investor Class (See Note 5) | | | 23,332 | |
| Federal and state registration fees | | | 17,992 | |
| Service fees – Investor Class (See Note 5) | | | 15,554 | |
| Compliance expense (See Note 5) | | | 13,844 | |
| Audit fees | | | 11,227 | |
| Trustees’ fees and expenses | | | 9,319 | |
| Reports to shareholders | | | 4,168 | |
| Interest expense (See Note 7) | | | 2,866 | |
| Legal fees | | | 362 | |
| Other expenses | | | 4,970 | |
| Total expenses | | | 443,038 | |
| NET INVESTMENT LOSS | | $ | (111,639 | ) |
| | | | | |
| REALIZED AND UNREALIZED GAINS (LOSSES): | | | | |
| Net realized gain on investments | | $ | 3,337,362 | |
| Net change in unrealized appreciation/deprecation on investments | | | 17,664,092 | |
| Net gain on investments | | | 21,001,454 | |
| NET INCREASE IN NET ASSETS RESULTING FROM OPERATIONS | | $ | 20,889,815 | |
The accompanying notes are an integral part of these financial statements.
| HENNESSY FUNDS | 1-800-966-4354 | |
(This Page Intentionally Left Blank.)
| STATEMENTS OF CHANGES IN NET ASSETS |
Financial Statements
| Statements of Changes in Net Assets |
| | | Six Months Ended | | | | |
| | | April 30, 2021 | | | Year Ended | |
| | | (Unaudited) | | | October 31, 2020 | |
| OPERATIONS: | | | | | | |
| Net investment loss | | $ | (111,639 | ) | | $ | (32,857 | ) |
| Net realized gain on investments | | | 3,337,362 | | | | 885,211 | |
| Net change in unrealized | | | | | | | | |
| appreciation/depreciation on investments | | | 17,664,092 | | | | (1,457,375 | ) |
| Net increase (decrease) in net | | | | | | | | |
| assets resulting from operations | | | 20,889,815 | | | | (605,021 | ) |
| | | | | | | | | |
| CAPITAL SHARE TRANSACTIONS: | | | | | | | | |
| Proceeds from shares subscribed – Investor Class | | | 8,004,691 | | | | 5,673,827 | |
| Proceeds from shares subscribed – Institutional Class | | | 11,551,769 | | | | 11,305,560 | |
| Cost of shares redeemed – Investor Class | | | (4,086,801 | ) | | | (6,851,490 | ) |
| Cost of shares redeemed – Institutional Class | | | (16,813,423 | ) | | | (11,461,893 | ) |
| Net decrease in net assets derived | | | | | | | | |
| from capital share transactions | | | (1,343,764 | ) | | | (1,333,996 | ) |
| TOTAL INCREASE (DECREASE) IN NET ASSETS | | | 19,546,051 | | | | (1,939,017 | ) |
| | | | | | | | | |
| NET ASSETS: | | | | | | | | |
| Beginning of period | | | 43,659,708 | | | | 45,598,725 | |
| End of period | | $ | 63,205,759 | | | $ | 43,659,708 | |
| | | | | | | | | |
| CHANGES IN SHARES OUTSTANDING: | | | | | | | | |
| Shares sold – Investor Class | | | 274,818 | | | | 276,712 | |
| Shares sold – Institutional Class | | | 398,126 | | | | 544,138 | |
| Shares redeemed – Investor Class | | | (140,660 | ) | | | (312,507 | ) |
| Shares redeemed – Institutional Class | | | (560,610 | ) | | | (570,423 | ) |
| Net decrease in shares outstanding | | | (28,326 | ) | | | (62,080 | ) |
The accompanying notes are an integral part of these financial statements.
| HENNESSY FUNDS | 1-800-966-4354 | |
Financial Statements
For an Investor Class share outstanding throughout each period
| | | Six Months Ended | |
| | | April 30, 2021 | |
| | | (Unaudited) | |
| PER SHARE DATA: | | | |
| Net asset value, beginning of period | | $ | 22.33 | |
| | | | | |
| Income from investment operations: | | | | |
| Net investment income (loss) | | | (0.08 | )(1) |
| Net realized and unrealized gains (losses) on investments | | | 10.54 | |
| Total from investment operations | | | 10.46 | |
| | | | | |
| Less distributions: | | | | |
| Dividends from net investment income | | | — | |
| Dividends from net realized gains | | | — | |
| Total distributions | | | — | |
| Net asset value, end of period | | $ | 32.79 | |
| | | | | |
| TOTAL RETURN | | | 46.84 | %(2) |
| | | | | |
| SUPPLEMENTAL DATA AND RATIOS: | | | | |
| Net assets, end of period (millions) | | $ | 37.45 | |
| Ratio of expenses to average net assets | | | 1.70 | %(3) |
| Ratio of net investment income (loss) to average net assets | | | (0.58 | )%(3) |
Portfolio turnover rate(4) | | | 44 | %(2) |
(1) | Calculated using the average shares outstanding method. |
(2) | Not annualized. |
(3) | Annualized. |
(4) | Calculated on the basis of the Fund as a whole. |
The accompanying notes are an integral part of these financial statements.
| FINANCIAL HIGHLIGHTS — INVESTOR CLASS |
| Year Ended October 31, | |
| 2020 | | | 2019 | | | 2018 | | | 2017 | | | 2016 | |
| | | | | | | | | | | | | | |
| $ | 22.63 | | | $ | 21.43 | | | $ | 22.02 | | | $ | 16.23 | | | $ | 18.36 | |
| | | | | | | | | | | | | | | | | | | |
| | | | | | | | | | | | | | | | | | | |
| | (0.05 | )(1) | | | (0.05 | )(1) | | | (0.07 | ) | | | (0.08 | ) | | | 0.07 | |
| | (0.25 | ) | | | 1.84 | | | | 0.48 | | | | 5.97 | | | | (0.49 | ) |
| | (0.30 | ) | | | 1.79 | | | | 0.41 | | | | 5.89 | | | | (0.42 | ) |
| | | | | | | | | | | | | | | | | | | |
| | | | | | | | | | | | | | | | | | | |
| | — | | | | — | | | | — | | | | (0.10 | ) | | | (0.02 | ) |
| | — | | | | (0.59 | ) | | | (1.00 | ) | | | — | | | | (1.69 | ) |
| | — | | | | (0.59 | ) | | | (1.00 | ) | | | (0.10 | ) | | | (1.71 | ) |
| $ | 22.33 | | | $ | 22.63 | | | $ | 21.43 | | | $ | 22.02 | | | $ | 16.23 | |
| | | | | | | | | | | | | | | | | | | |
| | -1.33 | % | | | 8.75 | % | | | 1.82 | % | | | 36.41 | % | | | -2.57 | % |
| | | | | | | | | | | | | | | | | | | |
| | | | | | | | | | | | | | | | | | | |
| $ | 22.51 | | | $ | 23.63 | | | $ | 40.99 | | | $ | 26.33 | | | $ | 26.67 | |
| | 1.75 | % | | | 1.82 | % | | | 1.69 | % | | | 1.81 | % | | | 1.66 | % |
| | (0.21 | )% | | | (0.23 | )% | | | (0.44 | )% | | | (0.41 | )% | | | 0.16 | % |
| | 88 | % | | | 83 | % | | | 64 | % | | | 76 | % | | | 141 | % |
The accompanying notes are an integral part of these financial statements.
| HENNESSY FUNDS | 1-800-966-4354 | |
Financial Statements
For an Institutional Class share outstanding throughout each period
| | | Six Months Ended | |
| | | April 30, 2021 | |
| | | (Unaudited) | |
| PER SHARE DATA: | | | |
| Net asset value, beginning of period | | $ | 22.44 | |
| | | | | |
| Income from investment operations: | | | | |
| Net investment income (loss) | | | (0.02 | )(1) |
| Net realized and unrealized gains (losses) on investments | | | 10.60 | |
| Total from investment operations | | | 10.58 | |
| | | | | |
| Less distributions: | | | | |
| Dividends from net investment income | | | — | |
| Dividends from net realized gains | | | — | |
| Total distributions | | | — | |
| Net asset value, end of period | | $ | 33.02 | |
| | | | | |
| TOTAL RETURN | | | 47.15 | %(2) |
| | | | | |
| SUPPLEMENTAL DATA AND RATIOS: | | | | |
| Net assets, end of period (millions) | | $ | 25.75 | |
| Ratio of expenses to average net assets | | | 1.27 | %(3) |
| Ratio of net investment income (loss) to average net assets | | | (0.16 | )%(3) |
Portfolio turnover rate(4) | | | 44 | %(2) |
(1) | Calculated using the average shares outstanding method. |
(2) | Not annualized. |
(3) | Annualized. |
(4) | Calculated on the basis of the Fund as a whole. |
The accompanying notes are an integral part of these financial statements.
| FINANCIAL HIGHLIGHTS — INSTITUTIONAL CLASS |
| Year Ended October 31, | |
| 2020 | | | 2019 | | | 2018 | | | 2017 | | | 2016 | |
| | | | | | | | | | | | | | |
| $ | 22.68 | | | $ | 21.39 | | | $ | 21.91 | | | $ | 16.26 | | | $ | 18.39 | |
| | | | | | | | | | | | | | | | | | | |
| | | | | | | | | | | | | | | | | | | |
| | 0.02 | (1) | | | 0.01 | (1) | | | 0.03 | | | | 0.18 | | | | 0.02 | |
| | (0.26 | ) | | | 1.87 | | | | 0.45 | | | | 5.78 | | | | (0.36 | ) |
| | (0.24 | ) | | | 1.88 | | | | 0.48 | | | | 5.96 | | | | (0.34 | ) |
| | | | | | | | | | | | | | | | | | | |
| | | | | | | | | | | | | | | | | | | |
| | — | | | | — | | | | — | | | | (0.31 | ) | | | (0.09 | ) |
| | — | | | | (0.59 | ) | | | (1.00 | ) | | | — | | | | (1.70 | ) |
| | — | | | | (0.59 | ) | | | (1.00 | ) | | | (0.31 | ) | | | (1.79 | ) |
| $ | 22.44 | | | $ | 22.68 | | | $ | 21.39 | | | $ | 21.91 | | | $ | 16.26 | |
| | | | | | | | | | | | | | | | | | | |
| | -1.06 | % | | | 9.16 | % | | | 2.16 | % | | | 36.92 | % | | | -2.14 | % |
| | | | | | | | | | | | | | | | | | | |
| | | | | | | | | | | | | | | | | | | |
| $ | 21.15 | | | $ | 21.97 | | | $ | 8.85 | | | $ | 5.83 | | | $ | 0.35 | |
| | 1.45 | % | | | 1.43 | % | | | 1.34 | % | | | 1.50 | % | | | 1.24 | % |
| | 0.08 | % | | | 0.05 | % | | | (0.07 | )% | | | (0.17 | )% | | | 0.52 | % |
| | 88 | % | | | 83 | % | | | 64 | % | | | 76 | % | | | 141 | % |
The accompanying notes are an integral part of these financial statements.
| HENNESSY FUNDS | 1-800-966-4354 | |
Financial Statements
Notes to the Financial Statements April 30, 2021 (Unaudited) |
1). ORGANIZATION
The Hennessy Large Cap Financial Fund (the “Fund”) is a series of Hennessy Funds Trust (the “Trust”), which was organized as a Delaware statutory trust on September 17, 1992. The Fund is an open-end management investment company registered under the Investment Company Act of 1940, as amended. The investment objective of the Fund is capital appreciation. The Fund is a non-diversified fund.
The Fund offers Investor Class and Institutional Class shares. Each class of shares differs principally in its respective 12b-1 distribution and service, shareholder servicing, and sub-transfer agent expenses. There are no sales charges. Each class has identical rights to earnings, assets, and voting privileges, except for class-specific expenses and exclusive rights to vote on matters affecting only one class.
As an investment company, the Fund follows the investment company accounting and reporting guidance of the Financial Accounting Standards Board (“FASB”) Accounting Standard Codification Topic 946 “Financial Services—Investment Companies.”
2). SIGNIFICANT ACCOUNTING POLICIES
The following is a summary of significant accounting policies consistently followed by the Fund in the preparation of the financial statements. These policies conform to U.S. generally accepted accounting principles (“GAAP”).
| a). | Securities Valuation – All investments in securities are valued in accordance with the Fund’s valuation policies and procedures, as described in Note 3. |
| | |
| b). | Federal Income Taxes – The Fund has elected to be taxed as a regulated investment company and intends to distribute substantially all of its taxable income to its shareholders and otherwise comply with the provisions of the Internal Revenue Code of 1986, as amended, applicable to regulated investment companies. As a result, the Fund has made no provision for federal income taxes or excise taxes. Net investment income/loss and realized gains/losses for federal income tax purposes may differ from those reported in the financial statements because of temporary book-basis and tax-basis differences. Temporary differences are primarily the result of the treatment of wash sales for tax reporting purposes. The Fund recognizes interest and penalties related to income tax benefits, if any, in the Statement of Operations as an income tax expense. Distributions from net realized gains for book purposes may include short-term capital gains, which are included as ordinary income to shareholders for tax purposes. The Fund may utilize equalization accounting for tax purposes and designate earnings and profits, including net realized gains distributed to shareholders on redemption of shares, as part of the dividends paid deduction for income tax purposes. |
| | |
| c). | Accounting for Uncertainty in Income Taxes – The Fund has accounting policies regarding recognition and measurement of tax positions taken or expected to be taken on a tax return. The tax returns of the Fund for the prior three fiscal years are open for examination. The Fund has reviewed all open tax years in major tax jurisdictions and concluded that there is no impact on the Fund’s net assets and no tax liability resulting from unrecognized tax benefits relating to uncertain income tax positions taken or expected to be taken on a tax return. The Fund’s major tax jurisdictions are U.S. federal and Delaware. |
| NOTES TO THE FINANCIAL STATEMENTS |
| d). | Income and Expenses – Dividend income is recognized on the ex-dividend date or as soon as information is available to the Fund. Interest income, which includes the amortization of premium and accretion of discount, is recognized on an accrual basis. Market discounts, original issue discounts, and market premiums on debt securities are accreted or amortized to interest income over the life of a security with a corresponding increase or decrease, as applicable, in the cost basis of such security using the yield-to-maturity method or, where applicable, the first call date of the security. Other non-cash dividends are recognized as investment income at the fair value of the property received. The Fund is charged for those expenses that are directly attributable to its portfolio, such as advisory, administration, and certain shareholder service fees. Income, expenses (other than expenses attributable to a specific class), and realized and unrealized gains/losses on investments are allocated to each class of shares based on such class’s net assets. |
| | |
| e). | Distributions to Shareholders – Dividends from net investment income for the Fund, if any, are declared and paid annually, usually in December. Distributions of net realized capital gains, if any, are declared and paid annually, usually in December. |
| | |
| f). | Security Transactions – Investment and shareholder transactions are recorded on the trade date. The Fund determines the realized gain/loss from an investment transaction by comparing the original cost of the security lot sold with the net sale proceeds. Discounts and premiums on securities purchased are accreted or amortized, respectively, over the life of each such security. |
| | |
| g). | Use of Estimates – Preparing financial statements in accordance with GAAP requires management to make estimates and assumptions that affect the reported amounts of assets and liabilities and disclosure of contingent assets and liabilities at the date of the financial statements, as well as the reported change in net assets during the reporting period. Actual results could differ from those estimates. |
| | |
| h). | Share Valuation – The net asset value (“NAV”) per share of the Fund is calculated by dividing (i) the total value of the securities held by the Fund, plus cash and other assets, minus all liabilities (including estimated accrued expenses) by (ii) the total number of Fund shares outstanding, rounded to the nearest $0.01. Fund shares are not priced on days the New York Stock Exchange is closed for trading. The offering and redemption price per share for the Fund is equal to the Fund’s NAV per share. |
| | |
| i). | New Accounting Pronouncements – In August 2018, the FASB issued Accounting Standards Update No. 2018-13 “Disclosure Framework—Changes to the Disclosure Requirements for Fair Value Measurement” (“ASU 2018-13”). ASU 2018-13 eliminates the requirement to disclose the amount of and reasons for transfers between Level 1 and Level 2 of the fair value hierarchy, the timing of transfers between levels of the fair value hierarchy, and the valuation processes for Level 3 fair value measurements. ASU 2018-13 does not eliminate the requirement to disclose the range and weighted average used to develop significant unobservable inputs for Level 3 fair value measurements or the requirement to disclose the changes in unrealized gains and losses for recurring Level 3 fair value measurements. ASU 2018-13 requires that information is provided about the measurement uncertainty of Level 3 fair value measurements as of the reporting date. The guidance is effective for fiscal years beginning after December 15, 2019, and interim periods within those fiscal years. Management evaluated the impact of this change in guidance and, due to the permissibility of early adoption, modified the Fund’s fair value disclosures beginning with its fiscal year 2019. |
| HENNESSY FUNDS | 1-800-966-4354 | |
3). SECURITIES VALUATION
The Fund follows its valuation policies and procedures in determining its net asset value and, in preparing these financial statements, the fair value accounting standards that establish an authoritative definition of fair value and set out a hierarchy for measuring fair value. These standards require additional disclosures about the various inputs and valuation techniques used to develop the measurements of fair value and a discussion of changes in valuation techniques and related inputs during the period. These inputs are summarized in the three broad levels listed below:
| | Level 1 – | Unadjusted, quoted prices in active markets for identical instruments that the Fund has the ability to access at the date of measurement. |
| | | |
| | Level 2 – | Other significant observable inputs (including, but not limited to, quoted prices in active markets for similar instruments, quoted prices in markets that are not active for identical or similar instruments, and model-derived valuations in which all significant inputs and significant value drivers are observable in active markets, such as interest rates, prepayment speeds, credit risk curves, default rates, and similar data). |
| | | |
| | Level 3 – | Significant unobservable inputs (including the Fund’s own assumptions about what market participants would use to price the asset or liability based on the best available information) when observable inputs are unavailable. |
The following is a description of the valuation techniques applied to the Fund’s major categories of assets and liabilities on a recurring basis:
| | Equity Securities – Equity securities, including common stocks, preferred stocks, foreign-issued common stocks, exchange-traded funds, closed-end mutual funds, partnerships, rights, and real estate investment trusts, that are traded on a securities exchange for which a last-quoted sales price is readily available generally are valued at the last sales price as reported by the primary exchange on which the securities are listed. Securities listed on The NASDAQ Stock Market (“NASDAQ”) generally are valued at the NASDAQ Official Closing Price, which may differ from the last sales price reported. Securities traded on a securities exchange for which a last-quoted sales price is not readily available generally are valued at the mean between the bid and ask prices. To the extent these securities are actively traded and valuation adjustments are not applied, they are classified in Level 1 of the fair value hierarchy. Securities traded on foreign exchanges generally are not valued at the same time the Fund calculates its NAV because most foreign markets close well before such time. The earlier close of most foreign markets gives rise to the possibility that significant events, including broad market moves, may have occurred in the interim. In certain circumstances, it may be determined that a foreign security needs to be fair valued because it appears that the value of the security might have been materially affected by events occurring after the close of the market in which the security is principally traded, but before the time the Fund calculates its NAV, such as by a development that affects an entire market or region (e.g., a weather-related event) or a potentially global development (e.g., a terrorist attack that may be expected to have an effect on investor expectations worldwide). |
| | |
| | Registered Investment Companies – Investments in open-end registered investment companies, commonly referred to as mutual funds, generally are priced at the ending NAV provided by the applicable mutual fund’s service agent and are classified in Level 1 of the fair value hierarchy. |
| NOTES TO THE FINANCIAL STATEMENTS |
| | Debt Securities – Debt securities, including corporate bonds, asset-backed securities, mortgage-backed securities, municipal bonds, U.S. Treasuries, and U.S. government agency issues, are generally valued at market on the basis of valuations furnished by an independent pricing service that utilizes both dealer-supplied valuations and formula-based techniques. The pricing service may consider recently executed transactions in securities of the issuer or comparable issuers, market price quotations (where observable), bond spreads, and fundamental data relating to the issuer. In addition, the model may incorporate observable market data, such as reported sales of similar securities, broker quotes, yields, bids, offers, and reference data. Certain securities are valued primarily using dealer quotations. These securities are generally classified in Level 2 of the fair value hierarchy. |
| | |
| | Short-Term Securities – Short-term equity investments, including money market funds, are valued in the manner specified above for equity securities. Short-term debt investments with an original term to maturity of 60 days or less are valued at amortized cost, which approximates fair market value. If the original term to maturity of a short-term debt investment exceeds 60 days, then the values as of the 61st day prior to maturity are amortized. Amortized cost is not used if its use would be inappropriate due to credit or other impairments of the issuer, in which case the security’s fair value would be determined as described below. Short-term securities are generally classified in Level 1 or Level 2 of the fair value hierarchy depending on the inputs used and market activity levels for specific securities. |
The Board of Trustees of the Fund (the “Board”) has adopted fair value pricing procedures that are followed when a price for a security is not readily available or if a significant event has occurred that indicates the closing price of a security no longer represents the true value of that security. Fair value pricing determinations are made in good faith in accordance with these procedures. There are numerous criteria considered in determining a fair value of a security, such as the trading volume of a security and markets, the values of other similar securities, and news events with direct bearing on a security or markets. Fair value pricing results in an estimated price for a security that reflects the amount the Fund might reasonably expect to receive in a current sale. Depending on the relative significance of the valuation inputs, these securities may be classified in either Level 2 or Level 3 of the fair value hierarchy.
The fair value of foreign securities may be determined with the assistance of a pricing service using correlations between the movement of prices of such securities and indices of domestic securities and other appropriate indicators, such as closing market prices of relevant American Depositary Receipts or futures contracts. Using fair value pricing means that the Fund’s NAV reflects the affected portfolio securities’ values as determined by the Board or its designee, pursuant to the fair value pricing procedures adopted by the Board, instead of being determined by the market. Using a fair value pricing methodology to price a foreign security may result in a value that is different from such foreign security’s most recent closing price and from the value used by other investment companies to calculate their NAVs. Such securities are generally classified in Level 2 of the fair value hierarchy. Because the Fund may invest in foreign securities, the value of the Fund’s portfolio securities may change on days when a shareholder is unable to purchase or redeem Fund shares.
The Board has delegated day-to-day valuation matters to the Valuation and Liquidity Committee comprising representatives from Hennessy Advisors, Inc., the Fund’s investment advisor (the “Advisor”). The function of the Valuation and Liquidity Committee, among other things, is to value securities where current and reliable market quotations are not readily available. All actions taken by the Valuation and Liquidity Committee are reviewed by the Board.
| HENNESSY FUNDS | 1-800-966-4354 | |
The Fund has performed an analysis of all existing investments to determine the significance and character of all inputs to their fair value determinations. Various inputs are used to determine the value of the Fund’s investments. The inputs or methodology used for valuing securities are not necessarily an indication of the risk associated with investing in those securities. Details related to the fair value hierarchy of the Fund’s securities as of April 30, 2021, are included in the Schedule of Investments.
4). INVESTMENT TRANSACTIONS
Purchases and sales of investment securities (excluding government and short-term investments) for the Fund during the six months ended April 30, 2021, were $24,858,759 and $26,567,141, respectively.
There were no purchases or sales/maturities of long-term U.S. government securities for the Fund during the six months ended April 30, 2021.
5). INVESTMENT ADVISORY FEE AND OTHER TRANSACTIONS WITH AFFILIATES
The Advisor provides the Fund with investment advisory services under an Investment Advisory Agreement. The Advisor furnishes all investment advice, office space, and facilities and most of the personnel needed by the Fund. As compensation for its services, the Advisor is entitled to a monthly fee from the Fund. The fee is based on the average daily net assets of the Fund at an annual rate of 0.90%. The net investment advisory fees expensed by the Fund during the six months ended April 30, 2021, are included in the Statement of Operations.
The Board has approved a Shareholder Servicing Agreement for Investor Class shares of the Fund, which compensates the Advisor for the non-investment advisory services it provides to the Fund. The Shareholder Servicing Agreement provides for a monthly fee paid to the Advisor at an annual rate of 0.10% of the average daily net assets of the Fund attributable to Investor Class shares. The shareholder service fees expensed by the Fund during the six months ended April 30, 2021, are included in the Statement of Operations.
The Fund has adopted a plan pursuant to Rule 12b-1 under the Investment Company Act of 1940, as amended, that authorizes payments in connection with the distribution of Fund shares at an annual rate of up to 0.25% of the Fund’s average daily net assets attributable to Investor Class shares. Even though the authorized rate is up to 0.25%, the Fund is currently only using up to 0.15% of its average daily net assets attributable to Investor Class shares for such purpose. Amounts paid under the plan may be spent on any activities or expenses primarily intended to result in the sale of shares, including, but not limited to, advertising, shareholder account servicing, printing and mailing of prospectuses to other than current shareholders, printing and mailing of sales literature, and compensation for sales and marketing activities or to financial institutions and others, such as dealers and distributors. The distribution fees expensed by the Fund during the six months ended April 30, 2021, are included in the Statement of Operations.
The Fund has entered into agreements with various brokers, dealers, and financial intermediaries in connection with the sale of Fund shares. The agreements provide for periodic payments of sub-transfer agent expenses by the Fund to the brokers, dealers, and financial intermediaries for providing certain shareholder maintenance services. These shareholder services include the pre-processing and quality control of new accounts, shareholder correspondence, answering customer inquiries regarding account status, and facilitating shareholder telephone transactions. The sub-transfer agent fees expensed by the Fund during the six months ended April 30, 2021, are included in the Statement of Operations.
| NOTES TO THE FINANCIAL STATEMENTS |
U.S. Bancorp Fund Services, LLC, d/b/a U.S. Bank Global Fund Services (“Fund Services”) provides the Fund with administrative, accounting, and transfer agent services. As administrator, Fund Services is responsible for activities such as (i) preparing various federal and state regulatory filings, reports, and returns for the Fund, (ii) preparing reports and materials to be supplied to the Board, (iii) monitoring the activities of the Fund’s custodian, transfer agent, and accountants, and (iv) coordinating the preparation and payment of the Fund’s expenses and reviewing the Fund’s expense accruals. U.S. Bank N.A., an affiliate of Fund Services, serves as the Fund’s custodian. The servicing agreements between the Trust, Fund Services, and U.S. Bank N.A. contain a fee schedule that is inclusive of administrative, accounting, custody, and transfer agent fees. The administrative, accounting, custody, and transfer agent fees expensed by the Fund during the six months ended April 30, 2021, are included in the Statement of Operations.
Quasar Distributors, LLC (“Quasar”), a wholly owned broker-dealer subsidiary of Foreside Financial Group, LLC, acts as the Fund’s principal underwriter in a continuous public offering of Fund shares.
The officers of the Fund are affiliated with the Advisor. With the exception of the Chief Compliance Officer and the Senior Compliance Officer, such officers receive no compensation from the Fund for serving in their respective roles. The Fund, along with the other funds in the Hennessy Funds family (collectively, the “Hennessy Funds”), makes reimbursement payments on an equal basis to the Advisor for a portion of the salary and benefits associated with the office of the Chief Compliance Officer and for all of the salary and benefits associated with the office of the Senior Compliance Officer. The compliance fees expensed by the Fund during the six months ended April 30, 2021, are included in the Statement of Operations.
6). GUARANTEES AND INDEMNIFICATIONS
Under the Hennessy Funds’ organizational documents, their officers and trustees are indemnified by the Hennessy Funds against certain liabilities arising out of the performance of their duties to the Hennessy Funds. Additionally, in the normal course of business, the Hennessy Funds enter into contracts with service providers that contain general indemnification clauses. The Fund’s maximum exposure under these arrangements is unknown as this would involve future claims that may be made against the Fund that have not yet occurred. Currently, the Fund expects the risk of loss to be remote.
7). LINE OF CREDIT
The Fund has an uncommitted line of credit with the other Hennessy Funds in the amount of the lesser of (i) $100,000,000 or (ii) 33.33% of each Hennessy Fund’s net assets, or 30% for the Hennessy Gas Utility Fund and 10% for the Hennessy Balanced Fund. The line of credit is intended to provide any necessary short-term financing in connection with shareholder redemptions, subject to certain restrictions. The credit facility is with the Hennessy Funds’ custodian bank, U.S. Bank N.A. Borrowings under this arrangement bear interest at the bank’s prime rate and are secured by all of the Fund’s assets (as to its own borrowings only). During the six months ended April 30, 2021, the Fund had an outstanding average daily balance and a weighted average interest rate of $175,403 and 3.25%, respectively. The interest expensed by the Fund during the six months ended April 30, 2021, is included in the Statement of Operations. The maximum amount outstanding for the Fund during the period was $14,784,000. As of April 30, 2021, the Fund did not have any borrowings outstanding under the line of credit.
| HENNESSY FUNDS | 1-800-966-4354 | |
8). FEDERAL TAX INFORMATION
As of October 31, 2020, the Fund’s most recent fiscal year end, the components of accumulated earnings (losses) for income tax purposes were as follows:
| | | Investments | |
| Cost of investments for tax purposes | | $ | 37,074,652 | |
| Gross tax unrealized appreciation | | $ | 10,484,842 | |
| Gross tax unrealized depreciation | | | (3,835,619 | ) |
| Net tax unrealized appreciation/(depreciation) | | $ | 6,649,223 | |
| Undistributed ordinary income | | $ | — | |
| Undistributed long-term capital gains | | | — | |
| Total distributable earnings | | $ | — | |
| Other accumulated gain/(loss) | | $ | (1,011,813 | ) |
| Total accumulated gain/(loss) | | $ | 5,637,410 | |
The difference between book-basis unrealized appreciation/depreciation and tax-basis unrealized appreciation/depreciation (as shown above) is attributable primarily to wash sales.
As of October 31, 2020, the Fund had $914,702 in unlimited short-term capital loss carryforwards.
Capital losses sustained in or after fiscal year 2012 can be carried forward indefinitely, but any such loss retains the character of the original loss and must be utilized prior to any loss incurred before fiscal year 2012. As a result of this ordering rule, capital loss carryforwards incurred prior to fiscal year 2012 may be more likely to expire unused. Capital losses sustained prior to fiscal year 2012 can be carried forward for eight years and can be carried forward as short-term capital losses regardless of the character of the original loss.
As of October 31, 2020, the Fund deferred, on a tax basis, a late-year ordinary loss of $97,111. Late-year ordinary losses are net ordinary losses incurred after December 31, 2019, but within the taxable year, that are deemed to arise on the first day of the Fund’s next taxable year.
During fiscal year 2021 (year to date) and fiscal year 2020, the Fund did not pay any distributions.
9). LIBOR TRANSITION
The Fund invests in securities of financial institutions that may be involved in financings based on, among other floating rates, the London Interbank Offered Rate (“LIBOR”). LIBOR is the offered rate for short-term Eurodollar deposits between major international banks. On July 27, 2017, the UK Financial Conduct Authority, which regulates LIBOR, announced that it would no longer persuade or compel banks to submit rates for the calculation of LIBOR after 2021, meaning that LIBOR cannot continue on its current basis and will not be guaranteed after 2021. Regulators and industry working groups have suggested alternative reference rates, but global consensus is lacking, and the process for amending existing contracts or instruments to transition away from LIBOR remains unclear. The transition away from LIBOR may lead to increased volatility and illiquidity in markets tied to LIBOR, reduce the value of LIBOR-related instruments, and reduce the effectiveness of hedging strategies, which could adversely affect the Fund’s performance. Additionally, any alternative reference rate may be an ineffective substitute, resulting in prolonged adverse market conditions for the Fund’s investments.
| NOTES TO THE FINANCIAL STATEMENTS |
10). EVENTS SUBSEQUENT TO PERIOD END
Management has evaluated the Fund’s related events and transactions that occurred subsequent to April 30, 2021, through the date of issuance of the Fund’s financial statements. Management has determined that there were no subsequent events requiring recognition or disclosure in the financial statements.
| HENNESSY FUNDS | 1-800-966-4354 | |
Expense Example (Unaudited)
April 30, 2021
As a shareholder of the Fund, you incur ongoing costs, including management fees, service fees, and other Fund expenses. This Example is intended to help you understand your ongoing costs (in dollars) of investing in the Fund and to compare these costs with the ongoing costs of investing in other mutual funds. The Example is based on an investment of $1,000 invested at the beginning of the period and held for the entire period from November 1, 2020, through April 30, 2021.
Actual Expenses
In the table below, the first line under each of the “Investor Class” and “Institutional Class” headings provides information about actual account values and actual expenses for each share class. You may use this information, together with the amount you invested, to estimate the expenses that you paid over the period. Simply divide your account value by $1,000 (for example, an $8,600 account value divided by $1,000 = 8.6), then multiply the result by the number in the first line under the heading entitled “Expenses Paid During Period” to estimate the expenses you paid on your account during this period. Although the Fund charges no sales loads or transaction fees, you will be assessed fees for outgoing wire transfers, returned checks, and stop payment orders at prevailing rates charged by U.S. Bank Global Fund Services, the Fund’s transfer agent. If you request that a redemption be made by wire transfer, the Fund’s transfer agent charges a $15 fee. IRAs are charged a $15 annual maintenance fee (up to $30 maximum per shareholder for shareholders with multiple IRAs). The examples below include, but are not limited to, management, shareholder servicing, accounting, custody, and transfer agent fees. However, the examples below do not include portfolio trading commissions and related expenses.
Hypothetical Example for Comparison Purposes
In the table below, the second line under each of the “Investor Class” and “Institutional Class” headings provides information about hypothetical account values and hypothetical expenses based on the Fund’s actual expense ratio for each share class and an assumed rate of return of 5% per year before expenses, which is not the Fund’s actual return for such share class. The hypothetical account values and expenses may not be used to estimate the actual ending account balance or expenses you paid for the period. You may use this information to compare the ongoing costs of investing in the Fund and other funds. To do so, compare these 5% hypothetical examples with the 5% hypothetical examples that appear in the shareholder reports of the other funds. Please note that the expenses shown in the table are meant to highlight your ongoing costs only. Therefore, the second lines under “Investor Class” and “Institutional Class” headings are useful in comparing ongoing costs only and will not help you determine the relative total costs of owning different funds.
| | Beginning | Ending | |
| | Account Value | Account Value | Expenses Paid |
| | November 1, 2020 | April 30, 2021
| During Period(1) |
| Investor Class | | | |
| Actual | $1,000.00 | $1,468.40 | $10.40 |
| Hypothetical (5% return before expenses) | $1,000.00 | $1,016.36 | $ 8.50 |
| | | | |
| Institutional Class | | | |
| Actual | $1,000.00 | $1,471.50 | $ 7.78 |
| Hypothetical (5% return before expenses) | $1,000.00 | $1,018.50 | $ 6.36 |
(1) | Expenses are equal to the Fund’s annualized expense ratio of 1.70% for Investor Class shares or 1.27% for Institutional Class shares, as applicable, multiplied by the average account value over the period, multiplied by 181/365 days (to reflect the half-year period). |
| HENNESSY FUNDS | 1-800-966-4354 | |
How to Obtain a Copy of the Fund’s Proxy
Voting Policy and Proxy Voting Records
A description of the policies and procedures the Fund uses to determine how to vote proxies relating to portfolio securities is available without charge (1) by calling 1-800-966-4354, (2) on the Hennessy Funds’ website at www.hennessyfunds.com/proxy-voting/voting-policy, or (3) on the U.S. Securities and Exchange Commission’s (the “SEC”) website at www.sec.gov. The Fund’s proxy voting record is available without charge on both the Hennessy Funds’ website at www.hennessyfunds.com/proxy-voting/voting-record and the SEC’s website at www.sec.gov no later than August 31 for the prior 12 months ending June 30.
Availability of Quarterly Portfolio Schedule
The Fund files a complete schedule of portfolio holdings with the SEC for the first and third quarters of each fiscal year as an exhibit to its reports on Form N-PORT. The Fund’s Form N-PORT reports are available on the SEC’s website at www.sec.gov or on request by calling 1-800-966-4354.
Important Notice Regarding Delivery
of Shareholder Documents
To help keep the Fund’s costs as low as possible, we generally deliver a single copy of notices, shareholder reports, proxy statements, and prospectuses to shareholders who share an address and have the same last name. This process does not apply to account statements. You may request an individual copy of a shareholder document at any time. If you would like to receive separate mailings of shareholder documents, please call U.S. Bank Global Fund Services at 1-800-261-6950 or 1-414-765-4124, and individual delivery will begin within 30 days of your request. If your account is held through a financial institution or other intermediary, please contact such intermediary directly to request individual delivery.
Electronic Delivery
As permitted by SEC regulations, the Fund’s shareholder reports are made available on a website, and unless you sign up for eDelivery or elect to receive paper copies as detailed below, you will be notified by mail each time a report is posted and provided with a website link to access the report.
The Fund also offers shareholders the option to receive all notices, account statements, prospectuses, tax forms, and shareholder reports online. To sign up for eDelivery or change your delivery preference, please visit www.hennessyfunds.com/account.
To elect to receive paper copies of all future reports free of charge, please call U.S. Bank Global Fund Services at 1-800-261-6950 or 1-414-765-4124.
Subscribe to receive our team’s unique market and sector insights delivered to your inbox
www.hennessyfunds.com/subscribe
Follow us on social media
| PROXY VOTING — BOARD APPROVAL OF INVESTMENT ADVISORY AGREEMENT |
Board Approval of Investment Advisory
Agreement
At its meeting on March 10, 2021, the Board of Trustees of the Fund (the “Board,” and the members thereof, the “Trustees”) unanimously approved the continuation of the investment advisory agreement of the Fund with Hennessy Advisors, Inc. (the “Advisor”). As part of the process, the Trustees reviewed their fiduciary duties and the relevant factors for them to consider with respect to approving the advisory agreement. In addition, the Trustees who are not deemed “interested persons” (as defined by the Investment Company Act of 1940, as amended) of the Fund (the “Independent Trustees”) met in executive session to discuss the approval of the advisory agreement.
In advance of the meeting, the Advisor sent detailed information to the Trustees to assist them in their evaluation of the advisory agreement. This information included, but was not limited to, the following:
| | (1) | A memorandum from outside legal counsel that described the fiduciary duties of the Board with respect to approving the continuation of the advisory agreement and the relevant factors for consideration; |
| | | |
| | (2) | A memorandum from the Advisor that listed the factors relevant to the Board’s approval of the continuation of the advisory agreement and also referenced the documents that had been provided to help the Board assess each such factor; |
| | | |
| | (3) | The Advisor’s financial statements from its most recent Form 10-K and Form 10-Q; |
| | | |
| | (4) | A summary of the advisory agreement; |
| | | |
| | (5) | A recent Fund fact sheet, which included performance information over various periods; |
| | | |
| | (6) | An description of the range of services provided by the Advisor; |
| | | |
| | (7) | A peer expense comparison of the net expense ratio and investment advisory fee of the Fund; and |
| | | |
| | (8) | A memorandum from the Adviser regarding economies of scale. |
All of the factors discussed were considered as a whole by the Trustees and by the Independent Trustees meeting in executive session. The factors were viewed in their totality by the Trustees, with no single factor being the principal or determinative factor in the Trustees’ determination of whether to approve the continuation of the advisory agreement. The Trustees recognized that the management and fee arrangements for the Fund are the result of years of review and discussion between the Independent Trustees and the Advisor, that certain aspects of such arrangements may receive greater scrutiny in some years than in others, and that the Trustees’ conclusions may be based, in part, on their consideration of these same arrangements and information received during the course of the year and in prior years.
Prior to approving the continuation of the advisory agreement, the Trustees, including the Independent Trustees in executive session, considered, among other items:
| | (1) | The nature and quality of the advisory services provided by the Advisor; |
| | | |
| | (2) | A comparison of the fees and expenses of the Fund to other similar funds; |
| | | |
| | (3) | Whether economies of scale are recognized by the Fund; |
| | | |
| | (4) | The costs and profitability of the Fund to the Advisor; |
| | | |
| | (5) | The performance of the Fund; and |
| HENNESSY FUNDS | 1-800-966-4354 | |
| | (6) | Any benefits to the Advisor from serving as an investment advisor to the Fund (other than the advisory fee). |
The material considerations and determinations of the Trustees, including the Independent Trustees, were as follows:
| | (1) | The Trustees considered the services identified below that are provided by the Advisor. Based on this review, the Trustees concluded that the Advisor provides high-quality services to the Fund and noted that their overall confidence in the Advisor was high. The Trustees also concluded that they were satisfied with the nature, extent, and quality of the advisory services provided to the Fund by the Advisor and that the nature and extent of the services provided by the Advisor were appropriate to assure that the Fund’s operations are conducted in compliance with applicable laws, rules, and regulations. |
| | | (a) | The Advisor acts as the portfolio manager for the Fund. In this capacity, the Advisor does the following: |
| | | | (i) | manages the composition of the Fund’s portfolio, including the purchase, retention, and disposition of portfolio securities in accordance with the Fund’s investment objectives, policies, and restrictions; |
| | | | | |
| | | | (ii) | seeks best execution for the Fund’s portfolio; |
| | | | | |
| | | | (iii) | manages the use of soft dollars for the Fund; and |
| | | | | |
| | | | (iv) | manages proxy voting for the Fund. |
| | | (b) | The Advisor performs a daily reconciliation of portfolio positions and cash for the Fund. |
| | | | |
| | | (c) | The Advisor monitors the liquidity of each Fund. |
| | | | |
| | | (d) | The Advisor monitors the Fund’s compliance with its investment objectives and restrictions and federal securities laws. |
| | | | |
| | | (e) | The Advisor maintains a compliance program (including a code of ethics), conducts ongoing reviews of the compliance programs of the Fund’s service providers (including their codes of ethics, as appropriate), conducts on-site visits to the Fund’s service providers as feasible, monitors incidents of abusive trading practices, reviews Fund expense accruals, payments, and fixed expense ratios, evaluates insurance providers for fidelity bond, D&O/E&O insurance, and cybersecurity insurance coverage, manages regulatory examination compliance and responses, conducts employee compliance training, reviews reports provided by service providers, and maintains books and records. |
| | | | |
| | | (f) | The Advisor oversees service providers that provide accounting, administration, distribution, transfer agency, custodial, sales, marketing, public relations, audit, information technology, and legal services to the Fund. |
| | | | |
| | | (g) | The Advisor maintains in-house marketing and distribution departments on behalf of the Fund. |
| | | | |
| | | (h) | The Advisor prepares or directs the preparation of all regulatory filings for the Fund, including writing and annually updating the Fund’s prospectus and related documents. |
| | | | |
| | | (i) | For each annual report of the Fund, the Advisor prepares a written summary of the Fund’s performance during the most recent 12-month period. |
| BOARD APPROVAL OF INVESTMENT ADVISORY AGREEMENT |
| | | (j) | The Advisor oversees distribution of the Fund through third-party broker/dealers and independent financial institutions such as Charles Schwab, Inc., Fidelity, TD Ameritrade, and Pershing. The Advisor compensates, in part, a number of these third-party providers out of its own revenues. |
| | | | |
| | | (k) | The Advisor pays the incentive compensation of the Fund’s compliance officers and employs other staff, such as legal, marketing, national accounts, distribution, sales, administrative, and trading oversight personnel, as well as management executives. |
| | | | |
| | | (l) | The Advisor provides a quarterly compliance certification to the Board. |
| | | | |
| | | (m) | The Advisor prepares or reviews all Board materials, frequently presents to the Board and leads Board discussions, prepares or reviews all meeting minutes, and arranges for Board training and education. |
| | (2) | The Trustees compared the performance of the Fund to benchmark indices over various periods and also noted that the Trustees review and discuss reports comparing the investment performance of the Fund to various indices at each quarterly Board meeting. Based on such information, the Trustees determined that the Advisor manages the Fund in a manner materially consistent with its stated investment objective and style. The Trustees concluded that the performance of the Fund over various periods warranted continuation of the advisory agreement. |
| | | |
| | (3) | The Trustees reviewed the advisory fees and overall expense ratios of the Fund compared to other funds similar in asset size and investment objective to the Fund using data from Morningstar. As part of the discussion with management, the Trustees ensured that they understood and were comfortable with the criteria used to determine the mutual funds included in the Morningstar categories for purposes of the materials considered at the meeting. The Trustees determined that the advisory fee and overall expense ratio of the Fund falls within the range of the advisory fees and overall expense ratios of other comparable funds and concluded that they are reasonable and warranted continuation of the advisory agreement. |
| | | |
| | (4) | The Trustees also considered whether the Advisor was realizing economies of scale that it should share with the Fund’s shareholders. The Trustees noted that many of the expenses incurred to manage the Fund are asset-based fees, so the Advisor would not realize material economies of scale relating to those expenses as the assets of the Fund increase. For example, third-party platform fees increase as the Fund’s assets grow. The Trustees also considered the Advisor’s significant marketing efforts to promote the Funds and the Advisor’s agreement to waive fees or lower its management fees in certain circumstances. |
| | | |
| | (5) | The Trustees considered the profitability of the Advisor, including the impact of mutual fund platform fees on the Advisor’s profitability, and also considered the resources and revenues that the Advisor has put into managing and distributing the Fund. The Trustees then concluded that the profits of the Advisor are reasonable and not excessive when compared to profitability guidelines set forth in relevant court cases. |
| | | |
| | (6) | The Trustees considered the high level of professionalism and knowledge of the Advisor’s employees, along with a very low level of turnover, and concluded that this was beneficial to the Fund and its shareholders. |
| HENNESSY FUNDS | 1-800-966-4354 | |
| | (7) | The Trustees considered any benefits to the Advisor from serving as an advisor to the Fund (other than the advisory fee). The Trustees noted that the Advisor may derive ancillary benefits from, by way of example, its association with the Fund in the form of proprietary and third-party research products and services received from broker-dealers that execute portfolio trades for the Fund. The Trustees determined that any such products and services have been used for legitimate purposes relating to the Fund by providing assistance in the investment decision-making process. The Trustees concluded that any additional benefits realized by the Advisor from its relationship with the Fund were reasonable, which was based on, among other things, the Trustees’ finding that the research, analytical, statistical, and other information and services provided by brokers are merely supplemental to the Advisor’s own efforts in the performance of its duties under the advisory agreement. |
After reviewing the materials and information provided at the meeting, as well as other information regularly provided at the Board’s quarterly meetings throughout the year regarding the quality of services provided by the Advisor, the performance of the Fund, expense information, brokerage commissions information, the adequacy and efficacy of the Advisor’s written policies and procedures, other regulatory compliance issues, trading information and related matters, and other factors that the Trustees deemed relevant, the Trustees, including the Independent Trustees, approved the continuation of the advisory agreement.
| BOARD APPROVAL OF INVESTMENT ADVISORY AGREEMENT |
(This Page Intentionally Left Blank.)
For information, questions, or assistance, please call
The Hennessy Funds
1-800-966-4354 or 1-415-899-1555
INVESTMENT ADVISOR
Hennessy Advisors, Inc.
7250 Redwood Boulevard, Suite 200
Novato, California 94945
ADMINISTRATOR,
TRANSFER AGENT,
DIVIDEND PAYING AGENT, &
SHAREHOLDER SERVICING AGENT
U.S. Bancorp Fund Services, LLC
d/b/a U.S. Bank Global Fund Services
P.O. Box 701
Milwaukee, Wisconsin 53201-0701
CUSTODIAN
U.S. Bank N.A.
Custody Operations
1555 North River Center Drive, Suite 302
Milwaukee, Wisconsin 53212
TRUSTEES
Neil J. Hennessy
Robert T. Doyle
J. Dennis DeSousa
Gerald P. Richardson
COUNSEL
Foley & Lardner LLP
777 East Wisconsin Avenue
Milwaukee, Wisconsin 53202-5306
INDEPENDENT REGISTERED
PUBLIC ACCOUNTING FIRM
Tait, Weller & Baker LLP
Two Liberty Place
50 South 16th Street, Suite 2900
Philadelphia, Pennsylvania 19102-2529
DISTRIBUTOR
Quasar Distributors, LLC
111 East Kilbourn Avenue, Suite 2200
Milwaukee, Wisconsin 53202
www.hennessyfunds.com | 1-800-966-4354
This report has been prepared for shareholders and may be distributed to
others only if preceded or accompanied by a current prospectus.
SEMI-ANNUAL REPORT
APRIL 30, 2021
HENNESSY SMALL CAP FINANCIAL FUND
Investor Class HSFNX
Institutional Class HISFX
www.hennessyfunds.com | 1-800-966-4354
(This Page Intentionally Left Blank.)
Contents
| Letter to Shareholders | 2 |
| Performance Overview | 4 |
| Financial Statements | |
| Schedule of Investments | 5 |
| Statement of Assets and Liabilities | 8 |
| Statement of Operations | 9 |
| Statements of Changes in Net Assets | 11 |
| Financial Highlights | 12 |
| Notes to the Financial Statements | 16 |
| Expense Example | 24 |
| Proxy Voting Policy and Proxy Voting Records | 26 |
| Availability of Quarterly Portfolio Schedule | 26 |
| Federal Tax Distribution Information | 26 |
| Important Notice Regarding Delivery of Shareholder Documents | 26 |
| Electronic Delivery | 26 |
| Board Approval of Investment Advisory Agreement | 27 |
| HENNESSY FUNDS | 1-800-966-4354 | |
May 2021
Dear Hennessy Funds Shareholder:
I can hardly believe that we have been navigating through one of the worst pandemics in modern history for more than a year. From the start, our thoughts have been with those affected by COVID-19 and with our frontline healthcare and essential workers. We are encouraged by the rapid rollout of vaccines and the continued reopening of the economy, and we hope this signals a turning point.
This is the first time in over 20 years in this business that I have witnessed volatility as extreme as the volatility that has rocked the financial markets and the economy over the past year. Both the pace of change and the magnitude of change have been staggering. As I reflect on this, I am reminded of a scientific concept called “punctuated equilibrium.” Biologist Stephen Jay Gould revolutionized evolutionary thinking with this theory, which challenged the prevailing belief that biological change happens slowly, consistently, and methodically over time. His theory instead proposed that change happens abruptly and dramatically and that new species pop up and others vanish rapidly, sometimes caused by catastrophic events. In between these explosive periods are much longer intervals of relative stability.
The dramatic market downdraft brought on by the pandemic, followed by the equally dramatic recovery, have been jarring. We witnessed an explosion of IPOs, a plethora of bankruptcies, and a dramatic change in market leadership. Yet unlike in the biological world, we are able to respond to stock market crises and try to dampen their negative impact. There have been numerous and unprecedented fiscal and monetary responses from the Federal Reserve and the U.S. government, and in many ways these measures may have spurred the economic recovery.
For the first six months of our fiscal year through April 30, 2021, the market appeared to be on a relentless march higher, with the S&P 500® Index rising 28.85% on a total return basis, setting new all-time highs 35 times in 124 trading days and closing at its then-highest level ever on April 29, 2021. We saw a dramatic shift back toward value investing, and many of the sectors and individual stocks that had underperformed for most of last year soared. Value outperformed growth, small-caps beat mid-caps, and mid-caps beat large-caps. The Energy and Financials sectors skyrocketed, as evidenced by the S&P 500® Energy Index’s total return of 75.94% and the Russell 1000® Index Financials’ total return of 52.00% during the six-month period. As we begin to move beyond the chaos caused by the pandemic, solid market fundamentals are reappearing, which we believe underscores the health and strength of our economy.
We are pleased with the performance of our mutual funds during the first half of our fiscal year. On an absolute basis, each of our 16 Funds achieved positive performance, and 11 of our 16 funds outperformed their primary benchmark. Ten of our 11 domestic equity-only Funds outperformed the S&P 500® Index, and three of our sector Funds posted total returns of over 50%, due primarily to their focus on the Energy and Financials sectors. We believe this was a favorable period for both our style of high-conviction investing as well as the areas and sectors of the market in which our Funds focus. While performance may wax and wane over a complete market cycle, we remain committed to managing our portfolios for long-term performance, ever mindful of downside risk.
Circling back to Gould’s theory of punctuated equilibrium, we are left with the question, “Where do we go from here?” Are we entering a more stable period in the economy and the market, similar to the periods of relative stasis in the geological record? We are optimistic that this may in fact be the case and that the markets will return to a less volatile part of the cycle. But, with history as our guide, we know that even the greatest bull markets have experienced corrections along the way. While certain individual stock or sector valuations might look stretched, we believe the market as a whole has more room to run. Strong GDP growth and increasing earnings expectations for this year, a potentially lower-for-longer interest rate environment, accommodative fiscal and monetary policies, a healthy and robust financial system, low unemployment and solid wage growth, and a measured reopening of certain parts of the economy all support the market moving higher from here.
We remain committed to our shareholders as we thoughtfully navigate these unprecedented times. We know that you have a multitude of investment options to choose from, and we are grateful for the trust you put in us and your continued interest and investment in our family of Funds. Should you have any questions or would like to speak with us, please don’t hesitate to call us directly at (800) 966-4354.
Best regards,
| |
| |
| |
| |
|
| Ryan C. Kelley |
| Chief Investment Officer |
Past performance does not guarantee future results. To obtain current standardized performance for the Hennessy Funds, visit https://www.hennessyfunds.com/funds/price-performance.
Mutual fund investing involves risk. Principal loss is possible.
Opinions expressed are those of Ryan C. Kelley and are subject to change, are not guaranteed, and should not be considered investment advice.
The S&P 500® Index is a capitalization-weighted index that is designed to represent the broad domestic economy through changes in aggregate market value of 500 stocks across all major industries. The S&P 500® Energy Index comprises those companies included in the S&P 500® Index that are classified in the Energy sector. The Russell 1000® Index Financials is a subset of the Russell 1000® Index that measures the performance of securities classified in the Financials sector of the large-capitalization U.S. equity market. The indices are used herein for comparative purposes in accordance with SEC regulations. One cannot invest directly in an index. All returns are shown on a total return basis.
| HENNESSY FUNDS | 1-800-966-4354 | |
Performance Overview (Unaudited)
AVERAGE ANNUAL TOTAL RETURN FOR PERIODS ENDED APRIL 30, 2021
| | Six | One | Five | Ten |
| | Months(1) | Year
| Years
| Years
|
| Hennessy Small Cap Financial Fund – | | | | |
| Investor Class (HSFNX) | 75.43% | 101.52% | 13.41% | 10.66% |
| Hennessy Small Cap Financial Fund – | | | | |
| Institutional Class (HISFX) | 75.79% | 102.32% | 13.83% | 11.03% |
Russell 2000® Index Financials | 50.99% | 68.41% | 12.55% | 11.42% |
Russell 2000® Index | 48.06% | 74.91% | 16.48% | 11.63% |
Expense ratios: 1.66% (Investor Class); 1.30% (Institutional Class)
(1) | Periods of less than one year are not annualized. |
_______________
Performance data quoted represents past performance; past performance does not guarantee future results. The investment return and principal value of an investment will fluctuate so that an investor’s shares, when redeemed, may be worth more or less than their original cost. The performance table does not reflect the deduction of taxes that a shareholder would pay on Fund distributions or the redemption of Fund shares. Current performance of the Fund may be lower or higher than the performance quoted. Performance data current to the most recent month end may be obtained by visiting www.hennessyfunds.com. Performance for periods including or prior to October 26, 2012, is that of the FBR Small Cap Financial Fund.
The Russell 2000® Index Financials is a subset of the Russell 2000® Index that measures the performance of the securities classified in the financials sector of the small-capitalization U.S. equity market. The Russell 2000® Index comprises the smallest 2,000 companies in the Russell 3000® Index based on market capitalization, representing approximately 8% of the Russell 3000® Index in terms of total market capitalization. One cannot invest directly in an index. These indices are used herein for comparative purposes in accordance with Securities and Exchange Commission regulations.
Frank Russell Company (“Russell”) is the source and owner of the trademarks, service marks, and copyrights related to the Russell Indexes. Russell® is a trademark of Frank Russell Company. Neither Russell nor its licensors accept any liability for any errors or omissions in the Russell Indexes or Russell ratings or underlying data and no party may rely on any Russell Indexes or Russell ratings or underlying data contained in this communication. No further distribution of Russell data is permitted without Russell’s express written consent. Russell does not promote, sponsor, or endorse the content of this communication.
The expense ratios presented are from the most recent prospectus. The expense ratios for the current reporting period are available in the Financial Highlights section of this report.
| PERFORMANCE OVERVIEW/SCHEDULE OF INVESTMENTS |
Financial Statements
Schedule of Investments as of April 30, 2021 (Unaudited) |
HENNESSY SMALL CAP FINANCIAL FUND
(% of Net Assets)
| TOP TEN HOLDINGS (EXCLUDING MONEY MARKET FUNDS) | % NET ASSETS |
| Alliance Data Systems Corp. | 4.78% |
| HomeTrust Bancshares, Inc. | 4.57% |
| First BanCorp. | 4.55% |
| CIT Group, Inc. | 4.48% |
| Hingham Institution for Savings | 4.41% |
| Lakeland Bancorp, Inc. | 4.33% |
| Hancock Whitney Corp. | 4.19% |
| Meridian Bancorp, Inc. | 4.00% |
| Texas Capital Bancshares, Inc. | 3.98% |
| Berkshire Hills Bancorp, Inc. | 3.94% |
Note: For presentation purposes, the Fund has grouped some of the industry categories. For purposes of categorizing securities for compliance with Section 8(b)(1) of the Investment Company Act of 1940, as amended, the Fund uses more specific industry classifications.
The Global Industry Classification Standard (GICS®) was developed by and is the exclusive property and a service mark of MSCI, Inc. and Standard & Poor’s Financial Services LLC. It has been licensed for use by the Hennessy Funds.
| HENNESSY FUNDS | 1-800-966-4354 | |
| COMMON STOCKS – 99.09% | | Number | | | | | | % of | |
| | | of Shares | | | Value | | | Net Assets | |
| Financials – 94.31% | | | | | | | | | |
| Associated Banc-Corp. | | | 155,000 | | | $ | 3,392,950 | | | | 2.46 | % |
| BankUnited, Inc. | | | 70,000 | | | | 3,262,700 | | | | 2.36 | % |
| Banner Corp. | | | 82,000 | | | | 4,660,880 | | | | 3.38 | % |
| Berkshire Hills Bancorp, Inc. | | | 245,000 | | | | 5,436,550 | | | | 3.94 | % |
| Brookline Bancorp, Inc. | | | 100,000 | | | | 1,610,000 | | | | 1.17 | % |
| Cadence BanCorp | | | 235,000 | | | | 5,228,750 | | | | 3.79 | % |
| CIT Group, Inc. | | | 116,000 | | | | 6,181,640 | | | | 4.48 | % |
| ConnectOne Bancorp, Inc. | | | 175,000 | | | | 4,751,250 | | | | 3.44 | % |
| First BanCorp. (a) | | | 500,000 | | | | 6,285,000 | | | | 4.55 | % |
| First Midwest Bancorp, Inc. | | | 255,000 | | | | 5,347,350 | | | | 3.87 | % |
| Flushing Financial Corp. | | | 10,000 | | | | 232,700 | | | | 0.17 | % |
| Hancock Whitney Corp. | | | 125,000 | | | | 5,780,000 | | | | 4.19 | % |
| HarborOne Bancorp, Inc. | | | 115,000 | | | | 1,645,650 | | | | 1.19 | % |
| Hingham Institution for Savings | | | 20,000 | | | | 6,082,800 | | | | 4.41 | % |
| HomeTrust Bancshares, Inc. | | | 230,000 | | | | 6,302,000 | | | | 4.57 | % |
| Independent Bank Corp. | | | 62,500 | | | | 5,118,750 | | | | 3.71 | % |
| Investors Bancorp, Inc. | | | 335,000 | | | | 4,904,400 | | | | 3.55 | % |
| Kearny Financial Corp. of Maryland | | | 180,000 | | | | 2,300,400 | | | | 1.67 | % |
| Lakeland Bancorp, Inc. | | | 330,000 | | | | 5,982,900 | | | | 4.33 | % |
| Meridian Bancorp, Inc. | | | 250,000 | | | | 5,527,500 | | | | 4.00 | % |
| New York Community Bancorp, Inc. | | | 370,000 | | | | 4,425,200 | | | | 3.21 | % |
| Pacific Premier Bancorp, Inc. | | | 80,000 | | | | 3,522,400 | | | | 2.55 | % |
| PacWest Bancorp | | | 112,500 | | | | 4,883,625 | | | | 3.54 | % |
| Shore Bancshares, Inc. | | | 70,000 | | | | 1,178,800 | | | | 0.85 | % |
| Sterling Bancorp | | | 125,000 | | | | 3,141,250 | | | | 2.28 | % |
| Synovus Financial Corp. | | | 115,000 | | | | 5,388,900 | | | | 3.90 | % |
| Texas Capital Bancshares, Inc. (b) | | | 80,000 | | | | 5,490,400 | | | | 3.98 | % |
| Webster Financial Corp. | | | 40,000 | | | | 2,116,400 | | | | 1.53 | % |
| Wintrust Financial Corp. | | | 70,000 | | | | 5,397,000 | | | | 3.91 | % |
| WSFS Financial Corp. | | | 90,000 | | | | 4,598,100 | | | | 3.33 | % |
| | | | | | | | 130,176,245 | | | | 94.31 | % |
| | | | | | | | | | | | | |
| Information Technology – 4.78% | | | | | | | | | | | | |
| Alliance Data Systems Corp. | | | 56,000 | | | | 6,599,600 | | | | 4.78 | % |
| | | | | | | | | | | | | |
| Total Common Stocks | | | | | | | | | | | | |
| (Cost $85,004,255) | | | | | | | 136,775,845 | | | | 99.09 | % |
The accompanying notes are an integral part of these financial statements.
| SHORT-TERM INVESTMENTS – 0.85% | | Number | | | | | | % of | |
| | | of Shares | | | Value | | | Net Assets | |
| Money Market Funds – 0.85% | | | | | | | | | |
| First American Government Obligations Fund, | | | | | | | | | |
| Institutional Class, 0.03% (c) | | | 1,173,385 | | | $ | 1,173,385 | | | | 0.85 | % |
| | | | | | | | | | | | | |
| Total Short-Term Investments | | | | | | | | | | | | |
| (Cost $1,173,385) | | | | | | | 1,173,385 | | | | 0.85 | % |
| | | | | | | | | | | | | |
| Total Investments | | | | | | | | | | | | |
| (Cost $86,177,640) – 99.94% | | | | | | | 137,949,230 | | | | 99.94 | % |
| Other Assets in Excess of Liabilities – 0.06% | | | | | | | 88,429 | | | | 0.06 | % |
| | | | | | | | | | | | | |
TOTAL NET ASSETS – 100.00% | | | | | | $ | 138,037,659 | | | | 100.00 | % |
Percentages are stated as a percent of net assets.
| (a) | U.S.-traded security of a foreign corporation. |
| (b) | Non-income-producing security. |
| (c) | The rate listed is the fund’s seven-day yield as of April 30, 2021. |
Summary of Fair Value Exposure as of April 30, 2021
The following is a summary of the inputs used to value the Fund’s net assets as of April 30, 2021 (see Note 3 in the accompanying Notes to the Financial Statements):
| Common Stocks | | Level 1 | | | Level 2 | | | Level 3 | | | Total | |
| Financials | | $ | 130,176,245 | | | $ | — | | | $ | — | | | $ | 130,176,245 | |
| Information Technology | | | 6,599,600 | | | | — | | | | — | | | | 6,599,600 | |
| Total Common Stocks | | $ | 136,775,845 | | | $ | — | | | $ | — | | | $ | 136,775,845 | |
| Short-Term Investments | | | | | | | | | | | | | | | | |
| Money Market Funds | | $ | 1,173,385 | | | $ | — | | | $ | — | | | $ | 1,173,385 | |
| Total Short-Term Investments | | $ | 1,173,385 | | | $ | — | | | $ | — | | | $ | 1,173,385 | |
| Total Investments | | $ | 137,949,230 | | | $ | — | | | $ | — | | | $ | 137,949,230 | |
The accompanying notes are an integral part of these financial statements.
| HENNESSY FUNDS | 1-800-966-4354 | |
Financial Statements
Statement of Assets and Liabilities as of April 30, 2021 (Unaudited) |
| ASSETS: | | | |
| Investments in securities, at value (cost $86,177,640) | | $ | 137,949,230 | |
| Dividends and interest receivable | | | 8,807 | |
| Receivable for fund shares sold | | | 343,998 | |
| Prepaid expenses and other assets | | | 20,459 | |
| Total assets | | | 138,322,494 | |
| | | | | |
| LIABILITIES: | | | | |
| Payable for fund shares redeemed | | | 75,909 | |
| Payable to advisor | | | 98,963 | |
| Payable to sub-transfer agents | | | 34,186 | |
| Payable to administrator | | | 25,791 | |
| Payable to auditor | | | 11,227 | |
| Accrued distribution fees | | | 19,708 | |
| Accrued service fees | | | 9,191 | |
| Accrued trustees fees | | | 4,892 | |
| Accrued expenses and other payables | | | 4,968 | |
| Total liabilities | | | 284,835 | |
| NET ASSETS | | $ | 138,037,659 | |
| | | | | |
| NET ASSETS CONSISTS OF: | | | | |
| Capital stock | | $ | 92,059,306 | |
| Total distributable earnings | | | 45,978,353 | |
| Total net assets | | $ | 138,037,659 | |
| | | | | |
| NET ASSETS: | | | | |
| Investor Class | | | | |
| Shares authorized (no par value) | | Unlimited | |
| Net assets applicable to outstanding shares | | $ | 115,597,051 | |
| Shares issued and outstanding | | | 3,808,681 | |
| Net asset value, offering price, and redemption price per share | | $ | 30.35 | |
| | | | | |
| Institutional Class | | | | |
| Shares authorized (no par value) | | Unlimited | |
| Net assets applicable to outstanding shares | | $ | 22,440,608 | |
| Shares issued and outstanding | | | 1,257,191 | |
| Net asset value, offering price, and redemption price per share | | $ | 17.85 | |
The accompanying notes are an integral part of these financial statements.
| STATEMENT OF ASSETS AND LIABILITIES/STATEMENT OF OPERATIONS |
Financial Statements
Statement of Operations for the six months ended April 30, 2021 (Unaudited) |
| INVESTMENT INCOME: | | | |
Dividend income(1) | | $ | 1,176,060 | |
| Interest income | | | 307 | |
| Total investment income | | | 1,176,367 | |
| | | | | |
| EXPENSES: | | | | |
| Investment advisory fees (See Note 5) | | | 458,414 | |
| Sub-transfer agent expenses – Investor Class (See Note 5) | | | 75,684 | |
| Sub-transfer agent expenses – Institutional Class (See Note 5) | | | 3,854 | |
| Distribution fees – Investor Class (See Note 5) | | | 63,793 | |
| Administration, accounting, custody, and transfer agent fees (See Note 5) | | | 62,038 | |
| Service fees – Investor Class (See Note 5) | | | 42,529 | |
| Federal and state registration fees | | | 16,569 | |
| Compliance expense (See Note 5) | | | 13,844 | |
| Audit fees | | | 11,227 | |
| Trustees’ fees and expenses | | | 9,412 | |
| Reports to shareholders | | | 6,903 | |
| Legal fees | | | 548 | |
| Interest expense (See Note 7) | | | 208 | |
| Other expenses | | | 7,142 | |
| Total expenses | | | 772,165 | |
| NET INVESTMENT INCOME | | $ | 404,202 | |
| | | | | |
| REALIZED AND UNREALIZED GAINS (LOSSES): | | | | |
| Net realized gain on investments | | $ | 3,319,553 | |
| Net change in unrealized appreciation/depreciation on investments | | | 47,464,837 | |
| Net gain on investments | | | 50,784,390 | |
| NET INCREASE IN NET ASSETS RESULTING FROM OPERATIONS | | $ | 51,188,592 | |
(1) | Net of foreign taxes withheld of $5,050. |
The accompanying notes are an integral part of these financial statements.
| HENNESSY FUNDS | 1-800-966-4354 | |
(This Page Intentionally Left Blank.)
| STATEMENTS OF CHANGES IN NET ASSETS |
Financial Statements
| Statements of Changes in Net Assets |
| | | Six Months Ended | | | | |
| | | April 30, 2021 | | | Year Ended | |
| | | (Unaudited) | | | October 31, 2020 | |
| OPERATIONS: | | | | | | |
| Net investment income | | $ | 404,202 | | | $ | 774,849 | |
| Net realized gain (loss) on investments | | | 3,319,553 | | | | (8,317,125 | ) |
| Net change in unrealized | | | | | | | | |
| appreciation/depreciation on investments | | | 47,464,837 | | | | (9,544,740 | ) |
| Net increase (decrease) in net | | | | | | | | |
| assets resulting from operations | | | 51,188,592 | | | | (17,087,016 | ) |
| | | | | | | | | |
| DISTRIBUTIONS TO SHAREHOLDERS: | | | | | | | | |
| Distributable earnings – Investor Class | | | (640,077 | ) | | | (3,014,018 | ) |
| Distributable earnings – Institutional Class | | | (266,480 | ) | | | (963,722 | ) |
| Total distributions | | | (906,557 | ) | | | (3,977,740 | ) |
| | | | | | | | | |
| CAPITAL SHARE TRANSACTIONS: | | | | | | | | |
| Proceeds from shares subscribed – Investor Class | | | 32,825,478 | | | | 1,461,277 | |
| Proceeds from shares subscribed – Institutional Class | | | 8,597,544 | | | | 4,656,510 | |
| Dividends reinvested – Investor Class | | | 621,958 | | | | 2,952,871 | |
| Dividends reinvested – Institutional Class | | | 237,659 | | | | 935,074 | |
| Cost of shares redeemed – Investor Class | | | (14,647,404 | ) | | | (21,427,965 | ) |
| Cost of shares redeemed – Institutional Class | | | (5,449,480 | ) | | | (12,043,139 | ) |
| Net increase (decrease) in net assets derived | | | | | | | | |
| from capital share transactions | | | 22,185,755 | | | | (23,465,372 | ) |
| TOTAL INCREASE (DECREASE) IN NET ASSETS | | | 72,467,790 | | | | (44,530,128 | ) |
| | | | | | | | | |
| NET ASSETS: | | | | | | | | |
| Beginning of period | | | 65,569,869 | | | | 110,099,997 | |
| End of period | | $ | 138,037,659 | | | $ | 65,569,869 | |
| | | | | | | | | |
| CHANGES IN SHARES OUTSTANDING: | | | | | | | | |
| Shares sold – Investor Class | | | 1,197,879 | | | | 90,621 | |
| Shares sold – Institutional Class | | | 561,491 | | | | 483,086 | |
| Shares issued to holders as reinvestment | | | | | | | | |
| of dividends – Investor Class | | | 28,361 | | | | 136,924 | |
| Shares issued to holders as reinvestment | | | | | | | | |
| of dividends – Institutional Class | | | 18,452 | | | | 72,426 | |
| Shares redeemed – Investor Class | | | (565,158 | ) | | | (1,216,466 | ) |
| Shares redeemed – Institutional Class | | | (346,369 | ) | | | (1,136,528 | ) |
| Net increase (decrease) in shares outstanding | | | 894,656 | | | | (1,569,937 | ) |
The accompanying notes are an integral part of these financial statements.
| HENNESSY FUNDS | 1-800-966-4354 | |
Financial Statements
For an Investor Class share outstanding throughout each period
| | | Six Months Ended | |
| | | April 30, 2021 | |
| | | (Unaudited) | |
| PER SHARE DATA: | | | |
| Net asset value, beginning of period | | $ | 17.46 | |
| | | | | |
| Income from investment operations: | | | | |
| Net investment income (loss) | | | 0.09 | (1) |
| Net realized and unrealized gains (losses) on investments | | | 13.00 | |
| Total from investment operations | | | 13.09 | |
| | | | | |
| Less distributions: | | | | |
| Dividends from net investment income | | | (0.20 | ) |
| Dividends from net realized gains | | | — | |
| Total distributions | | | (0.20 | ) |
| Net asset value, end of period | | $ | 30.35 | |
| | | | | |
| TOTAL RETURN | | | 75.43 | %(3) |
| | | | | |
| SUPPLEMENTAL DATA AND RATIOS: | | | | |
| Net assets, end of period (millions) | | $ | 115.60 | |
| Ratio of expenses to average net assets | | | 1.58 | %(4) |
| Ratio of net investment income (loss) to average net assets | | | 0.73 | %(4) |
Portfolio turnover rate(5) | | | 15 | %(3) |
(1) | Calculated using the average shares outstanding method. |
(2) | Amount is between $(0.005) and $0.005. |
(3) | Not annualized. |
(4) | Annualized. |
(5) | Calculated on the basis of the Fund as a whole. |
The accompanying notes are an integral part of these financial statements.
| FINANCIAL HIGHLIGHTS — INVESTOR CLASS |
| Year Ended October 31, | |
| 2020 | | | 2019 | | | 2018 | | | 2017 | | | 2016 | |
| | | | | | | | | | | | | | |
| $ | 21.60 | | | $ | 21.96 | | | $ | 26.02 | | | $ | 23.48 | | | $ | 23.81 | |
| | | | | | | | | | | | | | | | | | | |
| | | | | | | | | | | | | | | | | | | |
| | 0.16 | (1) | | | 0.10 | (1) | | | 0.03 | | | | (0.04 | ) | | | 0.10 | |
| | (3.55 | ) | | | 0.93 | | | | (2.12 | ) | | | 5.83 | | | | 1.20 | |
| | (3.39 | ) | | | 1.03 | | | | (2.09 | ) | | | 5.79 | | | | 1.30 | |
| | | | | | | | | | | | | | | | | | | |
| | | | | | | | | | | | | | | | | | | |
| | (0.09 | ) | | | (0.07 | ) | | | 0.00 | (2) | | | (0.06 | ) | | | (0.03 | ) |
| | (0.66 | ) | | | (1.32 | ) | | | (1.97 | ) | | | (3.19 | ) | | | (1.60 | ) |
| | (0.75 | ) | | | (1.39 | ) | | | (1.97 | ) | | | (3.25 | ) | | | (1.63 | ) |
| $ | 17.46 | | | $ | 21.60 | | | $ | 21.96 | | | $ | 26.02 | | | $ | 23.48 | |
| | | | | | | | | | | | | | | | | | | |
| | -16.37 | % | | | 5.27 | % | | | -8.79 | % | | | 25.03 | % | | | 5.80 | % |
| | | | | | | | | | | | | | | | | | | |
| | | | | | | | | | | | | | | | | | | |
| $ | 54.96 | | | $ | 89.36 | | | $ | 122.00 | | | $ | 174.01 | | | $ | 132.09 | |
| | 1.65 | % | | | 1.58 | % | | | 1.54 | % | | | 1.52 | % | | | 1.54 | % |
| | 0.96 | % | | | 0.47 | % | | | 0.11 | % | | | (0.06 | )% | | | 0.38 | % |
| | 75 | % | | | 46 | % | | | 28 | % | | | 46 | % | | | 46 | % |
The accompanying notes are an integral part of these financial statements.
| HENNESSY FUNDS | 1-800-966-4354 | |
Financial Statements
For an Institutional Class share outstanding throughout each period
| | | Six Months Ended | |
| | | April 30, 2021 | |
| | | (Unaudited) | |
| PER SHARE DATA: | | | |
| Net asset value, beginning of period | | $ | 10.37 | |
| | | | | |
| Income from investment operations: | | | | |
| Net investment income | | | 0.08 | (1) |
| Net realized and unrealized gains (losses) on investments | | | 7.67 | |
| Total from investment operations | | | 7.75 | |
| | | | | |
| Less distributions: | | | | |
| Dividends from net investment income | | | (0.27 | ) |
| Dividends from net realized gains | | | — | |
| Total distributions | | | (0.27 | ) |
| Net asset value, end of period | | $ | 17.85 | |
| | | | | |
| TOTAL RETURN | | | 75.79 | %(2) |
| | | | | |
| SUPPLEMENTAL DATA AND RATIOS: | | | | |
| Net assets, end of period (millions) | | $ | 22.44 | |
| Ratio of expenses to average net assets | | | 1.19 | %(3) |
| Ratio of net investment income to average net assets | | | 1.10 | %(3) |
Portfolio turnover rate(4) | | | 15 | %(2) |
(1) | Calculated using the average shares outstanding method. |
(2) | Not annualized. |
(3) | Annualized. |
(4) | Calculated on the basis of the Fund as a whole. |
The accompanying notes are an integral part of these financial statements.
| FINANCIAL HIGHLIGHTS — INSTITUTIONAL CLASS |
| Year Ended October 31, | |
| 2020 | | | 2019 | | | 2018 | | | 2017 | | | 2016 | |
| | | | | | | | | | | | | | |
| $ | 12.92 | | | $ | 13.28 | | | $ | 15.69 | | | $ | 14.23 | | | $ | 14.39 | |
| | | | | | | | | | | | | | | | | | | |
| | | | | | | | | | | | | | | | | | | |
| | 0.13 | (1) | | | 0.10 | (1) | | | 0.07 | | | | 0.02 | | | | 0.09 | |
| | (2.10 | ) | | | 0.54 | | | | (1.27 | ) | | | 3.56 | | | | 0.75 | |
| | (1.97 | ) | | | 0.64 | | | | (1.20 | ) | | | 3.58 | | | | 0.84 | |
| | | | | | | | | | | | | | | | | | | |
| | | | | | | | | | | | | | | | | | | |
| | (0.19 | ) | | | (0.18 | ) | | | (0.02 | ) | | | (0.17 | ) | | | (0.04 | ) |
| | (0.39 | ) | | | (0.82 | ) | | | (1.19 | ) | | | (1.95 | ) | | | (0.96 | ) |
| | (0.58 | ) | | | (1.00 | ) | | | (1.21 | ) | | | (2.12 | ) | | | (1.00 | ) |
| $ | 10.37 | | | $ | 12.92 | | | $ | 13.28 | | | $ | 15.69 | | | $ | 14.23 | |
| | | | | | | | | | | | | | | | | | | |
| | -16.05 | % | | | 5.57 | % | | | -8.42 | % | | | 25.56 | % | | | 6.22 | % |
| | | | | | | | | | | | | | | | | | | |
| | | | | | | | | | | | | | | | | | | |
| $ | 10.61 | | | $ | 20.74 | | | $ | 35.66 | | | $ | 37.92 | | | $ | 21.27 | |
| | 1.29 | % | | | 1.23 | % | | | 1.15 | % | | | 1.15 | % | | | 1.17 | % |
| | 1.27 | % | | | 0.84 | % | | | 0.51 | % | | | 0.30 | % | | | 0.72 | % |
| | 75 | % | | | 46 | % | | | 28 | % | | | 46 | % | | | 46 | % |
The accompanying notes are an integral part of these financial statements.
| HENNESSY FUNDS | 1-800-966-4354 | |
Financial Statements
Notes to the Financial Statements April 30, 2021 (Unaudited) |
1). ORGANIZATION
The Hennessy Small Cap Financial Fund (the “Fund”) is a series of Hennessy Funds Trust (the “Trust”), which was organized as a Delaware statutory trust on September 17, 1992. The Fund is an open-end management investment company registered under the Investment Company Act of 1940, as amended. The investment objective of the Fund is capital appreciation. The Fund is a non-diversified fund.
The Fund offers Investor Class and Institutional Class shares. Each class of shares differs principally in its respective 12b-1 distribution and service, shareholder servicing, and sub-transfer agent expenses. There are no sales charges. Each class has identical rights to earnings, assets, and voting privileges, except for class-specific expenses and exclusive rights to vote on matters affecting only one class.
As an investment company, the Fund follows the investment company accounting and reporting guidance of the Financial Accounting Standards Board (“FASB”) Accounting Standard Codification Topic 946 “Financial Services—Investment Companies.”
2). SIGNIFICANT ACCOUNTING POLICIES
The following is a summary of significant accounting policies consistently followed by the Fund in the preparation of the financial statements. These policies conform to U.S. generally accepted accounting principles (“GAAP”).
| a). | Securities Valuation – All investments in securities are valued in accordance with the Fund’s valuation policies and procedures, as described in Note 3. |
| | |
| b). | Federal Income Taxes – The Fund has elected to be taxed as a regulated investment company and intends to distribute substantially all of its taxable income to its shareholders and otherwise comply with the provisions of the Internal Revenue Code of 1986, as amended, applicable to regulated investment companies. As a result, the Fund has made no provision for federal income taxes or excise taxes. Net investment income/loss and realized gains/losses for federal income tax purposes may differ from those reported in the financial statements because of temporary book-basis and tax-basis differences. Temporary differences are primarily the result of the treatment of wash sales for tax reporting purposes. The Fund recognizes interest and penalties related to income tax benefits, if any, in the Statement of Operations as an income tax expense. Distributions from net realized gains for book purposes may include short-term capital gains, which are included as ordinary income to shareholders for tax purposes. The Fund may utilize equalization accounting for tax purposes and designate earnings and profits, including net realized gains distributed to shareholders on redemption of shares, as part of the dividends paid deduction for income tax purposes. |
| | |
| c). | Accounting for Uncertainty in Income Taxes – The Fund has accounting policies regarding recognition and measurement of tax positions taken or expected to be taken on a tax return. The tax returns of the Fund for the prior three fiscal years are open for examination. The Fund has reviewed all open tax years in major tax jurisdictions and concluded that there is no impact on the Fund’s net assets and no tax liability resulting from unrecognized tax benefits relating to uncertain income tax positions taken or expected to be taken on a tax return. The Fund’s major tax jurisdictions are U.S. federal and Delaware. |
| NOTES TO THE FINANCIAL STATEMENTS |
| d). | Income and Expenses – Dividend income is recognized on the ex-dividend date or as soon as information is available to the Fund. Interest income, which includes the amortization of premium and accretion of discount, is recognized on an accrual basis. Market discounts, original issue discounts, and market premiums on debt securities are accreted or amortized to interest income over the life of a security with a corresponding increase or decrease, as applicable, in the cost basis of such security using the yield-to-maturity method or, where applicable, the first call date of the security. Other non-cash dividends are recognized as investment income at the fair value of the property received. The Fund is charged for those expenses that are directly attributable to its portfolio, such as advisory, administration, and certain shareholder service fees. Income, expenses (other than expenses attributable to a specific class), and realized and unrealized gains/losses on investments are allocated to each class of shares based on such class’s net assets. |
| | |
| e). | Distributions to Shareholders – Dividends from net investment income for the Fund, if any, are declared and paid annually, usually in December. Distributions of net realized capital gains, if any, are declared and paid annually, usually in December. |
| | |
| f). | Security Transactions – Investment and shareholder transactions are recorded on the trade date. The Fund determines the realized gain/loss from an investment transaction by comparing the original cost of the security lot sold with the net sale proceeds. Discounts and premiums on securities purchased are accreted or amortized, respectively, over the life of each such security. |
| | |
| g). | Use of Estimates – Preparing financial statements in accordance with GAAP requires management to make estimates and assumptions that affect the reported amounts of assets and liabilities and disclosure of contingent assets and liabilities at the date of the financial statements, as well as the reported change in net assets during the reporting period. Actual results could differ from those estimates. |
| | |
| h). | Share Valuation – The net asset value (“NAV”) per share of the Fund is calculated by dividing (i) the total value of the securities held by the Fund, plus cash and other assets, minus all liabilities (including estimated accrued expenses) by (ii) the total number of Fund shares outstanding, rounded to the nearest $0.01. Fund shares are not priced on days the New York Stock Exchange is closed for trading. The offering and redemption price per share for the Fund is equal to the Fund’s NAV per share. |
| | |
| i). | New Accounting Pronouncements – In August 2018, the FASB issued Accounting Standards Update No. 2018-13 “Disclosure Framework—Changes to the Disclosure Requirements for Fair Value Measurement” (“ASU 2018-13”). ASU 2018-13 eliminates the requirement to disclose the amount of and reasons for transfers between Level 1 and Level 2 of the fair value hierarchy, the timing of transfers between levels of the fair value hierarchy, and the valuation processes for Level 3 fair value measurements. ASU 2018-13 does not eliminate the requirement to disclose the range and weighted average used to develop significant unobservable inputs for Level 3 fair value measurements or the requirement to disclose the changes in unrealized gains and losses for recurring Level 3 fair value measurements. ASU 2018-13 requires that information is provided about the measurement uncertainty of Level 3 fair value measurements as of the reporting date. The guidance is effective for fiscal years beginning after December 15, 2019, and interim periods within those fiscal years. Management evaluated the impact of this change in guidance and, due to the permissibility of early adoption, modified the Fund’s fair value disclosures beginning with its fiscal year 2019. |
| HENNESSY FUNDS | 1-800-966-4354 | |
3). SECURITIES VALUATION
The Fund follows its valuation policies and procedures in determining its net asset value and, in preparing these financial statements, the fair value accounting standards that establish an authoritative definition of fair value and set out a hierarchy for measuring fair value. These standards require additional disclosures about the various inputs and valuation techniques used to develop the measurements of fair value and a discussion of changes in valuation techniques and related inputs during the period. These inputs are summarized in the three broad levels listed below:
| | Level 1 – | Unadjusted, quoted prices in active markets for identical instruments that the Fund has the ability to access at the date of measurement. |
| | | |
| | Level 2 – | Other significant observable inputs (including, but not limited to, quoted prices in active markets for similar instruments, quoted prices in markets that are not active for identical or similar instruments, and model-derived valuations in which all significant inputs and significant value drivers are observable in active markets, such as interest rates, prepayment speeds, credit risk curves, default rates, and similar data). |
| | | |
| | Level 3 – | Significant unobservable inputs (including the Fund’s own assumptions about what market participants would use to price the asset or liability based on the best available information) when observable inputs are unavailable. |
The following is a description of the valuation techniques applied to the Fund’s major categories of assets and liabilities on a recurring basis:
| | Equity Securities – Equity securities, including common stocks, preferred stocks, foreign-issued common stocks, exchange-traded funds, closed-end mutual funds, partnerships, rights, and real estate investment trusts, that are traded on a securities exchange for which a last-quoted sales price is readily available generally are valued at the last sales price as reported by the primary exchange on which the securities are listed. Securities listed on The NASDAQ Stock Market (“NASDAQ”) generally are valued at the NASDAQ Official Closing Price, which may differ from the last sales price reported. Securities traded on a securities exchange for which a last-quoted sales price is not readily available generally are valued at the mean between the bid and ask prices. To the extent these securities are actively traded and valuation adjustments are not applied, they are classified in Level 1 of the fair value hierarchy. Securities traded on foreign exchanges generally are not valued at the same time the Fund calculates its NAV because most foreign markets close well before such time. The earlier close of most foreign markets gives rise to the possibility that significant events, including broad market moves, may have occurred in the interim. In certain circumstances, it may be determined that a foreign security needs to be fair valued because it appears that the value of the security might have been materially affected by events occurring after the close of the market in which the security is principally traded, but before the time the Fund calculates its NAV, such as by a development that affects an entire market or region (e.g., a weather-related event) or a potentially global development (e.g., a terrorist attack that may be expected to have an effect on investor expectations worldwide). |
| | |
| | Registered Investment Companies – Investments in open-end registered investment companies, commonly referred to as mutual funds, generally are priced at the ending NAV provided by the applicable mutual fund’s service agent and are classified in Level 1 of the fair value hierarchy. |
| NOTES TO THE FINANCIAL STATEMENTS |
| | Debt Securities – Debt securities, including corporate bonds, asset-backed securities, mortgage-backed securities, municipal bonds, U.S. Treasuries, and U.S. government agency issues, are generally valued at market on the basis of valuations furnished by an independent pricing service that utilizes both dealer-supplied valuations and formula-based techniques. The pricing service may consider recently executed transactions in securities of the issuer or comparable issuers, market price quotations (where observable), bond spreads, and fundamental data relating to the issuer. In addition, the model may incorporate observable market data, such as reported sales of similar securities, broker quotes, yields, bids, offers, and reference data. Certain securities are valued primarily using dealer quotations. These securities are generally classified in Level 2 of the fair value hierarchy. |
| | |
| | Short-Term Securities – Short-term equity investments, including money market funds, are valued in the manner specified above for equity securities. Short-term debt investments with an original term to maturity of 60 days or less are valued at amortized cost, which approximates fair market value. If the original term to maturity of a short-term debt investment exceeds 60 days, then the values as of the 61st day prior to maturity are amortized. Amortized cost is not used if its use would be inappropriate due to credit or other impairments of the issuer, in which case the security’s fair value would be determined as described below. Short-term securities are generally classified in Level 1 or Level 2 of the fair value hierarchy depending on the inputs used and market activity levels for specific securities. |
The Board of Trustees of the Fund (the “Board”) has adopted fair value pricing procedures that are followed when a price for a security is not readily available or if a significant event has occurred that indicates the closing price of a security no longer represents the true value of that security. Fair value pricing determinations are made in good faith in accordance with these procedures. There are numerous criteria considered in determining a fair value of a security, such as the trading volume of a security and markets, the values of other similar securities, and news events with direct bearing on a security or markets. Fair value pricing results in an estimated price for a security that reflects the amount the Fund might reasonably expect to receive in a current sale. Depending on the relative significance of the valuation inputs, these securities may be classified in either Level 2 or Level 3 of the fair value hierarchy.
The fair value of foreign securities may be determined with the assistance of a pricing service using correlations between the movement of prices of such securities and indices of domestic securities and other appropriate indicators, such as closing market prices of relevant American Depositary Receipts or futures contracts. Using fair value pricing means that the Fund’s NAV reflects the affected portfolio securities’ values as determined by the Board or its designee, pursuant to the fair value pricing procedures adopted by the Board, instead of being determined by the market. Using a fair value pricing methodology to price a foreign security may result in a value that is different from such foreign security’s most recent closing price and from the value used by other investment companies to calculate their NAVs. Such securities are generally classified in Level 2 of the fair value hierarchy. Because the Fund may invest in foreign securities, the value of the Fund’s portfolio securities may change on days when a shareholder is unable to purchase or redeem Fund shares.
The Board has delegated day-to-day valuation matters to the Valuation and Liquidity Committee comprising representatives from Hennessy Advisors, Inc., the Fund’s investment advisor (the “Advisor”). The function of the Valuation and Liquidity Committee, among other things, is to value securities where current and reliable market quotations are not readily available. All actions taken by the Valuation and Liquidity Committee are reviewed by the Board.
| HENNESSY FUNDS | 1-800-966-4354 | |
The Fund has performed an analysis of all existing investments to determine the significance and character of all inputs to their fair value determinations. Various inputs are used to determine the value of the Fund’s investments. The inputs or methodology used for valuing securities are not necessarily an indication of the risk associated with investing in those securities. Details related to the fair value hierarchy of the Fund’s securities as of April 30, 2021, are included in the Schedule of Investments.
4). INVESTMENT TRANSACTIONS
Purchases and sales of investment securities (excluding government and short-term investments) for the Fund during the six months ended April 30, 2021, were $36,111,682 and $15,012,417, respectively.
There were no purchases or sales/maturities of long-term U.S. government securities for the Fund during the six months ended April 30, 2021.
5). INVESTMENT ADVISORY FEE AND OTHER TRANSACTIONS WITH AFFILIATES
The Advisor provides the Fund with investment advisory services under an Investment Advisory Agreement. The Advisor furnishes all investment advice, office space, and facilities and most of the personnel needed by the Fund. As compensation for its services, the Advisor is entitled to a monthly fee from the Fund. The fee is based on the average daily net assets of the Fund at an annual rate of 0.90%. The net investment advisory fees expensed by the Fund during the six months ended April 30, 2021, are included in the Statement of Operations.
The Board has approved a Shareholder Servicing Agreement for Investor Class shares of the Fund, which compensates the Advisor for the non-investment advisory services it provides to the Fund. The Shareholder Servicing Agreement provides for a monthly fee paid to the Advisor at an annual rate of 0.10% of the average daily net assets of the Fund attributable to Investor Class shares. The shareholder service fees expensed by the Fund during the six months ended April 30, 2021, are included in the Statement of Operations.
The Fund has adopted a plan pursuant to Rule 12b-1 under the Investment Company Act of 1940, as amended, that authorizes payments in connection with the distribution of Fund shares at an annual rate of up to 0.25% of the Fund’s average daily net assets attributable to Investor Class shares. Even though the authorized rate is up to 0.25%, the Fund is currently only using up to 0.15% of its average daily net assets attributable to Investor Class shares for such purpose. Amounts paid under the plan may be spent on any activities or expenses primarily intended to result in the sale of shares, including, but not limited to, advertising, shareholder account servicing, printing and mailing of prospectuses to other than current shareholders, printing and mailing of sales literature, and compensation for sales and marketing activities or to financial institutions and others, such as dealers and distributors. The distribution fees expensed by the Fund during the six months ended April 30, 2021, are included in the Statement of Operations.
The Fund has entered into agreements with various brokers, dealers, and financial intermediaries in connection with the sale of Fund shares. The agreements provide for periodic payments of sub-transfer agent expenses by the Fund to the brokers, dealers, and financial intermediaries for providing certain shareholder maintenance services. These shareholder services include the pre-processing and quality control of new accounts, shareholder correspondence, answering customer inquiries regarding account status, and facilitating shareholder telephone transactions. The sub-transfer agent fees expensed by the Fund during the six months ended April 30, 2021, are included in the Statement of Operations.
| NOTES TO THE FINANCIAL STATEMENTS |
U.S. Bancorp Fund Services, LLC, d/b/a U.S. Bank Global Fund Services (“Fund Services”) provides the Fund with administrative, accounting, and transfer agent services. As administrator, Fund Services is responsible for activities such as (i) preparing various federal and state regulatory filings, reports, and returns for the Fund, (ii) preparing reports and materials to be supplied to the Board, (iii) monitoring the activities of the Fund’s custodian, transfer agent, and accountants, and (iv) coordinating the preparation and payment of the Fund’s expenses and reviewing the Fund’s expense accruals. U.S. Bank N.A., an affiliate of Fund Services, serves as the Fund’s custodian. The servicing agreements between the Trust, Fund Services, and U.S. Bank N.A. contain a fee schedule that is inclusive of administrative, accounting, custody, and transfer agent fees. The administrative, accounting, custody, and transfer agent fees expensed by the Fund during the six months ended April 30, 2021, are included in the Statement of Operations.
Quasar Distributors, LLC (“Quasar”), a wholly owned broker-dealer subsidiary of Foreside Financial Group, LLC, acts as the Fund’s principal underwriter in a continuous public offering of Fund shares.
The officers of the Fund are affiliated with the Advisor. With the exception of the Chief Compliance Officer and the Senior Compliance Officer, such officers receive no compensation from the Fund for serving in their respective roles. The Fund, along with the other funds in the Hennessy Funds family (collectively, the “Hennessy Funds”), makes reimbursement payments on an equal basis to the Advisor for a portion of the salary and benefits associated with the office of the Chief Compliance Officer and for all of the salary and benefits associated with the office of the Senior Compliance Officer. The compliance fees expensed by the Fund during the six months ended April 30, 2021, are included in the Statement of Operations.
6). GUARANTEES AND INDEMNIFICATIONS
Under the Hennessy Funds’ organizational documents, their officers and trustees are indemnified by the Hennessy Funds against certain liabilities arising out of the performance of their duties to the Hennessy Funds. Additionally, in the normal course of business, the Hennessy Funds enter into contracts with service providers that contain general indemnification clauses. The Fund’s maximum exposure under these arrangements is unknown as this would involve future claims that may be made against the Fund that have not yet occurred. Currently, the Fund expects the risk of loss to be remote.
7). LINE OF CREDIT
The Fund has an uncommitted line of credit with the other Hennessy Funds in the amount of the lesser of (i) $100,000,000 or (ii) 33.33% of each Hennessy Fund’s net assets, or 30% for the Hennessy Gas Utility Fund and 10% for the Hennessy Balanced Fund. The line of credit is intended to provide any necessary short-term financing in connection with shareholder redemptions, subject to certain restrictions. The credit facility is with the Hennessy Funds’ custodian bank, U.S. Bank N.A. Borrowings under this arrangement bear interest at the bank’s prime rate and are secured by all of the Fund’s assets (as to its own borrowings only). During the six months ended April 30, 2021, the Fund had an outstanding average daily balance and a weighted average interest rate of $12,746 and 3.25%, respectively. The interest expensed by the Fund during the six months ended April 30, 2021, is included in the Statement of Operations. The maximum amount outstanding for the Fund during the period was $316,000. As of April 30, 2021, the Fund did not have any borrowings outstanding under the line of credit.
| HENNESSY FUNDS | 1-800-966-4354 | |
8). FEDERAL TAX INFORMATION
As of October 31, 2020, the Fund’s most recent fiscal year end, the components of accumulated earnings (losses) for income tax purposes were as follows:
| | | Investments | |
| Cost of investments for tax purposes | | $ | 63,533,123 | |
| Gross tax unrealized appreciation | | $ | 11,645,918 | |
| Gross tax unrealized depreciation | | | (9,553,201 | ) |
| Net tax unrealized appreciation/(depreciation) | | $ | 2,092,717 | |
| Undistributed ordinary income | | $ | 242,896 | |
| Undistributed long-term capital gains | | | — | |
| Total distributable earnings | | $ | 242,896 | |
| Other accumulated gain/(loss) | | $ | (6,639,295 | ) |
| Total accumulated gain/(loss) | | $ | (4,303,682 | ) |
The difference between book-basis unrealized appreciation/depreciation and tax-basis unrealized appreciation/depreciation (as shown above) is attributable primarily to wash sales.
As of October 31, 2020, the Fund had $2,735,116 in unlimited long-term and $3,904,179 in unlimited short-term capital loss carryforwards.
Capital losses sustained in or after fiscal year 2012 can be carried forward indefinitely, but any such loss retains the character of the original loss and must be utilized prior to any loss incurred before fiscal year 2012. As a result of this ordering rule, capital loss carryforwards incurred prior to fiscal year 2012 may be more likely to expire unused. Capital losses sustained prior to fiscal year 2012 can be carried forward for eight years and can be carried forward as short-term capital losses regardless of the character of the original loss.
As of October 31, 2020, the Fund did not defer, on a tax basis, any late-year ordinary losses. Late-year ordinary losses are net ordinary losses incurred after December 31, 2019, but within the taxable year, that are deemed to arise on the first day of the Fund’s next taxable year.
During fiscal year 2021 (year to date) and fiscal year 2020, the tax character of distributions paid by the Fund was as follows:
| | | Six Months Ended | | | Year Ended | |
| | | April 30, 2021 | | | October 31, 2020 | |
Ordinary income(1) | | $ | 906,557 | | | $ | 698,496 | |
| Long-term capital gains | | | — | | | | 3,279,244 | |
| Total distributions | | $ | 906,557 | | | $ | 3,977,740 | |
(1) Ordinary income includes short-term capital gains.
9). LIBOR TRANSITION
The Fund invests in securities of financial institutions that may be involved in financings based on, among other floating rates, the London Interbank Offered Rate (“LIBOR”). LIBOR is the offered rate for short-term Eurodollar deposits between major international banks. On July 27, 2017, the UK Financial Conduct Authority, which regulates LIBOR, announced that it would no longer persuade or compel banks to submit rates for the calculation of LIBOR after 2021, meaning that LIBOR cannot continue on its current basis and will not be guaranteed after 2021. Regulators and industry working groups have suggested alternative reference rates, but global consensus is lacking, and the process for
| NOTES TO THE FINANCIAL STATEMENTS |
amending existing contracts or instruments to transition away from LIBOR remains unclear. The transition away from LIBOR may lead to increased volatility and illiquidity in markets tied to LIBOR, reduce the value of LIBOR-related instruments, and reduce the effectiveness of hedging strategies, which could adversely affect the Fund’s performance. Additionally, any alternative reference rate may be an ineffective substitute, resulting in prolonged adverse market conditions for the Fund’s investments.
10). EVENTS SUBSEQUENT TO PERIOD END
Management has evaluated the Fund’s related events and transactions that occurred subsequent to April 30, 2021, through the date of issuance of the Fund’s financial statements. Management has determined that there were no subsequent events requiring recognition or disclosure in the financial statements.
| HENNESSY FUNDS | 1-800-966-4354 | |
Expense Example (Unaudited)
April 30, 2021
As a shareholder of the Fund, you incur ongoing costs, including management fees, service fees, and other Fund expenses. This Example is intended to help you understand your ongoing costs (in dollars) of investing in the Fund and to compare these costs with the ongoing costs of investing in other mutual funds. The Example is based on an investment of $1,000 invested at the beginning of the period and held for the entire period from November 1, 2020, through April 30, 2021.
Actual Expenses
In the table below, the first line under each of the “Investor Class” and “Institutional Class” headings provides information about actual account values and actual expenses for each share class. You may use this information, together with the amount you invested, to estimate the expenses that you paid over the period. Simply divide your account value by $1,000 (for example, an $8,600 account value divided by $1,000 = 8.6), then multiply the result by the number in the first line under the heading entitled “Expenses Paid During Period” to estimate the expenses you paid on your account during this period. Although the Fund charges no sales loads or transaction fees, you will be assessed fees for outgoing wire transfers, returned checks, and stop payment orders at prevailing rates charged by U.S. Bank Global Fund Services, the Fund’s transfer agent. If you request that a redemption be made by wire transfer, the Fund’s transfer agent charges a $15 fee. IRAs are charged a $15 annual maintenance fee (up to $30 maximum per shareholder for shareholders with multiple IRAs). The examples below include, but are not limited to, management, shareholder servicing, accounting, custody, and transfer agent fees. However, the examples below do not include portfolio trading commissions and related expenses.
Hypothetical Example for Comparison Purposes
In the table below, the second line under each of the “Investor Class” and “Institutional Class” headings provides information about hypothetical account values and hypothetical expenses based on the Fund’s actual expense ratio for each share class and an assumed rate of return of 5% per year before expenses, which is not the Fund’s actual return for such share class. The hypothetical account values and expenses may not be used to estimate the actual ending account balance or expenses you paid for the period. You may use this information to compare the ongoing costs of investing in the Fund and other funds. To do so, compare these 5% hypothetical examples with the 5% hypothetical examples that appear in the shareholder reports of the other funds. Please note that the expenses shown in the table are meant to highlight your ongoing costs only. Therefore, the second lines under “Investor Class” and “Institutional Class” headings are useful in comparing ongoing costs only and will not help you determine the relative total costs of owning different funds.
| | Beginning | Ending | |
| | Account Value | Account Value | Expenses Paid |
| | November 1, 2020 | April 30, 2021
| During Period(1) |
| Investor Class | | | |
| Actual | $1,000.00 | $1,754.30 | $10.79 |
| Hypothetical (5% return before expenses) | $1,000.00 | $1,016.96 | $ 7.90 |
| | | | |
| Institutional Class | | | |
| Actual | $1,000.00 | $1,757.90 | $ 8.14 |
| Hypothetical (5% return before expenses) | $1,000.00 | $1,018.89 | $ 5.96 |
(1) | Expenses are equal to the Fund’s annualized expense ratio of 1.58% for Investor Class shares or 1.19% for Institutional Class shares, as applicable, multiplied by the average account value over the period, multiplied by 181/365 days (to reflect the half-year period). |
| HENNESSY FUNDS | 1-800-966-4354 | |
How to Obtain a Copy of the Fund’s Proxy
Voting Policy and Proxy Voting Records
A description of the policies and procedures the Fund uses to determine how to vote proxies relating to portfolio securities is available without charge (1) by calling 1-800-966-4354, (2) on the Hennessy Funds’ website at www.hennessyfunds.com/proxy-voting/voting-policy, or (3) on the U.S. Securities and Exchange Commission’s (the “SEC”) website at www.sec.gov. The Fund’s proxy voting record is available without charge on both the Hennessy Funds’ website at www.hennessyfunds.com/proxy-voting/voting-record and the SEC’s website at www.sec.gov no later than August 31 for the prior 12 months ending June 30.
Availability of Quarterly Portfolio Schedule
The Fund files a complete schedule of portfolio holdings with the SEC for the first and third quarters of each fiscal year as an exhibit to its reports on Form N-PORT. The Fund’s Form N-PORT reports are available on the SEC’s website at www.sec.gov or on request by calling 1-800-966-4354.
Federal Tax Distribution Information (Unaudited)
For fiscal year 2020, certain dividends paid by the Fund may be subject to a maximum tax rate of 23.8%, as provided for by the Jobs and Growth Tax Relief Reconciliation Act of 2003. The percentage of dividends declared from ordinary income designated as qualified dividend income was 100.00%.
For corporate shareholders, the percent of ordinary income distributions that qualified for the corporate dividends received deduction for fiscal year 2020 was 100.00%.
The percentage of taxable ordinary income distributions that were designated as short-term capital gain distributions under Section 871(k)(2)(C) of the Internal Revenue Code of 1986, as amended, for the Fund was 0.00%.
Important Notice Regarding Delivery
of Shareholder Documents
To help keep the Fund’s costs as low as possible, we generally deliver a single copy of notices, shareholder reports, proxy statements, and prospectuses to shareholders who share an address and have the same last name. This process does not apply to account statements. You may request an individual copy of a shareholder document at any time. If you would like to receive separate mailings of shareholder documents, please call U.S. Bank Global Fund Services at 1-800-261-6950 or 1-414-765-4124, and individual delivery will begin within 30 days of your request. If your account is held through a financial institution or other intermediary, please contact such intermediary directly to request individual delivery.
Electronic Delivery
As permitted by SEC regulations, the Fund’s shareholder reports are made available on a website, and unless you sign up for eDelivery or elect to receive paper copies as detailed below, you will be notified by mail each time a report is posted and provided with a website link to access the report.
The Fund also offers shareholders the option to receive all notices, account statements, prospectuses, tax forms, and shareholder reports online. To sign up for eDelivery or change your delivery preference, please visit www.hennessyfunds.com/account.
To elect to receive paper copies of all future reports free of charge, please call U.S. Bank Global Fund Services at 1-800-261-6950 or 1-414-765-4124.
Subscribe to receive our team’s unique market and sector insights delivered to your inbox
www.hennessyfunds.com/subscribe
Follow us on social media
| PROXY VOTING — BOARD APPROVAL OF INVESTMENT ADVISORY AGREEMENT |
Board Approval of Investment Advisory
Agreement
At its meeting on March 10, 2021, the Board of Trustees of the Fund (the “Board,” and the members thereof, the “Trustees”) unanimously approved the continuation of the investment advisory agreement of the Fund with Hennessy Advisors, Inc. (the “Advisor”). As part of the process, the Trustees reviewed their fiduciary duties and the relevant factors for them to consider with respect to approving the advisory agreement. In addition, the Trustees who are not deemed “interested persons” (as defined by the Investment Company Act of 1940, as amended) of the Fund (the “Independent Trustees”) met in executive session to discuss the approval of the advisory agreement.
In advance of the meeting, the Advisor sent detailed information to the Trustees to assist them in their evaluation of the advisory agreement. This information included, but was not limited to, the following:
| | (1) | A memorandum from outside legal counsel that described the fiduciary duties of the Board with respect to approving the continuation of the advisory agreement and the relevant factors for consideration; |
| | | |
| | (2) | A memorandum from the Advisor that listed the factors relevant to the Board’s approval of the continuation of the advisory agreement and also referenced the documents that had been provided to help the Board assess each such factor; |
| | | |
| | (3) | The Advisor’s financial statements from its most recent Form 10-K and Form 10-Q; |
| | | |
| | (4) | A summary of the advisory agreement; |
| | | |
| | (5) | A recent Fund fact sheet, which included performance information over various periods; |
| | | |
| | (6) | An description of the range of services provided by the Advisor; |
| | | |
| | (7) | A peer expense comparison of the net expense ratio and investment advisory fee of the Fund; and |
| | | |
| | (8) | A memorandum from the Adviser regarding economies of scale. |
All of the factors discussed were considered as a whole by the Trustees and by the Independent Trustees meeting in executive session. The factors were viewed in their totality by the Trustees, with no single factor being the principal or determinative factor in the Trustees’ determination of whether to approve the continuation of the advisory agreement. The Trustees recognized that the management and fee arrangements for the Fund are the result of years of review and discussion between the Independent Trustees and the Advisor, that certain aspects of such arrangements may receive greater scrutiny in some years than in others, and that the Trustees’ conclusions may be based, in part, on their consideration of these same arrangements and information received during the course of the year and in prior years.
Prior to approving the continuation of the advisory agreement, the Trustees, including the Independent Trustees in executive session, considered, among other items:
| | (1) | The nature and quality of the advisory services provided by the Advisor; |
| | | |
| | (2) | A comparison of the fees and expenses of the Fund to other similar funds; |
| | | |
| | (3) | Whether economies of scale are recognized by the Fund; |
| | | |
| | (4) | The costs and profitability of the Fund to the Advisor; |
| | | |
| | (5) | The performance of the Fund; and |
| HENNESSY FUNDS | 1-800-966-4354 | |
| | (6) | Any benefits to the Advisor from serving as an investment advisor to the Fund (other than the advisory fee). |
The material considerations and determinations of the Trustees, including the Independent Trustees, were as follows:
| | (1) | The Trustees considered the services identified below that are provided by the Advisor. Based on this review, the Trustees concluded that the Advisor provides high-quality services to the Fund and noted that their overall confidence in the Advisor was high. The Trustees also concluded that they were satisfied with the nature, extent, and quality of the advisory services provided to the Fund by the Advisor and that the nature and extent of the services provided by the Advisor were appropriate to assure that the Fund’s operations are conducted in compliance with applicable laws, rules, and regulations. |
| | | (a) | The Advisor acts as the portfolio manager for the Fund. In this capacity, the Advisor does the following: |
| | | | (i) | manages the composition of the Fund’s portfolio, including the purchase, retention, and disposition of portfolio securities in accordance with the Fund’s investment objectives, policies, and restrictions; |
| | | | | |
| | | | (ii) | seeks best execution for the Fund’s portfolio; |
| | | | | |
| | | | (iii) | manages the use of soft dollars for the Fund; and |
| | | | | |
| | | | (iv) | manages proxy voting for the Fund. |
| | | (b) | The Advisor performs a daily reconciliation of portfolio positions and cash for the Fund. |
| | | | |
| | | (c) | The Advisor monitors the liquidity of each Fund. |
| | | | |
| | | (d) | The Advisor monitors the Fund’s compliance with its investment objectives and restrictions and federal securities laws. |
| | | | |
| | | (e) | The Advisor maintains a compliance program (including a code of ethics), conducts ongoing reviews of the compliance programs of the Fund’s service providers (including their codes of ethics, as appropriate), conducts on-site visits to the Fund’s service providers as feasible, monitors incidents of abusive trading practices, reviews Fund expense accruals, payments, and fixed expense ratios, evaluates insurance providers for fidelity bond, D&O/E&O insurance, and cybersecurity insurance coverage, manages regulatory examination compliance and responses, conducts employee compliance training, reviews reports provided by service providers, and maintains books and records. |
| | | | |
| | | (f) | The Advisor oversees service providers that provide accounting, administration, distribution, transfer agency, custodial, sales, marketing, public relations, audit, information technology, and legal services to the Fund. |
| | | | |
| | | (g) | The Advisor maintains in-house marketing and distribution departments on behalf of the Fund. |
| | | | |
| | | (h) | The Advisor prepares or directs the preparation of all regulatory filings for the Fund, including writing and annually updating the Fund’s prospectus and related documents. |
| | | | |
| | | (i) | For each annual report of the Fund, the Advisor prepares a written summary of the Fund’s performance during the most recent 12-month period. |
| BOARD APPROVAL OF INVESTMENT ADVISORY AGREEMENT |
| | | (j) | The Advisor oversees distribution of the Fund through third-party broker/dealers and independent financial institutions such as Charles Schwab, Inc., Fidelity, TD Ameritrade, and Pershing. The Advisor compensates, in part, a number of these third-party providers out of its own revenues. |
| | | | |
| | | (k) | The Advisor pays the incentive compensation of the Fund’s compliance officers and employs other staff, such as legal, marketing, national accounts, distribution, sales, administrative, and trading oversight personnel, as well as management executives. |
| | | | |
| | | (l) | The Advisor provides a quarterly compliance certification to the Board. |
| | | | |
| | | (m) | The Advisor prepares or reviews all Board materials, frequently presents to the Board and leads Board discussions, prepares or reviews all meeting minutes, and arranges for Board training and education. |
| | (2) | The Trustees compared the performance of the Fund to benchmark indices over various periods and also noted that the Trustees review and discuss reports comparing the investment performance of the Fund to various indices at each quarterly Board meeting. Based on such information, the Trustees determined that the Advisor manages the Fund in a manner materially consistent with its stated investment objective and style. The Trustees concluded that the performance of the Fund over various periods warranted continuation of the advisory agreement. |
| | | |
| | (3) | The Trustees reviewed the advisory fees and overall expense ratios of the Fund compared to other funds similar in asset size and investment objective to the Fund using data from Morningstar. As part of the discussion with management, the Trustees ensured that they understood and were comfortable with the criteria used to determine the mutual funds included in the Morningstar categories for purposes of the materials considered at the meeting. The Trustees determined that the advisory fee and overall expense ratio of the Fund falls within the range of the advisory fees and overall expense ratios of other comparable funds and concluded that they are reasonable and warranted continuation of the advisory agreement. |
| | | |
| | (4) | The Trustees also considered whether the Advisor was realizing economies of scale that it should share with the Fund’s shareholders. The Trustees noted that many of the expenses incurred to manage the Fund are asset-based fees, so the Advisor would not realize material economies of scale relating to those expenses as the assets of the Fund increase. For example, third-party platform fees increase as the Fund’s assets grow. The Trustees also considered the Advisor’s significant marketing efforts to promote the Funds and the Advisor’s agreement to waive fees or lower its management fees in certain circumstances. |
| | | |
| | (5) | The Trustees considered the profitability of the Advisor, including the impact of mutual fund platform fees on the Advisor’s profitability, and also considered the resources and revenues that the Advisor has put into managing and distributing the Fund. The Trustees then concluded that the profits of the Advisor are reasonable and not excessive when compared to profitability guidelines set forth in relevant court cases. |
| | | |
| | (6) | The Trustees considered the high level of professionalism and knowledge of the Advisor’s employees, along with a very low level of turnover, and concluded that this was beneficial to the Fund and its shareholders. |
| HENNESSY FUNDS | 1-800-966-4354 | |
| | (7) | The Trustees considered any benefits to the Advisor from serving as an advisor to the Fund (other than the advisory fee). The Trustees noted that the Advisor may derive ancillary benefits from, by way of example, its association with the Fund in the form of proprietary and third-party research products and services received from broker-dealers that execute portfolio trades for the Fund. The Trustees determined that any such products and services have been used for legitimate purposes relating to the Fund by providing assistance in the investment decision-making process. The Trustees concluded that any additional benefits realized by the Advisor from its relationship with the Fund were reasonable, which was based on, among other things, the Trustees’ finding that the research, analytical, statistical, and other information and services provided by brokers are merely supplemental to the Advisor’s own efforts in the performance of its duties under the advisory agreement. |
After reviewing the materials and information provided at the meeting, as well as other information regularly provided at the Board’s quarterly meetings throughout the year regarding the quality of services provided by the Advisor, the performance of the Fund, expense information, brokerage commissions information, the adequacy and efficacy of the Advisor’s written policies and procedures, other regulatory compliance issues, trading information and related matters, and other factors that the Trustees deemed relevant, the Trustees, including the Independent Trustees, approved the continuation of the advisory agreement.
| BOARD APPROVAL OF INVESTMENT ADVISORY AGREEMENT |
(This Page Intentionally Left Blank.)
For information, questions, or assistance, please call
The Hennessy Funds
1-800-966-4354 or 1-415-899-1555
INVESTMENT ADVISOR
Hennessy Advisors, Inc.
7250 Redwood Boulevard, Suite 200
Novato, California 94945
ADMINISTRATOR,
TRANSFER AGENT,
DIVIDEND PAYING AGENT, &
SHAREHOLDER SERVICING AGENT
U.S. Bancorp Fund Services, LLC
d/b/a U.S. Bank Global Fund Services
P.O. Box 701
Milwaukee, Wisconsin 53201-0701
CUSTODIAN
U.S. Bank N.A.
Custody Operations
1555 North River Center Drive, Suite 302
Milwaukee, Wisconsin 53212
TRUSTEES
Neil J. Hennessy
Robert T. Doyle
J. Dennis DeSousa
Gerald P. Richardson
COUNSEL
Foley & Lardner LLP
777 East Wisconsin Avenue
Milwaukee, Wisconsin 53202-5306
INDEPENDENT REGISTERED
PUBLIC ACCOUNTING FIRM
Tait, Weller & Baker LLP
Two Liberty Place
50 South 16th Street, Suite 2900
Philadelphia, Pennsylvania 19102-2529
DISTRIBUTOR
Quasar Distributors, LLC
111 East Kilbourn Avenue, Suite 2200
Milwaukee, Wisconsin 53202
www.hennessyfunds.com | 1-800-966-4354
This report has been prepared for shareholders and may be distributed to
others only if preceded or accompanied by a current prospectus.
SEMI-ANNUAL REPORT
APRIL 30, 2021
HENNESSY TECHNOLOGY FUND
Investor Class HTECX
Institutional Class HTCIX
www.hennessyfunds.com | 1-800-966-4354
(This Page Intentionally Left Blank.)
Contents
| Letter to Shareholders | 2 |
| Performance Overview | 4 |
| Financial Statements | |
| Schedule of Investments | 5 |
| Statement of Assets and Liabilities | 9 |
| Statement of Operations | 10 |
| Statements of Changes in Net Assets | 11 |
| Financial Highlights | 12 |
| Notes to the Financial Statements | 16 |
| Expense Example | 24 |
| Proxy Voting Policy and Proxy Voting Records | 26 |
| Availability of Quarterly Portfolio Schedule | 26 |
| Federal Tax Distribution Information | 26 |
| Important Notice Regarding Delivery of Shareholder Documents | 26 |
| Electronic Delivery | 26 |
| Board Approval of Investment Advisory Agreement | 27 |
| HENNESSY FUNDS | 1-800-966-4354 | |
May 2021
Dear Hennessy Funds Shareholder:
I can hardly believe that we have been navigating through one of the worst pandemics in modern history for more than a year. From the start, our thoughts have been with those affected by COVID-19 and with our frontline healthcare and essential workers. We are encouraged by the rapid rollout of vaccines and the continued reopening of the economy, and we hope this signals a turning point.
This is the first time in over 20 years in this business that I have witnessed volatility as extreme as the volatility that has rocked the financial markets and the economy over the past year. Both the pace of change and the magnitude of change have been staggering. As I reflect on this, I am reminded of a scientific concept called “punctuated equilibrium.” Biologist Stephen Jay Gould revolutionized evolutionary thinking with this theory, which challenged the prevailing belief that biological change happens slowly, consistently, and methodically over time. His theory instead proposed that change happens abruptly and dramatically and that new species pop up and others vanish rapidly, sometimes caused by catastrophic events. In between these explosive periods are much longer intervals of relative stability.
The dramatic market downdraft brought on by the pandemic, followed by the equally dramatic recovery, have been jarring. We witnessed an explosion of IPOs, a plethora of bankruptcies, and a dramatic change in market leadership. Yet unlike in the biological world, we are able to respond to stock market crises and try to dampen their negative impact. There have been numerous and unprecedented fiscal and monetary responses from the Federal Reserve and the U.S. government, and in many ways these measures may have spurred the economic recovery.
For the first six months of our fiscal year through April 30, 2021, the market appeared to be on a relentless march higher, with the S&P 500® Index rising 28.85% on a total return basis, setting new all-time highs 35 times in 124 trading days and closing at its then-highest level ever on April 29, 2021. We saw a dramatic shift back toward value investing, and many of the sectors and individual stocks that had underperformed for most of last year soared. Value outperformed growth, small-caps beat mid-caps, and mid-caps beat large-caps. The Energy and Financials sectors skyrocketed, as evidenced by the S&P 500® Energy Index’s total return of 75.94% and the Russell 1000® Index Financials’ total return of 52.00% during the six-month period. As we begin to move beyond the chaos caused by the pandemic, solid market fundamentals are reappearing, which we believe underscores the health and strength of our economy.
We are pleased with the performance of our mutual funds during the first half of our fiscal year. On an absolute basis, each of our 16 Funds achieved positive performance, and 11 of our 16 funds outperformed their primary benchmark. Ten of our 11 domestic equity-only Funds outperformed the S&P 500® Index, and three of our sector Funds posted total returns of over 50%, due primarily to their focus on the Energy and Financials sectors. We believe this was a favorable period for both our style of high-conviction investing as well as the areas and sectors of the market in which our Funds focus. While performance may wax and wane over a complete market cycle, we remain committed to managing our portfolios for long-term performance, ever mindful of downside risk.
Circling back to Gould’s theory of punctuated equilibrium, we are left with the question, “Where do we go from here?” Are we entering a more stable period in the economy and the market, similar to the periods of relative stasis in the geological record? We are optimistic that this may in fact be the case and that the markets will return to a less volatile part of the cycle. But, with history as our guide, we know that even the greatest bull markets have experienced corrections along the way. While certain individual stock or sector valuations might look stretched, we believe the market as a whole has more room to run. Strong GDP growth and increasing earnings expectations for this year, a potentially lower-for-longer interest rate environment, accommodative fiscal and monetary policies, a healthy and robust financial system, low unemployment and solid wage growth, and a measured reopening of certain parts of the economy all support the market moving higher from here.
We remain committed to our shareholders as we thoughtfully navigate these unprecedented times. We know that you have a multitude of investment options to choose from, and we are grateful for the trust you put in us and your continued interest and investment in our family of Funds. Should you have any questions or would like to speak with us, please don’t hesitate to call us directly at (800) 966-4354.
Best regards,
| |
| |
| |
| |
|
| Ryan C. Kelley |
| Chief Investment Officer |
Past performance does not guarantee future results. To obtain current standardized performance for the Hennessy Funds, visit https://www.hennessyfunds.com/funds/price-performance.
Mutual fund investing involves risk. Principal loss is possible.
Opinions expressed are those of Ryan C. Kelley and are subject to change, are not guaranteed, and should not be considered investment advice.
The S&P 500® Index is a capitalization-weighted index that is designed to represent the broad domestic economy through changes in aggregate market value of 500 stocks across all major industries. The S&P 500® Energy Index comprises those companies included in the S&P 500® Index that are classified in the Energy sector. The Russell 1000® Index Financials is a subset of the Russell 1000® Index that measures the performance of securities classified in the Financials sector of the large-capitalization U.S. equity market. The indices are used herein for comparative purposes in accordance with SEC regulations. One cannot invest directly in an index. All returns are shown on a total return basis.
| HENNESSY FUNDS | 1-800-966-4354 | |
Performance Overview (Unaudited)
AVERAGE ANNUAL TOTAL RETURN FOR PERIODS ENDED APRIL 30, 2021
| | Six | One | Five | Ten |
| | Months(1) | Year
| Years
| Years
|
| Hennessy Technology Fund – | | | | |
| Investor Class (HTECX) | 41.98% | 66.79% | 20.98% | 11.78% |
| Hennessy Technology Fund – | | | | |
| Institutional Class (HTCIX) | 42.13% | 67.19% | 21.29% | 12.08% |
| NASDAQ Composite Index | 28.41% | 58.30% | 25.23% | 18.49% |
S&P 500® Index | 28.85% | 45.98% | 17.42% | 14.17% |
| Expense ratios: | Gross 3.45%, Net 1.23%(2) (Investor Class); |
| | Gross 3.08%, Net 0.98%(2) (Institutional Class) |
(1) | Periods of less than one year are not annualized. |
(2) | The Fund’s investment advisor has contractually agreed to limit expenses until February 28, 2022. |
_______________
Performance data quoted represents past performance; past performance does not guarantee future results. The investment return and principal value of an investment will fluctuate so that an investor’s shares, when redeemed, may be worth more or less than their original cost. The performance table does not reflect the deduction of taxes that a shareholder would pay on Fund distributions or the redemption of Fund shares. Current performance of the Fund may be lower or higher than the performance quoted. Performance data current to the most recent month end may be obtained by visiting www.hennessyfunds.com. Performance for periods including or prior to October 26, 2012, is that of the FBR Technology Fund.
The NASDAQ Composite Index is a broad-based capitalization-weighted index of all common stocks listed on The NASDAQ Stock Market. The S&P 500® Index is a capitalization-weighted index that is designed to represent the broad domestic economy through changes in the aggregate market value of 500 stocks across all major industries. One cannot invest directly in an index. These indices are used herein for comparative purposes in accordance with Securities and Exchange Commission regulations.
Standard & Poor’s Financial Services is the source and owner of the S&P® and S&P 500® trademarks.
The expense ratios presented are from the most recent prospectus. The expense ratios for the current reporting period are available in the Financial Highlights section of this report.
| PERFORMANCE OVERVIEW/SCHEDULE OF INVESTMENTS |
Financial Statements
Schedule of Investments as of April 30, 2021 (Unaudited) |
HENNESSY TECHNOLOGY FUND
(% of Net Assets)
| TOP TEN HOLDINGS (EXCLUDING MONEY MARKET FUNDS) | % NET ASSETS |
| Seagate Technology PLC | 1.96% |
| 1-800-Flowers.com, Inc. | 1.83% |
| Revolve Group, Inc. | 1.81% |
| Cambium Networks Corp. | 1.79% |
| Atlassian Corp. PLC | 1.76% |
| Bentley Systems, Inc. | 1.75% |
| CDW Corp. | 1.74% |
| Fortinet, Inc. | 1.74% |
| Adobe Systems, Inc. | 1.72% |
| Amazon.com, Inc. | 1.72% |
Note: For presentation purposes, the Fund has grouped some of the industry categories. For purposes of categorizing securities for compliance with Section 8(b)(1) of the Investment Company Act of 1940, as amended, the Fund uses more specific industry classifications.
The Global Industry Classification Standard (GICS®) was developed by and is the exclusive property and a service mark of MSCI, Inc. and Standard & Poor’s Financial Services LLC. It has been licensed for use by the Hennessy Funds.
| HENNESSY FUNDS | 1-800-966-4354 | |
| COMMON STOCKS – 97.16% | | Number | | | | | | % of | |
| | | of Shares | | | Value | | | Net Assets | |
| Communication Services – 4.93% | | | | | | | | | |
| Cargurus, Inc. (a) | | | 5,550 | | | $ | 136,974 | | | | 1.66 | % |
| Momo, Inc. – ADR (b) | | | 8,902 | | | | 130,503 | | | | 1.58 | % |
| SciPlay Corp. (a) | | | 7,877 | | | | 139,029 | | | | 1.69 | % |
| | | | | | | | 406,506 | | | | 4.93 | % |
| | | | | | | | | | | | | |
| Consumer Discretionary – 10.24% | | | | | | | | | | | | |
| 1-800-Flowers.com, Inc. (a) | | | 4,713 | | | | 150,698 | | | | 1.83 | % |
| Amazon.com, Inc. (a) | | | 41 | | | | 142,164 | | | | 1.72 | % |
| Etsy, Inc. (a) | | | 683 | | | | 135,774 | | | | 1.65 | % |
| Shutterstock, Inc. | | | 1,452 | | | | 126,585 | | | | 1.54 | % |
| Revolve Group, Inc. (a) | | | 3,077 | | | | 149,204 | | | | 1.81 | % |
| Vipshop Holdings Ltd. – ADR (a)(b) | | | 4,523 | | | | 139,173 | | | | 1.69 | % |
| | | | | | | | 843,598 | | | | 10.24 | % |
| | | | | | | | | | | | | |
| Information Technology – 81.99% | | | | | | | | | | | | |
| Accenture PLC, Class A (b) | | | 479 | | | | 138,896 | | | | 1.69 | % |
| Adobe Systems, Inc. (a) | | | 279 | | | | 141,827 | | | | 1.72 | % |
| Advanced Micro Devices, Inc. (a) | | | 1,654 | | | | 135,000 | | | | 1.64 | % |
| Amkor Technology, Inc. | | | 5,106 | | | | 103,243 | | | | 1.25 | % |
| Apple, Inc. | | | 1,070 | | | | 140,662 | | | | 1.71 | % |
| Arrow Electronics, Inc. (a) | | | 1,175 | | | | 134,032 | | | | 1.63 | % |
| ASE Technology Holding Co. Ltd. – ADR (b) | | | 17,007 | | | | 141,328 | | | | 1.71 | % |
| Aspen Technology, Inc. (a) | | | 882 | | | | 115,401 | | | | 1.40 | % |
| Atlassian Corp. PLC (a)(b) | | | 609 | | | | 144,674 | | | | 1.76 | % |
| Autodesk, Inc. (a) | | | 464 | | | | 135,446 | | | | 1.64 | % |
| Automatic Data Processing, Inc. | | | 717 | | | | 134,072 | | | | 1.63 | % |
| Bentley Systems, Inc. | | | 2,812 | | | | 143,974 | | | | 1.75 | % |
| Cambium Networks Corp. (a)(b) | | | 2,453 | | | | 147,180 | | | | 1.79 | % |
| Cardtronics PLC (a)(b) | | | 3,466 | | | | 134,619 | | | | 1.63 | % |
| CDW Corp. | | | 805 | | | | 143,556 | | | | 1.74 | % |
| Celestica, Inc. (a)(b) | | | 15,203 | | | | 126,641 | | | | 1.54 | % |
| Conduent, Inc. (a) | | | 19,444 | | | | 132,219 | | | | 1.60 | % |
| CSG Systems International, Inc. | | | 2,934 | | | | 134,935 | | | | 1.64 | % |
| Daktronics, Inc. (a) | | | 21,165 | | | | 130,588 | | | | 1.58 | % |
| Digital Turbine, Inc. (a) | | | 1,646 | | | | 124,158 | | | | 1.51 | % |
| DXC Technology Co. (a) | | | 4,229 | | | | 139,176 | | | | 1.69 | % |
The accompanying notes are an integral part of these financial statements.
| COMMON STOCKS | | Number | | | | | | % of | |
| | | of Shares | | | Value | | | Net Assets | |
| Information Technology (Continued) | | | | | | | | | |
| Fair Isaac Corp. (a) | | | 267 | | | $ | 139,216 | | | | 1.69 | % |
| Flex Ltd. (a)(b) | | | 7,356 | | | | 127,994 | | | | 1.55 | % |
| Fortinet, Inc. (a) | | | 704 | | | | 143,778 | | | | 1.74 | % |
| Hewlett Packard Enterprise Co. | | | 8,556 | | | | 137,067 | | | | 1.66 | % |
| Inseego Corp. (a) | | | 13,958 | | | | 123,947 | | | | 1.50 | % |
| Intel Corp. | | | 2,024 | | | | 116,441 | | | | 1.41 | % |
| Intelligent Systems Corp. (a) | | | 3,253 | | | | 124,655 | | | | 1.51 | % |
| Jabil, Inc. | | | 2,508 | | | | 131,469 | | | | 1.60 | % |
| Kimball Electronics, Inc. (a) | | | 5,050 | | | | 116,201 | | | | 1.41 | % |
| KLA-Tencor Corp. | | | 379 | | | | 119,518 | | | | 1.45 | % |
| Lam Research Corp. | | | 204 | | | | 126,572 | | | | 1.54 | % |
| Mastercard, Inc., Class A | | | 366 | | | | 139,834 | | | | 1.70 | % |
| Methode Electronics, Inc. | | | 3,051 | | | | 137,081 | | | | 1.66 | % |
| NetApp, Inc. | | | 1,812 | | | | 135,338 | | | | 1.64 | % |
| Oracle Corp. | | | 1,864 | | | | 141,273 | | | | 1.71 | % |
| Qualcomm, Inc. | | | 934 | | | | 129,639 | | | | 1.57 | % |
| Sanmina Corp. (a) | | | 3,134 | | | | 127,993 | | | | 1.55 | % |
| Seagate Technology PLC (b) | | | 1,744 | | | | 161,913 | | | | 1.96 | % |
| ServiceNow, Inc. (a) | | | 262 | | | | 132,669 | | | | 1.61 | % |
| Sykes Enterprises, Inc. (a) | | | 2,960 | | | | 129,737 | | | | 1.57 | % |
| Synnex Corp. | | | 1,121 | | | | 135,865 | | | | 1.65 | % |
| Taiwan Semiconductor Manufacturing Co. Ltd. – ADR (b) | | | 1,082 | | | | 126,313 | | | | 1.53 | % |
| Texas Instruments, Inc. | | | 684 | | | | 123,469 | | | | 1.50 | % |
| The Western Union Co. | | | 5,238 | | | | 134,931 | | | | 1.64 | % |
| Tower Semiconductor Ltd. (a)(b) | | | 4,470 | | | | 126,501 | | | | 1.53 | % |
| TTM Technologies, Inc. (a) | | | 8,854 | | | | 132,810 | | | | 1.61 | % |
| Vertex, Inc. (a) | | | 5,965 | | | | 121,865 | | | | 1.48 | % |
| Vishay Intertechnology, Inc. | | | 5,280 | | | | 129,730 | | | | 1.57 | % |
| Xerox Holdings Corp. | | | 5,436 | | | | 131,225 | | | | 1.59 | % |
| Zoom Video Communications, Inc. (a) | | | 416 | | | | 132,941 | | | | 1.61 | % |
| | | | | | | | 6,759,612 | | | | 81.99 | % |
| | | | | | | | | | | | | |
| Total Common Stocks | | | | | | | | | | | | |
| (Cost $6,315,088) | | | | | | | 8,009,716 | | | | 97.16 | % |
The accompanying notes are an integral part of these financial statements.
| HENNESSY FUNDS | 1-800-966-4354 | |
| SHORT-TERM INVESTMENTS – 2.78% | | Number | | | | | | % of | |
| | | of Shares | | | Value | | | Net Assets | |
| Money Market Funds – 2.78% | | | | | | | | | |
| First American Government Obligations Fund, | | | | | | | | | |
| Institutional Class, 0.03% (c) | | | 229,558 | | | $ | 229,558 | | | | 2.78 | % |
| | | | | | | | | | | | | |
| Total Short-Term Investments | | | | | | | | | | | | |
| (Cost $229,558) | | | | | | | 229,558 | | | | 2.78 | % |
| | | | | | | | | | | | | |
| Total Investments | | | | | | | | | | | | |
| (Cost $6,544,646) – 99.94% | | | | | | | 8,239,274 | | | | 99.94 | % |
| Other Assets in Excess of Liabilities – 0.06% | | | | | | | 5,111 | | | | 0.06 | % |
| | | | | | | | | | | | | |
TOTAL NET ASSETS – 100.00% | | | | | | $ | 8,244,385 | | | | 100.00 | % |
Percentages are stated as a percent of net assets.
ADR – American Depositary Receipt
PLC – Public Limited Company
| (a) | Non-income-producing security. |
| (b) | U.S.-traded security of a foreign corporation. |
| (c) | The rate listed is the fund’s seven-day yield as of April 30, 2021. |
Summary of Fair Value Exposure as of April 30, 2021
The following is a summary of the inputs used to value the Fund’s net assets as of April 30, 2021 (see Note 3 in the accompanying Notes to the Financial Statements):
| Common Stocks | | Level 1 | | | Level 2 | | | Level 3 | | | Total | |
| Communication Services | | $ | 406,506 | | | $ | — | | | $ | — | | | $ | 406,506 | |
| Consumer Discretionary | | | 843,598 | | | | — | | | | — | | | | 843,598 | |
| Information Technology | | | 6,759,612 | | | | — | | | | — | | | | 6,759,612 | |
| Total Common Stocks | | $ | 8,009,716 | | | $ | — | | | $ | — | | | $ | 8,009,716 | |
| Short-Term Investments | | | | | | | | | | | | | | | | |
| Money Market Funds | | $ | 229,558 | | | $ | — | | | $ | — | | | $ | 229,558 | |
| Total Short-Term Investments | | $ | 229,558 | | | $ | — | | | $ | — | | | $ | 229,558 | |
| Total Investments | | $ | 8,239,274 | | | $ | — | | | $ | — | | | $ | 8,239,274 | |
The accompanying notes are an integral part of these financial statements.
| SCHEDULE OF INVESTMENTS/STATEMENT OF ASSETS AND LIABILITIES |
Financial Statements
Statement of Assets and Liabilities as of April 30, 2021 (Unaudited) |
| ASSETS: | | | |
| Investments in securities, at value (cost $6,544,646) | | $ | 8,239,274 | |
| Cash | | | 5,519 | |
| Dividends and interest receivable | | | 1,765 | |
| Receivable for fund shares sold | | | 850 | |
| Prepaid expenses and other assets | | | 16,003 | |
| Due from advisor | | | 3,105 | |
| Total assets | | | 8,266,516 | |
| | | | | |
| LIABILITIES: | | | | |
| Payable to auditor | | | 11,227 | |
| Accrued distribution fees | | | 1,146 | |
| Accrued service fees | | | 511 | |
| Accrued trustees fees | | | 5,159 | |
| Accrued expenses and other payables | | | 4,088 | |
| Total liabilities | | | 22,131 | |
| NET ASSETS | | $ | 8,244,385 | |
| | | | | |
| NET ASSETS CONSISTS OF: | | | | |
| Capital stock | | $ | 5,235,867 | |
| Total distributable earnings | | | 3,008,518 | |
| Total net assets | | $ | 8,244,385 | |
| | | | | |
| NET ASSETS: | | | | |
| Investor Class | | | | |
| Shares authorized (no par value) | | Unlimited | |
| Net assets applicable to outstanding shares | | $ | 6,178,946 | |
| Shares issued and outstanding | | | 234,886 | |
| Net asset value, offering price, and redemption price per share | | $ | 26.31 | |
| | | | | |
| Institutional Class | | | | |
| Shares authorized (no par value) | | Unlimited | |
| Net assets applicable to outstanding shares | | $ | 2,065,439 | |
| Shares issued and outstanding | | | 76,470 | |
| Net asset value, offering price, and redemption price per share | | $ | 27.01 | |
The accompanying notes are an integral part of these financial statements.
| HENNESSY FUNDS | 1-800-966-4354 | |
Financial Statements
Statement of Operations for the six months ended April 30, 2021 (Unaudited) |
| INVESTMENT INCOME: | | | |
Dividend income(1) | | $ | 55,230 | |
| Interest income | | | 36 | |
| Total investment income | | | 55,266 | |
| | | | | |
| EXPENSES: | | | | |
| Investment advisory fees (See Note 5) | | | 27,298 | |
| Federal and state registration fees | | | 14,583 | |
| Compliance expense (See Note 5) | | | 13,844 | |
| Audit fees | | | 11,227 | |
| Administration, accounting, custody, and transfer agent fees (See Note 5) | | | 10,345 | |
| Trustees’ fees and expenses | | | 9,143 | |
| Sub-transfer agent expenses – Investor Class (See Note 5) | | | 3,904 | |
| Sub-transfer agent expenses – Institutional Class (See Note 5) | | | 345 | |
| Distribution fees – Investor Class (See Note 5) | | | 4,122 | |
| Reports to shareholders | | | 2,813 | |
| Service fees – Investor Class (See Note 5) | | | 2,748 | |
| Other expenses | | | 2,326 | |
| Total expenses before waivers and reimbursements | | | 102,698 | |
| Service provider expense waiver (See Note 5) | | | (10,345 | ) |
| Expense reimbursement by advisor – Investor Class (See Note 5) | | | (37,477 | ) |
| Expense reimbursement by advisor – Institutional Class (See Note 5) | | | (11,855 | ) |
| Net expenses | | | 43,021 | |
| NET INVESTMENT INCOME | | $ | 12,245 | |
| | | | | |
| REALIZED AND UNREALIZED GAINS (LOSSES): | | | | |
| Net realized gain on investments | | $ | 1,363,208 | |
| Net change in unrealized appreciation/depreciation on investments | | | 1,001,898 | |
| Net gain on investments | | | 2,365,106 | |
| NET INCREASE IN NET ASSETS RESULTING FROM OPERATIONS | | $ | 2,377,351 | |
(1) | Net of issuance fees of $306. |
The accompanying notes are an integral part of these financial statements.
| STATEMENT OF OPERATIONS/STATEMENTS OF CHANGES IN NET ASSETS |
Financial Statements
| Statements of Changes in Net Assets |
| | | Six Months Ended | | | | |
| | | April 30, 2021 | | | Year Ended | |
| | | (Unaudited) | | | October 31, 2020 | |
| OPERATIONS: | | | | | | |
| Net investment income | | $ | 12,245 | | | $ | 9,137 | |
| Net realized gain on investments | | | 1,363,208 | | | | 677,479 | |
| Net change in unrealized | | | | | | | | |
| appreciation/depreciation on investments | | | 1,001,898 | | | | (84,382 | ) |
| Net increase in net assets resulting from operations | | | 2,377,351 | | | | 602,234 | |
| | | | | | | | | |
| DISTRIBUTIONS TO SHAREHOLDERS: | | | | | | | | |
| Distributable earnings – Investor Class | | | (493,580 | ) | | | (108,418 | ) |
| Distributable earnings – Institutional Class | | | (175,930 | ) | | | (37,553 | ) |
| Total distributions | | | (669,510 | ) | | | (145,971 | ) |
| | | | | | | | | |
| CAPITAL SHARE TRANSACTIONS: | | | | | | | | |
| Proceeds from shares subscribed – Investor Class | | | 642,864 | | | | 731,750 | |
| Proceeds from shares subscribed – Institutional Class | | | 41,450 | | | | 67,473 | |
| Dividends reinvested – Investor Class | | | 482,162 | | | | 106,748 | |
| Dividends reinvested – Institutional Class | | | 175,930 | | | | 37,105 | |
| Cost of shares redeemed – Investor Class | | | (472,913 | ) | | | (811,778 | ) |
| Cost of shares redeemed – Institutional Class | | | (59,416 | ) | | | (92,300 | ) |
| Net increase in net assets derived | | | | | | | | |
| from capital share transactions | | | 810,077 | | | | 38,998 | |
| TOTAL INCREASE IN NET ASSETS | | | 2,517,918 | | | | 495,261 | |
| | | | | | | | | |
| NET ASSETS: | | | | | | | | |
| Beginning of period | | | 5,726,467 | | | | 5,231,206 | |
| End of period | | $ | 8,244,385 | | | $ | 5,726,467 | |
| | | | | | | | | |
| CHANGES IN SHARES OUTSTANDING: | | | | | | | | |
| Shares sold – Investor Class | | | 25,202 | | | | 39,530 | |
| Shares sold – Institutional Class | | | 1,657 | | | | 3,356 | |
| Shares issued to holders as reinvestment | | | | | | | | |
| of dividends – Investor Class | | | 21,238 | | | | 5,574 | |
| Shares issued to holders as reinvestment | | | | | | | | |
| of dividends – Institutional Class | | | 7,528 | | | | 1,887 | |
| Shares redeemed – Investor Class | | | (19,180 | ) | | | (43,369 | ) |
| Shares redeemed – Institutional Class | | | (2,440 | ) | | | (4,535 | ) |
| Net increase in shares outstanding | | | 34,005 | | | | 2,443 | |
The accompanying notes are an integral part of these financial statements.
| HENNESSY FUNDS | 1-800-966-4354 | |
Financial Statements
For an Investor Class share outstanding throughout each period
| | | Six Months Ended | |
| | | April 30, 2021 | |
| | | (Unaudited) | |
| PER SHARE DATA: | | | |
| Net asset value, beginning of period | | $ | 20.50 | |
| | | | | |
| Income from investment operations: | | | | |
| Net investment income (loss) | | | 0.03 | (1) |
| Net realized and unrealized gains on investments | | | 8.18 | |
| Total from investment operations | | | 8.21 | |
| | | | | |
| Less distributions: | | | | |
| Dividends from net investment income | | | (0.04 | ) |
| Dividends from net realized gains | | | (2.36 | ) |
| Total distributions | | | (2.40 | ) |
| Net asset value, end of period | | $ | 26.31 | |
| | | | | |
| TOTAL RETURN | | | 41.98 | %(2) |
| | | | | |
| SUPPLEMENTAL DATA AND RATIOS: | | | | |
| Net assets, end of period (millions) | | $ | 6.18 | |
| Ratio of expenses to average net assets: | | | | |
| Before expense reimbursement | | | 2.87 | %(3) |
| After expense reimbursement | | | 1.23 | %(3) |
| Ratio of net investment income (loss) to average net assets: | | | | |
| Before expense reimbursement | | | (1.38 | )%(3) |
| After expense reimbursement | | | 0.26 | %(3) |
Portfolio turnover rate(5) | | | 112 | %(2) |
(1) | Calculated using the average shares outstanding method. |
(2) | Not annualized. |
(3) | Annualized. |
(4) | The Fund’s current expense limitation agreement, which became effective on February 28, 2017, was in effect for eight months of the year ended October 31, 2017. |
(5) | Calculated on the basis of the Fund as a whole. |
The accompanying notes are an integral part of these financial statements.
| FINANCIAL HIGHLIGHTS — INVESTOR CLASS |
| Year Ended October 31, | |
| 2020 | | | 2019 | | | 2018 | | | 2017 | | | 2016 | |
| | | | | | | | | | | | | | |
| $ | 18.90 | | | $ | 18.04 | | | $ | 18.46 | | | $ | 15.82 | | | $ | 15.36 | |
| | | | | | | | | | | | | | | | | | | |
| | | | | | | | | | | | | | | | | | | |
| | 0.02 | (1) | | | (0.03 | )(1) | | | (0.05 | ) | | | (0.23 | ) | | | (0.68 | ) |
| | 2.10 | | | | 3.15 | | | | 1.26 | | | | 2.87 | | | | 1.14 | |
| | 2.12 | | | | 3.12 | | | | 1.21 | | | | 2.64 | | | | 0.46 | |
| | | | | | | | | | | | | | | | | | | |
| | | | | | | | | | | | | | | | | | | |
| | — | | | | — | | | | — | | | | — | | | | — | |
| | (0.52 | ) | | | (2.26 | ) | | | (1.63 | ) | | | — | | | | — | |
| | (0.52 | ) | | | (2.26 | ) | | | (1.63 | ) | | | — | | | | — | |
| $ | 20.50 | | | $ | 18.90 | | | $ | 18.04 | | | $ | 18.46 | | | $ | 15.82 | |
| | | | | | | | | | | | | | | | | | | |
| | 11.42 | % | | | 20.47 | % | | | 7.25 | % | | | 16.69 | % | | | 2.99 | % |
| | | | | | | | | | | | | | | | | | | |
| | | | | | | | | | | | | | | | | | | |
| $ | 4.26 | | | $ | 3.89 | | | $ | 3.31 | | | $ | 3.20 | | | $ | 2.91 | |
| | | | | | | | | | | | | | | | | | | |
| | 3.45 | % | | | 3.84 | % | | | 3.70 | % | | | 4.16 | % | | | 3.61 | % |
| | 1.23 | % | | | 1.23 | % | | | 1.23 | % | | | 2.15 | %(4) | | | 3.61 | % |
| | | | | | | | | | | | | | | | | | | |
| | (2.12 | )% | | | (2.80 | )% | | | (2.83 | )% | | | (3.16 | )% | | | (2.92 | )% |
| | 0.10 | % | | | (0.19 | )% | | | (0.36 | )% | | | (1.15 | )%(4) | | | (2.92 | )% |
| | 192 | % | | | 185 | % | | | 225 | % | | | 267 | % | | | 80 | % |
The accompanying notes are an integral part of these financial statements.
| HENNESSY FUNDS | 1-800-966-4354 | |
Financial Statements
For an Institutional Class share outstanding throughout each period
| | | Six Months Ended | |
| | | April 30, 2021 | |
| | | (Unaudited) | |
| PER SHARE DATA: | | | |
| Net asset value, beginning of period | | $ | 21.08 | |
| | | | | |
| Income from investment operations: | | | | |
| Net investment income (loss) | | | 0.07 | (1) |
| Net realized and unrealized gains on investments | | | 8.40 | |
| Total from investment operations | | | 8.47 | |
| | | | | |
| Less distributions: | | | | |
| Dividends from net investment income | | | (0.11 | ) |
| Dividends from net realized gains | | | (2.43 | ) |
| Total distributions | | | (2.54 | ) |
| Net asset value, end of period | | $ | 27.01 | |
| | | | | |
| TOTAL RETURN | | | 42.13 | %(2) |
| | | | | |
| SUPPLEMENTAL DATA AND RATIOS: | | | | |
| Net assets, end of period (millions) | | $ | 2.07 | |
| Ratio of expenses to average net assets: | | | | |
| Before expense reimbursement | | | 2.52 | %(3) |
| After expense reimbursement | | | 0.98 | %(3) |
| Ratio of net investment income (loss) to average net assets: | | | | |
| Before expense reimbursement | | | (1.02 | )%(3) |
| After expense reimbursement | | | 0.52 | %(3) |
Portfolio turnover rate(5) | | | 112 | %(2) |
(1) | Calculated using the average shares outstanding method. |
(2) | Not annualized. |
(3) | Annualized. |
(4) | The Fund’s current expense limitation agreement, which became effective on February 28, 2017, was in effect for eight months of the year ended October 31, 2017. |
(5) | Calculated on the basis of the Fund as a whole. |
The accompanying notes are an integral part of these financial statements.
| FINANCIAL HIGHLIGHTS — INSTITUTIONAL CLASS |
| Year Ended October 31, | |
| 2020 | | | 2019 | | | 2018 | | | 2017 | | | 2016 | |
| | | | | | | | | | | | | | |
| $ | 19.40 | | | $ | 18.47 | | | $ | 18.85 | | | $ | 16.11 | | | $ | 15.58 | |
| | | | | | | | | | | | | | | | | | | |
| | | | | | | | | | | | | | | | | | | |
| | 0.07 | (1) | | | 0.01 | (1) | | | 0.01 | | | | (0.12 | ) | | | (0.43 | ) |
| | 2.15 | | | | 3.23 | | | | 1.28 | | | | 2.86 | | | | 0.96 | |
| | 2.22 | | | | 3.24 | | | | 1.29 | | | | 2.74 | | | | 0.53 | |
| | | | | | | | | | | | | | | | | | | |
| | | | | | | | | | | | | | | | | | | |
| | (0.01 | ) | | | — | | | | — | | | | — | | | | — | |
| | (0.53 | ) | | | (2.31 | ) | | | (1.67 | ) | | | — | | | | — | |
| | (0.54 | ) | | | (2.31 | ) | | | (1.67 | ) | | | — | | | | — | |
| $ | 21.08 | | | $ | 19.40 | | | $ | 18.47 | | | $ | 18.85 | | | $ | 16.11 | |
| | | | | | | | | | | | | | | | | | | |
| | 11.67 | % | | | 20.77 | % | | | 7.54 | % | | | 17.01 | % | | | 3.40 | % |
| | | | | | | | | | | | | | | | | | | |
| | | | | | | | | | | | | | | | | | | |
| $ | 1.47 | | | $ | 1.34 | | | $ | 1.09 | | | $ | 1.22 | | | $ | 0.90 | |
| | | | | | | | | | | | | | | | | | | |
| | 3.08 | % | | | 3.47 | % | | | 3.27 | % | | | 3.74 | % | | | 3.28 | % |
| | 0.98 | % | | | 0.98 | % | | | 0.98 | % | | | 1.77 | %(4) | | | 3.28 | % |
| | | | | | | | | | | | | | | | | | | |
| | (1.74 | )% | | | (2.43 | )% | | | (2.41 | )% | | | (2.74 | )% | | | (2.59 | )% |
| | 0.36 | % | | | 0.06 | % | | | (0.12 | )% | | | (0.77 | )%(4) | | | (2.59 | )% |
| | 192 | % | | | 185 | % | | | 225 | % | | | 267 | % | | | 80 | % |
The accompanying notes are an integral part of these financial statements.
| HENNESSY FUNDS | 1-800-966-4354 | |
Financial Statements
Notes to the Financial Statements April 30, 2021 (Unaudited) |
1). ORGANIZATION
The Hennessy Technology Fund (the “Fund”) is a series of Hennessy Funds Trust (the “Trust”), which was organized as a Delaware statutory trust on September 17, 1992. The Fund is an open-end management investment company registered under the Investment Company Act of 1940, as amended. The investment objective of the Fund is long-term capital appreciation. The Fund is a diversified fund.
The Fund offers Investor Class and Institutional Class shares. Each class of shares differs principally in its respective 12b-1 distribution and service, shareholder servicing, and sub-transfer agent expenses. There are no sales charges. Each class has identical rights to earnings, assets, and voting privileges, except for class-specific expenses and exclusive rights to vote on matters affecting only one class.
As an investment company, the Fund follows the investment company accounting and reporting guidance of the Financial Accounting Standards Board (“FASB”) Accounting Standard Codification Topic 946 “Financial Services—Investment Companies.”
2). SIGNIFICANT ACCOUNTING POLICIES
The following is a summary of significant accounting policies consistently followed by the Fund in the preparation of the financial statements. These policies conform to U.S. generally accepted accounting principles (“GAAP”).
| a). | Securities Valuation – All investments in securities are valued in accordance with the Fund’s valuation policies and procedures, as described in Note 3. |
| | |
| b). | Federal Income Taxes – The Fund has elected to be taxed as a regulated investment company and intends to distribute substantially all of its taxable income to its shareholders and otherwise comply with the provisions of the Internal Revenue Code of 1986, as amended, applicable to regulated investment companies. As a result, the Fund has made no provision for federal income taxes or excise taxes. Net investment income/loss and realized gains/losses for federal income tax purposes may differ from those reported in the financial statements because of temporary book-basis and tax-basis differences. Temporary differences are primarily the result of the treatment of wash sales for tax reporting purposes. The Fund recognizes interest and penalties related to income tax benefits, if any, in the Statement of Operations as an income tax expense. Distributions from net realized gains for book purposes may include short-term capital gains, which are included as ordinary income to shareholders for tax purposes. The Fund may utilize equalization accounting for tax purposes and designate earnings and profits, including net realized gains distributed to shareholders on redemption of shares, as part of the dividends paid deduction for income tax purposes. |
| | |
| c). | Accounting for Uncertainty in Income Taxes – The Fund has accounting policies regarding recognition and measurement of tax positions taken or expected to be taken on a tax return. The tax returns of the Fund for the prior three fiscal years are open for examination. The Fund has reviewed all open tax years in major tax jurisdictions and concluded that there is no impact on the Fund’s net assets and no tax liability resulting from unrecognized tax benefits relating to uncertain income tax positions taken or expected to be taken on a tax return. The Fund’s major tax jurisdictions are U.S. federal and Delaware. |
| NOTES TO THE FINANCIAL STATEMENTS |
| d). | Income and Expenses – Dividend income is recognized on the ex-dividend date or as soon as information is available to the Fund. Interest income, which includes the amortization of premium and accretion of discount, is recognized on an accrual basis. Market discounts, original issue discounts, and market premiums on debt securities are accreted or amortized to interest income over the life of a security with a corresponding increase or decrease, as applicable, in the cost basis of such security using the yield-to-maturity method or, where applicable, the first call date of the security. Other non-cash dividends are recognized as investment income at the fair value of the property received. The Fund is charged for those expenses that are directly attributable to its portfolio, such as advisory, administration, and certain shareholder service fees. Income, expenses (other than expenses attributable to a specific class), and realized and unrealized gains/losses on investments are allocated to each class of shares based on such class’s net assets. |
| | |
| e). | Distributions to Shareholders – Dividends from net investment income for the Fund, if any, are declared and paid annually, usually in December. Distributions of net realized capital gains, if any, are declared and paid annually, usually in December. |
| | |
| f). | Security Transactions – Investment and shareholder transactions are recorded on the trade date. The Fund determines the realized gain/loss from an investment transaction by comparing the original cost of the security lot sold with the net sale proceeds. Discounts and premiums on securities purchased are accreted or amortized, respectively, over the life of each such security. |
| | |
| g). | Use of Estimates – Preparing financial statements in accordance with GAAP requires management to make estimates and assumptions that affect the reported amounts of assets and liabilities and disclosure of contingent assets and liabilities at the date of the financial statements, as well as the reported change in net assets during the reporting period. Actual results could differ from those estimates. |
| | |
| h). | Share Valuation – The net asset value (“NAV”) per share of the Fund is calculated by dividing (i) the total value of the securities held by the Fund, plus cash and other assets, minus all liabilities (including estimated accrued expenses) by (ii) the total number of Fund shares outstanding, rounded to the nearest $0.01. Fund shares are not priced on days the New York Stock Exchange is closed for trading. The offering and redemption price per share for the Fund is equal to the Fund’s NAV per share. |
| | |
| i). | New Accounting Pronouncements – In August 2018, the FASB issued Accounting Standards Update No. 2018-13 “Disclosure Framework—Changes to the Disclosure Requirements for Fair Value Measurement” (“ASU 2018-13”). ASU 2018-13 eliminates the requirement to disclose the amount of and reasons for transfers between Level 1 and Level 2 of the fair value hierarchy, the timing of transfers between levels of the fair value hierarchy, and the valuation processes for Level 3 fair value measurements. ASU 2018-13 does not eliminate the requirement to disclose the range and weighted average used to develop significant unobservable inputs for Level 3 fair value measurements or the requirement to disclose the changes in unrealized gains and losses for recurring Level 3 fair value measurements. ASU 2018-13 requires that information is provided about the measurement uncertainty of Level 3 fair value measurements as of the reporting date. The guidance is effective for fiscal years beginning after December 15, 2019, and interim periods within those fiscal years. Management evaluated the impact of this change in guidance and, due to the permissibility of early adoption, modified the Fund’s fair value disclosures beginning with its fiscal year 2019. |
| HENNESSY FUNDS | 1-800-966-4354 | |
3). SECURITIES VALUATION
The Fund follows its valuation policies and procedures in determining its net asset value and, in preparing these financial statements, the fair value accounting standards that establish an authoritative definition of fair value and set out a hierarchy for measuring fair value. These standards require additional disclosures about the various inputs and valuation techniques used to develop the measurements of fair value and a discussion of changes in valuation techniques and related inputs during the period. These inputs are summarized in the three broad levels listed below:
| | Level 1 – | Unadjusted, quoted prices in active markets for identical instruments that the Fund has the ability to access at the date of measurement. |
| | | |
| | Level 2 – | Other significant observable inputs (including, but not limited to, quoted prices in active markets for similar instruments, quoted prices in markets that are not active for identical or similar instruments, and model-derived valuations in which all significant inputs and significant value drivers are observable in active markets, such as interest rates, prepayment speeds, credit risk curves, default rates, and similar data). |
| | | |
| | Level 3 – | Significant unobservable inputs (including the Fund’s own assumptions about what market participants would use to price the asset or liability based on the best available information) when observable inputs are unavailable. |
The following is a description of the valuation techniques applied to the Fund’s major categories of assets and liabilities on a recurring basis:
| | Equity Securities – Equity securities, including common stocks, preferred stocks, foreign-issued common stocks, exchange-traded funds, closed-end mutual funds, partnerships, rights, and real estate investment trusts, that are traded on a securities exchange for which a last-quoted sales price is readily available generally are valued at the last sales price as reported by the primary exchange on which the securities are listed. Securities listed on The NASDAQ Stock Market (“NASDAQ”) generally are valued at the NASDAQ Official Closing Price, which may differ from the last sales price reported. Securities traded on a securities exchange for which a last-quoted sales price is not readily available generally are valued at the mean between the bid and ask prices. To the extent these securities are actively traded and valuation adjustments are not applied, they are classified in Level 1 of the fair value hierarchy. Securities traded on foreign exchanges generally are not valued at the same time the Fund calculates its NAV because most foreign markets close well before such time. The earlier close of most foreign markets gives rise to the possibility that significant events, including broad market moves, may have occurred in the interim. In certain circumstances, it may be determined that a foreign security needs to be fair valued because it appears that the value of the security might have been materially affected by events occurring after the close of the market in which the security is principally traded, but before the time the Fund calculates its NAV, such as by a development that affects an entire market or region (e.g., a weather-related event) or a potentially global development (e.g., a terrorist attack that may be expected to have an effect on investor expectations worldwide). |
| | |
| | Registered Investment Companies – Investments in open-end registered investment companies, commonly referred to as mutual funds, generally are priced at the ending NAV provided by the applicable mutual fund’s service agent and are classified in Level 1 of the fair value hierarchy. |
| NOTES TO THE FINANCIAL STATEMENTS |
| | Debt Securities – Debt securities, including corporate bonds, asset-backed securities, mortgage-backed securities, municipal bonds, U.S. Treasuries, and U.S. government agency issues, are generally valued at market on the basis of valuations furnished by an independent pricing service that utilizes both dealer-supplied valuations and formula-based techniques. The pricing service may consider recently executed transactions in securities of the issuer or comparable issuers, market price quotations (where observable), bond spreads, and fundamental data relating to the issuer. In addition, the model may incorporate observable market data, such as reported sales of similar securities, broker quotes, yields, bids, offers, and reference data. Certain securities are valued primarily using dealer quotations. These securities are generally classified in Level 2 of the fair value hierarchy. |
| | |
| | Short-Term Securities – Short-term equity investments, including money market funds, are valued in the manner specified above for equity securities. Short-term debt investments with an original term to maturity of 60 days or less are valued at amortized cost, which approximates fair market value. If the original term to maturity of a short-term debt investment exceeds 60 days, then the values as of the 61st day prior to maturity are amortized. Amortized cost is not used if its use would be inappropriate due to credit or other impairments of the issuer, in which case the security’s fair value would be determined as described below. Short-term securities are generally classified in Level 1 or Level 2 of the fair value hierarchy depending on the inputs used and market activity levels for specific securities. |
The Board of Trustees of the Fund (the “Board”) has adopted fair value pricing procedures that are followed when a price for a security is not readily available or if a significant event has occurred that indicates the closing price of a security no longer represents the true value of that security. Fair value pricing determinations are made in good faith in accordance with these procedures. There are numerous criteria considered in determining a fair value of a security, such as the trading volume of a security and markets, the values of other similar securities, and news events with direct bearing on a security or markets. Fair value pricing results in an estimated price for a security that reflects the amount the Fund might reasonably expect to receive in a current sale. Depending on the relative significance of the valuation inputs, these securities may be classified in either Level 2 or Level 3 of the fair value hierarchy.
The fair value of foreign securities may be determined with the assistance of a pricing service using correlations between the movement of prices of such securities and indices of domestic securities and other appropriate indicators, such as closing market prices of relevant American Depositary Receipts or futures contracts. Using fair value pricing means that the Fund’s NAV reflects the affected portfolio securities’ values as determined by the Board or its designee, pursuant to the fair value pricing procedures adopted by the Board, instead of being determined by the market. Using a fair value pricing methodology to price a foreign security may result in a value that is different from such foreign security’s most recent closing price and from the value used by other investment companies to calculate their NAVs. Such securities are generally classified in Level 2 of the fair value hierarchy. Because the Fund may invest in foreign securities, the value of the Fund’s portfolio securities may change on days when a shareholder is unable to purchase or redeem Fund shares.
The Board has delegated day-to-day valuation matters to the Valuation and Liquidity Committee comprising representatives from Hennessy Advisors, Inc., the Fund’s investment advisor (the “Advisor”). The function of the Valuation and Liquidity Committee, among other things, is to value securities where current and reliable market quotations are not readily available. All actions taken by the Valuation and Liquidity Committee are reviewed by the Board.
| HENNESSY FUNDS | 1-800-966-4354 | |
The Fund has performed an analysis of all existing investments to determine the significance and character of all inputs to their fair value determinations. Various inputs are used to determine the value of the Fund’s investments. The inputs or methodology used for valuing securities are not necessarily an indication of the risk associated with investing in those securities. Details related to the fair value hierarchy of the Fund’s securities as of April 30, 2021, are included in the Schedule of Investments.
4). INVESTMENT TRANSACTIONS
Purchases and sales of investment securities (excluding government and short-term investments) for the Fund during the six months ended April 30, 2021, were $8,053,534 and $7,912,852, respectively.
There were no purchases or sales/maturities of long-term U.S. government securities for the Fund during the six months ended April 30, 2021.
5). INVESTMENT ADVISORY FEE AND OTHER TRANSACTIONS WITH AFFILIATES
The Advisor provides the Fund with investment advisory services under an Investment Advisory Agreement. The Advisor furnishes all investment advice, office space, and facilities and most of the personnel needed by the Fund. As compensation for its services, the Advisor is entitled to a monthly fee from the Fund. The fee is based on the average daily net assets of the Fund at an annual rate of 0.74%. The net investment advisory fees expensed by the Fund during the six months ended April 30, 2021, are included in the Statement of Operations.
The Advisor has contractually agreed to limit total annual operating expenses to 0.98% of the Fund’s net assets for both Investor Class shares and Institutional Class shares (excluding all federal, state and local taxes, interest, brokerage commissions, 12b-1 fees, shareholder servicing fees payable to the Advisor, extraordinary items, and acquired fund fees and expenses and other costs incurred in connection with the purchase and sale of securities) through February 28, 2022.
For three years following the date on which expenses were waived or incurred, the Advisor may recoup waived or reimbursed expenses from the Fund if total operating expenses, including such recoupment, does not exceed the expense limitation in effect (i) at the time the Advisor waived or reimbursed such expenses and (ii) at the time the Advisor recoups such expenses. As of April 30, 2021, expenses subject to potential recovery for Investor Class and Institutional Class shares and the fiscal years in which they expire were as follows:
| | | Fiscal Year | Fiscal Year | Fiscal Year | Fiscal Year | |
| | | 2021
| 2022
| 2023
| 2024
| Total |
| | Investor Class | $42,604 | $92,255 | $86,892 | $37,477 | $259,228 |
| | Institutional Class | $13,210 | $29,447 | $27,643 | $11,855 | $ 82,155 |
The Advisor did not recoup expenses from the Fund during the six months ended April 30, 2021.
The Board has approved a Shareholder Servicing Agreement for Investor Class shares of the Fund, which compensates the Advisor for the non-investment advisory services it provides to the Fund. The Shareholder Servicing Agreement provides for a monthly fee paid to the Advisor at an annual rate of 0.10% of the average daily net assets of the Fund attributable to Investor Class shares. The shareholder service fees expensed by the Fund during the six months ended April 30, 2021, are included in the Statement of Operations.
The Fund has adopted a plan pursuant to Rule 12b-1 under the Investment Company Act of 1940, as amended, that authorizes payments in connection with the distribution of Fund shares at an annual rate of up to 0.25% of the Fund’s average daily
| NOTES TO THE FINANCIAL STATEMENTS |
net assets attributable to Investor Class shares. Even though the authorized rate is up to 0.25%, the Fund is currently only using up to 0.15% of its average daily net assets attributable to Investor Class shares for such purpose. Amounts paid under the plan may be spent on any activities or expenses primarily intended to result in the sale of shares, including, but not limited to, advertising, shareholder account servicing, printing and mailing of prospectuses to other than current shareholders, printing and mailing of sales literature, and compensation for sales and marketing activities or to financial institutions and others, such as dealers and distributors. The distribution fees expensed by the Fund during the six months ended April 30, 2021, are included in the Statement of Operations.
The Fund has entered into agreements with various brokers, dealers, and financial intermediaries in connection with the sale of Fund shares. The agreements provide for periodic payments of sub-transfer agent expenses by the Fund to the brokers, dealers, and financial intermediaries for providing certain shareholder maintenance services. These shareholder services include the pre-processing and quality control of new accounts, shareholder correspondence, answering customer inquiries regarding account status, and facilitating shareholder telephone transactions. The sub-transfer agent fees expensed by the Fund during the six months ended April 30, 2021, are included in the Statement of Operations.
U.S. Bancorp Fund Services, LLC, d/b/a U.S. Bank Global Fund Services (“Fund Services”) provides the Fund with administrative, accounting, and transfer agent services. As administrator, Fund Services is responsible for activities such as (i) preparing various federal and state regulatory filings, reports, and returns for the Fund, (ii) preparing reports and materials to be supplied to the Board, (iii) monitoring the activities of the Fund’s custodian, transfer agent, and accountants, and (iv) coordinating the preparation and payment of the Fund’s expenses and reviewing the Fund’s expense accruals. U.S. Bank N.A., an affiliate of Fund Services, serves as the Fund’s custodian. The servicing agreements between the Trust, Fund Services, and U.S. Bank N.A. contain a fee schedule that is inclusive of administrative, accounting, custody, and transfer agent fees. The administrative, accounting, custody, and transfer agent fees expensed by the Fund during the six months ended April 30, 2021, are included in the Statement of Operations. Fund Services has voluntarily waived all or a portion of its fees for the Fund. The fees voluntarily waived by Fund Services during the six months ended April 30, 2021, are included in the Statement of Operations.
Quasar Distributors, LLC (“Quasar”), a wholly owned broker-dealer subsidiary of Foreside Financial Group, LLC, acts as the Fund’s principal underwriter in a continuous public offering of Fund shares.
The officers of the Fund are affiliated with the Advisor. With the exception of the Chief Compliance Officer and the Senior Compliance Officer, such officers receive no compensation from the Fund for serving in their respective roles. The Fund, along with the other funds in the Hennessy Funds family (collectively, the “Hennessy Funds”), makes reimbursement payments on an equal basis to the Advisor for a portion of the salary and benefits associated with the office of the Chief Compliance Officer and for all of the salary and benefits associated with the office of the Senior Compliance Officer. The compliance fees expensed by the Fund during the six months ended April 30, 2021, are included in the Statement of Operations.
6). GUARANTEES AND INDEMNIFICATIONS
Under the Hennessy Funds’ organizational documents, their officers and trustees are indemnified by the Hennessy Funds against certain liabilities arising out of the performance of their duties to the Hennessy Funds. Additionally, in the normal course of
| HENNESSY FUNDS | 1-800-966-4354 | |
business, the Hennessy Funds enter into contracts with service providers that contain general indemnification clauses. The Fund’s maximum exposure under these arrangements is unknown as this would involve future claims that may be made against the Fund that have not yet occurred. Currently, the Fund expects the risk of loss to be remote.
7). LINE OF CREDIT
The Fund has an uncommitted line of credit with the other Hennessy Funds in the amount of the lesser of (i) $100,000,000 or (ii) 33.33% of each Hennessy Fund’s net assets, or 30% for the Hennessy Gas Utility Fund and 10% for the Hennessy Balanced Fund. The line of credit is intended to provide any necessary short-term financing in connection with shareholder redemptions, subject to certain restrictions. The credit facility is with the Hennessy Funds’ custodian bank, U.S. Bank N.A. Borrowings under this arrangement bear interest at the bank’s prime rate and are secured by all of the Fund’s assets (as to its own borrowings only). During the six months ended April 30, 2021, the Fund did not have any borrowings outstanding under the line of credit.
8). FEDERAL TAX INFORMATION
As of October 31, 2020, the Fund’s most recent fiscal year end, the components of accumulated earnings (losses) for income tax purposes were as follows:
| | | Investments | |
| Cost of investments for tax purposes | | $ | 5,113,211 | |
| Gross tax unrealized appreciation | | $ | 1,023,207 | |
| Gross tax unrealized depreciation | | | (393,145 | ) |
| Net tax unrealized appreciation/(depreciation) | | $ | 630,062 | |
| Undistributed ordinary income | | $ | 239,745 | |
| Undistributed long-term capital gains | | | 430,870 | |
| Total distributable earnings | | $ | 670,615 | |
| Other accumulated gain/(loss) | | $ | — | |
| Total accumulated gain/(loss) | | $ | 1,300,677 | |
The difference between book-basis unrealized appreciation/depreciation and tax-basis unrealized appreciation/depreciation (as shown above) is attributable primarily to wash sales.
As of October 31, 2020, the Fund had no tax basis capital losses to offset future capital gains.
As of October 31, 2020, the Fund did not defer, on a tax basis, any late-year ordinary losses. Late-year ordinary losses are net ordinary losses incurred after December 31, 2019, but within the taxable year, that are deemed to arise on the first day of the Fund’s next taxable year.
During fiscal year 2021 (year to date) and fiscal year 2020, the tax character of distributions paid by the Fund was as follows:
| | | Six Months Ended | | | Year Ended | |
| | | April 30, 2021 | | | October 31, 2020 | |
Ordinary income(1) | | $ | 239,745 | | | $ | 61,675 | |
| Long-term capital gains | | | 429,765 | | | | 84,296 | |
| Total distributions | | $ | 669,510 | | | $ | 145,971 | |
(1) Ordinary income includes short-term capital gains.
| NOTES TO THE FINANCIAL STATEMENTS |
9). EVENTS SUBSEQUENT TO PERIOD END
Management has evaluated the Fund’s related events and transactions that occurred subsequent to April 30, 2021, through the date of issuance of the Fund’s financial statements. Management has determined that there were no subsequent events requiring recognition or disclosure in the financial statements.
| HENNESSY FUNDS | 1-800-966-4354 | |
Expense Example (Unaudited)
April 30, 2021
As a shareholder of the Fund, you incur ongoing costs, including management fees, service fees, and other Fund expenses. This Example is intended to help you understand your ongoing costs (in dollars) of investing in the Fund and to compare these costs with the ongoing costs of investing in other mutual funds. The Example is based on an investment of $1,000 invested at the beginning of the period and held for the entire period from November 1, 2020, through April 30, 2021.
Actual Expenses
In the table below, the first line under each of the “Investor Class” and “Institutional Class” headings provides information about actual account values and actual expenses for each share class. You may use this information, together with the amount you invested, to estimate the expenses that you paid over the period. Simply divide your account value by $1,000 (for example, an $8,600 account value divided by $1,000 = 8.6), then multiply the result by the number in the first line under the heading entitled “Expenses Paid During Period” to estimate the expenses you paid on your account during this period. Although the Fund charges no sales loads or transaction fees, you will be assessed fees for outgoing wire transfers, returned checks, and stop payment orders at prevailing rates charged by U.S. Bank Global Fund Services, the Fund’s transfer agent. If you request that a redemption be made by wire transfer, the Fund’s transfer agent charges a $15 fee. IRAs are charged a $15 annual maintenance fee (up to $30 maximum per shareholder for shareholders with multiple IRAs). The examples below include, but are not limited to, management, shareholder servicing, accounting, custody, and transfer agent fees. However, the examples below do not include portfolio trading commissions and related expenses.
Hypothetical Example for Comparison Purposes
In the table below, the second line under each of the “Investor Class” and “Institutional Class” headings provides information about hypothetical account values and hypothetical expenses based on the Fund’s actual expense ratio for each share class and an assumed rate of return of 5% per year before expenses, which is not the Fund’s actual return for such share class. The hypothetical account values and expenses may not be used to estimate the actual ending account balance or expenses you paid for the period. You may use this information to compare the ongoing costs of investing in the Fund and other funds. To do so, compare these 5% hypothetical examples with the 5% hypothetical examples that appear in the shareholder reports of the other funds. Please note that the expenses shown in the table are meant to highlight your ongoing costs only. Therefore, the second lines under “Investor Class” and “Institutional Class” headings are useful in comparing ongoing costs only and will not help you determine the relative total costs of owning different funds.
| | Beginning | Ending | |
| | Account Value | Account Value | Expenses Paid |
| | November 1, 2020 | April 30, 2021
| During Period(1) |
| Investor Class | | | |
| Actual | $1,000.00 | $1,419.80 | $7.38 |
| Hypothetical (5% return before expenses) | $1,000.00 | $1,018.70 | $6.16 |
| | | | |
| Institutional Class | | | |
| Actual | $1,000.00 | $1,421.30 | $5.88 |
| Hypothetical (5% return before expenses) | $1,000.00 | $1,019.93 | $4.91 |
(1) | Expenses are equal to the Fund’s annualized expense ratio of 1.23% for Investor Class shares or 0.98% for Institutional Class shares, as applicable, multiplied by the average account value over the period, multiplied by 181/365 days (to reflect the half-year period). |
| HENNESSY FUNDS | 1-800-966-4354 | |
How to Obtain a Copy of the Fund’s Proxy
Voting Policy and Proxy Voting Records
A description of the policies and procedures the Fund uses to determine how to vote proxies relating to portfolio securities is available without charge (1) by calling 1-800-966-4354, (2) on the Hennessy Funds’ website at www.hennessyfunds.com/proxy-voting/voting-policy, or (3) on the U.S. Securities and Exchange Commission’s (the “SEC”) website at www.sec.gov. The Fund’s proxy voting record is available without charge on both the Hennessy Funds’ website at www.hennessyfunds.com/proxy-voting/voting-record and the SEC’s website at www.sec.gov no later than August 31 for the prior 12 months ending June 30.
Availability of Quarterly Portfolio Schedule
The Fund files a complete schedule of portfolio holdings with the SEC for the first and third quarters of each fiscal year as an exhibit to its reports on Form N-PORT. The Fund’s Form N-PORT reports are available on the SEC’s website at www.sec.gov or on request by calling 1-800-966-4354.
Federal Tax Distribution Information (Unaudited)
For fiscal year 2020, certain dividends paid by the Fund may be subject to a maximum tax rate of 23.8%, as provided for by the Jobs and Growth Tax Relief Reconciliation Act of 2003. The percentage of dividends declared from ordinary income designated as qualified dividend income was 72.00%.
For corporate shareholders, the percent of ordinary income distributions that qualified for the corporate dividends received deduction for fiscal year 2020 was 0.00%.
The percentage of taxable ordinary income distributions that were designated as short-term capital gain distributions under Section 871(k)(2)(C) of the Internal Revenue Code of 1986, as amended, for the Fund was 98.92%.
Important Notice Regarding Delivery
of Shareholder Documents
To help keep the Fund’s costs as low as possible, we generally deliver a single copy of notices, shareholder reports, proxy statements, and prospectuses to shareholders who share an address and have the same last name. This process does not apply to account statements. You may request an individual copy of a shareholder document at any time. If you would like to receive separate mailings of shareholder documents, please call U.S. Bank Global Fund Services at 1-800-261-6950 or 1-414-765-4124, and individual delivery will begin within 30 days of your request. If your account is held through a financial institution or other intermediary, please contact such intermediary directly to request individual delivery.
Electronic Delivery
As permitted by SEC regulations, the Fund’s shareholder reports are made available on a website, and unless you sign up for eDelivery or elect to receive paper copies as detailed below, you will be notified by mail each time a report is posted and provided with a website link to access the report.
The Fund also offers shareholders the option to receive all notices, account statements, prospectuses, tax forms, and shareholder reports online. To sign up for eDelivery or change your delivery preference, please visit www.hennessyfunds.com/account.
To elect to receive paper copies of all future reports free of charge, please call U.S. Bank Global Fund Services at 1-800-261-6950 or 1-414-765-4124.
Subscribe to receive our team’s unique market and sector insights delivered to your inbox
www.hennessyfunds.com/subscribe
Follow us on social media
| PROXY VOTING — BOARD APPROVAL OF INVESTMENT ADVISORY AGREEMENT |
Board Approval of Investment Advisory
Agreement
At its meeting on March 10, 2021, the Board of Trustees of the Fund (the “Board,” and the members thereof, the “Trustees”) unanimously approved the continuation of the investment advisory agreement of the Fund with Hennessy Advisors, Inc. (the “Advisor”). As part of the process, the Trustees reviewed their fiduciary duties and the relevant factors for them to consider with respect to approving the advisory agreement. In addition, the Trustees who are not deemed “interested persons” (as defined by the Investment Company Act of 1940, as amended) of the Fund (the “Independent Trustees”) met in executive session to discuss the approval of the advisory agreement.
In advance of the meeting, the Advisor sent detailed information to the Trustees to assist them in their evaluation of the advisory agreement. This information included, but was not limited to, the following:
| | (1) | A memorandum from outside legal counsel that described the fiduciary duties of the Board with respect to approving the continuation of the advisory agreement and the relevant factors for consideration; |
| | | |
| | (2) | A memorandum from the Advisor that listed the factors relevant to the Board’s approval of the continuation of the advisory agreement and also referenced the documents that had been provided to help the Board assess each such factor; |
| | | |
| | (3) | The Advisor’s financial statements from its most recent Form 10-K and Form 10-Q; |
| | | |
| | (4) | A summary of the advisory agreement; |
| | | |
| | (5) | A recent Fund fact sheet, which included performance information over various periods; |
| | | |
| | (6) | An description of the range of services provided by the Advisor; |
| | | |
| | (7) | A peer expense comparison of the net expense ratio and investment advisory fee of the Fund; and |
| | | |
| | (8) | A memorandum from the Adviser regarding economies of scale. |
All of the factors discussed were considered as a whole by the Trustees and by the Independent Trustees meeting in executive session. The factors were viewed in their totality by the Trustees, with no single factor being the principal or determinative factor in the Trustees’ determination of whether to approve the continuation of the advisory agreement. The Trustees recognized that the management and fee arrangements for the Fund are the result of years of review and discussion between the Independent Trustees and the Advisor, that certain aspects of such arrangements may receive greater scrutiny in some years than in others, and that the Trustees’ conclusions may be based, in part, on their consideration of these same arrangements and information received during the course of the year and in prior years.
Prior to approving the continuation of the advisory agreement, the Trustees, including the Independent Trustees in executive session, considered, among other items:
| | (1) | The nature and quality of the advisory services provided by the Advisor; |
| | | |
| | (2) | A comparison of the fees and expenses of the Fund to other similar funds; |
| | | |
| | (3) | Whether economies of scale are recognized by the Fund; |
| | | |
| | (4) | The costs and profitability of the Fund to the Advisor; |
| | | |
| | (5) | The performance of the Fund; and |
| HENNESSY FUNDS | 1-800-966-4354 | |
| | (6) | Any benefits to the Advisor from serving as an investment advisor to the Fund (other than the advisory fee). |
The material considerations and determinations of the Trustees, including the Independent Trustees, were as follows:
| | (1) | The Trustees considered the services identified below that are provided by the Advisor. Based on this review, the Trustees concluded that the Advisor provides high-quality services to the Fund and noted that their overall confidence in the Advisor was high. The Trustees also concluded that they were satisfied with the nature, extent, and quality of the advisory services provided to the Fund by the Advisor and that the nature and extent of the services provided by the Advisor were appropriate to assure that the Fund’s operations are conducted in compliance with applicable laws, rules, and regulations. |
| | | (a) | The Advisor acts as the portfolio manager for the Fund. In this capacity, the Advisor does the following: |
| | | | (i) | manages the composition of the Fund’s portfolio, including the purchase, retention, and disposition of portfolio securities in accordance with the Fund’s investment objectives, policies, and restrictions; |
| | | | | |
| | | | (ii) | seeks best execution for the Fund’s portfolio; |
| | | | | |
| | | | (iii) | manages the use of soft dollars for the Fund; and |
| | | | | |
| | | | (iv) | manages proxy voting for the Fund. |
| | | (b) | The Advisor performs a daily reconciliation of portfolio positions and cash for the Fund. |
| | | | |
| | | (c) | The Advisor monitors the liquidity of each Fund. |
| | | | |
| | | (d) | The Advisor monitors the Fund’s compliance with its investment objectives and restrictions and federal securities laws. |
| | | | |
| | | (e) | The Advisor maintains a compliance program (including a code of ethics), conducts ongoing reviews of the compliance programs of the Fund’s service providers (including their codes of ethics, as appropriate), conducts on-site visits to the Fund’s service providers as feasible, monitors incidents of abusive trading practices, reviews Fund expense accruals, payments, and fixed expense ratios, evaluates insurance providers for fidelity bond, D&O/E&O insurance, and cybersecurity insurance coverage, manages regulatory examination compliance and responses, conducts employee compliance training, reviews reports provided by service providers, and maintains books and records. |
| | | | |
| | | (f) | The Advisor oversees service providers that provide accounting, administration, distribution, transfer agency, custodial, sales, marketing, public relations, audit, information technology, and legal services to the Fund. |
| | | | |
| | | (g) | The Advisor maintains in-house marketing and distribution departments on behalf of the Fund. |
| | | | |
| | | (h) | The Advisor prepares or directs the preparation of all regulatory filings for the Fund, including writing and annually updating the Fund’s prospectus and related documents. |
| | | | |
| | | (i) | For each annual report of the Fund, the Advisor prepares a written summary of the Fund’s performance during the most recent 12-month period. |
| BOARD APPROVAL OF INVESTMENT ADVISORY AGREEMENT |
| | | (j) | The Advisor oversees distribution of the Fund through third-party broker/dealers and independent financial institutions such as Charles Schwab, Inc., Fidelity, TD Ameritrade, and Pershing. The Advisor compensates, in part, a number of these third-party providers out of its own revenues. |
| | | | |
| | | (k) | The Advisor pays the incentive compensation of the Fund’s compliance officers and employs other staff, such as legal, marketing, national accounts, distribution, sales, administrative, and trading oversight personnel, as well as management executives. |
| | | | |
| | | (l) | The Advisor provides a quarterly compliance certification to the Board. |
| | | | |
| | | (m) | The Advisor prepares or reviews all Board materials, frequently presents to the Board and leads Board discussions, prepares or reviews all meeting minutes, and arranges for Board training and education. |
| | (2) | The Trustees compared the performance of the Fund to benchmark indices over various periods and also noted that the Trustees review and discuss reports comparing the investment performance of the Fund to various indices at each quarterly Board meeting. Based on such information, the Trustees determined that the Advisor manages the Fund in a manner materially consistent with its stated investment objective and style. The Trustees concluded that the performance of the Fund over various periods warranted continuation of the advisory agreement. |
| | | |
| | (3) | The Trustees reviewed the advisory fees and overall expense ratios of the Fund compared to other funds similar in asset size and investment objective to the Fund using data from Morningstar. As part of the discussion with management, the Trustees ensured that they understood and were comfortable with the criteria used to determine the mutual funds included in the Morningstar categories for purposes of the materials considered at the meeting. The Trustees determined that the advisory fee and overall expense ratio of the Fund falls within the range of the advisory fees and overall expense ratios of other comparable funds and concluded that they are reasonable and warranted continuation of the advisory agreement. |
| | | |
| | (4) | The Trustees also considered whether the Advisor was realizing economies of scale that it should share with the Fund’s shareholders. The Trustees noted that many of the expenses incurred to manage the Fund are asset-based fees, so the Advisor would not realize material economies of scale relating to those expenses as the assets of the Fund increase. For example, third-party platform fees increase as the Fund’s assets grow. The Trustees also considered the Advisor’s significant marketing efforts to promote the Funds and the Advisor’s agreement to waive fees or lower its management fees in certain circumstances. |
| | | |
| | (5) | The Trustees considered the profitability of the Advisor, including the impact of mutual fund platform fees on the Advisor’s profitability, and also considered the resources and revenues that the Advisor has put into managing and distributing the Fund. The Trustees then concluded that the profits of the Advisor are reasonable and not excessive when compared to profitability guidelines set forth in relevant court cases. |
| | | |
| | (6) | The Trustees considered the high level of professionalism and knowledge of the Advisor’s employees, along with a very low level of turnover, and concluded that this was beneficial to the Fund and its shareholders. |
| HENNESSY FUNDS | 1-800-966-4354 | |
| | (7) | The Trustees considered any benefits to the Advisor from serving as an advisor to the Fund (other than the advisory fee). The Trustees noted that the Advisor may derive ancillary benefits from, by way of example, its association with the Fund in the form of proprietary and third-party research products and services received from broker-dealers that execute portfolio trades for the Fund. The Trustees determined that any such products and services have been used for legitimate purposes relating to the Fund by providing assistance in the investment decision-making process. The Trustees concluded that any additional benefits realized by the Advisor from its relationship with the Fund were reasonable, which was based on, among other things, the Trustees’ finding that the research, analytical, statistical, and other information and services provided by brokers are merely supplemental to the Advisor’s own efforts in the performance of its duties under the advisory agreement. |
After reviewing the materials and information provided at the meeting, as well as other information regularly provided at the Board’s quarterly meetings throughout the year regarding the quality of services provided by the Advisor, the performance of the Fund, expense information, brokerage commissions information, the adequacy and efficacy of the Advisor’s written policies and procedures, other regulatory compliance issues, trading information and related matters, and other factors that the Trustees deemed relevant, the Trustees, including the Independent Trustees, approved the continuation of the advisory agreement.
| BOARD APPROVAL OF INVESTMENT ADVISORY AGREEMENT |
(This Page Intentionally Left Blank.)
For information, questions, or assistance, please call
The Hennessy Funds
1-800-966-4354 or 1-415-899-1555
INVESTMENT ADVISOR
Hennessy Advisors, Inc.
7250 Redwood Boulevard, Suite 200
Novato, California 94945
ADMINISTRATOR,
TRANSFER AGENT,
DIVIDEND PAYING AGENT, &
SHAREHOLDER SERVICING AGENT
U.S. Bancorp Fund Services, LLC
d/b/a U.S. Bank Global Fund Services
P.O. Box 701
Milwaukee, Wisconsin 53201-0701
CUSTODIAN
U.S. Bank N.A.
Custody Operations
1555 North River Center Drive, Suite 302
Milwaukee, Wisconsin 53212
TRUSTEES
Neil J. Hennessy
Robert T. Doyle
J. Dennis DeSousa
Gerald P. Richardson
COUNSEL
Foley & Lardner LLP
777 East Wisconsin Avenue
Milwaukee, Wisconsin 53202-5306
INDEPENDENT REGISTERED
PUBLIC ACCOUNTING FIRM
Tait, Weller & Baker LLP
Two Liberty Place
50 South 16th Street, Suite 2900
Philadelphia, Pennsylvania 19102-2529
DISTRIBUTOR
Quasar Distributors, LLC
111 East Kilbourn Avenue, Suite 2200
Milwaukee, Wisconsin 53202
www.hennessyfunds.com | 1-800-966-4354
This report has been prepared for shareholders and may be distributed to
others only if preceded or accompanied by a current prospectus.