As filed with the Securities and Exchange Commission on July 6, 2018
UNITED STATES
SECURITIES AND EXCHANGE COMMISSION
Washington, D.C. 20549
FORM N-CSR
CERTIFIED SHAREHOLDER REPORT OF REGISTERED
MANAGEMENT INVESTMENT COMPANIES
Investment Company Act file number (811-07168)
Hennessy Funds Trust
(Exact name of registrant as specified in charter)
7250 Redwood Blvd., Suite 200
Novato, CA 94945
(Address of principal executive offices) (Zip code)
Neil J. Hennessy
7250 Redwood Blvd., Suite 200
Novato, CA 94945
(Name and address of agent for service)
800-966-4354
Registrant’s telephone number, including area code
Date of fiscal year end: October 31, 2018
Date of reporting period: April 30, 2018
Item 1. Reports to Stockholders.
SEMI-ANNUAL REPORT
APRIL 30, 2018
HENNESSY CORNERSTONE
GROWTH FUND
Investor Class HFCGX
Institutional Class HICGX
hennessyfunds.com | 1-800-966-4354
(This Page Intentionally Left Blank.)
Contents
| Letter to Shareholders | | | 2 |
| Performance Overview | | | 4 |
| Financial Statements | | | |
| Schedule of Investments | | | 5 |
| Statement of Assets and Liabilities | | | 10 |
| Statement of Operations | | | 11 |
| Statements of Changes in Net Assets | | | 13 |
| Financial Highlights | | | 14 |
| Notes to the Financial Statements | | | 18 |
| Expense Example | | | 26 |
| Proxy Voting Policy and Proxy Voting Records | | | 28 |
| Quarterly Schedule of Investments | | | 28 |
| Important Notice Regarding Delivery of Shareholder Documents | | | 28 |
| Board Approval of Investment Advisory Agreement | | | 29 |
| HENNESSY FUNDS | 1-800-966-4354 | |
May 2018
Dear Hennessy Funds Shareholder:
Investors in the United States and abroad experienced the return of volatility in the six months ended April 30, 2018, especially during the second half of the period. Equities rallied sharply during the first half of the period and fell back during the second half, but nevertheless ended the period with solid gains, with the Dow Jones Industrial Average posting a total return of 4.5% and the S&P 500 Index up 3.8%. Over the past year, I have repeatedly shared my belief that the stock market was due for a correction, but that it would bounce back, as it has so many times during the current bull market.
In the closing months of 2017 and into January 2018, U.S. equities rallied in response to the enactment of the Tax Cuts and Jobs Act of 2017, which significantly lowered corporate tax rates. Investors were also encouraged by two quarters of real GDP growth of 3.2% and 2.9%. However, equity prices quickly lost ground in reaction to the imposition of trade tariffs on steel and aluminum, and fears that additional proposed tariffs could provoke a trade war with China. Signals from the Federal Reserve that the pace of interest rate increases would move slightly higher also weighed on investors. During the period, the federal funds rate was raised twice, by a quarter point each time, in December 2017 and March 2018.
The current bull market in U.S. equities is now entering its 10th year, and we remain optimistic about the outlook for stock prices. In our opinion, economic fundamentals look positive. The U.S. economy is growing at a solid pace of 2 – 3% annually, inflation is low, and high employment levels are supporting healthy growth in consumption. Wages are rising, but the rate of increase has remained steady at around 2.6% per year since mid-2016. While it appears that the Federal Reserve will continue to raise the federal funds rate and normalize monetary policy, we believe it will be able to do so gradually, avoiding a severe jolt to either financial markets or the economy. Meanwhile, companies continue to report robust earnings growth, boosted this year by lower tax rates.
We believe U.S. equities remain attractively valued. U.S. long bond yields are hovering near 3%, having risen over the period in response to strong economic activity. Prospective PE multiples, however, have dropped significantly since the end of 2017, the result of a combination of lower taxes, higher operating earnings, and lower stock prices. The Dow Jones Industrial Average and the S&P 500 Index are trading at about 17x forward earnings, down from approximately 20x at the beginning of the calendar year, valuations we believe to be very reasonable.
We are not overly concerned about recent protectionist actions by the U.S. administration. We consider the announcements and ongoing discussions regarding import tariffs and NAFTA to be representative of standard Trump deal-making tactics – make far-reaching demands and then negotiate a reasonable outcome that is beneficial to both sides. We expect continued pro-business policies and regulatory relief to be enacted by our leaders in Washington.
Finally, as noted many times in past letters during this bull market, the euphoria that has historically accompanied a peak in the market continues to be absent. Investors today are worried about many things, including higher interest rates, larger budget deficits, higher import tariffs, and political distractions. But they are definitely not euphoric. In the past, I have likened the current bull market to the 1982-2000 bull market, and I continue
HENNESSYFUNDS.COM
to believe the comparison is a good one. We remain confident that the market will be able to weather the current period of volatility and that the economy, despite higher interest rates and possible trade disruptions, is resilient enough to continue its steady growth into the coming year.
Thank you for your continued confidence and investment in the Hennessy Funds. If you have any questions or would like to speak with us directly, please don’t hesitate to call us at (800) 966-4354.
Best regards,
Neil J. Hennessy
President and Chief Investment Officer
Past performance does not guarantee future results.
Mutual fund investing involves risk. Principal loss is possible.
Opinions expressed are those of Neil Hennessy and are subject to change, are not guaranteed, and should not be considered investment advice.
The Dow Jones Industrial Average and S&P 500 Index are unmanaged indices commonly used to measure the performance of U.S. stocks. One cannot invest directly in an index.
Price to earnings (PE) is calculated by dividing a company’s market price per share by its earnings per share. Earnings growth is not a measure of a fund’s future performance.
| HENNESSY FUNDS | 1-800-966-4354 | |
Performance Overview (Unaudited)
AVERAGE ANNUAL TOTAL RETURN FOR PERIODS ENDED APRIL 30, 2018
| | Six | One | Five | Ten |
| | Months(1) | Year | Years | Years |
| Hennessy Cornerstone Growth Fund – | | | | |
| Investor Class (HFCGX) | -2.69% | 13.80% | 11.19% | 5.88% |
| Hennessy Cornerstone Growth Fund – | | | | |
| Institutional Class (HICGX) | -2.54% | 14.14% | 11.51% | 6.20% |
Russell 2000® Index | 3.27% | 11.54% | 11.74% | 9.49% |
| S&P 500 Index | 3.82% | 13.27% | 12.96% | 9.02% |
Expense ratios: 1.30% (Investor Class); 0.97% (Institutional Class)
(1) | Periods less than one year are not annualized. |
Performance data quoted represents past performance; past performance does not guarantee future results. The investment return and principal value of an investment will fluctuate so that an investor’s shares, when redeemed, may be worth more or less than their original cost. The performance table does not reflect the deduction of taxes that a shareholder would pay on Fund distributions or the redemption of Fund shares. Current performance of the Fund may be lower or higher than the performance quoted. Performance data current to the most recent month end may be obtained by visiting hennessyfunds.com.
The Russell 2000® Index is an index commonly used to measure the performance of U.S. small-capitalization stocks. The S&P 500 Index is an unmanaged index commonly used to measure the performance of U.S. stocks. One cannot invest directly in an index.
Frank Russell Company (“Russell”) is the source and owner of the trademarks, service marks, and copyrights related to the Russell Indexes. Russell® is a trademark of Frank Russell Company. Neither Russell nor its licensors accept any liability for any errors or omissions in the Russell Indexes or Russell ratings or underlying data and no party may rely on any Russell Indexes or Russell ratings or underlying data contained in this communication. No further distribution of Russell data is permitted without Russell’s express written consent. Russell does not promote, sponsor, or endorse the content of this communication.
The expense ratios presented are from the most recent prospectus. The expense ratios for the current reporting period are available in the Financial Highlights section of this report.
HENNESSYFUNDS.COM
| PERFORMANCE OVERVIEW/SCHEDULE OF INVESTMENTS |
Financial Statements
Schedule of Investments as of April 30, 2018 (Unaudited) |
HENNESSY CORNERSTONE GROWTH FUND
(% of Net Assets)
| TOP TEN HOLDINGS (EXCLUDING CASH/CASH EQUIVALENTS) | % NET ASSETS |
| Enova International, Inc. | 2.57% |
| Comtech Telecommunications Corp. | 2.57% |
| Insperity, Inc. | 2.42% |
| Providence Service Corp. | 2.34% |
| AMN Healthcare Services, Inc. | 2.30% |
| Crocs, Inc. | 2.30% |
| Boot Barn Holdings, Inc. | 2.26% |
| Marathon Petroleum Corp. | 2.22% |
| Burlington Stores, Inc. | 2.21% |
| Penn National Gaming, Inc. | 2.19% |
Note: For presentation purposes, the Fund has grouped some of the industry categories. For purposes of categorizing securities for compliance with Section 8(b)(1) of the Investment Company Act of 1940, as amended, the Fund uses more specific industry classifications.
The Global Industry Classification Standard (GICS®) was developed by and is the exclusive property and a service mark of MSCI, Inc. and Standard & Poor Financial Services LLC. It has been licensed for use by the Hennessy Funds.
| HENNESSY FUNDS | 1-800-966-4354 | |
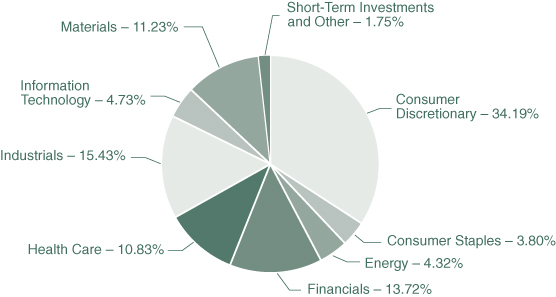
| COMMON STOCKS – 98.25% | | Number | | | | | | % of | |
| | | of Shares | | | Value | | | Net Assets | |
| Consumer Discretionary – 34.19% | | | | | | | | | |
| Best Buy Co., Inc. | | | 56,000 | | | $ | 4,285,680 | | | | 2.12 | % |
| Boot Barn Holdings, Inc. (a) | | | 233,600 | | | | 4,571,552 | | | | 2.26 | % |
| Burlington Stores, Inc. (a) | | | 32,800 | | | | 4,455,880 | | | | 2.21 | % |
| Callaway Golf Co. | | | 253,900 | | | | 4,382,314 | | | | 2.17 | % |
| Conn’s, Inc. (a) | | | 127,700 | | | | 3,256,350 | | | | 1.61 | % |
| Crocs, Inc. (a) | | | 294,900 | | | | 4,659,420 | | | | 2.30 | % |
| Dollar Tree, Inc. (a) | | | 37,500 | | | | 3,595,875 | | | | 1.78 | % |
| Fiat Chrysler Automobiles N.V. (a)(b) | | | 180,300 | | | | 3,935,949 | | | | 1.95 | % |
| KB Home | | | 129,700 | | | | 3,443,535 | | | | 1.70 | % |
| Kohl’s Corp. | | | 62,500 | | | | 3,882,500 | | | | 1.92 | % |
| Lear Corp. | | | 20,700 | | | | 3,870,279 | | | | 1.92 | % |
| Live Nation Entertainment, Inc. (a) | | | 83,700 | | | | 3,303,639 | | | | 1.64 | % |
| Penn National Gaming, Inc. (a) | | | 146,000 | | | | 4,425,260 | | | | 2.19 | % |
| Qurate Retail, Inc. QVC Group (a) | | | 140,800 | | | | 3,296,128 | | | | 1.63 | % |
| Regis Corp. (a) | | | 241,300 | | | | 3,769,106 | | | | 1.87 | % |
| Sleep Number Corp. (a) | | | 109,900 | | | | 3,114,566 | | | | 1.54 | % |
| The Children’s Place, Inc. | | | 27,400 | | | | 3,494,870 | | | | 1.73 | % |
| Vipshop Holdings Ltd. – ADR (a)(b) | | | 215,700 | | | | 3,339,036 | | | | 1.65 | % |
| | | | | | | | 69,081,939 | | | | 34.19 | % |
| | | | | | | | | | | | | |
| Consumer Staples – 3.80% | | | | | | | | | | | | |
| Nomad Foods Ltd. (a)(b) | | | 235,200 | | | | 3,878,448 | | | | 1.92 | % |
| Sprouts Farmers Market, Inc. (a) | | | 151,800 | | | | 3,799,554 | | | | 1.88 | % |
| | | | | | | | 7,678,002 | | | | 3.80 | % |
| | | | | | | | | | | | | |
| Energy – 4.32% | | | | | | | | | | | | |
| CVR Energy, Inc. | | | 122,700 | | | | 4,233,150 | | | | 2.10 | % |
| Marathon Petroleum Corp. | | | 59,900 | | | | 4,487,109 | | | | 2.22 | % |
| | | | | | | | 8,720,259 | | | | 4.32 | % |
| | | | | | | | | | | | | |
| Financials – 13.72% | | | | | | | | | | | | |
| Enova International, Inc. (a) | | | 177,500 | | | | 5,200,750 | | | | 2.57 | % |
| EZCORP, Inc., Class A (a) | | | 300,500 | | | | 4,116,850 | | | | 2.04 | % |
| First American Financial Corp. | | | 69,400 | | | | 3,547,034 | | | | 1.76 | % |
| LPL Financial Holdings, Inc. | | | 62,700 | | | | 3,797,739 | | | | 1.88 | % |
| PennyMac Financial Services, Inc., Class A (a) | | | 161,900 | | | | 3,335,140 | | | | 1.65 | % |
| Progressive Corp. | | | 69,400 | | | | 4,184,126 | | | | 2.07 | % |
The accompanying notes are an integral part of these financial statements.
HENNESSYFUNDS.COM
| COMMON STOCKS | | Number | | | | | | % of | |
| | | of Shares | | | Value | | | Net Assets | |
| Financials (Continued) | | | | | | | | | |
| The Carlyle Group LP | | | 172,400 | | | $ | 3,534,200 | | | | 1.75 | % |
| | | | | | | | 27,715,839 | | | | 13.72 | % |
| | | | | | | | | | | | | |
| Health Care – 10.83% | | | | | | | | | | | | |
| AMN Healthcare Services, Inc. (a) | | | 69,700 | | | | 4,659,445 | | | | 2.30 | % |
| Anthem, Inc. | | | 17,100 | | | | 4,035,429 | | | | 2.00 | % |
| Centene Corp. (a) | | | 39,600 | | | | 4,299,768 | | | | 2.13 | % |
| Providence Service Corp. (a) | | | 62,300 | | | | 4,727,324 | | | | 2.34 | % |
| UnitedHealth Group, Inc. | | | 17,600 | | | | 4,160,640 | | | | 2.06 | % |
| | | | | | | | 21,882,606 | | | | 10.83 | % |
| | | | | | | | | | | | | |
| Industrials – 15.43% | | | | | | | | | | | | |
| CBIZ, Inc. (a) | | | 221,000 | | | | 4,110,600 | | | | 2.03 | % |
| CNH Industrial N.V. (b) | | | 281,100 | | | | 3,443,475 | | | | 1.70 | % |
| Insperity, Inc. | | | 60,800 | | | | 4,879,200 | | | | 2.42 | % |
| MasTec, Inc. (a) | | | 78,300 | | | | 3,445,200 | | | | 1.71 | % |
| Saia, Inc. (a) | | | 54,400 | | | | 3,593,120 | | | | 1.78 | % |
| SPX FLOW, Inc. (a) | | | 83,700 | | | | 3,766,500 | | | | 1.86 | % |
| Titan Machinery, Inc. (a) | | | 198,700 | | | | 3,838,884 | | | | 1.90 | % |
| XPO Logistics, Inc. (a) | | | 42,200 | | | | 4,100,152 | | | | 2.03 | % |
| | | | | | | | 31,177,131 | | | | 15.43 | % |
| | | | | | | | | | | | | |
| Information Technology – 4.73% | | | | | | | | | | | | |
| Comtech Telecommunications Corp. | | | 169,600 | | | | 5,188,064 | | | | 2.57 | % |
| Mantech International Corp., Class A | | | 74,000 | | | | 4,372,660 | | | | 2.16 | % |
| | | | | | | | 9,560,724 | | | | 4.73 | % |
| | | | | | | | | | | | | |
| Materials – 11.23% | | | | | | | | | | | | |
| Alcoa Corp. (a) | | | 83,400 | | | | 4,270,080 | | | | 2.11 | % |
| Boise Cascade Co. | | | 91,300 | | | | 3,798,080 | | | | 1.88 | % |
| Constellium N.V., Class A (a)(b) | | | 325,100 | | | | 3,689,885 | | | | 1.83 | % |
| Huntsman Corp. | | | 118,100 | | | | 3,515,837 | | | | 1.74 | % |
| Schnitzer Steel Industries, Inc., Class A | | | 113,200 | | | | 3,333,740 | | | | 1.65 | % |
| Verso Corp. (a) | | | 226,300 | | | | 4,086,978 | | | | 2.02 | % |
| | | | | | | | 22,694,600 | | | | 11.23 | % |
| | | | | | | | | | | | | |
| Total Common Stocks | | | | | | | | | | | | |
| (Cost $197,555,038) | | | | | | | 198,511,100 | | | | 98.25 | % |
The accompanying notes are an integral part of these financial statements.
| HENNESSY FUNDS | 1-800-966-4354 | |
| RIGHTS – 0.00% | | Number | | | | | | % of | |
| | | of Shares | | | Value | | | Net Assets | |
| Health Care – 0.00% | | | | | | | | | |
| Forest Laboratories, Inc. (a)(c) | | | 5,500 | | | $ | 55 | | | | 0.00 | % |
| | | | | | | | | | | | | |
| Total Rights | | | | | | | | | | | | |
| (Cost $0) | | | | | | | 55 | | | | 0.00 | % |
| | | | | | | | | | | | | |
| SHORT-TERM INVESTMENTS – 1.96% | | | | | | | | | | | | |
| | | | | | | | | | | | | |
| Money Market Funds – 1.96% | | | | | | | | | | | | |
| Fidelity Government Portfolio, Institutional Class, 1.58% (d) | | | 3,966,017 | | | | 3,966,017 | | | | 1.96 | % |
| | | | | | | | | | | | | |
| Total Short-Term Investments | | | | | | | | | | | | |
| (Cost $3,966,017) | | | | | | | 3,966,017 | | | | 1.96 | % |
| | | | | | | | | | | | | |
| Total Investments | | | | | | | | | | | | |
| (Cost $201,521,055) – 100.21% | | | | | | | 202,477,172 | | | | 100.21 | % |
| Liabilities in Excess of Other Assets – (0.21)% | | | | | | | (433,284 | ) | | | (0.21 | )% |
| | | | | | | | | | | | | |
TOTAL NET ASSETS – 100.00% | | | | | | $ | 202,043,888 | | | | 100.00 | % |
Percentages are stated as a percent of net assets.
ADR – American Depositary Receipt
| (a) | Non-income producing security. |
| (b) | U.S. traded security of a foreign corporation |
| (c) | Security is fair valued in good faith and is deemed a Level 3 investment because it is valued using significant unobservable inputs.. |
| (d) | The rate listed is the fund’s seven-day yield as of April 30, 2018. |
The accompanying notes are an integral part of these financial statements.
HENNESSYFUNDS.COM
Summary of Fair Value Exposure at April 30, 2018
The following is a summary of the inputs used to value the Fund’s net assets as of April 30, 2018 (See Note 3 in the accompanying notes to the financial statements):
| Common Stocks | | Level 1 | | | Level 2 | | | Level 3 | | | Total | |
| Consumer Discretionary | | $ | 69,081,939 | | | $ | — | | | $ | — | | | $ | 69,081,939 | |
| Consumer Staples | | | 7,678,002 | | | | — | | | | — | | | | 7,678,002 | |
| Energy | | | 8,720,259 | | | | — | | | | — | | | | 8,720,259 | |
| Financials | | | 27,715,839 | | | | — | | | | — | | | | 27,715,839 | |
| Health Care | | | 21,882,606 | | | | — | | | | — | | | | 21,882,606 | |
| Industrials | | | 31,177,131 | | | | — | | | | — | | | | 31,177,131 | |
| Information Technology | | | 9,560,724 | | | | — | | | | — | | | | 9,560,724 | |
| Materials | | | 22,694,600 | | | | — | | | | — | | | | 22,694,600 | |
| Total Common Stocks | | $ | 198,511,100 | | | $ | — | | | $ | — | | | $ | 198,511,100 | |
| Rights | | | | | | | | | | | | | | | | |
| Health Care | | $ | — | | | $ | — | | | $ | 55 | * | | $ | 55 | |
| Total Rights | | $ | — | | | $ | — | | | $ | 55 | | | $ | 55 | |
| Short-Term Investments | | | | | | | | | | | | | | | | |
| Money Market Funds | | $ | 3,966,017 | | | $ | — | | | $ | — | | | $ | 3,966,017 | |
| Total Short-Term Investments | | $ | 3,966,017 | | | $ | — | | | $ | — | | | $ | 3,966,017 | |
| Total Investments | | $ | 202,477,117 | | | $ | — | | | $ | 55 | | | $ | 202,477,172 | |
* Acquired in merger.
Transfers between levels are recognized at the end of the reporting period. During the six-month period ended April 30, 2018, the Fund recognized no transfers between levels.
Level 3 Reconciliation Disclosure
Following is a reconciliation of Level 3 assets for which significant unobservable inputs were used to determine fair value.
| | | Rights | |
| Balance as of October 31, 2017 | | $ | 55 | |
| Accrued discounts/premiums | | | — | |
| Realized gain (loss) | | | — | |
| Change in unrealized appreciation (depreciation) | | | — | |
| Purchases | | | — | |
| (Sales) | | | — | |
| Transfer in and/or out of Level 3 | | | — | |
| Balance as of April 30, 2018 | | $ | 55 | |
| | | | | |
| Change in unrealized appreciation/depreciation during the period for | | | | |
| Level 3 investments held at April 30, 2018 | | $ | — | |
The Level 3 investments as of April 30, 2018, represented 0.00% of net assets and did not warrant a disclosure of significant unobservable inputs.
The accompanying notes are an integral part of these financial statements.
| HENNESSY FUNDS | 1-800-966-4354 | |
Financial Statements
Statement of Assets and Liabilities as of April 30, 2018 (Unaudited) |
| ASSETS: | | | |
| Investments in securities, at value (cost $201,521,055) | | $ | 202,477,172 | |
| Dividends and interest receivable | | | 63,509 | |
| Receivable for fund shares sold | | | 4,825 | |
| Prepaid expenses and other assets | | | 31,433 | |
| Total Assets | | | 202,576,939 | |
| | | | | |
| LIABILITIES: | | | | |
| Payable for fund shares redeemed | | | 175,438 | |
| Payable to advisor | | | 123,561 | |
| Payable to administrator | | | 32,915 | |
| Payable to auditor | | | 9,721 | |
| Accrued distribution fees | | | 126,138 | |
| Accrued service fees | | | 14,770 | |
| Accrued trustees fees | | | 5,070 | |
| Accrued expenses and other payables | | | 45,438 | |
| Total Liabilities | | | 533,051 | |
| NET ASSETS | | $ | 202,043,888 | |
| | | | | |
| NET ASSETS CONSIST OF: | | | | |
| Capital stock | | $ | 175,246,176 | |
| Accumulated net investment loss | | | (1,542,624 | ) |
| Accumulated net realized gain on investments | | | 27,384,911 | |
| Unrealized net appreciation on investments | | | 955,425 | |
| Total Net Assets | | $ | 202,043,888 | |
| | | | | |
| NET ASSETS | | | | |
| Investor Class: | | | | |
| Shares authorized (no par value) | | Unlimited | |
| Net assets applicable to outstanding Investor Class shares | | $ | 178,711,891 | |
| Shares issued and outstanding | | | 7,604,472 | |
| Net asset value, offering price and redemption price per share | | $ | 23.50 | |
| | | | | |
| Institutional Class: | | | | |
| Shares authorized (no par value) | | Unlimited | |
| Net assets applicable to outstanding Institutional Class shares | | $ | 23,331,997 | |
| Shares issued and outstanding | | | 963,653 | |
| Net asset value, offering price and redemption price per share | | $ | 24.21 | |
The accompanying notes are an integral part of these financial statements.
HENNESSYFUNDS.COM
| STATEMENT OF ASSETS AND LIABILITIES/STATEMENT OF OPERATIONS |
Financial Statements
Statement of Operations for the six months ended April 30, 2018 (Unaudited) |
| INVESTMENT INCOME: | | | |
Dividend income(1) | | $ | 569,749 | |
| Interest income | | | 26,769 | |
| Total investment income | | | 596,518 | |
| | | | | |
| EXPENSES: | | | | |
| Investment advisory fees (See Note 5) | | | 788,303 | |
| Sub-transfer agent expenses – Investor Class (See Note 5) | | | 139,929 | |
| Sub-transfer agent expenses – Institutional Class (See Note 5) | | | 7,945 | |
| Distribution fees – Investor Class (See Note 5) | | | 139,929 | |
| Administration, fund accounting, custody and transfer agent fees (See Note 5) | | | 100,198 | |
| Service fees – Investor Class (See Note 5) | | | 93,286 | |
| Federal and state registration fees | | | 16,990 | |
| Compliance expense (See Note 5) | | | 14,628 | |
| Reports to shareholders | | | 12,447 | |
| Audit fees | | | 10,969 | |
| Trustees’ fees and expenses | | | 9,377 | |
| Interest expense (See Note 7) | | | 355 | |
| Other expenses | | | 7,937 | |
| Total expenses | | | 1,342,293 | |
| NET INVESTMENT LOSS | | $ | (745,775 | ) |
| | | | | |
| REALIZED AND UNREALIZED GAINS: | | | | |
| Net realized gain on investments | | $ | 27,387,007 | |
| Net change in unrealized appreciation on investments | | | (32,414,086 | ) |
| Net loss on investments | | | (5,027,079 | ) |
| NET DECREASE IN NET ASSETS RESULTING FROM OPERATIONS | | $ | (5,772,854 | ) |
(1) | Net of foreign taxes withheld and issuance fees of $11,564. |
The accompanying notes are an integral part of these financial statements.
| HENNESSY FUNDS | 1-800-966-4354 | |
(This Page Intentionally Left Blank.)
HENNESSYFUNDS.COM
| STATEMENTS OF CHANGES IN NET ASSETS |
Financial Statements
| Statements of Changes in Net Assets |
| | | Six Months Ended | | | | |
| | | April 30, 2018 | | | Year Ended | |
| | | (Unaudited) | | | October 31, 2017 | |
| OPERATIONS: | | | | | | |
| Net investment loss | | $ | (745,775 | ) | | $ | (615,891 | ) |
| Net realized gain on investments | | | 27,387,007 | | | | 25,408,962 | |
| Net change in unrealized appreciation on investments | | | (32,414,086 | ) | | | 26,412,588 | |
| Net increase (decrease) in net assets | | | | | | | | |
| resulting from operations | | | (5,772,854 | ) | | | 51,205,659 | |
| | | | | | | | | |
| CAPITAL SHARE TRANSACTIONS: | | | | | | | | |
| Proceeds from shares subscribed – Investor Class | | | 2,087,487 | | | | 5,154,765 | |
| Proceeds from shares subscribed – Institutional Class | | | 817,261 | | | | 6,572,602 | |
| Cost of shares redeemed – Investor Class | | | (15,462,705 | ) | | | (37,414,723 | ) |
| Cost of shares redeemed – Institutional Class | | | (8,486,489 | ) | | | (7,012,794 | ) |
| Net decrease in net assets derived | | | | | | | | |
| from capital share transactions | | | (21,044,446 | ) | | | (32,700,150 | ) |
| TOTAL INCREASE (DECREASE) IN NET ASSETS | | | (26,817,300 | ) | | | 18,505,509 | |
| | | | | | | | | |
| NET ASSETS: | | | | | | | | |
| Beginning of period | | | 228,861,188 | | | | 210,355,679 | |
| End of period | | $ | 202,043,888 | | | $ | 228,861,188 | |
| Undistributed net investment loss, end of period | | $ | (1,542,624 | ) | | $ | (796,849 | ) |
| | | | | | | | | |
| CHANGES IN SHARES OUTSTANDING: | | | | | | | | |
| Shares sold – Investor Class | | | 87,289 | | | | 233,860 | |
| Shares sold – Institutional Class | | | 32,627 | | | | 279,691 | |
| Shares redeemed – Investor Class | | | (646,541 | ) | | | (1,795,884 | ) |
| Shares redeemed – Institutional Class | | | (342,548 | ) | | | (328,917 | ) |
| Net decrease in shares outstanding | | | (869,173 | ) | | | (1,611,250 | ) |
The accompanying notes are an integral part of these financial statements.
| HENNESSY FUNDS | 1-800-966-4354 | |
Financial Statements
For an Investor Class share outstanding throughout each period
| | Six Months Ended | |
| | April 30, 2018 | |
| | (Unaudited) | |
| PER SHARE DATA: | | | | |
| Net asset value, beginning of period | | $ | 24.16 | | |
| | | | | | |
| Income from investment operations: | | | | | |
| Net investment income (loss) | | | (0.10 | ) | |
| Net realized and unrealized gains (losses) on investments | | | (0.56 | ) | |
| Total from investment operations | | | (0.66 | ) | |
| | | | | | |
| Less distributions: | | | | | |
| Dividends from net investment income | | | — | | |
| Total distributions | | | — | | |
| Net asset value, end of period | | $ | 23.50 | | |
| | | | | | |
| TOTAL RETURN | | | (2.69 | )%(1) | |
| | | | | | |
| SUPPLEMENTAL DATA AND RATIOS: | | | | | |
| Net assets, end of period (millions) | | $ | 178.71 | | |
| Ratio of expenses to average net assets | | | 1.30 | %(2) | |
| Ratio of net investment income (loss) to average net assets | | | (0.74 | )%(2) | |
Portfolio turnover rate(3) | | | 93 | %(1) | |
(1) | Not annualized. |
(2) | Annualized. |
(3) | Portfolio turnover is calculated on the basis of the Fund as a whole. |
The accompanying notes are an integral part of these financial statements.
HENNESSYFUNDS.COM
| FINANCIAL HIGHLIGHTS — INVESTOR CLASS |
| Year Ended October 31, | |
| 2017 | | | 2016 | | | 2015 | | | 2014 | | | 2013 | |
| | | | | | | | | | | | | | |
| $ | 18.98 | | | $ | 20.00 | | | $ | 18.68 | | | $ | 15.65 | | | $ | 12.38 | |
| | | | | | | | | | | | | | | | | | | |
| | | | | | | | | | | | | | | | | | | |
| | (0.09 | ) | | | (0.02 | ) | | | 0.06 | | | | (0.04 | ) | | | (0.11 | ) |
| | 5.27 | | | | (0.98 | ) | | | 1.26 | | | | 3.07 | | | | 3.38 | |
| | 5.18 | | | | (1.00 | ) | | | 1.32 | | | | 3.03 | | | | 3.27 | |
| | | | | | | | | | | | | | | | | | | |
| | | | | | | | | | | | | | | | | | | |
| | — | | | | (0.02 | ) | | | — | | | | — | | | | — | |
| | — | | | | (0.02 | ) | | | — | | | | — | | | | — | |
| $ | 24.16 | | | $ | 18.98 | | | $ | 20.00 | | | $ | 18.68 | | | $ | 15.65 | |
| | | | | | | | | | | | | | | | | | | |
| | 27.29 | % | | | (5.00 | )% | | | 7.07 | % | | | 19.36 | % | | | 26.41 | % |
| | | | | | | | | | | | | | | | | | | |
| | | | | | | | | | | | | | | | | | | |
| $ | 197.22 | | | $ | 184.61 | | | $ | 248.74 | | | $ | 227.68 | | | $ | 220.83 | |
| | 1.30 | % | | | 1.32 | % | | | 1.15 | % | | | 1.23 | % | | | 1.29 | % |
| | (0.33 | )% | | | (0.18 | )% | | | 0.30 | % | | | (0.17 | )% | | | (0.26 | )% |
| | 98 | % | | | 97 | % | | | 102 | % | | | 84 | % | | | 105 | % |
The accompanying notes are an integral part of these financial statements.
| HENNESSY FUNDS | 1-800-966-4354 | |
Financial Statements
For an Institutional Class share outstanding throughout each period
| | Six Months Ended | |
| | April 30, 2018 | |
| | (Unaudited) | |
| PER SHARE DATA: | | | | |
| Net asset value, beginning of period | | $ | 24.85 | | |
| | | | | | |
| Income from investment operations: | | | | | |
| Net investment income (loss) | | | 0.08 | | |
| Net realized and unrealized gains (losses) on investments | | | (0.72 | ) | |
| Total from investment operations | | | (0.64 | ) | |
| | | | | | |
| Less distributions: | | | | | |
| Dividends from net investment income | | | — | | |
| Total distributions | | | — | | |
| Net asset value, end of period | | $ | 24.21 | | |
| | | | | | |
| TOTAL RETURN | | | (2.54 | )%(1) | |
| | | | | | |
| SUPPLEMENTAL DATA AND RATIOS: | | | | | |
| Net assets, end of period (millions) | | $ | 23.33 | | |
| Ratio of expenses to average net assets: | | | | | |
| Before expense reimbursement | | | 0.96 | %(2) | |
| After expense reimbursement | | | 0.96 | %(2) | |
| Ratio of net investment loss to average net assets: | | | | | |
| Before expense reimbursement | | | (0.41 | )%(2) | |
| After expense reimbursement | | | (0.41 | )%(2) | |
Portfolio turnover rate(3) | | | 93 | %(1) | |
(1) | Not annualized. |
(2) | Annualized. |
(3) | Portfolio turnover is calculated on the basis of the Fund as a whole. |
The accompanying notes are an integral part of these financial statements.
HENNESSYFUNDS.COM
| FINANCIAL HIGHLIGHTS — INSTITUTIONAL CLASS |
| Year Ended October 31, | |
| 2017 | | | 2016 | | | 2015 | | | 2014 | | | 2013 | |
| | | | | | | | | | | | | | |
| $ | 19.46 | | | $ | 20.47 | | | $ | 19.08 | | | $ | 15.94 | | | $ | 12.57 | |
| | | | | | | | | | | | | | | | | | | |
| | | | | | | | | | | | | | | | | | | |
| | 0.01 | | | | 0.17 | | | | 0.03 | | | | 0.06 | | | | 0.01 | |
| | 5.38 | | | | (1.13 | ) | | | 1.36 | | | | 3.08 | | | | 3.36 | |
| | 5.39 | | | | (0.96 | ) | | | 1.39 | | | | 3.14 | | | | 3.37 | |
| | | | | | | | | | | | | | | | | | | |
| | | | | | | | | | | | | | | | | | | |
| | — | | | | (0.05 | ) | | | — | | | | — | | | | — | |
| | — | | | | (0.05 | ) | | | — | | | | — | | | | — | |
| $ | 24.85 | | | $ | 19.46 | | | $ | 20.47 | | | $ | 19.08 | | | $ | 15.94 | |
| | | | | | | | | | | | | | | | | | | |
| | 27.70 | % | | | (4.69 | )% | | | 7.29 | % | | | 19.70 | % | | | 26.81 | % |
| | | | | | | | | | | | | | | | | | | |
| | | | | | | | | | | | | | | | | | | |
| $ | 31.65 | | | $ | 25.74 | | | $ | 38.96 | | | $ | 25.54 | | | $ | 26.23 | |
| | | | | | | | | | | | | | | | | | | |
| | 0.97 | % | | | 0.98 | % | | | 0.99 | % | | | 1.03 | % | | | 1.11 | % |
| | 0.97 | % | | | 0.98 | % | | | 0.99 | % | | | 0.98 | % | | | 0.98 | % |
| | | | | | | | | | | | | | | | | | | |
| | (0.00 | )% | | | 0.14 | % | | | 0.51 | % | | | 0.03 | % | | | (0.01 | )% |
| | (0.00 | )% | | | 0.14 | % | | | 0.51 | % | | | 0.08 | % | | | 0.12 | % |
| | 98 | % | | | 97 | % | | | 102 | % | | | 84 | % | | | 105 | % |
The accompanying notes are an integral part of these financial statements.
| HENNESSY FUNDS | 1-800-966-4354 | |
Financial Statements
Notes to the Financial Statements April 30, 2018 (Unaudited) |
1). ORGANIZATION
The Hennessy Cornerstone Growth Fund (the “Fund”) is a series of Hennessy Funds Trust (the “Trust”), which was organized as a Delaware statutory trust on September 17, 1992. The Fund is an open-end management investment company registered under the Investment Company Act of 1940, as amended. The investment objective of the Fund is long-term growth of capital. The Fund is a diversified fund.
The Fund offers Investor Class and Institutional Class shares. Each class of shares differs principally in its respective 12b-1 distribution and service, shareholder servicing, and sub-transfer agent expenses. There are no sales charges. Each class has identical rights to earnings, assets, and voting privileges, except for class-specific expenses and exclusive rights to vote on matters affecting only an individual class.
As an investment company, the Fund follows the investment company accounting and reporting guidance of the Financial Accounting Standards Board (“FASB”) Accounting Standard Codification Topic 946 “Financial Services—Investment Companies.”
2). SIGNIFICANT ACCOUNTING POLICIES
The following is a summary of significant accounting policies consistently followed by the Fund in the preparation of the financial statements. These policies conform to U.S. generally accepted accounting principles (“GAAP”).
| a). | Investment Valuation – All investments in securities are recorded at their estimated fair value, as described in Note 3. |
| | |
| b). | Federal Income Taxes – No provision for federal income taxes or excise taxes has been made because the Fund has elected to be taxed as a “regulated investment company” and intends to distribute substantially all of its taxable income to its shareholders and otherwise comply with the provisions of the Internal Revenue Code of 1986, as amended, applicable to regulated investment companies. Net investment income/loss and realized gains/losses for federal income tax purposes may differ from those reported in the financial statements because of temporary book and tax basis differences. Temporary differences are primarily the result of the treatment of wash sales for tax reporting purposes. The Fund recognizes interest and penalties related to income tax benefits, if any, in the Statement of Operations as an income tax expense. Distributions from net realized gains for book purposes may include short-term capital gains, which are included as ordinary income to shareholders for tax purposes. The Fund may utilize equalization accounting for tax purposes and designate earnings and profits, including net realized gains distributed to shareholders on redemption of shares, as part of the dividends paid deduction for income tax purposes. |
| | |
| c). | Accounting for Uncertainty in Income Taxes – The Fund has accounting policies regarding recognition and measurement of tax positions taken or expected to be taken on a tax return. The tax returns of the Fund for the prior three fiscal years are open for examination. The Fund has reviewed all open tax years in major jurisdictions and concluded that there is no impact on the Fund’s net assets and no tax liability resulting from unrecognized tax benefits relating to uncertain income tax positions taken or expected to be taken on a tax return. The Fund’s major tax jurisdictions are U.S. federal and Delaware. |
HENNESSYFUNDS.COM
| NOTES TO THE FINANCIAL STATEMENTS |
| d). | Income and Expenses – Dividend income is recognized on the ex-dividend date or as soon as information is available to the Fund. Interest income, which includes the amortization of premium and accretion of discount, is recognized on an accrual basis. The Fund is charged for those expenses that are directly attributable to the portfolio, such as advisory, administration, and certain shareholder service fees. Income, expenses (other than expenses attributable to a specific class), and realized and unrealized gains/losses on investments are allocated to each class of shares based on such class’s net assets. |
| | |
| e). | Distributions to Shareholders – Dividends from net investment income for the Fund, if any, are declared and paid annually, usually in December. Distributions of net realized capital gains, if any, are declared and paid annually, usually in December. |
| | |
| f). | Security Transactions – Investment and shareholder transactions are recorded on the trade date. The Fund determines the realized gain/loss from an investment transaction by comparing the original cost of the security lot sold with the net sale proceeds. Discounts and premiums on securities purchased are accreted or amortized, respectively, over the life of each such security. |
| | |
| g). | Use of Estimates – The preparation of financial statements in conformity with GAAP requires management to make estimates and assumptions that affect the reported amounts of assets and liabilities and disclosure of contingent assets and liabilities at the date of the financial statements and the reported change in net assets during the reporting period. Actual results could differ from those estimates. |
| | |
| h). | Share Valuation – The net asset value (“NAV”) per share of the Fund is calculated by dividing (i) the total value of the securities held by the Fund, plus cash and other assets, minus all liabilities (including estimated accrued expenses) by (ii) the total number of shares outstanding for the Fund, rounded to the nearest cent. The Fund’s shares will not be priced on days the New York Stock Exchange is closed for trading. The offering and redemption price per share for the Fund is equal to the Fund’s NAV per share. |
3). SECURITIES VALUATION
The Fund follows fair valuation accounting standards that establish an authoritative definition of fair value and set out a hierarchy for measuring fair value. These standards require additional disclosures about the various inputs and valuation techniques used to develop the measurements of fair value and a discussion of changes in valuation techniques and related inputs during the period. These inputs are summarized in the three broad levels listed below:
| | Level 1 – | Unadjusted, quoted prices in active markets for identical instruments that the Fund has the ability to access at the date of measurement. |
| | | |
| | Level 2 – | Other significant observable inputs (including, but not limited to, quoted prices in active markets for similar instruments, quoted prices in markets that are not active for identical or similar instruments, and model-derived valuations in which all significant inputs and significant value drivers are observable in active markets (such as interest rates, prepayment speeds, credit risk curves, default rates, and similar data)). |
| | | |
| | Level 3 – | Significant unobservable inputs (including the Fund’s own assumptions about what market participants would use to price the asset or liability based on the best available information) when observable inputs are unavailable. |
Following is a description of the valuation techniques applied to the Fund’s major categories of assets and liabilities measured at fair value on a recurring basis.
| HENNESSY FUNDS | 1-800-966-4354 | |
| | Equity Securities – Equity securities, including common stocks, preferred stocks, foreign-issued common stocks, exchange-traded funds, closed-end mutual funds, partnerships, rights, and real estate investment trusts, that are traded on a securities exchange for which a last-quoted sales price is readily available will generally be valued at the last sales price as reported by the primary exchange on which the securities are listed. Securities listed on The NASDAQ Stock Market (“NASDAQ”) will generally be valued at the NASDAQ Official Closing Price, which may differ from the last sales price reported. Securities traded on a securities exchange for which a last-quoted sales price is not readily available will generally be valued at the mean between the bid and ask prices. To the extent these securities are actively traded and valuation adjustments are not applied, they are classified in Level 1 of the fair value hierarchy. Securities traded on foreign exchanges generally are not valued at the same time the Fund calculates its NAV because most foreign markets close well before such time. The earlier close of most foreign markets gives rise to the possibility that significant events, including broad market moves, may have occurred in the interim. In certain circumstances, it may be determined that a security needs to be fair valued because it appears that the value of the security might have been materially affected by events occurring after the close of the market in which the security is principally traded, but before the time the Fund calculates its NAV, such as by a development that affects an entire market or region (e.g., a weather-related event) or a potentially global development (e.g., a terrorist attack that may be expected to have an effect on investor expectations worldwide). |
| | |
| | Registered Investment Companies – Investments in registered investment companies (e.g., mutual funds) are generally priced at the ending NAV provided by the applicable registered investment company’s service agent and will be classified in Level 1 of the fair value hierarchy. |
| | |
| | Debt Securities – Debt securities, including corporate bonds, asset-backed securities, mortgage-backed securities, municipal bonds, U.S. Treasuries, and U.S. government agency issues, are generally valued at market on the basis of valuations furnished by an independent pricing service that utilizes both dealer-supplied valuations and formula-based techniques. The pricing service may consider recently executed transactions in securities of the issuer or comparable issuers, market price quotations (where observable), bond spreads, and fundamental data relating to the issuer. In addition, the model may incorporate observable market data, such as reported sales of similar securities, broker quotes, yields, bids, offers, and reference data. Certain securities are valued primarily using dealer quotations. These securities are generally classified in Level 2 of the fair value hierarchy. |
| | |
| | Short-Term Securities – Short-term equity investments, including money market funds, are valued in the manner specified above. Short-term debt investments with an original term to maturity of 60 days or less are valued at amortized cost, which approximates fair market value. If the original term to maturity of a short-term debt investment exceeded 60 days, then the values as of the 61st day prior to maturity are amortized. Amortized cost is not used if its use would be inappropriate due to credit or other impairments of the issuer, in which case the security’s fair value would be determined, as described below. Short-term securities are generally classified in Level 1 or Level 2 of the fair market hierarchy depending on the inputs used and market activity levels for specific securities. |
The Board of Trustees of the Fund (the “Board”) has adopted fair value pricing procedures that are followed when a price for a security is not readily available or if a significant event has occurred that indicates the closing price of a security no longer
HENNESSYFUNDS.COM
| NOTES TO THE FINANCIAL STATEMENTS |
represents the true value of that security. Fair value pricing determinations are made in good faith in accordance with these procedures. There are numerous criteria that will be given consideration in determining a fair value of a security, such as the trading volume of a security and markets, the values of other similar securities, and news events with direct bearing on a security or markets. Fair value pricing results in an estimated price for a security that reflects the amount the Fund might reasonably expect to receive in a current sale. Depending on the relative significance of the valuation inputs, these securities may be classified in either Level 2 or Level 3 of the fair value hierarchy.
The fair valuation of foreign securities may be determined with the assistance of a pricing service using correlations between the movement of prices of such securities and indices of domestic securities and other appropriate indicators, such as closing market prices of relevant American Depositary Receipts or futures contracts. The effect of using fair value pricing is that the Fund’s NAV will reflect the affected portfolio securities’ values as determined by the Board or its designee instead of being determined by the market. Using a fair value pricing methodology to price a foreign security may result in a value that is different from such foreign security’s most recent closing price and from the value used by other investment companies to calculate their NAVs. Such securities are generally classified in Level 2 of the fair valuation hierarchy. Because the Fund may invest in foreign securities, the value of the Fund’s portfolio securities may change on days when you will not be able to purchase or redeem your shares.
The Board has delegated day-to-day valuation matters to a Valuation Committee comprised of one or more representatives from Hennessy Advisors, Inc., the Fund’s investment advisor (the “Advisor”). The function of the Valuation Committee is to value securities where current and reliable market quotations are not readily available. All actions taken by the Valuation Committee are reviewed by the Board.
The Fund has performed an analysis of all existing investments to determine the significance and character of all inputs to their fair value determinations. Various inputs are used to determine the value of the Fund’s investments. The inputs or methodology used for valuing securities are not necessarily an indication of the risk associated with investing in those securities. Details related to the fair valuation hierarchy of the Fund’s securities as of April 30, 2018, are included in the Schedule of Investments.
4). INVESTMENT TRANSACTIONS
Purchases and sales of investment securities (excluding government and short-term investments) for the Fund during the six months ended April 30, 2018, were $195,462,565 and $212,458,167, respectively.
There were no purchases or sales/maturities of long-term U.S. government securities for the Fund during the six months ended April 30, 2018.
The Fund is permitted to purchase or sell securities from or to another fund in the Hennessy Funds family of funds (the “Hennessy Funds”) under specified conditions outlined in procedures adopted by the Board. The procedures have been designed to ensure that any purchase or sale of securities by the Fund from or to another Hennessy Fund complies with Rule 17a-7 of the Investment Company Act of 1940, as amended. During the six months ended April 30, 2018, the Fund did not engage in purchases or sales of securities pursuant to Rule 17a-7 of the Investment Company Act of 1940, as amended.
5). INVESTMENT MANAGEMENT FEE AND OTHER TRANSACTIONS WITH AFFILIATES
The Advisor provides the Fund with investment management services under an Investment Advisory Agreement. The Advisor furnishes all investment advice, office space, and facilities, as well as most of the personnel needed by the Fund. As
| HENNESSY FUNDS | 1-800-966-4354 | |
compensation for its services, the Advisor is entitled to a monthly fee from the Fund. The fee is based upon the average daily net assets of the Fund at an annual rate of 0.74%. The net investment advisory fees expensed by the Fund during the six months ended April 30, 2018, are included in the Statement of Operations.
In the past, the Advisor had contractually agreed to waive its fees and absorb expenses to the extent that total annual operating expenses exceeded 0.98% of the Fund’s net assets for Institutional Class shares of the Fund (excluding all federal, state and local taxes, interest, brokerage commissions, acquired fund fees and expenses and other costs incurred in connection with the purchase and sale of securities, and extraordinary items). The expense limitation agreement was terminated by the Board as of February 28, 2015.
For a period of three years after the year in which the Advisor waived or reimbursed expenses, the Advisor may seek reimbursement from the Fund to the extent that total annual fund operating expenses are less than the expense limitation that was in effect at the time the Advisor waived or reimbursed expenses. As of April 30, 2018, cumulative expenses subject to potential recovery under the aforementioned conditions were $1,023 for Institutional Class shares, which will expire on October 31, 2018.
The Board has approved a Shareholder Servicing Agreement for Investor Class shares of the Fund, which was instituted to compensate the Advisor for the non-investment management services it provides to the Fund. The Shareholder Servicing Agreement provides for a monthly fee paid to the Advisor at an annual rate of 0.10% of the average daily net assets of the Fund attributable to Investor Class shares. The shareholder service fees expensed by the Fund during the six months ended April 30, 2018, are included in the Statement of Operations.
The Fund has adopted a plan pursuant to Rule 12b-1 under the Investment Company Act of 1940, as amended, that authorizes payments in connection with the distribution of the Fund’s shares at an annual rate of up to 0.25% of the Fund’s average daily net assets attributable to Investor Class shares. Even though the authorized rate is up to 0.25%, the Fund is currently only using up to 0.15% of its average daily net assets attributable to Investor Class shares for such purpose. Amounts paid under the plan may be spent on any activities or expenses primarily intended to result in the sale of shares, including, but not limited to, advertising, shareholder account servicing, the printing and mailing of prospectuses to other than current shareholders, the printing and mailing of sales literature, and compensation for sales and marketing activities or to financial institutions and others, such as dealers and distributors. The distribution fees expensed by the Fund during the six months ended April 30, 2018, are included in the Statement of Operations.
The Fund has entered into agreements with various brokers, dealers, and financial intermediaries in connection with the sale of shares of the Fund. The agreements provide for periodic payments by the Fund to the brokers, dealers, and financial intermediaries for providing certain shareholder maintenance services (sub-transfer agent expenses). These shareholder services include the pre-processing and quality control of new accounts, shareholder correspondence, answering customer inquiries regarding account status, and facilitating shareholder telephone transactions. The sub-transfer agent fees expensed by the Fund during the six months ended April 30, 2018, are included in the Statement of Operations.
U.S. Bancorp Fund Services, LLC (“USBFS”) provides the Fund with administrative, fund accounting, and transfer agent services. As administrator, USBFS is responsible for activities such as (i) preparing various federal and state regulatory filings, reports, and returns for the Fund, (ii) preparing reports and materials to be supplied to the Board, (iii) monitoring the activities of the Fund’s custodian, transfer agent, and accountants,
HENNESSYFUNDS.COM
| NOTES TO THE FINANCIAL STATEMENTS |
and (iv) coordinating the preparation and payment of the Fund’s expenses and reviewing the Fund’s expense accruals. U.S. Bank N.A., an affiliate of USBFS, serves as the Fund’s custodian. The servicing agreements between the Trust and USBFS and U.S. Bank N.A. contain a fee schedule that is inclusive of administrative, fund accounting, custody, and transfer agent fees. The administrative, fund accounting, custody, and transfer agent fees expensed by the Fund during the six months ended April 30, 2018, are included in the Statement of Operations.
Quasar Distributors, LLC acts as the Fund’s principal underwriter in a continuous public offering of the Fund’s shares. Quasar Distributors, LLC is an affiliate of USBFS and U.S. Bank N.A.
The officers of the Fund are affiliated with the Advisor. Such officers, with the exception of the Chief Compliance Officer and the Senior Compliance Officer, receive no compensation from the Fund for serving in their respective roles. The Fund, along with the other Hennessy Funds, makes reimbursement payments, on an equal basis, to the Advisor for a portion of the salary and benefits associated with the office of the Chief Compliance Officer and for all of the salary and benefits associated with the office of the Senior Compliance Officer. The compliance fees expensed by the Fund during the six months ended April 30, 2018, are included in the Statement of Operations.
6). GUARANTEES AND INDEMNIFICATIONS
Under the Hennessy Funds’ organizational documents, their officers and trustees are indemnified by the Hennessy Funds against certain liabilities arising out of the performance of their duties to the Hennessy Funds. Additionally, in the normal course of business, the Hennessy Funds enter into contracts with service providers that contain general indemnification clauses. The Fund’s maximum exposure under these arrangements is unknown as this would involve future claims that may be made against the Fund that have not yet occurred. Currently, the Fund expects the risk of loss to be remote.
7). LINE OF CREDIT
The Fund has an uncommitted line of credit with the other Hennessy Funds in the amount of the lesser of (i) $100,000,000 or (ii) 33.33% of each Hennessy Fund’s net assets, or 30% for the Hennessy Gas Utility Fund and 10% for the Hennessy Balanced Fund, intended to provide short-term financing, if necessary, subject to certain restrictions, in connection with shareholder redemptions. The credit facility is with the Hennessy Funds’ custodian bank, U.S. Bank N.A. Borrowings under this arrangement bear interest at the bank’s prime rate and are secured by all of the Fund’s assets (as to its own borrowings only). During the six months ended April 30, 2018, the Fund had an outstanding average daily balance and a weighted average interest rate of $15,691 and 4.50%, respectively. The interest expensed by the Fund during the six months ended April 30, 2018, is included in the Statement of Operations. The maximum amount outstanding for the Fund during the period was $838,000. As of April 30, 2018, the Fund did not have any borrowings outstanding under the line of credit.
| HENNESSY FUNDS | 1-800-966-4354 | |
8). FEDERAL TAX INFORMATION
As of October 31, 2017, the Fund’s most recent fiscal year end, the components of accumulated earnings (losses) for income tax purposes were as follows:
| | | | Investments | |
| | Cost of investments for tax purposes | | $ | 195,261,730 | |
| | Gross tax unrealized appreciation | | $ | 47,139,153 | |
| | Gross tax unrealized depreciation | | | (13,771,738 | ) |
| | Net tax unrealized appreciation | | $ | 33,367,415 | |
| | Undistributed ordinary income | | $ | — | |
| | Undistributed long-term capital gains | | | — | |
| | Total distributable earnings | | $ | — | |
| | Other accumulated loss | | $ | (796,849 | ) |
| | Total accumulated gain | | $ | 32,570,566 | |
The difference between book-basis unrealized appreciation/depreciation (as shown in the Statement of Assets and Liabilities) and tax-basis unrealized appreciation/depreciation (as shown above) is attributable primarily to partnership adjustments.
As of October 31, 2017, the Fund’s most recent fiscal year end, the Fund had no tax basis capital losses to offset future capital gains.
During fiscal year 2017, the Fund’s most recent fiscal year, the capital losses utilized by the Fund were $25,411,058 and capital losses expired were $81,285,880.
Capital losses sustained in fiscal year 2012 and in future taxable years will not expire and may be carried over by the Fund without limitation; however, they will retain the character of the original loss. Furthermore, any loss incurred during those taxable years will be required to be utilized prior to the losses incurred in taxable years prior to 2012. As a result of this ordering rule, pre-enactment capital loss carryforwards may be more likely to expire unused. Under pre-enactment law, capital losses could be carried forward for eight years, and carried forward as short-term capital losses, irrespective of the character of the original loss.
As of October 31, 2017, the Fund’s most recent fiscal year end, the Fund deferred, on a tax basis, a late-year ordinary loss of $796,849. Late-year ordinary losses are net ordinary losses incurred after December 31, 2016, but within the taxable year, that are deemed to arise on the first day of the Fund’s next taxable year.
During fiscal year 2018 (year to date) and fiscal year 2017, the Fund did not pay any distributions.
9). EVENTS SUBSEQUENT TO PERIOD END
Management has evaluated the Fund’s related events and transactions that occurred subsequent to April 30, 2018, through the date of issuance of the Fund’s financial statements. Management has determined that there were no subsequent events requiring recognition or disclosure in the financial statements.
HENNESSYFUNDS.COM
| NOTES TO THE FINANCIAL STATEMENTS |
(This Page Intentionally Left Blank.)
| HENNESSY FUNDS | 1-800-966-4354 | |
Expense Example (Unaudited)
April 30, 2018
As a shareholder of the Fund, you incur two types of costs: (1) transaction costs, including sales charges (loads) on purchase payments, reinvested dividends, or other distributions; redemption fees; and exchange fees; and (2) ongoing costs, including management fees; service fees; and other Fund expenses. This Example is intended to help you understand your ongoing costs (in dollars) of investing in the Fund and to compare these costs with the ongoing costs of investing in other mutual funds. The Example is based on an investment of $1,000 invested at the beginning of the period and held for the entire period from November 1, 2017, through April 30, 2018.
Actual Expenses
The first line of the table below under the “Investor Class” and “Institutional Class” headings provides information about actual account values and actual expenses. Although the Fund charges no sales loads or transaction fees, you will be assessed fees for outgoing wire transfers, returned checks and stop payment orders at prevailing rates charged by U.S. Bancorp Fund Services, LLC, the Fund’s transfer agent. If you request that a redemption be made by wire transfer, currently a $15 fee is charged by the Fund’s transfer agent. IRA accounts will be charged a $15 annual maintenance fee. The example below includes, but is not limited to, management fees, shareholder servicing fees, fund accounting, custody, and transfer agent fees. However, the example below does not include portfolio trading commissions and related expenses, and other extraordinary expenses as determined under generally accepted accounting principles. You may use the information in this line, together with the amount you invested, to estimate the expenses that you paid over the period. Simply divide your account value by $1,000 (for example, an $8,600 account value divided by $1,000 = 8.6), then multiply the result by the number in the first line of the table under the “Investor Class” or “Institutional Class” headings in the column entitled “Expenses Paid During Period” to estimate the expenses you paid on your account during this period.
Hypothetical Example for Comparison Purposes
The second line of the table below under the “Investor Class” and “Institutional Class” headings provides information about hypothetical account values and hypothetical expenses based on the Fund’s actual expense ratios and an assumed rate of return of 5% per year before expenses, which is not the Fund’s actual return.] The hypothetical account values and expenses may not be used to estimate the actual ending account balance or expenses you paid for the period. You may use this information to compare the ongoing costs of investing in the Fund and other funds. To do so, compare this 5% hypothetical example with the 5% hypothetical examples that appear in the shareholder reports of the other funds. Please note that the expenses shown in the table are meant to highlight your ongoing costs only and do not reflect any transactional costs, such as sales charges (loads), or exchange fees. Therefore, the second line of the table under the “Investor Class” and “Institutional Class” headings is useful in comparing ongoing costs only, and will not help you determine the relative total costs of owning different funds. In addition, if these transactional costs were included, your costs would have been higher.
HENNESSYFUNDS.COM
| | | | Expenses Paid |
| | Beginning | Ending | During Period(1) |
| | Account Value | Account Value | November 1, 2017 – |
| | November 1, 2017 | April 30, 2018 | April 30, 2018 |
| Investor Class | | | |
| Actual | $1,000.00 | $ 973.10 | $6.36 |
| Hypothetical (5% return before expenses) | $1,000.00 | $1,018.35 | $6.51 |
| | | | |
| Institutional Class | | | |
| Actual | $1,000.00 | $ 974.60 | $4.70 |
| Hypothetical (5% return before expenses) | $1,000.00 | $1,020.03 | $4.81 |
(1) | Expenses are equal to the Fund’s expense ratio of 1.30% for Investor Class shares or 0.96% for Institutional Class shares, as applicable, multiplied by the average account value over the period, multiplied by 181/365 days (to reflect one-half year period). |
| HENNESSY FUNDS | 1-800-966-4354 | |
How to Obtain a Copy of the Fund’s
Proxy Voting Policy and Proxy Voting Records
A description of the policies and procedures the Fund uses to determine how to vote proxies relating to portfolio securities is available without charge (1) by calling 1-800-966-4354, (2) on the Hennessy Funds’ website at hennessyfunds.com/proxy-voting/voting-policy, or (3) on the U.S. Securities and Exchange Commission’s (the “SEC”) website at www.sec.gov. The Fund’s proxy voting record is available without charge on both the Hennessy Funds’ website at hennessyfunds.com/proxy-voting/voting-record and the SEC’s website at www.sec.gov no later than August 31 for the prior 12 months ending June 30.
Quarterly Filings on Form N-Q
The Fund files a complete schedule of portfolio holdings with the SEC for the first and third quarters of each fiscal year on Form N-Q. The Fund’s Forms N-Q are available on the SEC’s website at www.sec.gov. The Fund’s Forms N-Q may be reviewed and copied at the SEC’s Public Reference Room in Washington, DC and information on the operation of the Public Reference Room may be obtained by calling 1-800-SEC-0330. Information included in the Fund’s Forms N-Q will also be available upon request by calling 1-800-966-4354.
Important Notice Regarding Delivery of
Shareholder Documents
To help keep the Fund’s costs as low as possible, we generally deliver a single copy of shareholder reports, proxy statements, and prospectuses to shareholders who share an address and have the same last name. This process does not apply to account statements. You may request an individual copy of a shareholder document at any time. If you would like to receive separate mailings of shareholder documents, please call U.S. Bancorp Fund Services, LLC at 1-800-261-6950 or 1-414-765-4124, and individual delivery will begin within 30 days of your request. If your account is held through a financial institution or other intermediary, please contact such intermediary directly to request individual delivery.
HENNESSYFUNDS.COM
| PROXY VOTING — BOARD APPROVAL OF INVESTMENT ADVISORY AGREEMENT |
Board Approval of Investment Advisory
Agreement
At its meeting on March 7, 2018, the Board of Trustees of the Fund (the “Board,” and the members thereof, the “Trustees”) unanimously approved the continuation of the investment advisory agreement of the Fund with Hennessy Advisors, Inc. (the “Advisor”). As part of the process of approving the continuation of the advisory agreement, the Trustees reviewed their fiduciary duties with respect to approving the advisory agreement and the relevant factors for them to consider. In addition, the Trustees who are not deemed “interested persons” (as defined by the Investment Company Act of 1940, as amended) of the Fund (the “Independent Trustees”) met in executive session to discuss the approval of the advisory agreement.
In advance of the meeting, the Advisor sent detailed information to the Trustees to assist them in their evaluation of the advisory agreement. This information included, but was not limited to, the following:
| | (1) | A memorandum from outside legal counsel that described the fiduciary duties of the Board with respect to approving the continuation of the advisory agreement and the relevant factors for consideration; |
| | | |
| | (2) | A memorandum from the Advisor that listed the factors relevant to the Board’s approval of the continuation of the advisory agreement and also referenced the documents that had been provided to help the Board assess each such factor; |
| | | |
| | (3) | An inventory of the range of services provided by the Advisor to the Fund; |
| | | |
| | (4) | A written discussion of economies of scale; |
| | | |
| | (5) | The advisory agreement; |
| | | |
| | (6) | A recent Fund fact sheet, which included, among other things, performance information over various periods; |
| | | |
| | (7) | A peer expense comparison of both the net expense ratio and investment advisory fee of the Fund; |
| | | |
| | (8) | The Advisor’s most recent Form 10-K and Form 10-Q, which includes information about the Advisor’s profitability; |
| | | |
| | (9) | Information about brokerage commissions; |
| | | |
| | (10) | Information about the Fund’s compliance program; and |
| | | |
| | (11) | The Advisor’s current Form ADV Part I. |
All of the factors discussed were considered as a whole by the Trustees, and also by the Independent Trustees meeting in executive session. The factors were viewed in their totality by the Trustees, with no single factor being the principal or determinative factor in the Trustees’ determination of whether to approve the continuation of the advisory agreement. The Trustees recognized that the management and fee arrangements for the Fund are the result of years of review and discussion between the Independent Trustees and the Advisor, that certain aspects of such arrangements may receive greater scrutiny in some years than in others, and that the Trustees’ conclusions may be based, in part, on their consideration of these same arrangements and information received during the course of the year and in prior years.
| HENNESSY FUNDS | 1-800-966-4354 | |
Prior to approving the continuation of the advisory agreement, the Trustees, including the Independent Trustees in executive session, considered, among other items:
| | (1) | The nature and quality of the advisory services provided by the Advisor; |
| | | |
| | (2) | A comparison of the fees and expenses of the Fund to other similar funds; |
| | | |
| | (3) | Whether economies of scale are recognized by the Fund; |
| | | |
| | (4) | The costs and profitability of the Fund to the Advisor; |
| | | |
| | (5) | The performance of the Fund; and |
| | | |
| | (6) | Any benefits to the Advisor from serving as an investment advisor to the Fund (other than the advisory fee). |
The material considerations and determinations of the Trustees, including the Independent Trustees, were as follows:
| | (1) | The Trustees considered the services identified below that are provided by the Advisor. Based on this review, the Trustees concluded that the Advisor provides high-quality services to the Fund, and they noted that their overall confidence in the Advisor is high. The Trustees also concluded that they were satisfied with the nature, extent, and quality of the advisory services provided to the Fund by the Advisor, and that the nature and extent of the services provided by the Advisor are appropriate to assure that the Fund’s operations are conducted in compliance with applicable laws, rules, and regulations. |
| | | (a) | The Advisor acts as the portfolio manager for the Fund. In this capacity, the Advisor does the following: |
| | | | (i) | manages the composition of the Fund’s portfolio, including the purchase, retention, and disposition of portfolio securities in accordance with the Fund’s investment objectives, policies, and restrictions; |
| | | | | |
| | | | (ii) | ensures compliance with “best execution” for the Fund’s portfolio; |
| | | | | |
| | | | (iii) | manages the use of soft dollars for the Fund; and |
| | | | | |
| | | | (iv) | manages proxy voting for the Fund. |
| | | (b) | The Advisor performs a daily reconciliation of portfolio positions and cash for the Fund. |
| | | | |
| | | (c) | The Advisor monitors the Fund’s compliance with its investment objectives and restrictions. |
| | | | |
| | | (d) | The Advisor monitors compliance with federal securities laws and performs activities such as maintaining a compliance program, conducting ongoing reviews of the compliance programs of the Fund’s service providers, conducting on-site visits to the Fund’s service providers, monitoring incidents of abusive trading practices, reviewing Fund expense accruals, payments, and fixed expense ratios, evaluating insurance providers for fidelity bond coverage and D&O/E&O insurance coverage, conducting employee compliance training, reviewing reports provided by service providers, maintaining books and records, and preparing an annual compliance report for the Board. |
| | | | |
| | | (e) | The Advisor oversees service providers that provide accounting, administration, distribution, transfer agency, custodial, sales, marketing, public relations, audit, information technology, and legal services to the Fund. |
HENNESSYFUNDS.COM
| BOARD APPROVAL OF INVESTMENT ADVISORY AGREEMENT |
| | | (f) | The Advisor maintains in-house marketing and distribution departments on behalf of the Fund. |
| | | | |
| | | (g) | The Advisor is actively involved with preparing regulatory filings for the Fund, including writing and annually updating the Fund’s prospectus and related documents. |
| | | | |
| | | (h) | The Advisor prepares a written summary of the Fund’s performance for the most recent 12-month period for each annual report of the Fund. |
| | | | |
| | | (i) | The Advisor oversees distribution of the Fund through third-party broker/dealers and independent financial institutions such as Charles Schwab, Inc., Fidelity, TD Waterhouse, and Pershing. The Advisor participates in “no transaction fee” (“NTF”) programs with these companies on behalf of the Fund, which allow customers to purchase the Fund through third-party distribution channels without paying a transaction fee. The Advisor compensates, in part, a number of these third-party providers of NTF programs out of its own revenues. |
| | | | |
| | | (j) | The Advisor pays the incentive compensation of the Fund’s compliance officers and employs other staff, such as legal, marketing, national accounts, distribution, sales, administrative, and trading oversight personnel, as well as management executives. |
| | | | |
| | | (k) | The Advisor provides a quarterly compliance certification to the Board. |
| | | | |
| | | (l) | The Advisor prepares or reviews Board materials, frequently presents to the Board or leads Board discussions, prepares or reviews meeting minutes, and arranges for Board training and education. |
| | (2) | The Trustees compared the performance of the Fund to benchmark indices over various time periods and also noted that the Trustees review and discuss reports comparing the investment performance of the Fund to various indices at each quarterly Board meeting. Based on all such information, the Trustees believe that the Advisor manages the Fund in a manner that is materially consistent with its stated investment objective and style. The Trustees concluded that the performance of the Fund over various time periods warranted the continuation of the advisory agreement. |
| | | |
| | (3) | The Trustees reviewed the advisory fees and overall expense ratios of the Fund compared to other funds similar in asset size and investment objective to the Fund using data from Morningstar. As part of the discussion with management, the Trustees ensured that they understood and were comfortable with the criteria used to determine the mutual funds included in the Morningstar categories for purposes of the materials considered at the meeting. The Trustees determined that the advisory fee and overall expense ratio of the Fund falls within the range of the advisory fees and overall expense ratios of other comparable funds and concluded that they are reasonable and warranted continuation of the advisory agreement. |
| | | |
| | (4) | The Trustees also considered whether economies of scale were being realized by the Advisor that should be shared with the Fund’s shareholders. The Trustees noted that many of the expenses incurred to manage the Fund are asset-based fees and thus do not result in material economies of scale being realized as the assets of the Fund increase. For example, mutual fund platform fees increase as the Fund’s assets grow. The Trustees also considered the Advisor’s efforts to |
| HENNESSY FUNDS | 1-800-966-4354 | |
| | | contain expenses, the Advisor’s significant marketing efforts to promote the Funds, and the Advisor’s agreement to waive fees or lower its management fees in certain circumstances. The Trustees noted that at current asset levels it did not appear that there were economies of scale being realized by the Advisor and concluded that it would continue to monitor economies of scale in the future as circumstances changed. |
| | | |
| | (5) | The Trustees considered the profitability of the Advisor, including the impact of mutual fund platform fees on the Advisor’s profitability, and also considered the resources and revenues that the Advisor has put into managing and distributing the Fund. The Trustees then concluded that the profits of the Advisor are reasonable and not excessive when compared to profitability guidelines set forth in relevant court cases. |
| | | |
| | (6) | The Trustees considered the high level of professionalism and knowledge of the Advisor’s employees, along with a very low level of turnover, and concluded that this was beneficial to the Fund and its shareholders. |
| | | |
| | (7) | The Trustees considered any benefits to the Advisor from serving as an advisor to the Fund (other than the advisory fee). The Trustees noted that the Advisor may derive ancillary benefits from, by way of example, its association with the Fund in the form of proprietary and third-party research products and services received from broker-dealers that execute portfolio trades for the Fund. The Trustees determined that any such products and services have been used for legitimate purposes relating to the Fund by providing assistance in the investment decision-making process. The Trustees concluded that any additional benefits realized by the Advisor its relationship with the Fund were reasonable. |
After reviewing the materials provided at the meeting and management’s presentation, as well as other information regularly provided at the Board’s quarterly meetings throughout the year regarding the quality of services provided by the Advisor, the performance of the Fund, expense information, regulatory compliance issues, trading information and related matters, and other factors that the Trustees deemed relevant, the Trustees, including the Independent Trustees, approved the continuation of the advisory agreement.
HENNESSYFUNDS.COM
| BOARD APPROVAL OF INVESTMENT ADVISORY AGREEMENT |
(This Page Intentionally Left Blank.)
For information, questions or assistance, please call
The Hennessy Funds
1-800-966-4354 or 1-415-899-1555
INVESTMENT ADVISOR
Hennessy Advisors, Inc.
7250 Redwood Boulevard, Suite 200
Novato, California 94945
ADMINISTRATOR,
TRANSFER AGENT,
DIVIDEND PAYING AGENT &
SHAREHOLDER SERVICING AGENT
U.S. Bancorp Fund Services, LLC
P.O. Box 701
Milwaukee, Wisconsin 53201-0701
CUSTODIAN
U.S. Bank N.A.
Custody Operations
1555 North River Center Drive, Suite 302
Milwaukee, Wisconsin 53212
TRUSTEES
Neil J. Hennessy
Robert T. Doyle
J. Dennis DeSousa
Gerald P. Richardson
COUNSEL
Foley & Lardner LLP
777 East Wisconsin Avenue
Milwaukee, Wisconsin 53202-5306
INDEPENDENT REGISTERED
PUBLIC ACCOUNTING FIRM
Tait, Weller & Baker LLP
1818 Market Street, Suite 2400
Philadelphia, Pennsylvania 19103
DISTRIBUTOR
Quasar Distributors, LLC
777 East Wisconsin Avenue
Milwaukee, Wisconsin 53202
hennessyfunds.com | 1-800-966-4354
This report has been prepared for shareholders and may be distributed to
others only if preceded or accompanied by a current prospectus.
SEMI-ANNUAL REPORT
APRIL 30, 2018
HENNESSY FOCUS FUND
Investor Class HFCSX
Institutional Class HFCIX
hennessyfunds.com | 1-800-966-4354
(This Page Intentionally Left Blank.)
Contents
| Letter to Shareholders | | | 2 |
| Performance Overview | | | 4 |
| Financial Statements | | | |
| Schedule of Investments | | | 5 |
| Statement of Assets and Liabilities | | | 9 |
| Statement of Operations | | | 10 |
| Statements of Changes in Net Assets | | | 11 |
| Financial Highlights | | | 12 |
| Notes to the Financial Statements | | | 16 |
| Expense Example | | | 24 |
| Proxy Voting Policy and Proxy Voting Records | | | 26 |
| Quarterly Schedule of Investments | | | 26 |
| Important Notice Regarding Delivery of Shareholder Documents | | | 26 |
| Board Approval of Investment Advisory Agreements | | | 27 |
| HENNESSY FUNDS | 1-800-966-4354 | |
May 2018
Dear Hennessy Funds Shareholder:
Investors in the United States and abroad experienced the return of volatility in the six months ended April 30, 2018, especially during the second half of the period. Equities rallied sharply during the first half of the period and fell back during the second half, but nevertheless ended the period with solid gains, with the Dow Jones Industrial Average posting a total return of 4.5% and the S&P 500 Index up 3.8%. Over the past year, I have repeatedly shared my belief that the stock market was due for a correction, but that it would bounce back, as it has so many times during the current bull market.
In the closing months of 2017 and into January 2018, U.S. equities rallied in response to the enactment of the Tax Cuts and Jobs Act of 2017, which significantly lowered corporate tax rates. Investors were also encouraged by two quarters of real GDP growth of 3.2% and 2.9%. However, equity prices quickly lost ground in reaction to the imposition of trade tariffs on steel and aluminum, and fears that additional proposed tariffs could provoke a trade war with China. Signals from the Federal Reserve that the pace of interest rate increases would move slightly higher also weighed on investors. During the period, the federal funds rate was raised twice, by a quarter point each time, in December 2017 and March 2018.
The current bull market in U.S. equities is now entering its 10th year, and we remain optimistic about the outlook for stock prices. In our opinion, economic fundamentals look positive. The U.S. economy is growing at a solid pace of 2 – 3% annually, inflation is low, and high employment levels are supporting healthy growth in consumption. Wages are rising, but the rate of increase has remained steady at around 2.6% per year since mid-2016. While it appears that the Federal Reserve will continue to raise the federal funds rate and normalize monetary policy, we believe it will be able to do so gradually, avoiding a severe jolt to either financial markets or the economy. Meanwhile, companies continue to report robust earnings growth, boosted this year by lower tax rates.
We believe U.S. equities remain attractively valued. U.S. long bond yields are hovering near 3%, having risen over the period in response to strong economic activity. Prospective PE multiples, however, have dropped significantly since the end of 2017, the result of a combination of lower taxes, higher operating earnings, and lower stock prices. The Dow Jones Industrial Average and the S&P 500 Index are trading at about 17x forward earnings, down from approximately 20x at the beginning of the calendar year, valuations we believe to be very reasonable.
We are not overly concerned about recent protectionist actions by the U.S. administration. We consider the announcements and ongoing discussions regarding import tariffs and NAFTA to be representative of standard Trump deal-making tactics – make far-reaching demands and then negotiate a reasonable outcome that is beneficial to both sides. We expect continued pro-business policies and regulatory relief to be enacted by our leaders in Washington.
Finally, as noted many times in past letters during this bull market, the euphoria that has historically accompanied a peak in the market continues to be absent. Investors today are worried about many things, including higher interest rates, larger budget deficits, higher import tariffs, and political distractions. But they are definitely not euphoric. In the past, I have likened the current bull market to the 1982-2000 bull market, and I continue
HENNESSYFUNDS.COM
to believe the comparison is a good one. We remain confident that the market will be able to weather the current period of volatility and that the economy, despite higher interest rates and possible trade disruptions, is resilient enough to continue its steady growth into the coming year.
Thank you for your continued confidence and investment in the Hennessy Funds. If you have any questions or would like to speak with us directly, please don’t hesitate to call us at (800) 966-4354.
Best regards,
Neil J. Hennessy
President and Chief Investment Officer
Past performance does not guarantee future results.
Mutual fund investing involves risk. Principal loss is possible.
Opinions expressed are those of Neil Hennessy and are subject to change, are not guaranteed, and should not be considered investment advice.
The Dow Jones Industrial Average and S&P 500 Index are unmanaged indices commonly used to measure the performance of U.S. stocks. One cannot invest directly in an index.
Price to earnings (PE) is calculated by dividing a company’s market price per share by its earnings per share. Earnings growth is not a measure of a fund’s future performance.
| HENNESSY FUNDS | 1-800-966-4354 | |
Performance Overview (Unaudited)
AVERAGE ANNUAL TOTAL RETURN FOR PERIODS ENDED APRIL 30, 2018
| | Six | One | Five | Ten |
| | Months(1) | Year | Years | Years |
| Hennessy Focus Fund – | | | | |
| Investor Class (HFCSX) | 1.41% | 11.32% | 10.90% | 10.79% |
| Hennessy Focus Fund – | | | | |
Institutional Class (HFCIX)(2) | 1.59% | 11.72% | 11.29% | 11.17% |
Russell 3000® Index | 3.79% | 13.05% | 12.75% | 9.13% |
Russell Mid Cap® Growth Index | 5.16% | 16.87% | 12.76% | 9.74% |
Expense ratios: 1.50% (Investor Class); 1.12% (Institutional Class)
(1) | Periods less than one year are not annualized. |
(2) | The inception date of Institutional Class shares is May 30, 2008. Performance shown prior to the inception of Institutional Class shares reflects the performance of Investor Class shares and includes expenses that are higher than those of Institutional Class shares. |
Performance data quoted represents past performance; past performance does not guarantee future results. The investment return and principal value of an investment will fluctuate so that an investor’s shares, when redeemed, may be worth more or less than their original cost. The performance table does not reflect the deduction of taxes that a shareholder would pay on Fund distributions or the redemption of Fund shares. Current performance of the Fund may be lower or higher than the performance quoted. Performance data current to the most recent month end may be obtained by visiting hennessyfunds.com. Performance for periods prior to October 26, 2012, is that of the FBR Focus Fund.
The Russell 3000® Index is an unmanaged index commonly used to measure the performance of U.S. stocks. The Russell Midcap® Growth Index is an unmanaged index commonly used to measure the performance of U.S. medium-capitalization growth stocks. One cannot invest directly in an index.
Frank Russell Company (“Russell”) is the source and owner of the trademarks, service marks, and copyrights related to the Russell Indexes. Russell® is a trademark of Frank Russell Company. Neither Russell nor its licensors accept any liability for any errors or omissions in the Russell Indexes or Russell ratings or underlying data and no party may rely on any Russell Indexes or Russell ratings or underlying data contained in this communication. No further distribution of Russell data is permitted without Russell’s express written consent. Russell does not promote, sponsor, or endorse the content of this communication.
The expense ratios presented are from the most recent prospectus. The expense ratios for the current reporting period are available in the Financial Highlights section of this report.
HENNESSYFUNDS.COM
| PERFORMANCE OVERVIEW/SCHEDULE OF INVESTMENTS |
Financial Statements
Schedule of Investments as of April 30, 2018 (Unaudited) |
HENNESSY FOCUS FUND
(% of Net Assets)
| TOP TEN HOLDINGS (EXCLUDING CASH/CASH EQUIVALENTS) | % NET ASSETS |
| American Tower Corp., Class A | 11.31% |
| Markel Corp. | 9.42% |
| The Charles Schwab Corp. | 8.67% |
| O’Reilly Automotive, Inc. | 8.34% |
| CarMax, Inc. | 7.16% |
| Brookfield Asset Management, Inc. | 6.96% |
| Hexcel Corp. | 6.66% |
| Aon PLC | 6.49% |
| Twenty First Century Fox, Inc. | 5.43% |
| American Woodmark Corp. | 4.29% |
Note: For presentation purposes, the Fund has grouped some of the industry categories. For purposes of categorizing securities for compliance with section 8(b)(1) of the Investment Company Act of 1940, as amended, the Fund uses more specific industry classifications.
The Global Industry Classification Standard (GICS®) was developed by and is the exclusive property and a service mark of MSCI, Inc. and Standard & Poor Financial Services LLC. It has been licensed for use by the Hennessy Funds.
| HENNESSY FUNDS | 1-800-966-4354 | |
| COMMON STOCKS – 76.52% | | Number | | | | | | % of | |
| | | of Shares | | | Value | | | Net Assets | |
| Consumer Discretionary – 25.28% | | | | | | | | | |
| CarMax, Inc. (a) | | | 2,962,712 | | | $ | 185,169,500 | | | | 7.16 | % |
| NVR, Inc. (a) | | | 33,974 | | | | 105,319,400 | | | | 4.07 | % |
| O’Reilly Automotive, Inc. (a) | | | 842,815 | | | | 215,819,637 | | | | 8.34 | % |
| Penn National Gaming, Inc. (a) | | | 238,898 | | | | 7,240,998 | | | | 0.28 | % |
| Twenty First Century Fox, Inc. | | | 3,837,592 | | | | 140,302,364 | | | | 5.43 | % |
| | | | | | | | 653,851,899 | | | | 25.28 | % |
| | | | | | | | | | | | | |
| Financials – 29.55% | | | | | | | | | | | | |
| Aon PLC (b) | | | 1,179,036 | | | | 167,977,259 | | | | 6.49 | % |
| Encore Capital Group, Inc. (a)(d) | | | 2,258,784 | | | | 100,741,766 | | | | 3.90 | % |
| Markel Corp. (a) | | | 215,672 | | | | 243,717,987 | | | | 9.42 | % |
| Marlin Business Services Corp. (d) | | | 1,010,273 | | | | 27,681,480 | | | | 1.07 | % |
| The Charles Schwab Corp. | | | 4,029,065 | | | | 224,338,339 | | | | 8.67 | % |
| | | | | | | | 764,456,831 | | | | 29.55 | % |
| | | | | | | | | | | | | |
| Health Care – 1.64% | | | | | | | | | | | | |
| Henry Schein, Inc. (a) | | | 558,796 | | | | 42,468,496 | | | | 1.64 | % |
| | | | | | | | | | | | | |
| Industrials – 13.08% | | | | | | | | | | | | |
| American Woodmark Corp. (a)(d) | | | 1,350,360 | | | | 110,999,592 | | | | 4.29 | % |
| Ametek, Inc. | | | 459,822 | | | | 32,095,576 | | | | 1.24 | % |
| Hexcel Corp. | | | 2,592,037 | | | | 172,292,699 | | | | 6.66 | % |
| Mistras Group, Inc. (a) | | | 1,171,870 | | | | 22,816,309 | | | | 0.89 | % |
| | | | | | | | 338,204,176 | | | | 13.08 | % |
| | | | | | | | | | | | | |
| Information Technology – 6.97% | | | | | | | | | | | | |
| Alphabet, Inc., Class A (a) | | | 68,984 | | | | 70,265,723 | | | | 2.72 | % |
| Alphabet, Inc., Class C (a) | | | 108,017 | | | | 109,888,935 | | | | 4.25 | % |
| | | | | | | | 180,154,658 | | | | 6.97 | % |
| Total Common Stocks | | | | | | | | | | | | |
| (Cost $912,729,645) | | | | | | | 1,979,136,060 | | | | 76.52 | % |
The accompanying notes are an integral part of these financial statements.
HENNESSYFUNDS.COM
| REITS – 21.57% | | Number | | | | | | % of | |
| | | of Shares | | | Value | | | Net Assets | |
| Financials – 21.57% | | | | | | | | | |
| American Tower Corp., Class A | | | 2,145,080 | | | $ | 292,503,109 | | | | 11.31 | % |
| Brookfield Asset Management, Inc. (b) | | | 4,543,328 | | | | 180,097,522 | | | | 6.96 | % |
| Gaming and Leisure Properties, Inc. | | | 2,489,361 | | | | 85,310,401 | | | | 3.30 | % |
| | | | | | | | 557,911,032 | | | | 21.57 | % |
| Total REITS | | | | | | | | | | | | |
| (Cost $320,324,163) | | | | | | | 557,911,032 | | | | 21.57 | % |
| | | | | | | | | | | | | |
| SHORT-TERM INVESTMENTS – 1.65% | | | | | | | | | | | | |
| | | | | | | | | | | | | |
| Money Market Funds – 1.65% | | | | | | | | | | | | |
| Fidelity Government Portfolio, Institutional Class, 1.58% (c) | | | 42,770,056 | | | | 42,770,056 | | | | 1.65 | % |
| | | | | | | | | | | | | |
| Total Short-Term Investments | | | | | | | | | | | | |
| (Cost $42,770,056) | | | | | | | 42,770,056 | | | | 1.65 | % |
| | | | | | | | | | | | | |
| Total Investments | | | | | | | | | | | | |
| (Cost $1,275,823,864) – 99.74% | | | | | | | 2,579,817,148 | | | | 99.74 | % |
| Other Assets in Excess of Liabilities – 0.26% | | | | | | | 6,795,567 | | | | 0.26 | % |
| | | | | | | | | | | | | |
TOTAL NET ASSETS – 100.00% | | | | | | $ | 2,586,612,715 | | | | 100.00 | % |
Percentages are stated as a percent of net assets.
PLC – Public Limited Company
REIT – Real Estate Investment Trust
| (a) | Non-income producing security. |
| (b) | U.S. traded security of a foreign corporation. |
| (c) | The rate listed is the fund’s seven-day yield as of April 30, 2018. |
| (d) | Investment represents five percent or more of the outstanding voting securities of the issuer, and is or was an affiliate of the Hennessy Focus Fund, as defined in the Investment Company Act of 1940, as amended, at or during the six-month period ended April 30, 2018. Details of transactions with these affiliated companies for the six-month period ended April 30, 2018, are as follows: |
| | | | American | | | Encore Capital | | | Marlin Business | |
| | Issuer | | Woodmark Corp. | | | Group, Inc. | | | Services Corp. | |
| | Beginning Cost | | $ | 54,953,784 | | | $ | 73,525,403 | | | $ | 15,865,289 | |
| | Purchase Cost | | $ | 10,108,023 | | | $ | — | | | $ | — | |
| | Sales Cost | | $ | — | | | $ | — | | | $ | — | |
| | Ending Cost | | $ | 65,061,807 | | | $ | 73,525,403 | | | $ | 15,865,289 | |
| | Dividend Income | | $ | — | | | $ | — | | | $ | 282,876 | |
| | Net Change in | | | | | | | | | | | | |
| | Unrealized Appreciation | | $ | (19,700,104 | ) | | $ | (4,178,750 | ) | | $ | 5,556,502 | |
| | Realized Gain/Loss | | $ | — | | | $ | — | | | $ | — | |
| | Shares | | | 1,350,360 | | | | 2,258,784 | | | | 1,010,273 | |
| | Market Value | | $ | 110,999,592 | | | $ | 100,741,766 | | | $ | 27,681,480 | |
The accompanying notes are an integral part of these financial statements.
| HENNESSY FUNDS | 1-800-966-4354 | |
Summary of Fair Value Exposure at April 30, 2018
The following is a summary of the inputs used to value the Fund’s net assets as of April 30, 2018 (See Note 3 in the accompanying notes to the financial statements):
| Common Stocks | | Level 1 | | | Level 2 | | | Level 3 | | | Total | |
| Consumer Discretionary | | $ | 653,851,899 | | | $ | — | | | $ | — | | | $ | 653,851,899 | |
| Financials | | | 764,456,831 | | | | — | | | | — | | | | 764,456,831 | |
| Health Care | | | 42,468,496 | | | | — | | | | — | | | | 42,468,496 | |
| Industrials | | | 338,204,176 | | | | — | | | | — | | | | 338,204,176 | |
| Information Technology | | | 180,154,658 | | | | — | | | | — | | | | 180,154,658 | |
| Total Common Stocks | | $ | 1,979,136,060 | | | $ | — | | | $ | — | | | $ | 1,979,136,060 | |
| REITS | | | | | | | | | | | | | | | | |
| Financials | | $ | 557,911,032 | | | $ | — | | | $ | — | | | $ | 557,911,032 | |
| Total REITS | | $ | 557,911,032 | | | $ | — | | | $ | — | | | $ | 557,911,032 | |
| Short-Term Investments | | | | | | | | | | | | | | | | |
| Money Market Funds | | $ | 42,770,056 | | | $ | — | | | $ | — | | | $ | 42,770,056 | |
| Total Short-Term Investments | | $ | 42,770,056 | | | $ | — | | | $ | — | | | $ | 42,770,056 | |
| Total Investments | | $ | 2,579,817,148 | | | $ | — | | | $ | — | | | $ | 2,579,817,148 | |
Transfers between levels are recognized at the end of the reporting period. During the six-month period ended April 30, 2018, the Fund recognized no transfers between levels.
The accompanying notes are an integral part of these financial statements.
HENNESSYFUNDS.COM
| SCHEDULE OF INVESTMENTS/STATEMENT OF ASSETS AND LIABILITIES |
Financial Statements
Statement of Assets and Liabilities as of April 30, 2018 (Unaudited) |
| ASSETS: | | | |
| Investments in unaffiliated securities, at value (cost $1,121,371,365) | | $ | 2,340,394,310 | |
| Investments in affiliated securities, at value (cost $154,452,499) | | | 239,422,838 | |
| Total investments in securities, at value (cost $1,275,823,864) | | | 2,579,817,148 | |
| Dividends and interest receivable | | | 530,169 | |
| Receivable for fund shares sold | | | 1,901,958 | |
| Receivable for securities sold | | | 9,581,055 | |
| Prepaid expenses and other assets | | | 75,137 | |
| Total Assets | | | 2,591,905,467 | |
| | | | | |
| LIABILITIES: | | | | |
| Payable for fund shares redeemed | | | 2,010,211 | |
| Payable to advisor | | | 1,930,064 | |
| Payable to administrator | | | 413,170 | |
| Payable to auditor | | | 10,258 | |
| Accrued distribution fees | | | 281,540 | |
| Accrued service fees | | | 128,653 | |
| Accrued trustees fees | | | 277 | |
| Accrued expenses and other payables | | | 518,579 | |
| Total Liabilities | | | 5,292,752 | |
| NET ASSETS | | $ | 2,586,612,715 | |
| | | | | |
| NET ASSETS CONSIST OF: | | | | |
| Capital stock | | $ | 1,269,048,712 | |
| Accumulated net investment loss | | | (16,408,820 | ) |
| Accumulated net realized gain on investments | | | 29,979,539 | |
| Unrealized net appreciation on investments | | | 1,303,993,284 | |
| Total Net Assets | | $ | 2,586,612,715 | |
| | | | | |
| NET ASSETS | | | | |
| Investor Class: | | | | |
| Shares authorized (no par value) | | Unlimited | |
| Net assets applicable to outstanding Investor Class shares | | $ | 1,558,965,276 | |
| Shares issued and outstanding | | | 18,104,324 | |
| Net asset value, offering price and redemption price per share | | $ | 86.11 | |
| | | | | |
| Institutional Class: | | | | |
| Shares authorized (no par value) | | Unlimited | |
| Net assets applicable to outstanding Institutional Class shares | | $ | 1,027,647,439 | |
| Shares issued and outstanding | | | 11,613,994 | |
| Net asset value, offering price and redemption price per share | | $ | 88.48 | |
The accompanying notes are an integral part of these financial statements.
| HENNESSY FUNDS | 1-800-966-4354 | |
Financial Statements
Statement of Operations for the six months ended April 30, 2018 (Unaudited) |
| INVESTMENT INCOME: | | | |
Dividend income from unaffiliated securities(1) | | $ | 10,660,391 | |
| Dividend income from affiliated securities | | | 282,876 | |
| Interest income | | | 702,397 | |
| Total investment income | | | 11,645,664 | |
| | | | | |
| EXPENSES: | | | | |
| Investment advisory fees (See Note 5) | | | 12,241,487 | |
| Sub-transfer agent expenses – Investor Class (See Note 5) | | | 1,708,150 | |
| Sub-transfer agent expenses – Institutional Class (See Note 5) | | | 456,429 | |
| Administration, fund accounting, custody and transfer agent fees (See Note 5) | | | 1,279,089 | |
| Distribution fees – Investor Class (See Note 5) | | | 1,236,796 | |
| Service fees – Investor Class (See Note 5) | | | 824,531 | |
| Reports to shareholders | | | 80,335 | |
| Federal and state registration fees | | | 36,649 | |
| Compliance expense (See Note 5) | | | 14,628 | |
| Trustees’ fees and expenses | | | 13,163 | |
| Audit fees | | | 10,860 | |
| Legal fees | | | 9,260 | |
| Other expenses | | | 88,784 | |
| Total expenses | | | 18,000,161 | |
| NET INVESTMENT LOSS | | $ | (6,354,497 | ) |
| | | | | |
| REALIZED AND UNREALIZED GAINS: | | | | |
| Net realized gain on: | | | | |
| Unaffiliated Investments | | $ | 29,979,615 | |
| Affiliated Investments | | | — | |
| Net change in unrealized appreciation on: | | | | |
| Unaffiliated Investments | | | 38,614,783 | |
| Affiliated Investments | | | (18,322,352 | ) |
| Net gain on investments | | | 50,272,046 | |
| NET INCREASE IN NET ASSETS RESULTING FROM OPERATIONS | | $ | 43,917,549 | |
(1) | Net of foreign taxes withheld of $197,635. |
The accompanying notes are an integral part of these financial statements.
HENNESSYFUNDS.COM
| STATEMENT OF OPERATIONS/STATEMENTS OF CHANGES IN NET ASSETS |
Financial Statements
| Statements of Changes in Net Assets |
| | | Six Months Ended | | | | |
| | | April 30, 2018 | | | Year Ended | |
| | | (Unaudited) | | | October 31, 2017 | |
| OPERATIONS: | | | | | | |
| Net investment loss | | $ | (6,354,497 | ) | | $ | (9,635,486 | ) |
| Net realized gain on investments | | | 29,979,615 | | | | 6,262,037 | |
| Net change in unrealized appreciation on investments | | | 20,292,431 | | | | 477,904,990 | |
| Net increase in net assets resulting from operations | | | 43,917,549 | | | | 474,531,541 | |
| | | | | | | | | |
| DISTRIBUTIONS TO SHAREHOLDERS FROM: | | | | | | | | |
| Net realized gains – Investor Class | | | (103,968 | ) | | | — | |
| Net realized gains – Institutional Class | | | (67,148 | ) | | | — | |
| Total distributions | | | (171,116 | ) | | | — | |
| | | | | | | | | |
| CAPITAL SHARE TRANSACTIONS: | | | | | | | | |
| Proceeds from shares subscribed – Investor Class | | | 67,357,142 | | | | 192,418,104 | |
| Proceeds from shares subscribed – Institutional Class | | | 107,759,674 | | | | 329,777,433 | |
| Dividends reinvested – Investor Class | | | 102,585 | | | | — | |
| Dividends reinvested – Institutional Class | | | 57,674 | | | | — | |
| Cost of shares redeemed – Investor Class | | | (209,551,666 | ) | | | (448,768,404 | ) |
| Cost of shares redeemed – Institutional Class | | | (155,180,417 | ) | | | (208,168,872 | ) |
| Net decrease in net assets derived | | | | | | | | |
| from capital share transactions | | | (189,455,008 | ) | | | (134,741,739 | ) |
| TOTAL INCREASE (DECREASE) IN NET ASSETS | | | (145,708,575 | ) | | | 339,789,802 | |
| | | | | | | | | |
| NET ASSETS: | | | | | | | | |
| Beginning of period | | | 2,732,321,290 | | | | 2,392,531,488 | |
| End of period | | $ | 2,586,612,715 | | | $ | 2,732,321,290 | |
| Undistributed net investment loss, end of period | | $ | (16,408,820 | ) | | $ | (10,054,323 | ) |
| | | | | | | | | |
| CHANGES IN SHARES OUTSTANDING: | | | | | | | | |
| Shares sold – Investor Class | | | 769,295 | | | | 2,500,539 | |
| Shares sold – Institutional Class | | | 1,198,236 | | | | 4,162,013 | |
| Shares issued to holders as reinvestment | | | | | | | | |
| of dividends – Investor Class | | | 1,169 | | | | — | |
| Shares issued to holders as reinvestment | | | | | | | | |
| of dividends – Institutional Class | | | 641 | | | | — | |
| Shares redeemed – Investor Class | | | (2,390,699 | ) | | | (5,805,953 | ) |
| Shares redeemed – Institutional Class | | | (1,724,145 | ) | | | (2,633,695 | ) |
| Net decrease in shares outstanding | | | (2,145,503 | ) | | | (1,777,096 | ) |
The accompanying notes are an integral part of these financial statements.
| HENNESSY FUNDS | 1-800-966-4354 | |
Financial Statements
For an Investor Class share outstanding throughout each period
| | Six Months Ended | |
| | April 30, 2018 | |
| | (Unaudited) | |
| PER SHARE DATA: | | | | |
| Net asset value, beginning of period | | $ | 84.92 | | |
| | | | | | |
| Income from investment operations: | | | | | |
| Net investment income (loss) | | | (0.34 | ) | |
| Net realized and unrealized gains (losses) on investments | | | 1.54 | | |
| Total from investment operations | | | 1.20 | | |
| | | | | | |
| Less distributions: | | | | | |
| Dividends from net investment income | | | — | | |
| Dividends from net realized gains | | | (0.01 | ) | |
| Total distributions | | | (0.01 | ) | |
| Paid-in capital from redemption fees | | | — | | |
| Net asset value, end of period | | $ | 86.11 | | |
| | | | | | |
| TOTAL RETURN | | | 1.41 | %(2) | |
| | | | | | |
| SUPPLEMENTAL DATA AND RATIOS: | | | | | |
| Net assets, end of period (millions) | | $ | 1,558.97 | | |
| Ratio of expenses to average net assets | | | 1.47 | %(3) | |
| Ratio of net investment income (loss) to average net assets | | | (0.61 | )%(3) | |
Portfolio turnover rate(4) | | | 0 | %(2) | |
(1) | Amount is less than $0.01. |
(2) | Not annualized. |
(3) | Annualized. |
(4) | Portfolio turnover is calculated on the basis of the Fund as a whole. |
The accompanying notes are an integral part of these financial statements.
HENNESSYFUNDS.COM
| FINANCIAL HIGHLIGHTS — INVESTOR CLASS |
| Year Ended October 31, | |
| 2017 | | | 2016 | | | 2015 | | | 2014 | | | 2013 | |
| | | | | | | | | | | | | | |
| $ | 70.63 | | | $ | 71.94 | | | $ | 69.46 | | | $ | 63.58 | | | $ | 51.78 | |
| | | | | | | | | | | | | | | | | | | |
| | | | | | | | | | | | | | | | | | | |
| | (0.51 | ) | | | (0.45 | ) | | | (0.33 | ) | | | 0.27 | | | | (0.32 | ) |
| | 14.80 | | | | (0.72 | ) | | | 8.07 | | | | 6.68 | | | | 16.44 | |
| | 14.29 | | | | (1.17 | ) | | | 7.74 | | | | 6.95 | | | | 16.12 | |
| | | | | | | | | | | | | | | | | | | |
| | | | | | | | | | | | | | | | | | | |
| | — | | | | — | | | | (0.02 | ) | | | — | | | | — | |
| | — | | | | (0.14 | ) | | | (5.24 | ) | | | (1.07 | ) | | | (4.32 | ) |
| | — | | | | (0.14 | ) | | | (5.26 | ) | | | (1.07 | ) | | | (4.32 | ) |
| | — | | | | — | | | | — | | | | 0.00 | (1) | | | 0.00 | (1) |
| $ | 84.92 | | | $ | 70.63 | | | $ | 71.94 | | | $ | 69.46 | | | $ | 63.58 | |
| | | | | | | | | | | | | | | | | | | |
| | 20.23 | % | | | (1.63 | )% | | | 11.83 | % | | | 11.05 | % | | | 33.54 | % |
| | | | | | | | | | | | | | | | | | | |
| | | | | | | | | | | | | | | | | | | |
| $ | 1,675.00 | | | $ | 1,626.71 | | | $ | 1,615.36 | | | $ | 1,213.03 | | | $ | 1,139.85 | |
| | 1.48 | % | | | 1.47 | % | | | 1.46 | % | | | 1.41 | % | | | 1.43 | % |
| | (0.51 | )% | | | (0.65 | )% | | | (0.55 | )% | | | 0.41 | % | | | (0.85 | )% |
| | 5 | % | | | 2 | % | | | 4 | % | | | 18 | % | | | 4 | % |
The accompanying notes are an integral part of these financial statements.
| HENNESSY FUNDS | 1-800-966-4354 | |
Financial Statements
For an Institutional Class share outstanding throughout each period
| | Six Months Ended | |
| | April 30, 2018 | |
| | (Unaudited) | |
| PER SHARE DATA: | | | | |
| Net asset value, beginning of period | | $ | 87.10 | | |
| | | | | | |
| Income from investment operations: | | | | | |
| Net investment income (loss) | | | (0.10 | ) | |
| Net realized and unrealized gains (losses) on investments | | | 1.49 | | |
| Total from investment operations | | | 1.39 | | |
| | | | | | |
| Less distributions: | | | | | |
| Dividends from net investment income | | | — | | |
| Dividends from net realized gains | | | (0.01 | ) | |
| Total distributions | | | (0.01 | ) | |
| Net asset value, end of period | | $ | 88.48 | | |
| | | | | | |
| TOTAL RETURN | | | 1.59 | %(1) | |
| | | | | | |
| SUPPLEMENTAL DATA AND RATIOS: | | | | | |
| Net assets, end of period (millions) | | $ | 1,027.65 | | |
| Ratio of expenses to average net assets | | | 1.10 | %(2) | |
| Ratio of net investment income (loss) to average net assets | | | (0.24 | )%(2) | |
Portfolio turnover rate(3) | | | 0 | %(1) | |
(1) | Not annualized. |
(2) | Annualized. |
(3) | Portfolio turnover is calculated on the basis of the Fund as a whole. |
The accompanying notes are an integral part of these financial statements.
HENNESSYFUNDS.COM
| FINANCIAL HIGHLIGHTS — INSTITUTIONAL CLASS |
| Year Ended October 31, | |
| 2017 | | | 2016 | | | 2015 | | | 2014 | | | 2013 | |
| | | | | | | | | | | | | | |
| $ | 72.17 | | | $ | 73.24 | | | $ | 70.50 | | | $ | 64.32 | | | $ | 52.19 | |
| | | | | | | | | | | | | | | | | | | |
| | | | | | | | | | | | | | | | | | | |
| | (0.11 | ) | | | (0.14 | ) | | | (0.08 | ) | | | 0.35 | | | | (0.13 | ) |
| | 15.04 | | | | (0.79 | ) | | | 8.19 | | | | 6.90 | | | | 16.58 | |
| | 14.93 | | | | (0.93 | ) | | | 8.11 | | | | 7.25 | | | | 16.45 | |
| | | | | | | | | | | | | | | | | | | |
| | | | | | | | | | | | | | | | | | | |
| | — | | | | — | | | | (0.05 | ) | | | — | | | | — | |
| | — | | | | (0.14 | ) | | | (5.32 | ) | | | (1.07 | ) | | | (4.32 | ) |
| | — | | | | (0.14 | ) | | | (5.37 | ) | | | (1.07 | ) | | | (4.32 | ) |
| $ | 87.10 | | | $ | 72.17 | | | $ | 73.24 | | | $ | 70.50 | | | $ | 64.32 | |
| | | | | | | | | | | | | | | | | | | |
| | 20.69 | % | | | (1.27 | )% | | | 12.23 | % | | | 11.40 | % | | | 33.94 | % |
| | | | | | | | | | | | | | | | | | | |
| | | | | | | | | | | | | | | | | | | |
| $ | 1,057.32 | | | $ | 765.82 | | | $ | 520.06 | | | $ | 283.31 | | | $ | 179.89 | |
| | 1.10 | % | | | 1.10 | % | | | 1.11 | % | | | 1.10 | % | | | 1.13 | % |
| | (0.13 | )% | | | (0.28 | )% | | | (0.19 | )% | | | 0.59 | % | | | (0.52 | )% |
| | 5 | % | | | 2 | % | | | 4 | % | | | 18 | % | | | 4 | % |
The accompanying notes are an integral part of these financial statements.
| HENNESSY FUNDS | 1-800-966-4354 | |
Financial Statements
Notes to the Financial Statements April 30, 2018 (Unaudited) |
1). ORGANIZATION
The Hennessy Focus Fund (the “Fund”) is a series of Hennessy Funds Trust (the “Trust”), which was organized as a Delaware statutory trust on September 17, 1992. The Fund is an open-end management investment company registered under the Investment Company Act of 1940, as amended. The investment objective of the Fund is capital appreciation. The Fund is a non-diversified fund.
The Fund offers Investor Class and Institutional Class shares. Each class of shares differs principally in its respective 12b-1 distribution and service, shareholder servicing, and sub-transfer agent expenses. There are no sales charges. Each class has identical rights to earnings, assets, and voting privileges, except for class-specific expenses and exclusive rights to vote on matters affecting only an individual class.
As an investment company, the Fund follows the investment company accounting and reporting guidance of the Financial Accounting Standards Board (“FASB”) Accounting Standard Codification Topic 946 “Financial Services—Investment Companies.”
2). SIGNIFICANT ACCOUNTING POLICIES
The following is a summary of significant accounting policies consistently followed by the Fund in the preparation of the financial statements. These policies conform to U.S. generally accepted accounting principles (“GAAP”).
| a). | Investment Valuation – All investments in securities are recorded at their estimated fair value, as described in Note 3. |
| | |
| b). | Federal Income Taxes – No provision for federal income taxes or excise taxes has been made because the Fund has elected to be taxed as a “regulated investment company” and intends to distribute substantially all of its taxable income to its shareholders and otherwise comply with the provisions of the Internal Revenue Code of 1986, as amended, applicable to regulated investment companies. Net investment income/loss and realized gains/losses for federal income tax purposes may differ from those reported in the financial statements because of temporary book and tax basis differences. Temporary differences are primarily the result of the treatment of wash sales for tax reporting purposes. The Fund recognizes interest and penalties related to income tax benefits, if any, in the Statement of Operations as an income tax expense. Distributions from net realized gains for book purposes may include short-term capital gains, which are included as ordinary income to shareholders for tax purposes. The Fund may utilize equalization accounting for tax purposes and designate earnings and profits, including net realized gains distributed to shareholders on redemption of shares, as part of the dividends paid deduction for income tax purposes. |
| | |
| c). | Accounting for Uncertainty in Income Taxes – The Fund has accounting policies regarding recognition and measurement of tax positions taken or expected to be taken on a tax return. The tax returns of the Fund for the prior three fiscal years are open for examination. The Fund has reviewed all open tax years in major jurisdictions and concluded that there is no impact on the Fund’s net assets and no tax liability resulting from unrecognized tax benefits relating to uncertain income tax positions taken or expected to be taken on a tax return. The Fund’s major tax jurisdictions are U.S. federal and Delaware. |
HENNESSYFUNDS.COM
| NOTES TO THE FINANCIAL STATEMENTS |
| d). | Income and Expenses – Dividend income is recognized on the ex-dividend date or as soon as information is available to the Fund. Interest income, which includes the amortization of premium and accretion of discount, is recognized on an accrual basis. The Fund is charged for those expenses that are directly attributable to the portfolio, such as advisory, administration, and certain shareholder service fees. Income, expenses (other than expenses attributable to a specific class), and realized and unrealized gains/losses on investments are allocated to each class of shares based on such class’s net assets. |
| | |
| e). | Distributions to Shareholders – Dividends from net investment income for the Fund, if any, are declared and paid annually, usually in December. Distributions of net realized capital gains, if any, are declared and paid annually, usually in December. |
| | |
| f). | Security Transactions – Investment and shareholder transactions are recorded on the trade date. The Fund determines the realized gain/loss from an investment transaction by comparing the original cost of the security lot sold with the net sale proceeds. Discounts and premiums on securities purchased are accreted or amortized, respectively, over the life of each such security. |
| | |
| g). | Use of Estimates – The preparation of financial statements in conformity with GAAP requires management to make estimates and assumptions that affect the reported amounts of assets and liabilities and disclosure of contingent assets and liabilities at the date of the financial statements and the reported change in net assets during the reporting period. Actual results could differ from those estimates. |
| | |
| h). | Share Valuation – The net asset value (“NAV”) per share of the Fund is calculated by dividing (i) the total value of the securities held by the Fund, plus cash and other assets, minus all liabilities (including estimated accrued expenses) by (ii) the total number of shares outstanding for the Fund, rounded to the nearest cent. The Fund’s shares will not be priced on days the New York Stock Exchange is closed for trading. The offering and redemption price per share for the Fund is equal to the Fund’s NAV per share. |
3). SECURITIES VALUATION
The Fund follows fair valuation accounting standards that establish an authoritative definition of fair value and set out a hierarchy for measuring fair value. These standards require additional disclosures about the various inputs and valuation techniques used to develop the measurements of fair value and a discussion of changes in valuation techniques and related inputs during the period. These inputs are summarized in the three broad levels listed below:
| | Level 1 – | Unadjusted, quoted prices in active markets for identical instruments that the Fund has the ability to access at the date of measurement. |
| | | |
| | Level 2 – | Other significant observable inputs (including, but not limited to, quoted prices in active markets for similar instruments, quoted prices in markets that are not active for identical or similar instruments, and model-derived valuations in which all significant inputs and significant value drivers are observable in active markets (such as interest rates, prepayment speeds, credit risk curves, default rates, and similar data)). |
| | | |
| | Level 3 – | Significant unobservable inputs (including the Fund’s own assumptions about what market participants would use to price the asset or liability based on the best available information) when observable inputs are unavailable. |
Following is a description of the valuation techniques applied to the Fund’s major categories of assets and liabilities measured at fair value on a recurring basis.
| HENNESSY FUNDS | 1-800-966-4354 | |
| | Equity Securities – Equity securities, including common stocks, preferred stocks, foreign-issued common stocks, exchange-traded funds, closed-end mutual funds, partnerships, rights, and real estate investment trusts, that are traded on a securities exchange for which a last-quoted sales price is readily available will generally be valued at the last sales price as reported by the primary exchange on which the securities are listed. Securities listed on The NASDAQ Stock Market (“NASDAQ”) will generally be valued at the NASDAQ Official Closing Price, which may differ from the last sales price reported. Securities traded on a securities exchange for which a last-quoted sales price is not readily available will generally be valued at the mean between the bid and ask prices. To the extent these securities are actively traded and valuation adjustments are not applied, they are classified in Level 1 of the fair value hierarchy. Securities traded on foreign exchanges generally are not valued at the same time the Fund calculates its NAV because most foreign markets close well before such time. The earlier close of most foreign markets gives rise to the possibility that significant events, including broad market moves, may have occurred in the interim. In certain circumstances, it may be determined that a security needs to be fair valued because it appears that the value of the security might have been materially affected by events occurring after the close of the market in which the security is principally traded, but before the time the Fund calculates its NAV, such as by a development that affects an entire market or region (e.g., a weather-related event) or a potentially global development (e.g., a terrorist attack that may be expected to have an effect on investor expectations worldwide). |
| | |
| | Registered Investment Companies – Investments in registered investment companies (e.g., mutual funds) are generally priced at the ending NAV provided by the applicable registered investment company’s service agent and will be classified in Level 1 of the fair value hierarchy. |
| | |
| | Debt Securities – Debt securities, including corporate bonds, asset-backed securities, mortgage-backed securities, municipal bonds, U.S. Treasuries, and U.S. government agency issues, are generally valued at market on the basis of valuations furnished by an independent pricing service that utilizes both dealer-supplied valuations and formula-based techniques. The pricing service may consider recently executed transactions in securities of the issuer or comparable issuers, market price quotations (where observable), bond spreads, and fundamental data relating to the issuer. In addition, the model may incorporate observable market data, such as reported sales of similar securities, broker quotes, yields, bids, offers, and reference data. Certain securities are valued primarily using dealer quotations. These securities are generally classified in Level 2 of the fair value hierarchy. |
| | |
| | Short-Term Securities – Short-term equity investments, including money market funds, are valued in the manner specified above. Short-term debt investments with an original term to maturity of 60 days or less are valued at amortized cost, which approximates fair market value. If the original term to maturity of a short-term debt investment exceeded 60 days, then the values as of the 61st day prior to maturity are amortized. Amortized cost is not used if its use would be inappropriate due to credit or other impairments of the issuer, in which case the security’s fair value would be determined, as described below. Short-term securities are generally classified in Level 1 or Level 2 of the fair market hierarchy depending on the inputs used and market activity levels for specific securities. |
The Board of Trustees of the Fund (the “Board”) has adopted fair value pricing procedures that are followed when a price for a security is not readily available or if a significant event has occurred that indicates the closing price of a security no longer
HENNESSYFUNDS.COM
| NOTES TO THE FINANCIAL STATEMENTS |
represents the true value of that security. Fair value pricing determinations are made in good faith in accordance with these procedures. There are numerous criteria that will be given consideration in determining a fair value of a security, such as the trading volume of a security and markets, the values of other similar securities, and news events with direct bearing on a security or markets. Fair value pricing results in an estimated price for a security that reflects the amount the Fund might reasonably expect to receive in a current sale. Depending on the relative significance of the valuation inputs, these securities may be classified in either Level 2 or Level 3 of the fair value hierarchy.
The fair valuation of foreign securities may be determined with the assistance of a pricing service using correlations between the movement of prices of such securities and indices of domestic securities and other appropriate indicators, such as closing market prices of relevant American Depositary Receipts or futures contracts. The effect of using fair value pricing is that the Fund’s NAV will reflect the affected portfolio securities’ values as determined by the Board or its designee instead of being determined by the market. Using a fair value pricing methodology to price a foreign security may result in a value that is different from such foreign security’s most recent closing price and from the value used by other investment companies to calculate their NAVs. Such securities are generally classified in Level 2 of the fair valuation hierarchy. Because the Fund may invest in foreign securities, the value of the Fund’s portfolio securities may change on days when you will not be able to purchase or redeem your shares.
The Board has delegated day-to-day valuation matters to a Valuation Committee comprised of one or more representatives from Hennessy Advisors, Inc., the Fund’s investment advisor (the “Advisor”). The function of the Valuation Committee is to value securities where current and reliable market quotations are not readily available. All actions taken by the Valuation Committee are reviewed by the Board.
The Fund has performed an analysis of all existing investments to determine the significance and character of all inputs to their fair value determinations. Various inputs are used to determine the value of the Fund’s investments. The inputs or methodology used for valuing securities are not necessarily an indication of the risk associated with investing in those securities. Details related to the fair valuation hierarchy of the Fund’s securities as of April 30, 2018, are included in the Schedule of Investments.
4). INVESTMENT TRANSACTIONS
Purchases and sales of investment securities (excluding government and short-term investments) for the Fund during the six months ended April 30, 2018, were $10,108,022 and $79,410,068, respectively.
There were no purchases or sales/maturities of long-term U.S. government securities for the Fund during the six months ended April 30, 2018.
The Fund is permitted to purchase or sell securities from or to another fund in the Hennessy Funds family of funds (the “Hennessy Funds”) under specified conditions outlined in procedures adopted by the Board. The procedures have been designed to ensure that any purchase or sale of securities by the Fund from or to another Hennessy Fund complies with Rule 17a-7 of the Investment Company Act of 1940, as amended. During the six months ended April 30, 2018, the Fund did not engage in purchases or sales of securities pursuant to Rule 17a-7 of the Investment Company Act of 1940, as amended.
5). INVESTMENT MANAGEMENT FEE AND OTHER TRANSACTIONS WITH AFFILIATES
The Advisor provides the Fund with investment management services under an Investment Advisory Agreement. The Advisor furnishes all investment advice, office space, and facilities, as well as most of the personnel needed by the Fund. As
| HENNESSY FUNDS | 1-800-966-4354 | |
compensation for its services, the Advisor is entitled to a monthly fee from the Fund. The fee is based upon the average daily net assets of the Fund at an annual rate of 0.90%. The net investment advisory fees expensed by the Fund during the six months ended April 30, 2018, are included in the Statement of Operations.
The Advisor has delegated the day-to-day management of the Fund to a sub-advisor, Broad Run Investment Management, LLC. The Advisor pays the sub-advisory fees from its own assets, and these fees are not an additional expense of the Fund. For the most recent fiscal year, the Advisor (not the Fund) paid a sub-advisory fee, based upon the daily net assets of the Fund, at a rate of 0.29%.
The Board has approved a Shareholder Servicing Agreement for Investor Class shares of the Fund, which was instituted to compensate the Advisor for the non-investment management services it provides to the Fund. The Shareholder Servicing Agreement provides for a monthly fee paid to the Advisor at an annual rate of 0.10% of the average daily net assets of the Fund attributable to Investor Class shares. The shareholder service fees expensed by the Fund during the six months ended April 30, 2018, are included in the Statement of Operations.
The Fund has adopted a plan pursuant to Rule 12b-1 under the Investment Company Act of 1940, as amended, that authorizes payments in connection with the distribution of the Fund’s shares at an annual rate of up to 0.25% of the Fund’s average daily net assets attributable to Investor Class shares. Even though the authorized rate is up to 0.25%, the Fund is currently only using up to 0.15% of its average daily net assets attributable to Investor Class shares for such purpose. Amounts paid under the plan may be spent on any activities or expenses primarily intended to result in the sale of shares, including, but not limited to, advertising, shareholder account servicing, the printing and mailing of prospectuses to other than current shareholders, the printing and mailing of sales literature, and compensation for sales and marketing activities or to financial institutions and others, such as dealers and distributors. The distribution fees expensed by the Fund during the six months ended April 30, 2018, are included in the Statement of Operations.
The Fund has entered into agreements with various brokers, dealers, and financial intermediaries in connection with the sale of shares of the Fund. The agreements provide for periodic payments by the Fund to the brokers, dealers, and financial intermediaries for providing certain shareholder maintenance services (sub-transfer agent expenses). These shareholder services include the pre-processing and quality control of new accounts, shareholder correspondence, answering customer inquiries regarding account status, and facilitating shareholder telephone transactions. The sub-transfer agent fees expensed by the Fund during the six months ended April 30, 2018, are included in the Statement of Operations.
U.S. Bancorp Fund Services, LLC (“USBFS”) provides the Fund with administrative, fund accounting, and transfer agent services. As administrator, USBFS is responsible for activities such as (i) preparing various federal and state regulatory filings, reports, and returns for the Fund, (ii) preparing reports and materials to be supplied to the Board, (iii) monitoring the activities of the Fund’s custodian, transfer agent, and accountants, and (iv) coordinating the preparation and payment of the Fund’s expenses and reviewing the Fund’s expense accruals. U.S. Bank N.A., an affiliate of USBFS, serves as the Fund’s custodian. The servicing agreements between the Trust and USBFS and U.S. Bank N.A. contain a fee schedule that is inclusive of administrative, fund accounting, custody, and transfer agent fees. The administrative, fund accounting, custody, and transfer agent fees expensed by the Fund during the six months ended April 30, 2018, are included in the Statement of Operations.
HENNESSYFUNDS.COM
| NOTES TO THE FINANCIAL STATEMENTS |
Quasar Distributors, LLC acts as the Fund’s principal underwriter in a continuous public offering of the Fund’s shares. Quasar Distributors, LLC is an affiliate of USBFS and U.S. Bank N.A.
The officers of the Fund are affiliated with the Advisor. Such officers, with the exception of the Chief Compliance Officer and the Senior Compliance Officer, receive no compensation from the Fund for serving in their respective roles. The Fund, along with the other Hennessy Funds, makes reimbursement payments, on an equal basis, to the Advisor for a portion of the salary and benefits associated with the office of the Chief Compliance Officer and for all of the salary and benefits associated with the office of the Senior Compliance Officer. The compliance fees expensed by the Fund during the six months ended April 30, 2018, are included in the Statement of Operations.
6). GUARANTEES AND INDEMNIFICATIONS
Under the Hennessy Funds’ organizational documents, their officers and trustees are indemnified by the Hennessy Funds against certain liabilities arising out of the performance of their duties to the Hennessy Funds. Additionally, in the normal course of business, the Hennessy Funds enter into contracts with service providers that contain general indemnification clauses. The Fund’s maximum exposure under these arrangements is unknown as this would involve future claims that may be made against the Fund that have not yet occurred. Currently, the Fund expects the risk of loss to be remote.
7). LINE OF CREDIT
The Fund has an uncommitted line of credit with the other Hennessy Funds in the amount of the lesser of (i) $100,000,000 or (ii) 33.33% of each Hennessy Fund’s net assets, or 30% for the Hennessy Gas Utility Fund and 10% for the Hennessy Balanced Fund, intended to provide short-term financing, if necessary, subject to certain restrictions, in connection with shareholder redemptions. The credit facility is with the Hennessy Funds’ custodian bank, U.S. Bank N.A. Borrowings under this arrangement bear interest at the bank’s prime rate and are secured by all of the Fund’s assets (as to its own borrowings only). During the six months ended April 30, 2018, the Fund did not have any borrowings outstanding under the line of credit.
8). FEDERAL TAX INFORMATION
As of October 31, 2017, the Fund’s most recent fiscal year end, the components of accumulated earnings (losses) for income tax purposes were as follows:
| | | | Investments | |
| | Cost of investments for tax purposes | | $ | 1,447,856,078 | |
| | Gross tax unrealized appreciation | | $ | 1,307,230,638 | |
| | Gross tax unrealized depreciation | | | (23,529,785 | ) |
| | Net tax unrealized appreciation | | $ | 1,283,700,853 | |
| | Undistributed ordinary income | | $ | — | |
| | Undistributed long-term capital gains | | | 171,040 | |
| | Total distributable earnings | | $ | 171,040 | |
| | Other accumulated loss | | $ | (10,054,323 | ) |
| | Total accumulated gain | | $ | 1,273,817,570 | |
As of October 31, 2017, the Fund’s most recent fiscal year end, the Fund had no tax basis capital losses to offset future capital gains.
During fiscal year 2017, the Fund’s most recent fiscal year, the capital losses utilized by the Fund were $6,090,997.
| HENNESSY FUNDS | 1-800-966-4354 | |
As of October 31, 2017, the Fund’s most recent fiscal year end, the Fund deferred, on a tax basis, a late-year ordinary loss of $10,054,323. Late-year ordinary losses are net ordinary losses incurred after December 31, 2016, but within the taxable year, that are deemed to arise on the first day of the Fund’s next taxable year.
During fiscal year 2018 (year to date) and fiscal year 2017, the tax character of distributions paid by the Fund was as follows:
| | | | Six Months Ended | | | Year Ended | |
| | | | April 30, 2018 | | | October 31, 2017 | |
| | Ordinary income(1) | | $ | — | | | $ | — | |
| | Long-term capital gain | | | 171,116 | | | | — | |
| | | | $ | 171,116 | | | $ | — | |
(1) Ordinary income includes short-term gain/loss.
9). EVENTS SUBSEQUENT TO PERIOD END
Management has evaluated the Fund’s related events and transactions that occurred subsequent to April 30, 2018, through the date of issuance of the Fund’s financial statements. Management has determined that there were no subsequent events requiring recognition or disclosure in the financial statements.
HENNESSYFUNDS.COM
| NOTES TO THE FINANCIAL STATEMENTS |
(This Page Intentionally Left Blank.)
| HENNESSY FUNDS | 1-800-966-4354 | |
Expense Example (Unaudited)
April 30, 2018
As a shareholder of the Fund, you incur two types of costs: (1) transaction costs, including sales charges (loads) on purchase payments, reinvested dividends, or other distributions; redemption fees; and exchange fees; and (2) ongoing costs, including management fees; service fees; and other Fund expenses. This Example is intended to help you understand your ongoing costs (in dollars) of investing in the Fund and to compare these costs with the ongoing costs of investing in other mutual funds. The Example is based on an investment of $1,000 invested at the beginning of the period and held for the entire period from November 1, 2017, through April 30, 2018.
Actual Expenses
The first line of the table below under the “Investor Class” and “Institutional Class” headings provides information about actual account values and actual expenses. Although the Fund charges no sales loads or transaction fees, you will be assessed fees for outgoing wire transfers, returned checks and stop payment orders at prevailing rates charged by U.S. Bancorp Fund Services, LLC, the Fund’s transfer agent. If you request that a redemption be made by wire transfer, currently a $15 fee is charged by the Fund’s transfer agent. IRA accounts will be charged a $15 annual maintenance fee. The example below includes, but is not limited to, management fees, shareholder servicing fees, fund accounting, custody, and transfer agent fees. However, the example below does not include portfolio trading commissions and related expenses, and other extraordinary expenses as determined under generally accepted accounting principles. You may use the information in this line, together with the amount you invested, to estimate the expenses that you paid over the period. Simply divide your account value by $1,000 (for example, an $8,600 account value divided by $1,000 = 8.6), then multiply the result by the number in the first line of the table under the “Investor Class” or “Institutional Class” headings in the column entitled “Expenses Paid During Period” to estimate the expenses you paid on your account during this period.
Hypothetical Example for Comparison Purposes
The second line of the table below under the “Investor Class” and “Institutional Class” headings provides information about hypothetical account values and hypothetical expenses based on the Fund’s actual expense ratios and an assumed rate of return of 5% per year before expenses, which is not the Fund’s actual return. The hypothetical account values and expenses may not be used to estimate the actual ending account balance or expenses you paid for the period. You may use this information to compare the ongoing costs of investing in the Fund and other funds. To do so, compare this 5% hypothetical example with the 5% hypothetical examples that appear in the shareholder reports of the other funds. Please note that the expenses shown in the table are meant to highlight your ongoing costs only and do not reflect any transactional costs, such as sales charges (loads), or exchange fees. Therefore, the second line of the table under the “Investor Class” and “Institutional Class” headings is useful in comparing ongoing costs only, and will not help you determine the relative total costs of owning different funds. In addition, if these transactional costs were included, your costs would have been higher.
HENNESSYFUNDS.COM
| | | | Expenses Paid |
| | Beginning | Ending | During Period(1) |
| | Account Value | Account Value | November 1, 2017 – |
| | November 1, 2017 | April 30, 2018 | April 30, 2018 |
| Investor Class | | | |
| Actual | $1,000.00 | $1,014.10 | $7.34 |
| Hypothetical (5% return before expenses) | $1,000.00 | $1,017.50 | $7.35 |
| | | | |
| Institutional Class | | | |
| Actual | $1,000.00 | $1,015.90 | $5.50 |
| Hypothetical (5% return before expenses) | $1,000.00 | $1,019.34 | $5.51 |
(1) | Expenses are equal to the Fund’s expense ratio of 1.47% for Investor Class shares or 1.10% for Institutional Class shares, as applicable, multiplied by the average account value over the period, multiplied by 181/365 days (to reflect one-half year period). |
| HENNESSY FUNDS | 1-800-966-4354 | |
How to Obtain a Copy of the Fund’s
Proxy Voting Policy and Proxy Voting Records
A description of the policies and procedures the Fund uses to determine how to vote proxies relating to portfolio securities is available without charge (1) by calling 1-800-966-4354, (2) on the Hennessy Funds’ website at hennessyfunds.com/proxy-voting/voting-policy, or (3) on the U.S. Securities and Exchange Commission’s (the “SEC”) website at www.sec.gov. The Fund’s proxy voting record is available without charge on both the Hennessy Funds’ website at hennessyfunds.com/proxy-voting/voting-record and the SEC’s website at www.sec.gov no later than August 31 for the prior 12 months ending June 30.
Quarterly Filings on Form N-Q
The Fund files a complete schedule of portfolio holdings with the SEC for the first and third quarters of each fiscal year on Form N-Q. The Fund’s Forms N-Q are available on the SEC’s website at www.sec.gov. The Fund’s Forms N-Q may be reviewed and copied at the SEC’s Public Reference Room in Washington, DC and information on the operation of the Public Reference Room may be obtained by calling 1-800-SEC-0330. Information included in the Fund’s Forms N-Q will also be available upon request by calling 1-800-966-4354.
Important Notice Regarding Delivery of
Shareholder Documents
To help keep the Fund’s costs as low as possible, we generally deliver a single copy of shareholder reports, proxy statements, and prospectuses to shareholders who share an address and have the same last name. This process does not apply to account statements. You may request an individual copy of a shareholder document at any time. If you would like to receive separate mailings of shareholder documents, please call U.S. Bancorp Fund Services, LLC at 1-800-261-6950 or 1-414-765-4124, and individual delivery will begin within 30 days of your request. If your account is held through a financial institution or other intermediary, please contact such intermediary directly to request individual delivery.
HENNESSYFUNDS.COM
| PROXY VOTING — BOARD APPROVAL OF INVESTMENT ADVISORY AGREEMENTS |
Board Approval of Investment Advisory
Agreements
At its meeting on March 7, 2018, the Board of Trustees of the Fund (the “Board,” and the members thereof, the “Trustees”) unanimously approved the continuation of the investment advisory agreement of the Fund with Hennessy Advisors, Inc. (the “Advisor”) and the sub-advisory agreement of the Fund between the Advisor and Broad Run Investment Management, LLC. (the “Sub-Advisor”). As part of the process of approving the continuation of the advisory and sub-advisory agreements, the Trustees reviewed their fiduciary duties with respect to approving the advisory and sub-advisory agreements and the relevant factors for them to consider. In addition, the Trustees who are not deemed “interested persons” (as defined by the Investment Company Act of 1940, as amended) of the Fund (the “Independent Trustees”) met in executive session to discuss the approval of the advisory and sub-advisory agreements.
In advance of the meeting, the Advisor sent detailed information to the Trustees to assist them in their evaluation of the advisory and sub-advisory agreements. This information included, but was not limited to, the following:
| | (1) | A memorandum from outside legal counsel that described the fiduciary duties of the Board with respect to approving the continuation of the advisory and sub-advisory agreements and the relevant factors for consideration; |
| | | |
| | (2) | A memorandum from the Advisor that listed the factors relevant to the Board’s approval of the continuation of the advisory and sub-advisory agreements and also referenced the documents that had been provided to help the Board assess each such factor; |
| | | |
| | (3) | An inventory of the range of services provided by the Advisor and the Sub-Advisor to the Fund; |
| | | |
| | (4) | A written discussion of economies of scale; |
| | | |
| | (5) | The advisory and sub-advisory agreements; |
| | | |
| | (6) | A recent Fund fact sheet, which included, among other things, performance information over various periods; |
| | | |
| | (7) | A peer expense comparison of both the net expense ratio and investment advisory fee of the Fund; |
| | | |
| | (8) | The Advisor’s most recent Form 10-K and Form 10-Q, which includes information about the Advisor’s profitability; |
| | | |
| | (9) | Information about brokerage commissions; |
| | | |
| | (10) | Information about the Fund’s compliance program; |
| | | |
| | (11) | The Advisor’s current Form ADV Part I; |
| | | |
| | (12) | A completed questionnaire from the Sub-Advisor and summary thereof; |
| | | |
| | (13) | The Sub-Advisor’s Code of Ethics; |
| | | |
| | (14) | The Sub-Advisor’s Form ADV Parts I and II; and |
| | | |
| | (15) | Financial information for the Sub-Advisor. |
All of the factors discussed were considered as a whole by the Trustees, and also by the Independent Trustees meeting in executive session. The factors were viewed in their totality by the Trustees, with no single factor being the principal or determinative factor in
| HENNESSY FUNDS | 1-800-966-4354 | |
the Trustees’ determination of whether to approve the continuation of the advisory and sub-advisory agreements. The Trustees recognized that the management and fee arrangements for the Fund are the result of years of review and discussion between the Independent Trustees and the Advisor, that certain aspects of such arrangements may receive greater scrutiny in some years than in others, and that the Trustees’ conclusions may be based, in part, on their consideration of these same arrangements and information received during the course of the year and in prior years.
Prior to approving the continuation of the advisory and sub-advisory agreements, the Trustees, including the Independent Trustees in executive session, considered, among other items:
| | (1) | The nature and quality of the advisory services provided by the Advisor and the Sub-Advisor; |
| | | |
| | (2) | A comparison of the fees and expenses of the Fund to other similar funds; |
| | | |
| | (3) | Whether economies of scale are recognized by the Fund; |
| | | |
| | (4) | The costs and profitability of the Fund to the Advisor and the Sub-Advisor; |
| | | |
| | (5) | The performance of the Fund; and |
| | | |
| | (6) | Any benefits to the Advisor and the Sub-Advisor from serving as an investment advisor to the Fund (other than the advisory and sub-advisory fees). |
The material considerations and determinations of the Trustees, including the Independent Trustees, were as follows:
| | (1) | The Trustees considered the services identified below that are provided by the Advisor. Based on this review, the Trustees concluded that the Advisor provides high-quality services to the Fund, and they noted that their overall confidence in the Advisor is high. The Trustees also concluded that they were satisfied with the nature, extent, and quality of the advisory services provided to the Fund by the Advisor, and that the nature and extent of the services provided by the Advisor are appropriate to assure that the Fund’s operations are conducted in compliance with applicable laws, rules, and regulations. |
| | | (a) | The Advisor oversees the Sub-Advisor for the Fund, and the Sub-Advisor acts as the portfolio manager for the Fund. |
| | | | |
| | | (b) | The Advisor performs a daily reconciliation of portfolio positions and cash for the Fund. |
| | | | |
| | | (c) | The Advisor monitors the Fund’s compliance with its investment objectives and restrictions. |
| | | | |
| | | (d) | The Advisor monitors compliance with federal securities laws and performs activities such as maintaining a compliance program, conducting ongoing reviews of the compliance programs of the Sub-Advisor and the Fund’s other service providers, conducting on-site visits to the Sub-Advisor and the Fund’s other service providers, monitoring incidents of abusive trading practices, reviewing Fund expense accruals, payments, and fixed expense ratios, evaluating insurance providers for fidelity bond coverage and D&O/E&O insurance coverage, conducting employee compliance training, reviewing reports provided by service providers, maintaining books and records, and preparing an annual compliance report for the Board. |
HENNESSYFUNDS.COM
| BOARD APPROVAL OF INVESTMENT ADVISORY AGREEMENTS |
| | | (e) | The Advisor oversees the selection and continued employment of the Sub-Advisor, reviews the Fund’s investment performance, and monitors the Sub-Advisor’s adherence to the Fund’s investment objectives, policies, and restrictions. |
| | | | |
| | | (f) | The Advisor oversees service providers that provide accounting, administration, distribution, transfer agency, custodial, sales, marketing, public relations, audit, information technology, and legal services to the Fund. |
| | | | |
| | | (g) | The Advisor maintains in-house marketing and distribution departments on behalf of the Fund. |
| | | | |
| | | (h) | The Advisor is actively involved with preparing regulatory filings for the Fund, including writing and annually updating the Fund’s prospectus and related documents. |
| | | | |
| | | (i) | The Advisor reviews the written summary prepared by the Sub-Advisor of the Fund’s performance for the most recent 12-month period for each annual report of the Fund. |
| | | | |
| | | (j) | The Advisor oversees distribution of the Fund through third-party broker/dealers and independent financial institutions such as Charles Schwab, Inc., Fidelity, TD Waterhouse, and Pershing. The Advisor participates in “no transaction fee” (“NTF”) programs with these companies on behalf of the Fund, which allow customers to purchase the Fund through third-party distribution channels without paying a transaction fee. The Advisor compensates, in part, a number of these third-party providers of NTF programs out of its own revenues. |
| | | | |
| | | (k) | The Advisor pays the incentive compensation of the Fund’s compliance officers and employs other staff, such as legal, marketing, national accounts, distribution, sales, administrative, and trading oversight personnel, as well as management executives. |
| | | | |
| | | (l) | The Advisor provides a quarterly compliance certification to the Board. |
| | | | |
| | | (m) | The Advisor prepares or reviews Board materials, frequently presents to the Board or leads Board discussions, prepares or reviews meeting minutes, and arranges for Board training and education. |
| | (2) | The Trustees considered the services identified below that are provided by the Sub-Advisor: |
| | | (a) | The Sub-Advisor acts as the portfolio manager for the Fund. In this capacity, the Sub-Advisor does the following: |
| | | | (i) | manages the composition of the Fund’s portfolio, including the purchase, retention, and disposition of portfolio securities in accordance with the Fund’s investment objectives, policies, and restrictions; |
| | | | | |
| | | | (ii) | ensures compliance with “best execution” for the Fund’s portfolio; |
| | | | | |
| | | | (iii) | manages the use of soft dollars for the Fund; and |
| | | | | |
| | | | (iv) | manages proxy voting for the Fund. |
| | | (b) | The Sub-Advisor ensures that its compliance program includes policies and procedures relevant to the Fund and the Sub-Advisor’s duties as a portfolio manager to the Fund. |
| HENNESSY FUNDS | 1-800-966-4354 | |
| | | (c) | The Sub-Advisor prepares a written summary of the Fund’s performance (with respect to the equity allocation or the fixed income allocation, as applicable) for the most recent 12-month period for each annual report of the Fund. |
| | | | |
| | | (d) | The Sub-Advisor provides a quarterly compliance certification to the Board regarding trading and allocation practices, supervisory matters, the Sub-Advisor’s compliance program (including its code of ethics), compliance with the Fund’s policies, and general firm updates. |
| | (3) | The Trustees considered the distinction between the services performed by the Advisor and the Sub-Advisor. The Trustees noted that the management of the Fund, including the oversight of the Sub-Advisor, involves more comprehensive and substantive duties than the duties of the Sub-Advisor. Specifically, the Trustees considered the lists of services identified above and concluded that the services performed by the Advisor for the Fund require a higher level of service and oversight than the services performed by the Sub-Advisor. Based on this determination, the Trustees concluded that the differential in advisory fees between the Advisor and the Sub-Advisor is reasonable. |
| | | |
| | (4) | The Trustees compared the performance of the Fund to benchmark indices over various time periods and also noted that the Trustees review and discuss reports comparing the investment performance of the Fund to various indices at each quarterly Board meeting. Based on all such information, the Trustees believe that the Advisor and the Sub-Advisor manage the Fund in a manner that is materially consistent with its stated investment objective and style. The Trustees concluded that the performance of the Fund over various time periods warranted the continuation of the advisory and sub-advisory agreements. |
| | | |
| | (5) | The Trustees reviewed the advisory fees and overall expense ratios of the Fund compared to other funds similar in asset size and investment objective to the Fund using data from Morningstar. As part of the discussion with management, the Trustees ensured that they understood and were comfortable with the criteria used to determine the mutual funds included in the Morningstar categories for purposes of the materials considered at the meeting. The Trustees determined that the advisory fee and overall expense ratio of the Fund falls within the range of the advisory fees and overall expense ratios of other comparable funds and concluded that they are reasonable and warranted continuation of the advisory and sub-advisory agreements. |
| | | |
| | (6) | The Trustees also considered whether economies of scale were being realized by the Advisor that should be shared with the Fund’s shareholders. The Trustees noted that many of the expenses incurred to manage the Fund are asset-based fees and thus do not result in material economies of scale being realized as the assets of the Fund increase. For example, mutual fund platform fees increase as the Fund’s assets grow. The Trustees also considered the Advisor’s efforts to contain expenses, the Advisor’s significant marketing efforts to promote the Funds, and the Advisor’s agreement to waive fees or lower its management fees in certain circumstances. The Trustees determined that it did not appear that there were significant economies of scale being realized by the Advisor and concluded that it would continue to monitor economies of scale in the future as circumstances changed. |
HENNESSYFUNDS.COM
| BOARD APPROVAL OF INVESTMENT ADVISORY AGREEMENTS |
| | (7) | The Trustees considered the profitability of the Advisor and the Sub-Advisor, including the impact of mutual fund platform fees on the Advisor’s profitability, and also considered the resources and revenues that the Advisor has put into managing and distributing the Fund. The Trustees then concluded that the profits of the Advisor and the Sub-Advisor are reasonable and not excessive when compared to profitability guidelines set forth in relevant court cases. |
| | | |
| | (8) | The Trustees considered the high level of professionalism and knowledge of the Advisor’s employees, along with a very low level of turnover, and concluded that this was beneficial to the Fund and its shareholders. |
| | | |
| | (9) | The Trustees considered any benefits to the Advisor and the Sub-Advisor from serving as an advisor to the Fund (other than the advisory and sub-advisory fees). The Trustees noted that the Advisor and the Sub-Advisor may derive ancillary benefits from, by way of example, their association with the Fund in the form of proprietary and third-party research products and services received from broker-dealers that execute portfolio trades for the Fund. The Trustees determined that any such products and services have been used for legitimate purposes relating to the Fund by providing assistance in the investment decision-making process. The Trustees concluded that any additional benefits realized by the Advisor and the Sub-Advisor from their relationship with the Fund were reasonable. |
After reviewing the materials provided at the meeting and management’s presentation, as well as other information regularly provided at the Board’s quarterly meetings throughout the year regarding the quality of services provided by the Advisor and the Sub-Advisor, the performance of the Fund, expense information, regulatory compliance issues, trading information and related matters, and other factors that the Trustees deemed relevant, the Trustees, including the Independent Trustees, approved the continuation of the advisory and sub-advisory agreements.
| HENNESSY FUNDS | 1-800-966-4354 | |
(This Page Intentionally Left Blank.)
For information, questions or assistance, please call
The Hennessy Funds
1-800-966-4354 or 1-415-899-1555
INVESTMENT ADVISOR
Hennessy Advisors, Inc.
7250 Redwood Boulevard, Suite 200
Novato, California 94945
ADMINISTRATOR,
TRANSFER AGENT,
DIVIDEND PAYING AGENT &
SHAREHOLDER SERVICING AGENT
U.S. Bancorp Fund Services, LLC
P.O. Box 701
Milwaukee, Wisconsin 53201-0701
CUSTODIAN
U.S. Bank N.A.
Custody Operations
1555 North River Center Drive, Suite 302
Milwaukee, Wisconsin 53212
TRUSTEES
Neil J. Hennessy
Robert T. Doyle
J. Dennis DeSousa
Gerald P. Richardson
COUNSEL
Foley & Lardner LLP
777 East Wisconsin Avenue
Milwaukee, Wisconsin 53202-5306
INDEPENDENT REGISTERED
PUBLIC ACCOUNTING FIRM
Tait, Weller & Baker LLP
1818 Market Street, Suite 2400
Philadelphia, Pennsylvania 19103
DISTRIBUTOR
Quasar Distributors, LLC
777 East Wisconsin Avenue
Milwaukee, Wisconsin 53202
hennessyfunds.com | 1-800-966-4354
This report has been prepared for shareholders and may be distributed to
others only if preceded or accompanied by a current prospectus.
SEMI-ANNUAL REPORT
APRIL 30, 2018
HENNESSY CORNERSTONE
MID CAP 30 FUND
Investor Class HFMDX
Institutional Class HIMDX
hennessyfunds.com | 1-800-966-4354
(This Page Intentionally Left Blank.)
Contents
| Letter to Shareholders | | | 2 |
| Performance Overview | | | 4 |
| Financial Statements | | | |
| Schedule of Investments | | | 5 |
| Statement of Assets and Liabilities | | | 11 |
| Statement of Operations | | | 12 |
| Statements of Changes in Net Assets | | | 13 |
| Financial Highlights | | | 14 |
| Notes to the Financial Statements | | | 18 |
| Expense Example | | | 26 |
| Proxy Voting Policy and Proxy Voting Records | | | 28 |
| Quarterly Schedule of Investments | | | 28 |
| Important Notice Regarding Delivery of Shareholder Documents | | | 28 |
| Board Approval of Investment Advisory Agreement | | | 29 |
| HENNESSY FUNDS | 1-800-966-4354 | |
May 2018
Dear Hennessy Funds Shareholder:
Investors in the United States and abroad experienced the return of volatility in the six months ended April 30, 2018, especially during the second half of the period. Equities rallied sharply during the first half of the period and fell back during the second half, but nevertheless ended the period with solid gains, with the Dow Jones Industrial Average posting a total return of 4.5% and the S&P 500 Index up 3.8%. Over the past year, I have repeatedly shared my belief that the stock market was due for a correction, but that it would bounce back, as it has so many times during the current bull market.
In the closing months of 2017 and into January 2018, U.S. equities rallied in response to the enactment of the Tax Cuts and Jobs Act of 2017, which significantly lowered corporate tax rates. Investors were also encouraged by two quarters of real GDP growth of 3.2% and 2.9%. However, equity prices quickly lost ground in reaction to the imposition of trade tariffs on steel and aluminum, and fears that additional proposed tariffs could provoke a trade war with China. Signals from the Federal Reserve that the pace of interest rate increases would move slightly higher also weighed on investors. During the period, the federal funds rate was raised twice, by a quarter point each time, in December 2017 and March 2018.
The current bull market in U.S. equities is now entering its 10th year, and we remain optimistic about the outlook for stock prices. In our opinion, economic fundamentals look positive. The U.S. economy is growing at a solid pace of 2 – 3% annually, inflation is low, and high employment levels are supporting healthy growth in consumption. Wages are rising, but the rate of increase has remained steady at around 2.6% per year since mid-2016. While it appears that the Federal Reserve will continue to raise the federal funds rate and normalize monetary policy, we believe it will be able to do so gradually, avoiding a severe jolt to either financial markets or the economy. Meanwhile, companies continue to report robust earnings growth, boosted this year by lower tax rates.
We believe U.S. equities remain attractively valued. U.S. long bond yields are hovering near 3%, having risen over the period in response to strong economic activity. Prospective PE multiples, however, have dropped significantly since the end of 2017, the result of a combination of lower taxes, higher operating earnings, and lower stock prices. The Dow Jones Industrial Average and the S&P 500 Index are trading at about 17x forward earnings, down from approximately 20x at the beginning of the calendar year, valuations we believe to be very reasonable.
We are not overly concerned about recent protectionist actions by the U.S. administration. We consider the announcements and ongoing discussions regarding import tariffs and NAFTA to be representative of standard Trump deal-making tactics – make far-reaching demands and then negotiate a reasonable outcome that is beneficial to both sides. We expect continued pro-business policies and regulatory relief to be enacted by our leaders in Washington.
Finally, as noted many times in past letters during this bull market, the euphoria that has historically accompanied a peak in the market continues to be absent. Investors today are worried about many things, including higher interest rates, larger budget deficits, higher import tariffs, and political distractions. But they are definitely not euphoric. In the past, I have likened the current bull market to the 1982-2000 bull market, and I continue
to believe the comparison is a good one. We remain confident that the market will be able to weather the current period of volatility and that the economy, despite higher interest rates and possible trade disruptions, is resilient enough to continue its steady growth into the coming year.
Thank you for your continued confidence and investment in the Hennessy Funds. If you have any questions or would like to speak with us directly, please don’t hesitate to call us at (800) 966-4354.
Best regards,
Neil J. Hennessy
President and Chief Investment Officer
Past performance does not guarantee future results.
Mutual fund investing involves risk. Principal loss is possible.
Opinions expressed are those of Neil Hennessy and are subject to change, are not guaranteed, and should not be considered investment advice.
The Dow Jones Industrial Average and S&P 500 Index are unmanaged indices commonly used to measure the performance of U.S. stocks. One cannot invest directly in an index.
Price to earnings (PE) is calculated by dividing a company’s market price per share by its earnings per share. Earnings growth is not a measure of a fund’s future performance.
| HENNESSY FUNDS | 1-800-966-4354 | |
Performance Overview (Unaudited)
AVERAGE ANNUAL TOTAL RETURN FOR PERIODS ENDED APRIL 30, 2018
| | Six | One | Five | Ten |
| | Months(1) | Year | Years | Years |
| Hennessy Cornerstone | | | | |
| Mid Cap 30 Fund – | | | | |
| Investor Class (HFMDX) | -0.09% | 9.57% | 9.83% | 8.31% |
| Hennessy Cornerstone | | | | |
| Mid Cap 30 Fund – | | | | |
| Institutional Class (HIMDX) | 0.06% | 9.98% | 10.19% | 8.68% |
Russell Midcap® Index | 3.69% | 11.17% | 11.77% | 9.48% |
| S&P 500 Index | 3.82% | 13.27% | 12.96% | 9.02% |
Expense ratios: 1.34% (Investor Class); 0.97% (Institutional Class)
(1) | Periods less than one year are not annualized. |
Performance data quoted represents past performance; past performance does not guarantee future results. The investment return and principal value of an investment will fluctuate so that an investor’s shares, when redeemed, may be worth more or less than their original cost. The performance table does not reflect the deduction of taxes that a shareholder would pay on Fund distributions or the redemption of Fund shares. Current performance of the Fund may be lower or higher than the performance quoted. Performance data current to the most recent month end may be obtained by visiting hennessyfunds.com.
The Russell Midcap® Index is an index commonly used to measure the performance of U.S. medium-capitalization stocks. The S&P 500 Index is an unmanaged index commonly used to measure the performance of U.S. stocks. One cannot invest directly in an index.
Frank Russell Company (“Russell”) is the source and owner of the trademarks, service marks, and copyrights related to the Russell Indexes. Russell® is a trademark of Frank Russell Company. Neither Russell nor its licensors accept any liability for any errors or omissions in the Russell Indexes or Russell ratings or underlying data and no party may rely on any Russell Indexes or Russell ratings or underlying data contained in this communication. No further distribution of Russell data is permitted without Russell’s express written consent. Russell does not promote, sponsor, or endorse the content of this communication.
The expense ratios presented are from the most recent prospectus. The expense ratios for the current reporting period are available in the Financial Highlights section of this report.
HENNESSYFUNDS.COM
| PERFORMANCE OVERVIEW/SCHEDULE OF INVESTMENTS |
Financial Statements
Schedule of Investments as of April 30, 2018 (Unaudited) |
HENNESSY CORNERSTONE MID CAP 30 FUND
(% of Net Assets)
| TOP TEN HOLDINGS (EXCLUDING CASH/CASH EQUIVALENTS) | % NET ASSETS |
| ASGN, Inc. | 4.42% |
| HollyFrontier Corp. | 4.39% |
| XPO Logistics, Inc. | 4.05% |
| Korn/Ferry International | 3.95% |
| TriNet Group, Inc. | 3.86% |
| Pinnacle Entertainment, Inc. | 3.66% |
| Boise Cascade Co. | 3.51% |
| Penn National Gaming, Inc. | 3.45% |
| Alcoa Corp. | 3.42% |
| NRG Energy, Inc. | 3.39% |
Note: For presentation purposes, the Fund has grouped some of the industry categories. For purposes of categorizing securities for compliance with Section 8(b)(1) of the Investment Company Act of 1940, as amended, the Fund uses more specific industry classifications.
The Global Industry Classification Standard (GICS®) was developed by and is the exclusive property and a service mark of MSCI, Inc. and Standard & Poor Financial Services LLC. It has been licensed for use by the Hennessy Funds.
| HENNESSY FUNDS | 1-800-966-4354 | |
| COMMON STOCKS – 98.57% | | Number | | | | | | % of | |
| | | of Shares | | | Value | | | Net Assets | |
| Consumer Discretionary – 30.55% | | | | | | | | | |
| Brunswick Corp. | | | 6,220 | | | $ | 372,454 | | | | 0.04 | % |
| Burlington Stores, Inc. (a) | | | 3,810 | | | | 517,588 | | | | 0.05 | % |
| Dana, Inc. | | | 1,011,400 | | | | 24,000,522 | | | | 2.33 | % |
| KB Home | | | 1,113,100 | | | | 29,552,805 | | | | 2.87 | % |
| LGI Homes, Inc. (a) | | | 501,800 | | | | 34,724,560 | | | | 3.37 | % |
| Live Nation Entertainment, Inc. (a) | | | 11,330 | | | | 447,195 | | | | 0.04 | % |
| Mohawk Industries, Inc. (a) | | | 2,640 | | | | 554,083 | | | | 0.05 | % |
| Norwegian Cruise Line Holdings Ltd. (a)(b) | | | 10,940 | | | | 584,962 | | | | 0.06 | % |
| Ollie’s Bargain Outlet Holdings, Inc. (a) | | | 5,990 | | | | 372,578 | | | | 0.04 | % |
| Penn National Gaming, Inc. (a) | | | 1,171,800 | | | | 35,517,258 | | | | 3.45 | % |
| Pinnacle Entertainment, Inc. (a) | | | 1,174,400 | | | | 37,721,728 | | | | 3.66 | % |
| PulteGroup, Inc. | | | 1,020,600 | | | | 30,985,416 | | | | 3.01 | % |
| Scientific Games Corp. (a) | | | 653,800 | | | | 34,847,540 | | | | 3.38 | % |
| Thor Industries, Inc. | | | 263,440 | | | | 27,961,522 | | | | 2.72 | % |
| Ulta Beauty, Inc. (a) | | | 1,490 | | | | 373,856 | | | | 0.04 | % |
| Visteon Corp. (a) | | | 250,100 | | | | 31,122,444 | | | | 3.02 | % |
| Winnebago Industries, Inc. | | | 657,200 | | | | 24,907,880 | | | | 2.42 | % |
| | | | | | | | 314,564,391 | | | | 30.55 | % |
| | | | | | | | | | | | | |
| Consumer Staples – 2.31% | | | | | | | | | | | | |
| Pinnacle Foods, Inc. | | | 12,280 | | | | 741,712 | | | | 0.07 | % |
| Sanderson Farms, Inc. | | | 206,900 | | | | 22,999,004 | | | | 2.24 | % |
| | | | | | | | 23,740,716 | | | | 2.31 | % |
| | | | | | | | | | | | | |
| Energy – 7.93% | | | | | | | | | | | | |
| CVR Energy, Inc. | | | 1,008,200 | | | | 34,782,900 | | | | 3.38 | % |
| Diamondback Energy, Inc. (a) | | | 4,310 | | | | 553,619 | | | | 0.05 | % |
| HollyFrontier Corp. | | | 745,400 | | | | 45,238,326 | | | | 4.39 | % |
| Matador Resources Co. (a) | | | 18,140 | | | | 593,904 | | | | 0.06 | % |
| Newfield Exploration Co. (a) | | | 15,690 | | | | 467,562 | | | | 0.05 | % |
| | | | | | | | 81,636,311 | | | | 7.93 | % |
| | | | | | | | | | | | | |
| Financials – 9.93% | | | | | | | | | | | | |
| American Equity Investment Life Holding Co. | | | 1,106,900 | | | | 33,428,380 | | | | 3.24 | % |
| Bank of the Ozarks | | | 12,440 | | | | 582,192 | | | | 0.05 | % |
| E*TRADE Financial Corp. (a) | | | 12,810 | | | | 777,311 | | | | 0.07 | % |
| East West Bancorp, Inc. | | | 9,130 | | | | 608,241 | | | | 0.06 | % |
The accompanying notes are an integral part of these financial statements.
HENNESSYFUNDS.COM
| COMMON STOCKS | | Number | | | | | | % of | |
| | | of Shares | | | Value | | | Net Assets | |
| Financials (Continued) | | | | | | | | | |
| Encore Capital Group, Inc. (a) | | | 654,500 | | | $ | 29,190,700 | | | | 2.83 | % |
| Evercore Partners, Inc., Class A | | | 10,950 | | | | 1,108,687 | | | | 0.11 | % |
| First Republic Bank | | | 6,490 | | | | 602,726 | | | | 0.06 | % |
| Kemper Corp. | | | 486,100 | | | | 32,811,750 | | | | 3.19 | % |
| Pinnacle Financial Partners, Inc. | | | 7,550 | | | | 483,578 | | | | 0.05 | % |
| Raymond James Financial, Inc. | | | 7,640 | | | | 685,690 | | | | 0.07 | % |
| Signature Bank (a) | | | 2,970 | | | | 377,636 | | | | 0.04 | % |
| The Progressive Corp. | | | 11,860 | | | | 715,039 | | | | 0.07 | % |
| Western Alliance Bancorp (a) | | | 15,290 | | | | 901,804 | | | | 0.09 | % |
| | | | | | | | 102,273,734 | | | | 9.93 | % |
| | | | | | | | | | | | | |
| Health Care – 0.39% | | | | | | | | | | | | |
| Amedisys, Inc. (a) | | | 6,010 | | | | 397,201 | | | | 0.04 | % |
| Insulet Corp. (a) | | | 5,410 | | | | 465,260 | | | | 0.05 | % |
| Ionis Pharmaceuticals, Inc. (a) | | | 3,850 | | | | 165,666 | | | | 0.02 | % |
| K2M Group Holdings, Inc. (a) | | | 15,410 | | | | 294,331 | | | | 0.03 | % |
| Natus Medical, Inc. (a) | | | 13,880 | | | | 458,734 | | | | 0.04 | % |
| NuVasive, Inc. (a) | | | 8,020 | | | | 426,744 | | | | 0.04 | % |
| Paratek Pharmaceuticals, Inc. (a) | | | 12,790 | | | | 136,853 | | | | 0.01 | % |
| Perrigo Co. PLC (b) | | | 3,880 | | | | 303,183 | | | | 0.03 | % |
| PRA Health Sciences, Inc. (a) | | | 3,920 | | | | 322,106 | | | | 0.03 | % |
| Teleflex, Inc. | | | 3,900 | | | | 1,044,732 | | | | 0.10 | % |
| | | | | | | | 4,014,810 | | | | 0.39 | % |
| | | | | | | | | | | | | |
| Industrials – 33.04% | | | | | | | | | | | | |
| A.O. Smith Corp. | | | 15,480 | | | | 949,698 | | | | 0.09 | % |
| Apogee Enterprises, Inc. | | | 6,530 | | | | 268,448 | | | | 0.02 | % |
| ASGN, Inc. (a) | | | 564,640 | | | | 45,526,923 | | | | 4.42 | % |
| Builders FirstSource, Inc. (a) | | | 1,800,500 | | | | 32,823,115 | | | | 3.19 | % |
| Comfort Systems USA, Inc. | | | 17,030 | | | | 718,666 | | | | 0.07 | % |
| CoStar Group, Inc. (a) | | | 1,860 | | | | 681,987 | | | | 0.07 | % |
| Granite Construction, Inc. | | | 2,470 | | | | 129,379 | | | | 0.01 | % |
| JetBlue Airways Corp. (a) | | | 22,100 | | | | 424,099 | | | | 0.04 | % |
| Korn/Ferry International | | | 761,500 | | | | 40,709,790 | | | | 3.95 | % |
| Lennox International, Inc. | | | 2,480 | | | | 479,558 | | | | 0.05 | % |
| Mercury Systems, Inc. (a) | | | 17,190 | | | | 551,455 | | | | 0.05 | % |
The accompanying notes are an integral part of these financial statements.
| HENNESSY FUNDS | 1-800-966-4354 | |
| COMMON STOCKS | | Number | | | | | | % of | |
| | | of Shares | | | Value | | | Net Assets | |
| Industrials (Continued) | | | | | | | | | |
| Meritor, Inc. (a) | | | 1,217,000 | | | $ | 23,694,990 | | | | 2.30 | % |
| Oshkosh Corp. | | | 9,510 | | | | 686,242 | | | | 0.07 | % |
| Quanta Services, Inc. (a) | | | 17,060 | | | | 554,450 | | | | 0.06 | % |
| Rush Enterprises, Inc., Class A (a) | | | 632,800 | | | | 25,837,224 | | | | 2.51 | % |
| SiteOne Landscape Supply, Inc. (a) | | | 505,200 | | | | 34,606,200 | | | | 3.36 | % |
| Tetra Tech, Inc. | | | 15,080 | | | | 729,872 | | | | 0.07 | % |
| The Brink’s Co. | | | 401,365 | | | | 29,620,737 | | | | 2.88 | % |
| The Manitowoc Co., Inc. (a) | | | 782,400 | | | | 19,286,160 | | | | 1.87 | % |
| The Middleby Corp. (a) | | | 4,210 | | | | 529,786 | | | | 0.05 | % |
| TriNet Group, Inc. (a) | | | 770,000 | | | | 39,770,500 | | | | 3.86 | % |
| XPO Logistics, Inc. (a) | | | 428,900 | | | | 41,671,924 | | | | 4.05 | % |
| | | | | | | | 340,251,203 | | | | 33.04 | % |
| | | | | | | | | | | | | |
| Information Technology – 0.97% | | | | | | | | | | | | |
| Cadence Design Systems, Inc. (a) | | | 4,610 | | | | 184,677 | | | | 0.02 | % |
| Coupa Software, Inc. (a) | | | 14,010 | | | | 649,644 | | | | 0.06 | % |
| Euronet Worldwide, Inc. (a) | | | 4,840 | | | | 378,052 | | | | 0.04 | % |
| FleetCor Technologies, Inc. (a) | | | 2,320 | | | | 480,890 | | | | 0.05 | % |
| Fortinet, Inc. (a) | | | 13,480 | | | | 746,253 | | | | 0.07 | % |
| Gartner, Inc. (a) | | | 2,550 | | | | 309,289 | | | | 0.03 | % |
| HubSpot, Inc. (a) | | | 4,930 | | | | 522,087 | | | | 0.05 | % |
| Lam Research Corp. | | | 2,770 | | | | 512,616 | | | | 0.05 | % |
| Lumentum Holdings, Inc. (a) | | | 6,690 | | | | 337,510 | | | | 0.03 | % |
| Marvell Technology Group Ltd. (b) | | | 29,800 | | | | 597,788 | | | | 0.06 | % |
| ON Semiconductor Corp. (a) | | | 20,050 | | | | 442,704 | | | | 0.04 | % |
| OSI Systems, Inc. (a) | | | 5,910 | | | | 378,358 | | | | 0.04 | % |
| Palo Alto Networks, Inc. (a) | | | 2,700 | | | | 519,777 | | | | 0.05 | % |
| Paycom Software, Inc. (a) | | | 5,860 | | | | 669,271 | | | | 0.07 | % |
| Proofpoint, Inc. (a) | | | 3,650 | | | | 430,481 | | | | 0.04 | % |
| RingCentral, Inc.,Class A (a) | | | 17,330 | | | | 1,161,977 | | | | 0.11 | % |
| Skyworks Solutions, Inc. | | | 5,000 | | | | 433,800 | | | | 0.04 | % |
| Total System Services, Inc. | | | 9,450 | | | | 794,367 | | | | 0.08 | % |
| Tyler Technologies, Inc. (a) | | | 2,020 | | | | 442,218 | | | | 0.04 | % |
| | | | | | | | 9,991,759 | | | | 0.97 | % |
The accompanying notes are an integral part of these financial statements.
HENNESSYFUNDS.COM
| COMMON STOCKS | | Number | | | | | | % of | |
| | | of Shares | | | Value | | | Net Assets | |
| Materials – 9.96% | | | | | | | | | |
| Alcoa Corp. (a) | | | 687,400 | | | $ | 35,194,880 | | | | 3.42 | % |
| Axalta Coating Systems Ltd. (a)(b) | | | 17,260 | | | | 533,334 | | | | 0.05 | % |
| Boise Cascade Co. | | | 867,800 | | | | 36,100,480 | | | | 3.51 | % |
| Eagle Materials, Inc. | | | 4,870 | | | | 481,935 | | | | 0.05 | % |
| Huntsman Corp. | | | 999,800 | | | | 29,764,046 | | | | 2.89 | % |
| Vulcan Materials Co. | | | 4,230 | | | | 472,449 | | | | 0.04 | % |
| | | | | | | | 102,547,124 | | | | 9.96 | % |
| | | | | | | | | | | | | |
| Utilities – 3.49% | | | | | | | | | | | | |
| American Water Works Co., Inc. | | | 6,870 | | | | 594,805 | | | | 0.06 | % |
| MDU Resources Group, Inc. | | | 15,960 | | | | 449,593 | | | | 0.04 | % |
| NRG Energy, Inc. | | | 1,125,800 | | | | 34,899,800 | | | | 3.39 | % |
| | | | | | | | 35,944,198 | | | | 3.49 | % |
| Total Common Stocks | | | | | | | | | | | | |
| (Cost $972,558,184) | | | | | | | 1,014,964,246 | | | | 98.57 | % |
| | | | | | | | | | | | | |
| REITS – 0.27% | | | | | | | | | | | | |
| | | | | | | | | | | | | |
| Financials – 0.27% | | | | | | | | | | | | |
| Equinix, Inc. | | | 1,650 | | | | 694,303 | | | | 0.07 | % |
| Hudson Pacific Properties, Inc. | | | 12,670 | | | | 416,463 | | | | 0.04 | % |
| Monmouth Real Estate Investment Corp. | | | 30,000 | | | | 468,900 | | | | 0.04 | % |
| National Storage Affiliates Trust | | | 18,050 | | | | 475,076 | | | | 0.05 | % |
| Physicians Realty Trust | | | 23,450 | | | | 350,343 | | | | 0.03 | % |
| Retail Opportunity Investments Corp. | | | 21,340 | | | | 367,048 | | | | 0.04 | % |
| | | | | | | | 2,772,133 | | | | 0.27 | % |
| Total REITS | | | | | | | | | | | | |
| (Cost $2,264,284) | | | | | | | 2,772,133 | | | | 0.27 | % |
The accompanying notes are an integral part of these financial statements.
| HENNESSY FUNDS | 1-800-966-4354 | |
| SHORT-TERM INVESTMENTS – 1.53% | | Number | | | | | | % | |
| | | of Shares | | | Value | | | Net Assets | |
| Money Market Funds – 1.53% | | | | | | | | | |
| Fidelity Government Portfolio, Institutional Class, 1.58% (c) | | | 15,701,918 | | | $ | 15,701,918 | | | | 1.53 | % |
| | | | | | | | | | | | | |
| Total Short-Term Investments | | | | | | | | | | | | |
| (Cost $15,701,918) | | | | | | | 15,701,918 | | | | 1.53 | % |
| | | | | | | | | | | | | |
| Total Investments | | | | | | | | | | | | |
| (Cost $990,524,386) – 100.37% | | | | | | | 1,033,438,297 | | | | 100.37 | % |
| Liabilities in Excess of Other Assets – (0.37)% | | | | | | | (3,765,137 | ) | | | (0.37 | )% |
| | | | | | | | | | | | | |
TOTAL NET ASSETS – 100.00% | | | | | | $ | 1,029,673,160 | | | | 100.00 | % |
Percentages are stated as a percent of net assets.
PLC – Public Limited Company
| (a) | Non-income producing security. |
| (b) | U.S. traded security of a foreign corporation. |
| (c) | The rate listed is the fund’s seven-day yield as of April 30, 2018. |
Summary of Fair Value Exposure at April 30, 2018
The following is a summary of the inputs used to value the Fund’s net assets as of April 30, 2018 (See Note 3 in the accompanying notes to the financial statements):
| Common Stocks | | Level 1 | | | Level 2 | | | Level 3 | | | Total | |
| Consumer Discretionary | | $ | 314,564,391 | | | $ | — | | | $ | — | | | $ | 314,564,391 | |
| Consumer Staples | | | 23,740,716 | | | | — | | | | — | | | | 23,740,716 | |
| Energy | | | 81,636,311 | | | | — | | | | — | | | | 81,636,311 | |
| Financials | | | 102,273,734 | | | | — | | | | — | | | | 102,273,734 | |
| Health Care | | | 4,014,810 | | | | — | | | | — | | | | 4,014,810 | |
| Industrials | | | 340,251,203 | | | | — | | | | — | | | | 340,251,203 | |
| Information Technology | | | 9,991,759 | | | | — | | | | — | | | | 9,991,759 | |
| Materials | | | 102,547,124 | | | | — | | | | — | | | | 102,547,124 | |
| Utilities | | | 35,944,198 | | | | — | | | | — | | | | 35,944,198 | |
| Total Common Stocks | | $ | 1,014,964,246 | | | $ | — | | | $ | — | | | $ | 1,014,964,246 | |
| REITS | | | | | | | | | | | | | | | | |
| Financials | | $ | 2,772,133 | | | $ | — | | | $ | — | | | $ | 2,772,133 | |
| Total REITS | | $ | 2,772,133 | | | $ | — | | | $ | — | | | $ | 2,772,133 | |
| Short-Term Investments | | | | | | | | | | | | | | | | |
| Money Market Funds | | $ | 15,701,918 | | | $ | — | | | $ | — | | | $ | 15,701,918 | |
| Total Short-Term Investments | | $ | 15,701,918 | | | $ | — | | | $ | — | | | $ | 15,701,918 | |
| Total Investments | | $ | 1,033,438,297 | | | $ | — | | | $ | — | | | $ | 1,033,438,297 | |
Transfers between levels are recognized at the end of the reporting period. During the six-month period ended April 30, 2018, the Fund recognized no transfers between levels.
The accompanying notes are an integral part of these financial statements.
HENNESSYFUNDS.COM
| SCHEDULE OF INVESTMENTS/STATEMENT OF ASSETS AND LIABILITIES |
Financial Statements
Statement of Assets and Liabilities as of April 30, 2018 (Unaudited) |
| ASSETS: | | | |
| Investments in securities, at value (cost $990,524,386) | | $ | 1,033,438,297 | |
| Cash | | | 977 | |
| Dividends and interest receivable | | | 143,149 | |
| Receivable for fund shares sold | | | 360,680 | |
| Prepaid expenses and other assets | | | 42,643 | |
| Total Assets | | | 1,033,985,746 | |
| | | | | |
| LIABILITIES: | | | | |
| Payable for fund shares redeemed | | | 3,168,783 | |
| Payable to advisor | | | 634,089 | |
| Payable to administrator | | | 174,792 | |
| Payable to auditor | | | 9,723 | |
| Accrued distribution fees | | | 97,792 | |
| Accrued service fees | | | 39,482 | |
| Accrued trustees fees | | | 3,236 | |
| Accrued expenses and other payables | | | 184,689 | |
| Total Liabilities | | | 4,312,586 | |
| NET ASSETS | | $ | 1,029,673,160 | |
| | | | | |
| NET ASSETS CONSIST OF: | | | | |
| Capital stock | | $ | 745,830,845 | |
| Accumulated net investment loss | | | (5,786,323 | ) |
| Accumulated net realized gain on investments | | | 246,714,727 | |
| Unrealized net appreciation on investments | | | 42,913,911 | |
| Total Net Assets | | $ | 1,029,673,160 | |
| | | | | |
| NET ASSETS | | | | |
| Investor Class: | | | | |
| Shares authorized (no par value) | | Unlimited | |
| Net assets applicable to outstanding Investor Class shares | | $ | 472,472,609 | |
| Shares issued and outstanding | | | 25,081,031 | |
| Net asset value, offering price and redemption price per share | | $ | 18.84 | |
| | | | | |
| Institutional Class: | | | | |
| Shares authorized (no par value) | | Unlimited | |
| Net assets applicable to outstanding Institutional Class shares | | $ | 557,200,551 | |
| Shares issued and outstanding | | | 28,768,926 | |
| Net asset value, offering price and redemption price per share | | $ | 19.37 | |
The accompanying notes are an integral part of these financial statements.
| HENNESSY FUNDS | 1-800-966-4354 | |
Financial Statements
Statement of Operations for the six months ended April 30, 2018 (Unaudited) |
| INVESTMENT INCOME: | | | |
| Dividend income | | $ | 3,454,047 | |
| Interest income | | | 131,253 | |
| Total investment income | | | 3,585,300 | |
| | | | | |
| EXPENSES: | | | | |
| Investment advisory fees (See Note 5) | | | 3,887,142 | |
| Sub-transfer agent expenses – Investor Class (See Note 5) | | | 430,537 | |
| Sub-transfer agent expenses – Institutional Class (See Note 5) | | | 259,351 | |
| Administration, fund accounting, custody and transfer agent fees (See Note 5) | | | 493,767 | |
| Distribution fees – Investor Class (See Note 5) | | | 331,931 | |
| Service fees – Investor Class (See Note 5) | | | 221,287 | |
| Reports to shareholders | | | 43,340 | |
| Federal and state registration fees | | | 24,891 | |
| Compliance expense (See Note 5) | | | 14,628 | |
| Audit fees | | | 10,969 | |
| Trustees’ fees and expenses | | | 10,861 | |
| Interest expense (See Note 7) | | | 7,717 | |
| Legal fees | | | 5,171 | |
| Other expenses | | | 33,741 | |
| Total expenses | | | 5,775,333 | |
| NET INVESTMENT LOSS | | $ | (2,190,033 | ) |
| | | | | |
| REALIZED AND UNREALIZED GAINS (LOSSES): | | | | |
| Net realized gain on investments | | $ | 236,242,487 | |
| Net change in unrealized appreciation on investments | | | (251,140,932 | ) |
| Net gain on investments | | | (14,898,445 | ) |
| NET INCREASE IN NET ASSETS RESULTING FROM OPERATIONS | | $ | (17,088,478 | ) |
The accompanying notes are an integral part of these financial statements.
HENNESSYFUNDS.COM
| STATEMENT OF OPERATIONS/STATEMENTS OF CHANGES IN NET ASSETS |
Financial Statements
| Statements of Changes in Net Assets |
| | | Six Months Ended | | | | |
| | | April 30, 2018 | | | Year Ended | |
| | | (Unaudited) | | | October 31, 2017 | |
| OPERATIONS: | | | | | | |
| Net investment loss | | $ | (2,190,033 | ) | | $ | (1,057,646 | ) |
| Net realized gain on investments | | | 236,242,487 | | | | 245,505,242 | |
| Net change in unrealized appreciation on investments | | | (251,140,932 | ) | | | (15,162,353 | ) |
| Net increase in net assets resulting from operations | | | (17,088,478 | ) | | | 229,285,243 | |
| | | | | | | | | |
| DISTRIBUTIONS TO SHAREHOLDERS FROM: | | | | | | | | |
| Net realized gains – Investor Class | | | (59,254,277 | ) | | | (3,088,473 | ) |
| Net realized gains – Institutional Class | | | (103,063,607 | ) | | | (4,766,317 | ) |
| Total distributions | | | (162,317,884 | ) | | | (7,854,790 | ) |
| | | | | | | | | |
| CAPITAL SHARE TRANSACTIONS: | | | | | | | | |
| Proceeds from shares issued in the | | | | | | | | |
| Reorganization – Investor Class (See Note 9) | | | 216,366,669 | | | | — | |
| Proceeds from shares issued in the | | | | | | | | |
| Reorganization – Institutional Class (See Note 9) | | | 105,537,409 | | | | — | |
| Proceeds from shares subscribed – Investor Class | | | 15,727,903 | | | | 37,287,639 | |
| Proceeds from shares subscribed – Institutional Class | | | 34,032,626 | | | | 90,659,855 | |
| Dividends reinvested – Investor Class | | | 58,251,271 | | | | 3,040,512 | |
| Dividends reinvested – Institutional Class | | | 99,300,713 | | | | 4,572,946 | |
| Cost of shares redeemed – Investor Class | | | (94,902,126 | ) | | | (257,782,079 | ) |
| Cost of shares redeemed – Institutional Class | | | (196,779,498 | ) | | | (367,781,422 | ) |
| Net increase (decrease) in net assets derived | | | | | | | | |
| from capital share transactions | | | 237,534,967 | | | | (490,002,549 | ) |
| TOTAL INCREASE (DECREASE) IN NET ASSETS | | | 58,128,605 | | | | (268,572,096 | ) |
| | | | | | | | | |
| NET ASSETS: | | | | | | | | |
| Beginning of period | | | 971,544,555 | | | | 1,240,116,651 | |
| End of period | | $ | 1,029,673,160 | | | $ | 971,544,555 | |
| Undistributed net investment loss, end of period | | $ | (5,786,323 | ) | | $ | (1,118,367 | ) |
| | | | | | | | | |
| CHANGES IN SHARES OUTSTANDING: | | | | | | | | |
| Shares issued in the Reorganization – Investor Class | | | 10,499,531 | | | | — | |
| Shares issued in the Reorganization – Institutional Class | | | 4,794,539 | | | | — | |
| Shares sold – Investor Class | | | 801,212 | | | | 1,844,085 | |
| Shares sold – Institutional Class | | | 1,592,282 | | | | 4,348,038 | |
| Shares issued to holders as reinvestment | | | | | | | | |
| of dividends – Investor Class | | | 3,038,668 | | | | 149,705 | |
| Shares issued to holders as reinvestment | | | | | | | | |
| of dividends – Institutional Class | | | 5,045,768 | | | | 220,065 | |
| Shares redeemed – Investor Class | | | (4,891,712 | ) | | | (12,769,278 | ) |
| Shares redeemed – Institutional Class | | | (9,558,292 | ) | | | (17,841,055 | ) |
| Net increase (decrease) in shares outstanding | | | 11,321,996 | | | | (24,048,440 | ) |
The accompanying notes are an integral part of these financial statements.
| HENNESSY FUNDS | 1-800-966-4354 | |
Financial Statements
For an Investor Class share outstanding throughout each period
| | Six Months Ended | |
| | April 30, 2018 | |
| | (Unaudited) | |
| PER SHARE DATA: | | | | |
| Net asset value, beginning of period | | $ | 22.46 | | |
| | | | | | |
| Income from investment operations: | | | | | |
| Net investment income (loss) | | | 0.02 | | |
| Net realized and unrealized gains (losses) on investments | | | 0.02 | | |
| Total from investment operations | | | 0.04 | | |
| | | | | | |
| Less distributions: | | | | | |
| Dividends from net investment income | | | — | | |
| Dividends from net realized gains | | | (3.66 | ) | |
| Total distributions | | | (3.66 | ) | |
| Net asset value, end of period | | $ | 18.84 | | |
| | | | | | |
| TOTAL RETURN | | | (0.09 | )%(1) | |
| | | | | | |
| SUPPLEMENTAL DATA AND RATIOS: | | | | | |
| Net assets, end of period (millions) | | $ | 472.47 | | |
| Ratio of expenses to average net assets | | | 1.31 | %(2) | |
| Ratio of net investment income (loss) to average net assets | | | (0.63 | )%(2) | |
Portfolio turnover rate(3) | | | 90 | %(1) | |
(1) | Not annualized. |
(2) | Annualized. |
(3) | Portfolio turnover is calculated on the basis of the Fund as a whole. |
The accompanying notes are an integral part of these financial statements.
HENNESSYFUNDS.COM
| FINANCIAL HIGHLIGHTS — INVESTOR CLASS |
| Year Ended October 31, | |
| 2017 | | | 2016 | | | 2015 | | | 2014 | | | 2013 | |
| | | | | | | | | | | | | | |
| $ | 18.37 | | | $ | 20.12 | | | $ | 19.00 | | | $ | 17.32 | | | $ | 14.06 | |
| | | | | | | | | | | | | | | | | | | |
| | | | | | | | | | | | | | | | | | | |
| | (0.15 | ) | | | (0.07 | ) | | | 0.10 | | | | (0.05 | ) | | | 0.09 | |
| | 4.36 | | | | (1.51 | ) | | | 2.16 | | | | 3.04 | | | | 3.35 | |
| | 4.21 | | | | (1.58 | ) | | | 2.26 | | | | 2.99 | | | | 3.44 | |
| | | | | | | | | | | | | | | | | | | |
| | | | | | | | | | | | | | | | | | | |
| | — | | | | (0.03 | ) | | | — | | | | (0.05 | ) | | | (0.18 | ) |
| | (0.12 | ) | | | (0.14 | ) | | | (1.14 | ) | | | (1.26 | ) | | | — | |
| | (0.12 | ) | | | (0.17 | ) | | | (1.14 | ) | | | (1.31 | ) | | | (0.18 | ) |
| $ | 22.46 | | | $ | 18.37 | | | $ | 20.12 | | | $ | 19.00 | | | $ | 17.32 | |
| | | | | | | | | | | | | | | | | | | |
| | 23.02 | % | | | (7.89 | )% | | | 12.35 | % | | | 18.25 | % | | | 24.78 | % |
| | | | | | | | | | | | | | | | | | | |
| | | | | | | | | | | | | | | | | | | |
| $ | 351.16 | | | $ | 485.15 | | | $ | 765.90 | | | $ | 258.17 | | | $ | 159.45 | |
| | 1.34 | % | | | 1.35 | % | | | 1.17 | % | | | 1.25 | % | | | 1.31 | % |
| | (0.33 | )% | | | (0.24 | )% | | | 0.27 | % | | | (0.47 | )% | | | 0.51 | % |
| | 106 | % | | | 108 | % | | | 5 | % | | | 132 | % | | | 212 | % |
The accompanying notes are an integral part of these financial statements.
| HENNESSY FUNDS | 1-800-966-4354 | |
Financial Statements
For an Institutional Class share outstanding throughout each period
| | Six Months Ended | |
| | April 30, 2018 | |
| | (Unaudited) | |
| PER SHARE DATA: | | | | |
| Net asset value, beginning of period | | $ | 23.07 | | |
| | | | | | |
| Income from investment operations: | | | | | |
| Net investment income (loss) | | | (0.03 | ) | |
| Net realized and unrealized gains (losses) on investments | | | 0.10 | | |
| Total from investment operations | | | 0.07 | | |
| | | | | | |
| Less distributions: | | | | | |
| Dividends from net investment income | | | — | | |
| Dividends from net realized gains | | | (3.77 | ) | |
| Total distributions | | | (3.77 | ) | |
| Net asset value, end of period | | $ | 19.37 | | |
| | | | | | |
| TOTAL RETURN | | | 0.06 | %(2) | |
| | | | | | |
| SUPPLEMENTAL DATA AND RATIOS: | | | | | |
| Net assets, end of period (millions) | | $ | 557.20 | | |
| Ratio of expenses to average net assets: | | | | | |
| Before reimbursement | | | 0.95 | %(3) | |
| After reimbursement | | | 0.95 | %(3) | |
| Ratio of net investment income to average net assets: | | | | | |
| Before reimbursement | | | (0.26 | )%(3) | |
| After reimbursement | | | (0.26 | )%(3) | |
Portfolio Turnover(4) | | | 90 | %(2) | |
(1) | Amount is less than $0.01. |
(2) | Not annualized. |
(3) | Annualized. |
(4) | Portfolio turnover is calculated on the basis of the Fund as a whole. |
The accompanying notes are an integral part of these financial statements.
HENNESSYFUNDS.COM
| FINANCIAL HIGHLIGHTS — INSTITUTIONAL CLASS |
| Year Ended October 31, | |
| 2017 | | | 2016 | | | 2015 | | | 2014 | | | 2013 | |
| | | | | | | | | | | | | | |
| $ | 18.80 | | | $ | 20.55 | | | $ | 19.36 | | | $ | 17.62 | | | $ | 14.31 | |
| | | | | | | | | | | | | | | | | | | |
| | | | | | | | | | | | | | | | | | | |
| | 0.02 | | | | 0.00 | (1) | | | (0.03 | ) | | | (0.08 | ) | | | 0.14 | |
| | 4.38 | | | | (1.54 | ) | | | 2.38 | | | | 3.17 | | | | 3.41 | |
| | 4.40 | | | | (1.54 | ) | | | 2.35 | | | | 3.09 | | | | 3.55 | |
| | | | | | | | | | | | | | | | | | | |
| | | | | | | | | | | | | | | | | | | |
| | — | | | | (0.06 | ) | | | — | | | | (0.09 | ) | | | (0.24 | ) |
| | (0.13 | ) | | | (0.15 | ) | | | (1.16 | ) | | | (1.26 | ) | | | — | |
| | (0.13 | ) | | | (0.21 | ) | | | (1.16 | ) | | | (1.35 | ) | | | (0.24 | ) |
| $ | 23.07 | | | $ | 18.80 | | | $ | 20.55 | | | $ | 19.36 | | | $ | 17.62 | |
| | | | | | | | | | | | | | | | | | | |
| | 23.47 | % | | | (7.53 | )% | | | 12.62 | % | | | 18.57 | % | | | 25.15 | % |
| | | | | | | | | | | | | | | | | | | |
| | | | | | | | | | | | | | | | | | | |
| $ | 620.38 | | | $ | 754.97 | | | $ | 306.04 | | | $ | 75.53 | | | $ | 51.19 | |
| | | | | | | | | | | | | | | | | | | |
| | 0.97 | % | | | 0.97 | % | | | 0.96 | % | | | 1.07 | % | | | 1.11 | % |
| | 0.97 | % | | | 0.97 | % | | | 0.96 | % | | | 0.98 | % | | | 0.98 | % |
| | | | | | | | | | | | | | | | | | | |
| | 0.04 | % | | | 0.07 | % | | | 0.41 | % | | | (0.29 | )% | | | 0.71 | % |
| | 0.04 | % | | | 0.07 | % | | | 0.41 | % | | | (0.20 | )% | | | 0.84 | % |
| | 106 | % | | | 108 | % | | | 5 | % | | | 132 | % | | | 212 | % |
The accompanying notes are an integral part of these financial statements.
| HENNESSY FUNDS | 1-800-966-4354 | |
Financial Statements
Notes to the Financial Statements April 30, 2018 (Unaudited) |
1). ORGANIZATION
The Hennessy Cornerstone Mid Cap 30 Fund (the “Fund”) is a series of Hennessy Funds Trust (the “Trust”), which was organized as a Delaware statutory trust on September 17, 1992. The Fund is an open-end management investment company registered under the Investment Company Act of 1940, as amended. The investment objective of the Fund is long-term growth of capital. The Fund is a diversified fund.
The Fund offers Investor Class and Institutional Class shares. Each class of shares differs principally in its respective 12b-1 distribution and service, shareholder servicing, and sub-transfer agent expenses. There are no sales charges. Each class has identical rights to earnings, assets, and voting privileges, except for class-specific expenses and exclusive rights to vote on matters affecting only an individual class.
As an investment company, the Fund follows the investment company accounting and reporting guidance of the Financial Accounting Standards Board (“FASB”) Accounting Standard Codification Topic 946 “Financial Services—Investment Companies.”
2). SIGNIFICANT ACCOUNTING POLICIES
The following is a summary of significant accounting policies consistently followed by the Fund in the preparation of the financial statements. These policies conform to U.S. generally accepted accounting principles (“GAAP”).
| a). | Investment Valuation – All investments in securities are recorded at their estimated fair value, as described in Note 3. |
| | |
| b). | Federal Income Taxes – No provision for federal income taxes or excise taxes has been made because the Fund has elected to be taxed as a “regulated investment company” and intends to distribute substantially all of its taxable income to its shareholders and otherwise comply with the provisions of the Internal Revenue Code of 1986, as amended, applicable to regulated investment companies. Net investment income/loss and realized gains/losses for federal income tax purposes may differ from those reported in the financial statements because of temporary book and tax basis differences. Temporary differences are primarily the result of the treatment of wash sales for tax reporting purposes. The Fund recognizes interest and penalties related to income tax benefits, if any, in the Statement of Operations as an income tax expense. Distributions from net realized gains for book purposes may include short-term capital gains, which are included as ordinary income to shareholders for tax purposes. The Fund may utilize equalization accounting for tax purposes and designate earnings and profits, including net realized gains distributed to shareholders on redemption of shares, as part of the dividends paid deduction for income tax purposes. |
| | |
| c). | Accounting for Uncertainty in Income Taxes – The Fund has accounting policies regarding recognition and measurement of tax positions taken or expected to be taken on a tax return. The tax returns of the Fund for the prior three fiscal years are open for examination. The Fund has reviewed all open tax years in major jurisdictions and concluded that there is no impact on the Fund’s net assets and no tax liability resulting from unrecognized tax benefits relating to uncertain income tax positions taken or expected to be taken on a tax return. The Fund’s major tax jurisdictions are U.S. federal and Delaware. |
HENNESSYFUNDS.COM
| NOTES TO THE FINANCIAL STATEMENTS |
| d). | Income and Expenses – Dividend income is recognized on the ex-dividend date or as soon as information is available to the Fund. Interest income, which includes the amortization of premium and accretion of discount, is recognized on an accrual basis. The Fund is charged for those expenses that are directly attributable to the portfolio, such as advisory, administration, and certain shareholder service fees. Income, expenses (other than expenses attributable to a specific class), and realized and unrealized gains/losses on investments are allocated to each class of shares based on such class’s net assets. |
| | |
| e). | Distributions to Shareholders – Dividends from net investment income for the Fund, if any, are declared and paid annually, usually in December. Distributions of net realized capital gains, if any, are declared and paid annually, usually in December. |
| | |
| f). | Security Transactions – Investment and shareholder transactions are recorded on the trade date. The Fund determines the realized gain/loss from an investment transaction by comparing the original cost of the security lot sold with the net sale proceeds. Discounts and premiums on securities purchased are accreted or amortized, respectively, over the life of each such security. |
| | |
| g). | Use of Estimates – The preparation of financial statements in conformity with GAAP requires management to make estimates and assumptions that affect the reported amounts of assets and liabilities and disclosure of contingent assets and liabilities at the date of the financial statements and the reported change in net assets during the reporting period. Actual results could differ from those estimates. |
| | |
| h). | Share Valuation – The net asset value (“NAV”) per share of the Fund is calculated by dividing (i) the total value of the securities held by the Fund, plus cash and other assets, minus all liabilities (including estimated accrued expenses) by (ii) the total number of shares outstanding for the Fund, rounded to the nearest cent. The Fund’s shares will not be priced on days the New York Stock Exchange is closed for trading. The offering and redemption price per share for the Fund is equal to the Fund’s NAV per share. |
3). SECURITIES VALUATION
The Fund follows fair valuation accounting standards that establish an authoritative definition of fair value and set out a hierarchy for measuring fair value. These standards require additional disclosures about the various inputs and valuation techniques used to develop the measurements of fair value and a discussion of changes in valuation techniques and related inputs during the period. These inputs are summarized in the three broad levels listed below:
| | Level 1 – | Unadjusted, quoted prices in active markets for identical instruments that the Fund has the ability to access at the date of measurement. |
| | | |
| | Level 2 – | Other significant observable inputs (including, but not limited to, quoted prices in active markets for similar instruments, quoted prices in markets that are not active for identical or similar instruments, and model-derived valuations in which all significant inputs and significant value drivers are observable in active markets (such as interest rates, prepayment speeds, credit risk curves, default rates, and similar data)). |
| | | |
| | Level 3 – | Significant unobservable inputs (including the Fund’s own assumptions about what market participants would use to price the asset or liability based on the best available information) when observable inputs are unavailable. |
Following is a description of the valuation techniques applied to the Fund’s major categories of assets and liabilities measured at fair value on a recurring basis.
| HENNESSY FUNDS | 1-800-966-4354 | |
| | Equity Securities – Equity securities, including common stocks, preferred stocks, foreign-issued common stocks, exchange-traded funds, closed-end mutual funds, partnerships, rights, and real estate investment trusts, that are traded on a securities exchange for which a last-quoted sales price is readily available will generally be valued at the last sales price as reported by the primary exchange on which the securities are listed. Securities listed on The NASDAQ Stock Market (“NASDAQ”) will generally be valued at the NASDAQ Official Closing Price, which may differ from the last sales price reported. Securities traded on a securities exchange for which a last-quoted sales price is not readily available will generally be valued at the mean between the bid and ask prices. To the extent these securities are actively traded and valuation adjustments are not applied, they are classified in Level 1 of the fair value hierarchy. Securities traded on foreign exchanges generally are not valued at the same time the Fund calculates its NAV because most foreign markets close well before such time. The earlier close of most foreign markets gives rise to the possibility that significant events, including broad market moves, may have occurred in the interim. In certain circumstances, it may be determined that a security needs to be fair valued because it appears that the value of the security might have been materially affected by events occurring after the close of the market in which the security is principally traded, but before the time the Fund calculates its NAV, such as by a development that affects an entire market or region (e.g., a weather-related event) or a potentially global development (e.g., a terrorist attack that may be expected to have an effect on investor expectations worldwide). |
| | |
| | Registered Investment Companies – Investments in registered investment companies (e.g., mutual funds) are generally priced at the ending NAV provided by the applicable registered investment company’s service agent and will be classified in Level 1 of the fair value hierarchy. |
| | |
| | Debt Securities – Debt securities, including corporate bonds, asset-backed securities, mortgage-backed securities, municipal bonds, U.S. Treasuries, and U.S. government agency issues, are generally valued at market on the basis of valuations furnished by an independent pricing service that utilizes both dealer-supplied valuations and formula-based techniques. The pricing service may consider recently executed transactions in securities of the issuer or comparable issuers, market price quotations (where observable), bond spreads, and fundamental data relating to the issuer. In addition, the model may incorporate observable market data, such as reported sales of similar securities, broker quotes, yields, bids, offers, and reference data. Certain securities are valued primarily using dealer quotations. These securities are generally classified in Level 2 of the fair value hierarchy. |
| | |
| | Short-Term Securities – Short-term equity investments, including money market funds, are valued in the manner specified above. Short-term debt investments with an original term to maturity of 60 days or less are valued at amortized cost, which approximates fair market value. If the original term to maturity of a short-term debt investment exceeded 60 days, then the values as of the 61st day prior to maturity are amortized. Amortized cost is not used if its use would be inappropriate due to credit or other impairments of the issuer, in which case the security’s fair value would be determined, as described below. Short-term securities are generally classified in Level 1 or Level 2 of the fair market hierarchy depending on the inputs used and market activity levels for specific securities. |
The Board of Trustees of the Fund (the “Board”) has adopted fair value pricing procedures that are followed when a price for a security is not readily available or if a significant event has occurred that indicates the closing price of a security no longer
HENNESSYFUNDS.COM
| NOTES TO THE FINANCIAL STATEMENTS |
represents the true value of that security. Fair value pricing determinations are made in good faith in accordance with these procedures. There are numerous criteria that will be given consideration in determining a fair value of a security, such as the trading volume of a security and markets, the values of other similar securities, and news events with direct bearing on a security or markets. Fair value pricing results in an estimated price for a security that reflects the amount the Fund might reasonably expect to receive in a current sale. Depending on the relative significance of the valuation inputs, these securities may be classified in either Level 2 or Level 3 of the fair value hierarchy.
The fair valuation of foreign securities may be determined with the assistance of a pricing service using correlations between the movement of prices of such securities and indices of domestic securities and other appropriate indicators, such as closing market prices of relevant American Depositary Receipts or futures contracts. The effect of using fair value pricing is that the Fund’s NAV will reflect the affected portfolio securities’ values as determined by the Board or its designee instead of being determined by the market. Using a fair value pricing methodology to price a foreign security may result in a value that is different from such foreign security’s most recent closing price and from the value used by other investment companies to calculate their NAVs. Such securities are generally classified in Level 2 of the fair valuation hierarchy. Because the Fund may invest in foreign securities, the value of the Fund’s portfolio securities may change on days when you will not be able to purchase or redeem your shares.
The Board has delegated day-to-day valuation matters to a Valuation Committee comprised of one or more representatives from Hennessy Advisors, Inc., the Fund’s investment advisor (the “Advisor”). The function of the Valuation Committee is to value securities where current and reliable market quotations are not readily available. All actions taken by the Valuation Committee are reviewed by the Board.
The Fund has performed an analysis of all existing investments to determine the significance and character of all inputs to their fair value determinations. Various inputs are used to determine the value of the Fund’s investments. The inputs or methodology used for valuing securities are not necessarily an indication of the risk associated with investing in those securities. Details related to the fair valuation hierarchy of the Fund’s securities as of April 30, 2018, are included in the Schedule of Investments.
4). INVESTMENT TRANSACTIONS
Purchases and sales of investment securities (excluding government and short-term investments) for the Fund during the six months ended April 30, 2018, were $925,831,924 and $1,164,342,075, respectively.
There were no purchases or sales/maturities of long-term U.S. government securities for the Fund during the six months ended April 30, 2018.
The Fund is permitted to purchase or sell securities from or to another fund in the Hennessy Funds family of funds (the “Hennessy Funds”) under specified conditions outlined in procedures adopted by the Board. The procedures have been designed to ensure that any purchase or sale of securities by the Fund from or to another Hennessy Fund complies with Rule 17a-7 of the Investment Company Act of 1940, as amended. During the six months ended April 30, 2018, the Fund did not engage in purchases or sales of securities pursuant to Rule 17a-7 of the Investment Company Act of 1940, as amended.
5). INVESTMENT MANAGEMENT FEE AND OTHER TRANSACTIONS WITH AFFILIATES
The Advisor provides the Fund with investment management services under an Investment Advisory Agreement. The Advisor furnishes all investment advice, office space, and facilities, as well as most of the personnel needed by the Fund. As
| HENNESSY FUNDS | 1-800-966-4354 | |
compensation for its services, the Advisor is entitled to a monthly fee from the Fund. The fee is based upon the average daily net assets of the Fund at an annual rate of 0.74%. The net investment advisory fees expensed by the Fund during the six months ended April 30, 2018, are included in the Statement of Operations.
The Advisor has agreed to limit total annual operating expenses to 1.39% of the Fund’s net assets for Investor Class shares and 1.07% of the Fund’s net assets for Institutional Class shares (in each case, excluding all federal, state, and local taxes, interest, brokerage commissions, acquired fund fees and expenses and other costs incurred in connection with the purchase and sale of securities, and extraordinary items) through January 12, 2020, pursuant to the written direction of the Board. In addition, in the past, the Advisor had contractually agreed to waive its fees and absorb expenses to the extent that total annual operating expenses exceeded 0.98% of the Fund’s net assets for Institutional Class shares of the Fund (excluding all federal, state and local taxes, interest, brokerage commissions, acquired fund fees and expenses and other costs incurred in connection with the purchase and sale of securities, and extraordinary items). The expense limitation agreement was terminated by the Board as of February 28, 2015.
The Board has approved a Shareholder Servicing Agreement for Investor Class shares of the Fund, which was instituted to compensate the Advisor for the non-investment management services it provides to the Fund. The Shareholder Servicing Agreement provides for a monthly fee paid to the Advisor at an annual rate of 0.10% of the average daily net assets of the Fund attributable to Investor Class shares. The shareholder service fees expensed by the Fund during the six months ended April 30, 2018, are included in the Statement of Operations.
The Fund has adopted a plan pursuant to Rule 12b-1 under the Investment Company Act of 1940, as amended, that authorizes payments in connection with the distribution of the Fund’s shares at an annual rate of up to 0.25% of the Fund’s average daily net assets attributable to Investor Class shares. Even though the authorized rate is up to 0.25%, the Fund is currently only using up to 0.15% of its average daily net assets attributable to Investor Class shares for such purpose. Amounts paid under the plan may be spent on any activities or expenses primarily intended to result in the sale of shares, including, but not limited to, advertising, shareholder account servicing, the printing and mailing of prospectuses to other than current shareholders, the printing and mailing of sales literature, and compensation for sales and marketing activities or to financial institutions and others, such as dealers and distributors. The distribution fees expensed by the Fund during the six months ended April 30, 2018, are included in the Statement of Operations.
The Fund has entered into agreements with various brokers, dealers, and financial intermediaries in connection with the sale of shares of the Fund. The agreements provide for periodic payments by the Fund to the brokers, dealers, and financial intermediaries for providing certain shareholder maintenance services (sub-transfer agent expenses). These shareholder services include the pre-processing and quality control of new accounts, shareholder correspondence, answering customer inquiries regarding account status, and facilitating shareholder telephone transactions. The sub-transfer agent fees expensed by the Fund during the six months ended April 30, 2018, are included in the Statement of Operations.
U.S. Bancorp Fund Services, LLC (“USBFS”) provides the Fund with administrative, fund accounting, and transfer agent services. As administrator, USBFS is responsible for activities such as (i) preparing various federal and state regulatory filings, reports, and returns for the Fund, (ii) preparing reports and materials to be supplied to the Board, (iii) monitoring the activities of the Fund’s custodian, transfer agent, and accountants, and (iv) coordinating the preparation and payment of the Fund’s expenses and reviewing
HENNESSYFUNDS.COM
| NOTES TO THE FINANCIAL STATEMENTS |
the Fund’s expense accruals. U.S. Bank N.A., an affiliate of USBFS, serves as the Fund’s custodian. The servicing agreements between the Trust and USBFS and U.S. Bank N.A. contain a fee schedule that is inclusive of administrative, fund accounting, custody, and transfer agent fees. The administrative, fund accounting, custody, and transfer agent fees expensed by the Fund during the six months ended April 30, 2018, are included in the Statement of Operations.
Quasar Distributors, LLC acts as the Fund’s principal underwriter in a continuous public offering of the Fund’s shares. Quasar Distributors, LLC is an affiliate of USBFS and U.S. Bank N.A.
The officers of the Fund are affiliated with the Advisor. Such officers, with the exception of the Chief Compliance Officer and the Senior Compliance Officer, receive no compensation from the Fund for serving in their respective roles. The Fund, along with the other Hennessy Funds, makes reimbursement payments, on an equal basis, to the Advisor for a portion of the salary and benefits associated with the office of the Chief Compliance Officer and for all of the salary and benefits associated with the office of the Senior Compliance Officer. The compliance fees expensed by the Fund during the six months ended April 30, 2018, are included in the Statement of Operations.
6). GUARANTEES AND INDEMNIFICATIONS
Under the Hennessy Funds’ organizational documents, their officers and trustees are indemnified by the Hennessy Funds against certain liabilities arising out of the performance of their duties to the Hennessy Funds. Additionally, in the normal course of business, the Hennessy Funds enter into contracts with service providers that contain general indemnification clauses. The Fund’s maximum exposure under these arrangements is unknown as this would involve future claims that may be made against the Fund that have not yet occurred. Currently, the Fund expects the risk of loss to be remote.
7). LINE OF CREDIT
The Fund has an uncommitted line of credit with the other Hennessy Funds in the amount of the lesser of (i) $100,000,000 or (ii) 33.33% of each Hennessy Fund’s net assets, or 30% for the Hennessy Gas Utility Fund and 10% for the Hennessy Balanced Fund, intended to provide short-term financing, if necessary, subject to certain restrictions, in connection with shareholder redemptions. The credit facility is with the Hennessy Funds’ custodian bank, U.S. Bank N.A. Borrowings under this arrangement bear interest at the bank’s prime rate and are secured by all of the Fund’s assets (as to its own borrowings only). During the six months ended April 30, 2018, the Fund had an outstanding average daily balance and a weighted average interest rate of $360,652 and 4.50%, respectively. The interest expensed by the Fund during the six months ended April 30, 2018, is included in the Statement of Operations. The maximum amount outstanding for the Fund during the period was $13,923,000. As of April 30, 2018, the Fund did not have any borrowings outstanding under the line of credit.
| HENNESSY FUNDS | 1-800-966-4354 | |
8). FEDERAL TAX INFORMATION
As of October 31, 2017, the Fund’s most recent fiscal year end, the components of accumulated earnings (losses) for income tax purposes were as follows:
| | | Investments | |
| Cost of investments for tax purposes | | $ | 791,238,690 | |
| Gross tax unrealized appreciation | | $ | 227,861,188 | |
| Gross tax unrealized depreciation | | | (51,402,015 | ) |
| Net tax unrealized appreciation | | $ | 176,459,173 | |
| Undistributed ordinary income | | $ | — | |
| Undistributed long-term capital gains | | | 162,316,294 | |
| Total distributable earnings | | $ | 162,316,294 | |
| Other accumulated loss | | $ | (1,118,367 | ) |
| Total accumulated gain | | $ | 337,657,100 | |
The difference between book-basis unrealized appreciation/depreciation (as shown in the Statement of Assets and Liabilities) and tax-basis unrealized appreciation/depreciation (as shown above) is attributable primarily to wash sales.
As of October 31, 2017, the Fund’s most recent fiscal year end, the Fund had no tax basis capital losses to offset future capital gains.
As of October 31, 2017, the Fund’s most recent fiscal year end, the Fund deferred, on a tax basis, a late-year ordinary loss of $1,118,367. Late-year ordinary losses are net ordinary losses incurred after December 31, 2016, but within the taxable year, that are deemed to arise on the first day of the Fund’s next taxable year.
During fiscal year 2018 (year to date) and fiscal year 2017, the tax character of distributions paid by the Fund was as follows:
| | | Six Months Ended | | | Year Ended | |
| | | April 30, 2018 | | | October 31, 2017 | |
Ordinary income(1) | | $ | — | | | $ | — | |
| Long-term capital gain | | | 162,317,884 | | | | 7,854,790 | |
| | | $ | 162,317,884 | | | $ | 7,854,790 | |
(1) Ordinary income includes short-term gain/loss.
9). AGREEMENT AND PLAN OF REORGANIZATION – THE RAINIER FUNDS
On November 16, 2017, and December 26, 2017, shareholders of each of the Rainier Mid Cap Equity Fund and the Rainier Small/Mid Cap Equity Fund, respectively, approved an Agreement and Plan of Reorganization between the Trust, on behalf of the Fund, and Rainier Investment Management Mutual Funds, a Delaware statutory trust, on behalf of the Rainier Mid Cap Equity Fund and the Rainier Small/Mid Cap Equity Fund, respectively. The Agreements and Plans of Reorganization provided for the transfer of all of the assets of the Rainier Mid Cap Equity Fund and the Rainier Small/Mid Cap Equity Fund to the Fund and the assumption of the liabilities (other than any excluded liabilities) of the Rainier Mid Cap Equity Fund and the Rainier Small/Mid Cap Equity Fund by the Fund. The Rainier Mid Cap Equity Fund, the Rainier Small/Mid Cap Equity Fund, and the Fund have substantially similar investment objectives. The following tables illustrate the specifics of the reorganization of the Rainier Mid Cap Equity Fund and the Rainier Small/Mid Cap Equity Fund into the Fund:
HENNESSYFUNDS.COM
| NOTES TO THE FINANCIAL STATEMENTS |
| | Shares | Rainier | Shares | | | |
| | Issued to | Small/Mid | Issued to | Hennessy | | |
| Rainier Mid | Shareholders | Cap Equity | Shareholders of | Mid Cap 30 | | |
| Cap Equity Fund | of Rainier Mid | Fund | Rainier Small/Mid | Fund | Combined | Tax Status |
Net Assets | Cap Equity Fund | Net Assets | Cap Equity Fund | Net Assets | Net Assets | of Transfer |
$69,217,067(1) | 2,967,419 | $252,687,011(2) | 12,326,651 | $947,148,790 | $1,269,052,868 | Non-taxable |
(1) | Includes accumulated realized gains and unrealized appreciation in the amounts of $5,937,065 and $21,448,120, respectively. |
(2) | Includes accumulated realized gains and unrealized appreciation in the amounts of $7,344,615 and $93,339,700, respectively. |
Assuming the reorganization had been completed on November 1, 2017, the beginning of the annual reporting period of the Fund, the pro forma results of operation (unaudited) as of April 30, 2018, would have been as follows:
| Net investment loss | | $ | (2,575,657 | ) |
| Net realized gain on investments | | $ | 243,235,033 | |
| Net change in unrealized appreciation on investments | | $ | (241,303,259 | ) |
| Net decrease in net assets resulting from operations | | $ | (643,883 | ) |
Because the Fund has been managed as a single integrated portfolio since the reorganization was completed, it is not practicable to separate the amounts of revenue and earnings of the Rainier Mid Cap Equity Fund and the Rainier Small/Mid Cap Equity Fund that have been included in the Fund’s Statement of Operations since December 1, 2017 and January 12, 2018, the dates the reorganizations were completed, respectively.
10). EVENTS SUBSEQUENT TO PERIOD END
Management has evaluated the Fund’s related events and transactions that occurred subsequent to April 30, 2018, through the date of issuance of the Fund’s financial statements. Management has determined that there were no subsequent events requiring recognition or disclosure in the financial statements.
| HENNESSY FUNDS | 1-800-966-4354 | |
Expense Example (Unaudited)
April 30, 2018
As a shareholder of the Fund, you incur two types of costs: (1) transaction costs, including sales charges (loads) on purchase payments, reinvested dividends, or other distributions; redemption fees; and exchange fees; and (2) ongoing costs, including management fees; service fees; and other Fund expenses. This Example is intended to help you understand your ongoing costs (in dollars) of investing in the Fund and to compare these costs with the ongoing costs of investing in other mutual funds. The Example is based on an investment of $1,000 invested at the beginning of the period and held for the entire period from November 1, 2017, through April 30, 2018.
Actual Expenses
The first line of the table below under the “Investor Class” and “Institutional Class” headings provides information about actual account values and actual expenses. Although the Fund charges no sales loads or transaction fees, you will be assessed fees for outgoing wire transfers, returned checks and stop payment orders at prevailing rates charged by U.S. Bancorp Fund Services, LLC, the Fund’s transfer agent. If you request that a redemption be made by wire transfer, currently a $15 fee is charged by the Fund’s transfer agent. IRA accounts will be charged a $15 annual maintenance fee. The example below includes, but is not limited to, management fees, shareholder servicing fees, fund accounting, custody, and transfer agent fees. However, the example below does not include portfolio trading commissions and related expenses, and other extraordinary expenses as determined under generally accepted accounting principles. You may use the information in this line, together with the amount you invested, to estimate the expenses that you paid over the period. Simply divide your account value by $1,000 (for example, an $8,600 account value divided by $1,000 = 8.6), then multiply the result by the number in the first line of the table under the “Investor Class” or “Institutional Class” headings in the column entitled “Expenses Paid During Period” to estimate the expenses you paid on your account during this period.
Hypothetical Example for Comparison Purposes
The second line of the table below under the “Investor Class” and “Institutional Class” headings provides information about hypothetical account values and hypothetical expenses based on the Fund’s actual expense ratios and an assumed rate of return of 5% per year before expenses, which is not the Fund’s actual return. The hypothetical account values and expenses may not be used to estimate the actual ending account balance or expenses you paid for the period. You may use this information to compare the ongoing costs of investing in the Fund and other funds. To do so, compare this 5% hypothetical example with the 5% hypothetical examples that appear in the shareholder reports of the other funds. Please note that the expenses shown in the table are meant to highlight your ongoing costs only and do not reflect any transactional costs, such as sales charges (loads), or exchange fees. Therefore, the second line of the table under the “Investor Class” and “Institutional Class” headings is useful in comparing ongoing costs only, and will not help you determine the relative total costs of owning different funds. In addition, if these transactional costs were included, your costs would have been higher.
HENNESSYFUNDS.COM
| | | | Expenses Paid |
| | Beginning | Ending | During Period(1) |
| | Account Value | Account Value | November 1, 2017 – |
| | November 1, 2017 | April 30, 2018 | April 30, 2018 |
| Investor Class | | | |
| Actual | $1,000.00 | $ 999.10 | $6.49 |
| Hypothetical (5% return before expenses) | $1,000.00 | $1,018.30 | $6.56 |
| | | | |
| Institutional Class | | | |
| Actual | $1,000.00 | $1,000.60 | $4.71 |
| Hypothetical (5% return before expenses) | $1,000.00 | $1,020.08 | $4.76 |
(1) | Expenses are equal to the Fund’s expense ratio of 1.31% for Investor Class shares or 0.95% for Institutional Class shares, as applicable, multiplied by the average account value over the period, multiplied by 181/365 days (to reflect one-half year period). |
| HENNESSY FUNDS | 1-800-966-4354 | |
How to Obtain a Copy of the Fund’s
Proxy Voting Policy and Proxy Voting Records
A description of the policies and procedures the Fund uses to determine how to vote proxies relating to portfolio securities is available without charge (1) by calling 1-800-966-4354, (2) on the Hennessy Funds’ website at hennessyfunds.com/proxy-voting/voting-policy, or (3) on the U.S. Securities and Exchange Commission’s (the “SEC”) website at www.sec.gov. The Fund’s proxy voting record is available without charge on both the Hennessy Funds’ website at hennessyfunds.com/proxy-voting/voting-record and the SEC’s website at www.sec.gov no later than August 31 for the prior 12 months ending June 30.
Quarterly Filings on Form N-Q
The Fund files a complete schedule of portfolio holdings with the SEC for the first and third quarters of each fiscal year on Form N-Q. The Fund’s Forms N-Q are available on the SEC’s website at www.sec.gov. The Fund’s Forms N-Q may be reviewed and copied at the SEC’s Public Reference Room in Washington, DC and information on the operation of the Public Reference Room may be obtained by calling 1-800-SEC-0330. Information included in the Fund’s Forms N-Q will also be available upon request by calling 1-800-966-4354.
Important Notice Regarding Delivery of
Shareholder Documents
To help keep the Fund’s costs as low as possible, we generally deliver a single copy of shareholder reports, proxy statements, and prospectuses to shareholders who share an address and have the same last name. This process does not apply to account statements. You may request an individual copy of a shareholder document at any time. If you would like to receive separate mailings of shareholder documents, please call U.S. Bancorp Fund Services, LLC at 1-800-261-6950 or 1-414-765-4124, and individual delivery will begin within 30 days of your request. If your account is held through a financial institution or other intermediary, please contact such intermediary directly to request individual delivery.
HENNESSYFUNDS.COM
| PROXY VOTING — BOARD APPROVAL OF INVESTMENT ADVISORY AGREEMENT |
Board Approval of Investment Advisory
Agreement
At its meeting on March 7, 2018, the Board of Trustees of the Fund (the “Board,” and the members thereof, the “Trustees”) unanimously approved the continuation of the investment advisory agreement of the Fund with Hennessy Advisors, Inc. (the “Advisor”). As part of the process of approving the continuation of the advisory agreement, the Trustees reviewed their fiduciary duties with respect to approving the advisory agreement and the relevant factors for them to consider. In addition, the Trustees who are not deemed “interested persons” (as defined by the Investment Company Act of 1940, as amended) of the Fund (the “Independent Trustees”) met in executive session to discuss the approval of the advisory agreement.
In advance of the meeting, the Advisor sent detailed information to the Trustees to assist them in their evaluation of the advisory agreement. This information included, but was not limited to, the following:
| | (1) | A memorandum from outside legal counsel that described the fiduciary duties of the Board with respect to approving the continuation of the advisory agreement and the relevant factors for consideration; |
| | | |
| | (2) | A memorandum from the Advisor that listed the factors relevant to the Board’s approval of the continuation of the advisory agreement and also referenced the documents that had been provided to help the Board assess each such factor; |
| | | |
| | (3) | An inventory of the range of services provided by the Advisor to the Fund; |
| | | |
| | (4) | A written discussion of economies of scale; |
| | | |
| | (5) | The advisory agreement; |
| | | |
| | (6) | A recent Fund fact sheet, which included, among other things, performance information over various periods; |
| | | |
| | (7) | A peer expense comparison of both the net expense ratio and investment advisory fee of the Fund; |
| | | |
| | (8) | The Advisor’s most recent Form 10-K and Form 10-Q, which includes information about the Advisor’s profitability; |
| | | |
| | (9) | Information about brokerage commissions; |
| | | |
| | (10) | Information about the Fund’s compliance program; and |
| | | |
| | (11) | The Advisor’s current Form ADV Part I. |
All of the factors discussed were considered as a whole by the Trustees, and also by the Independent Trustees meeting in executive session. The factors were viewed in their totality by the Trustees, with no single factor being the principal or determinative factor in the Trustees’ determination of whether to approve the continuation of the advisory agreement. The Trustees recognized that the management and fee arrangements for the Fund are the result of years of review and discussion between the Independent Trustees and the Advisor, that certain aspects of such arrangements may receive greater scrutiny in some years than in others, and that the Trustees’ conclusions may be based, in part, on their consideration of these same arrangements and information received during the course of the year and in prior years.
| HENNESSY FUNDS | 1-800-966-4354 | |
Prior to approving the continuation of the advisory agreement, the Trustees, including the Independent Trustees in executive session, considered, among other items:
| | (1) | The nature and quality of the advisory services provided by the Advisor; |
| | | |
| | (2) | A comparison of the fees and expenses of the Fund to other similar funds; |
| | | |
| | (3) | Whether economies of scale are recognized by the Fund; |
| | | |
| | (4) | The costs and profitability of the Fund to the Advisor; |
| | | |
| | (5) | The performance of the Fund; and |
| | | |
| | (6) | Any benefits to the Advisor from serving as an investment advisor to the Fund (other than the advisory fee). |
The material considerations and determinations of the Trustees, including the Independent Trustees, were as follows:
| | (1) | The Trustees considered the services identified below that are provided by the Advisor. Based on this review, the Trustees concluded that the Advisor provides high-quality services to the Fund, and they noted that their overall confidence in the Advisor is high. The Trustees also concluded that they were satisfied with the nature, extent, and quality of the advisory services provided to the Fund by the Advisor, and that the nature and extent of the services provided by the Advisor are appropriate to assure that the Fund’s operations are conducted in compliance with applicable laws, rules, and regulations. |
| | | (a) | The Advisor acts as the portfolio manager for the Fund. In this capacity, the Advisor does the following: |
| | | | (i) | manages the composition of the Fund’s portfolio, including the purchase, retention, and disposition of portfolio securities in accordance with the Fund’s investment objectives, policies, and restrictions; |
| | | | | |
| | | | (ii) | ensures compliance with “best execution” for the Fund’s portfolio; |
| | | | | |
| | | | (iii) | manages the use of soft dollars for the Fund; and |
| | | | | |
| | | | (iv) | manages proxy voting for the Fund. |
| | | (b) | The Advisor performs a daily reconciliation of portfolio positions and cash for the Fund. |
| | | | |
| | | (c) | The Advisor monitors the Fund’s compliance with its investment objectives and restrictions. |
| | | | |
| | | (d) | The Advisor monitors compliance with federal securities laws and performs activities such as maintaining a compliance program, conducting ongoing reviews of the compliance programs of the Fund’s service providers, conducting on-site visits to the Fund’s service providers, monitoring incidents of abusive trading practices, reviewing Fund expense accruals, payments, and fixed expense ratios, evaluating insurance providers for fidelity bond coverage and D&O/E&O insurance coverage, conducting employee compliance training, reviewing reports provided by service providers, maintaining books and records, and preparing an annual compliance report for the Board. |
| | | | |
| | | (e) | The Advisor oversees service providers that provide accounting, administration, distribution, transfer agency, custodial, sales, marketing, public relations, audit, information technology, and legal services to the Fund. |
HENNESSYFUNDS.COM
| BOARD APPROVAL OF INVESTMENT ADVISORY AGREEMENT |
| | | (f) | The Advisor maintains in-house marketing and distribution departments on behalf of the Fund. |
| | | | |
| | | (g) | The Advisor is actively involved with preparing regulatory filings for the Fund, including writing and annually updating the Fund’s prospectus and related documents. |
| | | | |
| | | (h) | The Advisor prepares a written summary of the Fund’s performance for the most recent 12-month period for each annual report of the Fund. |
| | | | |
| | | (i) | The Advisor oversees distribution of the Fund through third-party broker/dealers and independent financial institutions such as Charles Schwab, Inc., Fidelity, TD Waterhouse, and Pershing. The Advisor participates in “no transaction fee” (“NTF”) programs with these companies on behalf of the Fund, which allow customers to purchase the Fund through third-party distribution channels without paying a transaction fee. The Advisor compensates, in part, a number of these third-party providers of NTF programs out of its own revenues. |
| | | | |
| | | (j) | The Advisor pays the incentive compensation of the Fund’s compliance officers and employs other staff, such as legal, marketing, national accounts, distribution, sales, administrative, and trading oversight personnel, as well as management executives. |
| | | | |
| | | (k) | The Advisor provides a quarterly compliance certification to the Board. |
| | | | |
| | | (l) | The Advisor prepares or reviews Board materials, frequently presents to the Board or leads Board discussions, prepares or reviews meeting minutes, and arranges for Board training and education. |
| | (2) | The Trustees compared the performance of the Fund to benchmark indices over various time periods and also noted that the Trustees review and discuss reports comparing the investment performance of the Fund to various indices at each quarterly Board meeting. Based on all such information, the Trustees believe that the Advisor manages the Fund in a manner that is materially consistent with its stated investment objective and style. The Trustees concluded that the performance of the Fund over various time periods warranted the continuation of the advisory agreement. |
| | | |
| | (3) | The Trustees reviewed the advisory fees and overall expense ratios of the Fund compared to other funds similar in asset size and investment objective to the Fund using data from Morningstar. As part of the discussion with management, the Trustees ensured that they understood and were comfortable with the criteria used to determine the mutual funds included in the Morningstar categories for purposes of the materials considered at the meeting. The Trustees determined that the advisory fee and overall expense ratio of the Fund falls within the range of the advisory fees and overall expense ratios of other comparable funds and concluded that they are reasonable and warranted continuation of the advisory agreement. |
| | | |
| | (4) | The Trustees also considered whether economies of scale were being realized by the Advisor that should be shared with the Fund’s shareholders. The Trustees noted that many of the expenses incurred to manage the Fund are asset-based fees and thus do not result in material economies of scale being realized as the assets of the Fund increase. For example, mutual fund platform fees increase as the Fund’s assets grow. The Trustees also considered the Advisor’s efforts to |
| HENNESSY FUNDS | 1-800-966-4354 | |
| | | contain expenses, the Advisor’s significant marketing efforts to promote the Funds, and the Advisor’s agreement to waive fees or lower its management fees in certain circumstances. The Trustees determined that it did not appear that there were significant economies of scale being realized by the Advisor and concluded that it would continue to monitor economies of scale in the future as circumstances changed. |
| | | |
| | (5) | The Trustees considered the profitability of the Advisor, including the impact of mutual fund platform fees on the Advisor’s profitability, and also considered the resources and revenues that the Advisor has put into managing and distributing the Fund. The Trustees then concluded that the profits of the Advisor are reasonable and not excessive when compared to profitability guidelines set forth in relevant court cases. |
| | | |
| | (6) | The Trustees considered the high level of professionalism and knowledge of the Advisor’s employees, along with a very low level of turnover, and concluded that this was beneficial to the Fund and its shareholders. |
| | | |
| | (7) | The Trustees considered any benefits to the Advisor from serving as an advisor to the Fund (other than the advisory fee). The Trustees noted that the Advisor may derive ancillary benefits from, by way of example, its association with the Fund in the form of proprietary and third-party research products and services received from broker-dealers that execute portfolio trades for the Fund. The Trustees determined that any such products and services have been used for legitimate purposes relating to the Fund by providing assistance in the investment decision-making process. The Trustees concluded that any additional benefits realized by the Advisor from its relationship with the Fund were reasonable. |
After reviewing the materials provided at the meeting and management’s presentation, as well as other information regularly provided at the Board’s quarterly meetings throughout the year regarding the quality of services provided by the Advisor, the performance of the Fund, expense information, regulatory compliance issues, trading information and related matters, and other factors that the Trustees deemed relevant, the Trustees, including the Independent Trustees, approved the continuation of the advisory agreement.
HENNESSYFUNDS.COM
| BOARD APPROVAL OF INVESTMENT ADVISORY AGREEMENT |
(This Page Intentionally Left Blank.)
For information, questions or assistance, please call
The Hennessy Funds
1-800-966-4354 or 1-415-899-1555
INVESTMENT ADVISOR
Hennessy Advisors, Inc.
7250 Redwood Boulevard, Suite 200
Novato, California 94945
ADMINISTRATOR,
TRANSFER AGENT,
DIVIDEND PAYING AGENT &
SHAREHOLDER SERVICING AGENT
U.S. Bancorp Fund Services, LLC
P.O. Box 701
Milwaukee, Wisconsin 53201-0701
CUSTODIAN
U.S. Bank N.A.
Custody Operations
1555 North River Center Drive, Suite 302
Milwaukee, Wisconsin 53212
TRUSTEES
Neil J. Hennessy
Robert T. Doyle
J. Dennis DeSousa
Gerald P. Richardson
COUNSEL
Foley & Lardner LLP
777 East Wisconsin Avenue
Milwaukee, Wisconsin 53202-5306
INDEPENDENT REGISTERED
PUBLIC ACCOUNTING FIRM
Tait, Weller & Baker LLP
1818 Market Street, Suite 2400
Philadelphia, Pennsylvania 19103
DISTRIBUTOR
Quasar Distributors, LLC
777 East Wisconsin Avenue
Milwaukee, Wisconsin 53202
hennessyfunds.com | 1-800-966-4354
This report has been prepared for shareholders and may be distributed to
others only if preceded or accompanied by a current prospectus.
SEMI-ANNUAL REPORT
APRIL 30, 2018
HENNESSY CORNERSTONE
LARGE GROWTH FUND
Investor Class HFLGX
Institutional Class HILGX
hennessyfunds.com | 1-800-966-4354
(This Page Intentionally Left Blank.)
Contents
| Letter to Shareholders | 2 |
| Performance Overview | 4 |
| Financial Statements | |
| Schedule of Investments | 5 |
| Statement of Assets and Liabilities | 9 |
| Statement of Operations | 10 |
| Statements of Changes in Net Assets | 11 |
| Financial Highlights | 12 |
| Notes to the Financial Statements | 16 |
| Expense Example | 23 |
| Proxy Voting Policy and Proxy Voting Records | 25 |
| Quarterly Schedule of Investments | 25 |
| Federal Tax Distribution Information | 25 |
| Important Notice Regarding Delivery of Shareholder Documents | 25 |
| Board Approval of Investment Advisory Agreement | 26 |
| HENNESSY FUNDS | 1-800-966-4354 | |
May 2018
Dear Hennessy Funds Shareholder:
Investors in the United States and abroad experienced the return of volatility in the six months ended April 30, 2018, especially during the second half of the period. Equities rallied sharply during the first half of the period and fell back during the second half, but nevertheless ended the period with solid gains, with the Dow Jones Industrial Average posting a total return of 4.5% and the S&P 500 Index up 3.8%. Over the past year, I have repeatedly shared my belief that the stock market was due for a correction, but that it would bounce back, as it has so many times during the current bull market.
In the closing months of 2017 and into January 2018, U.S. equities rallied in response to the enactment of the Tax Cuts and Jobs Act of 2017, which significantly lowered corporate tax rates. Investors were also encouraged by two quarters of real GDP growth of 3.2% and 2.9%. However, equity prices quickly lost ground in reaction to the imposition of trade tariffs on steel and aluminum, and fears that additional proposed tariffs could provoke a trade war with China. Signals from the Federal Reserve that the pace of interest rate increases would move slightly higher also weighed on investors. During the period, the federal funds rate was raised twice, by a quarter point each time, in December 2017 and March 2018.
The current bull market in U.S. equities is now entering its 10th year, and we remain optimistic about the outlook for stock prices. In our opinion, economic fundamentals look positive. The U.S. economy is growing at a solid pace of 2 – 3% annually, inflation is low, and high employment levels are supporting healthy growth in consumption. Wages are rising, but the rate of increase has remained steady at around 2.6% per year since mid-2016. While it appears that the Federal Reserve will continue to raise the federal funds rate and normalize monetary policy, we believe it will be able to do so gradually, avoiding a severe jolt to either financial markets or the economy. Meanwhile, companies continue to report robust earnings growth, boosted this year by lower tax rates.
We believe U.S. equities remain attractively valued. U.S. long bond yields are hovering near 3%, having risen over the period in response to strong economic activity. Prospective PE multiples, however, have dropped significantly since the end of 2017, the result of a combination of lower taxes, higher operating earnings, and lower stock prices. The Dow Jones Industrial Average and the S&P 500 Index are trading at about 17x forward earnings, down from approximately 20x at the beginning of the calendar year, valuations we believe to be very reasonable.
We are not overly concerned about recent protectionist actions by the U.S. administration. We consider the announcements and ongoing discussions regarding import tariffs and NAFTA to be representative of standard Trump deal-making tactics – make far-reaching demands and then negotiate a reasonable outcome that is beneficial to both sides. We expect continued pro-business policies and regulatory relief to be enacted by our leaders in Washington.
Finally, as noted many times in past letters during this bull market, the euphoria that has historically accompanied a peak in the market continues to be absent. Investors today are worried about many things, including higher interest rates, larger budget deficits, higher import tariffs, and political distractions. But they are definitely not euphoric. In the past, I have likened the current bull market to the 1982-2000 bull market, and I continue
HENNESSYFUNDS.COM
to believe the comparison is a good one. We remain confident that the market will be able to weather the current period of volatility and that the economy, despite higher interest rates and possible trade disruptions, is resilient enough to continue its steady growth into the coming year.
Thank you for your continued confidence and investment in the Hennessy Funds. If you have any questions or would like to speak with us directly, please don’t hesitate to call us at (800) 966-4354.
Best regards,
Neil J. Hennessy
President and Chief Investment Officer
Past performance does not guarantee future results.
Mutual fund investing involves risk. Principal loss is possible.
Opinions expressed are those of Neil Hennessy and are subject to change, are not guaranteed, and should not be considered investment advice.
The Dow Jones Industrial Average and S&P 500 Index are unmanaged indices commonly used to measure the performance of U.S. stocks. One cannot invest directly in an index.
Price to earnings (PE) is calculated by dividing a company’s market price per share by its earnings per share. Earnings growth is not a measure of a fund’s future performance.
| HENNESSY FUNDS | 1-800-966-4354 | |
Performance Overview (Unaudited)
AVERAGE ANNUAL TOTAL RETURN FOR PERIODS ENDED APRIL 30, 2018
| | | | | Since |
| | Six | One | Five | Inception |
| | Months(1) | Year | Years | (3/20/09) |
| Hennessy Cornerstone | | | | |
| Large Growth Fund – | | | | |
| Investor Class (HFLGX) | 5.87% | 9.60% | 11.47% | 16.14% |
| Hennessy Cornerstone | | | | |
| Large Growth Fund – | | | | |
| Institutional Class (HILGX) | 5.92% | 9.81% | 11.69% | 16.41% |
Russell 1000® Index | 3.83% | 13.17% | 12.84% | 17.14% |
| S&P 500 Index | 3.82% | 13.27% | 12.96% | 16.97% |
| Expense ratios: | 1.26% (Investor Class); |
| | Gross 1.01%, Net 0.99%(2) (Institutional Class) |
(1) | Periods less than one year are not annualized. |
(2) | The Fund’s investment advisor has contractually agreed to limit expenses until November 30, 2019. |
___________________
Performance data quoted represents past performance; past performance does not guarantee future results. The investment return and principal value of an investment will fluctuate so that an investor’s shares, when redeemed, may be worth more or less than their original cost. The performance table does not reflect the deduction of taxes that a shareholder would pay on Fund distributions or the redemption of Fund shares. Current performance of the Fund may be lower or higher than the performance quoted. Performance data current to the most recent month end may be obtained by visiting hennessyfunds.com.
The Russell 1000® Index is commonly used to measure the performance of large capitalization U.S. stocks. The S&P 500 Index is an unmanaged index commonly used to measure the performance of U.S. stocks. One cannot invest directly in an index.
Frank Russell Company (“Russell”) is the source and owner of the trademarks, service marks, and copyrights related to the Russell Indexes. Russell® is a trademark of Frank Russell Company. Neither Russell nor its licensors accept any liability for any errors or omissions in the Russell Indexes or Russell ratings or underlying data and no party may rely on any Russell Indexes or Russell ratings or underlying data contained in this communication. No further distribution of Russell data is permitted without Russell’s express written consent. Russell does not promote, sponsor, or endorse the content of this communication.
The expense ratios presented are from the most recent prospectus. The expense ratios for the current reporting period are available in the Financial Highlights section of this report.
| PERFORMANCE OVERVIEW/SCHEDULE OF INVESTMENTS |
Financial Statements
Schedule of Investments as of April 30, 2018 (Unaudited) |
HENNESSY CORNERSTONE LARGE GROWTH FUND
(% of Net Assets)
| TOP TEN HOLDINGS (EXCLUDING CASH/CASH EQUIVALENTS) | % NET ASSETS |
| Intel Corp. | 2.32% |
| CSX Corp. | 2.25% |
| Micron Technology, Inc. | 2.19% |
| Best Buy Co., Inc. | 2.19% |
| Allstate Corp. | 2.17% |
| Lam Research Corp. | 2.15% |
| Centene Corp. | 2.12% |
| HP, Inc. | 2.12% |
| United Continental Holdings, Inc. | 2.11% |
| Eastman Chemical Co. | 2.11% |
Note: For presentation purposes, the Fund has grouped some of the industry categories. For purposes of categorizing securities for compliance with Section 8(b)(1) of the Investment Company Act of 1940, as amended, the Fund uses more specific industry classifications.
The Global Industry Classification Standard (GICS®) was developed by and is the exclusive property and a service mark of MSCI, Inc. and Standard & Poor Financial Services LLC. It has been licensed for use by the Hennessy Funds.
| HENNESSY FUNDS | 1-800-966-4354 | |
| COMMON STOCKS – 97.72% | | Number | | | | | | % of | |
| | | of Shares | | | Value | | | Net Assets | |
| Consumer Discretionary – 24.77% | | | | | | | | | |
| AutoZone, Inc. (a) | | | 4,100 | | | $ | 2,560,532 | | | | 1.70 | % |
| Best Buy Co., Inc. | | | 43,100 | | | | 3,298,443 | | | | 2.19 | % |
| CBS Corp., Class B | | | 57,000 | | | | 2,804,400 | | | | 1.86 | % |
| Darden Restaurants, Inc. | | | 32,200 | | | | 2,990,092 | | | | 1.98 | % |
| General Motors Co. | | | 72,100 | | | | 2,648,954 | | | | 1.76 | % |
| Kohl’s Corp. | | | 49,600 | | | | 3,081,152 | | | | 2.05 | % |
| L Brands, Inc. | | | 62,200 | | | | 2,171,402 | | | | 1.44 | % |
| Omnicom Group, Inc. | | | 38,500 | | | | 2,835,910 | | | | 1.88 | % |
| Starbucks Corp. | | | 54,670 | | | | 3,147,352 | | | | 2.09 | % |
| Target Corp. | | | 42,100 | | | | 3,056,460 | | | | 2.03 | % |
| The Gap, Inc. | | | 96,400 | | | | 2,818,736 | | | | 1.87 | % |
| The Walt Disney Co. | | | 29,300 | | | | 2,939,669 | | | | 1.95 | % |
| Wyndham Worldwide Corp. | | | 26,000 | | | | 2,969,460 | | | | 1.97 | % |
| | | | | | | | 37,322,562 | | | | 24.77 | % |
| | | | | | | | | | | | | |
| Consumer Staples – 18.51% | | | | | | | | | | | | |
| Altria Group, Inc. | | | 46,400 | | | | 2,603,504 | | | | 1.73 | % |
| Campbell Soup Co. | | | 65,400 | | | | 2,667,012 | | | | 1.77 | % |
| Conagra Brands, Inc. | | | 84,900 | | | | 3,147,243 | | | | 2.09 | % |
| CVS Health Corp. | | | 43,400 | | | | 3,030,622 | | | | 2.01 | % |
| General Mills, Inc. | | | 55,200 | | | | 2,414,448 | | | | 1.60 | % |
| Kimberly-Clark Corp. | | | 26,600 | | | | 2,754,164 | | | | 1.83 | % |
| The Kroger Co. | | | 111,400 | | | | 2,806,166 | | | | 1.86 | % |
| Tyson Foods, Inc., Class A | | | 40,600 | | | | 2,846,060 | | | | 1.89 | % |
| Walgreens Boots Alliance, Inc. | | | 44,200 | | | | 2,937,090 | | | | 1.95 | % |
| Walmart, Inc. | | | 30,400 | | | | 2,689,184 | | | | 1.78 | % |
| | | | | | | | 27,895,493 | | | | 18.51 | % |
| | | | | | | | | | | | | |
| Financials – 3.97% | | | | | | | | | | | | |
| Allstate Corp. | | | 33,400 | | | | 3,267,188 | | | | 2.17 | % |
| Ameriprise Financial, Inc. | | | 19,400 | | | | 2,720,074 | | | | 1.80 | % |
| | | | | | | | 5,987,262 | | | | 3.97 | % |
| | | | | | | | | | | | | |
| Health Care – 6.17% | | | | | | | | | | | | |
| Centene Corp. (a) | | | 29,400 | | | | 3,192,252 | | | | 2.12 | % |
| Express Scripts Holding Co. (a) | | | 41,600 | | | | 3,149,120 | | | | 2.09 | % |
| HCA Healthcare, Inc. | | | 30,800 | | | | 2,948,792 | | | | 1.96 | % |
| | | | | | | | 9,290,164 | | | | 6.17 | % |
The accompanying notes are an integral part of these financial statements.
| COMMON STOCKS | | Number | | | | | | % of | |
| | | of Shares | | | Value | | | Net Assets | |
| Industrials – 19.74% | | | | | | | | | |
| American Airlines Group, Inc. | | | 60,500 | | | $ | 2,597,265 | | | | 1.72 | % |
| CSX Corp. | | | 57,000 | | | | 3,385,230 | | | | 2.25 | % |
| Deere & Co. | | | 19,000 | | | | 2,571,270 | | | | 1.71 | % |
| Delta Air Lines, Inc. | | | 58,200 | | | | 3,039,204 | | | | 2.02 | % |
| FedEx Corp. | | | 12,600 | | | | 3,114,720 | | | | 2.07 | % |
| PACCAR, Inc. | | | 44,400 | | | | 2,826,948 | | | | 1.87 | % |
| Southwest Airlines Co. | | | 53,300 | | | | 2,815,839 | | | | 1.87 | % |
| Union Pacific Corp. | | | 23,598 | | | | 3,153,401 | | | | 2.09 | % |
| United Continental Holdings, Inc. (a) | | | 47,200 | | | | 3,187,888 | | | | 2.11 | % |
| Waste Management, Inc. | | | 37,600 | | | | 3,056,504 | | | | 2.03 | % |
| | | | | | | | 29,748,269 | | | | 19.74 | % |
| | | | | | | | | | | | | |
| Information Technology – 14.76% | | | | | | | | | | | | |
| Apple, Inc. | | | 18,630 | | | | 3,078,794 | | | | 2.04 | % |
| Applied Materials, Inc. | | | 61,200 | | | | 3,039,804 | | | | 2.02 | % |
| HP, Inc. | | | 148,400 | | | | 3,189,116 | | | | 2.12 | % |
| Intel Corp. | | | 67,550 | | | | 3,486,931 | | | | 2.32 | % |
| International Business Machines Corp. | | | 20,000 | | | | 2,899,200 | | | | 1.92 | % |
| Lam Research Corp. | | | 17,500 | | | | 3,238,550 | | | | 2.15 | % |
| Micron Technology, Inc. (a) | | | 71,800 | | | | 3,301,364 | | | | 2.19 | % |
| | | | | | | | 22,233,759 | | | | 14.76 | % |
| | | | | | | | | | | | | |
| Materials – 7.82% | | | | | | | | | | | | |
| Eastman Chemical Co. | | | 31,100 | | | | 3,174,688 | | | | 2.11 | % |
| Freeport-McMoRan, Inc. | | | 172,400 | | | | 2,622,204 | | | | 1.74 | % |
| Nucor Corp. | | | 47,800 | | | | 2,945,436 | | | | 1.96 | % |
| Steel Dynamics, Inc. | | | 67,700 | | | | 3,033,637 | | | | 2.01 | % |
| | | | | | | | 11,775,965 | | | | 7.82 | % |
| | | | | | | | | | | | | |
| Telecommunication Services – 1.98% | | | | | | | | | | | | |
| Verizon Communications, Inc. | | | 60,500 | | | | 2,985,675 | | | | 1.98 | % |
| | | | | | | | | | | | | |
| Total Common Stocks | | | | | | | | | | | | |
| (Cost $141,875,441) | | | | | | | 147,239,149 | | | | 97.72 | % |
The accompanying notes are an integral part of these financial statements.
| HENNESSY FUNDS | 1-800-966-4354 | |
| SHORT-TERM INVESTMENTS – 2.41% | | Number | | | | | | % of | |
| | | of Shares | | | Value | | | Net Assets | |
| Money Market Funds – 2.41% | | | | | | | | | |
| Fidelity Government Portfolio, Institutional Class, 1.58% (b) | | | 3,638,751 | | | $ | 3,638,751 | | | | 2.41 | % |
| | | | | | | | | | | | | |
| Total Short-Term Investments | | | | | | | | | | | | |
| (Cost $3,638,751) | | | | | | | 3,638,751 | | | | 2.41 | % |
| | | | | | | | | | | | | |
| Total Investments | | | | | | | | | | | | |
| (Cost $145,514,192) – 100.13% | | | | | | | 150,877,900 | | | | 100.13 | % |
| Liabilities in Excess of Other Assets – (0.13)% | | | | | | | (192,735 | ) | | | (0.13 | )% |
| | | | | | | | | | | | | |
TOTAL NET ASSETS – 100.00% | | | | | | $ | 150,685,165 | | | | 100.00 | % |
Percentages are stated as a percent of net assets.
| (a) | Non-income producing security. |
| (b) | The rate listed is the fund’s seven-day yield as of April 30, 2018. |
Summary of Fair Value Exposure at April 30, 2018
The following is a summary of the inputs used to value the Fund’s net assets as of April 30, 2018 (See Note 3 in the accompanying notes to the financial statements):
| Common Stocks | | Level 1 | | | Level 2 | | | Level 3 | | | Total | |
| Consumer Discretionary | | $ | 37,322,562 | | | $ | — | | | $ | — | | | $ | 37,322,562 | |
| Consumer Staples | | | 27,895,493 | | | | — | | | | — | | | | 27,895,493 | |
| Financials | | | 5,987,262 | | | | — | | | | — | | | | 5,987,262 | |
| Health Care | | | 9,290,164 | | | | — | | | | — | | | | 9,290,164 | |
| Industrials | | | 29,748,269 | | | | — | | | | — | | | | 29,748,269 | |
| Information Technology | | | 22,233,759 | | | | — | | | | — | | | | 22,233,759 | |
| Materials | | | 11,775,965 | | | | — | | | | — | | | | 11,775,965 | |
| Telecommunication Services | | | 2,985,675 | | | | — | | | | — | | | | 2,985,675 | |
| Total Common Stocks | | $ | 147,239,149 | | | $ | — | | | $ | — | | | $ | 147,239,149 | |
| Short-Term Investments | | | | | | | | | | | | | | | | |
| Money Market Funds | | $ | 3,638,751 | | | $ | — | | | $ | — | | | $ | 3,638,751 | |
| Total Short-Term Investments | | $ | 3,638,751 | | | $ | — | | | $ | — | | | $ | 3,638,751 | |
| Total Investments | | $ | 150,877,900 | | | $ | — | | | $ | — | | | $ | 150,877,900 | |
Transfers between levels are recognized at the end of the reporting period. During the six-month period ended April 30, 2018, the Fund recognized no transfers between levels.
The accompanying notes are an integral part of these financial statements.
| SCHEDULE OF INVESTMENTS/STATEMENT OF ASSETS AND LIABILITIES |
Financial Statements
Statement of Assets and Liabilities as of April 30, 2018 (Unaudited) |
| ASSETS: | | | |
| Investments in securities, at value (cost $145,514,192) | | $ | 150,877,900 | |
| Dividends and interest receivable | | | 190,543 | |
| Receivable for fund shares sold | | | 54,479 | |
| Prepaid expenses and other assets | | | 17,526 | |
| Total Assets | | | 151,140,448 | |
| | | | | |
| LIABILITIES: | | | | |
| Payable for fund shares redeemed | | | 99,107 | |
| Payable to advisor | | | 93,543 | |
| Payable to administrator | | | 24,603 | |
| Payable to auditor | | | 9,731 | |
| Accrued distribution fees | | | 200,169 | |
| Accrued service fees | | | 10,926 | |
| Accrued trustees fees | | | 4,837 | |
| Accrued expenses and other payables | | | 12,367 | |
| Total Liabilities | | | 455,283 | |
| NET ASSETS | | $ | 150,685,165 | |
| | | | | |
| NET ASSETS CONSIST OF: | | | | |
| Capital stock | | $ | 106,223,464 | |
| Accumulated net investment income | | | 188,245 | |
| Accumulated net realized gain on investments | | | 38,909,762 | |
| Unrealized net appreciation on investments | | | 5,363,694 | |
| Total Net Assets | | $ | 150,685,165 | |
| | | | | |
| NET ASSETS | | | | |
| Investor Class: | | | | |
| Shares authorized (no par value) | | Unlimited | |
| Net assets applicable to outstanding Investor Class shares | | $ | 130,255,454 | |
| Shares issued and outstanding | | | 10,913,391 | |
| Net asset value, offering price and redemption price per share | | $ | 11.94 | |
| | | | | |
| Institutional Class: | | | | |
| Shares authorized (no par value) | | Unlimited | |
| Net assets applicable to outstanding Institutional Class shares | | $ | 20,429,711 | |
| Shares issued and outstanding | | | 1,695,111 | |
| Net asset value, offering price and redemption price per share | | $ | 12.05 | |
The accompanying notes are an integral part of these financial statements.
| HENNESSY FUNDS | 1-800-966-4354 | |
Financial Statements
Statement of Operations for the six months ended April 30, 2018 (Unaudited) |
| INVESTMENT INCOME: | | | |
| Dividend income | | $ | 1,409,378 | |
| Interest income | | | 28,432 | |
| Total investment income | | | 1,437,810 | |
| | | | | |
| EXPENSES: | | | | |
| Investment advisory fees (See Note 5) | | | 558,008 | |
| Distribution fees – Investor Class (See Note 5) | | | 97,816 | |
| Administration, fund accounting, custody and transfer agent fees (See Note 5) | | | 70,862 | |
| Service fees – Investor Class (See Note 5) | | | 65,211 | |
| Sub-transfer agent expenses – Investor Class (See Note 5) | | | 40,782 | |
| Sub-transfer agent expenses – Institutional Class (See Note 5) | | | 3,795 | |
| Federal and state registration fees | | | 16,846 | |
| Compliance expense (See Note 5) | | | 14,628 | |
| Audit fees | | | 10,964 | |
| Trustees’ fees and expenses | | | 9,169 | |
| Reports to shareholders | | | 6,954 | |
| Legal fees | | | 564 | |
| Other expenses | | | 4,920 | |
| Total expenses | | | 900,519 | |
| NET INVESTMENT INCOME | | $ | 537,291 | |
| | | | | |
| REALIZED AND UNREALIZED GAINS: | | | | |
| Net realized gain on investments | | $ | 29,165,119 | |
| Net change in unrealized appreciation on investments | | | (23,142,997 | ) |
| Net gain on investments | | | 6,022,122 | |
| NET INCREASE IN NET ASSETS RESULTING FROM OPERATIONS | | $ | 6,559,413 | |
The accompanying notes are an integral part of these financial statements.
| STATEMENT OF OPERATIONS/STATEMENTS OF CHANGES IN NET ASSETS |
Financial Statements
| Statements of Changes in Net Assets |
| | | Six Months Ended | | | | |
| | | April 30, 2018 | | | Year Ended | |
| | | (Unaudited) | | | October 31, 2017 | |
| OPERATIONS: | | | | | | |
| Net investment income | | $ | 537,291 | | | $ | 1,052,238 | |
| Net realized gain on investments | | | 29,165,119 | | | | 10,781,271 | |
| Net change in unrealized appreciation on investments | | | (23,142,997 | ) | | | 3,606,256 | |
| Net increase in net assets resulting from operations | | | 6,559,413 | | | | 15,439,765 | |
| | | | | | | | | |
| DISTRIBUTIONS TO SHAREHOLDERS FROM: | | | | | | | | |
| Net investment income – Investor Class | | | (878,512 | ) | | | (1,086,070 | ) |
| Net investment income – Institutional Class | | | (173,726 | ) | | | (172,457 | ) |
| Net realized gains – Investor Class | | | (4,755,306 | ) | | | — | |
| Net realized gains – Institutional Class | | | (767,550 | ) | | | — | |
| Total distributions | | | (6,575,094 | ) | | | (1,258,527 | ) |
| | | | | | | | | |
| CAPITAL SHARE TRANSACTIONS: | | | | | | | | |
| Proceeds from shares issued in | | | | | | | | |
| the Reorganization – Investor Class | | | 42,940,856 | | | | — | |
| Proceeds from shares issued in | | | | | | | | |
| the Reorganization – Institutional Class | | | 9,672,906 | | | | — | |
| Proceeds from shares subscribed – Investor Class | | | 1,888,780 | | | | 6,295,964 | |
| Proceeds from shares subscribed – Institutional Class | | | 705,254 | | | | 772,639 | |
| Dividends reinvested – Investor Class | | | 5,350,903 | | | | 1,010,431 | |
| Dividends reinvested – Institutional Class | | | 911,739 | | | | 169,405 | |
| Cost of shares redeemed – Investor Class | | | (11,735,065 | ) | | | (15,757,878 | ) |
| Cost of shares redeemed – Institutional Class | | | (2,948,945 | ) | | | (2,723,788 | ) |
| Net increase (decrease) in net assets derived | | | | | | | | |
| from capital share transactions | | | 46,786,428 | | | | (10,233,227 | ) |
| TOTAL INCREASE IN NET ASSETS | | | 46,770,747 | | | | 3,948,011 | |
| | | | | | | | | |
| NET ASSETS: | | | | | | | | |
| Beginning of period | | | 103,914,418 | | | | 99,966,407 | |
| End of period | | $ | 150,685,165 | | | $ | 103,914,418 | |
| Undistributed net investment income, end of period | | $ | 188,245 | | | $ | 1,052,238 | |
| | | | | | | | | |
| CHANGES IN SHARES OUTSTANDING: | | | | | | | | |
| Shares issued in the Reorganization – Investor Class | | | 3,458,944 | | | | — | |
| Shares issued in the Reorganization – Institutional Class | | | 771,378 | | | | — | |
| Shares sold – Investor Class | | | 152,232 | | | | 565,507 | |
| Shares sold – Institutional Class | | | 55,582 | | | | 68,027 | |
| Shares issued to holders as reinvestment | | | | | | | | |
| of dividends – Investor Class | | | 442,489 | | | | 92,025 | |
| Shares issued to holders as reinvestment | | | | | | | | |
| of dividends – Institutional Class | | | 74,617 | | | | 15,303 | |
| Shares redeemed – Investor Class | | | (945,886 | ) | | | (1,394,127 | ) |
| Shares redeemed – Institutional Class | | | (232,180 | ) | | | (238,017 | ) |
| Net increase (decrease) in shares outstanding | | | 3,777,176 | | | | (891,282 | ) |
The accompanying notes are an integral part of these financial statements.
| HENNESSY FUNDS | 1-800-966-4354 | |
Financial Statements
For an Investor Class share outstanding throughout each period
| | | Six Months Ended | |
| | | April 30, 2018 | |
| | | (Unaudited) | |
| PER SHARE DATA: | | | |
| Net asset value, beginning of period | | $ | 11.75 | |
| | | | | |
| Income from investment operations: | | | | |
| Net investment income | | | (0.00 | )(1) |
| Net realized and unrealized gains on investments | | | 0.70 | |
| Total from investment operations | | | 0.70 | |
| | | | | |
| Less distributions: | | | | |
| Dividends from net investment income | | | (0.08 | ) |
| Dividends from net realized gains | | | (0.43 | ) |
| Total distributions | | | (0.51 | ) |
| Net asset value, end of period | | $ | 11.94 | |
| | | | | |
| TOTAL RETURN | | | 5.87 | %(2) |
| | | | | |
| SUPPLEMENTAL DATA AND RATIOS: | | | | |
| Net assets, end of period (millions) | | $ | 130.26 | |
| Ratio of expenses to average net assets | | | 1.23 | %(3) |
| Ratio of net investment income to average net assets | | | 0.68 | %(3) |
Portfolio turnover rate(4) | | | 72 | %(2) |
(1) | Amount is less than $(0.01). |
(2) | Not annualized. |
(3) | Annualized. |
(4) | Portfolio turnover is calculated on the basis of the Fund as a whole. |
The accompanying notes are an integral part of these financial statements.
HENNESSYFUNDS.COM
| FINANCIAL HIGHLIGHTS — INVESTOR CLASS |
| Year Ended October 31, | | |
| 2017 | | | 2016 | | | 2015 | | | 2014 | | | 2013 | | |
| | | | | | | | | | | | | | | |
| $ | 10.27 | | | $ | 12.99 | | | $ | 15.16 | | | $ | 13.56 | | | $ | 10.77 | | |
| | | | | | | | | | | | | | | | | | | | |
| | | | | | | | | | | | | | | | | | | | |
| | 0.11 | | | | 0.09 | | | | 0.17 | | | | 0.15 | | | | 0.14 | | |
| | 1.49 | | | | 0.08 | | | | 0.04 | | | | 2.28 | | | | 2.77 | | |
| | 1.60 | | | | 0.17 | | | | 0.21 | | | | 2.43 | | | | 2.91 | | |
| | | | | | | | | | | | | | | | | | | | |
| | | | | | | | | | | | | | | | | | | | |
| | (0.12 | ) | | | (0.16 | ) | | | (0.14 | ) | | | (0.15 | ) | | | (0.10 | ) | |
| | — | | | | (2.73 | ) | | | (2.24 | ) | | | (0.68 | ) | | | (0.02 | ) | |
| | (0.12 | ) | | | (2.89 | ) | | | (2.38 | ) | | | (0.83 | ) | | | (0.12 | ) | |
| $ | 11.75 | | | $ | 10.27 | | | $ | 12.99 | | | $ | 15.16 | | | $ | 13.56 | | |
| | | | | | | | | | | | | | | | | | | | |
| | 15.70 | % | | | 2.63 | % | | | 1.11 | % | | | 18.73 | % | | | 27.32 | % | |
| | | | | | | | | | | | | | | | | | | | |
| | | | | | | | | | | | | | | | | | | | |
| $ | 91.74 | | | $ | 87.73 | | | $ | 98.64 | | | $ | 105.51 | | | $ | 88.77 | | |
| | 1.25 | % | | | 1.25 | % | | | 1.09 | % | | | 1.15 | % | | | 1.19 | % | |
| | 0.95 | % | | | 1.22 | % | | | 1.37 | % | | | 1.12 | % | | | 1.10 | % | |
| | 65 | % | | | 53 | % | | | 79 | % | | | 57 | % | | | 73 | % | |
The accompanying notes are an integral part of these financial statements.
| HENNESSY FUNDS | 1-800-966-4354 | |
Financial Statements
For an Institutional Class share outstanding throughout each period
| | | Six Months Ended | |
| | | April 30, 2018 | |
| | | (Unaudited) | |
| PER SHARE DATA: | | | |
| Net asset value, beginning of period | | $ | 11.87 | |
| | | | | |
| Income from investment operations: | | | | |
| Net investment income | | | 0.07 | |
| Net realized and unrealized gains on investments | | | 0.64 | |
| Total from investment operations | | | 0.71 | |
| | | | | |
| Less distributions: | | | | |
| Dividends from net investment income | | | (0.10 | ) |
| Dividends from net realized gains | | | (0.43 | ) |
| Total distributions | | | (0.53 | ) |
| Net asset value, end of period | | $ | 12.05 | |
| | | | | |
| TOTAL RETURN | | | 5.92 | %(1) |
| | | | | |
| SUPPLEMENTAL DATA AND RATIOS: | | | | |
| Net assets, end of period (millions) | | $ | 20.43 | |
| Ratio of expenses to average net assets: | | | | |
| Before expense reimbursement | | | 0.96 | %(2) |
| After expense reimbursement | | | 0.96 | %(2) |
| Ratio of net investment income to average net assets: | | | | |
| Before expense reimbursement | | | 0.94 | %(2) |
| After expense reimbursement | | | 0.94 | %(2) |
Portfolio turnover rate(3) | | | 72 | %(1) |
(1) | Not annualized. |
(2) | Annualized. |
(3) | Portfolio turnover is calculated on the basis of the Fund as a whole. |
The accompanying notes are an integral part of these financial statements.
HENNESSYFUNDS.COM
| FINANCIAL HIGHLIGHTS — INSTITUTIONAL CLASS |
| Year Ended October 31, | | |
| 2017 | | | 2016 | | | 2015 | | | 2014 | | | 2013 | | |
| | | | | | | | | | | | | | | |
| $ | 10.37 | | | $ | 13.10 | | | $ | 15.30 | | | $ | 13.68 | | | $ | 10.85 | | |
| | | | | | | | | | | | | | | | | | | | |
| | | | | | | | | | | | | | | | | | | | |
| | 0.13 | | | | 0.13 | | | | 0.20 | | | | 0.17 | | | | 0.09 | | |
| | 1.52 | | | | 0.07 | | | | 0.02 | | | | 2.30 | | | | 2.88 | | |
| | 1.65 | | | | 0.20 | | | | 0.22 | | | | 2.47 | | | | 2.97 | | |
| | | | | | | | | | | | | | | | | | | | |
| | | | | | | | | | | | | | | | | | | | |
| | (0.15 | ) | | | (0.17 | ) | | | (0.16 | ) | | | (0.17 | ) | | | (0.12 | ) | |
| | — | | | | (2.76 | ) | | | (2.26 | ) | | | (0.68 | ) | | | (0.02 | ) | |
| | (0.15 | ) | | | (2.93 | ) | | | (2.42 | ) | | | (0.85 | ) | | | (0.14 | ) | |
| $ | 11.87 | | | $ | 10.37 | | | $ | 13.10 | | | $ | 15.30 | | | $ | 13.68 | | |
| | | | | | | | | | | | | | | | | | | | |
| | 16.00 | % | | | 2.92 | % | | | 1.19 | % | | | 18.96 | % | | | 27.63 | % | |
| | | | | | | | | | | | | | | | | | | | |
| | | | | | | | | | | | | | | | | | | | |
| $ | 12.17 | | | $ | 12.24 | | | $ | 13.82 | | | $ | 14.88 | | | $ | 16.19 | | |
| | | | | | | | | | | | | | | | | | | | |
| | 1.00 | % | | | 1.01 | % | | | 0.99 | % | | | 1.06 | % | | | 1.10 | % | |
| | 1.00 | % | | | 1.01 | % | | | 0.99 | % | | | 0.98 | % | | | 0.98 | % | |
| | | | | | | | | | | | | | | | | | | | |
| | 1.20 | % | | | 1.47 | % | | | 1.47 | % | | | 1.21 | % | | | 1.38 | % | |
| | 1.20 | % | | | 1.47 | % | | | 1.47 | % | | | 1.30 | % | | | 1.50 | % | |
| | 65 | % | | | 53 | % | | | 79 | % | | | 57 | % | | | 73 | % | |
The accompanying notes are an integral part of these financial statements.
| HENNESSY FUNDS | 1-800-966-4354 | |
Financial Statements
Notes to the Financial Statements April 30, 2018 (Unaudited) |
1). ORGANIZATION
The Hennessy Cornerstone Large Growth Fund (the “Fund”) is a series of Hennessy Funds Trust (the “Trust”), which was organized as a Delaware statutory trust on September 17, 1992. The Fund is an open-end management investment company registered under the Investment Company Act of 1940, as amended. The investment objective of the Fund is long-term growth of capital. The Fund is a diversified fund.
The Fund offers Investor Class and Institutional Class shares. Each class of shares differs principally in its respective 12b-1 distribution and service, shareholder servicing, and sub-transfer agent expenses. There are no sales charges. Each class has identical rights to earnings, assets, and voting privileges, except for class-specific expenses and exclusive rights to vote on matters affecting only an individual class.
As an investment company, the Fund follows the investment company accounting and reporting guidance of the Financial Accounting Standards Board (“FASB”) Accounting Standard Codification Topic 946 “Financial Services—Investment Companies.”
2). SIGNIFICANT ACCOUNTING POLICIES
The following is a summary of significant accounting policies consistently followed by the Fund in the preparation of the financial statements. These policies conform to U.S. generally accepted accounting principles (“GAAP”).
| a). | Investment Valuation – All investments in securities are recorded at their estimated fair value, as described in Note 3. |
| | |
| b). | Federal Income Taxes – No provision for federal income taxes or excise taxes has been made because the Fund has elected to be taxed as a “regulated investment company” and intends to distribute substantially all of its taxable income to its shareholders and otherwise comply with the provisions of the Internal Revenue Code of 1986, as amended, applicable to regulated investment companies. Net investment income/loss and realized gains/losses for federal income tax purposes may differ from those reported in the financial statements because of temporary book and tax basis differences. Temporary differences are primarily the result of the treatment of wash sales for tax reporting purposes. The Fund recognizes interest and penalties related to income tax benefits, if any, in the Statement of Operations as an income tax expense. Distributions from net realized gains for book purposes may include short-term capital gains, which are included as ordinary income to shareholders for tax purposes. The Fund may utilize equalization accounting for tax purposes and designate earnings and profits, including net realized gains distributed to shareholders on redemption of shares, as part of the dividends paid deduction for income tax purposes. |
| | |
| c). | Accounting for Uncertainty in Income Taxes – The Fund has accounting policies regarding recognition and measurement of tax positions taken or expected to be taken on a tax return. The tax returns of the Fund for the prior three fiscal years are open for examination. The Fund has reviewed all open tax years in major jurisdictions and concluded that there is no impact on the Fund’s net assets and no tax liability resulting from unrecognized tax benefits relating to uncertain income tax positions taken or expected to be taken on a tax return. The Fund’s major tax jurisdictions are U.S. federal and Delaware. |
| NOTES TO THE FINANCIAL STATEMENTS |
| d). | Income and Expenses – Dividend income is recognized on the ex-dividend date or as soon as information is available to the Fund. Interest income, which includes the amortization of premium and accretion of discount, is recognized on an accrual basis. The Fund is charged for those expenses that are directly attributable to the portfolio, such as advisory, administration, and certain shareholder service fees. Income, expenses (other than expenses attributable to a specific class), and realized and unrealized gains/losses on investments are allocated to each class of shares based on such class’s net assets. |
| | |
| e). | Distributions to Shareholders – Dividends from net investment income for the Fund, if any, are declared and paid annually, usually in December. Distributions of net realized capital gains, if any, are declared and paid annually, usually in December. |
| | |
| f). | Security Transactions – Investment and shareholder transactions are recorded on the trade date. The Fund determines the realized gain/loss from an investment transaction by comparing the original cost of the security lot sold with the net sale proceeds. Discounts and premiums on securities purchased are accreted or amortized, respectively, over the life of each such security. |
| | |
| g). | Use of Estimates – The preparation of financial statements in conformity with GAAP requires management to make estimates and assumptions that affect the reported amounts of assets and liabilities and disclosure of contingent assets and liabilities at the date of the financial statements and the reported change in net assets during the reporting period. Actual results could differ from those estimates. |
| | |
| h). | Share Valuation – The net asset value (“NAV”) per share of the Fund is calculated by dividing (i) the total value of the securities held by the Fund, plus cash and other assets, minus all liabilities (including estimated accrued expenses) by (ii) the total number of shares outstanding for the Fund, rounded to the nearest cent. The Fund’s shares will not be priced on days the New York Stock Exchange is closed for trading. The offering and redemption price per share for the Fund is equal to the Fund’s NAV per share. |
3). SECURITIES VALUATION
The Fund follows fair valuation accounting standards that establish an authoritative definition of fair value and set out a hierarchy for measuring fair value. These standards require additional disclosures about the various inputs and valuation techniques used to develop the measurements of fair value and a discussion of changes in valuation techniques and related inputs during the period. These inputs are summarized in the three broad levels listed below:
| | Level 1 – | Unadjusted, quoted prices in active markets for identical instruments that the Fund has the ability to access at the date of measurement. |
| | | |
| | Level 2 – | Other significant observable inputs (including, but not limited to, quoted prices in active markets for similar instruments, quoted prices in markets that are not active for identical or similar instruments, and model-derived valuations in which all significant inputs and significant value drivers are observable in active markets (such as interest rates, prepayment speeds, credit risk curves, default rates, and similar data)). |
| | | |
| | Level 3 – | Significant unobservable inputs (including the Fund’s own assumptions about what market participants would use to price the asset or liability based on the best available information) when observable inputs are unavailable. |
Following is a description of the valuation techniques applied to the Fund’s major categories of assets and liabilities measured at fair value on a recurring basis.
| HENNESSY FUNDS | 1-800-966-4354 | |
| | Equity Securities – Equity securities, including common stocks, preferred stocks, exchange-traded funds, closed-end mutual funds, partnerships, rights, and real estate investment trusts, that are traded on a securities exchange for which a last-quoted sales price is readily available will generally be valued at the last sales price as reported by the primary exchange on which the securities are listed. Securities listed on The NASDAQ Stock Market (“NASDAQ”) will generally be valued at the NASDAQ Official Closing Price, which may differ from the last sales price reported. Securities traded on a securities exchange for which a last-quoted sales price is not readily available will generally be valued at the mean between the bid and ask prices. To the extent these securities are actively traded and valuation adjustments are not applied, they are classified in Level 1 of the fair value hierarchy. |
| | |
| | Registered Investment Companies – Investments in registered investment companies (e.g., mutual funds) are generally priced at the ending NAV provided by the applicable registered investment company’s service agent and will be classified in Level 1 of the fair value hierarchy. |
| | |
| | Debt Securities – Debt securities, including corporate bonds, asset-backed securities, mortgage-backed securities, municipal bonds, U.S. Treasuries, and U.S. government agency issues, are generally valued at market on the basis of valuations furnished by an independent pricing service that utilizes both dealer-supplied valuations and formula-based techniques. The pricing service may consider recently executed transactions in securities of the issuer or comparable issuers, market price quotations (where observable), bond spreads, and fundamental data relating to the issuer. In addition, the model may incorporate observable market data, such as reported sales of similar securities, broker quotes, yields, bids, offers, and reference data. Certain securities are valued primarily using dealer quotations. These securities are generally classified in Level 2 of the fair value hierarchy. |
| | |
| | Short-Term Securities – Short-term equity investments, including money market funds, are valued in the manner specified above. Short-term debt investments with an original term to maturity of 60 days or less are valued at amortized cost, which approximates fair market value. If the original term to maturity of a short-term debt investment exceeded 60 days, then the values as of the 61st day prior to maturity are amortized. Amortized cost is not used if its use would be inappropriate due to credit or other impairments of the issuer, in which case the security’s fair value would be determined, as described below. Short-term securities are generally classified in Level 1 or Level 2 of the fair market hierarchy depending on the inputs used and market activity levels for specific securities. |
The Board of Trustees of the Fund (the “Board”) has adopted fair value pricing procedures that are followed when a price for a security is not readily available or if a significant event has occurred that indicates the closing price of a security no longer represents the true value of that security. Fair value pricing determinations are made in good faith in accordance with these procedures. There are numerous criteria that will be given consideration in determining a fair value of a security, such as the trading volume of a security and markets, the values of other similar securities, and news events with direct bearing on a security or markets. Fair value pricing results in an estimated price for a security that reflects the amount the Fund might reasonably expect to receive in a current sale. Depending on the relative significance of the valuation inputs, these securities may be classified in either Level 2 or Level 3 of the fair value hierarchy.
The Board has delegated day-to-day valuation matters to a Valuation Committee comprised of one or more representatives from Hennessy Advisors, Inc., the Fund’s investment advisor (the “Advisor”). The function of the Valuation Committee is to value
HENNESSYFUNDS.COM
| NOTES TO THE FINANCIAL STATEMENTS |
securities where current and reliable market quotations are not readily available. All actions taken by the Valuation Committee are reviewed by the Board.
The Fund has performed an analysis of all existing investments to determine the significance and character of all inputs to their fair value determinations. Various inputs are used to determine the value of the Fund’s investments. The inputs or methodology used for valuing securities are not necessarily an indication of the risk associated with investing in those securities. Details related to the fair valuation hierarchy of the Fund’s securities as of April 30, 2018, are included in the Schedule of Investments.
4). INVESTMENT TRANSACTIONS
Purchases and sales of investment securities (excluding government and short-term investments) for the Fund during the six months ended April 30, 2018, were $101,540,954 and $110,611,091, respectively.
There were no purchases or sales/maturities of long-term U.S. government securities for the Fund during the six months ended April 30, 2018.
The Fund is permitted to purchase or sell securities from or to another fund in the Hennessy Funds family of funds (the “Hennessy Funds”) under specified conditions outlined in procedures adopted by the Board. The procedures have been designed to ensure that any purchase or sale of securities by the Fund from or to another Hennessy Fund complies with Rule 17a-7 of the Investment Company Act of 1940, as amended. During the six months ended April 30, 2018, the Fund did not engage in purchases or sales of securities pursuant to Rule 17a-7 of the Investment Company Act of 1940, as amended.
5). INVESTMENT MANAGEMENT FEE AND OTHER TRANSACTIONS WITH AFFILIATES
The Advisor provides the Fund with investment management services under an Investment Advisory Agreement. The Advisor furnishes all investment advice, office space, and facilities, as well as most of the personnel needed by the Fund. As compensation for its services, the Advisor is entitled to a monthly fee from the Fund. The fee is based upon the average daily net assets of the Fund at an annual rate of 0.74%. The net investment advisory fees expensed by the Fund during the six months ended April 30, 2018, are included in the Statement of Operations.
The Advisor has contractually agreed to limit total annual operating expenses to 1.29% of the Fund’s net assets for Investor Class shares and 0.98% of the Fund’s net assets for Institutional Class shares (in each case, excluding all federal, state and local taxes, interest, brokerage commissions, acquired fund fees and expenses and other costs incurred in connection with the purchase and sale of securities, and extraordinary items) through November 30, 2019. In addition, in the past, the Advisor had contractually agreed to waive its fees and absorb expenses to the extent that total annual operating expenses exceeded 0.98% of the Fund’s net assets for Institutional Class shares of the Fund (excluding all federal, state and local taxes, interest, brokerage commissions, acquired fund fees and expenses and other costs incurred in connection with the purchase and sale of securities, and extraordinary items). The expense limitation agreement was terminated by the Board as of February 28, 2015.
For a period of three years after the year in which the Advisor waived or reimbursed expenses, the Advisor may seek reimbursement from the Fund to the extent that total annual fund operating expenses are less than the expense limitation that was in effect at the time the Advisor waived or reimbursed expenses. As of April 30, 2018, cumulative expenses subject to potential recovery under the aforementioned conditions were $238 for Institutional Class shares, which will expire on October 31, 2018.
| HENNESSY FUNDS | 1-800-966-4354 | |
The Board has approved a Shareholder Servicing Agreement for Investor Class shares of the Fund, which was instituted to compensate the Advisor for the non-investment management services it provides to the Fund. The Shareholder Servicing Agreement provides for a monthly fee paid to the Advisor at an annual rate of 0.10% of the average daily net assets of the Fund attributable to Investor Class shares. The shareholder service fees expensed by the Fund during the six months ended April 30, 2018, are included in the Statement of Operations.
The Fund has adopted a plan pursuant to Rule 12b-1 under the Investment Company Act of 1940, as amended, that authorizes payments in connection with the distribution of the Fund’s shares at an annual rate of up to 0.25% of the Fund’s average daily net assets attributable to Investor Class shares. Even though the authorized rate is up to 0.25%, the Fund is currently only using up to 0.15% of its average daily net assets attributable to Investor Class shares for such purpose. Amounts paid under the plan may be spent on any activities or expenses primarily intended to result in the sale of shares, including, but not limited to, advertising, shareholder account servicing, the printing and mailing of prospectuses to other than current shareholders, the printing and mailing of sales literature, and compensation for sales and marketing activities or to financial institutions and others, such as dealers and distributors. The distribution fees expensed by the Fund during the six months ended April 30, 2018, are included in the Statement of Operations.
The Fund has entered into agreements with various brokers, dealers, and financial intermediaries in connection with the sale of shares of the Fund. The agreements provide for periodic payments by the Fund to the brokers, dealers, and financial intermediaries for providing certain shareholder maintenance services (sub-transfer agent expenses). These shareholder services include the pre-processing and quality control of new accounts, shareholder correspondence, answering customer inquiries regarding account status, and facilitating shareholder telephone transactions. The sub-transfer agent fees expensed by the Fund during the six months ended April 30, 2018, are included in the Statement of Operations.
U.S. Bancorp Fund Services, LLC (“USBFS”) provides the Fund with administrative, fund accounting, and transfer agent services. As administrator, USBFS is responsible for activities such as (i) preparing various federal and state regulatory filings, reports, and returns for the Fund, (ii) preparing reports and materials to be supplied to the Board, (iii) monitoring the activities of the Fund’s custodian, transfer agent, and accountants, and (iv) coordinating the preparation and payment of the Fund’s expenses and reviewing the Fund’s expense accruals. U.S. Bank N.A., an affiliate of USBFS, serves as the Fund’s custodian. The servicing agreements between the Trust and USBFS and U.S. Bank N.A. contain a fee schedule that is inclusive of administrative, fund accounting, custody, and transfer agent fees. The administrative, fund accounting, custody, and transfer agent fees expensed by the Fund during the six months ended April 30, 2018, are included in the Statement of Operations.
Quasar Distributors, LLC acts as the Fund’s principal underwriter in a continuous public offering of the Fund’s shares. Quasar Distributors, LLC is an affiliate of USBFS and U.S. Bank N.A.
The officers of the Fund are affiliated with the Advisor. Such officers, with the exception of the Chief Compliance Officer and the Senior Compliance Officer, receive no compensation from the Fund for serving in their respective roles. The Fund, along with the other Hennessy Funds, makes reimbursement payments, on an equal basis, to the Advisor for a portion of the salary and benefits associated with the office of the Chief Compliance Officer and for all of the salary and benefits associated with the office of the
HENNESSYFUNDS.COM
| NOTES TO THE FINANCIAL STATEMENTS |
Senior Compliance Officer. The compliance fees expensed by the Fund during the six months ended April 30, 2018, are included in the Statement of Operations.
6). GUARANTEES AND INDEMNIFICATIONS
Under the Hennessy Funds’ organizational documents, their officers and trustees are indemnified by the Hennessy Funds against certain liabilities arising out of the performance of their duties to the Hennessy Funds. Additionally, in the normal course of business, the Hennessy Funds enter into contracts with service providers that contain general indemnification clauses. The Fund’s maximum exposure under these arrangements is unknown as this would involve future claims that may be made against the Fund that have not yet occurred. Currently, the Fund expects the risk of loss to be remote.
7). LINE OF CREDIT
The Fund has an uncommitted line of credit with the other Hennessy Funds in the amount of the lesser of (i) $100,000,000 or (ii) 33.33% of each Hennessy Fund’s net assets, or 30% for the Hennessy Gas Utility Fund and 10% for the Hennessy Balanced Fund, intended to provide short-term financing, if necessary, subject to certain restrictions, in connection with shareholder redemptions. The credit facility is with the Hennessy Funds’ custodian bank, U.S. Bank N.A. Borrowings under this arrangement bear interest at the bank’s prime rate and are secured by all of the Fund’s assets (as to its own borrowings only). During the six months ended April 30, 2018, the Fund did not have any borrowings outstanding under the line of credit.
8). FEDERAL TAX INFORMATION
As of October 31, 2017, the Fund’s most recent fiscal year end, the components of accumulated earnings (losses) for income tax purposes were as follows:
| | | | Investments | |
| | Cost of investments for tax purposes | | $ | 93,561,008 | |
| | Gross tax unrealized appreciation | | $ | 17,983,371 | |
| | Gross tax unrealized depreciation | | | (7,236,321 | ) |
| | Net tax unrealized appreciation | | $ | 10,747,050 | |
| | Undistributed ordinary income | | $ | 1,275,496 | |
| | Undistributed long-term capital gains | | | 5,299,525 | |
| | Total distributable earnings | | $ | 6,575,021 | |
| | Other accumulated gain | | $ | — | |
| | Total accumulated gain | | $ | 17,322,071 | |
As of October 31, 2017, the Fund’s most recent fiscal year end, the Fund had no tax basis capital losses to offset future capital gains.
During fiscal year 2017, the Fund’s most recent fiscal year, the capital losses utilized by the Fund were $4,683,932.
Capital losses sustained in fiscal year 2012 and in future taxable years will not expire and may be carried over by the Fund without limitation; however, they will retain the character of the original loss. Furthermore, any loss incurred during those taxable years will be required to be utilized prior to the losses incurred in taxable years prior to 2012. As a result of this ordering rule, pre-enactment capital loss carryforwards may be more likely to expire unused. Under pre-enactment law, capital losses could be carried forward for eight years, and carried forward as short-term capital losses, irrespective of the character of the original loss.
| HENNESSY FUNDS | 1-800-966-4354 | |
As of October 31, 2017, the Fund’s most recent fiscal year end, the Fund did not defer, on a tax basis, any late-year ordinary losses. Late-year ordinary losses are net ordinary losses incurred after December 31, 2016, but within the taxable year, that are deemed to arise on the first day of the Fund’s next taxable year.
During fiscal year 2018 (year to date) and fiscal year 2017, the tax character of distributions paid by the Fund was as follows:
| | | | Six Months Ended | | | Year Ended | |
| | | | April 30, 2018 | | | October 31, 2017 | |
| | Ordinary income(1) | | $ | 1,275,498 | | | $ | 1,258,527 | |
| | Long-term capital gain | | | 5,299,596 | | | | — | |
| | | | $ | 6,575,094 | | | $ | 1,258,527 | |
(1) Ordinary income includes short-term gain/loss.
9). AGREEMENT AND PLAN OF REORGANIZATION – THE RAINIER FUNDS
On November 16, 2017, shareholders of the Rainier Large Cap Equity Fund approved an Agreement and Plan of Reorganization between the Trust, on behalf of the Fund, and Rainier Investment Management Mutual Funds, a Delaware statutory trust, on behalf of the Rainier Large Cap Equity Fund. The Agreement and Plan of Reorganization provided for the transfer of all of the assets of the Rainier Large Cap Equity Fund to the Fund and the assumption of the liabilities (other than any excluded liabilities) of the Rainier Large Cap Equity Fund by the Fund. The Rainier Large Cap Equity Fund and the Fund have substantially similar investment objectives. The following tables illustrate the specifics of the reorganization of the Rainier Large Cap Equity Fund into the Fund:
| | Shares Issued | Hennessy | | |
| Rainier Large | to Shareholders | Large Growth | | |
| Cap Equity Fund | of Rainier Large | Fund | Combined | Tax Status |
Net Assets | Cap Equity Fund | Net Assets | Net Assets | of Transfer |
$52,613,762(1) | 4,230,342 | $109,172,141 | $161,785,904 | Non-taxable |
| | (1) | Includes accumulated realized losses and unrealized appreciation in the amounts of $9,744,716 and $17,759,649, respectively. |
Assuming the reorganization had been completed on November 1, 2017, the beginning of the annual reporting period of the Fund, the pro forma results of operation (unaudited) as of April 30, 2018, would have been as follows:
| | Net investment income | | $ | 571,910 | |
| | Net realized gain on investments | | $ | 30,216,630 | |
| | Net change in unrealized appreciation on investments | | $ | (23,007,476 | ) |
| | Net increase in net assets resulting from operations | | $ | 7,781,064 | |
Because the Fund has been managed as a single integrated portfolio since the reorganization was completed, it is not practicable to separate the amounts of revenue and earnings of the Rainier Large Cap Equity Fund that have been included in the Fund’s Statement of Operations since December 1, 2017, the date the reorganization was completed.
10). EVENTS SUBSEQUENT TO PERIOD END
Management has evaluated the Fund’s related events and transactions that occurred subsequent to April 30, 2018, through the date of issuance of the Fund’s financial statements. Management has determined that there were no subsequent events requiring recognition or disclosure in the financial statements.
HENNESSYFUNDS.COM
| NOTES TO THE FINANCIAL STATEMENTS/EXPENSE EXAMPLE |
Expense Example (Unaudited)
April 30, 2018
As a shareholder of the Fund, you incur two types of costs: (1) transaction costs, including sales charges (loads) on purchase payments, reinvested dividends, or other distributions; redemption fees; and exchange fees; and (2) ongoing costs, including management fees; service fees; and other Fund expenses. This Example is intended to help you understand your ongoing costs (in dollars) of investing in the Fund and to compare these costs with the ongoing costs of investing in other mutual funds. The Example is based on an investment of $1,000 invested at the beginning of the period and held for the entire period from November 1, 2017, through April 30, 2018.
Actual Expenses
The first line of the table below under the “Investor Class” and “Institutional Class” headings provides information about actual account values and actual expenses. Although the Fund charges no sales loads or transaction fees, you will be assessed fees for outgoing wire transfers, returned checks and stop payment orders at prevailing rates charged by U.S. Bancorp Fund Services, LLC, the Fund’s transfer agent. If you request that a redemption be made by wire transfer, currently a $15 fee is charged by the Fund’s transfer agent. IRA accounts will be charged a $15 annual maintenance fee. The example below includes, but is not limited to, management fees, shareholder servicing fees, fund accounting, custody, and transfer agent fees. However, the example below does not include portfolio trading commissions and related expenses, and other extraordinary expenses as determined under generally accepted accounting principles. You may use the information in this line, together with the amount you invested, to estimate the expenses that you paid over the period. Simply divide your account value by $1,000 (for example, an $8,600 account value divided by $1,000 = 8.6), then multiply the result by the number in the first line of the table under the “Investor Class” or “Institutional Class” headings in the column entitled “Expenses Paid During Period” to estimate the expenses you paid on your account during this period.
Hypothetical Example for Comparison Purposes
The second line of the table below under the “Investor Class” and “Institutional Class” headings provides information about hypothetical account values and hypothetical expenses based on the Fund’s actual expense ratios and an assumed rate of return of 5% per year before expenses, which is not the Fund’s actual return.] The hypothetical account values and expenses may not be used to estimate the actual ending account balance or expenses you paid for the period. You may use this information to compare the ongoing costs of investing in the Fund and other funds. To do so, compare this 5% hypothetical example with the 5% hypothetical examples that appear in the shareholder reports of the other funds. Please note that the expenses shown in the table are meant to highlight your ongoing costs only and do not reflect any transactional costs, such as sales charges (loads), or exchange fees. Therefore, the second line of the table under the “Investor Class” and “Institutional Class” headings is useful in comparing ongoing costs only, and will not help you determine the relative total costs of owning different funds. In addition, if these transactional costs were included, your costs would have been higher.
| HENNESSY FUNDS | 1-800-966-4354 | |
| | | | Expenses Paid |
| | Beginning | Ending | During Period(1) |
| | Account Value | Account Value | November 1, 2017 – |
| | November 1, 2017 | April 30, 2018 | April 30, 2018 |
| Investor Class | | | |
| Actual | $1,000.00 | $1,058.70 | $6.28 |
| Hypothetical (5% return before expenses) | $1,000.00 | $1,018.70 | $6.16 |
| | | | |
| Institutional Class | | | |
| Actual | $1,000.00 | $1,059.20 | $4.90 |
| Hypothetical (5% return before expenses) | $1,000.00 | $1,020.03 | $4.81 |
(1) | Expenses are equal to the Fund’s expense ratio of 1.23% for Investor Class shares or 0.96% for Institutional Class shares, as applicable, multiplied by the average account value over the period, multiplied by 181/365 days (to reflect one-half year period). |
HENNESSYFUNDS.COM
| EXPENSE EXAMPLE — IMPORTANT NOTICE REGARDING DELIVERY OF SHAREHOLDER DOCUMENTS |
How to Obtain a Copy of the Fund’s
Proxy Voting Policy and Proxy Voting Records
A description of the policies and procedures the Fund uses to determine how to vote proxies relating to portfolio securities is available without charge (1) by calling 1-800-966-4354, (2) on the Hennessy Funds’ website at hennessyfunds.com/proxy-voting/voting-policy, or (3) on the U.S. Securities and Exchange Commission’s (the “SEC”) website at www.sec.gov. The Fund’s proxy voting record is available without charge on both the Hennessy Funds’ website at hennessyfunds.com/proxy-voting/voting-record and the SEC’s website at www.sec.gov no later than August 31 for the prior 12 months ending June 30.
Quarterly Filings on Form N-Q
The Fund files a complete schedule of portfolio holdings with the SEC for the first and third quarters of each fiscal year on Form N-Q. The Fund’s Forms N-Q are available on the SEC’s website at www.sec.gov. The Fund’s Forms N-Q may be reviewed and copied at the SEC’s Public Reference Room in Washington, DC and information on the operation of the Public Reference Room may be obtained by calling 1-800-SEC-0330. Information included in the Fund’s Forms N-Q will also be available upon request by calling 1-800-966-4354.
Federal Tax Distribution Information
(Unaudited)
For fiscal year 2017, certain dividends paid by the Fund may be subject to a maximum tax rate of 23.8%, as provided for by the Jobs and Growth Tax Relief Reconciliation Act of 2003. The percentage of dividends declared from ordinary income designated as qualified dividend income was 100.0%.
For corporate shareholders, the percent of ordinary income distributions that qualified for the corporate dividends received deduction for fiscal year 2017, was 100.00%.
The percentage of taxable ordinary income distributions that were designated as short-term capital gain distributions under Section 871(k)(2)(C) of the Internal Revenue Code of 1986, as amended, for the Fund was 0.00%.
Important Notice Regarding Delivery of
Shareholder Documents
To help keep the Fund’s costs as low as possible, we generally deliver a single copy of shareholder reports, proxy statements, and prospectuses to shareholders who share an address and have the same last name. This process does not apply to account statements. You may request an individual copy of a shareholder document at any time. If you would like to receive separate mailings of shareholder documents, please call U.S. Bancorp Fund Services, LLC at 1-800-261-6950 or 1-414-765-4124, and individual delivery will begin within 30 days of your request. If your account is held through a financial institution or other intermediary, please contact such intermediary directly to request individual delivery.
| HENNESSY FUNDS | 1-800-966-4354 | |
Board Approval of Investment Advisory
Agreement
At its meeting on March 7, 2018, the Board of Trustees of the Fund (the “Board,” and the members thereof, the “Trustees”) unanimously approved the continuation of the investment advisory agreement of the Fund with Hennessy Advisors, Inc. (the “Advisor”). As part of the process of approving the continuation of the advisory agreement, the Trustees reviewed their fiduciary duties with respect to approving the advisory agreement and the relevant factors for them to consider. In addition, the Trustees who are not deemed “interested persons” (as defined by the Investment Company Act of 1940, as amended) of the Fund (the “Independent Trustees”) met in executive session to discuss the approval of the advisory agreement.
In advance of the meeting, the Advisor sent detailed information to the Trustees to assist them in their evaluation of the advisory agreement. This information included, but was not limited to, the following:
| | (1) | A memorandum from outside legal counsel that described the fiduciary duties of the Board with respect to approving the continuation of the advisory agreement and the relevant factors for consideration; |
| | | |
| | (2) | A memorandum from the Advisor that listed the factors relevant to the Board’s approval of the continuation of the advisory agreement and also referenced the documents that had been provided to help the Board assess each such factor; |
| | | |
| | (3) | An inventory of the range of services provided by the Advisor to the Fund; |
| | | |
| | (4) | A written discussion of economies of scale; |
| | | |
| | (5) | The advisory agreement; |
| | | |
| | (6) | A recent Fund fact sheet, which included, among other things, performance information over various periods; |
| | | |
| | (7) | A peer expense comparison of both the net expense ratio and investment advisory fee of the Fund; |
| | | |
| | (8) | The Advisor’s most recent Form 10-K and Form 10-Q, which includes information about the Advisor’s profitability; |
| | | |
| | (9) | Information about brokerage commissions; |
| | | |
| | (10) | Information about the Fund’s compliance program; and |
| | | |
| | (11) | The Advisor’s current Form ADV Part I. |
All of the factors discussed were considered as a whole by the Trustees, and also by the Independent Trustees meeting in executive session. The factors were viewed in their totality by the Trustees, with no single factor being the principal or determinative factor in the Trustees’ determination of whether to approve the continuation of the advisory agreement. The Trustees recognized that the management and fee arrangements for the Fund are the result of years of review and discussion between the Independent Trustees and the Advisor, that certain aspects of such arrangements may receive greater scrutiny in some years than in others, and that the Trustees’ conclusions may be based, in part, on their consideration of these same arrangements and information received during the course of the year and in prior years.
HENNESSYFUNDS.COM
| BOARD APPROVAL OF INVESTMENT ADVISORY AGREEMENT |
Prior to approving the continuation of the advisory agreement, the Trustees, including the Independent Trustees in executive session, considered, among other items:
| | (1) | The nature and quality of the advisory services provided by the Advisor; |
| | | |
| | (2) | A comparison of the fees and expenses of the Fund to other similar funds; |
| | | |
| | (3) | Whether economies of scale are recognized by the Fund; |
| | | |
| | (4) | The costs and profitability of the Fund to the Advisor; |
| | | |
| | (5) | The performance of the Fund; and |
| | | |
| | (6) | Any benefits to the Advisor from serving as an investment advisor to the Fund (other than the advisory fee). |
The material considerations and determinations of the Trustees, including the Independent Trustees, were as follows:
| | (1) | The Trustees considered the services identified below that are provided by the Advisor. Based on this review, the Trustees concluded that the Advisor provides high-quality services to the Fund, and they noted that their overall confidence in the Advisor is high. The Trustees also concluded that they were satisfied with the nature, extent, and quality of the advisory services provided to the Fund by the Advisor, and that the nature and extent of the services provided by the Advisor are appropriate to assure that the Fund’s operations are conducted in compliance with applicable laws, rules, and regulations. |
| | | (a) | The Advisor acts as the portfolio manager for the Fund. In this capacity, the Advisor does the following: |
| | | | (i) | manages the composition of the Fund’s portfolio, including the purchase, retention, and disposition of portfolio securities in accordance with the Fund’s investment objectives, policies, and restrictions; |
| | | | | |
| | | | (ii) | ensures compliance with “best execution” for the Fund’s portfolio; |
| | | | | |
| | | | (iii) | manages the use of soft dollars for the Fund; and |
| | | | | |
| | | | (iv) | manages proxy voting for the Fund. |
| | | (b) | The Advisor performs a daily reconciliation of portfolio positions and cash for the Fund. |
| | | | |
| | | (c) | The Advisor monitors the Fund’s compliance with its investment objectives and restrictions. |
| | | | |
| | | (d) | The Advisor monitors compliance with federal securities laws and performs activities such as maintaining a compliance program, conducting ongoing reviews of the compliance programs of the Fund’s service providers, conducting on-site visits to the Fund’s service providers, monitoring incidents of abusive trading practices, reviewing Fund expense accruals, payments, and fixed expense ratios, evaluating insurance providers for fidelity bond coverage and D&O/E&O insurance coverage, conducting employee compliance training, reviewing reports provided by service providers, maintaining books and records, and preparing an annual compliance report for the Board. |
| | | | |
| | | (e) | The Advisor oversees service providers that provide accounting, administration, distribution, transfer agency, custodial, sales, marketing, public relations, audit, information technology, and legal services to the Fund. |
| HENNESSY FUNDS | 1-800-966-4354 | |
| | | (f) | The Advisor maintains in-house marketing and distribution departments on behalf of the Fund. |
| | | | |
| | | (g) | The Advisor is actively involved with preparing regulatory filings for the Fund, including writing and annually updating the Fund’s prospectus and related documents. |
| | | | |
| | | (h) | The Advisor prepares a written summary of the Fund’s performance for the most recent 12-month period for each annual report of the Fund. |
| | | | |
| | | (i) | The Advisor oversees distribution of the Fund through third-party broker/dealers and independent financial institutions such as Charles Schwab, Inc., Fidelity, TD Waterhouse, and Pershing. The Advisor participates in “no transaction fee” (“NTF”) programs with these companies on behalf of the Fund, which allow customers to purchase the Fund through third-party distribution channels without paying a transaction fee. The Advisor compensates, in part, a number of these third-party providers of NTF programs out of its own revenues. |
| | | | |
| | | (j) | The Advisor pays the incentive compensation of the Fund’s compliance officers and employs other staff, such as legal, marketing, national accounts, distribution, sales, administrative, and trading oversight personnel, as well as management executives. |
| | | | |
| | | (k) | The Advisor provides a quarterly compliance certification to the Board. |
| | | | |
| | | (l) | The Advisor prepares or reviews Board materials, frequently presents to the Board or leads Board discussions, prepares or reviews meeting minutes, and arranges for Board training and education. |
| | (2) | The Trustees compared the performance of the Fund to benchmark indices over various time periods and also noted that the Trustees review and discuss reports comparing the investment performance of the Fund to various indices at each quarterly Board meeting. Based on all such information, the Trustees believe that the Advisor manages the Fund in a manner that is materially consistent with its stated investment objective and style. The Trustees concluded that the performance of the Fund over various time periods warranted the continuation of the advisory agreement. |
| | | |
| | (3) | The Trustees reviewed the advisory fees and overall expense ratios of the Fund compared to other funds similar in asset size and investment objective to the Fund using data from Morningstar. As part of the discussion with management, the Trustees ensured that they understood and were comfortable with the criteria used to determine the mutual funds included in the Morningstar categories for purposes of the materials considered at the meeting. The Trustees determined that the advisory fee and overall expense ratio of the Fund falls within the range of the advisory fees and overall expense ratios of other comparable funds and concluded that they are reasonable and warranted continuation of the advisory agreement. |
| | | |
| | (4) | The Trustees also considered whether economies of scale were being realized by the Advisor that should be shared with the Fund’s shareholders. The Trustees noted that many of the expenses incurred to manage the Fund are asset-based fees and thus do not result in material economies of scale being realized as the assets of the Fund increase. For example, mutual fund platform fees increase as the Fund’s assets grow. The Trustees also considered the Advisor’s efforts to |
HENNESSYFUNDS.COM
| BOARD APPROVAL OF INVESTMENT ADVISORY AGREEMENT |
| | | contain expenses, the Advisor’s significant marketing efforts to promote the Funds, and the Advisor’s agreement to waive fees or lower its management fees in certain circumstances. The Trustees noted that at current asset levels it did not appear that there were economies of scale being realized by the Advisor and concluded that it would continue to monitor economies of scale in the future as circumstances changed. |
| | | |
| | (5) | The Trustees considered the profitability of the Advisor, including the impact of mutual fund platform fees on the Advisor’s profitability, and also considered the resources and revenues that the Advisor has put into managing and distributing the Fund. The Trustees then concluded that the profits of the Advisor are reasonable and not excessive when compared to profitability guidelines set forth in relevant court cases. |
| | | |
| | (6) | The Trustees considered the high level of professionalism and knowledge of the Advisor’s employees, along with a very low level of turnover, and concluded that this was beneficial to the Fund and its shareholders. |
| | | |
| | (7) | The Trustees considered any benefits to the Advisor from serving as an advisor to the Fund (other than the advisory fee). The Trustees noted that the Advisor may derive ancillary benefits from, by way of example, its association with the Fund in the form of proprietary and third-party research products and services received from broker-dealers that execute portfolio trades for the Fund. The Trustees determined that any such products and services have been used for legitimate purposes relating to the Fund by providing assistance in the investment decision-making process. The Trustees concluded that any additional benefits realized by the Advisor its relationship with the Fund were reasonable. |
After reviewing the materials provided at the meeting and management’s presentation, as well as other information regularly provided at the Board’s quarterly meetings throughout the year regarding the quality of services provided by the Advisor, the performance of the Fund, expense information, regulatory compliance issues, trading information and related matters, and other factors that the Trustees deemed relevant, the Trustees, including the Independent Trustees, approved the continuation of the advisory agreement.
| HENNESSY FUNDS | 1-800-966-4354 | |
For information, questions or assistance, please call
The Hennessy Funds
1-800-966-4354 or 1-415-899-1555
INVESTMENT ADVISOR
Hennessy Advisors, Inc.
7250 Redwood Boulevard, Suite 200
Novato, California 94945
ADMINISTRATOR,
TRANSFER AGENT,
DIVIDEND PAYING AGENT &
SHAREHOLDER SERVICING AGENT
U.S. Bancorp Fund Services, LLC
P.O. Box 701
Milwaukee, Wisconsin 53201-0701
CUSTODIAN
U.S. Bank N.A.
Custody Operations
1555 North River Center Drive, Suite 302
Milwaukee, Wisconsin 53212
TRUSTEES
Neil J. Hennessy
Robert T. Doyle
J. Dennis DeSousa
Gerald P. Richardson
COUNSEL
Foley & Lardner LLP
777 East Wisconsin Avenue
Milwaukee, Wisconsin 53202-5306
INDEPENDENT REGISTERED
PUBLIC ACCOUNTING FIRM
Tait, Weller & Baker LLP
1818 Market Street, Suite 2400
Philadelphia, Pennsylvania 19103
DISTRIBUTOR
Quasar Distributors, LLC
777 East Wisconsin Avenue
Milwaukee, Wisconsin 53202
hennessyfunds.com | 1-800-966-4354
This report has been prepared for shareholders and may be distributed to
others only if preceded or accompanied by a current prospectus.
SEMI-ANNUAL REPORT
APRIL 30, 2018
HENNESSY CORNERSTONE
VALUE FUND
Investor Class HFCVX
Institutional Class HICVX
hennessyfunds.com | 1-800-966-4354
(This Page Intentionally Left Blank.)
Contents
| Letter to Shareholders | 2 |
| Performance Overview | 4 |
| Financial Statements | |
| Schedule of Investments | 5 |
| Statement of Assets and Liabilities | 9 |
| Statement of Operations | 10 |
| Statements of Changes in Net Assets | 12 |
| Financial Highlights | 14 |
| Notes to the Financial Statements | 18 |
| Expense Example | 26 |
| Proxy Voting Policy and Proxy Voting Records | 28 |
| Quarterly Schedule of Investments | 28 |
| Federal Tax Distribution Information | 28 |
| Important Notice Regarding Delivery of Shareholder Documents | 28 |
| Board Approval of Investment Advisory Agreement | 29 |
| HENNESSY FUNDS | 1-800-966-4354 | |
May 2018
Dear Hennessy Funds Shareholder:
Investors in the United States and abroad experienced the return of volatility in the six months ended April 30, 2018, especially during the second half of the period. Equities rallied sharply during the first half of the period and fell back during the second half, but nevertheless ended the period with solid gains, with the Dow Jones Industrial Average posting a total return of 4.5% and the S&P 500 Index up 3.8%. Over the past year, I have repeatedly shared my belief that the stock market was due for a correction, but that it would bounce back, as it has so many times during the current bull market.
In the closing months of 2017 and into January 2018, U.S. equities rallied in response to the enactment of the Tax Cuts and Jobs Act of 2017, which significantly lowered corporate tax rates. Investors were also encouraged by two quarters of real GDP growth of 3.2% and 2.9%. However, equity prices quickly lost ground in reaction to the imposition of trade tariffs on steel and aluminum, and fears that additional proposed tariffs could provoke a trade war with China. Signals from the Federal Reserve that the pace of interest rate increases would move slightly higher also weighed on investors. During the period, the federal funds rate was raised twice, by a quarter point each time, in December 2017 and March 2018.
The current bull market in U.S. equities is now entering its 10th year, and we remain optimistic about the outlook for stock prices. In our opinion, economic fundamentals look positive. The U.S. economy is growing at a solid pace of 2 – 3% annually, inflation is low, and high employment levels are supporting healthy growth in consumption. Wages are rising, but the rate of increase has remained steady at around 2.6% per year since mid-2016. While it appears that the Federal Reserve will continue to raise the federal funds rate and normalize monetary policy, we believe it will be able to do so gradually, avoiding a severe jolt to either financial markets or the economy. Meanwhile, companies continue to report robust earnings growth, boosted this year by lower tax rates.
We believe U.S. equities remain attractively valued. U.S. long bond yields are hovering near 3%, having risen over the period in response to strong economic activity. Prospective PE multiples, however, have dropped significantly since the end of 2017, the result of a combination of lower taxes, higher operating earnings, and lower stock prices. The Dow Jones Industrial Average and the S&P 500 Index are trading at about 17x forward earnings, down from approximately 20x at the beginning of the calendar year, valuations we believe to be very reasonable.
We are not overly concerned about recent protectionist actions by the U.S. administration. We consider the announcements and ongoing discussions regarding import tariffs and NAFTA to be representative of standard Trump deal-making tactics – make far-reaching demands and then negotiate a reasonable outcome that is beneficial to both sides. We expect continued pro-business policies and regulatory relief to be enacted by our leaders in Washington.
Finally, as noted many times in past letters during this bull market, the euphoria that has historically accompanied a peak in the market continues to be absent. Investors today are worried about many things, including higher interest rates, larger budget deficits, higher import tariffs, and political distractions. But they are definitely not euphoric. In the past, I have likened the current bull market to the 1982-2000 bull market, and I continue
HENNESSYFUNDS.COM
to believe the comparison is a good one. We remain confident that the market will be able to weather the current period of volatility and that the economy, despite higher interest rates and possible trade disruptions, is resilient enough to continue its steady growth into the coming year.
Thank you for your continued confidence and investment in the Hennessy Funds. If you have any questions or would like to speak with us directly, please don’t hesitate to call us at (800) 966-4354.
Best regards,
Neil J. Hennessy
President and Chief Investment Officer
Past performance does not guarantee future results.
Mutual fund investing involves risk. Principal loss is possible.
Opinions expressed are those of Neil Hennessy and are subject to change, are not guaranteed, and should not be considered investment advice.
The Dow Jones Industrial Average and S&P 500 Index are unmanaged indices commonly used to measure the performance of U.S. stocks. One cannot invest directly in an index.
Price to earnings (PE) is calculated by dividing a company’s market price per share by its earnings per share. Earnings growth is not a measure of a fund’s future performance.
| HENNESSY FUNDS | 1-800-966-4354 | |
Performance Overview (Unaudited)
AVERAGE ANNUAL TOTAL RETURN FOR PERIODS ENDED APRIL 30, 2018
| | Six | One | Five | Ten |
| | Months(1) | Year | Years | Years |
| Hennessy Cornerstone Value Fund – | | | | |
| Investor Class (HFCVX) | 4.45% | 13.65% | 9.60% | 7.72% |
| Hennessy Cornerstone Value Fund – | | | | |
| Institutional Class (HICVX) | 4.53% | 13.90% | 9.80% | 7.99% |
Russell 1000® Value Index | 1.94% | 7.50% | 10.52% | 7.30% |
| S&P 500 Index | 3.82% | 13.27% | 12.96% | 9.02% |
Expense ratios: 1.23% (Investor Class); 0.98% (Institutional Class)
(1) | Periods less than one year are not annualized. |
___________________
Performance data quoted represents past performance; past performance does not guarantee future results. The investment return and principal value of an investment will fluctuate so that an investor’s shares, when redeemed, may be worth more or less than their original cost. The performance table does not reflect the deduction of taxes that a shareholder would pay on Fund distributions or the redemption of Fund shares. Current performance of the Fund may be lower or higher than the performance quoted. Performance data current to the most recent month end may be obtained by visiting hennessyfunds.com.
The Russell 1000® Value Index is an unmanaged index commonly used to measure the performance of U.S. large-capitalization value stocks. The S&P 500 Index is an unmanaged index commonly used to measure the performance of U.S. stocks. One cannot invest directly in an index.
Frank Russell Company (“Russell”) is the source and owner of the trademarks, service marks, and copyrights related to the Russell Indexes. Russell® is a trademark of Frank Russell Company. Neither Russell nor its licensors accept any liability for any errors or omissions in the Russell Indexes or Russell ratings or underlying data and no party may rely on any Russell Indexes or Russell ratings or underlying data contained in this communication. No further distribution of Russell data is permitted without Russell’s express written consent. Russell does not promote, sponsor, or endorse the content of this communication.
The expense ratios presented are from the most recent prospectus. The expense ratios for the current reporting period are available in the Financial Highlights section of this report.
| PERFORMANCE OVERVIEW/SCHEDULE OF INVESTMENTS |
Financial Statements
Schedule of Investments as of April 30, 2018 (Unaudited) |
HENNESSY CORNERSTONE VALUE FUND
(% of Net Assets)
| TOP TEN HOLDINGS (EXCLUDING CASH/CASH EQUIVALENTS) | % NET ASSETS |
| Statoil ASA – ADR | 2.23% |
| Phillips 66 | 2.22% |
| Marathon Petroleum Corp. | 2.21% |
| Total S.A. – ADR | 2.20% |
| Intel Corp. | 2.19% |
| GlaxoSmithKline PLC – ADR | 2.19% |
| Cisco Systems, Inc. | 2.18% |
| Canadian Natural Resources Ltd. | 2.16% |
| Suncor Energy, Inc. | 2.16% |
| BP PLC – ADR | 2.13% |
Note: For presentation purposes, the Fund has grouped some of the industry categories. For purposes of categorizing securities for compliance with Section 8(b)(1) of the Investment Company Act of 1940, as amended, the Fund uses more specific industry classifications.
The Global Industry Classification Standard (GICS®) was developed by and is the exclusive property and a service mark of MSCI, Inc. and Standard & Poor Financial Services LLC. It has been licensed for use by the Hennessy Funds.
| HENNESSY FUNDS | 1-800-966-4354 | |
| COMMON STOCKS – 95.82% | | Number | | | | | | % of | |
| | | of Shares | | | Value | | | Net Assets | |
| Consumer Discretionary – 9.57% | | | | | | | | | |
| Carnival Corp. (a) | | | 81,300 | | | $ | 5,126,778 | | | | 1.80 | % |
| Ford Motor Co. | | | 530,645 | | | | 5,964,450 | | | | 2.10 | % |
| General Motors Co. | | | 137,300 | | | | 5,044,402 | | | | 1.77 | % |
| Las Vegas Sands Corp. | | | 75,100 | | | | 5,507,083 | | | | 1.93 | % |
| Target Corp. | | | 77,400 | | | | 5,619,240 | | | | 1.97 | % |
| | | | | | | | 27,261,953 | | | | 9.57 | % |
| | | | | | | | | | | | | |
| Consumer Staples – 15.32% | | | | | | | | | | | | |
| Altria Group, Inc. | | | 82,800 | | | | 4,645,908 | | | | 1.63 | % |
| CVS Health Corp. | | | 74,000 | | | | 5,167,420 | | | | 1.81 | % |
| General Mills, Inc. | | | 99,500 | | | | 4,352,130 | | | | 1.53 | % |
| PepsiCo, Inc. | | | 48,400 | | | | 4,885,496 | | | | 1.72 | % |
| Philip Morris International, Inc. | | | 54,300 | | | | 4,452,600 | | | | 1.56 | % |
| The Coca-Cola Co. | | | 122,300 | | | | 5,284,583 | | | | 1.86 | % |
| The Kraft Heinz Co. | | | 74,300 | | | | 4,189,034 | | | | 1.47 | % |
| The Procter & Gamble Co. | | | 67,400 | | | | 4,875,716 | | | | 1.71 | % |
| Unilever PLC – ADR (a) | | | 103,100 | | | | 5,770,507 | | | | 2.03 | % |
| | | | | | | | 43,623,394 | | | | 15.32 | % |
| | | | | | | | | | | | | |
| Energy – 25.24% | | | | | | | | | | | | |
| BP PLC – ADR (a) | | | 136,000 | | | | 6,064,240 | | | | 2.13 | % |
| Canadian Natural Resources Ltd. (a) | | | 170,500 | | | | 6,151,640 | | | | 2.16 | % |
| Chevron Corp. | | | 46,475 | | | | 5,814,487 | | | | 2.04 | % |
| Exxon Mobil Corp. | | | 66,710 | | | | 5,186,702 | | | | 1.82 | % |
| Marathon Petroleum Corp. | | | 84,000 | | | | 6,292,440 | | | | 2.21 | % |
| Occidental Petroleum Corp. | | | 77,660 | | | | 6,000,012 | | | | 2.11 | % |
| Phillips 66 | | | 56,800 | | | | 6,322,408 | | | | 2.22 | % |
| Royal Dutch Shell PLC – ADR (a) | | | 80,900 | | | | 5,858,778 | | | | 2.06 | % |
| Schlumberger Ltd. (a) | | | 79,100 | | | | 5,423,096 | | | | 1.90 | % |
| Statoil ASA – ADR (a) | | | 248,300 | | | | 6,356,480 | | | | 2.23 | % |
| Suncor Energy, Inc. (a) | | | 160,600 | | | | 6,139,738 | | | | 2.16 | % |
| Total S.A. – ADR (a) | | | 100,300 | | | | 6,279,783 | | | | 2.20 | % |
| | | | | | | | 71,889,804 | | | | 25.24 | % |
| | | | | | | | | | | | | |
| Financials – 11.21% | | | | | | | | | | | | |
| Bank of Nova Scotia (a) | | | 87,500 | | | | 5,377,750 | | | | 1.89 | % |
| HSBC Holdings PLC – ADR (a) | | | 108,000 | | | | 5,428,080 | | | | 1.90 | % |
| Manulife Financial Corp. (a) | | | 274,200 | | | | 5,174,154 | | | | 1.82 | % |
The accompanying notes are an integral part of these financial statements.
HENNESSYFUNDS.COM
| COMMON STOCKS | | Number | | | | | | % of | |
| | | of Shares | | | Value | | | Net Assets | |
| Financials (Continued) | | | | | | | | | |
| Royal Bank of Canada (a) | | | 67,900 | | | $ | 5,163,795 | | | | 1.81 | % |
| Thomson Reuters Corp. (a) | | | 134,400 | | | | 5,405,568 | | | | 1.90 | % |
| Toronto-Dominion Bank (a) | | | 95,700 | | | | 5,373,555 | | | | 1.89 | % |
| | | | | | | | 31,922,902 | | | | 11.21 | % |
| | | | | | | | | | | | | |
| Health Care – 15.52% | | | | | | | | | | | | |
| Amgen, Inc. | | | 31,300 | | | | 5,461,224 | | | | 1.92 | % |
| Bristol-Myers Squibb Co. | | | 93,000 | | | | 4,848,090 | | | | 1.70 | % |
| Eli Lilly and Co. | | | 71,500 | | | | 5,796,505 | | | | 2.03 | % |
| Gilead Sciences, Inc. | | | 69,500 | | | | 5,019,985 | | | | 1.76 | % |
| GlaxoSmithKline PLC – ADR (a) | | | 155,200 | | | | 6,225,072 | | | | 2.19 | % |
| Johnson & Johnson | | | 42,100 | | | | 5,325,229 | | | | 1.87 | % |
| Merck & Co., Inc. | | | 98,200 | | | | 5,781,034 | | | | 2.03 | % |
| Pfizer, Inc. | | | 157,200 | | | | 5,755,092 | | | | 2.02 | % |
| | | | | | | | 44,212,231 | | | | 15.52 | % |
| | | | | | | | | | | | | |
| Industrials – 7.25% | | | | | | | | | | | | |
| Emerson Electric Co. | | | 80,600 | | | | 5,352,646 | | | | 1.88 | % |
| General Electric Co. | | | 360,034 | | | | 5,065,678 | | | | 1.78 | % |
| Johnson Controls International PLC (a) | | | 148,800 | | | | 5,039,856 | | | | 1.77 | % |
| United Parcel Service, Inc., Class B | | | 45,700 | | | | 5,186,950 | | | | 1.82 | % |
| | | | | | | | 20,645,130 | | | | 7.25 | % |
| | | | | | | | | | | | | |
| Information Technology – 8.06% | | | | | | | | | | | | |
| Cisco Systems, Inc. | | | 140,110 | | | | 6,205,472 | | | | 2.18 | % |
| HP, Inc. | | | 249,600 | | | | 5,363,904 | | | | 1.88 | % |
| Intel Corp. | | | 120,900 | | | | 6,240,858 | | | | 2.19 | % |
| International Business Machines Corp. | | | 35,600 | | | | 5,160,576 | | | | 1.81 | % |
| | | | | | | | 22,970,810 | | | | 8.06 | % |
| | | | | | | | | | | | | |
| Telecommunication Services – 3.65% | | | | | | | | | | | | |
| AT&T, Inc. | | | 155,460 | | | | 5,083,542 | | | | 1.78 | % |
| Verizon Communications, Inc. | | | 107,700 | | | | 5,314,995 | | | | 1.87 | % |
| | | | | | | | 10,398,537 | | | | 3.65 | % |
| Total Common Stocks | | | | | | | | | | | | |
| (Cost $258,388,700) | | | | | | | 272,924,761 | | | | 95.82 | % |
The accompanying notes are an integral part of these financial statements.
| HENNESSY FUNDS | 1-800-966-4354 | |
| SHORT-TERM INVESTMENTS – 4.29% | | Number | | | | | | % of | |
| | | of Shares | | | Value | | | Net Assets | |
| Money Market Funds – 4.29% | | | | | | | | | |
| Fidelity Government Portfolio, Institutional Class, 1.58% (b) | | | 12,227,542 | | | $ | 12,227,542 | | | | 4.29 | % |
| | | | | | | | | | | | | |
| Total Short-Term Investments | | | | | | | | | | | | |
| (Cost $12,227,542) | | | | | | | 12,227,542 | | | | 4.29 | % |
| | | | | | | | | | | | | |
| Total Investments | | | | | | | | | | | | |
| (Cost $270,616,242) – 100.11% | | | | | | | 285,152,303 | | | | 100.11 | % |
| Liabilities in Excess of Other Assets – (0.11)% | | | | | | | (324,071 | ) | | | (0.11 | )% |
| | | | | | | | | | | | | |
TOTAL NET ASSETS – 100.00% | | | | | | $ | 284,828,232 | | | | 100.00 | % |
Percentages are stated as a percent of net assets.
ADR – American Depositary Receipt
PLC – Public Limited Company
| (a) | U.S. traded security of a foreign corporation. |
| (b) | The rate listed is the fund’s seven-day yield as of April 30, 2018. |
Summary of Fair Value Exposure at April 30, 2018
The following is a summary of the inputs used to value the Fund’s net assets as of April 30, 2018 (See Note 3 in the accompanying notes to the financial statements):
| Common Stocks | | Level 1 | | | Level 2 | | | Level 3 | | | Total | |
| Consumer Discretionary | | $ | 27,261,953 | | | $ | — | | | $ | — | | | $ | 27,261,953 | |
| Consumer Staples | | | 43,623,394 | | | | — | | | | — | | | | 43,623,394 | |
| Energy | | | 71,889,804 | | | | — | | | | — | | | | 71,889,804 | |
| Financials | | | 31,922,902 | | | | — | | | | — | | | | 31,922,902 | |
| Health Care | | | 44,212,231 | | | | — | | | | — | | | | 44,212,231 | |
| Industrials | | | 20,645,130 | | | | — | | | | — | | | | 20,645,130 | |
| Information Technology | | | 22,970,810 | | | | — | | | | — | | | | 22,970,810 | |
| Telecommunication Services | | | 10,398,537 | | | | — | | | | — | | | | 10,398,537 | |
| Total Common Stocks | | $ | 272,924,761 | | | $ | — | | | $ | — | | | $ | 272,924,761 | |
| Short-Term Investments | | | | | | | | | | | | | | | | |
| Money Market Funds | | $ | 12,227,542 | | | $ | — | | | $ | — | | | $ | 12,227,542 | |
| Total Short-Term Investments | | $ | 12,227,542 | | | $ | — | | | $ | — | | | $ | 12,227,542 | |
| Total Investments | | $ | 285,152,303 | | | $ | — | | | $ | — | | | $ | 285,152,303 | |
Transfers between levels are recognized at the end of the reporting period. During the six-month period ended April 30, 2018, the Fund recognized no transfers between levels.
The accompanying notes are an integral part of these financial statements.
HENNESSYFUNDS.COM
| SCHEDULE OF INVESTMENTS/STATEMENT OF ASSETS AND LIABILITIES |
Financial Statements
Statement of Assets and Liabilities as of April 30, 2018 (Unaudited) |
| ASSETS: | | | |
| Investments in securities, at value (cost $270,616,242) | | $ | 285,152,303 | |
| Dividends and interest receivable | | | 509,180 | |
| Receivable for fund shares sold | | | 3,658 | |
| Prepaid expenses and other assets | | | 24,105 | |
| Total Assets | | | 285,689,246 | |
| | | | | |
| LIABILITIES: | | | | |
| Payable for fund shares redeemed | | | 44,317 | |
| Payable to advisor | | | 173,384 | |
| Payable to administrator | | | 44,893 | |
| Payable to auditor | | | 9,731 | |
| Accrued distribution fees | | | 520,914 | |
| Accrued service fees | | | 22,855 | |
| Accrued trustees fees | | | 4,665 | |
| Accrued expenses and other payables | | | 40,255 | |
| Total Liabilities | | | 861,014 | |
| NET ASSETS | | $ | 284,828,232 | |
| | | | | |
| NET ASSETS CONSIST OF: | | | | |
| Capital stock | | $ | 235,242,800 | |
| Accumulated net investment income | | | 1,901,446 | |
| Accumulated net realized gain on investments | | | 33,147,751 | |
| Unrealized net appreciation on investments | | | 14,536,235 | |
| Total Net Assets | | $ | 284,828,232 | |
| | | | | |
| NET ASSETS | | | | |
| Investor Class: | | | | |
| Shares authorized (no par value) | | Unlimited | |
| Net assets applicable to outstanding Investor Class shares | | $ | 277,834,952 | |
| Shares issued and outstanding | | | 14,293,228 | |
| Net asset value, offering price and redemption price per share | | $ | 19.44 | |
| | | | | |
| Institutional Class: | | | | |
| Shares authorized (no par value) | | Unlimited | |
| Net assets applicable to outstanding Institutional Class shares | | $ | 6,993,280 | |
| Shares issued and outstanding | | | 359,465 | |
| Net asset value, offering price and redemption price per share | | $ | 19.45 | |
The accompanying notes are an integral part of these financial statements.
| HENNESSY FUNDS | 1-800-966-4354 | |
Financial Statements
Statement of Operations for the six months ended April 30, 2018 (Unaudited) |
| INVESTMENT INCOME: | | | |
Dividend income(1) | | $ | 4,764,577 | |
| Interest income | | | 67,266 | |
| Total investment income | | | 4,831,843 | |
| | | | | |
| EXPENSES: | | | | |
| Investment advisory fees (See Note 5) | | | 1,071,679 | |
| Distribution fees – Investor Class (See Note 5) | | | 211,792 | |
| Service fees – Investor Class (See Note 5) | | | 141,195 | |
| Administration, fund accounting, custody and transfer agent fees (See Note 5) | | | 136,180 | |
| Sub-transfer agent expenses – Investor Class (See Note 5) | | | 98,836 | |
| Sub-transfer agent expenses – Institutional Class (See Note 5) | | | 3,540 | |
| Federal and state registration fees | | | 17,407 | |
| Compliance expense (See Note 5) | | | 14,628 | |
| Reports to shareholders | | | 12,534 | |
| Audit fees | | | 10,965 | |
| Trustees’ fees and expenses | | | 9,442 | |
| Legal fees | | | 1,864 | |
| Other expenses | | | 10,103 | |
| Total expenses | | | 1,740,165 | |
| NET INVESTMENT INCOME | | $ | 3,091,678 | |
| | | | | |
| REALIZED AND UNREALIZED GAINS (LOSSES): | | | | |
| Net realized gain on investments | | $ | 33,550,028 | |
| Net change in unrealized appreciation on investments | | | (23,881,548 | ) |
| Net gain on investments | | | 9,668,480 | |
| NET INCREASE IN NET ASSETS RESULTING FROM OPERATIONS | | $ | 12,760,158 | |
(1) | Net of foreign taxes withheld and issuance fees of $183,992. |
The accompanying notes are an integral part of these financial statements.
HENNESSYFUNDS.COM
(This Page Intentionally Left Blank.)
| HENNESSY FUNDS | 1-800-966-4354 | |
Financial Statements
| Statements of Changes in Net Assets |
| | | Six Months Ended | | | | |
| | | April 30, 2018 | | | Year Ended | |
| | | (Unaudited) | | | October 31, 2017 | |
| OPERATIONS: | | | | | | |
| Net investment income | | $ | 3,091,678 | | | $ | 5,498,468 | |
| Net realized gain on investments | | | 33,550,028 | | | | 40,317,512 | |
| Net change in unrealized appreciation | | | | | | | | |
| (depreciation) on investments | | | (23,881,548 | ) | | | (11,111,810 | ) |
| Net increase in net assets resulting from operations | | | 12,760,158 | | | | 34,704,170 | |
| | | | | | | | | |
| DISTRIBUTIONS TO SHAREHOLDERS FROM: | | | | | | | | |
| Net investment income – Investor Class | | | (5,999,514 | ) | | | (2,916,316 | ) |
| Net investment income – Institutional Class | | | (170,988 | ) | | | (52,044 | ) |
| Net realized gains – Investor Class | | | (32,837,590 | ) | | | — | |
| Net realized gains – Institutional Class | | | (861,875 | ) | | | — | |
| Total distributions | | | (39,869,967 | ) | | | (2,968,360 | ) |
| | | | | | | | | |
| CAPITAL SHARE TRANSACTIONS: | | | | | | | | |
| Proceeds from shares issued in the reorganization – | | | | | | | | |
| Investor Class (See Note 9) | | | — | | | | 141,680,285 | |
| Proceeds from shares issued in the reorganization – | | | | | | | | |
| Institutional Class (See Note 9) | | | — | | | | 3,258,094 | |
| Proceeds from shares subscribed – Investor Class | | | 1,261,492 | | | | 2,341,233 | |
| Proceeds from shares subscribed – Institutional Class | | | 358,000 | | | | 2,547,752 | |
| Dividends reinvested – Investor Class | | | 36,758,790 | | | | 2,640,562 | |
| Dividends reinvested – Institutional Class | | | 906,472 | | | | 33,704 | |
| Cost of shares redeemed – Investor Class | | | (14,840,221 | ) | | | (23,154,846 | ) |
| Cost of shares redeemed – Institutional Class | | | (973,244 | ) | | | (1,029,188 | ) |
| Net increase in net assets derived | | | | | | | | |
| from capital share transactions | | | 23,471,289 | | | | 128,317,596 | |
| TOTAL INCREASE (DECREASE) IN NET ASSETS | | | (3,638,520 | ) | | | 160,053,406 | |
| | | | | | | | | |
| NET ASSETS: | | | | | | | | |
| Beginning of period | | | 288,466,752 | | | | 128,413,346 | |
| End of period | | $ | 284,828,232 | | | $ | 288,466,752 | |
| Undistributed net investment income, end of period | | $ | 1,901,446 | | | $ | 4,980,270 | |
The accompanying notes are an integral part of these financial statements.
HENNESSYFUNDS.COM
| STATEMENTS OF CHANGES IN NET ASSETS |
| | | Six Months Ended | | | | |
| | | April 30, 2018 | | | Year Ended | |
| | | (Unaudited) | | | October 31, 2017 | |
| CHANGES IN SHARES OUTSTANDING: | | | | | | |
| Shares issued in the reorganization – Investor Class | | | — | | | | 7,092,199 | |
| Shares issued in the reorganization – Institutional Class | | | — | | | | 163,058 | |
| Shares sold – Investor Class | | | 62,632 | | | | 118,558 | |
| Shares sold – Institutional Class | | | 18,161 | | | | 127,648 | |
| Shares issued to holders as reinvestment | | | | | | | | |
| of dividends – Investor Class | | | 1,887,491 | | | | 138,105 | |
| Shares issued to holders as reinvestment | | | | | | | | |
| of dividends – Institutional Class | | | 46,455 | | | | 1,763 | |
| Shares redeemed – Investor Class | | | (743,547 | ) | | | (1,154,302 | ) |
| Shares redeemed – Institutional Class | | | (48,924 | ) | | | (50,925 | ) |
| Net increase in shares outstanding | | | 1,222,268 | | | | 6,436,104 | |
The accompanying notes are an integral part of these financial statements.
| HENNESSY FUNDS | 1-800-966-4354 | |
Financial Statements
For an Investor Class share outstanding throughout each period
| | | Six Months Ended | |
| | | April 30, 2018 | |
| | | (Unaudited) | |
| PER SHARE DATA: | | | |
| Net asset value, beginning of period | | $ | 21.48 | |
| | | | | |
| Income from investment operations: | | | | |
| Net investment income | | | 0.18 | |
| Net realized and unrealized gains (losses) on investments | | | 0.73 | |
| Total from investment operations | | | 0.91 | |
| | | | | |
| Less distributions: | | | | |
| Dividends from net investment income | | | (0.42 | ) |
| Dividends from net realized gains | | | (2.53 | ) |
| Total distributions | | | (2.95 | ) |
| Net asset value, end of period | | $ | 19.44 | |
| | | | | |
| TOTAL RETURN | | | 4.45 | %(1) |
| | | | | |
| SUPPLEMENTAL DATA AND RATIOS: | | | | |
| Net assets, end of period (millions) | | $ | 277.83 | |
| Ratio of expenses to average net assets | | | 1.21 | %(2) |
| Ratio of net investment income to average net assets | | | 2.13 | %(2) |
Portfolio turnover rate(3) | | | 41 | %(1) |
(1) | Not annualized. |
(2) | Annualized. |
(3) | Portfolio turnover is calculated on the basis of the Fund as a whole. |
The accompanying notes are an integral part of these financial statements.
HENNESSYFUNDS.COM
| FINANCIAL HIGHLIGHTS — INVESTOR CLASS |
| Year Ended October 31, | | |
| 2017 | | | 2016 | | | 2015 | | | 2014 | | | 2013 | | |
| | | | | | | | | | | | | | | |
| $ | 18.36 | | | $ | 17.69 | | | $ | 18.41 | | | $ | 16.90 | | | $ | 14.02 | | |
| | | | | | | | | | | | | | | | | | | | |
| | | | | | | | | | | | | | | | | | | | |
| | 0.45 | | | | 0.43 | | | | 0.44 | | | | 0.39 | | | | 0.42 | | |
| | 3.10 | | | | 0.67 | | | | (0.75 | ) | | | 1.55 | | | | 2.84 | | |
| | 3.55 | | | | 1.10 | | | | (0.31 | ) | | | 1.94 | | | | 3.26 | | |
| | | | | | | | | | | | | | | | | | | | |
| | | | | | | | | | | | | | | | | | | | |
| | (0.43 | ) | | | (0.43 | ) | | | (0.41 | ) | | | (0.43 | ) | | | (0.38 | ) | |
| | — | | | | — | | | | — | | | | — | | | | — | | |
| | (0.43 | ) | | | (0.43 | ) | | | (0.41 | ) | | | (0.43 | ) | | | (0.38 | ) | |
| $ | 21.48 | | | $ | 18.36 | | | $ | 17.69 | | | $ | 18.41 | | | $ | 16.90 | | |
| | | | | | | | | | | | | | | | | | | | |
| | 19.63 | % | | | 6.41 | % | | | (1.77 | )% | | | 11.69 | % | | | 23.84 | % | |
| | | | | | | | | | | | | | | | | | | | |
| | | | | | | | | | | | | | | | | | | | |
| $ | 281.07 | | | $ | 126.53 | | | $ | 129.86 | | | $ | 145.04 | | | $ | 138.94 | | |
| | 1.22 | % | | | 1.25 | % | | | 1.10 | % | | | 1.17 | % | | | 1.22 | % | |
| | 2.36 | % | | | 2.33 | % | | | 2.32 | % | | | 2.18 | % | | | 2.60 | % | |
| | 72 | % | | | 36 | % | | | 46 | % | | | 34 | % | | | 41 | % | |
The accompanying notes are an integral part of these financial statements.
| HENNESSY FUNDS | 1-800-966-4354 | |
Financial Statements
For an Institutional Class share outstanding throughout each period
| | | Six Months Ended | |
| | | April 30, 2018 | |
| | | (Unaudited) | |
| PER SHARE DATA: | | | |
| Net asset value, beginning of period | | $ | 21.52 | |
| | | | | |
| Income from investment operations: | | | | |
| Net investment income | | | 0.20 | |
| Net realized and unrealized gains (losses) on investments | | | 0.72 | |
| Total from investment operations | | | 0.92 | |
| | | | | |
| Less distributions: | | | | |
| Dividends from net investment income | | | (0.46 | ) |
| Dividends from net realized gains | | | (2.53 | ) |
| Total distributions | | | (2.99 | ) |
| Net asset value, end of period | | $ | 19.45 | |
| | | | | |
| TOTAL RETURN | | | 4.53 | %(1) |
| | | | | |
| SUPPLEMENTAL DATA AND RATIOS: | | | | |
| Net assets, end of period (millions) | | $ | 6.99 | |
| Ratio of expenses to average net assets: | | | | |
| Before expense reimbursement | | | 0.98 | %(2) |
| After expense reimbursement | | | 0.98 | %(2) |
| Ratio of net investment income to average net assets: | | | | |
| Before expense reimbursement | | | 2.37 | %(2) |
| After expense reimbursement | | | 2.37 | %(2) |
Portfolio turnover rate(3) | | | 41 | %(1) |
(1) | Not annualized. |
(2) | Annualized. |
(3) | Portfolio turnover is calculated on the basis of the Fund as a whole. |
The accompanying notes are an integral part of these financial statements.
HENNESSYFUNDS.COM
| FINANCIAL HIGHLIGHTS — INSTITUTIONAL CLASS |
| Year Ended October 31, | | |
| 2017 | | | 2016 | | | 2015 | | | 2014 | | | 2013 | | |
| | | | | | | | | | | | | | | |
| $ | 18.40 | | | $ | 17.67 | | | $ | 18.41 | | | $ | 16.92 | | | $ | 14.04 | | |
| | | | | | | | | | | | | | | | | | | | |
| | | | | | | | | | | | | | | | | | | | |
| | 0.43 | | | | 0.48 | | | | 0.53 | | | | 0.59 | | | | 0.50 | | |
| | 3.18 | | | | 0.67 | | | | (0.83 | ) | | | 1.37 | | | | 2.80 | | |
| | 3.61 | | | | 1.15 | | | | (0.30 | ) | | | 1.96 | | | | 3.30 | | |
| | | | | | | | | | | | | | | | | | | | |
| | | | | | | | | | | | | | | | | | | | |
| | (0.49 | ) | | | (0.42 | ) | | | (0.44 | ) | | | (0.47 | ) | | | (0.42 | ) | |
| | — | | | | — | | | | — | | | | — | | | | — | | |
| | (0.49 | ) | | | (0.42 | ) | | | (0.44 | ) | | | (0.47 | ) | | | (0.42 | ) | |
| $ | 21.52 | | | $ | 18.40 | | | $ | 17.67 | | | $ | 18.41 | | | $ | 16.92 | | |
| | | | | | | | | | | | | | | | | | | | |
| | 19.95 | % | | | 6.72 | % | | | (1.72 | )% | | | 11.82 | % | | | 24.13 | % | |
| | | | | | | | | | | | | | | | | | | | |
| | | | | | | | | | | | | | | | | | | | |
| $ | 7.40 | | | $ | 1.88 | | | $ | 1.75 | | | $ | 10.65 | | | $ | 4.09 | | |
| | | | | | | | | | | | | | | | | | | | |
| | 0.97 | % | | | 0.95 | % | | | 1.00 | % | | | 1.03 | % | | | 1.10 | % | |
| | 0.97 | % | | | 0.95 | % | | | 1.00 | % | | | 0.98 | % | | | 0.98 | % | |
| | | | | | | | | | | | | | | | | | | | |
| | 2.60 | % | | | 2.63 | % | | | 2.43 | % | | | 2.30 | % | | | 2.64 | % | |
| | 2.60 | % | | | 2.63 | % | | | 2.43 | % | | | 2.35 | % | | | 2.76 | % | |
| | 72 | % | | | 36 | % | | | 46 | % | | | 34 | % | | | 41 | % | |
The accompanying notes are an integral part of these financial statements.
| HENNESSY FUNDS | 1-800-966-4354 | |
Financial Statements
Notes to the Financial Statements April 30, 2018 (Unaudited) |
1). ORGANIZATION
The Hennessy Cornerstone Value Fund (the “Fund”) is a series of Hennessy Funds Trust (the “Trust”), which was organized as a Delaware statutory trust on September 17, 1992. The Fund is an open-end management investment company registered under the Investment Company Act of 1940, as amended. The investment objective of the Fund is total return, consisting of capital appreciation and current income. The Fund is a diversified fund.
The Fund offers Investor Class and Institutional Class shares. Each class of shares differs principally in its respective 12b-1 distribution and service, shareholder servicing, and sub-transfer agent expenses. There are no sales charges. Each class has identical rights to earnings, assets, and voting privileges, except for class-specific expenses and exclusive rights to vote on matters affecting only an individual class.
As an investment company, the Fund follows the investment company accounting and reporting guidance of the Financial Accounting Standards Board (“FASB”) Accounting Standard Codification Topic 946 “Financial Services—Investment Companies.”
2). SIGNIFICANT ACCOUNTING POLICIES
The following is a summary of significant accounting policies consistently followed by the Fund in the preparation of the financial statements. These policies conform to U.S. generally accepted accounting principles (“GAAP”).
| a). | Investment Valuation – All investments in securities are recorded at their estimated fair value, as described in Note 3. |
| | |
| b). | Federal Income Taxes – No provision for federal income taxes or excise taxes has been made because the Fund has elected to be taxed as a “regulated investment company” and intends to distribute substantially all of its taxable income to its shareholders and otherwise comply with the provisions of the Internal Revenue Code of 1986, as amended, applicable to regulated investment companies. Net investment income/loss and realized gains/losses for federal income tax purposes may differ from those reported in the financial statements because of temporary book and tax basis differences. Temporary differences are primarily the result of the treatment of wash sales for tax reporting purposes. The Fund recognizes interest and penalties related to income tax benefits, if any, in the Statement of Operations as an income tax expense. Distributions from net realized gains for book purposes may include short-term capital gains, which are included as ordinary income to shareholders for tax purposes. The Fund may utilize equalization accounting for tax purposes and designate earnings and profits, including net realized gains distributed to shareholders on redemption of shares, as part of the dividends paid deduction for income tax purposes. |
| | |
| c). | Accounting for Uncertainty in Income Taxes – The Fund has accounting policies regarding recognition and measurement of tax positions taken or expected to be taken on a tax return. The tax returns of the Fund for the prior three fiscal years are open for examination. The Fund has reviewed all open tax years in major jurisdictions and concluded that there is no impact on the Fund’s net assets and no tax liability resulting from unrecognized tax benefits relating to uncertain income tax |
HENNESSYFUNDS.COM
| NOTES TO THE FINANCIAL STATEMENTS |
| | positions taken or expected to be taken on a tax return. The Fund’s major tax jurisdictions are U.S. federal and Delaware. |
| | |
| d). | Income and Expenses – Dividend income is recognized on the ex-dividend date or as soon as information is available to the Fund. Interest income, which includes the amortization of premium and accretion of discount, is recognized on an accrual basis. The Fund is charged for those expenses that are directly attributable to the portfolio, such as advisory, administration, and certain shareholder service fees. Income, expenses (other than expenses attributable to a specific class), and realized and unrealized gains/losses on investments are allocated to each class of shares based on such class’s net assets. |
| | |
| e). | Distributions to Shareholders – Dividends from net investment income for the Fund, if any, are declared and paid annually, usually in December. Distributions of net realized capital gains, if any, are declared and paid annually, usually in December. |
| | |
| f). | Security Transactions – Investment and shareholder transactions are recorded on the trade date. The Fund determines the realized gain/loss from an investment transaction by comparing the original cost of the security lot sold with the net sale proceeds. Discounts and premiums on securities purchased are accreted or amortized, respectively, over the life of each such security. |
| | |
| g). | Use of Estimates – The preparation of financial statements in conformity with GAAP requires management to make estimates and assumptions that affect the reported amounts of assets and liabilities and disclosure of contingent assets and liabilities at the date of the financial statements and the reported change in net assets during the reporting period. Actual results could differ from those estimates. |
| | |
| h). | Share Valuation – The net asset value (“NAV”) per share of the Fund is calculated by dividing (i) the total value of the securities held by the Fund, plus cash and other assets, minus all liabilities (including estimated accrued expenses) by (ii) the total number of shares outstanding for the Fund, rounded to the nearest cent. The Fund’s shares will not be priced on days the New York Stock Exchange is closed for trading. The offering and redemption price per share for the Fund is equal to the Fund’s NAV per share. |
3). SECURITIES VALUATION
The Fund follows fair valuation accounting standards that establish an authoritative definition of fair value and set out a hierarchy for measuring fair value. These standards require additional disclosures about the various inputs and valuation techniques used to develop the measurements of fair value and a discussion of changes in valuation techniques and related inputs during the period. These inputs are summarized in the three broad levels listed below:
| | Level 1 – | Unadjusted, quoted prices in active markets for identical instruments that the Fund has the ability to access at the date of measurement. |
| | | |
| | Level 2 – | Other significant observable inputs (including, but not limited to, quoted prices in active markets for similar instruments, quoted prices in markets that are not active for identical or similar instruments, and model-derived valuations in which all significant inputs and significant value drivers are observable in active markets (such as interest rates, prepayment speeds, credit risk curves, default rates, and similar data)). |
| | | |
| | Level 3 – | Significant unobservable inputs (including the Fund’s own assumptions about what market participants would use to price the asset or liability based on the best available information) when observable inputs are unavailable. |
| HENNESSY FUNDS | 1-800-966-4354 | |
Following is a description of the valuation techniques applied to the Fund’s major categories of assets and liabilities measured at fair value on a recurring basis.
| | Equity Securities – Equity securities, including common stocks, preferred stocks, foreign-issued common stocks, exchange-traded funds, closed-end mutual funds, partnerships, rights, and real estate investment trusts, that are traded on a securities exchange for which a last-quoted sales price is readily available will generally be valued at the last sales price as reported by the primary exchange on which the securities are listed. Securities listed on The NASDAQ Stock Market (“NASDAQ”) will generally be valued at the NASDAQ Official Closing Price, which may differ from the last sales price reported. Securities traded on a securities exchange for which a last-quoted sales price is not readily available will generally be valued at the mean between the bid and ask prices. To the extent these securities are actively traded and valuation adjustments are not applied, they are classified in Level 1 of the fair value hierarchy. Securities traded on foreign exchanges generally are not valued at the same time the Fund calculates its NAV because most foreign markets close well before such time. The earlier close of most foreign markets gives rise to the possibility that significant events, including broad market moves, may have occurred in the interim. In certain circumstances, it may be determined that a security needs to be fair valued because it appears that the value of the security might have been materially affected by events occurring after the close of the market in which the security is principally traded, but before the time the Fund calculates its NAV, such as by a development that affects an entire market or region (e.g., a weather-related event) or a potentially global development (e.g., a terrorist attack that may be expected to have an effect on investor expectations worldwide). |
| | |
| | Registered Investment Companies – Investments in registered investment companies (e.g., mutual funds) are generally priced at the ending NAV provided by the applicable registered investment company’s service agent and will be classified in Level 1 of the fair value hierarchy. |
| | |
| | Debt Securities – Debt securities, including corporate bonds, asset-backed securities, mortgage-backed securities, municipal bonds, U.S. Treasuries, and U.S. government agency issues, are generally valued at market on the basis of valuations furnished by an independent pricing service that utilizes both dealer-supplied valuations and formula-based techniques. The pricing service may consider recently executed transactions in securities of the issuer or comparable issuers, market price quotations (where observable), bond spreads, and fundamental data relating to the issuer. In addition, the model may incorporate observable market data, such as reported sales of similar securities, broker quotes, yields, bids, offers, and reference data. Certain securities are valued primarily using dealer quotations. These securities are generally classified in Level 2 of the fair value hierarchy. |
| | |
| | Short-Term Securities – Short-term equity investments, including money market funds, are valued in the manner specified above. Short-term debt investments with an original term to maturity of 60 days or less are valued at amortized cost, which approximates fair market value. If the original term to maturity of a short-term debt investment exceeded 60 days, then the values as of the 61st day prior to maturity are amortized. Amortized cost is not used if its use would be inappropriate due to credit or other impairments of the issuer, in which case the security’s fair value would be determined, as described below. Short-term securities are generally classified in Level 1 or Level 2 of the fair market hierarchy depending on the inputs used and market activity levels for specific securities. |
| NOTES TO THE FINANCIAL STATEMENTS |
The Board of Trustees of the Fund (the “Board”) has adopted fair value pricing procedures that are followed when a price for a security is not readily available or if a significant event has occurred that indicates the closing price of a security no longer represents the true value of that security. Fair value pricing determinations are made in good faith in accordance with these procedures. There are numerous criteria that will be given consideration in determining a fair value of a security, such as the trading volume of a security and markets, the values of other similar securities, and news events with direct bearing on a security or markets. Fair value pricing results in an estimated price for a security that reflects the amount the Fund might reasonably expect to receive in a current sale. Depending on the relative significance of the valuation inputs, these securities may be classified in either Level 2 or Level 3 of the fair value hierarchy.
The fair valuation of foreign securities may be determined with the assistance of a pricing service using correlations between the movement of prices of such securities and indices of domestic securities and other appropriate indicators, such as closing market prices of relevant American Depositary Receipts or futures contracts. The effect of using fair value pricing is that the Fund’s NAV will reflect the affected portfolio securities’ values as determined by the Board or its designee instead of being determined by the market. Using a fair value pricing methodology to price a foreign security may result in a value that is different from such foreign security’s most recent closing price and from the value used by other investment companies to calculate their NAVs. Such securities are generally classified in Level 2 of the fair valuation hierarchy. Because the Fund may invest in foreign securities, the value of the Fund’s portfolio securities may change on days when you will not be able to purchase or redeem your shares.
The Board has delegated day-to-day valuation matters to a Valuation Committee comprised of one or more representatives from Hennessy Advisors, Inc., the Fund’s investment advisor (the “Advisor”). The function of the Valuation Committee is to value securities where current and reliable market quotations are not readily available. All actions taken by the Valuation Committee are reviewed by the Board.
The Fund has performed an analysis of all existing investments to determine the significance and character of all inputs to their fair value determinations. Various inputs are used to determine the value of the Fund’s investments. The inputs or methodology used for valuing securities are not necessarily an indication of the risk associated with investing in those securities. Details related to the fair valuation hierarchy of the Fund’s securities as of April 30, 2018, are included in the Schedule of Investments.
4). INVESTMENT TRANSACTIONS
Purchases and sales of investment securities (excluding government and short-term investments) for the Fund during the six months ended April 30, 2018, were $115,959,770 and $133,488,650, respectively.
There were no purchases or sales/maturities of long-term U.S. government securities for the Fund during the six months ended April 30, 2018.
The Fund is permitted to purchase or sell securities from or to another fund in the Hennessy Funds family of funds (the “Hennessy Funds”) under specified conditions outlined in procedures adopted by the Board. The procedures have been designed to ensure that any purchase or sale of securities by the Fund from or to another Hennessy Fund complies with Rule 17a-7 of the Investment Company Act of 1940, as amended. During the six months ended April 30, 2018, the Fund did not engage in purchases or sales of securities pursuant to Rule 17a-7 of the Investment Company Act of 1940, as amended.
| HENNESSY FUNDS | 1-800-966-4354 | |
5). INVESTMENT MANAGEMENT FEE AND OTHER TRANSACTIONS WITH AFFILIATES
The Advisor provides the Fund with investment management services under an Investment Advisory Agreement. The Advisor furnishes all investment advice, office space, and facilities, as well as most of the personnel needed by the Fund. As compensation for its services, the Advisor is entitled to a monthly fee from the Fund. The fee is based upon the average daily net assets of the Fund at an annual rate of 0.74%. The net investment advisory fees expensed by the Fund during the six months ended April 30, 2018, are included in the Statement of Operations.
The Board has approved a Shareholder Servicing Agreement for Investor Class shares of the Fund, which was instituted to compensate the Advisor for the non-investment management services it provides to the Fund. The Shareholder Servicing Agreement provides for a monthly fee paid to the Advisor at an annual rate of 0.10% of the average daily net assets of the Fund attributable to Investor Class shares. The shareholder service fees expensed by the Fund during the six months ended April 30, 2018, are included in the Statement of Operations.
The Fund has adopted a plan pursuant to Rule 12b-1 under the Investment Company Act of 1940, as amended, that authorizes payments in connection with the distribution of the Fund’s shares at an annual rate of up to 0.25% of the Fund’s average daily net assets attributable to Investor Class shares. Even though the authorized rate is up to 0.25%, the Fund is currently only using up to 0.15% of its average daily net assets attributable to Investor Class shares for such purpose. Amounts paid under the plan may be spent on any activities or expenses primarily intended to result in the sale of shares, including, but not limited to, advertising, shareholder account servicing, the printing and mailing of prospectuses to other than current shareholders, the printing and mailing of sales literature, and compensation for sales and marketing activities or to financial institutions and others, such as dealers and distributors. The distribution fees expensed by the Fund during the six months ended April 30, 2018, are included in the Statement of Operations.
The Fund has entered into agreements with various brokers, dealers, and financial intermediaries in connection with the sale of shares of the Fund. The agreements provide for periodic payments by the Fund to the brokers, dealers, and financial intermediaries for providing certain shareholder maintenance services (sub-transfer agent expenses). These shareholder services include the pre-processing and quality control of new accounts, shareholder correspondence, answering customer inquiries regarding account status, and facilitating shareholder telephone transactions. The sub-transfer agent fees expensed by the Fund during the six months ended April 30, 2018, are included in the Statement of Operations.
U.S. Bancorp Fund Services, LLC (“USBFS”) provides the Fund with administrative, fund accounting, and transfer agent services. As administrator, USBFS is responsible for activities such as (i) preparing various federal and state regulatory filings, reports, and returns for the Fund, (ii) preparing reports and materials to be supplied to the Board, (iii) monitoring the activities of the Fund’s custodian, transfer agent, and accountants, and (iv) coordinating the preparation and payment of the Fund’s expenses and reviewing the Fund’s expense accruals. U.S. Bank N.A., an affiliate of USBFS, serves as the Fund’s custodian. The servicing agreements between the Trust and USBFS and U.S. Bank N.A. contain a fee schedule that is inclusive of administrative, fund accounting, custody, and transfer agent fees. The administrative, fund accounting, custody, and transfer agent fees expensed by the Fund during the six months ended April 30, 2018, are included in the Statement of Operations.
HENNESSYFUNDS.COM
| NOTES TO THE FINANCIAL STATEMENTS |
Quasar Distributors, LLC acts as the Fund’s principal underwriter in a continuous public offering of the Fund’s shares. Quasar Distributors, LLC is an affiliate of USBFS and U.S. Bank N.A.
The officers of the Fund are affiliated with the Advisor. Such officers, with the exception of the Chief Compliance Officer and the Senior Compliance Officer, receive no compensation from the Fund for serving in their respective roles. The Fund, along with the other Hennessy Funds, makes reimbursement payments, on an equal basis, to the Advisor for a portion of the salary and benefits associated with the office of the Chief Compliance Officer and for all of the salary and benefits associated with the office of the Senior Compliance Officer. The compliance fees expensed by the Fund during the six months ended April 30, 2018, are included in the Statement of Operations.
6). GUARANTEES AND INDEMNIFICATIONS
Under the Hennessy Funds’ organizational documents, their officers and trustees are indemnified by the Hennessy Funds against certain liabilities arising out of the performance of their duties to the Hennessy Funds. Additionally, in the normal course of business, the Hennessy Funds enter into contracts with service providers that contain general indemnification clauses. The Fund’s maximum exposure under these arrangements is unknown as this would involve future claims that may be made against the Fund that have not yet occurred. Currently, the Fund expects the risk of loss to be remote.
7). LINE OF CREDIT
The Fund has an uncommitted line of credit with the other Hennessy Funds in the amount of the lesser of (i) $100,000,000 or (ii) 33.33% of each Hennessy Fund’s net assets, or 30% for the Hennessy Gas Utility Fund and 10% for the Hennessy Balanced Fund, intended to provide short-term financing, if necessary, subject to certain restrictions, in connection with shareholder redemptions. The credit facility is with the Hennessy Funds’ custodian bank, U.S. Bank N.A. Borrowings under this arrangement bear interest at the bank’s prime rate and are secured by all of the Fund’s assets (as to its own borrowings only). During the six months ended April 30, 2018, the Fund did not have any borrowings outstanding under the line of credit.
8). FEDERAL TAX INFORMATION
As of October 31, 2017, the Fund’s most recent fiscal year end, the components of accumulated earnings (losses) for income tax purposes were as follows:
| | | | Investments | |
| | Cost of investments for tax purposes | | $ | 250,803,731 | |
| | Gross tax unrealized appreciation | | $ | 47,828,641 | |
| | Gross tax unrealized depreciation | | | (9,815,980 | ) |
| | Net tax unrealized appreciation | | $ | 38,012,661 | |
| | Undistributed ordinary income | | $ | 7,619,693 | |
| | Undistributed long-term capital gains | | | 31,059,954 | |
| | Total distributable earnings | | $ | 38,679,647 | |
| | Other accumulated gain | | $ | 2,933 | |
| | Total accumulated gain | | $ | 76,695,241 | |
The difference between book-basis unrealized appreciation/depreciation (as shown in the Statement of Assets and Liabilities) and tax-basis unrealized appreciation/depreciation (as shown above) is attributable primarily to wash sales.
As of October 31, 2017, the Fund’s most recent fiscal year end, the Fund had no tax basis capital losses to offset future capital gains.
| HENNESSY FUNDS | 1-800-966-4354 | |
During fiscal year 2017, the Fund’s most recent fiscal year, the capital losses utilized by the Fund were $2,900,273.
Capital losses sustained in fiscal year 2012 and in future taxable years will not expire and may be carried over by the Fund without limitation; however, they will retain the character of the original loss. Furthermore, any loss incurred during those taxable years will be required to be utilized prior to the losses incurred in taxable years prior to 2012. As a result of this ordering rule, pre-enactment capital loss carryforwards may be more likely to expire unused. Under pre-enactment law, capital losses could be carried forward for eight years, and carried forward as short-term capital losses, irrespective of the character of the original loss.
As of October 31, 2017, the Fund’s most recent fiscal year end, the Fund did not defer, on a tax basis, any late-year ordinary losses. Late-year ordinary losses are net ordinary losses incurred after December 31, 2016, but within the taxable year, that are deemed to arise on the first day of the Fund’s next taxable year.
During fiscal year 2018 (year to date) and fiscal year 2017, the tax character of distributions paid by the Fund was as follows:
| | | | Six Months Ended | | | Year Ended | |
| | | | April 30, 2018 | | | October 31, 2017 | |
| | Ordinary income(1) | | $ | 8,809,992 | | | $ | 2,968,360 | |
| | Long-term capital gain | | | 31,059,975 | | | | — | |
| | | | $ | 39,869,967 | | | $ | 2,968,360 | |
(1) Ordinary income includes short-term gain/loss.
9). AGREEMENT AND PLAN OF REORGANIZATION
On December 27, 2016, the Board of the Trust approved and declared advisable the reorganization of the Hennessy Large Value Fund (the “Large Value Fund”) into the Fund. The purpose of the reorganization was to combine two funds within the Trust with similar investment objectives and strategies. The reorganization provided for the transfer of assets of the Large Value Fund to the Fund and the assumption of the liabilities of the Large Value Fund by the Fund. Following the reorganization, the Fund held the assets of the Large Value Fund until the Fund rebalanced its portfolio in the winter, pursuant to its customary procedures. The reorganization was effective as of the close of business on February 27, 2017. The following tables illustrate the specifics of the Fund’s reorganization:
| | Shares Issued | | | |
| | to Shareholders | Cornerstone | | |
| Large Value Fund | of Large Value | Value Fund | Combined | Tax Status |
Net Assets | Fund | Net Assets | Net Assets | of Transfer |
$144,938,380(1) | 7,255,257 | $138,339,221 | $283,277,601 | Non-taxable |
| | (1) | Includes accumulated realized losses and unrealized appreciation in the amounts of $(1,561,193) and $34,112,735, respectively. |
Assuming the reorganization had been completed on November 1, 2016, the beginning of the annual reporting period of the Fund, the pro forma results of operation (unaudited) for fiscal year 2017 would have been as follows:
| | Net investment income | | $ | 6,090,397 | |
| | Net realized gain on investments | | $ | 41,027,748 | |
| | Net change in unrealized appreciation on investments | | $ | 5,413,160 | |
| | Net increase in net assets resulting from operations | | $ | 52,531,305 | |
| NOTES TO THE FINANCIAL STATEMENTS |
Because the Fund has been managed as a single integrated portfolio since the reorganization was completed, it is not practicable to separate the amounts of revenue and earnings of the Large Value Fund and the Fund that have been included in the Fund’s Statement of Operations since February 27, 2017.
10). EVENTS SUBSEQUENT TO PERIOD END
Management has evaluated the Fund’s related events and transactions that occurred subsequent to April 30, 2018, through the date of issuance of the Fund’s financial statements. Management has determined that there were no subsequent events requiring recognition or disclosure in the financial statements.
| HENNESSY FUNDS | 1-800-966-4354 | |
Expense Example (Unaudited)
April 30, 2018
As a shareholder of the Fund, you incur two types of costs: (1) transaction costs, including sales charges (loads) on purchase payments, reinvested dividends, or other distributions; redemption fees; and exchange fees; and (2) ongoing costs, including management fees; service fees; and other Fund expenses. This Example is intended to help you understand your ongoing costs (in dollars) of investing in the Fund and to compare these costs with the ongoing costs of investing in other mutual funds. The Example is based on an investment of $1,000 invested at the beginning of the period and held for the entire period from November 1, 2017, through April 30, 2018.
Actual Expenses
The first line of the table below under the “Investor Class” and “Institutional Class” headings provides information about actual account values and actual expenses. Although the Fund charges no sales loads or transaction fees, you will be assessed fees for outgoing wire transfers, returned checks and stop payment orders at prevailing rates charged by U.S. Bancorp Fund Services, LLC, the Fund’s transfer agent. If you request that a redemption be made by wire transfer, currently a $15 fee is charged by the Fund’s transfer agent. IRA accounts will be charged a $15 annual maintenance fee. The example below includes, but is not limited to, management fees, shareholder servicing fees, fund accounting, custody, and transfer agent fees. However, the example below does not include portfolio trading commissions and related expenses, and other extraordinary expenses as determined under generally accepted accounting principles. You may use the information in this line, together with the amount you invested, to estimate the expenses that you paid over the period. Simply divide your account value by $1,000 (for example, an $8,600 account value divided by $1,000 = 8.6), then multiply the result by the number in the first line of the table under the “Investor Class” or “Institutional Class” headings in the column entitled “Expenses Paid During Period” to estimate the expenses you paid on your account during this period.
Hypothetical Example for Comparison Purposes
The second line of the table below under the “Investor Class” and “Institutional Class” headings provides information about hypothetical account values and hypothetical expenses based on the Fund’s actual expense ratios and an assumed rate of return of 5% per year before expenses, which is not the Fund’s actual return. The hypothetical account values and expenses may not be used to estimate the actual ending account balance or expenses you paid for the period. You may use this information to compare the ongoing costs of investing in the Fund and other funds. To do so, compare this 5% hypothetical example with the 5% hypothetical examples that appear in the shareholder reports of the other funds. Please note that the expenses shown in the table are meant to highlight your ongoing costs only and do not reflect any transactional costs, such as sales charges (loads), or exchange fees. Therefore, the second line of the table under the “Investor Class” and “Institutional Class” headings is useful in comparing ongoing costs only, and will not help you determine the relative total costs of owning different funds. In addition, if these transactional costs were included, your costs would have been higher.
HENNESSYFUNDS.COM
| | | | Expenses Paid |
| | Beginning | Ending | During Period(1) |
| | Account Value | Account Value | November 1, 2017 – |
| | November 1, 2017 | April 30, 2018 | April 30, 2018 |
| Investor Class | | | |
| Actual | $1,000.00 | $1,044.50 | $6.13 |
| Hypothetical (5% return before expenses) | $1,000.00 | $1,018.79 | $6.06 |
| | | | |
| Institutional Class | | | |
| Actual | $1,000.00 | $1,045.30 | $4.97 |
| Hypothetical (5% return before expenses) | $1,000.00 | $1,019.93 | $4.91 |
(1) | Expenses are equal to the Fund’s expense ratio of 1.21% for Investor Class shares or 0.98% for Institutional Class shares, as applicable, multiplied by the average account value over the period, multiplied by 181/365 days (to reflect one-half year period). |
| HENNESSY FUNDS | 1-800-966-4354 | |
How to Obtain a Copy of the Fund’s
Proxy Voting Policy and Proxy Voting Records
A description of the policies and procedures the Fund uses to determine how to vote proxies relating to portfolio securities is available without charge (1) by calling 1-800-966-4354, (2) on the Hennessy Funds’ website at hennessyfunds.com/proxy-voting/voting-policy, or (3) on the U.S. Securities and Exchange Commission’s (the “SEC”) website at www.sec.gov. The Fund’s proxy voting record is available without charge on both the Hennessy Funds’ website at hennessyfunds.com/proxy-voting/voting-record and the SEC’s website at www.sec.gov no later than August 31 for the prior 12 months ending June 30.
Quarterly Filings on Form N-Q
The Fund files a complete schedule of portfolio holdings with the SEC for the first and third quarters of each fiscal year on Form N-Q. The Fund’s Forms N-Q are available on the SEC’s website at www.sec.gov. The Fund’s Forms N-Q may be reviewed and copied at the SEC’s Public Reference Room in Washington, DC and information on the operation of the Public Reference Room may be obtained by calling 1-800-SEC-0330. Information included in the Fund’s Forms N-Q will also be available upon request by calling 1-800-966-4354.
Federal Tax Distribution Information
(Unaudited)
For fiscal year 20187, certain dividends paid by the Fund may be subject to a maximum tax rate of 23.8%, as provided for by the Jobs and Growth Tax Relief Reconciliation Act of 2003. The percentage of dividends declared from ordinary income designated as qualified dividend income was 100.00%.
For corporate shareholders, the percent of ordinary income distributions that qualified for the corporate dividends received deduction for fiscal year 2017, was 94.30%.
The percentage of taxable ordinary income distributions that were designated as short-term capital gain distributions under Section 871(k)(2)(C) of the Internal Revenue Code of 1986, as amended, for the Fund was 0.00%.
Important Notice Regarding Delivery of
Shareholder Documents
To help keep the Fund’s costs as low as possible, we generally deliver a single copy of shareholder reports, proxy statements, and prospectuses to shareholders who share an address and have the same last name. This process does not apply to account statements. You may request an individual copy of a shareholder document at any time. If you would like to receive separate mailings of shareholder documents, please call U.S. Bancorp Fund Services, LLC at 1-800-261-6950 or 1-414-765-4124, and individual delivery will begin within 30 days of your request. If your account is held through a financial institution or other intermediary, please contact such intermediary directly to request individual delivery.
HENNESSYFUNDS.COM
| PROXY VOTING — BOARD APPROVAL OF INVESTMENT ADVISORY AGREEMENT |
Board Approval of Investment Advisory
Agreement
At its meeting on March 7, 2018, the Board of Trustees of the Fund (the “Board,” and the members thereof, the “Trustees”) unanimously approved the continuation of the investment advisory agreement of the Fund with Hennessy Advisors, Inc. (the “Advisor”). As part of the process of approving the continuation of the advisory agreement, the Trustees reviewed their fiduciary duties with respect to approving the advisory agreement and the relevant factors for them to consider. In addition, the Trustees who are not deemed “interested persons” (as defined by the Investment Company Act of 1940, as amended) of the Fund (the “Independent Trustees”) met in executive session to discuss the approval of the advisory agreement.
In advance of the meeting, the Advisor sent detailed information to the Trustees to assist them in their evaluation of the advisory agreement. This information included, but was not limited to, the following:
| | (1) | A memorandum from outside legal counsel that described the fiduciary duties of the Board with respect to approving the continuation of the advisory agreement and the relevant factors for consideration; |
| | | |
| | (2) | A memorandum from the Advisor that listed the factors relevant to the Board’s approval of the continuation of the advisory agreement and also referenced the documents that had been provided to help the Board assess each such factor; |
| | | |
| | (3) | An inventory of the range of services provided by the Advisor to the Fund; |
| | | |
| | (4) | A written discussion of economies of scale; |
| | | |
| | (5) | The advisory agreement; |
| | | |
| | (6) | A recent Fund fact sheet, which included, among other things, performance information over various periods; |
| | | |
| | (7) | A peer expense comparison of both the net expense ratio and investment advisory fee of the Fund; |
| | | |
| | (8) | The Advisor’s most recent Form 10-K and Form 10-Q, which includes information about the Advisor’s profitability; |
| | | |
| | (9) | Information about brokerage commissions; |
| | | |
| | (10) | Information about the Fund’s compliance program; and |
| | | |
| | (11) | The Advisor’s current Form ADV Part I. |
All of the factors discussed were considered as a whole by the Trustees, and also by the Independent Trustees meeting in executive session. The factors were viewed in their totality by the Trustees, with no single factor being the principal or determinative factor in the Trustees’ determination of whether to approve the continuation of the advisory agreement. The Trustees recognized that the management and fee arrangements for the Fund are the result of years of review and discussion between the Independent Trustees and the Advisor, that certain aspects of such arrangements may receive greater scrutiny in some years than in others, and that the Trustees’ conclusions may be based, in part, on their consideration of these same arrangements and information received during the course of the year and in prior years.
| HENNESSY FUNDS | 1-800-966-4354 | |
Prior to approving the continuation of the advisory agreement, the Trustees, including the Independent Trustees in executive session, considered, among other items:
| | (1) | The nature and quality of the advisory services provided by the Advisor; |
| | | |
| | (2) | A comparison of the fees and expenses of the Fund to other similar funds; |
| | | |
| | (3) | Whether economies of scale are recognized by the Fund; |
| | | |
| | (4) | The costs and profitability of the Fund to the Advisor; |
| | | |
| | (5) | The performance of the Fund; and |
| | | |
| | (6) | Any benefits to the Advisor from serving as an investment advisor to the Fund (other than the advisory fee). |
The material considerations and determinations of the Trustees, including the Independent Trustees, were as follows:
| | (1) | The Trustees considered the services identified below that are provided by the Advisor. Based on this review, the Trustees concluded that the Advisor provides high-quality services to the Fund, and they noted that their overall confidence in the Advisor is high. The Trustees also concluded that they were satisfied with the nature, extent, and quality of the advisory services provided to the Fund by the Advisor, and that the nature and extent of the services provided by the Advisor are appropriate to assure that the Fund’s operations are conducted in compliance with applicable laws, rules, and regulations. |
| | | (a) | The Advisor acts as the portfolio manager for the Fund. In this capacity, the Advisor does the following: |
| | | | (i) | manages the composition of the Fund’s portfolio, including the purchase, retention, and disposition of portfolio securities in accordance with the Fund’s investment objectives, policies, and restrictions; |
| | | | | |
| | | | (ii) | ensures compliance with “best execution” for the Fund’s portfolio; |
| | | | | |
| | | | (iii) | manages the use of soft dollars for the Fund; and |
| | | | | |
| | | | (iv) | manages proxy voting for the Fund. |
| | | (b) | The Advisor performs a daily reconciliation of portfolio positions and cash for the Fund. |
| | | | |
| | | (c) | The Advisor monitors the Fund’s compliance with its investment objectives and restrictions. |
| | | | |
| | | (d) | The Advisor monitors compliance with federal securities laws and performs activities such as maintaining a compliance program, conducting ongoing reviews of the compliance programs of the Fund’s service providers, conducting on-site visits to the Fund’s service providers, monitoring incidents of abusive trading practices, reviewing Fund expense accruals, payments, and fixed expense ratios, evaluating insurance providers for fidelity bond coverage and D&O/E&O insurance coverage, conducting employee compliance training, reviewing reports provided by service providers, maintaining books and records, and preparing an annual compliance report for the Board. |
| | | | |
| | | (e) | The Advisor oversees service providers that provide accounting, administration, distribution, transfer agency, custodial, sales, marketing, public relations, audit, information technology, and legal services to the Fund. |
| BOARD APPROVAL OF INVESTMENT ADVISORY AGREEMENT |
| | | (f) | The Advisor maintains in-house marketing and distribution departments on behalf of the Fund. |
| | | | |
| | | (g) | The Advisor is actively involved with preparing regulatory filings for the Fund, including writing and annually updating the Fund’s prospectus and related documents. |
| | | | |
| | | (h) | The Advisor prepares a written summary of the Fund’s performance for the most recent 12-month period for each annual report of the Fund. |
| | | | |
| | | (i) | The Advisor oversees distribution of the Fund through third-party broker/dealers and independent financial institutions such as Charles Schwab, Inc., Fidelity, TD Waterhouse, and Pershing. The Advisor participates in “no transaction fee” (“NTF”) programs with these companies on behalf of the Fund, which allow customers to purchase the Fund through third-party distribution channels without paying a transaction fee. The Advisor compensates, in part, a number of these third-party providers of NTF programs out of its own revenues. |
| | | | |
| | | (j) | The Advisor pays the incentive compensation of the Fund’s compliance officers and employs other staff, such as legal, marketing, national accounts, distribution, sales, administrative, and trading oversight personnel, as well as management executives. |
| | | | |
| | | (k) | The Advisor provides a quarterly compliance certification to the Board. |
| | | | |
| | | (l) | The Advisor prepares or reviews Board materials, frequently presents to the Board or leads Board discussions, prepares or reviews meeting minutes, and arranges for Board training and education. |
| | (2) | The Trustees compared the performance of the Fund to benchmark indices over various time periods and also noted that the Trustees review and discuss reports comparing the investment performance of the Fund to various indices at each quarterly Board meeting. Based on all such information, the Trustees believe that the Advisor manages the Fund in a manner that is materially consistent with its stated investment objective and style. The Trustees concluded that the performance of the Fund over various time periods warranted the continuation of the advisory agreement. |
| | | |
| | (3) | The Trustees reviewed the advisory fees and overall expense ratios of the Fund compared to other funds similar in asset size and investment objective to the Fund using data from Morningstar. As part of the discussion with management, the Trustees ensured that they understood and were comfortable with the criteria used to determine the mutual funds included in the Morningstar categories for purposes of the materials considered at the meeting. The Trustees determined that the advisory fee and overall expense ratio of the Fund falls within the range of the advisory fees and overall expense ratios of other comparable funds and concluded that they are reasonable and warranted continuation of the advisory agreement. |
| | | |
| | (4) | The Trustees also considered whether economies of scale were being realized by the Advisor that should be shared with the Fund’s shareholders. The Trustees noted that many of the expenses incurred to manage the Fund are asset-based fees and thus do not result in material economies of scale being realized as the assets of the Fund increase. For example, mutual fund platform fees increase as the Fund’s assets grow. The Trustees also considered the Advisor’s efforts to |
| HENNESSY FUNDS | 1-800-966-4354 | |
| | | contain expenses, the Advisor’s significant marketing efforts to promote the Funds, and the Advisor’s agreement to waive fees or lower its management fees in certain circumstances. The Trustees noted that at current asset levels it did not appear that there were economies of scale being realized by the Advisor and concluded that it would continue to monitor economies of scale in the future as circumstances changed. |
| | | |
| | (5) | The Trustees considered the profitability of the Advisor, including the impact of mutual fund platform fees on the Advisor’s profitability, and also considered the resources and revenues that the Advisor has put into managing and distributing the Fund. The Trustees then concluded that the profits of the Advisor are reasonable and not excessive when compared to profitability guidelines set forth in relevant court cases. |
| | | |
| | (6) | The Trustees considered the high level of professionalism and knowledge of the Advisor’s employees, along with a very low level of turnover, and concluded that this was beneficial to the Fund and its shareholders. |
| | | |
| | (7) | The Trustees considered any benefits to the Advisor from serving as an advisor to the Fund (other than the advisory fee). The Trustees noted that the Advisor may derive ancillary benefits from, by way of example, its association with the Fund in the form of proprietary and third-party research products and services received from broker-dealers that execute portfolio trades for the Fund. The Trustees determined that any such products and services have been used for legitimate purposes relating to the Fund by providing assistance in the investment decision-making process. The Trustees concluded that any additional benefits realized by the Advisor from its relationship with the Fund were reasonable. |
After reviewing the materials provided at the meeting and management’s presentation, as well as other information regularly provided at the Board’s quarterly meetings throughout the year regarding the quality of services provided by the Advisor, the performance of the Fund, expense information, regulatory compliance issues, trading information and related matters, and other factors that the Trustees deemed relevant, the Trustees, including the Independent Trustees, approved the continuation of the advisory agreement.
HENNESSYFUNDS.COM
| BOARD APPROVAL OF INVESTMENT ADVISORY AGREEMENT |
(This Page Intentionally Left Blank.)
For information, questions or assistance, please call
The Hennessy Funds
1-800-966-4354 or 1-415-899-1555
INVESTMENT ADVISOR
Hennessy Advisors, Inc.
7250 Redwood Boulevard, Suite 200
Novato, California 94945
ADMINISTRATOR,
TRANSFER AGENT,
DIVIDEND PAYING AGENT &
SHAREHOLDER SERVICING AGENT
U.S. Bancorp Fund Services, LLC
P.O. Box 701
Milwaukee, Wisconsin 53201-0701
CUSTODIAN
U.S. Bank N.A.
Custody Operations
1555 North River Center Drive, Suite 302
Milwaukee, Wisconsin 53212
TRUSTEES
Neil J. Hennessy
Robert T. Doyle
J. Dennis DeSousa
Gerald P. Richardson
COUNSEL
Foley & Lardner LLP
777 East Wisconsin Avenue
Milwaukee, Wisconsin 53202-5306
INDEPENDENT REGISTERED
PUBLIC ACCOUNTING FIRM
Tait, Weller & Baker LLP
1818 Market Street, Suite 2400
Philadelphia, Pennsylvania 19103
DISTRIBUTOR
Quasar Distributors, LLC
777 East Wisconsin Avenue
Milwaukee, Wisconsin 53202
hennessyfunds.com | 1-800-966-4354
This report has been prepared for shareholders and may be distributed to
others only if preceded or accompanied by a current prospectus.
SEMI-ANNUAL REPORT
APRIL 30, 2018
HENNESSY TOTAL RETURN FUND
Investor Class HDOGX
hennessyfunds.com | 1-800-966-4354
(This Page Intentionally Left Blank.)
Contents
| Letter to Shareholders | 2 |
| Performance Overview | 4 |
| Financial Statements | |
| Schedule of Investments | 5 |
| Statement of Assets and Liabilities | 9 |
| Statement of Operations | 10 |
| Statements of Changes in Net Assets | 11 |
| Statement of Cash Flows | 12 |
| Financial Highlights | 14 |
| Notes to the Financial Statements | 16 |
| Expense Example | 24 |
| Proxy Voting Policy and Proxy Voting Records | 25 |
| Quarterly Schedule of Investments | 25 |
| Federal Tax Distribution Information | 25 |
| Important Notice Regarding Delivery of Shareholder Documents | 25 |
| Board Approval of Investment Advisory Agreement | 26 |
| HENNESSY FUNDS | 1-800-966-4354 | |
May 2018
Dear Hennessy Funds Shareholder:
Investors in the United States and abroad experienced the return of volatility in the six months ended April 30, 2018, especially during the second half of the period. Equities rallied sharply during the first half of the period and fell back during the second half, but nevertheless ended the period with solid gains, with the Dow Jones Industrial Average posting a total return of 4.5% and the S&P 500 Index up 3.8%. Over the past year, I have repeatedly shared my belief that the stock market was due for a correction, but that it would bounce back, as it has so many times during the current bull market.
In the closing months of 2017 and into January 2018, U.S. equities rallied in response to the enactment of the Tax Cuts and Jobs Act of 2017, which significantly lowered corporate tax rates. Investors were also encouraged by two quarters of real GDP growth of 3.2% and 2.9%. However, equity prices quickly lost ground in reaction to the imposition of trade tariffs on steel and aluminum, and fears that additional proposed tariffs could provoke a trade war with China. Signals from the Federal Reserve that the pace of interest rate increases would move slightly higher also weighed on investors. During the period, the federal funds rate was raised twice, by a quarter point each time, in December 2017 and March 2018.
The current bull market in U.S. equities is now entering its 10th year, and we remain optimistic about the outlook for stock prices. In our opinion, economic fundamentals look positive. The U.S. economy is growing at a solid pace of 2 – 3% annually, inflation is low, and high employment levels are supporting healthy growth in consumption. Wages are rising, but the rate of increase has remained steady at around 2.6% per year since mid-2016. While it appears that the Federal Reserve will continue to raise the federal funds rate and normalize monetary policy, we believe it will be able to do so gradually, avoiding a severe jolt to either financial markets or the economy. Meanwhile, companies continue to report robust earnings growth, boosted this year by lower tax rates.
We believe U.S. equities remain attractively valued. U.S. long bond yields are hovering near 3%, having risen over the period in response to strong economic activity. Prospective PE multiples, however, have dropped significantly since the end of 2017, the result of a combination of lower taxes, higher operating earnings, and lower stock prices. The Dow Jones Industrial Average and the S&P 500 Index are trading at about 17x forward earnings, down from approximately 20x at the beginning of the calendar year, valuations we believe to be very reasonable.
We are not overly concerned about recent protectionist actions by the U.S. administration. We consider the announcements and ongoing discussions regarding import tariffs and NAFTA to be representative of standard Trump deal-making tactics – make far-reaching demands and then negotiate a reasonable outcome that is beneficial to both sides. We expect continued pro-business policies and regulatory relief to be enacted by our leaders in Washington.
Finally, as noted many times in past letters during this bull market, the euphoria that has historically accompanied a peak in the market continues to be absent. Investors today are worried about many things, including higher interest rates, larger budget deficits, higher import tariffs, and political distractions. But they are definitely not euphoric. In the past, I have likened the current bull market to the 1982-2000 bull market, and I continue
HENNESSYFUNDS.COM
to believe the comparison is a good one. We remain confident that the market will be able to weather the current period of volatility and that the economy, despite higher interest rates and possible trade disruptions, is resilient enough to continue its steady growth into the coming year.
Thank you for your continued confidence and investment in the Hennessy Funds. If you have any questions or would like to speak with us directly, please don’t hesitate to call us at (800) 966-4354.
Best regards,
Neil J. Hennessy
President and Chief Investment Officer
Past performance does not guarantee future results.
Mutual fund investing involves risk. Principal loss is possible.
Opinions expressed are those of Neil Hennessy and are subject to change, are not guaranteed, and should not be considered investment advice.
The Dow Jones Industrial Average and S&P 500 Index are unmanaged indices commonly used to measure the performance of U.S. stocks. One cannot invest directly in an index.
Price to earnings (PE) is calculated by dividing a company’s market price per share by its earnings per share. Earnings growth is not a measure of a fund’s future performance.
| HENNESSY FUNDS | 1-800-966-4354 | |
Performance Overview (Unaudited)
AVERAGE ANNUAL TOTAL RETURN FOR PERIODS ENDED APRIL 30, 2018
| | Six | One | Five | Ten |
| | Months(1) | Year | Years | Years |
| Hennessy Total | | | | |
| Return Fund (HDOGX) | 1.34% | 7.40% | 6.79% | 5.88% |
| 75/25 Blended DJIA/ | | | | |
| Treasury Index | 3.62% | 13.74% | 9.80% | 7.27% |
| Dow Jones Industrial Average | 4.51% | 18.09% | 12.96% | 9.39% |
Expense ratio: 1.58%
(1) | Periods less than one year are not annualized. |
___________________
Performance data quoted represents past performance; past performance does not guarantee future results. The investment return and principal value of an investment will fluctuate so that an investor’s shares, when redeemed, may be worth more or less than their original cost. The performance table does not reflect the deduction of taxes that a shareholder would pay on Fund distributions or the redemption of Fund shares. Current performance of the Fund may be lower or higher than the performance quoted. Performance data current to the most recent month end may be obtained by visiting hennessyfunds.com.
The 75/25 Blended DJIA/Treasury Index consists of 75% common stocks represented by the Dow Jones Industrial Average and 25% short-duration Treasury securities represented by the ICE BofAML U.S. 3-Month Treasury Bill Index. The Dow Jones Industrial Average is an unmanaged index commonly used to measure the performance of U.S. stocks. The ICE BofAML U.S. 3-Month Treasury Bill Index is an unmanaged index of Treasury securities maturing in 90 days. One cannot invest directly in an index.
The expense ratio presented is from the most recent prospectus. The expense ratio for the current reporting period is available in the Financial Highlights section of this report.
| PERFORMANCE OVERVIEW/SCHEDULE OF INVESTMENTS |
Financial Statements
Schedule of Investments as of April 30, 2018 (Unaudited) |
HENNESSY TOTAL RETURN FUND
(% of Net Assets)
| TOP TEN HOLDINGS | % NET ASSETS |
| U.S. Treasury Bill, 1.780%, 06/21/2018 | 25.15% |
| U.S. Treasury Bill, 1.630%, 05/17/2018 | 20.99% |
| U.S. Treasury Bill, 1.760%, 07/19/2018 | 20.93% |
| Cisco Systems, Inc. | 9.36% |
| Chevron Corp. | 7.87% |
| Pfizer, Inc. | 7.62% |
| Verizon Communications, Inc. | 7.35% |
| Exxon Mobil Corp. | 6.90% |
| International Business Machines Corp. | 6.84% |
| The Coca-Cola Co. | 6.71% |
Note: For presentation purposes, the Fund has grouped some of the industry categories. For purposes of categorizing securities for compliance with Section 8(b)(1) of the Investment Company Act of 1940, as amended, the Fund uses more specific industry classifications.
The Global Industry Classification Standard (GICS®) was developed by and is the exclusive property and a service mark of MSCI, Inc. and Standard & Poor Financial Services LLC. It has been licensed for use by the Hennessy Funds.
| HENNESSY FUNDS | 1-800-966-4354 | |
| COMMON STOCKS – 72.04% | | Number | | | | | | % of | |
| | | of Shares | | | Value | | | Net Assets | |
| Consumer Staples – 12.58% | | | | | | | | | |
| The Coca-Cola Co. | | | 110,900 | | | $ | 4,791,989 | | | | 6.71 | % |
| The Procter & Gamble Co. | | | 57,900 | | | | 4,188,486 | | | | 5.87 | % |
| | | | | | | | 8,980,475 | | | | 12.58 | % |
| | | | | | | | | | | | | |
| Energy – 14.77% | | | | | | | | | | | | |
| Chevron Corp. | | | 44,900 | | | | 5,617,439 | | | | 7.87 | % |
| Exxon Mobil Corp. | | | 63,400 | | | | 4,929,350 | | | | 6.90 | % |
| | | | | | | | 10,546,789 | | | | 14.77 | % |
| | | | | | | | | | | | | |
| Health Care – 12.25% | | | | | | | | | | | | |
| Merck & Co., Inc. | | | 56,100 | | | | 3,302,607 | | | | 4.63 | % |
| Pfizer, Inc. | | | 148,700 | | | | 5,443,907 | | | | 7.62 | % |
| | | | | | | | 8,746,514 | | | | 12.25 | % |
| | | | | | | | | | | | | |
| Industrials – 4.86% | | | | | | | | | | | | |
| General Electric Co. | | | 246,400 | | | | 3,466,848 | | | | 4.86 | % |
| | | | | | | | | | | | | |
| Information Technology – 20.23% | | | | | | | | | | | | |
| Cisco Systems, Inc. | | | 151,000 | | | | 6,687,790 | | | | 9.36 | % |
| Intel Corp. | | | 55,700 | | | | 2,875,234 | | | | 4.03 | % |
| International Business Machines Corp. | | | 33,700 | | | | 4,885,152 | | | | 6.84 | % |
| | | | | | | | 14,448,176 | | | | 20.23 | % |
| | | | | | | | | | | | | |
| Telecommunication Services – 7.35% | | | | | | | | | | | | |
| Verizon Communications, Inc. | | | 106,400 | | | | 5,250,840 | | | | 7.35 | % |
| | | | | | | | | | | | | |
| Total Common Stocks | | | | | | | | | | | | |
| (Cost $48,730,547) | | | | | | | 51,439,642 | | | | 72.04 | % |
The accompanying notes are an integral part of these financial statements.
HENNESSYFUNDS.COM
| SHORT-TERM INVESTMENTS – 68.44% | | Number of Shares/ | | | | | | % of | |
| | | Par Amount | | | Value | | | Net Assets | |
| Money Market Funds – 1.37% | | | | | | | | | |
| Fidelity Government Portfolio, Institutional Class, 1.58% (a) | | | 977,644 | | | $ | 977,644 | | | | 1.37 | % |
| | | | | | | | | | | | | |
| U.S. Treasury Bills (c) – 67.07% | | | | | | | | | | | | |
| 1.780%, 06/21/2018 (b) | | | 18,000,000 | | | | 17,957,415 | | | | 25.15 | % |
| 1.760%, 07/19/2018 (b) | | | 15,000,000 | | | | 14,942,396 | | | | 20.93 | % |
| 1.630%, 05/17/2018 (b) | | | 15,000,000 | | | | 14,989,733 | | | | 20.99 | % |
| | | | | | | | 47,889,544 | | | | 67.07 | % |
| Total Short-Term Investments | | | | | | | | | | | | |
| (Cost $48,866,365) | | | | | | | 48,867,188 | | | | 68.44 | % |
| | | | | | | | | | | | | |
| Total Investments | | | | | | | | | | | | |
| (Cost $97,596,912) – 140.48% | | | | | | | 100,306,830 | | | | 140.48 | % |
| Liabilities in Excess of Other Assets – (40.48)% | | | | | | | (28,906,202 | ) | | | (40.48 | )% |
| | | | | | | | | | | | | |
TOTAL NET ASSETS – 100.00% | | | | | | $ | 71,400,628 | | | | 100.00 | % |
Percentages are stated as a percent of net assets.
| (a) | The rate listed is the fund’s seven-day yield as of April 30, 2018. |
| (b) | The rate listed is discount rate at issue. |
| (c) | Collateral or partial collateral for securities sold subject to repurchase. |
The accompanying notes are an integral part of these financial statements.
| HENNESSY FUNDS | 1-800-966-4354 | |
Summary of Fair Value Exposure at April 30, 2018
The following is a summary of the inputs used to value the Fund’s net assets as of April 30, 2018 (See Note 3 in the accompanying notes to the financial statements):
| Common Stocks | | Level 1 | | | Level 2 | | | Level 3 | | | Total | |
| Consumer Staples | | $ | 8,980,475 | | | $ | — | | | $ | — | | | $ | 8,980,475 | |
| Energy | | | 10,546,789 | | | | — | | | | — | | | | 10,546,789 | |
| Health Care | | | 8,746,514 | | | | — | | | | — | | | | 8,746,514 | |
| Industrials | | | 3,466,848 | | | | — | | | | — | | | | 3,466,848 | |
| Information Technology | | | 14,448,176 | | | | — | | | | — | | | | 14,448,176 | |
| Telecommunication Services | | | 5,250,840 | | | | — | | | | — | | | | 5,250,840 | |
| Total Common Stocks | | $ | 51,439,642 | | | $ | — | | | $ | — | | | $ | 51,439,642 | |
| Short-Term Investments | | | | | | | | | | | | | | | | |
| Money Market Funds | | $ | 977,644 | | | $ | — | | | $ | — | | | $ | 977,644 | |
| U.S. Treasury Bills | | | — | | | | 47,889,544 | | | | — | | | | 47,889,544 | |
| Total Short-Term Investments | | $ | 977,644 | | | $ | 47,889,544 | | | $ | — | | | $ | 48,867,188 | |
| Total Investments | | $ | 52,417,286 | | | $ | 47,889,544 | | | $ | — | | | $ | 100,306,830 | |
Transfers between levels are recognized at the end of the reporting period. During the six-month period ended April 30, 2018, the Fund recognized no transfers between levels.
Schedule of Reverse Repurchase Agreements
| | | | | Principal | Maturity | | Maturity | |
| Face Value | | Counterparty | Rate | Trade Date | Date | | Amount | |
| $ | 8,995,000 | | Jefferies LLC | 1.65% | 2/16/18 | 5/17/18 | | $ | 9,032,104 | |
| | 10,794,000 | | Jefferies LLC | 1.90% | 3/23/18 | 6/21/18 | | | 10,845,272 | |
| | 8,995,000 | | Jefferies LLC | 1.90% | 4/20/18 | 7/19/18 | | | 9,037,726 | |
| $ | 28,784,000 | | | | | | | $ | 28,915,102 | |
As of April 30, 2018, the fair value of securities held as collateral for reverse repurchase agreements was $31,926,363, as noted on the Schedule of Investments.
Reverse repurchase agreements are carried at face value; hence, they are not included in the fair valuation hierarchy. The face value of the reverse repurchase agreements at April 30, 2018, was $28,784,000. Due to the short-term nature of the reverse repurchase agreements, face value approximates fair value. The face value plus interest due at maturity is equal to $28,915,102.
The accompanying notes are an integral part of these financial statements.
HENNESSYFUNDS.COM
| SCHEDULE OF INVESTMENTS/STATEMENT OF ASSETS AND LIABILITIES |
Financial Statements
Statement of Assets and Liabilities as of April 30, 2018 (Unaudited) |
| ASSETS: | | | |
| Investments in securities, at value (cost $97,596,912) | | $ | 100,306,830 | |
| Dividends and interest receivable | | | 106,255 | |
| Receivable for fund shares sold | | | 934 | |
| Prepaid expenses and other assets | | | 13,852 | |
| Total Assets | | | 100,427,871 | |
| | | | | |
| LIABILITIES: | | | | |
| Payable for fund shares redeemed | | | 27,308 | |
| Payable to advisor | | | 35,643 | |
| Payable to administrator | | | 11,900 | |
| Payable to auditor | | | 9,724 | |
| Accrued distribution fees | | | 79,348 | |
| Accrued service fees | | | 5,941 | |
| Reverse repurchase agreements | | | 28,784,000 | |
| Accrued interest payable | | | 48,852 | |
| Accrued trustees fees | | | 5,095 | |
| Accrued expenses and other payables | | | 19,432 | |
| Total Liabilities | | | 29,027,243 | |
| NET ASSETS | | $ | 71,400,628 | |
| | | | | |
| NET ASSETS CONSIST OF: | | | | |
| Capital stock | | $ | 66,237,667 | |
| Accumulated net investment income | | | 101,215 | |
| Accumulated net realized gain on investments | | | 2,351,828 | |
| Unrealized net appreciation on investments | | | 2,709,918 | |
| Total Net Assets | | $ | 71,400,628 | |
| | | | | |
| NET ASSETS | | | | |
| Investor Class: | | | | |
| Shares authorized (no par value) | | Unlimited | |
| Net assets applicable to outstanding Investor Class shares | | $ | 71,400,628 | |
| Shares issued and outstanding | | | 5,399,446 | |
| Net asset value, offering price and redemption price per share | | $ | 13.22 | |
The accompanying notes are an integral part of these financial statements.
| HENNESSY FUNDS | 1-800-966-4354 | |
Financial Statements
Statement of Operations for the six months ended April 30, 2018 (Unaudited) |
| INVESTMENT INCOME: | | | |
| Dividend income | | $ | 919,235 | |
| Interest income | | | 353,704 | |
| Total investment income | | | 1,272,939 | |
| | | | | |
| EXPENSES: | | | | |
| Investment advisory fees (See Note 5) | | | 225,333 | |
| Interest expense (See Notes 7 and 9) | | | 235,314 | |
| Distribution fees – Investor Class (See Note 5) | | | 56,333 | |
| Service fees – Investor Class (See Note 5) | | | 37,555 | |
| Sub-transfer agent expenses – Investor Class (See Note 5) | | | 36,804 | |
| Administration, fund accounting, custody and transfer agent fees (See Note 5) | | | 35,319 | |
| Compliance expense (See Note 5) | | | 14,628 | |
| Federal and state registration fees | | | 12,433 | |
| Audit fees | | | 10,969 | |
| Trustees’ fees and expenses | | | 9,141 | |
| Reports to shareholders | | | 6,715 | |
| Other expenses | | | 3,912 | |
| Total expenses | | | 684,456 | |
| NET INVESTMENT INCOME | | $ | 588,483 | |
| | | | | |
| REALIZED AND UNREALIZED GAINS (LOSSES): | | | | |
| Net realized gain on investments | | $ | 2,483,966 | |
| Net change in unrealized appreciation on investments | | | (2,034,916 | ) |
| Net gain on investments | | | 449,050 | |
| NET INCREASE IN NET ASSETS RESULTING FROM OPERATIONS | | $ | 1,037,533 | |
The accompanying notes are an integral part of these financial statements.
HENNESSYFUNDS.COM
| STATEMENT OF OPERATIONS/STATEMENTS OF CHANGES IN NET ASSETS |
Financial Statements
| Statements of Changes in Net Assets |
| | | Six Months Ended | | | | |
| | | April 30, 2018 | | | Year Ended | |
| | | (Unaudited) | | | October 31, 2017 | |
| OPERATIONS: | | | | | | |
| Net investment income | | $ | 588,483 | | | $ | 1,187,349 | |
| Net realized gain on investments | | | 2,483,966 | | | | 8,689,833 | |
| Net change in unrealized appreciation on investments | | | (2,034,916 | ) | | | 49,360 | |
| Net increase in net assets resulting from operations | | | 1,037,533 | | | | 9,926,542 | |
| | | | | | | | | |
| DISTRIBUTIONS TO SHAREHOLDERS FROM: | | | | | | | | |
| Net investment income – Investor Class | | | (600,064 | ) | | | (1,171,215 | ) |
| Net realized gains – Investor Class | | | (7,947,899 | ) | | | (4,428,807 | ) |
| Total distributions | | | (8,547,963 | ) | | | (5,600,022 | ) |
| | | | | | | | | |
| CAPITAL SHARE TRANSACTIONS: | | | | | | | | |
| Proceeds from shares subscribed – Investor Class | | | 1,076,579 | | | | 17,437,144 | |
| Dividends reinvested – Investor Class | | | 8,117,264 | | | | 5,335,208 | |
| Cost of shares redeemed – Investor Class | | | (8,035,685 | ) | | | (33,215,945 | ) |
| Net increase (decrease) in net assets derived | | | | | | | | |
| from capital share transactions | | | 1,158,158 | | | | (10,443,593 | ) |
| TOTAL DECREASE IN NET ASSETS | | | (6,352,272 | ) | | | (6,117,073 | ) |
| | | | | | | | | |
| NET ASSETS: | | | | | | | | |
| Beginning of period | | | 77,752,900 | | | | 83,869,973 | |
| End of period | | $ | 71,400,628 | | | $ | 77,752,900 | |
| Undistributed net investment income, end of period | | $ | 101,215 | | | $ | 112,796 | |
| | | | | | | | | |
| CHANGES IN SHARES OUTSTANDING: | | | | | | | | |
| Shares sold – Investor Class | | | 79,393 | | | | 1,237,906 | |
| Shares issued to holders as reinvestment | | | | | | | | |
| of dividends – Investor Class | | | 609,009 | | | | 387,386 | |
| Shares redeemed – Investor Class | | | (593,328 | ) | | | (2,382,169 | ) |
| Net increase (decrease) in shares outstanding | | | 95,074 | | | | (756,877 | ) |
The accompanying notes are an integral part of these financial statements.
| HENNESSY FUNDS | 1-800-966-4354 | |
Financial Statements
Statement of Cash Flows for the six months ended April 30, 2018 (Unaudited) |
| Cash flows from operating activities: | | | |
| Net increase in net assets from operations | | $ | 1,037,533 | |
| Adjustments to reconcile net increase in net assets from | | | | |
| operations to net cash provided by operating activities: | | | | |
| Payments to purchase securities | | | (3,644,370 | ) |
| Proceeds from sale of securities | | | 6,022,973 | |
| Proceeds from securities litigation | | | 9,577 | |
| Sale of short term investments, net | | | 8,371,528 | |
| Realized gain on investments in securities | | | (2,483,966 | ) |
| Net accretion of discount on securities | | | (339,519 | ) |
| Change in unrealized appreciation on investments in securities | | | 2,034,916 | |
| (Increases) decreases in operating assets: | | | | |
| Decrease in dividends and interest receivable | | | 12,839 | |
| Increase in prepaid expenses and other assets | | | (877 | ) |
| Increases (decreases) in operating liabilities: | | | | |
| Decrease in payable to advisor | | | (4,589 | ) |
| Decrease in payable to administrator | | | (1,229 | ) |
| Increase in accrued distribution fees | | | 16,812 | |
| Decrease in accrued service fees | | | (764 | ) |
| Increase in accrued interest payable | | | 9,990 | |
| Decrease in accrued audit fees | | | (11,581 | ) |
| Decrease in accrued trustee fees | | | (477 | ) |
| Increase in other accrued expenses and payables | | | 6,085 | |
| Net cash used in operating activities | | | 11,034,881 | |
| | | | | |
| Cash flows from financing activities: | | | | |
| Increase in reverse repurchase agreements | | | (3,598,000 | ) |
| Proceeds from shares sold | | | 1,081,375 | |
| Payment on shares redeemed | | | (8,087,558 | ) |
| Distributions paid in cash, net of reinvestments | | | (430,698 | ) |
| Net cash provided by financing activities | | | (11,034,881 | ) |
| Net increase in cash | | | — | |
| | | | | |
| Cash: | | | | |
| Beginning balance | | | — | |
| Ending balance | | $ | — | |
| | | | | |
| Supplemental information: | | | | |
| Non-cash financing activities not included herein consists | | | | |
| of dividend reinvestment of dividends and distributions | | $ | 8,117,264 | |
| | | | | |
| Cash paid for interest | | $ | 225,324 | |
The accompanying notes are an integral part of these financial statements.
HENNESSYFUNDS.COM
(This Page Intentionally Left Blank.)
| HENNESSY FUNDS | 1-800-966-4354 | |
Financial Statements
For an Investor Class share outstanding throughout each period
| | | Six Months Ended | |
| | | April 30, 2018 | |
| | | (Unaudited) | |
| PER SHARE DATA: | | | |
| Net asset value, beginning of period | | $ | 14.66 | |
| | | | | |
| Income from investment operations: | | | | |
| Net investment income | | | 0.11 | |
| Net realized and unrealized gains (losses) on investments | | | 0.08 | |
| Total from investment operations | | | 0.19 | |
| | | | | |
| Less distributions: | | | | |
| Dividends from net investment income | | | (0.11 | ) |
| Dividends from net realized gains | | | (1.52 | ) |
| Total distributions | | | (1.63 | ) |
| Net asset value, end of period | | $ | 13.22 | |
| | | | | |
| TOTAL RETURN | | | 1.34 | %(2) |
| | | | | |
| SUPPLEMENTAL DATA AND RATIOS: | | | | |
| Net assets, end of period (millions) | | $ | 71.40 | |
| Ratio of expenses to average net assets | | | 1.82 | %(1) |
| Ratio of net investment income to average net assets | | | 1.57 | %(1) |
| Portfolio turnover rate | | | 7 | %(2) |
(1) | Annualized. |
(2) | Not annualized. |
The accompanying notes are an integral part of these financial statements.
HENNESSYFUNDS.COM
| FINANCIAL HIGHLIGHTS — INVESTOR CLASS |
| Year Ended October 31, | | |
| 2017 | | | 2016 | | | 2015 | | | 2014 | | | 2013 | | |
| | | | | | | | | | | | | | | |
| $ | 13.84 | | | $ | 14.19 | | | $ | 15.27 | | | $ | 14.30 | | | $ | 12.64 | | |
| | | | | | | | | | | | | | | | | | | | |
| | | | | | | | | | | | | | | | | | | | |
| | 0.20 | | | | 0.16 | | | | 0.20 | | | | 0.20 | | | | 0.16 | | |
| | 1.48 | | | | 0.88 | | | | (0.02 | ) | | | 0.96 | | | | 1.66 | | |
| | 1.68 | | | | 1.04 | | | | 0.18 | | | | 1.16 | | | | 1.82 | | |
| | | | | | | | | | | | | | | | | | | | |
| | | | | | | | | | | | | | | | | | | | |
| | (0.20 | ) | | | (0.16 | ) | | | (0.20 | ) | | | (0.19 | ) | | | (0.16 | ) | |
| | (0.66 | ) | | | (1.23 | ) | | | (1.06 | ) | | | — | | | | — | | |
| | (0.86 | ) | | | (1.39 | ) | | | (1.26 | ) | | | (0.19 | ) | | | (0.16 | ) | |
| $ | 14.66 | | | $ | 13.84 | | | $ | 14.19 | | | $ | 15.27 | | | $ | 14.30 | | |
| | | | | | | | | | | | | | | | | | | | |
| | 12.56 | % | | | 8.20 | % | | | 1.22 | % | | | 8.15 | % | | | 14.49 | % | |
| | | | | | | | | | | | | | | | | | | | |
| | | | | | | | | | | | | | | | | | | | |
| $ | 77.75 | | | $ | 83.87 | | | $ | 69.42 | | | $ | 83.89 | | | $ | 90.24 | | |
| | 1.57 | % | | | 1.44 | % | | | 1.28 | % | | | 1.34 | % | | | 1.37 | % | |
| | 1.38 | % | | | 1.22 | % | | | 1.40 | % | | | 1.31 | % | | | 1.16 | % | |
| | 36 | % | | | 44 | % | | | 27 | % | | | 23 | % | | | 31 | % | |
The accompanying notes are an integral part of these financial statements.
| HENNESSY FUNDS | 1-800-966-4354 | |
Financial Statements
Notes to the Financial Statements April 30, 2018 (Unaudited) |
1). ORGANIZATION
The Hennessy Total Return Fund (the “Fund”) is a series of Hennessy Funds Trust (the “Trust”), which was organized as a Delaware statutory trust on September 17, 1992. The Fund is an open-end management investment company registered under the Investment Company Act of 1940, as amended. The investment objective of the Fund is total return, consisting of capital appreciation and current income. The Fund is a non-diversified fund and offers Investor Class shares.
As an investment company, the Fund follows the investment company accounting and reporting guidance of the Financial Accounting Standards Board (“FASB”) Accounting Standard Codification Topic 946 “Financial Services—Investment Companies.”
2). SIGNIFICANT ACCOUNTING POLICIES
The following is a summary of significant accounting policies consistently followed by the Fund in the preparation of the financial statements. These policies conform to U.S. generally accepted accounting principles (“GAAP”).
| a). | Investment Valuation – All investments in securities are recorded at their estimated fair value, as described in Note 3. |
| | |
| b). | Federal Income Taxes – No provision for federal income taxes or excise taxes has been made because the Fund has elected to be taxed as a “regulated investment company” and intends to distribute substantially all of its taxable income to its shareholders and otherwise comply with the provisions of the Internal Revenue Code of 1986, as amended, applicable to regulated investment companies. Net investment income/loss and realized gains/losses for federal income tax purposes may differ from those reported in the financial statements because of temporary book and tax basis differences. Temporary differences are primarily the result of the treatment of wash sales for tax reporting purposes. The Fund recognizes interest and penalties related to income tax benefits, if any, in the Statement of Operations as an income tax expense. Distributions from net realized gains for book purposes may include short-term capital gains, which are included as ordinary income to shareholders for tax purposes. The Fund may utilize equalization accounting for tax purposes and designate earnings and profits, including net realized gains distributed to shareholders on redemption of shares, as part of the dividends paid deduction for income tax purposes. |
| | |
| c). | Accounting for Uncertainty in Income Taxes – The Fund has accounting policies regarding recognition and measurement of tax positions taken or expected to be taken on a tax return. The tax returns of the Fund for the prior three fiscal years are open for examination. The Fund has reviewed all open tax years in major jurisdictions and concluded that there is no impact on the Fund’s net assets and no tax liability resulting from unrecognized tax benefits relating to uncertain income tax positions taken or expected to be taken on a tax return. The Fund’s major tax jurisdictions are U.S. federal and Delaware. |
| | |
| d). | Income and Expenses – Dividend income is recognized on the ex-dividend date or as soon as information is available to the Fund. Interest income, which includes the amortization of premium and accretion of discount, is recognized on an accrual basis. |
HENNESSYFUNDS.COM
| NOTES TO THE FINANCIAL STATEMENTS |
| | The Fund is charged for those expenses that are directly attributable to the portfolio, such as advisory, administration, and certain shareholder service fees. |
| | |
| e). | Distributions to Shareholders – Dividends from net investment income for the Fund, if any, are declared and paid at the end of each calendar quarter. Distributions of net realized capital gains, if any, are declared and paid annually, usually in December. |
| | |
| f). | Security Transactions – Investment and shareholder transactions are recorded on the trade date. The Fund determines the realized gain/loss from an investment transaction by comparing the original cost of the security lot sold with the net sale proceeds. Discounts and premiums on securities purchased are accreted or amortized, respectively, over the life of each such security. |
| | |
| g). | Use of Estimates – The preparation of financial statements in conformity with GAAP requires management to make estimates and assumptions that affect the reported amounts of assets and liabilities and disclosure of contingent assets and liabilities at the date of the financial statements and the reported change in net assets during the reporting period. Actual results could differ from those estimates. |
| | |
| h). | Share Valuation – The net asset value (“NAV”) per share of the Fund is calculated by dividing (i) the total value of the securities held by the Fund, plus cash and other assets, minus all liabilities (including estimated accrued expenses) by (ii) the total number of shares outstanding for the Fund, rounded to the nearest cent. The Fund’s shares will not be priced on days the New York Stock Exchange is closed for trading. The offering and redemption price per share for the Fund is equal to the Fund’s NAV per share. |
| | |
| i). | Derivatives – The Fund may invest in, or enter into, derivatives, such as options, futures contracts, options on futures contracts, and swaps, for a variety of reasons, including to hedge certain risks, provide a substitute for purchasing or selling particular securities, or increase potential income gain. Derivatives are financial contracts based on an underlying or notional amount, require no initial investment or an initial net investment that is smaller than would normally be required to have a similar response to changes in market factors, and require or permit net settlement. Derivatives may allow the Fund to increase or decrease the level of risk to which the Fund is exposed more quickly and efficiently than transactions in other types of instruments. The main reason for utilizing derivative instruments is for hedging purposes. |
| | |
| | The Fund follows the financial accounting reporting rules as required by the Derivatives and Hedging Topic of the FASB Accounting Standards Codification. Under such rules, the Fund is required to include enhanced disclosure that enables investors to understand how and why an entity uses derivatives, how derivatives are accounted for, and how derivatives instruments affect an entity’s results of operations and financial position. During fiscal year 2017, the Fund did not hold any derivative instruments. |
| | |
| j). | Repurchase and Reverse Repurchase Agreements – The Fund may enter into repurchase agreements and reverse repurchase agreements with member banks or security dealers of the Federal Reserve Board whom the investment advisor deems creditworthy. Transactions involving repurchase agreements and reverse repurchase agreements are treated as collateralized financing transactions and are recorded at their contracted resell or repurchase amounts, which approximates fair value. Interest on repurchase agreements and reverse repurchase agreements is included in interest receivable and interest payable, respectively. |
| HENNESSY FUNDS | 1-800-966-4354 | |
| | In connection with repurchase agreements, securities pledged as collateral are held by the custodian bank until the respective agreements mature. Provisions of the repurchase agreements ensure that the market value of the collateral, including accrued interest thereon, is sufficient to cover the repurchase amount in the event of default of the counterparty. If the counterparty defaults and the fair value of the collateral declines, or if the counterparty enters an insolvency proceeding, realization of the collateral by the Fund may be delayed or limited. |
| | |
| | At April 30, 2018, securities with a fair value of $31,926,363, which are included in investments in securities in the Statement of Assets and Liabilities, were pledged to collateralize reverse repurchase agreements. |
| | |
| k). | Offsetting Assets and Liabilities – The Fund follows the financial reporting rules regarding offsetting assets and liabilities and related netting arrangements to enable users of its financial statements to understand the effect of those arrangements on its financial position. Reverse repurchase transactions are entered into by the Fund under Master Repurchase Agreements (“MRAs”) that permit the Fund, under certain circumstances, including an event of default (such as bankruptcy or insolvency), to offset payables under the MRA with collateral held with the counterparty and create one single net payment from the Fund. Upon a bankruptcy or insolvency of the MRA counterparty, the Fund is considered an unsecured creditor with respect to excess collateral and, as such, the return of excess collateral may be delayed. In the event the buyer of securities under an MRA files for bankruptcy or becomes insolvent, the Fund’s use of the proceeds of the MRA may be restricted while the other party, or its trustee or receiver, determines whether or not to enforce the Fund’s obligation to repurchase the securities. For additional information regarding the offsetting of assets and liabilities at April 30, 2018, please refer to the table in Note 9. |
3). SECURITIES VALUATION
The Fund follows fair valuation accounting standards that establish an authoritative definition of fair value and set out a hierarchy for measuring fair value. These standards require additional disclosures about the various inputs and valuation techniques used to develop the measurements of fair value and a discussion of changes in valuation techniques and related inputs during the period. These inputs are summarized in the three broad levels listed below:
| | Level 1 – | Unadjusted, quoted prices in active markets for identical instruments that the Fund has the ability to access at the date of measurement. |
| | | |
| | Level 2 – | Other significant observable inputs (including, but not limited to, quoted prices in active markets for similar instruments, quoted prices in markets that are not active for identical or similar instruments, and model-derived valuations in which all significant inputs and significant value drivers are observable in active markets, (such as interest rates, prepayment speeds, credit risk curves, default rates, and similar data)). |
| | | |
| | Level 3 – | Significant unobservable inputs (including the Fund’s own assumptions about what market participants would use to price the asset or liability based on the best available information) when observable inputs are unavailable. |
Following is a description of the valuation techniques applied to the Fund’s major categories of assets and liabilities measured at fair value on a recurring basis.
| | Equity Securities – Equity securities, including common stocks, preferred stocks, exchange-traded funds, closed-end mutual funds, partnerships, rights, and real estate investment trusts, that are traded on a securities exchange for which a last-quoted |
HENNESSYFUNDS.COM
| NOTES TO THE FINANCIAL STATEMENTS |
| | sales price is readily available will generally be valued at the last sales price as reported by the primary exchange on which the securities are listed. Securities listed on The NASDAQ Stock Market (“NASDAQ”) will generally be valued at the NASDAQ Official Closing Price, which may differ from the last sales price reported. Securities traded on a securities exchange for which a last-quoted sales price is not readily available will generally be valued at the mean between the bid and ask prices. To the extent these securities are actively traded and valuation adjustments are not applied, they are classified in Level 1 of the fair value hierarchy. |
| | |
| | Registered Investment Companies – Investments in registered investment companies (e.g., mutual funds) are generally priced at the ending NAV provided by the applicable registered investment company’s service agent and will be classified in Level 1 of the fair value hierarchy. |
| | |
| | Debt Securities – Debt securities, including corporate bonds, asset-backed securities, mortgage-backed securities, municipal bonds, U.S. Treasuries, and U.S. government agency issues, are generally valued at market on the basis of valuations furnished by an independent pricing service that utilizes both dealer-supplied valuations and formula-based techniques. The pricing service may consider recently executed transactions in securities of the issuer or comparable issuers, market price quotations (where observable), bond spreads, and fundamental data relating to the issuer. In addition, the model may incorporate observable market data, such as reported sales of similar securities, broker quotes, yields, bids, offers, and reference data. Certain securities are valued primarily using dealer quotations. These securities are generally classified in Level 2 of the fair value hierarchy. |
| | |
| | Short-Term Securities – Short-term equity investments, including money market funds, are valued in the manner specified above. Short-term debt investments with an original term to maturity of 60 days or less are valued at amortized cost, which approximates fair market value. If the original term to maturity of a short-term debt investment exceeded 60 days, then the values as of the 61st day prior to maturity are amortized. Amortized cost is not used if its use would be inappropriate due to credit or other impairments of the issuer, in which case the security’s fair value would be determined, as described below. Short-term securities are generally classified in Level 1 or Level 2 of the fair market hierarchy depending on the inputs used and market activity levels for specific securities. |
The Board of Trustees of the Fund (the “Board”) has adopted fair value pricing procedures that are followed when a price for a security is not readily available or if a significant event has occurred that indicates the closing price of a security no longer represents the true value of that security. Fair value pricing determinations are made in good faith in accordance with these procedures. There are numerous criteria that will be given consideration in determining a fair value of a security, such as the trading volume of a security and markets, the values of other similar securities, and news events with direct bearing on a security or markets. Fair value pricing results in an estimated price for a security that reflects the amount the Fund might reasonably expect to receive in a current sale. Depending on the relative significance of the valuation inputs, these securities may be classified in either Level 2 or Level 3 of the fair value hierarchy.
The Board has delegated day-to-day valuation matters to a Valuation Committee comprised of one or more representatives from Hennessy Advisors, Inc., the Fund’s investment advisor (the “Advisor”). The function of the Valuation Committee is to value securities where current and reliable market quotations are not readily available. All actions taken by the Valuation Committee are reviewed by the Board.
| HENNESSY FUNDS | 1-800-966-4354 | |
The Fund has performed an analysis of all existing investments to determine the significance and character of all inputs to their fair value determinations. Various inputs are used to determine the value of the Fund’s investments. The inputs or methodology used for valuing securities are not necessarily an indication of the risk associated with investing in those securities. Details related to the fair valuation hierarchy of the Fund’s securities as of April 30, 2018, are included in the Schedule of Investments.
4). INVESTMENT TRANSACTIONS
Purchases and sales of investment securities (excluding government and short-term investments) for the Fund during the six months ended April 30, 2018, were $3,644,370 and $6,022,973, respectively.
There were no purchases or sales/maturities of long-term U.S. government securities for the Fund during the six months ended April 30, 2018.
The Fund is permitted to purchase or sell securities from or to another fund in the Hennessy Funds family of funds (the “Hennessy Funds”) under specified conditions outlined in procedures adopted by the Board. The procedures have been designed to ensure that any purchase or sale of securities by the Fund from or to another Hennessy Fund complies with Rule 17a-7 of the Investment Company Act of 1940, as amended. During the six months ended April 30, 2018, the Fund did not engage in purchases or sales of securities pursuant to Rule 17a-7 of the Investment Company Act of 1940, as amended.
5). INVESTMENT MANAGEMENT FEE AND OTHER TRANSACTIONS WITH AFFILIATES
The Advisor provides the Fund with investment management services under an Investment Advisory Agreement. The Advisor furnishes all investment advice, office space, and facilities, as well as most of the personnel needed by the Fund. As compensation for its services, the Advisor is entitled to a monthly fee from the Fund. The fee is based upon the average daily net assets of the Fund at an annual rate of 0.60%. The net investment advisory fees expensed by the Fund during the six months ended April 30, 2018, are included in the Statement of Operations.
The Board has approved a Shareholder Servicing Agreement for the Fund, which was instituted to compensate the Advisor for the non-investment management services it provides to the Fund. The Shareholder Servicing Agreement provides for a monthly fee paid to the Advisor at an annual rate of 0.10% of the average daily net assets of the Fund. The shareholder service fees expensed by the Fund during the six months ended April 30, 2018, are included in the Statement of Operations.
The Fund has adopted a plan pursuant to Rule 12b-1 under the Investment Company Act of 1940, as amended, that authorizes payments in connection with the distribution of the Fund’s shares at an annual rate of up to 0.25% of the Fund’s average daily net assets. Even though the authorized rate is up to 0.25%, the Fund is currently only using up to 0.15% of its average daily net assets for such purpose. Amounts paid under the plan may be spent on any activities or expenses primarily intended to result in the sale of shares, including, but not limited to, advertising, shareholder account servicing, the printing and mailing of prospectuses to other than current shareholders, the printing and mailing of sales literature, and compensation for sales and marketing activities or to financial institutions and others, such as dealers and distributors. The distribution fees expensed by the Fund during the six months ended April 30, 2018, are included in the Statement of Operations.
The Fund has entered into agreements with various brokers, dealers, and financial intermediaries in connection with the sale of shares of the Fund. The agreements provide for periodic payments by the Fund to the brokers, dealers, and financial
HENNESSYFUNDS.COM
| NOTES TO THE FINANCIAL STATEMENTS |
intermediaries for providing certain shareholder maintenance services (sub-transfer agent expenses). These shareholder services include the pre-processing and quality control of new accounts, shareholder correspondence, answering customer inquiries regarding account status, and facilitating shareholder telephone transactions. The sub-transfer agent fees expensed by the Fund during the six months ended April 30, 2018, are included in the Statement of Operations.
U.S. Bancorp Fund Services, LLC (“USBFS”) provides the Fund with administrative, fund accounting, and transfer agent services. As administrator, USBFS is responsible for activities such as (i) preparing various federal and state regulatory filings, reports, and returns for the Fund, (ii) preparing reports and materials to be supplied to the Board, (iii) monitoring the activities of the Fund’s custodian, transfer agent, and accountants, and (iv) coordinating the preparation and payment of the Fund’s expenses and reviewing the Fund’s expense accruals. U.S. Bank N.A., an affiliate of USBFS, serves as the Fund’s custodian. The servicing agreements between the Trust and USBFS and U.S. Bank N.A. contain a fee schedule that is inclusive of administrative, fund accounting, custody, and transfer agent fees. The administrative, fund accounting, custody, and transfer agent fees expensed by the Fund during the six months ended April 30, 2018, are included in the Statement of Operations.
Quasar Distributors, LLC acts as the Fund’s principal underwriter in a continuous public offering of the Fund’s shares. Quasar Distributors, LLC is an affiliate of USBFS and U.S. Bank N.A.
The officers of the Fund are affiliated with the Advisor. Such officers, with the exception of the Chief Compliance Officer and the Senior Compliance Officer, receive no compensation from the Fund for serving in their respective roles. The Fund, along with the other Hennessy Funds, makes reimbursement payments, on an equal basis, to the Advisor for a portion of the salary and benefits associated with the office of the Chief Compliance Officer and for all of the salary and benefits associated with the office of the Senior Compliance Officer. The compliance fees expensed by the Fund during the six months ended April 30, 2018, are included in the Statement of Operations.
6). GUARANTEES AND INDEMNIFICATIONS
Under the Hennessy Funds’ organizational documents, their officers and trustees are indemnified by the Hennessy Funds against certain liabilities arising out of the performance of their duties to the Hennessy Funds. Additionally, in the normal course of business, the Hennessy Funds enter into contracts with service providers that contain general indemnification clauses. The Fund’s maximum exposure under these arrangements is unknown as this would involve future claims that may be made against the Fund that have not yet occurred. Currently, the Fund expects the risk of loss to be remote.
7). LINE OF CREDIT
The Fund has an uncommitted line of credit with the other Hennessy Funds in the amount of the lesser of (i) $100,000,000 or (ii) 33.33% of each Hennessy Fund’s net assets, or 30% for the Hennessy Gas Utility Fund and 10% for the Hennessy Balanced Fund, intended to provide short-term financing, if necessary, subject to certain restrictions, in connection with shareholder redemptions. The credit facility is with the Hennessy Funds’ custodian bank, U.S. Bank N.A. Borrowings under this arrangement bear interest at the bank’s prime rate and are secured by all of the Fund’s assets (as to its own borrowings only). During the six months ended April 30, 2018, the Fund did not have any borrowings outstanding under the line of credit.
| HENNESSY FUNDS | 1-800-966-4354 | |
8). FEDERAL TAX INFORMATION
As of October 31, 2017, the Fund’s most recent fiscal year end, the components of accumulated earnings (losses) for income tax purposes were as follows:
| | | | Investments | |
| | Cost of investments for tax purposes | | $ | 105,665,206 | |
| | Gross tax unrealized appreciation | | $ | 6,050,237 | |
| | Gross tax unrealized depreciation | | | (1,437,473 | ) |
| | Net tax unrealized appreciation | | $ | 4,612,764 | |
| | Undistributed ordinary income | | $ | 805,355 | |
| | Undistributed long-term capital gains | | | 7,255,272 | |
| | Total distributable earnings | | $ | 8,060,627 | |
| | Other accumulated gain | | $ | — | |
| | Total accumulated gain | | $ | 12,673,391 | |
The difference between book-basis unrealized appreciation/depreciation (as shown in the Statement of Assets and Liabilities) and tax-basis unrealized appreciation/depreciation (as shown above) is attributable primarily to wash sales.
As of October 31, 2017, the Fund’s most recent fiscal year end, the Fund had no tax basis capital losses to offset future capital gains.
As of October 31, 2017, the Fund’s most recent fiscal year end, the Fund did not defer, on a tax basis, any late-year ordinary losses. Late-year ordinary losses are net ordinary losses incurred after December 31, 2016, but within the taxable year, that are deemed to arise on the first day of the Fund’s next taxable year.
During fiscal year 2018 (year to date) and fiscal year 2017, the tax character of distributions paid by the Fund was as follows:
| | | | Six Months Ended | | | Year Ended | |
| | | | April 30, 2018 | | | October 31, 2017 | |
| | Ordinary income(1) | | $ | 752,643 | | | $ | 1,216,622 | |
| | Long-term capital gain | | | 7,255,320 | | | | 4,383,400 | |
| | | | $ | 8,547,963 | | | $ | 5,600,022 | |
(1) Ordinary income includes short-term gain/loss.
9). REVERSE REPURCHASE AGREEMENTS
The Fund may enter into reverse repurchase agreements with the same parties with whom it may enter into repurchase agreements. Under a reverse repurchase agreement, the Fund sells securities and agrees to repurchase them at a mutually agreed-upon date and price. Reverse repurchase agreements are regarded as a form of secured borrowing by the Fund. Securities sold under reverse repurchase agreements are reflected as a liability in the Statement of Assets and Liabilities. Interest payments made under reverse repurchase agreements were $235,310, and are recorded as a component of interest expense in the Statement of Operations.
During the six months ended April 30, 2018, the average daily balance and average interest rate in effect for reverse repurchase agreements were $31,179,354 and 1.506%, respectively. Below is information about the scheduled maturity date, amount, and interest rate for outstanding reverse repurchase agreements as of April 30, 2018:
Maturity Date | Amount | Interest Rate |
| May 17, 2018 | $ 8,995,000 | 1.65% |
| June 21, 2018 | $10,794,000 | 1.90% |
| July 19, 2018 | $ 8,995,000 | 1.90% |
HENNESSYFUNDS.COM
| NOTES TO THE FINANCIAL STATEMENTS |
Outstanding reverse repurchase agreements at April 30, 2018, were equal to 40.31% of the Fund’s net assets.
Below is information about instruments and transactions eligible for offset in the Statement of Assets and Liabilities, on both a gross and net basis, as well as instruments and transactions subject to an agreement similar to a master netting arrangement:
| | | Gross | Net | | | |
| | | Amounts | Amounts | | | |
| | | Offset | Presented | Gross Amounts Not | |
| | | in the | in the | Offset in the Statement | |
| | Gross | Statement | Statement | of Assets and Liabilities | |
| | Amounts of | of | of | | Collateral | |
| | Recognized | Assets and | Assets and | Financial | Pledged | Net |
Description | Liabilities | Liabilities | Liabilities | Instruments | (Received) | Amount |
| Reverse | | | | | | |
| Repurchase | | | | | | |
| Agreements | $28,784,000 | $ — | $28,784,000 | $28,784,000 | $ — | $ — |
| | $28,784,000 | $ — | $28,784,000 | $28,784,000 | $ — | $ — |
For additional information, please refer to the “Offsetting Assets and Liabilities” section in Note 2.
10). EVENTS SUBSEQUENT TO PERIOD END
Management has evaluated the Fund’s related events and transactions that occurred subsequent to April 30, 2018, through the date of issuance of the Fund’s financial statements. Management has determined that there were no subsequent events requiring recognition or disclosure in the financial statements.
| HENNESSY FUNDS | 1-800-966-4354 | |
Expense Example (Unaudited)
April 30, 2018
As a shareholder of the Fund, you incur two types of costs: (1) transaction costs, including sales charges (loads) on purchase payments, reinvested dividends, or other distributions; redemption fees; and exchange fees; and (2) ongoing costs, including management fees; service fees; and other Fund expenses. This Example is intended to help you understand your ongoing costs (in dollars) of investing in the Fund and to compare these costs with the ongoing costs of investing in other mutual funds. The Example is based on an investment of $1,000 invested at the beginning of the period and held for the entire period from November 1, 2017, through April 30, 2018.
Actual Expenses
The first line of the table below provides information about actual account values and actual expenses. Although the Fund charges no sales loads or transaction fees, you will be assessed fees for outgoing wire transfers, returned checks and stop payment orders at prevailing rates charged by U.S. Bancorp Fund Services, LLC, the Fund’s transfer agent. If you request that a redemption be made by wire transfer, currently a $15 fee is charged by the Fund’s transfer agent. IRA accounts will be charged a $15 annual maintenance fee. The example below includes, but is not limited to, management fees, shareholder servicing fees, fund accounting, custody, and transfer agent fees. However, the example below does not include portfolio trading commissions and related expenses, and other extraordinary expenses as determined under generally accepted accounting principles. You may use the information in this line, together with the amount you invested, to estimate the expenses that you paid over the period. Simply divide your account value by $1,000 (for example, an $8,600 account value divided by $1,000 = 8.6), then multiply the result by the number in the first line of the table under the heading entitled “Expenses Paid During Period” to estimate the expenses you paid on your account during this period.
Hypothetical Example for Comparison Purposes
The second line of the table below provides information about hypothetical account values and hypothetical expenses based on the Fund’s actual expense ratio and an assumed rate of return of 5% per year before expenses, which is not the Fund’s actual return. The hypothetical account values and expenses may not be used to estimate the actual ending account balance or expenses you paid for the period. You may use this information to compare the ongoing costs of investing in the Fund and other funds. To do so, compare this 5% hypothetical example with the 5% hypothetical examples that appear in the shareholder reports of the other funds. Please note that the expenses shown in the table are meant to highlight your ongoing costs only and do not reflect any transactional costs, such as sales charges (loads), or exchange fees. Therefore, the second line of the table is useful in comparing ongoing costs only, and will not help you determine the relative total costs of owning different funds. In addition, if these transactional costs were included, your costs would have been higher.
| | | | Expenses Paid |
| | Beginning | Ending | During Period(1) |
| | Account Value | Account Value | November 1, 2017 – |
| | November 1, 2017 | April 30, 2018 | April 30, 2018 |
| Investor Class | | | |
| Actual | $1,000.00 | $1,013.40 | $9.09 |
| Hypothetical (5% return before expenses) | $1,000.00 | $1,015.77 | $9.10 |
(1) | Expenses are equal to the Fund’s expense ratio of 1.82%, multiplied by the average account value over the period, multiplied by 181/365 days (to reflect one-half year period). |
HENNESSYFUNDS.COM
| EXPENSE EXAMPLE — IMPORTANT NOTICE REGARDING DELIVERY OF SHAREHOLDER DOCUMENTS |
How to Obtain a Copy of the Fund’s
Proxy Voting Policy and Proxy Voting Records
A description of the policies and procedures the Fund uses to determine how to vote proxies relating to portfolio securities is available without charge (1) by calling 1-800-966-4354, (2) on the Hennessy Funds’ website at hennessyfunds.com/proxy-voting/voting-policy, or (3) on the U.S. Securities and Exchange Commission’s (the “SEC”) website at www.sec.gov. The Fund’s proxy voting record is available without charge on both the Hennessy Funds’ website at hennessyfunds.com/proxy-voting/voting-record and the SEC’s website at www.sec.gov no later than August 31 for the prior 12 months ending June 30.
Quarterly Filings on Form N-Q
The Fund files a complete schedule of portfolio holdings with the SEC for the first and third quarters of each fiscal year on Form N-Q. The Fund’s Forms N-Q are available on the SEC’s website at www.sec.gov. The Fund’s Forms N-Q may be reviewed and copied at the SEC’s Public Reference Room in Washington, DC and information on the operation of the Public Reference Room may be obtained by calling 1-800-SEC-0330. Information included in the Fund’s Forms N-Q will also be available upon request by calling 1-800-966-4354.
Federal Tax Distribution Information
(Unaudited)
For fiscal year 2017, certain dividends paid by the Fund may be subject to a maximum tax rate of 23.8%, as provided for by the Jobs and Growth Tax Relief Reconciliation Act of 2003. The percentage of dividends declared from ordinary income designated as qualified dividend income was 100.00%.
For corporate shareholders, the percent of ordinary income distributions that qualified for the corporate dividends received deduction for fiscal year 2017, was 100.00%.
The percentage of taxable ordinary income distributions that were designated as short-term capital gain distributions under Section 871(k)(2)(C) of the Internal Revenue Code of 1986, as amended, for the Fund was 3.73%.
Important Notice Regarding Delivery of
Shareholder Documents
To help keep the Fund’s costs as low as possible, we generally deliver a single copy of shareholder reports, proxy statements, and prospectuses to shareholders who share an address and have the same last name. This process does not apply to account statements. You may request an individual copy of a shareholder document at any time. If you would like to receive separate mailings of shareholder documents, please call U.S. Bancorp Fund Services, LLC at 1-800-261-6950 or 1-414-765-4124, and individual delivery will begin within 30 days of your request. If your account is held through a financial institution or other intermediary, please contact such intermediary directly to request individual delivery.
| HENNESSY FUNDS | 1-800-966-4354 | |
Board Approval of Investment Advisory
Agreement
At its meeting on March 7, 2018, the Board of Trustees of the Fund (the “Board,” and the members thereof, the “Trustees”) unanimously approved the continuation of the investment advisory agreement of the Fund with Hennessy Advisors, Inc. (the “Advisor”). As part of the process of approving the continuation of the advisory agreement, the Trustees reviewed their fiduciary duties with respect to approving the advisory agreement and the relevant factors for them to consider. In addition, the Trustees who are not deemed “interested persons” (as defined by the Investment Company Act of 1940, as amended) of the Fund (the “Independent Trustees”) met in executive session to discuss the approval of the advisory agreement.
In advance of the meeting, the Advisor sent detailed information to the Trustees to assist them in their evaluation of the advisory agreement. This information included, but was not limited to, the following:
| | (1) | A memorandum from outside legal counsel that described the fiduciary duties of the Board with respect to approving the continuation of the advisory agreement and the relevant factors for consideration; |
| | | |
| | (2) | A memorandum from the Advisor that listed the factors relevant to the Board’s approval of the continuation of the advisory agreement and also referenced the documents that had been provided to help the Board assess each such factor; |
| | | |
| | (3) | An inventory of the range of services provided by the Advisor to the Fund; |
| | | |
| | (4) | A written discussion of economies of scale; |
| | | |
| | (5) | The advisory agreement; |
| | | |
| | (6) | A recent Fund fact sheet, which included, among other things, performance information over various periods; |
| | | |
| | (7) | A peer expense comparison of both the net expense ratio and investment advisory fee of the Fund; |
| | | |
| | (8) | The Advisor’s most recent Form 10-K and Form 10-Q, which includes information about the Advisor’s profitability; |
| | | |
| | (9) | Information about brokerage commissions; |
| | | |
| | (10) | Information about the Fund’s compliance program; and |
| | | |
| | (11) | The Advisor’s current Form ADV Part I. |
All of the factors discussed were considered as a whole by the Trustees, and also by the Independent Trustees meeting in executive session. The factors were viewed in their totality by the Trustees, with no single factor being the principal or determinative factor in the Trustees’ determination of whether to approve the continuation of the advisory agreement. The Trustees recognized that the management and fee arrangements for the Fund are the result of years of review and discussion between the Independent Trustees and the Advisor, that certain aspects of such arrangements may receive greater scrutiny in some years than in others, and that the Trustees’ conclusions may be based, in part, on their consideration of these same arrangements and information received during the course of the year and in prior years.
HENNESSYFUNDS.COM
| BOARD APPROVAL OF INVESTMENT ADVISORY AGREEMENT |
Prior to approving the continuation of the advisory agreement, the Trustees, including the Independent Trustees in executive session, considered, among other items:
| | (1) | The nature and quality of the advisory services provided by the Advisor; |
| | | |
| | (2) | A comparison of the fees and expenses of the Fund to other similar funds; |
| | | |
| | (3) | Whether economies of scale are recognized by the Fund; |
| | | |
| | (4) | The costs and profitability of the Fund to the Advisor; |
| | | |
| | (5) | The performance of the Fund; and |
| | | |
| | (6) | Any benefits to the Advisor from serving as an investment advisor to the Fund (other than the advisory fee). |
The material considerations and determinations of the Trustees, including the Independent Trustees, were as follows:
| | (1) | The Trustees considered the services identified below that are provided by the Advisor. Based on this review, the Trustees concluded that the Advisor provides high-quality services to the Fund, and they noted that their overall confidence in the Advisor is high. The Trustees also concluded that they were satisfied with the nature, extent, and quality of the advisory services provided to the Fund by the Advisor, and that the nature and extent of the services provided by the Advisor are appropriate to assure that the Fund’s operations are conducted in compliance with applicable laws, rules, and regulations. |
| | | (a) | The Advisor acts as the portfolio manager for the Fund. In this capacity, the Advisor does the following: |
| | | | (i) | manages the composition of the Fund’s portfolio, including the purchase, retention, and disposition of portfolio securities in accordance with the Fund’s investment objectives, policies, and restrictions; |
| | | | | |
| | | | (ii) | ensures compliance with “best execution” for the Fund’s portfolio; |
| | | | | |
| | | | (iii) | manages the use of soft dollars for the Fund; and |
| | | | | |
| | | | (iv) | manages proxy voting for the Fund. |
| | | (b) | The Advisor performs a daily reconciliation of portfolio positions and cash for the Fund. |
| | | | |
| | | (c) | The Advisor monitors the Fund’s compliance with its investment objectives and restrictions. |
| | | | |
| | | (d) | The Advisor monitors compliance with federal securities laws and performs activities such as maintaining a compliance program, conducting ongoing reviews of the compliance programs of the Fund’s service providers, conducting on-site visits to the Fund’s service providers, monitoring incidents of abusive trading practices, reviewing Fund expense accruals, payments, and fixed expense ratios, evaluating insurance providers for fidelity bond coverage and D&O/E&O insurance coverage, conducting employee compliance training, reviewing reports provided by service providers, maintaining books and records, and preparing an annual compliance report for the Board. |
| | | | |
| | | (e) | The Advisor oversees service providers that provide accounting, administration, distribution, transfer agency, custodial, sales, marketing, public relations, audit, information technology, and legal services to the Fund. |
| HENNESSY FUNDS | 1-800-966-4354 | |
| | | (f) | The Advisor maintains in-house marketing and distribution departments on behalf of the Fund. |
| | | | |
| | | (g) | The Advisor is actively involved with preparing regulatory filings for the Fund, including writing and annually updating the Fund’s prospectus and related documents. |
| | | | |
| | | (h) | The Advisor prepares a written summary of the Fund’s performance for the most recent 12-month period for each annual report of the Fund. |
| | | | |
| | | (i) | The Advisor oversees distribution of the Fund through third-party broker/dealers and independent financial institutions such as Charles Schwab, Inc., Fidelity, TD Waterhouse, and Pershing. The Advisor participates in “no transaction fee” (“NTF”) programs with these companies on behalf of the Fund, which allow customers to purchase the Fund through third-party distribution channels without paying a transaction fee. The Advisor compensates, in part, a number of these third-party providers of NTF programs out of its own revenues. |
| | | | |
| | | (j) | The Advisor pays the incentive compensation of the Fund’s compliance officers and employs other staff, such as legal, marketing, national accounts, distribution, sales, administrative, and trading oversight personnel, as well as management executives. |
| | | | |
| | | (k) | The Advisor provides a quarterly compliance certification to the Board. |
| | | | |
| | | (l) | The Advisor prepares or reviews Board materials, frequently presents to the Board or leads Board discussions, prepares or reviews meeting minutes, and arranges for Board training and education. |
| | (2) | The Trustees compared the performance of the Fund to benchmark indices over various time periods and also noted that the Trustees review and discuss reports comparing the investment performance of the Fund to various indices at each quarterly Board meeting. Based on all such information, the Trustees believe that the Advisor manages the Fund in a manner that is materially consistent with its stated investment objective and style. The Trustees concluded that the performance of the Fund over various time periods warranted the continuation of the advisory agreement. |
| | | |
| | (3) | The Trustees reviewed the advisory fees and overall expense ratios of the Fund compared to other funds similar in asset size and investment objective to the Fund using data from Morningstar. As part of the discussion with management, the Trustees ensured that they understood and were comfortable with the criteria used to determine the mutual funds included in the Morningstar categories for purposes of the materials considered at the meeting. The Trustees determined that the advisory fee and overall expense ratio of the Fund falls within the range of the advisory fees and overall expense ratios of other comparable funds and concluded that they are reasonable and warranted continuation of the advisory agreement. |
| | | |
| | (4) | The Trustees also considered whether economies of scale were being realized by the Advisor that should be shared with the Fund’s shareholders. The Trustees noted that many of the expenses incurred to manage the Fund are asset-based fees and thus do not result in material economies of scale being realized as the assets of the Fund increase. For example, mutual fund platform fees increase as the Fund’s assets grow. The Trustees also considered the Advisor’s efforts to |
HENNESSYFUNDS.COM
| BOARD APPROVAL OF INVESTMENT ADVISORY AGREEMENT |
| | | contain expenses, the Advisor’s significant marketing efforts to promote the Funds, and the Advisor’s agreement to waive fees or lower its management fees in certain circumstances. The Trustees noted that at current asset levels it did not appear that there were economies of scale being realized by the Advisor and concluded that it would continue to monitor economies of scale in the future as circumstances changed. |
| | | |
| | (5) | The Trustees considered the profitability of the Advisor, including the impact of mutual fund platform fees on the Advisor’s profitability, and also considered the resources and revenues that the Advisor has put into managing and distributing the Fund. The Trustees then concluded that the profits of the Advisor are reasonable and not excessive when compared to profitability guidelines set forth in relevant court cases. |
| | | |
| | (6) | The Trustees considered the high level of professionalism and knowledge of the Advisor’s employees, along with a very low level of turnover, and concluded that this was beneficial to the Fund and its shareholders. |
| | | |
| | (7) | The Trustees considered any benefits to the Advisor from serving as an advisor to the Fund (other than the advisory fee). The Trustees noted that the Advisor may derive ancillary benefits from, by way of example, its association with the Fund in the form of proprietary and third-party research products and services received from broker-dealers that execute portfolio trades for the Fund. The Trustees determined that any such products and services have been used for legitimate purposes relating to the Fund by providing assistance in the investment decision-making process. The Trustees concluded that any additional benefits realized by the Advisor from its relationship with the Fund were reasonable. |
After reviewing the materials provided at the meeting and management’s presentation, as well as other information regularly provided at the Board’s quarterly meetings throughout the year regarding the quality of services provided by the Advisor, the performance of the Fund, expense information, regulatory compliance issues, trading information and related matters, and other factors that the Trustees deemed relevant, the Trustees, including the Independent Trustees, approved the continuation of the advisory agreement.
| HENNESSY FUNDS | 1-800-966-4354 | |
For information, questions or assistance, please call
The Hennessy Funds
1-800-966-4354 or 1-415-899-1555
INVESTMENT ADVISOR
Hennessy Advisors, Inc.
7250 Redwood Boulevard, Suite 200
Novato, California 94945
ADMINISTRATOR,
TRANSFER AGENT,
DIVIDEND PAYING AGENT &
SHAREHOLDER SERVICING AGENT
U.S. Bancorp Fund Services, LLC
P.O. Box 701
Milwaukee, Wisconsin 53201-0701
CUSTODIAN
U.S. Bank N.A.
Custody Operations
1555 North River Center Drive, Suite 302
Milwaukee, Wisconsin 53212
TRUSTEES
Neil J. Hennessy
Robert T. Doyle
J. Dennis DeSousa
Gerald P. Richardson
COUNSEL
Foley & Lardner LLP
777 East Wisconsin Avenue
Milwaukee, Wisconsin 53202-5306
INDEPENDENT REGISTERED
PUBLIC ACCOUNTING FIRM
Tait, Weller & Baker LLP
1818 Market Street, Suite 2400
Philadelphia, Pennsylvania 19103
DISTRIBUTOR
Quasar Distributors, LLC
777 East Wisconsin Avenue
Milwaukee, Wisconsin 53202
hennessyfunds.com | 1-800-966-4354
This report has been prepared for shareholders and may be distributed to
others only if preceded or accompanied by a current prospectus.
SEMI-ANNUAL REPORT
APRIL 30, 2018
HENNESSY EQUITY AND
INCOME FUND
Investor Class HEIFX
Institutional Class HEIIX
hennessyfunds.com | 1-800-966-4354
(This Page Intentionally Left Blank.)
Contents
| Letter to Shareholders | 2 |
| Performance Overview | 4 |
| Financial Statements | |
| Schedule of Investments | 5 |
| Statement of Assets and Liabilities | 17 |
| Statement of Operations | 18 |
| Statements of Changes in Net Assets | 19 |
| Financial Highlights | 20 |
| Notes to the Financial Statements | 24 |
| Expense Example | 32 |
| Proxy Voting Policy and Proxy Voting Records | 34 |
| Quarterly Schedule of Investments | 34 |
| Federal Tax Distribution Information | 34 |
| Important Notice Regarding Delivery of Shareholder Documents | 34 |
| Board Approval of Investment Advisory Agreements | 35 |
| HENNESSY FUNDS | 1-800-966-4354 | |
May 2018
Dear Hennessy Funds Shareholder:
Investors in the United States and abroad experienced the return of volatility in the six months ended April 30, 2018, especially during the second half of the period. Equities rallied sharply during the first half of the period and fell back during the second half, but nevertheless ended the period with solid gains, with the Dow Jones Industrial Average posting a total return of 4.5% and the S&P 500 Index up 3.8%. Over the past year, I have repeatedly shared my belief that the stock market was due for a correction, but that it would bounce back, as it has so many times during the current bull market.
In the closing months of 2017 and into January 2018, U.S. equities rallied in response to the enactment of the Tax Cuts and Jobs Act of 2017, which significantly lowered corporate tax rates. Investors were also encouraged by two quarters of real GDP growth of 3.2% and 2.9%. However, equity prices quickly lost ground in reaction to the imposition of trade tariffs on steel and aluminum, and fears that additional proposed tariffs could provoke a trade war with China. Signals from the Federal Reserve that the pace of interest rate increases would move slightly higher also weighed on investors. During the period, the federal funds rate was raised twice, by a quarter point each time, in December 2017 and March 2018.
The current bull market in U.S. equities is now entering its 10th year, and we remain optimistic about the outlook for stock prices. In our opinion, economic fundamentals look positive. The U.S. economy is growing at a solid pace of 2 – 3% annually, inflation is low, and high employment levels are supporting healthy growth in consumption. Wages are rising, but the rate of increase has remained steady at around 2.6% per year since mid-2016. While it appears that the Federal Reserve will continue to raise the federal funds rate and normalize monetary policy, we believe it will be able to do so gradually, avoiding a severe jolt to either financial markets or the economy. Meanwhile, companies continue to report robust earnings growth, boosted this year by lower tax rates.
We believe U.S. equities remain attractively valued. U.S. long bond yields are hovering near 3%, having risen over the period in response to strong economic activity. Prospective PE multiples, however, have dropped significantly since the end of 2017, the result of a combination of lower taxes, higher operating earnings, and lower stock prices. The Dow Jones Industrial Average and the S&P 500 Index are trading at about 17x forward earnings, down from approximately 20x at the beginning of the calendar year, valuations we believe to be very reasonable.
We are not overly concerned about recent protectionist actions by the U.S. administration. We consider the announcements and ongoing discussions regarding import tariffs and NAFTA to be representative of standard Trump deal-making tactics – make far-reaching demands and then negotiate a reasonable outcome that is beneficial to both sides. We expect continued pro-business policies and regulatory relief to be enacted by our leaders in Washington.
Finally, as noted many times in past letters during this bull market, the euphoria that has historically accompanied a peak in the market continues to be absent. Investors today are worried about many things, including higher interest rates, larger budget deficits, higher import tariffs, and political distractions. But they are definitely not euphoric. In the past, I have likened the current bull market to the 1982-2000 bull market, and I continue
HENNESSYFUNDS.COM
to believe the comparison is a good one. We remain confident that the market will be able to weather the current period of volatility and that the economy, despite higher interest rates and possible trade disruptions, is resilient enough to continue its steady growth into the coming year.
Thank you for your continued confidence and investment in the Hennessy Funds. If you have any questions or would like to speak with us directly, please don’t hesitate to call us at (800) 966-4354.
Best regards,
Neil J. Hennessy
President and Chief Investment Officer
Past performance does not guarantee future results.
Mutual fund investing involves risk. Principal loss is possible.
Opinions expressed are those of Neil Hennessy and are subject to change, are not guaranteed, and should not be considered investment advice.
The Dow Jones Industrial Average and S&P 500 Index are unmanaged indices commonly used to measure the performance of U.S. stocks. One cannot invest directly in an index.
Price to earnings (PE) is calculated by dividing a company’s market price per share by its earnings per share. Earnings growth is not a measure of a fund’s future performance.
| HENNESSY FUNDS | 1-800-966-4354 | |
Performance Overview (Unaudited)
AVERAGE ANNUAL TOTAL RETURN FOR PERIODS ENDED APRIL 30, 2018
| | Six | One | Five | Ten |
| | Months(1) | Year | Years | Years |
| Hennessy Equity and Income Fund – | | | | |
| Investor Class (HEIFX) | 1.26% | 6.19% | 6.17% | 6.50% |
| Hennessy Equity and Income Fund – | | | | |
| Institutional Class (HEIIX) | 1.46% | 6.63% | 6.53% | 6.81% |
| Blended Balanced Index | 1.67% | 7.53% | 8.17% | 6.84% |
| S&P 500 Index | 3.82% | 13.27% | 12.96% | 9.02% |
Expense ratios: 1.48% (Investor Class); 1.10% (Institutional Class)
(1) | Periods less than one year are not annualized. |
___________________
Performance data quoted represents past performance; past performance does not guarantee future results. The investment return and principal value of an investment will fluctuate so that an investor’s shares, when redeemed, may be worth more or less than their original cost. The performance table does not reflect the deduction of taxes that a shareholder would pay on Fund distributions or the redemption of Fund shares. Current performance of the Fund may be lower or higher than the performance quoted. Performance data current to the most recent month end may be obtained by visiting hennessyfunds.com. Performance for the period from March 12, 2010, to October 26, 2012, is that of the FBR Balanced Fund and for the periods prior to March 12, 2010, is that of the AFBA 5 Star Balanced Fund.
The Blended Balanced Index consists of 60% common stocks represented by the S&P 500 Index and 40% bonds represented by the Bloomberg Barclays Capital Intermediate U.S. Government/Credit Index. The S&P 500 Index is an unmanaged index commonly used to measure the performance of U.S. stocks. The Bloomberg Barclays Capital Intermediate U.S. Government/Credit Index is an unmanaged index commonly used to measure the performance of U.S. bonds. One cannot invest directly in an index.
The expense ratios presented are from the most recent prospectus. The expense ratios for the current reporting period are available in the Financial Highlights section of this report.
HENNESSYFUNDS.COM
| PERFORMANCE OVERVIEW/SCHEDULE OF INVESTMENTS |
Financial Statements
Schedule of Investments as of April 30, 2018 (Unaudited) |
HENNESSY EQUITY AND INCOME FUND
(% of Net Assets)
| TOP TEN HOLDINGS (EXCLUDING CASH/CASH EQUIVALENTS) | % NET ASSETS |
| Berkshire Hathaway, Inc., Class B | 4.35% |
| The Progressive Corp. | 3.19% |
| Apple, Inc. | 3.09% |
| Alphabet, Inc., Class C | 2.96% |
| Visa, Inc., Class A | 2.92% |
| Dollar Tree, Inc. | 2.81% |
| Carnival Corp. | 2.71% |
| BlackRock, Inc. | 2.64% |
| Norfolk Southern Corp. | 2.36% |
| CarMax, Inc. | 2.22% |
Note: For presentation purposes, the Fund has grouped some of the industry categories. For purposes of categorizing securities for compliance with section 8(b)(1) of the Investment Company Act of 1940, as amended, the Fund uses more specific industry classifications.
The Global Industry Classification Standard (GICS®) was developed by and is the exclusive property and a service mark of MSCI, Inc. and Standard & Poor Financial Services LLC. It has been licensed for use by the Hennessy Funds.
| HENNESSY FUNDS | 1-800-966-4354 | |
| COMMON STOCKS –58.85% | | Number | | | | | | % of | |
| | | of Shares | | | Value | | | Net Assets | |
| Consumer Discretionary – 13.94% | | | | | | | | | |
| CarMax, Inc. (a) | | | 84,812 | | | $ | 5,300,750 | | | | 2.22 | % |
| Carnival Corp. (b) | | | 102,696 | | | | 6,476,010 | | | | 2.71 | % |
| Dollar Tree, Inc. (a) | | | 70,197 | | | | 6,731,190 | | | | 2.81 | % |
| Home Depot, Inc. | | | 25,460 | | | | 4,705,008 | | | | 1.97 | % |
| Lowe’s Companies, Inc. | | | 23,678 | | | | 1,951,778 | | | | 0.81 | % |
| NIKE, Inc., Class B | | | 68,116 | | | | 4,658,453 | | | | 1.95 | % |
| O’Reilly Automotive, Inc. (a) | | | 13,731 | | | | 3,516,097 | | | | 1.47 | % |
| | | | | | | | 33,339,286 | | | | 13.94 | % |
| | | | | | | | | | | | | |
| Consumer Staples – 2.79% | | | | | | | | | | | | |
| Altria Group, Inc. | | | 73,722 | | | | 4,136,542 | | | | 1.73 | % |
| The Coca-Cola Co. | | | 58,402 | | | | 2,523,550 | | | | 1.06 | % |
| | | | | | | | 6,660,092 | | | | 2.79 | % |
| | | | | | | | | | | | | |
| Energy – 1.43% | | | | | | | | | | | | |
| Chevron Corp. | | | 27,328 | | | | 3,419,006 | | | | 1.43 | % |
| | | | | | | | | | | | | |
| Financials – 15.04% | | | | | | | | | | | | |
| Alleghany Corp. | | | 7,711 | | | | 4,431,280 | | | | 1.85 | % |
| Bank of America Corp. | | | 87,139 | | | | 2,607,199 | | | | 1.09 | % |
| Berkshire Hathaway, Inc., Class B (a) | | | 53,661 | | | | 10,395,746 | | | | 4.35 | % |
| BlackRock, Inc. | | | 12,090 | | | | 6,304,935 | | | | 2.64 | % |
| The Progressive Corp. | | | 126,697 | | | | 7,638,562 | | | | 3.19 | % |
| Wells Fargo & Co. | | | 88,376 | | | | 4,592,017 | | | | 1.92 | % |
| | | | | | | | 35,969,739 | | | | 15.04 | % |
| | | | | | | | | | | | | |
| Health Care – 2.77% | | | | | | | | | | | | |
| Alexion Pharmaceuticals, Inc. (a) | | | 33,305 | | | | 3,917,667 | | | | 1.64 | % |
| Bristol-Myers Squibb Co. | | | 51,758 | | | | 2,698,145 | | | | 1.13 | % |
| | | | | | | | 6,615,812 | | | | 2.77 | % |
| | | | | | | | | | | | | |
| Industrials – 8.54% | | | | | | | | | | | | |
| Deere & Co. | | | 27,353 | | | | 3,701,681 | | | | 1.55 | % |
| FedEx Corp. | | | 14,098 | | | | 3,485,026 | | | | 1.46 | % |
| General Dynamics Corp. | | | 24,976 | | | | 5,027,919 | | | | 2.10 | % |
| Norfolk Southern Corp. | | | 39,287 | | | | 5,636,506 | | | | 2.36 | % |
| Southwest Airlines Co. | | | 48,591 | | | | 2,567,062 | | | | 1.07 | % |
| | | | | | | | 20,418,194 | | | | 8.54 | % |
The accompanying notes are an integral part of these financial statements.
HENNESSYFUNDS.COM
| COMMON STOCKS | | Number | | | | | | % of | |
| | | of Shares | | | Value | | | Net Assets | |
| Information Technology – 10.84% | | | | | | | | | |
| Alphabet, Inc., Class C (a) | | | 6,962 | | | $ | 7,082,651 | | | | 2.96 | % |
| Apple, Inc. | | | 44,622 | | | | 7,374,232 | | | | 3.09 | % |
| Cisco Systems, Inc. | | | 100,967 | | | | 4,471,828 | | | | 1.87 | % |
| Visa, Inc., Class A | | | 55,037 | | | | 6,983,095 | | | | 2.92 | % |
| | | | | | | | 25,911,806 | | | | 10.84 | % |
| | | | | | | | | | | | | |
| Materials – 2.58% | | | | | | | | | | | | |
| Albemarle Corp. | | | 22,640 | | | | 2,195,175 | | | | 0.92 | % |
| NewMarket Corp. | | | 10,448 | | | | 3,965,538 | | | | 1.66 | % |
| | | | | | | | 6,160,713 | | | | 2.58 | % |
| | | | | | | | | | | | | |
| Telecommunication Services – 0.92% | | | | | | | | | | | | |
| Verizon Communications, Inc. | | | 44,806 | | | | 2,211,176 | | | | 0.92 | % |
| | | | | | | | | | | | | |
| Total Common Stocks | | | | | | | | | | | | |
| (Cost $110,995,304) | | | | | | | 140,705,824 | | | | 58.85 | % |
| | | | | | | | | | | | | |
| PREFERRED STOCKS – 1.96% | | | | | | | | | | | | |
| | | | | | | | | | | | | |
| Consumer Staples – 0.09% | | | | | | | | | | | | |
| CHS, Inc., Series 4, 7.500%, Perpetual | | | 7,380 | | | | 203,393 | | | | 0.09 | % |
| | | | | | | | | | | | | |
| Energy – 0.05% | | | | | | | | | | | | |
| Enbridge, Inc., Series B, 6.375% to 04/15/2023, 3.593% to | | | | | | | | | | | | |
| 04/15/2028, 3.843% to 04/15/2043 then 3 Month | | | | | | | | | | | | |
| LIBOR USD + 4.593%, 04/15/2078 (a)(b)(f) | | | 5,095 | | | | 128,649 | | | | 0.05 | % |
| | | | | | | | | | | | | |
| Financials – 1.70% | | | | | | | | | | | | |
| Aegon N.V., 6.375%, Perpetual (b) | | | 4,050 | | | | 104,045 | | | | 0.04 | % |
| Arch Capital Group Ltd., Series F, 5.450%, Perpetual (b) | | | 5,200 | | | | 125,476 | | | | 0.05 | % |
| Axis Capital Holdings Ltd., Series E, 5.500%, Perpetual (b) | | | 2,700 | | | | 65,448 | | | | 0.03 | % |
| Banc of California, Inc., Series E, 7.000%, Perpetual | | | 4,065 | | | | 103,332 | | | | 0.04 | % |
| Bank of America Corp. | | | | | | | | | | | | |
| Series EE, 6.000%, Perpetual | | | 3,710 | | | | 95,607 | | | | 0.04 | % |
| Series CC, 6.200%, Perpetual | | | 2,440 | | | | 63,099 | | | | 0.03 | % |
| BB&T Corp. | | | | | | | | | | | | |
| 5.625%, Perpetual | | | 4,575 | | | | 117,989 | | | | 0.05 | % |
| Series F, 5.200%, Perpetual | | | 4,800 | | | | 120,624 | | | | 0.05 | % |
| Capital One Financial Corp. | | | | | | | | | | | | |
| Series F, 6.200%, Perpetual | | | 4,610 | | | | 120,828 | | | | 0.05 | % |
| Series H, 6.000%, Perpetual | | | 4,675 | | | | 120,896 | | | | 0.05 | % |
The accompanying notes are an integral part of these financial statements.
| HENNESSY FUNDS | 1-800-966-4354 | |
| PREFERRED STOCKS | | Number | | | | | | % of | |
| | | of Shares | | | Value | | | Net Assets | |
| Financials (Continued) | | | | | | | | | |
| Citigroup, Inc. | | | | | | | | | |
| Series C, 5.800%, Perpetual | | | 3,935 | | | $ | 99,241 | | | | 0.04 | % |
| Series S, 6.300%, Perpetual | | | 3,855 | | | | 101,232 | | | | 0.04 | % |
| Fannie Mae Preferred, Series S, 8.250%, Perpetual (a) | | | 7,000 | | | | 44,800 | | | | 0.02 | % |
| Fifth Third Bancorp, Series I, 6.625% to 12/31/2023 | | | | | | | | | | | | |
| then 3 Month LIBOR USD+ 3.710%, Perpetual (f) | | | 1,300 | | | | 36,894 | | | | 0.02 | % |
| First Republic Bank | | | | | | | | | | | | |
| Series F, 5.700%, Perpetual | | | 3,465 | | | | 88,566 | | | | 0.04 | % |
| Series G, 5.500%, Perpetual | | | 3,610 | | | | 91,008 | | | | 0.04 | % |
| Huntington Bancshares, Inc., Series D, 6.250%, Perpetual | | | 6,290 | | | | 164,672 | | | | 0.07 | % |
| IBERIABANK Corp., Series B, 6.625% to 08/01/2025 then | | | | | | | | | | | | |
| 3 Month LIBOR USD + 4.262%, Perpetual (f) | | | 1,920 | | | | 52,224 | | | | 0.02 | % |
| ING Groep N.V., 6.125%, Perpetual (b) | | | 2,055 | | | | 52,135 | | | | 0.02 | % |
| JPMorgan Chase & Co., Series BB, 6.150%, Perpetual | | | 9,030 | | | | 236,857 | | | | 0.10 | % |
| KeyCorp, Series E, 6.125% to 12/15/2026 then | | | | | | | | | | | | |
| 3 Month LIBOR USD + 3.892%, Perpetual (f) | | | 4,520 | | | | 122,628 | | | | 0.05 | % |
| Legg Mason, Inc. | | | | | | | | | | | | |
| 5.450%, 09/15/2056 | | | 2,295 | | | | 54,896 | | | | 0.02 | % |
| 6.375%, 03/15/2056 | | | 2,051 | | | | 53,203 | | | | 0.02 | % |
| Morgan Stanley, Series I, 6.375% to 10/15/2024 then | | | | | | | | | | | | |
| 3 Month LIBOR USD + 3.708%, Perpetual (f) | | | 7,585 | | | | 202,823 | | | | 0.09 | % |
| National General Holdings Corp., Series C, 7.500%, Perpetual | | | 2,795 | | | | 69,651 | | | | 0.03 | % |
| Regions Financial Corp., Series B, 6.375% to 09/15/2024 then | | | | | | | | | | | | |
| 3 Month LIBOR USD +3.536%, Perpetual (f) | | | 4,355 | | | | 120,111 | | | | 0.05 | % |
| State Street Corp | | | | | | | | | | | | |
| Series D, 5.900% to 03/15/2024 then 3 Month | | | | | | | | | | | | |
| LIBOR USD + 3.108%, Perpetual (f) | | | 4,465 | | | | 117,831 | | | | 0.05 | % |
| Series E, 6.000%, Perpetual | | | 4,585 | | | | 119,439 | | | | 0.05 | % |
| TCF Financial Corp., Series C, 5.700%, Perpetual | | | 2,220 | | | | 55,100 | | | | 0.02 | % |
| The Allstate Corp. | | | | | | | | | | | | |
| Series E, 6.625%, Perpetual | | | 4,120 | | | | 107,367 | | | | 0.05 | % |
| Series G, 5.625%, Perpetual (a) | | | 5,700 | | | | 142,899 | | | | 0.06 | % |
| The Charles Schwab Corp. | | | | | | | | | | | | |
| Series C, 6.000%, Perpetual | | | 4,575 | | | | 118,904 | | | | 0.05 | % |
| Series D, 5.950%, Perpetual | | | 4,625 | | | | 120,296 | | | | 0.05 | % |
| The Goldman Sachs Group, Inc. | | | | | | | | | | | | |
| Series K, 6.375% to 05/10/2024 then 3 Month | | | | | | | | | | | | |
| LIBOR USD + 3.550%, Perpetual (f) | | | 2,715 | | | | 75,151 | | | | 0.03 | % |
| Series N, 6.300%, Perpetual | | | 2,755 | | | | 72,016 | | | | 0.03 | % |
| U.S. Bancorp, Series F, 6.500% to 01/15/2022 then | | | | | | | | | | | | |
| 3 Month LIBOR USD + 4.447%, Perpetual (d)(f) | | | 3,240 | | | | 89,424 | | | | 0.04 | % |
The accompanying notes are an integral part of these financial statements.
HENNESSYFUNDS.COM
| PREFERRED STOCKS | | Number | | | | | | % of | |
| | | of Shares | | | Value | | | Net Assets | |
| Financials (Continued) | | | | | | | | | |
| Validus Holdings Ltd., Series A, 5.875%, Perpetual (b) | | | 5,700 | | | $ | 142,500 | | | | 0.06 | % |
| Webster Financial Corp., Series F, 5.250%, Perpetual | | | 1,075 | | | | 25,424 | | | | 0.01 | % |
| Wells Fargo & Co. | | | | | | | | | | | | |
| Series V, 6.000%, Perpetual | | | 4,610 | | | | 118,800 | | | | 0.05 | % |
| Series X, 5.500%, Perpetual | | | 5,045 | | | | 124,763 | | | | 0.05 | % |
| | | | | | | | 4,058,199 | | | | 1.70 | % |
| | | | | | | | | | | | | |
| Telecommunication Services – 0.05% | | | | | | | | | | | | |
| AT&T, Inc., 5.350%, 11/01/2066 | | | 5,300 | | | | 130,274 | | | | 0.05 | % |
| | | | | | | | | | | | | |
| Utilities – 0.07% | | | | | | | | | | | | |
| DTE Energy Co., Series F, 6.000%, 12/15/2076 | | | 2,605 | | | | 67,678 | | | | 0.03 | % |
| The Southern Co., 6.250%, 10/15/2075 | | | 4,025 | | | | 104,247 | | | | 0.04 | % |
| | | | | | | | 171,925 | | | | 0.07 | % |
| Total Preferred Stocks | | | | | | | | | | | | |
| (Cost $4,812,365) | | | | | | | 4,692,440 | | | | 1.96 | % |
| | | | | | | | | | | | | |
| REITS – 0.62% | | | | | | | | | | | | |
| | | | | | | | | | | | | |
| Financials – 0.62% | | | | | | | | | | | | |
| Annaly Capital Management, Inc., Series F, 6.950% to 09/30/2022 | | | | | | | | | | | | |
| then 3 Month LIBOR USD + 4.993%, Perpetual (f) | | | 5,050 | | | | 127,209 | | | | 0.05 | % |
| Apollo Commercial Real Estate Finance, Inc. | | | 7,975 | | | | 143,709 | | | | 0.06 | % |
| Chimera Investment Corp. | | | 8,250 | | | | 144,293 | | | | 0.06 | % |
| Chimera Investment Corp. | | | | | | | | | | | | |
| Series A, 8.000%, Perpetual | | | 4,925 | | | | 124,356 | | | | 0.05 | % |
| Series B, 8.000% to 03/30/2024 then 3 Month | | | | | | | | | | | | |
| LIBOR USD + 5.791%, Perpetual (f) | | | 2,665 | | | | 67,425 | | | | 0.03 | % |
| Invesco Mortgage Capital, Inc., Series C, 7.500% to | | | | | | | | | | | | |
| 09/27/2027 then 3 Month LIBOR USD + 5.289%, Perpetual (f) | | | 5,150 | | | | 123,343 | | | | 0.05 | % |
| Monmouth Real Estate Investment Corp., Series C, 6.125%, Perpetual | | | 4,505 | | | | 108,075 | | | | 0.05 | % |
| Public Storage, Series B, 5.400%, Perpetual | | | 3,275 | | | | 81,220 | | | | 0.03 | % |
| Starwood Property Trust, Inc. | | | 6,925 | | | | 145,148 | | | | 0.06 | % |
| Two Harbors Investment Corp. | | | 9,400 | | | | 143,444 | | | | 0.06 | % |
| Two Harbors Investment Corp., Series B, 7.625% to 07/27/2027 | | | | | | | | | | | | |
| then 3 Month LIBOR USD + 5.352%, Perpetual (f) | | | 8,105 | | | | 202,625 | | | | 0.09 | % |
| Vornado Realty Trust, Series M, 5.250%, Perpetual | | | 3,495 | | | | 76,086 | | | | 0.03 | % |
| | | | | | | | 1,486,933 | | | | 0.62 | % |
| Total REITS | | | | | | | | | | | | |
| (Cost $1,516,325) | | | | | | | 1,486,933 | | | | 0.62 | % |
The accompanying notes are an integral part of these financial statements.
| HENNESSY FUNDS | 1-800-966-4354 | |
| CORPORATE BONDS – 24.96% | | Par | | | | | | % of | |
| | | Amount | | | Value | | | Net Assets | |
| Consumer Discretionary – 0.50% | | | | | | | | | |
| Ford Motor Co., 7.450%, 07/16/2031 | | | 1,000,000 | | | $ | 1,186,429 | | | | 0.50 | % |
| | | | | | | | | | | | | |
| Consumer Staples – 0.57% | | | | | | | | | | | | |
| CVS Health Corp., 4.125%, 05/15/2021 | | | 1,000,000 | | | | 1,022,167 | | | | 0.43 | % |
| Wal-Mart Stores, Inc., 5.000%, 10/25/2040 | | | 300,000 | | | | 345,553 | | | | 0.14 | % |
| | | | | | | | 1,367,720 | | | | 0.57 | % |
| | | | | | | | | | | | | |
| Energy – 2.37% | | | | | | | | | | | | |
| Boardwalk Pipelines LP, 4.450%, 07/15/2027 | | | 1,200,000 | | | | 1,172,779 | | | | 0.49 | % |
| Canadian Natural Resources Ltd., 3.900%, 02/01/2025 (b) | | | 1,000,000 | | | | 987,663 | | | | 0.41 | % |
| Encana Corp., 3.900%, 11/15/2021 (b) | | | 1,600,000 | | | | 1,612,854 | | | | 0.67 | % |
| Husky Energy, Inc., 4.000%, 04/15/2024 (b) | | | 750,000 | | | | 753,262 | | | | 0.32 | % |
| National Oilwell Varco, Inc., 2.600%, 12/01/2022 | | | 1,200,000 | | | | 1,144,831 | | | | 0.48 | % |
| | | | | | | | 5,671,389 | | | | 2.37 | % |
| | | | | | | | | | | | | |
| Financials – 12.94% | | | | | | | | | | | | |
| American International Group, Inc. | | | | | | | | | | | | |
| 4.125%, 02/15/2024 | | | 1,000,000 | | | | 1,008,269 | | | | 0.42 | % |
| 4.875%, 06/01/2022 | | | 1,000,000 | | | | 1,047,866 | | | | 0.44 | % |
| Associates Corporation of North America, 6.950%, 11/01/2018 | | | 300,000 | | | | 306,557 | | | | 0.13 | % |
| BB&T Corp., 2.300%, 10/15/2018 | | | 1,000,000 | | | | 999,182 | | | | 0.42 | % |
| Boston Properties, Inc., 5.875%, 10/15/2019 | | | 700,000 | | | | 725,953 | | | | 0.30 | % |
| Capital One Financial Corp., 4.750%, 07/15/2021 | | | 1,500,000 | | | | 1,559,781 | | | | 0.65 | % |
| Capital One NA, 2.250%, 09/13/2021 | | | 500,000 | | | | 480,507 | | | | 0.20 | % |
| Comerica, Inc., 2.125%, 05/23/2019 | | | 500,000 | | | | 497,100 | | | | 0.21 | % |
| Diamond 1 Finance Corp. / Diamond 2 Finance Corp., | | | | | | | | | | | | |
| 5.450%, 06/15/2023 (e) | | | 1,220,000 | | | | 1,284,581 | | | | 0.54 | % |
| Discover Financial Services, 5.200%, 04/27/2022 | | | 900,000 | | | | 939,241 | | | | 0.39 | % |
| First Niagara Financial Group, Inc., 6.750%, 03/19/2020 | | | 590,000 | | | | 626,868 | | | | 0.26 | % |
| Fifth Third Bancorp, 2.375%, 04/25/2019 | | | 1,775,000 | | | | 1,771,387 | | | | 0.74 | % |
| General Electric Capital Corp., 6.000%, 08/07/2019 | | | 610,000 | | | | 633,312 | | | | 0.27 | % |
| JPMorgan Chase & Co., 2.700%, 05/18/2023 | | | 1,000,000 | | | | 959,052 | | | | 0.40 | % |
| KeyCorp | | | | | | | | | | | | |
| 5.100%, 03/24/2021 | | | 950,000 | | | | 997,560 | | | | 0.42 | % |
| 2.300%, 12/13/2018 | | | 2,600,000 | | | | 2,597,105 | | | | 1.08 | % |
| Lincoln National Corp., 6.250%, 02/15/2020 | | | 780,000 | | | | 820,526 | | | | 0.34 | % |
| Morgan Stanley, 5.500%, 07/28/2021 | | | 2,333,000 | | | | 2,481,168 | | | | 1.04 | % |
| Prudential Financial, Inc., 3.878%, 03/27/2028 | | | 400,000 | | | | 398,653 | | | | 0.17 | % |
| Qwest Capital Funding, Inc., 6.500%, 11/15/2018 | | | 700,000 | | | | 714,000 | | | | 0.30 | % |
The accompanying notes are an integral part of these financial statements.
HENNESSYFUNDS.COM
| CORPORATE BONDS | | Par | | | | | | % of | |
| | | Amount | | | Value | | | Net Assets | |
| Financials (Continued) | | | | | | | | | |
| Raymond James Financial, Inc. | | | | | | | | | |
| 3.625%, 09/15/2026 | | | 1,500,000 | | | $ | 1,454,904 | | | | 0.61 | % |
| 5.625%, 04/01/2024 | | | 700,000 | | | | 764,615 | | | | 0.32 | % |
| Synchrony Financial, 3.750%, 08/15/2021 | | | 1,200,000 | | | | 1,205,887 | | | | 0.51 | % |
| Synovus Financial Corp., 3.125%, 11/01/2022 | | | 1,300,000 | | | | 1,247,155 | | | | 0.52 | % |
| The Goldman Sachs Group, Inc. | | | | | | | | | | | | |
| 5.375%, 03/15/2020 | | | 1,100,000 | | | | 1,146,556 | | | | 0.48 | % |
| 6.000%, 06/15/2020 | | | 1,500,000 | | | | 1,586,962 | | | | 0.66 | % |
| The Toronto-Dominion Bank, 2.125%, 07/02/2019 (b) | | | 1,500,000 | | | | 1,490,698 | | | | 0.62 | % |
| Westpac Banking Corp., 4.875%, 11/19/2019 (b) | | | 450,000 | | | | 463,073 | | | | 0.19 | % |
| Willis North America, Inc., 3.600%, 05/15/2024 | | | 750,000 | | | | 728,242 | | | | 0.31 | % |
| | | | | | | | 30,936,760 | | | | 12.94 | % |
| | | | | | | | | | | | | |
| Health Care – 2.78% | | | | | | | | | | | | |
| Agilent Technologies, Inc., 5.000%, 07/15/2020 | | | 650,000 | | | | 676,166 | | | | 0.28 | % |
| Amgen, Inc. | | | | | | | | | | | | |
| 3.450%, 10/01/2020 | | | 1,000,000 | | | | 1,010,319 | | | | 0.42 | % |
| 3.625%, 05/22/2024 | | | 1,500,000 | | | | 1,496,800 | | | | 0.63 | % |
| Celgene Corp., 3.625%, 05/15/2024 | | | 1,600,000 | | | | 1,566,603 | | | | 0.65 | % |
| Express Scripts Holding Co., 3.500%, 06/15/2024 | | | 700,000 | | | | 671,527 | | | | 0.28 | % |
| Zoetis, Inc., 3.250%, 02/01/2023 | | | 1,250,000 | | | | 1,233,626 | | | | 0.52 | % |
| | | | | | | | 6,655,041 | | | | 2.78 | % |
| | | | | | | | | | | | | |
| Industrials – 0.42% | | | | | | | | | | | | |
| Rio Tinto Finance USA Ltd., 3.750%, 06/15/2025 (b) | | | 1,000,000 | | | | 1,010,251 | | | | 0.42 | % |
| | | | | | | | | | | | | |
| Information Technology – 1.32% | | | | | | | | | | | | |
| Alibaba Group Holding Ltd, 3.600%, 11/28/2024 (b) | | | 1,000,000 | | | | 984,250 | | | | 0.41 | % |
| Apple, Inc., 4.500%, 02/23/2036 | | | 250,000 | | | | 268,184 | | | | 0.11 | % |
| Corning, Inc. | | | | | | | | | | | | |
| 6.625%, 05/15/2019 | | | 695,000 | | | | 721,492 | | | | 0.30 | % |
| 6.850%, 03/01/2029 | | | 275,000 | | | | 335,713 | | | | 0.14 | % |
| Juniper Networks, Inc., 4.600%, 03/15/2021 | | | 600,000 | | | | 613,397 | | | | 0.26 | % |
| Oracle Corp., 2.650%, 07/15/2026 | | | 250,000 | | | | 231,416 | | | | 0.10 | % |
| | | | | | | | 3,154,452 | | | | 1.32 | % |
| | | | | | | | | | | | | |
| Materials – 1.59% | | | | | | | | | | | | |
| AngloGold Ashanti Holdings PLC, 5.125%, 08/01/2022 (b) | | | 1,000,000 | | | | 1,026,433 | | | | 0.43 | % |
| Goldcorp, Inc., 3.625%, 06/09/2021 (b) | | | 750,000 | | | | 750,712 | | | | 0.31 | % |
| Newmont Mining Corp., 3.500%, 03/15/2022 | | | 1,000,000 | | | | 996,095 | | | | 0.42 | % |
| The Dow Chemical Co., 4.250%, 11/15/2020 | | | 1,000,000 | | | | 1,024,639 | | | | 0.43 | % |
| | | | | | | | 3,797,879 | | | | 1.59 | % |
The accompanying notes are an integral part of these financial statements.
| HENNESSY FUNDS | 1-800-966-4354 | |
| CORPORATE BONDS | | Par | | | | | | % of | |
| | | Amount | | | Value | | | Net Assets | |
| Retail Trade – 0.44% | | | | | | | | | |
| Macy’s Retail Holdings, Inc. | | | | | | | | | |
| 4.375%, 09/01/2023 | | | 900,000 | | | $ | 897,539 | | | | 0.38 | % |
| 4.500%, 12/15/2034 | | | 175,000 | | | | 149,198 | | | | 0.06 | % |
| | | | | | | | 1,046,737 | | | | 0.44 | % |
| | | | | | | | | | | | | |
| Telecommunication Services – 2.03% | | | | | | | | | | | | |
| AT&T, Inc. | | | | | | | | | | | | |
| 3.000%, 02/15/2022 | | | 500,000 | | | | 492,298 | | | | 0.21 | % |
| 4.250%, 03/01/2027 | | | 980,000 | | | | 974,653 | | | | 0.41 | % |
| 5.350%, 09/01/2040 | | | 200,000 | | | | 204,860 | | | | 0.08 | % |
| 5.800%, 02/15/2019 | | | 800,000 | | | | 818,551 | | | | 0.34 | % |
| Deutsche Telekom AG, 6.000%, 07/08/2019 (b) | | | 1,160,000 | | | | 1,202,721 | | | | 0.51 | % |
| Verizon Communications, Inc., 2.450%, 11/01/2022 | | | 1,200,000 | | | | 1,149,105 | | | | 0.48 | % |
| | | | | | | | 4,842,188 | | | | 2.03 | % |
| Total Corporate Bonds | | | | | | | | | | | | |
| (Cost $60,075,795) | | | | | | | 59,668,846 | | | | 24.96 | % |
| | | | | | | | | | | | | |
| MORTGAGE BACKED SECURITIES – 4.70% | | | | | | | | | | | | |
| Fannie Mae Pool | | | | | | | | | | | | |
| 3.000%, 10/01/2043 | | | 2,739,050 | | | | 2,665,982 | | | | 1.12 | % |
| 3.500%, 01/01/2042 | | | 531,538 | | | | 531,857 | | | | 0.22 | % |
| 4.000%, 10/01/2041 | | | 641,926 | | | | 659,067 | | | | 0.28 | % |
| 4.000%, 12/01/2041 | | | 544,008 | | | | 558,529 | | | | 0.23 | % |
| 4.500%, 08/01/2020 | | | 25,036 | | | | 25,348 | | | | 0.01 | % |
| 6.000%, 10/01/2037 | | | 130,618 | | | | 145,615 | | | | 0.06 | % |
| Fannie Mae REMICS | | | | | | | | | | | | |
| Series 13-52, 1.250%, 06/25/2043 | | | 174,044 | | | | 157,002 | | | | 0.07 | % |
| Series 12-22, 2.000%, 11/25/2040 | | | 150,207 | | | | 144,702 | | | | 0.06 | % |
| Series 12-16, 2.000%, 11/25/2041 | | | 129,231 | | | | 122,137 | | | | 0.05 | % |
| Series 10-134, 2.250%, 03/25/2039 | | | 121,269 | | | | 118,972 | | | | 0.05 | % |
| Freddie Mac Gold Pool | | | | | | | | | | | | |
| 3.000%, 05/01/2042 | | | 940,420 | | | | 915,836 | | | | 0.38 | % |
| 3.000%, 09/01/2042 | | | 1,863,152 | | | | 1,814,596 | | | | 0.76 | % |
| 3.500%, 01/01/2048 | | | 1,779,219 | | | | 1,768,917 | | | | 0.74 | % |
| 5.000%, 05/01/2020 | | | 22,217 | | | | 22,410 | | | | 0.01 | % |
| 5.500%, 04/01/2037 | | | 80,525 | | | | 89,175 | | | | 0.04 | % |
| Freddie Mac REMICS | | | | | | | | | | | | |
| Series 4146, 1.500%, 10/15/2042 | | | 111,093 | | | | 107,089 | | | | 0.05 | % |
| Series 4309, 2.000%, 10/15/2043 | | | 106,304 | | | | 100,892 | | | | 0.04 | % |
| Series 3928, 2.500%, 08/15/2040 | | | 314,235 | | | | 307,304 | | | | 0.13 | % |
| Series 3870, 2.750%, 01/15/2041 | | | 82,948 | | | | 80,712 | | | | 0.03 | % |
| Series 4016, 3.000%, 09/15/2039 | | | 325,768 | | | | 321,384 | | | | 0.13 | % |
| Series 4322, 3.000%, 05/15/2043 | | | 321,589 | | | | 319,118 | | | | 0.13 | % |
| Government National Mortgage Association, 1.750%, 02/16/2043 | | | 272,516 | | | | 256,550 | | | | 0.11 | % |
| | | | | | | | | | | | | |
| Total Mortgage Backed Securities | | | | | | | | | | | | |
| (Cost $11,503,876) | | | | | | | 11,233,194 | | | | 4.70 | % |
The accompanying notes are an integral part of these financial statements.
HENNESSYFUNDS.COM
| U.S. TREASURY OBLIGATIONS – 3.41% | | Par | | | | | | % of | |
| | | Amount | | | Value | | | Net Assets | |
| U.S. Treasury Bonds – 0.41% | | | | | | | | | |
| U.S. Treasury Bonds, 3.625%, 02/15/2044 | | | 900,000 | | | $ | 986,308 | | | | 0.41 | % |
| | | | | | | | | | | | | |
| U.S. Treasury Notes – 3.00% | | | | | | | | | | | | |
| U.S. Treasury Notes | | | | | | | | | | | | |
| 1.500%, 08/31/2018 | | | 2,250,000 | | | | 2,246,704 | | | | 0.94 | % |
| 2.250%, 02/15/2027 | | | 1,470,000 | | | | 1,392,423 | | | | 0.58 | % |
| 2.625%, 11/15/2020 | | | 1,250,000 | | | | 1,251,343 | | | | 0.52 | % |
| 3.625%, 08/15/2019 | | | 2,250,000 | | | | 2,285,288 | | | | 0.96 | % |
| | | | | | | | 7,175,758 | | | | 3.00 | % |
| Total U.S. Treasury Obligations | | | | | | | | | | | | |
| (Cost $8,303,118) | | | | | | | 8,162,066 | | | | 3.41 | % |
| | | | | | | | | | | | | |
| U.S. GOVERNMENT AGENCY ISSUES – 2.61% | | | | | | | | | | | | |
| Fannie Mae | | | | | | | | | | | | |
| 1.500%, 08/10/2021 | | | 1,000,000 | | | | 957,167 | | | | 0.40 | % |
| 1.500%, 04/18/2028 (g) | | | 1,000,000 | | | | 988,370 | | | | 0.41 | % |
| 2.500%, 03/30/2026 (g) | | | 1,200,000 | | | | 1,195,969 | | | | 0.50 | % |
| Federal Home Loan Banks | | | | | | | | | | | | |
| 1.250%, 10/17/2031 (g) | | | 1,250,000 | | | | 1,188,186 | | | | 0.50 | % |
| 2.750%, 07/11/2031 | | | 800,000 | | | | 731,398 | | | | 0.31 | % |
| Freddie Mac | | | | | | | | | | | | |
| 2.000%, 10/27/2023 | | | 1,200,000 | | | | 1,174,865 | | | | 0.49 | % |
| | | | | | | | | | | | | |
| Total U.S. Government Agency Issues | | | | | | | | | | | | |
| (Cost $6,397,845) | | | | | | | 6,235,955 | | | | 2.61 | % |
| | | | | | | | | | | | | |
| INVESTMENT COMPANIES (EXCLUDING | | | | | | | | | | | | |
| MONEY MARKET FUNDS) – 1.25% | | | | | | | | | | | | |
| Apollo Investment Corp. | | | 26,675 | | | | 143,245 | | | | 0.06 | % |
| Ares Capital Corp. | | | 9,500 | | | | 152,380 | | | | 0.06 | % |
| FS Investment Corp. | | | 20,000 | | | | 152,000 | | | | 0.06 | % |
| Gladstone Capital Corp. | | | 16,600 | | | | 145,084 | | | | 0.06 | % |
| Guggenheim Credit Allocation Fund | | | 34,000 | | | | 729,980 | | | | 0.31 | % |
| Hercules Capital, Inc. | | | 12,225 | | | | 151,590 | | | | 0.06 | % |
| Main Street Capital Corp. | | | 3,975 | | | | 150,096 | | | | 0.06 | % |
| Monroe Capital Corp. | | | 11,300 | | | | 145,318 | | | | 0.06 | % |
| New Mountain Finance Corp. | | | 11,275 | | | | 152,212 | | | | 0.06 | % |
| SPDR Barclays Capital High Yield Bond | | | 1,000 | | | | 35,870 | | | | 0.02 | % |
| SPDR Barclays Short Term High Yield | | | 4,000 | | | | 109,680 | | | | 0.05 | % |
| SPDR Wells Fargo Preferred Stock ETF | | | 2,800 | | | | 119,840 | | | | 0.05 | % |
The accompanying notes are an integral part of these financial statements.
| HENNESSY FUNDS | 1-800-966-4354 | |
| INVESTMENT COMPANIES (EXCLUDING | | Par Amount/ | | | | | | % of | |
| MONEY MARKET FUNDS) | | Number of Shares | | | Value | | | Net Assets | |
| TPG Specialty Lending, Inc. | | | 8,225 | | | $ | 148,544 | | | | 0.06 | % |
| Triangle Capital Corp. | | | 12,700 | | | | 147,193 | | | | 0.06 | % |
| Vanguard High-Yield Corporate Fund | | | 89,820 | | | | 517,364 | | | | 0.22 | % |
| | | | | | | | | | | | | |
| Total Investment Companies (Excluding Money Market Funds) | | | | | | | | | | | | |
| (Cost $3,215,800) | | | | | | | 3,000,396 | | | | 1.25 | % |
| | | | | | | | | | | | | |
| SHORT-TERM INVESTMENTS – 0.60% | | | | | | | | | | | | |
| | | | | | | | | | | | | |
| Money Market Funds – 0.60% | | | | | | | | | | | | |
| Fidelity Government Portfolio, Institutional Class, 1.58% (c) | | | 1,422,883 | | | | 1,422,883 | | | | 0.60 | % |
| | | | | | | | | | | | | |
| Total Short-Term Investments | | | | | | | | | | | | |
| (Cost $1,422,883) | | | | | | | 1,422,883 | | | | 0.60 | % |
| | | | | | | | | | | | | |
| Total Investments | | | | | | | | | | | | |
| (Cost $208,243,311) – 98.96% | | | | | | | 236,608,537 | | | | 98.96 | % |
| Other Assets in Excess of Liabilities – 1.04% | | | | | | | 2,481,680 | | | | 1.04 | % |
| | | | | | | | | | | | | |
TOTAL NET ASSETS – 100.00% | | | | | | $ | 239,090,217 | | | | 100.00 | % |
Percentages are stated as a percent of net assets.
PLC – Public Limited Company
REIT – Real Estate Investment Trust
| (a) | Non-income producing security. |
| (b) | U.S. traded security of a foreign corporation. |
| (c) | The rate listed is the fund’s seven-day yield as of April 30, 2018. |
| (d) | Investment in affiliated security. Quasar Distributors, LLC, which serves as the Fund’s distributor, is a subsidiary of U.S. Bancorp. Details of transactions with this affiliated company for the three-month period ended January 31, 2018, are as follows: |
| | Issuer | | U.S. Bancorp | | |
| | Beginning Cost | | $ | 93,213 | | |
| | Purchase Cost | | $ | — | | |
| | Sales Cost | | $ | — | | |
| | Ending Cost | | $ | 93,213 | | |
| | Dividend Income | | $ | 2,633 | | |
| | Net Change in | | | | | |
| | Unrealized Appreciation | | $ | (3,823 | ) | |
| | Realized Gain (Loss) | | $ | — | | |
| | Shares | | | 3,240 | | |
| | Market Value | | $ | 89,424 | | |
| (e) | Rule 144A security. Security is exempt from registration pursuant to Rule 144A under the Securities Act of 1933, as amended. Rule 144A securities may be resold in transactions exempt from registration to qualified institutional investors. As of April 30, 2018, the market value of this security totaled $1,284,581, which represents 0.54% of net assets. |
| (f) | Variable rate security; rate disclosed is the current rate as of April 30, 2018. |
| (g) | Step-up bond; rate disclosed is the current rate as of April 30, 2018. |
The accompanying notes are an integral part of these financial statements.
HENNESSYFUNDS.COM
Summary of Fair Value Exposure at April 30, 2018
The following is a summary of the inputs used to value the Fund's net assets as of April 30, 2018 (See Note 3 in the accompanying notes to the financial statements):
| Common Stocks | | Level 1 | | | Level 2 | | | Level 3 | | | Total | |
| Consumer Discretionary | | $ | 33,339,286 | | | $ | — | | | $ | — | | | $ | 33,339,286 | |
| Consumer Staples | | | 6,660,092 | | | | — | | | | — | | | | 6,660,092 | |
| Energy | | | 3,419,006 | | | | — | | | | — | | | | 3,419,006 | |
| Financials | | | 35,969,739 | | | | — | | | | — | | | | 35,969,739 | |
| Health Care | | | 6,615,812 | | | | — | | | | — | | | | 6,615,812 | |
| Industrials | | | 20,418,194 | | | | — | | | | — | | | | 20,418,194 | |
| Information Technology | | | 25,911,806 | | | | — | | | | — | | | | 25,911,806 | |
| Materials | | | 6,160,713 | | | | — | | | | — | | | | 6,160,713 | |
| Telecommunication Services | | | 2,211,176 | | | | — | | | | — | | | | 2,211,176 | |
| Total Common Stocks | | $ | 140,705,824 | | | $ | — | | | $ | — | | | $ | 140,705,824 | |
| Preferred Stocks | | | | | | | | | | | | | | | | |
| Consumer Staples | | $ | 203,393 | | | $ | — | | | $ | — | | | $ | 203,393 | |
| Energy | | | 128,649 | | | | — | | | | — | | | | 128,649 | |
| Financials | | | 4,003,099 | | | | 55,100 | | | | — | | | | 4,058,199 | |
| Telecommunication Services | | | 130,274 | | | | — | | | | — | | | | 130,274 | |
| Utilities | | | 171,925 | | | | — | | | | — | | | | 171,925 | |
| Total Preferred Stocks | | $ | 4,637,340 | | | $ | 55,100 | | | $ | — | | | $ | 4,692,440 | |
| REITS | | | | | | | | | | | | | | | | |
| Financials | | $ | 1,486,933 | | | $ | — | | | $ | — | | | $ | 1,486,933 | |
| Total REITS | | $ | 1,486,933 | | | $ | — | | | $ | — | | | $ | 1,486,933 | |
| Corporate Bonds | | | | | | | | | | | | | | | | |
| Consumer Discretionary | | $ | — | | | $ | 1,186,429 | | | $ | — | | | $ | 1,186,429 | |
| Consumer Staples | | | — | | | | 1,367,720 | | | | — | | | | 1,367,720 | |
| Energy | | | — | | | | 5,671,389 | | | | — | | | | 5,671,389 | |
| Financials | | | — | | | | 30,936,760 | | | | — | | | | 30,936,760 | |
| Health Care | | | — | | | | 6,655,041 | | | | — | | | | 6,655,041 | |
| Industrials | | | — | | | | 1,010,251 | | | | — | | | | 1,010,251 | |
| Information Technology | | | — | | | | 3,154,452 | | | | — | | | | 3,154,452 | |
| Materials | | | — | | | | 3,797,879 | | | | — | | | | 3,797,879 | |
| Retail Trade | | | — | | | | 1,046,737 | | | | — | | | | 1,046,737 | |
| Telecommunication Services | | | — | | | | 4,842,188 | | | | — | | | | 4,842,188 | |
| Total Corporate Bonds | | $ | — | | | $ | 59,668,846 | | | $ | — | | | $ | 59,668,846 | |
| Mortgage Backed Securities | | $ | — | | | $ | 11,233,194 | | | $ | — | | | $ | 11,233,194 | |
| U.S. Treasury Obligations | | | | | | | | | | | | | | | | |
| U.S. Treasury Bonds | | $ | — | | | $ | 986,308 | | | $ | — | | | $ | 986,308 | |
| U.S. Treasury Notes | | | — | | | | 7,175,758 | | | | — | | | | 7,175,758 | |
| Total U.S. Treasury Obligations | | $ | — | | | $ | 8,162,066 | | | $ | — | | | $ | 8,162,066 | |
| U.S. Government Agency Issues | | $ | — | | | $ | 6,235,955 | | | $ | — | | | $ | 6,235,955 | |
| Investment Companies (Excluding | | | | | | | | | | | | | | | | |
| Money Market Funds) | | $ | 3,000,396 | | | $ | — | | | $ | — | | | $ | 3,000,396 | |
| Short-Term Investments | | | | | | | | | | | | | | | | |
| Money Market Funds | | $ | 1,422,883 | | | $ | — | | | $ | — | | | $ | 1,422,883 | |
| Total Short-Term Investments | | $ | 1,422,883 | | | $ | — | | | $ | — | | | $ | 1,422,883 | |
| Total Investments | | $ | 151,253,376 | | | $ | 85,355,161 | | | $ | — | | | $ | 236,608,537 | |
Transfers between levels are recognized at the end of the reporting period. During the six-month period ended April 30, 2018, the Fund recognized transfers between Level 1 and Level 2.
The accompanying notes are an integral part of these financial statements.
| HENNESSY FUNDS | 1-800-966-4354 | |
Below is a reconciliation that details the transfer of securities between Level 1 and Level 2 during the reporting period.
| | | Preferred Stock | |
| Transfers into Level 1 | | $ | — | |
| Transfers out of Level 1 | | | (55,100 | ) |
| Net Transfers into/(out of) Level 1 | | $ | (55,100 | ) |
| Transfers into Level 2 | | $ | 55,100 | |
| Transfers out of Level 2 | | | — | |
| Net transfers into/(out of) Level 2 | | $ | 55,100 | |
The Fund transferred $55,100 from Level 1 to Level 2 at April 30, 2018. The security was being actively traded on October 31, 2017, but was transferred due to lack of an active market on April 30, 2018.
The accompanying notes are an integral part of these financial statements.
HENNESSYFUNDS.COM
| SCHEDULE OF INVESTMENTS/STATEMENT OF ASSETS AND LIABILITIES |
Financial Statements
Statement of Assets and Liabilities as of April 30, 2018 (Unaudited) |
| ASSETS: | | | |
| Investments in unaffiliated securities, at value (cost $208,150,098) | | $ | 236,519,113 | |
| Investments in affiliated securities, at value (cost $93,213) | | | 89,424 | |
| Total investments in securities, at value (cost $208,243,311) | | | 236,608,537 | |
| Dividends and interest receivable | | | 918,361 | |
| Receivable for fund shares sold | | | 43,758 | |
| Receivable for securities sold | | | 4,322,291 | |
| Prepaid expenses and other assets | | | 32,430 | |
| Total Assets | | | 241,925,377 | |
| | | | | |
| LIABILITIES: | | | | |
| Payable for securities purchased | | | 2,206,983 | |
| Payable for fund shares redeemed | | | 286,047 | |
| Payable to advisor | | | 159,623 | |
| Payable to administrator | | | 41,854 | |
| Payable to auditor | | | 10,259 | |
| Accrued distribution fees | | | 29,200 | |
| Accrued service fees | | | 11,363 | |
| Accrued trustees fees | | | 4,846 | |
| Accrued expenses and other payables | | | 84,985 | |
| Total Liabilities | | | 2,835,160 | |
| NET ASSETS | | $ | 239,090,217 | |
| | | | | |
| NET ASSETS CONSIST OF: | | | | |
| Capital stock | | $ | 199,409,290 | |
| Accumulated net investment income | | | 80,355 | |
| Accumulated net realized gain on investments | | | 11,235,346 | |
| Unrealized net appreciation on investments | | | 28,365,226 | |
| Total Net Assets | | $ | 239,090,217 | |
| | | | | |
| NET ASSETS | | | | |
| Investor Class: | | | | |
| Shares authorized (no par value) | | Unlimited | |
| Net assets applicable to outstanding Investor Class shares | | $ | 136,366,603 | |
| Shares issued and outstanding | | | 8,767,150 | |
| Net asset value, offering price and redemption price per share | | $ | 15.55 | |
| | | | | |
| Institutional Class: | | | | |
| Shares authorized (no par value) | | Unlimited | |
| Net assets applicable to outstanding Institutional Class shares | | $ | 102,723,614 | |
| Shares issued and outstanding | | | 6,996,992 | |
| Net asset value, offering price and redemption price per share | | $ | 14.68 | |
The accompanying notes are an integral part of these financial statements.
| HENNESSY FUNDS | 1-800-966-4354 | |
Financial Statements
Statement of Operations for the six months ended April 30, 2018 (Unaudited) |
| INVESTMENT INCOME: | | | |
| Dividend income from unaffiliated securities | | $ | 1,665,806 | |
| Dividend income from affiliated securities | | | 2,633 | |
| Interest income | | | 1,350,858 | |
| Total investment income | | | 3,019,297 | |
| | | | | |
| EXPENSES: | | | | |
| Investment advisory fees (See Note 5) | | | 1,024,722 | |
| Sub-transfer agent expenses – Investor Class (See Note 5) | | | 169,357 | |
| Sub-transfer agent expenses – Institutional Class (See Note 5) | | | 45,764 | |
| Administration, fund accounting, custody and transfer agent fees (See Note 5) | | | 120,468 | |
| Distribution fees – Investor Class (See Note 5) | | | 110,450 | |
| Service fees – Investor Class (See Note 5) | | | 73,633 | |
| Federal and state registration fees | | | 18,468 | |
| Compliance expense (See Note 5) | | | 14,628 | |
| Reports to shareholders | | | 14,183 | |
| Audit fees | | | 10,862 | |
| Trustees’ fees and expenses | | | 9,487 | |
| Legal fees | | | 756 | |
| Interest expense (See Note 7) | | | 40 | |
| Other expenses | | | 10,499 | |
| Total expenses | | | 1,623,317 | |
| NET INVESTMENT INCOME | | $ | 1,395,980 | |
| | | | | |
| REALIZED AND UNREALIZED GAINS (LOSSES): | | | | |
| Net realized gain on: | | | | |
| Unaffiliated investments | | $ | 11,245,864 | |
| Affiliated investments | | | — | |
| Net change in unrealized appreciation on: | | | | |
| Unaffiliated investments | | | (8,309,506 | ) |
| Affiliated investments | | | (3,823 | ) |
| Net gain on investments | | | 2,932,535 | |
| NET INCREASE IN NET ASSETS RESULTING FROM OPERATIONS | | $ | 4,328,515 | |
The accompanying notes are an integral part of these financial statements.
HENNESSYFUNDS.COM
| STATEMENT OF OPERATIONS/STATEMENTS OF CHANGES IN NET ASSETS |
Financial Statements
| Statements of Changes in Net Assets |
| | | Six Months Ended | | | | |
| | | April 30, 2018 | | | Year Ended | |
| | | (Unaudited) | | | October 31, 2017 | |
| OPERATIONS: | | | | | | |
| Net investment income | | $ | 1,395,980 | | | $ | 2,708,905 | |
| Net realized gain on investments | | | 11,245,864 | | | | 18,193,893 | |
| Net change in unrealized appreciation on investments | | | (8,313,329 | ) | | | 19,387,071 | |
| Net increase in net assets resulting from operations | | | 4,328,515 | | | | 40,289,869 | |
| | | | | | | | | |
| DISTRIBUTIONS TO SHAREHOLDERS FROM: | | | | | | | | |
| Net investment income – Investor Class | | | (655,828 | ) | | | (1,353,800 | ) |
| Net investment income – Institutional Class | | | (763,234 | ) | | | (1,431,025 | ) |
| Net realized gains – Investor Class | | | (7,803,712 | ) | | | (16,086,706 | ) |
| Net realized gains – Institutional Class | | | (5,611,760 | ) | | | (10,462,912 | ) |
| Total distributions | | | (14,834,534 | ) | | | (29,334,443 | ) |
| | | | | | | | | |
| CAPITAL SHARE TRANSACTIONS: | | | | | | | | |
| Proceeds from shares subscribed – Investor Class | | | 4,050,663 | | | | 8,054,934 | |
| Proceeds from shares subscribed – Institutional Class | | | 5,389,287 | | | | 20,836,993 | |
| Dividends reinvested – Investor Class | | | 8,227,392 | | | | 17,017,145 | |
| Dividends reinvested – Institutional Class | | | 5,042,520 | | | | 9,255,346 | |
| Cost of shares redeemed – Investor Class | | | (25,296,690 | ) | | | (78,489,456 | ) |
| Cost of shares redeemed – Institutional Class | | | (13,880,293 | ) | | | (53,524,682 | ) |
| Net decrease in net assets derived | | | | | | | | |
| from capital share transactions | | | (16,467,121 | ) | | | (76,849,720 | ) |
| TOTAL DECREASE IN NET ASSETS | | | (26,973,140 | ) | | | (65,894,294 | ) |
| | | | | | | | | |
| NET ASSETS: | | | | | | | | |
| Beginning of period | | | 266,063,357 | | | | 331,957,651 | |
| End of period | | $ | 239,090,217 | | | $ | 266,063,357 | |
| Undistributed net investment income, end of period | | $ | 80,355 | | | $ | 103,437 | |
| | | | | | | | | |
| CHANGES IN SHARES OUTSTANDING: | | | | | | | | |
| Shares sold – Investor Class | | | 253,666 | | | | 516,776 | |
| Shares sold – Institutional Class | | | 354,738 | | | | 1,415,138 | |
| Shares issued to holders as reinvestment | | | | | | | | |
| of dividends – Investor Class | | | 518,446 | | | | 1,128,293 | |
| Shares issued to holders as reinvestment | | | | | | | | |
| of dividends – Institutional Class | | | 336,434 | | | | 648,210 | |
| Shares redeemed – Investor Class | | | (1,570,299 | ) | | | (5,022,332 | ) |
| Shares redeemed – Institutional Class | | | (914,883 | ) | | | (3,644,869 | ) |
| Net decrease in shares outstanding | | | (1,021,898 | ) | | | (4,958,784 | ) |
The accompanying notes are an integral part of these financial statements.
| HENNESSY FUNDS | 1-800-966-4354 | |
Financial Statements
For an Investor Class share outstanding throughout each period
| | | Six Months Ended | |
| | | April 30, 2018 | |
| | | (Unaudited) | |
| PER SHARE DATA: | | | |
| Net asset value, beginning of period | | $ | 16.24 | |
| | | | | |
| Income from investment operations: | | | | |
| Net investment income | | | 0.08 | |
| Net realized and unrealized gains (losses) on investments | | | 0.14 | |
| Total from investment operations | | | 0.22 | |
| | | | | |
| Less distributions: | | | | |
| Dividends from net investment income | | | (0.07 | ) |
| Dividends from net realized gains | | | (0.84 | ) |
| Total distributions | | | (0.91 | ) |
| Net asset value, end of period | | $ | 15.55 | |
| | | | | |
| TOTAL RETURN | | | 1.26 | %(1) |
| | | | | |
| SUPPLEMENTAL DATA AND RATIOS: | | | | |
| Net assets, end of period (millions) | | $ | 136.37 | |
| Ratio of expenses to average net assets: | | | | |
| Before expense reimbursement | | | 1.44 | %(2) |
| After expense reimbursement | | | 1.44 | %(2) |
| Ratio of net investment income to average net assets: | | | | |
| Before expense reimbursement | | | 0.92 | %(2) |
| After expense reimbursement | | | 0.92 | %(2) |
Portfolio turnover rate(3) | | | 10 | %(1) |
(1) | Not annualized. |
(2) | Annualized. |
(3) | Portfolio turnover is calculated on the basis of the Fund as a whole. |
The accompanying notes are an integral part of these financial statements.
HENNESSYFUNDS.COM
| FINANCIAL HIGHLIGHTS — INVESTOR CLASS |
| Year Ended October 31, | | |
| 2017 | | | 2016 | | | 2015 | | | 2014 | | | 2013 | | |
| | | | | | | | | | | | | | | |
| $ | 15.61 | | | $ | 16.15 | | | $ | 16.68 | | | $ | 15.77 | | | $ | 13.96 | | |
| | | | | | | | | | | | | | | | | | | | |
| | | | | | | | | | | | | | | | | | | | |
| | 0.14 | | | | 0.14 | | | | 0.13 | | | | 0.16 | | | | 0.23 | | |
| | 1.95 | | | | (0.16 | ) | | | 0.11 | | | | 1.41 | | | | 1.81 | | |
| | 2.09 | | | | (0.02 | ) | | | 0.24 | | | | 1.57 | | | | 2.04 | | |
| | | | | | | | | | | | | | | | | | | | |
| | | | | | | | | | | | | | | | | | | | |
| | (0.12 | ) | | | (0.13 | ) | | | (0.13 | ) | | | (0.16 | ) | | | (0.23 | ) | |
| | (1.34 | ) | | | (0.39 | ) | | | (0.64 | ) | | | (0.50 | ) | | | — | | |
| | (1.46 | ) | | | (0.52 | ) | | | (0.77 | ) | | | (0.66 | ) | | | (0.23 | ) | |
| $ | 16.24 | | | $ | 15.61 | | | $ | 16.15 | | | $ | 16.68 | | | $ | 15.77 | | |
| | | | | | | | | | | | | | | | | | | | |
| | 14.16 | % | | | (0.12 | )% | | | 1.43 | % | | | 10.28 | % | | | 14.72 | % | |
| | | | | | | | | | | | | | | | | | | | |
| | | | | | | | | | | | | | | | | | | | |
| $ | 155.33 | | | $ | 202.04 | | | $ | 292.84 | | | $ | 284.45 | | | $ | 233.25 | | |
| | | | | | | | | | | | | | | | | | | | |
| | 1.43 | % | | | 1.43 | % | | | 1.38 | % | | | 1.33 | % | | | 1.36 | % | |
| | 1.43 | % | | | 1.43 | % | | | 1.38 | % | | | 1.33 | % | | | 1.33 | % | |
| | | | | | | | | | | | | | | | | | | | |
| | 0.78 | % | | | 0.84 | % | | | 0.83 | % | | | 1.01 | % | | | 1.51 | % | |
| | 0.78 | % | | | 0.84 | % | | | 0.83 | % | | | 1.01 | % | | | 1.54 | % | |
| | 15 | % | | | 24 | % | | | 39 | % | | | 28 | % | | | 52 | % | |
The accompanying notes are an integral part of these financial statements.
| HENNESSY FUNDS | 1-800-966-4354 | |
Financial Statements
For an Institutional Class share outstanding throughout each period
| | | Six Months Ended | |
| | | April 30, 2018 | |
| | | (Unaudited) | |
| PER SHARE DATA: | | | |
| Net asset value, beginning of period | | $ | 15.34 | |
| | | | | |
| Income from investment operations: | | | | |
| Net investment income | | | 0.10 | |
| Net realized and unrealized gains (losses) on investments | | | 0.14 | |
| Total from investment operations | | | 0.24 | |
| | | | | |
| Less distributions: | | | | |
| Dividends from net investment income | | | (0.11 | ) |
| Dividends from net realized gains | | | (0.79 | ) |
| Total distributions | | | (0.90 | ) |
| Net asset value, end of period | | $ | 14.68 | |
| | | | | |
| TOTAL RETURN | | | 1.46 | %(1) |
| | | | | |
| SUPPLEMENTAL DATA AND RATIOS: | | | | |
| Net assets, end of period (millions) | | $ | 102.72 | |
| Ratio of expenses to average net assets | | | 1.04 | %(2) |
| Ratio of net investment income to average net assets | | | 1.32 | %(2) |
Portfolio turnover rate(3) | | | 10 | %(1) |
(1) | Not annualized. |
(2) | Annualized. |
(3) | Portfolio turnover is calculated on the basis of the Fund as a whole. |
The accompanying notes are an integral part of these financial statements.
HENNESSYFUNDS.COM
| FINANCIAL HIGHLIGHTS — INSTITUTIONAL CLASS |
| Year Ended October 31, | | |
| 2017 | | | 2016 | | | 2015 | | | 2014 | | | 2013 | | |
| | | | | | | | | | | | | | | |
| $ | 14.76 | | | $ | 15.28 | | | $ | 15.80 | | | $ | 14.97 | | | $ | 13.29 | | |
| | | | | | | | | | | | | | | | | | | | |
| | | | | | | | | | | | | | | | | | | | |
| | 0.16 | | | | 0.18 | | | | 0.19 | | | | 0.20 | | | | 0.25 | | |
| | 1.87 | | | | (0.13 | ) | | | 0.09 | | | | 1.33 | | | | 1.72 | | |
| | 2.03 | | | | 0.05 | | | | 0.28 | | | | 1.53 | | | | 1.97 | | |
| | | | | | | | | | | | | | | | | | | | |
| | | | | | | | | | | | | | | | | | | | |
| | (0.18 | ) | | | (0.20 | ) | | | (0.19 | ) | | | (0.20 | ) | | | (0.29 | ) | |
| | (1.27 | ) | | | (0.37 | ) | | | (0.61 | ) | | | (0.50 | ) | | | — | | |
| | (1.45 | ) | | | (0.57 | ) | | | (0.80 | ) | | | (0.70 | ) | | | (0.29 | ) | |
| $ | 15.34 | | | $ | 14.76 | | | $ | 15.28 | | | $ | 15.80 | | | $ | 14.97 | | |
| | | | | | | | | | | | | | | | | | | | |
| | 14.60 | % | | | 0.30 | % | | | 1.75 | % | | | 10.60 | % | | | 14.99 | % | |
| | | | | | | | | | | | | | | | | | | | |
| | | | | | | | | | | | | | | | | | | | |
| $ | 110.74 | | | $ | 129.91 | | | $ | 168.84 | | | $ | 102.10 | | | $ | 85.12 | | |
| | 1.05 | % | | | 1.03 | % | | | 1.04 | % | | | 1.05 | % | | | 1.06 | % | |
| | 1.16 | % | | | 1.23 | % | | | 1.18 | % | | | 1.29 | % | | | 1.95 | % | |
| | 15 | % | | | 24 | % | | | 39 | % | | | 28 | % | | | 52 | % | |
The accompanying notes are an integral part of these financial statements.
| HENNESSY FUNDS | 1-800-966-4354 | |
Financial Statements
Notes to the Financial Statements April 30, 2018 (Unaudited) |
1). ORGANIZATION
The Hennessy Equity and Income Fund (the “Fund”) is a series of Hennessy Funds Trust (the “Trust”), which was organized as a Delaware statutory trust on September 17, 1992. The Fund is an open-end management investment company registered under the Investment Company Act of 1940, as amended. The investment objective of the Fund is long-term capital growth and current income. The Fund is a diversified fund.
The Fund offers Investor Class and Institutional Class shares. Each class of shares differs principally in its respective 12b-1 distribution and service, shareholder servicing, and sub-transfer agent expenses. There are no sales charges. Each class has identical rights to earnings, assets, and voting privileges, except for class-specific expenses and exclusive rights to vote on matters affecting only an individual class.
As an investment company, the Fund follows the investment company accounting and reporting guidance of the Financial Accounting Standards Board (“FASB”) Accounting Standard Codification Topic 946 “Financial Services—Investment Companies.”
2). SIGNIFICANT ACCOUNTING POLICIES
The following is a summary of significant accounting policies consistently followed by the Fund in the preparation of the financial statements. These policies conform to U.S. generally accepted accounting principles (“GAAP”).
| a). | Investment Valuation – All investments in securities are recorded at their estimated fair value, as described in Note 3. |
| | |
| b). | Federal Income Taxes – No provision for federal income taxes or excise taxes has been made because the Fund has elected to be taxed as a “regulated investment company” and intends to distribute substantially all of its taxable income to its shareholders and otherwise comply with the provisions of the Internal Revenue Code of 1986, as amended, applicable to regulated investment companies. Net investment income/loss and realized gains/losses for federal income tax purposes may differ from those reported in the financial statements because of temporary book and tax basis differences. Temporary differences are primarily the result of the treatment of wash sales for tax reporting purposes. The Fund recognizes interest and penalties related to income tax benefits, if any, in the Statement of Operations as an income tax expense. Distributions from net realized gains for book purposes may include short-term capital gains, which are included as ordinary income to shareholders for tax purposes. The Fund may utilize equalization accounting for tax purposes and designate earnings and profits, including net realized gains distributed to shareholders on redemption of shares, as part of the dividends paid deduction for income tax purposes. |
| | |
| c). | Accounting for Uncertainty in Income Taxes – The Fund has accounting policies regarding recognition and measurement of tax positions taken or expected to be taken on a tax return. The tax returns of the Fund for the prior three fiscal years are open for examination. The Fund has reviewed all open tax years in major jurisdictions and concluded that there is no impact on the Fund’s net assets and no tax liability resulting from unrecognized tax benefits relating to uncertain income tax positions taken or expected to be taken on a tax return. The Fund’s major tax jurisdictions are U.S. federal and Delaware. |
| NOTES TO THE FINANCIAL STATEMENTS |
| d). | Income and Expenses – Dividend income is recognized on the ex-dividend date or as soon as information is available to the Fund. Interest income, which includes the amortization of premium and accretion of discount, is recognized on an accrual basis. The Fund is charged for those expenses that are directly attributable to the portfolio, such as advisory, administration, and certain shareholder service fees. Income, expenses (other than expenses attributable to a specific class), and realized and unrealized gains/losses on investments are allocated to each class of shares based on such class’s net assets. |
| | |
| e). | Distributions to Shareholders – Dividends from net investment income for the Fund, if any, are declared and paid at the end of each calendar quarter. Distributions of net realized capital gains, if any, are declared and paid annually, usually in December. |
| | |
| f). | Security Transactions – Investment and shareholder transactions are recorded on the trade date. The Fund determines the realized gain/loss from an investment transaction by comparing the original cost of the security lot sold with the net sale proceeds. Discounts and premiums on securities purchased are accreted or amortized, respectively, over the life of each such security. |
| | |
| g). | Use of Estimates – The preparation of financial statements in conformity with GAAP requires management to make estimates and assumptions that affect the reported amounts of assets and liabilities and disclosure of contingent assets and liabilities at the date of the financial statements and the reported change in net assets during the reporting period. Actual results could differ from those estimates. |
| | |
| h). | Share Valuation – The net asset value (“NAV”) per share of the Fund is calculated by dividing (i) the total value of the securities held by the Fund, plus cash and other assets, minus all liabilities (including estimated accrued expenses) by (ii) the total number of shares outstanding for the Fund, rounded to the nearest cent. The Fund’s shares will not be priced on days the New York Stock Exchange is closed for trading. The offering and redemption price per share for the Fund is equal to the Fund’s NAV per share. |
3). SECURITIES VALUATION
The Fund follows fair valuation accounting standards that establish an authoritative definition of fair value and set out a hierarchy for measuring fair value. These standards require additional disclosures about the various inputs and valuation techniques used to develop the measurements of fair value and a discussion of changes in valuation techniques and related inputs during the period. These inputs are summarized in the three broad levels listed below:
| | Level 1 – | Unadjusted, quoted prices in active markets for identical instruments that the Fund has the ability to access at the date of measurement. |
| | | |
| | Level 2 – | Other significant observable inputs (including, but not limited to, quoted prices in active markets for similar instruments, quoted prices in markets that are not active for identical or similar instruments, and model-derived valuations in which all significant inputs and significant value drivers are observable in active markets (such as interest rates, prepayment speeds, credit risk curves, default rates, and similar data)). |
| | | |
| | Level 3 – | Significant unobservable inputs (including the Fund’s own assumptions about what market participants would use to price the asset or liability based on the best available information) when observable inputs are unavailable. |
Following is a description of the valuation techniques applied to the Fund’s major categories of assets and liabilities measured at fair value on a recurring basis.
| HENNESSY FUNDS | 1-800-966-4354 | |
| | Equity Securities – Equity securities, including common stocks, preferred stocks, foreign-issued common stocks, exchange-traded funds, closed-end mutual funds, partnerships, rights, and real estate investment trusts, that are traded on a securities exchange for which a last-quoted sales price is readily available will generally be valued at the last sales price as reported by the primary exchange on which the securities are listed. Securities listed on The NASDAQ Stock Market (“NASDAQ”) will generally be valued at the NASDAQ Official Closing Price, which may differ from the last sales price reported. Securities traded on a securities exchange for which a last-quoted sales price is not readily available will generally be valued at the mean between the bid and ask prices. To the extent these securities are actively traded and valuation adjustments are not applied, they are classified in Level 1 of the fair value hierarchy. Securities traded on foreign exchanges generally are not valued at the same time the Fund calculates its NAV because most foreign markets close well before such time. The earlier close of most foreign markets gives rise to the possibility that significant events, including broad market moves, may have occurred in the interim. In certain circumstances, it may be determined that a security needs to be fair valued because it appears that the value of the security might have been materially affected by events occurring after the close of the market in which the security is principally traded, but before the time the Fund calculates its NAV, such as by a development that affects an entire market or region (e.g., a weather-related event) or a potentially global development (e.g., a terrorist attack that may be expected to have an effect on investor expectations worldwide). |
| | |
| | Registered Investment Companies – Investments in registered investment companies (e.g., mutual funds) are generally priced at the ending NAV provided by the applicable registered investment company’s service agent and will be classified in Level 1 of the fair value hierarchy. |
| | |
| | Debt Securities – Debt securities, including corporate bonds, asset-backed securities, mortgage-backed securities, municipal bonds, U.S. Treasuries, and U.S. government agency issues, are generally valued at market on the basis of valuations furnished by an independent pricing service that utilizes both dealer-supplied valuations and formula-based techniques. The pricing service may consider recently executed transactions in securities of the issuer or comparable issuers, market price quotations (where observable), bond spreads, and fundamental data relating to the issuer. In addition, the model may incorporate observable market data, such as reported sales of similar securities, broker quotes, yields, bids, offers, and reference data. Certain securities are valued primarily using dealer quotations. These securities are generally classified in Level 2 of the fair value hierarchy. |
| | |
| | Short-Term Securities – Short-term equity investments, including money market funds, are valued in the manner specified above. Short-term debt investments with an original term to maturity of 60 days or less are valued at amortized cost, which approximates fair market value. If the original term to maturity of a short-term debt investment exceeded 60 days, then the values as of the 61st day prior to maturity are amortized. Amortized cost is not used if its use would be inappropriate due to credit or other impairments of the issuer, in which case the security’s fair value would be determined, as described below. Short-term securities are generally classified in Level 1 or Level 2 of the fair market hierarchy depending on the inputs used and market activity levels for specific securities. |
The Board of Trustees of the Fund (the “Board”) has adopted fair value pricing procedures that are followed when a price for a security is not readily available or if a significant event has occurred that indicates the closing price of a security no longer
HENNESSYFUNDS.COM
| NOTES TO THE FINANCIAL STATEMENTS |
represents the true value of that security. Fair value pricing determinations are made in good faith in accordance with these procedures. There are numerous criteria that will be given consideration in determining a fair value of a security, such as the trading volume of a security and markets, the values of other similar securities, and news events with direct bearing on a security or markets. Fair value pricing results in an estimated price for a security that reflects the amount the Fund might reasonably expect to receive in a current sale. Depending on the relative significance of the valuation inputs, these securities may be classified in either Level 2 or Level 3 of the fair value hierarchy.
The fair valuation of foreign securities may be determined with the assistance of a pricing service using correlations between the movement of prices of such securities and indices of domestic securities and other appropriate indicators, such as closing market prices of relevant American Depositary Receipts or futures contracts. The effect of using fair value pricing is that the Fund’s NAV will reflect the affected portfolio securities’ values as determined by the Board or its designee instead of being determined by the market. Using a fair value pricing methodology to price a foreign security may result in a value that is different from such foreign security’s most recent closing price and from the value used by other investment companies to calculate their NAVs. Such securities are generally classified in Level 2 of the fair valuation hierarchy. Because the Fund may invest in foreign securities, the value of the Fund’s portfolio securities may change on days when you will not be able to purchase or redeem your shares.
The Board has delegated day-to-day valuation matters to a Valuation Committee comprised of one or more representatives from Hennessy Advisors, Inc., the Fund’s investment advisor (the “Advisor”). The function of the Valuation Committee is to value securities where current and reliable market quotations are not readily available. All actions taken by the Valuation Committee are reviewed by the Board.
The Fund has performed an analysis of all existing investments to determine the significance and character of all inputs to their fair value determinations. Various inputs are used to determine the value of the Fund’s investments. The inputs or methodology used for valuing securities are not necessarily an indication of the risk associated with investing in those securities. Details related to the fair valuation hierarchy of the Fund’s securities as of April 30, 2018, are included in the Schedule of Investments.
4). INVESTMENT TRANSACTIONS
Purchases and sales of investment securities (excluding government and short-term investments) for the Fund during the six months ended April 30, 2018, were $16,333,407 and $47,638,318, respectively.
Purchases and sales/maturities of long-term U.S. government securities for the Fund during the six months ended April 30, 2018, were $7,977,559 and $8,463,940, respectively.
The Fund is permitted to purchase or sell securities from or to another fund in the Hennessy Funds family of funds (the “Hennessy Funds”) under specified conditions outlined in procedures adopted by the Board. The procedures have been designed to ensure that any purchase or sale of securities by the Fund from or to another Hennessy Fund complies with Rule 17a-7 of the Investment Company Act of 1940, as amended. During the six months ended April 30, 2018, the Fund did not engage in purchases or sales of securities pursuant to Rule 17a-7 of the Investment Company Act of 1940, as amended.
| HENNESSY FUNDS | 1-800-966-4354 | |
5). INVESTMENT MANAGEMENT FEE AND OTHER TRANSACTIONS WITH AFFILIATES
The Advisor provides the Fund with investment management services under an Investment Advisory Agreement. The Advisor furnishes all investment advice, office space, and facilities, as well as most of the personnel needed by the Fund. As compensation for its services, the Advisor is entitled to a monthly fee from the Fund. The fee is based upon the average daily net assets of the Fund at an annual rate of 0.80%. The net investment advisory fees expensed by the Fund during the six months ended April 30, 2018, are included in the Statement of Operations.
The Advisor has delegated the day-to-day management of the equity allocation of the Fund to The London Company of Virginia, LLC and has delegated the day-to-day management of the fixed income allocation of the Fund to Financial Counselors, Inc. The Advisor pays the sub-advisory fees from its own assets, and these fees are not an additional expense of the Fund. For the most recent fiscal year, the Advisor (not the Fund) paid a sub-advisory fee, based upon the daily net assets of the Fund, at a rate of 0.33% for the equity allocation and 0.27% for the fixed income allocation.
The Board has approved a Shareholder Servicing Agreement for Investor Class shares of the Fund, which was instituted to compensate the Advisor for the non-investment management services it provides to the Fund. The Shareholder Servicing Agreement provides for a monthly fee paid to the Advisor at an annual rate of 0.10% of the average daily net assets of the Fund attributable to Investor Class shares. The shareholder service fees expensed by the Fund during the six months ended April 30, 2018, are included in the Statement of Operations.
The Fund has adopted a plan pursuant to Rule 12b-1 under the Investment Company Act of 1940, as amended, that authorizes payments in connection with the distribution of the Fund’s shares at an annual rate of up to 0.25% of the Fund’s average daily net assets attributable to Investor Class shares. Even though the authorized rate is up to 0.25%, the Fund is currently only using up to 0.15% of its average daily net assets attributable to Investor Class shares for such purpose. Amounts paid under the plan may be spent on any activities or expenses primarily intended to result in the sale of shares, including, but not limited to, advertising, shareholder account servicing, the printing and mailing of prospectuses to other than current shareholders, the printing and mailing of sales literature, and compensation for sales and marketing activities or to financial institutions and others, such as dealers and distributors. The distribution fees expensed by the Fund during the six months ended April 30, 2018, are included in the Statement of Operations.
The Fund has entered into agreements with various brokers, dealers, and financial intermediaries in connection with the sale of shares of the Fund. The agreements provide for periodic payments by the Fund to the brokers, dealers, and financial intermediaries for providing certain shareholder maintenance services (sub-transfer agent expenses). These shareholder services include the pre-processing and quality control of new accounts, shareholder correspondence, answering customer inquiries regarding account status, and facilitating shareholder telephone transactions. The sub-transfer agent fees expensed by the Fund during the six months ended April 30, 2018, are included in the Statement of Operations.
U.S. Bancorp Fund Services, LLC (“USBFS”) provides the Fund with administrative, fund accounting, and transfer agent services. As administrator, USBFS is responsible for activities such as (i) preparing various federal and state regulatory filings, reports, and returns for the Fund, (ii) preparing reports and materials to be supplied to the Board, (iii) monitoring the activities of the Fund’s custodian, transfer agent, and accountants, and (iv) coordinating the preparation and payment of the Fund’s expenses and reviewing
HENNESSYFUNDS.COM
| NOTES TO THE FINANCIAL STATEMENTS |
the Fund’s expense accruals. U.S. Bank N.A., an affiliate of USBFS, serves as the Fund’s custodian. The servicing agreements between the Trust and USBFS and U.S. Bank N.A. contain a fee schedule that is inclusive of administrative, fund accounting, custody, and transfer agent fees. The administrative, fund accounting, custody, and transfer agent fees expensed by the Fund during the six months ended April 30, 2018, are included in the Statement of Operations.
Quasar Distributors, LLC acts as the Fund’s principal underwriter in a continuous public offering of the Fund’s shares. Quasar Distributors, LLC is an affiliate of USBFS and U.S. Bank N.A.
The officers of the Fund are affiliated with the Advisor. Such officers, with the exception of the Chief Compliance Officer and the Senior Compliance Officer, receive no compensation from the Fund for serving in their respective roles. The Fund, along with the other Hennessy Funds, makes reimbursement payments, on an equal basis, to the Advisor for a portion of the salary and benefits associated with the office of the Chief Compliance Officer and for all of the salary and benefits associated with the office of the Senior Compliance Officer. The compliance fees expensed by the Fund during the six months ended April 30, 2018, are included in the Statement of Operations.
6). GUARANTEES AND INDEMNIFICATIONS
Under the Hennessy Funds’ organizational documents, their officers and trustees are indemnified by the Hennessy Funds against certain liabilities arising out of the performance of their duties to the Hennessy Funds. Additionally, in the normal course of business, the Hennessy Funds enter into contracts with service providers that contain general indemnification clauses. The Fund’s maximum exposure under these arrangements is unknown as this would involve future claims that may be made against the Fund that have not yet occurred. Currently, the Fund expects the risk of loss to be remote.
7). LINE OF CREDIT
The Fund has an uncommitted line of credit with the other Hennessy Funds in the amount of the lesser of (i) $100,000,000 or (ii) 33.33% of each Hennessy Fund’s net assets, or 30% for the Hennessy Gas Utility Fund and 10% for the Hennessy Balanced Fund, intended to provide short-term financing, if necessary, subject to certain restrictions, in connection with shareholder redemptions. The credit facility is with the Hennessy Funds’ custodian bank, U.S. Bank N.A. Borrowings under this arrangement bear interest at the bank’s prime rate and are secured by all of the Fund’s assets (as to its own borrowings only). During the six months ended April 30, 2018, the Fund had an outstanding average daily balance and a weighted average interest rate of $1,890 and 4.50%, respectively. The interest expensed by the Fund during the six months ended April 30, 2018, is included in the Statement of Operations. The maximum amount outstanding for the Fund during the period was $342,000. As of April 30, 2018, the Fund did not have any borrowings outstanding under the line of credit.
| HENNESSY FUNDS | 1-800-966-4354 | |
8). FEDERAL TAX INFORMATION
As of October 31, 2017, the Fund’s most recent fiscal year end, the components of accumulated earnings (losses) for income tax purposes were as follows:
| | | | Investments | |
| | Cost of investments for tax purposes | | $ | 230,094,090 | |
| | Gross tax unrealized appreciation | | $ | 39,103,812 | |
| | Gross tax unrealized depreciation | | | (2,435,698 | ) |
| | Net tax unrealized appreciation | | $ | 36,668,114 | |
| | Undistributed ordinary income | | $ | 103,437 | |
| | Undistributed long-term capital gains | | | 13,415,395 | |
| | Total distributable earnings | | $ | 13,518,832 | |
| | Other accumulated gain | | $ | — | |
| | Total accumulated gain | | $ | 50,186,946 | |
The difference between book-basis unrealized appreciation/depreciation (as shown in the Statement of Assets and Liabilities) and tax-basis unrealized appreciation/depreciation (as shown above) is attributable primarily to wash sales.
As of October 31, 2017, the Fund’s most recent fiscal year end, the Fund had no tax basis capital losses to offset future capital gains.
As of October 31, 2017, the Fund’s most recent fiscal year end, the Fund did not defer, on a tax basis, any late-year ordinary losses. Late-year ordinary losses are net ordinary losses incurred after December 31, 2016, but within the taxable year, that are deemed to arise on the first day of the Fund’s next taxable year.
During fiscal year 2018 (year to date) and fiscal year 2017, the tax character of distributions paid by the Fund was as follows:
| | | Six Months Ended | | Year Ended | |
| | | | April 30, 2018 | | | October 31, 2017 | |
| | Ordinary income(1) | | $ | 1,419,062 | | | $ | 2,761,400 | |
| | Long-term capital gain | | | 13,415,472 | | | | 26,573,043 | |
| | | | $ | 14,834,534 | | | $ | 29,334,443 | |
(1) Ordinary income includes short-term gain/loss.
9). EVENTS SUBSEQUENT TO PERIOD END
Management has evaluated the Fund’s related events and transactions that occurred subsequent to April 30, 2018, through the date of issuance of the Fund’s financial statements. Management has determined that there were no subsequent events requiring recognition or disclosure in the financial statements.
HENNESSYFUNDS.COM
| NOTES TO THE FINANCIAL STATEMENTS |
(This Page Intentionally Left Blank.)
| HENNESSY FUNDS | 1-800-966-4354 | |
Expense Example (Unaudited)
April 30, 2018
As a shareholder of the Fund, you incur two types of costs: (1) transaction costs, including sales charges (loads) on purchase payments, reinvested dividends, or other distributions; redemption fees; and exchange fees; and (2) ongoing costs, including management fees; service fees; and other Fund expenses. This Example is intended to help you understand your ongoing costs (in dollars) of investing in the Fund and to compare these costs with the ongoing costs of investing in other mutual funds. The Example is based on an investment of $1,000 invested at the beginning of the period and held for the entire period from November 1, 2017, through April 30, 2018.
Actual Expenses
The first line of the table below under the “Investor Class” and “Institutional Class” headings provides information about actual account values and actual expenses. Although the Fund charges no sales loads or transaction fees, you will be assessed fees for outgoing wire transfers, returned checks and stop payment orders at prevailing rates charged by U.S. Bancorp Fund Services, LLC, the Fund’s transfer agent. If you request that a redemption be made by wire transfer, currently a $15 fee is charged by the Fund’s transfer agent. IRA accounts will be charged a $15 annual maintenance fee. The example below includes, but is not limited to, management fees, shareholder servicing fees, fund accounting, custody, and transfer agent fees. However, the example below does not include portfolio trading commissions and related expenses, and other extraordinary expenses as determined under generally accepted accounting principles. You may use the information in this line, together with the amount you invested, to estimate the expenses that you paid over the period. Simply divide your account value by $1,000 (for example, an $8,600 account value divided by $1,000 = 8.6), then multiply the result by the number in the first line of the table under the “Investor Class” or “Institutional Class” headings in the column entitled “Expenses Paid During Period” to estimate the expenses you paid on your account during this period.
Hypothetical Example for Comparison Purposes
The second line of the table below under the “Investor Class” and “Institutional Class” headings provides information about hypothetical account values and hypothetical expenses based on the Fund’s actual expense ratios and an assumed rate of return of 5% per year before expenses, which is not the Fund’s actual return. The hypothetical account values and expenses may not be used to estimate the actual ending account balance or expenses you paid for the period. You may use this information to compare the ongoing costs of investing in the Fund and other funds. To do so, compare this 5% hypothetical example with the 5% hypothetical examples that appear in the shareholder reports of the other funds. Please note that the expenses shown in the table are meant to highlight your ongoing costs only and do not reflect any transactional costs, such as sales charges (loads), or exchange fees. Therefore, the second line of the table under the “Investor Class” and “Institutional Class” headings is useful in comparing ongoing costs only, and will not help you determine the relative total costs of owning different funds. In addition, if these transactional costs were included, your costs would have been higher.
HENNESSYFUNDS.COM
| | | | Expenses Paid |
| | Beginning | Ending | During Period(1) |
| | Account Value | Account Value | November 1, 2017 – |
| | November 1, 2017 | April 30, 2018 | April 30, 2018 |
| Investor Class | | | |
| Actual | $1,000.00 | $1,012.60 | $7.19 |
| Hypothetical (5% return before expenses) | $1,000.00 | $1,017.65 | $7.20 |
| | | | |
| Institutional Class | | | |
| Actual | $1,000.00 | $1,014.60 | $5.19 |
| Hypothetical (5% return before expenses) | $1,000.00 | $1,019.64 | $5.21 |
(1) | Expenses are equal to the Fund’s expense ratio of 1.44% for Investor Class shares or 1.04% for Institutional Class shares, as applicable, multiplied by the average account value over the period, multiplied by 181/365 days (to reflect one-half year period). |
| HENNESSY FUNDS | 1-800-966-4354 | |
How to Obtain a Copy of the Fund’s
Proxy Voting Policy and Proxy Voting Records
A description of the policies and procedures the Fund uses to determine how to vote proxies relating to portfolio securities is available without charge (1) by calling 1-800-966-4354, (2) on the Hennessy Funds’ website at hennessyfunds.com/proxy-voting/voting-policy, or (3) on the U.S. Securities and Exchange Commission’s (the “SEC”) website at www.sec.gov. The Fund’s proxy voting record is available without charge on both the Hennessy Funds’ website at hennessyfunds.com/proxy-voting/voting-record and the SEC’s website at www.sec.gov no later than August 31 for the prior 12 months ending June 30.
Quarterly Filings on Form N-Q
The Fund files a complete schedule of portfolio holdings with the SEC for the first and third quarters of each fiscal year on Form N-Q. The Fund’s Forms N-Q are available on the SEC’s website at www.sec.gov. The Fund’s Forms N-Q may be reviewed and copied at the SEC’s Public Reference Room in Washington, DC and information on the operation of the Public Reference Room may be obtained by calling 1-800-SEC-0330. Information included in the Fund’s Forms N-Q will also be available upon request by calling 1-800-966-4354.
Federal Tax Distribution Information
(Unaudited)
For fiscal year 2017, certain dividends paid by the Fund may be subject to a maximum tax rate of 23.8%, as provided for by the Jobs and Growth Tax Relief Reconciliation Act of 2003. The percentage of dividends declared from ordinary income designated as qualified dividend income was 100.00%.
For corporate shareholders, the percent of ordinary income distributions that qualified for the corporate dividends received deduction for fiscal year 2017, was 100.00%.
The percentage of taxable ordinary income distributions that were designated as short-term capital gain distributions under Section 871(k)(2)(C) of the Internal Revenue Code of 1986, as amended, for the Fund was 0.00%.
Important Notice Regarding Delivery of
Shareholder Documents
To help keep the Fund’s costs as low as possible, we generally deliver a single copy of shareholder reports, proxy statements, and prospectuses to shareholders who share an address and have the same last name. This process does not apply to account statements. You may request an individual copy of a shareholder document at any time. If you would like to receive separate mailings of shareholder documents, please call U.S. Bancorp Fund Services, LLC at 1-800-261-6950 or 1-414-765-4124, and individual delivery will begin within 30 days of your request. If your account is held through a financial institution or other intermediary, please contact such intermediary directly to request individual delivery.
HENNESSYFUNDS.COM
| PROXY VOTING — BOARD APPROVAL OF INVESTMENT ADVISORY AGREEMENTS |
Board Approval of Investment Advisory
Agreements
At its meeting on March 7, 2018, the Board of Trustees of the Fund (the “Board,” and the members thereof, the “Trustees”) unanimously approved the continuation of the investment advisory agreement of the Fund with Hennessy Advisors, Inc. (the “Advisor”) and the sub-advisory agreement for the equity allocation of the Fund between the Advisor and The London Company, LLC, and the sub-advisory agreement for the fixed income allocation of the Fund between the Advisor and Financial Counselors, Inc. (with The London Company, LLC and Financial Counselors, Inc. herein referred to as individually as a “Sub-Advisor” and together as the “Sub-Advisors”). As part of the process of approving the continuation of the advisory and sub-advisory agreements, the Trustees reviewed their fiduciary duties with respect to approving the advisory and sub-advisory agreements and the relevant factors for them to consider. In addition, the Trustees who are not deemed “interested persons” (as defined by the Investment Company Act of 1940, as amended) of the Fund (the “Independent Trustees”) met in executive session to discuss the approval of the advisory and sub-advisory agreements.
In advance of the meeting, the Advisor sent detailed information to the Trustees to assist them in their evaluation of the advisory and sub-advisory agreements. This information included, but was not limited to, the following:
| | (1) | A memorandum from outside legal counsel that described the fiduciary duties of the Board with respect to approving the continuation of the advisory and sub-advisory agreements and the relevant factors for consideration; |
| | | |
| | (2) | A memorandum from the Advisor that listed the factors relevant to the Board’s approval of the continuation of the advisory and sub-advisory agreements and also referenced the documents that had been provided to help the Board assess each such factor; |
| | | |
| | (3) | An inventory of the range of services provided by the Advisor and the Sub-Advisors to the Fund; |
| | | |
| | (4) | A written discussion of economies of scale; |
| | | |
| | (5) | The advisory and sub-advisory agreements; |
| | | |
| | (6) | A recent Fund fact sheet, which included, among other things, performance information over various periods; |
| | | |
| | (7) | A peer expense comparison of both the net expense ratio and investment advisory fee of the Fund; |
| | | |
| | (8) | The Advisor’s most recent Form 10-K and Form 10-Q, which includes information about the Advisor’s profitability; |
| | | |
| | (9) | Information about brokerage commissions; |
| | | |
| | (10) | Information about the Fund’s compliance program; |
| | | |
| | (11) | The Advisor’s current Form ADV Part I; |
| | | |
| | (12) | A completed questionnaire from each Sub-Advisor and summary thereof; |
| | | |
| | (13) | Each Sub-Advisor’s Code of Ethics; |
| | | |
| | (14) | Each Sub-Advisor’s Form ADV Parts I and II; and |
| | | |
| | (15) | Financial information for the holding company of each Sub-Advisor. |
| HENNESSY FUNDS | 1-800-966-4354 | |
All of the factors discussed were considered as a whole by the Trustees, and also by the Independent Trustees meeting in executive session. The factors were viewed in their totality by the Trustees, with no single factor being the principal or determinative factor in the Trustees’ determination of whether to approve the continuation of the advisory and sub-advisory agreements. The Trustees recognized that the management and fee arrangements for the Fund are the result of years of review and discussion between the Independent Trustees and the Advisor, that certain aspects of such arrangements may receive greater scrutiny in some years than in others, and that the Trustees’ conclusions may be based, in part, on their consideration of these same arrangements and information received during the course of the year and in prior years.
Prior to approving the continuation of the advisory and sub-advisory agreements, the Trustees, including the Independent Trustees in executive session, considered, among other items:
| | (1) | The nature and quality of the advisory services provided by the Advisor and the Sub-Advisors; |
| | | |
| | (2) | A comparison of the fees and expenses of the Fund to other similar funds; |
| | | |
| | (3) | Whether economies of scale are recognized by the Fund; |
| | | |
| | (4) | The costs and profitability of the Fund to the Advisor and the Sub-Advisors; |
| | | |
| | (5) | The performance of the Fund; and |
| | | |
| | (6) | Any benefits to the Advisor and the Sub-Advisors from serving as an investment advisor to the Fund (other than the advisory and sub-advisory fees). |
The material considerations and determinations of the Trustees, including the Independent Trustees, were as follows:
| | (1) | The Trustees considered the services identified below that are provided by the Advisor. Based on this review, the Trustees concluded that the Advisor provides high-quality services to the Fund, and they noted that their overall confidence in the Advisor is high. The Trustees also concluded that they were satisfied with the nature, extent, and quality of the advisory services provided to the Fund by the Advisor, and that the nature and extent of the services provided by the Advisor are appropriate to assure that the Fund’s operations are conducted in compliance with applicable laws, rules, and regulations. |
| | | (a) | The Advisor oversees the Sub-Advisors for the Fund, and the Sub-Advisors act as the portfolio managers for the Fund. |
| | | | |
| | | (b) | The Advisor performs a daily reconciliation of portfolio positions and cash for the Fund. |
| | | | |
| | | (c) | The Advisor monitors the Fund’s compliance with its investment objectives and restrictions. |
| | | | |
| | | (d) | The Advisor monitors compliance with federal securities laws and performs activities such as maintaining a compliance program, conducting ongoing reviews of the compliance programs of the Sub-Advisors and the Fund’s other service providers, conducting on-site visits to the Sub-Advisors and the Fund’s other service providers, monitoring incidents of abusive trading practices, reviewing Fund expense accruals, payments, and fixed expense ratios, evaluating insurance providers for fidelity bond coverage and D&O/E&O insurance coverage, conducting employee compliance training, reviewing reports provided by service providers, maintaining books and records, and preparing an annual compliance report for the Board. |
| BOARD APPROVAL OF INVESTMENT ADVISORY AGREEMENTS |
| | | (e) | The Advisor oversees the selection and continued employment of each Sub-Advisor, reviews the Fund’s investment performance, and monitors each Sub-Advisor’s adherence to the Fund’s investment objectives, policies, and restrictions. |
| | | | |
| | | (f) | The Advisor oversees service providers that provide accounting, administration, distribution, transfer agency, custodial, sales, marketing, public relations, audit, information technology, and legal services to the Fund. |
| | | | |
| | | (g) | The Advisor maintains in-house marketing and distribution departments on behalf of the Fund. |
| | | | |
| | | (h) | The Advisor is actively involved with preparing regulatory filings for the Fund, including writing and annually updating the Fund’s prospectus and related documents. |
| | | | |
| | | (i) | The Advisor reviews the written summaries prepared by the Sub-Advisors of the Fund’s performance for the most recent 12-month period for each annual report of the Fund. |
| | | | |
| | | (j) | The Advisor oversees distribution of the Fund through third-party broker/dealers and independent financial institutions such as Charles Schwab, Inc., Fidelity, TD Waterhouse, and Pershing. The Advisor participates in “no transaction fee” (“NTF”) programs with these companies on behalf of the Fund, which allow customers to purchase the Fund through third-party distribution channels without paying a transaction fee. The Advisor compensates, in part, a number of these third-party providers of NTF programs out of its own revenues. |
| | | | |
| | | (k) | The Advisor pays the incentive compensation of the Fund’s compliance officers and employs other staff, such as legal, marketing, national accounts, distribution, sales, administrative, and trading oversight personnel, as well as management executives. |
| | | | |
| | | (l) | The Advisor provides a quarterly compliance certification to the Board. |
| | | | |
| | | (m) | The Advisor prepares or reviews Board materials, frequently presents to the Board or leads Board discussions, prepares or reviews meeting minutes, and arranges for Board training and education. |
| | (2) | The Trustees considered the services identified below that are provided by each Sub-Advisor: |
| | | (a) | Each Sub-Advisor acts as the portfolio manager for the Fund. In this capacity, each Sub-Advisor does the following: |
| | | | (i) | manages the composition of the Fund’s portfolio, including the purchase, retention, and disposition of portfolio securities in accordance with the Fund’s investment objectives, policies, and restrictions; |
| | | | | |
| | | | (ii) | ensures compliance with “best execution” for the Fund’s portfolio; |
| | | | | |
| | | | (iii) | manages the use of soft dollars for the Fund; and |
| | | | | |
| | | | (iv) | manages proxy voting for the Fund. |
| | | (b) | Each Sub-Advisor ensures that its compliance program includes policies and procedures relevant to the Fund and the Sub-Advisor’s duties as a portfolio manager to the Fund. |
| HENNESSY FUNDS | 1-800-966-4354 | |
| | | (c) | Each Sub-Advisor prepares a written summary of the Fund’s performance (with respect to the equity allocation or the fixed income allocation, as applicable) for the most recent 12-month period for each annual report of the Fund. |
| | | | |
| | | (d) | Each Sub-Advisor provides a quarterly compliance certification to the Board regarding trading and allocation practices, supervisory matters, the Sub-Advisor’s compliance program (including its code of ethics), compliance with the Fund’s policies, and general firm updates. |
| | (3) | The Trustees considered the distinction between the services performed by the Advisor and the Sub-Advisors. The Trustees noted that the management of the Fund, including the oversight of the Sub-Advisors, involves more comprehensive and substantive duties than the duties of the Sub-Advisors. Specifically, the Trustees considered the lists of services identified above and concluded that the services performed by the Advisor for the Fund require a higher level of service and oversight than the services performed by the Sub-Advisors. Based on this determination, the Trustees concluded that the differential in advisory fees between the Advisor and the Sub-Advisors is reasonable. |
| | | |
| | (4) | The Trustees compared the performance of the Fund to benchmark indices over various time periods and also noted that the Trustees review and discuss reports comparing the investment performance of the Fund to various indices at each quarterly Board meeting. Based on all such information, the Trustees believe that the Advisor and the Sub-Advisors manage the Fund in a manner that is materially consistent with its stated investment objective and style. The Trustees concluded that the performance of the Fund over various time periods warranted the continuation of the advisory and sub-advisory agreements. |
| | | |
| | (5) | The Trustees reviewed the advisory fees and overall expense ratios of the Fund compared to other funds similar in asset size and investment objective to the Fund using data from Morningstar. As part of the discussion with management, the Trustees ensured that they understood and were comfortable with the criteria used to determine the mutual funds included in the Morningstar categories for purposes of the materials considered at the meeting. The Trustees determined that the advisory fee and overall expense ratio of the Fund falls within the range of the advisory fees and overall expense ratios of other comparable funds and concluded that they are reasonable and warranted continuation of the advisory and sub-advisory agreements. |
| | | |
| | (6) | The Trustees also considered whether economies of scale were being realized by the Advisor that should be shared with the Fund’s shareholders. The Trustees noted that many of the expenses incurred to manage the Fund are asset-based fees and thus do not result in material economies of scale being realized as the assets of the Fund increase. For example, mutual fund platform fees increase as the Fund’s assets grow. The Trustees also considered the Advisor’s efforts to contain expenses, the Advisor’s significant marketing efforts to promote the Funds, and the Advisor’s agreement to waive fees or lower its management fees in certain circumstances. The Trustees noted that at current asset levels it did not appear that there were economies of scale being realized by the Advisor and concluded that it would continue to monitor economies of scale in the future as circumstances changed. |
| BOARD APPROVAL OF INVESTMENT ADVISORY AGREEMENTS |
| | (7) | The Trustees considered the profitability of the Advisor and the Sub-Advisors, including the impact of mutual fund platform fees on the Advisor’s profitability, and also considered the resources and revenues that the Advisor has put into managing and distributing the Fund. The Trustees then concluded that the profits of the Advisor and the Sub-Advisors are reasonable and not excessive when compared to profitability guidelines set forth in relevant court cases. |
| | | |
| | (8) | The Trustees considered the high level of professionalism and knowledge of the Advisor’s employees, along with a very low level of turnover, and concluded that this was beneficial to the Fund and its shareholders. |
| | | |
| | (9) | The Trustees considered any benefits to the Advisor and the Sub-Advisors from serving as an advisor to the Fund (other than the advisory and sub-advisory fees). The Trustees noted that the Advisor and the Sub-Advisors may derive ancillary benefits from, by way of example, their association with the Fund in the form of proprietary and third-party research products and services received from broker-dealers that execute portfolio trades for the Fund. The Trustees determined that any such products and services have been used for legitimate purposes relating to the Fund by providing assistance in the investment decision-making process. The Trustees concluded that any additional benefits realized by the Advisor and the Sub-Advisors from their relationship with the Fund were reasonable. |
After reviewing the materials provided at the meeting and management’s presentation, as well as other information regularly provided at the Board’s quarterly meetings throughout the year regarding the quality of services provided by the Advisor and the Sub-Advisors, the performance of the Fund, expense information, regulatory compliance issues, trading information and related matters, and other factors that the Trustees deemed relevant, the Trustees, including the Independent Trustees, approved the continuation of the advisory and sub-advisory agreements.
| HENNESSY FUNDS | 1-800-966-4354 | |
(This Page Intentionally Left Blank.)
For information, questions or assistance, please call
The Hennessy Funds
1-800-966-4354 or 1-415-899-1555
INVESTMENT ADVISOR
Hennessy Advisors, Inc.
7250 Redwood Boulevard, Suite 200
Novato, California 94945
ADMINISTRATOR,
TRANSFER AGENT,
DIVIDEND PAYING AGENT &
SHAREHOLDER SERVICING AGENT
U.S. Bancorp Fund Services, LLC
P.O. Box 701
Milwaukee, Wisconsin 53201-0701
CUSTODIAN
U.S. Bank N.A.
Custody Operations
1555 North River Center Drive, Suite 302
Milwaukee, Wisconsin 53212
TRUSTEES
Neil J. Hennessy
Robert T. Doyle
J. Dennis DeSousa
Gerald P. Richardson
COUNSEL
Foley & Lardner LLP
777 East Wisconsin Avenue
Milwaukee, Wisconsin 53202-5306
INDEPENDENT REGISTERED
PUBLIC ACCOUNTING FIRM
Tait, Weller & Baker LLP
1818 Market Street, Suite 2400
Philadelphia, Pennsylvania 19103
DISTRIBUTOR
Quasar Distributors, LLC
777 East Wisconsin Avenue
Milwaukee, Wisconsin 53202
hennessyfunds.com | 1-800-966-4354
This report has been prepared for shareholders and may be distributed to
others only if preceded or accompanied by a current prospectus.
SEMI-ANNUAL REPORT
APRIL 30, 2018
HENNESSY BALANCED
FUND
Investor Class HBFBX
hennessyfunds.com | 1-800-966-4354
(This Page Intentionally Left Blank.)
Contents
| Letter to Shareholders | 2 |
| Performance Overview | 4 |
| Financial Statements | |
| Schedule of Investments | 5 |
| Statement of Assets and Liabilities | 8 |
| Statement of Operations | 9 |
| Statements of Changes in Net Assets | 11 |
| Financial Highlights | 12 |
| Notes to the Financial Statements | 14 |
| Expense Example | 20 |
| Proxy Voting Policy and Proxy Voting Records | 21 |
| Quarterly Schedule of Investments | 21 |
| Federal Tax Distribution Information | 21 |
| Important Notice Regarding Delivery of Shareholder Documents | 21 |
| Board Approval of Investment Advisory Agreement | 22 |
| HENNESSY FUNDS | 1-800-966-4354 | |
May 2018
Dear Hennessy Funds Shareholder:
Investors in the United States and abroad experienced the return of volatility in the six months ended April 30, 2018, especially during the second half of the period. Equities rallied sharply during the first half of the period and fell back during the second half, but nevertheless ended the period with solid gains, with the Dow Jones Industrial Average posting a total return of 4.5% and the S&P 500 Index up 3.8%. Over the past year, I have repeatedly shared my belief that the stock market was due for a correction, but that it would bounce back, as it has so many times during the current bull market.
In the closing months of 2017 and into January 2018, U.S. equities rallied in response to the enactment of the Tax Cuts and Jobs Act of 2017, which significantly lowered corporate tax rates. Investors were also encouraged by two quarters of real GDP growth of 3.2% and 2.9%. However, equity prices quickly lost ground in reaction to the imposition of trade tariffs on steel and aluminum, and fears that additional proposed tariffs could provoke a trade war with China. Signals from the Federal Reserve that the pace of interest rate increases would move slightly higher also weighed on investors. During the period, the federal funds rate was raised twice, by a quarter point each time, in December 2017 and March 2018.
The current bull market in U.S. equities is now entering its 10th year, and we remain optimistic about the outlook for stock prices. In our opinion, economic fundamentals look positive. The U.S. economy is growing at a solid pace of 2 – 3% annually, inflation is low, and high employment levels are supporting healthy growth in consumption. Wages are rising, but the rate of increase has remained steady at around 2.6% per year since mid-2016. While it appears that the Federal Reserve will continue to raise the federal funds rate and normalize monetary policy, we believe it will be able to do so gradually, avoiding a severe jolt to either financial markets or the economy. Meanwhile, companies continue to report robust earnings growth, boosted this year by lower tax rates.
We believe U.S. equities remain attractively valued. U.S. long bond yields are hovering near 3%, having risen over the period in response to strong economic activity. Prospective PE multiples, however, have dropped significantly since the end of 2017, the result of a combination of lower taxes, higher operating earnings, and lower stock prices. The Dow Jones Industrial Average and the S&P 500 Index are trading at about 17x forward earnings, down from approximately 20x at the beginning of the calendar year, valuations we believe to be very reasonable.
We are not overly concerned about recent protectionist actions by the U.S. administration. We consider the announcements and ongoing discussions regarding import tariffs and NAFTA to be representative of standard Trump deal-making tactics – make far-reaching demands and then negotiate a reasonable outcome that is beneficial to both sides. We expect continued pro-business policies and regulatory relief to be enacted by our leaders in Washington.
Finally, as noted many times in past letters during this bull market, the euphoria that has historically accompanied a peak in the market continues to be absent. Investors today are worried about many things, including higher interest rates, larger budget deficits, higher import tariffs, and political distractions. But they are definitely not euphoric. In the past, I have likened the current bull market to the 1982-2000 bull market, and I continue
HENNESSYFUNDS.COM
to believe the comparison is a good one. We remain confident that the market will be able to weather the current period of volatility and that the economy, despite higher interest rates and possible trade disruptions, is resilient enough to continue its steady growth into the coming year.
Thank you for your continued confidence and investment in the Hennessy Funds. If you have any questions or would like to speak with us directly, please don’t hesitate to call us at (800) 966-4354.
Best regards,
Neil J. Hennessy
President and Chief Investment Officer
Past performance does not guarantee future results.
Mutual fund investing involves risk. Principal loss is possible.
Opinions expressed are those of Neil Hennessy and are subject to change, are not guaranteed, and should not be considered investment advice.
The Dow Jones Industrial Average and S&P 500 Index are unmanaged indices commonly used to measure the performance of U.S. stocks. One cannot invest directly in an index.
Price to earnings (PE) is calculated by dividing a company’s market price per share by its earnings per share. Earnings growth is not a measure of a fund’s future performance.
| HENNESSY FUNDS | 1-800-966-4354 | |
Performance Overview (Unaudited)
AVERAGE ANNUAL TOTAL RETURN FOR PERIODS ENDED APRIL 30, 2018
| | Six | One | Five | Ten |
| | Months(1) | Year | Years | Years |
| Hennessy Balanced Fund (HBFBX) | 1.62% | 5.95% | 4.44% | 4.14% |
| 50/50 Blended DJIA/Treasury Index | 2.49% | 9.18% | 6.67% | 5.26% |
| Dow Jones Industrial Average | 4.51% | 18.09% | 12.96% | 9.39% |
Expense ratio: 1.83%
(1) | Periods less than one year are not annualized. |
___________________
Performance data quoted represents past performance; past performance does not guarantee future results. The investment return and principal value of an investment will fluctuate so that an investor’s shares, when redeemed, may be worth more or less than their original cost. The performance table does not reflect the deduction of taxes that a shareholder would pay on Fund distributions or the redemption of Fund shares. Current performance of the Fund may be lower or higher than the performance quoted. Performance data current to the most recent month end may be obtained by visiting hennessyfunds.com.
The 50/50 Blended DJIA/Treasury Index consists of 50% common stocks represented by the Dow Jones Industrial Average and 50% short-duration Treasury securities represented by the ICE BofAML 1-Year U.S. Treasury Note Index. The Dow Jones Industrial Average is an unmanaged index commonly used to measure the performance of U.S. stocks. The ICE BofAML 1-Year U.S. Treasury Note Index is an unmanaged index comprised of Treasury securities maturing in approximately one year. One cannot invest directly in an index.
The expense ratio presented is from the most recent prospectus. The expense ratio for the current reporting period is available in the Financial Highlights section of this report.
HENNESSYFUNDS.COM
| PERFORMANCE OVERVIEW/SCHEDULE OF INVESTMENTS |
Financial Statements
Schedule of Investments as of April 30, 2018 (Unaudited) |
HENNESSY BALANCED FUND
(% of Net Assets)
| TOP TEN HOLDINGS | % NET ASSETS |
| U.S. Treasury Bill,1.830%, 01/31/2019 | 16.69% |
| U.S. Treasury Bill, 1.680%, 05/24/2018 | 8.47% |
| U.S. Treasury Bill, 1.780%, 06/21/2018 | 8.46% |
| U.S. Treasury Bill, 1.650%, 12/06/2018 | 8.38% |
| Cisco Systems, Inc. | 5.74% |
| Chevron Corp. | 5.12% |
| International Business Machines Corp. | 4.76% |
| Pfizer, Inc. | 4.73% |
| Verizon Communications, Inc. | 4.69% |
| Exxon Mobil Corp. | 4.52% |
Note: For presentation purposes, the Fund has grouped some of the industry categories. For purposes of categorizing securities for compliance with Section 8(b)(1) of the Investment Company Act of 1940, as amended, the Fund uses more specific industry classifications.
The Global Industry Classification Standard (GICS®) was developed by and is the exclusive property and a service mark of MSCI, Inc. and Standard & Poor Financial Services LLC. It has been licensed for use by the Hennessy Funds.
| HENNESSY FUNDS | 1-800-966-4354 | |
| COMMON STOCKS – 47.64% | | Number | | | | | | % of | |
| | | of Shares | | | Value | | | Net Assets | |
| Consumer Staples – 8.26% | | | | | | | | | |
| The Coca-Cola Co. | | | 11,350 | | | $ | 490,433 | | | | 4.15 | % |
| The Procter & Gamble Co. | | | 6,700 | | | | 484,678 | | | | 4.11 | % |
| | | | | | | | 975,111 | | | | 8.26 | % |
| | | | | | | | | | | | | |
| Energy – 9.64% | | | | | | | | | | | | |
| Chevron Corp. | | | 4,830 | | | | 604,281 | | | | 5.12 | % |
| Exxon Mobil Corp. | | | 6,850 | | | | 532,588 | | | | 4.52 | % |
| | | | | | | | 1,136,869 | | | | 9.64 | % |
| | | | | | | | | | | | | |
| Health Care – 6.33% | | | | | | | | | | | | |
| Merck & Co., Inc. | | | 3,200 | | | | 188,384 | | | | 1.60 | % |
| Pfizer, Inc. | | | 15,252 | | | | 558,376 | | | | 4.73 | % |
| | | | | | | | 746,760 | | | | 6.33 | % |
| | | | | | | | | | | | | |
| Industrials – 4.54% | | | | | | | | | | | | |
| Caterpillar, Inc. | | | 980 | | | | 141,473 | | | | 1.20 | % |
| General Electric Co. | | | 28,052 | | | | 394,691 | | | | 3.34 | % |
| | | | | | | | 536,164 | | | | 4.54 | % |
| | | | | | | | | | | | | |
| Information Technology – 14.18% | | | | | | | | | | | | |
| Cisco Systems, Inc. | | | 15,300 | | | | 677,637 | | | | 5.74 | % |
| Intel Corp. | | | 8,400 | | | | 433,608 | | | | 3.68 | % |
| International Business Machines Corp. | | | 3,872 | | | | 561,285 | | | | 4.76 | % |
| | | | | | | | 1,672,530 | | | | 14.18 | % |
| | | | | | | | | | | | | |
| Telecommunication Services – 4.69% | | | | | | | | | | | | |
| Verizon Communications, Inc. | | | 11,208 | | | | 553,115 | | | | 4.69 | % |
| | | | | | | | | | | | | |
| Total Common Stocks | | | | | | | | | | | | |
| (Cost $5,233,743) | | | | | | | 5,620,549 | | | | 47.64 | % |
The accompanying notes are an integral part of these financial statements.
HENNESSYFUNDS.COM
| SHORT-TERM INVESTMENTS – 51.62% | | Number of Shares/ | | | | | | % of | |
| | | Par Amount | | | Value | | | Net Assets | |
| Money Market Funds – 1.21% | | | | | | | | | |
| Fidelity Government Portfolio, Institutional Class, 1.58% (a) | | | 143,171 | | | $ | 143,171 | | | | 1.21 | % |
| | | | | | | | | | | | | |
| U.S. Treasury Bills – 50.41% | | | | | | | | | | | | |
| 1.680%, 05/24/2018 (b) | | | 1,000,000 | | | | 999,288 | | | | 8.47 | % |
| 1.780%, 06/21/2018 (b) | | | 1,000,000 | | | | 998,328 | | | | 8.46 | % |
| 1.760%, 07/19/2018 (b) | | | 500,000 | | | | 498,080 | | | | 4.22 | % |
| 2.000%, 11/08/2018 (b) | | | 500,000 | | | | 494,932 | | | | 4.19 | % |
| 1.650%, 12/06/2018 (b) | | | 1,000,000 | | | | 988,851 | | | | 8.38 | % |
| 1.830%, 01/31/2019 (b) | | | 2,000,000 | | | | 1,968,719 | | | | 16.69 | % |
| | | | | | | | 5,948,198 | | | | 50.41 | % |
| Total Short-Term Investments | | | | | | | | | | | | |
| (Cost $6,096,875) | | | | | | | 6,091,369 | | | | 51.62 | % |
| | | | | | | | | | | | | |
| Total Investments | | | | | | | | | | | | |
| (Cost $11,330,618) – 99.26% | | | | | | | 11,711,918 | | | | 99.26 | % |
| Other Assets in Excess of Liabilities – 0.74% | | | | | | | 86,912 | | | | 0.74 | % |
| | | | | | | | | | | | | |
TOTAL NET ASSETS – 100.00% | | | | | | $ | 11,798,830 | | | | 100.00 | % |
Percentages are stated as a percent of net assets.
| (a) | The rate listed is the fund’s seven-day yield as of April 30, 2018. |
| (b) | The rate listed is discount rate at issue. |
Summary of Fair Value Exposure at April 30, 2018
The following is a summary of the inputs used to value the Fund’s net assets as of April 30, 2018 (See Note 3 in the accompanying notes to the financial statements):
| Common Stocks | | Level 1 | | | Level 2 | | | Level 3 | | | Total | |
| Consumer Staples | | $ | 975,111 | | | $ | — | | | $ | — | | | $ | 975,111 | |
| Energy | | | 1,136,869 | | | | — | | | | — | | | | 1,136,869 | |
| Health Care | | | 746,760 | | | | — | | | | — | | | | 746,760 | |
| Industrials | | | 536,164 | | | | — | | | | — | | | | 536,164 | |
| Information Technology | | | 1,672,530 | | | | — | | | | — | | | | 1,672,530 | |
| Telecommunication Services | | | 553,115 | | | | — | | | | — | | | | 553,115 | |
| Total Common Stocks | | $ | 5,620,549 | | | $ | — | | | $ | — | | | $ | 5,620,549 | |
| Short-Term Investments | | | | | | | | | | | | | | | | |
| Money Market Funds | | $ | 143,171 | | | $ | — | | | $ | — | | | $ | 143,171 | |
| U.S. Treasury Bills | | | — | | | | 5,948,198 | | | | — | | | | 5,948,198 | |
| Total Short-Term Investments | | $ | 143,171 | | | $ | 5,948,198 | | | $ | — | | | $ | 6,091,369 | |
| Total Investments | | $ | 5,763,720 | | | $ | 5,948,198 | | | $ | — | | | $ | 11,711,918 | |
Transfers between levels are recognized at the end of the reporting period. During the six-month period ended April 30, 2018, the Fund recognized no transfers between levels.
The accompanying notes are an integral part of these financial statements.
| HENNESSY FUNDS | 1-800-966-4354 | |
Financial Statements
Statement of Assets and Liabilities as of April 30, 2018 (Unaudited) |
| ASSETS: | | | |
| Investments in securities, at value (cost $11,330,618) | | $ | 11,711,918 | |
| Dividends and interest receivable | | | 11,409 | |
| Receivable for fund shares sold | | | 250 | |
| Receivable for securities sold | | | 845,810 | |
| Prepaid expenses and other assets | | | 14,882 | |
| Total Assets | | | 12,584,269 | |
| | | | | |
| LIABILITIES: | | | | |
| Payable for securities purchased | | | 703,464 | |
| Payable to advisor | | | 5,826 | |
| Payable to administrator | | | 1,739 | |
| Payable to auditor | | | 9,699 | |
| Accrued distribution fees | | | 46,023 | |
| Accrued service fees | | | 971 | |
| Accrued trustees fees | | | 4,666 | |
| Accrued expenses and other payables | | | 13,051 | |
| Total Liabilities | | | 785,439 | |
| NET ASSETS | | $ | 11,798,830 | |
| | | | | |
| NET ASSETS CONSIST OF: | | | | |
| Capital stock | | $ | 10,861,624 | |
| Accumulated net investment income | | | 5,173 | |
| Accumulated net realized gain on investments | | | 550,733 | |
| Unrealized net appreciation on investments | | | 381,300 | |
| Total Net Assets | | $ | 11,798,830 | |
| | | | | |
| NET ASSETS | | | | |
| Investor Class: | | | | |
| Shares authorized (no par value) | | Unlimited | |
| Net assets applicable to outstanding Investor Class shares | | $ | 11,798,830 | |
| Shares issued and outstanding | | | 969,407 | |
| Net asset value, offering price and redemption price per share | | $ | 12.17 | |
The accompanying notes are an integral part of these financial statements.
HENNESSYFUNDS.COM
| STATEMENT OF ASSETS AND LIABILITIES/STATEMENT OF OPERATIONS |
Financial Statements
Statement of Operations for the six months ended April 30, 2018 (Unaudited) |
| INVESTMENT INCOME: | | | |
| Dividend income | | $ | 104,004 | |
| Interest income | | | 39,969 | |
| Total investment income | | | 143,973 | |
| | | | | |
| EXPENSES: | | | | |
| Investment advisory fees (See Note 5) | | | 36,334 | |
| Compliance expense (See Note 5) | | | 14,628 | |
| Audit fees | | | 10,981 | |
| Federal and state registration fees | | | 10,452 | |
| Trustees’ fees and expenses | | | 9,243 | |
| Distribution fees – Investor Class (See Note 5) | | | 9,084 | |
| Service fees – Investor Class (See Note 5) | | | 6,056 | |
| Administration, fund accounting, custody and transfer agent fees (See Note 5) | | | 5,695 | |
| Sub-transfer agent expenses – Investor Class (See Note 5) | | | 3,791 | |
| Reports to shareholders | | | 3,189 | |
| Other expenses | | | 1,791 | |
| Total expenses | | | 111,244 | |
| NET INVESTMENT INCOME | | $ | 32,729 | |
| | | | | |
| REALIZED AND UNREALIZED GAINS: | | | | |
| Net realized gain on investments | | $ | 567,050 | |
| Net change in unrealized appreciation on investments | | | (389,254 | ) |
| Net gain on investments | | | 177,796 | |
| NET INCREASE IN NET ASSETS RESULTING FROM OPERATIONS | | $ | 210,525 | |
The accompanying notes are an integral part of these financial statements.
| HENNESSY FUNDS | 1-800-966-4354 | |
(This Page Intentionally Left Blank.)
| STATEMENTS OF CHANGES IN NET ASSETS |
Financial Statements
| Statements of Changes in Net Assets |
| | | Six Months Ended | | | | |
| | | April 30, 2018 | | | Year Ended | |
| | | (Unaudited) | | | October 31, 2017 | |
| OPERATIONS: | | | | | | |
| Net investment income | | $ | 32,729 | | | $ | 54,758 | |
| Net realized gain on investments | | | 567,050 | | | | 900,400 | |
| Net change in unrealized appreciation on investments | | | (389,254 | ) | | | 149,079 | |
| Net increase in net assets resulting from operations | | | 210,525 | | | | 1,104,237 | |
| | | | | | | | | |
| DISTRIBUTIONS TO SHAREHOLDERS FROM: | | | | | | | | |
| Net investment income – Investor Class | | | (34,125 | ) | | | (48,189 | ) |
| Net realized gains – Investor Class | | | (849,746 | ) | | | (845,247 | ) |
| Total distributions | | | (883,871 | ) | | | (893,436 | ) |
| | | | | | | | | |
| CAPITAL SHARE TRANSACTIONS: | | | | | | | | |
| Proceeds from shares subscribed – Investor Class | | | 378,431 | | | | 991,429 | |
| Dividends reinvested – Investor Class | | | 867,577 | | | | 877,425 | |
| Cost of shares redeemed – Investor Class | | | (1,012,781 | ) | | | (1,920,997 | ) |
| Net increase (decrease) in net assets derived | | | | | | | | |
| from capital share transactions | | | 233,227 | | | | (52,143 | ) |
| TOTAL INCREASE (DECREASE) IN NET ASSETS | | | (440,119 | ) | | | 158,658 | |
| | | | | | | | | |
| NET ASSETS: | | | | | | | | |
| Beginning of period | | | 12,238,949 | | | | 12,080,291 | |
| End of period | | $ | 11,798,830 | | | $ | 12,238,949 | |
| Undistributed net investment income, end of period | | $ | 5,173 | | | $ | 6,569 | |
| | | | | | | | | |
| CHANGES IN SHARES OUTSTANDING: | | | | | | | | |
| Shares sold – Investor Class | | | 29,378 | | | | 79,582 | |
| Shares issued to holders as reinvestment | | | | | | | | |
| of dividends – Investor Class | | | 71,509 | | | | 72,055 | |
| Shares redeemed – Investor Class | | | (81,643 | ) | | | (154,177 | ) |
| Net increase (decrease) in shares outstanding | | | 19,244 | | | | (2,540 | ) |
The accompanying notes are an integral part of these financial statements.
| HENNESSY FUNDS | 1-800-966-4354 | |
Financial Statements
For an Investor Class share outstanding throughout each period
| | | Six Months Ended | |
| | | April 30, 2018 | |
| | | (Unaudited) | |
| PER SHARE DATA: | | | |
| Net asset value, beginning of period | | $ | 12.88 | |
| | | | | |
| Income from investment operations: | | | | |
| Net investment income | | | 0.03 | |
| Net realized and unrealized gains (losses) on investments | | | 0.17 | |
| Total from investment operations | | | 0.20 | |
| | | | | |
| Less distributions: | | | | |
| Dividends from net investment income | | | (0.03 | ) |
| Dividends from net realized gains | | | (0.88 | ) |
| Total distributions | | | (0.91 | ) |
| Net asset value, end of period | | $ | 12.17 | |
| | | | | |
| TOTAL RETURN | | | 1.62 | %(1) |
| | | | | |
| SUPPLEMENTAL DATA AND RATIOS: | | | | |
| Net assets, end of period (millions) | | $ | 11.80 | |
| Ratio of expenses to average net assets | | | 1.84 | %(2) |
| Ratio of net investment income to average net assets | | | 0.54 | %(2) |
| Portfolio turnover rate | | | 9 | %(1) |
(1) | Not annualized. |
(2) | Annualized. |
The accompanying notes are an integral part of these financial statements.
HENNESSYFUNDS.COM
| FINANCIAL HIGHLIGHTS — INVESTOR CLASS |
| Year Ended October 31, | | |
| 2017 | | | 2016 | | | 2015 | | | 2014 | | | 2013 | | |
| | | | | | | | | | | | | | | |
| $ | 12.68 | | | $ | 12.37 | | | $ | 12.98 | | | $ | 12.90 | | | $ | 11.88 | | |
| | | | | | | | | | | | | | | | | | | | |
| | | | | | | | | | | | | | | | | | | | |
| | 0.06 | | | | 0.04 | | | | 0.03 | | | | 0.02 | | | | 0.02 | | |
| | 1.09 | | | | 0.58 | | | | (0.01 | ) | | | 0.51 | | | | 1.02 | | |
| | 1.15 | | | | 0.62 | | | | 0.02 | | | | 0.53 | | | | 1.04 | | |
| | | | | | | | | | | | | | | | | | | | |
| | | | | | | | | | | | | | | | | | | | |
| | (0.05 | ) | | | (0.04 | ) | | | (0.03 | ) | | | (0.01 | ) | | | (0.02 | ) | |
| | (0.90 | ) | | | (0.27 | ) | | | (0.60 | ) | | | (0.44 | ) | | | — | | |
| | (0.95 | ) | | | (0.31 | ) | | | (0.63 | ) | | | (0.45 | ) | | | (0.02 | ) | |
| $ | 12.88 | | | $ | 12.68 | | | $ | 12.37 | | | $ | 12.98 | | | $ | 12.90 | | |
| | | | | | | | | | | | | | | | | | | | |
| | 9.56 | % | | | 5.20 | % | | | 0.11 | % | | | 4.26 | % | | | 8.77 | % | |
| | | | | | | | | | | | | | | | | | | | |
| | | | | | | | | | | | | | | | | | | | |
| $ | 12.24 | | | $ | 12.08 | | | $ | 11.63 | | | $ | 12.54 | | | $ | 12.21 | | |
| | 1.82 | % | | | 1.68 | % | | | 1.68 | % | | | 1.75 | % | | | 1.75 | % | |
| | 0.45 | % | | | 0.33 | % | | | 0.20 | % | | | 0.17 | % | | | 0.14 | % | |
| | 31 | % | | | 51 | % | | | 34 | % | | | 23 | % | | | 22 | % | |
The accompanying notes are an integral part of these financial statements.
| HENNESSY FUNDS | 1-800-966-4354 | |
Financial Statements
Notes to the Financial Statements April 30, 2018 (Unaudited) |
1). ORGANIZATION
The Hennessy Balanced Fund (the “Fund”) is a series of Hennessy Funds Trust (the “Trust”), which was organized as a Delaware statutory trust on September 17, 1992. The Fund is an open-end management investment company registered under the Investment Company Act of 1940, as amended. The investment objective of the Fund is a combination of capital appreciation and current income. The Fund is a non-diversified fund and offers Investor Class shares.
As an investment company, the Fund follows the investment company accounting and reporting guidance of the Financial Accounting Standards Board (“FASB”) Accounting Standard Codification Topic 946 “Financial Services—Investment Companies.”
2). SIGNIFICANT ACCOUNTING POLICIES
The following is a summary of significant accounting policies consistently followed by the Fund in the preparation of the financial statements. These policies conform to U.S. generally accepted accounting principles (“GAAP”).
| a). | Investment Valuation – All investments in securities are recorded at their estimated fair value, as described in Note 3. |
| | |
| b). | Federal Income Taxes – No provision for federal income taxes or excise taxes has been made because the Fund has elected to be taxed as a “regulated investment company” and intends to distribute substantially all of its taxable income to its shareholders and otherwise comply with the provisions of the Internal Revenue Code of 1986, as amended, applicable to regulated investment companies. Net investment income/loss and realized gains/losses for federal income tax purposes may differ from those reported in the financial statements because of temporary book and tax basis differences. Temporary differences are primarily the result of the treatment of wash sales for tax reporting purposes. The Fund recognizes interest and penalties related to income tax benefits, if any, in the Statement of Operations as an income tax expense. Distributions from net realized gains for book purposes may include short-term capital gains, which are included as ordinary income to shareholders for tax purposes. The Fund may utilize equalization accounting for tax purposes and designate earnings and profits, including net realized gains distributed to shareholders on redemption of shares, as part of the dividends paid deduction for income tax purposes. |
| | |
| c). | Accounting for Uncertainty in Income Taxes – The Fund has accounting policies regarding recognition and measurement of tax positions taken or expected to be taken on a tax return. The tax returns of the Fund for the prior three fiscal years are open for examination. The Fund has reviewed all open tax years in major jurisdictions and concluded that there is no impact on the Fund’s net assets and no tax liability resulting from unrecognized tax benefits relating to uncertain income tax positions taken or expected to be taken on a tax return. The Fund’s major tax jurisdictions are U.S. federal and Delaware. |
| | |
| d). | Income and Expenses – Dividend income is recognized on the ex-dividend date or as soon as information is available to the Fund. Interest income, which includes the amortization of premium and accretion of discount, is recognized on an accrual basis. |
| NOTES TO THE FINANCIAL STATEMENTS |
| | The Fund is charged for those expenses that are directly attributable to the portfolio, such as advisory, administration, and certain shareholder service fees. |
| | |
| e). | Distributions to Shareholders – Dividends from net investment income for the Fund, if any, are declared and paid at the end of each calendar quarter. Distributions of net realized capital gains, if any, are declared and paid annually, usually in December. |
| | |
| f). | Security Transactions – Investment and shareholder transactions are recorded on the trade date. The Fund determines the realized gain/loss from an investment transaction by comparing the original cost of the security lot sold with the net sale proceeds. Discounts and premiums on securities purchased are accreted or amortized, respectively, over the life of each such security. |
| | |
| g). | Use of Estimates – The preparation of financial statements in conformity with GAAP requires management to make estimates and assumptions that affect the reported amounts of assets and liabilities and disclosure of contingent assets and liabilities at the date of the financial statements and the reported change in net assets during the reporting period. Actual results could differ from those estimates. |
| | |
| h). | Share Valuation – The net asset value (“NAV”) per share of the Fund is calculated by dividing (i) the total value of the securities held by the Fund, plus cash and other assets, minus all liabilities (including estimated accrued expenses) by (ii) the total number of shares outstanding for the Fund, rounded to the nearest cent. The Fund’s shares will not be priced on days the New York Stock Exchange is closed for trading. The offering and redemption price per share for the Fund is equal to the Fund’s NAV per share. |
3). SECURITIES VALUATION
The Fund follows fair valuation accounting standards that establish an authoritative definition of fair value and set out a hierarchy for measuring fair value. These standards require additional disclosures about the various inputs and valuation techniques used to develop the measurements of fair value and a discussion of changes in valuation techniques and related inputs during the period. These inputs are summarized in the three broad levels listed below:
| | Level 1 – | Unadjusted, quoted prices in active markets for identical instruments that the Fund has the ability to access at the date of measurement. |
| | Level 2 – | Other significant observable inputs (including, but not limited to, quoted prices in active markets for similar instruments, quoted prices in markets that are not active for identical or similar instruments, and model-derived valuations in which all significant inputs and significant value drivers are observable in active markets (such as interest rates, prepayment speeds, credit risk curves, default rates, and similar data)). |
| | Level 3 – | Significant unobservable inputs (including the Fund’s own assumptions about what market participants would use to price the asset or liability based on the best available information) when observable inputs are unavailable. |
Following is a description of the valuation techniques applied to the Fund’s major categories of assets and liabilities measured at fair value on a recurring basis.
| | Equity Securities – Equity securities, including common stocks, preferred stocks, exchange-traded funds, closed-end mutual funds, partnerships, rights, and real estate investment trusts, that are traded on a securities exchange for which a last-quoted sales price is readily available will generally be valued at the last sales price as reported by the primary exchange on which the securities are listed. Securities listed on The NASDAQ Stock Market (“NASDAQ”) will generally be valued at the |
| HENNESSY FUNDS | 1-800-966-4354 | |
| | NASDAQ Official Closing Price, which may differ from the last sales price reported. Securities traded on a securities exchange for which a last-quoted sales price is not readily available will generally be valued at the mean between the bid and ask prices. To the extent these securities are actively traded and valuation adjustments are not applied, they are classified in Level 1 of the fair value hierarchy. |
| | |
| | Registered Investment Companies – Investments in registered investment companies (e.g., mutual funds) are generally priced at the ending NAV provided by the applicable registered investment company’s service agent and will be classified in Level 1 of the fair value hierarchy. |
| | |
| | Debt Securities – Debt securities, including corporate bonds, asset-backed securities, mortgage-backed securities, municipal bonds, U.S. Treasuries, and U.S. government agency issues, are generally valued at market on the basis of valuations furnished by an independent pricing service that utilizes both dealer-supplied valuations and formula-based techniques. The pricing service may consider recently executed transactions in securities of the issuer or comparable issuers, market price quotations (where observable), bond spreads, and fundamental data relating to the issuer. In addition, the model may incorporate observable market data, such as reported sales of similar securities, broker quotes, yields, bids, offers, and reference data. Certain securities are valued primarily using dealer quotations. These securities are generally classified in Level 2 of the fair value hierarchy. |
| | |
| | Short-Term Securities – Short-term equity investments, including money market funds, are valued in the manner specified above. Short-term debt investments with an original term to maturity of 60 days or less are valued at amortized cost, which approximates fair market value. If the original term to maturity of a short-term debt investment exceeded 60 days, then the values as of the 61st day prior to maturity are amortized. Amortized cost is not used if its use would be inappropriate due to credit or other impairments of the issuer, in which case the security’s fair value would be determined, as described below. Short-term securities are generally classified in Level 1 or Level 2 of the fair market hierarchy depending on the inputs used and market activity levels for specific securities. |
The Board of Trustees of the Fund (the “Board”) has adopted fair value pricing procedures that are followed when a price for a security is not readily available or if a significant event has occurred that indicates the closing price of a security no longer represents the true value of that security. Fair value pricing determinations are made in good faith in accordance with these procedures. There are numerous criteria that will be given consideration in determining a fair value of a security, such as the trading volume of a security and markets, the values of other similar securities, and news events with direct bearing on a security or markets. Fair value pricing results in an estimated price for a security that reflects the amount the Fund might reasonably expect to receive in a current sale. Depending on the relative significance of the valuation inputs, these securities may be classified in either Level 2 or Level 3 of the fair value hierarchy.
The Board has delegated day-to-day valuation matters to a Valuation Committee comprised of one or more representatives from Hennessy Advisors, Inc., the Fund’s investment advisor (the “Advisor”). The function of the Valuation Committee is to value securities where current and reliable market quotations are not readily available. All actions taken by the Valuation Committee are reviewed by the Board.
The Fund has performed an analysis of all existing investments to determine the significance and character of all inputs to their fair value determinations. Various inputs are used to determine the value of the Fund’s investments. The inputs or methodology
HENNESSYFUNDS.COM
| NOTES TO THE FINANCIAL STATEMENTS |
used for valuing securities are not necessarily an indication of the risk associated with investing in those securities. Details related to the fair valuation hierarchy of the Fund’s securities as of April 30, 2018, are included in the Schedule of Investments.
4). INVESTMENT TRANSACTIONS
Purchases and sales of investment securities (excluding government and short-term investments) for the Fund during the six months ended April 30, 2018, were $557,093 and $1,440,616, respectively.
There were no purchases or sales/maturities of long-term U.S. government securities for the Fund during the six months ended April 30, 2018.
The Fund is permitted to purchase or sell securities from or to another fund in the Hennessy Funds family of funds (the “Hennessy Funds”) under specified conditions outlined in procedures adopted by the Board. The procedures have been designed to ensure that any purchase or sale of securities by the Fund from or to another Hennessy Fund complies with Rule 17a-7 of the Investment Company Act of 1940, as amended. During the six months ended April 30, 2018, the Fund did not engage in purchases or sales of securities pursuant to Rule 17a-7 of the Investment Company Act of 1940, as amended.
5). INVESTMENT MANAGEMENT FEE AND OTHER TRANSACTIONS WITH AFFILIATES
The Advisor provides the Fund with investment management services under an Investment Advisory Agreement. The Advisor furnishes all investment advice, office space, and facilities, as well as most of the personnel needed by the Fund. As compensation for its services, the Advisor is entitled to a monthly fee from the Fund. The fee is based upon the average daily net assets of the Fund at an annual rate of 0.60%. The net investment advisory fees expensed by the Fund during the six months ended April 30, 2018, are included in the Statement of Operations.
The Board has approved a Shareholder Servicing Agreement for the Fund, which was instituted to compensate the Advisor for the non-investment management services it provides to the Fund. The Shareholder Servicing Agreement provides for a monthly fee paid to the Advisor at an annual rate of 0.10% of the average daily net assets of the Fund. The shareholder service fees expensed by the Fund during the six months ended April 30, 2018, are included in the Statement of Operations.
The Fund has adopted a plan pursuant to Rule 12b-1 under the Investment Company Act of 1940, as amended, that authorizes payments in connection with the distribution of the Fund’s shares at an annual rate of up to 0.25% of the Fund’s average daily net assets. Even though the authorized rate is up to 0.25%, the Fund is currently only using up to 0.15% of its average daily net assets for such purpose. Amounts paid under the plan may be spent on any activities or expenses primarily intended to result in the sale of shares, including, but not limited to, advertising, shareholder account servicing, the printing and mailing of prospectuses to other than current shareholders, the printing and mailing of sales literature, and compensation for sales and marketing activities or to financial institutions and others, such as dealers and distributors. The distribution fees expensed by the Fund during the six months ended April 30, 2018, are included in the Statement of Operations.
The Fund has entered into agreements with various brokers, dealers, and financial intermediaries in connection with the sale of shares of the Fund. The agreements provide for periodic payments by the Fund to the brokers, dealers, and financial intermediaries for providing certain shareholder maintenance services (sub-transfer agent expenses). These shareholder services include the pre-processing and quality control of new
| HENNESSY FUNDS | 1-800-966-4354 | |
accounts, shareholder correspondence, answering customer inquiries regarding account status, and facilitating shareholder telephone transactions. The sub-transfer agent fees expensed by the Fund during the six months ended April 30, 2018, are included in the Statement of Operations.
U.S. Bancorp Fund Services, LLC (“USBFS”) provides the Fund with administrative, fund accounting, and transfer agent services. As administrator, USBFS is responsible for activities such as (i) preparing various federal and state regulatory filings, reports, and returns for the Fund, (ii) preparing reports and materials to be supplied to the Board, (iii) monitoring the activities of the Fund’s custodian, transfer agent, and accountants, and (iv) coordinating the preparation and payment of the Fund’s expenses and reviewing the Fund’s expense accruals. U.S. Bank, N.A., an affiliate of USBFS, serves as the Fund’s custodian. The servicing agreements between the Trust and USBFS and U.S. Bank, N.A. contain a fee schedule that is inclusive of administrative, fund accounting, custody, and transfer agent fees. The administrative, fund accounting, custody, and transfer agent fees expensed by the Fund during the six months ended April 30, 2018, are included in the Statement of Operations.
Quasar Distributors, LLC acts as the Fund’s principal underwriter in a continuous public offering of the Fund’s shares. Quasar Distributors, LLC is an affiliate of USBFS and U.S. Bank, N.A.
The officers of the Fund are affiliated with the Advisor. Such officers, with the exception of the Chief Compliance Officer and the Senior Compliance Officer, receive no compensation from the Fund for serving in their respective roles. The Fund, along with the other Hennessy Funds, makes reimbursement payments, on an equal basis, to the Advisor for a portion of the salary and benefits associated with the office of the Chief Compliance Officer and for all of the salary and benefits associated with the office of the Senior Compliance Officer. The compliance fees expensed by the Fund during the six months ended April 30, 2018, are included in the Statement of Operations.
6). GUARANTEES AND INDEMNIFICATIONS
Under the Hennessy Funds’ organizational documents, their officers and trustees are indemnified by the Hennessy Funds against certain liabilities arising out of the performance of their duties to the Hennessy Funds. Additionally, in the normal course of business, the Hennessy Funds enter into contracts with service providers that contain general indemnification clauses. The Fund’s maximum exposure under these arrangements is unknown as this would involve future claims that may be made against the Fund that have not yet occurred. Currently, the Fund expects the risk of loss to be remote.
7). LINE OF CREDIT
The Fund has an uncommitted line of credit with the other Hennessy Funds in the amount of the lesser of (i) $100,000,000 or (ii) 33.33% of each Hennessy Fund’s net assets, or 30% for the Hennessy Gas Utility Fund and 10% for the Fund, intended to provide short-term financing, if necessary, subject to certain restrictions, in connection with shareholder redemptions. The credit facility is with the Hennessy Funds’ custodian bank, U.S. Bank, N.A. Borrowings under this arrangement bear interest at the bank’s prime rate and are secured by all of the Fund’s assets (as to its own borrowings only). During the six months ended April 30, 2018, the Fund did not have any borrowings outstanding under the line of credit.
HENNESSYFUNDS.COM
| NOTES TO THE FINANCIAL STATEMENTS |
8). FEDERAL TAX INFORMATION
As of October 31, 2017, the Fund’s most recent fiscal year end, the components of accumulated earnings (losses) for income tax purposes were as follows:
| | | Investments | |
| Cost of investments for tax purposes | | $ | 11,552,368 | |
| Gross tax unrealized appreciation | | $ | 980,319 | |
| Gross tax unrealized depreciation | | | (226,073 | ) |
| Net tax unrealized appreciation | | $ | 754,246 | |
| Undistributed ordinary income | | $ | 68,742 | |
| Undistributed long-term capital gains | | | 787,564 | |
| Total distributable earnings | | $ | 856,306 | |
| Other accumulated gain | | $ | — | |
| Total accumulated gain | | $ | 1,610,552 | |
The difference between book-basis unrealized appreciation/depreciation (as shown in the Statement of Assets and Liabilities) and tax-basis unrealized appreciation/depreciation (as shown above) is attributable primarily to wash sales.
As of October 31, 2017, the Fund’s most recent fiscal year end, the Fund had no tax basis capital losses to offset future capital gains.
As of October 31, 2017, the Fund’s most recent fiscal year end, the Fund did not defer, on a tax basis, any late-year ordinary losses. Late-year ordinary losses are net ordinary losses incurred after December 31, 2016, but within the taxable year, that are deemed to arise on the first day of the Fund’s next taxable year.
During fiscal year 2018 (year to date) and fiscal year 2017, the tax character of distributions paid by the Fund was as follows:
| | | Six Months Ended | | | Year Ended | |
| | | April 30, 2018 | | | October 31, 2017 | |
Ordinary income(1) | | $ | 96,304 | | | $ | 91,227 | |
| Long-term capital gain | | | 787,567 | | | | 802,209 | |
| | | $ | 883,871 | | | $ | 893,436 | |
(1) Ordinary income includes short-term gain/loss.
9). EVENTS SUBSEQUENT TO PERIOD END
Management has evaluated the Fund’s related events and transactions that occurred subsequent to April 30, 2018, through the date of issuance of the Fund’s financial statements. Management has determined that there were no subsequent events requiring recognition or disclosure in the financial statements.
| HENNESSY FUNDS | 1-800-966-4354 | |
Expense Example (Unaudited)
April 30, 2018
As a shareholder of the Fund, you incur two types of costs: (1) transaction costs, including sales charges (loads) on purchase payments, reinvested dividends, or other distributions; redemption fees; and exchange fees; and (2) ongoing costs, including management fees; service fees; and other Fund expenses. This Example is intended to help you understand your ongoing costs (in dollars) of investing in the Fund and to compare these costs with the ongoing costs of investing in other mutual funds. The Example is based on an investment of $1,000 invested at the beginning of the period and held for the entire period from November 1, 2017, through April 30, 2018.
Actual Expenses
The first line of the table below provides information about actual account values and actual expenses. Although the Fund charges no sales loads or transaction fees, you will be assessed fees for outgoing wire transfers, returned checks and stop payment orders at prevailing rates charged by U.S. Bancorp Fund Services, LLC, the Fund’s transfer agent. If you request that a redemption be made by wire transfer, currently a $15 fee is charged by the Fund’s transfer agent. IRA accounts will be charged a $15 annual maintenance fee. The example below includes, but is not limited to, management fees, shareholder servicing fees, fund accounting, custody, and transfer agent fees. However, the example below does not include portfolio trading commissions and related expenses, and other extraordinary expenses as determined under generally accepted accounting principles. You may use the information in this line, together with the amount you invested, to estimate the expenses that you paid over the period. Simply divide your account value by $1,000 (for example, an $8,600 account value divided by $1,000 = 8.6), then multiply the result by the number in the first line of the table under the heading entitled “Expenses Paid During Period” to estimate the expenses you paid on your account during this period.
Hypothetical Example for Comparison Purposes
The second line of the table below provides information about hypothetical account values and hypothetical expenses based on the Fund’s actual expense ratio and an assumed rate of return of 5% per year before expenses, which is not the Fund’s actual return. The hypothetical account values and expenses may not be used to estimate the actual ending account balance or expenses you paid for the period. You may use this information to compare the ongoing costs of investing in the Fund and other funds. To do so, compare this 5% hypothetical example with the 5% hypothetical examples that appear in the shareholder reports of the other funds. Please note that the expenses shown in the table are meant to highlight your ongoing costs only and do not reflect any transactional costs, such as sales charges (loads), or exchange fees. Therefore, the second line of the table is useful in comparing ongoing costs only, and will not help you determine the relative total costs of owning different funds. In addition, if these transactional costs were included, your costs would have been higher.
| | | | Expenses Paid |
| | Beginning | Ending | During Period(1) |
| | Account Value | Account Value | November 1, 2017 – |
| | November 1, 2017 | April 30, 2018 | April 30, 2018 |
| Investor Class | | | |
| Actual | $1,000.00 | $1,016.20 | $9.20 |
| Hypothetical (5% return before expenses) | $1,000.00 | $1,015.67 | $9.20 |
(1) | Expenses are equal to the Fund’s expense ratio of 1.84%, multiplied by the average account value over the period, multiplied by 181/365 days (to reflect one-half year period). |
| EXPENSE EXAMPLE — IMPORTANT NOTICE REGARDING DELIVERY OF SHAREHOLDER DOCUMENTS |
How to Obtain a Copy of the Fund’s
Proxy Voting Policy and Proxy Voting Records
A description of the policies and procedures the Fund uses to determine how to vote proxies relating to portfolio securities is available without charge (1) by calling 1-800-966-4354, (2) on the Hennessy Funds’ website at hennessyfunds.com/proxy-voting/voting-policy, or (3) on the U.S. Securities and Exchange Commission’s (the “SEC”) website at www.sec.gov. The Fund’s proxy voting record is available without charge on both the Hennessy Funds’ website at hennessyfunds.com/proxy-voting/voting-record and the SEC’s website at www.sec.gov no later than August 31 for the prior 12 months ending June 30.
Quarterly Filings on Form N-Q
The Fund files a complete schedule of portfolio holdings with the SEC for the first and third quarters of each fiscal year on Form N-Q. The Fund’s Forms N-Q are available on the SEC’s website at www.sec.gov. The Fund’s Forms N-Q may be reviewed and copied at the SEC’s Public Reference Room in Washington, DC and information on the operation of the Public Reference Room may be obtained by calling 1-800-SEC-0330. Information included in the Fund’s Forms N-Q will also be available upon request by calling 1-800-966-4354.
Federal Tax Distribution Information
(Unaudited)
For fiscal year 2017, certain dividends paid by the Fund may be subject to a maximum tax rate of 23.8%, as provided for by the Jobs and Growth Tax Relief Reconciliation Act of 2003. The percentage of dividends declared from ordinary income designated as qualified dividend income was 100.00%.
For corporate shareholders, the percent of ordinary income distributions that qualified for the corporate dividends received deduction for fiscal year 2017, was 100.00%.
The percentage of taxable ordinary income distributions that were designated as short-term capital gain distributions under Section 871(k)(2)(C) of the Internal Revenue Code of 1986, as amended, for the Fund was 47.18%.
Important Notice Regarding Delivery of
Shareholder Documents
To help keep the Fund’s costs as low as possible, we generally deliver a single copy of shareholder reports, proxy statements, and prospectuses to shareholders who share an address and have the same last name. This process does not apply to account statements. You may request an individual copy of a shareholder document at any time. If you would like to receive separate mailings of shareholder documents, please call U.S. Bancorp Fund Services, LLC at 1-800-261-6950 or 1-414-765-4124, and individual delivery will begin within 30 days of your request. If your account is held through a financial institution or other intermediary, please contact such intermediary directly to request individual delivery.
| HENNESSY FUNDS | 1-800-966-4354 | |
Board Approval of Investment Advisory
Agreement
At its meeting on March 7, 2018, the Board of Trustees of the Fund (the “Board,” and the members thereof, the “Trustees”) unanimously approved the continuation of the investment advisory agreement of the Fund with Hennessy Advisors, Inc. (the “Advisor”). As part of the process of approving the continuation of the advisory agreement, the Trustees reviewed their fiduciary duties with respect to approving the advisory agreement and the relevant factors for them to consider. In addition, the Trustees who are not deemed “interested persons” (as defined by the Investment Company Act of 1940, as amended) of the Fund (the “Independent Trustees”) met in executive session to discuss the approval of the advisory agreement.
In advance of the meeting, the Advisor sent detailed information to the Trustees to assist them in their evaluation of the advisory agreement. This information included, but was not limited to, the following:
| | (1) | A memorandum from outside legal counsel that described the fiduciary duties of the Board with respect to approving the continuation of the advisory agreement and the relevant factors for consideration; |
| | | |
| | (2) | A memorandum from the Advisor that listed the factors relevant to the Board’s approval of the continuation of the advisory agreement and also referenced the documents that had been provided to help the Board assess each such factor; |
| | | |
| | (3) | An inventory of the range of services provided by the Advisor to the Fund; |
| | | |
| | (4) | A written discussion of economies of scale; |
| | | |
| | (5) | The advisory agreement; |
| | | |
| | (6) | A recent Fund fact sheet, which included, among other things, performance information over various periods; |
| | | |
| | (7) | A peer expense comparison of both the net expense ratio and investment advisory fee of the Fund; |
| | | |
| | (8) | The Advisor’s most recent Form 10-K and Form 10-Q, which includes information about the Advisor’s profitability; |
| | | |
| | (9) | Information about brokerage commissions; |
| | | |
| | (10) | Information about the Fund’s compliance program; and |
| | | |
| | (11) | The Advisor’s current Form ADV Part I. |
All of the factors discussed were considered as a whole by the Trustees, and also by the Independent Trustees meeting in executive session. The factors were viewed in their totality by the Trustees, with no single factor being the principal or determinative factor in the Trustees’ determination of whether to approve the continuation of the advisory agreement. The Trustees recognized that the management and fee arrangements for the Fund are the result of years of review and discussion between the Independent Trustees and the Advisor, that certain aspects of such arrangements may receive greater scrutiny in some years than in others, and that the Trustees’ conclusions may be based, in part, on their consideration of these same arrangements and information received during the course of the year and in prior years.
HENNESSYFUNDS.COM
| BOARD APPROVAL OF INVESTMENT ADVISORY AGREEMENT |
Prior to approving the continuation of the advisory agreement, the Trustees, including the Independent Trustees in executive session, considered, among other items:
| | (1) | The nature and quality of the advisory services provided by the Advisor; |
| | | |
| | (2) | A comparison of the fees and expenses of the Fund to other similar funds; |
| | | |
| | (3) | Whether economies of scale are recognized by the Fund; |
| | | |
| | (4) | The costs and profitability of the Fund to the Advisor; |
| | | |
| | (5) | The performance of the Fund; and |
| | | |
| | (6) | Any benefits to the Advisor from serving as an investment advisor to the Fund (other than the advisory fee). |
The material considerations and determinations of the Trustees, including the Independent Trustees, were as follows:
| | (1) | The Trustees considered the services identified below that are provided by the Advisor. Based on this review, the Trustees concluded that the Advisor provides high-quality services to the Fund, and they noted that their overall confidence in the Advisor is high. The Trustees also concluded that they were satisfied with the nature, extent, and quality of the advisory services provided to the Fund by the Advisor, and that the nature and extent of the services provided by the Advisor are appropriate to assure that the Fund’s operations are conducted in compliance with applicable laws, rules, and regulations. |
| | | (a) | The Advisor acts as the portfolio manager for the Fund. In this capacity, the Advisor does the following: |
| | | | (i) | manages the composition of the Fund’s portfolio, including the purchase, retention, and disposition of portfolio securities in accordance with the Fund’s investment objectives, policies, and restrictions; |
| | | | | |
| | | | (ii) | ensures compliance with “best execution” for the Fund’s portfolio; |
| | | | | |
| | | | (iii) | manages the use of soft dollars for the Fund; and |
| | | | | |
| | | | (iv) | manages proxy voting for the Fund. |
| | | (b) | The Advisor performs a daily reconciliation of portfolio positions and cash for the Fund. |
| | | | |
| | | (c) | The Advisor monitors the Fund’s compliance with its investment objectives and restrictions. |
| | | | |
| | | (d) | The Advisor monitors compliance with federal securities laws and performs activities such as maintaining a compliance program, conducting ongoing reviews of the compliance programs of the Fund’s service providers, conducting on-site visits to the Fund’s service providers, monitoring incidents of abusive trading practices, reviewing Fund expense accruals, payments, and fixed expense ratios, evaluating insurance providers for fidelity bond coverage and D&O/E&O insurance coverage, conducting employee compliance training, reviewing reports provided by service providers, maintaining books and records, and preparing an annual compliance report for the Board. |
| | | | |
| | | (e) | The Advisor oversees service providers that provide accounting, administration, distribution, transfer agency, custodial, sales, marketing, public relations, audit, information technology, and legal services to the Fund. |
| HENNESSY FUNDS | 1-800-966-4354 | |
| | | (f) | The Advisor maintains in-house marketing and distribution departments on behalf of the Fund. |
| | | | |
| | | (g) | The Advisor is actively involved with preparing regulatory filings for the Fund, including writing and annually updating the Fund’s prospectus and related documents. |
| | | | |
| | | (h) | The Advisor prepares a written summary of the Fund’s performance for the most recent 12-month period for each annual report of the Fund. |
| | | | |
| | | (i) | The Advisor oversees distribution of the Fund through third-party broker/dealers and independent financial institutions such as Charles Schwab, Inc., Fidelity, TD Waterhouse, and Pershing. The Advisor participates in “no transaction fee” (“NTF”) programs with these companies on behalf of the Fund, which allow customers to purchase the Fund through third-party distribution channels without paying a transaction fee. The Advisor compensates, in part, a number of these third-party providers of NTF programs out of its own revenues. |
| | | | |
| | | (j) | The Advisor pays the incentive compensation of the Fund’s compliance officers and employs other staff, such as legal, marketing, national accounts, distribution, sales, administrative, and trading oversight personnel, as well as management executives. |
| | | | |
| | | (k) | The Advisor provides a quarterly compliance certification to the Board. |
| | | | |
| | | (l) | The Advisor prepares or reviews Board materials, frequently presents to the Board or leads Board discussions, prepares or reviews meeting minutes, and arranges for Board training and education. |
| | (2) | The Trustees compared the performance of the Fund to benchmark indices over various time periods and also noted that the Trustees review and discuss reports comparing the investment performance of the Fund to various indices at each quarterly Board meeting. Based on all such information, the Trustees believe that the Advisor manages the Fund in a manner that is materially consistent with its stated investment objective and style. The Trustees concluded that the performance of the Fund over various time periods warranted the continuation of the advisory agreement. |
| | | |
| | (3) | The Trustees reviewed the advisory fees and overall expense ratios of the Fund compared to other funds similar in asset size and investment objective to the Fund using data from Morningstar. As part of the discussion with management, the Trustees ensured that they understood and were comfortable with the criteria used to determine the mutual funds included in the Morningstar categories for purposes of the materials considered at the meeting. The Trustees determined that the advisory fee and overall expense ratio of the Fund falls within the range of the advisory fees and overall expense ratios of other comparable funds and concluded that they are reasonable and warranted continuation of the advisory agreement. |
| | | |
| | (4) | The Trustees also considered whether economies of scale were being realized by the Advisor that should be shared with the Fund’s shareholders. The Trustees noted that many of the expenses incurred to manage the Fund are asset-based fees and thus do not result in material economies of scale being realized as the assets of the Fund increase. For example, mutual fund platform fees increase as the Fund’s assets grow. The Trustees also considered the Advisor’s efforts to |
HENNESSYFUNDS.COM
| BOARD APPROVAL OF INVESTMENT ADVISORY AGREEMENT |
| | | contain expenses, the Advisor’s significant marketing efforts to promote the Funds, and the Advisor’s agreement to waive fees or lower its management fees in certain circumstances. The Trustees noted that at current asset levels it did not appear that there were economies of scale being realized by the Advisor and concluded that it would continue to monitor economies of scale in the future as circumstances changed. |
| | | |
| | (5) | The Trustees considered the profitability of the Advisor, including the impact of mutual fund platform fees on the Advisor’s profitability, and also considered the resources and revenues that the Advisor has put into managing and distributing the Fund. The Trustees then concluded that the profits of the Advisor are reasonable and not excessive when compared to profitability guidelines set forth in relevant court cases. |
| | | |
| | (6) | The Trustees considered the high level of professionalism and knowledge of the Advisor’s employees, along with a very low level of turnover, and concluded that this was beneficial to the Fund and its shareholders. |
| | | |
| | (7) | The Trustees considered any benefits to the Advisor from serving as an advisor to the Fund (other than the advisory fee). The Trustees noted that the Advisor may derive ancillary benefits from, by way of example, its association with the Fund in the form of proprietary and third-party research products and services received from broker-dealers that execute portfolio trades for the Fund. The Trustees determined that any such products and services have been used for legitimate purposes relating to the Fund by providing assistance in the investment decision-making process. The Trustees concluded that any additional benefits realized by the Advisor from its relationship with the Fund were reasonable. |
After reviewing the materials provided at the meeting and management’s presentation, as well as other information regularly provided at the Board’s quarterly meetings throughout the year regarding the quality of services provided by the Advisor, the performance of the Fund, expense information, regulatory compliance issues, trading information and related matters, and other factors that the Trustees deemed relevant, the Trustees, including the Independent Trustees, approved the continuation of the advisory agreement.
| HENNESSY FUNDS | 1-800-966-4354 | |
For information, questions or assistance, please call
The Hennessy Funds
1-800-966-4354 or 1-415-899-1555
INVESTMENT ADVISOR
Hennessy Advisors, Inc.
7250 Redwood Boulevard, Suite 200
Novato, California 94945
ADMINISTRATOR,
TRANSFER AGENT,
DIVIDEND PAYING AGENT &
SHAREHOLDER SERVICING AGENT
U.S. Bancorp Fund Services, LLC
P.O. Box 701
Milwaukee, Wisconsin 53201-0701
CUSTODIAN
U.S. Bank N.A.
Custody Operations
1555 North River Center Drive, Suite 302
Milwaukee, Wisconsin 53212
TRUSTEES
Neil J. Hennessy
Robert T. Doyle
J. Dennis DeSousa
Gerald P. Richardson
COUNSEL
Foley & Lardner LLP
777 East Wisconsin Avenue
Milwaukee, Wisconsin 53202-5306
INDEPENDENT REGISTERED
PUBLIC ACCOUNTING FIRM
Tait, Weller & Baker LLP
1818 Market Street, Suite 2400
Philadelphia, Pennsylvania 19103
DISTRIBUTOR
Quasar Distributors, LLC
777 East Wisconsin Avenue
Milwaukee, Wisconsin 53202
hennessyfunds.com | 1-800-966-4354
This report has been prepared for shareholders and may be distributed to
others only if preceded or accompanied by a current prospectus.
SEMI-ANNUAL REPORT
APRIL 30, 2018
HENNESSY GAS UTILITY FUND
Investor Class GASFX
Institutional Class HGASX
hennessyfunds.com | 1-800-966-4354
(This Page Intentionally Left Blank.)
Contents
| Letter to Shareholders | | | 2 |
| Performance Overview | | | 4 |
| Financial Statements | | | |
| Schedule of Investments | | | 5 |
| Statement of Assets and Liabilities | | | 9 |
| Statement of Operations | | | 10 |
| Statements of Changes in Net Assets | | | 11 |
| Financial Highlights | | | 12 |
| Notes to the Financial Statements | | | 15 |
| Expense Example | | | 22 |
| Proxy Voting Policy and Proxy Voting Records | | | 24 |
| Quarterly Schedule of Investments | | | 24 |
| Federal Tax Distribution Information | | | 24 |
| Important Notice Regarding Delivery of Shareholder Documents | | | 24 |
| Board Approval of Investment Advisory Agreement | | | 25 |
| HENNESSY FUNDS | 1-800-966-4354 | |
May 2018
Dear Hennessy Funds Shareholder:
Investors in the United States and abroad experienced the return of volatility in the six months ended April 30, 2018, especially during the second half of the period. Equities rallied sharply during the first half of the period and fell back during the second half, but nevertheless ended the period with solid gains, with the Dow Jones Industrial Average posting a total return of 4.5% and the S&P 500 Index up 3.8%. Over the past year, I have repeatedly shared my belief that the stock market was due for a correction, but that it would bounce back, as it has so many times during the current bull market.
In the closing months of 2017 and into January 2018, U.S. equities rallied in response to the enactment of the Tax Cuts and Jobs Act of 2017, which significantly lowered corporate tax rates. Investors were also encouraged by two quarters of real GDP growth of 3.2% and 2.9%. However, equity prices quickly lost ground in reaction to the imposition of trade tariffs on steel and aluminum, and fears that additional proposed tariffs could provoke a trade war with China. Signals from the Federal Reserve that the pace of interest rate increases would move slightly higher also weighed on investors. During the period, the federal funds rate was raised twice, by a quarter point each time, in December 2017 and March 2018.
The current bull market in U.S. equities is now entering its 10th year, and we remain optimistic about the outlook for stock prices. In our opinion, economic fundamentals look positive. The U.S. economy is growing at a solid pace of 2 – 3% annually, inflation is low, and high employment levels are supporting healthy growth in consumption. Wages are rising, but the rate of increase has remained steady at around 2.6% per year since mid-2016. While it appears that the Federal Reserve will continue to raise the federal funds rate and normalize monetary policy, we believe it will be able to do so gradually, avoiding a severe jolt to either financial markets or the economy. Meanwhile, companies continue to report robust earnings growth, boosted this year by lower tax rates.
We believe U.S. equities remain attractively valued. U.S. long bond yields are hovering near 3%, having risen over the period in response to strong economic activity. Prospective PE multiples, however, have dropped significantly since the end of 2017, the result of a combination of lower taxes, higher operating earnings, and lower stock prices. The Dow Jones Industrial Average and the S&P 500 Index are trading at about 17x forward earnings, down from approximately 20x at the beginning of the calendar year, valuations we believe to be very reasonable.
We are not overly concerned about recent protectionist actions by the U.S. administration. We consider the announcements and ongoing discussions regarding import tariffs and NAFTA to be representative of standard Trump deal-making tactics – make far-reaching demands and then negotiate a reasonable outcome that is beneficial to both sides. We expect continued pro-business policies and regulatory relief to be enacted by our leaders in Washington.
Finally, as noted many times in past letters during this bull market, the euphoria that has historically accompanied a peak in the market continues to be absent. Investors today are worried about many things, including higher interest rates, larger budget deficits, higher import tariffs, and political distractions. But they are definitely not euphoric. In the past, I have likened the current bull market to the 1982-2000 bull market, and I continue
HENNESSYFUNDS.COM
to believe the comparison is a good one. We remain confident that the market will be able to weather the current period of volatility and that the economy, despite higher interest rates and possible trade disruptions, is resilient enough to continue its steady growth into the coming year.
Thank you for your continued confidence and investment in the Hennessy Funds. If you have any questions or would like to speak with us directly, please don’t hesitate to call us at (800) 966-4354.
Best regards,
Neil J. Hennessy
President and Chief Investment Officer
Past performance does not guarantee future results.
Mutual fund investing involves risk. Principal loss is possible.
Opinions expressed are those of Neil Hennessy and are subject to change, are not guaranteed, and should not be considered investment advice.
The Dow Jones Industrial Average and S&P 500 Index are unmanaged indices commonly used to measure the performance of U.S. stocks. One cannot invest directly in an index.
Price to earnings (PE) is calculated by dividing a company’s market price per share by its earnings per share. Earnings growth is not a measure of a fund’s future performance.
| HENNESSY FUNDS | 1-800-966-4354 | |
Performance Overview (Unaudited)
AVERAGE ANNUAL TOTAL RETURN FOR PERIODS ENDED APRIL 30, 2018
| | Six | One | Five | Ten |
| | Months(1) | Year | Years | Years |
| Hennessy Gas Utility Fund – | | | | |
| Investor Class (GASFX) | -5.83% | -2.64% | 5.91% | 8.25% |
| Hennessy Gas Utility Fund – | | | | |
Institutional Class (HGASX)(2) | -5.64% | -2.27% | 6.00% | 8.29% |
| AGA Stock Index | -5.24% | -1.33% | 7.04% | 9.12% |
| S&P 500 Index | 3.82% | 13.27% | 12.96% | 9.02% |
Expense ratios: 1.01% (Investor Class); 0.64% (Institutional Class)
(1) | Periods less than one year are not annualized. |
(2) | The inception date of Institutional Class shares is March 1, 2017. Performance shown prior to the inception of Institutional Class shares reflects the performance of Investor Class shares and includes expenses that are not applicable to, and are higher than, those of Institutional Class shares. |
___________________
Performance data quoted represents past performance; past performance does not guarantee future results. The investment return and principal value of an investment will fluctuate so that an investor’s shares, when redeemed, may be worth more or less than their original cost. The performance table does not reflect the deduction of taxes that a shareholder would pay on Fund distributions or the redemption of Fund shares. Current performance of the Fund may be lower or higher than the performance quoted. Performance data current to the most recent month end may be obtained by visiting hennessyfunds.com. Performance for periods prior to October 26, 2012, is that of the FBR Gas Utility Index Fund.
The AGA Stock Index is a market capitalization-weighted index, adjusted monthly, consisting of member companies of the AGA. Performance for the AGA Stock Index is provided monthly by the American Gas Association. The S&P 500 Index is an unmanaged index commonly used to measure the performance of U.S. stocks. One cannot invest directly in an index.
The expense ratios presented are from the most recent prospectus. The expense ratios for the current reporting period are available in the Financial Highlights section of this report.
HENNESSYFUNDS.COM
| PERFORMANCE OVERVIEW/SCHEDULE OF INVESTMENTS |
Financial Statements
Schedule of Investments as of April 30, 2018 (Unaudited) |
HENNESSY GAS UTILITY FUND
(% of Net Assets)
| TOP TEN HOLDINGS (EXCLUDING CASH/CASH EQUIVALENTS) | % NET ASSETS |
| Dominion Resources, Inc. | 5.04% |
| National Grid PLC – ADR | 5.03% |
| Cheniere Energy, Inc. | 5.02% |
| Atmos Energy Corp. | 5.02% |
| Sempra Energy | 4.97% |
| TransCanada Corp. | 4.87% |
| Enbridge, Inc. | 4.84% |
| Kinder Morgan, Inc. | 4.82% |
| PG&E Corp. | 3.44% |
| WEC Energy Group, Inc. | 3.35% |
Note: For presentation purposes, the Fund has grouped some of the industry categories. For purposes of categorizing securities for compliance with section 8(b)(1) of the Investment Company Act of 1940, as amended, the Fund uses more specific industry classifications.
The Global Industry Classification Standard (GICS®) was developed by and is the exclusive property and a service mark of MSCI, Inc. and Standard & Poor Financial Services LLC. It has been licensed for use by the Hennessy Funds.
| HENNESSY FUNDS | 1-800-966-4354 | |
| COMMON STOCKS – 98.38% | | Number | | | | | | % of | |
| | | of Shares | | | Value | | | Net Assets | |
| Energy – 21.60% | | | | | | | | | |
| Cheniere Energy, Inc. (a) | | | 907,917 | | | $ | 52,804,453 | | | | 5.02 | % |
| Enbridge, Inc. (b) | | | 1,680,765 | | | | 50,876,756 | | | | 4.84 | % |
| EQT Corp. | | | 283,982 | | | | 14,253,056 | | | | 1.36 | % |
| Kinder Morgan, Inc. | | | 3,199,101 | | | | 50,609,778 | | | | 4.82 | % |
| Tellurian, Inc. (a) | | | 767,690 | | | | 7,308,409 | | | | 0.69 | % |
| TransCanada Corp. (b) | | | 1,204,853 | | | | 51,146,010 | | | | 4.87 | % |
| | | | | | | | 226,998,462 | | | | 21.60 | % |
| | | | | | | | | | | | | |
| Financials – 0.64% | | | | | | | | | | | | |
| Berkshire Hathaway, Inc., Class A (a) | | | 23 | | | | 6,684,950 | | | | 0.64 | % |
| | | | | | | | | | | | | |
| Utilities – 76.14% | | | | | | | | | | | | |
| Algonquin Power & Utilities Corp. (b) | | | 378,664 | | | | 3,688,187 | | | | 0.35 | % |
| ALLETE, Inc. | | | 1,775 | | | | 135,628 | | | | 0.01 | % |
| Ameren Corp. | | | 133,240 | | | | 7,810,529 | | | | 0.74 | % |
| Atmos Energy Corp. | | | 607,086 | | | | 52,749,702 | | | | 5.02 | % |
| Avangrid, Inc. | | | 73,200 | | | | 3,858,372 | | | | 0.37 | % |
| Avista Corp. | | | 80,572 | | | | 4,178,464 | | | | 0.40 | % |
| Black Hills Corp. | | | 173,747 | | | | 9,847,980 | | | | 0.94 | % |
| Centerpoint Energy, Inc. | | | 756,028 | | | | 19,150,189 | | | | 1.82 | % |
| Chesapeake Utilities Corp. | | | 76,658 | | | | 5,826,008 | | | | 0.55 | % |
| CMS Energy Corp. | | | 526,998 | | | | 24,869,036 | | | | 2.37 | % |
| Consolidated Edison, Inc. | | | 331,936 | | | | 26,598,032 | | | | 2.53 | % |
| Corning Natural Gas Holding Corp. | | | 17,299 | | | | 311,216 | | | | 0.03 | % |
| Dominion Resources, Inc. | | | 796,296 | | | | 53,001,462 | | | | 5.04 | % |
| DTE Energy Co. | | | 251,104 | | | | 26,466,362 | | | | 2.52 | % |
| Duke Energy Corp. | | | 347,787 | | | | 27,878,606 | | | | 2.65 | % |
| Entergy Corp. | | | 9,560 | | | | 780,000 | | | | 0.07 | % |
| Eversource Energy | | | 205,075 | | | | 12,355,769 | | | | 1.18 | % |
| Exelon Corp. | | | 303,631 | | | | 12,048,078 | | | | 1.15 | % |
| Fortis, Inc. (b) | | | 415,776 | | | | 13,924,338 | | | | 1.32 | % |
| MDU Resources Group, Inc. | | | 504,407 | | | | 14,209,145 | | | | 1.35 | % |
| MGE Energy, Inc. | | | 39,229 | | | | 2,277,243 | | | | 0.22 | % |
| National Fuel Gas Co. | | | 346,924 | | | | 17,814,547 | | | | 1.70 | % |
| National Grid PLC – ADR (b) | | | 908,844 | | | | 52,876,544 | | | | 5.03 | % |
| New Jersey Resources Corp. | | | 364,634 | | | | 15,077,616 | | | | 1.43 | % |
The accompanying notes are an integral part of these financial statements.
HENNESSYFUNDS.COM
| COMMON STOCKS | | Number | | | | | | % of | |
| | | of Shares | | | Value | | | Net Assets | |
| Utilities (Continued) | | | | | | | | | |
| NiSource, Inc. | | | 1,252,781 | | | $ | 30,555,329 | | | | 2.91 | % |
| Northwest Natural Gas Co. | | | 178,803 | | | | 10,960,624 | | | | 1.04 | % |
| NorthWestern Corp. | | | 64,398 | | | | 3,538,026 | | | | 0.34 | % |
| ONE Gas, Inc. | | | 322,675 | | | | 22,496,901 | | | | 2.14 | % |
| PG&E Corp. | | | 783,849 | | | | 36,135,439 | | | | 3.44 | % |
| PPL Corp. | | | 390,419 | | | | 11,361,193 | | | | 1.08 | % |
| Public Service Enterprise Group, Inc. | | | 511,490 | | | | 26,674,203 | | | | 2.54 | % |
| RGC Resources, Inc. | | | 48,549 | | | | 1,257,419 | | | | 0.12 | % |
| SCANA Corp. | | | 137,966 | | | | 5,073,010 | | | | 0.48 | % |
| Sempra Energy | | | 467,340 | | | | 52,248,612 | | | | 4.97 | % |
| South Jersey Industries, Inc. | | | 338,671 | | | | 10,464,934 | | | | 1.00 | % |
| Southwest Gas Holdings, Inc. | | | 271,317 | | | | 19,803,428 | | | | 1.88 | % |
| Spire, Inc. | | | 258,491 | | | | 18,650,126 | | | | 1.77 | % |
| The Southern Co. | | | 758,200 | | | | 34,968,184 | | | | 3.33 | % |
| UGI Corp. | | | 273,752 | | | | 13,246,859 | | | | 1.26 | % |
| Unitil Corp. | | | 53,798 | | | | 2,614,045 | | | | 0.25 | % |
| Vectren Corp. | | | 277,628 | | | | 19,508,920 | | | | 1.86 | % |
| WEC Energy Group, Inc. | | | 547,740 | | | | 35,208,727 | | | | 3.35 | % |
| WGL Holdings, Inc. | | | 244,842 | | | | 20,836,054 | | | | 1.98 | % |
| Xcel Energy, Inc. | | | 361,399 | | | | 16,927,929 | | | | 1.61 | % |
| | | | | | | | 800,263,015 | | | | 76.14 | % |
| Total Common Stocks | | | | | | | | | | | | |
| (Cost $636,060,923) | | | | | | | 1,033,946,427 | | | | 98.38 | % |
| | | | | | | | | | | | | |
| PARTNERSHIPS – 1.24% | | | | | | | | | | | | |
| | | | | | | | | | | | | |
| Energy – 1.24% | | | | | | | | | | | | |
| Plains GP Holdings L.P., Class A | | | 537,255 | | | | 13,012,316 | | | | 1.24 | % |
| | | | | | | | | | | | | |
| Total Partnerships | | | | | | | | | | | | |
| (Cost $13,646,631) | | | | | | | 13,012,316 | | | | 1.24 | % |
The accompanying notes are an integral part of these financial statements.
| HENNESSY FUNDS | 1-800-966-4354 | |
| SHORT-TERM INVESTMENTS – 0.45% | | Number | | | | | | % of | |
| | | of Shares | | | Value | | | Net Assets | |
| Money Market Funds – 0.45% | | | | | | | | | |
| Fidelity Government Portfolio, Institutional Class, 1.58% (c) | | | 4,785,069 | | | $ | 4,785,069 | | | | 0.45 | % |
| | | | | | | | | | | | | |
| Total Short-Term Investments | | | | | | | | | | | | |
| (Cost $4,785,069) | | | | | | | 4,785,069 | | | | 0.45 | % |
| | | | | | | | | | | | | |
| Total Investments | | | | | | | | | | | | |
| (Cost $654,492,623) – 100.07% | | | | | | | 1,051,743,812 | | | | 100.07 | % |
| Liabilities in Excess of Other Assets – (0.07)% | | | | | | | (783,744 | ) | | | (0.07 | )% |
| | | | | | | | | | | | | |
TOTAL NET ASSETS – 100.00% | | | | | | $ | 1,050,960,068 | | | | 100.00 | % |
Percentages are stated as a percent of net assets.
ADR – American Depositary Receipt
| (a) | Non-income producing security. |
| (b) | U.S. traded security of a foreign corporation. |
| (c) | The rate listed is the fund’s seven-day yield as of April 30, 2018. |
Summary of Fair Value Exposure at April 30, 2018
The following is a summary of the inputs used to value the Fund’s net assets as of April 30, 2018 (See Note 3 in the accompanying notes to the financial statements):
| Common Stocks | | Level 1 | | | Level 2 | | | Level 3 | | | Total | |
| Energy | | $ | 226,998,462 | | | $ | — | | | $ | — | | | $ | 226,998,462 | |
| Financials | | | 6,684,950 | | | | — | | | | — | | | | 6,684,950 | |
| Utilities | | | 800,263,015 | | | | — | | | | — | | | | 800,263,015 | |
| Total Common Stocks | | $ | 1,033,946,427 | | | $ | — | | | $ | — | | | $ | 1,033,946,427 | |
| Partnerships | | | | | | | | | | | | | | | | |
| Energy | | $ | 13,012,316 | | | $ | — | | | $ | — | | | $ | 13,012,316 | |
| Total Partnerships | | $ | 13,012,316 | | | $ | — | | | $ | — | | | $ | 13,012,316 | |
| Short-Term Investments | | | | | | | | | | | | | | | | |
| Money Market Funds | | $ | 4,785,069 | | | $ | — | | | $ | — | | | $ | 4,785,069 | |
| Total Short-Term Investments | | $ | 4,785,069 | | | $ | — | | | $ | — | | | $ | 4,785,069 | |
| Total Investments | | $ | 1,051,743,812 | | | $ | — | | | $ | — | | | $ | 1,051,743,812 | |
Transfers between levels are recognized at the end of the reporting period. During the six-month period ended April 30, 2018, the Fund recognized no transfers between levels.
The accompanying notes are an integral part of these financial statements.
HENNESSYFUNDS.COM
| SCHEDULE OF INVESTMENTS/STATEMENT OF ASSETS AND LIABILITIES |
Financial Statements
Statement of Assets and Liabilities as of April 30, 2018 (Unaudited) |
| ASSETS: | | | |
| Investments in securities, at value (cost $654,492,623) | | $ | 1,051,743,812 | |
| Dividends and interest receivable | | | 1,129,674 | |
| Receivable for fund shares sold | | | 163,140 | |
| Return of capital receivable | | | 161,177 | |
| Prepaid expenses and other assets | | | 36,768 | |
| Total Assets | | | 1,053,234,571 | |
| | | | | |
| LIABILITIES: | | | | |
| Payable for fund shares redeemed | | | 1,134,541 | |
| Payable to advisor | | | 345,188 | |
| Payable to administrator | | | 168,863 | |
| Payable to auditor | | | 10,250 | |
| Accrued distribution fees | | | 200,632 | |
| Accrued service fees | | | 79,167 | |
| Accrued interest payable | | | 333 | |
| Accrued trustees fees | | | 3,776 | |
| Accrued expenses and other payables | | | 331,753 | |
| Total Liabilities | | | 2,274,503 | |
| NET ASSETS | | $ | 1,050,960,068 | |
| | | | | |
| NET ASSETS CONSIST OF: | | | | |
| Capital stock | | $ | 691,271,593 | |
| Accumulated net investment loss | | | (40,957 | ) |
| Accumulated net realized loss on investments | | | (37,522,656 | ) |
| Unrealized net appreciation on investments | | | 397,252,088 | |
| Total Net Assets | | $ | 1,050,960,068 | |
| | | | | |
| NET ASSETS | | | | |
| Investor Class: | | | | |
| Shares authorized (no par value) | | Unlimited | |
| Net assets applicable to outstanding Investor Class shares | | $ | 964,221,468 | |
| Shares issued and outstanding | | | 34,273,015 | |
| Net asset value, offering price and redemption price per share | | $ | 28.13 | |
| | | | | |
| Institutional Class: | | | | |
| Shares authorized (no par value) | | Unlimited | |
| Net assets applicable to outstanding Institutional Class shares | | $ | 86,738,600 | |
| Shares issued and outstanding | | | 3,085,555 | |
| Net asset value, offering price and redemption price per share | | $ | 28.11 | |
The accompanying notes are an integral part of these financial statements.
| HENNESSY FUNDS | 1-800-966-4354 | |
Financial Statements
Statement of Operations for the six months ended April 30, 2018 (Unaudited) |
| INVESTMENT INCOME: | | | |
Dividend income(1) | | $ | 18,394,962 | |
| Interest income | | | 38,155 | |
| Total investment income | | | 18,433,117 | |
| | | | | |
| EXPENSES: | | | | |
| Investment advisory fees (See Note 5) | | | 2,392,942 | |
| Sub-transfer agent expenses – Investor Class (See Note 5) | | | 1,175,333 | |
| Sub-transfer agent expenses – Institutional Class (See Note 5) | | | 42,538 | |
| Distribution fees – Investor Class (See Note 5) | | | 827,141 | |
| Administration, fund accounting, custody and transfer agent fees (See Note 5) | | | 563,065 | |
| Service fees – Investor Class (See Note 5) | | | 551,427 | |
| Reports to shareholders | | | 59,656 | |
| Federal and state registration fees | | | 27,885 | |
| Compliance expense (See Note 5) | | | 14,628 | |
| Trustees’ fees and expenses | | | 11,371 | |
| Audit fees | | | 10,852 | |
| Interest expense (See Note 7) | | | 9,658 | |
| Legal fees | | | 5,057 | |
| Other expenses | | | 286,246 | |
| Total expenses | | | 5,977,799 | |
| NET INVESTMENT INCOME | | $ | 12,455,318 | |
| | | | | |
| REALIZED AND UNREALIZED GAINS (LOSSES): | | | | |
| Net realized gain on investments | | $ | 47,660,462 | |
| Net change in unrealized appreciation on investments | | | (140,701,355 | ) |
| Net loss on investments | | | (93,040,893 | ) |
| NET DECREASE IN NET ASSETS RESULTING FROM OPERATIONS | | $ | (80,585,575 | ) |
(1) | Net of foreign taxes withheld and issuance fees of $539,979. |
The accompanying notes are an integral part of these financial statements.
HENNESSYFUNDS.COM
| STATEMENT OF OPERATIONS/STATEMENTS OF CHANGES IN NET ASSETS |
Financial Statements
| Statements of Changes in Net Assets |
| | | Six Months Ended | | | | |
| | | April 30, 2018 | | | Year Ended | |
| | | (Unaudited) | | | October 31, 2017 | |
| OPERATIONS: | | | | | | |
| Net investment income | | $ | 12,455,318 | | | $ | 33,553,345 | |
| Net realized gain on investments | | | 47,660,462 | | | | 11,936,515 | |
| Net change in unrealized appreciation on investments | | | (140,701,355 | ) | | | 96,396,614 | |
| Net increase (decrease) in net | | | | | | | | |
| assets resulting from operations | | | (80,585,575 | ) | | | 141,886,474 | |
| | | | | | | | | |
| DISTRIBUTIONS TO SHAREHOLDERS FROM: | | | | | | | | |
| Net investment income – Investor Class | | | (11,319,433 | ) | | | (34,370,968 | ) |
| Net investment income – Institutional Class | | | (1,176,842 | ) | | | (376,747 | ) |
| Net realized gains – Investor Class | | | (6,535,816 | ) | | | (19,805,380 | ) |
| Net realized gains – Institutional Class | | | (543,806 | ) | | | — | |
| Total distributions | | | (19,575,897 | ) | | | (54,553,095 | ) |
| | | | | | | | | |
| CAPITAL SHARE TRANSACTIONS: | | | | | | | | |
| Proceeds from shares subscribed – Investor Class | | | 29,314,650 | | | | 119,194,987 | |
| Proceeds from shares subscribed – Institutional Class | | | 49,318,402 | | | | 86,926,934 | |
| Dividends reinvested – Investor Class | | | 17,229,046 | | | | 51,110,167 | |
| Dividends reinvested – Institutional Class | | | 1,174,385 | | | | 280,823 | |
| Cost of shares redeemed – Investor Class | | | (297,080,779 | ) | | | (405,814,851 | ) |
| Cost of shares redeemed – Institutional Class | | | (40,155,696 | ) | | | (2,635,338 | ) |
| Net decrease in net assets derived | | | | | | | | |
| from capital share transactions | | | (240,199,992 | ) | | | (150,937,278 | ) |
| TOTAL DECREASE IN NET ASSETS | | | (340,361,464 | ) | | | (63,603,899 | ) |
| | | | | | | | | |
| NET ASSETS: | | | | | | | | |
| Beginning of period | | | 1,391,321,532 | | | | 1,454,925,431 | |
| End of period | | $ | 1,050,960,068 | | | $ | 1,391,321,532 | |
| Undistributed net investment loss, end of period | | $ | (40,957 | ) | | $ | — | |
| | | | | | | | | |
| CHANGES IN SHARES OUTSTANDING: | | | | | | | | |
| Shares sold – Investor Class | | | 1,025,047 | | | | 4,053,758 | |
| Shares sold – Institutional Class | | | 1,684,644 | | | | 2,868,864 | |
| Shares issued to holders as reinvestment | | | | | | | | |
| of dividends – Investor Class | | | 595,846 | | | | 1,768,098 | |
| Shares issued to holders as reinvestment | | | | | | | | |
| of dividends – Institutional Class | | | 40,865 | | | | 9,411 | |
| Shares redeemed – Investor Class | | | (10,407,457 | ) | | | (13,691,570 | ) |
| Shares redeemed – Institutional Class | | | (1,431,255 | ) | | | (86,974 | ) |
| Net decrease in shares outstanding | | | (8,492,310 | ) | | | (5,078,413 | ) |
The accompanying notes are an integral part of these financial statements.
| HENNESSY FUNDS | 1-800-966-4354 | |
Financial Statements
For an Investor Class share outstanding throughout each period
| | Six Months Ended | |
| | April 30, 2018 | |
| | (Unaudited) | |
| PER SHARE DATA: | | | | |
| Net asset value, beginning of period | | $ | 30.35 | | |
| | | | | | |
| Income from investment operations: | | | | | |
| Net investment income | | | 0.30 | | |
| Net realized and unrealized gains (losses) on investments | | | (2.06 | ) | |
| Total from investment operations | | | (1.76 | ) | |
| | | | | | |
| Less distributions: | | | | | |
| Dividends from net investment income | | | (0.30 | ) | |
| Dividends from net realized gains | | | (0.16 | ) | |
| Total distributions | | | (0.46 | ) | |
| Paid-in capital from redemption fees | | | — | | |
| Net asset value, end of period | | $ | 28.13 | | |
| | | | | | |
| TOTAL RETURN | | | (5.83 | )%(2) | |
| | | | | | |
| SUPPLEMENTAL DATA AND RATIOS: | | | | | |
| Net assets, end of period (millions) | | $ | 964.22 | | |
| Ratio of expenses to average net assets | | | 1.03 | %(3) | |
| Ratio of net investment income to average net assets | | | 2.06 | %(3) | |
Portfolio turnover rate(4) | | | 7 | %(2) | |
(1) | Amount is less than $0.01. |
(2) | Not annualized. |
(3) | Annualized. |
(4) | Portfolio turnover is calculated on the basis of the Fund as a whole. |
The accompanying notes are an integral part of these financial statements.
HENNESSYFUNDS.COM
| FINANCIAL HIGHLIGHTS — INVESTOR CLASS |
| Year Ended October 31, | |
| 2017 | | | 2016 | | | 2015 | | | 2014 | | | 2013 | |
| | | | | | | | | | | | | | |
| $ | 28.57 | | | $ | 27.69 | | | $ | 31.30 | | | $ | 26.69 | | | $ | 23.05 | |
| | | | | | | | | | | | | | | | | | | |
| | | | | | | | | | | | | | | | | | | |
| | 0.70 | | | | 0.62 | | | | 0.69 | | | | 0.62 | | | | 0.62 | |
| | 2.20 | | | | 1.58 | | | | (2.69 | ) | | | 5.18 | | | | 4.18 | |
| | 2.90 | | | | 2.20 | | | | (2.00 | ) | | | 5.80 | | | | 4.80 | |
| | | | | | | | | | | | | | | | | | | |
| | | | | | | | | | | | | | | | | | | |
| | (0.72 | ) | | | (0.69 | ) | | | (0.70 | ) | | | (0.59 | ) | | | (0.61 | ) |
| | (0.40 | ) | | | (0.63 | ) | | | (0.91 | ) | | | (0.60 | ) | | | (0.55 | ) |
| | (1.12 | ) | | | (1.32 | ) | | | (1.61 | ) | | | (1.19 | ) | | | (1.16 | ) |
| | — | | | | — | | | | — | | | | 0.00 | (1) | | | 0.00 | (1) |
| $ | 30.35 | | | $ | 28.57 | | | $ | 27.69 | | | $ | 31.30 | | | $ | 26.69 | |
| | | | | | | | | | | | | | | | | | | |
| | 10.39 | % | | | 8.52 | % | | | (6.59 | )% | | | 22.49 | % | | | 21.70 | % |
| | | | | | | | | | | | | | | | | | | |
| | | | | | | | | | | | | | | | | | | |
| $ | 1,306.70 | | | $ | 1,454.93 | | | $ | 1,649.21 | | | $ | 2,254.98 | | | $ | 1,182.79 | |
| | 1.01 | % | | | 1.01 | % | | | 0.93 | % | | | 0.77 | % | | | 0.80 | % |
| | 2.34 | % | | | 2.25 | % | | | 2.33 | % | | | 2.26 | % | | | 2.56 | % |
| | 18 | % | | | 38 | % | | | 37 | % | | | 20 | % | | | 18 | % |
The accompanying notes are an integral part of these financial statements.
| HENNESSY FUNDS | 1-800-966-4354 | |
Financial Statements
For an Institutional Class share outstanding throughout each period
| | Six Months Ended | | | | |
| | April 30, 2018 | | Period Ended | |
| | (Unaudited) | | October 31, 2017(1) | |
| PER SHARE DATA: | | | | | | | | |
| Net asset value, beginning of period | | $ | 30.32 | | | | $ | 29.68 | | |
| | | | | | | | | | | |
| Income from investment operations: | | | | | | | | | | |
| Net investment income | | | 0.33 | | | | | 0.62 | | |
| Net realized and unrealized gains (losses) on investments | | | (2.03 | ) | | | | 0.72 | | |
| Total from investment operations | | | (1.70 | ) | | | | 1.34 | | |
| | | | | | | | | | | |
| Less distributions: | | | | | | | | | | |
| Dividends from net investment income | | | (0.35 | ) | | | | (0.70 | ) | |
| Dividends from net realized gains | | | (0.16 | ) | | | | — | | |
| Total distributions | | | (0.51 | ) | | | | (0.70 | ) | |
| Net asset value, end of period | | $ | 28.11 | | | | $ | 30.32 | | |
| | | | | | | | | | | |
| TOTAL RETURN | | | (5.64 | )%(2) | | | | 4.56 | %(2)(3) | |
| | | | | | | | | | | |
| SUPPLEMENTAL DATA AND RATIOS: | | | | | | | | | | |
| Net assets, end of period (millions) | | $ | 86.74 | | | | $ | 84.62 | | |
| Ratio of expenses to average net assets | | | 0.66 | %(4) | | | | 0.64 | %(4) | |
| Ratio of net investment income to average net assets | | | 2.35 | %(4) | | | | 1.23 | %(4) | |
Portfolio turnover rate(5) | | | 7 | %(2) | | | | 18 | %(2) | |
(1) | The Institutional Class shares commenced operations on March 1, 2017. |
(2) | Not annualized. |
(3) | Actual return from inception date of March 1, 2017, to the year end of October 31, 2017. |
(4) | Annualized. |
(5) | Portfolio turnover is calculated on the basis of the Fund as a whole. |
The accompanying notes are an integral part of these financial statements.
HENNESSYFUNDS.COM
| FINANCIAL HIGHLIGHTS — INSTITUTIONAL CLASS/NOTES TO THE FINANCIAL STATEMENTS |
Financial Statements
Notes to the Financial Statements April 30, 2018 (Unaudited) |
1). ORGANIZATION
The Hennessy Gas Utility Fund (the “Fund”) is a series of Hennessy Funds Trust (the “Trust”), which was organized as a Delaware statutory trust on September 17, 1992. The Fund is an open-end management investment company registered under the Investment Company Act of 1940, as amended. The Fund did not have Institutional Class shares until March 1, 2017. The investment objective of the Fund is income and capital appreciation. The Fund is a diversified fund.
The Fund offers Investor Class and Institutional Class shares. Each class of shares differs principally in its respective 12b-1 distribution and service, shareholder servicing, and sub-transfer agent expenses. There are no sales charges. Each class has identical rights to earnings, assets, and voting privileges, except for class-specific expenses and exclusive rights to vote on matters affecting only an individual class.
As an investment company, the Fund follows the investment company accounting and reporting guidance of the Financial Accounting Standards Board (“FASB”) Accounting Standard Codification Topic 946 “Financial Services—Investment Companies.”
2). SIGNIFICANT ACCOUNTING POLICIES
The following is a summary of significant accounting policies consistently followed by the Fund in the preparation of the financial statements. These policies conform to U.S. generally accepted accounting principles (“GAAP”).
| a). | Investment Valuation – All investments in securities are recorded at their estimated fair value, as described in Note 3. |
| | |
| b). | Federal Income Taxes – No provision for federal income taxes or excise taxes has been made because the Fund has elected to be taxed as a “regulated investment company” and intends to distribute substantially all of its taxable income to its shareholders and otherwise comply with the provisions of the Internal Revenue Code of 1986, as amended, applicable to regulated investment companies. Net investment income/loss and realized gains/losses for federal income tax purposes may differ from those reported in the financial statements because of temporary book and tax basis differences. Temporary differences are primarily the result of the treatment of wash sales for tax reporting purposes. The Fund recognizes interest and penalties related to income tax benefits, if any, in the Statement of Operations as an income tax expense. Distributions from net realized gains for book purposes may include short-term capital gains, which are included as ordinary income to shareholders for tax purposes. The Fund may utilize equalization accounting for tax purposes and designate earnings and profits, including net realized gains distributed to shareholders on redemption of shares, as part of the dividends paid deduction for income tax purposes. |
| | |
| c). | Accounting for Uncertainty in Income Taxes – The Fund has accounting policies regarding recognition and measurement of tax positions taken or expected to be taken on a tax return. The tax returns of the Fund for the prior three fiscal years are open for examination. The Fund has reviewed all open tax years in major jurisdictions and concluded that there is no impact on the Fund’s net assets and no tax liability resulting from unrecognized tax benefits relating to uncertain income tax |
| HENNESSY FUNDS | 1-800-966-4354 | |
| | positions taken or expected to be taken on a tax return. The Fund’s major tax jurisdictions are U.S. federal and Delaware. |
| | |
| d). | Income and Expenses – Dividend income is recognized on the ex-dividend date or as soon as information is available to the Fund. Interest income, which includes the amortization of premium and accretion of discount, is recognized on an accrual basis. The Fund is charged for those expenses that are directly attributable to the portfolio, such as advisory, administration, and certain shareholder service fees. Income, expenses (other than expenses attributable to a specific class), and realized and unrealized gains/losses on investments are allocated to each class of shares based on such class’s net assets. |
| | |
| e). | Distributions to Shareholders – Dividends from net investment income for the Fund, if any, are declared and paid at the end of each calendar quarter. Distributions of net realized capital gains, if any, are declared and paid annually, usually in December. |
| | |
| f). | Security Transactions – Investment and shareholder transactions are recorded on the trade date. The Fund determines the realized gain/loss from an investment transaction by comparing the original cost of the security lot sold with the net sale proceeds. Discounts and premiums on securities purchased are accreted or amortized, respectively, over the life of each such security. |
| | |
| g). | Use of Estimates – The preparation of financial statements in conformity with GAAP requires management to make estimates and assumptions that affect the reported amounts of assets and liabilities and disclosure of contingent assets and liabilities at the date of the financial statements and the reported change in net assets during the reporting period. Actual results could differ from those estimates. |
| | |
| h). | Share Valuation – The net asset value (“NAV”) per share of the Fund is calculated by dividing (i) the total value of the securities held by the Fund, plus cash and other assets, minus all liabilities (including estimated accrued expenses) by (ii) the total number of shares outstanding for the Fund, rounded to the nearest cent. The Fund’s shares will not be priced on days the New York Stock Exchange is closed for trading. The offering and redemption price per share for the Fund is equal to the Fund’s NAV per share. |
3). SECURITIES VALUATION
The Fund follows fair valuation accounting standards that establish an authoritative definition of fair value and set out a hierarchy for measuring fair value. These standards require additional disclosures about the various inputs and valuation techniques used to develop the measurements of fair value and a discussion of changes in valuation techniques and related inputs during the period. These inputs are summarized in the three broad levels listed below:
| | Level 1 – | Unadjusted, quoted prices in active markets for identical instruments that the Fund has the ability to access at the date of measurement. |
| | | |
| | Level 2 – | Other significant observable inputs (including, but not limited to, quoted prices in active markets for similar instruments, quoted prices in markets that are not active for identical or similar instruments, and model-derived valuations in which all significant inputs and significant value drivers are observable in active markets (such as interest rates, prepayment speeds, credit risk curves, default rates, and similar data)). |
| | | |
| | Level 3 – | Significant unobservable inputs (including the Fund’s own assumptions about what market participants would use to price the asset or liability based on the best available information) when observable inputs are unavailable. |
HENNESSYFUNDS.COM
| NOTES TO THE FINANCIAL STATEMENTS |
Following is a description of the valuation techniques applied to the Fund’s major categories of assets and liabilities measured at fair value on a recurring basis.
| | Equity Securities – Equity securities, including common stocks, preferred stocks, foreign-issued common stocks, exchange-traded funds, closed-end mutual funds, partnerships, rights, and real estate investment trusts, that are traded on a securities exchange for which a last-quoted sales price is readily available will generally be valued at the last sales price as reported by the primary exchange on which the securities are listed. Securities listed on The NASDAQ Stock Market (“NASDAQ”) will generally be valued at the NASDAQ Official Closing Price, which may differ from the last sales price reported. Securities traded on a securities exchange for which a last-quoted sales price is not readily available will generally be valued at the mean between the bid and ask prices. To the extent these securities are actively traded and valuation adjustments are not applied, they are classified in Level 1 of the fair value hierarchy. Securities traded on foreign exchanges generally are not valued at the same time the Fund calculates its NAV because most foreign markets close well before such time. The earlier close of most foreign markets gives rise to the possibility that significant events, including broad market moves, may have occurred in the interim. In certain circumstances, it may be determined that a security needs to be fair valued because it appears that the value of the security might have been materially affected by events occurring after the close of the market in which the security is principally traded, but before the time the Fund calculates its NAV, such as by a development that affects an entire market or region (e.g., a weather-related event) or a potentially global development (e.g., a terrorist attack that may be expected to have an effect on investor expectations worldwide). |
| | |
| | Registered Investment Companies – Investments in registered investment companies (e.g., mutual funds) are generally priced at the ending NAV provided by the applicable registered investment company’s service agent and will be classified in Level 1 of the fair value hierarchy. |
| | |
| | Debt Securities – Debt securities, including corporate bonds, asset-backed securities, mortgage-backed securities, municipal bonds, U.S. Treasuries, and U.S. government agency issues, are generally valued at market on the basis of valuations furnished by an independent pricing service that utilizes both dealer-supplied valuations and formula-based techniques. The pricing service may consider recently executed transactions in securities of the issuer or comparable issuers, market price quotations (where observable), bond spreads, and fundamental data relating to the issuer. In addition, the model may incorporate observable market data, such as reported sales of similar securities, broker quotes, yields, bids, offers, and reference data. Certain securities are valued primarily using dealer quotations. These securities are generally classified in Level 2 of the fair value hierarchy. |
| | |
| | Short-Term Securities – Short-term equity investments, including money market funds, are valued in the manner specified above. Short-term debt investments with an original term to maturity of 60 days or less are valued at amortized cost, which approximates fair market value. If the original term to maturity of a short-term debt investment exceeded 60 days, then the values as of the 61st day prior to maturity are amortized. Amortized cost is not used if its use would be inappropriate due to credit or other impairments of the issuer, in which case the security’s fair value would be determined, as described below. Short-term securities are generally classified in Level 1 or Level 2 of the fair market hierarchy depending on the inputs used and market activity levels for specific securities. |
| HENNESSY FUNDS | 1-800-966-4354 | |
The Board of Trustees of the Fund (the “Board”) has adopted fair value pricing procedures that are followed when a price for a security is not readily available or if a significant event has occurred that indicates the closing price of a security no longer represents the true value of that security. Fair value pricing determinations are made in good faith in accordance with these procedures. There are numerous criteria that will be given consideration in determining a fair value of a security, such as the trading volume of a security and markets, the values of other similar securities, and news events with direct bearing on a security or markets. Fair value pricing results in an estimated price for a security that reflects the amount the Fund might reasonably expect to receive in a current sale. Depending on the relative significance of the valuation inputs, these securities may be classified in either Level 2 or Level 3 of the fair value hierarchy.
The fair valuation of foreign securities may be determined with the assistance of a pricing service using correlations between the movement of prices of such securities and indices of domestic securities and other appropriate indicators, such as closing market prices of relevant American Depositary Receipts or futures contracts. The effect of using fair value pricing is that the Fund’s NAV will reflect the affected portfolio securities’ values as determined by the Board or its designee instead of being determined by the market. Using a fair value pricing methodology to price a foreign security may result in a value that is different from such foreign security’s most recent closing price and from the value used by other investment companies to calculate their NAVs. Such securities are generally classified in Level 2 of the fair valuation hierarchy. Because the Fund may invest in foreign securities, the value of the Fund’s portfolio securities may change on days when you will not be able to purchase or redeem your shares.
The Board has delegated day-to-day valuation matters to a Valuation Committee comprised of one or more representatives from Hennessy Advisors, Inc., the Fund’s investment advisor (the “Advisor”). The function of the Valuation Committee is to value securities where current and reliable market quotations are not readily available. All actions taken by the Valuation Committee are reviewed by the Board.
The Fund has performed an analysis of all existing investments to determine the significance and character of all inputs to their fair value determinations. Various inputs are used to determine the value of the Fund’s investments. The inputs or methodology used for valuing securities are not necessarily an indication of the risk associated with investing in those securities. Details related to the fair valuation hierarchy of the Fund’s securities as of April 30, 2018, are included in the Schedule of Investments.
4). INVESTMENT TRANSACTIONS
Purchases and sales of investment securities (excluding government and short-term investments) for the Fund during the six months ended April 30, 2018, were $79,895,969 and $321,408,580, respectively.
There were no purchases or sales/maturities of long-term U.S. government securities for the Fund during the six months ended April 30, 2018.
The Fund is permitted to purchase or sell securities from or to another fund in the Hennessy Funds family of funds (the “Hennessy Funds”) under specified conditions outlined in procedures adopted by the Board. The procedures have been designed to ensure that any purchase or sale of securities by the Fund from or to another Hennessy Fund complies with Rule 17a-7 of the Investment Company Act of 1940, as amended. During the six months ended April 30, 2018, the Fund did not engage in purchases or sales of securities pursuant to Rule 17a-7 of the Investment Company Act of 1940, as amended.
HENNESSYFUNDS.COM
| NOTES TO THE FINANCIAL STATEMENTS |
5). INVESTMENT MANAGEMENT FEE AND OTHER TRANSACTIONS WITH AFFILIATES
The Advisor provides the Fund with investment management services under an Investment Advisory Agreement. The Advisor furnishes all investment advice, office space, and facilities, as well as most of the personnel needed by the Fund. As compensation for its services, the Advisor is entitled to a monthly fee from the Fund. The fee is based upon the average daily net assets of the Fund at an annual rate of 0.40%. The net investment advisory fees expensed by the Fund during the six months ended April 30, 2018, are included in the Statement of Operations.
The Board has approved a Shareholder Servicing Agreement for Investor Class shares of the Fund, which was instituted to compensate the Advisor for the non-investment management services it provides to the Fund. The Shareholder Servicing Agreement provides for a monthly fee paid to the Advisor at an annual rate of 0.10% of the average daily net assets of the Fund attributable to Investor Class shares. The shareholder service fees expensed by the Fund during the six months ended April 30, 2018, are included in the Statement of Operations.
The Fund has adopted a plan pursuant to Rule 12b-1 under the Investment Company Act of 1940, as amended, that authorizes payments in connection with the distribution of the Fund’s shares at an annual rate of up to 0.25% of the Fund’s average daily net assets attributable to Investor Class shares. Even though the authorized rate is up to 0.25%, the Fund is currently only using up to 0.15% of its average daily net assets attributable to Investor Class shares for such purpose. Amounts paid under the plan may be spent on any activities or expenses primarily intended to result in the sale of shares, including, but not limited to, advertising, shareholder account servicing, the printing and mailing of prospectuses to other than current shareholders, the printing and mailing of sales literature, and compensation for sales and marketing activities or to financial institutions and others, such as dealers and distributors. The distribution fees expensed by the Fund during the six months ended April 30, 2018, are included in the Statement of Operations.
The Fund has entered into agreements with various brokers, dealers, and financial intermediaries in connection with the sale of shares of the Fund. The agreements provide for periodic payments by the Fund to the brokers, dealers, and financial intermediaries for providing certain shareholder maintenance services (sub-transfer agent expenses). These shareholder services include the pre-processing and quality control of new accounts, shareholder correspondence, answering customer inquiries regarding account status, and facilitating shareholder telephone transactions. The sub-transfer agent fees expensed by the Fund during the six months ended April 30, 2018, are included in the Statement of Operations.
The Fund has entered into an Administrative Services Agreement among the Fund, the Advisor, and the American Gas Association (“AGA”), pursuant to which the AGA provides administrative services to the Fund. These administrative services include overseeing the calculation of the AGA Stock Index. ScottMadden, Inc. performs the actual computations required to produce the AGA Stock Index and receives a fee for such calculations pursuant to a contractual arrangement with AGA. AGA does not furnish other securities advice to the Fund or the Advisor or make recommendations regarding the purchase or sale of securities by the Fund. Under the terms of the Administrative Services Agreement, which has been approved by the Board, AGA provides the Fund with current information regarding the common stock composition of the AGA Stock Index at least monthly. In addition, upon request, AGA provides the Fund and the Advisor with information on the natural gas industry. The Fund pays AGA a fee at an annual rate of 0.04% of the average daily net assets of the Fund.
| HENNESSY FUNDS | 1-800-966-4354 | |
U.S. Bancorp Fund Services, LLC (“USBFS”) provides the Fund with administrative, fund accounting, and transfer agent services. As administrator, USBFS is responsible for activities such as (i) preparing various federal and state regulatory filings, reports, and returns for the Fund, (ii) preparing reports and materials to be supplied to the Board, (iii) monitoring the activities of the Fund’s custodian, transfer agent, and accountants, and (iv) coordinating the preparation and payment of the Fund’s expenses and reviewing the Fund’s expense accruals. U.S. Bank N.A., an affiliate of USBFS, serves as the Fund’s custodian. The servicing agreements between the Trust and USBFS and U.S. Bank N.A. contain a fee schedule that is inclusive of administrative, fund accounting, custody, and transfer agent fees. The administrative, fund accounting, custody, and transfer agent fees expensed by the Fund during the six months ended April 30, 2018, are included in the Statement of Operations.
Quasar Distributors, LLC acts as the Fund’s principal underwriter in a continuous public offering of the Fund’s shares. Quasar Distributors, LLC is an affiliate of USBFS and U.S. Bank N.A.
The officers of the Fund are affiliated with the Advisor. Such officers, with the exception of the Chief Compliance Officer and the Senior Compliance Officer, receive no compensation from the Fund for serving in their respective roles. The Fund, along with the other Hennessy Funds, makes reimbursement payments, on an equal basis, to the Advisor for a portion of the salary and benefits associated with the office of the Chief Compliance Officer and for all of the salary and benefits associated with the office of the Senior Compliance Officer. The compliance fees expensed by the Fund during the six months ended April 30, 2018, are included in the Statement of Operations.
6). GUARANTEES AND INDEMNIFICATIONS
Under the Hennessy Funds’ organizational documents, their officers and trustees are indemnified by the Hennessy Funds against certain liabilities arising out of the performance of their duties to the Hennessy Funds. Additionally, in the normal course of business, the Hennessy Funds enter into contracts with service providers that contain general indemnification clauses. The Fund’s maximum exposure under these arrangements is unknown as this would involve future claims that may be made against the Fund that have not yet occurred. Currently, the Fund expects the risk of loss to be remote.
7). LINE OF CREDIT
The Fund has an uncommitted line of credit with the other Hennessy Funds in the amount of the lesser of (i) $100,000,000 or (ii) 33.33% of each Hennessy Fund’s net assets, or 30% for the Fund and 10% for the Hennessy Balanced Fund, intended to provide short-term financing, if necessary, subject to certain restrictions, in connection with shareholder redemptions. The credit facility is with the Hennessy Funds’ custodian bank, U.S. Bank N.A. Borrowings under this arrangement bear interest at the bank’s prime rate and are secured by all of the Fund’s assets (as to its own borrowings only). During the six months ended April 30, 2018, the Fund had an outstanding average daily balance and a weighted average interest rate of $435,083 and 4.50%, respectively. The interest expensed by the Fund during the six months ended April 30, 2018, is included in the Statement of Operations. The maximum amount outstanding for the Fund during the period was $15,120,000. As of April 30, 2018, the Fund did not have any borrowings outstanding under the line of credit.
HENNESSYFUNDS.COM
| NOTES TO THE FINANCIAL STATEMENTS |
8). FEDERAL TAX INFORMATION
As of October 31, 2017, the Fund’s most recent fiscal year end, the components of accumulated earnings (losses) for income tax purposes were as follows:
| | | Investments | |
| Cost of investments for tax purposes | | $ | 934,660,895 | |
| Gross tax unrealized appreciation | | $ | 550,811,731 | |
| Gross tax unrealized depreciation | | | (98,044,885 | ) |
| Net tax unrealized appreciation | | $ | 452,766,846 | |
| Undistributed ordinary income | | $ | 2,936,439 | |
| Undistributed long-term capital gains | | | 4,143,011 | |
| Total distributable earnings | | $ | 7,079,450 | |
| Other accumulated gain | | $ | 3,651 | |
| Total accumulated gain | | $ | 459,849,947 | |
The difference between book-basis unrealized appreciation/depreciation (as shown in the Statement of Assets and Liabilities) and tax-basis unrealized appreciation/depreciation (as shown above) is attributable primarily to wash sales.
As of October 31, 2017, the Fund’s most recent fiscal year end, the Fund had no tax basis capital losses to offset future capital gains.
As of October 31, 2017, the Fund’s most recent fiscal year end, the Fund did not defer, on a tax basis, any late-year ordinary losses. Late-year ordinary losses are net ordinary losses incurred after December 31, 2016, but within the taxable year, that are deemed to arise on the first day of the Fund’s next taxable year.
During fiscal year 2018 (year to date) and fiscal year 2017, the tax character of distributions paid by the Fund was as follows:
| | | Six Months Ended | | | Year Ended | |
| | | April 30, 2018 | | | October 31, 2017 | |
Ordinary income(1) | | $ | 15,432,728 | | | $ | 34,747,715 | |
| Long-term capital gain | | | 4,143,169 | | | | 19,805,380 | |
| | | $ | 19,575,897 | | | $ | 54,553,095 | |
(1) Ordinary income includes short-term gain/loss.
9). EVENTS SUBSEQUENT TO PERIOD END
Management has evaluated the Fund’s related events and transactions that occurred subsequent to April 30, 2018, through the date of issuance of the Fund’s financial statements. Management has determined that there were no subsequent events requiring recognition or disclosure in the financial statements.
| HENNESSY FUNDS | 1-800-966-4354 | |
Expense Example (Unaudited)
April 30, 2018
As a shareholder of the Fund, you incur two types of costs: (1) transaction costs, including sales charges (loads) on purchase payments, reinvested dividends, or other distributions; redemption fees; and exchange fees; and (2) ongoing costs, including management fees; service fees; and other Fund expenses. This Example is intended to help you understand your ongoing costs (in dollars) of investing in the Fund and to compare these costs with the ongoing costs of investing in other mutual funds. The Example is based on an investment of $1,000 invested at the beginning of the period and held for the entire period from November 1, 2017, through April 30, 2018.
Actual Expenses
The first line of the table below under the “Investor Class” and “Institutional Class” headings provides information about actual account values and actual expenses. Although the Fund charges no sales loads or transaction fees, you will be assessed fees for outgoing wire transfers, returned checks and stop payment orders at prevailing rates charged by U.S. Bancorp Fund Services, LLC, the Fund’s transfer agent. If you request that a redemption be made by wire transfer, currently a $15 fee is charged by the Fund’s transfer agent. IRA accounts will be charged a $15 annual maintenance fee. The example below includes, but is not limited to, management fees, shareholder servicing fees, fund accounting, custody, and transfer agent fees. However, the example below does not include portfolio trading commissions and related expenses, and other extraordinary expenses as determined under generally accepted accounting principles. You may use the information in this line, together with the amount you invested, to estimate the expenses that you paid over the period. Simply divide your account value by $1,000 (for example, an $8,600 account value divided by $1,000 = 8.6), then multiply the result by the number in the first line of the table under the “Investor Class” or “Institutional Class” headings in the column entitled “Expenses Paid During Period” to estimate the expenses you paid on your account during this period.
Hypothetical Example for Comparison Purposes
The second line of the table below under the “Investor Class” and “Institutional Class” headings provides information about hypothetical account values and hypothetical expenses based on the Fund’s actual expense ratios and an assumed rate of return of 5% per year before expenses, which is not the Fund’s actual return. The hypothetical account values and expenses may not be used to estimate the actual ending account balance or expenses you paid for the period. You may use this information to compare the ongoing costs of investing in the Fund and other funds. To do so, compare this 5% hypothetical example with the 5% hypothetical examples that appear in the shareholder reports of the other funds. Please note that the expenses shown in the table are meant to highlight your ongoing costs only and do not reflect any transactional costs, such as sales charges (loads), or exchange fees. Therefore, the second line of the table under the “Investor Class” and “Institutional Class” headings is useful in comparing ongoing costs only, and will not help you determine the relative total costs of owning different funds. In addition, if these transactional costs were included, your costs would have been higher.
| | | | Expenses Paid |
| | Beginning | Ending | During Period(1) |
| | Account Value | Account Value | November 1, 2017 – |
| | November 1, 2017 | April 30, 2018 | April 30, 2018 |
| Investor Class | | | |
| Actual | $1,000.00 | $ 941.70 | $4.96 |
| Hypothetical (5% return before expenses) | $1,000.00 | $1,019.69 | $5.16 |
| | | | |
| Institutional Class | | | |
| Actual | $1,000.00 | $ 943.60 | $3.18 |
| Hypothetical (5% return before expenses) | $1,000.00 | $1,021.52 | $3.31 |
(1) | Expenses are equal to the Fund’s expense ratio of 1.03% for Investor Class shares or 0.66% for Institutional Class shares, as applicable, multiplied by the average account value over the period, multiplied by 181/365 days (to reflect one-half year period). |
| HENNESSY FUNDS | 1-800-966-4354 | |
How to Obtain a Copy of the Fund’s
Proxy Voting Policy and Proxy Voting Records
A description of the policies and procedures the Fund uses to determine how to vote proxies relating to portfolio securities is available without charge (1) by calling 1-800-966-4354, (2) on the Hennessy Funds’ website at hennessyfunds.com/proxy-voting/voting-policy, or (3) on the U.S. Securities and Exchange Commission’s (the “SEC”) website at www.sec.gov. The Fund’s proxy voting record is available without charge on both the Hennessy Funds’ website at hennessyfunds.com/proxy-voting/voting-record and the SEC’s website at www.sec.gov no later than August 31 for the prior 12 months ending June 30.
Quarterly Filings on Form N-Q
The Fund files a complete schedule of portfolio holdings with the SEC for the first and third quarters of each fiscal year on Form N-Q. The Fund’s Forms N-Q are available on the SEC’s website at www.sec.gov. The Fund’s Forms N-Q may be reviewed and copied at the SEC’s Public Reference Room in Washington, DC and information on the operation of the Public Reference Room may be obtained by calling 1-800-SEC-0330. Information included in the Fund’s Forms N-Q will also be available upon request by calling 1-800-966-4354.
Federal Tax Distribution Information
(Unaudited)
For fiscal year 2017, certain dividends paid by the Fund may be subject to a maximum tax rate of 23.8%, as provided for by the Jobs and Growth Tax Relief Reconciliation Act of 2003. The percentage of dividends declared from ordinary income designated as qualified dividend income was 100.00%.
For corporate shareholders, the percent of ordinary income distributions that qualified for the corporate dividends received deduction for fiscal year 2017, was 100.00%.
The percentage of taxable ordinary income distributions that were designated as short-term capital gain distributions under Section 871(k)(2)(C) of the Internal Revenue Code of 1986, as amended, for the Fund was 0.00%.
Important Notice Regarding Delivery of
Shareholder Documents
To help keep the Fund’s costs as low as possible, we generally deliver a single copy of shareholder reports, proxy statements, and prospectuses to shareholders who share an address and have the same last name. This process does not apply to account statements. You may request an individual copy of a shareholder document at any time. If you would like to receive separate mailings of shareholder documents, please call U.S. Bancorp Fund Services, LLC at 1-800-261-6950 or 1-414-765-4124, and individual delivery will begin within 30 days of your request. If your account is held through a financial institution or other intermediary, please contact such intermediary directly to request individual delivery.
HENNESSYFUNDS.COM
| PROXY VOTING — BOARD APPROVAL OF INVESTMENT ADVISORY AGREEMENT |
Board Approval of Investment Advisory
Agreement
At its meeting on March 7, 2018, the Board of Trustees of the Fund (the “Board,” and the members thereof, the “Trustees”) unanimously approved the continuation of the investment advisory agreement of the Fund with Hennessy Advisors, Inc. (the “Advisor”). As part of the process of approving the continuation of the advisory agreement, the Trustees reviewed their fiduciary duties with respect to approving the advisory agreement and the relevant factors for them to consider. In addition, the Trustees who are not deemed “interested persons” (as defined by the Investment Company Act of 1940, as amended) of the Fund (the “Independent Trustees”) met in executive session to discuss the approval of the advisory agreement.
In advance of the meeting, the Advisor sent detailed information to the Trustees to assist them in their evaluation of the advisory agreement. This information included, but was not limited to, the following:
| | (1) | A memorandum from outside legal counsel that described the fiduciary duties of the Board with respect to approving the continuation of the advisory agreement and the relevant factors for consideration; |
| | | |
| | (2) | A memorandum from the Advisor that listed the factors relevant to the Board’s approval of the continuation of the advisory agreement and also referenced the documents that had been provided to help the Board assess each such factor; |
| | | |
| | (3) | An inventory of the range of services provided by the Advisor to the Fund; |
| | | |
| | (4) | A written discussion of economies of scale; |
| | | |
| | (5) | The advisory agreement; |
| | | |
| | (6) | A recent Fund fact sheet, which included, among other things, performance information over various periods; |
| | | |
| | (7) | A peer expense comparison of both the net expense ratio and investment advisory fee of the Fund; |
| | | |
| | (8) | The Advisor’s most recent Form 10-K and Form 10-Q, which includes information about the Advisor’s profitability; |
| | | |
| | (9) | Information about brokerage commissions; |
| | | |
| | (10) | Information about the Fund’s compliance program; and |
| | | |
| | (11) | The Advisor’s current Form ADV Part I. |
All of the factors discussed were considered as a whole by the Trustees, and also by the Independent Trustees meeting in executive session. The factors were viewed in their totality by the Trustees, with no single factor being the principal or determinative factor in the Trustees’ determination of whether to approve the continuation of the advisory agreement. The Trustees recognized that the management and fee arrangements for the Fund are the result of years of review and discussion between the Independent Trustees and the Advisor, that certain aspects of such arrangements may receive greater scrutiny in some years than in others, and that the Trustees’ conclusions may be based, in part, on their consideration of these same arrangements and information received during the course of the year and in prior years.
| HENNESSY FUNDS | 1-800-966-4354 | |
Prior to approving the continuation of the advisory agreement, the Trustees, including the Independent Trustees in executive session, considered, among other items:
| | (1) | The nature and quality of the advisory services provided by the Advisor; |
| | | |
| | (2) | A comparison of the fees and expenses of the Fund to other similar funds; |
| | | |
| | (3) | Whether economies of scale are recognized by the Fund; |
| | | |
| | (4) | The costs and profitability of the Fund to the Advisor; |
| | | |
| | (5) | The performance of the Fund; and |
| | | |
| | (6) | Any benefits to the Advisor from serving as an investment advisor to the Fund (other than the advisory fee). |
The material considerations and determinations of the Trustees, including the Independent Trustees, were as follows:
| | (1) | The Trustees considered the services identified below that are provided by the Advisor. Based on this review, the Trustees concluded that the Advisor provides high-quality services to the Fund, and they noted that their overall confidence in the Advisor is high. The Trustees also concluded that they were satisfied with the nature, extent, and quality of the advisory services provided to the Fund by the Advisor, and that the nature and extent of the services provided by the Advisor are appropriate to assure that the Fund’s operations are conducted in compliance with applicable laws, rules, and regulations. |
| | | (a) | The Advisor acts as the portfolio manager for the Fund. In this capacity, the Advisor does the following: |
| | | | (i) | manages the composition of the Fund’s portfolio, including the purchase, retention, and disposition of portfolio securities in accordance with the Fund’s investment objectives, policies, and restrictions; |
| | | | | |
| | | | (ii) | ensures compliance with “best execution” for the Fund’s portfolio; |
| | | | | |
| | | | (iii) | manages the use of soft dollars for the Fund; and |
| | | | | |
| | | | (iv) | manages proxy voting for the Fund. |
| | | (b) | The Advisor performs a daily reconciliation of portfolio positions and cash for the Fund. |
| | | | |
| | | (c) | The Advisor monitors the Fund’s compliance with its investment objectives and restrictions. |
| | | | |
| | | (d) | The Advisor monitors compliance with federal securities laws and performs activities such as maintaining a compliance program, conducting ongoing reviews of the compliance programs of the Fund’s service providers, conducting on-site visits to the Fund’s service providers, monitoring incidents of abusive trading practices, reviewing Fund expense accruals, payments, and fixed expense ratios, evaluating insurance providers for fidelity bond coverage and D&O/E&O insurance coverage, conducting employee compliance training, reviewing reports provided by service providers, maintaining books and records, and preparing an annual compliance report for the Board. |
| | | | |
| | | (e) | The Advisor oversees service providers that provide accounting, administration, distribution, transfer agency, custodial, sales, marketing, public relations, audit, information technology, and legal services to the Fund. |
HENNESSYFUNDS.COM
| BOARD APPROVAL OF INVESTMENT ADVISORY AGREEMENT |
| | | (f) | The Advisor maintains in-house marketing and distribution departments on behalf of the Fund. |
| | | | |
| | | (g) | The Advisor is actively involved with preparing regulatory filings for the Fund, including writing and annually updating the Fund’s prospectus and related documents. |
| | | | |
| | | (h) | The Advisor prepares a written summary of the Fund’s performance for the most recent 12-month period for each annual report of the Fund. |
| | | | |
| | | (i) | The Advisor oversees distribution of the Fund through third-party broker/dealers and independent financial institutions such as Charles Schwab, Inc., Fidelity, TD Waterhouse, and Pershing. The Advisor participates in “no transaction fee” (“NTF”) programs with these companies on behalf of the Fund, which allow customers to purchase the Fund through third-party distribution channels without paying a transaction fee. The Advisor compensates, in part, a number of these third-party providers of NTF programs out of its own revenues. |
| | | | |
| | | (j) | The Advisor pays the incentive compensation of the Fund’s compliance officers and employs other staff, such as legal, marketing, national accounts, distribution, sales, administrative, and trading oversight personnel, as well as management executives. |
| | | | |
| | | (k) | The Advisor provides a quarterly compliance certification to the Board. |
| | | | |
| | | (l) | The Advisor prepares or reviews Board materials, frequently presents to the Board or leads Board discussions, prepares or reviews meeting minutes, and arranges for Board training and education. |
| | (2) | The Trustees compared the performance of the Fund to benchmark indices over various time periods and also noted that the Trustees review and discuss reports comparing the investment performance of the Fund to various indices at each quarterly Board meeting. Based on all such information, the Trustees believe that the Advisor manages the Fund in a manner that is materially consistent with its stated investment objective and style. The Trustees concluded that the performance of the Fund over various time periods warranted the continuation of the advisory agreement. |
| | | |
| | (3) | The Trustees reviewed the advisory fees and overall expense ratios of the Fund compared to other funds similar in asset size and investment objective to the Fund using data from Morningstar. As part of the discussion with management, the Trustees ensured that they understood and were comfortable with the criteria used to determine the mutual funds included in the Morningstar categories for purposes of the materials considered at the meeting. The Trustees determined that the advisory fee and overall expense ratio of the Fund falls within the range of the advisory fees and overall expense ratios of other comparable funds and concluded that they are reasonable and warranted continuation of the advisory agreement. |
| | | |
| | (4) | The Trustees also considered whether economies of scale were being realized by the Advisor that should be shared with the Fund’s shareholders. The Trustees noted that many of the expenses incurred to manage the Fund are asset-based fees and thus do not result in material economies of scale being realized as the assets of the Fund increase. For example, mutual fund platform fees increase as the Fund’s assets grow. The Trustees also considered the Advisor’s efforts to |
| HENNESSY FUNDS | 1-800-966-4354 | |
| | | contain expenses, the Advisor’s significant marketing efforts to promote the Funds, and the Advisor’s agreement to waive fees or lower its management fees in certain circumstances. The Trustees determined that it did not appear that there were significant economies of scale being realized by the Advisor and concluded that it would continue to monitor economies of scale in the future as circumstances changed. |
| | | |
| | (5) | The Trustees considered the profitability of the Advisor, including the impact of mutual fund platform fees on the Advisor’s profitability, and also considered the resources and revenues that the Advisor has put into managing and distributing the Fund. The Trustees then concluded that the profits of the Advisor are reasonable and not excessive when compared to profitability guidelines set forth in relevant court cases. |
| | | |
| | (6) | The Trustees considered the high level of professionalism and knowledge of the Advisor’s employees, along with a very low level of turnover, and concluded that this was beneficial to the Fund and its shareholders. |
| | | |
| | (7) | The Trustees considered any benefits to the Advisor from serving as an advisor to the Fund (other than the advisory fee). The Trustees noted that the Advisor may derive ancillary benefits from, by way of example, its association with the Fund in the form of proprietary and third-party research products and services received from broker-dealers that execute portfolio trades for the Fund. The Trustees determined that any such products and services have been used for legitimate purposes relating to the Fund by providing assistance in the investment decision-making process. The Trustees concluded that any additional benefits realized by the Advisor from its relationship with the Fund were reasonable. |
After reviewing the materials provided at the meeting and management’s presentation, as well as other information regularly provided at the Board’s quarterly meetings throughout the year regarding the quality of services provided by the Advisor, the performance of the Fund, expense information, regulatory compliance issues, trading information and related matters, and other factors that the Trustees deemed relevant, the Trustees, including the Independent Trustees, approved the continuation of the advisory agreement.
HENNESSYFUNDS.COM
| BOARD APPROVAL OF INVESTMENT ADVISORY AGREEMENT |
(This Page Intentionally Left Blank.)
For information, questions or assistance, please call
The Hennessy Funds
1-800-966-4354 or 1-415-899-1555
INVESTMENT ADVISOR
Hennessy Advisors, Inc.
7250 Redwood Boulevard, Suite 200
Novato, California 94945
ADMINISTRATOR,
TRANSFER AGENT,
DIVIDEND PAYING AGENT &
SHAREHOLDER SERVICING AGENT
U.S. Bancorp Fund Services, LLC
P.O. Box 701
Milwaukee, Wisconsin 53201-0701
CUSTODIAN
U.S. Bank N.A.
Custody Operations
1555 North River Center Drive, Suite 302
Milwaukee, Wisconsin 53212
TRUSTEES
Neil J. Hennessy
Robert T. Doyle
J. Dennis DeSousa
Gerald P. Richardson
COUNSEL
Foley & Lardner LLP
777 East Wisconsin Avenue
Milwaukee, Wisconsin 53202-5306
INDEPENDENT REGISTERED
PUBLIC ACCOUNTING FIRM
Tait, Weller & Baker LLP
1818 Market Street, Suite 2400
Philadelphia, Pennsylvania 19103
DISTRIBUTOR
Quasar Distributors, LLC
777 East Wisconsin Avenue
Milwaukee, Wisconsin 53202
hennessyfunds.com | 1-800-966-4354
This report has been prepared for shareholders and may be distributed to
others only if preceded or accompanied by a current prospectus.
SEMI-ANNUAL REPORT
APRIL 30, 2018
HENNESSY SMALL CAP
FINANCIAL FUND
Investor Class HSFNX
Institutional Class HISFX
hennessyfunds.com | 1-800-966-4354
(This Page Intentionally Left Blank.)
Contents
| Letter to Shareholders | | | 2 |
| Performance Overview | | | 4 |
| Financial Statements | | | |
| Schedule of Investments | | | 5 |
| Statement of Assets and Liabilities | | | 8 |
| Statement of Operations | | | 9 |
| Statements of Changes in Net Assets | | | 11 |
| Financial Highlights | | | 12 |
| Notes to the Financial Statements | | | 16 |
| Expense Example | | | 23 |
| Proxy Voting Policy and Proxy Voting Records | | | 25 |
| Quarterly Schedule of Investments | | | 25 |
| Federal Tax Distribution Information | | | 25 |
| Important Notice Regarding Delivery of Shareholder Documents | | | 25 |
| Board Approval of Investment Advisory Agreement | | | 26 |
| HENNESSY FUNDS | 1-800-966-4354 | |
May 2018
Dear Hennessy Funds Shareholder:
Investors in the United States and abroad experienced the return of volatility in the six months ended April 30, 2018, especially during the second half of the period. Equities rallied sharply during the first half of the period and fell back during the second half, but nevertheless ended the period with solid gains, with the Dow Jones Industrial Average posting a total return of 4.5% and the S&P 500 Index up 3.8%. Over the past year, I have repeatedly shared my belief that the stock market was due for a correction, but that it would bounce back, as it has so many times during the current bull market.
In the closing months of 2017 and into January 2018, U.S. equities rallied in response to the enactment of the Tax Cuts and Jobs Act of 2017, which significantly lowered corporate tax rates. Investors were also encouraged by two quarters of real GDP growth of 3.2% and 2.9%. However, equity prices quickly lost ground in reaction to the imposition of trade tariffs on steel and aluminum, and fears that additional proposed tariffs could provoke a trade war with China. Signals from the Federal Reserve that the pace of interest rate increases would move slightly higher also weighed on investors. During the period, the federal funds rate was raised twice, by a quarter point each time, in December 2017 and March 2018.
The current bull market in U.S. equities is now entering its 10th year, and we remain optimistic about the outlook for stock prices. In our opinion, economic fundamentals look positive. The U.S. economy is growing at a solid pace of 2 – 3% annually, inflation is low, and high employment levels are supporting healthy growth in consumption. Wages are rising, but the rate of increase has remained steady at around 2.6% per year since mid-2016. While it appears that the Federal Reserve will continue to raise the federal funds rate and normalize monetary policy, we believe it will be able to do so gradually, avoiding a severe jolt to either financial markets or the economy. Meanwhile, companies continue to report robust earnings growth, boosted this year by lower tax rates.
We believe U.S. equities remain attractively valued. U.S. long bond yields are hovering near 3%, having risen over the period in response to strong economic activity. Prospective PE multiples, however, have dropped significantly since the end of 2017, the result of a combination of lower taxes, higher operating earnings, and lower stock prices. The Dow Jones Industrial Average and the S&P 500 Index are trading at about 17x forward earnings, down from approximately 20x at the beginning of the calendar year, valuations we believe to be very reasonable.
We are not overly concerned about recent protectionist actions by the U.S. administration. We consider the announcements and ongoing discussions regarding import tariffs and NAFTA to be representative of standard Trump deal-making tactics – make far-reaching demands and then negotiate a reasonable outcome that is beneficial to both sides. We expect continued pro-business policies and regulatory relief to be enacted by our leaders in Washington.
Finally, as noted many times in past letters during this bull market, the euphoria that has historically accompanied a peak in the market continues to be absent. Investors today are worried about many things, including higher interest rates, larger budget deficits, higher import tariffs, and political distractions. But they are definitely not euphoric. In the past, I have likened the current bull market to the 1982-2000 bull market, and I continue
to believe the comparison is a good one. We remain confident that the market will be able to weather the current period of volatility and that the economy, despite higher interest rates and possible trade disruptions, is resilient enough to continue its steady growth into the coming year.
Thank you for your continued confidence and investment in the Hennessy Funds. If you have any questions or would like to speak with us directly, please don’t hesitate to call us at (800) 966-4354.
Best regards,
Neil J. Hennessy
President and Chief Investment Officer
Past performance does not guarantee future results.
Mutual fund investing involves risk. Principal loss is possible.
Opinions expressed are those of Neil Hennessy and are subject to change, are not guaranteed, and should not be considered investment advice.
The Dow Jones Industrial Average and S&P 500 Index are unmanaged indices commonly used to measure the performance of U.S. stocks. One cannot invest directly in an index.
Price to earnings (PE) is calculated by dividing a company’s market price per share by its earnings per share. Earnings growth is not a measure of a fund’s future performance.
| HENNESSY FUNDS | 1-800-966-4354 | |
Performance Overview (Unaudited)
AVERAGE ANNUAL TOTAL RETURN FOR PERIODS ENDED APRIL 30, 2018
| | Six | One | Five | Ten |
| | Months(1) | Year | Years | Years |
| Hennessy Small Cap Financial Fund – | | | | |
| Investor Class (HSFNX) | 1.22% | 7.02% | 12.37% | 10.20% |
| Hennessy Small Cap Financial Fund – | | | | |
Institutional Class (HISFX)(2) | 1.44% | 7.47% | 12.80% | 10.53% |
Russell 2000® Financial | | | | |
| Services Index | 0.14% | 6.10% | 11.89% | 8.30% |
Russell 2000® Index | 3.27% | 11.54% | 11.74% | 9.49% |
Expense ratios: 1.53% (Investor Class); 1.16% (Institutional Class)
(1) | Periods less than one year are not annualized. |
(2) | The inception date of Institutional Class shares is May 30, 2008. Performance shown prior to the inception of Institutional Class shares reflects the performance of Investor Class shares and includes expenses that are not applicable to, and are higher than, those of Institutional Class shares. |
Performance data quoted represents past performance; past performance does not guarantee future results. The investment return and principal value of an investment will fluctuate so that an investor’s shares, when redeemed, may be worth more or less than their original cost. The performance table does not reflect the deduction of taxes that a shareholder would pay on Fund distributions or the redemption of Fund shares. Current performance of the Fund may be lower or higher than the performance quoted. Performance data current to the most recent month end may be obtained by visiting hennessyfunds.com. Performance for periods prior to October 26, 2012, is that of the FBR Small Cap Financial Fund.
The Russell 2000® Financial Services Index is an unmanaged index commonly used to measure the performance of U.S. small-capitalization financial sector stocks. The Russell 2000® Index is an unmanaged index commonly used to measure the performance of U.S. small-capitalization stocks. One cannot invest directly in an index.
Frank Russell Company (“Russell”) is the source and owner of the trademarks, service marks, and copyrights related to the Russell Indexes. Russell® is a trademark of Frank Russell Company. Neither Russell nor its licensors accept any liability for any errors or omissions in the Russell Indexes or Russell ratings or underlying data and no party may rely on any Russell Indexes or Russell ratings or underlying data contained in this communication. No further distribution of Russell data is permitted without Russell’s express written consent. Russell does not promote, sponsor, or endorse the content of this communication.
The expense ratios presented are from the most recent prospectus. The expense ratios for the current reporting period are available in the Financial Highlights section of this report.
HENNESSYFUNDS.COM
| PERFORMANCE OVERVIEW/SCHEDULE OF INVESTMENTS |
Financial Statements
Schedule of Investments as of April 30, 2018 (Unaudited) |
HENNESSY SMALL CAP FINANCIAL FUND
(% of Net Assets)
| TOP TEN HOLDINGS (EXCLUDING CASH/CASH EQUIVALENTS) | % NET ASSETS |
| Hingham Institution for Savings | 5.14% |
| OceanFirst Financial Corp. | 4.89% |
| Brookline Bancorp, Inc. | 4.79% |
| FCB Financial Holdings, Inc., Class A | 4.40% |
| Meridian Bancorp, Inc. | 4.37% |
| Opus Bank | 4.22% |
| Banc of California, Inc. | 4.13% |
| ConnectOne Bancorp, Inc. | 4.09% |
| Eagle Bancorp, Inc. | 3.54% |
| Kearny Financial Corp. of Maryland | 3.54% |
Note: For presentation purposes, the Fund has grouped some of the industry categories. For purposes of categorizing securities for compliance with section 8(b)(1) of the Investment Company Act of 1940, as amended, the Fund uses more specific industry classifications.
The Global Industry Classification Standard (GICS®) was developed by and is the exclusive property and a service mark of MSCI, Inc. and Standard & Poor Financial Services LLC. It has been licensed for use by the Hennessy Funds.
| HENNESSY FUNDS | 1-800-966-4354 | |
| COMMON STOCKS – 94.87% | | Number | | | | | | % of | |
| | | of Shares | | | Value | | | Net Assets | |
| Financials – 94.87% | | | | | | | | | |
| Banc of California, Inc. | | | 410,000 | | | $ | 7,872,000 | | | | 4.13 | % |
| BankUnited, Inc. | | | 170,000 | | | | 6,733,700 | | | | 3.53 | % |
| Banner Corp. | | | 75,000 | | | | 4,305,000 | | | | 2.26 | % |
| Beneficial Bancorp, Inc. | | | 240,000 | | | | 3,804,000 | | | | 2.00 | % |
| BofI Holding, Inc. (a) | | | 75,000 | | | | 3,021,000 | | | | 1.59 | % |
| Brookline Bancorp, Inc. | | | 550,000 | | | | 9,130,000 | | | | 4.79 | % |
| Capstar Financial Holdings, Inc. (a) | | | 188,530 | | | | 3,599,038 | | | | 1.89 | % |
| Columbia Financial, Inc. (a) | | | 190,000 | | | | 2,945,000 | | | | 1.54 | % |
| ConnectOne Bancorp, Inc. | | | 295,000 | | | | 7,788,000 | | | | 4.09 | % |
| Dime Community Bancshares, Inc. | | | 245,000 | | | | 4,838,750 | | | | 2.54 | % |
| Eagle Bancorp, Inc. (a) | | | 115,000 | | | | 6,750,500 | | | | 3.54 | % |
| FCB Financial Holdings, Inc., Class A (a) | | | 145,000 | | | | 8,381,000 | | | | 4.40 | % |
| First BanCorp. (a)(b) | | | 600,000 | | | | 4,332,000 | | | | 2.27 | % |
| First Connecticut Bancorp, Inc. | | | 180,000 | | | | 4,338,000 | | | | 2.28 | % |
| Flushing Financial Corp. | | | 150,000 | | | | 3,886,500 | | | | 2.04 | % |
| Green Bancorp, Inc. (a) | | | 210,000 | | | | 4,735,500 | | | | 2.49 | % |
| Guaranty Bancshares, Inc. | | | 15,000 | | | | 491,850 | | | | 0.26 | % |
| HarborOne Bancorp, Inc. (a) | | | 285,000 | | | | 5,013,150 | | | | 2.63 | % |
| Hingham Institution for Savings | | | 48,000 | | | | 9,792,000 | | | | 5.14 | % |
| Hope Bancorp, Inc. | | | 110,000 | | | | 1,901,900 | | | | 1.00 | % |
| IBERIABANK Corp. | | | 70,000 | | | | 5,246,500 | | | | 2.75 | % |
| Independent Bank Corp. | | | 50,000 | | | | 3,615,000 | | | | 1.90 | % |
| Kearny Financial Corp. of Maryland | | | 480,000 | | | | 6,744,000 | | | | 3.54 | % |
| Meridian Bancorp, Inc. | | | 440,000 | | | | 8,316,000 | | | | 4.37 | % |
| Midland States Bancorp, Inc. | | | 135,000 | | | | 4,252,500 | | | | 2.23 | % |
| OceanFirst Financial Corp. | | | 345,000 | | | | 9,308,100 | | | | 4.89 | % |
| Opus Bank | | | 285,000 | | | | 8,037,000 | | | | 4.22 | % |
| PacWest Bancorp | | | 95,000 | | | | 4,867,800 | | | | 2.55 | % |
| Provident Financial Services, Inc. | | | 97,500 | | | | 2,546,700 | | | | 1.34 | % |
| Sterling Bancorp | | | 200,000 | | | | 4,750,000 | | | | 2.49 | % |
| Union Bankshares Corp. | | | 140,000 | | | | 5,293,400 | | | | 2.78 | % |
| United Financial Bancorp, Inc. | | | 250,000 | | | | 4,132,500 | | | | 2.17 | % |
| Washington Federal, Inc. | | | 175,000 | | | | 5,556,250 | | | | 2.92 | % |
| Western Alliance Bancorp (a) | | | 10,000 | | | | 589,800 | | | | 0.31 | % |
The accompanying notes are an integral part of these financial statements.
| COMMON STOCKS | | Number | | | | | | % of | |
| | | of Shares | | | Value | | | Net Assets | |
| Financials (Continued) | | | | | | | | | |
| Wintrust Financial Corp. | | | 42,500 | | | $ | 3,801,625 | | | | 2.00 | % |
| | | | | | | | | | | | | |
| Total Common Stocks | | | | | | | | | | | | |
| (Cost $148,397,307) | | | | | | | 180,716,063 | | | | 94.87 | % |
| | | | | | | | | | | | | |
| SHORT-TERM INVESTMENTS – 5.24% | | | | | | | | | | | | |
| | | | | | | | | | | | | |
| Money Market Funds – 5.24% | | | | | | | | | | | | |
| Fidelity Government Portfolio, Institutional Class, 1.58% (c) | | | 9,632,000 | | | | 9,632,000 | | | | 5.06 | % |
| The Government & Agency Portfolio, Institutional Class, 1.61% (c) | | | 339,207 | | | | 339,207 | | | | 0.18 | % |
| | | | | | | | | | | | | |
| Total Short-Term Investments | | | | | | | | | | | | |
| (Cost $9,971,207) | | | | | | | 9,971,207 | | | | 5.24 | % |
| | | | | | | | | | | | | |
| Total Investments | | | | | | | | | | | | |
| (Cost $158,368,514) – 100.11% | | | | | | | 190,687,270 | | | | 100.11 | % |
| Liabilities in Excess of Other Assets – (0.11)% | | | | | | | (202,164 | ) | | | (0.11 | )% |
| | | | | | | | | | | | | |
TOTAL NET ASSETS – 100.00% | | | | | | $ | 190,485,106 | | | | 100.00 | % |
Percentages are stated as a percent of net assets.
| (a) | Non-income producing security. |
| (b) | U.S. traded security of a foreign corporation. |
| (c) | The rate listed is the fund’s seven-day yield as of April 30, 2018. |
Summary of Fair Value Exposure at April 30, 2018
The following is a summary of the inputs used to value the Fund’s net assets as of April 30, 2018 (See Note 3 in the accompanying notes to the financial statements):
| Common Stocks | | Level 1 | | | Level 2 | | | Level 3 | | | Total | |
| Financials | | $ | 180,716,063 | | | $ | — | | | $ | — | | | $ | 180,716,063 | |
| Total Common Stocks | | $ | 180,716,063 | | | $ | — | | | $ | — | | | $ | 180,716,063 | |
| Short-Term Investments | | | | | | | | | | | | | | | | |
| Money Market Funds | | $ | 9,971,207 | | | $ | — | | | $ | — | | | $ | 9,971,207 | |
| Total Short-Term Investments | | $ | 9,971,207 | | | $ | — | | | $ | — | | | $ | 9,971,207 | |
| Total Investments | | $ | 190,687,270 | | | $ | — | | | $ | — | | | $ | 190,687,270 | |
Transfers between levels are recognized at the end of the reporting period. During the six-month period ended April 30, 2018, the Fund recognized no transfers between levels.
The accompanying notes are an integral part of these financial statements.
| HENNESSY FUNDS | 1-800-966-4354 | |
Financial Statements
Statement of Assets and Liabilities as of April 30, 2018 (Unaudited) |
| ASSETS: | | | |
| Investments in securities, at value (cost $158,368,514) | | $ | 190,687,270 | |
| Dividends and interest receivable | | | 95,700 | |
| Receivable for fund shares sold | | | 40,988 | |
| Receivable for securities sold | | | 307,193 | |
| Prepaid expenses and other assets | | | 29,523 | |
| Total Assets | | | 191,160,674 | |
| | | | | |
| LIABILITIES: | | | | |
| Payable for securities purchased | | | 233,250 | |
| Payable for fund shares redeemed | | | 156,271 | |
| Payable to advisor | | | 144,065 | |
| Payable to administrator | | | 30,179 | |
| Payable to auditor | | | 10,259 | |
| Accrued distribution fees | | | 32,145 | |
| Accrued service fees | | | 13,337 | |
| Accrued trustees fees | | | 4,951 | |
| Accrued expenses and other payables | | | 51,111 | |
| Total Liabilities | | | 675,568 | |
| NET ASSETS | | $ | 190,485,106 | |
| | | | | |
| NET ASSETS CONSIST OF: | | | | |
| Capital stock | | $ | 148,855,594 | |
| Accumulated net investment income | | | 17,140 | |
| Accumulated net realized gain on investments | | | 9,293,616 | |
| Unrealized net appreciation on investments | | | 32,318,756 | |
| Total Net Assets | | $ | 190,485,106 | |
| | | | | |
| NET ASSETS | | | | |
| Investor Class: | | | | |
| Shares authorized (no par value) | | Unlimited | |
| Net assets applicable to outstanding Investor Class shares | | $ | 160,308,978 | |
| Shares issued and outstanding | | | 6,578,059 | |
| Net asset value, offering price and redemption price per share | | $ | 24.37 | |
| | | | | |
| Institutional Class: | | | | |
| Shares authorized (no par value) | | Unlimited | |
| Net assets applicable to outstanding Institutional Class shares | | $ | 30,176,128 | |
| Shares issued and outstanding | | | 2,051,901 | |
| Net asset value, offering price and redemption price per share | | $ | 14.71 | |
The accompanying notes are an integral part of these financial statements.
HENNESSYFUNDS.COM
| STATEMENT OF ASSETS AND LIABILITIES/ STATEMENT OF OPERATIONS |
Financial Statements
Statement of Operations for the six months ended April 30, 2018 (Unaudited) |
| INVESTMENT INCOME: | | | |
| Dividend income | | $ | 1,510,045 | |
| Interest income | | | 60,808 | |
| Total investment income | | | 1,570,853 | |
| | | | | |
| EXPENSES: | | | | |
| Investment advisory fees (See Note 5) | | | 901,821 | |
| Sub-transfer agent expenses – Investor Class (See Note 5) | | | 186,077 | |
| Sub-transfer agent expenses – Institutional Class (See Note 5) | | | 13,910 | |
| Distribution fees – Investor Class (See Note 5) | | | 124,136 | |
| Administration, fund accounting, custody and transfer agent fees (See Note 5) | | | 94,225 | |
| Service fees – Investor Class (See Note 5) | | | 82,757 | |
| Federal and state registration fees | | | 24,148 | |
| Compliance expense (See Note 5) | | | 14,628 | |
| Reports to shareholders | | | 13,535 | |
| Audit fees | | | 10,860 | |
| Trustees’ fees and expenses | | | 9,395 | |
| Legal fees | | | 755 | |
| Other expenses | | | 7,980 | |
| Total expenses | | | 1,484,227 | |
| NET INVESTMENT INCOME | | $ | 86,626 | |
| | | | | |
| REALIZED AND UNREALIZED GAINS (LOSSES): | | | | |
| Net realized gain on investments | | $ | 10,389,825 | |
| Net change in unrealized appreciation on investments | | | (8,093,671 | ) |
| Net gain on investments | | | 2,296,154 | |
| NET INCREASE IN NET ASSETS RESULTING FROM OPERATIONS | | $ | 2,382,780 | |
The accompanying notes are an integral part of these financial statements.
| HENNESSY FUNDS | 1-800-966-4354 | |
(This Page Intentionally Left Blank.)
| STATEMENTS OF CHANGES IN NET ASSETS |
Financial Statements
| Statements of Changes in Net Assets |
| | | Six Months Ended | | | | |
| | | April 30, 2018 | | | Year Ended | |
| | | (Unaudited) | | | October 31, 2017 | |
| OPERATIONS: | | | | | | |
| Net investment income (loss) | | $ | 86,626 | | | $ | (3,352 | ) |
| Net realized gain on investments | | | 10,389,825 | | | | 19,986,888 | |
| Net change in unrealized appreciation on investments | | | (8,093,671 | ) | | | 17,014,799 | |
| Net increase in net assets resulting from operations | | | 2,382,780 | | | | 36,998,335 | |
| | | | | | | | | |
| DISTRIBUTIONS TO SHAREHOLDERS FROM: | | | | | | | | |
| Net investment income – Investor Class | | | (19,899 | ) | | | (483,756 | ) |
| Net investment income – Institutional Class | | | (49,587 | ) | | | (414,103 | ) |
| Net realized gains – Investor Class | | | (12,647,349 | ) | | | (19,796,278 | ) |
| Net realized gains – Institutional Class | | | (2,760,804 | ) | | | (3,118,417 | ) |
| Total distributions | | | (15,477,639 | ) | | | (23,812,554 | ) |
| | | | | | | | | |
| CAPITAL SHARE TRANSACTIONS: | | | | | | | | |
| Proceeds from shares subscribed – Investor Class | | | 15,902,837 | | | | 100,903,651 | |
| Proceeds from shares subscribed – Institutional Class | | | 4,585,174 | | | | 35,239,059 | |
| Dividends reinvested – Investor Class | | | 12,401,989 | | | | 19,917,344 | |
| Dividends reinvested – Institutional Class | | | 2,696,155 | | | | 3,189,710 | |
| Cost of shares redeemed – Investor Class | | | (31,244,614 | ) | | | (90,350,351 | ) |
| Cost of shares redeemed – Institutional Class | | | (12,694,543 | ) | | | (23,511,159 | ) |
| Net increase (decrease) in net assets derived | | | | | | | | |
| from capital share transactions | | | (8,353,002 | ) | | | 45,388,254 | |
| TOTAL INCREASE (DECREASE) IN NET ASSETS | | | (21,447,861 | ) | | | 58,574,035 | |
| | | | | | | | | |
| NET ASSETS: | | | | | | | | |
| Beginning of period | | | 211,932,967 | | | | 153,358,932 | |
| End of period | | $ | 190,485,106 | | | $ | 211,932,967 | |
| Undistributed net investment income, end of period | | $ | 17,140 | | | $ | — | |
| | | | | | | | | |
| CHANGES IN SHARES OUTSTANDING: | | | | | | | | |
| Shares sold – Investor Class | | | 637,747 | | | | 3,914,617 | |
| Shares sold – Institutional Class | | | 306,564 | | | | 2,297,508 | |
| Shares issued to holders as reinvestment | | | | | | | | |
| of dividends – Investor Class | | | 506,624 | | | | 782,880 | |
| Shares issued to holders as reinvestment | | | | | | | | |
| of dividends – Institutional Class | | | 182,573 | | | | 206,594 | |
| Shares redeemed – Investor Class | | | (1,253,431 | ) | | | (3,635,991 | ) |
| Shares redeemed – Institutional Class | | | (854,192 | ) | | | (1,581,565 | ) |
| Net increase (decrease) in shares outstanding | | | (474,115 | ) | | | 1,984,043 | |
The accompanying notes are an integral part of these financial statements.
| HENNESSY FUNDS | 1-800-966-4354 | |
Financial Statements
For an Investor Class share outstanding throughout each period
| | Six Months Ended | |
| | April 30, 2018 | |
| | (Unaudited) | |
| PER SHARE DATA: | | | | |
| Net asset value, beginning of period | | $ | 26.02 | | |
| | | | | | |
| Income from investment operations: | | | | | |
| Net investment income | | | 0.00 | (2) | |
| Net realized and unrealized gains on investments | | | 0.32 | | |
| Total from investment operations | | | 0.32 | | |
| | | | | | |
| Less distributions: | | | | | |
| Dividends from net investment income | | | 0.00 | (2) | |
| Dividends from net realized gains | | | (1.97 | ) | |
| Total distributions | | | (1.97 | ) | |
| Paid-in capital from redemption fees | | | — | | |
| Net asset value, end of period | | $ | 24.37 | | |
| | | | | | |
| TOTAL RETURN | | | 1.22 | %(3) | |
| | | | | | |
| SUPPLEMENTAL DATA AND RATIOS: | | | | | |
| Net assets, end of period (millions) | | $ | 160.31 | | |
| Ratio of expenses to average net assets | | | 1.55 | %(4) | |
| Ratio of net investment income (loss) to average net assets | | | 0.02 | %(4) | |
Portfolio turnover rate(5) | | | 13 | %(3) | |
(1) | Calculated based on average shares outstanding method. |
(2) | Amount is less than $0.01. |
(3) | Not annualized. |
(4) | Annualized. |
(5) | Portfolio turnover is calculated on the basis of the Fund as a whole. |
The accompanying notes are an integral part of these financial statements.
HENNESSYFUNDS.COM
| FINANCIAL HIGHLIGHTS — INVESTOR CLASS |
| Year Ended October 31, | |
| 2017 | | | 2016 | | | 2015 | | | 2014 | | | 2013 | |
| | | | | | | | | | | | | | |
| $ | 23.48 | | | $ | 23.81 | | | $ | 24.13 | | | $ | 25.40 | | | $ | 19.54 | |
| | | | | | | | | | | | | | | | | | | |
| | | | | | | | | | | | | | | | | | | |
| | (0.04 | ) | | | 0.10 | | | | 0.03 | (1) | | | (0.10 | ) | | | 0.10 | |
| | 5.83 | | | | 1.20 | | | | 2.99 | | | | 0.49 | | | | 5.88 | |
| | 5.79 | | | | 1.30 | | | | 3.02 | | | | 0.39 | | | | 5.98 | |
| | | | | | | | | | | | | | | | | | | |
| | | | | | | | | | | | | | | | | | | |
| | (0.06 | ) | | | (0.03 | ) | | | — | | | | (0.06 | ) | | | (0.12 | ) |
| | (3.19 | ) | | | (1.60 | ) | | | (3.34 | ) | | | (1.60 | ) | | | — | |
| | (3.25 | ) | | | (1.63 | ) | | | (3.34 | ) | | | (1.66 | ) | | | (0.12 | ) |
| | — | | | | — | | | | — | | | | 0.00 | (2) | | | 0.00 | (2) |
| $ | 26.02 | | | $ | 23.48 | | | $ | 23.81 | | | $ | 24.13 | | | $ | 25.40 | |
| | | | | | | | | | | | | | | | | | | |
| | 25.03 | % | | | 5.80 | % | | | 14.51 | % | | | 1.40 | % | | | 30.80 | % |
| | | | | | | | | | | | | | | | | | | |
| | | | | | | | | | | | | | | | | | | |
| $ | 174.01 | | | $ | 132.09 | | | $ | 218.50 | | | $ | 193.09 | | | $ | 243.42 | |
| | 1.52 | % | | | 1.54 | % | | | 1.50 | % | | | 1.44 | % | | | 1.46 | % |
| | (0.06 | )% | | | 0.38 | % | | | 0.17 | % | | | (0.36 | )% | | | 0.48 | % |
| | 46 | % | | | 46 | % | | | 49 | % | | | 47 | % | | | 57 | % |
The accompanying notes are an integral part of these financial statements.
| HENNESSY FUNDS | 1-800-966-4354 | |
Financial Statements
For an Institutional Class share outstanding throughout each period
| | Six Months Ended | |
| | April 30, 2018 | |
| | (Unaudited) | |
| PER SHARE DATA: | | | | |
| Net asset value, beginning of period | | $ | 15.69 | | |
| | | | | | |
| Income from investment operations: | | | | | |
| Net investment income (loss) | | | 0.03 | | |
| Net realized and unrealized gains on investments | | | 0.20 | | |
| Total from investment operations | | | 0.23 | | |
| | | | | | |
| Less distributions: | | | | | |
| Dividends from net investment income | | | (0.02 | ) | |
| Dividends from net realized gains | | | (1.19 | ) | |
| Total distributions | | | (1.21 | ) | |
| Net asset value, end of period | | $ | 14.71 | | |
| | | | | | |
| TOTAL RETURN | | | 1.44 | %(2) | |
| | | | | | |
| SUPPLEMENTAL DATA AND RATIOS: | | | | | |
| Net assets, end of period (millions) | | $ | 30.18 | | |
| Ratio of expenses to average net assets | | | 1.15 | %(3) | |
| Ratio of net investment income (loss) to average net assets | | | 0.42 | %(3) | |
Portfolio turnover rate(4) | | | 13 | %(2) | |
(1) | Calculated based on average shares outstanding method. |
(2) | Not annualized. |
(3) | Annualized. |
(4) | Portfolio turnover is calculated on the basis of the Fund as a whole. |
The accompanying notes are an integral part of these financial statements.
HENNESSYFUNDS.COM
| FINANCIAL HIGHLIGHTS — INSTITUTIONAL CLASS |
| Year Ended October 31, | |
| 2017 | | | 2016 | | | 2015 | | | 2014 | | | 2013 | |
| | | | | | | | | | | | | | |
| $ | 14.23 | | | $ | 14.39 | | | $ | 14.53 | | | $ | 15.96 | | | $ | 12.34 | |
| | | | | | | | | | | | | | | | | | | |
| | | | | | | | | | | | | | | | | | | |
| | 0.02 | | | | 0.09 | | | | 0.06 | (1) | | | (0.09 | ) | | | 0.14 | |
| | 3.56 | | | | 0.75 | | | | 1.81 | | | | 0.40 | | | | 3.66 | |
| | 3.58 | | | | 0.84 | | | | 1.87 | | | | 0.31 | | | | 3.80 | |
| | | | | | | | | | | | | | | | | | | |
| | | | | | | | | | | | | | | | | | | |
| | (0.17 | ) | | | (0.04 | ) | | | — | | | | (0.14 | ) | | | (0.18 | ) |
| | (1.95 | ) | | | (0.96 | ) | | | (2.01 | ) | | | (1.60 | ) | | | — | |
| | (2.12 | ) | | | (1.00 | ) | | | (2.01 | ) | | | (1.74 | ) | | | (0.18 | ) |
| $ | 15.69 | | | $ | 14.23 | | | $ | 14.39 | | | $ | 14.53 | | | $ | 15.96 | |
| | | | | | | | | | | | | | | | | | | |
| | 25.56 | % | | | 6.22 | % | | | 14.91 | % | | | 1.70 | % | | | 31.18 | % |
| | | | | | | | | | | | | | | | | | | |
| | | | | | | | | | | | | | | | | | | |
| $ | 37.92 | | | $ | 21.27 | | | $ | 25.94 | | | $ | 42.23 | | | $ | 68.80 | |
| | 1.15 | % | | | 1.17 | % | | | 1.17 | % | | | 1.12 | % | | | 1.15 | % |
| | 0.30 | % | | | 0.72 | % | | | 0.48 | % | | | (0.04 | )% | | | 0.74 | % |
| | 46 | % | | | 46 | % | | | 49 | % | | | 47 | % | | | 57 | % |
The accompanying notes are an integral part of these financial statements.
| HENNESSY FUNDS | 1-800-966-4354 | |
Financial Statements
Notes to the Financial Statements April 30, 2018 (Unaudited) |
1). ORGANIZATION
The Hennessy Small Cap Financial Fund (the “Fund”) is a series of Hennessy Funds Trust (the “Trust”), which was organized as a Delaware statutory trust on September 17, 1992. The Fund is an open-end management investment company registered under the Investment Company Act of 1940, as amended. The investment objective of the Fund is capital appreciation. The Fund is a non-diversified fund.
The Fund offers Investor Class and Institutional Class shares. Each class of shares differs principally in its respective 12b-1 distribution and service, shareholder servicing, and sub-transfer agent expenses. There are no sales charges. Each class has identical rights to earnings, assets, and voting privileges, except for class-specific expenses and exclusive rights to vote on matters affecting only an individual class.
As an investment company, the Fund follows the investment company accounting and reporting guidance of the Financial Accounting Standards Board (“FASB”) Accounting Standard Codification Topic 946 “Financial Services—Investment Companies.”
2). SIGNIFICANT ACCOUNTING POLICIES
The following is a summary of significant accounting policies consistently followed by the Fund in the preparation of the financial statements. These policies conform to U.S. generally accepted accounting principles (“GAAP”).
| a). | Investment Valuation – All investments in securities are recorded at their estimated fair value, as described in Note 3. |
| | |
| b). | Federal Income Taxes – No provision for federal income taxes or excise taxes has been made because the Fund has elected to be taxed as a “regulated investment company” and intends to distribute substantially all of its taxable income to its shareholders and otherwise comply with the provisions of the Internal Revenue Code of 1986, as amended, applicable to regulated investment companies. Net investment income/loss and realized gains/losses for federal income tax purposes may differ from those reported in the financial statements because of temporary book and tax basis differences. Temporary differences are primarily the result of the treatment of wash sales for tax reporting purposes. The Fund recognizes interest and penalties related to income tax benefits, if any, in the Statement of Operations as an income tax expense. Distributions from net realized gains for book purposes may include short-term capital gains, which are included as ordinary income to shareholders for tax purposes. The Fund may utilize equalization accounting for tax purposes and designate earnings and profits, including net realized gains distributed to shareholders on redemption of shares, as part of the dividends paid deduction for income tax purposes. |
| | |
| c). | Accounting for Uncertainty in Income Taxes – The Fund has accounting policies regarding recognition and measurement of tax positions taken or expected to be taken on a tax return. The tax returns of the Fund for the prior three fiscal years are open for examination. The Fund has reviewed all open tax years in major jurisdictions and concluded that there is no impact on the Fund’s net assets and no tax liability resulting from unrecognized tax benefits relating to uncertain income tax positions taken or expected to be taken on a tax return. The Fund’s major tax jurisdictions are U.S. federal and Delaware. |
| NOTES TO THE FINANCIAL STATEMENTS |
| d). | Income and Expenses – Dividend income is recognized on the ex-dividend date or as soon as information is available to the Fund. Interest income, which includes the amortization of premium and accretion of discount, is recognized on an accrual basis. The Fund is charged for those expenses that are directly attributable to the portfolio, such as advisory, administration, and certain shareholder service fees. Income, expenses (other than expenses attributable to a specific class), and realized and unrealized gains/losses on investments are allocated to each class of shares based on such class’s net assets. |
| | |
| e). | Distributions to Shareholders – Dividends from net investment income for the Fund, if any, are declared and paid annually, usually in December. Distributions of net realized capital gains, if any, are declared and paid annually, usually in December. |
| | |
| f). | Security Transactions – Investment and shareholder transactions are recorded on the trade date. The Fund determines the realized gain/loss from an investment transaction by comparing the original cost of the security lot sold with the net sale proceeds. Discounts and premiums on securities purchased are accreted or amortized, respectively, over the life of each such security. |
| | |
| g). | Use of Estimates – The preparation of financial statements in conformity with GAAP requires management to make estimates and assumptions that affect the reported amounts of assets and liabilities and disclosure of contingent assets and liabilities at the date of the financial statements and the reported change in net assets during the reporting period. Actual results could differ from those estimates. |
| | |
| h). | Share Valuation – The net asset value (“NAV”) per share of the Fund is calculated by dividing (i) the total value of the securities held by the Fund, plus cash and other assets, minus all liabilities (including estimated accrued expenses) by (ii) the total number of shares outstanding for the Fund, rounded to the nearest cent. The Fund’s shares will not be priced on days the New York Stock Exchange is closed for trading. The offering and redemption price per share for the Fund is equal to the Fund’s NAV per share. |
3). SECURITIES VALUATION
The Fund follows fair valuation accounting standards that establish an authoritative definition of fair value and set out a hierarchy for measuring fair value. These standards require additional disclosures about the various inputs and valuation techniques used to develop the measurements of fair value and a discussion of changes in valuation techniques and related inputs during the period. These inputs are summarized in the three broad levels listed below:
| | Level 1 – | Unadjusted, quoted prices in active markets for identical instruments that the Fund has the ability to access at the date of measurement. |
| | | |
| | Level 2 – | Other significant observable inputs (including, but not limited to, quoted prices in active markets for similar instruments, quoted prices in markets that are not active for identical or similar instruments, and model-derived valuations in which all significant inputs and significant value drivers are observable in active markets (such as interest rates, prepayment speeds, credit risk curves, default rates, and similar data)). |
| | | |
| | Level 3 – | Significant unobservable inputs (including the Fund’s own assumptions about what market participants would use to price the asset or liability based on the best available information) when observable inputs are unavailable. |
Following is a description of the valuation techniques applied to the Fund’s major categories of assets and liabilities measured at fair value on a recurring basis.
| HENNESSY FUNDS | 1-800-966-4354 | |
| | Equity Securities – Equity securities, including common stocks, preferred stocks, foreign-issued common stocks, exchange-traded funds, closed-end mutual funds, partnerships, rights, and real estate investment trusts, that are traded on a securities exchange for which a last-quoted sales price is readily available will generally be valued at the last sales price as reported by the primary exchange on which the securities are listed. Securities listed on The NASDAQ Stock Market (“NASDAQ”) will generally be valued at the NASDAQ Official Closing Price, which may differ from the last sales price reported. Securities traded on a securities exchange for which a last-quoted sales price is not readily available will generally be valued at the mean between the bid and ask prices. To the extent these securities are actively traded and valuation adjustments are not applied, they are classified in Level 1 of the fair value hierarchy. Securities traded on foreign exchanges generally are not valued at the same time the Fund calculates its NAV because most foreign markets close well before such time. The earlier close of most foreign markets gives rise to the possibility that significant events, including broad market moves, may have occurred in the interim. In certain circumstances, it may be determined that a security needs to be fair valued because it appears that the value of the security might have been materially affected by events occurring after the close of the market in which the security is principally traded, but before the time the Fund calculates its NAV, such as by a development that affects an entire market or region (e.g., a weather-related event) or a potentially global development (e.g., a terrorist attack that may be expected to have an effect on investor expectations worldwide). |
| | |
| | Registered Investment Companies – Investments in registered investment companies (e.g., mutual funds) are generally priced at the ending NAV provided by the applicable registered investment company’s service agent and will be classified in Level 1 of the fair value hierarchy. |
| | |
| | Debt Securities – Debt securities, including corporate bonds, asset-backed securities, mortgage-backed securities, municipal bonds, U.S. Treasuries, and U.S. government agency issues, are generally valued at market on the basis of valuations furnished by an independent pricing service that utilizes both dealer-supplied valuations and formula-based techniques. The pricing service may consider recently executed transactions in securities of the issuer or comparable issuers, market price quotations (where observable), bond spreads, and fundamental data relating to the issuer. In addition, the model may incorporate observable market data, such as reported sales of similar securities, broker quotes, yields, bids, offers, and reference data. Certain securities are valued primarily using dealer quotations. These securities are generally classified in Level 2 of the fair value hierarchy. |
| | |
| | Short-Term Securities – Short-term equity investments, including money market funds, are valued in the manner specified above. Short-term debt investments with an original term to maturity of 60 days or less are valued at amortized cost, which approximates fair market value. If the original term to maturity of a short-term debt investment exceeded 60 days, then the values as of the 61st day prior to maturity are amortized. Amortized cost is not used if its use would be inappropriate due to credit or other impairments of the issuer, in which case the security’s fair value would be determined, as described below. Short-term securities are generally classified in Level 1 or Level 2 of the fair market hierarchy depending on the inputs used and market activity levels for specific securities. |
The Board of Trustees of the Fund (the “Board”) has adopted fair value pricing procedures that are followed when a price for a security is not readily available or if a significant event has occurred that indicates the closing price of a security no longer
| NOTES TO THE FINANCIAL STATEMENTS |
represents the true value of that security. Fair value pricing determinations are made in good faith in accordance with these procedures. There are numerous criteria that will be given consideration in determining a fair value of a security, such as the trading volume of a security and markets, the values of other similar securities, and news events with direct bearing on a security or markets. Fair value pricing results in an estimated price for a security that reflects the amount the Fund might reasonably expect to receive in a current sale. Depending on the relative significance of the valuation inputs, these securities may be classified in either Level 2 or Level 3 of the fair value hierarchy.
The fair valuation of foreign securities may be determined with the assistance of a pricing service using correlations between the movement of prices of such securities and indices of domestic securities and other appropriate indicators, such as closing market prices of relevant American Depositary Receipts or futures contracts. The effect of using fair value pricing is that the Fund’s NAV will reflect the affected portfolio securities’ values as determined by the Board or its designee instead of being determined by the market. Using a fair value pricing methodology to price a foreign security may result in a value that is different from such foreign security’s most recent closing price and from the value used by other investment companies to calculate their NAVs. Such securities are generally classified in Level 2 of the fair valuation hierarchy. Because the Fund may invest in foreign securities, the value of the Fund’s portfolio securities may change on days when you will not be able to purchase or redeem your shares.
The Board has delegated day-to-day valuation matters to a Valuation Committee comprised of one or more representatives from Hennessy Advisors, Inc., the Fund’s investment advisor (the “Advisor”). The function of the Valuation Committee is to value securities where current and reliable market quotations are not readily available. All actions taken by the Valuation Committee are reviewed by the Board.
The Fund has performed an analysis of all existing investments to determine the significance and character of all inputs to their fair value determinations. Various inputs are used to determine the value of the Fund’s investments. The inputs or methodology used for valuing securities are not necessarily an indication of the risk associated with investing in those securities. Details related to the fair valuation hierarchy of the Fund’s securities as of April 30, 2018, are included in the Schedule of Investments.
4). INVESTMENT TRANSACTIONS
Purchases and sales of investment securities (excluding government and short-term investments) for the Fund during the six months ended April 30, 2018, were $25,613,894 and $52,125,229, respectively.
There were no purchases or sales/maturities of long-term U.S. government securities for the Fund during the six months ended April 30, 2018.
The Fund is permitted to purchase or sell securities from or to another fund in the Hennessy Funds family of funds (the “Hennessy Funds”) under specified conditions outlined in procedures adopted by the Board. The procedures have been designed to ensure that any purchase or sale of securities by the Fund from or to another Hennessy Fund complies with Rule 17a-7 of the Investment Company Act of 1940, as amended. During the six months ended April 30, 2018, the Fund did not engage in purchases or sales of securities pursuant to Rule 17a-7 of the Investment Company Act of 1940, as amended.
5). INVESTMENT MANAGEMENT FEE AND OTHER TRANSACTIONS WITH AFFILIATES
The Advisor provides the Fund with investment management services under an Investment Advisory Agreement. The Advisor furnishes all investment advice, office space, and facilities, as well as most of the personnel needed by the Fund. As
| HENNESSY FUNDS | 1-800-966-4354 | |
compensation for its services, the Advisor is entitled to a monthly fee from the Fund. The fee is based upon the average daily net assets of the Fund at an annual rate of 0.90%. The net investment advisory fees expensed by the Fund during the six months ended April 30, 2018, are included in the Statement of Operations.
The Board has approved a Shareholder Servicing Agreement for Investor Class shares of the Fund, which was instituted to compensate the Advisor for the non-investment management services it provides to the Fund. The Shareholder Servicing Agreement provides for a monthly fee paid to the Advisor at an annual rate of 0.10% of the average daily net assets of the Fund attributable to Investor Class shares. The shareholder service fees expensed by the Fund during the six months ended April 30, 2018, are included in the Statement of Operations.
The Fund has adopted a plan pursuant to Rule 12b-1 under the Investment Company Act of 1940, as amended, that authorizes payments in connection with the distribution of the Fund’s shares at an annual rate of up to 0.25% of the Fund’s average daily net assets attributable to Investor Class shares. Even though the authorized rate is up to 0.25%, the Fund is currently only using up to 0.15% of its average daily net assets attributable to Investor Class shares for such purpose. Amounts paid under the plan may be spent on any activities or expenses primarily intended to result in the sale of shares, including, but not limited to, advertising, shareholder account servicing, the printing and mailing of prospectuses to other than current shareholders, the printing and mailing of sales literature, and compensation for sales and marketing activities or to financial institutions and others, such as dealers and distributors. The distribution fees expensed by the Fund during the six months ended April 30, 2018, are included in the Statement of Operations.
The Fund has entered into agreements with various brokers, dealers, and financial intermediaries in connection with the sale of shares of the Fund. The agreements provide for periodic payments by the Fund to the brokers, dealers, and financial intermediaries for providing certain shareholder maintenance services (sub-transfer agent expenses). These shareholder services include the pre-processing and quality control of new accounts, shareholder correspondence, answering customer inquiries regarding account status, and facilitating shareholder telephone transactions. The sub-transfer agent fees expensed by the Fund during the six months ended April 30, 2018, are included in the Statement of Operations.
U.S. Bancorp Fund Services, LLC (“USBFS”) provides the Fund with administrative, fund accounting, and transfer agent services. As administrator, USBFS is responsible for activities such as (i) preparing various federal and state regulatory filings, reports, and returns for the Fund, (ii) preparing reports and materials to be supplied to the Board, (iii) monitoring the activities of the Fund’s custodian, transfer agent, and accountants, and (iv) coordinating the preparation and payment of the Fund’s expenses and reviewing the Fund’s expense accruals. U.S. Bank N.A., an affiliate of USBFS, serves as the Fund’s custodian. The servicing agreements between the Trust and USBFS and U.S. Bank N.A. contain a fee schedule that is inclusive of administrative, fund accounting, custody, and transfer agent fees. The administrative, fund accounting, custody, and transfer agent fees expensed by the Fund during the six months ended April 30, 2018, are included in the Statement of Operations.
Quasar Distributors, LLC acts as the Fund’s principal underwriter in a continuous public offering of the Fund’s shares. Quasar Distributors, LLC is an affiliate of USBFS and U.S. Bank N.A.
The officers of the Fund are affiliated with the Advisor. Such officers, with the exception of the Chief Compliance Officer and the Senior Compliance Officer, receive no
HENNESSYFUNDS.COM
| NOTES TO THE FINANCIAL STATEMENTS |
compensation from the Fund for serving in their respective roles. The Fund, along with the other Hennessy Funds, makes reimbursement payments, on an equal basis, to the Advisor for a portion of the salary and benefits associated with the office of the Chief Compliance Officer and for all of the salary and benefits associated with the office of the Senior Compliance Officer. The compliance fees expensed by the Fund during the six months ended April 30, 2018, are included in the Statement of Operations.
6). GUARANTEES AND INDEMNIFICATIONS
Under the Hennessy Funds’ organizational documents, their officers and trustees are indemnified by the Hennessy Funds against certain liabilities arising out of the performance of their duties to the Hennessy Funds. Additionally, in the normal course of business, the Hennessy Funds enter into contracts with service providers that contain general indemnification clauses. The Fund’s maximum exposure under these arrangements is unknown as this would involve future claims that may be made against the Fund that have not yet occurred. Currently, the Fund expects the risk of loss to be remote.
7). LINE OF CREDIT
The Fund has an uncommitted line of credit with the other Hennessy Funds in the amount of the lesser of (i) $100,000,000 or (ii) 33.33% of each Hennessy Fund’s net assets, or 30% for the Hennessy Gas Utility Fund and 10% for the Hennessy Balanced Fund, intended to provide short-term financing, if necessary, subject to certain restrictions, in connection with shareholder redemptions. The credit facility is with the Hennessy Funds’ custodian bank, U.S. Bank N.A. Borrowings under this arrangement bear interest at the bank’s prime rate and are secured by all of the Fund’s assets (as to its own borrowings only). During the six months ended April 30, 2018, the Fund did not have any borrowings outstanding under the line of credit.
8). FEDERAL TAX INFORMATION
As of October 31, 2017, the Fund’s most recent fiscal year end, the components of accumulated earnings (losses) for income tax purposes were as follows:
| | | Investments | |
| Cost of investments for tax purposes | | $ | 172,961,243 | |
| Gross tax unrealized appreciation | | $ | 43,775,010 | |
| Gross tax unrealized depreciation | | | (4,084,994 | ) |
| Net tax unrealized appreciation | | $ | 39,690,016 | |
| Undistributed ordinary income | | $ | 1,303,242 | |
| Undistributed long-term capital gains | | | 13,731,113 | |
| Total distributable earnings | | $ | 15,034,355 | |
| Other accumulated gain | | $ | — | |
| Total accumulated gain | | $ | 54,724,371 | |
The difference between book-basis unrealized appreciation/depreciation (as shown in the Statement of Assets and Liabilities) and tax-basis unrealized appreciation/depreciation (as shown above) is attributable primarily to wash sales.
As of October 31, 2017, the Fund’s most recent fiscal year end, the Fund had no tax basis capital losses to offset future capital gains.
As of October 31, 2017, the Fund’s most recent fiscal year end, the Fund did not defer, on a tax basis, any late-year ordinary losses. Late-year ordinary losses are net ordinary losses incurred after December 31, 2016, but within the taxable year, that are deemed to arise on the first day of the Fund’s next taxable year.
| HENNESSY FUNDS | 1-800-966-4354 | |
During fiscal year 2018 (year to date) and fiscal year 2017, the tax character of distributions paid by the Fund was as follows:
| | | Six Months Ended | | | Year Ended | |
| | | April 30, 2018 | | | October 31, 2017 | |
Ordinary income(1) | | $ | 1,372,736 | | | $ | 897,859 | |
| Long-term capital gain | | | 14,104,903 | | | | 22,914,695 | |
| | | $ | 15,477,639 | | | $ | 23,812,554 | |
(1) Ordinary income includes short-term gain/loss.
9). EVENTS SUBSEQUENT TO PERIOD END
Management has evaluated the Fund’s related events and transactions that occurred subsequent to April 30, 2018, through the date of issuance of the Fund’s financial statements. Management has determined that there were no subsequent events requiring recognition or disclosure in the financial statements.
| NOTES TO THE FINANCIAL STATEMENTS/EXPENSE EXAMPLE |
Expense Example (Unaudited)
April 30, 2018
As a shareholder of the Fund, you incur two types of costs: (1) transaction costs, including sales charges (loads) on purchase payments, reinvested dividends, or other distributions; redemption fees; and exchange fees; and (2) ongoing costs, including management fees; service fees; and other Fund expenses. This Example is intended to help you understand your ongoing costs (in dollars) of investing in the Fund and to compare these costs with the ongoing costs of investing in other mutual funds. The Example is based on an investment of $1,000 invested at the beginning of the period and held for the entire period from November 1, 2017, through April 30, 2018.
Actual Expenses
The first line of the table below under the “Investor Class” and “Institutional Class” headings provides information about actual account values and actual expenses. Although the Fund charges no sales loads or transaction fees, you will be assessed fees for outgoing wire transfers, returned checks and stop payment orders at prevailing rates charged by U.S. Bancorp Fund Services, LLC, the Fund’s transfer agent. If you request that a redemption be made by wire transfer, currently a $15 fee is charged by the Fund’s transfer agent. IRA accounts will be charged a $15 annual maintenance fee. The example below includes, but is not limited to, management fees, shareholder servicing fees, fund accounting, custody, and transfer agent fees. However, the example below does not include portfolio trading commissions and related expenses, and other extraordinary expenses as determined under generally accepted accounting principles. You may use the information in this line, together with the amount you invested, to estimate the expenses that you paid over the period. Simply divide your account value by $1,000 (for example, an $8,600 account value divided by $1,000 = 8.6), then multiply the result by the number in the first line of the table under the “Investor Class” or “Institutional Class” headings in the column entitled “Expenses Paid During Period” to estimate the expenses you paid on your account during this period.
Hypothetical Example for Comparison Purposes
The second line of the table below under the “Investor Class” and “Institutional Class” headings provides information about hypothetical account values and hypothetical expenses based on the Fund’s actual expense ratios and an assumed rate of return of 5% per year before expenses, which is not the Fund’s actual return. The hypothetical account values and expenses may not be used to estimate the actual ending account balance or expenses you paid for the period. You may use this information to compare the ongoing costs of investing in the Fund and other funds. To do so, compare this 5% hypothetical example with the 5% hypothetical examples that appear in the shareholder reports of the other funds. Please note that the expenses shown in the table are meant to highlight your ongoing costs only and do not reflect any transactional costs, such as sales charges (loads), or exchange fees. Therefore, the second line of the table under the “Investor Class” and “Institutional Class” headings is useful in comparing ongoing costs only, and will not help you determine the relative total costs of owning different funds. In addition, if these transactional costs were included, your costs would have been higher.
| HENNESSY FUNDS | 1-800-966-4354 | |
| | | | Expenses Paid |
| | Beginning | Ending | During Period(1) |
| | Account Value | Account Value | November 1, 2017 – |
| | November 1, 2017 | April 30, 2018 | April 30, 2018 |
| Investor Class | | | |
| Actual | $1,000.00 | $1,012.20 | $7.73 |
| Hypothetical (5% return before expenses) | $1,000.00 | $1,017.11 | $7.75 |
| | | | |
| Institutional Class | | | |
| Actual | $1,000.00 | $1,014.40 | $5.74 |
| Hypothetical (5% return before expenses) | $1,000.00 | $1,019.09 | $5.76 |
(1) | Expenses are equal to the Fund’s expense ratio of 1.55% for Investor Class shares or 1.15% for Institutional Class shares, as applicable, multiplied by the average account value over the period, multiplied by 181/365 days (to reflect one-half year period). |
HENNESSYFUNDS.COM
| EXPENSE EXAMPLE — IMPORTANT NOTICE REGARDING DELIVERY OF SHAREHOLDER DOCUMENTS |
How to Obtain a Copy of the Fund’s
Proxy Voting Policy and Proxy Voting Records
A description of the policies and procedures the Fund uses to determine how to vote proxies relating to portfolio securities is available without charge (1) by calling 1-800-966-4354, (2) on the Hennessy Funds’ website at hennessyfunds.com/proxy-voting/voting-policy, or (3) on the U.S. Securities and Exchange Commission’s (the “SEC”) website at www.sec.gov. The Fund’s proxy voting record is available without charge on both the Hennessy Funds’ website at hennessyfunds.com/proxy-voting/voting-record and the SEC’s website at www.sec.gov no later than August 31 for the prior 12 months ending June 30.
Quarterly Filings on Form N-Q
The Fund files a complete schedule of portfolio holdings with the SEC for the first and third quarters of each fiscal year on Form N-Q. The Fund’s Forms N-Q are available on the SEC’s website at www.sec.gov. The Fund’s Forms N-Q may be reviewed and copied at the SEC’s Public Reference Room in Washington, DC and information on the operation of the Public Reference Room may be obtained by calling 1-800-SEC-0330. Information included in the Fund’s Forms N-Q will also be available upon request by calling 1-800-966-4354.
Federal Tax Distribution Information
(Unaudited)
For fiscal year 2017, certain dividends paid by the Fund may be subject to a maximum tax rate of 23.8%, as provided for by the Jobs and Growth Tax Relief Reconciliation Act of 2003. The percentage of dividends declared from ordinary income designated as qualified dividend income was 100.00%.
For corporate shareholders, the percent of ordinary income distributions that qualified for the corporate dividends received deduction for fiscal year 2017, was 100.00%.
The percentage of taxable ordinary income distributions that were designated as short-term capital gain distributions under Section 871(k)(2)(C) of the Internal Revenue Code of 1986, as amended, for the Fund was 0.00%.
Important Notice Regarding Delivery of
Shareholder Documents
To help keep the Fund’s costs as low as possible, we generally deliver a single copy of shareholder reports, proxy statements, and prospectuses to shareholders who share an address and have the same last name. This process does not apply to account statements. You may request an individual copy of a shareholder document at any time. If you would like to receive separate mailings of shareholder documents, please call U.S. Bancorp Fund Services, LLC at 1-800-261-6950 or 1-414-765-4124, and individual delivery will begin within 30 days of your request. If your account is held through a financial institution or other intermediary, please contact such intermediary directly to request individual delivery.
| HENNESSY FUNDS | 1-800-966-4354 | |
Board Approval of Investment Advisory
Agreement
At its meeting on March 7, 2018, the Board of Trustees of the Fund (the “Board,” and the members thereof, the “Trustees”) unanimously approved the continuation of the investment advisory agreement of the Fund with Hennessy Advisors, Inc. (the “Advisor”). As part of the process of approving the continuation of the advisory agreement, the Trustees reviewed their fiduciary duties with respect to approving the advisory agreement and the relevant factors for them to consider. In addition, the Trustees who are not deemed “interested persons” (as defined by the Investment Company Act of 1940, as amended) of the Fund (the “Independent Trustees”) met in executive session to discuss the approval of the advisory agreement.
In advance of the meeting, the Advisor sent detailed information to the Trustees to assist them in their evaluation of the advisory agreement. This information included, but was not limited to, the following:
| | (1) | A memorandum from outside legal counsel that described the fiduciary duties of the Board with respect to approving the continuation of the advisory agreement and the relevant factors for consideration; |
| | | |
| | (2) | A memorandum from the Advisor that listed the factors relevant to the Board’s approval of the continuation of the advisory agreement and also referenced the documents that had been provided to help the Board assess each such factor; |
| | | |
| | (3) | An inventory of the range of services provided by the Advisor to the Fund; |
| | | |
| | (4) | A written discussion of economies of scale; |
| | | |
| | (5) | The advisory agreement; |
| | | |
| | (6) | A recent Fund fact sheet, which included, among other things, performance information over various periods; |
| | | |
| | (7) | A peer expense comparison of both the net expense ratio and investment advisory fee of the Fund; |
| | | |
| | (8) | The Advisor’s most recent Form 10-K and Form 10-Q, which includes information about the Advisor’s profitability; |
| | | |
| | (9) | Information about brokerage commissions; |
| | | |
| | (10) | Information about the Fund’s compliance program; and |
| | | |
| | (11) | The Advisor’s current Form ADV Part I. |
All of the factors discussed were considered as a whole by the Trustees, and also by the Independent Trustees meeting in executive session. The factors were viewed in their totality by the Trustees, with no single factor being the principal or determinative factor in the Trustees’ determination of whether to approve the continuation of the advisory agreement. The Trustees recognized that the management and fee arrangements for the Fund are the result of years of review and discussion between the Independent Trustees and the Advisor, that certain aspects of such arrangements may receive greater scrutiny in some years than in others, and that the Trustees’ conclusions may be based, in part, on their consideration of these same arrangements and information received during the course of the year and in prior years.
HENNESSYFUNDS.COM
| BOARD APPROVAL OF INVESTMENT ADVISORY AGREEMENT |
Prior to approving the continuation of the advisory agreement, the Trustees, including the Independent Trustees in executive session, considered, among other items:
| | (1) | The nature and quality of the advisory services provided by the Advisor; |
| | | |
| | (2) | A comparison of the fees and expenses of the Fund to other similar funds; |
| | | |
| | (3) | Whether economies of scale are recognized by the Fund; |
| | | |
| | (4) | The costs and profitability of the Fund to the Advisor; |
| | | |
| | (5) | The performance of the Fund; and |
| | | |
| | (6) | Any benefits to the Advisor from serving as an investment advisor to the Fund (other than the advisory fee). |
The material considerations and determinations of the Trustees, including the Independent Trustees, were as follows:
| | (1) | The Trustees considered the services identified below that are provided by the Advisor. Based on this review, the Trustees concluded that the Advisor provides high-quality services to the Fund, and they noted that their overall confidence in the Advisor is high. The Trustees also concluded that they were satisfied with the nature, extent, and quality of the advisory services provided to the Fund by the Advisor, and that the nature and extent of the services provided by the Advisor are appropriate to assure that the Fund’s operations are conducted in compliance with applicable laws, rules, and regulations. |
| | | (a) | The Advisor acts as the portfolio manager for the Fund. In this capacity, the Advisor does the following: |
| | | | (i) | manages the composition of the Fund’s portfolio, including the purchase, retention, and disposition of portfolio securities in accordance with the Fund’s investment objectives, policies, and restrictions; |
| | | | | |
| | | | (ii) | ensures compliance with “best execution” for the Fund’s portfolio; |
| | | | | |
| | | | (iii) | manages the use of soft dollars for the Fund; and |
| | | | | |
| | | | (iv) | manages proxy voting for the Fund. |
| | | (b) | The Advisor performs a daily reconciliation of portfolio positions and cash for the Fund. |
| | | | |
| | | (c) | The Advisor monitors the Fund’s compliance with its investment objectives and restrictions. |
| | | | |
| | | (d) | The Advisor monitors compliance with federal securities laws and performs activities such as maintaining a compliance program, conducting ongoing reviews of the compliance programs of the Fund’s service providers, conducting on-site visits to the Fund’s service providers, monitoring incidents of abusive trading practices, reviewing Fund expense accruals, payments, and fixed expense ratios, evaluating insurance providers for fidelity bond coverage and D&O/E&O insurance coverage, conducting employee compliance training, reviewing reports provided by service providers, maintaining books and records, and preparing an annual compliance report for the Board. |
| | | | |
| | | (e) | The Advisor oversees service providers that provide accounting, administration, distribution, transfer agency, custodial, sales, marketing, public relations, audit, information technology, and legal services to the Fund. |
| HENNESSY FUNDS | 1-800-966-4354 | |
| | | (f) | The Advisor maintains in-house marketing and distribution departments on behalf of the Fund. |
| | | | |
| | | (g) | The Advisor is actively involved with preparing regulatory filings for the Fund, including writing and annually updating the Fund’s prospectus and related documents. |
| | | | |
| | | (h) | The Advisor prepares a written summary of the Fund’s performance for the most recent 12-month period for each annual report of the Fund. |
| | | | |
| | | (i) | The Advisor oversees distribution of the Fund through third-party broker/dealers and independent financial institutions such as Charles Schwab, Inc., Fidelity, TD Waterhouse, and Pershing. The Advisor participates in “no transaction fee” (“NTF”) programs with these companies on behalf of the Fund, which allow customers to purchase the Fund through third-party distribution channels without paying a transaction fee. The Advisor compensates, in part, a number of these third-party providers of NTF programs out of its own revenues. |
| | | | |
| | | (j) | The Advisor pays the incentive compensation of the Fund’s compliance officers and employs other staff, such as legal, marketing, national accounts, distribution, sales, administrative, and trading oversight personnel, as well as management executives. |
| | | | |
| | | (k) | The Advisor provides a quarterly compliance certification to the Board. |
| | | | |
| | | (l) | The Advisor prepares or reviews Board materials, frequently presents to the Board or leads Board discussions, prepares or reviews meeting minutes, and arranges for Board training and education. |
| | (2) | The Trustees compared the performance of the Fund to benchmark indices over various time periods and also noted that the Trustees review and discuss reports comparing the investment performance of the Fund to various indices at each quarterly Board meeting. Based on all such information, the Trustees believe that the Advisor manages the Fund in a manner that is materially consistent with its stated investment objective and style. The Trustees concluded that the performance of the Fund over various time periods warranted the continuation of the advisory agreement. |
| | | |
| | (3) | The Trustees reviewed the advisory fees and overall expense ratios of the Fund compared to other funds similar in asset size and investment objective to the Fund using data from Morningstar. As part of the discussion with management, the Trustees ensured that they understood and were comfortable with the criteria used to determine the mutual funds included in the Morningstar categories for purposes of the materials considered at the meeting. The Trustees determined that the advisory fee and overall expense ratio of the Fund falls within the range of the advisory fees and overall expense ratios of other comparable funds and concluded that they are reasonable and warranted continuation of the advisory agreement. |
| | | |
| | (4) | The Trustees also considered whether economies of scale were being realized by the Advisor that should be shared with the Fund’s shareholders. The Trustees noted that many of the expenses incurred to manage the Fund are asset-based fees and thus do not result in material economies of scale being realized as the assets of the Fund increase. For example, mutual fund platform fees increase as the Fund’s assets grow. The Trustees also considered the Advisor’s efforts to |
HENNESSYFUNDS.COM
| BOARD APPROVAL OF INVESTMENT ADVISORY AGREEMENT |
| | | contain expenses, the Advisor’s significant marketing efforts to promote the Funds, and the Advisor’s agreement to waive fees or lower its management fees in certain circumstances. The Trustees determined that it did not appear that there were significant economies of scale being realized by the Advisor and concluded that it would continue to monitor economies of scale in the future as circumstances changed. |
| | | |
| | (5) | The Trustees considered the profitability of the Advisor, including the impact of mutual fund platform fees on the Advisor’s profitability, and also considered the resources and revenues that the Advisor has put into managing and distributing the Fund. The Trustees then concluded that the profits of the Advisor are reasonable and not excessive when compared to profitability guidelines set forth in relevant court cases. |
| | | |
| | (6) | The Trustees considered the high level of professionalism and knowledge of the Advisor’s employees, along with a very low level of turnover, and concluded that this was beneficial to the Fund and its shareholders. |
| | | |
| | (7) | The Trustees considered any benefits to the Advisor from serving as an advisor to the Fund (other than the advisory fee). The Trustees noted that the Advisor may derive ancillary benefits from, by way of example, its association with the Fund in the form of proprietary and third-party research products and services received from broker-dealers that execute portfolio trades for the Fund. The Trustees determined that any such products and services have been used for legitimate purposes relating to the Fund by providing assistance in the investment decision-making process. The Trustees concluded that any additional benefits realized by the Advisor from its relationship with the Fund were reasonable. |
After reviewing the materials provided at the meeting and management’s presentation, as well as other information regularly provided at the Board’s quarterly meetings throughout the year regarding the quality of services provided by the Advisor, the performance of the Fund, expense information, regulatory compliance issues, trading information and related matters, and other factors that the Trustees deemed relevant, the Trustees, including the Independent Trustees, approved the continuation of the advisory agreement.
| HENNESSY FUNDS | 1-800-966-4354 | |
For information, questions or assistance, please call
The Hennessy Funds
1-800-966-4354 or 1-415-899-1555
INVESTMENT ADVISOR
Hennessy Advisors, Inc.
7250 Redwood Boulevard, Suite 200
Novato, California 94945
ADMINISTRATOR,
TRANSFER AGENT,
DIVIDEND PAYING AGENT &
SHAREHOLDER SERVICING AGENT
U.S. Bancorp Fund Services, LLC
P.O. Box 701
Milwaukee, Wisconsin 53201-0701
CUSTODIAN
U.S. Bank N.A.
Custody Operations
1555 North River Center Drive, Suite 302
Milwaukee, Wisconsin 53212
TRUSTEES
Neil J. Hennessy
Robert T. Doyle
J. Dennis DeSousa
Gerald P. Richardson
COUNSEL
Foley & Lardner LLP
777 East Wisconsin Avenue
Milwaukee, Wisconsin 53202-5306
INDEPENDENT REGISTERED
PUBLIC ACCOUNTING FIRM
Tait, Weller & Baker LLP
1818 Market Street, Suite 2400
Philadelphia, Pennsylvania 19103
DISTRIBUTOR
Quasar Distributors, LLC
777 East Wisconsin Avenue
Milwaukee, Wisconsin 53202
hennessyfunds.com | 1-800-966-4354
This report has been prepared for shareholders and may be distributed to
others only if preceded or accompanied by a current prospectus.
SEMI-ANNUAL REPORT
APRIL 30, 2018
HENNESSY LARGE CAP
FINANCIAL FUND
Investor Class HLFNX
Institutional Class HILFX
hennessyfunds.com | 1-800-966-4354
(This Page Intentionally Left Blank.)
Contents
| Letter to Shareholders | | | 2 |
| Performance Overview | | | 4 |
| Financial Statements | | | |
| Schedule of Investments | | | 5 |
| Statement of Assets and Liabilities | | | 8 |
| Statement of Operations | | | 9 |
| Statements of Changes in Net Assets | | | 11 |
| Financial Highlights | | | 12 |
| Notes to the Financial Statements | | | 15 |
| Expense Example | | | 22 |
| Proxy Voting Policy and Proxy Voting Records | | | 24 |
| Quarterly Schedule of Investments | | | 24 |
| Federal Tax Distribution Information | | | 24 |
| Important Notice Regarding Delivery of Shareholder Documents | | | 24 |
| Board Approval of Investment Advisory Agreement | | | 25 |
| HENNESSY FUNDS | 1-800-966-4354 | |
May 2018
Dear Hennessy Funds Shareholder:
Investors in the United States and abroad experienced the return of volatility in the six months ended April 30, 2018, especially during the second half of the period. Equities rallied sharply during the first half of the period and fell back during the second half, but nevertheless ended the period with solid gains, with the Dow Jones Industrial Average posting a total return of 4.5% and the S&P 500 Index up 3.8%. Over the past year, I have repeatedly shared my belief that the stock market was due for a correction, but that it would bounce back, as it has so many times during the current bull market.
In the closing months of 2017 and into January 2018, U.S. equities rallied in response to the enactment of the Tax Cuts and Jobs Act of 2017, which significantly lowered corporate tax rates. Investors were also encouraged by two quarters of real GDP growth of 3.2% and 2.9%. However, equity prices quickly lost ground in reaction to the imposition of trade tariffs on steel and aluminum, and fears that additional proposed tariffs could provoke a trade war with China. Signals from the Federal Reserve that the pace of interest rate increases would move slightly higher also weighed on investors. During the period, the federal funds rate was raised twice, by a quarter point each time, in December 2017 and March 2018.
The current bull market in U.S. equities is now entering its 10th year, and we remain optimistic about the outlook for stock prices. In our opinion, economic fundamentals look positive. The U.S. economy is growing at a solid pace of 2 – 3% annually, inflation is low, and high employment levels are supporting healthy growth in consumption. Wages are rising, but the rate of increase has remained steady at around 2.6% per year since mid-2016. While it appears that the Federal Reserve will continue to raise the federal funds rate and normalize monetary policy, we believe it will be able to do so gradually, avoiding a severe jolt to either financial markets or the economy. Meanwhile, companies continue to report robust earnings growth, boosted this year by lower tax rates.
We believe U.S. equities remain attractively valued. U.S. long bond yields are hovering near 3%, having risen over the period in response to strong economic activity. Prospective PE multiples, however, have dropped significantly since the end of 2017, the result of a combination of lower taxes, higher operating earnings, and lower stock prices. The Dow Jones Industrial Average and the S&P 500 Index are trading at about 17x forward earnings, down from approximately 20x at the beginning of the calendar year, valuations we believe to be very reasonable.
We are not overly concerned about recent protectionist actions by the U.S. administration. We consider the announcements and ongoing discussions regarding import tariffs and NAFTA to be representative of standard Trump deal-making tactics – make far-reaching demands and then negotiate a reasonable outcome that is beneficial to both sides. We expect continued pro-business policies and regulatory relief to be enacted by our leaders in Washington.
Finally, as noted many times in past letters during this bull market, the euphoria that has historically accompanied a peak in the market continues to be absent. Investors today are worried about many things, including higher interest rates, larger budget deficits, higher import tariffs, and political distractions. But they are definitely not euphoric. In the past, I have likened the current bull market to the 1982-2000 bull market, and I continue
HENNESSYFUNDS.COM
to believe the comparison is a good one. We remain confident that the market will be able to weather the current period of volatility and that the economy, despite higher interest rates and possible trade disruptions, is resilient enough to continue its steady growth into the coming year.
Thank you for your continued confidence and investment in the Hennessy Funds. If you have any questions or would like to speak with us directly, please don’t hesitate to call us at (800) 966-4354.
Best regards,
Neil J. Hennessy
President and Chief Investment Officer
Past performance does not guarantee future results.
Mutual fund investing involves risk. Principal loss is possible.
Opinions expressed are those of Neil Hennessy and are subject to change, are not guaranteed, and should not be considered investment advice.
The Dow Jones Industrial Average and S&P 500 Index are unmanaged indices commonly used to measure the performance of U.S. stocks. One cannot invest directly in an index.
Price to earnings (PE) is calculated by dividing a company’s market price per share by its earnings per share. Earnings growth is not a measure of a fund’s future performance.
| HENNESSY FUNDS | 1-800-966-4354 | |
Performance Overview (Unaudited)
AVERAGE ANNUAL TOTAL RETURN FOR PERIODS ENDED APRIL 30, 2018
| | Six | One | Five | Ten |
| | Months(1) | Year | Years | Years |
| Hennessy Large Cap Financial Fund – | | | | |
| Investor Class (HLFNX) | 5.48% | 21.09% | 12.14% | 8.21% |
| Hennessy Large Cap Financial Fund – | | | | |
Institutional Class (HILFX)(2) | 5.64% | 21.44% | 12.40% | 8.33% |
Russell 1000® Financial | | | | |
| Services Index | 4.17% | 17.03% | 13.84% | 5.62% |
Russell 1000® Index | 3.83% | 13.17% | 12.84% | 9.10% |
Expense ratios: 1.82% (Investor Class); 1.51% (Institutional Class)
(1) | Periods less than one year are not annualized. |
(2) | The inception date of Institutional Class shares is June 15, 2015. Performance shown prior to the inception of Institutional Class shares reflects the performance of Investor Class shares and includes expenses that are not applicable to, and are higher than, those of Institutional Class shares. |
Performance data quoted represents past performance; past performance does not guarantee future results. The investment return and principal value of an investment will fluctuate so that an investor’s shares, when redeemed, may be worth more or less than their original cost. The performance table does not reflect the deduction of taxes that a shareholder would pay on Fund distributions or the redemption of Fund shares. Current performance of the Fund may be lower or higher than the performance quoted. Performance data current to the most recent month end may be obtained by visiting hennessyfunds.com. Performance for periods prior to October 26, 2012, is that of the FBR Large Cap Financial Fund.
The Russell 1000® Financial Services Index is an unmanaged index commonly used to measure the performance of large-capitalization financial sector stocks. The Russell 1000® Index is an unmanaged index commonly used to measure the performance of U.S. stocks. One cannot invest directly in an index.
Frank Russell Company (“Russell”) is the source and owner of the trademarks, service marks, and copyrights related to the Russell Indexes. Russell® is a trademark of Frank Russell Company. Neither Russell nor its licensors accept any liability for any errors or omissions in the Russell Indexes or Russell ratings or underlying data and no party may rely on any Russell Indexes or Russell ratings or underlying data contained in this communication. No further distribution of Russell data is permitted without Russell’s express written consent. Russell does not promote, sponsor, or endorse the content of this communication.
The expense ratios presented are from the most recent prospectus. The expense ratios for the current reporting period are available in the Financial Highlights section of this report.
HENNESSYFUNDS.COM
| PERFORMANCE OVERVIEW/SCHEDULE OF INVESTMENTS |
Financial Statements
Schedule of Investments as of April 30, 2018 (Unaudited) |
HENNESSY LARGE CAP FINANCIAL FUND
(% of Net Assets)
| TOP TEN HOLDINGS (EXCLUDING CASH/CASH EQUIVALENTS) | % NET ASSETS |
| Visa, Inc., Class A | 5.04% |
| The Charles Schwab Corp. | 4.96% |
| Bank of America Corp. | 4.76% |
| Mastercard, Inc., Class A | 4.73% |
| Global Payments, Inc. | 4.71% |
| JPMorgan Chase & Co. | 4.63% |
| PayPal Holdings, Inc. | 4.62% |
| Moody’s Corp. | 4.61% |
| The PNC Financial Services Group, Inc. | 4.55% |
| Citigroup, Inc. | 4.52% |
Note: For presentation purposes, the Fund has grouped some of the industry categories. For purposes of categorizing securities for compliance with section 8(b)(1) of the Investment Company Act of 1940, as amended, the Fund uses more specific industry classifications.
The Global Industry Classification Standard (GICS®) was developed by and is the exclusive property and a service mark of MSCI, Inc. and Standard & Poor Financial Services LLC. It has been licensed for use by the Hennessy Funds.
| HENNESSY FUNDS | 1-800-966-4354 | |
| COMMON STOCKS – 96.81% | | Number | | | | | | % of | |
| | | of Shares | | | Value | | | Net Assets | |
| Financials – 69.03% | | | | | | | | | |
| American Express Co. | | | 21,000 | | | $ | 2,073,750 | | | | 3.93 | % |
| Bank of America Corp. | | | 84,000 | | | | 2,513,280 | | | | 4.76 | % |
| Berkshire Hathaway, Inc., Class B (a) | | | 12,300 | | | | 2,382,879 | | | | 4.51 | % |
| Capital One Financial Corp. | | | 25,000 | | | | 2,265,500 | | | | 4.29 | % |
| Citigroup, Inc. | | | 35,000 | | | | 2,389,450 | | | | 4.52 | % |
| Citizens Financial Group, Inc. | | | 45,000 | | | | 1,867,050 | | | | 3.54 | % |
| Fifth Third Bancorp | | | 40,000 | | | | 1,326,800 | | | | 2.51 | % |
| JPMorgan Chase & Co. | | | 22,500 | | | | 2,447,550 | | | | 4.63 | % |
| Moody’s Corp. | | | 15,000 | | | | 2,433,000 | | | | 4.61 | % |
| Morgan Stanley | | | 45,000 | | | | 2,322,900 | | | | 4.40 | % |
| State Street Corp. | | | 11,000 | | | | 1,097,580 | | | | 2.08 | % |
| SunTrust Banks, Inc. | | | 35,000 | | | | 2,338,000 | | | | 4.43 | % |
| The Charles Schwab Corp. | | | 47,000 | | | | 2,616,960 | | | | 4.96 | % |
| The Goldman Sachs Group, Inc. | | | 9,500 | | | | 2,264,135 | | | | 4.29 | % |
| The PNC Financial Services Group, Inc. | | | 16,500 | | | | 2,402,565 | | | | 4.55 | % |
| U.S. Bancorp (c) | | | 20,000 | | | | 1,009,000 | | | | 1.91 | % |
| Wells Fargo & Co. | | | 15,000 | | | | 779,400 | | | | 1.48 | % |
| Zions Bancorporation | | | 35,000 | | | | 1,916,250 | | | | 3.63 | % |
| | | | | | | | 36,446,049 | | | | 69.03 | % |
| | | | | | | | | | | | | |
| Information Technology – 27.78% | | | | | | | | | | | | |
| Global Payments, Inc. | | | 22,000 | | | | 2,487,100 | | | | 4.71 | % |
| Mastercard, Inc., Class A | | | 14,000 | | | | 2,495,780 | | | | 4.73 | % |
| PayPal Holdings, Inc. (a) | | | 32,700 | | | | 2,439,747 | | | | 4.62 | % |
| Square, Inc., Class A (a) | | | 5,000 | | | | 236,700 | | | | 0.45 | % |
| Total System Services, Inc. | | | 27,500 | | | | 2,311,650 | | | | 4.38 | % |
| Visa, Inc., Class A | | | 21,000 | | | | 2,664,480 | | | | 5.04 | % |
| Zillow Group, Inc., Class A (a) | | | 42,000 | | | | 2,031,540 | | | | 3.85 | % |
| | | | | | | | 14,666,997 | | | | 27.78 | % |
| Total Common Stocks | | | | | | | | | | | | |
| (Cost $43,917,234) | | | | | | | 51,113,046 | | | | 96.81 | % |
The accompanying notes are an integral part of these financial statements.
HENNESSYFUNDS.COM
| SHORT-TERM INVESTMENTS – 3.25% | | Number | | | | | | % of | |
| | | of Shares | | | Value | | | Net Assets | |
| Money Market Funds – 3.25% | | | | | | | | | |
| Fidelity Government Portfolio, Institutional Class, 1.58% (b) | | | 1,715,134 | | | $ | 1,715,134 | | | | 3.25 | % |
| | | | | | | | | | | | | |
| Total Short-Term Investments | | | | | | | | | | | | |
| (Cost $1,715,134) | | | | | | | 1,715,134 | | | | 3.25 | % |
| | | | | | | | | | | | | |
| Total Investments | | | | | | | | | | | | |
| (Cost $45,632,368) – 100.06% | | | | | | | 52,828,180 | | | | 100.06 | % |
| Liabilities in Excess of Other Assets – (0.06)% | | | | | | | (33,995 | ) | | | (0.06 | )% |
| | | | | | | | | | | | | |
TOTAL NET ASSETS – 100.00% | | | | | | $ | 52,794,185 | | | | 100.00 | % |
Percentages are stated as a percent of net assets.
| (a) | Non-income producing security. |
| (b) | The rate listed is the fund’s seven-day yield as of April 30, 2018. |
| (c) | Investment in affiliated security. Quasar Distributors, LLC, which serves as the Fund’s distributor, is a subsidiary of U.S. Bancorp. Details of transactions with this affiliated company for the six-month period ended April 30, 2018, are as follows: |
| | Issuer | | U.S. Bancorp | |
| | Beginning Cost | | $ | 838,120 | |
| | Purchase Cost | | $ | 534,574 | |
| | Sales Cost | | $ | (316,055 | ) |
| | Ending Cost | | $ | 1,056,639 | |
| | Dividend Income | | $ | 11,100 | |
| | Net Change in | | | | |
| | Unrealized Appreciation | | $ | (133,979 | ) |
| | Realized Gain | | $ | 50,619 | |
| | Shares | | | 20,000 | |
| | Market Value | | $ | 1,009,000 | |
Summary of Fair Value Exposure at April 30, 2018
The following is a ummary of the inputs used to value the Fund’s net assets as of April 30, 2018 (See Note 3 in the accompanying notes to the financial statements):
| Common Stocks | | Level 1 | | | Level 2 | | | Level 3 | | | Total | |
| Financials | | $ | 36,446,049 | | | $ | — | | | $ | — | | | $ | 36,446,049 | |
| Information Technology | | | 14,666,997 | | | | — | | | | — | | | | 14,666,997 | |
| Total Common Stocks | | $ | 51,113,046 | | | $ | — | | | $ | — | | | $ | 51,113,046 | |
| Short-Term Investments | | | | | | | | | | | | | | | | |
| Money Market Funds | | $ | 1,715,134 | | | $ | — | | | $ | — | | | $ | 1,715,134 | |
| Total Short-Term Investments | | $ | 1,715,134 | | | $ | — | | | $ | — | | | $ | 1,715,134 | |
| Total Investments | | $ | 52,828,180 | | | $ | — | | | $ | — | | | $ | 52,828,180 | |
Transfers between levels are recognized at the end of the reporting period. During the six-month period ended April 30, 2018, the Fund recognized no transfers between levels.
The accompanying notes are an integral part of these financial statements.
| HENNESSY FUNDS | 1-800-966-4354 | |
Financial Statements
Statement of Assets and Liabilities as of April 30, 2018 (Unaudited) |
| ASSETS: | | | |
| Investments in unaffiliated securities, at value (cost $44,575,729) | | $ | 51,819,180 | |
| Investments in affiliated securities, at value (cost $1,056,639) | | | 1,009,000 | |
| Total Investments in securities, at value (cost $45,632,368) | | | 52,828,180 | |
| Dividends and interest receivable | | | 37,407 | |
| Receivable for fund shares sold | | | 54,223 | |
| Prepaid expenses and other assets | | | 23,570 | |
| Total Assets | | | 52,943,380 | |
| | | | | |
| LIABILITIES: | | | | |
| Payable for fund shares redeemed | | | 54,082 | |
| Payable to advisor | | | 39,162 | |
| Payable to administrator | | | 8,160 | |
| Payable to auditor | | | 10,259 | |
| Accrued distribution fees | | | 8,587 | |
| Accrued service fees | | | 3,732 | |
| Accrued interest payable | | | 91 | |
| Accrued trustees fees | | | 5,126 | |
| Accrued expenses and other payables | | | 19,996 | |
| Total Liabilities | | | 149,195 | |
| NET ASSETS | | $ | 52,794,185 | |
| | | | | |
| NET ASSETS CONSIST OF: | | | | |
| Capital stock | | $ | 44,935,815 | |
| Accumulated net investment loss | | | (224,923 | ) |
| Accumulated net realized gain on investments | | | 887,481 | |
| Unrealized net appreciation on investments | | | 7,195,812 | |
| Total Net Assets | | $ | 52,794,185 | |
| | | | | |
| NET ASSETS | | | | |
| Investor Class: | | | | |
| Shares authorized (no par value) | | Unlimited | |
| Net assets applicable to outstanding Investor Class shares | | $ | 45,329,977 | |
| Shares issued and outstanding | | | 2,042,345 | |
| Net asset value, offering price and redemption price per share | | $ | 22.20 | |
| | | | | |
| Institutional Class: | | | | |
| Shares authorized (no par value) | | Unlimited | |
| Net assets applicable to outstanding Institutional Class shares | | $ | 7,464,208 | |
| Shares issued and outstanding | | | 337,470 | |
| Net asset value, offering price and redemption price per share | | $ | 22.12 | |
The accompanying notes are an integral part of these financial statements.
HENNESSYFUNDS.COM
| STATEMENT OF ASSETS AND LIABILITIES/STATEMENT OF OPERATIONS |
Financial Statements
Statement of Operations for the six months ended April 30, 2018 (Unaudited) |
| INVESTMENT INCOME: | | | |
| Dividend income from unaffiliated securities | | $ | 203,894 | |
| Dividend income from affiliated securities | | | 11,100 | |
| Interest income | | | 12,045 | |
| Total investment income | | | 227,039 | |
| | | | | |
| EXPENSES: | | | | |
| Investment advisory fees (See Note 5) | | | 183,575 | |
| Sub-transfer agent expenses – Investor Class (See Note 5) | | | 30,090 | |
| Sub-transfer agent expenses – Institutional Class (See Note 5) | | | 3,564 | |
| Distribution fees – Investor Class (See Note 5) | | | 25,250 | |
| Administration, fund accounting, custody and transfer agent fees (See Note 5) | | | 19,143 | |
| Federal and state registration fees | | | 18,103 | |
| Service fees – Investor Class (See Note 5) | | | 16,833 | |
| Compliance expense (See Note 5) | | | 14,628 | |
| Audit fees | | | 10,860 | |
| Trustees’ fees and expenses | | | 9,036 | |
| Reports to shareholders | | | 4,351 | |
| Other expenses | | | 2,528 | |
| Total expenses | | | 337,961 | |
| NET INVESTMENT LOSS | | $ | (110,922 | ) |
| | | | | |
| REALIZED AND UNREALIZED GAINS (LOSSES): | | | | |
| Net realized gain on: | | | | |
| Unaffiliated investments | | $ | 1,316,180 | |
| Affiliated investments | | | 50,619 | |
| Net change in unrealized appreciation on: | | | | |
| Unaffiliated investments | | | 70,824 | |
| Affiliated investments | | | (133,979 | ) |
| Net gain on investments | | | 1,303,644 | |
| NET INCREASE IN NET ASSETS RESULTING FROM OPERATIONS | | $ | 1,192,722 | |
The accompanying notes are an integral part of these financial statements.
| HENNESSY FUNDS | 1-800-966-4354 | |
(This Page Intentionally Left Blank.)
HENNESSYFUNDS.COM
| STATEMENTS OF CHANGES IN NET ASSETS |
Financial Statements
| Statements of Changes in Net Assets |
| | | Six Months Ended | | | | |
| | | April 30, 2018 | | | Year Ended | |
| | | (Unaudited) | | | October 31, 2017 | |
| OPERATIONS: | | | | | | |
| Net investment loss | | $ | (110,922 | ) | | $ | (116,337 | ) |
| Net realized gain on investments | | | 1,366,799 | | | | 4,459,225 | |
| Net change in unrealized appreciation on investments | | | (63,155 | ) | | | 4,725,077 | |
| Net increase in net assets resulting from operations | | | 1,192,722 | | | | 9,067,965 | |
| | | | | | | | | |
| DISTRIBUTIONS TO SHAREHOLDERS FROM: | | | | | | | | |
| Net investment income – Investor Class | | | — | | | | (158,906 | ) |
| Net investment income –Institutional Class | | | — | | | | (29,650 | ) |
| Net realized gains – Investor Class | | | (1,219,312 | ) | | | — | |
| Net realized gains –Institutional Class | | | (296,176 | ) | | | — | |
| Total distributions | | | (1,515,488 | ) | | | (188,556 | ) |
| | | | | | | | | |
| CAPITAL SHARE TRANSACTIONS: | | | | | | | | |
| Proceeds from shares subscribed – Investor Class | | | 20,972,609 | | | | 5,666,734 | |
| Proceeds from shares subscribed – Institutional Class | | | 3,131,833 | | | | 5,259,686 | |
| Dividends reinvested – Investor Class | | | 1,178,036 | | | | 154,596 | |
| Dividends reinvested – Institutional Class | | | 296,176 | | | | 29,650 | |
| Cost of shares redeemed – Investor Class | | | (2,767,652 | ) | | | (14,389,624 | ) |
| Cost of shares redeemed – Institutional Class | | | (1,857,408 | ) | | | (458,597 | ) |
| Net increase (decrease) in net assets derived | | | | | | | | |
| from capital share transactions | | | 20,953,594 | | | | (3,737,555 | ) |
| TOTAL INCREASE IN NET ASSETS | | | 20,630,828 | | | | 5,141,854 | |
| | | | | | | | | |
| NET ASSETS: | | | | | | | | |
| Beginning of period | | | 32,163,357 | | | | 27,021,503 | |
| End of period | | $ | 52,794,185 | | | $ | 32,163,357 | |
| Undistributed net investment loss, end of period | | $ | (224,923 | ) | | $ | (114,001 | ) |
| | | | | | | | | |
| CHANGES IN SHARES OUTSTANDING: | | | | | | | | |
| Shares sold – Investor Class | | | 914,656 | | | | 289,553 | |
| Shares sold – Institutional Class | | | 138,964 | | | | 265,747 | |
| Shares issued to holders as reinvestment | | | | | | | | |
| of dividends – Investor Class | | | 54,162 | | | | 8,027 | |
| Shares issued to holders as reinvestment | | | | | | | | |
| of dividends – Institutional Class | | | 13,687 | | | | 1,551 | |
| Shares redeemed – Investor Class | | | (122,533 | ) | | | (745,488 | ) |
| Shares redeemed – Institutional Class | | | (81,382 | ) | | | (22,449 | ) |
| Net increase (decrease) in shares outstanding | | | 917,554 | | | | (203,059 | ) |
The accompanying notes are an integral part of these financial statements.
| HENNESSY FUNDS | 1-800-966-4354 | |
Financial Statements
For an Investor Class share outstanding throughout each period
| | Six Months Ended | |
| | April 30, 2018 | |
| | (Unaudited) | |
| PER SHARE DATA: | | | | |
| Net asset value, beginning of period | | $ | 22.02 | | |
| | | | | | |
| Income from investment operations: | | | | | |
| Net investment income (loss) | | | (0.02 | ) | |
| Net realized and unrealized gains (losses) on investments | | | 1.20 | | |
| Total from investment operations | | | 1.18 | | |
| | | | | | |
| Less distributions: | | | | | |
| Dividends from net investment income | | | — | | |
| Dividends from net realized gains | | | (1.00 | ) | |
| Total distributions | | | (1.00 | ) | |
| Net asset value, end of period | | $ | 22.20 | | |
| | | | | | |
| TOTAL RETURN | | | 5.48 | %(2) | |
| | | | | | |
| SUPPLEMENTAL DATA AND RATIOS: | | | | | |
| Net assets, end of period (millions) | | $ | 45.33 | | |
| Ratio of expenses to average net assets | | | 1.71 | %(3) | |
| Ratio of net investment income (loss) to average net assets | | | (0.61 | )%(3) | |
Portfolio turnover rate(4) | | | 25 | %(2) | |
(1) | Amount is less than $0.01. |
(2) | Not annualized. |
(3) | Annualized. |
(4) | Portfolio turnover is calculated on the basis of the Fund as a whole. |
The accompanying notes are an integral part of these financial statements.
HENNESSYFUNDS.COM
| FINANCIAL HIGHLIGHTS — INVESTOR CLASS |
| Year Ended October 31, | |
| 2017 | | | 2016 | | | 2015 | | | 2014 | | | 2013 | |
| | | | | | | | | | | | | | |
| $ | 16.23 | | | $ | 18.36 | | | $ | 20.87 | | | $ | 19.01 | | | $ | 14.16 | |
| | | | | | | | | | | | | | | | | | | |
| | | | | | | | | | | | | | | | | | | |
| | (0.08 | ) | | | 0.07 | | | | 0.01 | | | | 0.00 | (1) | | | (0.03 | ) |
| | 5.97 | | | | (0.49 | ) | | | (0.40 | ) | | | 2.44 | | | | 4.89 | |
| | 5.89 | | | | (0.42 | ) | | | (0.39 | ) | | | 2.44 | | | | 4.86 | |
| | | | | | | | | | | | | | | | | | | |
| | | | | | | | | | | | | | | | | | | |
| | (0.10 | ) | | | (0.02 | ) | | | — | | | | — | | | | (0.01 | ) |
| | — | | | | (1.69 | ) | | | (2.12 | ) | | | (0.58 | ) | | | — | |
| | (0.10 | ) | | | (1.71 | ) | | | (2.12 | ) | | | (0.58 | ) | | | (0.01 | ) |
| $ | 22.02 | | | $ | 16.23 | | | $ | 18.36 | | | $ | 20.87 | | | $ | 19.01 | |
| | | | | | | | | | | | | | | | | | | |
| | 36.41 | % | | | (2.57 | )% | | | (2.57 | )% | | | 13.04 | % | | | 34.37 | % |
| | | | | | | | | | | | | | | | | | | |
| | | | | | | | | | | | | | | | | | | |
| $ | 26.33 | | | $ | 26.67 | | | $ | 100.73 | | | $ | 98.07 | | | $ | 88.30 | |
| | 1.81 | % | | | 1.66 | % | | | 1.57 | % | | | 1.49 | % | | | 1.57 | % |
| | (0.41 | )% | | | 0.16 | % | | | 0.03 | % | | | (0.01 | )% | | | (0.22 | )% |
| | 76 | % | | | 141 | % | | | 74 | % | | | 58 | % | | | 75 | % |
The accompanying notes are an integral part of these financial statements.
| HENNESSY FUNDS | 1-800-966-4354 | |
Financial Statements
For an Institutional Class share outstanding throughout each period
| | | Six Months | | | | | | | | | | |
| | | Ended | | | | | | | | | Period Ended | |
| | | April 30, 2018 | | | Year Ended October 31, | | | October 31, | |
| | | (Unaudited) | | | 2017 | | | 2016 | | | 2015(1) | |
| PER SHARE DATA: | | | | | | | | | | | | |
| Net asset value, beginning of period | | $ | 21.91 | | | $ | 16.26 | | | $ | 18.39 | | | $ | 19.72 | |
| | | | | | | | | | | | | | | | | |
| Income from | | | | | | | | | | | | | | | | |
| investment operations: | | | | | | | | | | | | | | | | |
| Net investment income (loss) | | | (0.13 | ) | | | 0.18 | | | | 0.02 | | | | 0.01 | |
| Net realized and unrealized | | | | | | | | | | | | | | | | |
| gains (losses) on investments | | | 1.34 | | | | 5.78 | | | | (0.36 | ) | | | (1.34 | ) |
| Total from investment operations | | | 1.21 | | | | 5.96 | | | | (0.34 | ) | | | (1.33 | ) |
| | | | | | | | | | | | | | | | | |
| Less distributions: | | | | | | | | | | | | | | | | |
| Dividends from net | | | | | | | | | | | | | | | | |
| investment income | | | — | | | | (0.31 | ) | | | (0.09 | ) | | | — | |
| Dividends from net realized gains | | | (1.00 | ) | | | — | | | | (1.70 | ) | | | — | |
| Total distributions | | | (1.00 | ) | | | (0.31 | ) | | | (1.79 | ) | | | — | |
| Net asset value, end of period | | $ | 22.12 | | | $ | 21.91 | | | $ | 16.26 | | | $ | 18.39 | |
| | | | | | | | | | | | | | | | | |
| TOTAL RETURN | | | 5.64 | %(2) | | | 36.92 | % | | | (2.14 | )% | | | (6.74 | )%(2) |
| | | | | | | | | | | | | | | | | |
| SUPPLEMENTAL | | | | | | | | | | | | | | | | |
| DATA AND RATIOS: | | | | | | | | | | | | | | | | |
| Net assets, end of period (millions) | | $ | 7.46 | | | $ | 5.83 | | | $ | 0.35 | | | $ | 0.29 | |
| Ratio of expenses to | | | | | | | | | | | | | | | | |
| average net assets | | | 1.39 | %(3) | | | 1.50 | % | | | 1.24 | % | | | 1.19 | %(3) |
| Ratio of net investment income | | | | | | | | | | | | | | | | |
| (loss) to average net assets | | | (0.25 | )%(3) | | | (0.17 | )% | | | 0.52 | % | | | 0.25 | %(3) |
Portfolio turnover rate(4) | | | 25 | %(2) | | | 76 | % | | | 141 | % | | | 74 | %(2) |
(1) | Institutional Class shares commenced operations on June 15, 2015. |
(2) | Not annualized. |
(3) | Annualized. |
(4) | Portfolio turnover is calculated on the basis of the Fund as a whole. |
The accompanying notes are an integral part of these financial statements.
HENNESSYFUNDS.COM
| FINANCIAL HIGHLIGHTS — INSTITUTIONAL CLASS/NOTES TO THE FINANCIAL STATEMENTS |
Financial Statements
Notes to the Financial Statements April 30, 2018 (Unaudited) |
1). ORGANIZATION
The Hennessy Large Cap Financial Fund (the “Fund”) is a series of Hennessy Funds Trust (the “Trust”), which was organized as a Delaware statutory trust on September 17, 1992. The Fund is an open-end management investment company registered under the Investment Company Act of 1940, as amended. The Fund did not have Institutional Class shares until June 15, 2015. The investment objective of the Fund is capital appreciation. The Fund is a non-diversified fund.
The Fund offers Investor Class and Institutional Class shares. Each class of shares differs principally in its respective 12b-1 distribution and service, shareholder servicing, and sub-transfer agent expenses. There are no sales charges. Each class has identical rights to earnings, assets, and voting privileges, except for class-specific expenses and exclusive rights to vote on matters affecting only an individual class.
As an investment company, the Fund follows the investment company accounting and reporting guidance of the Financial Accounting Standards Board (“FASB”) Accounting Standard Codification Topic 946 “Financial Services—Investment Companies.”
2). SIGNIFICANT ACCOUNTING POLICIES
The following is a summary of significant accounting policies consistently followed by the Fund in the preparation of the financial statements. These policies conform to U.S. generally accepted accounting principles (“GAAP”).
| a). | Investment Valuation – All investments in securities are recorded at their estimated fair value, as described in Note 3. |
| | |
| b). | Federal Income Taxes – No provision for federal income taxes or excise taxes has been made because the Fund has elected to be taxed as a “regulated investment company” and intends to distribute substantially all of its taxable income to its shareholders and otherwise comply with the provisions of the Internal Revenue Code of 1986, as amended, applicable to regulated investment companies. Net investment income/loss and realized gains/losses for federal income tax purposes may differ from those reported in the financial statements because of temporary book and tax basis differences. Temporary differences are primarily the result of the treatment of wash sales for tax reporting purposes. The Fund recognizes interest and penalties related to income tax benefits, if any, in the Statement of Operations as an income tax expense. Distributions from net realized gains for book purposes may include short-term capital gains, which are included as ordinary income to shareholders for tax purposes. The Fund may utilize equalization accounting for tax purposes and designate earnings and profits, including net realized gains distributed to shareholders on redemption of shares, as part of the dividends paid deduction for income tax purposes. |
| | |
| c). | Accounting for Uncertainty in Income Taxes – The Fund has accounting policies regarding recognition and measurement of tax positions taken or expected to be taken on a tax return. The tax returns of the Fund for the prior three fiscal years are open for examination. The Fund has reviewed all open tax years in major jurisdictions and concluded that there is no impact on the Fund’s net assets and no tax liability resulting from unrecognized tax benefits relating to uncertain income tax |
| HENNESSY FUNDS | 1-800-966-4354 | |
| | positions taken or expected to be taken on a tax return. The Fund’s major tax jurisdictions are U.S. federal and Delaware. |
| | |
| d). | Income and Expenses – Dividend income is recognized on the ex-dividend date or as soon as information is available to the Fund. Interest income, which includes the amortization of premium and accretion of discount, is recognized on an accrual basis. The Fund is charged for those expenses that are directly attributable to the portfolio, such as advisory, administration, and certain shareholder service fees. Income, expenses (other than expenses attributable to a specific class), and realized and unrealized gains/losses on investments are allocated to each class of shares based on such class’s net assets. |
| | |
| e). | Distributions to Shareholders – Dividends from net investment income for the Fund, if any, are declared and paid annually, usually in December. Distributions of net realized capital gains, if any, are declared and paid annually, usually in December. |
| | |
| f). | Security Transactions – Investment and shareholder transactions are recorded on the trade date. The Fund determines the realized gain/loss from an investment transaction by comparing the original cost of the security lot sold with the net sale proceeds. Discounts and premiums on securities purchased are accreted or amortized, respectively, over the life of each such security. |
| | |
| g). | Use of Estimates – The preparation of financial statements in conformity with GAAP requires management to make estimates and assumptions that affect the reported amounts of assets and liabilities and disclosure of contingent assets and liabilities at the date of the financial statements and the reported change in net assets during the reporting period. Actual results could differ from those estimates. |
| | |
| h). | Share Valuation – The net asset value (“NAV”) per share of the Fund is calculated by dividing (i) the total value of the securities held by the Fund, plus cash and other assets, minus all liabilities (including estimated accrued expenses) by (ii) the total number of shares outstanding for the Fund, rounded to the nearest cent. The Fund’s shares will not be priced on days the New York Stock Exchange is closed for trading. The offering and redemption price per share for the Fund is equal to the Fund’s NAV per share. |
3). SECURITIES VALUATION
The Fund follows fair valuation accounting standards that establish an authoritative definition of fair value and set out a hierarchy for measuring fair value. These standards require additional disclosures about the various inputs and valuation techniques used to develop the measurements of fair value and a discussion of changes in valuation techniques and related inputs during the period. These inputs are summarized in the three broad levels listed below:
| | Level 1 – | Unadjusted, quoted prices in active markets for identical instruments that the Fund has the ability to access at the date of measurement. |
| | | |
| | Level 2 – | Other significant observable inputs (including, but not limited to, quoted prices in active markets for similar instruments, quoted prices in markets that are not active for identical or similar instruments, and model-derived valuations in which all significant inputs and significant value drivers are observable in active markets (such as interest rates, prepayment speeds, credit risk curves, default rates, and similar data)). |
| | | |
| | Level 3 – | Significant unobservable inputs (including the Fund’s own assumptions about what market participants would use to price the asset or liability based on the best available information) when observable inputs are unavailable. |
HENNESSYFUNDS.COM
| NOTES TO THE FINANCIAL STATEMENTS |
Following is a description of the valuation techniques applied to the Fund’s major categories of assets and liabilities measured at fair value on a recurring basis.
| | Equity Securities – Equity securities, including common stocks, preferred stocks, foreign-issued common stocks, exchange-traded funds, closed-end mutual funds, partnerships, rights, and real estate investment trusts, that are traded on a securities exchange for which a last-quoted sales price is readily available will generally be valued at the last sales price as reported by the primary exchange on which the securities are listed. Securities listed on The NASDAQ Stock Market (“NASDAQ”) will generally be valued at the NASDAQ Official Closing Price, which may differ from the last sales price reported. Securities traded on a securities exchange for which a last-quoted sales price is not readily available will generally be valued at the mean between the bid and ask prices. To the extent these securities are actively traded and valuation adjustments are not applied, they are classified in Level 1 of the fair value hierarchy. Securities traded on foreign exchanges generally are not valued at the same time the Fund calculates its NAV because most foreign markets close well before such time. The earlier close of most foreign markets gives rise to the possibility that significant events, including broad market moves, may have occurred in the interim. In certain circumstances, it may be determined that a security needs to be fair valued because it appears that the value of the security might have been materially affected by events occurring after the close of the market in which the security is principally traded, but before the time the Fund calculates its NAV, such as by a development that affects an entire market or region (e.g., a weather-related event) or a potentially global development (e.g., a terrorist attack that may be expected to have an effect on investor expectations worldwide). |
| | |
| | Registered Investment Companies – Investments in registered investment companies (e.g., mutual funds) are generally priced at the ending NAV provided by the applicable registered investment company’s service agent and will be classified in Level 1 of the fair value hierarchy. |
| | |
| | Debt Securities – Debt securities, including corporate bonds, asset-backed securities, mortgage-backed securities, municipal bonds, U.S. Treasuries, and U.S. government agency issues, are generally valued at market on the basis of valuations furnished by an independent pricing service that utilizes both dealer-supplied valuations and formula-based techniques. The pricing service may consider recently executed transactions in securities of the issuer or comparable issuers, market price quotations (where observable), bond spreads, and fundamental data relating to the issuer. In addition, the model may incorporate observable market data, such as reported sales of similar securities, broker quotes, yields, bids, offers, and reference data. Certain securities are valued primarily using dealer quotations. These securities are generally classified in Level 2 of the fair value hierarchy. |
| | |
| | Short-Term Securities – Short-term equity investments, including money market funds, are valued in the manner specified above. Short-term debt investments with an original term to maturity of 60 days or less are valued at amortized cost, which approximates fair market value. If the original term to maturity of a short-term debt investment exceeded 60 days, then the values as of the 61st day prior to maturity are amortized. Amortized cost is not used if its use would be inappropriate due to credit or other impairments of the issuer, in which case the security’s fair value would be determined, as described below. Short-term securities are generally classified in Level 1 or Level 2 of the fair market hierarchy depending on the inputs used and market activity levels for specific securities. |
| HENNESSY FUNDS | 1-800-966-4354 | |
The Board of Trustees of the Fund (the “Board”) has adopted fair value pricing procedures that are followed when a price for a security is not readily available or if a significant event has occurred that indicates the closing price of a security no longer represents the true value of that security. Fair value pricing determinations are made in good faith in accordance with these procedures. There are numerous criteria that will be given consideration in determining a fair value of a security, such as the trading volume of a security and markets, the values of other similar securities, and news events with direct bearing on a security or markets. Fair value pricing results in an estimated price for a security that reflects the amount the Fund might reasonably expect to receive in a current sale. Depending on the relative significance of the valuation inputs, these securities may be classified in either Level 2 or Level 3 of the fair value hierarchy.
The fair valuation of foreign securities may be determined with the assistance of a pricing service using correlations between the movement of prices of such securities and indices of domestic securities and other appropriate indicators, such as closing market prices of relevant American Depositary Receipts or futures contracts. The effect of using fair value pricing is that the Fund’s NAV will reflect the affected portfolio securities’ values as determined by the Board or its designee instead of being determined by the market. Using a fair value pricing methodology to price a foreign security may result in a value that is different from such foreign security’s most recent closing price and from the value used by other investment companies to calculate their NAVs. Such securities are generally classified in Level 2 of the fair valuation hierarchy. Because the Fund may invest in foreign securities, the value of the Fund’s portfolio securities may change on days when you will not be able to purchase or redeem your shares.
The Board has delegated day-to-day valuation matters to a Valuation Committee comprised of one or more representatives from Hennessy Advisors, Inc., the Fund’s investment advisor (the “Advisor”). The function of the Valuation Committee is to value securities where current and reliable market quotations are not readily available. All actions taken by the Valuation Committee are reviewed by the Board.
The Fund has performed an analysis of all existing investments to determine the significance and character of all inputs to their fair value determinations. Various inputs are used to determine the value of the Fund’s investments. The inputs or methodology used for valuing securities are not necessarily an indication of the risk associated with investing in those securities. Details related to the fair valuation hierarchy of the Fund’s securities as of April 30, 2018, are included in the Schedule of Investments.
4). INVESTMENT TRANSACTIONS
Purchases and sales of investment securities (excluding government and short-term investments) for the Fund during the six months ended April 30, 2018, were $27,606,234 and $9,613,562, respectively.
There were no purchases or sales/maturities of long-term U.S. government securities for the Fund during the six months ended April 30, 2018.
The Fund is permitted to purchase or sell securities from or to another fund in the Hennessy Funds family of funds (the “Hennessy Funds”) under specified conditions outlined in procedures adopted by the Board. The procedures have been designed to ensure that any purchase or sale of securities by the Fund from or to another Hennessy Fund complies with Rule 17a-7 of the Investment Company Act of 1940, as amended. During the six months ended April 30, 2018, the Fund did not engage in purchases or sales of securities pursuant to Rule 17a-7 of the Investment Company Act of 1940, as amended.
HENNESSYFUNDS.COM
| NOTES TO THE FINANCIAL STATEMENTS |
5). INVESTMENT MANAGEMENT FEE AND OTHER TRANSACTIONS WITH AFFILIATES
The Advisor provides the Fund with investment management services under an Investment Advisory Agreement. The Advisor furnishes all investment advice, office space, and facilities, as well as most of the personnel needed by the Fund. As compensation for its services, the Advisor is entitled to a monthly fee from the Fund. The fee is based upon the average daily net assets of the Fund at an annual rate of 0.90%. The net investment advisory fees expensed by the Fund during the six months ended April 30, 2018, are included in the Statement of Operations.
The Board has approved a Shareholder Servicing Agreement for Investor Class shares of the Fund, which was instituted to compensate the Advisor for the non-investment management services it provides to the Fund. The Shareholder Servicing Agreement provides for a monthly fee paid to the Advisor at an annual rate of 0.10% of the average daily net assets of the Fund attributable to Investor Class shares. The shareholder service fees expensed by the Fund during the six months ended April 30, 2018, are included in the Statement of Operations.
The Fund has adopted a plan pursuant to Rule 12b-1 under the Investment Company Act of 1940, as amended, that authorizes payments in connection with the distribution of the Fund’s shares at an annual rate of up to 0.25% of the Fund’s average daily net assets attributable to Investor Class shares. Even though the authorized rate is up to 0.25%, the Fund is currently only using up to 0.15% of its average daily net assets attributable to Investor Class shares for such purpose. Amounts paid under the plan may be spent on any activities or expenses primarily intended to result in the sale of shares, including, but not limited to, advertising, shareholder account servicing, the printing and mailing of prospectuses to other than current shareholders, the printing and mailing of sales literature, and compensation for sales and marketing activities or to financial institutions and others, such as dealers and distributors. The distribution fees expensed by the Fund during the six months ended April 30, 2018, are included in the Statement of Operations.
The Fund has entered into agreements with various brokers, dealers, and financial intermediaries in connection with the sale of shares of the Fund. The agreements provide for periodic payments by the Fund to the brokers, dealers, and financial intermediaries for providing certain shareholder maintenance services (sub-transfer agent expenses). These shareholder services include the pre-processing and quality control of new accounts, shareholder correspondence, answering customer inquiries regarding account status, and facilitating shareholder telephone transactions. The sub-transfer agent fees expensed by the Fund during the six months ended April 30, 2018, are included in the Statement of Operations.
U.S. Bancorp Fund Services, LLC (“USBFS”) provides the Fund with administrative, fund accounting, and transfer agent services. As administrator, USBFS is responsible for activities such as (i) preparing various federal and state regulatory filings, reports, and returns for the Fund, (ii) preparing reports and materials to be supplied to the Board, (iii) monitoring the activities of the Fund’s custodian, transfer agent, and accountants, and (iv) coordinating the preparation and payment of the Fund’s expenses and reviewing the Fund’s expense accruals. U.S. Bank N.A., an affiliate of USBFS, serves as the Fund’s custodian. The servicing agreements between the Trust and USBFS and U.S. Bank N.A. contain a fee schedule that is inclusive of administrative, fund accounting, custody, and transfer agent fees. The administrative, fund accounting, custody, and transfer agent fees expensed by the Fund during the six months ended April 30, 2018, are included in the Statement of Operations.
| HENNESSY FUNDS | 1-800-966-4354 | |
Quasar Distributors, LLC acts as the Fund’s principal underwriter in a continuous public offering of the Fund’s shares. Quasar Distributors, LLC is an affiliate of USBFS and U.S. Bank N.A.
The officers of the Fund are affiliated with the Advisor. Such officers, with the exception of the Chief Compliance Officer and the Senior Compliance Officer, receive no compensation from the Fund for serving in their respective roles. The Fund, along with the other Hennessy Funds, makes reimbursement payments, on an equal basis, to the Advisor for a portion of the salary and benefits associated with the office of the Chief Compliance Officer and for all of the salary and benefits associated with the office of the Senior Compliance Officer. The compliance fees expensed by the Fund during the six months ended April 30, 2018, are included in the Statement of Operations.
6). GUARANTEES AND INDEMNIFICATIONS
Under the Hennessy Funds’ organizational documents, their officers and trustees are indemnified by the Hennessy Funds against certain liabilities arising out of the performance of their duties to the Hennessy Funds. Additionally, in the normal course of business, the Hennessy Funds enter into contracts with service providers that contain general indemnification clauses. The Fund’s maximum exposure under these arrangements is unknown as this would involve future claims that may be made against the Fund that have not yet occurred. Currently, the Fund expects the risk of loss to be remote.
7). LINE OF CREDIT
The Fund has an uncommitted line of credit with the other Hennessy Funds in the amount of the lesser of (i) $100,000,000 or (ii) 33.33% of each Hennessy Fund’s net assets, or 30% for the Hennessy Gas Utility Fund and 10% for the Hennessy Balanced Fund, intended to provide short-term financing, if necessary, subject to certain restrictions, in connection with shareholder redemptions. The credit facility is with the Hennessy Funds’ custodian bank, U.S. Bank N.A. Borrowings under this arrangement bear interest at the bank’s prime rate and are secured by all of the Fund’s assets (as to its own borrowings only). During the six months ended April 30, 2018, the Fund did not have any borrowings outstanding under the line of credit.
8). FEDERAL TAX INFORMATION
As of October 31, 2017, the Fund’s most recent fiscal year end, the components of accumulated earnings (losses) for income tax purposes were as follows:
| | | | Investments | |
| | Cost of investments for tax purposes | | $ | 25,381,152 | |
| | Gross tax unrealized appreciation | | $ | 7,376,803 | |
| | Gross tax unrealized depreciation | | | (597,152 | ) |
| | Net tax unrealized appreciation | | $ | 6,779,651 | |
| | Undistributed ordinary income | | $ | — | |
| | Undistributed long-term capital gains | | | 1,515,486 | |
| | Total distributable earnings | | $ | 1,515,486 | |
| | Other accumulated loss | | $ | (114,001 | ) |
| | Total accumulated gain | | $ | 8,181,136 | |
The difference between book-basis unrealized appreciation/depreciation (as shown in the Statement of Assets and Liabilities) and tax-basis unrealized appreciation/depreciation (as shown above) is attributable primarily to wash sales.
As of October 31, 2017, the Fund’s most recent fiscal year end, the Fund had no tax basis capital losses to offset future capital gains.
HENNESSYFUNDS.COM
| NOTES TO THE FINANCIAL STATEMENTS |
During fiscal year 2017, the Fund’s most recent fiscal year, the capital losses utilized for the Fund were $1,792,283.
As of October 31, 2017, the Fund’s most recent fiscal year end, the Fund deferred, on a tax basis, a late-year ordinary loss of $114,001. Late-year ordinary losses are net ordinary losses incurred after December 31, 2016, but within the taxable year, that are deemed to arise on the first day of the Fund’s next taxable year.
During fiscal year 2018 (year to date) and fiscal year 2017, the tax character of distributions paid by the Fund was as follows:
| | | Six Months Ended | | | Year Ended | |
| | | April 30, 2018 | | | October 31, 2017 | |
Ordinary income(1) | | $ | — | | | $ | 187,217 | |
| Long-term capital gain | | | 1,515,488 | | | | 1,339 | |
| | | $ | 1,515,488 | | | $ | 188,556 | |
(1) Ordinary income includes short-term gain/loss.
9). EVENTS SUBSEQUENT TO PERIOD END
Management has evaluated the Fund’s related events and transactions that occurred subsequent to April 30, 2018, through the date of issuance of the Fund’s financial statements. Management has determined that there were no subsequent events requiring recognition or disclosure in the financial statements.
| HENNESSY FUNDS | 1-800-966-4354 | |
Expense Example (Unaudited)
April 30, 2018
As a shareholder of the Fund, you incur two types of costs: (1) transaction costs, including sales charges (loads) on purchase payments, reinvested dividends, or other distributions; redemption fees; and exchange fees; and (2) ongoing costs, including management fees; service fees; and other Fund expenses. This Example is intended to help you understand your ongoing costs (in dollars) of investing in the Fund and to compare these costs with the ongoing costs of investing in other mutual funds. The Example is based on an investment of $1,000 invested at the beginning of the period and held for the entire period from November 1, 2017, through April 30, 2018.
Actual Expenses
The first line of the table below under the “Investor Class” and “Institutional Class” headings provides information about actual account values and actual expenses. Although the Fund charges no sales loads or transaction fees, you will be assessed fees for outgoing wire transfers, returned checks and stop payment orders at prevailing rates charged by U.S. Bancorp Fund Services, LLC, the Fund’s transfer agent. If you request that a redemption be made by wire transfer, currently a $15 fee is charged by the Fund’s transfer agent. IRA accounts will be charged a $15 annual maintenance fee. The example below includes, but is not limited to, management fees, shareholder servicing fees, fund accounting, custody, and transfer agent fees. However, the example below does not include portfolio trading commissions and related expenses, and other extraordinary expenses as determined under generally accepted accounting principles. You may use the information in this line, together with the amount you invested, to estimate the expenses that you paid over the period. Simply divide your account value by $1,000 (for example, an $8,600 account value divided by $1,000 = 8.6), then multiply the result by the number in the first line of the table under the “Investor Class” or “Institutional Class” headings in the column entitled “Expenses Paid During Period” to estimate the expenses you paid on your account during this period.
Hypothetical Example for Comparison Purposes
The second line of the table below under the “Investor Class” and “Institutional Class” headings provides information about hypothetical account values and hypothetical expenses based on the Fund’s actual expense ratios and an assumed rate of return of 5% per year before expenses, which is not the Fund’s actual return. The hypothetical account values and expenses may not be used to estimate the actual ending account balance or expenses you paid for the period. You may use this information to compare the ongoing costs of investing in the Fund and other funds. To do so, compare this 5% hypothetical example with the 5% hypothetical examples that appear in the shareholder reports of the other funds. Please note that the expenses shown in the table are meant to highlight your ongoing costs only and do not reflect any transactional costs, such as sales charges (loads), or exchange fees. Therefore, the second line of the table under the “Investor Class” and “Institutional Class” headings is useful in comparing ongoing costs only, and will not help you determine the relative total costs of owning different funds. In addition, if these transactional costs were included, your costs would have been higher.
HENNESSYFUNDS.COM
| | | | Expenses Paid |
| | Beginning | Ending | During Period(1) |
| | Account Value | Account Value | November 1, 2017 – |
| | November 1, 2017 | April 30, 2018 | April 30, 2018 |
| Investor Class | | | |
| Actual | $1,000.00 | $1,054.80 | $8.71 |
| Hypothetical (5% return before expenses) | $1,000.00 | $1,016.31 | $8.55 |
| | | | |
| Institutional Class | | | |
| Actual | $1,000.00 | $1,056.40 | $7.09 |
| Hypothetical (5% return before expenses) | $1,000.00 | $1,017.90 | $6.95 |
(1) | Expenses are equal to the Fund’s expense ratio of 1.71% for Investor Class shares or 1.39% for Institutional Class shares, as applicable, multiplied by the average account value over the period, multiplied by 181/365 days (to reflect one-half year period). |
| HENNESSY FUNDS | 1-800-966-4354 | |
How to Obtain a Copy of the Fund’s
Proxy Voting Policy and Proxy Voting Records
A description of the policies and procedures the Fund uses to determine how to vote proxies relating to portfolio securities is available without charge (1) by calling 1-800-966-4354, (2) on the Hennessy Funds’ website at hennessyfunds.com/proxy-voting/voting-policy, or (3) on the U.S. Securities and Exchange Commission’s (the “SEC”) website at www.sec.gov. The Fund’s proxy voting record is available without charge on both the Hennessy Funds’ website at hennessyfunds.com/proxy-voting/voting-record and the SEC’s website at www.sec.gov no later than August 31 for the prior 12 months ending June 30.
Quarterly Filings on Form N-Q
The Fund files a complete schedule of portfolio holdings with the SEC for the first and third quarters of each fiscal year on Form N-Q. The Fund’s Forms N-Q are available on the SEC’s website at www.sec.gov. The Fund’s Forms N-Q may be reviewed and copied at the SEC’s Public Reference Room in Washington, DC and information on the operation of the Public Reference Room may be obtained by calling 1-800-SEC-0330. Information included in the Fund’s Forms N-Q will also be available upon request by calling 1-800-966-4354.
Federal Tax Distribution Information
(Unaudited)
For fiscal year 2017, certain dividends paid by the Fund may be subject to a maximum tax rate of 23.8%, as provided for by the Jobs and Growth Tax Relief Reconciliation Act of 2003. The percentage of dividends declared from ordinary income designated as qualified dividend income was 100.00%.
For corporate shareholders, the percent of ordinary income distributions that qualified for the corporate dividends received deduction for fiscal year 2017, was 100.00%.
The percentage of taxable ordinary income distributions that were designated as short-term capital gain distributions under Section 871(k)(2)(C) of the Internal Revenue Code of 1986, as amended, for the Fund was 0.00%.
Important Notice Regarding Delivery of
Shareholder Documents
To help keep the Fund’s costs as low as possible, we generally deliver a single copy of shareholder reports, proxy statements, and prospectuses to shareholders who share an address and have the same last name. This process does not apply to account statements. You may request an individual copy of a shareholder document at any time. If you would like to receive separate mailings of shareholder documents, please call U.S. Bancorp Fund Services, LLC at 1-800-261-6950 or 1-414-765-4124, and individual delivery will begin within 30 days of your request. If your account is held through a financial institution or other intermediary, please contact such intermediary directly to request individual delivery.
HENNESSYFUNDS.COM
| PROXY VOTING — BOARD APPROVAL OF INVESTMENT ADVISORY AGREEMENT |
Board Approval of Investment Advisory
Agreement
At its meeting on March 7, 2018, the Board of Trustees of the Fund (the “Board,” and the members thereof, the “Trustees”) unanimously approved the continuation of the investment advisory agreement of the Fund with Hennessy Advisors, Inc. (the “Advisor”). As part of the process of approving the continuation of the advisory agreement, the Trustees reviewed their fiduciary duties with respect to approving the advisory agreement and the relevant factors for them to consider. In addition, the Trustees who are not deemed “interested persons” (as defined by the Investment Company Act of 1940, as amended) of the Fund (the “Independent Trustees”) met in executive session to discuss the approval of the advisory agreement.
In advance of the meeting, the Advisor sent detailed information to the Trustees to assist them in their evaluation of the advisory agreement. This information included, but was not limited to, the following:
| | (1) | A memorandum from outside legal counsel that described the fiduciary duties of the Board with respect to approving the continuation of the advisory agreement and the relevant factors for consideration; |
| | | |
| | (2) | A memorandum from the Advisor that listed the factors relevant to the Board’s approval of the continuation of the advisory agreement and also referenced the documents that had been provided to help the Board assess each such factor; |
| | | |
| | (3) | An inventory of the range of services provided by the Advisor to the Fund; |
| | | |
| | (4) | A written discussion of economies of scale; |
| | | |
| | (5) | The advisory agreement; |
| | | |
| | (6) | A recent Fund fact sheet, which included, among other things, performance information over various periods; |
| | | |
| | (7) | A peer expense comparison of both the net expense ratio and investment advisory fee of the Fund; |
| | | |
| | (8) | The Advisor’s most recent Form 10-K and Form 10-Q, which includes information about the Advisor’s profitability; |
| | | |
| | (9) | Information about brokerage commissions; |
| | | |
| | (10) | Information about the Fund’s compliance program; and |
| | | |
| | (11) | The Advisor’s current Form ADV Part I. |
All of the factors discussed were considered as a whole by the Trustees, and also by the Independent Trustees meeting in executive session. The factors were viewed in their totality by the Trustees, with no single factor being the principal or determinative factor in the Trustees’ determination of whether to approve the continuation of the advisory agreement. The Trustees recognized that the management and fee arrangements for the Fund are the result of years of review and discussion between the Independent Trustees and the Advisor, that certain aspects of such arrangements may receive greater scrutiny in some years than in others, and that the Trustees’ conclusions may be based, in part, on their consideration of these same arrangements and information received during the course of the year and in prior years.
| HENNESSY FUNDS | 1-800-966-4354 | |
Prior to approving the continuation of the advisory agreement, the Trustees, including the Independent Trustees in executive session, considered, among other items:
| | (1) | The nature and quality of the advisory services provided by the Advisor; |
| | | |
| | (2) | A comparison of the fees and expenses of the Fund to other similar funds; |
| | | |
| | (3) | Whether economies of scale are recognized by the Fund; |
| | | |
| | (4) | The costs and profitability of the Fund to the Advisor; |
| | | |
| | (5) | The performance of the Fund; and |
| | | |
| | (6) | Any benefits to the Advisor from serving as an investment advisor to the Fund (other than the advisory fee). |
The material considerations and determinations of the Trustees, including the Independent Trustees, were as follows:
| | (1) | The Trustees considered the services identified below that are provided by the Advisor. Based on this review, the Trustees concluded that the Advisor provides high-quality services to the Fund, and they noted that their overall confidence in the Advisor is high. The Trustees also concluded that they were satisfied with the nature, extent, and quality of the advisory services provided to the Fund by the Advisor, and that the nature and extent of the services provided by the Advisor are appropriate to assure that the Fund’s operations are conducted in compliance with applicable laws, rules, and regulations. |
| | | (a) | The Advisor acts as the portfolio manager for the Fund. In this capacity, the Advisor does the following: |
| | | | (i) | manages the composition of the Fund’s portfolio, including the purchase, retention, and disposition of portfolio securities in accordance with the Fund’s investment objectives, policies, and restrictions; |
| | | | | |
| | | | (ii) | ensures compliance with “best execution” for the Fund’s portfolio; |
| | | | | |
| | | | (iii) | manages the use of soft dollars for the Fund; and |
| | | | | |
| | | | (iv) | manages proxy voting for the Fund. |
| | | (b) | The Advisor performs a daily reconciliation of portfolio positions and cash for the Fund. |
| | | | |
| | | (c) | The Advisor monitors the Fund’s compliance with its investment objectives and restrictions. |
| | | | |
| | | (d) | The Advisor monitors compliance with federal securities laws and performs activities such as maintaining a compliance program, conducting ongoing reviews of the compliance programs of the Fund’s service providers, conducting on-site visits to the Fund’s service providers, monitoring incidents of abusive trading practices, reviewing Fund expense accruals, payments, and fixed expense ratios, evaluating insurance providers for fidelity bond coverage and D&O/E&O insurance coverage, conducting employee compliance training, reviewing reports provided by service providers, maintaining books and records, and preparing an annual compliance report for the Board. |
| | | | |
| | | (e) | The Advisor oversees service providers that provide accounting, administration, distribution, transfer agency, custodial, sales, marketing, public relations, audit, information technology, and legal services to the Fund. |
HENNESSYFUNDS.COM
| BOARD APPROVAL OF INVESTMENT ADVISORY AGREEMENT |
| | | (f) | The Advisor maintains in-house marketing and distribution departments on behalf of the Fund. |
| | | | |
| | | (g) | The Advisor is actively involved with preparing regulatory filings for the Fund, including writing and annually updating the Fund’s prospectus and related documents. |
| | | | |
| | | (h) | The Advisor prepares a written summary of the Fund’s performance for the most recent 12-month period for each annual report of the Fund. |
| | | | |
| | | (i) | The Advisor oversees distribution of the Fund through third-party broker/dealers and independent financial institutions such as Charles Schwab, Inc., Fidelity, TD Waterhouse, and Pershing. The Advisor participates in “no transaction fee” (“NTF”) programs with these companies on behalf of the Fund, which allow customers to purchase the Fund through third-party distribution channels without paying a transaction fee. The Advisor compensates, in part, a number of these third-party providers of NTF programs out of its own revenues. |
| | | | |
| | | (j) | The Advisor pays the incentive compensation of the Fund’s compliance officers and employs other staff, such as legal, marketing, national accounts, distribution, sales, administrative, and trading oversight personnel, as well as management executives. |
| | | | |
| | | (k) | The Advisor provides a quarterly compliance certification to the Board. |
| | | | |
| | | (l) | The Advisor prepares or reviews Board materials, frequently presents to the Board or leads Board discussions, prepares or reviews meeting minutes, and arranges for Board training and education. |
| | (2) | The Trustees compared the performance of the Fund to benchmark indices over various time periods and also noted that the Trustees review and discuss reports comparing the investment performance of the Fund to various indices at each quarterly Board meeting. Based on all such information, the Trustees believe that the Advisor manages the Fund in a manner that is materially consistent with its stated investment objective and style. The Trustees concluded that the performance of the Fund over various time periods warranted the continuation of the advisory agreement. |
| | | |
| | (3) | The Trustees reviewed the advisory fees and overall expense ratios of the Fund compared to other funds similar in asset size and investment objective to the Fund using data from Morningstar. As part of the discussion with management, the Trustees ensured that they understood and were comfortable with the criteria used to determine the mutual funds included in the Morningstar categories for purposes of the materials considered at the meeting. The Trustees determined that the advisory fee and overall expense ratio of the Fund falls within the range of the advisory fees and overall expense ratios of other comparable funds and concluded that they are reasonable and warranted continuation of the advisory agreement. |
| | | |
| | (4) | The Trustees also considered whether economies of scale were being realized by the Advisor that should be shared with the Fund’s shareholders. The Trustees noted that many of the expenses incurred to manage the Fund are asset-based fees and thus do not result in material economies of scale being realized as the assets of the Fund increase. For example, mutual fund platform fees increase as the Fund’s assets grow. The Trustees also considered the Advisor’s efforts to |
| HENNESSY FUNDS | 1-800-966-4354 | |
| | | contain expenses, the Advisor’s significant marketing efforts to promote the Funds, and the Advisor’s agreement to waive fees or lower its management fees in certain circumstances. The Trustees determined that it did not appear that there were significant economies of scale being realized by the Advisor and concluded that it would continue to monitor economies of scale in the future as circumstances changed. |
| | | |
| | (5) | The Trustees considered the profitability of the Advisor, including the impact of mutual fund platform fees on the Advisor’s profitability, and also considered the resources and revenues that the Advisor has put into managing and distributing the Fund. The Trustees then concluded that the profits of the Advisor are reasonable and not excessive when compared to profitability guidelines set forth in relevant court cases. |
| | | |
| | (6) | The Trustees considered the high level of professionalism and knowledge of the Advisor’s employees, along with a very low level of turnover, and concluded that this was beneficial to the Fund and its shareholders. |
| | | |
| | (7) | The Trustees considered any benefits to the Advisor from serving as an advisor to the Fund (other than the advisory fee). The Trustees noted that the Advisor may derive ancillary benefits from, by way of example, its association with the Fund in the form of proprietary and third-party research products and services received from broker-dealers that execute portfolio trades for the Fund. The Trustees determined that any such products and services have been used for legitimate purposes relating to the Fund by providing assistance in the investment decision-making process. The Trustees concluded that any additional benefits realized by the Advisor from its relationship with the Fund were reasonable. |
After reviewing the materials provided at the meeting and management’s presentation, as well as other information regularly provided at the Board’s quarterly meetings throughout the year regarding the quality of services provided by the Advisor, the performance of the Fund, expense information, regulatory compliance issues, trading information and related matters, and other factors that the Trustees deemed relevant, the Trustees, including the Independent Trustees, approved the continuation of the advisory agreement.
HENNESSYFUNDS.COM
| BOARD APPROVAL OF INVESTMENT ADVISORY AGREEMENT |
(This Page Intentionally Left Blank.)
For information, questions or assistance, please call
The Hennessy Funds
1-800-966-4354 or 1-415-899-1555
INVESTMENT ADVISOR
Hennessy Advisors, Inc.
7250 Redwood Boulevard, Suite 200
Novato, California 94945
ADMINISTRATOR,
TRANSFER AGENT,
DIVIDEND PAYING AGENT &
SHAREHOLDER SERVICING AGENT
U.S. Bancorp Fund Services, LLC
P.O. Box 701
Milwaukee, Wisconsin 53201-0701
CUSTODIAN
U.S. Bank N.A.
Custody Operations
1555 North River Center Drive, Suite 302
Milwaukee, Wisconsin 53212
TRUSTEES
Neil J. Hennessy
Robert T. Doyle
J. Dennis DeSousa
Gerald P. Richardson
COUNSEL
Foley & Lardner LLP
777 East Wisconsin Avenue
Milwaukee, Wisconsin 53202-5306
INDEPENDENT REGISTERED
PUBLIC ACCOUNTING FIRM
Tait, Weller & Baker LLP
1818 Market Street, Suite 2400
Philadelphia, Pennsylvania 19103
DISTRIBUTOR
Quasar Distributors, LLC
777 East Wisconsin Avenue
Milwaukee, Wisconsin 53202
hennessyfunds.com | 1-800-966-4354
This report has been prepared for shareholders and may be distributed to
others only if preceded or accompanied by a current prospectus.
SEMI-ANNUAL REPORT
APRIL 30, 2018
HENNESSY TECHNOLOGY FUND
Investor Class HTECX
Institutional Class HTCIX
hennessyfunds.com | 1-800-966-4354
(This Page Intentionally Left Blank.)
Contents
| Letter to Shareholders | | | 2 |
| Performance Overview | | | 4 |
| Financial Statements | | | |
| Schedule of Investments | | | 5 |
| Statement of Assets and Liabilities | | | 9 |
| Statement of Operations | | | 10 |
| Statements of Changes in Net Assets | | | 11 |
| Financial Highlights | | | 12 |
| Notes to the Financial Statements | | | 16 |
| Expense Example | | | 23 |
| Proxy Voting Policy and Proxy Voting Records | | | 25 |
| Quarterly Schedule of Investments | | | 25 |
| Important Notice Regarding Delivery of Shareholder Documents | | | 25 |
| Board Approval of Investment Advisory Agreement | | | 26 |
| HENNESSY FUNDS | 1-800-966-4354 | |
May 2018
Dear Hennessy Funds Shareholder:
Investors in the United States and abroad experienced the return of volatility in the six months ended April 30, 2018, especially during the second half of the period. Equities rallied sharply during the first half of the period and fell back during the second half, but nevertheless ended the period with solid gains, with the Dow Jones Industrial Average posting a total return of 4.5% and the S&P 500 Index up 3.8%. Over the past year, I have repeatedly shared my belief that the stock market was due for a correction, but that it would bounce back, as it has so many times during the current bull market.
In the closing months of 2017 and into January 2018, U.S. equities rallied in response to the enactment of the Tax Cuts and Jobs Act of 2017, which significantly lowered corporate tax rates. Investors were also encouraged by two quarters of real GDP growth of 3.2% and 2.9%. However, equity prices quickly lost ground in reaction to the imposition of trade tariffs on steel and aluminum, and fears that additional proposed tariffs could provoke a trade war with China. Signals from the Federal Reserve that the pace of interest rate increases would move slightly higher also weighed on investors. During the period, the federal funds rate was raised twice, by a quarter point each time, in December 2017 and March 2018.
The current bull market in U.S. equities is now entering its 10th year, and we remain optimistic about the outlook for stock prices. In our opinion, economic fundamentals look positive. The U.S. economy is growing at a solid pace of 2 – 3% annually, inflation is low, and high employment levels are supporting healthy growth in consumption. Wages are rising, but the rate of increase has remained steady at around 2.6% per year since mid-2016. While it appears that the Federal Reserve will continue to raise the federal funds rate and normalize monetary policy, we believe it will be able to do so gradually, avoiding a severe jolt to either financial markets or the economy. Meanwhile, companies continue to report robust earnings growth, boosted this year by lower tax rates.
We believe U.S. equities remain attractively valued. U.S. long bond yields are hovering near 3%, having risen over the period in response to strong economic activity. Prospective PE multiples, however, have dropped significantly since the end of 2017, the result of a combination of lower taxes, higher operating earnings, and lower stock prices. The Dow Jones Industrial Average and the S&P 500 Index are trading at about 17x forward earnings, down from approximately 20x at the beginning of the calendar year, valuations we believe to be very reasonable.
We are not overly concerned about recent protectionist actions by the U.S. administration. We consider the announcements and ongoing discussions regarding import tariffs and NAFTA to be representative of standard Trump deal-making tactics – make far-reaching demands and then negotiate a reasonable outcome that is beneficial to both sides. We expect continued pro-business policies and regulatory relief to be enacted by our leaders in Washington.
Finally, as noted many times in past letters during this bull market, the euphoria that has historically accompanied a peak in the market continues to be absent. Investors today are worried about many things, including higher interest rates, larger budget deficits, higher import tariffs, and political distractions. But they are definitely not euphoric. In the past, I have likened the current bull market to the 1982-2000 bull market, and I continue
HENNESSYFUNDS.COM
to believe the comparison is a good one. We remain confident that the market will be able to weather the current period of volatility and that the economy, despite higher interest rates and possible trade disruptions, is resilient enough to continue its steady growth into the coming year.
Thank you for your continued confidence and investment in the Hennessy Funds. If you have any questions or would like to speak with us directly, please don’t hesitate to call us at (800) 966-4354.
Best regards,
Neil J. Hennessy
President and Chief Investment Officer
Past performance does not guarantee future results.
Mutual fund investing involves risk. Principal loss is possible.
Opinions expressed are those of Neil Hennessy and are subject to change, are not guaranteed, and should not be considered investment advice.
The Dow Jones Industrial Average and S&P 500 Index are unmanaged indices commonly used to measure the performance of U.S. stocks. One cannot invest directly in an index.
Price to earnings (PE) is calculated by dividing a company’s market price per share by its earnings per share. Earnings growth is not a measure of a fund’s future performance.
| HENNESSY FUNDS | 1-800-966-4354 | |
Performance Overview (Unaudited)
AVERAGE ANNUAL TOTAL RETURN FOR PERIODS ENDED APRIL 30, 2018
| | Six | One | Five | Ten |
| | Months(1) | Year | Years | Years |
| Hennessy Technology Fund – | | | | |
| Investor Class (HTECX) | 8.03% | 19.13% | 11.43% | 6.62% |
| Hennessy Technology Fund – | | | | |
Institutional Class (HTCIX)(2) | 8.12% | 19.40% | 11.76% | 6.86% |
| NASDAQ Composite Index | 5.58% | 18.09% | 17.64% | 12.65% |
| S&P 500 Index | 3.82% | 13.27% | 12.96% | 9.02% |
| Expense ratios: | Gross 4.12%, Net 1.24%(3) (Investor Class); |
| | Gross 3.70%, Net 0.99%(3) (Institutional Class) |
(1) | Periods less than one year are not annualized. |
(2) | The inception date of Institutional Class shares is March 12, 2010. Performance shown prior to the inception of Institutional Class shares reflects the performance of Investor Class shares and includes expenses that are not applicable to, and are higher than, those of Institutional Class shares. |
(3) | The Fund’s investment advisor has contractually agreed to limit expenses until February 28, 2019. |
Performance data quoted represents past performance; past performance does not guarantee future results. The investment return and principal value of an investment will fluctuate so that an investor’s shares, when redeemed, may be worth more or less than their original cost. The performance table does not reflect the deduction of taxes that a shareholder would pay on Fund distributions or the redemption of Fund shares. Current performance of the Fund may be lower or higher than the performance quoted. Performance data current to the most recent month end may be obtained by visiting hennessyfunds.com. Performance for periods prior to October 26, 2012, is that of the FBR Technology Fund.
The NASDAQ Composite Index is a broad-based capitalization-weighted index of all the NASDAQ National Market and Small Cap stocks. The S&P 500 Index is an unmanaged index commonly used to measure the performance of U.S. stocks. One cannot invest directly in an index.
The expense ratios presented are from the most recent prospectus. The expense ratios for the current reporting period are available in the Financial Highlights section of this report.
HENNESSYFUNDS.COM
| PERFORMANCE OVERVIEW/SCHEDULE OF INVESTMENTS |
Financial Statements
Schedule of Investments as of April 30, 2018 (Unaudited) |
HENNESSY TECHNOLOGY FUND
(% of Net Assets)
| TOP TEN HOLDINGS (EXCLUDING CASH/CASH EQUIVALENTS) | % NET ASSETS |
| Cardtronics PLC, Class A | 1.86% |
| F5 Networks, Inc. | 1.80% |
| Amazon.com, Inc. | 1.77% |
| First Data Corp., Class A | 1.77% |
| Celestica, Inc. | 1.76% |
| Cornerstone OnDemand, Inc. | 1.76% |
| Sanmina Corp. | 1.76% |
| Red Hat, Inc. | 1.75% |
| NetApp, Inc. | 1.74% |
| NIC, Inc. | 1.74% |
Note: For presentation purposes, the Fund has grouped some of the industry categories. For purposes of categorizing securities for compliance with section 8(b)(1) of the Investment Company Act of 1940, as amended, the Fund uses more specific industry classifications.
The Global Industry Classification Standard (GICS®) was developed by and is the exclusive property and a service mark of MSCI, Inc. and Standard & Poor Financial Services LLC. It has been licensed for use by the Hennessy Funds.
| HENNESSY FUNDS | 1-800-966-4354 | |
| COMMON STOCKS – 95.33% | | Number | | | | | | % of | |
| | | of Shares | | | Value | | | Net Assets | |
| Consumer Discretionary – 1.77% | | | | | | | | | |
| Amazon.com, Inc. (a) | | | 50 | | | $ | 78,306 | | | | 1.77 | % |
| | | | | | | | | | | | | |
| Information Technology – 93.56% | | | | | | | | | | | | |
| Accenture PLC, Class A (b) | | | 462 | | | | 69,854 | | | | 1.58 | % |
| Alpha & Omega Semiconductor Ltd. (a)(b) | | | 4,541 | | | | 68,842 | | | | 1.56 | % |
| Amkor Technology, Inc. (a) | | | 7,090 | | | | 58,705 | | | | 1.33 | % |
| Apple, Inc. | | | 410 | | | | 67,757 | | | | 1.54 | % |
| Applied Materials, Inc. | | | 1,292 | | | | 64,174 | | | | 1.46 | % |
| Automatic Data Processing, Inc. | | | 603 | | | | 71,202 | | | | 1.61 | % |
| Avnet, Inc. | | | 1,700 | | | | 66,691 | | | | 1.51 | % |
| Booz Allen Hamilton Holding Corp. | | | 1,804 | | | | 71,493 | | | | 1.62 | % |
| Broadridge Financial Solutions, Inc. | | | 636 | | | | 68,186 | | | | 1.55 | % |
| Cardtronics PLC, Class A (a)(b) | | | 3,119 | | | | 81,874 | | | | 1.86 | % |
| CDW Corp. of Delaware | | | 993 | | | | 70,791 | | | | 1.61 | % |
| Celestica, Inc. (a)(b) | | | 6,767 | | | | 77,820 | | | | 1.76 | % |
| ChipMOS TECHNOLOGIES, Inc. – ADR (b) | | | 4,307 | | | | 59,307 | | | | 1.34 | % |
| Convergys Corp. | | | 3,097 | | | | 72,346 | | | | 1.64 | % |
| Cornerstone OnDemand, Inc. (a) | | | 1,762 | | | | 77,757 | | | | 1.76 | % |
| EchoStar Corp., Class A (a) | | | 1,311 | | | | 68,880 | | | | 1.56 | % |
| F5 Networks, Inc. (a) | | | 486 | | | | 79,262 | | | | 1.80 | % |
| First Data Corp., Class A (a) | | | 4,326 | | | | 78,301 | | | | 1.77 | % |
| Fiserv, Inc. (a) | | | 969 | | | | 68,663 | | | | 1.56 | % |
| Fortinet, Inc. (a) | | | 1,304 | | | | 72,189 | | | | 1.64 | % |
| Hewlett Packard Enterprise Co. | | | 3,992 | | | | 68,064 | | | | 1.54 | % |
| Instructure, Inc. (a) | | | 1,688 | | | | 68,448 | | | | 1.55 | % |
| InterDigital, Inc. | | | 940 | | | | 69,983 | | | | 1.59 | % |
| Intuit, Inc. | | | 402 | | | | 74,286 | | | | 1.68 | % |
| Jabil Circuit, Inc. | | | 2,444 | | | | 65,010 | | | | 1.47 | % |
| KLA-Tencor Corp. | | | 649 | | | | 66,029 | | | | 1.50 | % |
| LG Display Co., Ltd. – ADR (a)(b) | | | 5,768 | | | | 62,294 | | | | 1.41 | % |
| Mastercard, Inc., Class A | | | 398 | | | | 70,951 | | | | 1.61 | % |
| Match Group, Inc. (a) | | | 1,599 | | | | 75,345 | | | | 1.71 | % |
| MercadoLibre, Inc. | | | 197 | | | | 66,903 | | | | 1.52 | % |
| Mimecast Ltd. (a)(b) | | | 1,963 | | | | 74,692 | | | | 1.69 | % |
| NCR Corp. (a) | | | 2,219 | | | | 68,279 | | | | 1.55 | % |
The accompanying notes are an integral part of these financial statements.
HENNESSYFUNDS.COM
| COMMON STOCKS | | Number | | | | | | % of | |
| | | of Shares | | | Value | | | Net Assets | |
| Information Technology (Continued) | | | | | | | | | |
| NetApp, Inc. | | | 1,155 | | | $ | 76,900 | | | | 1.74 | % |
| NIC, Inc. | | | 5,178 | | | | 76,893 | | | | 1.74 | % |
| ON Semiconductor Corp. (a) | | | 2,925 | | | | 64,584 | | | | 1.46 | % |
| Palo Alto Networks, Inc. (a) | | | 379 | | | | 72,961 | | | | 1.65 | % |
| Paychex, Inc. | | | 1,133 | | | | 68,626 | | | | 1.56 | % |
| Paycom Software, Inc. (a) | | | 658 | | | | 75,150 | | | | 1.70 | % |
| Paylocity Holding Corp. (a) | | | 1,366 | | | | 74,625 | | | | 1.69 | % |
| Pegasystems, Inc. | | | 1,144 | | | | 69,841 | | | | 1.58 | % |
| Proofpoint, Inc. (a) | | | 608 | | | | 71,708 | | | | 1.63 | % |
| Qualys, Inc. (a) | | | 951 | | | | 73,179 | | | | 1.66 | % |
| Red Hat, Inc. (a) | | | 472 | | | | 76,964 | | | | 1.75 | % |
| Sabre Corp. | | | 3,289 | | | | 67,885 | | | | 1.54 | % |
| Sanmina Corp. (a) | | | 2,629 | | | | 77,555 | | | | 1.76 | % |
| Science Applications International Corp. | | | 853 | | | | 73,179 | | | | 1.66 | % |
| Seagate Technology PLC (b) | | | 1,183 | | | | 68,484 | | | | 1.55 | % |
| ServiceNow, Inc. (a) | | | 423 | | | | 70,277 | | | | 1.59 | % |
| Shutterstock, Inc. (a) | | | 1,430 | | | | 60,260 | | | | 1.37 | % |
| SMART Global Holdings, Inc. (a)(b) | | | 1,344 | | | | 52,618 | | | | 1.19 | % |
| SolarEdge Technologies, Inc. (a) | | | 1,263 | | | | 66,497 | | | | 1.51 | % |
| Sykes Enterprises, Inc. (a) | | | 2,425 | | | | 69,743 | | | | 1.58 | % |
| Tech Data Corp. (a) | | | 853 | | | | 65,041 | | | | 1.47 | % |
| Texas Instruments, Inc. | | | 679 | | | | 68,871 | | | | 1.56 | % |
| The Ultimate Software Group, Inc. (a) | | | 291 | | | | 69,817 | | | | 1.58 | % |
| Tower Semiconductor Ltd. (a)(b) | | | 2,555 | | | | 66,098 | | | | 1.50 | % |
| Ultra Clean Holdings, Inc. (a) | | | 3,764 | | | | 65,908 | | | | 1.49 | % |
| Vishay Intertechnology, Inc. | | | 3,786 | | | | 66,823 | | | | 1.52 | % |
| Wix.com Ltd. (a)(b) | | | 883 | | | | 72,627 | | | | 1.65 | % |
| | | | | | | | 4,127,492 | | | | 93.56 | % |
| Total Common Stocks | | | | | | | | | | | | |
| (Cost $3,847,428) | | | | | | | 4,205,798 | | | | 95.33 | % |
The accompanying notes are an integral part of these financial statements.
| HENNESSY FUNDS | 1-800-966-4354 | |
| SHORT-TERM INVESTMENTS – 4.71% | | Number | | | | | | % of | |
| | | of Shares | | | Value | | | Net Assets | |
| Money Market Funds – 4.71% | | | | | | | | | |
| Fidelity Government Portfolio, Institutional Class, 1.58% (c) | | | 207,631 | | | $ | 207,631 | | | | 4.71 | % |
| | | | | | | | | | | | | |
| Total Short-Term Investments | | | | | | | | | | | | |
| (Cost $207,631) | | | | | | | 207,631 | | | | 4.71 | % |
| | | | | | | | | | | | | |
| Total Investments | | | | | | | | | | | | |
| (Cost $4,055,059) – 100.04% | | | | | | | 4,413,429 | | | | 100.04 | % |
| Liabilities in Excess of Other Assets – (0.04)% | | | | | | | (1,817 | ) | | | (0.04 | )% |
| | | | | | | | | | | | | |
TOTAL NET ASSETS – 100.00% | | | | | | $ | 4,411,612 | | | | 100.00 | % |
Percentages are stated as a percent of net assets.
ADR – American Depositary Receipt
PLC – Public Limited Company
| (a) | Non-income producing security. |
| (b) | U.S. traded security of a foreign corporation. |
| (c) | The rate listed is the fund’s seven-day yield as of April 30, 2018. |
Summary of Fair Value Exposure at April 30, 2018
The following is a summary of the inputs used to value the Fund’s net assets as of April 30, 2018 (See Note 3 in the accompanying notes to the financial statements):
| Common Stocks | | Level 1 | | | Level 2 | | | Level 3 | | | Total | |
| Consumer Discretionary | | $ | 78,306 | | | $ | — | | | $ | — | | | $ | 78,306 | |
| Information Technology | | | 4,127,492 | | | | — | | | | — | | | | 4,127,492 | |
| Total Common Stocks | | $ | 4,205,798 | | | $ | — | | | $ | — | | | $ | 4,205,798 | |
| Short-Term Investments | | | | | | | | | | | | | | | | |
| Money Market Funds | | $ | 207,631 | | | $ | — | | | $ | — | | | $ | 207,631 | |
| Total Short-Term Investments | | $ | 207,631 | | | $ | — | | | $ | — | | | $ | 207,631 | |
| Total Investments | | $ | 4,413,429 | | | $ | — | | | $ | — | | | $ | 4,413,429 | |
Transfers between levels are recognized at the end of the reporting period. During the six-month period ended April 30, 2018, the Fund recognized no transfers between levels.
The accompanying notes are an integral part of these financial statements.
HENNESSYFUNDS.COM
| SCHEDULE OF INVESTMENTS/STATEMENT OF ASSETS AND LIABILITIES |
Financial Statements
Statement of Assets and Liabilities as of April 30, 2018 (Unaudited) |
| ASSETS: | | | |
| Investments in securities, at value (cost $4,055,059) | | $ | 4,413,429 | |
| Dividends and interest receivable | | | 1,484 | |
| Prepaid expenses and other assets | | | 24,436 | |
| Due from Advisor | | | 6,492 | |
| Total Assets | | | 4,445,841 | |
| | | | | |
| LIABILITIES: | | | | |
| Payable to administrator | | | 1,063 | |
| Payable to auditor | | | 10,260 | |
| Accrued distribution fees | | | 6,972 | |
| Accrued service fees | | | 268 | |
| Accrued trustees fees | | | 5,187 | |
| Accrued expenses and other payables | | | 10,479 | |
| Total Liabilities | | | 34,229 | |
| NET ASSETS | | $ | 4,411,612 | |
| | | | | |
| NET ASSETS CONSIST OF: | | | | |
| Capital stock | | $ | 3,756,160 | |
| Accumulated net investment loss | | | (32,627 | ) |
| Accumulated net realized gain on investments | | | 329,709 | |
| Unrealized net appreciation on investments | | | 358,370 | |
| Total Net Assets | | $ | 4,411,612 | |
| | | | | |
| NET ASSETS | | | | |
| Investor Class: | | | | |
| Shares authorized (no par value) | | Unlimited | |
| Net assets applicable to outstanding Investor Class shares | | $ | 3,287,903 | |
| Shares issued and outstanding | | | 180,974 | |
| Net asset value, offering price and redemption price per share | | $ | 18.17 | |
| | | | | |
| Institutional Class: | | | | |
| Shares authorized (no par value) | | Unlimited | |
| Net assets applicable to outstanding Institutional Class shares | | $ | 1,123,709 | |
| Shares issued and outstanding | | | 60,502 | |
| Net asset value, offering price and redemption price per share | | $ | 18.57 | |
The accompanying notes are an integral part of these financial statements.
| HENNESSY FUNDS | 1-800-966-4354 | |
Financial Statements
Statement of Operations for the six months ended April 30, 2018 (Unaudited) |
| INVESTMENT INCOME: | | | |
Dividend income(1) | | $ | 14,269 | |
| Interest income | | | 993 | |
| Total investment income | | | 15,262 | |
| | | | | |
| EXPENSES: | | | | |
| Investment advisory fees (See Note 5) | | | 16,326 | |
| Federal and state registration fees | | | 14,929 | |
| Compliance expense (See Note 5) | | | 14,629 | |
| Audit fees | | | 10,860 | |
| Trustees’ fees and expenses | | | 8,991 | |
| Reports to shareholders | | | 3,372 | |
| Sub-transfer agent expenses – Investor Class (See Note 5) | | | 2,917 | |
| Distribution fees – Investor Class (See Note 5) | | | 2,431 | |
| Administration, fund accounting, custody and transfer agent fees (See Note 5) | | | 2,074 | |
| Service fees – Investor Class (See Note 5) | | | 1,621 | |
| Interest expense (See Note 7) | | | 31 | |
| Other expenses | | | 1,880 | |
| Total expenses before reimbursement by advisor | | | 80,061 | |
| Expense reimbursement by advisor – Investor Class (See Note 5) | | | (40,747 | ) |
| Expense reimbursement by advisor – Institutional Class (See Note 5) | | | (13,610 | ) |
| Net expenses | | | 25,704 | |
| NET INVESTMENT LOSS | | $ | (10,442 | ) |
| | | | | |
| REALIZED AND UNREALIZED GAINS (LOSSES): | | | | |
| Net realized gain on investments | | $ | 349,140 | |
| Net change in unrealized appreciation on investments | | | 8,309 | |
| Net gain on investments | | | 357,449 | |
| NET INCREASE IN NET ASSETS RESULTING FROM OPERATIONS | | $ | 347,007 | |
(1) | Net of foreign taxes withheld and issuance fees of $409. |
The accompanying notes are an integral part of these financial statements.
HENNESSYFUNDS.COM
| STATEMENT OF OPERATIONS/STATEMENTS OF CHANGES IN NET ASSETS |
Financial Statements
| Statements of Changes in Net Assets |
| | | Six Months Ended | | | | |
| | | April 30, 2018 | | | Year Ended | |
| | | (Unaudited) | | | October 31, 2017 | |
| OPERATIONS: | | | | | | |
| Net investment loss | | $ | (10,442 | ) | | $ | (41,753 | ) |
| Net realized gain on investments | | | 349,140 | | | | 632,539 | |
| Net change in unrealized appreciation on investments | | | 8,309 | | | | 31,853 | |
| Net increase in net assets resulting from operations | | | 347,007 | | | | 622,639 | |
| | | | | | | | | |
| DISTRIBUTIONS TO SHAREHOLDERS FROM: | | | | | | | | |
| Net realized gains – Investor Class | | | (284,123 | ) | | | — | |
| Net realized gains – Institutional Class | | | (107,305 | ) | | | — | |
| Total distributions | | | (391,428 | ) | | | — | |
| | | | | | | | | |
| CAPITAL SHARE TRANSACTIONS: | | | | | | | | |
| Proceeds from shares subscribed – Investor Class | | | 207,014 | | | | 422,345 | |
| Proceeds from shares subscribed – Institutional Class | | | 47,058 | | | | 218,028 | |
| Dividends reinvested – Investor Class | | | 278,793 | | | | — | |
| Dividends reinvested – Institutional Class | | | 106,216 | | | | — | |
| Cost of shares redeemed – Investor Class | | | (357,337 | ) | | | (587,405 | ) |
| Cost of shares redeemed – Institutional Class | | | (239,808 | ) | | | (74,362 | ) |
| Net increase (decrease) in net assets derived | | | | | | | | |
| from capital share transactions | | | 41,936 | | | | (21,394 | ) |
| TOTAL INCREASE (DECREASE) IN NET ASSETS | | | (2,485 | ) | | | 601,245 | |
| | | | | | | | | |
| NET ASSETS: | | | | | | | | |
| Beginning of period | | | 4,414,097 | | | | 3,812,852 | |
| End of period | | $ | 4,411,612 | | | $ | 4,414,097 | |
| Undistributed net investment loss, end of period | | $ | (32,627 | ) | | $ | (22,185 | ) |
| | | | | | | | | |
| CHANGES IN SHARES OUTSTANDING: | | | | | | | | |
| Shares sold – Investor Class | | | 11,256 | | | | 24,507 | |
| Shares sold – Institutional Class | | | 2,562 | | | | 12,743 | |
| Shares issued to holders as reinvestment | | | | | | | | |
| of dividends – Investor Class | | | 16,634 | | | | — | |
| Shares issued to holders as reinvestment | | | | | | | | |
| of dividends – Institutional Class | | | 6,208 | | | | — | |
| Shares redeemed – Investor Class | | | (20,133 | ) | | | (35,133 | ) |
| Shares redeemed – Institutional Class | | | (12,807 | ) | | | (4,356 | ) |
| Net increase (decrease) in shares outstanding | | | 3,720 | | | | (2,239 | ) |
The accompanying notes are an integral part of these financial statements.
| HENNESSY FUNDS | 1-800-966-4354 | |
Financial Statements
For an Investor Class share outstanding throughout each period
| | Six Months Ended | |
| | April 30, 2018 | |
| | (Unaudited) | |
| PER SHARE DATA: | | | | |
| Net asset value, beginning of period | | $ | 18.46 | | |
| | | | | | |
| Income from investment operations: | | | | | |
| Net investment loss | | | (0.04 | ) | |
| Net realized and unrealized gains on investments | | | 1.38 | | |
| Total from investment operations | | | 1.34 | | |
| | | | | | |
| Less distributions: | | | | | |
| Dividends from net realized gains | | | (1.63 | ) | |
| Total distributions | | | (1.63 | ) | |
| Net asset value, end of period | | $ | 18.17 | | |
| | | | | | |
| TOTAL RETURN | | | 8.03 | %(2) | |
| | | | | | |
| SUPPLEMENTAL DATA AND RATIOS: | | | | | |
| Net assets, end of period (millions) | | $ | 3.29 | | |
| Ratio of expenses to average net assets: | | | | | |
| Before expense reimbursement | | | 3.75 | %(3) | |
| After expense reimbursement | | | 1.23 | %(3) | |
| Ratio of net investment income to average net assets: | | | | | |
| Before expense reimbursement | | | (3.06 | )%(3) | |
| After expense reimbursement | | | (0.54 | )%(3) | |
Portfolio turnover rate(4) | | | 120 | %(2) | |
(1) | The Fund’s current expense limitation agreement, which became effective on February 28, 2017, was in effect for eight months of the year ended October 31, 2017. The Fund previously had an expense limitation agreement in effect from October 26, 2012, to February 28, 2015. |
(2) | Not annualized. |
(3) | Annualized. |
(4) | Portfolio turnover is calculated on the basis of the Fund as a whole. |
The accompanying notes are an integral part of these financial statements.
HENNESSYFUNDS.COM
| FINANCIAL HIGHLIGHTS — INVESTOR CLASS |
| Year Ended October 31, | |
| 2017 | | | 2016 | | | 2015 | | | 2014 | | | 2013 | |
| | | | | | | | | | | | | | |
| $ | 15.82 | | | $ | 15.36 | | | $ | 14.86 | | | $ | 13.57 | | | $ | 10.67 | |
| | | | | | | | | | | | | | | | | | | |
| | | | | | | | | | | | | | | | | | | |
| | (0.23 | ) | | | (0.68 | ) | | | (0.38 | ) | | | (0.23 | ) | | | (0.20 | ) |
| | 2.87 | | | | 1.14 | �� | | | 0.88 | | | | 1.52 | | | | 3.10 | |
| | 2.64 | | | | 0.46 | | | | 0.50 | | | | 1.29 | | | | 2.90 | |
| | | | | | | | | | | | | | | | | | | |
| | | | | | | | | | | | | | | | | | | |
| | — | | | | — | | | | — | | | | — | | | | — | |
| | — | | | | — | | | | — | | | | — | | | | — | |
| $ | 18.46 | | | $ | 15.82 | | | $ | 15.36 | | | $ | 14.86 | | | $ | 13.57 | |
| | | | | | | | | | | | | | | | | | | |
| | 16.69 | % | | | 2.99 | % | | | 3.36 | % | | | 9.51 | % | | | 27.18 | % |
| | | | | | | | | | | | | | | | | | | |
| | | | | | | | | | | | | | | | | | | |
| $ | 3.20 | | | $ | 2.91 | | | $ | 4.04 | | | $ | 4.99 | | | $ | 4.49 | |
| | | | | | | | | | | | | | | | | | | |
| | 4.16 | % | | | 3.61 | % | | | 3.13 | % | | | 2.92 | % | | | 3.04 | % |
| | 2.15 | %(1) | | | 3.61 | % | | | 2.75 | % | | | 1.95 | % | | | 1.95 | % |
| | | | | | | | | | | | | | | | | | | |
| | (3.16 | )% | | | (2.92 | )% | | | (2.30 | )% | | | (2.53 | )% | | | (2.36 | )% |
| | (1.15 | )%(1) | | | (2.92 | )% | | | (1.92 | )% | | | (1.55 | )% | | | (1.27 | )% |
| | 267 | % | | | 80 | % | | | 163 | % | | | 204 | % | | | 164 | % |
The accompanying notes are an integral part of these financial statements.
| HENNESSY FUNDS | 1-800-966-4354 | |
Financial Statements
For an Institutional Class share outstanding throughout each period
| | Six Months Ended | |
| | April 30, 2018 | |
| | (Unaudited) | |
| PER SHARE DATA: | | | | |
| Net asset value, beginning of period | | $ | 18.85 | | |
| | | | | | |
| Income from investment operations: | | | | | |
| Net investment loss | | | (0.00 | )(2) | |
| Net realized and unrealized gains on investments | | | 1.39 | | |
| Total from investment operations | | | 1.39 | | |
| | | | | | |
| Less distributions: | | | | | |
| Dividends from net realized gains | | | (1.67 | ) | |
| Total distributions | | | (1.67 | ) | |
| Net asset value, end of period | | $ | 18.57 | | |
| | | | | | |
| TOTAL RETURN | | | 8.12 | %(3) | |
| | | | | | |
| SUPPLEMENTAL DATA AND RATIOS: | | | | | |
| Net assets, end of period (millions) | | $ | 1.12 | | |
| Ratio of expenses to average net assets: | | | | | |
| Before expense reimbursement | | | 3.31 | %(4) | |
| After expense reimbursement | | | 0.98 | %(4) | |
| Ratio of net investment income to average net assets: | | | | | |
| Before expense reimbursement | | | (2.62 | )%(4) | |
| After expense reimbursement | | | (0.29 | )%(4) | |
Portfolio turnover rate(5) | | | 120 | %(3) | |
(1) | The Fund’s current expense limitation agreement, which became effective on February 28, 2017, was in effect for eight months of the year ended October 31, 2017. The Fund previously had an expense limitation agreement in effect from October 26, 2012, to February 28, 2015. |
(2) | Amount is less than $(0.01). |
(3) | Not annualized. |
(4) | Annualized. |
(5) | Portfolio turnover is calculated on the basis of the Fund as a whole. |
The accompanying notes are an integral part of these financial statements.
HENNESSYFUNDS.COM
| FINANCIAL HIGHLIGHTS — INSTITUTIONAL CLASS |
| Year Ended October 31, | |
| 2017 | | | 2016 | | | 2015 | | | 2014 | | | 2013 | |
| | | | | | | | | | | | | | |
| $ | 16.11 | | | $ | 15.58 | | | $ | 15.02 | | | $ | 13.68 | | | $ | 10.73 | |
| | | | | | | | | | | | | | | | | | | |
| | | | | | | | | | | | | | | | | | | |
| | (0.12 | ) | | | (0.43 | ) | | | (0.25 | ) | | | (0.26 | ) | | | (0.12 | ) |
| | 2.86 | | | | 0.96 | | | | 0.81 | | | | 1.60 | | | | 3.07 | |
| | 2.74 | | | | 0.53 | | | | 0.56 | | | | 1.34 | | | | 2.95 | |
| | | | | | | | | | | | | | | | | | | |
| | | | | | | | | | | | | | | | | | | |
| | — | | | | — | | | | — | | | | — | | | | — | |
| | — | | | | — | | | | — | | | | — | | | | — | |
| $ | 18.85 | | | $ | 16.11 | | | $ | 15.58 | | | $ | 15.02 | | | $ | 13.68 | |
| | | | | | | | | | | | | | | | | | | |
| | 17.01 | % | | | 3.40 | % | | | 3.73 | % | | | 9.80 | % | | | 27.49 | % |
| | | | | | | | | | | | | | | | | | | |
| | | | | | | | | | | | | | | | | | | |
| $ | 1.22 | | | $ | 0.90 | | | $ | 0.95 | | | $ | 0.93 | | | $ | 1.19 | |
| | | | | | | | | | | | | | | | | | | |
| | 3.74 | % | | | 3.28 | % | | | 2.76 | % | | | 2.60 | % | | | 2.76 | % |
| | 1.77 | %(1) | | | 3.28 | % | | | 2.44 | % | | | 1.70 | % | | | 1.70 | % |
| | | | | | | | | | | | | | | | | | | |
| | (2.74 | )% | | | (2.59 | )% | | | (1.92 | )% | | | (2.23 | )% | | | (2.10 | )% |
| | (0.77 | )%(1) | | | (2.59 | )% | | | (1.60 | )% | | | (1.33 | )% | | | (1.04 | )% |
| | 267 | % | | | 80 | % | | | 163 | % | | | 204 | % | | | 164 | % |
The accompanying notes are an integral part of these financial statements.
| HENNESSY FUNDS | 1-800-966-4354 | |
Financial Statements
Notes to the Financial Statements April 30, 2018 (Unaudited) |
1). ORGANIZATION
The Hennessy Technology Fund (the “Fund”) is a series of Hennessy Funds Trust (the “Trust”), which was organized as a Delaware statutory trust on September 17, 1992. The Fund is an open-end management investment company registered under the Investment Company Act of 1940, as amended. The investment objective of the Fund is long-term capital appreciation. The Fund is a diversified fund.
The Fund offers Investor Class and Institutional Class shares. Each class of shares differs principally in its respective 12b-1 distribution and service, shareholder servicing, and sub-transfer agent expenses. There are no sales charges. Each class has identical rights to earnings, assets, and voting privileges, except for class-specific expenses and exclusive rights to vote on matters affecting only an individual class.
As an investment company, the Fund follows the investment company accounting and reporting guidance of the Financial Accounting Standards Board (“FASB”) Accounting Standard Codification Topic 946 “Financial Services—Investment Companies.”
2). SIGNIFICANT ACCOUNTING POLICIES
The following is a summary of significant accounting policies consistently followed by the Fund in the preparation of the financial statements. These policies conform to U.S. generally accepted accounting principles (“GAAP”).
| a). | Investment Valuation – All investments in securities are recorded at their estimated fair value, as described in Note 3. |
| | |
| b). | Federal Income Taxes – No provision for federal income taxes or excise taxes has been made because the Fund has elected to be taxed as a “regulated investment company” and intends to distribute substantially all of its taxable income to its shareholders and otherwise comply with the provisions of the Internal Revenue Code of 1986, as amended, applicable to regulated investment companies. Net investment income/loss and realized gains/losses for federal income tax purposes may differ from those reported in the financial statements because of temporary book and tax basis differences. Temporary differences are primarily the result of the treatment of wash sales for tax reporting purposes. The Fund recognizes interest and penalties related to income tax benefits, if any, in the Statement of Operations as an income tax expense. Distributions from net realized gains for book purposes may include short-term capital gains, which are included as ordinary income to shareholders for tax purposes. The Fund may utilize equalization accounting for tax purposes and designate earnings and profits, including net realized gains distributed to shareholders on redemption of shares, as part of the dividends paid deduction for income tax purposes. |
| | |
| c). | Accounting for Uncertainty in Income Taxes – The Fund has accounting policies regarding recognition and measurement of tax positions taken or expected to be taken on a tax return. The tax returns of the Fund for the prior three fiscal years are open for examination. The Fund has reviewed all open tax years in major jurisdictions and concluded that there is no impact on the Fund’s net assets and no tax liability resulting from unrecognized tax benefits relating to uncertain income tax positions taken or expected to be taken on a tax return. The Fund’s major tax jurisdictions are U.S. federal and Delaware. |
HENNESSYFUNDS.COM
| NOTES TO THE FINANCIAL STATEMENTS |
| d). | Income and Expenses – Dividend income is recognized on the ex-dividend date or as soon as information is available to the Fund. Interest income, which includes the amortization of premium and accretion of discount, is recognized on an accrual basis. The Fund is charged for those expenses that are directly attributable to the portfolio, such as advisory, administration, and certain shareholder service fees. Income, expenses (other than expenses attributable to a specific class), and realized and unrealized gains/losses on investments are allocated to each class of shares based on such class’s net assets. |
| | |
| e). | Distributions to Shareholders – Dividends from net investment income for the Fund, if any, are declared and paid annually, usually in December. Distributions of net realized capital gains, if any, are declared and paid annually, usually in December. |
| | |
| f). | Security Transactions – Investment and shareholder transactions are recorded on the trade date. The Fund determines the realized gain/loss from an investment transaction by comparing the original cost of the security lot sold with the net sale proceeds. Discounts and premiums on securities purchased are accreted or amortized, respectively, over the life of each such security. |
| | |
| g). | Use of Estimates – The preparation of financial statements in conformity with GAAP requires management to make estimates and assumptions that affect the reported amounts of assets and liabilities and disclosure of contingent assets and liabilities at the date of the financial statements and the reported change in net assets during the reporting period. Actual results could differ from those estimates. |
| | |
| h). | Share Valuation – The net asset value (“NAV”) per share of the Fund is calculated by dividing (i) the total value of the securities held by the Fund, plus cash and other assets, minus all liabilities (including estimated accrued expenses) by (ii) the total number of shares outstanding for the Fund, rounded to the nearest cent. The Fund’s shares will not be priced on days the New York Stock Exchange is closed for trading. The offering and redemption price per share for the Fund is equal to the Fund’s NAV per share. |
3). SECURITIES VALUATION
The Fund follows fair valuation accounting standards that establish an authoritative definition of fair value and set out a hierarchy for measuring fair value. These standards require additional disclosures about the various inputs and valuation techniques used to develop the measurements of fair value and a discussion of changes in valuation techniques and related inputs during the period. These inputs are summarized in the three broad levels listed below:
| | Level 1 – | Unadjusted, quoted prices in active markets for identical instruments that the Fund has the ability to access at the date of measurement. |
| | | |
| | Level 2 – | Other significant observable inputs (including, but not limited to, quoted prices in active markets for similar instruments, quoted prices in markets that are not active for identical or similar instruments, and model-derived valuations in which all significant inputs and significant value drivers are observable in active markets (such as interest rates, prepayment speeds, credit risk curves, default rates, and similar data)). |
| | | |
| | Level 3 – | Significant unobservable inputs (including the Fund’s own assumptions about what market participants would use to price the asset or liability based on the best available information) when observable inputs are unavailable. |
Following is a description of the valuation techniques applied to the Fund’s major categories of assets and liabilities measured at fair value on a recurring basis.
| HENNESSY FUNDS | 1-800-966-4354 | |
| | Equity Securities – Equity securities, including common stocks, preferred stocks, foreign-issued common stocks, exchange-traded funds, closed-end mutual funds, partnerships, rights, and real estate investment trusts, that are traded on a securities exchange for which a last-quoted sales price is readily available will generally be valued at the last sales price as reported by the primary exchange on which the securities are listed. Securities listed on The NASDAQ Stock Market (“NASDAQ”) will generally be valued at the NASDAQ Official Closing Price, which may differ from the last sales price reported. Securities traded on a securities exchange for which a last-quoted sales price is not readily available will generally be valued at the mean between the bid and ask prices. To the extent these securities are actively traded and valuation adjustments are not applied, they are classified in Level 1 of the fair value hierarchy. Securities traded on foreign exchanges generally are not valued at the same time the Fund calculates its NAV because most foreign markets close well before such time. The earlier close of most foreign markets gives rise to the possibility that significant events, including broad market moves, may have occurred in the interim. In certain circumstances, it may be determined that a security needs to be fair valued because it appears that the value of the security might have been materially affected by events occurring after the close of the market in which the security is principally traded, but before the time the Fund calculates its NAV, such as by a development that affects an entire market or region (e.g., a weather-related event) or a potentially global development (e.g., a terrorist attack that may be expected to have an effect on investor expectations worldwide). |
| | |
| | Registered Investment Companies – Investments in registered investment companies (e.g., mutual funds) are generally priced at the ending NAV provided by the applicable registered investment company’s service agent and will be classified in Level 1 of the fair value hierarchy. |
| | |
| | Debt Securities – Debt securities, including corporate bonds, asset-backed securities, mortgage-backed securities, municipal bonds, U.S. Treasuries, and U.S. government agency issues, are generally valued at market on the basis of valuations furnished by an independent pricing service that utilizes both dealer-supplied valuations and formula-based techniques. The pricing service may consider recently executed transactions in securities of the issuer or comparable issuers, market price quotations (where observable), bond spreads, and fundamental data relating to the issuer. In addition, the model may incorporate observable market data, such as reported sales of similar securities, broker quotes, yields, bids, offers, and reference data. Certain securities are valued primarily using dealer quotations. These securities are generally classified in Level 2 of the fair value hierarchy. |
| | |
| | Short-Term Securities – Short-term equity investments, including money market funds, are valued in the manner specified above. Short-term debt investments with an original term to maturity of 60 days or less are valued at amortized cost, which approximates fair market value. If the original term to maturity of a short-term debt investment exceeded 60 days, then the values as of the 61st day prior to maturity are amortized. Amortized cost is not used if its use would be inappropriate due to credit or other impairments of the issuer, in which case the security’s fair value would be determined, as described below. Short-term securities are generally classified in Level 1 or Level 2 of the fair market hierarchy depending on the inputs used and market activity levels for specific securities. |
The Board of Trustees of the Fund (the “Board”) has adopted fair value pricing procedures that are followed when a price for a security is not readily available or if a significant event has occurred that indicates the closing price of a security no longer
HENNESSYFUNDS.COM
| NOTES TO THE FINANCIAL STATEMENTS |
represents the true value of that security. Fair value pricing determinations are made in good faith in accordance with these procedures. There are numerous criteria that will be given consideration in determining a fair value of a security, such as the trading volume of a security and markets, the values of other similar securities, and news events with direct bearing on a security or markets. Fair value pricing results in an estimated price for a security that reflects the amount the Fund might reasonably expect to receive in a current sale. Depending on the relative significance of the valuation inputs, these securities may be classified in either Level 2 or Level 3 of the fair value hierarchy.
The fair valuation of foreign securities may be determined with the assistance of a pricing service using correlations between the movement of prices of such securities and indices of domestic securities and other appropriate indicators, such as closing market prices of relevant American Depositary Receipts or futures contracts. The effect of using fair value pricing is that the Fund’s NAV will reflect the affected portfolio securities’ values as determined by the Board or its designee instead of being determined by the market. Using a fair value pricing methodology to price a foreign security may result in a value that is different from such foreign security’s most recent closing price and from the value used by other investment companies to calculate their NAVs. Such securities are generally classified in Level 2 of the fair valuation hierarchy. Because the Fund may invest in foreign securities, the value of the Fund’s portfolio securities may change on days when you will not be able to purchase or redeem your shares.
The Board has delegated day-to-day valuation matters to a Valuation Committee comprised of one or more representatives from Hennessy Advisors, Inc., the Fund’s investment advisor (the “Advisor”). The function of the Valuation Committee is to value securities where current and reliable market quotations are not readily available. All actions taken by the Valuation Committee are reviewed by the Board.
The Fund has performed an analysis of all existing investments to determine the significance and character of all inputs to their fair value determinations. Various inputs are used to determine the value of the Fund’s investments. The inputs or methodology used for valuing securities are not necessarily an indication of the risk associated with investing in those securities. Details related to the fair valuation hierarchy of the Fund’s securities as of April 30, 2018, are included in the Schedule of Investments.
4). INVESTMENT TRANSACTIONS
Purchases and sales of investment securities (excluding government and short-term investments) for the Fund during the six months ended April 30, 2018, were $5,096,586 and $5,472,305, respectively.
There were no purchases or sales/maturities of long-term U.S. government securities for the Fund during the six months ended April 30, 2018.
The Fund is permitted to purchase or sell securities from or to another fund in the Hennessy Funds family of funds (the “Hennessy Funds”) under specified conditions outlined in procedures adopted by the Board. The procedures have been designed to ensure that any purchase or sale of securities by the Fund from or to another Hennessy Fund complies with Rule 17a-7 of the Investment Company Act of 1940, as amended. During the six months ended April 30, 2018, the Fund did not engage in purchases or sales of securities pursuant to Rule 17a-7 of the Investment Company Act of 1940, as amended.
5). INVESTMENT MANAGEMENT FEE AND OTHER TRANSACTIONS WITH AFFILIATES
The Advisor provides the Fund with investment management services under an Investment Advisory Agreement. The Advisor furnishes all investment advice, office space, and facilities, as well as most of the personnel needed by the Fund. As
| HENNESSY FUNDS | 1-800-966-4354 | |
compensation for its services, the Advisor is entitled to a monthly fee from the Fund. The fee is based upon the average daily net assets of the Fund at an annual rate of 0.74%, effective as of February 28, 2017. Prior to that date, the annual rate was 0.90%. The net investment advisory fees expensed by the Fund during the six months ended April 30, 2018, are included in the Statement of Operations.
The Advisor has contractually agreed to limit total annual operating expenses of the Fund to 0.98% of the Fund’s net assets for both Investor Class shares and Institutional Class shares (excluding all federal, state and local taxes, interest, brokerage commissions, 12b-1 fees, shareholder servicing fees payable to the Advisor, acquired fund fees and expenses and other costs incurred in connection with the purchase and sale of securities, and extraordinary items) through February 28, 2019. In addition, in the past, the Advisor had contractually agreed to limit total annual operating expenses to 1.95% and 1.70% of the Fund’s net assets for Investor Class shares and Institutional Class shares, respectively (excluding interest, taxes, brokerage commissions, dividend expenses, acquired fund fees and expenses, extraordinary legal expenses, any other extraordinary expenses and, from and after November 1, 2014, 12b-1 fees). This prior expense limitation agreement for the Fund expired on February 28, 2015.
For a period of three years after the year in which the Advisor waived or reimbursed expenses, the Advisor may seek reimbursement from the Fund to the extent that total annual fund operating expenses are less than the expense limitation that was in effect at the time the Advisor waived or reimbursed expenses. As of April 30, 2018, cumulative expenses subject to potential recovery under the aforementioned conditions and year of expiration were as follows:
| | | | October 31, | | | October 31, | | | October 31, | | | | |
| | | | 2018 | | | 2020 | | | 2021 | | | Total | |
| | Investor Class | | $ | 16,551 | | | $ | 58,612 | | | $ | 40,747 | | | $ | 115,910 | |
| | Institutional Class | | $ | 3,036 | | | $ | 20,906 | | | $ | 13,610 | | | $ | 37,552 | |
The Board has approved a Shareholder Servicing Agreement for Investor Class shares of the Fund, which was instituted to compensate the Advisor for the non-investment management services it provides to the Fund. The Shareholder Servicing Agreement provides for a monthly fee paid to the Advisor at an annual rate of 0.10% of the average daily net assets of the Fund attributable to Investor Class shares. The shareholder service fees expensed by the Fund during the six months ended April 30, 2018, are included in the Statement of Operations.
The Fund has adopted a plan pursuant to Rule 12b-1 under the Investment Company Act of 1940, as amended, that authorizes payments in connection with the distribution of the Fund’s shares at an annual rate of up to 0.25% of the Fund’s average daily net assets attributable to Investor Class shares. Even though the authorized rate is up to 0.25%, the Fund is currently only using up to 0.15% of its average daily net assets attributable to Investor Class shares for such purpose. Amounts paid under the plan may be spent on any activities or expenses primarily intended to result in the sale of shares, including, but not limited to, advertising, shareholder account servicing, the printing and mailing of prospectuses to other than current shareholders, the printing and mailing of sales literature, and compensation for sales and marketing activities or to financial institutions and others, such as dealers and distributors. The distribution fees expensed by the Fund during the six months ended April 30, 2018, are included in the Statement of Operations.
The Fund has entered into agreements with various brokers, dealers, and financial intermediaries in connection with the sale of shares of the Fund. The agreements provide for periodic payments by the Fund to the brokers, dealers, and financial intermediaries
HENNESSYFUNDS.COM
| NOTES TO THE FINANCIAL STATEMENTS |
for providing certain shareholder maintenance services (sub-transfer agent expenses). These shareholder services include the pre-processing and quality control of new accounts, shareholder correspondence, answering customer inquiries regarding account status, and facilitating shareholder telephone transactions. The sub-transfer agent fees expensed by the Fund during the six months ended April 30, 2018, are included in the Statement of Operations.
U.S. Bancorp Fund Services, LLC (“USBFS”) provides the Fund with administrative, fund accounting, and transfer agent services. As administrator, USBFS is responsible for activities such as (i) preparing various federal and state regulatory filings, reports, and returns for the Fund, (ii) preparing reports and materials to be supplied to the Board, (iii) monitoring the activities of the Fund’s custodian, transfer agent, and accountants, and (iv) coordinating the preparation and payment of the Fund’s expenses and reviewing the Fund’s expense accruals. U.S. Bank N.A., an affiliate of USBFS, serves as the Fund’s custodian. The servicing agreements between the Trust and USBFS and U.S. Bank N.A. contain a fee schedule that is inclusive of administrative, fund accounting, custody, and transfer agent fees. The administrative, fund accounting, custody, and transfer agent fees expensed by the Fund during the six months ended April 30, 2018, are included in the Statement of Operations.
Quasar Distributors, LLC acts as the Fund’s principal underwriter in a continuous public offering of the Fund’s shares. Quasar Distributors, LLC is an affiliate of USBFS and U.S. Bank N.A.
The officers of the Fund are affiliated with the Advisor. Such officers, with the exception of the Chief Compliance Officer and the Senior Compliance Officer, receive no compensation from the Fund for serving in their respective roles. The Fund, along with the other Hennessy Funds, makes reimbursement payments, on an equal basis, to the Advisor for a portion of the salary and benefits associated with the office of the Chief Compliance Officer and for all of the salary and benefits associated with the office of the Senior Compliance Officer. The compliance fees expensed by the Fund during the six months ended April 30, 2018, are included in the Statement of Operations.
6). GUARANTEES AND INDEMNIFICATIONS
Under the Hennessy Funds’ organizational documents, their officers and trustees are indemnified by the Hennessy Funds against certain liabilities arising out of the performance of their duties to the Hennessy Funds. Additionally, in the normal course of business, the Hennessy Funds enter into contracts with service providers that contain general indemnification clauses. The Fund’s maximum exposure under these arrangements is unknown as this would involve future claims that may be made against the Fund that have not yet occurred. Currently, the Fund expects the risk of loss to be remote.
7). LINE OF CREDIT
The Fund has an uncommitted line of credit with the other Hennessy Funds in the amount of the lesser of (i) $100,000,000 or (ii) 33.33% of each Hennessy Fund’s net assets, or 30% for the Hennessy Gas Utility Fund and 10% for the Hennessy Balanced Fund, intended to provide short-term financing, if necessary, subject to certain restrictions, in connection with shareholder redemptions. The credit facility is with the Hennessy Funds’ custodian bank, U.S. Bank N.A. Borrowings under this arrangement bear interest at the bank’s prime rate and are secured by all of the Fund’s assets (as to its own borrowings only). During the six months ended April 30, 2018, the Fund had an outstanding average daily balance and a weighted average interest rate of $1,271 and 4.50%, respectively. The interest expensed by the Fund during the six months ended April 30, 2018, is included in the Statement of Operations. The maximum amount
| HENNESSY FUNDS | 1-800-966-4354 | |
outstanding for the Fund during the period was $171,000. As of April 30, 2018, the Fund did not have any borrowings outstanding under the line of credit.
8). FEDERAL TAX INFORMATION
As of October 31, 2017, the Fund’s most recent fiscal year end, the components of accumulated earnings (losses) for income tax purposes were as follows:
| | | Investments | |
| Cost of investments for tax purposes | | $ | 4,099,812 | |
| Gross tax unrealized appreciation | | $ | 533,548 | |
| Gross tax unrealized depreciation | | | (202,918 | ) |
| Net tax unrealized appreciation | | $ | 330,630 | |
| Undistributed ordinary income | | $ | — | |
| Undistributed long-term capital gains | | | 391,428 | |
| Total distributable earnings | | $ | 391,428 | |
| Other accumulated loss | | $ | (22,185 | ) |
| Total accumulated gain | | $ | 699,873 | |
The difference between book-basis unrealized appreciation/depreciation (as shown in the Statement of Assets and Liabilities) and tax-basis unrealized appreciation/depreciation (as shown above) is attributable primarily to wash sales.
As of October 31, 2017, the Fund’s most recent fiscal year end, the Fund had no tax basis capital losses to offset future capital gains.
During fiscal year 2017, the Fund’s most recent fiscal year, the capital losses utilized by the Fund were $64,213.
Capital losses sustained in fiscal year 2012 and in future taxable years will not expire and may be carried over by the Fund without limitation; however, they will retain the character of the original loss. Furthermore, any loss incurred during those taxable years will be required to be utilized prior to the losses incurred in taxable years prior to 2012. As a result of this ordering rule, pre-enactment capital loss carryforwards may be more likely to expire unused. Under pre-enactment law, capital losses could be carried forward for eight years, and carried forward as short-term capital losses, irrespective of the character of the original loss.
As of October 31, 2017, the Fund’s most recent fiscal year end, the Fund deferred, on a tax basis, a late-year ordinary loss of $22,185. Late-year ordinary losses are net ordinary losses incurred after December 31, 2016, but within the taxable year, that are deemed to arise on the first day of the Fund’s next taxable year.
During fiscal year 2018 (year to date) and fiscal year 2017, the tax character of distributions paid by the Fund was as follows:
| | | | Six Months Ended | | | Year Ended | |
| | | | April 30, 2018 | | | October 31, 2017 | |
| | Ordinary income(1) | | $ | — | | | $ | — | |
| | Long-term capital gain | | | 391,428 | | | | — | |
| | | | $ | 391,428 | | | $ | — | |
(1) Ordinary income includes short-term gain/loss.
9). EVENTS SUBSEQUENT TO PERIOD END
Management has evaluated the Fund’s related events and transactions that occurred subsequent to April 30, 2018, through the date of issuance of the Fund’s financial statements. Management has determined that there were no subsequent events requiring recognition or disclosure in the financial statements.
HENNESSYFUNDS.COM
| NOTES TO THE FINANCIAL STATEMENTS/ EXPENSE EXAMPLE |
Expense Example (Unaudited)
April 30, 2018
As a shareholder of the Fund, you incur two types of costs: (1) transaction costs, including sales charges (loads) on purchase payments, reinvested dividends, or other distributions; redemption fees; and exchange fees; and (2) ongoing costs, including management fees; service fees; and other Fund expenses. This Example is intended to help you understand your ongoing costs (in dollars) of investing in the Fund and to compare these costs with the ongoing costs of investing in other mutual funds. The Example is based on an investment of $1,000 invested at the beginning of the period and held for the entire period from November 1, 2017, through April 30, 2018.
Actual Expenses
The first line of the table below under the “Investor Class” and “Institutional Class” headings provides information about actual account values and actual expenses. Although the Fund charges no sales loads or transaction fees, you will be assessed fees for outgoing wire transfers, returned checks and stop payment orders at prevailing rates charged by U.S. Bancorp Fund Services, LLC, the Fund’s transfer agent. If you request that a redemption be made by wire transfer, currently a $15 fee is charged by the Fund’s transfer agent. IRA accounts will be charged a $15 annual maintenance fee. The example below includes, but is not limited to, management fees, shareholder servicing fees, fund accounting, custody, and transfer agent fees. However, the example below does not include portfolio trading commissions and related expenses, and other extraordinary expenses as determined under generally accepted accounting principles. You may use the information in this line, together with the amount you invested, to estimate the expenses that you paid over the period. Simply divide your account value by $1,000 (for example, an $8,600 account value divided by $1,000 = 8.6), then multiply the result by the number in the first line of the table under the “Investor Class” or “Institutional Class” headings in the column entitled “Expenses Paid During Period” to estimate the expenses you paid on your account during this period.
Hypothetical Example for Comparison Purposes
The second line of the table below under the “Investor Class” and “Institutional Class” headings provides information about hypothetical account values and hypothetical expenses based on the Fund’s actual expense ratios and an assumed rate of return of 5% per year before expenses, which is not the Fund’s actual return. The hypothetical account values and expenses may not be used to estimate the actual ending account balance or expenses you paid for the period. You may use this information to compare the ongoing costs of investing in the Fund and other funds. To do so, compare this 5% hypothetical example with the 5% hypothetical examples that appear in the shareholder reports of the other funds. Please note that the expenses shown in the table are meant to highlight your ongoing costs only and do not reflect any transactional costs, such as sales charges (loads), or exchange fees. Therefore, the second line of the table under the “Investor Class” and “Institutional Class” headings is useful in comparing ongoing costs only, and will not help you determine the relative total costs of owning different funds. In addition, if these transactional costs were included, your costs would have been higher.
| HENNESSY FUNDS | 1-800-966-4354 | |
| | | | Expenses Paid |
| | Beginning | Ending | During Period(1) |
| | Account Value | Account Value | November 1, 2017 – |
| | November 1, 2017 | April 30, 2018 | April 30, 2018 |
| Investor Class | | | |
| Actual | $1,000.00 | $1,080.30 | $6.34 |
| Hypothetical (5% return before expenses) | $1,000.00 | $1,018.70 | $6.16 |
| | | | |
| Institutional Class | | | |
| Actual | $1,000.00 | $1,081.20 | $5.06 |
| Hypothetical (5% return before expenses) | $1,000.00 | $1,019.93 | $4.91 |
(1) | Expenses are equal to the Fund’s expense ratio of 1.23% for Investor Class shares or 0.98% for Institutional Class shares, as applicable, multiplied by the average account value over the period, multiplied by 181/365 days (to reflect one-half year period). |
HENNESSYFUNDS.COM
| EXPENSE EXAMPLE — IMPORTANT NOTICE REGARDING DELIVERY OF SHAREHOLDER DOCUMENTS |
How to Obtain a Copy of the Fund’s
Proxy Voting Policy and Proxy Voting Records
A description of the policies and procedures the Fund uses to determine how to vote proxies relating to portfolio securities is available without charge (1) by calling 1-800-966-4354, (2) on the Hennessy Funds’ website at hennessyfunds.com/proxy-voting/voting-policy, or (3) on the U.S. Securities and Exchange Commission’s (the “SEC”) website at www.sec.gov. The Fund’s proxy voting record is available without charge on both the Hennessy Funds’ website at hennessyfunds.com/proxy-voting/voting-record and the SEC’s website at www.sec.gov no later than August 31 for the prior 12 months ending June 30.
Quarterly Filings on Form N-Q
The Fund files a complete schedule of portfolio holdings with the SEC for the first and third quarters of each fiscal year on Form N-Q. The Fund’s Forms N-Q are available on the SEC’s website at www.sec.gov. The Fund’s Forms N-Q may be reviewed and copied at the SEC’s Public Reference Room in Washington, DC and information on the operation of the Public Reference Room may be obtained by calling 1-800-SEC-0330. Information included in the Fund’s Forms N-Q will also be available upon request by calling 1-800-966-4354.
Important Notice Regarding Delivery of
Shareholder Documents
To help keep the Fund’s costs as low as possible, we generally deliver a single copy of shareholder reports, proxy statements, and prospectuses to shareholders who share an address and have the same last name. This process does not apply to account statements. You may request an individual copy of a shareholder document at any time. If you would like to receive separate mailings of shareholder documents, please call U.S. Bancorp Fund Services, LLC at 1-800-261-6950 or 1-414-765-4124, and individual delivery will begin within 30 days of your request. If your account is held through a financial institution or other intermediary, please contact such intermediary directly to request individual delivery.
| HENNESSY FUNDS | 1-800-966-4354 | |
Board Approval of Investment Advisory
Agreement
At its meeting on March 7, 2018, the Board of Trustees of the Fund (the “Board,” and the members thereof, the “Trustees”) unanimously approved the continuation of the investment advisory agreement of the Fund with Hennessy Advisors, Inc. (the “Advisor”). As part of the process of approving the continuation of the advisory agreement, the Trustees reviewed their fiduciary duties with respect to approving the advisory agreement and the relevant factors for them to consider. In addition, the Trustees who are not deemed “interested persons” (as defined by the Investment Company Act of 1940, as amended) of the Fund (the “Independent Trustees”) met in executive session to discuss the approval of the advisory agreement.
In advance of the meeting, the Advisor sent detailed information to the Trustees to assist them in their evaluation of the advisory agreement. This information included, but was not limited to, the following:
| | (1) | A memorandum from outside legal counsel that described the fiduciary duties of the Board with respect to approving the continuation of the advisory agreement and the relevant factors for consideration; |
| | | |
| | (2) | A memorandum from the Advisor that listed the factors relevant to the Board’s approval of the continuation of the advisory agreement and also referenced the documents that had been provided to help the Board assess each such factor; |
| | | |
| | (3) | An inventory of the range of services provided by the Advisor to the Fund; |
| | | |
| | (4) | A written discussion of economies of scale; |
| | | |
| | (5) | The advisory agreement; |
| | | |
| | (6) | A recent Fund fact sheet, which included, among other things, performance information over various periods; |
| | | |
| | (7) | A peer expense comparison of both the net expense ratio and investment advisory fee of the Fund; |
| | | |
| | (8) | The Advisor’s most recent Form 10-K and Form 10-Q, which includes information about the Advisor’s profitability; |
| | | |
| | (9) | Information about brokerage commissions; |
| | | |
| | (10) | Information about the Fund’s compliance program; and |
| | | |
| | (11) | The Advisor’s current Form ADV Part I. |
All of the factors discussed were considered as a whole by the Trustees, and also by the Independent Trustees meeting in executive session. The factors were viewed in their totality by the Trustees, with no single factor being the principal or determinative factor in the Trustees’ determination of whether to approve the continuation of the advisory agreement. The Trustees recognized that the management and fee arrangements for the Fund are the result of years of review and discussion between the Independent Trustees and the Advisor, that certain aspects of such arrangements may receive greater scrutiny in some years than in others, and that the Trustees’ conclusions may be based, in part, on their consideration of these same arrangements and information received during the course of the year and in prior years.
HENNESSYFUNDS.COM
| BOARD APPROVAL OF INVESTMENT ADVISORY AGREEMENT |
Prior to approving the continuation of the advisory agreement, the Trustees, including the Independent Trustees in executive session, considered, among other items:
| | (1) | The nature and quality of the advisory services provided by the Advisor; |
| | | |
| | (2) | A comparison of the fees and expenses of the Fund to other similar funds; |
| | | |
| | (3) | Whether economies of scale are recognized by the Fund; |
| | | |
| | (4) | The costs and profitability of the Fund to the Advisor; |
| | | |
| | (5) | The performance of the Fund; and |
| | | |
| | (6) | Any benefits to the Advisor from serving as an investment advisor to the Fund (other than the advisory fee). |
The material considerations and determinations of the Trustees, including the Independent Trustees, were as follows:
| | (1) | The Trustees considered the services identified below that are provided by the Advisor. Based on this review, the Trustees concluded that the Advisor provides high-quality services to the Fund, and they noted that their overall confidence in the Advisor is high. The Trustees also concluded that they were satisfied with the nature, extent, and quality of the advisory services provided to the Fund by the Advisor, and that the nature and extent of the services provided by the Advisor are appropriate to assure that the Fund’s operations are conducted in compliance with applicable laws, rules, and regulations. |
| | | (a) | The Advisor acts as the portfolio manager for the Fund. In this capacity, the Advisor does the following: |
| | | | (i) | manages the composition of the Fund’s portfolio, including the purchase, retention, and disposition of portfolio securities in accordance with the Fund’s investment objectives, policies, and restrictions; |
| | | | | |
| | | | (ii) | ensures compliance with “best execution” for the Fund’s portfolio; |
| | | | | |
| | | | (iii) | manages the use of soft dollars for the Fund; and |
| | | | | |
| | | | (iv) | manages proxy voting for the Fund. |
| | | (b) | The Advisor performs a daily reconciliation of portfolio positions and cash for the Fund. |
| | | | |
| | | (c) | The Advisor monitors the Fund’s compliance with its investment objectives and restrictions. |
| | | | |
| | | (d) | The Advisor monitors compliance with federal securities laws and performs activities such as maintaining a compliance program, conducting ongoing reviews of the compliance programs of the Fund’s service providers, conducting on-site visits to the Fund’s service providers, monitoring incidents of abusive trading practices, reviewing Fund expense accruals, payments, and fixed expense ratios, evaluating insurance providers for fidelity bond coverage and D&O/E&O insurance coverage, conducting employee compliance training, reviewing reports provided by service providers, maintaining books and records, and preparing an annual compliance report for the Board. |
| | | | |
| | | (e) | The Advisor oversees service providers that provide accounting, administration, distribution, transfer agency, custodial, sales, marketing, public relations, audit, information technology, and legal services to the Fund. |
| HENNESSY FUNDS | 1-800-966-4354 | |
| | | (f) | The Advisor maintains in-house marketing and distribution departments on behalf of the Fund. |
| | | | |
| | | (g) | The Advisor is actively involved with preparing regulatory filings for the Fund, including writing and annually updating the Fund’s prospectus and related documents. |
| | | | |
| | | (h) | The Advisor prepares a written summary of the Fund’s performance for the most recent 12-month period for each annual report of the Fund. |
| | | | |
| | | (i) | The Advisor oversees distribution of the Fund through third-party broker/dealers and independent financial institutions such as Charles Schwab, Inc., Fidelity, TD Waterhouse, and Pershing. The Advisor participates in “no transaction fee” (“NTF”) programs with these companies on behalf of the Fund, which allow customers to purchase the Fund through third-party distribution channels without paying a transaction fee. The Advisor compensates, in part, a number of these third-party providers of NTF programs out of its own revenues. |
| | | | |
| | | (j) | The Advisor pays the incentive compensation of the Fund’s compliance officers and employs other staff, such as legal, marketing, national accounts, distribution, sales, administrative, and trading oversight personnel, as well as management executives. |
| | | | |
| | | (k) | The Advisor provides a quarterly compliance certification to the Board. |
| | | | |
| | | (l) | The Advisor prepares or reviews Board materials, frequently presents to the Board or leads Board discussions, prepares or reviews meeting minutes, and arranges for Board training and education. |
| | (2) | The Trustees compared the performance of the Fund to benchmark indices over various time periods and also noted that the Trustees review and discuss reports comparing the investment performance of the Fund to various indices at each quarterly Board meeting. Based on all such information, the Trustees believe that the Advisor manages the Fund in a manner that is materially consistent with its stated investment objective and style. The Trustees concluded that the performance of the Fund over various time periods warranted the continuation of the advisory agreement. |
| | | |
| | (3) | The Trustees reviewed the advisory fees and overall expense ratios of the Fund compared to other funds similar in asset size and investment objective to the Fund using data from Morningstar. As part of the discussion with management, the Trustees ensured that they understood and were comfortable with the criteria used to determine the mutual funds included in the Morningstar categories for purposes of the materials considered at the meeting. The Trustees determined that the advisory fee and overall expense ratio of the Fund falls within the range of the advisory fees and overall expense ratios of other comparable funds and concluded that they are reasonable and warranted continuation of the advisory agreement. |
| | | |
| | (4) | The Trustees also considered whether economies of scale were being realized by the Advisor that should be shared with the Fund’s shareholders. The Trustees noted that many of the expenses incurred to manage the Fund are asset-based fees and thus do not result in material economies of scale being realized as the assets of the Fund increase. For example, mutual fund platform fees increase as the Fund’s assets grow. The Trustees also considered the Advisor’s efforts to |
HENNESSYFUNDS.COM
| BOARD APPROVAL OF INVESTMENT ADVISORY AGREEMENT |
| | | contain expenses, the Advisor’s significant marketing efforts to promote the Funds, and the Advisor’s agreement to waive fees or lower its management fees in certain circumstances. The Trustees noted that at current asset levels it did not appear that there were economies of scale being realized by the Advisor and concluded that it would continue to monitor economies of scale in the future as circumstances changed. |
| | | |
| | (5) | The Trustees considered the profitability of the Advisor, including the impact of mutual fund platform fees on the Advisor’s profitability, and also considered the resources and revenues that the Advisor has put into managing and distributing the Fund. The Trustees then concluded that the profits of the Advisor are reasonable and not excessive when compared to profitability guidelines set forth in relevant court cases. |
| | | |
| | (6) | The Trustees considered the high level of professionalism and knowledge of the Advisor’s employees, along with a very low level of turnover, and concluded that this was beneficial to the Fund and its shareholders. |
| | | |
| | (7) | The Trustees considered any benefits to the Advisor from serving as an advisor to the Fund (other than the advisory fee). The Trustees noted that the Advisor may derive ancillary benefits from, by way of example, its association with the Fund in the form of proprietary and third-party research products and services received from broker-dealers that execute portfolio trades for the Fund. The Trustees determined that any such products and services have been used for legitimate purposes relating to the Fund by providing assistance in the investment decision-making process. The Trustees concluded that any additional benefits realized by the Advisor from its relationship with the Fund were reasonable. |
After reviewing the materials provided at the meeting and management’s presentation, as well as other information regularly provided at the Board’s quarterly meetings throughout the year regarding the quality of services provided by the Advisor, the performance of the Fund, expense information, regulatory compliance issues, trading information and related matters, and other factors that the Trustees deemed relevant, the Trustees, including the Independent Trustees, approved the continuation of the advisory agreement.
| HENNESSY FUNDS | 1-800-966-4354 | |
For information, questions or assistance, please call
The Hennessy Funds
1-800-966-4354 or 1-415-899-1555
INVESTMENT ADVISOR
Hennessy Advisors, Inc.
7250 Redwood Boulevard, Suite 200
Novato, California 94945
ADMINISTRATOR,
TRANSFER AGENT,
DIVIDEND PAYING AGENT &
SHAREHOLDER SERVICING AGENT
U.S. Bancorp Fund Services, LLC
P.O. Box 701
Milwaukee, Wisconsin 53201-0701
CUSTODIAN
U.S. Bank N.A.
Custody Operations
1555 North River Center Drive, Suite 302
Milwaukee, Wisconsin 53212
TRUSTEES
Neil J. Hennessy
Robert T. Doyle
J. Dennis DeSousa
Gerald P. Richardson
COUNSEL
Foley & Lardner LLP
777 East Wisconsin Avenue
Milwaukee, Wisconsin 53202-5306
INDEPENDENT REGISTERED
PUBLIC ACCOUNTING FIRM
Tait, Weller & Baker LLP
1818 Market Street, Suite 2400
Philadelphia, Pennsylvania 19103
DISTRIBUTOR
Quasar Distributors, LLC
777 East Wisconsin Avenue
Milwaukee, Wisconsin 53202
hennessyfunds.com | 1-800-966-4354
This report has been prepared for shareholders and may be distributed to
others only if preceded or accompanied by a current prospectus.
SEMI-ANNUAL REPORT
APRIL 30, 2018
HENNESSY JAPAN FUND
Investor Class HJPNX
Institutional Class HJPIX
hennessyfunds.com | 1-800-966-4354
(This Page Intentionally Left Blank.)
Contents
| Letter to Shareholders | 2 |
| Performance Overview | 4 |
| Financial Statements | |
| Schedule of Investments | 5 |
| Statement of Assets and Liabilities | 9 |
| Statement of Operations | 10 |
| Statements of Changes in Net Assets | 11 |
| Financial Highlights | 12 |
| Notes to the Financial Statements | 16 |
| Expense Example | 24 |
| Proxy Voting Policy and Proxy Voting Records | 26 |
| Quarterly Schedule of Investments | 26 |
| Important Notice Regarding Delivery of Shareholder Documents | 26 |
| Board Approval of Investment Advisory Agreements | 27 |
| HENNESSY FUNDS | 1-800-966-4354 | |
May 2018
Dear Hennessy Funds Shareholder:
During the six-month period ended April 30, 2018, the Japanese stock market, as measured by the Tokyo Stock Price Index (TOPIX), rose by 5.67% (in U.S. Dollar terms).
The Japanese stock market showed robust performance over the first half of the period, supported by favorable midterm earnings results from Japanese companies, a stable yen and evidence of continued economic growth. Strong performance from U.S. equities, boosted by the passage of the Tax Reform bill lowering corporate taxes, also helped fuel investor confidence in Japanese stocks. However, Japanese equity prices dropped in the second half of the period as the imposition of trade tariffs by the U.S. set off fears of an international trade war and led to a slump in equity prices worldwide. The yen also strengthened in response to the perception of higher risk globally, contributing to the decline in equities. Additionally, the perception that the Bank of Japan was starting to move towards a slightly tighter monetary policy also disturbed investors. In the political arena, the decline in support for the Abe administration caused by a scandal involving the sale of land for a kindergarten school may have influenced the stock market’s fall. However, upward price movements in April suggest that more positive market sentiment is returning, especially for larger cap companies.
We believe Japan is slowly emerging from its long period of deflation. Although an inflation rate of 2% will be hard to reach in the short term, we believe keeping the consumer price index (CPI) rising at a rate of about 1% is much more achievable and will help change expectations regarding inflation. In the latest reading, inflation edged up to 1.1% in March 2018.
In our opinion, corporate earnings growth is the main factor driving the Japanese stock market higher. During the country’s tough deflationary years, Japanese companies were forced to restructure, close plants, and reduce employee headcount to survive. These moves increased the efficiency of Japan’s corporate sector. As a result, Japanese companies today are highly profitable, internationally competitive, and are generating strong corporate earnings growth. We believe earnings growth will continue to be robust, supporting further advances in the equity market.
We believe the structural reform program is progressing well. Over the last few years, the Liberal Democratic Party’s administration has implemented scores of structural reforms affecting the tax code, the labor market, and corporate governance. Recently, the government has been discussing the introduction of an element of meritocracy for white collar employment in an effort to improve labor productivity. Proposals under consideration include the idea that highly skilled workers be paid on the basis of work produced rather than hours worked. New revisions to the corporate governance code are also being discussed. Under the new guidelines, companies would have to publish a management succession plan, meet diversity criteria in their boardrooms, and justify non-strategic crossholdings between companies.
HENNESSYFUNDS.COM
We remain optimistic about the long-term prospects for Japan and its stock market. Thank you for your continued confidence and investment in the Hennessy Funds.
Sincerely,
 |  |
| Tadahiro Fujimura | Masakazu Takeda |
| Portfolio Manager, | Portfolio Manager, |
| Hennessy Japan Small Cap Fund; | Hennessy Japan Fund; |
| Chief Investment Officer | Fund Manager |
| SPARX Asset Management Co., Ltd. | SPARX Asset Management Co., Ltd. |
SPARX Asset Management Co., Ltd., located in Tokyo, Japan, is the sub-advisor to the Hennessy Japan Fund and the Hennessy Japan Small Cap Fund.
Past performance does not guarantee future results.
Mutual fund investing involves risk. Principal loss is possible.
Opinions expressed are those of Tadahiro Fujimura and Masakazu Takeda, are subject to change, are not guaranteed, and should not be considered investment advice.
The Tokyo Stock Price Index (TOPIX) is an unmanaged index commonly used to measure the performance of Japanese stocks. One cannot invest directly in an index.
Earnings growth is not a measure of a fund’s future performance.
| HENNESSY FUNDS | 1-800-966-4354 | |
Performance Overview (Unaudited)
AVERAGE ANNUAL TOTAL RETURN FOR PERIODS ENDED APRIL 30, 2018
| | Six | One | Five | Ten |
| | Months(1) | Year | Years | Years |
| Hennessy Japan Fund – | | | | |
| Investor Class (HJPNX) | 7.65% | 24.10% | 13.85% | 9.20% |
| Hennessy Japan Fund – | | | | |
| Institutional Class (HJPIX) | 7.90% | 24.61% | 14.21% | 9.46% |
| Russell/Nomura Total | | | | |
MarketTM Index | 5.13% | 20.50% | 8.68% | 4.43% |
| Tokyo Price Index (TOPIX) | 5.67% | 20.68% | 8.49% | 4.39% |
Expense ratios: 1.47% (Investor Class); 1.06% (Institutional Class)
(1) | Periods less than one year are not annualized. |
___________________
Performance data quoted represents past performance; past performance does not guarantee future results. The investment return and principal value of an investment will fluctuate so that an investor’s shares, when redeemed, may be worth more or less than their original cost. The performance table does not reflect the deduction of taxes that a shareholder would pay on Fund distributions or the redemption of Fund shares. Current performance of the Fund may be lower or higher than the performance quoted. Performance data current to the most recent month end may be obtained by visiting hennessyfunds.com.
The Russell/Nomura Total Market™ Index contains the top 98% of all stocks listed on Japan’s stock exchange and registered on Japan’s OTC market in terms of market capitalization. The Tokyo Price Index (TOPIX) is a market capitalization-weighted index of all companies listed on the First Section of the Tokyo Stock Exchange. One cannot invest directly in an index.
The expense ratios presented are from the most recent prospectus. The expense ratios for the current reporting period are available in the Financial Highlights section of this report.
HENNESSYFUNDS.COM
| PERFORMANCE OVERVIEW/SCHEDULE OF INVESTMENTS |
Financial Statements
Schedule of Investments as of April 30, 2018 (Unaudited) |
HENNESSY JAPAN FUND
(% of Net Assets)
| TOP TEN HOLDINGS (EXCLUDING CASH/CASH EQUIVALENTS) | % NET ASSETS |
| Fast Retailing Co., Ltd. | 5.26% |
| Terumo Corp. | 5.21% |
| Softbank Group Co. | 5.19% |
| Rohto Pharmaceutical Co., Ltd. | 5.08% |
| Keyence Corp. | 4.98% |
| Nidec Corp. | 4.94% |
| Daikin Industries | 4.93% |
| Unicharm Corp. | 4.93% |
| Mitsubishi Corp. | 4.85% |
| Misumi Group, Inc. | 4.81% |
Note: For presentation purposes, the Fund has grouped some of the industry categories. For purposes of categorizing securities for compliance with Section 8(b)(1) of the Investment Company Act of 1940, as amended, the Fund uses more specific industry classifications.
The Global Industry Classification Standard (GICS®) was developed by and is the exclusive property and a service mark of MSCI, Inc. and Standard & Poor Financial Services LLC. It has been licensed for use by the Hennessy Funds.
| HENNESSY FUNDS | 1-800-966-4354 | |
| COMMON STOCKS – 93.90% | | Number | | | | | | % of | |
| | | of Shares | | | Value | | | Net Assets | |
| Consumer Discretionary – 20.66% | | | | | | | | | |
| Asics Corp. | | | 930,000 | | | $ | 17,573,815 | | | | 3.84 | % |
| Fast Retailing Co., Ltd. | | | 54,800 | | | | 24,058,060 | | | | 5.26 | % |
| Isuzu Motors, Ltd. | | | 438,900 | | | | 6,699,497 | | | | 1.47 | % |
| Ryohin Keikaku Co., Ltd. | | | 29,600 | | | | 10,125,082 | | | | 2.22 | % |
| Shimano, Inc. | | | 161,600 | | | | 21,487,744 | | | | 4.70 | % |
| Toyota Motor Corp. | | | 220,900 | | | | 14,484,944 | | | | 3.17 | % |
| | | | | | | | 94,429,142 | | | | 20.66 | % |
| | | | | | | | | | | | | |
| Consumer Staples – 15.10% | | | | | | | | | | | | |
| Japan Tobacco, Inc. | | | 792,100 | | | | 21,292,600 | | | | 4.66 | % |
| Kao Corp. | | | 301,500 | | | | 21,673,641 | | | | 4.74 | % |
| Pigeon Corp. | | | 75,400 | | | | 3,534,305 | | | | 0.77 | % |
| Unicharm Corp. | | | 800,500 | | | | 22,505,143 | | | | 4.93 | % |
| | | | | | | | 69,005,689 | | | | 15.10 | % |
| | | | | | | | | | | | | |
| Financials – 8.43% | | | | | | | | | | | | |
| Mitsubishi UFJ Financial Group, Inc. | | | 3,104,400 | | | | 20,803,650 | | | | 4.55 | % |
| Sumitomo Mitsui Financial Group, Inc. | | | 425,800 | | | | 17,746,606 | | | | 3.88 | % |
| | | | | | | | 38,550,256 | | | | 8.43 | % |
| | | | | | | | | | | | | |
| Health Care – 10.29% | | | | | | | | | | | | |
| Rohto Pharmaceutical Co., Ltd. | | | 797,600 | | | | 23,216,085 | | | | 5.08 | % |
| Terumo Corp. | | | 421,100 | | | | 23,826,190 | | | | 5.21 | % |
| | | | | | | | 47,042,275 | | | | 10.29 | % |
| | | | | | | | | | | | | |
| Industrials – 27.35% | | | | | | | | | | | | |
| Daikin Industries | | | 193,000 | | | | 22,545,441 | | | | 4.93 | % |
| Kubota Corp. | | | 822,200 | | | | 13,862,723 | | | | 3.03 | % |
| Misumi Group, Inc. | | | 796,000 | | | | 21,966,742 | | | | 4.81 | % |
| Mitsubishi Corp. | | | 804,800 | | | | 22,192,802 | | | | 4.85 | % |
| Nidec Corp. | | | 144,200 | | | | 22,558,963 | | | | 4.94 | % |
| Recruit Holdings Co., Ltd. | | | 949,700 | | | | 21,897,198 | | | | 4.79 | % |
| | | | | | | | 125,023,869 | | | | 27.35 | % |
| | | | | | | | | | | | | |
| Information Technology – 4.98% | | | | | | | | | | | | |
| Keyence Corp. | | | 37,300 | | | | 22,744,780 | | | | 4.98 | % |
| | | | | | | | | | | | | |
| Materials – 1.90% | | | | | | | | | | | | |
| Fuji Seal International, Inc. | | | 232,200 | | | | 8,663,972 | | | | 1.90 | % |
The accompanying notes are an integral part of these financial statements.
| COMMON STOCKS | | Number | | | | | | % of | |
| | | of Shares | | | Value | | | Net Assets | |
| Telecommunication Services – 5.19% | | | | | | | | | |
| Softbank Group Co. | | | 310,700 | | | $ | 23,740,186 | | | | 5.19 | % |
| | | | | | | | | | | | | |
| Total Common Stocks | | | | | | | | | | | | |
| (Cost $333,301,416) | | | | | | | 429,200,169 | | | | 93.90 | % |
| | | | | | | | | | | | | |
| SHORT-TERM INVESTMENTS – 5.81% | | | | | | | | | | | | |
| | | | | | | | | | | | | |
| Money Market Funds – 5.81% | | | | | | | | | | | | |
| Fidelity Government Portfolio, Institutional Class, 1.58% (a) | | | 22,839,000 | | | | 22,839,000 | | | | 4.99 | % |
| The Government & Agency Portfolio, Institutional Class, 1.61% (a) | | | 3,740,514 | | | | 3,740,514 | | | | 0.82 | % |
| | | | | | | | 26,579,514 | | | | 5.81 | % |
| Total Short-Term Investments | | | | | | | | | | | | |
| (Cost $26,579,514) | | | | | | | 26,579,514 | | | | 5.81 | % |
| | | | | | | | | | | | | |
| Total Investments | | | | | | | | | | | | |
| (Cost $359,880,930) – 99.71% | | | | | | | 455,779,683 | | | | 99.71 | % |
| Other Assets in Excess of Liabilities – 0.29% | | | | | | | 1,305,009 | | | | 0.29 | % |
| | | | | | | | | | | | | |
TOTAL NET ASSETS – 100.00% | | | | | | $ | 457,084,692 | | | | 100.00 | % |
Percentages are stated as a percent of net assets.
| (a) | The rate listed is the fund’s seven-day yield as of April 30, 2018. |
The accompanying notes are an integral part of these financial statements.
| HENNESSY FUNDS | 1-800-966-4354 | |
Summary of Fair Value Exposure at April 30, 2018
The following is a summary of the inputs used to value the Fund’s net assets as of April 30, 2018 (See Note 3 in the accompanying notes to the financial statements):
| Common Stocks | | Level 1 | | | Level 2 | | | Level 3 | | | Total | |
| Consumer Discretionary | | $ | — | | | $ | 94,429,142 | | | $ | — | | | $ | 94,429,142 | |
| Consumer Staples | | | — | | | | 69,005,689 | | | | — | | | | 69,005,689 | |
| Financials | | | — | | | | 38,550,256 | | | | — | | | | 38,550,256 | |
| Health Care | | | — | | | | 47,042,275 | | | | — | | | | 47,042,275 | |
| Industrials | | | — | | | | 125,023,869 | | | | — | | | | 125,023,869 | |
| Information Technology | | | — | | | | 22,744,780 | | | | — | | | | 22,744,780 | |
| Materials | | | — | | | | 8,663,972 | | | | — | | | | 8,663,972 | |
| Telecommunication Services | | | — | | | | 23,740,186 | | | | — | | | | 23,740,186 | |
| Total Common Stocks | | $ | — | | | $ | 429,200,169 | | | $ | — | | | $ | 429,200,169 | |
| Short-Term Investments | | | | | | | | | | | | | | | | |
| Money Market Funds | | $ | 26,579,514 | | | $ | — | | | $ | — | | | $ | 26,579,514 | |
| Total Short-Term Investments | | $ | 26,579,514 | | | $ | — | | | $ | — | | | $ | 26,579,514 | |
| Total Investments | | $ | 26,579,514 | | | $ | 429,200,169 | | | $ | — | | | $ | 455,779,683 | |
Transfers between levels are recognized at the end of the reporting period. During the six-month period ended April 30, 2018, the Fund recognized no transfers between levels.
Transfers between Level 1 and Level 2 relate to the use of fair valuation pricing service. On days when the fair valuation pricing service is used, non-U.S. dollar denominated securities move from a Level 1 to a Level 2 classification.
The accompanying notes are an integral part of these financial statements.
HENNESSYFUNDS.COM
| SCHEDULE OF INVESTMENTS/STATEMENT OF ASSETS AND LIABILITIES |
Financial Statements
Statement of Assets and Liabilities as of April 30, 2018 (Unaudited) |
| ASSETS: | | | |
| Investments in securities, at value (cost $359,880,930) | | $ | 455,779,683 | |
| Dividends and interest receivable | | | 1,833,328 | |
| Receivable for fund shares sold | | | 1,047,326 | |
| Prepaid expenses and other assets | | | 58,181 | |
| Total Assets | | | 458,718,518 | |
| | | | | |
| LIABILITIES: | | | | |
| Payable for securities purchased | | | 904,855 | |
| Payable for fund shares redeemed | | | 276,015 | |
| Payable to advisor | | | 298,483 | |
| Payable to administrator | | | 67,419 | |
| Payable to auditor | | | 9,724 | |
| Accrued distribution fees | | | 19,079 | |
| Accrued service fees | | | 8,972 | |
| Accrued trustees fees | | | 3,585 | |
| Accrued expenses and other payables | | | 45,694 | |
| Total Liabilities | | | 1,633,826 | |
| NET ASSETS | | $ | 457,084,692 | |
| | | | | |
| NET ASSETS CONSIST OF: | | | | |
| Capital stock | | $ | 367,570,842 | |
| Accumulated net investment income | | | 519,934 | |
| Accumulated net realized loss on investments | | | (6,838,215 | ) |
| Unrealized net appreciation on investments | | | 95,832,131 | |
| Total Net Assets | | $ | 457,084,692 | |
| | | | | |
| NET ASSETS | | | | |
| Investor Class: | | | | |
| Shares authorized (no par value) | | Unlimited | |
| Net assets applicable to outstanding Investor Class shares | | $ | 109,795,384 | |
| Shares issued and outstanding | | | 3,114,349 | |
| Net asset value, offering price and redemption price per share | | $ | 35.25 | |
| | | | | |
| Institutional Class: | | | | |
| Shares authorized (no par value) | | Unlimited | |
| Net assets applicable to outstanding Institutional Class shares | | $ | 347,289,308 | |
| Shares issued and outstanding | | | 9,574,824 | |
| Net asset value, offering price and redemption price per share | | $ | 36.27 | |
The accompanying notes are an integral part of these financial statements.
| HENNESSY FUNDS | 1-800-966-4354 | |
Financial Statements
Statement of Operations for the six months ended April 30, 2018 (Unaudited) |
| INVESTMENT INCOME: | | | |
Dividend income(1) | | $ | 2,643,966 | |
| Interest income | | | 165,138 | |
| Total investment income | | | 2,809,104 | |
| | | | | |
| EXPENSES: | | | | |
| Investment advisory fees (See Note 5) | | | 1,486,699 | |
| Sub-transfer agent expenses – Investor Class (See Note 5) | | | 125,985 | |
| Sub-transfer agent expenses – Institutional Class (See Note 5) | | | 91,612 | |
| Administration, fund accounting, custody and transfer agent fees (See Note 5) | | | 174,488 | |
| Distribution fees – Investor Class (See Note 5) | | | 78,741 | |
| Service fees – Investor Class (See Note 5) | | | 52,493 | |
| Federal and state registration fees | | | 15,643 | |
| Compliance expense (See Note 5) | | | 14,629 | |
| Audit fees | | | 10,969 | |
| Reports to shareholders | | | 10,315 | |
| Trustees’ fees and expenses | | | 9,362 | |
| Legal fees | | | 1,744 | |
| Other expenses | | | 7,960 | |
| Total expenses | | | 2,080,640 | |
| NET INVESTMENT INCOME | | $ | 728,464 | |
| | | | | |
| REALIZED AND UNREALIZED GAINS (LOSSES): | | | | |
| Net realized loss on investments | | $ | (466,636 | ) |
| Net change in unrealized appreciation on investments | | | 22,729,938 | |
| Net gain on investments | | | 22,263,302 | |
| NET INCREASE IN NET ASSETS RESULTING FROM OPERATIONS | | $ | 22,991,766 | |
(1) | Net of foreign taxes withheld of $292,743. |
The accompanying notes are an integral part of these financial statements.
HENNESSYFUNDS.COM
| STATEMENT OF OPERATIONS/STATEMENTS OF CHANGES IN NET ASSETS |
Financial Statements
| Statements of Changes in Net Assets |
| | | Six Months Ended | | | | |
| | | April 30, 2018 | | | Year Ended | |
| | | (Unaudited) | | | October 31, 2017 | |
| OPERATIONS: | | | | | | |
| Net investment income | | $ | 728,464 | | | $ | 233,529 | |
| Net realized loss on investments | | | (466,636 | ) | | | (281,051 | ) |
| Net change in unrealized appreciation on investments | | | 22,729,938 | | | | 36,173,877 | |
| Net increase in net assets resulting from operations | | | 22,991,766 | | | | 36,126,355 | |
| | | | | | | | | |
| DISTRIBUTIONS TO SHAREHOLDERS FROM: | | | | | | | | |
| Net investment income – Investor Class | | | (15,955 | ) | | | — | |
| Net investment income – Institutional Class | | | (192,575 | ) | | | — | |
| Total distributions | | | (208,530 | ) | | | — | |
| | | | | | | | | |
| CAPITAL SHARE TRANSACTIONS: | | | | | | | | |
| Proceeds from shares subscribed – Investor Class | | | 43,396,319 | | | | 48,195,357 | |
| Proceeds from shares subscribed – Institutional Class | | | 216,692,349 | | | | 115,058,173 | |
| Dividends reinvested – Investor Class | | | 15,517 | | | | — | |
| Dividends reinvested – Institutional Class | | | 171,054 | | | | — | |
| Cost of shares redeemed – Investor Class | | | (24,336,818 | ) | | | (38,068,126 | ) |
| Cost of shares redeemed – Institutional Class | | | (63,502,309 | ) | | | (29,067,977 | ) |
| Net increase in net assets derived | | | | | | | | |
| from capital share transactions | | | 172,436,112 | | | | 96,117,427 | |
| TOTAL INCREASE IN NET ASSETS | | | 195,219,348 | | | | 132,243,782 | |
| | | | | | | | | |
| NET ASSETS: | | | | | | | | |
| Beginning of period | | | 261,865,344 | | | | 129,621,562 | |
| End of period | | $ | 457,084,692 | | | $ | 261,865,344 | |
| Undistributed net investment income, end of period | | $ | 519,934 | | | $ | — | |
| | | | | | | | | |
| CHANGES IN SHARES OUTSTANDING: | | | | | | | | |
| Shares sold – Investor Class | | | 1,235,253 | | | | 1,683,845 | |
| Shares sold – Institutional Class | | | 6,010,628 | | | | 3,882,507 | |
| Shares issued to holders as reinvestment | | | | | | | | |
| of dividends – Investor Class | | | 445 | | | | — | |
| Shares issued to holders as reinvestment | | | | | | | | |
| of dividends – Institutional Class | | | 4,774 | | | | — | |
| Shares redeemed – Investor Class | | | (699,759 | ) | | | (1,329,272 | ) |
| Shares redeemed – Institutional Class | | | (1,714,100 | ) | | | (990,930 | ) |
| Net increase in shares outstanding | | | 4,837,241 | | | | 3,246,150 | |
The accompanying notes are an integral part of these financial statements.
| HENNESSY FUNDS | 1-800-966-4354 | |
Financial Statements
For an Investor Class share outstanding throughout each period
| | | Six Months Ended | |
| | | April 30, 2018 | |
| | | (Unaudited) | |
| PER SHARE DATA: | | | |
| Net asset value, beginning of period | | $ | 32.75 | |
| | | | | |
| Income from investment operations: | | | | |
| Net investment loss | | | 0.00 | |
| Net realized and unrealized gains on investments | | | 2.51 | |
| Total from investment operations | | | 2.51 | |
| | | | | |
| Less distributions: | | | | |
| Dividends from net investment income | | | (0.01 | ) |
| Dividends from return of capital | | | — | |
| Total distributions | | | (0.01 | ) |
| Net asset value, end of period | | $ | 35.25 | |
| | | | | |
| TOTAL RETURN | | | 7.65 | %(1) |
| | | | | |
| SUPPLEMENTAL DATA AND RATIOS: | | | | |
| Net assets, end of period (millions) | | $ | 109.80 | |
| Ratio of expenses to average net assets | | | 1.42 | %(2) |
| Ratio of net investment loss to average net assets | | | (0.03 | )%(2) |
Portfolio turnover rate(3) | | | 1 | %(1) |
(1) | Not annualized. |
(2) | Annualized. |
(3) | Portfolio turnover is calculated on the basis of the Fund as a whole. |
The accompanying notes are an integral part of these financial statements.
HENNESSYFUNDS.COM
| FINANCIAL HIGHLIGHTS — INVESTOR CLASS |
| Year Ended October 31, | | |
| 2017 | | | 2016 | | | 2015 | | | 2014 | | | 2013 | | |
| | | | | | | | | | | | | | | |
| $ | 27.81 | | | $ | 24.07 | | | $ | 21.77 | | | $ | 19.68 | | | $ | 15.40 | | |
| | | | | | | | | | | | | | | | | | | | |
| | | | | | | | | | | | | | | | | | | | |
| | (0.03 | ) | | | (0.11 | ) | | | (0.10 | ) | | | (0.06 | ) | | | (0.04 | ) | |
| | 4.97 | | | | 3.85 | | | | 2.40 | | | | 2.15 | | | | 4.33 | | |
| | 4.94 | | | | 3.74 | | | | 2.30 | | | | 2.09 | | | | 4.29 | | |
| | | | | | | | | | | | | | | | | | | | |
| | | | | | | | | | | | | | | | | | | | |
| | — | | | | — | | | | — | | | | — | | | | — | | |
| | — | | | | — | | | | — | | | | — | | | | (0.01 | ) | |
| | — | | | | — | | | | — | | | | — | | | | (0.01 | ) | |
| $ | 32.75 | | | $ | 27.81 | | | $ | 24.07 | | | $ | 21.77 | | | $ | 19.68 | | |
| | | | | | | | | | | | | | | | | | | | |
| | 17.76 | % | | | 15.54 | % | | | 10.56 | % | | | 10.62 | % | | | 27.87 | % | |
| | | | | | | | | | | | | | | | | | | | |
| | | | | | | | | | | | | | | | | | | | |
| $ | 84.44 | | | $ | 61.85 | | | $ | 61.56 | | | $ | 27.26 | | | $ | 31.32 | | |
| | 1.46 | % | | | 1.50 | % | | | 1.53 | % | | | 1.70 | % | | | 1.90 | % | |
| | (0.15 | )% | | | (0.38 | )% | | | (0.44 | )% | | | (0.18 | )% | | | (0.35 | )% | |
| | 0 | % | | | 5 | % | | | 21 | % | | | 22 | % | | | 6 | % | |
The accompanying notes are an integral part of these financial statements.
| HENNESSY FUNDS | 1-800-966-4354 | |
Financial Statements
For an Institutional Class share outstanding throughout each period
| | | Six Months Ended | |
| | | April 30, 2018 | |
| | | (Unaudited) | |
| PER SHARE DATA: | | | |
| Net asset value, beginning of period | | $ | 33.64 | |
| | | | | |
| Income from investment operations: | | | | |
| Net investment income (loss) | | | 0.09 | |
| Net realized and unrealized gains on investments | | | 2.57 | |
| Total from investment operations | | | 2.66 | |
| | | | | |
| Less distributions: | | | | |
| Dividends from net investment income | | | (0.03 | ) |
| Dividends from return of capital | | | — | |
| Total distributions | | | (0.03 | ) |
| Net asset value, end of period | | $ | 36.27 | |
| | | | | |
| TOTAL RETURN | | | 7.90 | %(1) |
| | | | | |
| SUPPLEMENTAL DATA AND RATIOS: | | | | |
| Net assets, end of period (millions) | | $ | 347.29 | |
| Ratio of expenses to average net assets | | | 1.00 | %(2) |
| Ratio of net investment income (loss) to average net assets | | | 0.56 | %(2) |
Portfolio turnover rate(3) | | | 1 | %(1) |
(1) | Not annualized. |
(2) | Annualized. |
(3) | Portfolio turnover is calculated on the basis of the Fund as a whole. |
The accompanying notes are an integral part of these financial statements.
HENNESSYFUNDS.COM
| FINANCIAL HIGHLIGHTS — INSTITUTIONAL CLASS |
| Year Ended October 31, | | |
| 2017 | | | 2016 | | | 2015 | | | 2014 | | | 2013 | | |
| | | | | | | | | | | | | | | |
| $ | 28.45 | | | $ | 24.55 | | | $ | 22.15 | | | $ | 19.98 | | | $ | 15.60 | | |
| | | | | | | | | | | | | | | | | | | | |
| | | | | | | | | | | | | | | | | | | | |
| | 0.03 | | | | (0.01 | ) | | | (0.02 | ) | | | 0.07 | | | | (0.03 | ) | |
| | 5.16 | | | | 3.91 | | | | 2.42 | | | | 2.10 | | | | 4.42 | | |
| | 5.19 | | | | 3.90 | | | | 2.40 | | | | 2.17 | | | | 4.39 | | |
| | | | | | | | | | | | | | | | | | | | |
| | | | | | | | | | | | | | | | | | | | |
| | — | | | | — | | | | — | | | | — | | | | — | | |
| | — | | | | — | | | | — | | | | — | | | | (0.01 | ) | |
| | — | | | | — | | | | — | | | | — | | | | (0.01 | ) | |
| $ | 33.64 | | | $ | 28.45 | | | $ | 24.55 | | | $ | 22.15 | | | $ | 19.98 | | |
| | | | | | | | | | | | | | | | | | | | |
| | 18.24 | % | | | 15.89 | % | | | 10.84 | % | | | 10.86 | % | | | 28.19 | % | |
| | | | | | | | | | | | | | | | | | | | |
| | | | | | | | | | | | | | | | | | | | |
| $ | 177.42 | | | $ | 67.78 | | | $ | 54.13 | | | $ | 25.75 | | | $ | 9.07 | | |
| | 1.05 | % | | | 1.17 | % | | | 1.27 | % | | | 1.50 | % | | | 1.66 | % | |
| | 0.30 | % | | | (0.03 | )% | | | (0.08 | )% | | | 0.26 | % | | | (0.20 | )% | |
| | 0 | % | | | 5 | % | | | 21 | % | | | 22 | % | | | 6 | % | |
The accompanying notes are an integral part of these financial statements.
| HENNESSY FUNDS | 1-800-966-4354 | |
Financial Statements
Notes to the Financial Statements April 30, 2018 (Unaudited) |
1). ORGANIZATION
The Hennessy Japan Fund (the “Fund”) is a series of Hennessy Funds Trust (the “Trust”), which was organized as a Delaware statutory trust on September 17, 1992. The Fund is an open-end management investment company registered under the Investment Company Act of 1940, as amended. The investment objective of the Fund is long-term capital appreciation. The Fund is a diversified fund, but may employ a relatively focused investment strategy and may hold securities of fewer issuers than other diversified funds.
The Fund offers Investor Class and Institutional Class shares. Each class of shares differs principally in its respective 12b-1 distribution and service, shareholder servicing, and sub-transfer agent expenses. There are no sales charges. Each class has identical rights to earnings, assets, and voting privileges, except for class-specific expenses and exclusive rights to vote on matters affecting only an individual class.
As an investment company, the Fund follows the investment company accounting and reporting guidance of the Financial Accounting Standards Board (“FASB”) Accounting Standard Codification Topic 946 “Financial Services—Investment Companies.”
2). SIGNIFICANT ACCOUNTING POLICIES
The following is a summary of significant accounting policies consistently followed by the Fund in the preparation of the financial statements. These policies conform to U.S. generally accepted accounting principles (“GAAP”).
| a). | Investment Valuation – All investments in securities are recorded at their estimated fair value, as described in Note 3. |
| | |
| b). | Federal Income Taxes – No provision for federal income taxes or excise taxes has been made because the Fund has elected to be taxed as a “regulated investment company” and intends to distribute substantially all of its taxable income to its shareholders and otherwise comply with the provisions of the Internal Revenue Code of 1986, as amended, applicable to regulated investment companies. Net investment income/loss and realized gains/losses for federal income tax purposes may differ from those reported in the financial statements because of temporary book and tax basis differences. Temporary differences are primarily the result of the treatment of wash sales for tax reporting purposes. The Fund recognizes interest and penalties related to income tax benefits, if any, in the Statement of Operations as an income tax expense. Distributions from net realized gains for book purposes may include short-term capital gains, which are included as ordinary income to shareholders for tax purposes. The Fund may utilize equalization accounting for tax purposes and designate earnings and profits, including net realized gains distributed to shareholders on redemption of shares, as part of the dividends paid deduction for income tax purposes. |
| | |
| c). | Accounting for Uncertainty in Income Taxes – The Fund has accounting policies regarding recognition and measurement of tax positions taken or expected to be taken on a tax return. The tax returns of the Fund for the prior three fiscal years are open for examination. The Fund has reviewed all open tax years in major jurisdictions and concluded that there is no impact on the Fund’s net assets and no tax liability resulting from unrecognized tax benefits relating to uncertain income tax |
| NOTES TO THE FINANCIAL STATEMENTS |
| | positions taken or expected to be taken on a tax return. The Fund’s major tax jurisdictions are U.S. federal and Delaware. |
| | |
| d). | Income and Expenses – Dividend income is recognized on the ex-dividend date or as soon as information is available to the Fund. Interest income, which includes the amortization of premium and accretion of discount, is recognized on an accrual basis. The Fund is charged for those expenses that are directly attributable to the portfolio, such as advisory, administration, and certain shareholder service fees. Income, expenses (other than expenses attributable to a specific class), and realized and unrealized gains/losses on investments are allocated to each class of shares based on such class’s net assets. |
| | |
| e). | Distributions to Shareholders – Dividends from net investment income for the Fund, if any, are declared and paid annually, usually in December. Distributions of net realized capital gains, if any, are declared and paid annually, usually in December. |
| | |
| f). | Security Transactions – Investment and shareholder transactions are recorded on the trade date. The Fund determines the realized gain/loss from an investment transaction by comparing the original cost of the security lot sold with the net sale proceeds. Discounts and premiums on securities purchased are accreted or amortized, respectively, over the life of each such security. |
| | |
| g). | Use of Estimates – The preparation of financial statements in conformity with GAAP requires management to make estimates and assumptions that affect the reported amounts of assets and liabilities and disclosure of contingent assets and liabilities at the date of the financial statements and the reported change in net assets during the reporting period. Actual results could differ from those estimates. |
| | |
| h). | Share Valuation – The net asset value (“NAV”) per share of the Fund is calculated by dividing (i) the total value of the securities held by the Fund, plus cash and other assets, minus all liabilities (including estimated accrued expenses) by (ii) the total number of shares outstanding for the Fund, rounded to the nearest cent. The Fund’s shares will not be priced on days the New York Stock Exchange is closed for trading. The offering and redemption price per share for the Fund is equal to the Fund’s NAV per share. |
| | |
| i). | Foreign Currency – Values of investments denominated in foreign currencies are converted into U.S. dollars using the spot market rate of exchange at the time of valuation. Purchases and sales of investments and income are translated into U.S. dollars using the spot market rate of exchange prevailing on the respective dates of such transactions. The Fund does not isolate the portion of the results of operations resulting from fluctuations in foreign exchange rates on investments from fluctuations resulting from changes in the market prices of securities held. Such fluctuations are included with the net realized and unrealized gain/loss on investments. Foreign investments present additional risks due to currency fluctuations, economic and political factors, lower liquidity, government regulations, differences in accounting standards, and other factors. |
3). SECURITIES VALUATION
The Fund follows fair valuation accounting standards that establish an authoritative definition of fair value and set out a hierarchy for measuring fair value. These standards require additional disclosures about the various inputs and valuation techniques used to develop the measurements of fair value and a discussion of changes in valuation techniques and related inputs during the period. These inputs are summarized in the three broad levels listed below:
| HENNESSY FUNDS | 1-800-966-4354 | |
| | Level 1 – | Unadjusted, quoted prices in active markets for identical instruments that the Fund has the ability to access at the date of measurement. |
| | | |
| | Level 2 – | Other significant observable inputs (including, but not limited to, quoted prices in active markets for similar instruments, quoted prices in markets that are not active for identical or similar instruments, and model-derived valuations in which all significant inputs and significant value drivers are observable in active markets (such as interest rates, prepayment speeds, credit risk curves, default rates, and similar data)). |
| | | |
| | Level 3 – | Significant unobservable inputs (including the Fund’s own assumptions about what market participants would use to price the asset or liability based on the best available information) when observable inputs are unavailable. |
Following is a description of the valuation techniques applied to the Fund’s major categories of assets and liabilities measured at fair value on a recurring basis.
| | Equity Securities – Equity securities, including common stocks, preferred stocks, foreign-issued common stocks, exchange-traded funds, closed-end mutual funds, partnerships, rights, and real estate investment trusts, that are traded on a securities exchange for which a last-quoted sales price is readily available will generally be valued at the last sales price as reported by the primary exchange on which the securities are listed. Securities listed on The NASDAQ Stock Market (“NASDAQ”) will generally be valued at the NASDAQ Official Closing Price, which may differ from the last sales price reported. Securities traded on a securities exchange for which a last-quoted sales price is not readily available will generally be valued at the mean between the bid and ask prices. To the extent these securities are actively traded and valuation adjustments are not applied, they are classified in Level 1 of the fair value hierarchy. Securities traded on foreign exchanges generally are not valued at the same time the Fund calculates its NAV because most foreign markets close well before such time. The earlier close of most foreign markets gives rise to the possibility that significant events, including broad market moves, may have occurred in the interim. In certain circumstances, it may be determined that a security needs to be fair valued because it appears that the value of the security might have been materially affected by events occurring after the close of the market in which the security is principally traded, but before the time the Fund calculates its NAV, such as by a development that affects an entire market or region (e.g., a weather-related event) or a potentially global development (e.g., a terrorist attack that may be expected to have an effect on investor expectations worldwide). |
| | |
| | Registered Investment Companies – Investments in registered investment companies (e.g., mutual funds) are generally priced at the ending NAV provided by the applicable registered investment company’s service agent and will be classified in Level 1 of the fair value hierarchy. |
| | |
| | Debt Securities – Debt securities, including corporate bonds, asset-backed securities, mortgage-backed securities, municipal bonds, U.S. Treasuries, and U.S. government agency issues, are generally valued at market on the basis of valuations furnished by an independent pricing service that utilizes both dealer-supplied valuations and formula-based techniques. The pricing service may consider recently executed transactions in securities of the issuer or comparable issuers, market price quotations (where observable), bond spreads, and fundamental data relating to the issuer. In addition, the model may incorporate observable market data, such as reported sales of similar securities, broker quotes, yields, bids, offers, and reference data. Certain securities are valued primarily using dealer quotations. These securities are generally classified in Level 2 of the fair value hierarchy. |
| NOTES TO THE FINANCIAL STATEMENTS |
| | Short-Term Securities – Short-term equity investments, including money market funds, are valued in the manner specified above. Short-term debt investments with an original term to maturity of 60 days or less are valued at amortized cost, which approximates fair market value. If the original term to maturity of a short-term debt investment exceeded 60 days, then the values as of the 61st day prior to maturity are amortized. Amortized cost is not used if its use would be inappropriate due to credit or other impairments of the issuer, in which case the security’s fair value would be determined, as described below. Short-term securities are generally classified in Level 1 or Level 2 of the fair market hierarchy depending on the inputs used and market activity levels for specific securities. |
The Board of Trustees of the Fund (the “Board”) has adopted fair value pricing procedures that are followed when a price for a security is not readily available or if a significant event has occurred that indicates the closing price of a security no longer represents the true value of that security. Fair value pricing determinations are made in good faith in accordance with these procedures. There are numerous criteria that will be given consideration in determining a fair value of a security, such as the trading volume of a security and markets, the values of other similar securities, and news events with direct bearing on a security or markets. Fair value pricing results in an estimated price for a security that reflects the amount the Fund might reasonably expect to receive in a current sale. Depending on the relative significance of the valuation inputs, these securities may be classified in either Level 2 or Level 3 of the fair value hierarchy.
The fair valuation of foreign securities may be determined with the assistance of a pricing service using correlations between the movement of prices of such securities and indices of domestic securities and other appropriate indicators, such as closing market prices of relevant American Depositary Receipts or futures contracts. The effect of using fair value pricing is that the Fund’s NAV will reflect the affected portfolio securities’ values as determined by the Board or its designee instead of being determined by the market. Using a fair value pricing methodology to price a foreign security may result in a value that is different from such foreign security’s most recent closing price and from the value used by other investment companies to calculate their NAVs. Such securities are generally classified in Level 2 of the fair valuation hierarchy. Because the Fund may invest in foreign securities, the value of the Fund’s portfolio securities may change on days when you will not be able to purchase or redeem your shares.
The Board has delegated day-to-day valuation matters to a Valuation Committee comprised of one or more representatives from Hennessy Advisors, Inc., the Fund’s investment advisor (the “Advisor”). The function of the Valuation Committee is to value securities where current and reliable market quotations are not readily available. All actions taken by the Valuation Committee are reviewed by the Board.
The Fund has performed an analysis of all existing investments to determine the significance and character of all inputs to their fair value determinations. Various inputs are used to determine the value of the Fund’s investments. The inputs or methodology used for valuing securities are not necessarily an indication of the risk associated with investing in those securities. Details related to the fair valuation hierarchy of the Fund’s securities as of April 30, 2018, are included in the Schedule of Investments.
4). INVESTMENT TRANSACTIONS
Purchases and sales of investment securities (excluding government and short-term investments) for the Fund during the six months ended April 30, 2018, were $159,099,983 and $2,744,713, respectively.
| HENNESSY FUNDS | 1-800-966-4354 | |
There were no purchases or sales/maturities of long-term U.S. government securities for the Fund during the six months ended April 30, 2018.
The Fund is permitted to purchase or sell securities from or to another fund in the Hennessy Funds family of funds (the “Hennessy Funds”) under specified conditions outlined in procedures adopted by the Board. The procedures have been designed to ensure that any purchase or sale of securities by the Fund from or to another Hennessy Fund complies with Rule 17a-7 of the Investment Company Act of 1940, as amended. During the six months ended April 30, 2018, the Fund did not engage in purchases or sales of securities pursuant to Rule 17a-7 of the Investment Company Act of 1940, as amended.
5). INVESTMENT MANAGEMENT FEE AND OTHER TRANSACTIONS WITH AFFILIATES
The Advisor provides the Fund with investment management services under an Investment Advisory Agreement. The Advisor furnishes all investment advice, office space, and facilities, as well as most of the personnel needed by the Fund. As compensation for its services, the Advisor is entitled to a monthly fee from the Fund. The fee is based upon the average daily net assets of the Fund at an annual rate of 0.80%, effective as of March 1, 2016. Prior to that date, the annual rate was 1.00%. The net investment advisory fees expensed by the Fund during the six months ended April 30, 2018, are included in the Statement of Operations.
The Advisor has delegated the day-to-day management of the Fund to a sub-advisor, SPARX Asset Management Co., Ltd. The Advisor pays the sub-advisory fees from its own assets, and these fees are not an additional expense of the Fund. For the most recent fiscal year, the Advisor (not the Fund) paid a sub-advisory fee, based upon the daily net assets of the Fund, at the rate of 0.35%. Effective February 28, 2018, the Advisor amended the sub-advisory agreement with SPARX Asset Management Co., Ltd. to increase the sub-advisory fee to 0.40% of daily net assets between $500 million and $1 billion and 0.42% of daily net assets over $1 billion. The sub-advisory fee for the first $500 million of daily net assets remained at 0.35%. The Fund currently has less than $500 million of daily net assets.
The Board has approved a Shareholder Servicing Agreement for Investor Class shares of the Fund, which was instituted to compensate the Advisor for the non-investment management services it provides to the Fund. The Shareholder Servicing Agreement provides for a monthly fee paid to the Advisor at an annual rate of 0.10% of the average daily net assets of the Fund attributable to Investor Class shares. The shareholder service fees expensed by the Fund during the six months ended April 30, 2018, are included in the Statement of Operations.
The Fund has adopted a plan pursuant to Rule 12b-1 under the Investment Company Act of 1940, as amended, that authorizes payments in connection with the distribution of the Fund’s shares at an annual rate of up to 0.25% of the Fund’s average daily net assets attributable to Investor Class shares. Even though the authorized rate is up to 0.25%, the Fund is currently only using up to 0.15% of its average daily net assets attributable to Investor Class shares for such purpose. Amounts paid under the plan may be spent on any activities or expenses primarily intended to result in the sale of shares, including, but not limited to, advertising, shareholder account servicing, the printing and mailing of prospectuses to other than current shareholders, the printing and mailing of sales literature, and compensation for sales and marketing activities or to financial institutions and others, such as dealers and distributors. The distribution fees expensed by the Fund during the six months ended April 30, 2018, are included in the Statement of Operations.
The Fund has entered into agreements with various brokers, dealers, and financial intermediaries in connection with the sale of shares of the Fund. The agreements provide for periodic payments by the Fund to the brokers, dealers, and financial intermediaries
HENNESSYFUNDS.COM
| NOTES TO THE FINANCIAL STATEMENTS |
for providing certain shareholder maintenance services (sub-transfer agent expenses). These shareholder services include the pre-processing and quality control of new accounts, shareholder correspondence, answering customer inquiries regarding account status, and facilitating shareholder telephone transactions. The sub-transfer agent fees expensed by the Fund during the six months ended April 30, 2018, are included in the Statement of Operations.
U.S. Bancorp Fund Services, LLC (“USBFS”) provides the Fund with administrative, fund accounting, and transfer agent services. As administrator, USBFS is responsible for activities such as (i) preparing various federal and state regulatory filings, reports, and returns for the Fund, (ii) preparing reports and materials to be supplied to the Board, (iii) monitoring the activities of the Fund’s custodian, transfer agent, and accountants, and (iv) coordinating the preparation and payment of the Fund’s expenses and reviewing the Fund’s expense accruals. U.S. Bank N.A., an affiliate of USBFS, serves as the Fund’s custodian. The servicing agreements between the Trust and USBFS and U.S. Bank N.A. contain a fee schedule that is inclusive of administrative, fund accounting, custody, and transfer agent fees. The administrative, fund accounting, custody, and transfer agent fees expensed by the Fund during the six months ended April 30, 2018, are included in the Statement of Operations.
Quasar Distributors, LLC acts as the Fund’s principal underwriter in a continuous public offering of the Fund’s shares. Quasar Distributors, LLC is an affiliate of USBFS and U.S. Bank N.A.
The officers of the Fund are affiliated with the Advisor. Such officers, with the exception of the Chief Compliance Officer and the Senior Compliance Officer, receive no compensation from the Fund for serving in their respective roles. The Fund, along with the other Hennessy Funds, makes reimbursement payments, on an equal basis, to the Advisor for a portion of the salary and benefits associated with the office of the Chief Compliance Officer and for all of the salary and benefits associated with the office of the Senior Compliance Officer. The compliance fees expensed by the Fund during the six months ended April 30, 2018, are included in the Statement of Operations.
6). GUARANTEES AND INDEMNIFICATIONS
Under the Hennessy Funds’ organizational documents, their officers and trustees are indemnified by the Hennessy Funds against certain liabilities arising out of the performance of their duties to the Hennessy Funds. Additionally, in the normal course of business, the Hennessy Funds enter into contracts with service providers that contain general indemnification clauses. The Fund’s maximum exposure under these arrangements is unknown as this would involve future claims that may be made against the Fund that have not yet occurred. Currently, the Fund expects the risk of loss to be remote.
7). LINE OF CREDIT
The Fund has an uncommitted line of credit with the other Hennessy Funds in the amount of the lesser of (i) $100,000,000 or (ii) 33.33% of each Hennessy Fund’s net assets, or 30% for the Hennessy Gas Utility Fund and 10% for the Hennessy Balanced Fund, intended to provide short-term financing, if necessary, subject to certain restrictions, in connection with shareholder redemptions. The credit facility is with the Hennessy Funds’ custodian bank, U.S. Bank N.A. Borrowings under this arrangement bear interest at the bank’s prime rate and are secured by all of the Fund’s assets (as to its own borrowings only). During the six months ended April 30, 2018, the Fund did not have any borrowings outstanding under the line of credit.
| HENNESSY FUNDS | 1-800-966-4354 | |
8). FEDERAL TAX INFORMATION
As of October 31, 2017, the Fund’s most recent fiscal year end, the components of accumulated earnings (losses) for income tax purposes were as follows:
| | | Investments | |
| Cost of investments for tax purposes | | $ | 188,621,761 | |
| Gross tax unrealized appreciation | | $ | 76,695,159 | |
| Gross tax unrealized depreciation | | | (3,717,389 | ) |
| Net tax unrealized appreciation | | $ | 72,977,770 | |
| Undistributed ordinary income | | $ | — | |
| Undistributed long-term capital gains | | | — | |
| Total distributable earnings | | $ | — | |
| Other accumulated loss | | $ | (6,247,156 | ) |
| Total accumulated gain | | $ | 66,730,614 | |
The difference between book-basis unrealized appreciation/depreciation (as shown in the Statement of Assets and Liabilities) and tax-basis unrealized appreciation/depreciation (as shown above) is attributable primarily to wash sales.
As of October 31, 2017, the Fund’s most recent fiscal year end, the Fund had capital loss carryforwards that expire as follows:
| $6,121,138 | | October 31, 2018 | |
| $ 109,149 | | Unlimited Short-Term | |
Capital losses sustained in fiscal year 2012 and in future taxable years will not expire and may be carried over by the Fund without limitation; however, they will retain the character of the original loss. Furthermore, any loss incurred during those taxable years will be required to be utilized prior to the losses incurred in taxable years prior to 2012. As a result of this ordering rule, pre-enactment capital loss carryforwards may be more likely to expire unused. Under pre-enactment law, capital losses could be carried forward for eight years, and carried forward as short-term capital losses, irrespective of the character of the original loss.
As of October 31, 2017, the Fund’s most recent fiscal year end, the Fund did not defer, on a tax basis, any late-year ordinary losses. Late-year ordinary losses are net ordinary losses incurred after December 31, 2016, but within the taxable year, that are deemed to arise on the first day of the Fund’s next taxable year.
During fiscal year 2018 (year to date) and fiscal year 2017, the tax character of distributions paid by the Fund was as follows:
| | | Six Months Ended | | | Year Ended | |
| | | April 30, 2018 | | | October 31, 2017 | |
Ordinary income(1) | | $ | 208,530 | | | $ | — | |
| Long-term capital gain | | | — | | | | — | |
| | | $ | 208,530 | | | $ | — | |
(1) Ordinary income includes short-term gain/loss.
9). EVENTS SUBSEQUENT TO PERIOD END
Management has evaluated the Fund’s related events and transactions that occurred subsequent to April 30, 2018, through the date of issuance of the Fund’s financial statements. Management has determined that there were no subsequent events requiring recognition or disclosure in the financial statements.
HENNESSYFUNDS.COM
| NOTES TO THE FINANCIAL STATEMENTS |
(This Page Intentionally Left Blank.)
| HENNESSY FUNDS | 1-800-966-4354 | |
Expense Example (Unaudited)
April 30, 2018
As a shareholder of the Fund, you incur two types of costs: (1) transaction costs, including sales charges (loads) on purchase payments, reinvested dividends, or other distributions; redemption fees; and exchange fees; and (2) ongoing costs, including management fees; service fees; and other Fund expenses. This Example is intended to help you understand your ongoing costs (in dollars) of investing in the Fund and to compare these costs with the ongoing costs of investing in other mutual funds. The Example is based on an investment of $1,000 invested at the beginning of the period and held for the entire period from November 1, 2017, through April 30, 2018.
Actual Expenses
The first line of the table below under the “Investor Class” and “Institutional Class” headings provides information about actual account values and actual expenses. Although the Fund charges no sales loads or transaction fees, you will be assessed fees for outgoing wire transfers, returned checks and stop payment orders at prevailing rates charged by U.S. Bancorp Fund Services, LLC, the Fund’s transfer agent. If you request that a redemption be made by wire transfer, currently a $15 fee is charged by the Fund’s transfer agent. IRA accounts will be charged a $15 annual maintenance fee. The example below includes, but is not limited to, management fees, shareholder servicing fees, fund accounting, custody, and transfer agent fees. However, the example below does not include portfolio trading commissions and related expenses, and other extraordinary expenses as determined under generally accepted accounting principles. You may use the information in this line, together with the amount you invested, to estimate the expenses that you paid over the period. Simply divide your account value by $1,000 (for example, an $8,600 account value divided by $1,000 = 8.6), then multiply the result by the number in the first line of the table under the “Investor Class” or “Institutional Class” headings in the column entitled “Expenses Paid During Period” to estimate the expenses you paid on your account during this period.
Hypothetical Example for Comparison Purposes
The second line of the table below under the “Investor Class” and “Institutional Class” headings provides information about hypothetical account values and hypothetical expenses based on the Fund’s actual expense ratios and an assumed rate of return of 5% per year before expenses, which is not the Fund’s actual return. The hypothetical account values and expenses may not be used to estimate the actual ending account balance or expenses you paid for the period. You may use this information to compare the ongoing costs of investing in the Fund and other funds. To do so, compare this 5% hypothetical example with the 5% hypothetical examples that appear in the shareholder reports of the other funds. Please note that the expenses shown in the table are meant to highlight your ongoing costs only and do not reflect any transactional costs, such as sales charges (loads), or exchange fees. Therefore, the second line of the table under the “Investor Class” and “Institutional Class” headings is useful in comparing ongoing costs only, and will not help you determine the relative total costs of owning different funds. In addition, if these transactional costs were included, your costs would have been higher.
HENNESSYFUNDS.COM
| | | | Expenses Paid |
| | Beginning | Ending | During Period(1) |
| | Account Value | Account Value | November 1, 2017 – |
| | November 1, 2017 | April 30, 2018 | April 30, 2018 |
| Investor Class | | | |
| Actual | $1,000.00 | $1,076.50 | $7.31 |
| Hypothetical (5% return before expenses) | $1,000.00 | $1,017.75 | $7.10 |
| | | | |
| Institutional Class | | | |
| Actual | $1,000.00 | $1,079.00 | $5.15 |
| Hypothetical (5% return before expenses) | $1,000.00 | $1,019.84 | $5.01 |
(1) | Expenses are equal to the Fund’s expense ratio of 1.42% for Investor Class shares or 1.00% for Institutional Class shares, as applicable, multiplied by the average account value over the period, multiplied by 181/365 days (to reflect one-half year period). |
| HENNESSY FUNDS | 1-800-966-4354 | |
How to Obtain a Copy of the Fund’s
Proxy Voting Policy and Proxy Voting Records
A description of the policies and procedures the Fund uses to determine how to vote proxies relating to portfolio securities is available without charge (1) by calling 1-800-966-4354, (2) on the Hennessy Funds’ website at hennessyfunds.com/proxy-voting/voting-policy, or (3) on the U.S. Securities and Exchange Commission’s (the “SEC”) website at www.sec.gov. The Fund’s proxy voting record is available without charge on both the Hennessy Funds’ website at hennessyfunds.com/proxy-voting/voting-record and the SEC’s website at www.sec.gov no later than August 31 for the prior 12 months ending June 30.
Quarterly Filings on Form N-Q
The Fund files a complete schedule of portfolio holdings with the SEC for the first and third quarters of each fiscal year on Form N-Q. The Fund’s Forms N-Q are available on the SEC’s website at www.sec.gov. The Fund’s Forms N-Q may be reviewed and copied at the SEC’s Public Reference Room in Washington, DC and information on the operation of the Public Reference Room may be obtained by calling 1-800-SEC-0330. Information included in the Fund’s Forms N-Q will also be available upon request by calling 1-800-966-4354.
Important Notice Regarding Delivery of
Shareholder Documents
To help keep the Fund’s costs as low as possible, we generally deliver a single copy of shareholder reports, proxy statements, and prospectuses to shareholders who share an address and have the same last name. This process does not apply to account statements. You may request an individual copy of a shareholder document at any time. If you would like to receive separate mailings of shareholder documents, please call U.S. Bancorp Fund Services, LLC at 1-800-261-6950 or 1-414-765-4124, and individual delivery will begin within 30 days of your request. If your account is held through a financial institution or other intermediary, please contact such intermediary directly to request individual delivery.
HENNESSYFUNDS.COM
| PROXY VOTING — BOARD APPROVAL OF INVESTMENT ADVISORY AGREEMENTS |
Board Approval of Investment Advisory
Agreements
At a special meeting on February 21, 2018, the Board of Trustees of the Fund (the “Board,” and the members thereof, the “Trustees”) unanimously approved an amendment to the sub-advisory agreement of the Fund between Hennessy Advisors, Inc. (the “Advisor”) and SPARX Asset Management Co., Ltd. (the “Sub-Advisor”). In advance of the meeting, the Advisor sent detailed information to the Trustees to assist them in the evaluation of the proposed amendment to the sub-advisory agreement. The information provided to and considered by the Trustees was substantially similar to the information provided to and considered by the Trustees at the meeting held March 7, 2018, which is described below. In addition, the factors discussed by the Trustees and the material considerations and determinations of the Trustees were substantially similar to the factors discussed and the material considerations and determinations of the Trustees at the meeting held March 7, 2018, which is described below. The Trustees who are not deemed “interested persons” (as defined by the Investment Company Act of 1940, as amended) of the Fund (the “Independent Trustees”) met in executive session to discuss the approval of the amendment to the sub-advisory agreement.
After reviewing the materials provided at the meeting and management’s presentation, as well as other information regularly provided at the Board’s quarterly meetings throughout the year regarding the quality of services provided by the Sub-Advisor, the performance of the Fund, expense information, regulatory compliance issues, trading information and related matters, and other factors that the Trustees deemed relevant, the Trustees, including the Independent Trustees, approved the amendment to the sub-advisory agreement.
At its meeting on March 7, 2018, the Board unanimously approved the continuation of the investment advisory agreement of the Fund with the Advisor and the sub-advisory agreement of the Fund between the Advisor and the Sub-Advisor. As part of the process of approving the continuation of the advisory and sub-advisory agreements, the Trustees reviewed their fiduciary duties with respect to approving the advisory and sub-advisory agreements and the relevant factors for them to consider. In addition, the Independent Trustees met in executive session to discuss the approval of the advisory and sub-advisory agreements.
In advance of the meeting, the Advisor sent detailed information to the Trustees to assist them in their evaluation of the advisory and sub-advisory agreements. This information included, but was not limited to, the following:
| | (1) | A memorandum from outside legal counsel that described the fiduciary duties of the Board with respect to approving the continuation of the advisory and sub-advisory agreements and the relevant factors for consideration; |
| | | |
| | (2) | A memorandum from the Advisor that listed the factors relevant to the Board’s approval of the continuation of the advisory and sub-advisory agreements and also referenced the documents that had been provided to help the Board assess each such factor; |
| | | |
| | (3) | An inventory of the range of services provided by the Advisor and the Sub-Advisor to the Fund; |
| | | |
| | (4) | A written discussion of economies of scale; |
| HENNESSY FUNDS | 1-800-966-4354 | |
| | (5) | The advisory and sub-advisory agreements; |
| | | |
| | (6) | A recent Fund fact sheet, which included, among other things, performance information over various periods; |
| | | |
| | (7) | A peer expense comparison of both the net expense ratio and investment advisory fee of the Fund; |
| | | |
| | (8) | The Advisor’s most recent Form 10-K and Form 10-Q, which includes information about the Advisor’s profitability; |
| | | |
| | (9) | Information about brokerage commissions; |
| | | |
| | (10) | Information about the Fund’s compliance program; |
| | | |
| | (11) | The Advisor’s current Form ADV Part I; |
| | | |
| | (12) | A completed questionnaire from the Sub-Advisor and summary thereof; |
| | | |
| | (13) | The Sub-Advisor’s Code of Ethics; |
| | | |
| | (14) | The Sub-Advisor’s Form ADV Parts I and II; and |
| | | |
| | (15) | Financial information of the Sub-Advisor’s parent company. |
All of the factors discussed were considered as a whole by the Trustees, and also by the Independent Trustees meeting in executive session. The factors were viewed in their totality by the Trustees, with no single factor being the principal or determinative factor in the Trustees’ determination of whether to approve the continuation of the advisory and sub-advisory agreements. The Trustees recognized that the management and fee arrangements for the Fund are the result of years of review and discussion between the Independent Trustees and the Advisor, that certain aspects of such arrangements may receive greater scrutiny in some years than in others, and that the Trustees’ conclusions may be based, in part, on their consideration of these same arrangements and information received during the course of the year and in prior years.
Prior to approving the continuation of the advisory and sub-advisory agreements, the Trustees, including the Independent Trustees in executive session, considered, among other items:
| | (1) | The nature and quality of the advisory services provided by the Advisor and the Sub-Advisor; |
| | | |
| | (2) | A comparison of the fees and expenses of the Fund to other similar funds; |
| | | |
| | (3) | Whether economies of scale are recognized by the Fund; |
| | | |
| | (4) | The costs and profitability of the Fund to the Advisor and the Sub-Advisor; |
| | | |
| | (5) | The performance of the Fund; and |
| | | |
| | (6) | Any benefits to the Advisor and the Sub-Advisor from serving as an investment advisor to the Fund (other than the advisory and sub-advisory fees). |
The material considerations and determinations of the Trustees, including the Independent Trustees, were as follows:
| | (1) | The Trustees considered the services identified below that are provided by the Advisor. Based on this review, the Trustees concluded that the Advisor provides high-quality services to the Fund, and they noted that their overall confidence in the Advisor is high. The Trustees also concluded that they were satisfied with the nature, extent, and quality of the advisory services provided to the Fund by the Advisor, and that the nature and extent of the services provided by the Advisor are appropriate to assure that the Fund’s operations are conducted in compliance with applicable laws, rules, and regulations. |
| BOARD APPROVAL OF INVESTMENT ADVISORY AGREEMENTS |
| | | (a) | The Advisor oversees the Sub-Advisor for the Fund, and the Sub-Advisor acts as the portfolio manager for the Fund. |
| | | | |
| | | (b) | The Advisor performs a daily reconciliation of portfolio positions and cash for the Fund. |
| | | | |
| | | (c) | The Advisor monitors the Fund’s compliance with its investment objectives and restrictions. |
| | | | |
| | | (d) | The Advisor monitors compliance with federal securities laws and performs activities such as maintaining a compliance program, conducting ongoing reviews of the compliance programs of the Sub-Advisor and the Fund’s other service providers, conducting on-site visits to the Sub-Advisor and the Fund’s other service providers, monitoring incidents of abusive trading practices, reviewing Fund expense accruals, payments, and fixed expense ratios, evaluating insurance providers for fidelity bond coverage and D&O/E&O insurance coverage, conducting employee compliance training, reviewing reports provided by service providers, maintaining books and records, and preparing an annual compliance report for the Board. |
| | | | |
| | | (e) | The Advisor oversees the selection and continued employment of the Sub-Advisor, reviews the Fund’s investment performance, and monitors the Sub-Advisor’s adherence to the Fund’s investment objectives, policies, and restrictions. |
| | | | |
| | | (f) | The Advisor oversees service providers that provide accounting, administration, distribution, transfer agency, custodial, sales, marketing, public relations, audit, information technology, and legal services to the Fund. |
| | | | |
| | | (g) | The Advisor maintains in-house marketing and distribution departments on behalf of the Fund. |
| | | | |
| | | (h) | The Advisor is actively involved with preparing regulatory filings for the Fund, including writing and annually updating the Fund’s prospectus and related documents. |
| | | | |
| | | (i) | The Advisor reviews the written summary prepared by the Sub-Advisor of the Fund’s performance for the most recent 12-month period for each annual report of the Fund. |
| | | | |
| | | (j) | The Advisor oversees distribution of the Fund through third-party broker/dealers and independent financial institutions such as Charles Schwab, Inc., Fidelity, TD Waterhouse, and Pershing. The Advisor participates in “no transaction fee” (“NTF”) programs with these companies on behalf of the Fund, which allow customers to purchase the Fund through third-party distribution channels without paying a transaction fee. The Advisor compensates, in part, a number of these third-party providers of NTF programs out of its own revenues. |
| | | | |
| | | (k) | The Advisor pays the incentive compensation of the Fund’s compliance officers and employs other staff, such as legal, marketing, national accounts, distribution, sales, administrative, and trading oversight personnel, as well as management executives. |
| | | | |
| | | (l) | The Advisor provides a quarterly compliance certification to the Board. |
| HENNESSY FUNDS | 1-800-966-4354 | |
| | | (m) | The Advisor prepares or reviews Board materials, frequently presents to the Board or leads Board discussions, prepares or reviews meeting minutes, and arranges for Board training and education. |
| | (2) | The Trustees considered the services identified below that are provided by the Sub-Advisor: |
| | | (a) | The Sub-Advisor acts as the portfolio manager for the Fund. In this capacity, the Sub-Advisor does the following: |
| | | | (i) | manages the composition of the Fund’s portfolio, including the purchase, retention, and disposition of portfolio securities in accordance with the Fund’s investment objectives, policies, and restrictions; |
| | | | | |
| | | | (ii) | ensures compliance with “best execution” for the Fund’s portfolio; and |
| | | | | |
| | | | (iii) | manages proxy voting for the Fund. |
| | | (b) | The Sub-Advisor ensures that its compliance program includes policies and procedures relevant to the Fund and the Sub-Advisor’s duties as a portfolio manager to the Fund. |
| | | | |
| | | (c) | The Sub-Advisor prepares a written summary of the Fund’s performance for the most recent 12-month period for each annual report of the Fund. |
| | | | |
| | | (d) | The Sub-Advisor provides a quarterly compliance certification to the Board regarding trading and allocation practices, supervisory matters, the Sub-Advisor’s compliance program (including its code of ethics), compliance with the Fund’s policies, and general firm updates. |
| | (3) | The Trustees considered the distinction between the services performed by the Advisor and the Sub-Advisor. The Trustees noted that the management of the Fund, including the oversight of the Sub-Advisor, involves more comprehensive and substantive duties than the duties of the Sub-Advisor. Specifically, the Trustees considered the lists of services identified above and concluded that the services performed by the Advisor for the Fund require a higher level of service and oversight than the services performed by the Sub-Advisor. Based on this determination, the Trustees concluded that the differential in advisory fees between the Advisor and the Sub-Advisor is reasonable. |
| | | |
| | (4) | The Trustees compared the performance of the Fund to benchmark indices over various time periods and also noted that the Trustees review and discuss reports comparing the investment performance of the Fund to various indices at each quarterly Board meeting. Based on all such information, the Trustees believe that the Advisor and the Sub-Advisor manage the Fund in a manner that is materially consistent with its stated investment objective and style. The Trustees concluded that the performance of the Fund over various time periods warranted the continuation of the advisory and sub-advisory agreements. |
| | | |
| | (5) | The Trustees reviewed the advisory fees and overall expense ratios of the Fund compared to other funds similar in asset size and investment objective to the Fund using data from Morningstar. As part of the discussion with management, the Trustees ensured that they understood and were comfortable with the criteria used to determine the mutual funds included in the Morningstar categories for purposes of the materials considered at the meeting. The Trustees determined that the advisory fee and overall expense ratio of the Fund falls within the range of the advisory fees and overall expense ratios of other |
| BOARD APPROVAL OF INVESTMENT ADVISORY AGREEMENTS |
| | | comparable funds and concluded that they are reasonable and warranted continuation of the advisory and sub-advisory agreements. |
| | | |
| | (6) | The Trustees also considered whether economies of scale were being realized by the Advisor that should be shared with the Fund’s shareholders. The Trustees noted that many of the expenses incurred to manage the Fund are asset-based fees and thus do not result in material economies of scale being realized as the assets of the Fund increase. For example, mutual fund platform fees increase as the Fund’s assets grow. The Trustees also considered the Advisor’s efforts to contain expenses, the Advisor’s significant marketing efforts to promote the Funds, and the Advisor’s agreement to waive fees or lower its management fees in certain circumstances. The Trustees noted that at current asset levels it did not appear that there were economies of scale being realized by the Advisor and concluded that it would continue to monitor economies of scale in the future as circumstances changed. |
| | | |
| | (7) | The Trustees considered the profitability of the Advisor and the Sub-Advisor, including the impact of mutual fund platform fees on the Advisor’s profitability, and also considered the resources and revenues that the Advisor has put into managing and distributing the Fund. The Trustees then concluded that the profits of the Advisor and the Sub-Advisor are reasonable and not excessive when compared to profitability guidelines set forth in relevant court cases. |
| | | |
| | (8) | The Trustees considered the high level of professionalism and knowledge of the Advisor’s employees, along with a very low level of turnover, and concluded that this was beneficial to the Fund and its shareholders. |
| | | |
| | (9) | The Trustees considered any benefits to the Advisor and the Sub-Advisor from serving as an advisor to the Fund (other than the advisory and sub-advisory fees). The Trustees noted that the Advisor and the Sub-Advisor may derive ancillary benefits from, by way of example, their association with the Fund in the form of proprietary and third-party research products and services received from broker-dealers that execute portfolio trades for the Fund. The Trustees determined that any such products and services have been used for legitimate purposes relating to the Fund by providing assistance in the investment decision-making process. The Trustees concluded that any additional benefits realized by the Advisor and the Sub-Advisor from their relationship with the Fund were reasonable. |
After reviewing the materials provided at the meeting and management’s presentation, as well as other information regularly provided at the Board’s quarterly meetings throughout the year regarding the quality of services provided by the Advisor and the Sub-Advisor, the performance of the Fund, expense information, regulatory compliance issues, trading information and related matters, and other factors that the Trustees deemed relevant, the Trustees, including the Independent Trustees, approved the continuation of the advisory and sub-advisory agreements.
| HENNESSY FUNDS | 1-800-966-4354 | |
(This Page Intentionally Left Blank.)
For information, questions or assistance, please call
The Hennessy Funds
1-800-966-4354 or 1-415-899-1555
INVESTMENT ADVISOR
Hennessy Advisors, Inc.
7250 Redwood Boulevard, Suite 200
Novato, California 94945
ADMINISTRATOR,
TRANSFER AGENT,
DIVIDEND PAYING AGENT &
SHAREHOLDER SERVICING AGENT
U.S. Bancorp Fund Services, LLC
P.O. Box 701
Milwaukee, Wisconsin 53201-0701
CUSTODIAN
U.S. Bank N.A.
Custody Operations
1555 North River Center Drive, Suite 302
Milwaukee, Wisconsin 53212
TRUSTEES
Neil J. Hennessy
Robert T. Doyle
J. Dennis DeSousa
Gerald P. Richardson
COUNSEL
Foley & Lardner LLP
777 East Wisconsin Avenue
Milwaukee, Wisconsin 53202-5306
INDEPENDENT REGISTERED
PUBLIC ACCOUNTING FIRM
Tait, Weller & Baker LLP
1818 Market Street, Suite 2400
Philadelphia, Pennsylvania 19103
DISTRIBUTOR
Quasar Distributors, LLC
777 East Wisconsin Avenue
Milwaukee, Wisconsin 53202
hennessyfunds.com | 1-800-966-4354
This report has been prepared for shareholders and may be distributed to
others only if preceded or accompanied by a current prospectus.
SEMI-ANNUAL REPORT
APRIL 30, 2018
HENNESSY JAPAN SMALL CAP FUND
Investor Class HJPSX
Institutional Class HJSIX
hennessyfunds.com | 1-800-966-4354
(This Page Intentionally Left Blank.)
Contents
| Letter to Shareholders | 2 |
| Performance Overview | 4 |
| Financial Statements | |
| Schedule of Investments | 5 |
| Statement of Assets and Liabilities | 10 |
| Statement of Operations | 11 |
| Statements of Changes in Net Assets | 13 |
| Financial Highlights | 14 |
| Notes to the Financial Statements | 17 |
| Expense Example | 24 |
| Proxy Voting Policy and Proxy Voting Records | 26 |
| Quarterly Schedule of Investments | 26 |
| Federal Tax Distribution Information | 26 |
| Important Notice Regarding Delivery of Shareholder Documents | 26 |
| Board Approval of Investment Advisory Agreements | 27 |
| HENNESSY FUNDS | 1-800-966-4354 | |
May 2018
Dear Hennessy Funds Shareholder:
During the six-month period ended April 30, 2018, the Japanese stock market, as measured by the Tokyo Stock Price Index (TOPIX), rose by 5.67% (in U.S. Dollar terms).
The Japanese stock market showed robust performance over the first half of the period, supported by favorable midterm earnings results from Japanese companies, a stable yen and evidence of continued economic growth. Strong performance from U.S. equities, boosted by the passage of the Tax Reform bill lowering corporate taxes, also helped fuel investor confidence in Japanese stocks. However, Japanese equity prices dropped in the second half of the period as the imposition of trade tariffs by the U.S. set off fears of an international trade war and led to a slump in equity prices worldwide. The yen also strengthened in response to the perception of higher risk globally, contributing to the decline in equities. Additionally, the perception that the Bank of Japan was starting to move towards a slightly tighter monetary policy also disturbed investors. In the political arena, the decline in support for the Abe administration caused by a scandal involving the sale of land for a kindergarten school may have influenced the stock market’s fall. However, upward price movements in April suggest that more positive market sentiment is returning, especially for larger cap companies.
We believe Japan is slowly emerging from its long period of deflation. Although an inflation rate of 2% will be hard to reach in the short term, we believe keeping the consumer price index (CPI) rising at a rate of about 1% is much more achievable and will help change expectations regarding inflation. In the latest reading, inflation edged up to 1.1% in March 2018.
In our opinion, corporate earnings growth is the main factor driving the Japanese stock market higher. During the country’s tough deflationary years, Japanese companies were forced to restructure, close plants, and reduce employee headcount to survive. These moves increased the efficiency of Japan’s corporate sector. As a result, Japanese companies today are highly profitable, internationally competitive, and are generating strong corporate earnings growth. We believe earnings growth will continue to be robust, supporting further advances in the equity market.
We believe the structural reform program is progressing well. Over the last few years, the Liberal Democratic Party’s administration has implemented scores of structural reforms affecting the tax code, the labor market, and corporate governance. Recently, the government has been discussing the introduction of an element of meritocracy for white collar employment in an effort to improve labor productivity. Proposals under consideration include the idea that highly skilled workers be paid on the basis of work produced rather than hours worked. New revisions to the corporate governance code are also being discussed. Under the new guidelines, companies would have to publish a management succession plan, meet diversity criteria in their boardrooms, and justify non-strategic crossholdings between companies.
HENNESSYFUNDS.COM
We remain optimistic about the long-term prospects for Japan and its stock market. Thank you for your continued confidence and investment in the Hennessy Funds.
Sincerely,
| |
| Tadahiro Fujimura | Masakazu Takeda |
| Portfolio Manager, | Portfolio Manager, |
| Hennessy Japan Small Cap Fund; | Hennessy Japan Fund; |
| Chief Investment Officer | Fund Manager |
| SPARX Asset Management Co., Ltd. | SPARX Asset Management Co., Ltd. |
SPARX Asset Management Co., Ltd., located in Tokyo, Japan, is the sub-advisor to the Hennessy Japan Fund and the Hennessy Japan Small Cap Fund.
Past performance does not guarantee future results.
Mutual fund investing involves risk. Principal loss is possible.
Opinions expressed are those of Tadahiro Fujimura and Masakazu Takeda, are subject to change, are not guaranteed, and should not be considered investment advice.
The Tokyo Stock Price Index (TOPIX) is an unmanaged index commonly used to measure the performance of Japanese stocks. One cannot invest directly in an index.
Earnings growth is not a measure of a fund’s future performance.
| HENNESSY FUNDS | 1-800-966-4354 | |
Performance Overview (Unaudited)
AVERAGE ANNUAL TOTAL RETURN FOR PERIODS ENDED APRIL 30, 2018
| | Six | One | Five | Ten |
| | Months(1) | Year | Years | Years |
| Hennessy Japan Small Cap Fund – | | | | |
| Investor Class (HJPSX) | 12.23% | 33.64% | 16.77% | 12.09% |
| Hennessy Japan Small Cap Fund – | | | | |
Institutional Class (HJSIX)(2) | 12.57% | 34.28% | 16.99% | 12.20% |
| Russell/Nomura | | | | |
Small CapTM Index | 7.53% | 26.18% | 11.84% | 8.83% |
| Tokyo Price Index (TOPIX) | 5.67% | 20.68% | 8.49% | 4.39% |
Expense ratios: 1.61% (Investor Class); 1.20% (Institutional Class)
(1) | Periods less than one year are not annualized. |
(2) | The inception date of Institutional Class shares is June 15, 2015. Performance shown prior to the inception of Institutional Class shares reflects the performance of Investor Class shares and includes expenses that are not applicable to, and are higher than, those of Institutional Class shares. |
___________________
Performance data quoted represents past performance; past performance does not guarantee future results. The investment return and principal value of an investment will fluctuate so that an investor’s shares, when redeemed, may be worth more or less than their original cost. The performance table does not reflect the deduction of taxes that a shareholder would pay on Fund distributions or the redemption of Fund shares. Current performance of the Fund may be lower or higher than the performance quoted. Performance data current to the most recent month end may be obtained by visiting hennessyfunds.com.
The Russell/Nomura Small Cap™ Index contains the bottom 15% of the Russell/Nomura Total Market™ Index, which contains the top 98% of all stocks listed on Japan’s stock exchange and registered on Japan’s OTC market in terms of market capitalization. The Tokyo Price Index (TOPIX) is a market capitalization-weighted index of all companies listed on the First Section of the Tokyo Stock Exchange. One cannot invest directly in an index.
The expense ratios presented are from the most recent prospectus. The expense ratios for the current reporting period are available in the Financial Highlights section of this report.
| PERFORMANCE OVERVIEW/SCHEDULE OF INVESTMENTS |
Financial Statements
Schedule of Investments as of April 30, 2018 (Unaudited) |
HENNESSY JAPAN SMALL CAP FUND
(% of Net Assets)
| TOP TEN HOLDINGS (EXCLUDING CASH/CASH EQUIVALENTS) | % NET ASSETS |
| OBIC Business Consultants Co., Ltd. | 2.31% |
| BELLSYSTEM24 Holdings, Inc. | 2.26% |
| Digital Garage, Inc. | 2.14% |
| Kanematsu Corp. | 2.12% |
| Kito Corp. | 2.08% |
| Stella Chemifa Corp. | 2.07% |
| Doshisha Co., Ltd. | 2.02% |
| SBS Holdings, Inc. | 2.00% |
| Macromill, Inc. | 2.00% |
| Kakaku.com., Inc. | 1.99% |
Note: For presentation purposes, the Fund has grouped some of the industry categories. For purposes of categorizing securities for compliance with Section 8(b)(1) of the Investment Company Act of 1940, as amended, the Fund uses more specific industry classifications.
The Global Industry Classification Standard (GICS®) was developed by and is the exclusive property and a service mark of MSCI, Inc. and Standard & Poor Financial Services LLC. It has been licensed for use by the Hennessy Funds.
| HENNESSY FUNDS | 1-800-966-4354 | |
| COMMON STOCKS – 93.26% | | Number | | | | | | % of | |
| | | of Shares | | | Value | | | Net Assets | |
| Consumer Discretionary – 21.54% | | | | | | | | | |
| Bic Camera, Inc. | | | 237,400 | | | $ | 3,890,496 | | | | 1.68 | % |
| DCM Holdings Co., Ltd. | | | 441,200 | | | | 4,390,015 | | | | 1.90 | % |
| Doshisha Co., Ltd. | | | 200,300 | | | | 4,665,237 | | | | 2.02 | % |
| Foster Electric Co., Ltd. | | | 155,900 | | | | 3,652,165 | | | | 1.58 | % |
| Hiramatsu, Inc. | | | 505,100 | | | | 2,360,006 | | | | 1.02 | % |
| Kasai Kogyo Co., Ltd. | | | 272,900 | | | | 3,835,137 | | | | 1.66 | % |
| Komeda Holdings Co., Ltd. | | | 167,500 | | | | 3,380,388 | | | | 1.46 | % |
| Macromill, Inc. | | | 171,100 | | | | 4,623,166 | | | | 2.00 | % |
| Pacific Industrial Co., Ltd. | | | 253,100 | | | | 3,589,971 | | | | 1.55 | % |
| Resorttrust, Inc. | | | 174,600 | | | | 3,615,402 | | | | 1.57 | % |
| Saizeriya Co., Ltd. | | | 122,100 | | | | 2,820,562 | | | | 1.22 | % |
| Seiren Co., Ltd. | | | 169,800 | | | | 3,273,602 | | | | 1.42 | % |
| SOU, Inc. | | | 29,800 | | | | 1,414,764 | | | | 0.61 | % |
| Topre Corp. | | | 135,900 | | | | 4,265,162 | | | | 1.85 | % |
| | | | | | | | 49,776,073 | | | | 21.54 | % |
| | | | | | | | | | | | | |
| Consumer Staples – 1.92% | | | | | | | | | | | | |
| Kobe Bussan Co., Ltd. | | | 63,800 | | | | 3,091,040 | | | | 1.34 | % |
| Soiken Holdings, Inc. | | | 200,000 | | | | 1,347,706 | | | | 0.58 | % |
| | | | | | | | 4,438,746 | | | | 1.92 | % |
| | | | | | | | | | | | | |
| Financials – 2.54% | | | | | | | | | | | | |
| Aozora Bank, Ltd. | | | 103,900 | | | | 4,191,494 | | | | 1.81 | % |
| Lifenet Insurance Co. (a) | | | 389,800 | | | | 1,679,997 | | | | 0.73 | % |
| | | | | | | | 5,871,491 | | | | 2.54 | % |
| | | | | | | | | | | | | |
| Health Care – 4.74% | | | | | | | | | | | | |
| JEOL Ltd. | | | 485,000 | | | | 4,156,428 | | | | 1.80 | % |
| Nihon Kohden Corp. | | | 156,800 | | | | 4,481,176 | | | | 1.94 | % |
| Ship Healthcare Holdings, Inc. | | | 66,800 | | | | 2,319,502 | | | | 1.00 | % |
| | | | | | | | 10,957,106 | | | | 4.74 | % |
| | | | | | | | | | | | | |
| Industrials – 37.68% | | | | | | | | | | | | |
| BELLSYSTEM24 Holdings, Inc. | | | 325,500 | | | | 5,212,783 | | | | 2.26 | % |
| Benefit One, Inc. | | | 123,100 | | | | 2,878,588 | | | | 1.25 | % |
| Daihen Corp. | | | 307,000 | | | | 2,381,368 | | | | 1.03 | % |
| EF-ON, Inc. | | | 200,300 | | | | 2,754,257 | | | | 1.19 | % |
| Hamakyorex Co., Ltd. | | | 126,000 | | | | 4,391,932 | | | | 1.90 | % |
The accompanying notes are an integral part of these financial statements.
HENNESSYFUNDS.COM
| COMMON STOCKS | | Number | | | | | | % of | |
| | | of Shares | | | Value | | | Net Assets | |
| Industrials (Continued) | | | | | | | | | |
| Hanwa Co., Ltd. | | | 100,300 | | | $ | 4,382,317 | | | | 1.90 | % |
| Hito Communication, Inc. | | | 196,800 | | | | 3,717,904 | | | | 1.61 | % |
| Kanematsu Corp. | | | 320,600 | | | | 4,896,708 | | | | 2.12 | % |
| Kito Corp. | | | 249,600 | | | | 4,801,954 | | | | 2.08 | % |
| Maeda Kosen Co., Ltd. | | | 143,800 | | | | 2,183,677 | | | | 0.94 | % |
| METAWATER Co Ltd. | | | 116,700 | | | | 3,436,274 | | | | 1.49 | % |
| MIRAIT Holdings Corp. | | | 277,100 | | | | 4,394,644 | | | | 1.90 | % |
| Nihon Flush Co., Ltd. | | | 103,200 | | | | 2,546,826 | | | | 1.10 | % |
| Nippon Koei Co., Ltd. | | | 140,700 | | | | 4,124,653 | | | | 1.79 | % |
| Nippon Yusoki Co., Ltd. | | | 389,200 | | | | 3,353,901 | | | | 1.45 | % |
| Nissei ASB Machine Co., Ltd. | | | 35,600 | | | | 2,202,331 | | | | 0.95 | % |
| Okamura Corp. | | | 332,400 | | | | 4,487,946 | | | | 1.94 | % |
| Sato Holdings Corp. | | | 126,900 | | | | 3,560,218 | | | | 1.54 | % |
| SBS Holdings, Inc. | | | 371,700 | | | | 4,626,723 | | | | 2.00 | % |
| Shibuya Corp. | | | 110,400 | | | | 3,764,491 | | | | 1.63 | % |
| Takeei Corp. | | | 287,200 | | | | 3,504,818 | | | | 1.52 | % |
| Takuma Co., Ltd. | | | 384,700 | | | | 4,215,063 | | | | 1.82 | % |
| Tocalo Co., Ltd. | | | 171,200 | | | | 2,124,361 | | | | 0.92 | % |
| Tonami Holdings Co., Ltd. | | | 49,700 | | | | 3,124,893 | | | | 1.35 | % |
| | | | | | | | 87,068,630 | | | | 37.68 | % |
| | | | | | | | | | | | | |
| Information Technology – 17.03% | | | | | | | | | | | | |
| Digital Garage, Inc. | | | 148,900 | | | | 4,945,847 | | | | 2.14 | % |
| Elecom Co., Ltd. | | | 196,500 | | | | 4,404,654 | | | | 1.91 | % |
| Kakaku.com., Inc. | | | 241,500 | | | | 4,604,046 | | | | 1.99 | % |
| Kyosan Electric Manufacturing Co., Ltd. | | | 264,000 | | | | 1,695,990 | | | | 0.73 | % |
| Macnica Fuji Electronics Holdings, Inc. | | | 252,400 | | | | 4,318,154 | | | | 1.87 | % |
| Mimaki Engineering Co., Ltd. | | | 370,800 | | | | 2,910,258 | | | | 1.26 | % |
| Nihon Unisys, Ltd. | | | 152,400 | | | | 3,163,061 | | | | 1.37 | % |
| NS Solutions Corp. | | | 100,300 | | | | 2,903,830 | | | | 1.26 | % |
| OBIC Business Consultants Co., Ltd. | | | 73,200 | | | | 5,339,084 | | | | 2.31 | % |
| Sun Corp. | | | 293,500 | | | | 1,994,279 | | | | 0.87 | % |
| UMC Electronics Co., Ltd. | | | 113,400 | | | | 3,052,953 | | | | 1.32 | % |
| | | | | | | | 39,332,156 | | | | 17.03 | % |
The accompanying notes are an integral part of these financial statements.
| HENNESSY FUNDS | 1-800-966-4354 | |
| COMMON STOCKS | | Number | | | | | | % of | |
| | | of Shares | | | Value | | | Net Assets | |
| Materials – 7.81% | | | | | | | | | |
| Asahi Holdings, Inc. | | | 215,000 | | | $ | 3,925,820 | | | | 1.70 | % |
| Asia Pile Holdings Co. | | | 753,400 | | | | 4,426,493 | | | | 1.92 | % |
| Hakudo Co., Ltd. | | | 77,700 | | | | 1,562,935 | | | | 0.68 | % |
| Kuriyama Holdings Corp. | | | 163,400 | | | | 3,326,837 | | | | 1.44 | % |
| Stella Chemifa Corp. | | | 143,900 | | | | 4,791,464 | | | | 2.07 | % |
| | | | | | | | 18,033,549 | | | | 7.81 | % |
| Total Common Stocks | | | | | | | | | | | | |
| (Cost $189,119,435) | | | | | | | 215,477,751 | | | | 93.26 | % |
| | | | | | | | | | | | | |
| SHORT-TERM INVESTMENTS – 5.66% | | | | | | | | | | | | |
| | | | | | | | | | | | | |
| Money Market Funds – 5.66% | | | | | | | | | | | | |
| Fidelity Government Portfolio, Institutional Class, 1.58% (b) | | | 11,401,000 | | | | 11,401,000 | | | | 4.94 | % |
| The Government & Agency Portfolio, Institutional Class, 1.60% (b) | | | 1,673,342 | | | | 1,673,342 | | | | 0.72 | % |
| | | | | | | | 13,074,342 | | | | 5.66 | % |
| Total Short-Term Investments | | | | | | | | | | | | |
| (Cost $13,074,342) | | | | | | | 13,074,342 | | | | 5.66 | % |
| | | | | | | | | | | | | |
| Total Investments | | | | | | | | | | | | |
| (Cost $202,193,777) – 98.92% | | | | | | | 228,552,093 | | | | 98.92 | % |
| Other Assets in Excess of Liabilities – 1.08% | | | | | | | 2,503,611 | | | | 1.08 | % |
| | | | | | | | | | | | | |
TOTAL NET ASSETS – 100.00% | | | | | | $ | 231,055,704 | | | | 100.00 | % |
Percentages are stated as a percent of net assets.
| (a) | Non-income producing security. |
| (b) | The rate listed is the fund’s seven-day yield as of April 30, 2018. |
The accompanying notes are an integral part of these financial statements.
HENNESSYFUNDS.COM
Summary of Fair Value Exposure at April 30, 2018
The following is a summary of the inputs used to value the Fund’s net assets as of April 30, 2018 (See Note 3 in the accompanying notes to the financial statements):
| Common Stocks | | Level 1 | | | Level 2 | | | Level 3 | | | Total | |
| Consumer Discretionary | | $ | 1,414,764 | | | $ | 48,361,309 | | | $ | — | | | $ | 49,776,073 | |
| Consumer Staples | | | — | | | | 4,438,746 | | | | — | | | | 4,438,746 | |
| Financials | | | — | | | | 5,871,491 | | | | — | | | | 5,871,491 | |
| Health Care | | | — | | | | 10,957,106 | | | | — | | | | 10,957,106 | |
| Industrials | | | — | | | | 87,068,630 | | | | — | | | | 87,068,630 | |
| Information Technology | | | — | | | | 39,332,156 | | | | — | | | | 39,332,156 | |
| Materials | | | — | | | | 18,033,549 | | | | — | | | | 18,033,549 | |
| Total Common Stocks | | $ | 1,414,764 | | | $ | 214,062,987 | | | $ | — | | | $ | 215,477,751 | |
| Short-Term Investments | | | | | | | | | | | | | | | | |
| Money Market Funds | | $ | 13,074,342 | | | $ | — | | | $ | — | | | $ | 13,074,342 | |
| Total Short-Term Investments | | $ | 13,074,342 | | | $ | — | | | $ | — | | | $ | 13,074,342 | |
| Total Investments | | $ | 14,489,106 | | | $ | 214,062,987 | | | $ | — | | | $ | 228,552,093 | |
Transfers between levels are recognized at the end of the reporting period. During the six-month period ended April 30, 2018, the Fund recognized no transfers between levels.
Transfers between Level 1 and Level 2 relate to the use of fair valuation pricing service. On days when the fair valuation pricing service is used, non-U.S. dollar denominated securities move from a Level 1 to a Level 2 classification. One security held at April 30, 2018, SOU, Inc., was classified as Level 1 because it did not meet the confidence level to trigger fair value pricing. This security was not held at October 31, 2017, and therefore was not a transfer between levels.
The accompanying notes are an integral part of these financial statements.
| HENNESSY FUNDS | 1-800-966-4354 | |
Financial Statements
Statement of Assets and Liabilities as of April 30, 2018 (Unaudited) |
| ASSETS: | | | |
| Investments in securities, at value (cost $202,193,777) | | $ | 228,552,093 | |
| Dividends and interest receivable | | | 1,518,793 | |
| Receivable for fund shares sold | | | 1,420,703 | |
| Prepaid expenses and other assets | | | 52,400 | |
| Total Assets | | | 231,543,989 | |
| | | | | |
| LIABILITIES: | | | | |
| Payable for fund shares redeemed | | | 233,815 | |
| Payable to advisor | | | 147,922 | |
| Payable to administrator | | | 34,842 | |
| Payable to auditor | | | 9,700 | |
| Accrued distribution fees | | | 23,915 | |
| Accrued service fees | | | 10,072 | |
| Accrued trustees fees | | | 4,544 | |
| Accrued expenses and other payables | | | 23,475 | |
| Total Liabilities | | | 488,285 | |
| NET ASSETS | | $ | 231,055,704 | |
| | | | | |
| NET ASSETS CONSIST OF: | | | | |
| Capital stock | | $ | 198,474,020 | |
| Accumulated net investment income | | | 16,697 | |
| Accumulated net realized gain on investments | | | 6,259,179 | |
| Unrealized net appreciation on investments | | | 26,305,808 | |
| Total Net Assets | | $ | 231,055,704 | |
| | | | | |
| NET ASSETS | | | | |
| Investor Class: | | | | |
| Shares authorized (no par value) | | Unlimited | |
| Net assets applicable to outstanding Investor Class shares | | $ | 126,288,295 | |
| Shares issued and outstanding | | | 7,702,917 | |
| Net asset value, offering price and redemption price per share | | $ | 16.39 | |
| | | | | |
| Institutional Class: | | | | |
| Shares authorized (no par value) | | Unlimited | |
| Net assets applicable to outstanding Institutional Class shares | | $ | 104,767,409 | |
| Shares issued and outstanding | | | 6,471,989 | |
| Net asset value, offering price and redemption price per share | | $ | 16.19 | |
The accompanying notes are an integral part of these financial statements.
HENNESSYFUNDS.COM
| STATEMENT OF ASSETS AND LIABILITIES/STATEMENT OF OPERATIONS |
Financial Statements
Statement of Operations for the six months ended April 30, 2018 (Unaudited) |
| INVESTMENT INCOME: | | | |
Dividend income(1) | | $ | 1,684,018 | |
| Interest income | | | 96,928 | |
| Total investment income | | | 1,780,946 | |
| | | | | |
| EXPENSES: | | | | |
| Investment advisory fees (See Note 5) | | | 723,715 | |
| Sub-transfer agent expenses – Investor Class (See Note 5) | | | 118,853 | |
| Sub-transfer agent expenses – Institutional Class (See Note 5) | | | 23,453 | |
| Administration, fund accounting, custody and transfer agent fees (See Note 5) | | | 84,873 | |
| Distribution fees – Investor Class (See Note 5) | | | 77,880 | |
| Service fees – Investor Class (See Note 5) | | | 51,920 | |
| Federal and state registration fees | | | 18,551 | |
| Compliance expense (See Note 5) | | | 14,628 | |
| Audit fees | | | 10,980 | |
| Trustees’ fees and expenses | | | 9,033 | |
| Reports to shareholders | | | 5,597 | |
| Legal fees | | | 500 | |
| Other expenses | | | 3,496 | |
| Total expenses | | | 1,143,479 | |
| NET INVESTMENT INCOME | | $ | 637,467 | |
| | | | | |
| REALIZED AND UNREALIZED GAINS: | | | | |
| Net realized gain on investments | | $ | 6,472,537 | |
| Net change in unrealized appreciation on investments | | | 8,912,851 | |
| Net gain on investments | | | 15,385,388 | |
| NET INCREASE IN NET ASSETS RESULTING FROM OPERATIONS | | $ | 16,022,855 | |
(1) | Net of foreign taxes withheld of $187,113. |
The accompanying notes are an integral part of these financial statements.
| HENNESSY FUNDS | 1-800-966-4354 | |
(This Page Intentionally Left Blank.)
HENNESSYFUNDS.COM
| STATEMENTS OF CHANGES IN NET ASSETS |
Financial Statements
| Statements of Changes in Net Assets |
| | | Six Months Ended | | | | |
| | | April 30, 2018 | | | Year Ended | |
| | | (Unaudited) | | | October 31, 2017 | |
| OPERATIONS: | | | | | | |
| Net investment income | | $ | 637,467 | | | $ | 174,013 | |
| Net realized gain on investments | | | 6,472,537 | | | | 2,713,582 | |
| Net change in unrealized appreciation on investments | | | 8,912,851 | | | | 13,111,946 | |
| Net increase in net assets resulting from operations | | | 16,022,855 | | | | 15,999,541 | |
| | | | | | | | | |
| DISTRIBUTIONS TO SHAREHOLDERS FROM: | | | | | | | | |
| Net investment income – Investor Class | | | (314,870 | ) | | | (307,249 | ) |
| Net investment income – Institutional Class | | | (268,844 | ) | | | (7,754 | ) |
| Net realized gains – Investor Class | | | (1,465,606 | ) | | | (243,524 | ) |
| Net realized gains – Institutional Class | | | (841,079 | ) | | | (29,850 | ) |
| Total distributions | | | (2,890,399 | ) | | | (588,377 | ) |
| | | | | | | | | |
| CAPITAL SHARE TRANSACTIONS: | | | | | | | | |
| Proceeds from shares subscribed – Investor Class | | | 84,423,739 | | | | 49,025,671 | |
| Proceeds from shares subscribed – Institutional Class | | | 107,261,790 | | | | 27,290,706 | |
| Dividends reinvested – Investor Class | | | 1,748,814 | | | | 545,989 | |
| Dividends reinvested – Institutional Class | | | 1,109,775 | | | | 37,604 | |
| Cost of shares redeemed – Investor Class | | | (37,801,779 | ) | | | (18,881,862 | ) |
| Cost of shares redeemed – Institutional Class | | | (37,391,023 | ) | | | (4,516,415 | ) |
| Net increase in net assets derived | | | | | | | | |
| from capital share transactions | | | 119,351,316 | | | | 53,501,693 | |
| TOTAL INCREASE IN NET ASSETS | | | 132,483,772 | | | | 68,912,857 | |
| | | | | | | | | |
| NET ASSETS: | | | | | | | | |
| Beginning of period | | | 98,571,932 | | | | 29,659,075 | |
| End of period | | $ | 231,055,704 | | | $ | 98,571,932 | |
| Undistributed net investment | | | | | | | | |
| income (loss), end of period | | $ | 16,697 | | | $ | (37,056 | ) |
| | | | | | | | | |
| CHANGES IN SHARES OUTSTANDING: | | | | | | | | |
| Shares sold – Investor Class | | | 5,283,344 | | | | 3,750,829 | |
| Shares sold – Institutional Class | | | 6,788,618 | | | | 2,024,977 | |
| Shares issued to holders as reinvestment | | | | | | | | |
| of dividends – Investor Class | | | 113,712 | | | | 49,783 | |
| Shares issued to holders as reinvestment | | | | | | | | |
| of dividends – Institutional Class | | | 72,917 | | | | 3,468 | |
| Shares redeemed – Investor Class | | | (2,377,563 | ) | | | (1,440,939 | ) |
| Shares redeemed – Institutional Class | | | (2,339,351 | ) | | | (380,799 | ) |
| Net increase in shares outstanding | | | 7,541,677 | | | | 4,007,319 | |
The accompanying notes are an integral part of these financial statements.
| HENNESSY FUNDS | 1-800-966-4354 | |
Financial Statements
For an Investor Class share outstanding throughout each period
| | | Six Months Ended | |
| | | April 30, 2018 | |
| | | (Unaudited) | |
| PER SHARE DATA: | | | |
| Net asset value, beginning of period | | $ | 14.92 | |
| | | | | |
| Income from investment operations: | | | | |
| Net investment income (loss) | | | 0.05 | |
| Net realized and unrealized gains on investments | | | 1.75 | |
| Total from investment operations | | | 1.80 | |
| | | | | |
| Less distributions: | | | | |
| Dividends from net investment income | | | (0.05 | ) |
| Dividends from net realized gains | | | (0.28 | ) |
| Total distributions | | | (0.33 | ) |
| Net asset value, end of period | | $ | 16.39 | |
| | | | | |
| TOTAL RETURN | | | 12.23 | %(1) |
| | | | | |
| SUPPLEMENTAL DATA AND RATIOS: | | | | |
| Net assets, end of period (millions) | | $ | 126.29 | |
| Ratio of expenses to average net assets | | | 1.44 | %(2) |
| Ratio of net investment income (loss) to average net assets | | | 0.40 | %(2) |
Portfolio turnover rate(3) | | | 25 | %(1) |
(1) | Not annualized. |
(2) | Annualized. |
(3) | Portfolio turnover is calculated on the basis of the Fund as a whole. |
The accompanying notes are an integral part of these financial statements.
HENNESSYFUNDS.COM
| FINANCIAL HIGHLIGHTS — INVESTOR CLASS |
| Year Ended October 31, | | |
| 2017 | | | 2016 | | | 2015 | | | 2014 | | | 2013 | | |
| | | | | | | | | | | | | | | |
| $ | 11.29 | | | $ | 10.29 | | | $ | 10.51 | | | $ | 11.70 | | | $ | 10.54 | | |
| | | | | | | | | | | | | | | | | | | | |
| | | | | | | | | | | | | | | | | | | | |
| | 0.08 | | | | 0.03 | | | | (0.02 | ) | | | (0.04 | ) | | | 0.06 | | |
| | 3.77 | | | | 1.31 | | | | 0.71 | | | | 1.36 | | | | 3.44 | | |
| | 3.85 | | | | 1.34 | | | | 0.69 | | | | 1.32 | | | | 3.50 | | |
| | | | | | | | | | | | | | | | | | | | |
| | | | | | | | | | | | | | | | | | | | |
| | (0.12 | ) | | | — | | | | — | | | | — | | | | — | | |
| | (0.10 | ) | | | (0.34 | ) | | | (0.91 | ) | | | (2.51 | ) | | | (2.34 | ) | |
| | (0.22 | ) | | | (0.34 | ) | | | (0.91 | ) | | | (2.51 | ) | | | (2.34 | ) | |
| $ | 14.92 | | | $ | 11.29 | | | $ | 10.29 | | | $ | 10.51 | | | $ | 11.70 | | |
| | | | | | | | | | | | | | | | | | | | |
| | 34.82 | % | | | 13.44 | % | | | 7.37 | % | | | 13.99 | % | | | 40.59 | % | |
| | | | | | | | | | | | | | | | | | | | |
| | | | | | | | | | | | | | | | | | | | |
| $ | 69.86 | | | $ | 26.23 | | | $ | 22.68 | | | $ | 19.36 | | | $ | 14.82 | | |
| | 1.60 | % | | | 1.91 | % | | | 2.12 | % | | | 2.24 | % | | | 2.39 | % | |
| | 0.26 | % | | | 0.25 | % | | | (0.38 | )% | | | (0.39 | )% | | | (0.11 | )% | |
| | 41 | % | | | 22 | % | | | 75 | % | | | 63 | % | | | 141 | % | |
The accompanying notes are an integral part of these financial statements.
| HENNESSY FUNDS | 1-800-966-4354 | |
Financial Statements
For an Institutional Class share outstanding throughout each period
| | | Six Months | | | | | | | | | | |
| | | Ended | | | | | | | | | Period Ended | |
| | | April 30, 2018 | | | Year Ended October 31, | | | October 31, | |
| | | (Unaudited) | | | 2017 | | | 2016 | | | 2015(1) | |
| PER SHARE DATA: | | | | | | | | | | | | |
| Net asset value, beginning of period | | $ | 14.72 | | | $ | 11.33 | | | $ | 10.30 | | | $ | 10.89 | |
| | | | | | | | | | | | | | | | | |
| Income from | | | | | | | | | | | | | | | | |
| investment operations: | | | | | | | | | | | | | | | | |
| Net investment income (loss) | | | 0.07 | | | | 0.05 | | | | 0.06 | | | | (0.01 | ) |
| Net realized and unrealized | | | | | | | | | | | | | | | | |
| gains (losses) on investments | | | 1.76 | | | | 3.78 | | | | 1.31 | | | | (0.58 | ) |
| Total from investment operations | | | 1.83 | | | | 3.83 | | | | 1.37 | | | | (0.59 | ) |
| | | | | | | | | | | | | | | | | |
| Less distributions: | | | | | | | | | | | | | | | | |
| Dividends from net | | | | | | | | | | | | | | | | |
| investment income | | | (0.08 | ) | | | (0.10 | ) | | | — | | | | — | |
| Dividends from net realized gains | | | (0.28 | ) | | | (0.34 | ) | | | (0.34 | ) | | | — | |
| Total distributions | | | (0.36 | ) | | | (0.44 | ) | | | (0.34 | ) | | | — | |
| Net asset value, end of period | | $ | 16.19 | | | $ | 14.72 | | | $ | 11.33 | | | $ | 10.30 | |
| | | | | | | | | | | | | | | | | |
| TOTAL RETURN | | | 12.57 | %(2) | | | 35.17 | % | | | 13.73 | % | | | (5.42 | )%(2) |
| | | | | | | | | | | | | | | | | |
| SUPPLEMENTAL | | | | | | | | | | | | | | | | |
| DATA AND RATIOS: | | | | | | | | | | | | | | | | |
| Net assets, end of period (millions) | | $ | 104.77 | | | $ | 28.71 | | | $ | 3.42 | | | $ | 2.65 | |
| Ratio of expenses to | | | | | | | | | | | | | | | | |
| average net assets | | | 1.02 | %(3) | | | 1.19 | % | | | 1.63 | % | | | 1.86 | %(3) |
| Ratio of net investment income | | | | | | | | | | | | | | | | |
| (loss) to average net assets | | | 1.11 | %(3) | | | 0.80 | % | | | 0.63 | % | | | (1.04 | )%(3) |
Portfolio turnover rate(4) | | | 25 | %(2) | | | 41 | % | | | 22 | % | | | 75 | %(2) |
(1) | The Institutional Class shares commenced operations on June 15, 2015. |
(2) | Not annualized. |
(3) | Annualized. |
(4) | Portfolio turnover is calculated on the basis of the Fund as a whole. |
The accompanying notes are an integral part of these financial statements.
HENNESSYFUNDS.COM
| FINANCIAL HIGHLIGHTS — INSTITUTIONAL CLASS/NOTES TO THE FINANCIAL STATEMENTS |
Financial Statements
Notes to the Financial Statements April 30, 2018 (Unaudited) |
1). ORGANIZATION
The Hennessy Japan Small Cap Fund (the “Fund”) is a series of Hennessy Funds Trust (the “Trust”), which was organized as a Delaware statutory trust on September 17, 1992. The Fund is an open-end management investment company registered under the Investment Company Act of 1940, as amended. The Fund did not have Institutional Class shares until June 15, 2015. The investment objective of the Fund is long-term capital appreciation. The Fund is a diversified fund.
The Fund offers Investor Class and Institutional Class shares. Each class of shares differs principally in its respective 12b-1 distribution and service, shareholder servicing, and sub-transfer agent expenses. There are no sales charges. Each class has identical rights to earnings, assets, and voting privileges, except for class-specific expenses and exclusive rights to vote on matters affecting only an individual class.
As an investment company, the Fund follows the investment company accounting and reporting guidance of the Financial Accounting Standards Board (“FASB”) Accounting Standard Codification Topic 946 “Financial Services—Investment Companies.”
2). SIGNIFICANT ACCOUNTING POLICIES
The following is a summary of significant accounting policies consistently followed by the Fund in the preparation of the financial statements. These policies conform to U.S. generally accepted accounting principles (“GAAP”).
| a). | Investment Valuation – All investments in securities are recorded at their estimated fair value, as described in Note 3. |
| | |
| b). | Federal Income Taxes – No provision for federal income taxes or excise taxes has been made because the Fund has elected to be taxed as a “regulated investment company” and intends to distribute substantially all of its taxable income to its shareholders and otherwise comply with the provisions of the Internal Revenue Code of 1986, as amended, applicable to regulated investment companies. Net investment income/loss and realized gains/losses for federal income tax purposes may differ from those reported in the financial statements because of temporary book and tax basis differences. Temporary differences are primarily the result of the treatment of wash sales for tax reporting purposes. The Fund recognizes interest and penalties related to income tax benefits, if any, in the Statement of Operations as an income tax expense. Distributions from net realized gains for book purposes may include short-term capital gains, which are included as ordinary income to shareholders for tax purposes. The Fund may utilize equalization accounting for tax purposes and designate earnings and profits, including net realized gains distributed to shareholders on redemption of shares, as part of the dividends paid deduction for income tax purposes. |
| | |
| c). | Accounting for Uncertainty in Income Taxes – The Fund has accounting policies regarding recognition and measurement of tax positions taken or expected to be taken on a tax return. The tax returns of the Fund for the prior three fiscal years are open for examination. The Fund has reviewed all open tax years in major jurisdictions and concluded that there is no impact on the Fund’s net assets and no tax liability resulting from unrecognized tax benefits relating to uncertain income tax |
| HENNESSY FUNDS | 1-800-966-4354 | |
| | positions taken or expected to be taken on a tax return. The Fund’s major tax jurisdictions are U.S. federal and Delaware. |
| | |
| d). | Income and Expenses – Dividend income is recognized on the ex-dividend date or as soon as information is available to the Fund. Interest income, which includes the amortization of premium and accretion of discount, is recognized on an accrual basis. The Fund is charged for those expenses that are directly attributable to the portfolio, such as advisory, administration, and certain shareholder service fees. Income, expenses (other than expenses attributable to a specific class), and realized and unrealized gains/losses on investments are allocated to each class of shares based on such class’s net assets. |
| | |
| e). | Distributions to Shareholders – Dividends from net investment income for the Fund, if any, are declared and paid annually, usually in December. Distributions of net realized capital gains, if any, are declared and paid annually, usually in December. |
| | |
| f). | Security Transactions – Investment and shareholder transactions are recorded on the trade date. The Fund determines the realized gain/loss from an investment transaction by comparing the original cost of the security lot sold with the net sale proceeds. Discounts and premiums on securities purchased are accreted or amortized, respectively, over the life of each such security. |
| | |
| g). | Use of Estimates – The preparation of financial statements in conformity with GAAP requires management to make estimates and assumptions that affect the reported amounts of assets and liabilities and disclosure of contingent assets and liabilities at the date of the financial statements and the reported change in net assets during the reporting period. Actual results could differ from those estimates. |
| | |
| h). | Share Valuation – The net asset value (“NAV”) per share of the Fund is calculated by dividing (i) the total value of the securities held by the Fund, plus cash and other assets, minus all liabilities (including estimated accrued expenses) by (ii) the total number of shares outstanding for the Fund, rounded to the nearest cent. The Fund’s shares will not be priced on days the New York Stock Exchange is closed for trading. The offering and redemption price per share for the Fund is equal to the Fund’s NAV per share. |
| | |
| i). | Foreign Currency – Values of investments denominated in foreign currencies are converted into U.S. dollars using the spot market rate of exchange at the time of valuation. Purchases and sales of investments and income are translated into U.S. dollars using the spot market rate of exchange prevailing on the respective dates of such transactions. The Fund does not isolate the portion of the results of operations resulting from fluctuations in foreign exchange rates on investments from fluctuations resulting from changes in the market prices of securities held. Such fluctuations are included with the net realized and unrealized gain/loss on investments. Foreign investments present additional risks due to currency fluctuations, economic and political factors, lower liquidity, government regulations, differences in accounting standards, and other factors. |
3). SECURITIES VALUATION
The Fund follows fair valuation accounting standards that establish an authoritative definition of fair value and set out a hierarchy for measuring fair value. These standards require additional disclosures about the various inputs and valuation techniques used to develop the measurements of fair value and a discussion of changes in valuation techniques and related inputs during the period. These inputs are summarized in the three broad levels listed below:
HENNESSYFUNDS.COM
| NOTES TO THE FINANCIAL STATEMENTS |
| | Level 1 – | Unadjusted, quoted prices in active markets for identical instruments that the Fund has the ability to access at the date of measurement. |
| | | |
| | Level 2 – | Other significant observable inputs (including, but not limited to, quoted prices in active markets for similar instruments, quoted prices in markets that are not active for identical or similar instruments, and model-derived valuations in which all significant inputs and significant value drivers are observable in active markets (such as interest rates, prepayment speeds, credit risk curves, default rates, and similar data)). |
| | | |
| | Level 3 – | Significant unobservable inputs (including the Fund’s own assumptions about what market participants would use to price the asset or liability based on the best available information) when observable inputs are unavailable. |
Following is a description of the valuation techniques applied to the Fund’s major categories of assets and liabilities measured at fair value on a recurring basis.
| | Equity Securities – Equity securities, including common stocks, preferred stocks, foreign-issued common stocks, exchange-traded funds, closed-end mutual funds, partnerships, rights, and real estate investment trusts, that are traded on a securities exchange for which a last-quoted sales price is readily available will generally be valued at the last sales price as reported by the primary exchange on which the securities are listed. Securities listed on The NASDAQ Stock Market (“NASDAQ”) will generally be valued at the NASDAQ Official Closing Price, which may differ from the last sales price reported. Securities traded on a securities exchange for which a last-quoted sales price is not readily available will generally be valued at the mean between the bid and ask prices. To the extent these securities are actively traded and valuation adjustments are not applied, they are classified in Level 1 of the fair value hierarchy. Securities traded on foreign exchanges generally are not valued at the same time the Fund calculates its NAV because most foreign markets close well before such time. The earlier close of most foreign markets gives rise to the possibility that significant events, including broad market moves, may have occurred in the interim. In certain circumstances, it may be determined that a security needs to be fair valued because it appears that the value of the security might have been materially affected by events occurring after the close of the market in which the security is principally traded, but before the time the Fund calculates its NAV, such as by a development that affects an entire market or region (e.g., a weather-related event) or a potentially global development (e.g., a terrorist attack that may be expected to have an effect on investor expectations worldwide). |
| | |
| | Registered Investment Companies – Investments in registered investment companies (e.g., mutual funds) are generally priced at the ending NAV provided by the applicable registered investment company’s service agent and will be classified in Level 1 of the fair value hierarchy. |
| | |
| | Debt Securities – Debt securities, including corporate bonds, asset-backed securities, mortgage-backed securities, municipal bonds, U.S. Treasuries, and U.S. government agency issues, are generally valued at market on the basis of valuations furnished by an independent pricing service that utilizes both dealer-supplied valuations and formula-based techniques. The pricing service may consider recently executed transactions in securities of the issuer or comparable issuers, market price quotations (where observable), bond spreads, and fundamental data relating to the issuer. In addition, the model may incorporate observable market data, such as reported sales of similar securities, broker quotes, yields, bids, offers, and reference data. Certain securities are valued primarily using dealer quotations. These securities are generally classified in Level 2 of the fair value hierarchy. |
| HENNESSY FUNDS | 1-800-966-4354 | |
| | Short-Term Securities – Short-term equity investments, including money market funds, are valued in the manner specified above. Short-term debt investments with an original term to maturity of 60 days or less are valued at amortized cost, which approximates fair market value. If the original term to maturity of a short-term debt investment exceeded 60 days, then the values as of the 61st day prior to maturity are amortized. Amortized cost is not used if its use would be inappropriate due to credit or other impairments of the issuer, in which case the security’s fair value would be determined, as described below. Short-term securities are generally classified in Level 1 or Level 2 of the fair market hierarchy depending on the inputs used and market activity levels for specific securities. |
The Board of Trustees of the Fund (the “Board”) has adopted fair value pricing procedures that are followed when a price for a security is not readily available or if a significant event has occurred that indicates the closing price of a security no longer represents the true value of that security. Fair value pricing determinations are made in good faith in accordance with these procedures. There are numerous criteria that will be given consideration in determining a fair value of a security, such as the trading volume of a security and markets, the values of other similar securities, and news events with direct bearing on a security or markets. Fair value pricing results in an estimated price for a security that reflects the amount the Fund might reasonably expect to receive in a current sale. Depending on the relative significance of the valuation inputs, these securities may be classified in either Level 2 or Level 3 of the fair value hierarchy.
The fair valuation of foreign securities may be determined with the assistance of a pricing service using correlations between the movement of prices of such securities and indices of domestic securities and other appropriate indicators, such as closing market prices of relevant American Depositary Receipts or futures contracts. The effect of using fair value pricing is that the Fund’s NAV will reflect the affected portfolio securities’ values as determined by the Board or its designee instead of being determined by the market. Using a fair value pricing methodology to price a foreign security may result in a value that is different from such foreign security’s most recent closing price and from the value used by other investment companies to calculate their NAVs. Such securities are generally classified in Level 2 of the fair valuation hierarchy. Because the Fund may invest in foreign securities, the value of the Fund’s portfolio securities may change on days when you will not be able to purchase or redeem your shares.
The Board has delegated day-to-day valuation matters to a Valuation Committee comprised of one or more representatives from Hennessy Advisors, Inc., the Fund’s investment advisor (the “Advisor”). The function of the Valuation Committee is to value securities where current and reliable market quotations are not readily available. All actions taken by the Valuation Committee are reviewed by the Board.
The Fund has performed an analysis of all existing investments to determine the significance and character of all inputs to their fair value determinations. Various inputs are used to determine the value of the Fund’s investments. The inputs or methodology used for valuing securities are not necessarily an indication of the risk associated with investing in those securities. Details related to the fair valuation hierarchy of the Fund’s securities as of April 30, 2018, are included in the Schedule of Investments.
4). INVESTMENT TRANSACTIONS
Purchases and sales of investment securities (excluding government and short-term investments) for the Fund during the six months ended April 30, 2018, were $150,935,541 and $40,628,783, respectively.
HENNESSYFUNDS.COM
| NOTES TO THE FINANCIAL STATEMENTS |
There were no purchases or sales/maturities of long-term U.S. government securities for the Fund during the six months ended April 30, 2018.
The Fund is permitted to purchase or sell securities from or to another fund in the Hennessy Funds family of funds (the “Hennessy Funds”) under specified conditions outlined in procedures adopted by the Board. The procedures have been designed to ensure that any purchase or sale of securities by the Fund from or to another Hennessy Fund complies with Rule 17a-7 of the Investment Company Act of 1940, as amended. During the six months ended April 30, 2018, the Fund did not engage in purchases or sales of securities pursuant to Rule 17a-7 of the Investment Company Act of 1940, as amended.
5). INVESTMENT MANAGEMENT FEE AND OTHER TRANSACTIONS WITH AFFILIATES
The Advisor provides the Fund with investment management services under an Investment Advisory Agreement. The Advisor provides all investment advice, office space, and facilities, as well as most of the personnel needed by the Fund. As compensation for its services, the Advisor is entitled to a monthly fee from the Fund. The fee is based upon the average daily net assets of the Fund at an annual rate of 0.80%, effective as of March 1, 2016. Prior to that date, the annual rate was 1.20%. The net investment advisory fees expensed by the Fund during the six months ended April 30, 2018, are included in the Statement of Operations.
The Advisor has delegated the day-to-day management of the Fund to a sub-advisor, SPARX Asset Management Co., Ltd. The Advisor pays the sub-advisory fees from its own assets, and these fees are not an additional expense of the Fund. For the most recent fiscal year, the Advisor (not the Fund) paid a sub-advisory fee, based upon the daily net assets of the Fund, at the rate of 0.20%. Effective February 28, 2018, the Advisor amended the sub-advisory agreement with SPARX Asset Management Co., Ltd. to increase the sub-advisory fee to 0.35% of the first $500 million of daily net assets, 0.40% of the next $500 million of daily net assets, and 0.42% of daily net assets over $1 billion. The Fund currently has less than $500 million of daily net assets.
The Board has approved a Shareholder Servicing Agreement for Investor Class shares of the Fund, which was instituted to compensate the Advisor for the non-investment management services it provides to the Fund. The Shareholder Servicing Agreement provides for a monthly fee paid to the Advisor at an annual rate of 0.10% of the average daily net assets of the Fund attributable to Investor Class shares. The shareholder service fees expensed by the Fund during the six months ended April 30, 2018, are included in the Statement of Operations.
The Fund has adopted a plan pursuant to Rule 12b-1 under the Investment Company Act of 1940, as amended, that authorizes payments in connection with the distribution of the Fund’s shares at an annual rate of up to 0.25% of the Fund’s average daily net assets attributable to Investor Class shares. Even though the authorized rate is up to 0.25%, the Fund is currently only using up to 0.15% of its average daily net assets attributable to Investor Class shares for such purpose. Amounts paid under the plan may be spent on any activities or expenses primarily intended to result in the sale of shares, including, but not limited to, advertising, shareholder account servicing, the printing and mailing of prospectuses to other than current shareholders, the printing and mailing of sales literature, and compensation for sales and marketing activities or to financial institutions and others, such as dealers and distributors. The distribution fees expensed by the Fund during the six months ended April 30, 2018, are included in the Statement of Operations.
The Fund has entered into agreements with various brokers, dealers, and financial intermediaries in connection with the sale of shares of the Fund. The agreements provide for periodic payments by the Fund to the brokers, dealers, and financial intermediaries
| HENNESSY FUNDS | 1-800-966-4354 | |
for providing certain shareholder maintenance services (sub-transfer agent expenses). These shareholder services include the pre-processing and quality control of new accounts, shareholder correspondence, answering customer inquiries regarding account status, and facilitating shareholder telephone transactions. The sub-transfer agent fees expensed by the Fund during the six months ended April 30, 2018, are included in the Statement of Operations.
U.S. Bancorp Fund Services, LLC (“USBFS”) provides the Fund with administrative, fund accounting, and transfer agent services. As administrator, USBFS is responsible for activities such as (i) preparing various federal and state regulatory filings, reports, and returns for the Fund, (ii) preparing reports and materials to be supplied to the Board, (iii) monitoring the activities of the Fund’s custodian, transfer agent, and accountants, and (iv) coordinating the preparation and payment of the Fund’s expenses and reviewing the Fund’s expense accruals. U.S. Bank N.A., an affiliate of USBFS, serves as the Fund’s custodian. The servicing agreements between the Trust and USBFS and U.S. Bank N.A. contain a fee schedule that is inclusive of administrative, fund accounting, custody, and transfer agent fees. The administrative, fund accounting, custody, and transfer agent fees expensed by the Fund during the six months ended April 30, 2018, are included in the Statement of Operations.
Quasar Distributors, LLC acts as the Fund’s principal underwriter in a continuous public offering of the Fund’s shares. Quasar Distributors, LLC is an affiliate of USBFS and U.S. Bank N.A.
The officers of the Fund are affiliated with the Advisor. Such officers, with the exception of the Chief Compliance Officer and the Senior Compliance Officer, receive no compensation from the Fund for serving in their respective roles. The Fund, along with the other Hennessy Funds, makes reimbursement payments, on an equal basis, to the Advisor for a portion of the salary and benefits associated with the office of the Chief Compliance Officer and for all of the salary and benefits associated with the office of the Senior Compliance Officer. The compliance fees expensed by the Fund during the six months ended April 30, 2018, are included in the Statement of Operations.
6). GUARANTEES AND INDEMNIFICATIONS
Under the Hennessy Funds’ organizational documents, their officers and trustees are indemnified by the Hennessy Funds against certain liabilities arising out of the performance of their duties to the Hennessy Funds. Additionally, in the normal course of business, the Hennessy Funds enter into contracts with service providers that contain general indemnification clauses. The Fund’s maximum exposure under these arrangements is unknown as this would involve future claims that may be made against the Fund that have not yet occurred. Currently, the Fund expects the risk of loss to be remote.
7). LINE OF CREDIT
The Fund has an uncommitted line of credit with the other Hennessy Funds in the amount of the lesser of (i) $100,000,000 or (ii) 33.33% of each Hennessy Fund’s net assets, or 30% for the Hennessy Gas Utility Fund and 10% for the Hennessy Balanced Fund, intended to provide short-term financing, if necessary, subject to certain restrictions, in connection with shareholder redemptions. The credit facility is with the Hennessy Funds’ custodian bank, U.S. Bank N.A. Borrowings under this arrangement bear interest at the bank’s prime rate and are secured by all of the Fund’s assets (as to its own borrowings only). During the six months ended April 30, 2018, the Fund did not have any borrowings outstanding under the line of credit.
HENNESSYFUNDS.COM
| NOTES TO THE FINANCIAL STATEMENTS |
8). FEDERAL TAX INFORMATION
As of October 31, 2017, the Fund’s most recent fiscal year end, the components of accumulated earnings (losses) for income tax purposes were as follows:
| | | Investments | |
| Cost of investments for tax purposes | | $ | 81,687,609 | |
| Gross tax unrealized appreciation | | $ | 18,126,715 | |
| Gross tax unrealized depreciation | | | (1,561,001 | ) |
| Net tax unrealized appreciation | | $ | 16,565,714 | |
| Undistributed ordinary income | | $ | 583,714 | |
| Undistributed long-term capital gains | | | 2,306,674 | |
| Total distributable earnings | | $ | 2,890,388 | |
| Other accumulated loss | | $ | (6,874 | ) |
| Total accumulated gain | | $ | 19,449,228 | |
The difference between book-basis unrealized appreciation/depreciation (as shown in the Statement of Assets and Liabilities) and tax-basis unrealized appreciation/depreciation (as shown above) is attributable primarily to wash sales and passive foreign investment companies.
As of October 31, 2017, the Fund’s most recent fiscal year end, the Fund had no tax basis capital losses to offset future capital gains.
As of October 31, 2017, the Fund’s most recent fiscal year end, the Fund did not defer, on a tax basis, any late-year ordinary losses. Late-year ordinary losses are net ordinary losses incurred after December 31, 2016, but within the taxable year, that are deemed to arise on the first day of the Fund’s next taxable year.
During fiscal year 2018 (year to date) and fiscal year 2017, the tax character of distributions paid by the Fund was as follows:
| | | Six Months Ended | | | Year Ended | |
| | | April 30, 2018 | | | October 31, 2017 | |
Ordinary income(1) | | $ | 583,714 | | | $ | 588,377 | |
| Long-term capital gain | | | 2,306,685 | | | | — | |
| | | $ | 2,890,399 | | | $ | 588,377 | |
(1) Ordinary income includes short-term gain/loss.
9). EVENTS SUBSEQUENT TO PERIOD END
Management has evaluated the Fund’s related events and transactions that occurred subsequent to April 30, 2018, through the date of issuance of the Fund’s financial statements. Management has determined that there were no subsequent events requiring recognition or disclosure in the financial statements.
| HENNESSY FUNDS | 1-800-966-4354 | |
Expense Example (Unaudited)
April 30, 2018
As a shareholder of the Fund, you incur two types of costs: (1) transaction costs, including sales charges (loads) on purchase payments, reinvested dividends, or other distributions; redemption fees; and exchange fees; and (2) ongoing costs, including management fees; service fees; and other Fund expenses. This Example is intended to help you understand your ongoing costs (in dollars) of investing in the Fund and to compare these costs with the ongoing costs of investing in other mutual funds. The Example is based on an investment of $1,000 invested at the beginning of the period and held for the entire period from November 1, 2017, through April 30, 2018.
Actual Expenses
The first line of the table below under the “Investor Class” and “Institutional Class” headings provides information about actual account values and actual expenses. Although the Fund charges no sales loads or transaction fees, you will be assessed fees for outgoing wire transfers, returned checks and stop payment orders at prevailing rates charged by U.S. Bancorp Fund Services, LLC, the Fund’s transfer agent. If you request that a redemption be made by wire transfer, currently a $15 fee is charged by the Fund’s transfer agent. IRA accounts will be charged a $15 annual maintenance fee. The example below includes, but is not limited to, management fees, shareholder servicing fees, fund accounting, custody, and transfer agent fees. However, the example below does not include portfolio trading commissions and related expenses, and other extraordinary expenses as determined under generally accepted accounting principles. You may use the information in this line, together with the amount you invested, to estimate the expenses that you paid over the period. Simply divide your account value by $1,000 (for example, an $8,600 account value divided by $1,000 = 8.6), then multiply the result by the number in the first line of the table under the “Investor Class” or “Institutional Class” headings in the column entitled “Expenses Paid During Period” to estimate the expenses you paid on your account during this period.
Hypothetical Example for Comparison Purposes
The second line of the table below under the “Investor Class” and “Institutional Class” headings provides information about hypothetical account values and hypothetical expenses based on the Fund’s actual expense ratios and an assumed rate of return of 5% per year before expenses, which is not the Fund’s actual return. The hypothetical account values and expenses may not be used to estimate the actual ending account balance or expenses you paid for the period. You may use this information to compare the ongoing costs of investing in the Fund and other funds. To do so, compare this 5% hypothetical example with the 5% hypothetical examples that appear in the shareholder reports of the other funds. Please note that the expenses shown in the table are meant to highlight your ongoing costs only and do not reflect any transactional costs, such as sales charges (loads), or exchange fees. Therefore, the second line of the table under the “Investor Class” and “Institutional Class” headings is useful in comparing ongoing costs only, and will not help you determine the relative total costs of owning different funds. In addition, if these transactional costs were included, your costs would have been higher.
HENNESSYFUNDS.COM
| | | | Expenses Paid |
| | Beginning | Ending | During Period(1) |
| | Account Value | Account Value | November 1, 2017 – |
| | November 1, 2017 | April 30, 2018 | April 30, 2018 |
| Investor Class | | | |
| Actual | $1,000.00 | $1,122.30 | $7.58 |
| Hypothetical (5% return before expenses) | $1,000.00 | $1,017.65 | $7.20 |
| | | | |
| Institutional Class | | | |
| Actual | $1,000.00 | $1,125.70 | $5.38 |
| Hypothetical (5% return before expenses) | $1,000.00 | $1,019.74 | $5.11 |
(1) | Expenses are equal to the Fund’s expense ratio of 1.44% for Investor Class shares or 1.02% for Institutional Class shares, as applicable, multiplied by the average account value over the period, multiplied by 181/365 days (to reflect one-half year period). |
| HENNESSY FUNDS | 1-800-966-4354 | |
How to Obtain a Copy of the Fund’s
Proxy Voting Policy and Proxy Voting Records
A description of the policies and procedures the Fund uses to determine how to vote proxies relating to portfolio securities is available without charge (1) by calling 1-800-966-4354, (2) on the Hennessy Funds’ website at hennessyfunds.com/proxy-voting/voting-policy, or (3) on the U.S. Securities and Exchange Commission’s (the “SEC”) website at www.sec.gov. The Fund’s proxy voting record is available without charge on both the Hennessy Funds’ website at hennessyfunds.com/proxy-voting/voting-record and the SEC’s website at www.sec.gov no later than August 31 for the prior 12 months ending June 30.
Quarterly Filings on Form N-Q
The Fund files a complete schedule of portfolio holdings with the SEC for the first and third quarters of each fiscal year on Form N-Q. The Fund’s Forms N-Q are available on the SEC’s website at www.sec.gov. The Fund’s Forms N-Q may be reviewed and copied at the SEC’s Public Reference Room in Washington, DC and information on the operation of the Public Reference Room may be obtained by calling 1-800-SEC-0330. Information included in the Fund’s Forms N-Q will also be available upon request by calling 1-800-966-4354.
Federal Tax Distribution Information
(Unaudited)
For fiscal year 2017, certain dividends paid by the Fund may be subject to a maximum tax rate of 23.8%, as provided for by the Jobs and Growth Tax Relief Reconciliation Act of 2003. The percentage of dividends declared from ordinary income designated as qualified dividend income was 100.00%.
For corporate shareholders, the percent of ordinary income distributions that qualified for the corporate dividends received deduction for fiscal year 2017, was 0.00%.
The percentage of taxable ordinary income distributions that were designated as short-term capital gain distributions under Section 871(k)(2)(C) of the Internal Revenue Code of 1986, as amended, for the Fund was 46.46%.
| | Gross Foreign Income | Foreign Tax Paid | |
| Japan | $1,032,516 | $103,013 | |
Important Notice Regarding Delivery of
Shareholder Documents
To help keep the Fund’s costs as low as possible, we generally deliver a single copy of shareholder reports, proxy statements, and prospectuses to shareholders who share an address and have the same last name. This process does not apply to account statements. You may request an individual copy of a shareholder document at any time. If you would like to receive separate mailings of shareholder documents, please call U.S. Bancorp Fund Services, LLC at 1-800-261-6950 or 1-414-765-4124, and individual delivery will begin within 30 days of your request. If your account is held through a financial institution or other intermediary, please contact such intermediary directly to request individual delivery.
HENNESSYFUNDS.COM
| PROXY VOTING — BOARD APPROVAL OF INVESTMENT ADVISORY AGREEMENTS |
Board Approval of Investment Advisory
Agreements
At a special meeting on February 21, 2018, the Board of Trustees of the Fund (the “Board,” and the members thereof, the “Trustees”) unanimously approved an amendment to the sub-advisory agreement of the Fund between Hennessy Advisors, Inc. (the “Advisor”) and SPARX Asset Management Co., Ltd. (the “Sub-Advisor”). In advance of the meeting, the Advisor sent detailed information to the Trustees to assist them in the evaluation of the proposed amendment to the sub-advisory agreement. The information provided to and considered by the Trustees was substantially similar to the information provided to and considered by the Trustees at the meeting held March 7, 2018, which is described below. In addition, the factors discussed by the Trustees and the material considerations and determinations of the Trustees were substantially similar to the factors discussed and the material considerations and determinations of the Trustees at the meeting held March 7, 2018, which is described below. The Trustees who are not deemed “interested persons” (as defined by the Investment Company Act of 1940, as amended) of the Fund (the “Independent Trustees”) met in executive session to discuss the approval of the amendment to the sub-advisory agreement.
After reviewing the materials provided at the meeting and management’s presentation, as well as other information regularly provided at the Board’s quarterly meetings throughout the year regarding the quality of services provided by the Sub-Advisor, the performance of the Fund, expense information, regulatory compliance issues, trading information and related matters, and other factors that the Trustees deemed relevant, the Trustees, including the Independent Trustees, approved the amendment to the sub-advisory agreement.
At its meeting on March 7, 2018, the Board unanimously approved the continuation of the investment advisory agreement of the Fund with the Advisor and the sub-advisory agreement of the Fund between the Advisor and the Sub-Advisor. As part of the process of approving the continuation of the advisory and sub-advisory agreements, the Trustees reviewed their fiduciary duties with respect to approving the advisory and sub-advisory agreements and the relevant factors for them to consider. In addition, the Independent Trustees met in executive session to discuss the approval of the advisory and sub-advisory agreements.
In advance of the meeting, the Advisor sent detailed information to the Trustees to assist them in their evaluation of the advisory and sub-advisory agreements. This information included, but was not limited to, the following:
| | (1) | A memorandum from outside legal counsel that described the fiduciary duties of the Board with respect to approving the continuation of the advisory and sub-advisory agreements and the relevant factors for consideration; |
| | | |
| | (2) | A memorandum from the Advisor that listed the factors relevant to the Board’s approval of the continuation of the advisory and sub-advisory agreements and also referenced the documents that had been provided to help the Board assess each such factor; |
| | | |
| | (3) | An inventory of the range of services provided by the Advisor and the Sub-Advisor to the Fund; |
| | | |
| | (4) | A written discussion of economies of scale; |
| HENNESSY FUNDS | 1-800-966-4354 | |
| | (5) | The advisory and sub-advisory agreements; |
| | | |
| | (6) | A recent Fund fact sheet, which included, among other things, performance information over various periods; |
| | | |
| | (7) | A peer expense comparison of both the net expense ratio and investment advisory fee of the Fund; |
| | | |
| | (8) | The Advisor’s most recent Form 10-K and Form 10-Q, which includes information about the Advisor’s profitability; |
| | | |
| | (9) | Information about brokerage commissions; |
| | | |
| | (10) | Information about the Fund’s compliance program; |
| | | |
| | (11) | The Advisor’s current Form ADV Part I; |
| | | |
| | (12) | A completed questionnaire from the Sub-Advisor and summary thereof; |
| | | |
| | (13) | The Sub-Advisor’s Code of Ethics; |
| | | |
| | (14) | The Sub-Advisor’s Form ADV Parts I and II; and |
| | | |
| | (15) | Financial information of the Sub-Advisor’s parent company. |
All of the factors discussed were considered as a whole by the Trustees, and also by the Independent Trustees meeting in executive session. The factors were viewed in their totality by the Trustees, with no single factor being the principal or determinative factor in the Trustees’ determination of whether to approve the continuation of the advisory and sub-advisory agreements. The Trustees recognized that the management and fee arrangements for the Fund are the result of years of review and discussion between the Independent Trustees and the Advisor, that certain aspects of such arrangements may receive greater scrutiny in some years than in others, and that the Trustees’ conclusions may be based, in part, on their consideration of these same arrangements and information received during the course of the year and in prior years.
Prior to approving the continuation of the advisory and sub-advisory agreements, the Trustees, including the Independent Trustees in executive session, considered, among other items:
| | (1) | The nature and quality of the advisory services provided by the Advisor and the Sub-Advisor; |
| | | |
| | (2) | A comparison of the fees and expenses of the Fund to other similar funds; |
| | | |
| | (3) | Whether economies of scale are recognized by the Fund; |
| | | |
| | (4) | The costs and profitability of the Fund to the Advisor and the Sub-Advisor; |
| | | |
| | (5) | The performance of the Fund; and |
| | | |
| | (6) | Any benefits to the Advisor and the Sub-Advisor from serving as an investment advisor to the Fund (other than the advisory and sub-advisory fees). |
The material considerations and determinations of the Trustees, including the Independent Trustees, were as follows:
| | (1) | The Trustees considered the services identified below that are provided by the Advisor. Based on this review, the Trustees concluded that the Advisor provides high-quality services to the Fund, and they noted that their overall confidence in the Advisor is high. The Trustees also concluded that they were satisfied with the nature, extent, and quality of the advisory services provided to the Fund by the Advisor, and that the nature and extent of the services provided by the Advisor are appropriate to assure that the Fund’s operations are conducted in compliance with applicable laws, rules, and regulations. |
| BOARD APPROVAL OF INVESTMENT ADVISORY AGREEMENTS |
| | | (a) | The Advisor oversees the Sub-Advisor for the Fund, and the Sub-Advisor acts as the portfolio manager for the Fund. |
| | | | |
| | | (b) | The Advisor performs a daily reconciliation of portfolio positions and cash for the Fund. |
| | | | |
| | | (c) | The Advisor monitors the Fund’s compliance with its investment objectives and restrictions. |
| | | | |
| | | (d) | The Advisor monitors compliance with federal securities laws and performs activities such as maintaining a compliance program, conducting ongoing reviews of the compliance programs of the Sub-Advisor and the Fund’s other service providers, conducting on-site visits to the Sub-Advisor and the Fund’s other service providers, monitoring incidents of abusive trading practices, reviewing Fund expense accruals, payments, and fixed expense ratios, evaluating insurance providers for fidelity bond coverage and D&O/E&O insurance coverage, conducting employee compliance training, reviewing reports provided by service providers, maintaining books and records, and preparing an annual compliance report for the Board. |
| | | | |
| | | (e) | The Advisor oversees the selection and continued employment of the Sub-Advisor, reviews the Fund’s investment performance, and monitors the Sub-Advisor’s adherence to the Fund’s investment objectives, policies, and restrictions. |
| | | | |
| | | (f) | The Advisor oversees service providers that provide accounting, administration, distribution, transfer agency, custodial, sales, marketing, public relations, audit, information technology, and legal services to the Fund. |
| | | | |
| | | (g) | The Advisor maintains in-house marketing and distribution departments on behalf of the Fund. |
| | | | |
| | | (h) | The Advisor is actively involved with preparing regulatory filings for the Fund, including writing and annually updating the Fund’s prospectus and related documents. |
| | | | |
| | | (i) | The Advisor reviews the written summary prepared by the Sub-Advisor of the Fund’s performance for the most recent 12-month period for each annual report of the Fund. |
| | | | |
| | | (j) | The Advisor oversees distribution of the Fund through third-party broker/dealers and independent financial institutions such as Charles Schwab, Inc., Fidelity, TD Waterhouse, and Pershing. The Advisor participates in “no transaction fee” (“NTF”) programs with these companies on behalf of the Fund, which allow customers to purchase the Fund through third-party distribution channels without paying a transaction fee. The Advisor compensates, in part, a number of these third-party providers of NTF programs out of its own revenues. |
| | | | |
| | | (k) | The Advisor pays the incentive compensation of the Fund’s compliance officers and employs other staff, such as legal, marketing, national accounts, distribution, sales, administrative, and trading oversight personnel, as well as management executives. |
| | | | |
| | | (l) | The Advisor provides a quarterly compliance certification to the Board. |
| HENNESSY FUNDS | 1-800-966-4354 | |
| | | (m) | The Advisor prepares or reviews Board materials, frequently presents to the Board or leads Board discussions, prepares or reviews meeting minutes, and arranges for Board training and education. |
| | (2) | The Trustees considered the services identified below that are provided by the Sub-Advisor: |
| | | (a) | The Sub-Advisor acts as the portfolio manager for the Fund. In this capacity, the Sub-Advisor does the following: |
| | | | (i) | manages the composition of the Fund’s portfolio, including the purchase, retention, and disposition of portfolio securities in accordance with the Fund’s investment objectives, policies, and restrictions; |
| | | | | |
| | | | (ii) | ensures compliance with “best execution” for the Fund’s portfolio; and |
| | | | | |
| | | | (iii) | manages proxy voting for the Fund. |
| | | (b) | The Sub-Advisor ensures that its compliance program includes policies and procedures relevant to the Fund and the Sub-Advisor’s duties as a portfolio manager to the Fund. |
| | | | |
| | | (c) | The Sub-Advisor prepares a written summary of the Fund’s performance for the most recent 12-month period for each annual report of the Fund. |
| | | | |
| | | (d) | The Sub-Advisor provides a quarterly compliance certification to the Board regarding trading and allocation practices, supervisory matters, the Sub-Advisor’s compliance program (including its code of ethics), compliance with the Fund’s policies, and general firm updates. |
| | (3) | The Trustees considered the distinction between the services performed by the Advisor and the Sub-Advisor. The Trustees noted that the management of the Fund, including the oversight of the Sub-Advisor, involves more comprehensive and substantive duties than the duties of the Sub-Advisor. Specifically, the Trustees considered the lists of services identified above and concluded that the services performed by the Advisor for the Fund require a higher level of service and oversight than the services performed by the Sub-Advisor. Based on this determination, the Trustees concluded that the differential in advisory fees between the Advisor and the Sub-Advisor is reasonable. |
| | | |
| | (4) | The Trustees compared the performance of the Fund to benchmark indices over various time periods and also noted that the Trustees review and discuss reports comparing the investment performance of the Fund to various indices at each quarterly Board meeting. Based on all such information, the Trustees believe that the Advisor and the Sub-Advisor manage the Fund in a manner that is materially consistent with its stated investment objective and style. The Trustees concluded that the performance of the Fund over various time periods warranted the continuation of the advisory and sub-advisory agreements. |
| | | |
| | (5) | The Trustees reviewed the advisory fees and overall expense ratios of the Fund compared to other funds similar in asset size and investment objective to the Fund using data from Morningstar. As part of the discussion with management, the Trustees ensured that they understood and were comfortable with the criteria used to determine the mutual funds included in the Morningstar categories for purposes of the materials considered at the meeting. The Trustees determined that the advisory fee and overall expense ratio of the Fund falls within the range of the advisory fees and overall expense ratios of other |
| BOARD APPROVAL OF INVESTMENT ADVISORY AGREEMENTS |
| | | comparable funds and concluded that they are reasonable and warranted continuation of the advisory and sub-advisory agreements. |
| | | |
| | (6) | The Trustees also considered whether economies of scale were being realized by the Advisor that should be shared with the Fund’s shareholders. The Trustees noted that many of the expenses incurred to manage the Fund are asset-based fees and thus do not result in material economies of scale being realized as the assets of the Fund increase. For example, mutual fund platform fees increase as the Fund’s assets grow. The Trustees also considered the Advisor’s efforts to contain expenses, the Advisor’s significant marketing efforts to promote the Funds, and the Advisor’s agreement to waive fees or lower its management fees in certain circumstances. The Trustees noted that at current asset levels it did not appear that there were economies of scale being realized by the Advisor and concluded that it would continue to monitor economies of scale in the future as circumstances changed. |
| | | |
| | (7) | The Trustees considered the profitability of the Advisor and the Sub-Advisor, including the impact of mutual fund platform fees on the Advisor’s profitability, and also considered the resources and revenues that the Advisor has put into managing and distributing the Fund. The Trustees then concluded that the profits of the Advisor and the Sub-Advisor are reasonable and not excessive when compared to profitability guidelines set forth in relevant court cases. |
| | | |
| | (8) | The Trustees considered the high level of professionalism and knowledge of the Advisor’s employees, along with a very low level of turnover, and concluded that this was beneficial to the Fund and its shareholders. |
| | | |
| | (9) | The Trustees considered any benefits to the Advisor and the Sub-Advisor from serving as an advisor to the Fund (other than the advisory and sub-advisory fees). The Trustees noted that the Advisor and the Sub-Advisor may derive ancillary benefits from, by way of example, their association with the Fund in the form of proprietary and third-party research products and services received from broker-dealers that execute portfolio trades for the Fund. The Trustees determined that any such products and services have been used for legitimate purposes relating to the Fund by providing assistance in the investment decision-making process. The Trustees concluded that any additional benefits realized by the Advisor and the Sub-Advisor from their relationship with the Fund were reasonable. |
After reviewing the materials provided at the meeting and management’s presentation, as well as other information regularly provided at the Board’s quarterly meetings throughout the year regarding the quality of services provided by the Advisor and the Sub-Advisor, the performance of the Fund, expense information, regulatory compliance issues, trading information and related matters, and other factors that the Trustees deemed relevant, the Trustees, including the Independent Trustees, approved the continuation of the advisory and sub-advisory agreements.
| HENNESSY FUNDS | 1-800-966-4354 | |
(This Page Intentionally Left Blank.)
For information, questions or assistance, please call
The Hennessy Funds
1-800-966-4354 or 1-415-899-1555
INVESTMENT ADVISOR
Hennessy Advisors, Inc.
7250 Redwood Boulevard, Suite 200
Novato, California 94945
ADMINISTRATOR,
TRANSFER AGENT,
DIVIDEND PAYING AGENT &
SHAREHOLDER SERVICING AGENT
U.S. Bancorp Fund Services, LLC
P.O. Box 701
Milwaukee, Wisconsin 53201-0701
CUSTODIAN
U.S. Bank N.A.
Custody Operations
1555 North River Center Drive, Suite 302
Milwaukee, Wisconsin 53212
TRUSTEES
Neil J. Hennessy
Robert T. Doyle
J. Dennis DeSousa
Gerald P. Richardson
COUNSEL
Foley & Lardner LLP
777 East Wisconsin Avenue
Milwaukee, Wisconsin 53202-5306
INDEPENDENT REGISTERED
PUBLIC ACCOUNTING FIRM
Tait, Weller & Baker LLP
1818 Market Street, Suite 2400
Philadelphia, Pennsylvania 19103
DISTRIBUTOR
Quasar Distributors, LLC
777 East Wisconsin Avenue
Milwaukee, Wisconsin 53202
hennessyfunds.com | 1-800-966-4354
This report has been prepared for shareholders and may be distributed to
others only if preceded or accompanied by a current prospectus.
Item 2. Code of Ethics.
Not applicable for semi-annual reports.
Item 3. Audit Committee Financial Expert.
Not applicable for semi-annual reports.
Item 4. Principal Accountant Fees and Services.
Not applicable for semi-annual reports.
Item 5. Audit Committee of Listed Registrants.
Not applicable to registrants who are not listed issuers (as defined in Rule 10A-3 under the Securities Exchange Act of 1934).
Item 6. Investments.
The Schedules of Investments are included as part of the reports to shareholders filed under Item 1 of this Form.
Item 7. Disclosure of Proxy Voting Policies and Procedures for Closed-End Management Investment Companies.
Not applicable to open-end investment companies.
Item 8. Portfolio Managers of Closed-End Management Investment Companies.
Not applicable to open-end investment companies.
Item 9. Purchases of Equity Securities by Closed‑End Management Investment Company and Affiliated Purchasers.
Not applicable to open-end investment companies.
Item 10. Submission of Matters to a Vote of Security Holders.
Not Applicable.
Item 11. Controls and Procedures.
| (a) | The Registrant’s President and Treasurer have reviewed the Registrant's disclosure controls and procedures (as defined in Rule 30a-3(c) under the Investment Company Act of 1940 (the “Act”)) as of a date within 90 days of the filing of this report, as required by Rule 30a-3(b) under the Act and Rules 13a-15(b) or 15d‑15(b) under the Securities Exchange Act of 1934. Based on their review, such officers have concluded that the disclosure controls and procedures are effective in ensuring that information required to be disclosed in this report is appropriately recorded, processed, summarized and reported and made known to them by others within the Registrant and by the Registrant’s service providers. |
| (b) | There were no changes in the Registrant's internal control over financial reporting (as defined in Rule 30a-3(d) under the Act) that occurred during the second fiscal quarter of the period covered by this report that has materially affected, or is reasonably likely to materially affect, the Registrant's internal control over financial reporting. |
Item 12. Disclosure of Securities Lending Activities for Closed-End Management Investment Companies.
Not applicable to open-end investment companies.
Item 13. Exhibits.
| (a) | (1) Code of ethics, or amendments thereto, that is the subject of the disclosure required by Item 2, to the extent that the registrant intends to satisfy Item 2 requirements through filing of an exhibit. Not applicable. |
(2) A separate certification for each principal executive and principal financial officer pursuant to Rule 30a‑2(a) under the Act and Section 302 of the Sarbanes-Oxley Act of 2002. Filed herewith.
(3) Any written solicitation to purchase securities under Rule 23c‑1 under the Act sent or given during the period covered by the report by or on behalf of the registrant to 10 or more persons. Not applicable to open-end investment companies.
(4) Change in the registrant’s independent public accountant. Provide the information called for by Item 4 of Form 8-K under the Exchange Act (17 CFR 249.308). Unless specified by Item 4, or related to and necessary for a complete understanding of information not previously disclosed, the information should relate to events occurring during the reporting period. Not applicable.
| (b) | Certifications pursuant to Rule 30a‑2(b) under the Act and Section 906 of the Sarbanes‑Oxley Act of 2002. Furnished herewith. |
SIGNATURES
Pursuant to the requirements of the Securities Exchange Act of 1934 and the Investment Company Act of 1940, the registrant has duly caused this report to be signed on its behalf by the undersigned, thereunto duly authorized.
HENNESSY FUNDS TRUST
(Registrant)
By: /s/Neil J. Hennessy
Neil J. Hennessy
President
Date: July 6, 2018
Pursuant to the requirements of the Securities Exchange Act of 1934 and the Investment Company Act of 1940, this report has been signed below by the following persons on behalf of the registrant and in the capacities and on the dates indicated.
By: /s/Neil J. Hennessy
Neil J. Hennessy, President |
| |
| Date: July 6, 2018 |
By: /s/Teresa M. Nilsen
Teresa M. Nilsen, Treasurer |
| |
| Date: July 6, 2018 |