As filed with the Securities and Exchange Commission on July 8, 2016
UNITED STATES
SECURITIES AND EXCHANGE COMMISSION
Washington, D.C. 20549
FORM N-CSR
CERTIFIED SHAREHOLDER REPORT OF REGISTERED
MANAGEMENT INVESTMENT COMPANIES
Investment Company Act file number (811-07168)
Hennessy Funds Trust
(Exact name of registrant as specified in charter)
7250 Redwood Blvd., Suite 200
Novato, CA 94945
(Address of principal executive offices) (Zip code)
Neil J. Hennessy
7250 Redwood Blvd., Suite 200
Novato, CA 94945
(Name and address of agent for service)
800-966-4354
Registrant’s telephone number, including area code
Date of fiscal year end: October 31, 2016
Date of reporting period: April 30, 2016
Item 1. Reports to Stockholders.
SEMI-ANNUAL REPORT
APRIL 30, 2016
HENNESSY CORNERSTONE
GROWTH FUND
Investor Class HFCGX
Institutional Class HICGX
hennessyfunds.com | 1-800-966-4354
(This Page Intentionally Left Blank.)
Contents
| Letter to Shareholders | 2 |
| Performance Overview | 4 |
| Financial Statements | |
| Schedule of Investments | 6 |
| Statement of Assets and Liabilities | 11 |
| Statement of Operations | 12 |
| Statements of Changes in Net Assets | 13 |
| Financial Highlights | 14 |
| Notes to the Financial Statements | 18 |
| Expense Example | 25 |
| Proxy Voting | 27 |
| Quarterly Filings on Form N-Q | 27 |
| Householding | 27 |
| Board Approval of Investment Advisory Agreement | 28 |
| HENNESSY FUNDS | 1-800-966-4354 | |
June 2016
Dear Hennessy Funds Shareholder:
I used to tell my kids, “What doesn’t kill you makes you stronger.” Perhaps that is not the best analogy for investing, but in the face of such roller coaster volatility in the financial markets, it seems to me that what hasn’t killed this bull market rally may just make it stronger. The financial markets brought us flat to modest returns during the six months ended April 30, 2016, with the S&P 500 Index returning 0.43% and the Dow Jones Industrial Average (DJIA) returning 1.98% during the period. These six months were marked by high volatility, the onslaught of more and more regulatory hurdles, the Fed stuck in neutral, fears about the global economy, and wild political rhetoric — all headwinds that I believe could have significantly stalled any positive moves in the market, but didn’t. Even the aggressive pull back in January showed just how skittish the market can be, and yet again the markets showed great resiliency and marched right back.
I continue to be impressed with the persistence of the bull market in U.S. equities, now in its seventh year. Many commentators believe that the U.S. economy is due for a recession, and the market is due for a downturn. However, we find ourselves comparing today’s secular market to the bull run of 1982 to 2000, which was powered by a significant increase in valuations. On March 9th of this year, I took a moment to remember how we all felt seven years ago on March 9, 2009, at the bottom of the financial crisis downturn that had wiped out trillions of dollars’ worth of U.S. equities. I explained to our investors then, and I say the same thing today, I believe that if you invest in quality companies with good fundamentals, over the long term, you should do fine.
If history is any kind of guide, then I think this bull market has some room to run. Rising markets usually fall when there is extreme optimism or euphoria. I haven’t witnessed any of that as of yet. The volatility has unnerved many, but I encourage investors to try to remain focused on investment fundamentals. Many U.S. companies continue to find ways to make a profit and build their already strong balance sheets. Unemployment is low, and wages are rising in real terms, supporting consumer confidence and consumption. With an average price-to-sales ratio of only 1.7x and a dividend yield of approximately 2.5% for the Dow, I believe U.S. equities continue to be attractive. In my opinion, there are many compelling reasons why this market can continue to climb even higher.
The next six months may be fraught with more talk about what the Fed will do, who the next President of the United States will be, and what is happening in China and around the globe. Businesses in every industry, including the asset management business, have concerns about increasing regulatory burdens, taxes, and higher healthcare costs. But, I still believe the ingenuity and perseverance of American business will find ways to endure and to thrive.
Thank you for your continued confidence and investment in our products. If you have any questions or would like to speak with us directly, please don’t hesitate to call us at (800) 966-4354.
Best regards,
Neil J. Hennessy
President and Chief Investment Officer
Past performance does not guarantee future results.
Mutual fund investing involves risk. Principal loss is possible.
Opinions expressed are those of Neil Hennessy and are subject to change, are not guaranteed and should not be considered investment advice.
Price-to-sales ratio is a tool for calculating a stock’s valuation relative to other companies. It is calculated by dividing a stock’s current price by its revenue per share. Dividend yield is calculated as the annual dividends paid by a company divided by its market price per share.
The Dow Jones Industrial Average and S&P 500 Index are unmanaged indices commonly used to measure the performance of U.S. stocks. One cannot invest directly in an index.
| HENNESSY FUNDS | 1-800-966-4354 | |
Performance Overview (Unaudited)
AVERAGE ANNUAL TOTAL RETURN FOR PERIODS ENDED APRIL 30, 2016
| | Six | One | Five | Ten |
| | Months(1) | Year | Years | Years |
| Hennessy Cornerstone Growth Fund – | | | | |
| Investor Class (HFCGX) | -7.05% | -3.98% | 8.54% | 0.77% |
| Hennessy Cornerstone Growth Fund – | | | | |
Institutional Class (HICGX)(2) | -6.94% | -3.79% | 8.84% | 1.02% |
Russell 2000® Index | -1.90% | -5.94% | 6.98% | 5.42% |
| S&P 500 Index | 0.43% | 1.21% | 11.02% | 6.91% |
Expense ratios: 1.31% (Investor Class); 1.00% (Institutional Class)
Performance data quoted represents past performance; past performance does not guarantee future results. The investment return and principal value of an investment will fluctuate so that an investor’s shares, when redeemed, may be worth more or less than their original cost. The performance table does not reflect the deduction of taxes that a shareholder would pay on Fund distributions or the redemption of Fund shares. Current performance of the Fund may be lower or higher than the performance quoted. Performance data current to the most recent month end may be obtained by visiting hennessyfunds.com.
The expense ratios presented are from the most recent prospectus.
(1) | Periods less than one year are not annualized. |
(2) | The inception date of the Institutional Class shares is March 3, 2008. Performance shown prior to the inception of the Institutional Class shares reflects the performance of the Investor Class shares and includes expenses that are not applicable to and are higher than those of the Institutional Class shares. |
PERFORMANCE NARRATIVE
Portfolio Managers Neil J. Hennessy and Brian E. Peery
Performance:
For the six-month period ended April 30, 2016, the Investor Class of the Hennessy Cornerstone Growth Fund returned -7.05%, underperforming both the Russell 2000® Index and the S&P 500 Index, which returned -1.90% and 0.43% for the same period, respectively.
The Fund’s underperformance relative to its benchmark was primarily due to stock selection. Within the Industrial sector, our holdings in two airline stocks, JetBlue Airways Corp. and Republic Airways Holdings, Inc., were a drag on performance. Amira Nature Foods, Ltd. and Ingles Markets, Inc., both in the Consumer Staples sector, also hampered overall performance. Sector selection also resulted in slight underperformance versus the benchmark due to an overweight position in the Consumer Discretionary sector and an underweight position in the Financials sector. We continue to hold Amira Nature Foods in the portfolio, but no longer hold any of the other stocks mentioned.
Portfolio Strategy:
We believe that the Fund’s investment strategy, which seeks companies that are reporting growth in earnings, whose stock prices are showing positive relative strength but that still trade on low price-to-sales ratios, offers investors true “growth at a reasonable price.” Limiting the Fund’s portfolio to 50 stocks produces a relatively concentrated portfolio, where individual stock performance can influence the performance of the portfolio as a whole. We believe this stock selection approach has served us well over time, and we wholeheartedly support utilizing this methodology when investing.
Market Outlook:
Over the six-month period ended April 30, 2016, U.S. equities, as measured by the S&P 500 Index, produced an essentially flat return. The period was, however, once again marked by a great deal of volatility, with the major market indices dropping more than 10% at one point early in the year before recovering all of their losses. Throughout the period, there have been concerns about interest rates, commodity prices, economic growth (both domestic and international) and the U.S. Presidential election. Many, if not all, of these concerns still exist in the marketplace today, but we have reasons to be hopeful for the remainder of the year.
We believe the basic fundamentals of the market are attractive, and we continue to be optimistic about the possibility of further moderate market advances over the course of the year. We do not believe stocks are expensive at this point, though many are probably fairly valued. The Dow Jones Industrial Average and the S&P 500 Index have forward PE ratios of 16.5x and 17x, respectively, close to long-term averages. Corporate balance sheets appear to be in excellent shape, and while executives have shown some reluctance to increase capital spending beyond maintenance levels this cycle, we believe companies outside of the Energy sector will eventually start investing for expansion.
Investment Outlook:
We continue to believe there are good investment opportunities in the small and mid-cap space. Many of these companies have purely domestic businesses, which are benefiting from steady, albeit slow, economic growth at home, low inflation and low energy prices. With consumer debt levels falling and wage growth finally starting to accelerate, we are expecting a good year for consumer-based companies. We remain pleased with the positioning of the portfolio, which includes a large number of companies that are domestically focused and that we believe are reasonably valued and appear poised for growth. Relative to the Fund’s benchmarks, the portfolio remains overweight in both the Consumer Discretionary and Industrial sectors and we think that these areas of the market offer great growth potential through 2016.
Opinions expressed are those of the Portfolio Managers as of the date written and are subject to change, are not guaranteed, and should not be considered investment advice or an indication of trading intent.
The Russell 2000® Index is an index commonly used to measure the performance of U.S. small-capitalization stocks. The S&P 500 Index and Dow Jones Industrial Average are unmanaged indices commonly used to measure the performance of U.S. stocks. One cannot invest directly in an index.
The Fund invests in small and medium capitalized companies, which may have limited liquidity and greater price volatility than large capitalization companies. Investments in foreign securities may involve political, economic and currency risks, greater volatility and differences in accounting methods. The Fund’s formula-based strategy may cause the Fund to buy or sell securities at times when it may not be advantageous.
References to specific securities should not be considered a recommendation to buy or sell any security. Fund holdings and sector allocations are subject to change. Please refer to the Schedule of Investments included in this report for additional portfolio information.
Earnings growth is not a measure of the Fund’s future performance. Price-to-sales ratio is a tool for calculating a stock’s valuation relative to other companies. It is calculated by dividing a stock’s current price by its revenue per share. PE, or price to earnings, is calculated by dividing a company’s market price per share by its earnings per share.
| HENNESSY FUNDS | 1-800-966-4354 | |
Financial Statements
Schedule of Investments as of April 30, 2016 (Unaudited) |
HENNESSY CORNERSTONE GROWTH FUND
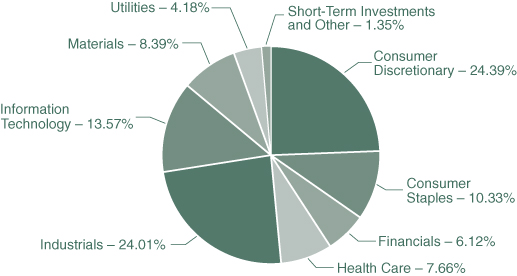
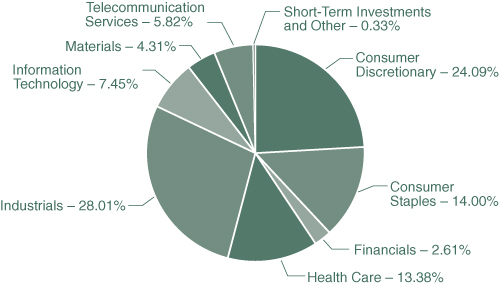
(% of Net Assets)
| TOP TEN HOLDINGS (EXCLUDING CASH/CASH EQUIVALENTS) | % NET ASSETS |
| Superior Industries International, Inc. | 2.51% |
| Air Transport Services Group, Inc. | 2.31% |
| Reliance Steel & Aluminum Co. | 2.30% |
| The Children’s Place, Inc. | 2.17% |
| Ingredion, Inc. | 2.16% |
| Potbelly Corp. | 2.15% |
| Avery Dennison Corp. | 2.12% |
| United Fire Group, Inc. | 2.11% |
| Astec Industries, Inc. | 2.11% |
| Insperity, Inc. | 2.11% |
Note: For presentation purposes, the Fund has grouped some of the industry categories. For purposes of categorizing securities for compliance with Section 8(b)(1) of the Investment Company Act of 1940, as amended, the Fund uses more specific industry classifications.
| | COMMON STOCKS – 98.65% | | Number | | | | | | % of | |
| | | | of Shares | | | Value | | | Net Assets | |
| | Consumer Discretionary – 24.39% | | | | | | | | | |
| | BJ’s Restaurants, Inc. (a) | | | 105,100 | | | $ | 4,687,460 | | | | 1.92 | % |
| | Burlington Stores, Inc. (a) | | | 82,700 | | | | 4,711,419 | | | | 1.93 | % |
| | Dollar General Corp. | | | 62,400 | | | | 5,111,184 | | | | 2.09 | % |
| | Genesco, Inc. (a) | | | 70,200 | | | | 4,856,436 | | | | 1.99 | % |
| | Genuine Parts Co. | | | 51,400 | | | | 4,932,858 | | | | 2.02 | % |
| | Movado Group, Inc. | | | 158,600 | | | | 4,474,106 | | | | 1.83 | % |
| | Omnicom Group, Inc. | | | 59,600 | | | | 4,945,012 | | | | 2.02 | % |
| | Potbelly Corp. (a) | | | 369,200 | | | | 5,261,100 | | | | 2.15 | % |
| | Superior Industries International, Inc. | | | 234,600 | | | | 6,127,752 | | | | 2.51 | % |
| | Target Corp. | | | 59,100 | | | | 4,698,450 | | | | 1.92 | % |
| | The Children’s Place, Inc. | | | 68,000 | | | | 5,297,880 | | | | 2.17 | % |
| | Vista Outdoor, Inc. (a) | | | 94,000 | | | | 4,510,120 | | | | 1.84 | % |
| | | | | | | | | 59,613,777 | | | | 24.39 | % |
| | | | | | | | | | | | | | |
| | Consumer Staples – 10.33% | | | | | | | | | | | | |
| | Amira Nature Foods, Ltd. (a)(b) | | | 364,000 | | | | 2,639,000 | | | | 1.08 | % |
| | Dean Foods Co. | | | 240,200 | | | | 4,138,646 | | | | 1.69 | % |
| | Ingredion, Inc. | | | 45,800 | | | | 5,271,122 | | | | 2.16 | % |
| | John B. Sanfilippo & Son, Inc. | | | 66,600 | | | | 3,684,978 | | | | 1.51 | % |
| | Post Holdings, Inc. (a) | | | 66,700 | | | | 4,791,728 | | | | 1.96 | % |
| | Tyson Foods, Inc., Class A | | | 71,600 | | | | 4,712,712 | | | | 1.93 | % |
| | | | | | | | | 25,238,186 | | | | 10.33 | % |
| | | | | | | | | | | | | | |
| | Financials – 6.12% | | | | | | | | | | | | |
| | Cash America International, Inc. | | | 137,500 | | | | 5,082,000 | | | | 2.08 | % |
| | The Progressive Corp. | | | 145,200 | | | | 4,733,520 | | | | 1.93 | % |
| | United Fire Group, Inc. | | | 114,900 | | | | 5,149,818 | | | | 2.11 | % |
| | | | | | | | | 14,965,338 | | | | 6.12 | % |
| | | | | | | | | | | | | | |
| | Health Care – 7.66% | | | | | | | | | | | | |
| | Henry Schein, Inc. (a) | | | 28,000 | | | | 4,723,600 | | | | 1.93 | % |
| | Owens & Minor, Inc. | | | 117,600 | | | | 4,279,464 | | | | 1.75 | % |
| | Triple-S Management Corp., Class B (a)(b) | | | 176,700 | | | | 4,601,268 | | | | 1.88 | % |
| | UnitedHealth Group, Inc. | | | 38,900 | | | | 5,122,352 | | | | 2.10 | % |
| | | | | | | | | 18,726,684 | | | | 7.66 | % |
The accompanying notes are an integral part of these financial statements.
| HENNESSY FUNDS | 1-800-966-4354 | |
| | COMMON STOCKS | | Number | | | | | | % of | |
| | | | of Shares | | | Value | | | Net Assets | |
| | Industrials – 24.01% | | | | | | | | | |
| | Air Transport Services Group, Inc. (a) | | | 401,200 | | | $ | 5,652,908 | | | | 2.31 | % |
| | Astec Industries, Inc. | | | 106,700 | | | | 5,164,280 | | | | 2.11 | % |
| | Brady Corp., Class A | | | 177,300 | | | | 4,696,677 | | | | 1.92 | % |
| | Briggs & Stratton Corp. | | | 217,900 | | | | 4,612,943 | | | | 1.89 | % |
| | C.H. Robinson Worldwide, Inc. | | | 66,400 | | | | 4,712,408 | | | | 1.93 | % |
| | Hawaiian Holdings, Inc. (a) | | | 107,700 | | | | 4,530,939 | | | | 1.85 | % |
| | Huntington Ingalls Industries, Inc. | | | 35,400 | | | | 5,124,858 | | | | 2.10 | % |
| | Insperity, Inc. | | | 97,600 | | | | 5,150,352 | | | | 2.11 | % |
| | Insteel Industries, Inc. | | | 177,000 | | | | 5,131,230 | | | | 2.10 | % |
| | John Bean Technologies Corp. | | | 88,100 | | | | 4,593,534 | | | | 1.88 | % |
| | Kaman Corp. | | | 105,500 | | | | 4,440,495 | | | | 1.81 | % |
| | Watsco, Inc. | | | 36,300 | | | | 4,881,261 | | | | 2.00 | % |
| | | | | | | | | 58,691,885 | | | | 24.01 | % |
| | | | | | | | | | | | | | |
| | Information Technology – 13.57% | | | | | | | | | | | | |
| | Arrow Electronics, Inc. (a) | | | 81,100 | | | | 5,036,310 | | | | 2.06 | % |
| | Convergys Corp. | | | 179,700 | | | | 4,762,050 | | | | 1.95 | % |
| | Itron, Inc. (a) | | | 116,300 | | | | 4,782,256 | | | | 1.96 | % |
| | NeoPhotonics Corp. (a) | | | 422,800 | | | | 5,069,372 | | | | 2.07 | % |
| | Orbotech, Ltd. (a)(b) | | | 204,600 | | | | 4,926,768 | | | | 2.02 | % |
| | SYNNEX Corp. | | | 49,300 | | | | 4,070,701 | | | | 1.66 | % |
| | Tech Data Corp. (a) | | | 65,800 | | | | 4,519,802 | | | | 1.85 | % |
| | | | | | | | | 33,167,259 | | | | 13.57 | % |
| | | | | | | | | | | | | | |
| | Materials – 8.39% | | | | | | | | | | | | |
| | Avery Dennison Corp. | | | 71,200 | | | | 5,169,832 | | | | 2.12 | % |
| | Bemis Co., Inc. | | | 94,400 | | | | 4,736,992 | | | | 1.94 | % |
| | Reliance Steel & Aluminum Co. | | | 76,100 | | | | 5,629,117 | | | | 2.30 | % |
| | Sonoco Products Co. | | | 106,000 | | | | 4,970,340 | | | | 2.03 | % |
| | | | | | | | | 20,506,281 | | | | 8.39 | % |
| | | | | | | | | | | | | | |
| | Utilities – 4.18% | | | | | | | | | | | | |
| | Exelon Corp. | | | 147,100 | | | | 5,161,739 | | | | 2.11 | % |
| | UGI Corp. | | | 125,400 | | | | 5,046,096 | | | | 2.07 | % |
| | | | | | | | | 10,207,835 | | | | 4.18 | % |
| | Total Common Stocks | | | | | | | | | | | | |
| | (Cost $239,750,382) | | | | | | | 241,117,245 | | | | 98.65 | % |
The accompanying notes are an integral part of these financial statements.
| | RIGHTS – 0.00% | | Number | | | | | | % of | |
| | | | of Shares | | | Value | | | Net Assets | |
| | Health Care – 0.00% | | | | | | | | | |
| | Forest Laboratories, Inc. (a)(c) | | | 5,500 | | | $ | 275 | | | | 0.00 | % |
| | | | | | | | | | | | | | |
| | Total Rights | | | | | | | | | | | | |
| | (Cost $0) | | | | | | | 275 | | | | 0.00 | % |
| | | | | | | | | | | | | | |
| | SHORT-TERM INVESTMENTS – 1.67% | | | | | | | | | | | | |
| | | | | | | | | | | | | | |
| | Money Market Funds – 1.67% | | | | | | | | | | | | |
| | Fidelity Government Portfolio, | | | | | | | | | | | | |
| | Institutional Class, 0.23% (d) | | | 4,082,267 | | | | 4,082,267 | | | | 1.67 | % |
| | | | | | | | | | | | | | |
| | Total Short-Term Investments | | | | | | | | | | | | |
| | (Cost $4,082,267) | | | | | | | 4,082,267 | | | | 1.67 | % |
| | | | | | | | | | | | | | |
| | Total Investments | | | | | | | | | | | | |
| | (Cost $243,832,649) – 100.32% | | | | | | | 245,199,787 | | | | 100.32 | % |
| | | | | | | | | | | | | | |
| | Liabilities in Excess | | | | | | | | | | | | |
| | of Other Assets – (0.32)% | | | | | | | (791,201 | ) | | | (0.32 | )% |
| | | | | | | | | | | | | | |
| | TOTAL NET ASSETS – 100.00% | | | | | | $ | 244,408,586 | | | | 100.00 | % |
Percentages are stated as a percent of net assets.
| (a) | Non-income producing security. |
| (b) | U.S. traded security of a foreign corporation. |
| (c) | Security is fair valued in good faith. |
| (d) | The rate listed is the fund’s 7-day yield as of April 30, 2016. |
The accompanying notes are an integral part of these financial statements.
| HENNESSY FUNDS | 1-800-966-4354 | |
Summary of Fair Value Exposure at April 30, 2016
The following is a summary of the inputs used to value the Fund’s net assets as of April 30, 2016 (See Note 3 in the accompanying notes to the financial statements):
| Common Stocks | | Level 1 | | | Level 2 | | | Level 3 | | | Total | |
| Consumer Discretionary | | $ | 59,613,777 | | | $ | — | | | $ | — | | | $ | 59,613,777 | |
| Consumer Staples | | | 25,238,186 | | | | — | | | | — | | | | 25,238,186 | |
| Financials | | | 14,965,338 | | | | — | | | | — | | | | 14,965,338 | |
| Health Care | | | 18,726,684 | | | | — | | | | — | | | | 18,726,684 | |
| Industrials | | | 58,691,885 | | | | — | | | | — | | | | 58,691,885 | |
| Information Technology | | | 33,167,259 | | | | — | | | | — | | | | 33,167,259 | |
| Materials | | | 20,506,281 | | | | — | | | | — | | | | 20,506,281 | |
| Utilities | | | 10,207,835 | | | | — | | | | — | | | | 10,207,835 | |
| Total Common Stocks | | $ | 241,117,245 | | | $ | — | | | $ | — | | | $ | 241,117,245 | |
| Rights | | | | | | | | | | | | | | | | |
| Health Care | | $ | — | | | $ | — | | | $ | 275 | * | | $ | 275 | |
| Total Rights | | $ | — | | | $ | — | | | $ | 275 | | | $ | 275 | |
| Short-Term Investments | | | | | | | | | | | | | | | | |
| Money Market Funds | | $ | 4,082,267 | | | $ | — | | | $ | — | | | $ | 4,082,267 | |
| Total Short-Term Investments | | $ | 4,082,267 | | | $ | — | | | $ | — | | | $ | 4,082,267 | |
| Total Investments | | $ | 245,199,512 | | | $ | — | | | $ | 275 | | | $ | 245,199,787 | |
* Acquired in merger.
Transfers between levels are recognized at the end of the reporting period. During the six-month period ended April 30, 2016, the Fund recognized no transfers between levels.
Level 3 Reconciliation Disclosure
Following is a reconciliation of Level 3 assets for which significant unobservable inputs were used to determine fair value.
| | | Rights | |
| Balance as of October 31, 2015 | | $ | 275 | |
| Accrued discounts/premiums | | | — | |
| Realized gain (loss) | | | — | |
| Change in unrealized appreciation (depreciation) | | | — | |
| Purchases | | | — | |
| (Sales) | | | — | |
| Transfer in and/or out of Level 3 | | | — | |
| Balance as of April 30, 2016 | | $ | 275 | |
| | | | | |
| Change in unrealized appreciation/depreciation during the period for | | | | |
| Level 3 investments held at April 30, 2016 | | $ | — | |
The Level 3 investments as of April 30, 2016, represented 0.00% of net assets and did not warrant a disclosure of significant unobservable valuation inputs.
The accompanying notes are an integral part of these financial statements.
Financial Statements
Statement of Assets and Liabilities as of April 30, 2016 (Unaudited) |
| ASSETS: | | | |
| Investments in securities, at value (cost $243,832,649) | | $ | 245,199,787 | |
| Dividends and interest receivable | | | 1,292 | |
| Receivable for fund shares sold | | | 30,699 | |
| Receivable for securities sold | | | 4,110 | |
| Prepaid expenses and other assets | | | 28,801 | |
| Total Assets | | | 245,264,689 | |
| | | | | |
| LIABILITIES: | | | | |
| Payable for fund shares redeemed | | | 473,797 | |
| Payable to advisor | | | 153,073 | |
| Payable to administrator | | | 62,402 | |
| Payable to auditor | | | 12,624 | |
| Accrued distribution fees | | | 59,614 | |
| Accrued service fees | | | 17,955 | |
| Accrued interest payable | | | 157 | |
| Accrued trustees fees | | | 2,694 | |
| Accrued expenses and other payables | | | 73,787 | |
| Total Liabilities | | | 856,103 | |
| NET ASSETS | | $ | 244,408,586 | |
| | | | | |
| NET ASSETS CONSIST OF: | | | | |
| Capital stock | | $ | 351,937,303 | |
| Accumulated net investment loss | | | (456,331 | ) |
| Accumulated net realized loss on investments | | | (108,439,524 | ) |
| Unrealized net appreciation on investments | | | 1,367,138 | |
| Total Net Assets | | $ | 244,408,586 | |
| | | | | |
| NET ASSETS | | | | |
| Investor Class: | | | | |
| Shares authorized (no par value) | | Unlimited | |
| Net assets applicable to outstanding Investor Class shares | | $ | 213,333,833 | |
| Shares issued and outstanding | | | 11,489,427 | |
| Net asset value, offering price and redemption price per share | | $ | 18.57 | |
| | | | | |
| Institutional Class: | | | | |
| Shares authorized (no par value) | | Unlimited | |
| Net assets applicable to outstanding Institutional Class shares | | $ | 31,074,753 | |
| Shares issued and outstanding | | | 1,635,328 | |
| Net asset value, offering price and redemption price per share | | $ | 19.00 | |
The accompanying notes are an integral part of these financial statements.
| HENNESSY FUNDS | 1-800-966-4354 | |
Financial Statements
Statement of Operations for the six months ended April 30, 2016 (Unaudited) |
| INVESTMENT INCOME: | | | |
| Dividend income | | $ | 1,205,229 | |
| Interest income | | | 6,442 | |
| Total investment income | | | 1,211,671 | |
| | | | | |
| EXPENSES: | | | | |
| Investment advisory fees (See Note 5) | | | 975,207 | |
| Sub-transfer agent expenses – Investor Class (See Note 5) | | | 192,227 | |
| Sub-transfer agent expenses – Institutional Class (See Note 5) | | | 14,309 | |
| Distribution fees – Investor Class (See Note 5) | | | 171,336 | |
| Administration, fund accounting, custody and transfer agent fees (See Note 5) | | | 129,223 | |
| Service fees – Investor Class (See Note 5) | | | 114,224 | |
| Audit fees | | | 13,720 | |
| Reports to shareholders | | | 13,117 | |
| Federal and state registration fees | | | 12,727 | |
| Compliance expense | | | 11,790 | |
| Trustees’ fees and expenses | | | 6,388 | |
| Interest expense (See Notes 6) | | | 1,887 | |
| Legal fees | | | 1,493 | |
| Other expenses | | | 10,354 | |
| Total expenses | | | 1,668,002 | |
| NET INVESTMENT LOSS | | $ | (456,331 | ) |
| | | | | |
| REALIZED AND UNREALIZED LOSSES: | | | | |
| Net realized loss on investments | | $ | (9,112,362 | ) |
| Net change in unrealized depreciation on investments | | | (11,535,539 | ) |
| Net loss on investments | | | (20,647,901 | ) |
| NET DECREASE IN NET ASSETS RESULTING FROM OPERATIONS | | $ | (21,104,232 | ) |
The accompanying notes are an integral part of these financial statements.
Financial Statements
| Statements of Changes in Net Assets |
| | | Six Months Ended | | | | |
| | | April 30, 2016 | | | Year Ended | |
| | | (Unaudited) | | | October 31, 2015 | |
| OPERATIONS: | | | | | | |
| Net investment income (loss) | | $ | (456,331 | ) | | $ | 926,445 | |
| Net realized gain (loss) on securities | | | (9,112,362 | ) | | | 50,172,808 | |
| Net change in unrealized depreciation on securities | | | (11,535,539 | ) | | | (32,171,870 | ) |
| Net increase (decrease) in net | | | | | | | | |
| assets resulting from operations | | | (21,104,232 | ) | | | 18,927,383 | |
| | | | | | | | | |
| DISTRIBUTIONS TO SHAREHOLDERS FROM: | | | | | | | | |
| Net investment income | | | | | | | | |
| Investor Class | | | (255,352 | ) | | | — | |
| Institutional Class | | | (98,941 | ) | | | — | |
| Total distributions | | | (354,293 | ) | | | — | |
| | | | | | | | | |
| CAPITAL SHARE TRANSACTIONS: | | | | | | | | |
| Proceeds from shares subscribed – Investor Class | | | 21,516,795 | | | | 52,930,420 | |
| Proceeds from shares subscribed – Institutional Class | | | 3,718,553 | | | | 31,992,911 | |
| Dividends reinvested – Investor Class | | | 249,654 | | | | — | |
| Dividends reinvested – Institutional Class | | | 93,766 | | | | — | |
| Cost of shares redeemed – Investor Class | | | (38,653,765 | ) | | | (48,171,421 | ) |
| Cost of shares redeemed – Institutional Class | | | (8,761,600 | ) | | | (21,201,209 | ) |
| Net increase (decrease) in net assets derived | | | | | | | | |
| from capital share transactions | | | (21,836,597 | ) | | | 15,550,701 | |
| TOTAL INCREASE (DECREASE) IN NET ASSETS | | | (43,295,122 | ) | | | 34,478,084 | |
| | | | | | | | | |
| NET ASSETS: | | | | | | | | |
| Beginning of period | | | 287,703,708 | | | | 253,225,624 | |
| End of period | | $ | 244,408,586 | | | $ | 287,703,708 | |
| Undistributed net investment income (loss), | | | | | | | | |
| end of period | | $ | (456,331 | ) | | $ | 354,293 | |
| | | | | | | | | |
| CHANGES IN SHARES OUTSTANDING: | | | | | | | | |
| Shares sold – Investor Class | | | 1,125,231 | | | | 2,691,286 | |
| Shares sold – Institutional Class | | | 191,817 | | | | 1,609,045 | |
| Shares issued to holders as reinvestment | | | | | | | | |
| of dividends – Investor Class | | | 12,816 | | | | — | |
| Shares issued to holders as reinvestment | | | | | | | | |
| of dividends – Institutional Class | | | 4,709 | | | | — | |
| Shares redeemed – Investor Class | | | (2,083,667 | ) | | | (2,447,997 | ) |
| Shares redeemed – Institutional Class | | | (464,693 | ) | | | (1,044,452 | ) |
| Net increase (decrease) in shares outstanding | | | (1,213,787 | ) | | | 807,882 | |
The accompanying notes are an integral part of these financial statements.
| HENNESSY FUNDS | 1-800-966-4354 | |
Financial Statements
For an Investor Class share outstanding throughout each period
| | | Six Months Ended | |
| | | April 30, 2016 | |
| | | (Unaudited) | |
| PER SHARE DATA: | | | |
| Net asset value, beginning of period | | $ | 20.00 | |
| | | | | |
| Income (loss) from investment operations: | | | | |
| Net investment income (loss) | | | (0.04 | ) |
| Net realized and unrealized gains (losses) on investments | | | (1.37 | ) |
| Total from investment operations | | | (1.41 | ) |
| | | | | |
| Less distributions: | | | | |
| Dividends from net investment income | | | (0.02 | ) |
| Total distributions | | | (0.02 | ) |
| Net asset value, end of period | | $ | 18.57 | |
| | | | | |
| TOTAL RETURN | | | (7.05 | )%(1) |
| | | | | |
| SUPPLEMENTAL DATA AND RATIOS: | | | | |
| Net assets, end of period (millions) | | $ | 213.33 | |
| Ratio of expenses to average net assets | | | 1.31 | %(2) |
| Ratio of net investment income (loss) to average net assets | | | (0.39 | )%(2) |
Portfolio turnover rate(3) | | | 96 | %(1) |
(1) | Not annualized. |
(2) | Annualized. |
(3) | Portfolio turnover is calculated on the basis of the Fund as a whole. |
The accompanying notes are an integral part of these financial statements.
| Year Ended October 31, | |
| 2015 | | | 2014 | | | 2013 | | | 2012 | | | 2011 | |
| | | | | | | | | | | | | | |
| $ | 18.68 | | | $ | 15.65 | | | $ | 12.38 | | | $ | 9.97 | | | $ | 10.28 | |
| | | | | | | | | | | | | | | | | | | |
| | | | | | | | | | | | | | | | | | | |
| | 0.06 | | | | (0.04 | ) | | | (0.11 | ) | | | (0.07 | ) | | | (0.08 | ) |
| | 1.26 | | | | 3.07 | | | | 3.38 | | | | 2.48 | | | | (0.23 | ) |
| | 1.32 | | | | 3.03 | | | | 3.27 | | | | 2.41 | | | | (0.31 | ) |
| | | | | | | | | | | | | | | | | | | |
| | | | | | | | | | | | | | | | | | | |
| | — | | | | — | | | | — | | | | — | | | | — | |
| | — | | | | — | | | | — | | | | — | | | | — | |
| $ | 20.00 | | | $ | 18.68 | | | $ | 15.65 | | | $ | 12.38 | | | $ | 9.97 | |
| | | | | | | | | | | | | | | | | | | |
| | 7.07 | % | | | 19.36 | % | | | 26.41 | % | | | 24.17 | % | | | (3.02 | )% |
| | | | | | | | | | | | | | | | | | | |
| | | | | | | | | | | | | | | | | | | |
| $ | 248.74 | | | $ | 227.68 | | | $ | 220.83 | | | $ | 265.60 | | | $ | 184.40 | |
| | 1.15 | % | | | 1.23 | % | | | 1.29 | % | | | 1.34 | % | | | 1.33 | % |
| | 0.30 | % | | | (0.17 | )% | | | (0.26 | )% | | | (0.66 | )% | | | (0.78 | )% |
| | 102 | % | | | 84 | % | | | 105 | % | | | 90 | % | | | 106 | % |
The accompanying notes are an integral part of these financial statements.
| HENNESSY FUNDS | 1-800-966-4354 | |
Financial Statements
For an Institutional Class share outstanding throughout each period
| | | Six Months Ended | |
| | | April 30, 2016 | |
| | | (Unaudited) | |
| PER SHARE DATA: | | | |
| Net asset value, beginning of period | | $ | 20.47 | |
| | | | | |
| Income (loss) from investment operations: | | | | |
| Net investment income (loss) | | | 0.03 | |
| Net realized and unrealized gains (losses) on investments | | | (1.45 | ) |
| Total from investment operations | | | (1.42 | ) |
| | | | | |
| Less distributions: | | | | |
| Dividends from net investment income | | | (0.05 | ) |
| Total distributions | | | (0.05 | ) |
| Net asset value, end of period | | $ | 19.00 | |
| | | | | |
| TOTAL RETURN | | | (6.94 | )%(1) |
| | | | | |
| SUPPLEMENTAL DATA AND RATIOS: | | | | |
| Net assets, end of period (millions) | | $ | 31.08 | |
| Ratio of expenses to average net assets: | | | | |
| Before expense reimbursement | | | 0.97 | %(2) |
| After expense reimbursement | | | 0.97 | %(2) |
| Ratio of net investment income (loss) to average net assets: | | | | |
| Before expense reimbursement | | | (0.05 | )%(2) |
| After expense reimbursement | | | (0.05 | )%(2) |
Portfolio turnover rate(3) | | | 96 | %(1) |
(1) | Not annualized. |
(2) | Annualized. |
(3) | Portfolio turnover is calculated on the basis of the Fund as a whole. |
The accompanying notes are an integral part of these financial statements.
| Year Ended October 31, | |
| 2015 | | | 2014 | | | 2013 | | | 2012 | | | 2011 | |
| | | | | | | | | | | | | | |
| $ | 19.08 | | | $ | 15.94 | | | $ | 12.57 | | | $ | 10.09 | | | $ | 10.37 | |
| | | | | | | | | | | | | | | | | | | |
| | | | | | | | | | | | | | | | | | | |
| | 0.03 | | | | 0.06 | | | | 0.01 | | | | (0.04 | ) | | | (0.05 | ) |
| | 1.36 | | | | 3.08 | | | | 3.36 | | | | 2.52 | | | | (0.23 | ) |
| | 1.39 | | | | 3.14 | | | | 3.37 | | | | 2.48 | | | | (0.28 | ) |
| | | | | | | | | | | | | | | | | | | |
| | | | | | | | | | | | | | | | | | | |
| | — | | | | — | | | | — | | | | — | | | | — | |
| | — | | | | — | | | | — | | | | — | | | | — | |
| $ | 20.47 | | | $ | 19.08 | | | $ | 15.94 | | | $ | 12.57 | | | $ | 10.09 | |
| | | | | | | | | | | | | | | | | | | |
| | 7.29 | % | | | 19.70 | % | | | 26.81 | % | | | 24.58 | % | | | (2.70 | )% |
| | | | | | | | | | | | | | | | | | | |
| | | | | | | | | | | | | | | | | | | |
| $ | 38.96 | | | $ | 25.54 | | | $ | 26.23 | | | $ | 37.11 | | | $ | 2.53 | |
| | | | | | | | | | | | | | | | | | | |
| | 0.99 | % | | | 1.03 | % | | | 1.11 | % | | | 1.11 | % | | | 1.09 | % |
| | 0.99 | % | | | 0.98 | % | | | 0.98 | % | | | 0.98 | % | | | 0.98 | % |
| | | | | | | | | | | | | | | | | | | |
| | 0.51 | % | | | 0.03 | % | | | (0.01 | )% | | | (0.51 | )% | | | (0.55 | )% |
| | 0.51 | % | | | 0.08 | % | | | 0.12 | % | | | (0.38 | )% | | | (0.44 | )% |
| | 102 | % | | | 84 | % | | | 105 | % | | | 90 | % | | | 106 | % |
The accompanying notes are an integral part of these financial statements.
| HENNESSY FUNDS | 1-800-966-4354 | |
Financial Statements
Notes to the Financial Statements April 30, 2016 (Unaudited) |
1). ORGANIZATION
The Hennessy Cornerstone Growth Fund (the “Fund”) is a series of Hennessy Funds Trust (the “Trust”), which was organized as a Delaware statutory trust on September 17, 1992. The Fund is an open-end management investment company registered under the Investment Company Act of 1940, as amended. The Fund is a successor to a fund with the same name (the “Predecessor Fund”) that was a series of Hennessy Mutual Funds, Inc., a Maryland corporation, pursuant to a reorganization that took place after the close of business on February 28, 2014. Prior to February 28, 2014, the Fund had no investment operations. As a result of the reorganization, holders of the Investor Class shares of the Predecessor Fund received Investor Class shares of the Fund (the Investor Class shares of the Fund are the successor to the accounting and performance information of the Predecessor Fund), and holders of the Institutional Class shares of the Predecessor Fund received Institutional Class shares of the Fund (the Institutional Class shares of the Fund are the successor to the accounting and performance information of the Predecessor Fund). The investment objective of the Fund is long-term growth of capital. The Fund is a diversified fund.
The Fund offers Investor Class and Institutional Class shares. Each class of shares differs principally in its respective administration, 12b-1 distribution and service, shareholder servicing, and transfer agent expenses and sales charges, if any. Each class has identical rights to earnings, assets, and voting privileges, except for class-specific expenses and exclusive rights to vote on matters affecting only an individual class.
As an investment company, the Fund follows the investment company accounting and reporting guidance of the Financial Accounting Standards Board (“FASB”) Accounting Standard Codification Topic 946 “Financial Services—Investment Companies.”
2). SIGNIFICANT ACCOUNTING POLICIES
The following is a summary of significant accounting policies consistently followed by the Fund in the preparation of the financial statements. These policies are in conformity with U.S. generally accepted accounting principles (“GAAP”).
| a). | Investment Valuation – All investments in securities are recorded at their estimated fair value, as described in Note 3. |
| b). | Federal Income Taxes – Provision for federal income taxes or excise taxes has not been made since the Fund has elected to be taxed as a “regulated investment company” and intends to distribute substantially all of its taxable income to its shareholders and otherwise comply with the provisions of the Internal Revenue Code of 1986, as amended, applicable to regulated investment companies. Net investment income or loss and realized gains and losses for federal income tax purposes may differ from that reported on the financial statements because of temporary book and tax basis differences. Temporary differences are primarily the result of the treatment of wash sales for tax reporting purposes. The Fund recognizes interest and penalties related to income tax benefits, if any, in the statement of operations as an income tax expense. Distributions from net realized gains for book purposes may include short-term capital gains, which are included as ordinary income to shareholders for tax purposes. |
| c). | Income and Expenses – Dividend income is recognized on the ex-dividend date or as soon as information is available to the Fund. Interest income, which includes the amortization of premium and accretion of discount, is recognized on an accrual basis. |
| | The Fund is charged for those expenses that are directly attributable to the portfolio, such as advisory, administration, and certain shareholder service fees. Income, expenses (other than expenses attributable to a specific class), and realized and unrealized gains or losses on investments are allocated to each class of shares based on its respective net assets. |
| d). | Distributions to Shareholders – Dividends from net investment income for the Fund, if any, are declared and paid annually, usually in December. Distributions of net realized capital gains, if any, are declared and paid annually, usually in December. |
| e). | Security Transactions – Investment and shareholder transactions are recorded on the trade date. The Fund determines the gain or loss realized from the investment transactions by comparing the original cost of the security lot sold with the net sale proceeds. Discounts and premiums on securities purchased are accreted/amortized over the life of the respective security. |
| f). | Use of Estimates – The preparation of financial statements in conformity with GAAP requires management to make estimates and assumptions that affect the reported amounts of assets and liabilities and disclosure of contingent assets and liabilities at the date of the financial statements and the reported change in net assets during the reporting period. Actual results could differ from those estimates. |
| g). | Share Valuation – The net asset value (“NAV”) per share of the Fund is calculated by dividing the sum of the value of the securities held by the Fund, plus cash or other assets, minus all liabilities (including estimated accrued expenses) by the total number of shares outstanding for the Fund, rounded to the nearest cent. The Fund’s shares will not be priced on days the New York Stock Exchange is closed for trading. The offering and redemption price per share for the Fund is equal to the Fund’s NAV per share. |
| h). | Foreign Currency – Values of investments denominated in foreign currencies, if any, are converted into U.S. dollars using the spot market rate of exchange at the time of valuation. Purchases and sales of investments and income are translated into U.S. dollars using the spot market rate of exchange prevailing on the respective dates of such transactions. The Fund does not isolate the portion of the results of operations resulting from fluctuations in foreign exchange rates on investments from fluctuations resulting from changes in the market prices of securities held. Such fluctuations are included with the net realized and unrealized gain or loss on investments. Foreign investments present additional risks due to currency fluctuations, economic and political factors, lower liquidity, government regulations, differences in accounting standards, and other factors. |
| i). | Forward Contracts – The Fund may enter into forward currency contracts to reduce its exposure to changes in foreign currency exchange rates on its foreign holdings and to lock in the U.S. dollar cost of firm purchase and sale commitments for securities denominated in foreign currencies. A forward currency contract is a commitment to purchase or sell a foreign currency at a future date at a negotiated forward rate. The gain or loss arising from the difference between the U.S. dollar cost of the original contract and the value of the foreign currency in U.S. dollars upon closing of such contract is included in net realized gain or loss from foreign currency transactions. During the six months ended April 30, 2016, the Fund did not enter into any forward contracts. |
| j). | Repurchase Agreements – The Fund may enter into repurchase agreements with member banks or security dealers of the Federal Reserve Board whom the investment advisor deems creditworthy. The repurchase price generally equals the price paid by the Fund plus interest negotiated on the basis of current short-term rates. |
| HENNESSY FUNDS | 1-800-966-4354 | |
| | Securities pledged as collateral for repurchase agreements are held by the custodian bank until the respective agreements mature. Provisions of the repurchase agreements ensure that the market value of the collateral, including accrued interest thereon, is sufficient to cover the repurchase amount in the event of default of the counterparty. If the counterparty defaults and the value of the collateral declines or if the counterparty enters an insolvency proceeding, realization of the collateral by the Fund may be delayed or limited. |
| k). | Accounting for Uncertainty in Income Taxes – The Fund has accounting policies regarding recognition and measurement of tax positions taken or expected to be taken on a tax return. The tax returns of the Fund for the prior three fiscal years are open for examination. The Fund has reviewed all open tax years in major jurisdictions and concluded that there is no impact on the Fund’s net assets and no tax liability resulting from unrecognized tax benefits relating to uncertain income tax positions taken or expected to be taken on a tax return. The Fund’s major tax jurisdictions are U.S. federal and Delaware. |
| l). | New Accounting Pronouncements – In May 2015, the FASB issued ASU No. 2015-07 “Disclosure for Investments in Certain Entities that Calculate Net Asset Value per Share (or Its Equivalent).” The amendments in ASU No. 2015-07 remove the requirement to categorize within the fair value hierarchy investments measured at NAV and require the disclosure of sufficient information to reconcile the fair value of the remaining assets categorized within the fair value hierarchy to the financial statements. The amendments in ASU No. 2015-07 are effective for fiscal years beginning after December 15, 2015, and interim periods within those fiscal years. Management has reviewed the requirements and believes the adoption of ASU 2015-07 will not have a material impact on the Fund’s financial statements and related disclosures. |
3). SECURITIES VALUATION
The Fund follows authoritative fair valuation accounting standards that establish an authoritative definition of fair value and set out a hierarchy for measuring fair value. These standards require additional disclosures about the various inputs and valuation techniques used to develop the measurements of fair value and a discussion in changes in valuation techniques and related inputs during the period. These inputs are summarized in the three broad levels listed below:
| | Level 1 – | Unadjusted, quoted prices in active markets for identical instruments that the Fund has the ability to access at the date of measurement. |
| | Level 2 – | Other significant observable inputs (including, but not limited to, quoted prices in active markets for similar instruments, quoted prices in markets that are not active for identical or similar instruments, and model-derived valuations in which all significant inputs and significant value drivers are observable in active markets (such as interest rates, prepayment speeds, credit risk curves, default rates, and similar data)). |
| | Level 3 – | Significant unobservable inputs (including the Fund’s own assumptions about what market participants would use to price the asset or liability based on the best available information) when observable inputs are unavailable. |
Following is a description of the valuation techniques applied to the Fund’s major categories of assets and liabilities measured at fair value on a recurring basis.
Equity Securities – Equity securities, including common stocks, preferred stocks, foreign-issued common stocks, exchange-traded funds, closed-end mutual funds, partnerships, rights, and real estate investment trusts, that are traded on a securities
exchange for which a last-quoted sales price is readily available will generally be valued at the last sales price as reported by the primary exchange on which the securities are listed. Securities listed on The NASDAQ Stock Market (“NASDAQ”) will generally be valued at the NASDAQ Official Closing Price, which may differ from the last sales price reported. Securities traded on a securities exchange for which a last-quoted sales price is not readily available will generally be valued at the mean between the bid and ask prices. To the extent these securities are actively traded and valuation adjustments are not applied, they are classified in Level 1 of the fair value hierarchy. Securities traded on foreign exchanges generally are not valued at the same time the Fund calculates its NAV because most foreign markets close well before such time. The earlier close of most foreign markets gives rise to the possibility that significant events, including broad market moves, may have occurred in the interim. In certain circumstances, it may be determined that a security needs to be fair valued because it appears that the value of the security might have been materially affected by events occurring after the close of the market in which the security is principally traded, but before the time the Fund calculates its NAV, such as by a development that affects an entire market or region (e.g., weather-related events) or a potentially global development (e.g., a terrorist attack that may be expected to have an effect on investor expectations worldwide).
Registered Investment Companies – Investments in registered investment companies (e.g., mutual funds) are generally priced at the ending NAV provided by the applicable registered investment company’s service agent and will be classified in Level 1 of the fair value hierarchy.
Debt Securities – Debt securities, including corporate bonds, asset-backed securities, mortgage-backed securities, municipal bonds, U.S. Treasuries, and U.S. government agency issues, are generally valued at market on the basis of valuations furnished by an independent pricing service that utilizes both dealer-supplied valuations and formula-based techniques. The pricing service may consider recently executed transactions in securities of the issuer or comparable issuers, market price quotations (where observable), bond spreads, and fundamental data relating to the issuer. In addition, the model may incorporate observable market data, such as reported sales of similar securities, broker quotes, yields, bids, offers, and reference data. Certain securities are valued primarily using dealer quotations. These securities are generally classified in Level 2 of the fair value hierarchy.
Short-Term Securities – Short-term equity investments, including money market funds, are valued in the manner specified above. Short-term debt investments with an original term to maturity of 60 days or less are valued at amortized cost, which approximates fair market value. If the original term to maturity of a short-term debt investment exceeded 60 days, then the values as of the 61st day prior to maturity are amortized. Amortized cost is not used if its use would be inappropriate due to credit or other impairments of the issuer, in which case the security’s fair value would be determined, as described below. Short-term securities are generally classified in Level 1 or Level 2 of the fair market hierarchy depending on the inputs used and market activity levels for specific securities.
The Board of Trustees of the Fund (the “Board”) has adopted fair value pricing procedures that are followed when a price for a security is not readily available or if a significant event has occurred that indicates the closing price of a security no longer represents the true value of that security. Fair value pricing determinations are made in good faith in accordance with these procedures. There are numerous criteria that will be given consideration in determining a fair value of a security, such as the trading volume of a security and markets, the value of other like securities, and news events with direct
| HENNESSY FUNDS | 1-800-966-4354 | |
bearing to a security or markets. Fair value pricing results in an estimated price for a security that reflects the amount the Fund might reasonably expect to receive in a current sale. Depending on the relative significance of the valuation inputs, these securities may be classified in either Level 2 or Level 3 of the fair value hierarchy.
The fair valuation of foreign securities may be determined with the assistance of a pricing service using correlations between the movement of prices of such securities and indices of domestic securities and other appropriate indicators, such as closing market prices of relevant American Depositary Receipts or futures contracts. The effect of using fair value pricing is that the Fund’s NAV will reflect the affected portfolio securities’ value as determined by the Board or its designee instead of being determined by the market. Using a fair value pricing methodology to price foreign securities may result in a value that is different from a foreign security’s most recent closing price and from the prices used by other investment companies to calculate their NAVs and are generally considered Level 2 prices in the fair valuation hierarchy. Because the Fund may invest in foreign securities, the value of the Fund’s portfolio securities may change on days when you will not be able to purchase or redeem your shares.
The Board has delegated day-to-day valuation matters to a Valuation Committee comprised of one or more representatives from Hennessy Advisors, Inc., the Fund’s investment advisor. The function of the Valuation Committee is to value securities where current and reliable market quotations are not readily available. All actions taken by the Valuation Committee are reviewed by the Board.
The Fund has performed an analysis of all existing investments to determine the significance and character of all inputs to their fair value determination. Various inputs are used in determining the value of the Fund’s investments. The inputs or methodology used for valuing securities are not necessarily an indication of the risk associated with investing in those securities. Details related to the fair valuation hierarchy of the Fund’s securities as of April 30, 2016, are included in the Fund’s Schedule of Investments.
4). INVESTMENT TRANSACTIONS
Purchases and sales of investment securities (excluding government and short-term investments) for the Fund during the six months ended April 30, 2016, were $235,715,965 and $248,467,968, respectively.
There were no purchases or sales/maturities of long-term U.S. government securities for the Fund during the six months ended April 30, 2016.
5). INVESTMENT MANAGEMENT FEE AND OTHER TRANSACTIONS WITH AFFILIATES
Hennessy Advisors, Inc. (the “Advisor”) is the investment advisor of the Fund. The Advisor provides the Fund with investment management services under an Investment Advisory Agreement. The Advisor furnishes all investment advice, office space, facilities, and provides most of the personnel needed by the Fund. As compensation for its services, the Advisor is entitled to a monthly fee from the Fund. The fee is based upon the average daily net assets of the Fund at the annual rate of 0.74%. The net investment advisory fees payable by the Fund as of April 30, 2016, were $153,073.
In the past, the Advisor had agreed to waive its fees and absorb expenses to the extent that the total annual operating expenses exceeded 0.98% of the Fund’s net assets for the Institutional Class shares of the Fund (excluding all federal, state and local taxes, interest, brokerage commissions, acquired fund fees and expenses and other costs incurred in connection with the purchase and sale of securities and extraordinary items). The expense limitation agreement was terminated by the Board as of February 28, 2015.
For a period of three years after the year in which the Advisor waived or reimbursed expenses, the Advisor may seek reimbursement from the Fund to the extent that total annual fund operating expenses are less than the expense limitation that was in effect at the time the Advisor waived or reimbursed expenses. As of April 30, 2016, cumulative expenses subject to potential recovery under the aforementioned conditions were $1,023 for Institutional Class shares, which will expire on October 31, 2018.
The Board has approved a Shareholder Servicing Agreement for the Investor Class shares of the Fund, which was instituted to compensate the Advisor for the non-investment management services it provides to the Fund. The Shareholder Servicing Agreement provides for a monthly fee paid to the Advisor at an annual rate of 0.10% of the average daily net assets of the Fund attributable to Investor Class shares. Shareholder service fees payable by the Fund as of April 30, 2016, were $17,955.
The Fund has adopted a plan pursuant to Rule 12b-1 under the Investment Company Act of 1940, as amended, that authorizes payments in connection with the distribution of the Fund’s shares at an annual rate of up to 0.25% of the Fund’s average daily net assets attributable to Investor Class shares. Even though the authorized rate is up to 0.25%, the Fund has only used up to 0.15% of its average daily net assets attributable to Investor Class shares for such purpose since the plan was implemented on November 1, 2015. Amounts paid under the plan may be spent on any activities or expenses primarily intended to result in the sale of shares, including, but not limited to, advertising, shareholder account servicing, the printing and mailing of prospectuses to other than current shareholders, the printing and mailing of sales literature, and compensation for sales and marketing activities or to financial institutions and others, such as dealers and distributors.
The Fund has entered into agreements with various brokers, dealers, and financial intermediaries in connection with the sale of shares of the Fund. The agreements provide for periodic payments by the Fund to the brokers, dealers, and financial intermediaries for providing certain shareholder maintenance services (sub-transfer agent expenses). These shareholder services include the pre-processing and quality control of new accounts, shareholder correspondence, answering customer inquiries regarding account status, and facilitating shareholder telephone transactions. Fees paid by the Fund to various brokers, dealers, and financial intermediaries during the six months ended April 30, 2016, were $206,536.
U.S. Bancorp Fund Services, LLC (“USBFS”) provides the Fund with administrative, fund accounting, and transfer agent services, and necessary office equipment. As administrator, USBFS is responsible for activities such as (i) preparing various federal and state regulatory filings, reports, and returns for the Fund, (ii) preparing reports and materials to be supplied to the Board, (iii) monitoring the activities of the Fund’s custodian, transfer agent, and accountants, and (iv) coordinating the preparation and payment of the Fund’s expenses and reviewing the Fund’s expense accruals. Fees paid to USBFS during the six months ended April 30, 2016, were $129,223.
U.S. Bank, N.A., an affiliate of USBFS, serves as the Fund’s custodian. Quasar Distributors, LLC acts as the Fund’s principal underwriter in a continuous public offering of the Fund’s shares. Quasar Distributors, LLC is an affiliate of USBFS and U.S. Bank, N.A.
6). LINE OF CREDIT
The Fund has an uncommitted line of credit with the other funds in the Hennessy Funds family of funds (the “Hennessy Funds”) in the amount of the lesser of (i) $100,000,000 or (ii) 33.33% of each Hennessy Fund’s net assets, or 30% for the Hennessy Gas Utility Fund and 10% for the Hennessy Balanced Fund, intended to provide short-term financing, if
| HENNESSY FUNDS | 1-800-966-4354 | |
necessary, subject to certain restrictions, in connection with shareholder redemptions. The credit facility is with the Hennessy Funds’ custodian bank, U.S. Bank, N.A. Borrowings under this arrangement bear interest at the bank’s prime rate and are secured by all of the Fund’s assets (as to its own borrowings only). During the six months ended April 30, 2016, the Fund had an outstanding average daily balance and a weighted average interest rate of $106,632 and 3.44%, respectively. The maximum amount outstanding for the Fund during the period was $5,057,000. At April 30, 2016, the Fund did not have any borrowings outstanding under the line of credit.
7). FEDERAL TAX INFORMATION
As of October 31, 2015, the Fund’s most recent fiscal year end, the components of accumulated earnings (losses) for income tax purposes were as follows:
| Cost of investments for tax purposes | | $ | 275,123,133 | |
| Gross tax unrealized appreciation | | $ | 33,988,871 | |
| Gross tax unrealized depreciation | | | (21,429,816 | ) |
| Net tax unrealized appreciation | | $ | 12,559,055 | |
| Undistributed ordinary income | | $ | 354,293 | |
| Undistributed long-term capital gains | | | — | |
| Total distributable earnings | | $ | 354,293 | |
| Other accumulated loss | | $ | (98,983,540 | ) |
| Total accumulated loss | | $ | (86,070,192 | ) |
The difference between book-basis unrealized appreciation/depreciation (as shown in the Statement of Assets and Liabilities) and tax-basis unrealized appreciation/depreciation (as shown above) is attributable primarily to wash sales and partnership adjustments.
At October 31, 2015, the Fund’s most recent fiscal year end, the Fund had capital loss carryforwards that expire as follows:
| $ 1,040,214 | 10/31/16 | |
| $97,943,326 | 10/31/17 | |
During the fiscal year ended October 31, 2015, the Fund’s most recent fiscal year, the capital loss carryforwards utilized for the Fund were $50,871,792.
Capital losses sustained in the fiscal year ended October 31, 2012 and in future taxable years will not expire and may be carried over by the Fund without limitation; however, they will retain the character of the original loss. Furthermore, any loss incurred during those taxable years will be required to be utilized prior to the losses incurred in taxable years prior to 2012. As a result of this ordering rule, pre-enactment capital loss carryforwards may be more likely to expire unused. Under pre-enactment law, capital losses could be carried forward for eight years, and carried forward as short-term capital losses, irrespective of the character of the original loss.
At October 31, 2015, the Fund’s most recent fiscal year end, the Fund did not defer, on a tax basis, any post-December late year ordinary loss deferrals.
The tax character of distributions paid during fiscal year 2016 (year to date) and fiscal year 2015 for the Fund were as follows:
| | | Six Months Ended | | | Year Ended | |
| | | April 30, 2016 | | | October 31, 2015 | |
| Ordinary income | | $ | 354,293 | | | $ | — | |
| Long-term capital gain | | | — | | | | — | |
| | | $ | 354,293 | | | $ | — | |
Expense Example (Unaudited)
April 30, 2016
As a shareholder of the Fund, you incur two types of costs: (1) transaction costs, including sales charges (loads) on purchase payments, reinvested dividends, or other distributions; redemption fees; and exchange fees; and (2) ongoing costs, including management fees; service fees; and other Fund expenses. This Example is intended to help you understand your ongoing costs (in dollars) of investing in the Fund and to compare these costs with the ongoing costs of investing in other mutual funds. The Example is based on an investment of $1,000 invested at the beginning of the period and held for the entire period from November 1, 2015 through April 30, 2016.
Actual Expenses
The first line of the table below under the “Investor Class” and “Institutional Class” headings provides information about actual account values and actual expenses. Although the Fund charges no sales loads or transaction fees, you will be assessed fees for outgoing wire transfers, returned checks and stop payment orders at prevailing rates charged by U.S. Bancorp Fund Services, LLC, the Fund’s transfer agent. If you request that a redemption be made by wire transfer, currently a $15.00 fee is charged by the Fund’s transfer agent. IRA accounts will be charged a $15.00 annual maintenance fee. The example below includes, but is not limited to, management fees, shareholder servicing fees, fund accounting, custody, and transfer agent fees. However, the example below does not include portfolio trading commissions and related expenses, and other extraordinary expenses as determined under generally accepted accounting principles. You may use the information in this line, together with the amount you invested, to estimate the expenses that you paid over the period. Simply divide your account value by $1,000 (for example, an $8,600 account value divided by $1,000 = 8.6), then multiply the result by the number in the first line of the table under the “Investor Class” and “Institutional Class” headings in the column entitled “Expenses Paid During Period” to estimate the expenses you paid on your account during this period.
Hypothetical Example for Comparison Purposes
The second line of the table below under the “Investor Class” and “Institutional Class” headings provides information about hypothetical account values and hypothetical expenses based on the Fund’s actual expense ratios and an assumed rate of return of 5% per year before expenses, which is not the Fund’s actual return. The hypothetical account values and expenses may not be used to estimate the actual ending account balance or expenses you paid for the period. You may use this information to compare the ongoing costs of investing in the Fund and other funds. To do so, compare this 5% hypothetical example with the 5% hypothetical examples that appear in the shareholder reports of the other funds. Please note that the expenses shown in the table are meant to highlight your ongoing costs only and do not reflect any transactional costs, such as sales charges (loads), or exchange fees. Therefore, the second line of the table under the “Investor Class” and “Institutional Class” headings is useful in comparing ongoing costs only, and will not help you determine the relative total costs of owning different funds. In addition, if these transactional costs were included, your costs would have been higher.
| HENNESSY FUNDS | 1-800-966-4354 | |
| | | | Expenses Paid |
| | Beginning | Ending | During Period(1) |
| | Account Value | Account Value | November 1, 2015 – |
| | November 1, 2015 | April 30, 2016 | April 30, 2016 |
| Investor Class | | | |
| Actual | $1,000.00 | $ 929.50 | $6.28 |
| Hypothetical (5% return before expenses) | $1,000.00 | $1,018.35 | $6.57 |
| | | | |
| Institutional Class | | | |
| Actual | $1,000.00 | $ 930.60 | $4.66 |
| Hypothetical (5% return before expenses) | $1,000.00 | $1,020.04 | $4.87 |
(1) | Expenses are equal to the Fund’s annualized expense ratio of 1.31% for Investor Class shares or 0.97% for Institutional Class shares, as applicable, multiplied by the average account value over the period, multiplied by 182/366 days (to reflect one-half year period). |
How to Obtain a Copy of the Fund’s
Proxy Voting Policy and Proxy Voting Records
A description of the policies and procedures the Fund uses to determine how to vote proxies relating to portfolio securities is available without charge: (1) by calling 1-800-966-4354; (2) on the Hennessy Funds’ website at hennessyfunds.com/proxy-voting/policy.fs; or (3) on the U.S. Securities and Exchange Commission’s website at www.sec.gov. The Fund’s proxy voting record is available without charge on both the Hennessy Funds’ website at hennessyfunds.com/proxy-voting/policy.fs and the SEC’s website at www.sec.gov no later than August 31 for the prior 12 months ending June 30.
Quarterly Filings on Form N-Q
The Fund files its complete schedule of portfolio holdings with the SEC for the first and third quarters of each fiscal year on Form N-Q. The Fund’s Form N-Q will be available on the SEC’s website at www.sec.gov. The Fund’s Form N-Q may be reviewed and copied at the SEC’s Public Reference Room in Washington, DC and information on the operation of the Public Reference Room may be obtained by calling 1-800-SEC-0330. Information included in the Fund’s N-Q will also be available upon request by calling 1-800-966-4354.
Householding
To help keep the Fund’s costs as low as possible, we generally deliver a single copy of most financial reports and prospectuses to shareholders who share an address, even if the accounts are registered under different names. This process, known as “householding,” does not apply to account statements. You may, of course, request an individual copy of a prospectus or financial report at any time. If you would like to receive separate mailings, please call the Administrator at 1-800-261-6950 or 1-414-765-4124 and we will begin individual delivery within 30 days of your request. If your account is held through a financial institution or other intermediary, please contact them directly to request individual delivery.
| HENNESSY FUNDS | 1-800-966-4354 | |
Board Approval of Investment Advisory
Agreement
At its meeting on March 9, 2016, the Board of Trustees of the Fund (the “Board,” and the members thereof, the “Trustees”) unanimously approved the continuation of the investment advisory agreement of the Fund with Hennessy Advisors, Inc. (the “Advisor”). As part of the process of approving the continuation of the advisory agreement, the Trustees reviewed their fiduciary duties with respect to approving the advisory agreement and the relevant factors for them to consider. In addition, the Trustees who are not deemed “interested persons” (as that term is defined by the Investment Company Act of 1940) of the Fund (the “Independent Trustees”) met in executive session to discuss the approval of the advisory agreement.
In advance of the meeting, the Advisor sent detailed information to the Trustees to assist them in their evaluation of the advisory agreement. This information included, but was not limited to, (i) a memorandum from outside legal counsel that described the fiduciary duties of the Board with respect to approving the continuation of the advisory agreement and the relevant factors for consideration, (ii) a memorandum from the Advisor that listed the factors relevant to the Board’s approval of the continuation of the advisory agreement and also referenced the documents that had been provided to help the Board assess each such factor, (iii) an inventory of the range of services provided by the Advisor for the Fund, (iv) a written discussion of economies of scale, (v) the advisory agreement, (vi) a recent Fund fact sheet, (vii) a peer expense comparison, (viii) performance information, (ix) the Advisor’s most recent Form 10-K and Form 10-Q, which included information about the Advisor’s profitability, (x) information about brokerage commissions, (xi) information about the Fund’s compliance program, (xii) the Advisor’s current Form ADV Part I, and (xii) other information the Trustees believed was useful in evaluating the approval of the continuation of the advisory agreement.
All of the factors discussed by the Trustees were considered as a whole, and were considered separately by the Independent Trustees, meeting in executive session. The factors were viewed in their totality by the Trustees, with no single factor being the principal or determinative factor in the Trustees’ determination of whether to approve the continuation of the advisory agreement. The Trustees recognized that the management and fee arrangements for the Fund are the result of years of review and discussion between the Independent Trustees and the Advisor, that certain aspects of such arrangements may receive greater scrutiny in some years than in others, and that the Trustees’ conclusions may be based, in part, on their consideration of these same arrangements and information received during the course of the year and in prior years.
Prior to approving the continuation of the advisory agreement, the Trustees and the Independent Trustees in executive session considered, among other items:
| | • | The nature and quality of the advisory services provided by the Advisor. |
| | • | A comparison of the fees and expenses of the Fund to other similar funds. |
| | • | Whether economies of scale are recognized by the Fund. |
| | • | The costs and profitability of the Fund to the Advisor. |
| | • | The performance of the Fund. |
| | • | The other benefits to the Advisor from serving as an investment advisor to the Fund (in addition to the advisory fee). |
The material considerations and determinations of the Board of Trustees, including all of the Independent Trustees, are as follows:
| | • | The Board considered the services identified below that are provided by the Advisor. Based on this review, the Trustees believe that the Advisor provides high-quality services to the Fund, and they noted that their overall confidence in the Advisor is high. The Trustees also concluded that they were satisfied with the nature, extent, and quality of the advisory services provided to the Fund by the Advisor, and that the nature and extent of the services provided by the Advisor are appropriate to assure that the Fund’s operations are conducted in compliance with applicable laws, rules, and regulations. |
| | | • | The Advisor acts as the portfolio manager for the Fund. In this capacity, the Advisor does the following: |
| | | | • | manages the composition of the Fund’s portfolio, including the purchase, retention, and disposition of portfolio securities in accordance with the Fund’s investment objectives, policies, and restrictions; |
| | | | • | ensures compliance with “best execution” for the Fund’s portfolio; |
| | | | • | manages the use of soft dollars for the Fund; |
| | | | • | manages proxy voting for the Fund; and |
| | | | • | holds a perpetual, royalty-free, exclusive license to the formula used for the Fund. |
| | | • | The Advisor performs a daily reconciliation of portfolio positions and cash for the Fund. |
| | | • | The Advisor monitors the Fund’s compliance with its investment objectives and restrictions. |
| | | • | The Advisor monitors compliance with federal securities laws and performs activities such as maintaining a compliance program, conducting ongoing reviews of the compliance programs of the Fund’s service providers, conducting on-site visits to the Fund’s service providers, monitoring incidents of abusive trading practices, reviewing Fund expense accruals, payments, and fixed expense ratios, evaluating insurance providers for fidelity bond coverage and D&O/E&O insurance coverage, conducting employee compliance training, reviewing reports provided by service providers, maintaining books and records, and preparing an annual compliance report to the Board. |
| | | • | The Advisor oversees service providers that provide accounting, administration, distribution, transfer agency, custodial, sales and marketing, public relations, audit, information technology, and legal services to the Fund. |
| | | • | The Advisor maintains in-house marketing and distribution departments on behalf of the Fund. |
| | | • | The Advisor is actively involved with preparing regulatory filings for the Fund, including writing and annually updating the Fund’s prospectus and related documents. |
| | | • | The Advisor prepares a written summary of the Fund’s performance for the most recent six-month period or twelve-month period, as applicable, for each semi-annual and annual report of the Fund. |
| | | • | The Advisor oversees distribution of the Fund through third-party broker/dealers and independent financial institutions such as Charles Schwab, Inc., Fidelity, TD Waterhouse, and Pershing. The Advisor participates in “no transaction fee” (“NTF”) programs with these companies on behalf of the Fund, |
| HENNESSY FUNDS | 1-800-966-4354 | |
| | | | which allow customers to purchase the Fund through third-party distribution channels without paying a transaction fee. The Advisor compensates, in part, a number of these third-party providers of NTF programs out of its own revenues. |
| | | • | The Advisor pays the incentive compensation of the Fund’s compliance officers and employs other staff, such as management executives, legal personnel, marketing personnel, national accounts and distribution personnel, sales personnel, administrative personnel, and trading oversight personnel. |
| | | • | The Advisor provides a quarterly compliance certification to the Board. |
| | | • | The Advisor prepares or reviews Board materials, frequently presents to the Board or leads Board discussions, prepares or reviews meeting minutes, and arranges for Board training and education. |
| | • | The Board compared the performance of the Fund to benchmark indices over various periods of time and they noted that at each quarterly meeting, the Trustees review reports comparing the investment performance of the Fund to various indices. Based on the information provided at the meeting and the information and quarterly discussions regarding the Fund’s investment performance, the Trustees believe that the Advisor manages the Fund in a manner that is materially consistent with its stated investment objective and style. The Trustees concluded that the performance of the Fund over various time horizons warranted the continuation of the advisory agreement. |
| | • | The Board reviewed the advisory fees and overall expense ratios of the Fund and comparable funds using data from Morningstar with respect to funds similar in asset size and investment objective to the Fund. As part of the discussion with management, the Trustees ensured that they understood and were comfortable with the criteria used to determine the mutual funds included in the Morningstar categories for purposes of the materials considered at the meeting. The Board determined that the advisory fee and overall expense ratio of the Fund falls within the range of the advisory fees and overall expense ratios of other comparable funds and concluded that they are reasonable and warranted continuation of the advisory agreement. |
| | • | The Board also considered whether economies of scale were being realized by the Advisor that should be shared with the Fund’s shareholders. The Trustees noted that many of the expenses incurred to manage the Fund are asset-based fees and thus do not result in material economies of scale being realized as the net assets of the Fund increase. For example, intermediary service fees increase as the Fund’s assets grow. The Trustees also considered the Advisor’s efforts to contain expenses, and took into account the Advisor’s significant marketing efforts to increase Fund assets. The Board noted that at current asset levels it did not appear that there were economies of scale being realized by the Advisor and concluded that it would continue to monitor economies of scale in the future as circumstances changed. |
| | • | The Board considered the profitability of the Advisor, including the impact of intermediary service fees on the Advisor’s profitability, and also considered the resources and revenues that the Advisor has put into managing and distributing the Fund. The Board then concluded that the profits of the Advisor are reasonable and not excessive when compared to profitability guidelines set forth in relevant court cases. |
| | • | The Board considered the high level of professionalism and knowledge of the Advisor’s employees, along with a very low level of turnover, and concluded that this was beneficial to the Fund and its shareholders. |
| | • | The Board considered other benefits to the Advisor from serving as an advisor to the Fund (in addition to the advisory fee). The Board noted that the Advisor may derive ancillary benefits from, by way of example, its association with the Fund in the form of proprietary and third-party research products and services received from broker dealers that execute portfolio trades for the Fund. The Board determined that any such products and services have been used for legitimate purposes relating to the Fund by providing assistance in the investment decision-making process. The Trustees concluded that the other benefits realized by the Advisor from its relationship with the Fund were reasonable. |
After reviewing the materials provided at the meeting and management’s presentation, as well as other information regularly provided at the Board’s quarterly meetings throughout the year regarding the quality of services provided by the Advisor, the performance of the Fund, expense information, regulatory compliance issues, trading information and related matters, and other factors deemed relevant by the Board, the Trustees, including all of the Independent Trustees, approved the continuation of the advisory agreement.
| HENNESSY FUNDS | 1-800-966-4354 | |
(This Page Intentionally Left Blank.)
For information, questions or assistance, please call
The Hennessy Funds
1-800-966-4354 or 1-415-899-1555
INVESTMENT ADVISOR
Hennessy Advisors, Inc.
7250 Redwood Blvd., Suite 200
Novato, California 94945
ADMINISTRATOR,
TRANSFER AGENT,
DIVIDEND PAYING AGENT &
SHAREHOLDER SERVICING AGENT
U.S. Bancorp Fund Services, LLC
P.O. Box 701
Milwaukee, Wisconsin 53201-0701
CUSTODIAN
U.S. Bank N.A.
Custody Operations
1555 North River Center Dr., Suite 302
Milwaukee, Wisconsin 53212
TRUSTEES
Neil J. Hennessy
Robert T. Doyle
J. Dennis DeSousa
Gerald P. Richardson
COUNSEL
Foley & Lardner LLP
777 East Wisconsin Avenue
Milwaukee, Wisconsin 53202-5306
INDEPENDENT REGISTERED
PUBLIC ACCOUNTING FIRM
KPMG LLP
777 East Wisconsin Avenue
Milwaukee, Wisconsin 53202-5306
DISTRIBUTOR
Quasar Distributors, LLC
615 East Michigan Street
Milwaukee, Wisconsin 53202
hennessyfunds.com | 1-800-966-4354
This report has been prepared for shareholders and may be distributed to
others only if preceded or accompanied by a current prospectus.
SEMI-ANNUAL REPORT
APRIL 30, 2016
HENNESSY FOCUS FUND
Investor Class HFCSX
Institutional Class HFCIX
hennessyfunds.com | 1-800-966-4354
(This Page Intentionally Left Blank.)
Contents
| Letter to Shareholders | 2 |
| Performance Overview | 4 |
| Financial Statements | |
| Schedule of Investments | 7 |
| Statement of Assets and Liabilities | 11 |
| Statement of Operations | 12 |
| Statements of Changes in Net Assets | 13 |
| Financial Highlights | 14 |
| Notes to the Financial Statements | 18 |
| Expense Example | 26 |
| Proxy Voting | 28 |
| Quarterly Filings on Form N-Q | 28 |
| Federal Tax Distribution Information | 28 |
| Householding | 28 |
| Board Approval of Investment Advisory Agreements | 29 |
| HENNESSY FUNDS | 1-800-966-4354 | |
June 2016
Dear Hennessy Funds Shareholder:
I used to tell my kids, “What doesn’t kill you makes you stronger.” Perhaps that is not the best analogy for investing, but in the face of such roller coaster volatility in the financial markets, it seems to me that what hasn’t killed this bull market rally may just make it stronger. The financial markets brought us flat to modest returns during the six months ended April 30, 2016, with the S&P 500 Index returning 0.43% and the Dow Jones Industrial Average (DJIA) returning 1.98% during the period. These six months were marked by high volatility, the onslaught of more and more regulatory hurdles, the Fed stuck in neutral, fears about the global economy, and wild political rhetoric — all headwinds that I believe could have significantly stalled any positive moves in the market, but didn’t. Even the aggressive pull back in January showed just how skittish the market can be, and yet again the markets showed great resiliency and marched right back.
I continue to be impressed with the persistence of the bull market in U.S. equities, now in its seventh year. Many commentators believe that the U.S. economy is due for a recession, and the market is due for a downturn. However, we find ourselves comparing today’s secular market to the bull run of 1982 to 2000, which was powered by a significant increase in valuations. On March 9th of this year, I took a moment to remember how we all felt seven years ago on March 9, 2009, at the bottom of the financial crisis downturn that had wiped out trillions of dollars’ worth of U.S. equities. I explained to our investors then, and I say the same thing today, I believe that if you invest in quality companies with good fundamentals, over the long term, you should do fine.
If history is any kind of guide, then I think this bull market has some room to run. Rising markets usually fall when there is extreme optimism or euphoria. I haven’t witnessed any of that as of yet. The volatility has unnerved many, but I encourage investors to try to remain focused on investment fundamentals. Many U.S. companies continue to find ways to make a profit and build their already strong balance sheets. Unemployment is low, and wages are rising in real terms, supporting consumer confidence and consumption. With an average price-to-sales ratio of only 1.7x and a dividend yield of approximately 2.5% for the Dow, I believe U.S. equities continue to be attractive. In my opinion, there are many compelling reasons why this market can continue to climb even higher.
The next six months may be fraught with more talk about what the Fed will do, who the next President of the United States will be, and what is happening in China and around the globe. Businesses in every industry, including the asset management business, have concerns about increasing regulatory burdens, taxes, and higher healthcare costs. But, I still believe the ingenuity and perseverance of American business will find ways to endure and to thrive.
Thank you for your continued confidence and investment in our products. If you have any questions or would like to speak with us directly, please don’t hesitate to call us at (800) 966-4354.
Best regards,
Neil J. Hennessy
President and Chief Investment Officer
Past performance does not guarantee future results.
Mutual fund investing involves risk. Principal loss is possible.
Opinions expressed are those of Neil Hennessy and are subject to change, are not guaranteed and should not be considered investment advice.
Price-to-sales ratio is a tool for calculating a stock’s valuation relative to other companies. It is calculated by dividing a stock’s current price by its revenue per share. Dividend yield is calculated as the annual dividends paid by a company divided by its market price per share.
The Dow Jones Industrial Average and S&P 500 Index are unmanaged indices commonly used to measure the performance of U.S. stocks. One cannot invest directly in an index.
| HENNESSY FUNDS | 1-800-966-4354 | |
Performance Overview (Unaudited)
AVERAGE ANNUAL TOTAL RETURN FOR PERIODS ENDED APRIL 30, 2016
| | Six | One | Five | Ten |
| | Months(1) | Year | Years | Years |
| Hennessy Focus Fund – | | | | |
| Investor Class (HFCSX) | -1.64% | 0.91% | 12.94% | 9.04% |
| Hennessy Focus Fund – | | | | |
| Institutional Class (HFCIX) | -1.46% | 1.30% | 13.29% | 9.33% |
Russell 3000® Index | 0.06% | -0.18% | 10.50% | 6.85% |
Russell Mid Cap® Growth Index | -1.54% | -4.13% | 9.20% | 7.38% |
Expense ratios: 1.47% (Investor Class); 1.12% (Institutional Class)
Performance data quoted represents past performance; past performance does not guarantee future results. The investment return and principal value of an investment will fluctuate so that an investor’s shares, when redeemed, may be worth more or less than their original cost. The performance table does not reflect the deduction of taxes that a shareholder would pay on Fund distributions or the redemption of Fund shares. Current performance of the Fund may be lower or higher than the performance quoted. Performance data current to the most recent month end may be obtained by visiting hennessyfunds.com. Performance for periods prior to October 26, 2012, is that of the FBR Focus Fund.
The expense ratios presented are from the most recent prospectus.
(1) | Periods less than one year are not annualized. |
PERFORMANCE NARRATIVE
Portfolio Managers Brian E. Macauley, CFA, David S. Rainey, CFA, and Ira M. Rothberg, CFA Broad Run Investment Management, LLC (sub-advisor)
Performance:
For the six-month period ended April 30, 2016, the Investor Class of the Hennessy Focus Fund returned -1.64%, underperforming both the Russell 3000® Index and the Russell Midcap® Growth Index, which returned 0.06% and -1.54%, respectively, for the same period.
Leading contributors to the Fund’s performance were Aon plc, Gaming and Leisure Properties, Inc. and American Tower Corporation, all of which the Fund continues to hold. Each of these companies produced attractive financial results over the six-month period, which helped drive appreciation in their stock prices. Leading detractors from the Fund’s performance were Encore Capital Group, Inc., O’Reilly Automotive, Inc., and CarMax, Inc. We believe that these businesses are likely to provide compelling forward returns, so the Fund continues to hold these investments.
We invest with a long-term time horizon and encourage shareholders to do the same. Despite the discussion of six-month results referenced above, we encourage fellow shareholders to also evaluate the Fund’s performance over five- and ten-year periods since shorter time periods can be influenced by many transitory issues unrelated to the growth in the intrinsic value of the Fund’s holdings.
Investment Outlook:
We continue to have a positive long-term outlook for the Fund. In the Fund, we seek to own a small collection of exceptional businesses at attractive valuations, and to hold these businesses long term, allowing their growth in earnings to drive most of the Fund’s
investment results. It is challenging to identify businesses that meet our high hurdle for earnings growth, and rare to find them at appealing valuations. Fortunately, our concentrated and long-term oriented investment approach does not require frequent activity; on average, we only need to add a few new investments to the portfolio each year.
A key tool in our search for these new investments is our “watch list.” This is our shopping list of exceptional businesses that we would like to own if valuation and/or other circumstances allowed. This list reflects our collective knowledge after more than a decade of scouring the markets and conducting research to identify businesses that meet our five investment criteria: high-quality business, large growth opportunity, excellent management, low “tail risk,” and discount valuation.
Some businesses have been on the watch list for just a few months, while others have been there for many years. We are continually looking to add to and refine this list, while advancing our understanding of these businesses and the industries in which they operate. Over the course of time, some development will typically occur at a watch list business spurring a fresh look and intensified consideration for its inclusion in the portfolio; perhaps the stock overacts to negative short-term news, there is a favorable industry development, or our own synthesis of information leads to a breakthrough insight. If we had not previously studied these businesses and been monitoring them, we would not be well positioned to notice the particular catalyst, nor able to intensify our research and reach an investment conclusion in as timely a manner.
During the six-month period ended April 30, 2016, we established a new position in AMETEK, Inc. at a 1% initial weighting. AMETEK makes a wide variety of specialized electrical and mechanical instruments for industrial applications. AMETEK compounded earnings per share at close to 16% per annum over the last 10 years by acquiring leading niche instruments businesses and dramatically improving them using a variety of management tools, including low-cost sourcing, value engineering, lean manufacturing, etc. The same people that executed this business plan in the past remain largely in place today, and we believe there is sufficient runway to continue executing this acquisition model for at least the next decade.
AMETEK is an idea from our watch list. We first studied AMETEK in early 2015 while making a systematic review of acquisition-oriented industrial conglomerates. AMETEK stood out from its peers for a variety of reasons, so we advanced our work and added it to our watch list in the second quarter of 2015. At the time, we liked the business but were concerned that falling oil prices, weakening emerging markets, and the strengthening U.S. dollar were not sufficiently reflected in consensus earnings expectations. By the first quarter of 2016, after revenue and earnings guidance were reset lower several times, we thought expectations more accurately reflected the macroeconomic challenges. Our continued research had advanced our understanding and appreciation of the business, so we initiated a small position. Over time, should our ongoing research reinforce our investment thesis, we will look to add to the position opportunistically.
Opinions expressed are those of the Portfolio Managers as of the date written and are subject to change, are not guaranteed, and should not be considered investment advice or an indication of trading intent.
The Russell 3000® Index is an unmanaged index commonly used to measure the performance of U.S. stocks. The Russell Midcap® Growth Index is an unmanaged index commonly used to measure the performance of U.S. medium-capitalization growth stocks. One cannot invest directly in an index.
The Fund is non-diversified, meaning it may concentrate its assets in fewer individual holdings than a diversified fund, making it more exposed to individual stock volatility than a diversified
| HENNESSY FUNDS | 1-800-966-4354 | |
fund. The Fund invests in small and medium capitalized companies, which involves additional risks such as limited liquidity and greater volatility. Investments in foreign securities involve greater volatility and political, economic and currency risk and differences in accounting methods.
References to specific securities should not be considered a recommendation to buy or sell any security. Fund holdings and sector allocations are subject to change. Please refer to the Schedule of Investments included in this report for additional portfolio information.
Earnings growth is not a measure of the Fund’s future performance.
Financial Statements
Schedule of Investments as of April 30, 2016 (Unaudited) |
HENNESSY FOCUS FUND
(% of Net Assets)
| TOP TEN HOLDINGS (EXCLUDING CASH/CASH EQUIVALENTS) | % NET ASSETS |
| American Tower Corp., Class A | 9.65% |
| O’Reilly Automotive, Inc. | 9.49% |
| Markel Corp. | 8.32% |
| CarMax, Inc. | 6.73% |
| Brookfield Asset Management, Inc. | 6.59% |
| Aon PLC | 5.31% |
| Hexcel Corp. | 4.08% |
| The Charles Schwab Corp. | 4.00% |
| Gaming and Leisure Properties, Inc. | 3.84% |
| Twenty First Century Fox, Inc. | 3.79% |
Note: For presentation purposes, the Fund has grouped some of the industry categories. For purposes of categorizing securities for compliance with section 8(b)(1) of the Investment Company Act of 1940, as amended, the Fund uses more specific industry classifications.
| HENNESSY FUNDS | 1-800-966-4354 | |
| | COMMON STOCKS – 69.84% | | Number | | | | | | % of | |
| | | | of Shares | | | Value | | | Net Assets | |
| | Consumer Discretionary – 20.84% | | | | | | | | | |
| | CarMax, Inc. (a) | | | 2,962,712 | | | $ | 156,875,601 | | | | 6.73 | % |
| | O’Reilly Automotive, Inc. (a) | | | 842,815 | | | | 221,390,644 | | | | 9.49 | % |
| | Penn National Gaming, Inc. (a) | | | 1,197,772 | | | | 19,320,062 | | | | 0.83 | % |
| | Twenty First Century Fox, Inc. | | | 2,917,592 | | | | 88,286,334 | | | | 3.79 | % |
| | | | | | | | | 485,872,641 | | | | 20.84 | % |
| | | | | | | | | | | | | | |
| | Energy – 3.10% | | | | | | | | | | | | |
| | World Fuel Services Corp. | | | 1,547,585 | | | | 72,318,647 | | | | 3.10 | % |
| | | | | | | | | | | | | | |
| | Financials – 28.73% | | | | | | | | | | | | |
| | Aon PLC (b) | | | 1,179,036 | | | | 123,940,264 | | | | 5.31 | % |
| | Brookfield Asset Management, Inc. (b) | | | 4,543,328 | | | | 153,655,353 | | | | 6.59 | % |
| | Diamond Hill Investment Group, Inc. | | | 151,439 | | | | 26,541,199 | | | | 1.14 | % |
| | Encore Capital Group, Inc. (a) (d) | | | 2,258,784 | | | | 63,584,770 | | | | 2.73 | % |
| | Markel Corp. (a) | | | 215,672 | | | | 193,912,852 | | | | 8.32 | % |
| | Marlin Business Services Corp. (d) | | | 1,010,273 | | | | 14,941,938 | | | | 0.64 | % |
| | The Charles Schwab Corp. | | | 3,280,035 | | | | 93,185,794 | | | | 4.00 | % |
| | | | | | | | | 669,762,170 | | | | 28.73 | % |
| | | | | | | | | | | | | | |
| | Health Care – 2.02% | | | | | | | | | | | | |
| | Henry Schein, Inc. (a) | | | 279,398 | | | | 47,134,443 | | | | 2.02 | % |
| | | | | | | | | | | | | | |
| | Industrials – 9.84% | | | | | | | | | | | | |
| | American Woodmark Corp. (a) (d) | | | 1,115,708 | | | | 81,268,171 | | | | 3.49 | % |
| | Ametek, Inc. | | | 459,822 | | | | 22,112,840 | | | | 0.95 | % |
| | Hexcel Corp. | | | 2,101,635 | | | | 95,141,016 | | | | 4.08 | % |
| | Mistras Group, Inc. (a) | | | 846,695 | | | | 20,633,957 | | | | 0.88 | % |
| | Roadrunner Transportation Systems, Inc. (a) | | | 869,200 | | | | 10,273,944 | | | | 0.44 | % |
| | | | | | | | | 229,429,928 | | | | 9.84 | % |
| | | | | | | | | | | | | | |
| | Information Technology – 5.31% | | | | | | | | | | | | |
| | Alphabet, Inc., Class A (a) | | | 68,984 | | | | 48,832,394 | | | | 2.10 | % |
| | Alphabet, Inc., Class C (a) | | | 108,017 | | | | 74,856,861 | | | | 3.21 | % |
| | | | | | | | | 123,689,255 | | | | 5.31 | % |
| | Total Common Stocks | | | | | | | | | | | | |
| | (Cost $983,420,761) | | | | | | | 1,628,207,084 | | | | 69.84 | % |
The accompanying notes are an integral part of these financial statements.
| | REITS – 13.49% | | Number | | | | | | % of | |
| | | | of Shares | | | Value | | | Net Assets | |
| | Financials – 13.49% | | | | | | | | | |
| | American Tower Corp., Class A | | | 2,145,080 | | | $ | 224,975,990 | | | | 9.65 | % |
| | Gaming and Leisure Properties, Inc. | | | 2,727,432 | | | | 89,432,495 | | | | 3.84 | % |
| | | | | | | | | | | | | | |
| | Total REITS | | | | | | | | | | | | |
| | (Cost $165,878,555) | | | | | | | 314,408,485 | | | | 13.49 | % |
| | | | | | | | | | | | | | |
| | | | | | | | | | | | | | |
| | | | | | | | | | | | | | |
| | | | | | | | | | | | | | |
| | SHORT-TERM INVESTMENTS – 16.55% | | | | | | | | | | | | |
| | Money Market Funds – 16.55% | | | | | | | | | | | | |
| | Dreyfus Government Cash Management, 0.20% (c) | | | 35,397,456 | | | | 35,397,456 | | | | 1.52 | % |
| | Federated Government Obligations Fund, Class I, 0.21% (c) | | | 116,835,000 | | | | 116,835,000 | | | | 5.01 | % |
| | Federated Treasury Obligations Fund, 0.17% (c) | | | 116,835,000 | | | | 116,835,000 | | | | 5.01 | % |
| | Fidelity Government Portfolio, Institutional Class, 0.23% (c) | | | 116,835,000 | | | | 116,835,000 | | | | 5.01 | % |
| | | | | | | | | 385,902,456 | | | | 16.55 | % |
| | Total Short-Term Investments | | | | | | | | | | | | |
| | (Cost $385,902,456) | | | | | | | 385,902,456 | | | | 16.55 | % |
| | | | | | | | | | | | | | |
| | Total Investments | | | | | | | | | | | | |
| | (Cost $1,535,201,772) – 99.88% | | | | | | | 2,328,518,025 | | | | 99.88 | % |
| | | | | | | | | | | | | | |
| | Other Assets in | | | | | | | | | | | | |
| | Excess of Liabilities – 0.12% | | | | | | | 2,780,144 | | | | 0.12 | % |
| | | | | | | | | | | | | | |
| | TOTAL NET ASSETS – 100.00% | | | | | | $ | 2,331,298,169 | | | | 100.00 | % |
Percentages are stated as a percent of net assets.
REIT – Real Estate Investment Trust
| (a) | Non-income producing security. |
| (b) | U.S. traded security of a foreign corporation. |
| (c) | The rate listed is the fund’s 7-day yield as of April 30, 2016. |
| (d) | Investment represents five percent or more of the outstanding voting securities of the issuer, and is or was an affiliate of the Hennessy Focus Fund, as defined in the Investment Company Act of 1940, as amended, at or during the period ended April 30, 2016. Details of transactions with these affiliated companies for the period ended April 30, 2016, are as follows: |
| | | | American | | | Encore Capital | | | Marlin Business | |
| | Issuer | | Woodmark Corp. | | | Group, Inc. | | | Services Corp. | |
| | Beginning Cost | | $ | 32,425,960 | | | $ | 72,792,945 | | | $ | 15,865,289 | |
| | Purchase Cost | | $ | 13,163,740 | | | $ | 732,458 | | | | — | |
| | Sales Cost | | | — | | | | — | | | | — | |
| | Ending Cost | | $ | 45,589,700 | | | $ | 73,525,403 | | | $ | 15,865,289 | |
| | Dividend Income | | | — | | | | — | | | $ | 282,876 | |
| | Shares | | | 1,115,708 | | | | 2,258,784 | | | | 1,010,273 | |
| | Market Value | | $ | 81,268,171 | | | $ | 63,584,770 | | | $ | 14,941,938 | |
The accompanying notes are an integral part of these financial statements.
| HENNESSY FUNDS | 1-800-966-4354 | |
Summary of Fair Value Exposure at April 30, 2016
The following is a summary of the inputs used to value the Fund’s net assets as of April 30, 2016 (See Note 3 in the accompanying notes to the financial statements):
| Common Stocks | | Level 1 | | | Level 2 | | | Level 3 | | | Total | |
| Consumer Discretionary | | $ | 485,872,641 | | | $ | — | | | $ | — | | | $ | 485,872,641 | |
| Energy | | | 72,318,647 | | | | — | | | | — | | | | 72,318,647 | |
| Financials | | | 669,762,170 | | | | — | | | | — | | | | 669,762,170 | |
| Health Care | | | 47,134,443 | | | | — | | | | — | | | | 47,134,443 | |
| Industrials | | | 229,429,928 | | | | — | | | | — | | | | 229,429,928 | |
| Information Technology | | | 123,689,255 | | | | — | | | | — | | | | 123,689,255 | |
| Total Common Stocks | | $ | 1,628,207,084 | | | $ | — | | | $ | — | | | $ | 1,628,207,084 | |
| REITS | | | | | | | | | | | | | | | | |
| Financials | | $ | 314,408,485 | | | $ | — | | | $ | — | | | $ | 314,408,485 | |
| Total REITS | | $ | 314,408,485 | | | $ | — | | | $ | — | | | $ | 314,408,485 | |
| Short-Term Investments | | | | | | | | | | | | | | | | |
| Money Market Funds | | $ | 385,902,456 | | | $ | — | | | $ | — | | | $ | 385,902,456 | |
| Total Short-Term Investments | | $ | 385,902,456 | | | $ | — | | | $ | — | | | $ | 385,902,456 | |
| Total Investments | | $ | 2,328,518,025 | | | $ | — | | | $ | — | | | $ | 2,328,518,025 | |
Transfers between levels are recognized at the end of the reporting period. During the six-month period ended April 30, 2016, the Fund recognized no transfers between levels.
The accompanying notes are an integral part of these financial statements.
Financial Statements
Statement of Assets and Liabilities as of April 30, 2016 (Unaudited) |
| ASSETS: | | | |
| Investments in securities, at value (cost $1,400,221,380) | | $ | 2,168,723,146 | |
| Investments in affiliated securities, at value (cost $134,980,392) | | | 159,794,879 | |
| Total Investments in securities, at value (cost $1,535,201,772) | | | 2,328,518,025 | |
| Dividends and interest receivable | | | 451,292 | |
| Receivable for fund shares sold | | | 6,726,253 | |
| Receivable for securities sold | | | 65,248 | |
| Prepaid expenses and other assets | | | 78,332 | |
| Total Assets | | | 2,335,839,150 | |
| | | | | |
| LIABILITIES: | | | | |
| Payable for fund shares redeemed | | | 1,448,444 | |
| Payable to advisor | | | 1,713,800 | |
| Payable to administrator | | | 529,620 | |
| Payable to auditor | | | 10,235 | |
| Accrued distribution fees | | | 264,852 | |
| Accrued service fees | | | 135,010 | |
| Accrued expenses and other payables | | | 439,020 | |
| Total Liabilities | | | 4,540,981 | |
| NET ASSETS | | $ | 2,331,298,169 | |
| | | | | |
| NET ASSETS CONSIST OF: | | | | |
| Capital stock | | $ | 1,553,686,485 | |
| Accumulated net investment loss | | | (14,105,412 | ) |
| Accumulated net realized loss on investments | | | (1,599,157 | ) |
| Unrealized net appreciation on investments | | | 793,316,253 | |
| Total Net Assets | | $ | 2,331,298,169 | |
| | | | | |
| NET ASSETS | | | | |
| Investor Class: | | | | |
| Shares authorized (no par value) | | Unlimited | |
| Net assets applicable to outstanding Investor Class shares | | $ | 1,648,391,240 | |
| Shares issued and outstanding | | | 23,340,245 | |
| Net asset value, offering price and redemption price per share | | $ | 70.62 | |
| | | | | |
| Institutional Class: | | | | |
| Shares authorized (no par value) | | Unlimited | |
| Net assets applicable to outstanding Institutional Class shares | | $ | 682,906,929 | |
| Shares issued and outstanding | | | 9,481,176 | |
| Net asset value, offering price and redemption price per share | | $ | 72.03 | |
The accompanying notes are an integral part of these financial statements.
| HENNESSY FUNDS | 1-800-966-4354 | |
Financial Statements
Statement of Operations for the six months ended April 30, 2016 (Unaudited) |
| INVESTMENT INCOME: | | | |
Dividend income(1) | | $ | 8,431,846 | |
| Dividend income from affiliated securities | | | 282,876 | |
| Interest income | | | 222,796 | |
| Total investment income | | | 8,937,518 | |
| | | | | |
| EXPENSES: | | | | |
| Investment advisory fees (See Note 5) | | | 9,648,712 | |
| Sub-transfer agent expenses – Investor Class (See Note 5) | | | 1,621,056 | |
| Sub-transfer agent expenses – Institutional Class (See Note 5) | | | 243,678 | |
| Distribution fees – Investor Class (See Note 5) | | | 1,177,673 | |
| Administration, fund accounting, custody and transfer agent fees (See Note 5) | | | 1,050,604 | |
| Service fees – Investor Class (See Note 5) | | | 785,115 | |
| Reports to shareholders | | | 51,370 | |
| Federal and state registration fees | | | 39,123 | |
| Compliance expense | | | 11,790 | |
| Audit fees | | | 10,227 | |
| Legal fees | | | 9,972 | |
| Trustees’ fees and expenses | | | 8,727 | |
| Other expenses | | | 54,788 | |
| Total expenses | | | 14,712,835 | |
| NET INVESTMENT LOSS | | $ | (5,775,317 | ) |
| | | | | |
| REALIZED AND UNREALIZED LOSSES: | | | | |
| Net realized loss on investments | | $ | (1,315,893 | ) |
| Net change in unrealized appreciation on investments | | | (25,728,947 | ) |
| Net loss on investments | | | (27,044,840 | ) |
| NET DECREASE IN NET ASSETS RESULTING FROM OPERATIONS | | $ | (32,820,157 | ) |
(1) | Net of foreign taxes withheld of $132,824. |
The accompanying notes are an integral part of these financial statements.
Financial Statements
| Statements of Changes in Net Assets |
| | | Six Months Ended | | | | |
| | | April 30, 2016 | | | Year Ended | |
| | | (Unaudited) | | | October 31, 2015 | |
| OPERATIONS: | | | | | | |
| Net investment loss | | $ | (5,775,317 | ) | | $ | (8,322,351 | ) |
| Net realized gain (loss) on investments | | | (1,315,893 | ) | | | 4,582,644 | |
| Net change in unrealized appreciation (depreciation) | | | | | | | | |
| on investments | | | (25,728,947 | ) | | | 189,175,587 | |
| Net increase (decrease) in net assets resulting from operations | | | (32,820,157 | ) | | | 185,435,880 | |
| | | | | | | | | |
| DISTRIBUTIONS TO SHAREHOLDERS FROM: | | | | | | | | |
| Net investment income | | | | | | | | |
| Investor Class | | | — | | | | (320,240 | ) |
| Institutional Class | | | — | | | | (218,677 | ) |
| Net realized gains | | | | | | | | |
| Investor Class | | | (3,251,490 | ) | | | (91,635,474 | ) |
| Institutional Class | | | (1,083,008 | ) | | | (21,665,079 | ) |
| Total distributions | | | (4,334,498 | ) | | | (113,839,470 | ) |
| | | | | | | | | |
| CAPITAL SHARE TRANSACTIONS: | | | | | | | | |
| Proceeds from shares subscribed – Investor Class | | | 268,338,988 | | | | 523,376,866 | |
| Proceeds from shares subscribed – Institutional Class | | | 230,642,184 | | | | 279,633,599 | |
| Dividends reinvested – Investor Class | | | 3,188,245 | | | | 90,396,629 | |
| Dividends reinvested – Institutional Class | | | 867,516 | | | | 16,054,210 | |
| Cost of shares redeemed – Investor Class | | | (204,814,644 | ) | | | (266,214,310 | ) |
| Cost of shares redeemed – Institutional Class | | | (65,186,229 | ) | | | (75,766,873 | ) |
| Net increase in net assets derived | | | | | | | | |
| from capital share transactions | | | 233,036,060 | | | | 567,480,121 | |
| TOTAL INCREASE IN NET ASSETS | | | 195,881,405 | | | | 639,076,531 | |
| | | | | | | | | |
| NET ASSETS: | | | | | | | | |
| Beginning of period | | | 2,135,416,764 | | | | 1,496,340,233 | |
| End of period | | $ | 2,331,298,169 | | | $ | 2,135,416,764 | |
| Undistributed net investment loss, end of period | | $ | (14,105,412 | ) | | $ | (8,330,095 | ) |
| | | | | | | | | |
| CHANGES IN SHARES OUTSTANDING: | | | | | | | | |
| Shares sold – Investor Class | | | 3,889,458 | | | | 7,439,297 | |
| Shares sold – Institutional Class | | | 3,318,513 | | | | 3,920,855 | |
| Shares issued to holders as reinvestment | | | | | | | | |
| of dividends – Investor Class | | | 45,333 | | | | 1,371,829 | |
| Shares issued to holders as reinvestment | | | | | | | | |
| of dividends – Institutional Class | | | 12,111 | | | | 239,922 | |
| Shares redeemed – Investor Class | | | (3,048,140 | ) | | | (3,820,415 | ) |
| Shares redeemed – Institutional Class | | | (950,576 | ) | | | (1,078,256 | ) |
| Net increase in shares outstanding | | | 3,266,699 | | | | 8,073,232 | |
The accompanying notes are an integral part of these financial statements.
| HENNESSY FUNDS | 1-800-966-4354 | |
Financial Statements
For an Investor Class share outstanding throughout each period
| | | Six Months Ended | |
| | | April 30, 2016 | |
| | | (Unaudited) | |
| PER SHARE DATA: | | | |
| Net asset value, beginning of period | | $ | 71.94 | |
| | | | | |
| Income (loss) from investment operations: | | | | |
| Net investment income (loss) | | | (0.20 | ) |
| Net realized and unrealized gains (losses) on investments | | | (0.98 | ) |
| Total from investment operations | | | (1.18 | ) |
| | | | | |
| Less distributions: | | | | |
| Dividends from net investment income | | | — | |
| Dividends from net realized gains | | | (0.14 | ) |
| Total distributions | | | (0.14 | ) |
| Paid-in capital from redemption fees | | | — | |
| Net asset value, end of period | | $ | 70.62 | |
| | | | | |
| TOTAL RETURN | | | (1.64 | )%(3) |
| | | | | |
| SUPPLEMENTAL DATA AND RATIOS: | | | | |
| Net assets, end of period (millions) | | $ | 1,648.39 | |
| Ratio of expenses to average net assets | | | 1.47 | %(4) |
| Ratio of net investment income (loss) to average net assets | | | (0.63 | )%(4) |
Portfolio turnover rate(5) | | | 4 | %(3) |
(1) | Calculated based on average shares outstanding method. |
(2) | Amount is less than $0.01. |
(3) | Not annualized. |
(4) | Annualized. |
(5) | Portfolio turnover is calculated on the basis of the Fund as a whole. |
The accompanying notes are an integral part of these financial statements.
| Year Ended October 31, | |
| 2015 | | | 2014 | | | 2013 | | | 2012 | | | 2011 | |
| | | | | | | | | | | | | | |
| $ | 69.46 | | | $ | 63.58 | | | $ | 51.78 | | | $ | 49.80 | | | $ | 47.57 | |
| | | | | | | | | | | | | | | | | | | |
| | | | | | | | | | | | | | | | | | | |
| | (0.33 | ) | | | 0.27 | | | | (0.32 | ) | | | (0.39 | ) | | | (0.50 | )(1) |
| | 8.07 | | | | 6.68 | | | | 16.44 | | | | 7.61 | | | | 4.44 | |
| | 7.74 | | | | 6.95 | | | | 16.12 | | | | 7.22 | | | | 3.94 | |
| | | | | | | | | | | | | | | | | | | |
| | | | | | | | | | | | | | | | | | | |
| | (0.02 | ) | | | — | | | | — | | | | — | | | | — | |
| | (5.24 | ) | | | (1.07 | ) | | | (4.32 | ) | | | (5.24 | ) | | | (1.72 | ) |
| | (5.26 | ) | | | (1.07 | ) | | | (4.32 | ) | | | (5.24 | ) | | | (1.72 | ) |
| | — | | | | 0.00 | (2) | | | 0.00 | (2) | | | 0.00 | (2) | | | 0.01 | |
| $ | 71.94 | | | $ | 69.46 | | | $ | 63.58 | | | $ | 51.78 | | | $ | 49.80 | |
| | | | | | | | | | | | | | | | | | | |
| | 11.83 | % | | | 11.05 | % | | | 33.54 | % | | | 16.17 | % | | | 8.35 | % |
| | | | | | | | | | | | | | | | | | | |
| | | | | | | | | | | | | | | | | | | |
| $ | 1,615.36 | | | $ | 1,213.03 | | | $ | 1,139.85 | | | $ | 707.61 | | | $ | 611.34 | |
| | 1.46 | % | | | 1.41 | % | | | 1.43 | % | | | 1.41 | % | | | 1.44 | % |
| | (0.55 | )% | | | 0.41 | % | | | (0.85 | )% | | | (0.79 | )% | | | (1.01 | )% |
| | 4 | % | | | 18 | % | | | 4 | % | | | 13 | % | | | 13 | % |
The accompanying notes are an integral part of these financial statements.
| HENNESSY FUNDS | 1-800-966-4354 | |
Financial Statements
For an Institutional Class share outstanding throughout each period*
| | | Six Months Ended | |
| | | April 30, 2016 | |
| | | (Unaudited) | |
| PER SHARE DATA: | | | |
| Net asset value, beginning of period | | $ | 73.24 | |
| | | | | |
| Income (loss) from investment operations: | | | | |
| Net investment income (loss) | | | (0.06 | ) |
| Net realized and unrealized gains (losses) on investments | | | (1.01 | ) |
| Total from investment operations | | | (1.07 | ) |
| | | | | |
| Less distributions: | | | | |
| Dividends from net investment income | | | — | |
| Dividends from net realized gains | | | (0.14 | ) |
| Total distributions | | | (0.14 | ) |
| Net asset value, end of period | | $ | 72.03 | |
| | | | | |
| TOTAL RETURN | | | (1.46 | )%(2) |
| | | | | |
| SUPPLEMENTAL DATA AND RATIOS: | | | | |
| Net assets, end of period (millions) | | $ | 682.91 | |
| Ratio of expenses to average net assets | | | 1.10 | %(3) |
| Ratio of net investment income (loss) to average net assets | | | (0.28 | )%(3) |
Portfolio turnover rate(4) | | | 4 | %(2) |
| * | Per share amounts have been restated on a retroactive basis to reflect a 1:18 reverse stock split effective December 10, 2010. |
(1) | Calculated based on average shares outstanding method. |
(2) | Not annualized. |
(3) | Annualized. |
(4) | Portfolio turnover is calculated on the basis of the Fund as a whole. |
The accompanying notes are an integral part of these financial statements.
| Year Ended October 31, | |
| 2015 | | | 2014 | | | 2013 | | | 2012 | | | 2011 | |
| | | | | | | | | | | | | | |
| $ | 70.50 | | | $ | 64.32 | | | $ | 52.19 | | | $ | 50.02 | | | $ | 47.64 | |
| | | | | | | | | | | | | | | | | | | |
| | | | | | | | | | | | | | | | | | | |
| | (0.08 | ) | | | 0.35 | | | | (0.13 | ) | | | (0.22 | ) | | | (0.37 | )(1) |
| | 8.19 | | | | 6.90 | | | | 16.58 | | | | 7.63 | | | | 4.47 | |
| | 8.11 | | | | 7.25 | | | | 16.45 | | | | 7.41 | | | | 4.10 | |
| | | | | | | | | | | | | | | | | | | |
| | | | | | | | | | | | | | | | | | | |
| | (0.05 | ) | | | — | | | | — | | | | — | | | | — | |
| | (5.32 | ) | | | (1.07 | ) | | | (4.32 | ) | | | (5.24 | ) | | | (1.72 | ) |
| | (5.37 | ) | | | (1.07 | ) | | | (4.32 | ) | | | (5.24 | ) | | | (1.72 | ) |
| $ | 73.24 | | | $ | 70.50 | | | $ | 64.32 | | | $ | 52.19 | | | $ | 50.02 | |
| | | | | | | | | | | | | | | | | | | |
| | 12.23 | % | | | 11.40 | % | | | 33.94 | % | | | 16.51 | % | | | 8.53 | % |
| | | | | | | | | | | | | | | | | | | |
| | | | | | | | | | | | | | | | | | | |
| $ | 520.06 | | | $ | 283.31 | | | $ | 179.89 | | | $ | 77.28 | | | $ | 49.01 | |
| | 1.11 | % | | | 1.10 | % | | | 1.13 | % | | | 1.12 | % | | | 1.15 | % |
| | (0.19 | )% | | | 0.59 | % | | | (0.52 | )% | | | (0.52 | )% | | | (0.76 | )% |
| | 4 | % | | | 18 | % | | | 4 | % | | | 13 | % | | | 13 | % |
The accompanying notes are an integral part of these financial statements.
| HENNESSY FUNDS | 1-800-966-4354 | |
Financial Statements
Notes to the Financial Statements April 30, 2016 (Unaudited) |
1). ORGANIZATION
The Hennessy Focus Fund (the “Fund”) is a series of Hennessy Funds Trust (the “Trust”), which was organized as a Delaware statutory trust on September 17, 1992. The Fund is an open-end management investment company registered under the Investment Company Act of 1940, as amended. The Fund is a successor to the FBR Focus Fund (the “Predecessor FBR Fund”), a series of The FBR Funds, a Delaware statutory trust, pursuant to a reorganization that took place after the close of business on October 26, 2012. Prior to October 26, 2012, the Fund had no investment operations. As a result of the reorganization, holders of the Investor Class shares of the Predecessor FBR Fund received Investor Class shares of the Fund (the Investor Class shares of the Fund are the successor to the accounting and performance information of the Predecessor FBR Fund), and holders of the Institutional Class shares of the Predecessor FBR Fund received Institutional Class shares of the Fund (the Institutional Class shares of the Fund are the successor to the accounting and performance information of the Predecessor FBR Fund). The investment objective of the Fund is capital appreciation. The Fund is a non-diversified fund.
The Fund offers Investor Class and Institutional Class shares. Each class of shares differs principally in its respective administration, 12b-1 distribution and service, shareholder servicing, and transfer agent expenses and sales charges, if any. Each class has identical rights to earnings, assets, and voting privileges, except for class-specific expenses and exclusive rights to vote on matters affecting only an individual class.
As an investment company, the Fund follows the investment company accounting and reporting guidance of the Financial Accounting Standards Board (“FASB”) Accounting Standard Codification Topic 946 “Financial Services—Investment Companies.”
2). SIGNIFICANT ACCOUNTING POLICIES
The following is a summary of significant accounting policies consistently followed by the Fund in the preparation of the financial statements. These policies are in conformity with U.S. generally accepted accounting principles (“GAAP”).
| a). | Investment Valuation – All investments in securities are recorded at their estimated fair value, as described in Note 3. |
| b). | Federal Income Taxes – Provision for federal income taxes or excise taxes has not been made since the Fund has elected to be taxed as a “regulated investment company” and intends to distribute substantially all of its taxable income to its shareholders and otherwise comply with the provisions of the Internal Revenue Code of 1986, as amended, applicable to regulated investment companies. Net investment income or loss and realized gains and losses for federal income tax purposes may differ from that reported on the financial statements because of temporary book and tax basis differences. Temporary differences are primarily the result of the treatment of wash sales for tax reporting purposes. The Fund recognizes interest and penalties related to income tax benefits, if any, in the statement of operations as an income tax expense. Distributions from net realized gains for book purposes may include short-term capital gains, which are included as ordinary income to shareholders for tax purposes. |
| c). | Income and Expenses – Dividend income is recognized on the ex-dividend date or as soon as information is available to the Fund. Interest income, which includes the amortization of premium and accretion of discount, is recognized on an accrual basis. The Fund is charged for those expenses that are directly attributable to the portfolio, such as advisory, administration, and certain shareholder service fees. Income, expenses (other than expenses attributable to a specific class), and realized and unrealized gains or losses on investments are allocated to each class of shares based on its respective net assets. |
| d). | Distributions to Shareholders – Dividends from net investment income for the Fund, if any, are declared and paid annually, usually in December. Distributions of net realized capital gains, if any, are declared and paid annually, usually in December. |
| e). | Security Transactions – Investment and shareholder transactions are recorded on the trade date. The Fund determines the gain or loss realized from the investment transactions by comparing the original cost of the security lot sold with the net sale proceeds. Discounts and premiums on securities purchased are accreted/amortized over the life of the respective security. |
| f). | Use of Estimates – The preparation of financial statements in conformity with GAAP requires management to make estimates and assumptions that affect the reported amounts of assets and liabilities and disclosure of contingent assets and liabilities at the date of the financial statements and the reported change in net assets during the reporting period. Actual results could differ from those estimates. |
| g). | Share Valuation – The net asset value (“NAV”) per share of the Fund is calculated by dividing the sum of the value of the securities held by the Fund, plus cash or other assets, minus all liabilities (including estimated accrued expenses) by the total number of shares outstanding for the Fund, rounded to the nearest cent. The Fund’s shares will not be priced on days the New York Stock Exchange is closed for trading. The offering and redemption price per share for the Fund is equal to the Fund’s NAV per share. |
| h). | Foreign Currency – Values of investments denominated in foreign currencies, if any, are converted into U.S. dollars using the spot market rate of exchange at the time of valuation. Purchases and sales of investments and income are translated into U.S. dollars using the spot market rate of exchange prevailing on the respective dates of such transactions. The Fund does not isolate the portion of the results of operations resulting from fluctuations in foreign exchange rates on investments from fluctuations resulting from changes in the market prices of securities held. Such fluctuations are included with the net realized and unrealized gain or loss on investments. Foreign investments present additional risks due to currency fluctuations, economic and political factors, lower liquidity, government regulations, differences in accounting standards, and other factors. |
| i). | Forward Contracts – The Fund may enter into forward currency contracts to reduce its exposure to changes in foreign currency exchange rates on its foreign holdings and to lock in the U.S. dollar cost of firm purchase and sale commitments for securities denominated in foreign currencies. A forward currency contract is a commitment to purchase or sell a foreign currency at a future date at a negotiated forward rate. The gain or loss arising from the difference between the U.S. dollar cost of the original contract and the value of the foreign currency in U.S. dollars upon closing of such contract is included in net realized gain or loss from foreign currency transactions. During the six months ended April 30, 2016, the Fund did not enter into any forward contracts. |
| HENNESSY FUNDS | 1-800-966-4354 | |
| j). | Repurchase Agreements – The Fund may enter into repurchase agreements with member banks or security dealers of the Federal Reserve Board whom the investment advisor deems creditworthy. The repurchase price generally equals the price paid by the Fund plus interest negotiated on the basis of current short-term rates. |
| | Securities pledged as collateral for repurchase agreements are held by the custodian bank until the respective agreements mature. Provisions of the repurchase agreements ensure that the market value of the collateral, including accrued interest thereon, is sufficient to cover the repurchase amount in the event of default of the counterparty. If the counterparty defaults and the value of the collateral declines or if the counterparty enters an insolvency proceeding, realization of the collateral by the Fund may be delayed or limited. |
| k). | Accounting for Uncertainty in Income Taxes – The Fund has accounting policies regarding recognition and measurement of tax positions taken or expected to be taken on a tax return. The tax returns of the Fund for the prior three fiscal years are open for examination. The Fund has reviewed all open tax years in major jurisdictions and concluded that there is no impact on the Fund’s net assets and no tax liability resulting from unrecognized tax benefits relating to uncertain income tax positions taken or expected to be taken on a tax return. The Fund’s major tax jurisdictions are U.S. federal and Delaware. |
| l). | Derivatives – The Fund may invest in, or enter into, derivatives, such as options, futures contracts, options on futures contracts, and swaps, for a variety of reasons, including to hedge certain risks, to provide a substitute for purchasing or selling particular securities, or to increase potential income gain. Derivatives are financial contracts based on an underlying or notional amount, require no initial investment or an initial net investment that is smaller than would normally be required to have a similar response to changes in market factors, and require or permit net settlement. Derivatives may allow the Fund to increase or decrease the level of risk to which the Fund is exposed more quickly and efficiently than transactions in other types of instruments. The main purpose of utilizing derivative instruments is for hedging purposes. |
| | The Fund follows the financial accounting reporting rules as required by the Derivatives and Hedging Topic of the FASB Accounting Standards Codification. Under such rules, the Fund is required to include enhanced disclosure that enables investors to understand how and why an entity uses derivatives, how derivatives are accounted for, and how derivatives instruments affect an entity’s results of operations and financial position. During the six months ended April 30, 2016, the Fund did not hold any derivative instruments. |
| m). | New Accounting Pronouncements – In May 2015, the FASB issued ASU No. 2015-07 “Disclosure for Investments in Certain Entities that Calculate Net Asset Value per Share (or Its Equivalent).” The amendments in ASU No. 2015-07 remove the requirement to categorize within the fair value hierarchy investments measured at NAV and require the disclosure of sufficient information to reconcile the fair value of the remaining assets categorized within the fair value hierarchy to the financial statements. The amendments in ASU No. 2015-07 are effective for fiscal years beginning after December 15, 2015, and interim periods within those fiscal years. Management has reviewed the requirements and believes the adoption of ASU 2015-07 will not have a material impact on the Fund’s financial statements and related disclosures. |
3). SECURITIES VALUATION
The Fund follows authoritative fair valuation accounting standards that establish an authoritative definition of fair value and set out a hierarchy for measuring fair value.
These standards require additional disclosures about the various inputs and valuation techniques used to develop the measurements of fair value and a discussion in changes in valuation techniques and related inputs during the period. These inputs are summarized in the three broad levels listed below:
| | Level 1 – | Unadjusted, quoted prices in active markets for identical instruments that the Fund has the ability to access at the date of measurement. |
| | Level 2 – | Other significant observable inputs (including, but not limited to, quoted prices in active markets for similar instruments, quoted prices in markets that are not active for identical or similar instruments, and model-derived valuations in which all significant inputs and significant value drivers are observable in active markets (such as interest rates, prepayment speeds, credit risk curves, default rates, and similar data)). |
| | Level 3 – | Significant unobservable inputs (including the Fund’s own assumptions about what market participants would use to price the asset or liability based on the best available information) when observable inputs are unavailable. |
Following is a description of the valuation techniques applied to the Fund’s major categories of assets and liabilities measured at fair value on a recurring basis.
Equity Securities – Equity securities, including common stocks, preferred stocks, foreign-issued common stocks, exchange-traded funds, closed-end mutual funds, partnerships, rights, and real estate investment trusts, that are traded on a securities exchange for which a last-quoted sales price is readily available will generally be valued at the last sales price as reported by the primary exchange on which the securities are listed. Securities listed on The NASDAQ Stock Market (“NASDAQ”) will generally be valued at the NASDAQ Official Closing Price, which may differ from the last sales price reported. Securities traded on a securities exchange for which a last-quoted sales price is not readily available will generally be valued at the mean between the bid and ask prices. To the extent these securities are actively traded and valuation adjustments are not applied, they are classified in Level 1 of the fair value hierarchy. Securities traded on foreign exchanges generally are not valued at the same time the Fund calculates its NAV because most foreign markets close well before such time. The earlier close of most foreign markets gives rise to the possibility that significant events, including broad market moves, may have occurred in the interim. In certain circumstances, it may be determined that a security needs to be fair valued because it appears that the value of the security might have been materially affected by events occurring after the close of the market in which the security is principally traded, but before the time the Fund calculates its NAV, such as by a development that affects an entire market or region (e.g., weather-related events) or a potentially global development (e.g., a terrorist attack that may be expected to have an effect on investor expectations worldwide).
Registered Investment Companies – Investments in registered investment companies (e.g., mutual funds) are generally priced at the ending NAV provided by the applicable registered investment company’s service agent and will be classified in Level 1 of the fair value hierarchy.
Debt Securities – Debt securities, including corporate bonds, asset-backed securities, mortgage-backed securities, municipal bonds, U.S. Treasuries, and U.S. government agency issues, are generally valued at market on the basis of valuations furnished by an independent pricing service that utilizes both dealer-supplied valuations and formula-based techniques. The pricing service may consider recently executed transactions in securities of the issuer or comparable issuers, market price quotations (where observable), bond spreads, and fundamental data relating to the issuer. In addition, the model may
| HENNESSY FUNDS | 1-800-966-4354 | |
incorporate observable market data, such as reported sales of similar securities, broker quotes, yields, bids, offers, and reference data. Certain securities are valued primarily using dealer quotations. These securities are generally classified in Level 2 of the fair value hierarchy.
Short-Term Securities – Short-term equity investments, including money market funds, are valued in the manner specified above. Short-term debt investments with an original term to maturity of 60 days or less are valued at amortized cost, which approximates fair market value. If the original term to maturity of a short-term debt investment exceeded 60 days, then the values as of the 61st day prior to maturity are amortized. Amortized cost is not used if its use would be inappropriate due to credit or other impairments of the issuer, in which case the security’s fair value would be determined, as described below. Short-term securities are generally classified in Level 1 or Level 2 of the fair market hierarchy depending on the inputs used and market activity levels for specific securities.
The Board of Trustees of the Fund (the “Board”) has adopted fair value pricing procedures that are followed when a price for a security is not readily available or if a significant event has occurred that indicates the closing price of a security no longer represents the true value of that security. Fair value pricing determinations are made in good faith in accordance with these procedures. There are numerous criteria that will be given consideration in determining a fair value of a security, such as the trading volume of a security and markets, the value of other like securities, and news events with direct bearing to a security or markets. Fair value pricing results in an estimated price for a security that reflects the amount the Fund might reasonably expect to receive in a current sale. Depending on the relative significance of the valuation inputs, these securities may be classified in either Level 2 or Level 3 of the fair value hierarchy.
The fair valuation of foreign securities may be determined with the assistance of a pricing service using correlations between the movement of prices of such securities and indices of domestic securities and other appropriate indicators, such as closing market prices of relevant American Depositary Receipts or futures contracts. The effect of using fair value pricing is that the Fund’s NAV will reflect the affected portfolio securities’ value as determined by the Board or its designee instead of being determined by the market. Using a fair value pricing methodology to price foreign securities may result in a value that is different from a foreign security’s most recent closing price and from the prices used by other investment companies to calculate their NAVs and are generally considered Level 2 prices in the fair valuation hierarchy. Because the Fund may invest in foreign securities, the value of the Fund’s portfolio securities may change on days when you will not be able to purchase or redeem your shares.
The Board has delegated day-to-day valuation matters to a Valuation Committee comprised of one or more representatives from Hennessy Advisors, Inc., the Fund’s investment advisor. The function of the Valuation Committee is to value securities where current and reliable market quotations are not readily available. All actions taken by the Valuation Committee are reviewed by the Board.
The Fund has performed an analysis of all existing investments to determine the significance and character of all inputs to their fair value determination. Various inputs are used in determining the value of the Fund’s investments. The inputs or methodology used for valuing securities are not necessarily an indication of the risk associated with investing in those securities. Details related to the fair valuation hierarchy of the Fund’s securities as of April 30, 2016, are included in the Fund’s Schedule of Investments.
4). INVESTMENT TRANSACTIONS
Purchases and sales of investment securities (excluding government and short-term investments) for the Fund during the six months ended April 30, 2016, were $190,590,079 and $32,176,761, respectively.
There were no purchases or sales/maturities of long-term U.S. government securities for the Fund during the six months ended April 30, 2016.
5). INVESTMENT MANAGEMENT FEE AND OTHER TRANSACTIONS WITH AFFILIATES
Hennessy Advisors, Inc. (the “Advisor”) is the investment advisor of the Fund. The Advisor provides the Fund with investment management services under an Investment Advisory Agreement. The Advisor furnishes all investment advice, office space, facilities, and provides most of the personnel needed by the Fund. As compensation for its services, the Advisor is entitled to a monthly fee from the Fund. The fee is based upon the average daily net assets of the Fund at the annual rate of 0.90%. The net investment advisory fees payable by the Fund as of April 30, 2016, were $1,713,800.
The Advisor has delegated the day-to-day management of the Fund to a sub-advisor, Broad Run Investment Management, LLC. The Advisor pays the sub-advisor fees for the Fund from its own assets and these fees are not an additional expense of the Fund.
In the past, the Advisor had contractually agreed to limit the total annual operating expenses of the Fund to 1.95% and 1.70% of the Fund’s net assets for the Investor Class shares and Institutional Class shares of the Fund, respectively (excluding interest, taxes, brokerage commissions, dividend expenses, acquired fund fees and expenses, extraordinary legal expenses, or any other extraordinary expenses and, from and after November 1, 2014, 12b-1 fees). The expense limitation agreement for the Fund expired as of February 28, 2015.
For a period of three years after the year in which the Advisor waived or reimbursed expenses, the Advisor may seek reimbursement from the Fund to the extent that total annual fund operating expenses are less than the expense limitation that was in effect at the time the Advisor waived or reimbursed expenses. During the three years ended October 31, 2015, no expenses were waived or reimbursed by the Advisor and therefore no expenses are subject to potential recovery.
The Board has approved a Shareholder Servicing Agreement for the Investor Class shares of the Fund, effective as of February 28, 2015, which was instituted to compensate the Advisor for the non-investment management services it provides to the Fund. The Shareholder Servicing Agreement provides for a monthly fee paid to the Advisor at an annual rate of 0.10% of the average daily net assets of the Fund attributable to Investor Class shares. Shareholder service fees payable by the Fund as of April 30, 2016, were $135,010.
The Fund has adopted a plan pursuant to Rule 12b-1 under the Investment Company Act of 1940, as amended, that authorizes payments in connection with the distribution of the Fund’s shares at an annual rate of up to 0.25% of the Fund’s average daily net assets attributable to Investor Class shares. Even though the authorized rate is up to 0.25%, the Fund has only used up to 0.15% of its average daily net assets attributable to Investor Class shares for such purpose since March 1, 2015. Amounts paid under the plan may be spent on any activities or expenses primarily intended to result in the sale of shares, including, but not limited to, advertising, shareholder account servicing, the printing and mailing of prospectuses to other than current shareholders, the printing and mailing of sales literature, and compensation for sales and marketing activities or to financial institutions and others, such as dealers and distributors.
| HENNESSY FUNDS | 1-800-966-4354 | |
The Fund has entered into agreements with various brokers, dealers, and financial intermediaries in connection with the sale of shares of the Fund. The agreements provide for periodic payments by the Fund to the brokers, dealers, and financial intermediaries for providing certain shareholder maintenance services (sub-transfer agent expenses). These shareholder services include the pre-processing and quality control of new accounts, shareholder correspondence, answering customer inquiries regarding account status, and facilitating shareholder telephone transactions. Fees paid by the Fund to various brokers, dealers, and financial intermediaries during the six months ended April 30, 2016, were $1,864,734.
U.S. Bancorp Fund Services, LLC (“USBFS”) provides the Fund with administrative, fund accounting, and transfer agent services, and necessary office equipment. As administrator, USBFS is responsible for activities such as (i) preparing various federal and state regulatory filings, reports, and returns for the Fund, (ii) preparing reports and materials to be supplied to the Board, (iii) monitoring the activities of the Fund’s custodian, transfer agent, and accountants, and (iv) coordinating the preparation and payment of the Fund’s expenses and reviewing the Fund’s expense accruals. Fees paid to USBFS during the six months ended April 30, 2016, were $1,050,604.
U.S. Bank, N.A., an affiliate of USBFS, serves as the Fund’s custodian. Quasar Distributors, LLC acts as the Fund’s principal underwriter in a continuous public offering of the Fund’s shares. Quasar Distributors, LLC is an affiliate of USBFS and U.S. Bank, N.A.
6). LINE OF CREDIT
The Fund has an uncommitted line of credit with the other funds in the Hennessy Funds family of funds (the “Hennessy Funds”) in the amount of the lesser of (i) $100,000,000 or (ii) 33.33% of each Hennessy Fund’s net assets, or 30% for the Hennessy Gas Utility Fund and 10% for the Hennessy Balanced Fund, intended to provide short-term financing, if necessary, subject to certain restrictions, in connection with shareholder redemptions. The credit facility is with the Hennessy Funds’ custodian bank, U.S. Bank, N.A. Borrowings under this arrangement bear interest at the bank’s prime rate and are secured by all of the Fund’s assets (as to its own borrowings only). During the six months ended April 30, 2016, the Fund did not have any borrowings outstanding under the line of credit.
7). FEDERAL TAX INFORMATION
As of October 31, 2015, the Fund’s most recent fiscal year end, the components of accumulated earnings (losses) for income tax purposes were as follows:
| Cost of investments for tax purposes | | $ | 1,278,943,526 | |
| Gross tax unrealized appreciation | | $ | 847,489,776 | |
| Gross tax unrealized depreciation | | | (28,444,576 | ) |
| Net tax unrealized appreciation | | $ | 819,045,200 | |
| Undistributed ordinary income | | $ | — | |
| Undistributed long-term capital gains | | | 4,051,234 | |
| Total distributable earnings | | $ | 4,051,234 | |
| Other accumulated loss | | $ | (8,330,095 | ) |
| Total accumulated gain | | $ | 814,766,339 | |
At October 31, 2015, the Fund’s most recent fiscal year end, the Fund had no tax basis capital losses to offset future capital gains.
At October 31, 2015, the Fund’s most recent fiscal year end, the Fund deferred, on a tax basis, a late year ordinary loss of $8,330,095.
The tax character of distributions paid during fiscal year 2016 (year to date) and fiscal year 2015 for the Fund were as follows:
| | | Six Months Ended | | | Year Ended | |
| | | April 30, 2016 | | | October 31, 2015 | |
| Ordinary income | | $ | — | | | $ | 2,736,846 | |
| Long-term capital gain | | | 4,334,498 | | | | 111,102,624 | |
| | | $ | 4,334,498 | | | $ | 113,839,470 | |
| HENNESSY FUNDS | 1-800-966-4354 | |
Expense Example (Unaudited)
April 30, 2016
As a shareholder of the Fund, you incur two types of costs: (1) transaction costs, including sales charges (loads) on purchase payments, reinvested dividends, or other distributions; redemption fees; and exchange fees; and (2) ongoing costs, including management fees; service fees; and other Fund expenses. This Example is intended to help you understand your ongoing costs (in dollars) of investing in the Fund and to compare these costs with the ongoing costs of investing in other mutual funds. The Example is based on an investment of $1,000 invested at the beginning of the period and held for the entire period from November 1, 2015 through April 30, 2016.
Actual Expenses
The first line of the table below under the “Investor Class” and “Institutional Class” headings provides information about actual account values and actual expenses. Although the Fund charges no sales loads or transaction fees, you will be assessed fees for outgoing wire transfers, returned checks and stop payment orders at prevailing rates charged by U.S. Bancorp Fund Services, LLC, the Fund’s transfer agent. If you request that a redemption be made by wire transfer, currently a $15.00 fee is charged by the Fund’s transfer agent. IRA accounts will be charged a $15.00 annual maintenance fee. The example below includes, but is not limited to, management fees, shareholder servicing fees, fund accounting, custody, and transfer agent fees. However, the example below does not include portfolio trading commissions and related expenses, and other extraordinary expenses as determined under generally accepted accounting principles. You may use the information in this line, together with the amount you invested, to estimate the expenses that you paid over the period. Simply divide your account value by $1,000 (for example, an $8,600 account value divided by $1,000 = 8.6), then multiply the result by the number in the first line of the table under the “Investor Class” and “Institutional Class” headings in the column entitled “Expenses Paid During Period” to estimate the expenses you paid on your account during this period.
Hypothetical Example for Comparison Purposes
The second line of the table below under the “Investor Class” and “Institutional Class” headings provides information about hypothetical account values and hypothetical expenses based on the Fund’s actual expense ratios and an assumed rate of return of 5% per year before expenses, which is not the Fund’s actual return. The hypothetical account values and expenses may not be used to estimate the actual ending account balance or expenses you paid for the period. You may use this information to compare the ongoing costs of investing in the Fund and other funds. To do so, compare this 5% hypothetical example with the 5% hypothetical examples that appear in the shareholder reports of the other funds. Please note that the expenses shown in the table are meant to highlight your ongoing costs only and do not reflect any transactional costs, such as sales charges (loads), or exchange fees. Therefore, the second line of the table under the “Investor Class” and “Institutional Class” headings is useful in comparing ongoing costs only, and will not help you determine the relative total costs of owning different funds. In addition, if these transactional costs were included, your costs would have been higher.
| | | | Expenses Paid |
| | Beginning | Ending | During Period(1) |
| | Account Value | Account Value | November 1, 2015 – |
| | November 1, 2015 | April 30, 2016 | April 30, 2016 |
| Investor Class | | | |
| Actual | $1,000.00 | $ 983.60 | $7.25 |
| Hypothetical (5% return before expenses) | $1,000.00 | $1,017.55 | $7.37 |
| | | | |
| Institutional Class | | | |
| Actual | $1,000.00 | $ 985.40 | $5.43 |
| Hypothetical (5% return before expenses) | $1,000.00 | $1,019.39 | $5.52 |
(1) | Expenses are equal to the Fund’s annualized expense ratio of 1.47% for Investor Class shares or 1.10% for Institutional Class shares, as applicable, multiplied by the average account value over the period, multiplied by 182/366 days (to reflect one-half year period). |
| HENNESSY FUNDS | 1-800-966-4354 | |
How to Obtain a Copy of the Fund’s
Proxy Voting Policy and Proxy Voting Records
A description of the policies and procedures the Fund uses to determine how to vote proxies relating to portfolio securities is available without charge: (1) by calling 1-800-966-4354; (2) on the Hennessy Funds’ website at hennessyfunds.com/proxy-voting/policy.fs; or (3) on the U.S. Securities and Exchange Commission’s website at www.sec.gov. The Fund’s proxy voting record is available without charge on both the Hennessy Funds’ website at hennessyfunds.com/proxy-voting/policy.fs and the SEC’s website at www.sec.gov no later than August 31 for the prior 12 months ending June 30.
Quarterly Filings on Form N-Q
The Fund files its complete schedule of portfolio holdings with the SEC for the first and third quarters of each fiscal year on Form N-Q. The Fund’s Form N-Q will be available on the SEC’s website at www.sec.gov. The Fund’s Form N-Q may be reviewed and copied at the SEC’s Public Reference Room in Washington, DC and information on the operation of the Public Reference Room may be obtained by calling 1-800-SEC-0330. Information included in the Fund’s N-Q will also be available upon request by calling 1-800-966-4354.
Federal Tax Distribution Information
(Unaudited)
For the fiscal year ended October 31, 2015, certain dividends paid by the Fund may be subject to a maximum tax rate of 23.8%, as provided for by the Jobs and Growth Tax Relief Reconciliation Act of 2003. The percentage of dividends declared from ordinary income designated as qualified dividend income was 100.00%.
For corporate shareholders, the percent of ordinary income distributions that qualified for the corporate dividends received deduction for the fiscal year ended October 31, 2015 was 100.00%.
The percentage of taxable ordinary income distributions that are designated as short-term capital gain distributions under Section 871(k)(2)(C) of the Internal Revenue Code of 1986, as amended, for the Fund was 90.67%.
Householding
To help keep the Fund’s costs as low as possible, we generally deliver a single copy of most financial reports and prospectuses to shareholders who share an address, even if the accounts are registered under different names. This process, known as “householding,” does not apply to account statements. You may, of course, request an individual copy of a prospectus or financial report at any time. If you would like to receive separate mailings, please call the Administrator at 1-800-261-6950 or 1-414-765-4124 and we will begin individual delivery within 30 days of your request. If your account is held through a financial institution or other intermediary, please contact them directly to request individual delivery.
Board Approval of Investment Advisory
Agreements
At its meeting on March 9, 2016, the Board of Trustees of the Fund (the “Board,” and the members thereof, the “Trustees”) unanimously approved the continuation of the investment advisory agreement of the Fund with Hennessy Advisors, Inc. (the “Advisor”) and the sub-advisory agreement of the Fund between the Advisor and Broad Run Investment Management, LLC (the “Sub-Advisor”). As part of the process of approving the continuation of the advisory and sub-advisory agreements, the Trustees reviewed their fiduciary duties with respect to approving the advisory and sub-advisory agreements and the relevant factors for them to consider. In addition, the Trustees who are not deemed “interested persons” (as that term is defined by the Investment Company Act of 1940) of the Fund (the “Independent Trustees”) met in executive session to discuss the approval of the advisory and sub-advisory agreements.
In advance of the meeting, the Advisor sent detailed information to the Trustees to assist them in their evaluation of the advisory and sub-advisory agreements. This information included, but was not limited to, (i) a memorandum from outside legal counsel that described the fiduciary duties of the Board with respect to approving the continuation of the advisory and sub-advisory agreements and the relevant factors for consideration, (ii) a memorandum from the Advisor that listed the factors relevant to the Board’s approval of the continuation of the advisory and sub-advisory agreements and also referenced the documents that had been provided to help the Board assess each such factor, (iii) an inventory of the range of services provided by the Advisor and the Sub-Advisor for the Fund, (iv) a written discussion of economies of scale, (v) the advisory and sub-advisory agreements, (vi) a recent Fund fact sheet, (vii) a peer expense comparison, (viii) performance information, (ix) the Advisor’s most recent Form 10-K and Form 10-Q, which included information about the Advisor’s profitability, (x) information about brokerage commissions, (xi) information about the Fund’s compliance program, (xii) the Advisor’s current Form ADV Part I, (xiii) a completed questionnaire from the Sub-Advisor and summary thereof, (xiv) the Sub-Advisor’s Code of Ethics, and (xv) the Sub-Advisor’s Form ADV Parts I and II, and (xvi) other information the Trustees believed was useful in evaluating the approval of the continuation of the advisory and sub-advisory agreements.
All of the factors discussed by the Trustees were considered as a whole, and were considered separately by the Independent Trustees, meeting in executive session. The factors were viewed in their totality by the Trustees, with no single factor being the principal or determinative factor in the Trustees’ determination of whether to approve the continuation of the advisory and sub-advisory agreements. The Trustees recognized that the management and fee arrangements for the Fund are the result of years of review and discussion between the Independent Trustees and the Advisor, that certain aspects of such arrangements may receive greater scrutiny in some years than in others, and that the Trustees’ conclusions may be based, in part, on their consideration of these same arrangements and information received during the course of the year and in prior years.
Prior to approving the continuation of the advisory and sub-advisory agreements, the Trustees and the Independent Trustees in executive session considered, among other items:
| | • | The nature and quality of the advisory services provided by the Advisor and the Sub-Advisor. |
| | • | A comparison of the fees and expenses of the Fund to other similar funds. |
| HENNESSY FUNDS | 1-800-966-4354 | |
| | • | Whether economies of scale are recognized by the Fund. |
| | • | The costs and profitability of the Fund to the Advisor and the Sub-Advisor. |
| | • | The performance of the Fund. |
| | • | The other benefits to the Advisor and the Sub-Advisor from serving as an investment advisor to the Fund (in addition to the advisory and sub-advisory fees). |
The material considerations and determinations of the Board of Trustees, including all of the Independent Trustees, are as follows:
| | • | The Board considered the services identified below that are provided by the Advisor. Based on this review, the Trustees believe that the Advisor provides high-quality services to the Fund, and they noted that their overall confidence in the Advisor is high. The Trustees also concluded that they were satisfied with the nature, extent, and quality of the advisory services provided to the Fund by the Advisor, and that the nature and extent of the services provided by the Advisor are appropriate to assure that the Fund’s operations are conducted in compliance with applicable laws, rules, and regulations. |
| | | • | The Advisor oversees the Sub-Advisor for the Fund and the Sub-Advisor acts as the portfolio manager for the Fund. |
| | | • | The Advisor performs a daily reconciliation of portfolio positions and cash for the Fund. |
| | | • | The Advisor monitors the Fund’s compliance with its investment objectives and restrictions. |
| | | • | The Advisor monitors compliance with federal securities laws and performs activities such as maintaining a compliance program, conducting ongoing reviews of the compliance programs of the Sub-Advisor and the Fund’s other service providers, conducting on-site visits to the Sub-Advisor and the Fund’s other service providers, monitoring incidents of abusive trading practices, reviewing Fund expense accruals, payments, and fixed expense ratios, evaluating insurance providers for fidelity bond coverage and D&O/E&O insurance coverage, conducting employee compliance training, reviewing reports provided by service providers, maintaining books and records, and preparing an annual compliance report to the Board. |
| | | • | The Advisor oversees the selection and continued employment of the Sub-Advisor, monitors the Sub-Advisor’s adherence to the Fund’s investment objectives, policies, and restrictions, and reviews the Fund’s investment performance. |
| | | • | The Advisor oversees service providers that provide accounting, administration, distribution, transfer agency, custodial, sales and marketing, public relations, audit, information technology, and legal services to the Fund. |
| | | • | The Advisor maintains in-house marketing and distribution departments on behalf of the Fund. |
| | | • | The Advisor is actively involved with preparing regulatory filings for the Fund, including writing and annually updating the Fund’s prospectus and related documents. |
| | | • | The Advisor reviews the written summary prepared by the Sub-Advisor of the Fund’s performance for the most recent six-month period or twelve-month period, as applicable, for each semi-annual and annual report of the Fund. |
| | | • | The Advisor oversees distribution of the Fund through third-party broker/dealers and independent financial institutions such as Charles Schwab, Inc., Fidelity, TD Waterhouse, and Pershing. The Advisor participates in “no transaction fee” (“NTF”) programs with these companies on behalf of the Fund, which allow customers to purchase the Fund through third-party distribution channels without paying a transaction fee. The Advisor compensates, in part, a number of these third-party providers of NTF programs out of its own revenues. |
| | | • | The Advisor pays the incentive compensation of the Fund’s compliance officers and employs other staff, such as management executives, legal personnel, marketing personnel, national accounts and distribution personnel, sales personnel, administrative personnel, and trading oversight personnel. |
| | | • | The Advisor provides a quarterly compliance certification to the Board. |
| | | • | The Advisor prepares or reviews Board materials, frequently presents to the Board or leads Board discussions, prepares or reviews meeting minutes, and arranges for Board training and education. |
| | • | The Board considered the services identified below that are provided by the Sub-Advisor: |
| | | • | The Sub-Advisor acts as the portfolio manager for the Fund. In this capacity, the Sub-Advisor does the following: |
| | | | • | manages the composition of the Fund’s portfolio, including the purchase, retention, and disposition of portfolio securities in accordance with the Fund’s investment objectives, policies, and restrictions; |
| | | | • | ensures compliance with “best execution” for the Fund’s portfolio; |
| | | | • | manages the use of soft dollars for the Fund; and |
| | | | • | manages proxy voting for the Fund. |
| | | • | The Sub-Advisor ensures that its compliance program includes policies and procedures relevant to the Fund and the Sub-Advisor’s duties as a portfolio manager to the Fund. |
| | | • | The Sub-Advisor prepares a written summary of the Fund’s performance for the most recent six-month period or twelve-month period, as applicable, for each semi-annual and annual report of the Fund. |
| | | • | The Sub-Advisor provides a quarterly compliance certification to the Board regarding trading and allocation practices, supervisory matters, the Sub-Advisor’s compliance program (including its code of ethics), compliance with the Fund’s policies, and general firm updates. |
| | | • | The Board considered the distinction between the services performed by the Advisor and the Sub-Advisor. It noted that the management of the Fund, including the oversight of the Sub-Advisor, involves more comprehensive and substantive duties than the duties of the Sub-Advisor. Specifically, the Board considered the lists of services identified above and concluded that the services performed by the Advisor for the Fund require a higher level of service and oversight than the services performed by the Sub-Advisor. Based on this determination, the Board concluded that the differential in advisory fees between the Advisor and the Sub-Advisor is reasonable. |
| HENNESSY FUNDS | 1-800-966-4354 | |
| | | • | The Board compared the performance of the Fund to benchmark indices over various periods of time and they noted that at each quarterly meeting, the Trustees review reports comparing the investment performance of the Fund to various indices. Based on the information provided at the meeting and the information and quarterly discussions regarding the Fund’s investment performance, the Trustees believe that the Advisor and the Sub-Advisor manage the Fund in a manner that is materially consistent with its stated investment objective and style. The Trustees concluded that the performance of the Fund over various time horizons warranted the continuation of the advisory and sub-advisory agreements. |
| | | • | The Board reviewed the advisory fees and overall expense ratios of the Fund and comparable funds using data from Morningstar with respect to funds similar in asset size and investment objective to the Fund. As part of the discussion with management, the Trustees ensured that they understood and were comfortable with the criteria used to determine the mutual funds included in the Morningstar categories for purposes of the materials considered at the meeting. The Board determined that the advisory fee and overall expense ratio of the Fund falls within the range of the advisory fees and overall expense ratios of other comparable funds and concluded that they are reasonable and warranted continuation of the advisory and sub-advisory agreements. |
| | | • | The Board also considered whether economies of scale were being realized by the Advisor that should be shared with the Fund’s shareholders. The Trustees noted that many of the expenses incurred to manage the Fund are asset-based fees and thus do not result in material economies of scale being realized as the net assets of the Fund increase. For example, intermediary service fees increase as the Fund’s assets grow. The Trustees also considered the Advisor’s efforts to contain expenses, and took into account the Advisor’s significant marketing efforts to increase Fund assets. The Board determined that it did not appear that there were significant economies of scale being realized by the Advisor and concluded that it would continue to monitor economies of scale in the future as circumstances changed. |
| | | • | The Board considered the profitability of the Advisor and the Sub-Advisor, including the impact of intermediary service fees on the Advisor’s profitability, and also considered the resources and revenues that the Advisor has put into managing and distributing the Fund. The Board then concluded that the profits of the Advisor and the Sub-Advisor are reasonable and not excessive when compared to profitability guidelines set forth in relevant court cases. |
| | | • | The Board considered the high level of professionalism and knowledge of the Advisor’s employees, along with a very low level of turnover, and concluded that this was beneficial to the Fund and its shareholders. |
| | | • | The Board considered other benefits to the Advisor and the Sub-Advisor from serving as an advisor to the Fund (in addition to the advisory fee or sub-advisory fee). The Board noted that the Advisor and the Sub-Advisor may derive ancillary benefits from, by way of example, its association with the Fund in the form of proprietary and third-party research products and services received from broker dealers that execute portfolio trades for the Fund. The Board determined that any such products and services have been used for legitimate purposes relating to the Fund by providing assistance in the investment decision-making |
| | | | process. The Trustees concluded that the other benefits realized by the Advisor and the Sub-Advisor from their relationship with the Fund were reasonable. |
After reviewing the materials provided at the meeting and management’s presentation, as well as other information regularly provided at the Board’s quarterly meetings throughout the year regarding the quality of services provided by the Advisor and the Sub-Advisor, the performance of the Fund, expense information, regulatory compliance issues, trading information and related matters, and other factors deemed relevant by the Board, the Trustees, including all of the Independent Trustees, approved the continuation of the advisory and sub-advisory agreements.
| HENNESSY FUNDS | 1-800-966-4354 | |
For information, questions or assistance, please call
The Hennessy Funds
1-800-966-4354 or 1-415-899-1555
INVESTMENT ADVISOR
Hennessy Advisors, Inc.
7250 Redwood Blvd., Suite 200
Novato, California 94945
ADMINISTRATOR,
TRANSFER AGENT,
DIVIDEND PAYING AGENT &
SHAREHOLDER SERVICING AGENT
U.S. Bancorp Fund Services, LLC
P.O. Box 701
Milwaukee, Wisconsin 53201-0701
CUSTODIAN
U.S. Bank N.A.
Custody Operations
1555 North River Center Dr., Suite 302
Milwaukee, Wisconsin 53212
TRUSTEES
Neil J. Hennessy
Robert T. Doyle
J. Dennis DeSousa
Gerald P. Richardson
COUNSEL
Foley & Lardner LLP
777 East Wisconsin Avenue
Milwaukee, Wisconsin 53202-5306
INDEPENDENT REGISTERED
PUBLIC ACCOUNTING FIRM
Tait, Weller & Baker LLP
1818 Market Street, Suite 2400
Philadelphia, Pennsylvania 19103
DISTRIBUTOR
Quasar Distributors, LLC
615 East Michigan Street
Milwaukee, Wisconsin 53202
hennessyfunds.com | 1-800-966-4354
This report has been prepared for shareholders and may be distributed to
others only if preceded or accompanied by a current prospectus.
SEMI-ANNUAL REPORT
APRIL 30, 2016
HENNESSY CORNERSTONE
MID CAP 30 FUND
Investor Class HFMDX
Institutional Class HIMDX
hennessyfunds.com | 1-800-966-4354
(This Page Intentionally Left Blank.)
Contents
| Letter to Shareholders | 2 |
| Performance Overview | 4 |
| Financial Statements | |
| Schedule of Investments | 6 |
| Statement of Assets and Liabilities | 10 |
| Statement of Operations | 11 |
| Statements of Changes in Net Assets | 13 |
| Financial Highlights | 14 |
| Notes to the Financial Statements | 18 |
| Expense Example | 26 |
| Proxy Voting | 28 |
| Quarterly Filings on Form N-Q | 28 |
| Federal Tax Distribution Information | 28 |
| Householding | 28 |
| Board Approval of Investment Advisory Agreement | 29 |
| HENNESSY FUNDS | 1-800-966-4354 | |
June 2016
Dear Hennessy Funds Shareholder:
I used to tell my kids, “What doesn’t kill you makes you stronger.” Perhaps that is not the best analogy for investing, but in the face of such roller coaster volatility in the financial markets, it seems to me that what hasn’t killed this bull market rally may just make it stronger. The financial markets brought us flat to modest returns during the six months ended April 30, 2016, with the S&P 500 Index returning 0.43% and the Dow Jones Industrial Average (DJIA) returning 1.98% during the period. These six months were marked by high volatility, the onslaught of more and more regulatory hurdles, the Fed stuck in neutral, fears about the global economy, and wild political rhetoric — all headwinds that I believe could have significantly stalled any positive moves in the market, but didn’t. Even the aggressive pull back in January showed just how skittish the market can be, and yet again the markets showed great resiliency and marched right back.
I continue to be impressed with the persistence of the bull market in U.S. equities, now in its seventh year. Many commentators believe that the U.S. economy is due for a recession, and the market is due for a downturn. However, we find ourselves comparing today’s secular market to the bull run of 1982 to 2000, which was powered by a significant increase in valuations. On March 9th of this year, I took a moment to remember how we all felt seven years ago on March 9, 2009, at the bottom of the financial crisis downturn that had wiped out trillions of dollars’ worth of U.S. equities. I explained to our investors then, and I say the same thing today, I believe that if you invest in quality companies with good fundamentals, over the long term, you should do fine.
If history is any kind of guide, then I think this bull market has some room to run. Rising markets usually fall when there is extreme optimism or euphoria. I haven’t witnessed any of that as of yet. The volatility has unnerved many, but I encourage investors to try to remain focused on investment fundamentals. Many U.S. companies continue to find ways to make a profit and build their already strong balance sheets. Unemployment is low, and wages are rising in real terms, supporting consumer confidence and consumption. With an average price-to-sales ratio of only 1.7x and a dividend yield of approximately 2.5% for the Dow, I believe U.S. equities continue to be attractive. In my opinion, there are many compelling reasons why this market can continue to climb even higher.
The next six months may be fraught with more talk about what the Fed will do, who the next President of the United States will be, and what is happening in China and around the globe. Businesses in every industry, including the asset management business, have concerns about increasing regulatory burdens, taxes, and higher healthcare costs. But, I still believe the ingenuity and perseverance of American business will find ways to endure and to thrive.
Thank you for your continued confidence and investment in our products. If you have any questions or would like to speak with us directly, please don’t hesitate to call us at (800) 966-4354.
Best regards,
Neil J. Hennessy
President and Chief Investment Officer
Past performance does not guarantee future results.
Mutual fund investing involves risk. Principal loss is possible.
Opinions expressed are those of Neil Hennessy and are subject to change, are not guaranteed and should not be considered investment advice.
Price-to-sales ratio is a tool for calculating a stock’s valuation relative to other companies. It is calculated by dividing a stock’s current price by its revenue per share. Dividend yield is calculated as the annual dividends paid by a company divided by its market price per share.
The Dow Jones Industrial Average and S&P 500 Index are unmanaged indices commonly used to measure the performance of U.S. stocks. One cannot invest directly in an index.
| HENNESSY FUNDS | 1-800-966-4354 | |
Performance Overview (Unaudited)
AVERAGE ANNUAL TOTAL RETURN FOR PERIODS ENDED APRIL 30, 2016
| | Six | One | Five | Ten |
| | Months(1) | Year | Years | Years |
| Hennessy Cornerstone | | | | |
| Mid Cap 30 Fund – | | | | |
| Investor Class (HFMDX) | -7.89% | -5.64% | 9.37% | 6.56% |
| Hennessy Cornerstone | | | | |
| Mid Cap 30 Fund – | | | | |
Institutional Class (HIMDX)(2) | -7.73% | -5.38% | 9.70% | 6.85% |
Russell Midcap® Index | 0.81% | -2.14% | 9.88% | 7.49% |
| S&P 500 Index | 0.43% | 1.21% | 11.02% | 6.91% |
Expense ratios: 1.33% (Investor Class); 0.97% (Institutional Class)
Performance data quoted represents past performance; past performance does not guarantee future results. The investment return and principal value of an investment will fluctuate so that an investor’s shares, when redeemed, may be worth more or less than their original cost. The performance table does not reflect the deduction of taxes that a shareholder would pay on Fund distributions or the redemption of Fund shares. Current performance of the Fund may be lower or higher than the performance quoted. Performance data current to the most recent month end may be obtained by visiting hennessyfunds.com.
The expense ratios presented are from the most recent prospectus.
(1) | Periods less than one year are not annualized. |
(2) | The inception date of the Institutional Class shares is March 3, 2008. Performance shown prior to the inception of the Institutional Class shares reflects the performance of the Investor Class shares and includes expenses that are not applicable to and are higher than those of the Institutional Class shares. |
PERFORMANCE NARRATIVE
Portfolio Managers Neil J.Hennessy and Brian E. Peery
Performance:
For the six-month period ended April 30, 2016, the Investor Class of the Hennessy Cornerstone Mid Cap 30 Fund returned -7.89%, underperforming both the Russell Midcap® Index and the S&P 500 Index, which returned 0.81% and 0.43% for the same period, respectively.
The Fund’s underperformance relative to its benchmark index was primarily due to stock selection within the Consumer Discretionary sector. GameStop Corporation, Skechers U.S.A., Inc. and Lithia Motors, Inc. all contributed significantly to the underperformance over the period. Price weakness in three other investments, JetBlue Airways Corporation, Ciena Corporation and AmTrust Financial Services, Inc., largely accounted for the remaining underperformance. We continue to hold all of the stocks mentioned within the portfolio, with the exception of Skechers.
Portfolio Strategy:
We believe that limiting the Fund to 30 stocks produces a relatively concentrated portfolio, where individual stock performance can influence the performance of the portfolio as a whole, while at the same time providing what we consider to be ample diversification. Additionally, the Fund employs a strict price-to-sales ratio limit of 1.5, resulting in the Fund investing in what we deem to be reasonably-valued stocks rather
than those whose price may be predicated on expected future growth. We believe this “growth at a reasonable price” stock selection approach has served us well over time, and we wholeheartedly support utilizing this methodology when investing.
Market Outlook:
Over the six-month period ended April 30, 2016, U.S. equities, as measured by the S&P 500 Index, produced an essentially flat return. The period was, however, once again marked by a great deal of volatility, with the major market indices dropping more than 10% at one point early in the year before recovering all of their losses. Throughout the period, there have been concerns about interest rates, commodity prices, economic growth (both domestic and international) and the U.S. Presidential election. Many, if not all, of these concerns still exist in the marketplace today, but we have reasons to be hopeful for the remainder of the year.
We believe the basic fundamentals of the market are attractive, and we continue to be optimistic about the possibility of further moderate market advances over the course of the year. We do not believe stocks are expensive at this point, though many are probably fairly valued. The Dow Jones Industrial Average and the S&P 500 Index have forward PE ratios of 16.5x and 17x, respectively, close to long-term averages. Corporate balance sheets appear to be in excellent shape, and while executives have shown some reluctance to increase capital spending beyond maintenance levels this cycle, we believe companies outside of the Energy sector will eventually start investing for expansion.
Investment Outlook:
We continue to believe there are good investment opportunities in the mid-cap space. Many mid-cap companies have purely domestic businesses, which are benefiting from steady, albeit slow, economic growth at home, low inflation and low energy prices. With consumer debt levels falling and wage growth finally starting to accelerate, we are expecting a good year for consumer-based companies. We remain pleased with the positioning of the portfolio, which includes a large number of companies that are domestically focused and that we believe are reasonably valued and appear poised for growth. Relative to the Fund’s benchmarks, the portfolio remains overweight in both the Consumer Discretionary and Industrial sectors, and we think that these areas of the market offer great growth potential through 2016.
Opinions expressed are those of the Portfolio Managers as of the date written and are subject to change, are not guaranteed, and should not be considered investment advice or an indication of trading intent.
The Russell Midcap® Index is an index commonly used to measure the performance of U.S. medium-capitalization stocks. The S&P 500 Index and Dow Jones Industrial Average are unmanaged indices commonly used to measure the performance of U.S. stocks. One cannot invest directly in an index.
The Fund invests in small and medium capitalized companies, which may have limited liquidity and greater price volatility than large capitalization companies. The Fund’s formula-based strategy may cause the Fund to buy or sell securities at times when it may not be advantageous.
References to specific securities should not be considered a recommendation to buy or sell any security. Fund holdings and sector allocations are subject to change. Please refer to the Schedule of Investments included in this report for additional portfolio information.
Diversification does not assure a profit or protect against loss in a declining market. Price-to-sales ratio is a tool for calculating a stock’s valuation relative to other companies. It is calculated by dividing a company’s market price per share by its revenue per share. PE, or price to earnings, is calculated by dividing a company’s market price per share by its earnings per share. Earnings growth is not a measure of the Fund’s future performance.
| HENNESSY FUNDS | 1-800-966-4354 | |
Financial Statements
Schedule of Investments as of April 30, 2016 (Unaudited) |
HENNESSY CORNERSTONE MID CAP 30 FUND
(% of Net Assets)
| TOP TEN HOLDINGS (EXCLUDING CASH/CASH EQUIVALENTS) | % NET ASSETS |
| Ingredion, Inc. | 4.23% |
| Hawaiian Holdings, Inc. | 4.19% |
| Atmos Energy Corp. | 4.05% |
| Avery Dennison Corp. | 3.88% |
| Pool Corp. | 3.75% |
| JC Penney Co., Inc. | 3.63% |
| Sinclair Broadcast Group, Inc. | 3.60% |
| Casey's General Stores, Inc. | 3.60% |
| NVR, Inc. | 3.54% |
| Owens & Minor, Inc. | 3.53% |
Note: For presentation purposes, the Fund has grouped some of the industry categories. For purposes of categorizing securities for compliance with Section 8(b)(1) of the Investment Company Act of 1940, as amended, the Fund uses more specific industry classifications.
| | COMMON STOCKS – 98.42% | | Number | | | | | | % of | |
| | | | of Shares | | | Value | | | Net Assets | |
| | Consumer Discretionary – 44.72% | | | | | | | | | |
| | AutoNation, Inc. (a) | | | 629,900 | | | $ | 31,904,435 | | | | 2.81 | % |
| | Boyd Gaming Corp. (a) | | | 1,955,200 | | | | 36,444,928 | | | | 3.21 | % |
| | Express, Inc. (a) | | | 2,051,700 | | | | 37,299,906 | | | | 3.29 | % |
| | GameStop Corp., Class A | | | 864,100 | | | | 28,342,480 | | | | 2.50 | % |
| | JC Penney Co., Inc. (a) | | | 4,438,900 | | | | 41,192,992 | | | | 3.63 | % |
| | Lear Corp. | | | 315,900 | | | | 36,369,567 | | | | 3.21 | % |
| | Lennar Corp. | | | 792,700 | | | | 35,917,237 | | | | 3.17 | % |
| | Lithia Motors, Inc., Class A | | | 339,818 | | | | 28,211,690 | | | | 2.49 | % |
| | NVR, Inc. (a) | | | 24,214 | | | | 40,226,476 | | | | 3.54 | % |
| | Pool Corp. | | | 487,400 | | | | 42,603,634 | | | | 3.75 | % |
| | Sinclair Broadcast Group Inc. | | | 1,274,100 | | | | 40,860,387 | | | | 3.60 | % |
| | The Goodyear Tire & Rubber Co. | | | 1,191,600 | | | | 34,520,652 | | | | 3.04 | % |
| | The Interpublic Group of Companies, Inc. | | | 1,700,300 | | | | 39,004,882 | | | | 3.44 | % |
| | Wayfair, Inc., Class A (a) | | | 915,257 | | | | 34,550,952 | | | | 3.04 | % |
| | | | | | | | | 507,450,218 | | | | 44.72 | % |
| | | | | | | | | | | | | | |
| | Consumer Staples – 7.83% | | | | | | | | | | | | |
| | Casey’s General Stores, Inc. | | | 365,100 | | | | 40,891,200 | | | | 3.60 | % |
| | Ingredion, Inc. | | | 416,600 | | | | 47,946,494 | | | | 4.23 | % |
| | | | | | | | | 88,837,694 | | | | 7.83 | % |
| | | | | | | | | | | | | | |
| | Financials – 6.08% | | | | | | | | | | | | |
| | AmTrust Financial Services, Inc. | | | 1,178,400 | | | | 29,283,240 | | | | 2.58 | % |
| | Hanover Insurance Group, Inc. | | | 462,900 | | | | 39,698,304 | | | | 3.50 | % |
| | | | | | | | | 68,981,544 | | | | 6.08 | % |
| | | | | | | | | | | | | | |
| | Health Care – 3.53% | | | | | | | | | | | | |
| | Owens & Minor, Inc. | | | 1,101,500 | | | | 40,083,585 | | | | 3.53 | % |
| | | | | | | | | | | | | | |
| | Industrials – 16.34% | | | | | | | | | | | | |
| | Dycom Industries, Inc. (a) | | | 497,700 | | | | 35,137,620 | | | | 3.10 | % |
| | Expeditors International of Washington, Inc. | | | 785,500 | | | | 38,968,655 | | | | 3.43 | % |
| | Hawaiian Holdings, Inc. (a) | | | 1,130,100 | | | | 47,543,307 | | | | 4.19 | % |
| | JetBlue Airways Corp. (a) | | | 1,551,500 | | | | 30,704,185 | | | | 2.70 | % |
| | ManpowerGroup, Inc. | | | 429,700 | | | | 33,099,791 | | | | 2.92 | % |
| | | | | | | | | 185,453,558 | | | | 16.34 | % |
The accompanying notes are an integral part of these financial statements.
| HENNESSY FUNDS | 1-800-966-4354 | |
| | COMMON STOCKS | | Number | | | | | | % of | |
| | | | of Shares | | | Value | | | Net Assets | |
| | Information Technology – 11.98% | | | | | | | | | |
| | CDW Corp. | | | 893,900 | | | $ | 34,415,150 | | | | 3.03 | % |
| | Ciena Corp. (a) | | | 1,633,500 | | | | 27,491,805 | | | | 2.42 | % |
| | SYNNEX Corp. | | | 447,900 | | | | 36,983,103 | | | | 3.26 | % |
| | Tech Data Corp. (a) | | | 539,800 | | | | 37,078,862 | | | | 3.27 | % |
| | | | | | | | | 135,968,920 | | | | 11.98 | % |
| | | | | | | | | | | | | | |
| | Materials – 3.89% | | | | | | | | | | | | |
| | Avery Dennison Corp. | | | 607,500 | | | | 44,110,575 | | | | 3.89 | % |
| | | | | | | | | | | | | | |
| | Utilities – 4.05% | | | | | | | | | | | | |
| | Atmos Energy Corp. | | | 633,100 | | | | 45,931,405 | | | | 4.05 | % |
| | | | | | | | | | | | | | |
| | Total Common Stocks | | | | | | | | | | | | |
| | (Cost $1,152,929,599) | | | | | | | 1,116,817,499 | | | | 98.42 | % |
| | | | | | | | | | | | | | |
| | SHORT-TERM INVESTMENTS – 4.00% | | | | | | | | | | | | |
| | | | | | | | | | | | | | |
| | Money Market Funds – 4.00% | | | | | | | | | | | | |
| | Fidelity Government Portfolio, Institutional Class, 0.23% (b) | | | 45,456,213 | | | | 45,456,213 | | | | 4.00 | % |
| | | | | | | | | | | | | | |
| | Total Short-Term Investments | | | | | | | | | | | | |
| | (Cost $45,456,213) | | | | | | | 45,456,213 | | | | 4.00 | % |
| | | | | | | | | | | | | | |
| | Total Investments | | | | | | | | | | | | |
| | (Cost $1,198,385,812) – 102.42% | | | | | | | 1,162,273,712 | | | | 102.42 | % |
| | | | | | | | | | | | | | |
| | Liabilities in Excess | | | | | | | | | | | | |
| | of Other Assets – (2.42)% | | | | | | | (27,515,282 | ) | | | (2.42 | )% |
| | | | | | | | | | | | | | |
| | TOTAL NET ASSETS – 100.00% | | | | | | $ | 1,134,758,430 | | | | 100.00 | % |
Percentages are stated as a percent of net assets.
| (a) | Non-income producing security. |
| (b) | The rate listed is the fund’s 7-day yield as of April 30, 2016. |
The accompanying notes are an integral part of these financial statements.
Summary of Fair Value Exposure at April 30, 2016
The following is a summary of the inputs used to value the Fund’s net assets as of April 30, 2016 (See Note 3 in the accompanying notes to the financial statements):
| Common Stocks | | Level 1 | | | Level 2 | | | Level 3 | | | Total | |
| Consumer Discretionary | | $ | 507,450,218 | | | $ | — | | | $ | — | | | $ | 507,450,218 | |
| Consumer Staples | | | 88,837,694 | | | | — | | | | — | | | | 88,837,694 | |
| Financials | | | 68,981,544 | | | | — | | | | — | | | | 68,981,544 | |
| Health Care | | | 40,083,585 | | | | — | | | | — | | | | 40,083,585 | |
| Industrials | | | 185,453,558 | | | | — | | | | — | | | | 185,453,558 | |
| Information Technology | | | 135,968,920 | | | | — | | | | — | | | | 135,968,920 | |
| Materials | | | 44,110,575 | | | | — | | | | — | | | | 44,110,575 | |
| Utilities | | | 45,931,405 | | | | — | | | | — | | | | 45,931,405 | |
| Total Common Stocks | | $ | 1,116,817,499 | | | $ | — | | | $ | — | | | $ | 1,116,817,499 | |
| Short-Term Investments | | | | | | | | | | | | | | | | |
| Money Market Funds | | $ | 45,456,213 | | | $ | — | | | $ | — | | | $ | 45,456,213 | |
| Total Short-Term Investments | | $ | 45,456,213 | | | $ | — | | | $ | — | | | $ | 45,456,213 | |
| Total Investments | | $ | 1,162,273,712 | | | $ | — | | | $ | — | | | $ | 1,162,273,712 | |
Transfers between levels are recognized at the end of the reporting period. During the six-month period ended April 30, 2016, the Fund recognized no transfers between levels.
The accompanying notes are an integral part of these financial statements.
| HENNESSY FUNDS | 1-800-966-4354 | |
Financial Statements
Statement of Assets and Liabilities as of April 30, 2016 (Unaudited) |
| ASSETS: | | | |
| Investments in securities, at value (cost $1,198,385,812) | | $ | 1,162,273,712 | |
| Dividends and interest receivable | | | 206,951 | |
| Receivable for fund shares sold | | | 3,349,851 | |
| Receivable for securities sold | | | 55,120 | |
| Prepaid expenses and other assets | | | 81,493 | |
| Total Assets | | | 1,165,967,127 | |
| | | | | |
| LIABILITIES: | | | | |
| Payable for securities purchased | | | 26,875,339 | |
| Payable for fund shares redeemed | | | 3,037,630 | |
| Payable to advisor | | | 704,349 | |
| Payable to administrator | | | 261,772 | |
| Payable to auditor | | | 10,565 | |
| Accrued distribution fees | | | 89,224 | |
| Accrued service fees | | | 59,393 | |
| Accrued trustees fees | | | 547 | |
| Accrued expenses and other payables | | | 169,878 | |
| Total Liabilities | | | 31,208,697 | |
| NET ASSETS | | $ | 1,134,758,430 | |
| | | | | |
| NET ASSETS CONSIST OF: | | | | |
| Capital stock | | $ | 1,187,813,466 | |
| Accumulated net investment loss | | | (2,029,665 | ) |
| Accumulated net realized loss on investments | | | (14,913,271 | ) |
| Unrealized net depreciation on investments | | | (36,112,100 | ) |
| Total Net Assets | | $ | 1,134,758,430 | |
| | | | | |
| NET ASSETS | | | | |
| Investor Class: | | | | |
| Shares authorized (no par value) | | Unlimited | |
| Net assets applicable to outstanding Investor Class shares | | $ | 703,670,046 | |
| Shares issued and outstanding | | | 38,299,840 | |
| Net asset value, offering price and redemption price per share | | $ | 18.37 | |
| | | | | |
| Institutional Class: | | | | |
| Shares authorized (no par value) | | Unlimited | |
| Net assets applicable to outstanding Institutional Class shares | | $ | 431,088,384 | |
| Shares issued and outstanding | | | 22,975,060 | |
| Net asset value, offering price and redemption price per share | | $ | 18.76 | |
The accompanying notes are an integral part of these financial statements.
Financial Statements
Statement of Operations for the six months ended April 30, 2016 (Unaudited) |
| INVESTMENT INCOME: | | | |
| Dividend income | | $ | 5,341,371 | |
| Interest income | | | 28,193 | |
| Total investment income | | | 5,369,564 | |
| | | | | |
| EXPENSES: | | | | |
| Investment advisory fees (See Note 5) | | | 3,762,831 | |
| Sub-transfer agent expenses – Investor Class (See Note 5) | | | 781,653 | |
| Sub-transfer agent expenses – Institutional Class (See Note 5) | | | 130,902 | |
| Distribution fees – Investor Class (See Note 5) | | | 519,951 | |
| Administration, fund accounting, custody and transfer agent fees (See Note 5) | | | 498,305 | |
| Service fees – Investor Class (See Note 5) | | | 346,634 | |
| Federal and state registration fees | | | 61,842 | |
| Reports to shareholders | | | 37,435 | |
| Compliance expense | | | 11,790 | |
| Audit fees | | | 11,435 | |
| Legal fees | | | 6,993 | |
| Trustees’ fees and expenses | | | 6,581 | |
| Interest expense (See Note 6) | | | 2,841 | |
| Other expenses | | | 29,042 | |
| Total expenses | | | 6,208,235 | |
| NET INVESTMENT LOSS | | $ | (838,671 | ) |
| | | | | |
| REALIZED AND UNREALIZED LOSSES: | | | | |
| Net realized loss on investments | | $ | (14,416,967 | ) |
| Net change in unrealized depreciation on investments | | | (77,702,079 | ) |
| Net loss on investments | | | (92,119,046 | ) |
| NET DECREASE IN NET ASSETS RESULTING FROM OPERATIONS | | $ | (92,957,717 | ) |
The accompanying notes are an integral part of these financial statements.
| HENNESSY FUNDS | 1-800-966-4354 | |
(This Page Intentionally Left Blank.)
Financial Statements
| Statements of Changes in Net Assets |
| | | Six Months Ended | | | | |
| | | April 30, 2016 | | | Year Ended | |
| | | (Unaudited) | | | October 31, 2015 | |
| OPERATIONS: | | | | | | |
| Net investment income (loss) | | $ | (838,671 | ) | | $ | 1,830,521 | |
| Net realized gain (loss) on investments | | | (14,416,967 | ) | | | 8,189,909 | |
| Net change in unrealized appreciation (depreciation) | | | | | | | | |
| on investments | | | (77,702,079 | ) | | | 19,847,205 | |
| Net increase (decrease) in net assets resulting from operations | | | (92,957,717 | ) | | | 29,867,635 | |
| | | | | | | | | |
| DISTRIBUTIONS TO SHAREHOLDERS FROM: | | | | | | | | |
| Net investment income | | | | | | | | |
| Investor Class | | | (983,906 | ) | | | — | |
| Institutional Class | | | (1,004,125 | ) | | | — | |
| Net realized gains | | | | | | | | |
| Investor Class | | | (5,450,291 | ) | | | (16,025,638 | ) |
| Institutional Class | | | (2,201,769 | ) | | | (4,641,869 | ) |
| Total distributions | | | (9,640,091 | ) | | | (20,667,507 | ) |
| | | | | | | | | |
| CAPITAL SHARE TRANSACTIONS: | | | | | | | | |
| Proceeds from shares subscribed – Investor Class | | | 235,817,262 | | | | 626,037,117 | |
| Proceeds from shares subscribed – Institutional Class | | | 243,597,357 | | | | 265,472,593 | |
| Dividends reinvested – Investor Class | | | 6,357,773 | | | | 15,829,426 | |
| Dividends reinvested – Institutional Class | | | 2,729,735 | | | | 4,211,897 | |
| Cost of shares redeemed – Investor Class | | | (233,000,057 | ) | | | (143,926,929 | ) |
| Cost of shares redeemed – Institutional Class | | | (90,087,109 | ) | | | (38,580,417 | ) |
| Net increase in net assets derived | | | | | | | | |
| from capital share transactions | | | 165,414,961 | | | | 729,043,687 | |
| TOTAL INCREASE IN NET ASSETS | | | 62,817,153 | | | | 738,243,815 | |
| | | | | | | | | |
| NET ASSETS: | | | | | | | | |
| Beginning of period | | | 1,071,941,277 | | | | 333,697,462 | |
| End of period | | $ | 1,134,758,430 | | | $ | 1,071,941,277 | |
| Undistributed net investment income (loss), | | | | | | | | |
| end of period | | $ | (2,029,665 | ) | | $ | 797,037 | |
| | | | | | | | | |
| CHANGES IN SHARES OUTSTANDING: | | | | | | | | |
| Shares sold – Investor Class | | | 12,575,797 | | | | 30,736,606 | |
| Shares sold – Institutional Class | | | 12,734,065 | | | | 12,673,580 | |
| Shares issued to holders as reinvestment | | | | | | | | |
| of dividends – Investor Class | | | 332,882 | | | | 847,400 | |
| Shares issued to holders as reinvestment | | | | | | | | |
| of dividends – Institutional Class | | | 140,166 | | | | 221,213 | |
| Shares redeemed – Investor Class | | | (12,671,404 | ) | | | (7,112,737 | ) |
| Shares redeemed – Institutional Class | | | (4,791,160 | ) | | | (1,904,158 | ) |
| Net increase in shares outstanding | | | 8,320,346 | | | | 35,461,904 | |
The accompanying notes are an integral part of these financial statements.
| HENNESSY FUNDS | 1-800-966-4354 | |
Financial Statements
For an Investor Class share outstanding throughout each period
| | | Six Months Ended | |
| | | April 30, 2016 | |
| | | (Unaudited) | |
| PER SHARE DATA: | | | |
| Net asset value, beginning of period | | $ | 20.12 | |
| | | | | |
| Income (loss) from investment operations: | | | | |
| Net investment income (loss) | | | (0.02 | ) |
| Net realized and unrealized gains (losses) on investments | | | (1.56 | ) |
| Total from investment operations | | | (1.58 | ) |
| | | | | |
| Less distributions: | | | | |
| Dividends from net investment income | | | (0.03 | ) |
| Dividends from net realized gains | | | (0.14 | ) |
| Total distributions | | | (0.17 | ) |
| Net asset value, end of period | | $ | 18.37 | |
| | | | | |
| TOTAL RETURN | | | (7.89 | )%(1) |
| | | | | |
| SUPPLEMENTAL DATA AND RATIOS: | | | | |
| Net assets, end of period (millions) | | $ | 703.67 | |
| Ratio of expenses to average net assets | | | 1.35 | %(2) |
| Ratio of net investment income (loss) to average net assets | | | (0.28 | )%(2) |
Portfolio turnover rate(3) | | | 113 | %(1) |
(1) | Not annualized. |
(2) | Annualized. |
(3) | Portfolio turnover is calculated on the basis of the Fund as a whole. |
The accompanying notes are an integral part of these financial statements.
| Year Ended October 31, | |
| 2015 | | | 2014 | | | 2013 | | | 2012 | | | 2011 | |
| | | | | | | | | | | | | | |
| $ | 19.00 | | | $ | 17.32 | | | $ | 14.06 | | | $ | 12.15 | | | $ | 11.18 | |
| | | | | | | | | | | | | | | | | | | |
| | | | | | | | | | | | | | | | | | | |
| | 0.10 | | | | (0.05 | ) | | | 0.09 | | | | 0.08 | | | | (0.09 | ) |
| | 2.16 | | | | 3.04 | | | | 3.35 | | | | 1.83 | | | | 1.06 | |
| | 2.26 | | | | 2.99 | | | | 3.44 | | | | 1.91 | | | | 0.97 | |
| | | | | | | | | | | | | | | | | | | |
| | | | | | | | | | | | | | | | | | | |
| | — | | | | (0.05 | ) | | | (0.18 | ) | | | — | | | | — | |
| | (1.14 | ) | | | (1.26 | ) | | | — | | | | — | | | | — | |
| | (1.14 | ) | | | (1.31 | ) | | | (0.18 | ) | | | — | | | | — | |
| $ | 20.12 | | | $ | 19.00 | | | $ | 17.32 | | | $ | 14.06 | | | $ | 12.15 | |
| | | | | | | | | | | | | | | | | | | |
| | 12.35 | % | | | 18.25 | % | | | 24.78 | % | | | 15.72 | % | | | 8.68 | % |
| | | | | | | | | | | | | | | | | | | |
| | | | | | | | | | | | | | | | | | | |
| $ | 765.90 | | | $ | 258.17 | | | $ | 159.45 | | | $ | 145.85 | | | $ | 146.23 | |
| | 1.17 | % | | | 1.25 | % | | | 1.31 | % | | | 1.37 | % | | | 1.36 | % |
| | 0.27 | % | | | (0.47 | )% | | | 0.51 | % | | | 0.59 | % | | | (0.79 | )% |
| | 5 | % | | | 132 | % | | | 212 | % | | | 25 | % | | | 107 | % |
The accompanying notes are an integral part of these financial statements.
| HENNESSY FUNDS | 1-800-966-4354 | |
Financial Statements
For an Institutional Class share outstanding throughout each period
| | | Six Months Ended | |
| | | April 30, 2016 | |
| | | (Unaudited) | |
| PER SHARE DATA: | | | |
| Net asset value, beginning of period | | $ | 20.55 | |
| | | | | |
| Income (loss) from investment operations: | | | | |
| Net investment income (loss) | | | 0.00 | (1) |
| Net realized and unrealized gains (losses) on investments | | | (1.58 | ) |
| Total from investment operations | | | (1.58 | ) |
| | | | | |
| Less distributions: | | | | |
| Dividends from net investment income | | | (0.06 | ) |
| Dividends from net realized gains | | | (0.15 | ) |
| Total distributions | | | (0.21 | ) |
| Net asset value, end of period | | $ | 18.76 | |
| | | | | |
| TOTAL RETURN | | | (7.73 | )%(2) |
| | | | | |
| SUPPLEMENTAL DATA AND RATIOS: | | | | |
| Net assets, end of period (millions) | | $ | 431.09 | |
| Ratio of expenses to average net assets: | | | | |
| Before expense reimbursement | | | 0.95 | %(3) |
| After expense reimbursement | | | 0.95 | %(3) |
| Ratio of net investment income (loss) to average net assets: | | | | |
| Before expense reimbursement | | | 0.07 | %(3) |
| After expense reimbursement | | | 0.07 | %(3) |
Portfolio turnover rate(4) | | | 113 | %(2) |
(1) | Amount is less than $0.01. |
(2) | Not annualized. |
(3) | Annualized. |
(4) | Portfolio turnover is calculated on the basis of the Fund as a whole. |
The accompanying notes are an integral part of these financial statements.
| Year Ended October 31, | |
| 2015 | | | 2014 | | | 2013 | | | 2012 | | | 2011 | |
| | | | | | | | | | | | | | |
| $ | 19.36 | | | $ | 17.62 | | | $ | 14.31 | | | $ | 12.32 | | | $ | 11.29 | |
| | | | | | | | | | | | | | | | | | | |
| | | | | | | | | | | | | | | | | | | |
| | (0.03 | ) | | | (0.08 | ) | | | 0.14 | | | | 0.09 | | | | (0.05 | ) |
| | 2.38 | | | | 3.17 | | | | 3.41 | | | | 1.90 | | | | 1.08 | |
| | 2.35 | | | | 3.09 | | | | 3.55 | | | | 1.99 | | | | 1.03 | |
| | | | | | | | | | | | | | | | | | | |
| | | | | | | | | | | | | | | | | | | |
| | — | | | | (0.09 | ) | | | (0.24 | ) | | | — | | | | — | |
| | (1.16 | ) | | | (1.26 | ) | | | — | | | | — | | | | — | |
| | (1.16 | ) | | | (1.35 | ) | | | (0.24 | ) | | | — | | | | — | |
| $ | 20.55 | | | $ | 19.36 | | | $ | 17.62 | | | $ | 14.31 | | | $ | 12.32 | |
| | | | | | | | | | | | | | | | | | | |
| | 12.62 | % | | | 18.57 | % | | | 25.15 | % | | | 16.15 | % | | | 9.12 | % |
| | | | | | | | | | | | | | | | | | | |
| | | | | | | | | | | | | | | | | | | |
| $ | 306.04 | | | $ | 75.53 | | | $ | 51.19 | | | $ | 41.62 | | | $ | 24.06 | |
| | | | | | | | | | | | | | | | | | | |
| | 0.96 | % | | | 1.07 | % | | | 1.11 | % | | | 1.16 | % | | | 1.14 | % |
| | 0.96 | % | | | 0.98 | % | | | 0.98 | % | | | 0.98 | % | | | 0.98 | % |
| | | | | | | | | | | | | | | | | | | |
| | 0.41 | % | | | (0.29 | )% | | | 0.71 | % | | | 0.90 | % | | | (0.41 | )% |
| | 0.41 | % | | | (0.20 | )% | | | 0.84 | % | | | 1.08 | % | | | (0.57 | )% |
| | 5 | % | | | 132 | % | | | 212 | % | | | 25 | % | | | 107 | % |
The accompanying notes are an integral part of these financial statements.
| HENNESSY FUNDS | 1-800-966-4354 | |
Financial Statements
Notes to the Financial Statements April 30, 2016 (Unaudited) |
1). ORGANIZATION
The Hennessy Cornerstone Mid Cap 30 Fund (the “Fund”) is a series of Hennessy Funds Trust (the “Trust”), which was organized as a Delaware statutory trust on September 17, 1992. The Fund is an open-end management investment company registered under the Investment Company Act of 1940, as amended. The Fund is a successor to a fund with the same name (the “Predecessor Fund”) that was a series of Hennessy Mutual Funds, Inc., a Maryland corporation, pursuant to a reorganization that took place after the close of business on February 28, 2014. Prior to February 28, 2014, the Fund had no investment operations. As a result of the reorganization, holders of the Investor Class shares of the Predecessor Fund received Investor Class shares of the Fund (the Investor Class shares of the Fund are the successor to the accounting and performance information of the Predecessor Fund), and holders of the Institutional Class shares of the Predecessor Fund received Institutional Class shares of the Fund (the Institutional Class shares of the Fund are the successor to the accounting and performance information of the Predecessor Fund). The investment objective of the Fund is long-term growth of capital. The Fund is a diversified fund.
The Fund offers Investor Class and Institutional Class shares. Each class of shares differs principally in its respective administration, 12b-1 distribution and service, shareholder servicing, and transfer agent expenses and sales charges, if any. Each class has identical rights to earnings, assets, and voting privileges, except for class-specific expenses and exclusive rights to vote on matters affecting only an individual class.
As an investment company, the Fund follows the investment company accounting and reporting guidance of the Financial Accounting Standards Board (“FASB”) Accounting Standard Codification Topic 946 “Financial Services—Investment Companies.”
2). SIGNIFICANT ACCOUNTING POLICIES
The following is a summary of significant accounting policies consistently followed by the Fund in the preparation of the financial statements. These policies are in conformity with U.S. generally accepted accounting principles (“GAAP”).
| a). | Investment Valuation – All investments in securities are recorded at their estimated fair value, as described in Note 3. |
| b). | Federal Income Taxes – Provision for federal income taxes or excise taxes has not been made since the Fund has elected to be taxed as a “regulated investment company” and intends to distribute substantially all of its taxable income to its shareholders and otherwise comply with the provisions of the Internal Revenue Code of 1986, as amended, applicable to regulated investment companies. Net investment income or loss and realized gains and losses for federal income tax purposes may differ from that reported on the financial statements because of temporary book and tax basis differences. Temporary differences are primarily the result of the treatment of wash sales for tax reporting purposes. The Fund recognizes interest and penalties related to income tax benefits, if any, in the statement of operations as an income tax expense. Distributions from net realized gains for book purposes may include short-term capital gains, which are included as ordinary income to shareholders for tax purposes. |
| c). | Income and Expenses – Dividend income is recognized on the ex-dividend date or as soon as information is available to the Fund. Interest income, which includes the amortization of premium and accretion of discount, is recognized on an accrual basis. The Fund is charged for those expenses that are directly attributable to the portfolio, such as advisory, administration, and certain shareholder service fees. Income, expenses (other than expenses attributable to a specific class), and realized and unrealized gains or losses on investments are allocated to each class of shares based on its respective net assets. |
| d). | Distributions to Shareholders – Dividends from net investment income for the Fund, if any, are declared and paid annually, usually in December. Distributions of net realized capital gains, if any, are declared and paid annually, usually in December. |
| e). | Security Transactions – Investment and shareholder transactions are recorded on the trade date. The Fund determines the gain or loss realized from the investment transactions by comparing the original cost of the security lot sold with the net sale proceeds. Discounts and premiums on securities purchased are accreted/amortized over the life of the respective security. |
| f). | Use of Estimates – The preparation of financial statements in conformity with GAAP requires management to make estimates and assumptions that affect the reported amounts of assets and liabilities and disclosure of contingent assets and liabilities at the date of the financial statements and the reported change in net assets during the reporting period. Actual results could differ from those estimates. |
| g). | Share Valuation – The net asset value (“NAV”) per share of the Fund is calculated by dividing the sum of the value of the securities held by the Fund, plus cash or other assets, minus all liabilities (including estimated accrued expenses) by the total number of shares outstanding for the Fund, rounded to the nearest cent. The Fund’s shares will not be priced on days the New York Stock Exchange is closed for trading. The offering and redemption price per share for the Fund is equal to the Fund’s NAV per share. |
| h). | Repurchase Agreements – The Fund may enter into repurchase agreements with member banks or security dealers of the Federal Reserve Board whom the investment advisor deems creditworthy. The repurchase price generally equals the price paid by the Fund plus interest negotiated on the basis of current short-term rates. |
| | Securities pledged as collateral for repurchase agreements are held by the custodian bank until the respective agreements mature. Provisions of the repurchase agreements ensure that the market value of the collateral, including accrued interest thereon, is sufficient to cover the repurchase amount in the event of default of the counterparty. If the counterparty defaults and the value of the collateral declines or if the counterparty enters an insolvency proceeding, realization of the collateral by the Fund may be delayed or limited. |
| i). | Accounting for Uncertainty in Income Taxes – The Fund has accounting policies regarding recognition and measurement of tax positions taken or expected to be taken on a tax return. The tax returns of the Fund for the prior three fiscal years are open for examination. The Fund has reviewed all open tax years in major jurisdictions and concluded that there is no impact on the Fund’s net assets and no tax liability resulting from unrecognized tax benefits relating to uncertain income tax positions taken or expected to be taken on a tax return. The Fund’s major tax jurisdictions are U.S. federal and Delaware. |
| j). | Derivatives – The Fund may invest in, or enter into, derivatives, such as options, futures contracts, options on futures contracts, and swaps, for a variety of reasons, including to |
| HENNESSY FUNDS | 1-800-966-4354 | |
| | hedge certain risks, to provide a substitute for purchasing or selling particular securities, or to increase potential income gain. Derivatives are financial contracts based on an underlying or notional amount, require no initial investment or an initial net investment that is smaller than would normally be required to have a similar response to changes in market factors, and require or permit net settlement. Derivatives may allow the Fund to increase or decrease the level of risk to which the Fund is exposed more quickly and efficiently than transactions in other types of instruments. The main purpose of utilizing derivative instruments is for hedging purposes. |
| | The Fund follows the financial accounting reporting rules as required by the Derivatives and Hedging Topic of the FASB Accounting Standards Codification. Under such rules, the Fund is required to include enhanced disclosure that enables investors to understand how and why an entity uses derivatives, how derivatives are accounted for, and how derivatives instruments affect an entity’s results of operations and financial position. During the six months ended April 30, 2016, the Fund did not hold any derivative instruments. |
| k). | New Accounting Pronouncements – In May 2015, the FASB issued ASU No. 2015-07 “Disclosure for Investments in Certain Entities that Calculate Net Asset Value per Share (or Its Equivalent).” The amendments in ASU No. 2015-07 remove the requirement to categorize within the fair value hierarchy investments measured at NAV and require the disclosure of sufficient information to reconcile the fair value of the remaining assets categorized within the fair value hierarchy to the financial statements. The amendments in ASU No. 2015-07 are effective for fiscal years beginning after December 15, 2015, and interim periods within those fiscal years. Management has reviewed the requirements and believes the adoption of ASU 2015-07 will not have a material impact on the Fund’s financial statements and related disclosures. |
3). SECURITIES VALUATION
The Fund follows authoritative fair valuation accounting standards that establish an authoritative definition of fair value and set out a hierarchy for measuring fair value. These standards require additional disclosures about the various inputs and valuation techniques used to develop the measurements of fair value and a discussion in changes in valuation techniques and related inputs during the period. These inputs are summarized in the three broad levels listed below:
| | Level 1 – | Unadjusted, quoted prices in active markets for identical instruments that the Fund has the ability to access at the date of measurement. |
| | Level 2 – | Other significant observable inputs (including, but not limited to, quoted prices in active markets for similar instruments, quoted prices in markets that are not active for identical or similar instruments, and model-derived valuations in which all significant inputs and significant value drivers are observable in active markets (such as interest rates, prepayment speeds, credit risk curves, default rates, and similar data)). |
| | Level 3 – | Significant unobservable inputs (including the Fund’s own assumptions about what market participants would use to price the asset or liability based on the best available information) when observable inputs are unavailable. |
Following is a description of the valuation techniques applied to the Fund’s major categories of assets and liabilities measured at fair value on a recurring basis.
Equity Securities – Equity securities, including common stocks, preferred stocks, exchange-traded funds, closed-end mutual funds, partnerships, rights, and real estate investment trusts, that are traded on a securities exchange for which a last-quoted sales
price is readily available will generally be valued at the last sales price as reported by the primary exchange on which the securities are listed. Securities listed on The NASDAQ Stock Market (“NASDAQ”) will generally be valued at the NASDAQ Official Closing Price, which may differ from the last sales price reported. Securities traded on a securities exchange for which a last-quoted sales price is not readily available will generally be valued at the mean between the bid and ask prices. To the extent these securities are actively traded and valuation adjustments are not applied, they are classified in Level 1 of the fair value hierarchy.
Registered Investment Companies – Investments in registered investment companies (e.g., mutual funds) are generally priced at the ending NAV provided by the applicable registered investment company’s service agent and will be classified in Level 1 of the fair value hierarchy.
Debt Securities – Debt securities, including corporate bonds, asset-backed securities, mortgage-backed securities, municipal bonds, U.S. Treasuries, and U.S. government agency issues, are generally valued at market on the basis of valuations furnished by an independent pricing service that utilizes both dealer-supplied valuations and formula-based techniques. The pricing service may consider recently executed transactions in securities of the issuer or comparable issuers, market price quotations (where observable), bond spreads, and fundamental data relating to the issuer. In addition, the model may incorporate observable market data, such as reported sales of similar securities, broker quotes, yields, bids, offers, and reference data. Certain securities are valued primarily using dealer quotations. These securities are generally classified in Level 2 of the fair value hierarchy.
Short-Term Securities – Short-term equity investments, including money market funds, are valued in the manner specified above. Short-term debt investments with an original term to maturity of 60 days or less are valued at amortized cost, which approximates fair market value. If the original term to maturity of a short-term debt investment exceeded 60 days, then the values as of the 61st day prior to maturity are amortized. Amortized cost is not used if its use would be inappropriate due to credit or other impairments of the issuer, in which case the security’s fair value would be determined, as described below. Short-term securities are generally classified in Level 1 or Level 2 of the fair market hierarchy depending on the inputs used and market activity levels for specific securities.
The Board of Trustees of the Fund (the “Board”) has adopted fair value pricing procedures that are followed when a price for a security is not readily available or if a significant event has occurred that indicates the closing price of a security no longer represents the true value of that security. Fair value pricing determinations are made in good faith in accordance with these procedures. There are numerous criteria that will be given consideration in determining a fair value of a security, such as the trading volume of a security and markets, the value of other like securities, and news events with direct bearing to a security or markets. Fair value pricing results in an estimated price for a security that reflects the amount the Fund might reasonably expect to receive in a current sale. Depending on the relative significance of the valuation inputs, these securities may be classified in either Level 2 or Level 3 of the fair value hierarchy.
The Board has delegated day-to-day valuation matters to a Valuation Committee comprised of one or more representatives from Hennessy Advisors, Inc., the Fund’s investment advisor. The function of the Valuation Committee is to value securities where current and reliable market quotations are not readily available. All actions taken by the Valuation Committee are reviewed by the Board.
| HENNESSY FUNDS | 1-800-966-4354 | |
The Fund has performed an analysis of all existing investments to determine the significance and character of all inputs to their fair value determination. Various inputs are used in determining the value of the Fund’s investments. The inputs or methodology used for valuing securities are not necessarily an indication of the risk associated with investing in those securities. Details related to the fair valuation hierarchy of the Fund’s securities as of April 30, 2016, are included in the Fund’s Schedule of Investments.
4). INVESTMENT TRANSACTIONS
Purchases and sales of investment securities (excluding government and short-term investments) for the Fund during the six months ended April 30, 2016, were $1,142,738,093 and $946,151,040, respectively.
There were no purchases or sales/maturities of long-term U.S. government securities for the Fund during the six months ended April 30, 2016.
5). INVESTMENT MANAGEMENT FEE AND OTHER TRANSACTIONS WITH AFFILIATES
Hennessy Advisors, Inc. (the “Advisor”) is the investment advisor of the Fund. The Advisor provides the Fund with investment management services under an Investment Advisory Agreement. The Advisor furnishes all investment advice, office space, facilities, and provides most of the personnel needed by the Fund. As compensation for its services, the Advisor is entitled to a monthly fee from the Fund. The fee is based upon the average daily net assets of the Fund at the annual rate of 0.74%. The net investment advisory fees payable by the Fund as of April 30, 2016, were $704,349.
In the past, the Advisor had agreed to waive its fees and absorb expenses to the extent that the total annual operating expenses exceeded 0.98% of the Fund’s net assets for the Institutional Class shares of the Fund (excluding all federal, state and local taxes, interest, brokerage commissions, acquired fund fees and expenses and other costs incurred in connection with the purchase and sale of securities and extraordinary items). The expense limitation agreement was terminated by the Board as of February 28, 2015.
For a period of three years after the year in which the Advisor waived or reimbursed expenses, the Advisor may seek reimbursement from the Fund to the extent that total annual fund operating expenses are less than the expense limitation that was in effect at the time the Advisor waived or reimbursed expenses. During the three years ended October 31, 2015, no expenses were waived or reimbursed by the Advisor and therefore no expenses are subject to potential recovery.
The Board has approved a Shareholder Servicing Agreement for the Investor Class shares of the Fund, which was instituted to compensate the Advisor for the non-investment management services it provides to the Fund. The Shareholder Servicing Agreement provides for a monthly fee paid to the Advisor at an annual rate of 0.10% of the average daily net assets of the Fund attributable to Investor Class shares. Shareholder service fees payable by the Fund as of April 30, 2016, were $59,393.
The Fund has adopted a plan pursuant to Rule 12b-1 under the Investment Company Act of 1940, as amended, that authorizes payments in connection with the distribution of the Fund’s shares at an annual rate of up to 0.25% of the Fund’s average daily net assets attributable to Investor Class shares. Even though the authorized rate is up to 0.25%, the Fund has only used up to 0.15% of its average daily net assets attributable to Investor Class shares for such purpose since the plan was implemented on November 1, 2015. Amounts paid under the plan may be spent on any activities or expenses primarily intended to result in the sale of shares, including, but not limited to, advertising, shareholder account servicing, the printing and mailing of prospectuses to other than current shareholders, the printing and mailing of sales literature, and
compensation for sales and marketing activities or to financial institutions and others, such as dealers and distributors.
The Fund has entered into agreements with various brokers, dealers, and financial intermediaries in connection with the sale of shares of the Fund. The agreements provide for periodic payments by the Fund to the brokers, dealers, and financial intermediaries for providing certain shareholder maintenance services (sub-transfer agent expenses). These shareholder services include the pre-processing and quality control of new accounts, shareholder correspondence, answering customer inquiries regarding account status, and facilitating shareholder telephone transactions. Fees paid by the Fund to various brokers, dealers, and financial intermediaries during the six months ended April 30, 2016, were $912,555.
U.S. Bancorp Fund Services, LLC (“USBFS”) provides the Fund with administrative, fund accounting, and transfer agent services, and necessary office equipment. As administrator, USBFS is responsible for activities such as (i) preparing various federal and state regulatory filings, reports, and returns for the Fund, (ii) preparing reports and materials to be supplied to the Board, (iii) monitoring the activities of the Fund’s custodian, transfer agent, and accountants, and (iv) coordinating the preparation and payment of the Fund’s expenses and reviewing the Fund’s expense accruals. Fees paid to USBFS during the six months ended April 30, 2016, were $498,305.
U.S. Bank, N.A., an affiliate of USBFS, serves as the Fund’s custodian. Quasar Distributors, LLC acts as the Fund’s principal underwriter in a continuous public offering of the Fund’s shares. Quasar Distributors, LLC is an affiliate of USBFS and U.S. Bank, N.A.
6). LINE OF CREDIT
The Fund has an uncommitted line of credit with the other funds in the Hennessy Funds family of funds (the “Hennessy Funds”) in the amount of the lesser of (i) $100,000,000 or (ii) 33.33% of each Hennessy Fund’s net assets, or 30% for the Hennessy Gas Utility Fund and 10% for the Hennessy Balanced Fund, intended to provide short-term financing, if necessary, subject to certain restrictions, in connection with shareholder redemptions. The credit facility is with the Hennessy Funds’ custodian bank, U.S. Bank, N.A. Borrowings under this arrangement bear interest at the bank’s prime rate and are secured by all of the Fund’s assets (as to its own borrowings only). During the six months ended April 30, 2016, the Fund had an outstanding average daily balance and a weighted average interest rate of $160,577 and 3.44%, respectively. The maximum amount outstanding for the Fund during the period was $4,954,000. At April 30, 2016, the Fund did not have any borrowings outstanding under the line of credit.
7). FEDERAL TAX INFORMATION
As of October 31, 2015, the Fund’s most recent fiscal year end, the components of accumulated earnings (losses) for income tax purposes were as follows:
| | Cost of investments for tax purposes | | $ | 1,018,008,256 | |
| | Gross tax unrealized appreciation | | $ | 105,116,797 | |
| | Gross tax unrealized depreciation | | | (63,529,121 | ) |
| | Net tax unrealized appreciation | | $ | 41,587,676 | |
| | Undistributed ordinary income | | $ | 8,448,767 | |
| | Undistributed long-term capital gains | | | — | |
| | Total distributable earnings | | $ | 8,448,767 | |
| | Other accumulated loss | | $ | (493,671 | ) |
| | Total accumulated gain | | $ | 49,542,772 | |
| HENNESSY FUNDS | 1-800-966-4354 | |
The difference between book-basis unrealized appreciation/depreciation (as shown in the Statement of Assets and Liabilities) and tax-basis unrealized appreciation/depreciation (as shown above) is attributable primarily to wash sales.
At October 31, 2015, the Fund’s most recent fiscal year end, the Fund had capital loss carryforwards of $493,671 that expire on October 31, 2016.
During the fiscal year ended October 31, 2015, the Fund’s most recent fiscal year, the capital loss carryforwards utilized for the Fund were $493,673.
Capital losses sustained in the fiscal year ended October 31, 2012 and in future taxable years will not expire and may be carried over by the Fund without limitation; however, they will retain the character of the original loss. Furthermore, any loss incurred during those taxable years will be required to be utilized prior to the losses incurred in taxable years prior to 2012. As a result of this ordering rule, pre-enactment capital loss carryforwards may be more likely to expire unused. Under pre-enactment law, capital losses could be carried forward for eight years, and carried forward as short-term capital losses, irrespective of the character of the original loss.
At October 31, 2015, the Fund’s most recent fiscal year end, the Fund did not defer, on a tax basis, any post-December late year ordinary loss deferrals.
The tax character of distributions paid during fiscal year 2016 (year to date) and fiscal year 2015 for the Fund were as follows:
| | | | Six Months Ended | | | Year Ended | |
| | | | April 30, 2016 | | | October 31, 2015 | |
| | Ordinary income | | $ | 9,640,091 | | | $ | 44,515 | |
| | Long-term capital gain | | | — | | | | 20,622,992 | |
| | | | $ | 9,640,091 | | | $ | 20,667,507 | |
8). AGREEMENT AND PLAN OF REORGANIZATION
In June 2016, the Board approved an Agreement and Plan of Reorganization between the Trust, on behalf of the Fund, and The Westport Funds, a Delaware statutory trust, on behalf of the Westport Fund and the Westport Select Cap Fund. The Agreement and Plan of Reorganization provides for the transfer of all of the assets of the Westport Fund and the Westport Select Cap Fund to the Fund and the assumption of the liabilities (other than any excluded liabilities) of the Westport Fund and the Westport Select Cap Fund by the Fund. Each of the Westport Fund, the Westport Select Cap Fund, and the Fund have substantially similar investment objectives. It is anticipated that the reorganization will be effective during the Fund’s fourth fiscal quarter of 2016.
The Fund has filed a preliminary proxy statement/prospectus on Form N-14, which sets forth the proposed reorganization to be submitted to shareholders of The Westport Funds for their approval. Shareholders of The Westport Funds are urged to read the definitive proxy statement/prospectus when it becomes available, because it will contain important information about the proposed reorganization.
(This Page Intentionally Left Blank.)
| HENNESSY FUNDS | 1-800-966-4354 | |
Expense Example (Unaudited)
April 30, 2016
As a shareholder of the Fund, you incur two types of costs: (1) transaction costs, including sales charges (loads) on purchase payments, reinvested dividends, or other distributions; redemption fees; and exchange fees; and (2) ongoing costs, including management fees; service fees; and other Fund expenses. This Example is intended to help you understand your ongoing costs (in dollars) of investing in the Fund and to compare these costs with the ongoing costs of investing in other mutual funds. The Example is based on an investment of $1,000 invested at the beginning of the period and held for the entire period from November 1, 2015 through April 30, 2016.
Actual Expenses
The first line of the table below under the “Investor Class” and “Institutional Class” headings provides information about actual account values and actual expenses. Although the Fund charges no sales loads or transaction fees, you will be assessed fees for outgoing wire transfers, returned checks and stop payment orders at prevailing rates charged by U.S. Bancorp Fund Services, LLC, the Fund’s transfer agent. If you request that a redemption be made by wire transfer, currently a $15.00 fee is charged by the Fund’s transfer agent. IRA accounts will be charged a $15.00 annual maintenance fee. The example below includes, but is not limited to, management fees, shareholder servicing fees, fund accounting, custody, and transfer agent fees. However, the example below does not include portfolio trading commissions and related expenses, and other extraordinary expenses as determined under generally accepted accounting principles. You may use the information in this line, together with the amount you invested, to estimate the expenses that you paid over the period. Simply divide your account value by $1,000 (for example, an $8,600 account value divided by $1,000 = 8.6), then multiply the result by the number in the first line of the table under the “Investor Class” and “Institutional Class” headings in the column entitled “Expenses Paid During Period” to estimate the expenses you paid on your account during this period.
Hypothetical Example for Comparison Purposes
The second line of the table below under the “Investor Class” and “Institutional Class” headings provides information about hypothetical account values and hypothetical expenses based on the Fund’s actual expense ratios and an assumed rate of return of 5% per year before expenses, which is not the Fund’s actual return. The hypothetical account values and expenses may not be used to estimate the actual ending account balance or expenses you paid for the period. You may use this information to compare the ongoing costs of investing in the Fund and other funds. To do so, compare this 5% hypothetical example with the 5% hypothetical examples that appear in the shareholder reports of the other funds. Please note that the expenses shown in the table are meant to highlight your ongoing costs only and do not reflect any transactional costs, such as sales charges (loads), or exchange fees. Therefore, the second line of the table under the “Investor Class” and “Institutional Class” headings is useful in comparing ongoing costs only, and will not help you determine the relative total costs of owning different funds. In addition, if these transactional costs were included, your costs would have been higher.
| | | | Expenses Paid |
| | Beginning | Ending | During Period(1) |
| | Account Value | Account Value | November 1, 2015 – |
| | November 1, 2015 | April 30, 2016 | April 30, 2016 |
| Investor Class | | | |
| Actual | $1,000.00 | $ 921.10 | $6.45 |
| Hypothetical (5% return before expenses) | $1,000.00 | $1,018.15 | $6.77 |
| Institutional Class | | | |
| Actual | $1,000.00 | $ 922.70 | $4.54 |
| Hypothetical (5% return before expenses) | $1,000.00 | $1,020.14 | $4.77 |
(1) | Expenses are equal to the Fund’s annualized expense ratio of 1.35% for Investor Class shares or 0.95% for Institutional Class shares, as applicable, multiplied by the average account value over the period, multiplied by 182/366 days (to reflect one-half year period). |
| HENNESSY FUNDS | 1-800-966-4354 | |
How to Obtain a Copy of the Fund’s
Proxy Voting Policy and Proxy Voting Records
A description of the policies and procedures the Fund uses to determine how to vote proxies relating to portfolio securities is available without charge: (1) by calling 1-800-966-4354; (2) on the Hennessy Funds’ website at hennessyfunds.com/proxy-voting/policy.fs; or (3) on the U.S. Securities and Exchange Commission’s website at www.sec.gov. The Fund’s proxy voting record is available without charge on both the Hennessy Funds’ website at hennessyfunds.com/proxy-voting/policy.fs and the SEC’s website at www.sec.gov no later than August 31 for the prior 12 months ending June 30.
Quarterly Filings on Form N-Q
The Fund files its complete schedule of portfolio holdings with the SEC for the first and third quarters of each fiscal year on Form N-Q. The Fund’s Form N-Q will be available on the SEC’s website at www.sec.gov. The Fund’s Form N-Q may be reviewed and copied at the SEC’s Public Reference Room in Washington, DC and information on the operation of the Public Reference Room may be obtained by calling 1-800-SEC-0330. Information included in the Fund’s N-Q will also be available upon request by calling 1-800-966-4354.
Federal Tax Distribution Information
(Unaudited)
For the fiscal year ended October 31, 2015, certain dividends paid by the Fund may be subject to a maximum tax rate of 23.8%, as provided for by the Jobs and Growth Tax Relief Reconciliation Act of 2003. The percentage of dividends declared from ordinary income designated as qualified dividend income was 99.78%.
For corporate shareholders, the percent of ordinary income distributions that qualified for the corporate dividends received deduction for the fiscal year ended October 31, 2015 was 99.78%.
The percentage of taxable ordinary income distributions that are designated as short-term capital gain distributions under Section 871(k)(2)(C) of the Internal Revenue Code of 1986, as amended, for the Fund was 100.00%.
Householding
To help keep the Fund’s costs as low as possible, we generally deliver a single copy of most financial reports and prospectuses to shareholders who share an address, even if the accounts are registered under different names. This process, known as “householding,” does not apply to account statements. You may, of course, request an individual copy of a prospectus or financial report at any time. If you would like to receive separate mailings, please call the Administrator at 1-800-261-6950 or 1-414-765-4124 and we will begin individual delivery within 30 days of your request. If your account is held through a financial institution or other intermediary, please contact them directly to request individual delivery.
Board Approval of Investment Advisory
Agreement
At its meeting on March 9, 2016, the Board of Trustees of the Fund (the “Board,” and the members thereof, the “Trustees”) unanimously approved the continuation of the investment advisory agreement of the Fund with Hennessy Advisors, Inc. (the “Advisor”). As part of the process of approving the continuation of the advisory agreement, the Trustees reviewed their fiduciary duties with respect to approving the advisory agreement and the relevant factors for them to consider. In addition, the Trustees who are not deemed “interested persons” (as that term is defined by the Investment Company Act of 1940) of the Fund (the “Independent Trustees”) met in executive session to discuss the approval of the advisory agreement.
In advance of the meeting, the Advisor sent detailed information to the Trustees to assist them in their evaluation of the advisory agreement. This information included, but was not limited to, (i) a memorandum from outside legal counsel that described the fiduciary duties of the Board with respect to approving the continuation of the advisory agreement and the relevant factors for consideration, (ii) a memorandum from the Advisor that listed the factors relevant to the Board’s approval of the continuation of the advisory agreement and also referenced the documents that had been provided to help the Board assess each such factor, (iii) an inventory of the range of services provided by the Advisor for the Fund, (iv) a written discussion of economies of scale, (v) the advisory agreement, (vi) a recent Fund fact sheet, (vii) a peer expense comparison, (viii) performance information, (ix) the Advisor’s most recent Form 10-K and Form 10-Q, which included information about the Advisor’s profitability, (x) information about brokerage commissions, (xi) information about the Fund’s compliance program, (xii) the Advisor’s current Form ADV Part I, and (xii) other information the Trustees believed was useful in evaluating the approval of the continuation of the advisory agreement.
All of the factors discussed by the Trustees were considered as a whole, and were considered separately by the Independent Trustees, meeting in executive session. The factors were viewed in their totality by the Trustees, with no single factor being the principal or determinative factor in the Trustees’ determination of whether to approve the continuation of the advisory agreement. The Trustees recognized that the management and fee arrangements for the Fund are the result of years of review and discussion between the Independent Trustees and the Advisor, that certain aspects of such arrangements may receive greater scrutiny in some years than in others, and that the Trustees’ conclusions may be based, in part, on their consideration of these same arrangements and information received during the course of the year and in prior years.
Prior to approving the continuation of the advisory agreement, the Trustees and the Independent Trustees in executive session considered, among other items:
| | • | The nature and quality of the advisory services provided by the Advisor. |
| | • | A comparison of the fees and expenses of the Fund to other similar funds. |
| | • | Whether economies of scale are recognized by the Fund. |
| | • | The costs and profitability of the Fund to the Advisor. |
| | • | The performance of the Fund. |
| | • | The other benefits to the Advisor from serving as an investment advisor to the Fund (in addition to the advisory fee). |
| HENNESSY FUNDS | 1-800-966-4354 | |
The material considerations and determinations of the Board of Trustees, including all of the Independent Trustees, are as follows:
| | • | The Board considered the services identified below that are provided by the Advisor. Based on this review, the Trustees believe that the Advisor provides high-quality services to the Fund, and they noted that their overall confidence in the Advisor is high. The Trustees also concluded that they were satisfied with the nature, extent, and quality of the advisory services provided to the Fund by the Advisor, and that the nature and extent of the services provided by the Advisor are appropriate to assure that the Fund’s operations are conducted in compliance with applicable laws, rules, and regulations. |
| | | • | The Advisor acts as the portfolio manager for the Fund. In this capacity, the Advisor does the following: |
| | | | • | manages the composition of the Fund’s portfolio, including the purchase, retention, and disposition of portfolio securities in accordance with the Fund’s investment objectives, policies, and restrictions; |
| | | | • | ensures compliance with “best execution” for the Fund’s portfolio; |
| | | | • | manages the use of soft dollars for the Fund. |
| | | • | The Advisor performs a daily reconciliation of portfolio positions and cash for the Fund. |
| | | • | The Advisor monitors the Fund’s compliance with its investment objectives and restrictions. |
| | | • | The Advisor monitors compliance with federal securities laws and performs activities such as maintaining a compliance program, conducting ongoing reviews of the compliance programs of the Fund’s service providers, conducting on-site visits to the Fund’s service providers, monitoring incidents of abusive trading practices, reviewing Fund expense accruals, payments, and fixed expense ratios, evaluating insurance providers for fidelity bond coverage and D&O/E&O insurance coverage, conducting employee compliance training, reviewing reports provided by service providers, maintaining books and records, and preparing an annual compliance report to the Board. |
| | | • | The Advisor oversees service providers that provide accounting, administration, distribution, transfer agency, custodial, sales and marketing, public relations, audit, information technology, and legal services to the Fund. |
| | | • | The Advisor maintains in-house marketing and distribution departments on behalf of the Fund. |
| | | • | The Advisor is actively involved with preparing regulatory filings for the Fund, including writing and annually updating the Fund’s prospectus and related documents. |
| | | • | The Advisor prepares a written summary of the Fund’s performance for the most recent six-month period or twelve-month period, as applicable, for each semi-annual and annual report of the Fund. |
| | | • | The Advisor oversees distribution of the Fund through third-party broker/dealers and independent financial institutions such as Charles Schwab, Inc., Fidelity, TD Waterhouse, and Pershing. The Advisor participates in “no transaction fee” (“NTF”) programs with these companies on behalf of the Fund, which allow customers to purchase the Fund through third-party distribution |
| | | | channels without paying a transaction fee. The Advisor compensates, in part, a number of these third-party providers of NTF programs out of its own revenues. |
| | | • | The Advisor pays the incentive compensation of the Fund’s compliance officers and employs other staff, such as management executives, legal personnel, marketing personnel, national accounts and distribution personnel, sales personnel, administrative personnel, and trading oversight personnel. |
| | | • | The Advisor provides a quarterly compliance certification to the Board. |
| | | • | The Advisor prepares or reviews Board materials, frequently presents to the Board or leads Board discussions, prepares or reviews meeting minutes, and arranges for Board training and education. |
| | • | The Board compared the performance of the Fund to benchmark indices over various periods of time and they noted that at each quarterly meeting, the Trustees review reports comparing the investment performance of the Fund to various indices. Based on the information provided at the meeting and the information and quarterly discussions regarding the Fund’s investment performance, the Trustees believe that the Advisor manages the Fund in a manner that is materially consistent with its stated investment objective and style. The Trustees concluded that the performance of the Fund over various time horizons warranted the continuation of the advisory agreement. |
| | • | The Board reviewed the advisory fees and overall expense ratios of the Fund and comparable funds using data from Morningstar with respect to funds similar in asset size and investment objective to the Fund. As part of the discussion with management, the Trustees ensured that they understood and were comfortable with the criteria used to determine the mutual funds included in the Morningstar categories for purposes of the materials considered at the meeting. The Board determined that the advisory fee and overall expense ratio of the Fund falls within the range of the advisory fees and overall expense ratios of other comparable funds and concluded that they are reasonable and warranted continuation of the advisory agreement. |
| | • | The Board also considered whether economies of scale were being realized by the Advisor that should be shared with the Fund’s shareholders. The Trustees noted that many of the expenses incurred to manage the Fund are asset-based fees and thus do not result in material economies of scale being realized as the net assets of the Fund increase. For example, intermediary service fees increase as the Fund’s assets grow. The Trustees also considered the Advisor’s efforts to contain expenses, and took into account the Advisor’s significant marketing efforts to increase Fund assets. The Board noted that at current asset levels it did not appear that there were economies of scale being realized by the Advisor and concluded that it would continue to monitor economies of scale in the future as circumstances changed. |
| | • | The Board considered the profitability of the Advisor, including the impact of intermediary service fees on the Advisor’s profitability, and also considered the resources and revenues that the Advisor has put into managing and distributing the Fund. The Board then concluded that the profits of the Advisor are reasonable and not excessive when compared to profitability guidelines set forth in relevant court cases. |
| HENNESSY FUNDS | 1-800-966-4354 | |
| | • | The Board considered the high level of professionalism and knowledge of the Advisor’s employees, along with a very low level of turnover, and concluded that this was beneficial to the Fund and its shareholders. |
| | • | The Board considered other benefits to the Advisor from serving as an advisor to the Fund (in addition to the advisory fee). The Board noted that the Advisor may derive ancillary benefits from, by way of example, its association with the Fund in the form of proprietary and third-party research products and services received from broker dealers that execute portfolio trades for the Fund. The Board determined that any such products and services have been used for legitimate purposes relating to the Fund by providing assistance in the investment decision-making process. The Trustees concluded that the other benefits realized by the Advisor from its relationship with the Fund were reasonable. |
After reviewing the materials provided at the meeting and management’s presentation, as well as other information regularly provided at the Board’s quarterly meetings throughout the year regarding the quality of services provided by the Advisor, the performance of the Fund, expense information, regulatory compliance issues, trading information and related matters, and other factors deemed relevant by the Board, the Trustees, including all of the Independent Trustees, approved the continuation of the advisory agreement.
(This Page Intentionally Left Blank.)
For information, questions or assistance, please call
The Hennessy Funds
1-800-966-4354 or 1-415-899-1555
INVESTMENT ADVISOR
Hennessy Advisors, Inc.
7250 Redwood Blvd., Suite 200
Novato, California 94945
ADMINISTRATOR,
TRANSFER AGENT,
DIVIDEND PAYING AGENT &
SHAREHOLDER SERVICING AGENT
U.S. Bancorp Fund Services, LLC
P.O. Box 701
Milwaukee, Wisconsin 53201-0701
CUSTODIAN
U.S. Bank N.A.
Custody Operations
1555 North River Center Dr., Suite 302
Milwaukee, Wisconsin 53212
TRUSTEES
Neil J. Hennessy
Robert T. Doyle
J. Dennis DeSousa
Gerald P. Richardson
COUNSEL
Foley & Lardner LLP
777 East Wisconsin Avenue
Milwaukee, Wisconsin 53202-5306
INDEPENDENT REGISTERED
PUBLIC ACCOUNTING FIRM
KPMG LLP
777 East Wisconsin Avenue
Milwaukee, Wisconsin 53202-5306
DISTRIBUTOR
Quasar Distributors, LLC
615 East Michigan Street
Milwaukee, Wisconsin 53202
hennessyfunds.com | 1-800-966-4354
This report has been prepared for shareholders and may be distributed to
others only if preceded or accompanied by a current prospectus.
SEMI-ANNUAL REPORT
APRIL 30, 2016
HENNESSY CORNERSTONE
LARGE GROWTH FUND
Investor Class HFLGX
Institutional Class HILGX
hennessyfunds.com | 1-800-966-4354
(This Page Intentionally Left Blank.)
Contents
| Letter to Shareholders | 2 |
| Performance Overview | 4 |
| Financial Statements | |
| Schedule of Investments | 6 |
| Statement of Assets and Liabilities | 10 |
| Statement of Operations | 11 |
| Statements of Changes in Net Assets | 13 |
| Financial Highlights | 14 |
| Notes to the Financial Statements | 18 |
| Expense Example | 26 |
| Proxy Voting | 28 |
| Quarterly Filings on Form N-Q | 28 |
| Federal Tax Distribution Information | 28 |
| Householding | 28 |
| Board Approval of Investment Advisory Agreement | 29 |
| HENNESSY FUNDS | 1-800-966-4354 | |
June 2016
Dear Hennessy Funds Shareholder:
I used to tell my kids, “What doesn’t kill you makes you stronger.” Perhaps that is not the best analogy for investing, but in the face of such roller coaster volatility in the financial markets, it seems to me that what hasn’t killed this bull market rally may just make it stronger. The financial markets brought us flat to modest returns during the six months ended April 30, 2016, with the S&P 500 Index returning 0.43% and the Dow Jones Industrial Average (DJIA) returning 1.98% during the period. These six months were marked by high volatility, the onslaught of more and more regulatory hurdles, the Fed stuck in neutral, fears about the global economy, and wild political rhetoric — all headwinds that I believe could have significantly stalled any positive moves in the market, but didn’t. Even the aggressive pull back in January showed just how skittish the market can be, and yet again the markets showed great resiliency and marched right back.
I continue to be impressed with the persistence of the bull market in U.S. equities, now in its seventh year. Many commentators believe that the U.S. economy is due for a recession, and the market is due for a downturn. However, we find ourselves comparing today’s secular market to the bull run of 1982 to 2000, which was powered by a significant increase in valuations. On March 9th of this year, I took a moment to remember how we all felt seven years ago on March 9, 2009, at the bottom of the financial crisis downturn that had wiped out trillions of dollars’ worth of U.S. equities. I explained to our investors then, and I say the same thing today, I believe that if you invest in quality companies with good fundamentals, over the long term, you should do fine.
If history is any kind of guide, then I think this bull market has some room to run. Rising markets usually fall when there is extreme optimism or euphoria. I haven’t witnessed any of that as of yet. The volatility has unnerved many, but I encourage investors to try to remain focused on investment fundamentals. Many U.S. companies continue to find ways to make a profit and build their already strong balance sheets. Unemployment is low, and wages are rising in real terms, supporting consumer confidence and consumption. With an average price-to-sales ratio of only 1.7x and a dividend yield of approximately 2.5% for the Dow, I believe U.S. equities continue to be attractive. In my opinion, there are many compelling reasons why this market can continue to climb even higher.
The next six months may be fraught with more talk about what the Fed will do, who the next President of the United States will be, and what is happening in China and around the globe. Businesses in every industry, including the asset management business, have concerns about increasing regulatory burdens, taxes, and higher healthcare costs. But, I still believe the ingenuity and perseverance of American business will find ways to endure and to thrive.
Thank you for your continued confidence and investment in our products. If you have any questions or would like to speak with us directly, please don’t hesitate to call us at (800) 966-4354.
Best regards,
Neil J. Hennessy
President and Chief Investment Officer
Past performance does not guarantee future results.
Mutual fund investing involves risk. Principal loss is possible.
Opinions expressed are those of Neil Hennessy and are subject to change, are not guaranteed and should not be considered investment advice.
Price-to-sales ratio is a tool for calculating a stock’s valuation relative to other companies. It is calculated by dividing a stock’s current price by its revenue per share. Dividend yield is calculated as the annual dividends paid by a company divided by its market price per share.
The Dow Jones Industrial Average and S&P 500 Index are unmanaged indices commonly used to measure the performance of U.S. stocks. One cannot invest directly in an index.
| HENNESSY FUNDS | 1-800-966-4354 | |
Performance Overview (Unaudited)
AVERAGE ANNUAL TOTAL RETURN FOR PERIODS ENDED APRIL 30, 2016
| | | | | Since |
| | Six | One | Five | Inception |
| | Months(1) | Year | Years | (3/20/09) |
| Hennessy Cornerstone | | | | |
| Large Growth Fund – | | | | |
| Investor Class (HFLGX) | -1.67% | -6.56% | 8.52% | 17.01% |
| Hennessy Cornerstone | | | | |
| Large Growth Fund – | | | | |
| Institutional Class (HILGX) | -1.54% | -6.40% | 8.75% | 17.30% |
Russell 1000® Index | 0.22% | 0.34% | 10.81% | 17.58% |
| S&P 500 Index | 0.43% | 1.21% | 11.02% | 17.37% |
Expense ratios: 1.24% (Investor Class); 0.99% (Institutional Class)
Performance data quoted represents past performance; past performance does not guarantee future results. The investment return and principal value of an investment will fluctuate so that an investor’s shares, when redeemed, may be worth more or less than their original cost. The performance table does not reflect the deduction of taxes that a shareholder would pay on Fund distributions or the redemption of Fund shares. Current performance of the Fund may be lower or higher than the performance quoted. Performance data current to the most recent month end may be obtained by visiting hennessyfunds.com.
The expense ratios presented are from the most recent prospectus.
(1) Periods less than one year are not annualized.
PERFORMANCE NARRATIVE
Portfolio Managers Neil J.Hennessy and Brian E.Peery
Performance:
For the six-month period ended April 30, 2016, the Investor Class of the Hennessy Cornerstone Large Growth Fund returned -1.67%, underperforming both the Russell 1000® Index and the S&P 500 Index, which returned 0.22% and 0.43% for the same period, respectively.
The overweight position in retailers, including Bed, Bath & Beyond, Inc. and Macy’s, Inc. hurt the Fund’s relative performance, as many retailers are struggling with slow growth in demand and increased competition from internet shopping. Airline stocks in the portfolio, American Airlines Group, Inc., United Continental Holdings, Inc. and Delta Air Lines, Inc., also hampered the portfolio’s overall performance. On a sector basis, the Fund’s overweight position in the Industrial Sector aided overall performance, as did its underweight positions in the Information Technology and Financials sectors. The Fund continues to hold all of the stocks mentioned.
Portfolio Strategy:
The Fund’s investment strategy is based on identifying large and well-established companies that trade at below average price-to-cash flow ratios. The Fund also seeks to invest only in what it deems to be higher-quality businesses and thus focuses on companies with high returns on total capital.
Market Outlook:
Over the six-month period ended April 30, 2016, U.S. equities, as measured by the S&P 500 Index, produced an essentially flat return. The period was, however, once again marked by a great deal of volatility, with the major market indices dropping more than 10% at one point early in the year before recovering all of their losses. Throughout the period, there have been concerns about interest rates, commodity prices, economic growth (both domestic and international) and the U.S. Presidential election. Many, if not all, of these concerns still exist in the marketplace today, but we have reasons to be hopeful for the remainder of the year.
We believe the basic fundamentals of the market are attractive, and we continue to be optimistic about the possibility of further moderate market advances over the course of the year. We do not believe stocks are expensive at this point, though many are probably fairly valued. The Dow Jones Industrial Average and the S&P 500 Index have forward PE ratios of 16.5x and 17x, respectively, close to long-term averages. Corporate balance sheets appear to be in excellent shape, and while executives have shown some reluctance to increase capital spending beyond maintenance levels this cycle, we believe companies outside of the Energy sector will eventually start investing for expansion.
Investment Outlook:
We are confident that there continue to be good investment opportunities in the large-cap space. While we believe higher interest rates may lead to an even stronger U.S. Dollar and difficulties for exporters, large-cap companies with more domestically focused businesses are benefiting from steady economic growth at home, low inflation and low energy prices. With consumer debt levels falling and wage growth finally starting to accelerate, we are expecting a good year for consumer-based companies. We remain pleased with the positioning of the portfolio, which includes a large number of companies that are domestically focused and that we believe are reasonably valued and appear poised for growth. Relative to the Fund’s benchmarks, the portfolio remains overweight in both the Consumer Discretionary and Industrial sectors and we think that these areas of the market offer great growth potential through 2016.
Opinions expressed are those of the Portfolio Managers as of the date written and are subject to change, are not guaranteed, and should not be considered investment advice or an indication of trading intent.
The Russell 1000® Index is commonly used to measure the performance of large-capitalization U.S. stocks. The S&P 500 Index and Dow Jones Industrial Average are unmanaged indices commonly used to measure the performance of U.S. stocks. One cannot invest directly in an index.
The Fund may invest in medium capitalized companies, which may have more limited liquidity and greater price volatility than large capitalization companies. The Fund’s formula-based strategy may cause the Fund to buy or sell securities at times when it may not be advantageous.
References to specific securities should not be considered a recommendation to buy or sell any security. Fund holdings and sector allocations are subject to change. Please refer to the Schedule of Investments included in this report for additional portfolio information.
Earnings growth is not a measure of the Fund’s future performance. PE, or price to earnings, is calculated by dividing a company’s market price per share by its earnings per share. Price-to-cash flow ratio is a stock valuation measure calculated by dividing a company’s cash flow per share into its current stock price.
| HENNESSY FUNDS | 1-800-966-4354 | |
Financial Statements
Schedule of Investments as of April 30, 2016 (Unaudited) |
HENNESSY CORNERSTONE LARGE GROWTH FUND
(% of Net Assets)
| TOP TEN HOLDINGS (EXCLUDING CASH/CASH EQUIVALENTS) | % NET ASSETS |
| Cummins, Inc. | 2.37% |
| FedEx Corp. | 2.28% |
| Caterpillar, Inc. | 2.25% |
| PACCAR, Inc. | 2.20% |
| Union Pacific Corp. | 2.20% |
| Baxter International, Inc. | 2.19% |
| Parker-Hannifin Corp. | 2.18% |
| Southwest Airlines Co. | 2.18% |
| Harley-Davidson, Inc. | 2.17% |
| Emerson Electric Co. | 2.16% |
Note: For presentation purposes, the Fund has grouped some of the industry categories. For purposes of categorizing securities for compliance with Section 8(b)(1) of the Investment Company Act of 1940, as amended, the Fund uses more specific industry classifications.
| | COMMON STOCKS – 96.20% | | Number | | | | | | % of | |
| | | | of Shares | | | Value | | | Net Assets | |
| | Consumer Discretionary – 24.02% | | | | | | | | | |
| | Bed Bath & Beyond, Inc. (a) | | | 43,000 | | | $ | 2,030,460 | | | | 1.99 | % |
| | Best Buy Co., Inc. | | | 66,900 | | | | 2,146,152 | | | | 2.10 | % |
| | Darden Restaurants, Inc. | | | 28,500 | | | | 1,774,125 | | | | 1.74 | % |
| | Harley-Davidson, Inc. | | | 46,300 | | | | 2,214,529 | | | | 2.17 | % |
| | Kohl’s Corp. | | | 37,600 | | | | 1,665,680 | | | | 1.63 | % |
| | Las Vegas Sands Corp. | | | 42,100 | | | | 1,900,815 | | | | 1.86 | % |
| | Macy’s, Inc. | | | 45,600 | | | | 1,805,304 | | | | 1.77 | % |
| | Nordstrom, Inc. | | | 37,600 | | | | 1,922,488 | | | | 1.89 | % |
| | Ralph Lauren Corp. | | | 16,400 | | | | 1,528,644 | | | | 1.50 | % |
| | Target Corp. | | | 25,400 | | | | 2,019,300 | | | | 1.98 | % |
| | The Gap, Inc. | | | 75,100 | | | | 1,740,818 | | | | 1.71 | % |
| | Tiffany & Co. | | | 29,400 | | | | 2,097,690 | | | | 2.06 | % |
| | Viacom, Inc. | | | 40,500 | | | | 1,656,450 | | | | 1.62 | % |
| | | | | | | | | 24,502,455 | | | | 24.02 | % |
| | | | | | | | | | | | | | |
| | Consumer Staples – 5.28% | | | | | | | | | | | | |
| | The Kroger Co. | | | 47,700 | | | | 1,688,103 | | | | 1.66 | % |
| | Wal-Mart Stores, Inc. | | | 28,100 | | | | 1,879,047 | | | | 1.84 | % |
| | Whole Foods Market, Inc. | | | 62,500 | | | | 1,817,500 | | | | 1.78 | % |
| | | | | | | | | 5,384,650 | | | | 5.28 | % |
| | | | | | | | | | | | | | |
| | Energy – 5.00% | | | | | | | | | | | | |
| | Marathon Petroleum Corp. | | | 44,800 | | | | 1,750,784 | | | | 1.71 | % |
| | Tesoro Corp. | | | 21,500 | | | | 1,713,335 | | | | 1.68 | % |
| | Valero Energy Corp. | | | 27,900 | | | | 1,642,473 | | | | 1.61 | % |
| | | | | | | | | 5,106,592 | | | | 5.00 | % |
| | | | | | | | | | | | | | |
| | Financials – 3.86% | | | | | | | | | | | | |
| | Franklin Resources, Inc. | | | 54,100 | | | | 2,020,094 | | | | 1.98 | % |
| | The Progressive Corp. | | | 58,700 | | | | 1,913,620 | | | | 1.88 | % |
| | | | | | | | | 3,933,714 | | | | 3.86 | % |
| | | | | | | | | | | | | | |
| | Health Care – 6.08% | | | | | | | | | | | | |
| | Baxter International, Inc. | | | 50,500 | | | | 2,233,110 | | | | 2.19 | % |
| | Gilead Sciences, Inc. | | | 20,600 | | | | 1,817,126 | | | | 1.78 | % |
| | HCA Holdings, Inc. (a) | | | 26,700 | | | | 2,152,554 | | | | 2.11 | % |
| | | | | | | | | 6,202,790 | | | | 6.08 | % |
The accompanying notes are an integral part of these financial statements.
| HENNESSY FUNDS | 1-800-966-4354 | |
| | COMMON STOCKS | | Number | | | | | | % of | |
| | | | of Shares | | | Value | | | Net Assets | |
| | Industrials – 36.60% | | | | | | | | | |
| | Alaska Air Group, Inc. | | | 26,300 | | | $ | 1,852,309 | | | | 1.82 | % |
| | American Airlines Group, Inc. | | | 47,300 | | | | 1,640,837 | | | | 1.61 | % |
| | Caterpillar, Inc. | | | 29,500 | | | | 2,292,740 | | | | 2.25 | % |
| | Cummins, Inc. | | | 20,700 | | | | 2,422,521 | | | | 2.37 | % |
| | Deere & Co. | | | 24,100 | | | | 2,027,051 | | | | 1.99 | % |
| | Delta Air Lines, Inc. | | | 41,700 | | | | 1,737,639 | | | | 1.70 | % |
| | Dover Corp. | | | 31,900 | | | | 2,095,830 | | | | 2.05 | % |
| | Emerson Electric Co. | | | 40,400 | | | | 2,207,052 | | | | 2.16 | % |
| | FedEx Corp. | | | 14,100 | | | | 2,328,051 | | | | 2.28 | % |
| | General Dynamics Corp. | | | 14,000 | | | | 1,967,280 | | | | 1.93 | % |
| | JetBlue Airways Corp. (a) | | | 90,500 | | | | 1,790,995 | | | | 1.76 | % |
| | PACCAR, Inc. | | | 38,100 | | | | 2,244,471 | | | | 2.20 | % |
| | Parker-Hannifin Corp. | | | 19,200 | | | | 2,227,584 | | | | 2.18 | % |
| | Southwest Airlines Co. | | | 49,800 | | | | 2,221,578 | | | | 2.18 | % |
| | The Boeing Co. | | | 15,300 | | | | 2,062,440 | | | | 2.02 | % |
| | Union Pacific Corp. | | | 25,700 | | | | 2,241,811 | | | | 2.20 | % |
| | United Continental Holdings, Inc. (a) | | | 39,100 | | | | 1,791,171 | | | | 1.76 | % |
| | United Technologies Corp. | | | 20,900 | | | | 2,181,333 | | | | 2.14 | % |
| | | | | | | | | 37,332,693 | | | | 36.60 | % |
| | | | | | | | | | | | | | |
| | Information Technology – 11.40% | | | | | | | | | | | | |
| | Apple, Inc. | | | 19,150 | | | | 1,795,121 | | | | 1.76 | % |
| | eBay, Inc. (a) | | | 78,000 | | | | 1,905,540 | | | | 1.87 | % |
| | Intel Corp. | | | 60,200 | | | | 1,822,856 | | | | 1.78 | % |
| | International Business Machines Corp. | | | 14,800 | | | | 2,159,912 | | | | 2.12 | % |
| | QUALCOMM, Inc. | | | 41,400 | | | | 2,091,528 | | | | 2.05 | % |
| | Skyworks Solutions, Inc. | | | 27,800 | | | | 1,857,596 | | | | 1.82 | % |
| | | | | | | | | 11,632,553 | | | | 11.40 | % |
| | | | | | | | | | | | | | |
| | Materials – 2.12% | | | | | | | | | | | | |
| | Praxair, Inc. | | | 18,400 | | | | 2,161,264 | | | | 2.12 | % |
| | | | | | | | | | | | | | |
| | Telecommunication Services – 1.84% | | | | | | | | | | | | |
| | Verizon Communications, Inc. | | | 36,800 | | | | 1,874,592 | | | | 1.84 | % |
| | | | | | | | | | | | | | |
| | Total Common Stocks | | | | | | | | | | | | |
| | (Cost $94,641,762) | | | | | | | 98,131,303 | | | | 96.20 | % |
The accompanying notes are an integral part of these financial statements.
| | SHORT-TERM INVESTMENTS – 3.86% | | Number | | | | | | % of | |
| | | | of Shares | | | Value | | | Net Assets | |
| | Money Market Funds – 3.86% | | | | | | | | | |
| | Fidelity Government Portfolio, Institutional Class, 0.23% (b) | | | 3,934,096 | | | $ | 3,934,096 | | | | 3.86 | % |
| | | | | | | | | | | | | | |
| | Total Short-Term Investments | | | | | | | | | | | | |
| | (Cost $3,934,096) | | | | | | | 3,934,096 | | | | 3.86 | % |
| | | | | | | | | | | | | | |
| | Total Investments | | | | | | | | | | | | |
| | (Cost $98,575,858) – 100.06% | | | | | | | 102,065,399 | | | | 100.06 | % |
| | | | | | | | | | | | | | |
| | Liabilities in Excess | | | | | | | | | | | | |
| | of Other Assets – (0.06)% | | | | | | | (62,364 | ) | | | (0.06 | )% |
| | | | | | | | | | | | | | |
| | TOTAL NET ASSETS – 100.00% | | | | | | $ | 102,003,035 | | | | 100.00 | % |
Percentages are stated as a percent of net assets.
| (a) | Non-income producing security. |
| (b) | The rate listed is the fund’s 7-day yield as of April 30, 2016. |
Summary of Fair Value Exposure at April 30, 2016
The following is a summary of the inputs used to value the Fund’s net assets as of April 30, 2016 (See Note 3 in the accompanying notes to the financial statements):
| Common Stocks | | Level 1 | | | Level 2 | | | Level 3 | | | Total | |
| Consumer Discretionary | | $ | 24,502,455 | | | $ | — | | | $ | — | | | $ | 24,502,455 | |
| Consumer Staples | | | 5,384,650 | | | | — | | | | — | | | | 5,384,650 | |
| Energy | | | 5,106,592 | | | | — | | | | — | | | | 5,106,592 | |
| Financials | | | 3,933,714 | | | | — | | | | — | | | | 3,933,714 | |
| Health Care | | | 6,202,790 | | | | — | | | | — | | | | 6,202,790 | |
| Industrials | | | 37,332,693 | | | | — | | | | — | | | | 37,332,693 | |
| Information Technology | | | 11,632,553 | | | | — | | | | — | | | | 11,632,553 | |
| Materials | | | 2,161,264 | | | | — | | | | — | | | | 2,161,264 | |
| Telecommunication Services | | | 1,874,592 | | | | — | | | | — | | | | 1,874,592 | |
| Total Common Stocks | | $ | 98,131,303 | | | $ | — | | | $ | — | | | $ | 98,131,303 | |
| Short-Term Investments | | | | | | | | | | | | | | | | |
| Money Market Funds | | $ | 3,934,096 | | | $ | — | | | $ | — | | | $ | 3,934,096 | |
| Total Short-Term Investments | | $ | 3,934,096 | | | $ | — | | | $ | — | | | $ | 3,934,096 | |
| Total Investments | | $ | 102,065,399 | | | $ | — | | | $ | — | | | $ | 102,065,399 | |
Transfers between levels are recognized at the end of the reporting period. During the six-month period ended April 30, 2016, the Fund recognized no transfers between levels.
The accompanying notes are an integral part of these financial statements.
| HENNESSY FUNDS | 1-800-966-4354 | |
Financial Statements
Statement of Assets and Liabilities as of April 30, 2016 (Unaudited) |
| ASSETS: | | | |
| Investments in securities, at value (cost $98,575,858) | | $ | 102,065,399 | |
| Dividends and interest receivable | | | 83,628 | |
| Receivable for fund shares sold | | | 10,436 | |
| Receivable for securities sold | | | 535 | |
| Prepaid expenses and other assets | | | 19,120 | |
| Total Assets | | | 102,179,118 | |
| | | | | |
| LIABILITIES: | | | | |
| Payable for fund shares redeemed | | | 2,331 | |
| Payable to advisor | | | 63,379 | |
| Payable to administrator | | | 24,811 | |
| Payable to auditor | | | 10,064 | |
| Accrued distribution fees | | | 47,208 | |
| Accrued service fees | | | 7,519 | |
| Accrued trustees fees | | | 3,009 | |
| Accrued expenses and other payables | | | 17,762 | |
| Total Liabilities | | | 176,083 | |
| NET ASSETS | | $ | 102,003,035 | |
| | | | | |
| NET ASSETS CONSIST OF: | | | | |
| Capital stock | | $ | 103,460,527 | |
| Accumulated net investment income | | | 672,772 | |
| Accumulated net realized loss on investments | | | (5,619,805 | ) |
| Unrealized net appreciation on investments | | | 3,489,541 | |
| Total Net Assets | | $ | 102,003,035 | |
| | | | | |
| NET ASSETS | | | | |
| Investor Class: | | | | |
| Shares authorized (no par value) | | Unlimited | |
| Net assets applicable to outstanding Investor Class shares | | $ | 89,621,499 | |
| Shares issued and outstanding | | | 9,104,768 | |
| Net asset value, offering price and redemption price per share | | $ | 9.84 | |
| | | | | |
| Institutional Class: | | | | |
| Shares authorized (no par value) | | Unlimited | |
| Net assets applicable to outstanding Institutional Class shares | | $ | 12,381,536 | |
| Shares issued and outstanding | | | 1,247,535 | |
| Net asset value, offering price and redemption price per share | | $ | 9.92 | |
The accompanying notes are an integral part of these financial statements.
Financial Statements
Statement of Operations for the six months ended April 30, 2016 (Unaudited) |
| INVESTMENT INCOME: | | | |
| Dividend income | | $ | 1,287,469 | |
| Interest income | | | 2,446 | |
| Total investment income | | | 1,289,915 | |
| | | | | |
| EXPENSES: | | | | |
| Investment advisory fees (See Note 5) | | | 375,919 | |
| Distribution fees – Investor Class (See Note 5) | | | 66,779 | |
| Administration, fund accounting, custody and transfer agent fees (See Note 5) | | | 49,793 | |
| Service fees – Investor Class (See Note 5) | | | 44,519 | |
| Sub-transfer agent expenses – Investor Class (See Note 5) | | | 20,741 | |
| Sub-transfer agent expenses – Institutional Class (See Note 5) | | | 3,048 | |
| Federal and state registration fees | | | 14,924 | |
| Compliance expense | | | 11,790 | |
| Audit fees | | | 10,466 | |
| Reports to shareholders | | | 7,106 | |
| Trustees’ fees and expenses | | | 6,133 | |
| Legal fees | | | 484 | |
| Other expenses | | | 5,441 | |
| Total expenses | | | 617,143 | |
| NET INVESTMENT INCOME | | $ | 672,772 | |
| | | | | |
| REALIZED AND UNREALIZED GAINS (LOSSES): | | | | |
| Net realized loss on investments | | $ | (4,577,052 | ) |
| Net change in unrealized appreciation on investments | | | 1,989,918 | |
| Net loss on investments | | | (2,587,134 | ) |
| NET DECREASE IN NET ASSETS RESULTING FROM OPERATIONS | | $ | (1,914,362 | ) |
The accompanying notes are an integral part of these financial statements.
| HENNESSY FUNDS | 1-800-966-4354 | |
(This Page Intentionally Left Blank.)
Financial Statements
| Statements of Changes in Net Assets |
| | | Six Months Ended | | | | |
| | | April 30, 2016 | | | Year Ended | |
| | | (Unaudited) | | | October 31, 2015 | |
| OPERATIONS: | | | | | | |
| Net investment income | | $ | 672,772 | | | $ | 1,652,829 | |
| Net realized gain (loss) on investments | | | (4,577,052 | ) | | | 23,691,496 | |
| Net change in unrealized appreciation (depreciation) | | | | | | | | |
| on investments | | | 1,989,918 | | | | (23,789,596 | ) |
| Net increase (decrease) in net assets resulting from operations | | | (1,914,362 | ) | | | 1,554,729 | |
| | | | | | | | | |
| DISTRIBUTIONS TO SHAREHOLDERS FROM: | | | | | | | | |
| Net investment income | | | | | | | | |
| Investor Class | | | (1,432,337 | ) | | | (1,131,289 | ) |
| Institutional Class | | | (220,462 | ) | | | (182,392 | ) |
| Net realized gains | | | | | | | | |
| Investor Class | | | (19,800,250 | ) | | | (15,515,006 | ) |
| Institutional Class | | | (2,853,456 | ) | | | (2,199,959 | ) |
| Total distributions | | | (24,306,505 | ) | | | (19,028,646 | ) |
| | | | | | | | | |
| CAPITAL SHARE TRANSACTIONS: | | | | | | | | |
| Proceeds from shares subscribed – Investor Class | | | 3,197,113 | | | | 10,488,951 | |
| Proceeds from shares subscribed – Institutional Class | | | 210,665 | | | | 1,162,873 | |
| Dividends reinvested – Investor Class | | | 20,149,648 | | | | 15,613,606 | |
| Dividends reinvested – Institutional Class | | | 2,974,276 | | | | 2,276,330 | |
| Cost of shares redeemed – Investor Class | | | (9,455,343 | ) | | | (17,679,567 | ) |
| Cost of shares redeemed – Institutional Class | | | (1,312,302 | ) | | | (2,316,917 | ) |
| Net increase in net assets derived from | | | | | | | | |
| capital share transactions | | | 15,764,057 | | | | 9,545,276 | |
| TOTAL DECREASE IN NET ASSETS | | | (10,456,810 | ) | | | (7,928,641 | ) |
| | | | | | | | | |
| NET ASSETS: | | | | | | | | |
| Beginning of period | | | 112,459,845 | | | | 120,388,486 | |
| End of period | | $ | 102,003,035 | | | $ | 112,459,845 | |
| Undistributed net investment income, end of period | | $ | 672,772 | | | $ | 1,652,799 | |
| | | | | | | | | |
| CHANGES IN SHARES OUTSTANDING: | | | | | | | | |
| Shares sold – Investor Class | | | 312,876 | | | | 772,173 | |
| Shares sold – Institutional Class | | | 20,715 | | | | 84,750 | |
| Shares issued to holders as reinvestment | | | | | | | | |
| of dividends – Investor Class | | | 2,044,705 | | | | 1,169,440 | |
| Shares issued to holders as reinvestment | | | | | | | | |
| of dividends – Institutional Class | | | 299,398 | | | | 168,993 | |
| Shares redeemed – Investor Class | | | (845,468 | ) | | | (1,307,953 | ) |
| Shares redeemed – Institutional Class | | | (127,124 | ) | | | (171,821 | ) |
| Net increase in shares outstanding | | | 1,705,102 | | | | 715,582 | |
The accompanying notes are an integral part of these financial statements.
| HENNESSY FUNDS | 1-800-966-4354 | |
Financial Statements
For an Investor Class share outstanding throughout each period
| | | Six Months Ended | |
| | | April 30, 2016 | |
| | | (Unaudited) | |
| PER SHARE DATA: | | | |
| Net asset value, beginning of period | | $ | 12.99 | |
| | | | | |
| Income (loss) from investment operations: | | | | |
| Net investment income | | | 0.03 | |
| Net realized and unrealized gains (losses) on investments | | | (0.29 | ) |
| Total from investment operations | | | (0.26 | ) |
| | | | | |
| Less distributions: | | | | |
| Dividends from net investment income | | | (0.16 | ) |
| Dividends from net realized gains | | | (2.73 | ) |
| Total distributions | | | (2.89 | ) |
| Net asset value, end of period | | $ | 9.84 | |
| | | | | |
| TOTAL RETURN | | | (1.67 | )%(1) |
| | | | | |
| SUPPLEMENTAL DATA AND RATIOS: | | | | |
| Net assets, end of period (millions) | | $ | 89.62 | |
| Ratio of expenses to average net assets: | | | | |
| Before expense reimbursement | | | 1.25 | %(2) |
| After expense reimbursement | | | 1.25 | %(2) |
| Ratio of net investment income to average net assets: | | | | |
| Before expense reimbursement | | | 1.29 | %(2) |
| After expense reimbursement | | | 1.29 | %(2) |
Portfolio turnover rate(3) | | | 54 | %(1) |
(1) | Not annualized. |
(2) | Annualized. |
(3) | Portfolio turnover is calculated on the basis of the Fund as a whole. |
The accompanying notes are an integral part of these financial statements.
| Year Ended October 31, | |
| 2015 | | | 2014 | | | 2013 | | | 2012 | | | 2011 | |
| | | | | | | | | | | | | | |
| $ | 15.16 | | | $ | 13.56 | | | $ | 10.77 | | | $ | 12.37 | | | $ | 11.70 | |
| | | | | | | | | | | | | | | | | | | |
| | | | | | | | | | | | | | | | | | | |
| | 0.17 | | | | 0.15 | | | | 0.14 | | | | 0.13 | | | | 0.09 | |
| | 0.04 | | | | 2.28 | | | | 2.77 | | | | 0.80 | | | | 0.69 | |
| | 0.21 | | | | 2.43 | | | | 2.91 | | | | 0.93 | | | | 0.78 | |
| | | | | | | | | | | | | | | | | | | |
| | | | | | | | | | | | | | | | | | | |
| | (0.14 | ) | | | (0.15 | ) | | | (0.10 | ) | | | (0.07 | ) | | | (0.09 | ) |
| | (2.24 | ) | | | (0.68 | ) | | | (0.02 | ) | | | (2.46 | ) | | | (0.02 | ) |
| | (2.38 | ) | | | (0.83 | ) | | | (0.12 | ) | | | (2.53 | ) | | | (0.11 | ) |
| $ | 12.99 | | | $ | 15.16 | | | $ | 13.56 | | | $ | 10.77 | | | $ | 12.37 | |
| | | | | | | | | | | | | | | | | | | |
| | 1.11 | % | | | 18.73 | % | | | 27.32 | % | | | 9.14 | % | | | 6.70 | % |
| | | | | | | | | | | | | | | | | | | |
| | | | | | | | | | | | | | | | | | | |
| $ | 98.64 | | | $ | 105.51 | | | $ | 88.77 | | | $ | 75.83 | | | $ | 77.88 | |
| | | | | | | | | | | | | | | | | | | |
| | 1.09 | % | | | 1.15 | % | | | 1.19 | % | | | 1.27 | % | | | 1.26 | % |
| | 1.09 | % | | | 1.15 | % | | | 1.19 | % | | | 1.27 | % | | | 1.30 | % |
| | | | | | | | | | | | | | | | | | | |
| | 1.37 | % | | | 1.12 | % | | | 1.10 | % | | | 1.35 | % | | | 0.72 | % |
| | 1.37 | % | | | 1.12 | % | | | 1.10 | % | | | 1.35 | % | | | 0.68 | % |
| | 79 | % | | | 57 | % | | | 73 | % | | | 0 | % | | | 70 | % |
The accompanying notes are an integral part of these financial statements.
| HENNESSY FUNDS | 1-800-966-4354 | |
Financial Statements
For an Institutional Class share outstanding throughout each period
| | | Six Months Ended | |
| | | April 30, 2016 | |
| | | (Unaudited) | |
| PER SHARE DATA: | | | |
| Net asset value, beginning of period | | $ | 13.10 | |
| | | | | |
| Income (loss) from investment operations: | | | | |
| Net investment income | | | 0.07 | |
| Net realized and unrealized gains (losses) on investments | | | (0.32 | ) |
| Total from investment operations | | | (0.25 | ) |
| | | | | |
| Less distributions: | | | | |
| Dividends from net investment income | | | (0.17 | ) |
| Dividends from net realized gains | | | (2.76 | ) |
| Total distributions | | | (2.93 | ) |
| Net asset value, end of period | | $ | 9.92 | |
| | | | | |
| TOTAL RETURN | | | (1.54 | )%(1) |
| | | | | |
| SUPPLEMENTAL DATA AND RATIOS: | | | | |
| Net assets, end of period (millions) | | $ | 12.38 | |
| Ratio of expenses to average net assets: | | | | |
| Before expense reimbursement | | | 1.00 | %(2) |
| After expense reimbursement | | | 1.00 | %(2) |
| Ratio of net investment income to average net assets: | | | | |
| Before expense reimbursement | | | 1.55 | %(2) |
| After expense reimbursement | | | 1.55 | %(2) |
Portfolio turnover rate(3) | | | 54 | %(1) |
(1) | Not annualized. |
(2) | Annualized. |
(3) | Portfolio turnover is calculated on the basis of the Fund as a whole. |
The accompanying notes are an integral part of these financial statements.
| Year Ended October 31, | |
| 2015 | | | 2014 | | | 2013 | | | 2012 | | | 2011 | |
| | | | | | | | | | | | | | |
| $ | 15.30 | | | $ | 13.68 | | | $ | 10.85 | | | $ | 12.44 | | | $ | 11.76 | |
| | | | | | | | | | | | | | | | | | | |
| | | | | | | | | | | | | | | | | | | |
| | 0.20 | | | | 0.17 | | | | 0.09 | | | | 0.07 | | | | 0.08 | |
| | 0.02 | | | | 2.30 | | | | 2.88 | | | | 0.89 | | | | 0.74 | |
| | 0.22 | | | | 2.47 | | | | 2.97 | | | | 0.96 | | | | 0.82 | |
| | | | | | | | | | | | | | | | | | | |
| | | | | | | | | | | | | | | | | | | |
| | (0.16 | ) | | | (0.17 | ) | | | (0.12 | ) | | | (0.09 | ) | | | (0.12 | ) |
| | (2.26 | ) | | | (0.68 | ) | | | (0.02 | ) | | | (2.46 | ) | | | (0.02 | ) |
| | (2.42 | ) | | | (0.85 | ) | | | (0.14 | ) | | | (2.55 | ) | | | (0.14 | ) |
| $ | 13.10 | | | $ | 15.30 | | | $ | 13.68 | | | $ | 10.85 | | | $ | 12.44 | |
| | | | | | | | | | | | | | | | | | | |
| | 1.19 | % | | | 18.96 | % | | | 27.63 | % | | | 9.43 | % | | | 6.99 | % |
| | | | | | | | | | | | | | | | | | | |
| | | | | | | | | | | | | | | | | | | |
| $ | 13.82 | | | $ | 14.88 | | | $ | 16.19 | | | $ | 33.94 | | | $ | 0.14 | |
| | | | | | | | | | | | | | | | | | | |
| | 0.99 | % | | | 1.06 | % | | | 1.10 | % | | | 1.41 | % | | | 1.14 | % |
| | 0.99 | % | | | 0.98 | % | | | 0.98 | % | | | 0.98 | % | | | 0.98 | % |
| | | | | | | | | | | | | | | | | | | |
| | 1.47 | % | | | 1.21 | % | | | 1.38 | % | | | 6.44 | % | | | 0.81 | % |
| | 1.47 | % | | | 1.30 | % | | | 1.50 | % | | | 6.87 | % | | | 0.97 | % |
| | 79 | % | | | 57 | % | | | 73 | % | | | 0 | % | | | 70 | % |
The accompanying notes are an integral part of these financial statements.
| HENNESSY FUNDS | 1-800-966-4354 | |
Financial Statements
Notes to the Financial Statements April 30, 2016 (Unaudited) |
1). ORGANIZATION
The Hennessy Cornerstone Large Growth Fund (the “Fund”) is a series of Hennessy Funds Trust (the “Trust”), which was organized as a Delaware statutory trust on September 17, 1992. The Fund is an open-end management investment company registered under the Investment Company Act of 1940, as amended. The investment objective of the Fund is long-term growth of capital. The Fund is a diversified fund.
The Fund offers Investor Class and Institutional Class shares. Each class of shares differs principally in its respective administration, 12b-1 distribution and service, shareholder servicing, and transfer agent expenses and sales charges, if any. Each class has identical rights to earnings, assets, and voting privileges, except for class-specific expenses and exclusive rights to vote on matters affecting only an individual class.
As an investment company, the Fund follows the investment company accounting and reporting guidance of the Financial Accounting Standards Board (“FASB”) Accounting Standard Codification Topic 946 “Financial Services—Investment Companies.”
2). SIGNIFICANT ACCOUNTING POLICIES
The following is a summary of significant accounting policies consistently followed by the Fund in the preparation of the financial statements. These policies are in conformity with U.S. generally accepted accounting principles (“GAAP”).
| a). | Investment Valuation – All investments in securities are recorded at their estimated fair value, as described in Note 3. |
| b). | Federal Income Taxes – Provision for federal income taxes or excise taxes has not been made since the Fund has elected to be taxed as a “regulated investment company” and intends to distribute substantially all of its taxable income to its shareholders and otherwise comply with the provisions of the Internal Revenue Code of 1986, as amended, applicable to regulated investment companies. Net investment income or loss and realized gains and losses for federal income tax purposes may differ from that reported on the financial statements because of temporary book and tax basis differences. Temporary differences are primarily the result of the treatment of wash sales for tax reporting purposes. The Fund recognizes interest and penalties related to income tax benefits, if any, in the statement of operations as an income tax expense. Distributions from net realized gains for book purposes may include short-term capital gains, which are included as ordinary income to shareholders for tax purposes. |
| c). | Income and Expenses – Dividend income is recognized on the ex-dividend date or as soon as information is available to the Fund. Interest income, which includes the amortization of premium and accretion of discount, is recognized on an accrual basis. The Fund is charged for those expenses that are directly attributable to the portfolio, such as advisory, administration, and certain shareholder service fees. Income, expenses (other than expenses attributable to a specific class), and realized and unrealized gains or losses on investments are allocated to each class of shares based on its respective net assets. |
| d). | Distributions to Shareholders – Dividends from net investment income for the Fund, if any, are declared and paid annually, usually in December. Distributions of net realized capital gains, if any, are declared and paid annually, usually in December. |
| e). | Security Transactions – Investment and shareholder transactions are recorded on the trade date. The Fund determines the gain or loss realized from the investment transactions by comparing the original cost of the security lot sold with the net sale proceeds. Discounts and premiums on securities purchased are accreted/amortized over the life of the respective security. |
| f). | Use of Estimates – The preparation of financial statements in conformity with GAAP requires management to make estimates and assumptions that affect the reported amounts of assets and liabilities and disclosure of contingent assets and liabilities at the date of the financial statements and the reported change in net assets during the reporting period. Actual results could differ from those estimates. |
| g). | Share Valuation – The net asset value (“NAV”) per share of the Fund is calculated by dividing the sum of the value of the securities held by the Fund, plus cash or other assets, minus all liabilities (including estimated accrued expenses) by the total number of shares outstanding for the Fund, rounded to the nearest cent. The Fund’s shares will not be priced on days the New York Stock Exchange is closed for trading. The offering and redemption price per share for the Fund is equal to the Fund’s NAV per share. |
| h). | Repurchase Agreements – The Fund may enter into repurchase agreements with member banks or security dealers of the Federal Reserve Board whom the investment advisor deems creditworthy. The repurchase price generally equals the price paid by the Fund plus interest negotiated on the basis of current short-term rates. |
| | Securities pledged as collateral for repurchase agreements are held by the custodian bank until the respective agreements mature. Provisions of the repurchase agreements ensure that the market value of the collateral, including accrued interest thereon, is sufficient to cover the repurchase amount in the event of default of the counterparty. If the counterparty defaults and the value of the collateral declines or if the counterparty enters an insolvency proceeding, realization of the collateral by the Fund may be delayed or limited. |
| i). | Accounting for Uncertainty in Income Taxes – The Fund has accounting policies regarding recognition and measurement of tax positions taken or expected to be taken on a tax return. The tax returns of the Fund for the prior three fiscal years are open for examination. The Fund has reviewed all open tax years in major jurisdictions and concluded that there is no impact on the Fund’s net assets and no tax liability resulting from unrecognized tax benefits relating to uncertain income tax positions taken or expected to be taken on a tax return. The Fund’s major tax jurisdictions are U.S. federal and Delaware. |
| j). | Derivatives – The Fund may invest in, or enter into, derivatives, such as options, futures contracts, options on futures contracts, and swaps, for a variety of reasons, including to hedge certain risks, to provide a substitute for purchasing or selling particular securities, or to increase potential income gain. Derivatives are financial contracts based on an underlying or notional amount, require no initial investment or an initial net investment that is smaller than would normally be required to have a similar response to changes in market factors, and require or permit net settlement. Derivatives may allow the Fund to increase or decrease the level of risk to which the Fund is exposed more quickly and efficiently than transactions in other types of instruments. The main purpose of utilizing derivative instruments is for hedging purposes. |
| | The Fund follows the financial accounting reporting rules as required by the Derivatives and Hedging Topic of the FASB Accounting Standards Codification. Under such rules, the Fund is required to include enhanced disclosure that enables investors to understand how and why an entity uses derivatives, how derivatives are |
| HENNESSY FUNDS | 1-800-966-4354 | |
| | accounted for, and how derivatives instruments affect an entity’s results of operations and financial position. During the six months ended April 30, 2016, the Fund did not hold any derivative instruments. |
| k). | New Accounting Pronouncements – In May 2015, the FASB issued ASU No. 2015-07 “Disclosure for Investments in Certain Entities that Calculate Net Asset Value per Share (or Its Equivalent).” The amendments in ASU No. 2015-07 remove the requirement to categorize within the fair value hierarchy investments measured at NAV and require the disclosure of sufficient information to reconcile the fair value of the remaining assets categorized within the fair value hierarchy to the financial statements. The amendments in ASU No. 2015-07 are effective for fiscal years beginning after December 15, 2015, and interim periods within those fiscal years. Management has reviewed the requirements and believes the adoption of ASU 2015-07 will not have a material impact on the Fund’s financial statements and related disclosures. |
3). SECURITIES VALUATION
The Fund follows authoritative fair valuation accounting standards that establish an authoritative definition of fair value and set out a hierarchy for measuring fair value. These standards require additional disclosures about the various inputs and valuation techniques used to develop the measurements of fair value and a discussion in changes in valuation techniques and related inputs during the period. These inputs are summarized in the three broad levels listed below:
| | Level 1 – | Unadjusted, quoted prices in active markets for identical instruments that the Fund has the ability to access at the date of measurement. |
| | Level 2 – | Other significant observable inputs (including, but not limited to, quoted prices in active markets for similar instruments, quoted prices in markets that are not active for identical or similar instruments, and model-derived valuations in which all significant inputs and significant value drivers are observable in active markets (such as interest rates, prepayment speeds, credit risk curves, default rates, and similar data)). |
| | Level 3 – | Significant unobservable inputs (including the Fund’s own assumptions about what market participants would use to price the asset or liability based on the best available information) when observable inputs are unavailable. |
Following is a description of the valuation techniques applied to the Fund’s major categories of assets and liabilities measured at fair value on a recurring basis.
Equity Securities – Equity securities, including common stocks, preferred stocks, exchange-traded funds, closed-end mutual funds, partnerships, rights, and real estate investment trusts, that are traded on a securities exchange for which a last-quoted sales price is readily available will generally be valued at the last sales price as reported by the primary exchange on which the securities are listed. Securities listed on The NASDAQ Stock Market (“NASDAQ”) will generally be valued at the NASDAQ Official Closing Price, which may differ from the last sales price reported. Securities traded on a securities exchange for which a last-quoted sales price is not readily available will generally be valued at the mean between the bid and ask prices. To the extent these securities are actively traded and valuation adjustments are not applied, they are classified in Level 1 of the fair value hierarchy.
Registered Investment Companies – Investments in registered investment companies (e.g., mutual funds) are generally priced at the ending NAV provided by the applicable registered investment company’s service agent and will be classified in Level 1 of the fair value hierarchy.
Debt Securities – Debt securities, including corporate bonds, asset-backed securities, mortgage-backed securities, municipal bonds, U.S. Treasuries, and U.S. government agency issues, are generally valued at market on the basis of valuations furnished by an independent pricing service that utilizes both dealer-supplied valuations and formula-based techniques. The pricing service may consider recently executed transactions in securities of the issuer or comparable issuers, market price quotations (where observable), bond spreads, and fundamental data relating to the issuer. In addition, the model may incorporate observable market data, such as reported sales of similar securities, broker quotes, yields, bids, offers, and reference data. Certain securities are valued primarily using dealer quotations. These securities are generally classified in Level 2 of the fair value hierarchy.
Short-Term Securities – Short-term equity investments, including money market funds, are valued in the manner specified above. Short-term debt investments with an original term to maturity of 60 days or less are valued at amortized cost, which approximates fair market value. If the original term to maturity of a short-term debt investment exceeded 60 days, then the values as of the 61st day prior to maturity are amortized. Amortized cost is not used if its use would be inappropriate due to credit or other impairments of the issuer, in which case the security’s fair value would be determined, as described below. Short-term securities are generally classified in Level 1 or Level 2 of the fair market hierarchy depending on the inputs used and market activity levels for specific securities.
The Board of Trustees of the Fund (the “Board”) has adopted fair value pricing procedures that are followed when a price for a security is not readily available or if a significant event has occurred that indicates the closing price of a security no longer represents the true value of that security. Fair value pricing determinations are made in good faith in accordance with these procedures. There are numerous criteria that will be given consideration in determining a fair value of a security, such as the trading volume of a security and markets, the value of other like securities, and news events with direct bearing to a security or markets. Fair value pricing results in an estimated price for a security that reflects the amount the Fund might reasonably expect to receive in a current sale. Depending on the relative significance of the valuation inputs, these securities may be classified in either Level 2 or Level 3 of the fair value hierarchy.
The Board has delegated day-to-day valuation matters to a Valuation Committee comprised of one or more representatives from Hennessy Advisors, Inc., the Fund’s investment advisor. The function of the Valuation Committee is to value securities where current and reliable market quotations are not readily available. All actions taken by the Valuation Committee are reviewed by the Board.
The Fund has performed an analysis of all existing investments to determine the significance and character of all inputs to their fair value determination. Various inputs are used in determining the value of the Fund’s investments. The inputs or methodology used for valuing securities are not necessarily an indication of the risk associated with investing in those securities. Details related to the fair valuation hierarchy of the Fund’s securities as of April 30, 2016, are included in the Fund’s Schedule of Investments.
4). INVESTMENT TRANSACTIONS
Purchases and sales of investment securities (excluding government and short-term investments) for the Fund during the six months ended April 30, 2016, were $52,445,861 and $60,474,280, respectively.
There were no purchases or sales/maturities of long-term U.S. government securities for the Fund during the six months ended April 30, 2016.
| HENNESSY FUNDS | 1-800-966-4354 | |
5). INVESTMENT MANAGEMENT FEE AND OTHER TRANSACTIONS WITH AFFILIATES
Hennessy Advisors, Inc. (the “Advisor”) is the investment advisor of the Fund. The Advisor provides the Fund with investment management services under an Investment Advisory Agreement. The Advisor furnishes all investment advice, office space, facilities, and provides most of the personnel needed by the Fund. As compensation for its services, the Advisor is entitled to a monthly fee from the Fund. The fee is based upon the average daily net assets of the Fund at the annual rate of 0.74%. The net investment advisory fees payable by the Fund as of April 30, 2016, were $63,379.
In the past, the Advisor had agreed to waive its fees and absorb expenses to the extent that the total annual operating expenses exceeded 0.98% of the Fund’s net assets for the Institutional Class shares of the Fund (excluding all federal, state and local taxes, interest, brokerage commissions, acquired fund fees and expenses and other costs incurred in connection with the purchase and sale of securities and extraordinary items). The expense limitation agreement was terminated by the Board as of February 28, 2015.
For a period of three years after the year in which the Advisor waived or reimbursed expenses, the Advisor may seek reimbursement from the Fund to the extent that total annual fund operating expenses are less than the expense limitation that was in effect at the time the Advisor waived or reimbursed expenses. As of April 30, 2016, cumulative expenses subject to potential recovery under the aforementioned conditions were $238 for Institutional Class shares, which will expire on October 31, 2018.
The Board has approved a Shareholder Servicing Agreement for the Investor Class shares of the Fund, which was instituted to compensate the Advisor for the non-investment management services it provides to the Fund. The Shareholder Servicing Agreement provides for a monthly fee paid to the Advisor at an annual rate of 0.10% of the average daily net assets of the Fund attributable to Investor Class shares. Shareholder service fees payable by the Fund as of April 30, 2016, were $7,519.
The Fund has adopted a plan pursuant to Rule 12b-1 under the Investment Company Act of 1940, as amended, that authorizes payments in connection with the distribution of the Fund’s shares at an annual rate of up to 0.25% of the Fund’s average daily net assets attributable to Investor Class shares. Even though the authorized rate is up to 0.25%, the Fund has only used up to 0.15% of its average daily net assets attributable to Investor Class shares for such purpose since the plan was implemented on November 1, 2015. Amounts paid under the plan may be spent on any activities or expenses primarily intended to result in the sale of shares, including, but not limited to, advertising, shareholder account servicing, the printing and mailing of prospectuses to other than current shareholders, the printing and mailing of sales literature, and compensation for sales and marketing activities or to financial institutions and others, such as dealers and distributors.
The Fund has entered into agreements with various brokers, dealers, and financial intermediaries in connection with the sale of shares of the Fund. The agreements provide for periodic payments by the Fund to the brokers, dealers, and financial intermediaries for providing certain shareholder maintenance services (sub-transfer agent expenses). These shareholder services include the pre-processing and quality control of new accounts, shareholder correspondence, answering customer inquiries regarding account status, and facilitating shareholder telephone transactions. Fees paid by the Fund to various brokers, dealers, and financial intermediaries during the six months ended April 30, 2016, were $23,789.
U.S. Bancorp Fund Services, LLC (“USBFS”) provides the Fund with administrative, fund accounting, and transfer agent services, and necessary office equipment. As
administrator, USBFS is responsible for activities such as (i) preparing various federal and state regulatory filings, reports, and returns for the Fund, (ii) preparing reports and materials to be supplied to the Board, (iii) monitoring the activities of the Fund’s custodian, transfer agent, and accountants, and (iv) coordinating the preparation and payment of the Fund’s expenses and reviewing the Fund’s expense accruals. Fees paid to USBFS during the six months ended April 30, 2016, were $49,793.
U.S. Bank, N.A., an affiliate of USBFS, serves as the Fund’s custodian. Quasar Distributors, LLC acts as the Fund’s principal underwriter in a continuous public offering of the Fund’s shares. Quasar Distributors, LLC is an affiliate of USBFS and U.S. Bank, N.A.
6). LINE OF CREDIT
The Fund has an uncommitted line of credit with the other funds in the Hennessy Funds family of funds (the “Hennessy Funds”) in the amount of the lesser of (i) $100,000,000 or (ii) 33.33% of each Hennessy Fund’s net assets, or 30% for the Hennessy Gas Utility Fund and 10% for the Hennessy Balanced Fund, intended to provide short-term financing, if necessary, subject to certain restrictions, in connection with shareholder redemptions. The credit facility is with the Hennessy Funds’ custodian bank, U.S. Bank, N.A. Borrowings under this arrangement bear interest at the bank’s prime rate and are secured by all of the Fund’s assets (as to its own borrowings only). During the six months ended April 30, 2016, the Fund had an outstanding average daily balance and a weighted average interest rate of $21,044 and 3.44%, respectively. The maximum amount outstanding for the Fund during the period was $1,291,000. At April 30, 2016, the Fund did not have any borrowings outstanding under the line of credit.
7). FEDERAL TAX INFORMATION
As of October 31, 2015, the Fund’s most recent fiscal year end, the components of accumulated earnings (losses) for income tax purposes were as follows:
| Cost of investments for tax purposes | | $ | 111,428,315 | |
| Gross tax unrealized appreciation | | $ | 11,949,775 | |
| Gross tax unrealized depreciation | | | (10,477,605 | ) |
| Net tax unrealized appreciation | | $ | 1,472,170 | |
| Undistributed ordinary income | | $ | 1,652,799 | |
| Undistributed long-term capital gains | | | 22,653,659 | |
| Total distributable earnings | | $ | 24,306,458 | |
| Other accumulated loss | | $ | (1,015,253 | ) |
| Total accumulated gain | | $ | 24,763,375 | |
The difference between book-basis unrealized appreciation/depreciation (as shown in the Statement of Assets and Liabilities) and tax-basis unrealized appreciation/depreciation (as shown above) is attributable primarily to wash sales.
At October 31, 2015, the Fund’s most recent fiscal year end, the Fund had capital loss carryforwards of $1,015,253 that expire on October 31, 2016.
During the fiscal year ended October 31, 2015, the Fund’s most recent fiscal year, the capital loss carryforwards utilized for the Fund were $1,015,253.
Capital losses sustained in the fiscal year ended October 31, 2012 and in future taxable years will not expire and may be carried over by the Fund without limitation; however, they will retain the character of the original loss. Furthermore, any loss incurred during those taxable years will be required to be utilized prior to the losses incurred in taxable years prior to 2012. As a result of this ordering rule, pre-enactment capital loss carryforwards may be more likely to expire unused. Under pre-enactment law,
| HENNESSY FUNDS | 1-800-966-4354 | |
capital losses could be carried forward for eight years, and carried forward as short-term capital losses, irrespective of the character of the original loss.
At October 31, 2015, the Fund’s most recent fiscal year end, the Fund did not defer, on a tax basis, any post-December late year ordinary loss deferrals.
The tax character of distributions paid during fiscal year 2016 (year to date) and fiscal year 2015 for the Fund were as follows:
| | | Six Months Ended | | | Year Ended | |
| | | April 30, 2016 | | | October 31, 2015 | |
| Ordinary income | | $ | 1,652,799 | | | $ | 1,313,681 | |
| Long-term capital gain | | | 22,653,706 | | | | 17,714,965 | |
| | | $ | 24,306,505 | | | $ | 19,028,646 | |
(This Page Intentionally Left Blank.)
| HENNESSY FUNDS | 1-800-966-4354 | |
Expense Example (Unaudited)
April 30, 2016
As a shareholder of the Fund, you incur two types of costs: (1) transaction costs, including sales charges (loads) on purchase payments, reinvested dividends, or other distributions; redemption fees; and exchange fees; and (2) ongoing costs, including management fees; service fees; and other Fund expenses. This Example is intended to help you understand your ongoing costs (in dollars) of investing in the Fund and to compare these costs with the ongoing costs of investing in other mutual funds. The Example is based on an investment of $1,000 invested at the beginning of the period and held for the entire period from November 1, 2015 through April 30, 2016.
Actual Expenses
The first line of the table below under the “Investor Class” and “Institutional Class” headings provides information about actual account values and actual expenses. Although the Fund charges no sales loads or transaction fees, you will be assessed fees for outgoing wire transfers, returned checks and stop payment orders at prevailing rates charged by U.S. Bancorp Fund Services, LLC, the Fund’s transfer agent. If you request that a redemption be made by wire transfer, currently a $15.00 fee is charged by the Fund’s transfer agent. IRA accounts will be charged a $15.00 annual maintenance fee. The example below includes, but is not limited to, management fees, shareholder servicing fees, fund accounting, custody, and transfer agent fees. However, the example below does not include portfolio trading commissions and related expenses, and other extraordinary expenses as determined under generally accepted accounting principles. You may use the information in this line, together with the amount you invested, to estimate the expenses that you paid over the period. Simply divide your account value by $1,000 (for example, an $8,600 account value divided by $1,000 = 8.6), then multiply the result by the number in the first line of the table under the “Investor Class” and ��Institutional Class” headings in the column entitled “Expenses Paid During Period” to estimate the expenses you paid on your account during this period.
Hypothetical Example for Comparison Purposes
The second line of the table below under the “Investor Class” and “Institutional Class” headings provides information about hypothetical account values and hypothetical expenses based on the Fund’s actual expense ratios and an assumed rate of return of 5% per year before expenses, which is not the Fund’s actual return. The hypothetical account values and expenses may not be used to estimate the actual ending account balance or expenses you paid for the period. You may use this information to compare the ongoing costs of investing in the Fund and other funds. To do so, compare this 5% hypothetical example with the 5% hypothetical examples that appear in the shareholder reports of the other funds. Please note that the expenses shown in the table are meant to highlight your ongoing costs only and do not reflect any transactional costs, such as sales charges (loads), or exchange fees. Therefore, the second line of the table under the “Investor Class” and “Institutional Class” headings is useful in comparing ongoing costs only, and will not help you determine the relative total costs of owning different funds. In addition, if these transactional costs were included, your costs would have been higher.
| | | | Expenses Paid |
| | Beginning | Ending | During Period(1) |
| | Account Value | Account Value | November 1, 2015 – |
| | November 1, 2015 | April 30, 2016 | April 30, 2016 |
| Investor Class | | | |
| Actual | $1,000.00 | $ 983.30 | $6.16 |
| Hypothetical (5% return before expenses) | $1,000.00 | $1,018.65 | $6.27 |
| | | | |
| Institutional Class | | | |
| Actual | $1,000.00 | $ 984.60 | $4.93 |
| Hypothetical (5% return before expenses) | $1,000.00 | $1,019.89 | $5.02 |
(1) | Expenses are equal to the Fund’s annualized expense ratio of 1.25% for Investor Class shares or 1.00% for Institutional Class shares, as applicable, multiplied by the average account value over the period, multiplied by 182/366 days (to reflect one-half year period). |
| HENNESSY FUNDS | 1-800-966-4354 | |
How to Obtain a Copy of the Fund’s
Proxy Voting Policy and Proxy Voting Records
A description of the policies and procedures the Fund uses to determine how to vote proxies relating to portfolio securities is available without charge: (1) by calling 1-800-966-4354; (2) on the Hennessy Funds’ website at hennessyfunds.com/proxy-voting/policy.fs; or (3) on the U.S. Securities and Exchange Commission’s website at www.sec.gov. The Fund’s proxy voting record is available without charge on both the Hennessy Funds’ website at hennessyfunds.com/proxy-voting/policy.fs and the SEC’s website at www.sec.gov no later than August 31 for the prior 12 months ending June 30.
Quarterly Filings on Form N-Q
The Fund files its complete schedule of portfolio holdings with the SEC for the first and third quarters of each fiscal year on Form N-Q. The Fund’s Form N-Q will be available on the SEC’s website at www.sec.gov. The Fund’s Form N-Q may be reviewed and copied at the SEC’s Public Reference Room in Washington, DC and information on the operation of the Public Reference Room may be obtained by calling 1-800-SEC-0330. Information included in the Fund’s N-Q will also be available upon request by calling 1-800-966-4354.
Federal Tax Distribution Information
(Unaudited)
For the fiscal year ended October 31, 2015, certain dividends paid by the Fund may be subject to a maximum tax rate of 23.8%, as provided for by the Jobs and Growth Tax Relief Reconciliation Act of 2003. The percentage of dividends declared from ordinary income designated as qualified dividend income was 100.00%.
For corporate shareholders, the percent of ordinary income distributions that qualified for the corporate dividends received deduction for the fiscal year ended October 31, 2015 was 100.00%.
The percentage of taxable ordinary income distributions that are designated as short-term capital gain distributions under Section 871(k)(2)(C) of the Internal Revenue Code of 1986, as amended, for the Fund was 0.00%.
Householding
To help keep the Fund’s costs as low as possible, we generally deliver a single copy of most financial reports and prospectuses to shareholders who share an address, even if the accounts are registered under different names. This process, known as “householding,” does not apply to account statements. You may, of course, request an individual copy of a prospectus or financial report at any time. If you would like to receive separate mailings, please call the Administrator at 1-800-261-6950 or 1-414-765-4124 and we will begin individual delivery within 30 days of your request. If your account is held through a financial institution or other intermediary, please contact them directly to request individual delivery.
Board Approval of Investment Advisory
Agreement
At its meeting on March 9, 2016, the Board of Trustees of the Fund (the “Board,” and the members thereof, the “Trustees”) unanimously approved the continuation of the investment advisory agreement of the Fund with Hennessy Advisors, Inc. (the “Advisor”). As part of the process of approving the continuation of the advisory agreement, the Trustees reviewed their fiduciary duties with respect to approving the advisory agreement and the relevant factors for them to consider. In addition, the Trustees who are not deemed “interested persons” (as that term is defined by the Investment Company Act of 1940) of the Fund (the “Independent Trustees”) met in executive session to discuss the approval of the advisory agreement.
In advance of the meeting, the Advisor sent detailed information to the Trustees to assist them in their evaluation of the advisory agreement. This information included, but was not limited to, (i) a memorandum from outside legal counsel that described the fiduciary duties of the Board with respect to approving the continuation of the advisory agreement and the relevant factors for consideration, (ii) a memorandum from the Advisor that listed the factors relevant to the Board’s approval of the continuation of the advisory agreement and also referenced the documents that had been provided to help the Board assess each such factor, (iii) an inventory of the range of services provided by the Advisor for the Fund, (iv) a written discussion of economies of scale, (v) the advisory agreement, (vi) a recent Fund fact sheet, (vii) a peer expense comparison, (viii) performance information, (ix) the Advisor’s most recent Form 10-K and Form 10-Q, which included information about the Advisor’s profitability, (x) information about brokerage commissions, (xi) information about the Fund’s compliance program, (xii) the Advisor’s current Form ADV Part I, and (xii) other information the Trustees believed was useful in evaluating the approval of the continuation of the advisory agreement.
All of the factors discussed by the Trustees were considered as a whole, and were considered separately by the Independent Trustees, meeting in executive session. The factors were viewed in their totality by the Trustees, with no single factor being the principal or determinative factor in the Trustees’ determination of whether to approve the continuation of the advisory agreement. The Trustees recognized that the management and fee arrangements for the Fund are the result of years of review and discussion between the Independent Trustees and the Advisor, that certain aspects of such arrangements may receive greater scrutiny in some years than in others, and that the Trustees’ conclusions may be based, in part, on their consideration of these same arrangements and information received during the course of the year and in prior years.
Prior to approving the continuation of the advisory agreement, the Trustees and the Independent Trustees in executive session considered, among other items:
| | • | The nature and quality of the advisory services provided by the Advisor. |
| | • | A comparison of the fees and expenses of the Fund to other similar funds. |
| | • | Whether economies of scale are recognized by the Fund. |
| | • | The costs and profitability of the Fund to the Advisor. |
| | • | The performance of the Fund. |
| | • | The other benefits to the Advisor from serving as an investment advisor to the Fund (in addition to the advisory fee). |
| HENNESSY FUNDS | 1-800-966-4354 | |
The material considerations and determinations of the Board of Trustees, including all of the Independent Trustees, are as follows:
| | • | The Board considered the services identified below that are provided by the Advisor. Based on this review, the Trustees believe that the Advisor provides high-quality services to the Fund, and they noted that their overall confidence in the Advisor is high. The Trustees also concluded that they were satisfied with the nature, extent, and quality of the advisory services provided to the Fund by the Advisor, and that the nature and extent of the services provided by the Advisor are appropriate to assure that the Fund’s operations are conducted in compliance with applicable laws, rules, and regulations. |
| | | • | The Advisor acts as the portfolio manager for the Fund. In this capacity, the Advisor does the following: |
| | | | • | manages the composition of the Fund’s portfolio, including the purchase, retention, and disposition of portfolio securities in accordance with the Fund’s investment objectives, policies, and restrictions; |
| | | | • | ensures compliance with “best execution” for the Fund’s portfolio; |
| | | | • | manages the use of soft dollars for the Fund. |
| | | • | The Advisor performs a daily reconciliation of portfolio positions and cash for the Fund. |
| | | • | The Advisor monitors the Fund’s compliance with its investment objectives and restrictions. |
| | | • | The Advisor monitors compliance with federal securities laws and performs activities such as maintaining a compliance program, conducting ongoing reviews of the compliance programs of the Fund’s service providers, conducting on-site visits to the Fund’s service providers, monitoring incidents of abusive trading practices, reviewing Fund expense accruals, payments, and fixed expense ratios, evaluating insurance providers for fidelity bond coverage and D&O/E&O insurance coverage, conducting employee compliance training, reviewing reports provided by service providers, maintaining books and records, and preparing an annual compliance report to the Board. |
| | | • | The Advisor oversees service providers that provide accounting, administration, distribution, transfer agency, custodial, sales and marketing, public relations, audit, information technology, and legal services to the Fund. |
| | | • | The Advisor maintains in-house marketing and distribution departments on behalf of the Fund. |
| | | • | The Advisor is actively involved with preparing regulatory filings for the Fund, including writing and annually updating the Fund’s prospectus and related documents. |
| | | • | The Advisor prepares a written summary of the Fund’s performance for the most recent six-month period or twelve-month period, as applicable, for each semi-annual and annual report of the Fund. |
| | | • | The Advisor oversees distribution of the Fund through third-party broker/dealers and independent financial institutions such as Charles Schwab, Inc., Fidelity, TD Waterhouse, and Pershing. The Advisor participates in “no transaction fee” (“NTF”) programs with these companies on behalf of the Fund, which allow customers to purchase the Fund through third-party distribution |
| | | | channels without paying a transaction fee. The Advisor compensates, in part, a number of these third-party providers of NTF programs out of its own revenues. |
| | | • | The Advisor pays the incentive compensation of the Fund’s compliance officers and employs other staff, such as management executives, legal personnel, marketing personnel, national accounts and distribution personnel, sales personnel, administrative personnel, and trading oversight personnel. |
| | | • | The Advisor provides a quarterly compliance certification to the Board. |
| | | • | The Advisor prepares or reviews Board materials, frequently presents to the Board or leads Board discussions, prepares or reviews meeting minutes, and arranges for Board training and education. |
| | • | The Board compared the performance of the Fund to benchmark indices over various periods of time and they noted that at each quarterly meeting, the Trustees review reports comparing the investment performance of the Fund to various indices. Based on the information provided at the meeting and the information and quarterly discussions regarding the Fund’s investment performance, the Trustees believe that the Advisor manages the Fund in a manner that is materially consistent with its stated investment objective and style. The Trustees concluded that the performance of the Fund over various time horizons warranted the continuation of the advisory agreement. |
| | • | The Board reviewed the advisory fees and overall expense ratios of the Fund and comparable funds using data from Morningstar with respect to funds similar in asset size and investment objective to the Fund. As part of the discussion with management, the Trustees ensured that they understood and were comfortable with the criteria used to determine the mutual funds included in the Morningstar categories for purposes of the materials considered at the meeting. The Board determined that the advisory fee and overall expense ratio of the Fund falls within the range of the advisory fees and overall expense ratios of other comparable funds and concluded that they are reasonable and warranted continuation of the advisory agreement. |
| | • | The Board also considered whether economies of scale were being realized by the Advisor that should be shared with the Fund’s shareholders. The Trustees noted that many of the expenses incurred to manage the Fund are asset-based fees and thus do not result in material economies of scale being realized as the net assets of the Fund increase. For example, intermediary service fees increase as the Fund’s assets grow. The Trustees also considered the Advisor’s efforts to contain expenses, and took into account the Advisor’s significant marketing efforts to increase Fund assets. The Board noted that at current asset levels it did not appear that there were economies of scale being realized by the Advisor and concluded that it would continue to monitor economies of scale in the future as circumstances changed. |
| | • | The Board considered the profitability of the Advisor, including the impact of intermediary service fees on the Advisor’s profitability, and also considered the resources and revenues that the Advisor has put into managing and distributing the Fund. The Board then concluded that the profits of the Advisor are reasonable and not excessive when compared to profitability guidelines set forth in relevant court cases. |
| HENNESSY FUNDS | 1-800-966-4354 | |
| | • | The Board considered the high level of professionalism and knowledge of the Advisor’s employees, along with a very low level of turnover, and concluded that this was beneficial to the Fund and its shareholders. |
| | • | The Board considered other benefits to the Advisor from serving as an advisor to the Fund (in addition to the advisory fee). The Board noted that the Advisor may derive ancillary benefits from, by way of example, its association with the Fund in the form of proprietary and third-party research products and services received from broker dealers that execute portfolio trades for the Fund. The Board determined that any such products and services have been used for legitimate purposes relating to the Fund by providing assistance in the investment decision-making process. The Trustees concluded that the other benefits realized by the Advisor from its relationship with the Fund were reasonable. |
After reviewing the materials provided at the meeting and management’s presentation, as well as other information regularly provided at the Board’s quarterly meetings throughout the year regarding the quality of services provided by the Advisor, the performance of the Fund, expense information, regulatory compliance issues, trading information and related matters, and other factors deemed relevant by the Board, the Trustees, including all of the Independent Trustees, approved the continuation of the advisory agreement.
(This Page Intentionally Left Blank.)
For information, questions or assistance, please call
The Hennessy Funds
1-800-966-4354 or 1-415-899-1555
INVESTMENT ADVISOR
Hennessy Advisors, Inc.
7250 Redwood Blvd., Suite 200
Novato, California 94945
ADMINISTRATOR,
TRANSFER AGENT,
DIVIDEND PAYING AGENT &
SHAREHOLDER SERVICING AGENT
U.S. Bancorp Fund Services, LLC
P.O. Box 701
Milwaukee, Wisconsin 53201-0701
CUSTODIAN
U.S. Bank N.A.
Custody Operations
1555 North River Center Dr., Suite 302
Milwaukee, Wisconsin 53212
TRUSTEES
Neil J. Hennessy
Robert T. Doyle
J. Dennis DeSousa
Gerald P. Richardson
COUNSEL
Foley & Lardner LLP
777 East Wisconsin Avenue
Milwaukee, Wisconsin 53202-5306
INDEPENDENT REGISTERED
PUBLIC ACCOUNTING FIRM
KPMG LLP
777 East Wisconsin Avenue
Milwaukee, Wisconsin 53202-5306
DISTRIBUTOR
Quasar Distributors, LLC
615 East Michigan Street
Milwaukee, Wisconsin 53202
hennessyfunds.com | 1-800-966-4354
This report has been prepared for shareholders and may be distributed to
others only if preceded or accompanied by a current prospectus.
SEMI-ANNUAL REPORT
APRIL 30, 2016
HENNESSY CORNERSTONE
VALUE FUND
Investor Class HFCVX
Institutional Class HICVX
hennessyfunds.com | 1-800-966-4354
(This Page Intentionally Left Blank.)
Contents
| Letter to Shareholders | 2 |
| Performance Overview | 4 |
| Financial Statements | |
| Schedule of Investments | 6 |
| Statement of Assets and Liabilities | 10 |
| Statement of Operations | 11 |
| Statements of Changes in Net Assets | 13 |
| Financial Highlights | 14 |
| Notes to the Financial Statements | 18 |
| Expense Example | 26 |
| Proxy Voting | 28 |
| Quarterly Filings on Form N-Q | 28 |
| Federal Tax Distribution Information | 28 |
| Householding | 28 |
| Board Approval of Investment Advisory Agreement | 29 |
| HENNESSY FUNDS | 1-800-966-4354 | |
June 2016
Dear Hennessy Funds Shareholder:
I used to tell my kids, “What doesn’t kill you makes you stronger.” Perhaps that is not the best analogy for investing, but in the face of such roller coaster volatility in the financial markets, it seems to me that what hasn’t killed this bull market rally may just make it stronger. The financial markets brought us flat to modest returns during the six months ended April 30, 2016, with the S&P 500 Index returning 0.43% and the Dow Jones Industrial Average (DJIA) returning 1.98% during the period. These six months were marked by high volatility, the onslaught of more and more regulatory hurdles, the Fed stuck in neutral, fears about the global economy, and wild political rhetoric — all headwinds that I believe could have significantly stalled any positive moves in the market, but didn’t. Even the aggressive pull back in January showed just how skittish the market can be, and yet again the markets showed great resiliency and marched right back.
I continue to be impressed with the persistence of the bull market in U.S. equities, now in its seventh year. Many commentators believe that the U.S. economy is due for a recession, and the market is due for a downturn. However, we find ourselves comparing today’s secular market to the bull run of 1982 to 2000, which was powered by a significant increase in valuations. On March 9th of this year, I took a moment to remember how we all felt seven years ago on March 9, 2009, at the bottom of the financial crisis downturn that had wiped out trillions of dollars’ worth of U.S. equities. I explained to our investors then, and I say the same thing today, I believe that if you invest in quality companies with good fundamentals, over the long term, you should do fine.
If history is any kind of guide, then I think this bull market has some room to run. Rising markets usually fall when there is extreme optimism or euphoria. I haven’t witnessed any of that as of yet. The volatility has unnerved many, but I encourage investors to try to remain focused on investment fundamentals. Many U.S. companies continue to find ways to make a profit and build their already strong balance sheets. Unemployment is low, and wages are rising in real terms, supporting consumer confidence and consumption. With an average price-to-sales ratio of only 1.7x and a dividend yield of approximately 2.5% for the Dow, I believe U.S. equities continue to be attractive. In my opinion, there are many compelling reasons why this market can continue to climb even higher.
The next six months may be fraught with more talk about what the Fed will do, who the next President of the United States will be, and what is happening in China and around the globe. Businesses in every industry, including the asset management business, have concerns about increasing regulatory burdens, taxes, and higher healthcare costs. But, I still believe the ingenuity and perseverance of American business will find ways to endure and to thrive.
Thank you for your continued confidence and investment in our products. If you have any questions or would like to speak with us directly, please don’t hesitate to call us at (800) 966-4354.
Best regards,
Neil J. Hennessy
President and Chief Investment Officer
Past performance does not guarantee future results.
Mutual fund investing involves risk. Principal loss is possible.
Opinions expressed are those of Neil Hennessy and are subject to change, are not guaranteed and should not be considered investment advice.
Price-to-sales ratio is a tool for calculating a stock’s valuation relative to other companies. It is calculated by dividing a stock’s current price by its revenue per share. Dividend yield is calculated as the annual dividends paid by a company divided by its market price per share.
The Dow Jones Industrial Average and S&P 500 Index are unmanaged indices commonly used to measure the performance of U.S. stocks. One cannot invest directly in an index.
| HENNESSY FUNDS | 1-800-966-4354 | |
Performance Overview (Unaudited)
AVERAGE ANNUAL TOTAL RETURN FOR PERIODS ENDED APRIL 30, 2016
| | Six | One | Five | Ten |
| | Months(1) | Year | Years | Years |
| Hennessy Cornerstone Value Fund – | | | | |
| Investor Class (HFCVX) | 2.99% | -2.41% | 8.56% | 5.48% |
| Hennessy Cornerstone Value Fund – | | | | |
Institutional Class (HICVX)(2) | 3.12% | -2.30% | 8.78% | 5.69% |
Russell 1000® Value Index | 1.93% | -0.40% | 10.13% | 5.67% |
| S&P 500 Index | 0.43% | 1.21% | 11.02% | 6.91% |
Expense ratios: 1.25% (Investor Class); 1.00% (Institutional Class)
Performance data quoted represents past performance; past performance does not guarantee future results. The investment return and principal value of an investment will fluctuate so that an investor’s shares, when redeemed, may be worth more or less than their original cost. The performance table does not reflect the deduction of taxes that a shareholder would pay on Fund distributions or the redemption of Fund shares. Current performance of the Fund may be lower or higher than the performance quoted. Performance data current to the most recent month end may be obtained by visiting hennessyfunds.com.
The expense ratios presented are from the most recent prospectus.
(1) | Periods less than one year are not annualized. |
(2) | The inception date of the Institutional Class shares is March 3, 2008. Performance shown prior to the inception of the Institutional Class shares reflects the performance of the Investor Class shares and includes expenses that are not applicable to and are higher than those of the Institutional Class shares. |
PERFORMANCE NARRATIVE
Portfolio Managers Neil J. Hennessy and Brian E. Peery
Performance:
For the six-month period ended April 30, 2016, the Investor Class of the Hennessy Cornerstone Value Fund returned 2.99%, outperforming both the Russell 1000® Value Index and the S&P 500 Index, which returned 1.93% and 0.43% for the same period, respectively.
The Fund’s outperformance relative to its benchmark was primarily due to sector allocation, chiefly an overweight position in Consumer Staples. Within the Consumer Staples sector, Archer-Daniels-Midland Company and Mondelez International, Inc. performed particularly well. The Fund’s investments in the Energy Sector, principally Marathon Oil Corporation, Exxon Mobil Corporation and Valero Energy Corporation, hurt overall performance. While oil prices have rebounded recently, concern over dividend payments and a difficult operating environment have kept the equity prices of many Energy stocks relatively depressed. The Fund continues to hold all the stocks mentioned, with the exception of Mondelez.
Portfolio Strategy:
The Fund’s investment strategy is to identify large, widely-held stocks with strong operating cash flow. The Fund then selects the companies it believes are best able to pay and sustain a high dividend yield. Limiting the Fund’s portfolio to 50 stocks produces a relatively concentrated portfolio, where individual stock performance can influence the performance of the portfolio as a whole.
Market Outlook:
Over the six-month period ended April 30, 2016, U.S. equities, as measured by the S&P 500 Index, produced an essentially flat return. The period was, however, once again marked by a great deal of volatility, with the major market indices dropping more than 10% at one point early in the year before recovering all of their losses. Throughout the period, there have been concerns about interest rates, commodity prices, economic growth (both domestic and international) and the U.S. Presidential election. Many, if not all, of these concerns still exist in the marketplace today, but we have reasons to be hopeful for the remainder of the year.
We believe the basic fundamentals of the market are attractive, and we continue to be optimistic about the possibility of further moderate market advances over the course of the year. We do not believe stocks are expensive at this point, though many are probably fairly valued. The Dow Jones Industrial Average and the S&P 500 Index have forward PE ratios of 16.5x and 17x, respectively, close to long-term averages. Corporate balance sheets appear to be in excellent shape, and while executives have shown some reluctance to increase capital spending beyond maintenance levels this cycle, we believe companies outside of the Energy sector will eventually start investing for expansion.
Investment Outlook:
While dividend-paying stocks have fallen and risen alongside the market, some of what we believe to be the highest quality companies in the U.S., namely those with the strongest financials, are trading at very reasonable valuations, in our view. We believe these stocks are attractive “value” investments and a number of them are holdings in the Fund today, primarily in the Consumer Staples, Energy and Financials sectors.
Opinions expressed are those of the Portfolio Managers as of the date written and are subject to change, are not guaranteed, and should not be considered investment advice or an indication of trading intent.
The Russell 1000® Value Index is an unmanaged index commonly used to measure the performance of U.S. large-capitalization value stocks. The S&P 500 Index and Dow Jones Industrial Average are unmanaged indices commonly used to measure the performance of U.S. stocks. One cannot invest directly in an index.
The Fund may invest in medium capitalized companies, which may have more limited liquidity and greater price volatility than large capitalization companies. Investments in foreign securities may involve political, economic and currency risks, greater volatility and differences in accounting methods. The Fund’s formula-based strategy may cause the Fund to buy or sell securities at times when it may not be advantageous.
References to specific securities should not be considered a recommendation to buy or sell any security. Fund holdings and sector allocations are subject to change. Please refer to the Schedule of Investments included in this report for additional portfolio information.
Operating cash flow is a measure of the amount of cash generated by a company’s normal business operations. Dividend yield is calculated as the annual dividends paid by a company divided by the price of a share of their stock. PE, or price to earnings, is calculated by dividing a company’s market price per share by its earnings per share.
| HENNESSY FUNDS | 1-800-966-4354 | |
Financial Statements
Schedule of Investments as of April 30, 2016 (Unaudited) |
HENNESSY CORNERSTONE VALUE FUND
(% of Net Assets)
| TOP TEN HOLDINGS (EXCLUDING CASH/CASH EQUIVALENTS) | % NET ASSETS |
| Bank of Nova Scotia | 2.26% |
| National Oilwell Varco, Inc. | 2.19% |
| Suncor Energy, Inc. | 2.17% |
| International Paper Co. | 2.16% |
| HP, Inc. | 2.15% |
| Royal Bank of Canada | 2.13% |
| Archer Daniels Midland Co. | 2.12% |
| Bank of Montreal | 2.12% |
| Marathon Petroleum Corp. | 2.10% |
| Prudential Financial, Inc. | 2.06% |
Note: For presentation purposes, the Fund has grouped some of the industry categories. For purposes of categorizing securities for compliance with Section 8(b)(1) of the Investment Company Act of 1940, as amended, the Fund uses more specific industry classifications.
| | COMMON STOCKS – 97.99% | | Number | | | | | | % of | |
| | | | of Shares | | | Value | | | Net Assets | |
| | Consumer Discretionary – 13.25% | | | | | | | | | |
| | Ford Motor Co. | | | 187,300 | | | $ | 2,539,788 | | | | 1.96 | % |
| | General Motors Co. | | | 78,500 | | | | 2,496,300 | | | | 1.92 | % |
| | Johnson Controls, Inc. | | | 63,500 | | | | 2,628,900 | | | | 2.03 | % |
| | Las Vegas Sands Corp. | | | 49,600 | | | | 2,239,440 | | | | 1.72 | % |
| | The Gap, Inc. | | | 90,300 | | | | 2,093,154 | | | | 1.61 | % |
| | Thomson Reuters Corp. (a) | | | 62,900 | | | | 2,587,077 | | | | 1.99 | % |
| | Viacom, Inc. | | | 64,100 | | | | 2,621,690 | | | | 2.02 | % |
| | | | | | | | | 17,206,349 | | | | 13.25 | % |
| | | | | | | | | | | | | | |
| | Consumer Staples – 9.37% | | | | | | | | | | | | |
| | Altria Group, Inc. | | | 38,000 | | | | 2,382,980 | | | | 1.84 | % |
| | Archer Daniels Midland Co. | | | 68,800 | | | | 2,747,872 | | | | 2.12 | % |
| | Philip Morris International, Inc. | | | 25,200 | | | | 2,472,624 | | | | 1.90 | % |
| | Procter & Gamble Co. | | | 27,900 | | | | 2,235,348 | | | | 1.72 | % |
| | Reynolds American, Inc. | | | 46,800 | | | | 2,321,280 | | | | 1.79 | % |
| | | | | | | | | 12,160,104 | | | | 9.37 | % |
| | | | | | | | | | | | | | |
| | Energy – 14.14% | | | | | | | | | | | | |
| | California Resources Corp. | | | 3,042 | | | | 6,692 | | | | 0.00 | % |
| | Chevron Corp. | | | 26,000 | | | | 2,656,680 | | | | 2.05 | % |
| | Exxon Mobil Corp. | | | 28,000 | | | | 2,475,200 | | | | 1.91 | % |
| | Marathon Petroleum Corp. | | | 69,700 | | | | 2,723,876 | | | | 2.10 | % |
| | National Oilwell Varco, Inc. | | | 78,900 | | | | 2,843,556 | | | | 2.19 | % |
| | Occidental Petroleum Corp. | | | 32,500 | | | | 2,491,125 | | | | 1.92 | % |
| | Suncor Energy, Inc. (a) | | | 95,800 | | | | 2,813,646 | | | | 2.17 | % |
| | Valero Energy Corp. | | | 39,800 | | | | 2,343,026 | | | | 1.80 | % |
| | | | | | | | | 18,353,801 | | | | 14.14 | % |
| | | | | | | | | | | | | | |
| | Financials – 14.65% | | | | | | | | | | | | |
| | Bank of Montreal (a) | | | 42,200 | | | | 2,749,752 | | | | 2.12 | % |
| | Bank of Nova Scotia (a) | | | 56,000 | | | | 2,937,200 | | | | 2.26 | % |
| | Manulife Financial Corp. (a) | | | 176,100 | | | | 2,593,953 | | | | 2.00 | % |
| | MetLife, Inc. | | | 58,500 | | | | 2,638,350 | | | | 2.03 | % |
| | Prudential Financial, Inc. | | | 34,500 | | | | 2,678,580 | | | | 2.06 | % |
| | Royal Bank of Canada (a) | | | 44,400 | | | | 2,758,128 | | | | 2.13 | % |
| | Toronto-Dominion Bank (a) | | | 59,900 | | | | 2,665,550 | | | | 2.05 | % |
| | | | | | | | | 19,021,513 | | | | 14.65 | % |
The accompanying notes are an integral part of these financial statements.
| HENNESSY FUNDS | 1-800-966-4354 | |
| | COMMON STOCKS | | Number | | | | | | % of | |
| | | | of Shares | | | Value | | | Net Assets | |
| | Health Care – 5.84% | | | | | | | | | |
| | AbbVie, Inc. | | | 41,800 | | | $ | 2,549,800 | | | | 1.96 | % |
| | Merck & Co., Inc. | | | 45,400 | | | | 2,489,736 | | | | 1.92 | % |
| | Pfizer, Inc. | | | 77,600 | | | | 2,538,296 | | | | 1.96 | % |
| | | | | | | | | 7,577,832 | | | | 5.84 | % |
| | | | | | | | | | | | | | |
| | Industrials – 11.87% | | | | | | | | | | | | |
| | Caterpillar, Inc. | | | 34,200 | | | | 2,658,024 | | | | 2.05 | % |
| | Eaton Corp. PLC (a) | | | 41,000 | | | | 2,594,070 | | | | 2.00 | % |
| | Emerson Electric Co. | | | 48,100 | | | | 2,627,703 | | | | 2.02 | % |
| | General Electric Co. | | | 78,300 | | | | 2,407,725 | | | | 1.85 | % |
| | The Boeing Co. | | | 19,800 | | | | 2,669,040 | | | | 2.06 | % |
| | United Parcel Service, Inc. | | | 23,300 | | | | 2,448,131 | | | | 1.89 | % |
| | | | | | | | | 15,404,693 | | | | 11.87 | % |
| | | | | | | | | | | | | | |
| | Information Technology – 11.55% | | | | | | | | | | | | |
| | Cisco Systems, Inc. | | | 86,900 | | | | 2,388,881 | | | | 1.84 | % |
| | HP, Inc. | | | 228,000 | | | | 2,797,560 | | | | 2.15 | % |
| | Intel Corp. | | | 78,000 | | | | 2,361,840 | | | | 1.82 | % |
| | International Business Machines Corp. | | | 18,200 | | | | 2,656,108 | | | | 2.05 | % |
| | QUALCOMM, Inc. | | | 47,500 | | | | 2,399,700 | | | | 1.85 | % |
| | Xerox Corp. | | | 249,600 | | | | 2,396,160 | | | | 1.84 | % |
| | | | | | | | | 15,000,249 | | | | 11.55 | % |
| | | | | | | | | | | | | | |
| | Materials – 7.91% | | | | | | | | | | | | |
| | International Paper Co. | | | 64,600 | | | | 2,795,242 | | | | 2.16 | % |
| | LyondellBasell Industries NV (a) | | | 29,100 | | | | 2,405,697 | | | | 1.85 | % |
| | The Dow Chemical Co. | | | 47,900 | | | | 2,520,019 | | | | 1.94 | % |
| | The Mosaic Co. | | | 90,800 | | | | 2,541,492 | | | | 1.96 | % |
| | | | | | | | | 10,262,450 | | | | 7.91 | % |
| | | | | | | | | | | | | | |
| | Telecommunication Services – 9.41% | | | | | | | | | | | | |
| | AT&T, Inc. | | | 62,700 | | | | 2,434,014 | | | | 1.88 | % |
| | BCE, Inc. (a) | | | 54,200 | | | | 2,542,522 | | | | 1.96 | % |
| | CenturyLink, Inc. | | | 77,300 | | | | 2,392,435 | | | | 1.84 | % |
| | Rogers Communications, Inc. (a) | | | 64,700 | | | | 2,515,536 | | | | 1.94 | % |
| | Verizon Communications, Inc. | | | 45,700 | | | | 2,327,958 | | | | 1.79 | % |
| | | | | | | | | 12,212,465 | | | | 9.41 | % |
| | Total Common Stocks | | | | | | | | | | | | |
| | (Cost $113,692,327) | | | | | | | 127,199,456 | | | | 97.99 | % |
The accompanying notes are an integral part of these financial statements.
| | SHORT-TERM INVESTMENTS – 1.98% | | Number | | | | | | % of | |
| | | | of Shares | | | Value | | | Net Assets | |
| | Money Market Funds – 1.98% | | | | | | | | | |
| | Fidelity Government Portfolio, Institutional Class, 0.23% (b) | | | 2,570,045 | | | $ | 2,570,045 | | | | 1.98 | % |
| | | | | | | | | | | | | | |
| | Total Short-Term Investments | | | | | | | | | | | | |
| | (Cost $2,570,045) | | | | | | | 2,570,045 | | | | 1.98 | % |
| | | | | | | | | | | | | | |
| | Total Investments | | | | | | | | | | | | |
| | (Cost $116,262,372) – 99.97% | | | | | | | 129,769,501 | | | | 99.97 | % |
| | | | | | | | | | | | | | |
| | Other Assets in | | | | | | | | | | | | |
| | Excess of Liabilities – 0.03% | | | | | | | 36,035 | | | | 0.03 | % |
| | | | | | | | | | | | | | |
| | TOTAL NET ASSETS – 100.00% | | | | | | $ | 129,805,536 | | | | 100.00 | % |
Percentages are stated as a percent of net assets.
| (a) | U.S. traded security of a foreign corporation. |
| (b) | The rate listed is the fund’s 7-day yield as of April 30, 2016. |
Summary of Fair Value Exposure at April 30, 2016
The following is a summary of the inputs used to value the Fund’s net assets as of April 30, 2016 (See Note 3 in the accompanying notes to the financial statements):
| Common Stocks | | Level 1 | | | Level 2 | | | Level 3 | | | Total | |
| Consumer Discretionary | | $ | 17,206,349 | | | $ | — | | | $ | — | | | $ | 17,206,349 | |
| Consumer Staples | | | 12,160,104 | | | | — | | | | — | | | | 12,160,104 | |
| Energy | | | 18,353,801 | | | | — | | | | — | | | | 18,353,801 | |
| Financials | | | 19,021,513 | | | | — | | | | — | | | | 19,021,513 | |
| Health Care | | | 7,577,832 | | | | — | | | | — | | | | 7,577,832 | |
| Industrials | | | 15,404,693 | | | | — | | | | — | | | | 15,404,693 | |
| Information Technology | | | 15,000,249 | | | | — | | | | — | | | | 15,000,249 | |
| Materials | | | 10,262,450 | | | | — | | | | — | | | | 10,262,450 | |
| Telecommunication Services | | | 12,212,465 | | | | — | | | | — | | | | 12,212,465 | |
| Total Common Stocks | | $ | 127,199,456 | | | $ | — | | | $ | — | | | $ | 127,199,456 | |
| Short-Term Investments | | | | | | | | | | | | | | | | |
| Money Market Funds | | $ | 2,570,045 | | | $ | — | | | $ | — | | | $ | 2,570,045 | |
| Total Short-Term Investments | | $ | 2,570,045 | | | $ | — | | | $ | — | | | $ | 2,570,045 | |
| Total Investments | | $ | 129,769,501 | | | $ | — | | | $ | — | | | $ | 129,769,501 | |
Transfers between levels are recognized at the end of the reporting period. During the six-month period ended April 30, 2016, the Fund recognized no transfers between levels.
The accompanying notes are an integral part of these financial statements.
| HENNESSY FUNDS | 1-800-966-4354 | |
Financial Statements
Statement of Assets and Liabilities as of April 30, 2016 (Unaudited) |
| ASSETS: | | | |
| Investments in securities, at value (cost $116,262,372) | | $ | 129,769,501 | |
| Receivable for investments sold | | | 716 | |
| Dividends and interest receivable | | | 249,899 | |
| Prepaid expenses and other assets | | | 22,319 | |
| Total Assets | | | 130,042,435 | |
| | | | | |
| LIABILITIES: | | | | |
| Payable for fund shares redeemed | | | 13,829 | |
| Payable to advisor | | | 78,254 | |
| Payable to administrator | | | 30,822 | |
| Payable to auditor | | | 11,369 | |
| Accrued distribution fees | | | 62,073 | |
| Accrued service fees | | | 10,413 | |
| Accrued interest payable | | | 129 | |
| Accrued trustees fees | | | 3,101 | |
| Accrued expenses and other payables | | | 26,909 | |
| Total Liabilities | | | 236,899 | |
| NET ASSETS | | $ | 129,805,536 | |
| | | | | |
| NET ASSETS CONSIST OF: | | | | |
| Capital stock | | $ | 119,430,888 | |
| Accumulated net investment income | | | 953,657 | |
| Accumulated net realized loss on investments | | | (4,086,596 | ) |
| Unrealized net appreciation on investments | | | 13,507,587 | |
| Total Net Assets | | $ | 129,805,536 | |
| | | | | |
| NET ASSETS | | | | |
| Investor Class: | | | | |
| Shares authorized (no par value) | | Unlimited | |
| Net assets applicable to outstanding Investor Class shares | | $ | 127,793,888 | |
| Shares issued and outstanding | | | 7,193,286 | |
| Net asset value, offering price and redemption price per share | | $ | 17.77 | |
| | | | | |
| Institutional Class: | | | | |
| Shares authorized (no par value) | | Unlimited | |
| Net assets applicable to outstanding Institutional Class shares | | $ | 2,011,648 | |
| Shares issued and outstanding | | | 113,127 | |
| Net asset value, offering price and redemption price per share | | $ | 17.78 | |
The accompanying notes are an integral part of these financial statements.
Financial Statements
Statement of Operations for the six months ended April 30, 2016 (Unaudited) |
| INVESTMENT INCOME: | | | |
Dividend income(1) | | $ | 2,244,150 | |
| Interest income | | | 1,949 | |
| Total investment income | | | 2,246,099 | |
| | | | | |
| EXPENSES: | | | | |
| Investment advisory fees (See Note 5) | | | 456,752 | |
| Distribution fees – Investor Class (See Note 5) | | | 91,298 | |
| Service fees – Investor Class (See Note 5) | | | 60,865 | |
| Administration, fund accounting, custody and transfer agent fees (See Note 5) | | | 60,495 | |
| Sub-transfer agent expenses – Investor Class (See Note 5) | | | 44,124 | |
| Audit fees | | | 12,063 | |
| Compliance expense | | | 11,790 | |
| Federal and state registration fees | | | 11,229 | |
| Reports to shareholders | | | 8,177 | |
| Trustees’ fees and expenses | | | 6,183 | |
| Legal fees | | | 378 | |
| Interest expense (See Note 6) | | | 142 | |
| Other expenses | | | 6,199 | |
| Total expenses | | | 769,695 | |
| NET INVESTMENT INCOME | | $ | 1,476,404 | |
| | | | | |
| REALIZED AND UNREALIZED GAINS: | | | | |
| Net realized gain on investments | | $ | 352,732 | |
| Net change in unrealized appreciation on investments | | | 1,815,559 | |
| Net gain on investments | | | 2,168,291 | |
| NET INCREASE IN NET ASSETS RESULTING FROM OPERATIONS | | $ | 3,644,695 | |
(1) | Net of foreign taxes withheld and issuance fees of $63,560. |
The accompanying notes are an integral part of these financial statements.
| HENNESSY FUNDS | 1-800-966-4354 | |
(This Page Intentionally Left Blank.)
Financial Statements
| Statements of Changes in Net Assets |
| | | Six Months Ended | | | | |
| | | April 30, 2016 | | | Year Ended | |
| | | (Unaudited) | | | October 31, 2015 | |
| OPERATIONS: | | | | | | |
| Net investment income | | $ | 1,476,404 | | | $ | 3,327,853 | |
| Net realized gain on investments | | | 352,732 | | | | 19,281,025 | |
| Net change in unrealized appreciation (depreciation) | | | | | | | | |
| on investments | | | 1,815,559 | | | | (25,214,358 | ) |
| Net increase (decrease) in net assets | | | | | | | | |
| resulting from operations | | | 3,644,695 | | | | (2,605,480 | ) |
| | | | | | | | | |
| DISTRIBUTIONS TO SHAREHOLDERS FROM: | | | | | | | | |
| Net investment income | | | | | | | | |
| Investor Class | | | (3,068,445 | ) | | | (3,147,811 | ) |
| Institutional Class | | | (41,663 | ) | | | (257,598 | ) |
| Total distributions | | | (3,110,108 | ) | | | (3,405,409 | ) |
| | | | | | | | | |
| CAPITAL SHARE TRANSACTIONS: | | | | | | | | |
| Proceeds from shares subscribed – Investor Class | | | 834,739 | | | | 2,074,393 | |
| Proceeds from shares subscribed – Institutional Class | | | 320,945 | | | | 1,559,641 | |
| Dividends reinvested – Investor Class | | | 2,748,596 | | | | 2,823,170 | |
| Dividends reinvested – Institutional Class | | | 26,592 | | | | 243,110 | |
| Cost of shares redeemed – Investor Class | | | (6,166,698 | ) | | | (14,508,452 | ) |
| Cost of shares redeemed – Institutional Class | | | (105,906 | ) | | | (10,255,757 | ) |
| Net decrease in net assets derived | | | | | | | | |
| from capital share transactions | | | (2,341,732 | ) | | | (18,063,895 | ) |
| TOTAL DECREASE IN NET ASSETS | | | (1,807,145 | ) | | | (24,074,784 | ) |
| | | | | | | | | |
| NET ASSETS: | | | | | | | | |
| Beginning of period | | | 131,612,681 | | | | 155,687,465 | |
| End of period | | $ | 129,805,536 | | | $ | 131,612,681 | |
| Undistributed net investment income, end of period | | $ | 953,657 | | | $ | 2,587,361 | |
| | | | | | | | | |
| CHANGES IN SHARES OUTSTANDING: | | | | | | | | |
| Shares sold – Investor Class | | | 48,764 | | | | 115,014 | |
| Shares sold – Institutional Class | | | 18,412 | | | | 88,261 | |
| Shares issued to holders as reinvestment | | | | | | | | |
| of dividends – Investor Class | | | 162,543 | | | | 155,034 | |
| Shares issued to holders as reinvestment | | | | | | | | |
| of dividends – Institutional Class | | | 1,573 | | | | 13,365 | |
| Shares redeemed – Investor Class | | | (360,636 | ) | | | (807,635 | ) |
| Shares redeemed – Institutional Class | | | (6,082 | ) | | | (580,726 | ) |
| Net decrease in shares outstanding | | | (135,426 | ) | | | (1,016,687 | ) |
The accompanying notes are an integral part of these financial statements.
| HENNESSY FUNDS | 1-800-966-4354 | |
Financial Statements
For an Investor Class share outstanding throughout each period
| | | Six Months Ended | |
| | | April 30, 2016 | |
| | | (Unaudited) | |
| PER SHARE DATA: | | | |
| Net asset value, beginning of period | | $ | 17.69 | |
| | | | | |
| Income (loss) from investment operations: | | | | |
| Net investment income | | | 0.21 | |
| Net realized and unrealized gains (losses) on investments | | | 0.30 | |
| Total from investment operations | | | 0.51 | |
| | | | | |
| Less distributions: | | | | |
| Dividends from net investment income | | | (0.43 | ) |
| Total distributions | | | (0.43 | ) |
| Net asset value, end of period | | $ | 17.77 | |
| | | | | |
| TOTAL RETURN | | | 2.99 | %(1) |
| | | | | |
| SUPPLEMENTAL DATA AND RATIOS: | | | | |
| Net assets, end of period (millions) | | $ | 127.79 | |
| Ratio of expenses to average net assets | | | 1.25 | %(2) |
| Ratio of net investment income to average net assets | | | 2.39 | %(2) |
Portfolio turnover rate(3) | | | 35 | %(1) |
(1) | Not annualized. |
(2) | Annualized. |
(3) | Portfolio turnover is calculated on the basis of the Fund as a whole. |
The accompanying notes are an integral part of these financial statements.
| Year Ended October 31, | |
| 2015 | | | 2014 | | | 2013 | | | 2012 | | | 2011 | |
| | | | | | | | | | | | | | |
| $ | 18.41 | | | $ | 16.90 | | | $ | 14.02 | | | $ | 12.84 | | | $ | 12.53 | |
| | | | | | | | | | | | | | | | | | | |
| | | | | | | | | | | | | | | | | | | |
| | 0.44 | | | | 0.39 | | | | 0.42 | | | | 0.37 | | | | 0.45 | |
| | (0.75 | ) | | | 1.55 | | | | 2.84 | | | | 1.23 | | | | 0.23 | |
| | (0.31 | ) | | | 1.94 | | | | 3.26 | | | | 1.60 | | | | 0.68 | |
| | | | | | | | | | | | | | | | | | | |
| | | | | | | | | | | | | | | | | | | |
| | (0.41 | ) | | | (0.43 | ) | | | (0.38 | ) | | | (0.42 | ) | | | (0.37 | ) |
| | (0.41 | ) | | | (0.43 | ) | | | (0.38 | ) | | | (0.42 | ) | | | (0.37 | ) |
| $ | 17.69 | | | $ | 18.41 | | | $ | 16.90 | | | $ | 14.02 | | | $ | 12.84 | |
| | | | | | | | | | | | | | | | | | | |
| | (1.77 | )% | | | 11.69 | % | | | 23.84 | % | | | 12.79 | % | | | 5.58 | % |
| | | | | | | | | | | | | | | | | | | |
| | | | | | | | | | | | | | | | | | | |
| $ | 129.86 | | | $ | 145.04 | | | $ | 138.94 | | | $ | 124.99 | | | $ | 116.41 | |
| | 1.10 | % | | | 1.17 | % | | | 1.22 | % | | | 1.26 | % | | | 1.31 | % |
| | 2.32 | % | | | 2.18 | % | | | 2.60 | % | | | 2.67 | % | | | 2.94 | % |
| | 46 | % | | | 34 | % | | | 41 | % | | | 47 | % | | | 40 | % |
The accompanying notes are an integral part of these financial statements.
| HENNESSY FUNDS | 1-800-966-4354 | |
Financial Statements
For an Institutional Class share outstanding throughout each period
| | | Six Months Ended | |
| | | April 30, 2016 | |
| | | (Unaudited) | |
| PER SHARE DATA: | | | |
| Net asset value, beginning of period | | $ | 17.67 | |
| | | | | |
| Income (loss) from investment operations: | | | | |
| Net investment income | | | 0.21 | |
| Net realized and unrealized gains (losses) on investments | | | 0.32 | |
| Total from investment operations | | | 0.53 | |
| | | | | |
| Less distributions: | | | | |
| Dividends from net investment income | | | (0.42 | ) |
| Total distributions | | | (0.42 | ) |
| Net asset value, end of period | | $ | 17.78 | |
| | | | | |
| TOTAL RETURN | | | 3.12 | %(1) |
| | | | | |
| SUPPLEMENTAL DATA AND RATIOS: | | | | |
| Net assets, end of period (millions) | | $ | 2.01 | |
| Ratio of expenses to average net assets: | | | | |
| Before expense reimbursement | | | 0.92 | %(2) |
| After expense reimbursement | | | 0.92 | %(2) |
| Ratio of net investment income to average net assets: | | | | |
| Before expense reimbursement | | | 2.70 | %(2) |
| After expense reimbursement | | | 2.70 | %(2) |
Portfolio turnover rate(3) | | | 35 | %(1) |
(1) | Not annualized. |
(2) | Annualized. |
(3) | Portfolio turnover is calculated on the basis of the Fund as a whole. |
The accompanying notes are an integral part of these financial statements.
| Year Ended October 31, | |
| 2015 | | | 2014 | | | 2013 | | | 2012 | | | 2011 | |
| | | | | | | | | | | | | | |
| $ | 18.41 | | | $ | 16.92 | | | $ | 14.04 | | | $ | 12.86 | | | $ | 12.54 | |
| | | | | | | | | | | | | | | | | | | |
| | | | | | | | | | | | | | | | | | | |
| | 0.53 | | | | 0.59 | | | | 0.50 | | | | 0.45 | | | | 0.36 | |
| | (0.83 | ) | | | 1.37 | | | | 2.80 | | | | 1.19 | | | | 0.37 | |
| | (0.30 | ) | | | 1.96 | | | | 3.30 | | | | 1.64 | | | | 0.73 | |
| | | | | | | | | | | | | | | | | | | |
| | | | | | | | | | | | | | | | | | | |
| | (0.44 | ) | | | (0.47 | ) | | | (0.42 | ) | | | (0.46 | ) | | | (0.41 | ) |
| | (0.44 | ) | | | (0.47 | ) | | | (0.42 | ) | | | (0.46 | ) | | | (0.41 | ) |
| $ | 17.67 | | | $ | 18.41 | | | $ | 16.92 | | | $ | 14.04 | | | $ | 12.86 | |
| | | | | | | | | | | | | | | | | | | |
| | (1.72 | )% | | | 11.82 | % | | | 24.13 | % | | | 13.13 | % | | | 6.00 | % |
| | | | | | | | | | | | | | | | | | | |
| | | | | | | | | | | | | | | | | | | |
| $ | 1.75 | | | $ | 10.65 | | | $ | 4.09 | | | $ | 2.53 | | | $ | 1.17 | |
| | | | | | | | | | | | | | | | | | | |
| | 1.00 | % | | | 1.03 | % | | | 1.10 | % | | | 1.20 | % | | | 1.14 | % |
| | 1.00 | % | | | 0.98 | % | | | 0.98 | % | | | 0.98 | % | | | 0.98 | % |
| | | | | | | | | | | | | | | | | | | |
| | 2.43 | % | | | 2.30 | % | | | 2.64 | % | | | 2.72 | % | | | 3.04 | % |
| | 2.43 | % | | | 2.35 | % | | | 2.76 | % | | | 2.94 | % | | | 3.20 | % |
| | 46 | % | | | 34 | % | | | 41 | % | | | 47 | % | | | 40 | % |
The accompanying notes are an integral part of these financial statements.
| HENNESSY FUNDS | 1-800-966-4354 | |
Financial Statements
Notes to the Financial Statements April 30, 2016 (Unaudited) |
1). ORGANIZATION
The Hennessy Cornerstone Value Fund (the “Fund”) is a series of Hennessy Funds Trust (the “Trust”), which was organized as a Delaware statutory trust on September 17, 1992. The Fund is an open-end management investment company registered under the Investment Company Act of 1940, as amended. The Fund is a successor to a fund with the same name (the “Predecessor Fund”) that was a series of Hennessy Mutual Funds, Inc., a Maryland corporation, pursuant to a reorganization that took place after the close of business on February 28, 2014. Prior to February 28, 2014, the Fund had no investment operations. As a result of the reorganization, holders of the Investor Class shares of the Predecessor Fund received Investor Class shares of the Fund (the Investor Class shares of the Fund are the successor to the accounting and performance information of the Predecessor Fund), and holders of the Institutional Class shares of the Predecessor Fund received Institutional Class shares of the Fund (the Institutional Class shares of the Fund are the successor to the accounting and performance information of the Predecessor Fund). The investment objective of the Fund is total return, consisting of capital appreciation and current income. The Fund is a diversified fund.
The Fund offers Investor Class and Institutional Class shares. Each class of shares differs principally in its respective administration, 12b-1 distribution and service, shareholder servicing, and transfer agent expenses and sales charges, if any. Each class has identical rights to earnings, assets, and voting privileges, except for class-specific expenses and exclusive rights to vote on matters affecting only an individual class.
As an investment company, the Fund follows the investment company accounting and reporting guidance of the Financial Accounting Standards Board (“FASB”) Accounting Standard Codification Topic 946 “Financial Services—Investment Companies.”
2). SIGNIFICANT ACCOUNTING POLICIES
The following is a summary of significant accounting policies consistently followed by the Fund in the preparation of the financial statements. These policies are in conformity with U.S. generally accepted accounting principles (“GAAP”).
| a). | Investment Valuation – All investments in securities are recorded at their estimated fair value, as described in Note 3. |
| b). | Federal Income Taxes – Provision for federal income taxes or excise taxes has not been made since the Fund has elected to be taxed as a “regulated investment company” and intends to distribute substantially all of its taxable income to its shareholders and otherwise comply with the provisions of the Internal Revenue Code of 1986, as amended, applicable to regulated investment companies. Net investment income or loss and realized gains and losses for federal income tax purposes may differ from that reported on the financial statements because of temporary book and tax basis differences. Temporary differences are primarily the result of the treatment of wash sales for tax reporting purposes. The Fund recognizes interest and penalties related to income tax benefits, if any, in the statement of operations as an income tax expense. Distributions from net realized gains for book purposes may include short-term capital gains, which are included as ordinary income to shareholders for tax purposes. |
| c). | Income and Expenses – Dividend income is recognized on the ex-dividend date or as soon as information is available to the Fund. Interest income, which includes the amortization of premium and accretion of discount, is recognized on an accrual basis. The Fund is charged for those expenses that are directly attributable to the portfolio, such as advisory, administration, and certain shareholder service fees. Income, expenses (other than expenses attributable to a specific class), and realized and unrealized gains or losses on investments are allocated to each class of shares based on its respective net assets. |
| d). | Distributions to Shareholders – Dividends from net investment income for the Fund, if any, are declared and paid annually, usually in December. Distributions of net realized capital gains, if any, are declared and paid annually, usually in December. |
| e). | Security Transactions – Investment and shareholder transactions are recorded on the trade date. The Fund determines the gain or loss realized from the investment transactions by comparing the original cost of the security lot sold with the net sale proceeds. Discounts and premiums on securities purchased are accreted/amortized over the life of the respective security. |
| f). | Use of Estimates – The preparation of financial statements in conformity with GAAP requires management to make estimates and assumptions that affect the reported amounts of assets and liabilities and disclosure of contingent assets and liabilities at the date of the financial statements and the reported change in net assets during the reporting period. Actual results could differ from those estimates. |
| g). | Share Valuation – The net asset value (“NAV”) per share of the Fund is calculated by dividing the sum of the value of the securities held by the Fund, plus cash or other assets, minus all liabilities (including estimated accrued expenses) by the total number of shares outstanding for the Fund, rounded to the nearest cent. The Fund’s shares will not be priced on days the New York Stock Exchange is closed for trading. The offering and redemption price per share for the Fund is equal to the Fund’s NAV per share. |
| h). | Foreign Currency – Values of investments denominated in foreign currencies, if any, are converted into U.S. dollars using the spot market rate of exchange at the time of valuation. Purchases and sales of investments and income are translated into U.S. dollars using the spot market rate of exchange prevailing on the respective dates of such transactions. The Fund does not isolate the portion of the results of operations resulting from fluctuations in foreign exchange rates on investments from fluctuations resulting from changes in the market prices of securities held. Such fluctuations are included with the net realized and unrealized gain or loss on investments. Foreign investments present additional risks due to currency fluctuations, economic and political factors, lower liquidity, government regulations, differences in accounting standards, and other factors. |
| i). | Forward Contracts – The Fund may enter into forward currency contracts to reduce its exposure to changes in foreign currency exchange rates on its foreign holdings and to lock in the U.S. dollar cost of firm purchase and sale commitments for securities denominated in foreign currencies. A forward currency contract is a commitment to purchase or sell a foreign currency at a future date at a negotiated forward rate. The gain or loss arising from the difference between the U.S. dollar cost of the original contract and the value of the foreign currency in U.S. dollars upon closing of such contract is included in net realized gain or loss from foreign currency transactions. During the six months ended April 30, 2016, the Fund did not enter into any forward contracts. |
| HENNESSY FUNDS | 1-800-966-4354 | |
| j). | Repurchase Agreements – The Fund may enter into repurchase agreements with member banks or security dealers of the Federal Reserve Board whom the investment advisor deems creditworthy. The repurchase price generally equals the price paid by the Fund plus interest negotiated on the basis of current short-term rates. |
| | Securities pledged as collateral for repurchase agreements are held by the custodian bank until the respective agreements mature. Provisions of the repurchase agreements ensure that the market value of the collateral, including accrued interest thereon, is sufficient to cover the repurchase amount in the event of default of the counterparty. If the counterparty defaults and the value of the collateral declines or if the counterparty enters an insolvency proceeding, realization of the collateral by the Fund may be delayed or limited. |
| k). | Accounting for Uncertainty in Income Taxes – The Fund has accounting policies regarding recognition and measurement of tax positions taken or expected to be taken on a tax return. The tax returns of the Fund for the prior three fiscal years are open for examination. The Fund has reviewed all open tax years in major jurisdictions and concluded that there is no impact on the Fund’s net assets and no tax liability resulting from unrecognized tax benefits relating to uncertain income tax positions taken or expected to be taken on a tax return. The Fund’s major tax jurisdictions are U.S. federal and Delaware. |
| l). | Derivatives – The Fund may invest in, or enter into, derivatives, such as options, futures contracts, options on futures contracts, and swaps, for a variety of reasons, including to hedge certain risks, to provide a substitute for purchasing or selling particular securities, or to increase potential income gain. Derivatives are financial contracts based on an underlying or notional amount, require no initial investment or an initial net investment that is smaller than would normally be required to have a similar response to changes in market factors, and require or permit net settlement. Derivatives may allow the Fund to increase or decrease the level of risk to which the Fund is exposed more quickly and efficiently than transactions in other types of instruments. The main purpose of utilizing derivative instruments is for hedging purposes. |
| | The Fund follows the financial accounting reporting rules as required by the Derivatives and Hedging Topic of the FASB Accounting Standards Codification. Under such rules, the Fund is required to include enhanced disclosure that enables investors to understand how and why an entity uses derivatives, how derivatives are accounted for, and how derivatives instruments affect an entity’s results of operations and financial position. During the six months ended April 30, 2016, the Fund did not hold any derivative instruments. |
| m). | New Accounting Pronouncements – In May 2015, the FASB issued ASU No. 2015-07 “Disclosure for Investments in Certain Entities that Calculate Net Asset Value per Share (or Its Equivalent).” The amendments in ASU No. 2015-07 remove the requirement to categorize within the fair value hierarchy investments measured at NAV and require the disclosure of sufficient information to reconcile the fair value of the remaining assets categorized within the fair value hierarchy to the financial statements. The amendments in ASU No. 2015-07 are effective for fiscal years beginning after December 15, 2015, and interim periods within those fiscal years. Management has reviewed the requirements and believes the adoption of ASU 2015-07 will not have a material impact on the Fund’s financial statements and related disclosures. |
3). SECURITIES VALUATION
The Fund follows authoritative fair valuation accounting standards that establish an authoritative definition of fair value and set out a hierarchy for measuring fair value.
These standards require additional disclosures about the various inputs and valuation techniques used to develop the measurements of fair value and a discussion in changes in valuation techniques and related inputs during the period. These inputs are summarized in the three broad levels listed below:
| | Level 1 – | Unadjusted, quoted prices in active markets for identical instruments that the Fund has the ability to access at the date of measurement. |
| | Level 2 – | Other significant observable inputs (including, but not limited to, quoted prices in active markets for similar instruments, quoted prices in markets that are not active for identical or similar instruments, and model-derived valuations in which all significant inputs and significant value drivers are observable in active markets (such as interest rates, prepayment speeds, credit risk curves, default rates, and similar data)). |
| | Level 3 – | Significant unobservable inputs (including the Fund’s own assumptions about what market participants would use to price the asset or liability based on the best available information) when observable inputs are unavailable. |
Following is a description of the valuation techniques applied to the Fund’s major categories of assets and liabilities measured at fair value on a recurring basis.
Equity Securities – Equity securities, including common stocks, preferred stocks, foreign-issued common stocks, exchange-traded funds, closed-end mutual funds, partnerships, rights, and real estate investment trusts, that are traded on a securities exchange for which a last-quoted sales price is readily available will generally be valued at the last sales price as reported by the primary exchange on which the securities are listed. Securities listed on The NASDAQ Stock Market (“NASDAQ”) will generally be valued at the NASDAQ Official Closing Price, which may differ from the last sales price reported. Securities traded on a securities exchange for which a last-quoted sales price is not readily available will generally be valued at the mean between the bid and ask prices. To the extent these securities are actively traded and valuation adjustments are not applied, they are classified in Level 1 of the fair value hierarchy. Securities traded on foreign exchanges generally are not valued at the same time the Fund calculates its NAV because most foreign markets close well before such time. The earlier close of most foreign markets gives rise to the possibility that significant events, including broad market moves, may have occurred in the interim. In certain circumstances, it may be determined that a security needs to be fair valued because it appears that the value of the security might have been materially affected by events occurring after the close of the market in which the security is principally traded, but before the time the Fund calculates its NAV, such as by a development that affects an entire market or region (e.g., weather-related events) or a potentially global development (e.g., a terrorist attack that may be expected to have an effect on investor expectations worldwide).
Registered Investment Companies – Investments in registered investment companies (e.g., mutual funds) are generally priced at the ending NAV provided by the applicable registered investment company’s service agent and will be classified in Level 1 of the fair value hierarchy.
Debt Securities – Debt securities, including corporate bonds, asset-backed securities, mortgage-backed securities, municipal bonds, U.S. Treasuries, and U.S. government agency issues, are generally valued at market on the basis of valuations furnished by an independent pricing service that utilizes both dealer-supplied valuations and formula-based techniques. The pricing service may consider recently executed transactions in securities of the issuer or comparable issuers, market price quotations (where observable), bond spreads, and fundamental data relating to the issuer. In addition, the model may
| HENNESSY FUNDS | 1-800-966-4354 | |
incorporate observable market data, such as reported sales of similar securities, broker quotes, yields, bids, offers, and reference data. Certain securities are valued primarily using dealer quotations. These securities are generally classified in Level 2 of the fair value hierarchy.
Short-Term Securities – Short-term equity investments, including money market funds, are valued in the manner specified above. Short-term debt investments with an original term to maturity of 60 days or less are valued at amortized cost, which approximates fair market value. If the original term to maturity of a short-term debt investment exceeded 60 days, then the values as of the 61st day prior to maturity are amortized. Amortized cost is not used if its use would be inappropriate due to credit or other impairments of the issuer, in which case the security’s fair value would be determined, as described below. Short-term securities are generally classified in Level 1 or Level 2 of the fair market hierarchy depending on the inputs used and market activity levels for specific securities.
The Board of Trustees of the Fund (the “Board”) has adopted fair value pricing procedures that are followed when a price for a security is not readily available or if a significant event has occurred that indicates the closing price of a security no longer represents the true value of that security. Fair value pricing determinations are made in good faith in accordance with these procedures. There are numerous criteria that will be given consideration in determining a fair value of a security, such as the trading volume of a security and markets, the value of other like securities, and news events with direct bearing to a security or markets. Fair value pricing results in an estimated price for a security that reflects the amount the Fund might reasonably expect to receive in a current sale. Depending on the relative significance of the valuation inputs, these securities may be classified in either Level 2 or Level 3 of the fair value hierarchy.
The fair valuation of foreign securities may be determined with the assistance of a pricing service using correlations between the movement of prices of such securities and indices of domestic securities and other appropriate indicators, such as closing market prices of relevant American Depositary Receipts or futures contracts. The effect of using fair value pricing is that the Fund’s NAV will reflect the affected portfolio securities’ value as determined by the Board or its designee instead of being determined by the market. Using a fair value pricing methodology to price foreign securities may result in a value that is different from a foreign security’s most recent closing price and from the prices used by other investment companies to calculate their NAVs and are generally considered Level 2 prices in the fair valuation hierarchy. Because the Fund may invest in foreign securities, the value of the Fund’s portfolio securities may change on days when you will not be able to purchase or redeem your shares.
The Board has delegated day-to-day valuation matters to a Valuation Committee comprised of one or more representatives from Hennessy Advisors, Inc., the Fund’s investment advisor. The function of the Valuation Committee is to value securities where current and reliable market quotations are not readily available. All actions taken by the Valuation Committee are reviewed by the Board.
The Fund has performed an analysis of all existing investments to determine the significance and character of all inputs to their fair value determination. Various inputs are used in determining the value of the Fund’s investments. The inputs or methodology used for valuing securities are not necessarily an indication of the risk associated with investing in those securities. Details related to the fair valuation hierarchy of the Fund’s securities as of April 30, 2016, are included in the Fund’s Schedule of Investments.
4). INVESTMENT TRANSACTIONS
Purchases and sales of investment securities (excluding government and short-term investments) for the Fund during the six months ended April 30, 2016, were $44,110,949 and $48,999,626, respectively.
There were no purchases or sales/maturities of long-term U.S. government securities for the Fund during the six months ended April 30, 2016.
5). INVESTMENT MANAGEMENT FEE AND OTHER TRANSACTIONS WITH AFFILIATES
Hennessy Advisors, Inc. (the “Advisor”) is the investment advisor of the Fund. The Advisor provides the Fund with investment management services under an Investment Advisory Agreement. The Advisor furnishes all investment advice, office space, facilities, and provides most of the personnel needed by the Fund. As compensation for its services, the Advisor is entitled to a monthly fee from the Fund. The fee is based upon the average daily net assets of the Fund at the annual rate of 0.74%. The net investment advisory fees payable by the Fund as of April 30, 2016, were $78,254.
In the past, the Advisor had agreed to waive its fees and absorb expenses to the extent that the total annual operating expenses exceeded 0.98% of the Fund’s net assets for the Institutional Class shares of the Fund (excluding all federal, state and local taxes, interest, brokerage commissions, acquired fund fees and expenses and other costs incurred in connection with the purchase and sale of securities and extraordinary items). The expense limitation agreement was terminated by the Board as of February 28, 2015.
For a period of three years after the year in which the Advisor waived or reimbursed expenses, the Advisor may seek reimbursement from the Fund to the extent that total annual fund operating expenses are less than the expense limitation that was in effect at the time the Advisor waived or reimbursed expenses. During the three years ended October 31, 2015, no expenses were waived or reimbursed by the Advisor and therefore no expenses are subject to potential recovery.
The Board has approved a Shareholder Servicing Agreement for the Investor Class shares of the Fund, which was instituted to compensate the Advisor for the non-investment management services it provides to the Fund. The Shareholder Servicing Agreement provides for a monthly fee paid to the Advisor at an annual rate of 0.10% of the average daily net assets of the Fund attributable to Investor Class shares. Shareholder service fees payable by the Fund as of April 30, 2016, were $10,413.
The Fund has adopted a plan pursuant to Rule 12b-1 under the Investment Company Act of 1940, as amended, that authorizes payments in connection with the distribution of the Fund’s shares at an annual rate of up to 0.25% of the Fund’s average daily net assets attributable to Investor Class shares. Even though the authorized rate is up to 0.25%, the Fund has only used up to 0.15% of its average daily net assets attributable to Investor Class shares for such purpose since the plan was implemented on November 1, 2015. Amounts paid under the plan may be spent on any activities or expenses primarily intended to result in the sale of shares, including, but not limited to, advertising, shareholder account servicing, the printing and mailing of prospectuses to other than current shareholders, the printing and mailing of sales literature, and compensation for sales and marketing activities or to financial institutions and others, such as dealers and distributors.
The Fund has entered into agreements with various brokers, dealers, and financial intermediaries in connection with the sale of shares of the Fund. The agreements provide for periodic payments by the Fund to the brokers, dealers, and financial intermediaries for providing certain shareholder maintenance services (sub-transfer agent
| HENNESSY FUNDS | 1-800-966-4354 | |
expenses). These shareholder services include the pre-processing and quality control of new accounts, shareholder correspondence, answering customer inquiries regarding account status, and facilitating shareholder telephone transactions. Fees paid by the Fund to various brokers, dealers, and financial intermediaries during the six months ended April 30, 2016, were $44,124.
U.S. Bancorp Fund Services, LLC (“USBFS”) provides the Fund with administrative, fund accounting, and transfer agent services, and necessary office equipment. As administrator, USBFS is responsible for activities such as (i) preparing various federal and state regulatory filings, reports, and returns for the Fund, (ii) preparing reports and materials to be supplied to the Board, (iii) monitoring the activities of the Fund’s custodian, transfer agent, and accountants, and (iv) coordinating the preparation and payment of the Fund’s expenses and reviewing the Fund’s expense accruals. Fees paid to USBFS during the six months ended April 30, 2016, were $60,495.
U.S. Bank, N.A., an affiliate of USBFS, serves as the Fund’s custodian. Quasar Distributors, LLC acts as the Fund’s principal underwriter in a continuous public offering of the Fund’s shares. Quasar Distributors, LLC is an affiliate of USBFS and U.S. Bank, N.A.
6). LINE OF CREDIT
The Fund has an uncommitted line of credit with the other funds in the Hennessy Funds family of funds (the “Hennessy Funds”) in the amount of the lesser of (i) $100,000,000 or (ii) 33.33% of each Hennessy Fund’s net assets, or 30% for the Hennessy Gas Utility Fund and 10% for the Hennessy Balanced Fund, intended to provide short-term financing, if necessary, subject to certain restrictions, in connection with shareholder redemptions. The credit facility is with the Hennessy Funds’ custodian bank, U.S. Bank, N.A. Borrowings under this arrangement bear interest at the bank’s prime rate and are secured by all of the Fund’s assets (as to its own borrowings only). During the six months ended April 30, 2016, the Fund had an outstanding average daily balance and a weighted average interest rate of $8,555 and 3.44%, respectively. The maximum amount outstanding for the Fund during the period was $244,000. At April 30, 2016, the Fund did not have any borrowings outstanding under the line of credit.
7). FEDERAL TAX INFORMATION
As of October 31, 2015, the Fund’s most recent fiscal year end, the components of accumulated earnings (losses) for income tax purposes were as follows:
| Cost of investments for tax purposes | | $ | 120,220,585 | |
| Gross tax unrealized appreciation | | $ | 21,946,324 | |
| Gross tax unrealized depreciation | | | (10,698,702 | ) |
| Net tax unrealized appreciation | | $ | 11,247,622 | |
| Undistributed ordinary income | | $ | 2,587,361 | |
| Undistributed long-term capital gains | | | — | |
| Total distributable earnings | | $ | 2,587,361 | |
| Other accumulated loss | | $ | (3,994,922 | ) |
| Total accumulated gain | | $ | 9,840,061 | |
The difference between book-basis unrealized appreciation/depreciation (as shown in the Statement of Assets and Liabilities) and tax-basis unrealized appreciation/depreciation (as shown above) is attributable primarily to wash sales.
At October 31, 2015, the Fund’s most recent fiscal year end, the Fund had capital loss carryforwards of $3,994,751 that expire on October 31, 2017.
During the fiscal year ended October 31, 2015, the Fund’s most recent fiscal year, the capital loss carryforwards utilized for the Fund were $19,412,346.
Capital losses sustained in the fiscal year ended October 31, 2012 and in future taxable years will not expire and may be carried over by the Fund without limitation; however, they will retain the character of the original loss. Furthermore, any loss incurred during those taxable years will be required to be utilized prior to the losses incurred in taxable years prior to 2012. As a result of this ordering rule, pre-enactment capital loss carryforwards may be more likely to expire unused. Under pre-enactment law, capital losses could be carried forward for eight years, and carried forward as short-term capital losses, irrespective of the character of the original loss.
At October 31, 2015, the Fund’s most recent fiscal year end, the Fund did not defer, on a tax basis, any post-December late year ordinary loss deferrals.
The tax character of distributions paid during fiscal year 2016 (year to date) and fiscal year 2015 for the Fund were as follows:
| | | Six Months Ended | | | Year Ended | |
| | | April 30, 2016 | | | October 31, 2015 | |
| Ordinary income | | $ | 3,110,108 | | | $ | 3,405,409 | |
| Long-term capital gain | | | — | | | | — | |
| | | $ | 3,110,108 | | | $ | 3,405,409 | |
| HENNESSY FUNDS | 1-800-966-4354 | |
Expense Example (Unaudited)
April 30, 2016
As a shareholder of the Fund, you incur two types of costs: (1) transaction costs, including sales charges (loads) on purchase payments, reinvested dividends, or other distributions; redemption fees; and exchange fees; and (2) ongoing costs, including management fees; service fees; and other Fund expenses. This Example is intended to help you understand your ongoing costs (in dollars) of investing in the Fund and to compare these costs with the ongoing costs of investing in other mutual funds. The Example is based on an investment of $1,000 invested at the beginning of the period and held for the entire period from November 1, 2015 through April 30, 2016.
Actual Expenses
The first line of the table below under the “Investor Class” and “Institutional Class” headings provides information about actual account values and actual expenses. Although the Fund charges no sales loads or transaction fees, you will be assessed fees for outgoing wire transfers, returned checks and stop payment orders at prevailing rates charged by U.S. Bancorp Fund Services, LLC, the Fund’s transfer agent. If you request that a redemption be made by wire transfer, currently a $15.00 fee is charged by the Fund’s transfer agent. IRA accounts will be charged a $15.00 annual maintenance fee. The example below includes, but is not limited to, management fees, shareholder servicing fees, fund accounting, custody, and transfer agent fees. However, the example below does not include portfolio trading commissions and related expenses, and other extraordinary expenses as determined under generally accepted accounting principles. You may use the information in this line, together with the amount you invested, to estimate the expenses that you paid over the period. Simply divide your account value by $1,000 (for example, an $8,600 account value divided by $1,000 = 8.6), then multiply the result by the number in the first line of the table under the “Investor Class” and “Institutional Class” headings in the column entitled “Expenses Paid During Period” to estimate the expenses you paid on your account during this period.
Hypothetical Example for Comparison Purposes
The second line of the table below under the “Investor Class” and “Institutional Class” headings provides information about hypothetical account values and hypothetical expenses based on the Fund’s actual expense ratios and an assumed rate of return of 5% per year before expenses, which is not the Fund’s actual return. The hypothetical account values and expenses may not be used to estimate the actual ending account balance or expenses you paid for the period. You may use this information to compare the ongoing costs of investing in the Fund and other funds. To do so, compare this 5% hypothetical example with the 5% hypothetical examples that appear in the shareholder reports of the other funds. Please note that the expenses shown in the table are meant to highlight your ongoing costs only and do not reflect any transactional costs, such as sales charges (loads), or exchange fees. Therefore, the second line of the table under the “Investor Class” and “Institutional Class” headings is useful in comparing ongoing costs only, and will not help you determine the relative total costs of owning different funds. In addition, if these transactional costs were included, your costs would have been higher.
| | | | Expenses Paid |
| | Beginning | Ending | During Period(1) |
| | Account Value | Account Value | November 1, 2015 – |
| | November 1, 2015 | April 30, 2016 | April 30, 2016 |
| Investor Class | | | |
| Actual | $1,000.00 | $1,029.90 | $6.31 |
| Hypothetical (5% return before expenses) | $1,000.00 | $1,018.65 | $6.27 |
| | | | |
| Institutional Class | | | |
| Actual | $1,000.00 | $1,031.20 | $4.65 |
| Hypothetical (5% return before expenses) | $1,000.00 | $1,020.29 | $4.62 |
(1) | Expenses are equal to the Fund’s annualized expense ratio of 1.25% for Investor Class shares or 0.92% for Institutional Class shares, as applicable, multiplied by the average account value over the period, multiplied by 182/366 days (to reflect one-half year period). |
| HENNESSY FUNDS | 1-800-966-4354 | |
How to Obtain a Copy of the Fund’s
Proxy Voting Policy and Proxy Voting Records
A description of the policies and procedures the Fund uses to determine how to vote proxies relating to portfolio securities is available without charge: (1) by calling 1-800-966-4354; (2) on the Hennessy Funds’ website at hennessyfunds.com/proxy-voting/policy.fs; or (3) on the U.S. Securities and Exchange Commission’s website at www.sec.gov. The Fund’s proxy voting record is available without charge on both the Hennessy Funds’ website at hennessyfunds.com/proxy-voting/policy.fs and the SEC’s website at www.sec.gov no later than August 31 for the prior 12 months ending June 30.
Quarterly Filings on Form N-Q
The Fund files its complete schedule of portfolio holdings with the SEC for the first and third quarters of each fiscal year on Form N-Q. The Fund’s Form N-Q will be available on the SEC’s website at www.sec.gov. The Fund’s Form N-Q may be reviewed and copied at the SEC’s Public Reference Room in Washington, DC and information on the operation of the Public Reference Room may be obtained by calling 1-800-SEC-0330. Information included in the Fund’s N-Q will also be available upon request by calling 1-800-966-4354.
Federal Tax Distribution Information
(Unaudited)
For the fiscal year ended October 31, 2015, certain dividends paid by the Fund may be subject to a maximum tax rate of 23.8%, as provided for by the Jobs and Growth Tax Relief Reconciliation Act of 2003. The percentage of dividends declared from ordinary income designated as qualified dividend income was 100.00%.
For corporate shareholders, the percent of ordinary income distributions that qualified for the corporate dividends received deduction for the fiscal year ended October 31, 2015 was 100.00%.
The percentage of taxable ordinary income distributions that are designated as short-term capital gain distributions under Section 871(k)(2)(C) of the Internal Revenue Code of 1986, as amended, for the Fund was 0.00%.
Householding
To help keep the Fund’s costs as low as possible, we generally deliver a single copy of most financial reports and prospectuses to shareholders who share an address, even if the accounts are registered under different names. This process, known as “householding,” does not apply to account statements. You may, of course, request an individual copy of a prospectus or financial report at any time. If you would like to receive separate mailings, please call the Administrator at 1-800-261-6950 or 1-414-765-4124 and we will begin individual delivery within 30 days of your request. If your account is held through a financial institution or other intermediary, please contact them directly to request individual delivery.
Board Approval of Investment Advisory
Agreement
At its meeting on March 9, 2016, the Board of Trustees of the Fund (the “Board,” and the members thereof, the “Trustees”) unanimously approved the continuation of the investment advisory agreement of the Fund with Hennessy Advisors, Inc. (the “Advisor”). As part of the process of approving the continuation of the advisory agreement, the Trustees reviewed their fiduciary duties with respect to approving the advisory agreement and the relevant factors for them to consider. In addition, the Trustees who are not deemed “interested persons” (as that term is defined by the Investment Company Act of 1940) of the Fund (the “Independent Trustees”) met in executive session to discuss the approval of the advisory agreement.
In advance of the meeting, the Advisor sent detailed information to the Trustees to assist them in their evaluation of the advisory agreement. This information included, but was not limited to, (i) a memorandum from outside legal counsel that described the fiduciary duties of the Board with respect to approving the continuation of the advisory agreement and the relevant factors for consideration, (ii) a memorandum from the Advisor that listed the factors relevant to the Board’s approval of the continuation of the advisory agreement and also referenced the documents that had been provided to help the Board assess each such factor, (iii) an inventory of the range of services provided by the Advisor for the Fund, (iv) a written discussion of economies of scale, (v) the advisory agreement, (vi) a recent Fund fact sheet, (vii) a peer expense comparison, (viii) performance information, (ix) the Advisor’s most recent Form 10-K and Form 10-Q, which included information about the Advisor’s profitability, (x) information about brokerage commissions, (xi) information about the Fund’s compliance program, (xii) the Advisor’s current Form ADV Part I, and (xii) other information the Trustees believed was useful in evaluating the approval of the continuation of the advisory agreement.
All of the factors discussed by the Trustees were considered as a whole, and were considered separately by the Independent Trustees, meeting in executive session. The factors were viewed in their totality by the Trustees, with no single factor being the principal or determinative factor in the Trustees’ determination of whether to approve the continuation of the advisory agreement. The Trustees recognized that the management and fee arrangements for the Fund are the result of years of review and discussion between the Independent Trustees and the Advisor, that certain aspects of such arrangements may receive greater scrutiny in some years than in others, and that the Trustees’ conclusions may be based, in part, on their consideration of these same arrangements and information received during the course of the year and in prior years.
Prior to approving the continuation of the advisory agreement, the Trustees and the Independent Trustees in executive session considered, among other items:
| | • | The nature and quality of the advisory services provided by the Advisor. |
| | • | A comparison of the fees and expenses of the Fund to other similar funds. |
| | • | Whether economies of scale are recognized by the Fund. |
| | • | The costs and profitability of the Fund to the Advisor. |
| | • | The performance of the Fund. |
| | • | The other benefits to the Advisor from serving as an investment advisor to the Fund (in addition to the advisory fee). |
| HENNESSY FUNDS | 1-800-966-4354 | |
The material considerations and determinations of the Board of Trustees, including all of the Independent Trustees, are as follows:
| | • | The Board considered the services identified below that are provided by the Advisor. Based on this review, the Trustees believe that the Advisor provides high-quality services to the Fund, and they noted that their overall confidence in the Advisor is high. The Trustees also concluded that they were satisfied with the nature, extent, and quality of the advisory services provided to the Fund by the Advisor, and that the nature and extent of the services provided by the Advisor are appropriate to assure that the Fund’s operations are conducted in compliance with applicable laws, rules, and regulations. |
| | | �� | The Advisor acts as the portfolio manager for the Fund. In this capacity, the Advisor does the following: |
| | | | • | manages the composition of the Fund’s portfolio, including the purchase, retention, and disposition of portfolio securities in accordance with the Fund’s investment objectives, policies, and restrictions; |
| | | | • | ensures compliance with “best execution” for the Fund’s portfolio; |
| | | | • | manages the use of soft dollars for the Fund; |
| | | | • | manages proxy voting for the Fund; and |
| | | | • | holds a perpetual, royalty-free, exclusive license to the formula used for the Fund. |
| | | • | The Advisor performs a daily reconciliation of portfolio positions and cash for the Fund. |
| | | • | The Advisor monitors the Fund’s compliance with its investment objectives and restrictions. |
| | | • | The Advisor monitors compliance with federal securities laws and performs activities such as maintaining a compliance program, conducting ongoing reviews of the compliance programs of the Fund’s service providers, conducting on-site visits to the Fund’s service providers, monitoring incidents of abusive trading practices, reviewing Fund expense accruals, payments, and fixed expense ratios, evaluating insurance providers for fidelity bond coverage and D&O/E&O insurance coverage, conducting employee compliance training, reviewing reports provided by service providers, maintaining books and records, and preparing an annual compliance report to the Board. |
| | | • | The Advisor oversees service providers that provide accounting, administration, distribution, transfer agency, custodial, sales and marketing, public relations, audit, information technology, and legal services to the Fund. |
| | | • | The Advisor maintains in-house marketing and distribution departments on behalf of the Fund. |
| | | • | The Advisor is actively involved with preparing regulatory filings for the Fund, including writing and annually updating the Fund’s prospectus and related documents. |
| | | • | The Advisor prepares a written summary of the Fund’s performance for the most recent six-month period or twelve-month period, as applicable, for each semi-annual and annual report of the Fund. |
| | | • | The Advisor oversees distribution of the Fund through third-party broker/dealers and independent financial institutions such as Charles Schwab, Inc., Fidelity, TD Waterhouse, and Pershing. The Advisor participates in “no transaction fee” (“NTF”) programs with these companies on behalf of the Fund, |
| | | | which allow customers to purchase the Fund through third-party distribution channels without paying a transaction fee. The Advisor compensates, in part, a number of these third-party providers of NTF programs out of its own revenues. |
| | | • | The Advisor pays the incentive compensation of the Fund’s compliance officers and employs other staff, such as management executives, legal personnel, marketing personnel, national accounts and distribution personnel, sales personnel, administrative personnel, and trading oversight personnel. |
| | | • | The Advisor provides a quarterly compliance certification to the Board. |
| | | • | The Advisor prepares or reviews Board materials, frequently presents to the Board or leads Board discussions, prepares or reviews meeting minutes, and arranges for Board training and education. |
| | • | The Board compared the performance of the Fund to benchmark indices over various periods of time and they noted that at each quarterly meeting, the Trustees review reports comparing the investment performance of the Fund to various indices. Based on the information provided at the meeting and the information and quarterly discussions regarding the Fund’s investment performance, the Trustees believe that the Advisor manages the Fund in a manner that is materially consistent with its stated investment objective and style. The Trustees concluded that the performance of the Fund over various time horizons warranted the continuation of the advisory agreement. |
| | • | The Board reviewed the advisory fees and overall expense ratios of the Fund and comparable funds using data from Morningstar with respect to funds similar in asset size and investment objective to the Fund. As part of the discussion with management, the Trustees ensured that they understood and were comfortable with the criteria used to determine the mutual funds included in the Morningstar categories for purposes of the materials considered at the meeting. The Board determined that the advisory fee and overall expense ratio of the Fund falls within the range of the advisory fees and overall expense ratios of other comparable funds and concluded that they are reasonable and warranted continuation of the advisory agreement. |
| | • | The Board also considered whether economies of scale were being realized by the Advisor that should be shared with the Fund’s shareholders. The Trustees noted that many of the expenses incurred to manage the Fund are asset-based fees and thus do not result in material economies of scale being realized as the net assets of the Fund increase. For example, intermediary service fees increase as the Fund’s assets grow. The Trustees also considered the Advisor’s efforts to contain expenses, and took into account the Advisor’s significant marketing efforts to increase Fund assets. The Board noted that at current asset levels it did not appear that there were economies of scale being realized by the Advisor and concluded that it would continue to monitor economies of scale in the future as circumstances changed. |
| | • | The Board considered the profitability of the Advisor, including the impact of intermediary service fees on the Advisor’s profitability, and also considered the resources and revenues that the Advisor has put into managing and distributing the Fund. The Board then concluded that the profits of the Advisor are reasonable and not excessive when compared to profitability guidelines set forth in relevant court cases. |
| | • | The Board considered the high level of professionalism and knowledge of the Advisor’s employees, along with a very low level of turnover, and concluded that this was beneficial to the Fund and its shareholders. |
| HENNESSY FUNDS | 1-800-966-4354 | |
| | • | The Board considered other benefits to the Advisor from serving as an advisor to the Fund (in addition to the advisory fee). The Board noted that the Advisor may derive ancillary benefits from, by way of example, its association with the Fund in the form of proprietary and third-party research products and services received from broker dealers that execute portfolio trades for the Fund. The Board determined that any such products and services have been used for legitimate purposes relating to the Fund by providing assistance in the investment decision-making process. The Trustees concluded that the other benefits realized by the Advisor from its relationship with the Fund were reasonable. |
After reviewing the materials provided at the meeting and management’s presentation, as well as other information regularly provided at the Board’s quarterly meetings throughout the year regarding the quality of services provided by the Advisor, the performance of the Fund, expense information, regulatory compliance issues, trading information and related matters, and other factors deemed relevant by the Board, the Trustees, including all of the Independent Trustees, approved the continuation of the advisory agreement.
(This Page Intentionally Left Blank.)
For information, questions or assistance, please call
The Hennessy Funds
1-800-966-4354 or 1-415-899-1555
INVESTMENT ADVISOR
Hennessy Advisors, Inc.
7250 Redwood Blvd., Suite 200
Novato, California 94945
ADMINISTRATOR,
TRANSFER AGENT,
DIVIDEND PAYING AGENT &
SHAREHOLDER SERVICING AGENT
U.S. Bancorp Fund Services, LLC
P.O. Box 701
Milwaukee, Wisconsin 53201-0701
CUSTODIAN
U.S. Bank N.A.
Custody Operations
1555 North River Center Dr., Suite 302
Milwaukee, Wisconsin 53212
TRUSTEES
Neil J. Hennessy
Robert T. Doyle
J. Dennis DeSousa
Gerald P. Richardson
COUNSEL
Foley & Lardner LLP
777 East Wisconsin Avenue
Milwaukee, Wisconsin 53202-5306
INDEPENDENT REGISTERED
PUBLIC ACCOUNTING FIRM
KPMG LLP
777 East Wisconsin Avenue
Milwaukee, Wisconsin 53202-5306
DISTRIBUTOR
Quasar Distributors, LLC
615 East Michigan Street
Milwaukee, Wisconsin 53202
hennessyfunds.com | 1-800-966-4354
This report has been prepared for shareholders and may be distributed to
others only if preceded or accompanied by a current prospectus.
SEMI-ANNUAL REPORT
APRIL 30, 2016
HENNESSY LARGE VALUE FUND
Investor Class HLVFX
Institutional Class HLVIX
hennessyfunds.com | 1-800-966-4354
(This Page Intentionally Left Blank.)
Contents
| Letter to Shareholders | 2 |
| Performance Overview | 4 |
| Financial Statements | |
| Schedule of Investments | 6 |
| Statement of Assets and Liabilities | 12 |
| Statement of Operations | 13 |
| Statements of Changes in Net Assets | 15 |
| Financial Highlights | 16 |
| Notes to the Financial Statements | 20 |
| Expense Example | 27 |
| Proxy Voting | 29 |
| Quarterly Filings on Form N-Q | 29 |
| Federal Tax Distribution Information | 29 |
| Householding | 29 |
| Board Approval of Investment Advisory Agreements | 30 |
| HENNESSY FUNDS | 1-800-966-4354 | |
June 2016
Dear Hennessy Funds Shareholder:
I used to tell my kids, “What doesn’t kill you makes you stronger.” Perhaps that is not the best analogy for investing, but in the face of such roller coaster volatility in the financial markets, it seems to me that what hasn’t killed this bull market rally may just make it stronger. The financial markets brought us flat to modest returns during the six months ended April 30, 2016, with the S&P 500 Index returning 0.43% and the Dow Jones Industrial Average (DJIA) returning 1.98% during the period. These six months were marked by high volatility, the onslaught of more and more regulatory hurdles, the Fed stuck in neutral, fears about the global economy, and wild political rhetoric — all headwinds that I believe could have significantly stalled any positive moves in the market, but didn’t. Even the aggressive pull back in January showed just how skittish the market can be, and yet again the markets showed great resiliency and marched right back.
I continue to be impressed with the persistence of the bull market in U.S. equities, now in its seventh year. Many commentators believe that the U.S. economy is due for a recession, and the market is due for a downturn. However, we find ourselves comparing today’s secular market to the bull run of 1982 to 2000, which was powered by a significant increase in valuations. On March 9th of this year, I took a moment to remember how we all felt seven years ago on March 9, 2009, at the bottom of the financial crisis downturn that had wiped out trillions of dollars’ worth of U.S. equities. I explained to our investors then, and I say the same thing today, I believe that if you invest in quality companies with good fundamentals, over the long term, you should do fine.
If history is any kind of guide, then I think this bull market has some room to run. Rising markets usually fall when there is extreme optimism or euphoria. I haven’t witnessed any of that as of yet. The volatility has unnerved many, but I encourage investors to try to remain focused on investment fundamentals. Many U.S. companies continue to find ways to make a profit and build their already strong balance sheets. Unemployment is low, and wages are rising in real terms, supporting consumer confidence and consumption. With an average price-to-sales ratio of only 1.7x and a dividend yield of approximately 2.5% for the Dow, I believe U.S. equities continue to be attractive. In my opinion, there are many compelling reasons why this market can continue to climb even higher.
The next six months may be fraught with more talk about what the Fed will do, who the next President of the United States will be, and what is happening in China and around the globe. Businesses in every industry, including the asset management business, have concerns about increasing regulatory burdens, taxes, and higher healthcare costs. But, I still believe the ingenuity and perseverance of American business will find ways to endure and to thrive.
Thank you for your continued confidence and investment in our products. If you have any questions or would like to speak with us directly, please don’t hesitate to call us at (800) 966-4354.
Best regards,
Neil J. Hennessy
President and Chief Investment Officer
Past performance does not guarantee future results.
Mutual fund investing involves risk. Principal loss is possible.
Opinions expressed are those of Neil Hennessy and are subject to change, are not guaranteed and should not be considered investment advice.
Price-to-sales ratio is a tool for calculating a stock’s valuation relative to other companies. It is calculated by dividing a stock’s current price by its revenue per share. Dividend yield is calculated as the annual dividends paid by a company divided by its market price per share.
The Dow Jones Industrial Average and S&P 500 Index are unmanaged indices commonly used to measure the performance of U.S. stocks. One cannot invest directly in an index.
| HENNESSY FUNDS | 1-800-966-4354 | |
Performance Overview (Unaudited)
AVERAGE ANNUAL TOTAL RETURN FOR PERIODS ENDED APRIL 30, 2016
| | Six | One | Five | Ten |
| | Months(1) | Year | Years | Years |
| Hennessy Large Value Fund – | | | | |
| Investor Class (HLVFX) | -2.43% | -4.72% | 8.51% | 4.36% |
| Hennessy Large Value Fund – | | | | |
Institutional Class (HLVIX)(2) | -2.39% | -4.64% | 8.82% | 4.59% |
Russell 1000® Value Index | 1.93% | -0.40% | 10.13% | 5.67% |
| S&P 500 Index | 0.43% | 1.21% | 11.02% | 6.91% |
Expense ratios: 1.35% (Investor Class); 1.18% (Institutional Class)
Performance data quoted represents past performance; past performance does not guarantee future results. The investment return and principal value of an investment will fluctuate so that an investor’s shares, when redeemed, may be worth more or less than their original cost. The performance table does not reflect the deduction of taxes that a shareholder would pay on Fund distributions or the redemption of Fund shares. Current performance of the Fund may be lower or higher than the performance quoted. Performance data current to the most recent month end may be obtained by visiting hennessyfunds.com. Performance for periods prior to March 20, 2009, reflects the performance of the Tamarack Value Fund, the predecessor to the Hennessy Large Value Fund.
The expense ratios presented are from the most recent prospectus.
(1) | Periods less than one year are not annualized. |
(2) | The inception date of the Institutional Class shares is March 20, 2009. Performance shown prior to the inception of the Institutional Class shares reflects the performance of the Investor Class shares and includes expenses that are not applicable to and are higher than those of the Institutional Class shares. |
PERFORMANCE NARRATIVE
Portfolio Managers Stuart A. Lippe, Barbara S. Browning, CFA, and Adam D. Scheiner, CFA
RBC Global Asset Management (U.S.) Inc. (sub-advisor)
Performance:
For the six-month period ended April 30, 2016, the Investor Class of the Hennessy Large Value Fund returned -2.43%, underperforming both the Russell 1000® Value Index and the S&P 500 Index, which returned 1.93% and 0.43%, respectively, for the same period.
The Fund’s relative underperformance was due primarily to adverse stock selection in the Financials, Information Technology, and Materials sectors. Performance due to sector allocation decisions was modestly negative, but the Fund’s sector neutral mandate, by design, limits the impact of sector weighting decisions, with the Fund’s managers instead making bets at the industry level. However, the negative effect of the moderate underweight position in the relatively strong Telecommunication Services sector, as well as the slight overweight to the Utilities sector, detracted from returns.
Within the Financials sector, Morgan Stanley (-23%) and Bank of America Corp. (-13%) were the worst performers. Banks broadly have underperformed due to prospects of lower interest rates going forward as a result of U.S. and global economic weakness. Overall, we believe bank stocks are close to fairly valued unless we get a pickup in growth or higher rates. We are modestly overweight banks with a bias towards capital markets, as we believe that the second quarter should see some benefits from a pickup in the stock market. The Fund continues to hold Bank of America, but has since liquidated Morgan Stanley. On a positive note, the Fund benefitted from not holding several poor performing
stocks in the sector, including Waddell & Reed Financial, Inc. (-43%) and OneMain Holdings, Inc. (-32%).
Stock selection within the Information Technology sector was also a significant detractor from the Fund’s relative performance. Western Digital Corp. (-38%), a computer data storage company, was the largest detractor from performance within the sector. Concerns over the level of complexity of their deal with SanDisk have been overshadowing the anticipated benefits of the combination of the two companies. In addition, weak PC sales have affected Western Digital. The Fund continues to hold Western Digital.
Our stock selection within the Materials sector negatively impacted performance as well. WestRock Co. (-20%), a provider of paper and packaging solutions in the field of corrugated paper, was a weak performer. While containerboard fundamentals are relatively stable, execution missteps and ambiguous communications with shareholders caused reported earnings to fall far short of expectations. The stock will remain under a cloud until results improve and the company spins off its specialty chemical business. The Fund continues to hold WestRock.
Investment Outlook:
We remain confident in our stock selection-driven process and our ability to find special situation stocks that have the potential to outperform regardless of the market environment. While investment decisions are the result of bottom-up stock selection and our sector-neutral mandate requires investment in all 10 major sectors of the market, there are a number of industry-based themes that we believe could drive performance of the Fund over the coming year. Within the Consumer Discretionary sector, we are overweight department stores and multiline retail, which are somewhat insulated from online competition by their breadth of offerings. They are also less reliant on mall foot traffic, and they are farther ahead in building online and “omni-channel” capabilities than specialty retail stores.
With regards to Technology, trends in the industry continue to favor companies exposed to the secular growth areas of mobile content, cloud computing and software. We continue to look for attractively valued opportunities in these areas. We are overweight semiconductors as we look for exposure to the Internet of Things (IoT). Essentially, the IoT is the idea of everyday things becoming “connected” or “smart.” This transition is occurring in autos through infotainment offerings, safety features, and fuel efficiency mechanisms that all require integrated circuits and sensors to communicate, measure, and process data. The IoT theme is also penetrating other industries, such as industrial automation, appliances, and fitness wearables. Finally, in Health Care, we are seeing continued growth in demand for health services prompted by health care reform (especially with regard to managed care) that we believe supports our overweight position in health care providers and services.
Opinions expressed are those of the Portfolio Managers as of the date written and are subject to change, are not guaranteed, and should not be considered investment advice or an indication of trading intent.
The Russell 1000® Value Index is an unmanaged index commonly used to measure the performance of U.S. large-capitalization value stocks. The S&P 500 Index is an unmanaged index commonly used to measure the performance of U.S. stocks. One cannot invest directly in an index.
The Fund may invest in medium-capitalization companies, which may have more limited liquidity and greater price volatility than large-capitalization companies.
References to specific securities should not be considered a recommendation to buy or sell any security. Fund holdings and sector allocations are subject to change. Please refer to the Schedule of Investments included in this report for additional portfolio information.
| HENNESSY FUNDS | 1-800-966-4354 | |
Financial Statements
Schedule of Investments as of April 30, 2016 (Unaudited) |
HENNESSY LARGE VALUE FUND
(% of Net Assets)
| TOP TEN HOLDINGS (EXCLUDING CASH/CASH EQUIVALENTS) | % NET ASSETS |
| Johnson & Johnson | 3.39% |
| Exxon Mobil Corp. | 3.27% |
| NextEra Energy, Inc. | 2.94% |
| Procter & Gamble Co. | 2.77% |
| Wells Fargo & Co. | 2.70% |
| Microsoft Corp. | 2.55% |
| Bank of America Corp. | 2.43% |
| General Electric Co. | 2.43% |
| Occidental Petroleum Corp. | 2.41% |
| DTE Energy Co. | 2.24% |
Note: For presentation purposes, the Fund has grouped some of the industry categories. For purposes of categorizing securities for compliance with Section 8(b)(1) of the Investment Company Act of 1940, as amended, the Fund uses more specific industry classifications.
| | COMMON STOCKS – 95.65% | | Number | | | | | | % of | |
| | | | of Shares | | | Value | | | Net Assets | |
| | Consumer Discretionary – 5.83% | | | | | | | | | |
| | Carnival Corp. (b) | | | 27,720 | | | $ | 1,359,666 | | | | 1.02 | % |
| | Ford Motor Co. | | | 117,215 | | | | 1,589,435 | | | | 1.19 | % |
| | Lowe’s Companies, Inc. | | | 12,910 | | | | 981,418 | | | | 0.73 | % |
| | Target Corp. | | | 20,455 | | | | 1,626,173 | | | | 1.22 | % |
| | Time Warner, Inc. | | | 22,490 | | | | 1,689,899 | | | | 1.27 | % |
| | Viacom, Inc., Class B | | | 13,040 | | | | 533,336 | | | | 0.40 | % |
| | | | | | | | | 7,779,927 | | | | 5.83 | % |
| | | | | | | | | | | | | | |
| | Consumer Staples – 6.83% | | | | | | | | | | | | |
| | ConAgra Foods, Inc. | | | 20,740 | | | | 924,174 | | | | 0.69 | % |
| | Mondelez International, Inc. | | | 44,750 | | | | 1,922,460 | | | | 1.44 | % |
| | PepsiCo, Inc. | | | 10,830 | | | | 1,115,057 | | | | 0.84 | % |
| | Procter & Gamble Co. | | | 46,165 | | | | 3,698,740 | | | | 2.77 | % |
| | Tyson Foods, Inc., Class A | | | 22,080 | | | | 1,453,306 | | | | 1.09 | % |
| | | | | | | | | 9,113,737 | | | | 6.83 | % |
| | | | | | | | | | | | | | |
| | Energy – 13.04% | | | | | | | | | | | | |
| | Anadarko Petroleum Corp. | | | 15,670 | | | | 826,749 | | | | 0.62 | % |
| | Chevron Corp. | | | 12,935 | | | | 1,321,699 | | | | 0.99 | % |
| | ConocoPhillips | | | 18,870 | | | | 901,797 | | | | 0.68 | % |
| | Exxon Mobil Corp. | | | 49,390 | | | | 4,366,076 | | | | 3.27 | % |
| | Helmerich & Payne, Inc. | | | 9,910 | | | | 655,249 | | | | 0.49 | % |
| | Hess Corp. | | | 42,390 | | | | 2,527,292 | | | | 1.89 | % |
| | Marathon Oil Corp. | | | 78,265 | | | | 1,102,754 | | | | 0.83 | % |
| | Occidental Petroleum Corp. | | | 42,020 | | | | 3,220,833 | | | | 2.41 | % |
| | Pioneer Natural Resources Co. | | | 10,050 | | | | 1,669,305 | | | | 1.25 | % |
| | Valero Energy Corp. | | | 13,845 | | | | 815,055 | | | | 0.61 | % |
| | | | | | | | | 17,406,809 | | | | 13.04 | % |
| | | | | | | | | | | | | | |
| | Financials – 23.64% | | | | | | | | | | | | |
| | Affiliated Managers Group, Inc. (a) | | | 10,245 | | | | 1,744,928 | | | | 1.31 | % |
| | Allstate Corp. | | | 19,142 | | | | 1,245,187 | | | | 0.93 | % |
| | American International Group, Inc. | | | 23,925 | | | | 1,335,494 | | | | 1.00 | % |
| | Bank of America Corp. | | | 223,299 | | | | 3,251,233 | | | | 2.43 | % |
| | BlackRock, Inc. | | | 4,330 | | | | 1,542,909 | | | | 1.15 | % |
| | Chubb, Ltd. (b) | | | 20,160 | | | | 2,376,058 | | | | 1.78 | % |
| | Citigroup, Inc. | | | 51,885 | | | | 2,401,238 | | | | 1.80 | % |
The accompanying notes are an integral part of these financial statements.
| HENNESSY FUNDS | 1-800-966-4354 | |
| | COMMON STOCKS | | Number | | | | | | % of | |
| | | | of Shares | | | Value | | | Net Assets | |
| | Financials (Continued) | | | | | | | | | |
| | CME Group, Inc. | | | 17,978 | | | $ | 1,652,358 | | | | 1.24 | % |
| | First Republic Bank | | | 13,230 | | | | 930,334 | | | | 0.70 | % |
| | JPMorgan Chase & Co. | | | 39,875 | | | | 2,520,100 | | | | 1.89 | % |
| | Prudential Financial, Inc. | | | 19,017 | | | | 1,476,480 | | | | 1.11 | % |
| | Signature Bank (a) | | | 4,161 | | | | 573,511 | | | | 0.43 | % |
| | SunTrust Banks, Inc. | | | 48,514 | | | | 2,024,974 | | | | 1.52 | % |
| | Synchrony Financial (a) | | | 69,965 | | | | 2,138,830 | | | | 1.60 | % |
| | The Goldman Sachs Group, Inc. | | | 10,866 | | | | 1,783,219 | | | | 1.34 | % |
| | Wells Fargo & Co. | | | 72,060 | | | | 3,601,559 | | | | 2.70 | % |
| | XL Group PLC (b) | | | 29,080 | | | | 951,788 | | | | 0.71 | % |
| | | | | | | | | 31,550,200 | | | | 23.64 | % |
| | | | | | | | | | | | | | |
| | Health Care – 12.57% | | | | | | | | | | | | |
| | Aetna, Inc. | | | 20,452 | | | | 2,296,146 | | | | 1.72 | % |
| | Allergan PLC (a)(b) | | | 6,540 | | | | 1,416,302 | | | | 1.06 | % |
| | Johnson & Johnson | | | 40,370 | | | | 4,524,670 | | | | 3.39 | % |
| | Medtronic PLC (b) | | | 26,875 | | | | 2,127,156 | | | | 1.59 | % |
| | Merck & Co., Inc. | | | 47,600 | | | | 2,610,384 | | | | 1.96 | % |
| | Pfizer, Inc. | | | 48,665 | | | | 1,591,832 | | | | 1.19 | % |
| | Thermo Fisher Scientific, Inc. | | | 15,350 | | | | 2,214,238 | | | | 1.66 | % |
| | | | | | | | | 16,780,728 | | | | 12.57 | % |
| | | | | | | | | | | | | | |
| | Industrials – 12.20% | | | | | | | | | | | | |
| | CSX Corp. | | | 18,563 | | | | 506,213 | | | | 0.38 | % |
| | Danaher Corp. | | | 12,650 | | | | 1,223,887 | | | | 0.92 | % |
| | FedEx Corp. | | | 5,632 | | | | 929,900 | | | | 0.70 | % |
| | General Dynamics Corp. | | | 7,060 | | | | 992,071 | | | | 0.74 | % |
| | General Electric Co. | | | 105,564 | | | | 3,246,093 | | | | 2.43 | % |
| | Honeywell International, Inc. | | | 15,620 | | | | 1,784,897 | | | | 1.34 | % |
| | Ingersoll-Rand PLC (b) | | | 27,580 | | | | 1,807,593 | | | | 1.35 | % |
| | Owens Corning | | | 21,650 | | | | 997,415 | | | | 0.75 | % |
| | Pentair PLC (b) | | | 20,700 | | | | 1,202,256 | | | | 0.90 | % |
| | Raytheon Co. | | | 10,930 | | | | 1,381,006 | | | | 1.03 | % |
| | Southwest Airlines Co. | | | 23,221 | | | | 1,035,889 | | | | 0.78 | % |
| | United Technologies Corp. | | | 11,280 | | | | 1,177,294 | | | | 0.88 | % |
| | | | | | | | | 16,284,514 | | | | 12.20 | % |
The accompanying notes are an integral part of these financial statements.
| | COMMON STOCKS | | Number | | | | | | % of | |
| | | | of Shares | | | Value | | | Net Assets | |
| | Information Technology – 10.53% | | | | | | | | | |
| | Broadcom, Ltd. (b) | | | 7,830 | | | $ | 1,141,222 | | | | 0.86 | % |
| | Cisco Systems, Inc. | | | 99,240 | | | | 2,728,108 | | | | 2.04 | % |
| | Citrix Systems, Inc. (a) | | | 14,560 | | | | 1,191,590 | | | | 0.89 | % |
| | Cognizant Technology Solutions Corp., Class A (a) | | | 12,340 | | | | 720,286 | | | | 0.54 | % |
| | LAM Research Corp. | | | 20,885 | | | | 1,595,614 | | | | 1.20 | % |
| | Microsoft Corp. | | | 68,285 | | | | 3,405,373 | | | | 2.55 | % |
| | Skyworks Solutions, Inc. | | | 31,945 | | | | 2,134,565 | | | | 1.60 | % |
| | Western Digital Corp. | | | 27,726 | | | | 1,133,023 | | | | 0.85 | % |
| | | | | | | | | 14,049,781 | | | | 10.53 | % |
| | | | | | | | | | | | | | |
| | Materials – 2.72% | | | | | | | | | | | | |
| | Celanese Corp., Series A | | | 12,600 | | | | 890,820 | | | | 0.67 | % |
| | PPG Industries, Inc. | | | 14,570 | | | | 1,608,382 | | | | 1.20 | % |
| | WestRock Co. | | | 27,085 | | | | 1,133,507 | | | | 0.85 | % |
| | | | | | | | | 3,632,709 | | | | 2.72 | % |
| | | | | | | | | | | | | | |
| | Telecommunication Services – 0.97% | | | | | | | | | | | | |
| | AT&T, Inc. | | | 6,570 | | | | 255,047 | | | | 0.19 | % |
| | T- Mobile US, Inc. (a) | | | 26,290 | | | | 1,032,671 | | | | 0.78 | % |
| | | | | | | | | 1,287,718 | | | | 0.97 | % |
| | | | | | | | | | | | | | |
| | Utilities – 7.32% | | | | | | | | | | | | |
| | Ameren Corp. | | | 11,990 | | | | 575,520 | | | | 0.43 | % |
| | American Electric Power, Inc. | | | 35,970 | | | | 2,284,095 | | | | 1.71 | % |
| | DTE Energy Co. | | | 33,585 | | | | 2,994,439 | | | | 2.24 | % |
| | NextEra Energy, Inc. | | | 33,300 | | | | 3,915,414 | | | | 2.94 | % |
| | | | | | | | | 9,769,468 | | | | 7.32 | % |
| | Total Common Stocks | | | | | | | | | | | | |
| | (Cost $110,274,931) | | | | | | | 127,655,591 | | | | 95.65 | % |
| | | | | | | | | | | | | | |
| | REITS – 4.29% | | | | | | | | | | | | |
| | Financials – 4.29% | | | | | | | | | | | | |
| | AvalonBay Communities, Inc. | | | 8,208 | | | | 1,451,092 | | | | 1.09 | % |
| | Host Hotels & Resorts, Inc. | | | 63,864 | | | | 1,010,329 | | | | 0.75 | % |
| | Kilroy Realty Corp. | | | 16,332 | | | | 1,058,477 | | | | 0.79 | % |
| | Simon Property Group, Inc. | | | 11,000 | | | | 2,212,870 | | | | 1.66 | % |
| | | | | | | | | | | | | | |
| | Total REITS | | | | | | | | | | | | |
| | (Cost $5,589,998) | | | | | | | 5,732,768 | | | | 4.29 | % |
The accompanying notes are an integral part of these financial statements.
| HENNESSY FUNDS | 1-800-966-4354 | |
| | SHORT-TERM INVESTMENTS – 0.49% | | Number | | | | | | % of | |
| | | | of Shares | | | Value | | | Net Assets | |
| | Money Market Funds – 0.49% | | | | | | | | | |
| | Fidelity Government Portfolio, | | | | | | | | | |
| | Institutional Class, 0.23% (c) | | | 649,758 | | | $ | 649,758 | | | | 0.49 | % |
| | | | | | | | | | | | | | |
| | Total Short-Term Investments | | | | | | | | | | | | |
| | (Cost $649,758) | | | | | | | 649,758 | | | | 0.49 | % |
| | | | | | | | | | | | | | |
| | Total Investments | | | | | | | | | | | | |
| | (Cost $116,514,687) – 100.43% | | | | | | | 134,038,117 | | | | 100.43 | % |
| | | | | | | | | | | | | | |
| | Liabilities in | | | | | | | | | | | | |
| | Excess of Other Assets – (0.43)% | | | | | | | (575,124 | ) | | | (0.43 | )% |
| | | | | | | | | | | | | | |
| | TOTAL NET ASSETS – 100.00% | | | | | | $ | 133,462,993 | | | | 100.00 | % |
Percentages are stated as a percent of net assets.
REIT – Real Estate Investment Trust
| (a) | Non-income producing security. |
| (b) | U.S. traded security of a foreign corporation. |
| (c) | The rate listed is the fund’s 7-day yield as of April 30, 2016. |
The accompanying notes are an integral part of these financial statements.
Summary of Fair Value Exposure at April 30, 2016
The following is a summary of the inputs used to value the Fund’s net assets as of April 30, 2016 (See Note 3 in the accompanying notes to the financial statements):
| Common Stocks | | Level 1 | | | Level 2 | | | Level 3 | | | Total | |
| Consumer Discretionary | | $ | 7,779,927 | | | $ | — | | | $ | — | | | $ | 7,779,927 | |
| Consumer Staples | | | 9,113,737 | | | | — | | | | — | | | | 9,113,737 | |
| Energy | | | 17,406,809 | | | | — | | | | — | | | | 17,406,809 | |
| Financials | | | 31,550,200 | | | | — | | | | — | | | | 31,550,200 | |
| Health Care | | | 16,780,728 | | | | — | | | | — | | | | 16,780,728 | |
| Industrials | | | 16,284,514 | | | | — | | | | — | | | | 16,284,514 | |
| Information Technology | | | 14,049,781 | | | | — | | | | — | | | | 14,049,781 | |
| Materials | | | 3,632,709 | | | | — | | | | — | | | | 3,632,709 | |
| Telecommunication Services | | | 1,287,718 | | | | — | | | | — | | | | 1,287,718 | |
| Utilities | | | 9,769,468 | | | | — | | | | — | | | | 9,769,468 | |
| Total Common Stocks | | $ | 127,655,591 | | | $ | — | | | $ | — | | | $ | 127,655,591 | |
| REITS | | | | | | | | | | | | | | | | |
| Financials | | $ | 5,732,768 | | | $ | — | | | $ | — | | | $ | 5,732,768 | |
| Total REITS | | $ | 5,732,768 | | | $ | — | | | $ | — | | | $ | 5,732,768 | |
| Short-Term Investments | | | | | | | | | | | | | | | | |
| Money Market Funds | | $ | 649,758 | | | $ | — | | | $ | — | | | $ | 649,758 | |
| Total Short-Term Investments | | $ | 649,758 | | | $ | — | | | $ | — | | | $ | 649,758 | |
| Total Investments | | $ | 134,038,117 | | | $ | — | | | $ | — | | | $ | 134,038,117 | |
Transfers between levels are recognized at the end of the reporting period. During the six-month period ended April 30, 2016, the Fund recognized no transfers between levels.
The accompanying notes are an integral part of these financial statements.
| HENNESSY FUNDS | 1-800-966-4354 | |
Financial Statements
Statement of Assets and Liabilities as of April 30, 2016 (Unaudited) |
| ASSETS: | | | |
| Investments in securities, at value (cost $116,514,687) | | $ | 134,038,117 | |
| Dividends and interest receivable | | | 106,849 | |
| Receivable for fund shares sold | | | 1,828 | |
| Receivable for securities sold | | | 528,959 | |
| Prepaid expenses and other assets | | | 24,184 | |
| Total Assets | | | 134,699,937 | |
| | | | | |
| LIABILITIES: | | | | |
| Payable for securities purchased | | | 962,174 | |
| Payable for fund shares redeemed | | | 27,887 | |
| Payable to advisor | | | 93,360 | |
| Payable to administrator | | | 31,769 | |
| Payable to auditor | | | 10,923 | |
| Accrued distribution fees | | | 65,850 | |
| Accrued service fees | | | 10,865 | |
| Accrued trustees fees | | | 2,980 | |
| Accrued expenses and other payables | | | 31,136 | |
| Total Liabilities | | | 1,236,944 | |
| NET ASSETS | | $ | 133,462,993 | |
| | | | | |
| NET ASSETS CONSIST OF: | | | | |
| Capital stock | | $ | 116,450,320 | |
| Accumulated net investment income | | | 337,429 | |
| Accumulated net realized loss on investments | | | (848,186 | ) |
| Unrealized net appreciation on investments | | | 17,523,430 | |
| Total Net Assets | | $ | 133,462,993 | |
| | | | | |
| NET ASSETS | | | | |
| Investor Class: | | | | |
| Shares authorized (no par value) | | Unlimited | |
| Net assets applicable to outstanding Investor Class shares | | $ | 132,095,131 | |
| Shares issued and outstanding | | | 4,412,577 | |
| Net asset value, offering price and redemption price per share | | $ | 29.94 | |
| | | | | |
| Institutional Class: | | | | |
| Shares authorized (no par value) | | Unlimited | |
| Net assets applicable to outstanding Institutional Class shares | | $ | 1,367,862 | |
| Shares issued and outstanding | | | 45,596 | |
| Net asset value, offering price and redemption price per share | | $ | 30.00 | |
The accompanying notes are an integral part of these financial statements.
Financial Statements
Statement of Operations for the six months ended April 30, 2016 (Unaudited) |
| INVESTMENT INCOME: | | | |
| Dividend income | | $ | 1,620,298 | |
| Interest income | | | 661 | |
| Total investment income | | | 1,620,959 | |
| | | | | |
| EXPENSES: | | | | |
| Investment advisory fees (See Note 5) | | | 562,900 | |
| Distribution fees – Investor Class (See Note 5) | | | 98,269 | |
| Service fees – Investor Class (See Note 5) | | | 65,512 | |
| Administration, fund accounting, custody and transfer agent fees (See Note 5) | | | 64,922 | |
| Sub-transfer agent expenses – Investor Class (See Note 5) | | | 53,201 | |
| Sub-transfer agent expenses – Institutional Class (See Note 5) | | | 1,486 | |
| Reports to shareholders | | | 13,377 | |
| Compliance expense | | | 11,790 | |
| Audit fees | | | 11,556 | |
| Accrued distribution fees | | | 10,372 | |
| Trustees’ fees and expenses | | | 6,183 | |
| Legal fees | | | 504 | |
| Other expenses | | | 6,356 | |
| Total expenses | | | 906,428 | |
| NET INVESTMENT INCOME | | $ | 714,531 | |
| | | | | |
| REALIZED AND UNREALIZED LOSSES: | | | | |
| Net realized loss on investments | | $ | (166,863 | ) |
| Net change in unrealized depreciation on investments | | | (4,171,389 | ) |
| Net loss on investments | | | (4,338,252 | ) |
| NET DECREASE IN NET ASSETS RESULTING FROM OPERATIONS | | $ | (3,623,721 | ) |
The accompanying notes are an integral part of these financial statements.
| HENNESSY FUNDS | 1-800-966-4354 | |
(This Page Intentionally Left Blank.)
Financial Statements
| Statements of Changes in Net Assets |
| | | Six Months Ended | | | | |
| | | April 30, 2016 | | | Year Ended | |
| | | (Unaudited) | | | October 31, 2015 | |
| OPERATIONS: | | | | | | |
| Net investment income | | $ | 714,531 | | | $ | 1,340,808 | |
| Net realized gain (loss) on investments | | | (166,863 | ) | | | 10,907,367 | |
| Net change in unrealized depreciation on investments | | | (4,171,389 | ) | | | (9,429,582 | ) |
| Net increase (decrease) in net | | | | | | | | |
| assets resulting from operations | | | (3,623,721 | ) | | | 2,818,593 | |
| | | | | | | | | |
| DISTRIBUTIONS TO SHAREHOLDERS FROM: | | | | | | | | |
| Net investment income | | | | | | | | |
| Investor Class | | | (1,379,214 | ) | | | (1,223,834 | ) |
| Institutional Class | | | (18,326 | ) | | | (4,422 | ) |
| Net realized gains | | | | | | | | |
| Investor Class | | | (11,104,771 | ) | | | (6,143,232 | ) |
| Institutional Class | | | (125,018 | ) | | | (16,453 | ) |
| Total distributions | | | (12,627,329 | ) | | | (7,387,941 | ) |
| | | | | | | | | |
| CAPITAL SHARE TRANSACTIONS: | | | | | | | | |
| Proceeds from shares subscribed – Investor Class | | | 486,064 | | | | 1,694,661 | |
| Proceeds from shares subscribed – Institutional Class | | | 810,881 | | | | 963,669 | |
| Dividends reinvested – Investor Class | | | 12,006,353 | | | | 7,104,575 | |
| Dividends reinvested – Institutional Class | | | 140,185 | | | | 20,495 | |
| Cost of shares redeemed – Investor Class | | | (6,273,919 | ) | | | (13,521,759 | ) |
| Cost of shares redeemed – Institutional Class | | | (712,917 | ) | | | (82,147 | ) |
| Net increase (decrease) in net assets derived from | | | | | | | | |
| capital share transactions | | | 6,456,647 | | | | (3,820,506 | ) |
| TOTAL DECREASE IN NET ASSETS | | | (9,794,403 | ) | | | (8,389,854 | ) |
| | | | | | | | | |
| NET ASSETS: | | | | | | | | |
| Beginning of period | | | 143,257,396 | | | | 151,647,250 | |
| End of period | | $ | 133,462,993 | | | $ | 143,257,396 | |
| Undistributed net investment income, end of period | | $ | 337,429 | | | $ | 1,020,438 | |
| | | | | | | | | |
| CHANGES IN SHARES OUTSTANDING: | | | | | | | | |
| Shares sold – Investor Class | | | 16,324 | | | | 49,427 | |
| Shares sold – Institutional Class | | | 26,370 | | | | 28,858 | |
| Shares issued to holders as reinvestment | | | | | | | | |
| of dividends – Investor Class | | | 397,477 | | | | 208,039 | |
| Shares issued to holders as reinvestment | | | | | | | | |
| of dividends – Institutional Class | | | 4,626 | | | | 598 | |
| Shares redeemed – Investor Class | | | (210,661 | ) | | | (395,518 | ) |
| Shares redeemed – Institutional Class | | | (23,856 | ) | | | (2,406 | ) |
| Net increase (decrease) in shares outstanding | | | 210,280 | | | | (111,002 | ) |
The accompanying notes are an integral part of these financial statements.
| HENNESSY FUNDS | 1-800-966-4354 | |
Financial Statements
For an Investor Class share outstanding throughout each period
| | | Six Months Ended | |
| | | April 30, 2016 | |
| | | (Unaudited) | |
| PER SHARE DATA: | | | |
| Net asset value, beginning of period | | $ | 33.72 | |
| | | | | |
| Income (loss) from investment operations: | | | | |
| Net investment income | | | 0.14 | |
| Net realized and unrealized gains (losses) on investments | | | (0.96 | ) |
| Total from investment operations | | | (0.82 | ) |
| | | | | |
| Less distributions: | | | | |
| Dividends from net investment income | | | (0.31 | ) |
| Dividends from net realized gains | | | (2.65 | ) |
| Total distributions | | | (2.96 | ) |
| Net asset value, end of period | | $ | 29.94 | |
| | | | | |
| TOTAL RETURN | | | (2.43 | )%(1) |
| | | | �� | |
| SUPPLEMENTAL DATA AND RATIOS: | | | | |
| Net assets, end of period (millions) | | $ | 132.09 | |
| Ratio of expenses to average net assets | | | 1.37 | %(2) |
| Ratio of net investment income to average net assets | | | 1.08 | %(2) |
Portfolio turnover rate(3) | | | 91 | %(1) |
(1) | Not annualized. |
(2) | Annualized. |
(3) | Portfolio turnover is calculated on the basis of the Fund as a whole. |
The accompanying notes are an integral part of these financial statements.
| Year Ended October 31, | |
| 2015 | | | 2014 | | | 2013 | | | 2012 | | | 2011 | |
| | | | | | | | | | | | | | |
| $ | 34.79 | | | $ | 30.70 | | | $ | 24.71 | | | $ | 21.47 | | | $ | 20.57 | |
| | | | | | | | | | | | | | | | | | | |
| | | | | | | | | | | | | | | | | | | |
| | 0.30 | | | | 0.28 | | | | 0.28 | | | | 0.28 | | | | 0.22 | |
| | 0.32 | | | | 4.06 | | | | 6.00 | | | | 3.14 | | | | 0.89 | |
| | 0.62 | | | | 4.34 | | | | 6.28 | | | | 3.42 | | | | 1.11 | |
| | | | | | | | | | | | | | | | | | | |
| | | | | | | | | | | | | | | | | | | |
| | (0.27 | ) | | | (0.25 | ) | | | (0.29 | ) | | | (0.18 | ) | | | (0.21 | ) |
| | (1.42 | ) | | | — | | | | — | | | | — | | | | — | |
| | (1.69 | ) | | | (0.25 | ) | | | (0.29 | ) | | | (0.18 | ) | | | (0.21 | ) |
| $ | 33.72 | | | $ | 34.79 | | | $ | 30.70 | | | $ | 24.71 | | | $ | 21.47 | |
| | | | | | | | | | | | | | | | | | | |
| | 1.77 | % | | | 14.20 | % | | | 25.64 | % | | | 16.07 | % | | | 5.36 | % |
| | | | | | | | | | | | | | | | | | | |
| | | | | | | | | | | | | | | | | | | |
| $ | 141.96 | | | $ | 151.25 | | | $ | 143.48 | | | $ | 125.00 | | | $ | 123.97 | |
| | 1.20 | % | | | 1.28 | % | | | 1.33 | % | | | 1.40 | % | | | 1.38 | % |
| | 0.90 | % | | | 0.80 | % | | | 0.98 | % | | | 1.16 | % | | | 0.97 | % |
| | 85 | % | | | 85 | % | | | 91 | % | | | 111 | % | | | 149 | % |
The accompanying notes are an integral part of these financial statements.
| HENNESSY FUNDS | 1-800-966-4354 | |
Financial Statements
For an Institutional Class share outstanding throughout each period
| | | Six Months Ended | |
| | | April 30, 2016 | |
| | | (Unaudited) | |
| PER SHARE DATA: | | | |
| Net asset value, beginning of period | | $ | 33.82 | |
| | | | | |
| Income (loss) from investment operations: | | | | |
| Net investment income | | | 0.13 | |
| Net realized and unrealized gains (losses) on investments | | | (0.94 | ) |
| Total from investment operations | | | (0.81 | ) |
| | | | | |
| Less distributions: | | | | |
| Dividends from net investment income | | | (0.35 | ) |
| Dividends from net realized gains | | | (2.66 | ) |
| Total distributions | | | (3.01 | ) |
| Net asset value, end of period | | $ | 30.00 | |
| | | | | |
| TOTAL RETURN | | | (2.39 | )%(1) |
| | | | | |
| SUPPLEMENTAL DATA AND RATIOS: | | | | |
| Net assets, end of period (millions) | | $ | 1.37 | |
| Ratio of expenses to average net assets: | | | | |
| Before expense reimbursement | | | 1.25 | %(2) |
| After expense reimbursement | | | 1.25 | %(2) |
| Ratio of net investment income to average net assets: | | | | |
| Before expense reimbursement | | | 1.21 | %(2) |
| After expense reimbursement | | | 1.21 | %(2) |
Portfolio turnover rate(3) | | | 91 | %(1) |
(1) | Not annualized. |
(2) | Annualized. |
(3) | Portfolio turnover is calculated on the basis of the Fund as a whole. |
The accompanying notes are an integral part of these financial statements.
| Year Ended October 31, | |
| 2015 | | | 2014 | | | 2013 | | | 2012 | | | 2011 | |
| | | | | | | | | | | | | | |
| $ | 34.94 | | | $ | 30.83 | | | $ | 24.83 | | | $ | 21.56 | | | $ | 20.65 | |
| | | | | | | | | | | | | | | | | | | |
| | | | | | | | | | | | | | | | | | | |
| | 0.23 | | | | 0.34 | | | | 0.49 | | | | 0.39 | | | | 0.27 | |
| | 0.44 | | | | 4.11 | | | | 5.90 | | | | 3.15 | | | | 0.92 | |
| | 0.67 | | | | 4.45 | | | | 6.39 | | | | 3.54 | | | | 1.19 | |
| | | | | | | | | | | | | | | | | | | |
| | | | | | | | | | | | | | | | | | | |
| | (0.36 | ) | | | (0.34 | ) | | | (0.39 | ) | | | (0.27 | ) | | | (0.28 | ) |
| | (1.43 | ) | | | — | | | | — | | | | — | | | | — | |
| | (1.79 | ) | | | (0.34 | ) | | | (0.39 | ) | | | (0.27 | ) | | | (0.28 | ) |
| $ | 33.82 | | | $ | 34.94 | | | $ | 30.83 | | | $ | 24.83 | | | $ | 21.56 | |
| | | | | | | | | | | | | | | | | | | |
| | 1.89 | % | | | 14.55 | % | | | 26.08 | % | | | 16.58 | % | | | 5.76 | % |
| | | | | | | | | | | | | | | | | | | |
| | | | | | | | | | | | | | | | | | | |
| $ | 1.30 | | | $ | 0.40 | | | $ | 0.34 | | | $ | 0.06 | | | $ | 0.04 | |
| | | | | | | | | | | | | | | | | | | |
| | 1.18 | % | | | 1.18 | % | | | 1.14 | % | | | 1.22 | % | | | 1.21 | % |
| | 1.15 | % | | | 0.98 | % | | | 0.98 | % | | | 0.98 | % | | | 0.98 | % |
| | | | | | | | | | | | | | | | | | | |
| | 0.83 | % | | | 0.91 | % | | | 1.07 | % | | | 1.29 | % | | | 1.13 | % |
| | 0.86 | % | | | 1.11 | % | | | 1.23 | % | | | 1.53 | % | | | 1.36 | % |
| | 85 | % | | | 85 | % | | | 91 | % | | | 111 | % | | | 149 | % |
The accompanying notes are an integral part of these financial statements.
| HENNESSY FUNDS | 1-800-966-4354 | |
Financial Statements
Notes to the Financial Statements April 30, 2016 (Unaudited) |
1). ORGANIZATION
The Hennessy Large Value Fund (the “Fund”) is a series of Hennessy Funds Trust (the “Trust”), which was organized as a Delaware statutory trust on September 17, 1992. The Fund is an open-end management investment company registered under the Investment Company Act of 1940, as amended. The investment objective of the Fund is long-term growth of capital and current income. The Fund is a diversified fund.
The Fund offers Investor Class and Institutional Class shares. Each class of shares differs principally in its respective administration, 12b-1 distribution and service, shareholder servicing, and transfer agent expenses and sales charges, if any. Each class has identical rights to earnings, assets, and voting privileges, except for class-specific expenses and exclusive rights to vote on matters affecting only an individual class.
As an investment company, the Fund follows the investment company accounting and reporting guidance of the Financial Accounting Standards Board (“FASB”) Accounting Standard Codification Topic 946 “Financial Services—Investment Companies.”
2). SIGNIFICANT ACCOUNTING POLICIES
The following is a summary of significant accounting policies consistently followed by the Fund in the preparation of the financial statements. These policies are in conformity with U.S. generally accepted accounting principles (“GAAP”).
| a). | Investment Valuation – All investments in securities are recorded at their estimated fair value, as described in Note 3. |
| b). | Federal Income Taxes – Provision for federal income taxes or excise taxes has not been made since the Fund has elected to be taxed as a “regulated investment company” and intends to distribute substantially all of its taxable income to its shareholders and otherwise comply with the provisions of the Internal Revenue Code of 1986, as amended, applicable to regulated investment companies. Net investment income or loss and realized gains and losses for federal income tax purposes may differ from that reported on the financial statements because of temporary book and tax basis differences. Temporary differences are primarily the result of the treatment of wash sales for tax reporting purposes. The Fund recognizes interest and penalties related to income tax benefits, if any, in the statement of operations as an income tax expense. Distributions from net realized gains for book purposes may include short-term capital gains, which are included as ordinary income to shareholders for tax purposes. |
| c). | Income and Expenses – Dividend income is recognized on the ex-dividend date or as soon as information is available to the Fund. Interest income, which includes the amortization of premium and accretion of discount, is recognized on an accrual basis. The Fund is charged for those expenses that are directly attributable to the portfolio, such as advisory, administration, and certain shareholder service fees. Income, expenses (other than expenses attributable to a specific class), and realized and unrealized gains or losses on investments are allocated to each class of shares based on its respective net assets. |
| d). | Distributions to Shareholders – Dividends from net investment income for the Fund, if any, are declared and paid annually, usually in December. Distributions of net realized capital gains, if any, are declared and paid annually, usually in December. |
| e). | Security Transactions – Investment and shareholder transactions are recorded on the trade date. The Fund determines the gain or loss realized from the investment transactions by comparing the original cost of the security lot sold with the net sale proceeds. Discounts and premiums on securities purchased are accreted/amortized over the life of the respective security. |
| f). | Use of Estimates – The preparation of financial statements in conformity with GAAP requires management to make estimates and assumptions that affect the reported amounts of assets and liabilities and disclosure of contingent assets and liabilities at the date of the financial statements and the reported change in net assets during the reporting period. Actual results could differ from those estimates. |
| g). | Share Valuation – The net asset value (“NAV”) per share of the Fund is calculated by dividing the sum of the value of the securities held by the Fund, plus cash or other assets, minus all liabilities (including estimated accrued expenses) by the total number of shares outstanding for the Fund, rounded to the nearest cent. The Fund’s shares will not be priced on days the New York Stock Exchange is closed for trading. The offering and redemption price per share for the Fund is equal to the Fund’s NAV per share. |
| h). | Foreign Currency – Values of investments denominated in foreign currencies, if any, are converted into U.S. dollars using the spot market rate of exchange at the time of valuation. Purchases and sales of investments and income are translated into U.S. dollars using the spot market rate of exchange prevailing on the respective dates of such transactions. The Fund does not isolate the portion of the results of operations resulting from fluctuations in foreign exchange rates on investments from fluctuations resulting from changes in the market prices of securities held. Such fluctuations are included with the net realized and unrealized gain or loss on investments. Foreign investments present additional risks due to currency fluctuations, economic and political factors, lower liquidity, government regulations, differences in accounting standards, and other factors. |
| i). | Forward Contracts – The Fund may enter into forward currency contracts to reduce its exposure to changes in foreign currency exchange rates on its foreign holdings and to lock in the U.S. dollar cost of firm purchase and sale commitments for securities denominated in foreign currencies. A forward currency contract is a commitment to purchase or sell a foreign currency at a future date at a negotiated forward rate. The gain or loss arising from the difference between the U.S. dollar cost of the original contract and the value of the foreign currency in U.S. dollars upon closing of such contract is included in net realized gain or loss from foreign currency transactions. During the six months ended April 30, 2016, the Fund did not enter into any forward contracts. |
| j). | Repurchase Agreements – The Fund may enter into repurchase agreements with member banks or security dealers of the Federal Reserve Board whom the investment advisor deems creditworthy. The repurchase price generally equals the price paid by the Fund plus interest negotiated on the basis of current short-term rates. |
| | Securities pledged as collateral for repurchase agreements are held by the custodian bank until the respective agreements mature. Provisions of the repurchase agreements ensure that the market value of the collateral, including accrued interest thereon, is sufficient to cover the repurchase amount in the event of default of the counterparty. If the counterparty defaults and the value of the collateral declines or if the counterparty enters an insolvency proceeding, realization of the collateral by the Fund may be delayed or limited. |
| HENNESSY FUNDS | 1-800-966-4354 | |
| k). | Accounting for Uncertainty in Income Taxes – The Fund has accounting policies regarding recognition and measurement of tax positions taken or expected to be taken on a tax return. The tax returns of the Fund for the prior three fiscal years are open for examination. The Fund has reviewed all open tax years in major jurisdictions and concluded that there is no impact on the Fund’s net assets and no tax liability resulting from unrecognized tax benefits relating to uncertain income tax positions taken or expected to be taken on a tax return. The Fund’s major tax jurisdictions are U.S. federal and Delaware. |
| l). | Derivatives – The Fund may invest in, or enter into, derivatives, such as options, futures contracts, options on futures contracts, and swaps, for a variety of reasons, including to hedge certain risks, to provide a substitute for purchasing or selling particular securities, or to increase potential income gain. Derivatives are financial contracts based on an underlying or notional amount, require no initial investment or an initial net investment that is smaller than would normally be required to have a similar response to changes in market factors, and require or permit net settlement. Derivatives may allow the Fund to increase or decrease the level of risk to which the Fund is exposed more quickly and efficiently than transactions in other types of instruments. The main purpose of utilizing derivative instruments is for hedging purposes. |
| | The Fund follows the financial accounting reporting rules as required by the Derivatives and Hedging Topic of the FASB Accounting Standards Codification. Under such rules, the Fund is required to include enhanced disclosure that enables investors to understand how and why an entity uses derivatives, how derivatives are accounted for, and how derivatives instruments affect an entity’s results of operations and financial position. During the six months ended April 30, 2016, the Fund did not hold any derivative instruments. |
| m). | New Accounting Pronouncements – In May 2015, the FASB issued ASU No. 2015-07 “Disclosure for Investments in Certain Entities that Calculate Net Asset Value per Share (or Its Equivalent).” The amendments in ASU No. 2015-07 remove the requirement to categorize within the fair value hierarchy investments measured at NAV and require the disclosure of sufficient information to reconcile the fair value of the remaining assets categorized within the fair value hierarchy to the financial statements. The amendments in ASU No. 2015-07 are effective for fiscal years beginning after December 15, 2015, and interim periods within those fiscal years. Management has reviewed the requirements and believes the adoption of ASU 2015-07 will not have a material impact on the Fund’s financial statements and related disclosures. |
3). SECURITIES VALUATION
The Fund follows authoritative fair valuation accounting standards that establish an authoritative definition of fair value and set out a hierarchy for measuring fair value. These standards require additional disclosures about the various inputs and valuation techniques used to develop the measurements of fair value and a discussion in changes in valuation techniques and related inputs during the period. These inputs are summarized in the three broad levels listed below:
| | Level 1 – | Unadjusted, quoted prices in active markets for identical instruments that the Fund has the ability to access at the date of measurement. |
| | Level 2 – | Other significant observable inputs (including, but not limited to, quoted prices in active markets for similar instruments, quoted prices in markets that are not active for identical or similar instruments, and model-derived valuations in which all significant inputs and significant value drivers are |
| | | observable in active markets (such as interest rates, prepayment speeds, credit risk curves, default rates, and similar data)). |
| | Level 3 – | Significant unobservable inputs (including the Fund’s own assumptions about what market participants would use to price the asset or liability based on the best available information) when observable inputs are unavailable. |
Following is a description of the valuation techniques applied to the Fund’s major categories of assets and liabilities measured at fair value on a recurring basis.
Equity Securities – Equity securities, including common stocks, preferred stocks, foreign-issued common stocks, exchange-traded funds, closed-end mutual funds, partnerships, rights, and real estate investment trusts, that are traded on a securities exchange for which a last-quoted sales price is readily available will generally be valued at the last sales price as reported by the primary exchange on which the securities are listed. Securities listed on The NASDAQ Stock Market (“NASDAQ”) will generally be valued at the NASDAQ Official Closing Price, which may differ from the last sales price reported. Securities traded on a securities exchange for which a last-quoted sales price is not readily available will generally be valued at the mean between the bid and ask prices. To the extent these securities are actively traded and valuation adjustments are not applied, they are classified in Level 1 of the fair value hierarchy. Securities traded on foreign exchanges generally are not valued at the same time the Fund calculates its NAV because most foreign markets close well before such time. The earlier close of most foreign markets gives rise to the possibility that significant events, including broad market moves, may have occurred in the interim. In certain circumstances, it may be determined that a security needs to be fair valued because it appears that the value of the security might have been materially affected by events occurring after the close of the market in which the security is principally traded, but before the time the Fund calculates its NAV, such as by a development that affects an entire market or region (e.g., weather-related events) or a potentially global development (e.g., a terrorist attack that may be expected to have an effect on investor expectations worldwide).
Registered Investment Companies – Investments in registered investment companies (e.g., mutual funds) are generally priced at the ending NAV provided by the applicable registered investment company’s service agent and will be classified in Level 1 of the fair value hierarchy.
Debt Securities – Debt securities, including corporate bonds, asset-backed securities, mortgage-backed securities, municipal bonds, U.S. Treasuries, and U.S. government agency issues, are generally valued at market on the basis of valuations furnished by an independent pricing service that utilizes both dealer-supplied valuations and formula-based techniques. The pricing service may consider recently executed transactions in securities of the issuer or comparable issuers, market price quotations (where observable), bond spreads, and fundamental data relating to the issuer. In addition, the model may incorporate observable market data, such as reported sales of similar securities, broker quotes, yields, bids, offers, and reference data. Certain securities are valued primarily using dealer quotations. These securities are generally classified in Level 2 of the fair value hierarchy.
Short-Term Securities – Short-term equity investments, including money market funds, are valued in the manner specified above. Short-term debt investments with an original term to maturity of 60 days or less are valued at amortized cost, which approximates fair market value. If the original term to maturity of a short-term debt investment exceeded 60 days, then the values as of the 61st day prior to maturity are amortized. Amortized cost is not used if its use would be inappropriate due to credit or other impairments of the
| HENNESSY FUNDS | 1-800-966-4354 | |
issuer, in which case the security’s fair value would be determined, as described below. Short-term securities are generally classified in Level 1 or Level 2 of the fair market hierarchy depending on the inputs used and market activity levels for specific securities.
The Board of Trustees of the Fund (the “Board”) has adopted fair value pricing procedures that are followed when a price for a security is not readily available or if a significant event has occurred that indicates the closing price of a security no longer represents the true value of that security. Fair value pricing determinations are made in good faith in accordance with these procedures. There are numerous criteria that will be given consideration in determining a fair value of a security, such as the trading volume of a security and markets, the value of other like securities, and news events with direct bearing to a security or markets. Fair value pricing results in an estimated price for a security that reflects the amount the Fund might reasonably expect to receive in a current sale. Depending on the relative significance of the valuation inputs, these securities may be classified in either Level 2 or Level 3 of the fair value hierarchy.
The fair valuation of foreign securities may be determined with the assistance of a pricing service using correlations between the movement of prices of such securities and indices of domestic securities and other appropriate indicators, such as closing market prices of relevant American Depositary Receipts or futures contracts. The effect of using fair value pricing is that the Fund’s NAV will reflect the affected portfolio securities’ value as determined by the Board or its designee instead of being determined by the market. Using a fair value pricing methodology to price foreign securities may result in a value that is different from a foreign security’s most recent closing price and from the prices used by other investment companies to calculate their NAVs and are generally considered Level 2 prices in the fair valuation hierarchy. Because the Fund may invest in foreign securities, the value of the Fund’s portfolio securities may change on days when you will not be able to purchase or redeem your shares.
The Board has delegated day-to-day valuation matters to a Valuation Committee comprised of one or more representatives from Hennessy Advisors, Inc., the Fund’s investment advisor. The function of the Valuation Committee is to value securities where current and reliable market quotations are not readily available. All actions taken by the Valuation Committee are reviewed by the Board.
The Fund has performed an analysis of all existing investments to determine the significance and character of all inputs to their fair value determination. Various inputs are used in determining the value of the Fund’s investments. The inputs or methodology used for valuing securities are not necessarily an indication of the risk associated with investing in those securities. Details related to the fair valuation hierarchy of the Fund’s securities as of April 30, 2016, are included in the Fund’s Schedule of Investments.
4). INVESTMENT TRANSACTIONS
Purchases and sales of investment securities (excluding government and short-term investments) for the Fund during the six months ended April 30, 2016, were $60,195,627 and $64,716,916, respectively.
There were no purchases or sales/maturities of long-term U.S. government securities for the Fund during the six months ended April 30, 2016.
5). INVESTMENT MANAGEMENT FEE AND OTHER TRANSACTIONS WITH AFFILIATES
Hennessy Advisors, Inc. (the “Advisor”) is the investment advisor of the Fund. The Advisor provides the Fund with investment management services under an Investment Advisory Agreement. The Advisor furnishes all investment advice, office space, facilities, and provides most of the personnel needed by the Fund. As compensation for its services,
the Advisor is entitled to a monthly fee from the Fund. The fee is based upon the average daily net assets of the Fund at the annual rate of 0.85%. The net investment advisory fees payable by the Fund as of April 30, 2016, were $93,360.
The Advisor has delegated the day-to-day management of the Fund to a sub-advisor, RBC Global Asset Management (U.S.) Inc. The Advisor pays the sub-advisor fees for the Fund from its own assets and these fees are not an additional expense of the Fund.
In the past, the Advisor had agreed to waive its fees and absorb expenses to the extent that the total annual operating expenses exceeded 0.98% of the Fund’s net assets for the Institutional Class shares of the Fund (excluding all federal, state and local taxes, interest, brokerage commissions, acquired fund fees and expenses and other costs incurred in connection with the purchase and sale of securities and extraordinary items). The expense limitation agreement was terminated by the Board as of February 28, 2015.
For a period of three years after the year in which the Advisor waived or reimbursed expenses, the Advisor may seek reimbursement from the Fund to the extent that total annual fund operating expenses are less than the expense limitation that was in effect at the time the Advisor waived or reimbursed expenses. As of April 30, 2016, cumulative expenses subject to potential recovery under the aforementioned conditions were $153 for Institutional Class shares, of which $9 will expire on October 31, 2017, and $144 will expire on October 31, 2018.
The Board has approved a Shareholder Servicing Agreement for the Investor Class shares of the Fund, which was instituted to compensate the Advisor for the non-investment management services it provides to the Fund. The Shareholder Servicing Agreement provides for a monthly fee paid to the Advisor at an annual rate of 0.10% of the average daily net assets of the Fund attributable to Investor Class shares. Shareholder service fees payable by the Fund as of April 30, 2016, were $10,865.
The Fund has adopted a plan pursuant to Rule 12b-1 under the Investment Company Act of 1940, as amended, that authorizes payments in connection with the distribution of the Fund’s shares at an annual rate of up to 0.25% of the Fund’s average daily net assets attributable to Investor Class shares. Even though the authorized rate is up to 0.25%, the Fund has only used up to 0.15% of its average daily net assets attributable to Investor Class shares for such purpose since the plan was implemented on November 1, 2015. Amounts paid under the plan may be spent on any activities or expenses primarily intended to result in the sale of shares, including, but not limited to, advertising, shareholder account servicing, the printing and mailing of prospectuses to other than current shareholders, the printing and mailing of sales literature, and compensation for sales and marketing activities or to financial institutions and others, such as dealers and distributors.
The Fund has entered into agreements with various brokers, dealers, and financial intermediaries in connection with the sale of shares of the Fund. The agreements provide for periodic payments by the Fund to the brokers, dealers, and financial intermediaries for providing certain shareholder maintenance services (sub-transfer agent expenses). These shareholder services include the pre-processing and quality control of new accounts, shareholder correspondence, answering customer inquiries regarding account status, and facilitating shareholder telephone transactions. Fees paid by the Fund to various brokers, dealers, and financial intermediaries during the six months ended April 30, 2016, were $54,687.
U.S. Bancorp Fund Services, LLC (“USBFS”) provides the Fund with administrative, fund accounting, and transfer agent services, and necessary office equipment. As administrator, USBFS is responsible for activities such as (i) preparing various federal and
| HENNESSY FUNDS | 1-800-966-4354 | |
state regulatory filings, reports, and returns for the Fund, (ii) preparing reports and materials to be supplied to the Board, (iii) monitoring the activities of the Fund’s custodian, transfer agent, and accountants, and (iv) coordinating the preparation and payment of the Fund’s expenses and reviewing the Fund’s expense accruals. Fees paid to USBFS during the six months ended April 30, 2016, were $64,922.
U.S. Bank, N.A., an affiliate of USBFS, serves as the Fund’s custodian. Quasar Distributors, LLC acts as the Fund’s principal underwriter in a continuous public offering of the Fund’s shares. Quasar Distributors, LLC is an affiliate of USBFS and U.S. Bank, N.A.
6). LINE OF CREDIT
The Fund has an uncommitted line of credit with the other funds in the Hennessy Funds family of funds (the “Hennessy Funds”) in the amount of the lesser of (i) $100,000,000 or (ii) 33.33% of each Hennessy Fund’s net assets, or 30% for the Hennessy Gas Utility Fund and 10% for the Hennessy Balanced Fund, intended to provide short-term financing, if necessary, subject to certain restrictions, in connection with shareholder redemptions. The credit facility is with the Hennessy Funds’ custodian bank, U.S. Bank, N.A. Borrowings under this arrangement bear interest at the bank’s prime rate and are secured by all of the Fund’s assets (as to its own borrowings only). During the six months ended April 30, 2016, the Fund did not have any borrowings outstanding under the line of credit.
7). FEDERAL TAX INFORMATION
As of October 31, 2015, the Fund’s most recent fiscal year end, the components of accumulated earnings (losses) for income tax purposes were as follows:
| Cost of investments for tax purposes | | $ | 123,086,450 | |
| Gross tax unrealized appreciation | | $ | 26,647,958 | |
| Gross tax unrealized depreciation | | | (5,634,408 | ) |
| Net tax unrealized appreciation | | $ | 21,013,550 | |
| Undistributed ordinary income | | $ | 1,846,994 | |
| Undistributed long-term capital gains | | | 10,403,179 | |
| Total distributable earnings | | $ | 12,250,173 | |
| Other accumulated loss | | $ | — | |
| Total accumulated gain | | $ | 33,263,723 | |
The difference between book-basis unrealized appreciation/depreciation (as shown in the Statement of Assets and Liabilities) and tax-basis unrealized appreciation/depreciation (as shown above) is attributable primarily to wash sales.
At October 31, 2015, the Fund’s most recent fiscal year end, the Fund had no tax basis capital losses to offset future capital gains.
At October 31, 2015, the Fund’s most recent fiscal year end, the Fund did not defer, on a tax basis, any post-December late year ordinary loss deferrals.
The tax character of distributions paid during fiscal year 2016 (year to date) and fiscal year 2015 for the Fund were as follows:
| | | Six Months Ended | | | Year Ended | |
| | | April 30, 2016 | | | October 31, 2015 | |
| Ordinary income | | $ | 2,224,115 | | | $ | 1,228,256 | |
| Long-term capital gain | | | 10,403,214 | | | | 6,159,685 | |
| | | $ | 12,627,329 | | | $ | 7,387,941 | |
Expense Example (Unaudited)
April 30, 2016
As a shareholder of the Fund, you incur two types of costs: (1) transaction costs, including sales charges (loads) on purchase payments, reinvested dividends, or other distributions; redemption fees; and exchange fees; and (2) ongoing costs, including management fees; service fees; and other Fund expenses. This Example is intended to help you understand your ongoing costs (in dollars) of investing in the Fund and to compare these costs with the ongoing costs of investing in other mutual funds. The Example is based on an investment of $1,000 invested at the beginning of the period and held for the entire period from November 1, 2015 through April 30, 2016.
Actual Expenses
The first line of the table below under the “Investor Class” and “Institutional Class” headings provides information about actual account values and actual expenses. Although the Fund charges no sales loads or transaction fees, you will be assessed fees for outgoing wire transfers, returned checks and stop payment orders at prevailing rates charged by U.S. Bancorp Fund Services, LLC, the Fund’s transfer agent. If you request that a redemption be made by wire transfer, currently a $15.00 fee is charged by the Fund’s transfer agent. IRA accounts will be charged a $15.00 annual maintenance fee. The example below includes, but is not limited to, management fees, shareholder servicing fees, fund accounting, custody, and transfer agent fees. However, the example below does not include portfolio trading commissions and related expenses, and other extraordinary expenses as determined under generally accepted accounting principles. You may use the information in this line, together with the amount you invested, to estimate the expenses that you paid over the period. Simply divide your account value by $1,000 (for example, an $8,600 account value divided by $1,000 = 8.6), then multiply the result by the number in the first line of the table under the “Investor Class” and “Institutional Class” headings in the column entitled “Expenses Paid During Period” to estimate the expenses you paid on your account during this period.
Hypothetical Example for Comparison Purposes
The second line of the table below under the “Investor Class” and “Institutional Class” headings provides information about hypothetical account values and hypothetical expenses based on the Fund’s actual expense ratios and an assumed rate of return of 5% per year before expenses, which is not the Fund’s actual return. The hypothetical account values and expenses may not be used to estimate the actual ending account balance or expenses you paid for the period. You may use this information to compare the ongoing costs of investing in the Fund and other funds. To do so, compare this 5% hypothetical example with the 5% hypothetical examples that appear in the shareholder reports of the other funds. Please note that the expenses shown in the table are meant to highlight your ongoing costs only and do not reflect any transactional costs, such as sales charges (loads), or exchange fees. Therefore, the second line of the table under the “Investor Class” and “Institutional Class” headings is useful in comparing ongoing costs only, and will not help you determine the relative total costs of owning different funds. In addition, if these transactional costs were included, your costs would have been higher.
| HENNESSY FUNDS | 1-800-966-4354 | |
| | | | Expenses Paid |
| | Beginning | Ending | During Period(1) |
| | Account Value | Account Value | November 1, 2015 – |
| | November 1, 2015 | April 30, 2016 | April 30, 2016 |
| Investor Class | | | |
| Actual | $1,000.00 | $ 975.70 | $6.73 |
| Hypothetical (5% return | | | |
| before expenses) | $1,000.00 | $1,018.05 | $6.87 |
| | | | |
| Institutional Class | | | |
| Actual | $1,000.00 | $ 976.10 | $6.14 |
| Hypothetical (5% return | | | |
| before expenses) | $1,000.00 | $1,018.65 | $6.27 |
(1) | Expenses are equal to the Fund’s annualized expense ratio of 1.37% for Investor Class shares or 1.25% for Institutional Class shares, as applicable, multiplied by the average account value over the period, multiplied by 182/366 days (to reflect one-half year period). |
How to Obtain a Copy of the Fund’s
Proxy Voting Policy and Proxy Voting Records
A description of the policies and procedures the Fund uses to determine how to vote proxies relating to portfolio securities is available without charge: (1) by calling 1-800-966-4354; (2) on the Hennessy Funds’ website at hennessyfunds.com/proxy-voting/policy.fs; or (3) on the U.S. Securities and Exchange Commission’s website at www.sec.gov. The Fund’s proxy voting record is available without charge on both the Hennessy Funds’ website at hennessyfunds.com/proxy-voting/policy.fs and the SEC’s website at www.sec.gov no later than August 31 for the prior 12 months ending June 30.
Quarterly Filings on Form N-Q
The Fund files its complete schedule of portfolio holdings with the SEC for the first and third quarters of each fiscal year on Form N-Q. The Fund’s Form N-Q will be available on the SEC’s website at www.sec.gov. The Fund’s Form N-Q may be reviewed and copied at the SEC’s Public Reference Room in Washington, DC and information on the operation of the Public Reference Room may be obtained by calling 1-800-SEC-0330. Information included in the Fund’s N-Q will also be available upon request by calling 1-800-966-4354.
Federal Tax Distribution Information
(Unaudited)
For the fiscal year ended October 31, 2015, certain dividends paid by the Fund may be subject to a maximum tax rate of 23.8%, as provided for by the Jobs and Growth Tax Relief Reconciliation Act of 2003. The percentage of dividends declared from ordinary income designated as qualified dividend income was 100.00%.
For corporate shareholders, the percent of ordinary income distributions that qualified for the corporate dividends received deduction for the fiscal year ended October 31, 2015 was 100.00%.
The percentage of taxable ordinary income distributions that are designated as short-term capital gain distributions under Section 871(k)(2)(C) of the Internal Revenue Code of 1986, as amended, for the Fund was 0.00%.
Householding
To help keep the Fund’s costs as low as possible, we generally deliver a single copy of most financial reports and prospectuses to shareholders who share an address, even if the accounts are registered under different names. This process, known as “householding,” does not apply to account statements. You may, of course, request an individual copy of a prospectus or financial report at any time. If you would like to receive separate mailings, please call the Administrator at 1-800-261-6950 or 1-414-765-4124 and we will begin individual delivery within 30 days of your request. If your account is held through a financial institution or other intermediary, please contact them directly to request individual delivery.
| HENNESSY FUNDS | 1-800-966-4354 | |
Board Approval of Investment Advisory
Agreements
At its meeting on March 9, 2016, the Board of Trustees of the Fund (the “Board,” and the members thereof, the “Trustees”) unanimously approved the continuation of the investment advisory agreement of the Fund with Hennessy Advisors, Inc. (the “Advisor”) and the sub-advisory agreement of the Fund between the Advisor and RBC Global Asset Management (U.S.) Inc. (the “Sub-Advisor”). As part of the process of approving the continuation of the advisory and sub-advisory agreements, the Trustees reviewed their fiduciary duties with respect to approving the advisory and sub-advisory agreements and the relevant factors for them to consider. In addition, the Trustees who are not deemed “interested persons” (as that term is defined by the Investment Company Act of 1940) of the Fund (the “Independent Trustees”) met in executive session to discuss the approval of the advisory and sub-advisory agreements.
In advance of the meeting, the Advisor sent detailed information to the Trustees to assist them in their evaluation of the advisory and sub-advisory agreements. This information included, but was not limited to, (i) a memorandum from outside legal counsel that described the fiduciary duties of the Board with respect to approving the continuation of the advisory and sub-advisory agreements and the relevant factors for consideration, (ii) a memorandum from the Advisor that listed the factors relevant to the Board’s approval of the continuation of the advisory and sub-advisory agreements and also referenced the documents that had been provided to help the Board assess each such factor, (iii) an inventory of the range of services provided by the Advisor and the Sub-Advisor for the Fund, (iv) a written discussion of economies of scale, (v) the advisory and sub-advisory agreements, (vi) a recent Fund fact sheet, (vii) a peer expense comparison, (viii) performance information, (ix) the Advisor’s most recent Form 10-K and Form 10-Q, which included information about the Advisor’s profitability, (x) information about brokerage commissions, (xi) information about the Fund’s compliance program, (xii) the Advisor’s current Form ADV Part I, (xiii) a completed questionnaire from the Sub-Advisor and summary thereof, (xiv) the Sub-Advisor’s Code of Ethics, and (xv) the Sub-Advisor’s Form ADV Parts I and II, and (xvi) other information the Trustees believed was useful in evaluating the approval of the continuation of the advisory and sub-advisory agreements.
All of the factors discussed by the Trustees were considered as a whole, and were considered separately by the Independent Trustees, meeting in executive session. The factors were viewed in their totality by the Trustees, with no single factor being the principal or determinative factor in the Trustees’ determination of whether to approve the continuation of the advisory and sub-advisory agreements. The Trustees recognized that the management and fee arrangements for the Fund are the result of years of review and discussion between the Independent Trustees and the Advisor, that certain aspects of such arrangements may receive greater scrutiny in some years than in others, and that the Trustees’ conclusions may be based, in part, on their consideration of these same arrangements and information received during the course of the year and in prior years.
Prior to approving the continuation of the advisory and sub-advisory agreements, the Trustees and the Independent Trustees in executive session considered, among other items:
| | • | The nature and quality of the advisory services provided by the Advisor and the Sub-Advisor. |
| | • | A comparison of the fees and expenses of the Fund to other similar funds. |
| | • | Whether economies of scale are recognized by the Fund. |
| | • | The costs and profitability of the Fund to the Advisor and the Sub-Advisor. |
| | • | The performance of the Fund. |
| | • | The other benefits to the Advisor and the Sub-Advisor from serving as an investment advisor to the Fund (in addition to the advisory and sub-advisory fees). |
The material considerations and determinations of the Board of Trustees, including all of the Independent Trustees, are as follows:
| | • | The Board considered the services identified below that are provided by the Advisor. Based on this review, the Trustees believe that the Advisor provides high-quality services to the Fund, and they noted that their overall confidence in the Advisor is high. The Trustees also concluded that they were satisfied with the nature, extent, and quality of the advisory services provided to the Fund by the Advisor, and that the nature and extent of the services provided by the Advisor are appropriate to assure that the Fund’s operations are conducted in compliance with applicable laws, rules, and regulations. |
| | | • | The Advisor oversees the Sub-Advisor for the Fund and the Sub-Advisor acts as the portfolio manager for the Fund. |
| | | • | The Advisor performs a daily reconciliation of portfolio positions and cash for the Fund. |
| | | • | The Advisor monitors the Fund’s compliance with its investment objectives and restrictions. |
| | | • | The Advisor monitors compliance with federal securities laws and performs activities such as maintaining a compliance program, conducting ongoing reviews of the compliance programs of the Sub-Advisor and the Fund’s other service providers, conducting on-site visits to the Sub-Advisor and the Fund’s other service providers, monitoring incidents of abusive trading practices, reviewing Fund expense accruals, payments, and fixed expense ratios, evaluating insurance providers for fidelity bond coverage and D&O/E&O insurance coverage, conducting employee compliance training, reviewing reports provided by service providers, maintaining books and records, and preparing an annual compliance report to the Board. |
| | | • | The Advisor oversees the selection and continued employment of the Sub-Advisor, monitors the Sub-Advisor’s adherence to the Fund’s investment objectives, policies, and restrictions, and reviews the Fund’s investment performance. |
| | | • | The Advisor oversees service providers that provide accounting, administration, distribution, transfer agency, custodial, sales and marketing, public relations, audit, information technology, and legal services to the Fund. |
| | | • | The Advisor maintains in-house marketing and distribution departments on behalf of the Fund. |
| | | • | The Advisor is actively involved with preparing regulatory filings for the Fund, including writing and annually updating the Fund’s prospectus and related documents. |
| | | • | The Advisor reviews the written summary prepared by the Sub-Advisor of the Fund’s performance for the most recent six-month period or twelve-month period, as applicable, for each semi-annual and annual report of the Fund. |
| | | • | The Advisor oversees distribution of the Fund through third-party broker/dealers and independent financial institutions such as Charles Schwab, Inc., Fidelity, TD Waterhouse, and Pershing. The Advisor participates in “no |
| HENNESSY FUNDS | 1-800-966-4354 | |
| | | | transaction fee” (“NTF”) programs with these companies on behalf of the Fund, which allow customers to purchase the Fund through third-party distribution channels without paying a transaction fee. The Advisor compensates, in part, a number of these third-party providers of NTF programs out of its own revenues. |
| | | • | The Advisor pays the incentive compensation of the Fund’s compliance officers and employs other staff, such as management executives, legal personnel, marketing personnel, national accounts and distribution personnel, sales personnel, administrative personnel, and trading oversight personnel. |
| | | • | The Advisor provides a quarterly compliance certification to the Board. |
| | | • | The Advisor prepares or reviews Board materials, frequently presents to the Board or leads Board discussions, prepares or reviews meeting minutes, and arranges for Board training and education. |
| | • | The Board considered the services identified below that are provided by the Sub-Advisor: |
| | | • | The Sub-Advisor acts as the portfolio manager for the Fund. In this capacity, the Sub-Advisor does the following: |
| | | | • | manages the composition of the Fund’s portfolio, including the purchase, retention, and disposition of portfolio securities in accordance with the Fund’s investment objectives, policies, and restrictions; |
| | | | • | ensures compliance with “best execution” for the Fund’s portfolio; |
| | | | • | manages the use of soft dollars for the Fund; and |
| | | | • | manages proxy voting for the Fund. |
| | | • | The Sub-Advisor ensures that its compliance program includes policies and procedures relevant to the Fund and the Sub-Advisor’s duties as a portfolio manager to the Fund. |
| | | • | The Sub-Advisor prepares a written summary of the Fund’s performance for the most recent six-month period or twelve-month period, as applicable, for each semi-annual and annual report of the Fund. |
| | | • | The Sub-Advisor provides a quarterly compliance certification to the Board regarding trading and allocation practices, supervisory matters, the Sub-Advisor’s compliance program (including its code of ethics), compliance with the Fund’s policies, and general firm updates. |
| | • | The Board considered the distinction between the services performed by the Advisor and the Sub-Advisor. It noted that the management of the Fund, including the oversight of the Sub-Advisor, involves more comprehensive and substantive duties than the duties of the Sub-Advisor. Specifically, the Board considered the lists of services identified above and concluded that the services performed by the Advisor for the Fund require a higher level of service and oversight than the services performed by the Sub-Advisor. Based on this determination, the Board concluded that the differential in advisory fees between the Advisor and the Sub-Advisor is reasonable. |
| | • | The Board compared the performance of the Fund to benchmark indices over various periods of time and they noted that at each quarterly meeting, the Trustees review reports comparing the investment performance of the Fund to various indices. Based on the information provided at the meeting and the information and quarterly discussions regarding the Fund’s investment performance, the Trustees believe that the Advisor and the Sub-Advisor manage the Fund in a |
| | | manner that is materially consistent with its stated investment objective and style. The Trustees concluded that the performance of the Fund over various time horizons warranted the continuation of the advisory and sub-advisory agreements. |
| | • | The Board reviewed the advisory fees and overall expense ratios of the Fund and comparable funds using data from Morningstar with respect to funds similar in asset size and investment objective to the Fund. As part of the discussion with management, the Trustees ensured that they understood and were comfortable with the criteria used to determine the mutual funds included in the Morningstar categories for purposes of the materials considered at the meeting. The Board determined that the advisory fee and overall expense ratio of the Fund falls within the range of the advisory fees and overall expense ratios of other comparable funds and concluded that they are reasonable and warranted continuation of the advisory and sub-advisory agreements. |
| | • | The Board also considered whether economies of scale were being realized by the Advisor that should be shared with the Fund’s shareholders. The Trustees noted that many of the expenses incurred to manage the Fund are asset-based fees and thus do not result in material economies of scale being realized as the net assets of the Fund increase. For example, intermediary service fees increase as the Fund’s assets grow. The Trustees also considered the Advisor’s efforts to contain expenses, and took into account the Advisor’s significant marketing efforts to increase Fund assets. The Board noted that at current asset levels it did not appear that there were economies of scale being realized by the Advisor and concluded that it would continue to monitor economies of scale in the future as circumstances changed. |
| | • | The Board considered the profitability of the Advisor and the Sub-Advisor, including the impact of intermediary service fees on the Advisor’s profitability, and also considered the resources and revenues that the Advisor has put into managing and distributing the Fund. The Board then concluded that the profits of the Advisor and the Sub-Advisor are reasonable and not excessive when compared to profitability guidelines set forth in relevant court cases. |
| | • | The Board considered the high level of professionalism and knowledge of the Advisor’s employees, along with a very low level of turnover, and concluded that this was beneficial to the Fund and its shareholders. |
| | • | The Board considered other benefits to the Advisor and the Sub-Advisor from serving as an advisor to the Fund (in addition to the advisory fee or sub-advisory fee). The Board noted that the Advisor and the Sub-Advisor may derive ancillary benefits from, by way of example, its association with the Fund in the form of proprietary and third-party research products and services received from broker dealers that execute portfolio trades for the Fund. The Board determined that any such products and services have been used for legitimate purposes relating to the Fund by providing assistance in the investment decision-making process. The Trustees concluded that the other benefits realized by the Advisor and the Sub-Advisor from their relationship with the Fund were reasonable. |
After reviewing the materials provided at the meeting and management’s presentation, as well as other information regularly provided at the Board’s quarterly meetings throughout the year regarding the quality of services provided by the Advisor and the Sub-Advisor, the performance of the Fund, expense information, regulatory compliance issues, trading information and related matters, and other factors deemed relevant by the Board, the Trustees, including all of the Independent Trustees, approved the continuation of the advisory and sub-advisory agreements.
| HENNESSY FUNDS | 1-800-966-4354 | |
For information, questions or assistance, please call
The Hennessy Funds
1-800-966-4354 or 1-415-899-1555
INVESTMENT ADVISOR
Hennessy Advisors, Inc.
7250 Redwood Blvd., Suite 200
Novato, California 94945
ADMINISTRATOR,
TRANSFER AGENT,
DIVIDEND PAYING AGENT &
SHAREHOLDER SERVICING AGENT
U.S. Bancorp Fund Services, LLC
P.O. Box 701
Milwaukee, Wisconsin 53201-0701
CUSTODIAN
U.S. Bank N.A.
Custody Operations
1555 North River Center Dr., Suite 302
Milwaukee, Wisconsin 53212
TRUSTEES
Neil J. Hennessy
Robert T. Doyle
J. Dennis DeSousa
Gerald P. Richardson
COUNSEL
Foley & Lardner LLP
777 East Wisconsin Avenue
Milwaukee, Wisconsin 53202-5306
INDEPENDENT REGISTERED
PUBLIC ACCOUNTING FIRM
KPMG LLP
777 East Wisconsin Avenue
Milwaukee, Wisconsin 53202-5306
DISTRIBUTOR
Quasar Distributors, LLC
615 East Michigan Street
Milwaukee, Wisconsin 53202
hennessyfunds.com | 1-800-966-4354
This report has been prepared for shareholders and may be distributed to
others only if preceded or accompanied by a current prospectus.
SEMI-ANNUAL REPORT
APRIL 30, 2016
HENNESSY TOTAL RETURN FUND
Investor Class HDOGX
hennessyfunds.com | 1-800-966-4354
(This Page Intentionally Left Blank.)
Contents
| Letter to Shareholders | 2 |
| Performance Overview | 4 |
| Financial Statements | |
| Schedule of Investments | 6 |
| Statement of Assets and Liabilities | 10 |
| Statement of Operations | 11 |
| Statements of Changes in Net Assets | 12 |
| Statement of Cash Flows | 13 |
| Financial Highlights | 14 |
| Notes to the Financial Statements | 16 |
| Expense Example | 23 |
| Proxy Voting | 24 |
| Quarterly Filings on Form N-Q | 24 |
| Federal Tax Distribution Information | 24 |
| Householding | 24 |
| Board Approval of Investment Advisory Agreement | 25 |
| HENNESSY FUNDS | 1-800-966-4354 | |
June 2016
Dear Hennessy Funds Shareholder:
I used to tell my kids, “What doesn’t kill you makes you stronger.” Perhaps that is not the best analogy for investing, but in the face of such roller coaster volatility in the financial markets, it seems to me that what hasn’t killed this bull market rally may just make it stronger. The financial markets brought us flat to modest returns during the six months ended April 30, 2016, with the S&P 500 Index returning 0.43% and the Dow Jones Industrial Average (DJIA) returning 1.98% during the period. These six months were marked by high volatility, the onslaught of more and more regulatory hurdles, the Fed stuck in neutral, fears about the global economy, and wild political rhetoric — all headwinds that I believe could have significantly stalled any positive moves in the market, but didn’t. Even the aggressive pull back in January showed just how skittish the market can be, and yet again the markets showed great resiliency and marched right back.
I continue to be impressed with the persistence of the bull market in U.S. equities, now in its seventh year. Many commentators believe that the U.S. economy is due for a recession, and the market is due for a downturn. However, we find ourselves comparing today’s secular market to the bull run of 1982 to 2000, which was powered by a significant increase in valuations. On March 9th of this year, I took a moment to remember how we all felt seven years ago on March 9, 2009, at the bottom of the financial crisis downturn that had wiped out trillions of dollars’ worth of U.S. equities. I explained to our investors then, and I say the same thing today, I believe that if you invest in quality companies with good fundamentals, over the long term, you should do fine.
If history is any kind of guide, then I think this bull market has some room to run. Rising markets usually fall when there is extreme optimism or euphoria. I haven’t witnessed any of that as of yet. The volatility has unnerved many, but I encourage investors to try to remain focused on investment fundamentals. Many U.S. companies continue to find ways to make a profit and build their already strong balance sheets. Unemployment is low, and wages are rising in real terms, supporting consumer confidence and consumption. With an average price-to-sales ratio of only 1.7x and a dividend yield of approximately 2.5% for the Dow, I believe U.S. equities continue to be attractive. In my opinion, there are many compelling reasons why this market can continue to climb even higher.
The next six months may be fraught with more talk about what the Fed will do, who the next President of the United States will be, and what is happening in China and around the globe. Businesses in every industry, including the asset management business, have concerns about increasing regulatory burdens, taxes, and higher healthcare costs. But, I still believe the ingenuity and perseverance of American business will find ways to endure and to thrive.
Thank you for your continued confidence and investment in our products. If you have any questions or would like to speak with us directly, please don’t hesitate to call us at (800) 966-4354.
Best regards,
Neil J. Hennessy
President and Chief Investment Officer
Past performance does not guarantee future results.
Mutual fund investing involves risk. Principal loss is possible.
Opinions expressed are those of Neil Hennessy and are subject to change, are not guaranteed and should not be considered investment advice.
Price-to-sales ratio is a tool for calculating a stock’s valuation relative to other companies. It is calculated by dividing a stock’s current price by its revenue per share. Dividend yield is calculated as the annual dividends paid by a company divided by its market price per share.
The Dow Jones Industrial Average and S&P 500 Index are unmanaged indices commonly used to measure the performance of U.S. stocks. One cannot invest directly in an index.
| HENNESSY FUNDS | 1-800-966-4354 | |
Performance Overview (Unaudited)
AVERAGE ANNUAL TOTAL RETURN FOR PERIODS ENDED APRIL 30, 2016
| | Six | One | Five | Ten |
| | Months(1) | Year | Years | Years |
| Hennessy Total Return Fund (HDOGX) | 5.54% | 4.51% | 8.06% | 5.34% |
75/25 Blended DJIA/Treasury Index(2) | 1.60% | 1.91% | 7.22% | 5.96% |
| Dow Jones Industrial Average | 1.98% | 2.25% | 9.52% | 7.34% |
Expense ratio: 1.28%
Performance data quoted represents past performance; past performance does not guarantee future results. The investment return and principal value of an investment will fluctuate so that an investor’s shares, when redeemed, may be worth more or less than their original cost. The performance table does not reflect the deduction of taxes that a shareholder would pay on Fund distributions or the redemption of Fund shares. Current performance of the Fund may be lower or higher than the performance quoted. Performance data current to the most recent month end may be obtained by visiting hennessyfunds.com.
The expense ratio presented is from the most recent prospectus.
(1) | Periods less than one year are not annualized. |
(2) | The 75/25 Blended DJIA/Treasury Index consists of 75% common stocks represented by the Dow Jones Industrial Average and 25% short-duration Treasury securities represented by the BofA Merrill Lynch 90-day U.S. Treasury Bill Index. |
PERFORMANCE NARRATIVE
Portfolio Managers Neil J. Hennessy and Brian E. Peery
Performance:
For the six-month period ended April 30, 2016, the Hennessy Total Return Fund returned 5.54%, outperforming both the 75/25 Blended DJIA/Treasury Index* and the Dow Jones Industrial Average, which returned 1.60% and 1.98% for the same period, respectively.
The Fund outperformed its primary benchmark, the 75/25 Blended DJIA/Treasury Index,* as a result of both sector allocation and stock selection. Two of the largest contributors to the Fund’s relative outperformance were McDonald’s Corporation and General Electric Company, both of which were overweight in the portfolio compared to the benchmark. Pfizer, Inc., which is also overweight versus the benchmark, was the largest detractor to overall performance. From a sector perspective, an overweight position in the Energy sector as oil prices rebounded, and an underweight position in the Financials sector, also aided performance. The Fund continues to hold General Electric, McDonald’s and Pfizer.
Good returns from the equity investments in the portfolio more than offset a negative relative contribution from the Government Securities portion of the portfolio.
Portfolio Strategy:
The Fund invests approximately 75% of its assets in the “Dogs of the Dow,” the 10 highest dividend yielding Dow stocks, and 25% of its assets in U.S. Treasuries. As a result of this “blended” strategy, the Fund may be expected to underperform equities in periods when markets rise and outperform in periods when markets fall. The Fund is designed to allow investors to gain exposure to the equity market while maintaining a percentage of their investment in fixed income securities. We believe the Fund is well positioned for the more
conservative investor, as the equity portion of the portfolio is invested in what we would deem to be high-quality companies, each with a historically high dividend yield. The relatively short duration of the 25% weighting of U.S. Treasuries in the portfolio (all less than one year) may allow us the ability to roll into higher yielding Treasuries in the event yields rise.
Market Outlook:
Over the six-month period ended April 30, 2016, U.S. equities, as measured by the S&P 500 Index, produced an essentially flat return. The period was, however, once again marked by a great deal of volatility, with major market indices dropping more than 10% at one point early in the year before recovering all of their losses. Throughout this period, there have been concerns about interest rates, commodity prices, economic growth (both domestic and international) and the U.S. Presidential election. Many, if not all, of these concerns still exist in the marketplace today, but we have reasons to be hopeful for the remainder of the year.
We believe the basic fundamentals of the market are attractive, and we continue to be optimistic about the possibility of further moderate market advances over the course of the year. We do not believe stocks are expensive at this point, though many are probably fairly valued. The Dow Jones Industrial Average and the S&P 500 Index have forward PE ratios of 16.5x and 17x, respectively, close to long-term averages. Corporate balance sheets appear to be in excellent shape, and while executives have shown some reluctance to increase capital spending beyond maintenance levels this cycle, we believe companies outside of the Energy sector will eventually start investing for expansion.
| * | The 75/25 Blended DJIA/Treasury Index consists of 75% common stocks represented by the Dow Jones Industrial Average and 25% short-duration Treasury securities represented by the BofA Merrill Lynch 90-day U.S. Treasury Bill Index. |
Opinions expressed are those of the Portfolio Managers as of the date written and are subject to change, are not guaranteed, and should not be considered investment advice or an indication of trading intent.
The S&P 500 Index and Dow Jones Industrial Average are unmanaged indices commonly used to measure the performance of U.S. stocks. The BofA Merrill Lynch 90-day U.S. Treasury Bill Index is an unmanaged index of Treasury securities maturing in 90 days. One cannot invest directly in an index.
The Fund is non-diversified, meaning it may concentrate its assets in fewer individual holdings than a diversified fund, making it more exposed to individual stock volatility than a diversified fund. The Fund’s formula-based strategy may cause the Fund to buy or sell securities at times when it may not be advantageous.
References to specific securities should not be considered a recommendation to buy or sell any security. Fund holdings and sector allocations are subject to change. Please refer to the Schedule of Investments included in this report for additional portfolio information.
Dividend yield is calculated as the annual dividends paid by a company divided by its market price per share. PE, or price to earnings, is calculated by dividing a company’s market price per share by its earnings per share.
| HENNESSY FUNDS | 1-800-966-4354 | |
Financial Statements
Schedule of Investments as of April 30, 2016 (Unaudited) |
HENNESSY TOTAL RETURN FUND
(% of Net Assets)
| TOP TEN HOLDINGS | % NET ASSETS |
| U.S. Treasury Bill, 0.300%, 06/23/2016 | 24.55% |
| U.S. Treasury Bill, 0.220%, 07/21/2016 | 23.19% |
| U.S. Treasury Bill, 0.175%, 05/19/2016 | 17.73% |
| Chevron Corp. | 7.35% |
| Exxon Mobil Corp. | 7.21% |
| Verizon Communications, Inc. | 7.00% |
| Caterpillar, Inc. | 6.97% |
| International Business Machines Corp. | 6.45% |
| Pfizer, Inc. | 6.35% |
| Merck & Co., Inc. | 6.28% |
Note: For presentation purposes, the Fund has grouped some of the industry categories. For purposes of categorizing securities for compliance with Section 8(b)(1) of the Investment Company Act of 1940, as amended, the Fund uses more specific industry classifications.
| | COMMON STOCKS – 69.72% | | Number | | | | | | % of | |
| | | | of Shares | | | Value | | | Net Assets | |
| | Consumer Discretionary – 2.28% | | | | | | | | | |
| | McDonald’s Corp. | | | 13,200 | | | $ | 1,669,668 | | | | 2.28 | % |
| | | | | | | | | | | | | | |
| | Consumer Staples – 9.93% | | | | | | | | | | | | |
| | Procter & Gamble Co. | | | 52,600 | | | | 4,214,312 | | | | 5.75 | % |
| | The Coca-Cola Co. | | | 4,600 | | | | 206,080 | | | | 0.28 | % |
| | Wal-Mart Stores, Inc. | | | 42,700 | | | | 2,855,349 | | | | 3.90 | % |
| | | | | | | | | 7,275,741 | | | | 9.93 | % |
| | | | | | | | | | | | | | |
| �� | Energy – 14.56% | | | | | | | | | | | | |
| | Chevron Corp. | | | 52,700 | | | | 5,384,886 | | | | 7.35 | % |
| | Exxon Mobil Corp. | | | 59,800 | | | | 5,286,320 | | | | 7.21 | % |
| | | | | | | | | 10,671,206 | | | | 14.56 | % |
| | | | | | | | | | | | | | |
| | Health Care – 12.63% | | | | | | | | | | | | |
| | Merck & Co., Inc. | | | 84,000 | | | | 4,606,560 | | | | 6.28 | % |
| | Pfizer, Inc. | | | 142,300 | | | | 4,654,633 | | | | 6.35 | % |
| | | | | | | | | 9,261,193 | | | | 12.63 | % |
| | | | | | | | | | | | | | |
| | Industrials – 12.74% | | | | | | | | | | | | |
| | Caterpillar, Inc. | | | 65,700 | | | | 5,106,204 | | | | 6.97 | % |
| | General Electric Co. | | | 109,200 | | | | 3,357,900 | | | | 4.58 | % |
| | The Boeing Co. | | | 6,500 | | | | 876,200 | | | | 1.19 | % |
| | | | | | | | | 9,340,304 | | | | 12.74 | % |
| | | | | | | | | | | | | | |
| | Information Technology – 10.27% | | | | | | | | | | | | |
| | Cisco Systems, Inc. | | | 66,000 | | | | 1,814,340 | | | | 2.48 | % |
| | Intel Corp. | | | 32,500 | | | | 984,100 | | | | 1.34 | % |
| | International Business Machines Corp. | | | 32,400 | | | | 4,728,456 | | | | 6.45 | % |
| | | | | | | | | 7,526,896 | | | | 10.27 | % |
| | | | | | | | | | | | | | |
| | Materials – 0.31% | | | | | | | | | | | | |
| | E.I. du Pont de Nemours & Co. | | | 3,400 | | | | 224,094 | | | | 0.31 | % |
| | | | | | | | | | | | | | |
| | Telecommunication Services – 7.00% | | | | | | | | | | | | |
| | Verizon Communications, Inc. | | | 100,800 | | | | 5,134,752 | | | | 7.00 | % |
| | | | | | | | | | | | | | |
| | Total Common Stocks | | | | | | | | | | | | |
| | (Cost $44,552,909) | | | | | | | 51,103,854 | | | | 69.72 | % |
The accompanying notes are an integral part of these financial statements.
| HENNESSY FUNDS | 1-800-966-4354 | |
| | SHORT-TERM INVESTMENTS – 76.15% | | Number of Shares/ | | | | | | % of | |
| | | | Par Amount | | | Value | | | Net Assets | |
| | Money Market Funds – 10.68% | | | | | | | | | |
| | Federated Government Obligations Fund, Class I, 0.21% (a) | | | 3,568,000 | | | $ | 3,568,000 | | | | 4.87 | % |
| | Federated Treasury Obligations Fund, 0.17% (a) | | | 694,866 | | | | 694,866 | | | | 0.95 | % |
| | Fidelity Government Portfolio, | | | | | | | | | | | | |
| | Institutional Class, 0.23% (a) | | | 3,568,000 | | | | 3,568,000 | | | | 4.86 | % |
| | | | | | | | | 7,830,866 | | | | 10.68 | % |
| | | | | | | | | | | | | | |
| | U.S. Treasury Bills (c) – 65.47% | | | | | | | | | | | | |
| | 0.175%, 05/19/2016 (b) | | | 13,000,000 | | | | 12,998,094 | | | | 17.73 | % |
| | 0.300%, 06/23/2016 (b) | | | 18,000,000 | | | | 17,992,580 | | | | 24.55 | % |
| | 0.220%, 07/21/2016 (b) | | | 17,000,000 | | | | 16,993,081 | | | | 23.19 | % |
| | | | | | | | | 47,983,755 | | | | 65.47 | % |
| | Total Short-Term Investments | | | | | | | | | | | | |
| | (Cost $55,813,687) | | | | | | | 55,814,621 | | | | 76.15 | % |
| | | | | | | | | | | | | | |
| | Total Investments | | | | | | | | | | | | |
| | (Cost $100,366,596) – 145.87% | | | | | | | 106,918,475 | | | | 145.87 | % |
| | | | | | | | | | | | | | |
| | Liabilities in Excess | | | | | | | | | | | | |
| | of Other Assets – (45.87)% | | | | | | | (33,621,117 | ) | | | (45.87 | )% |
| | | | | | | | | | | | | | |
| | TOTAL NET ASSETS – 100.00% | | | | | | $ | 73,297,358 | | | | 100.00 | % |
Percentages are stated as a percent of net assets.
| (a) | The rate listed is the fund’s 7-day yield as of April 30, 2016. |
| (b) | The rate listed is discount rate at issue. |
| (c) | Collateral or partial collateral for securities sold subject to repurchase. |
The accompanying notes are an integral part of these financial statements.
Summary of Fair Value Exposure at April 30, 2016
The following is a summary of the inputs used to value the Fund’s net assets as of April 30, 2016 (See Note 3 in the accompanying notes to the financial statements):
| Common Stocks | | Level 1 | | | Level 2 | | | Level 3 | | | Total | |
| Consumer Discretionary | | $ | 1,669,668 | | | $ | — | | | $ | — | | | $ | 1,669,668 | |
| Consumer Staples | | | 7,275,741 | | | | — | | | | — | | | | 7,275,741 | |
| Energy | | | 10,671,206 | | | | — | | | | — | | | | 10,671,206 | |
| Health Care | | | 9,261,193 | | | | — | | | | — | | | | 9,261,193 | |
| Industrials | | | 9,340,304 | | | | — | | | | — | | | | 9,340,304 | |
| Information Technology | | | 7,526,896 | | | | — | | | | — | | | | 7,526,896 | |
| Materials | | | 224,094 | | | | — | | | | — | | | | 224,094 | |
| Telecommunication Services | | | 5,134,752 | | | | — | | | | — | | | | 5,134,752 | |
| Total Common Stocks | | $ | 51,103,854 | | | $ | — | | | $ | — | | | $ | 51,103,854 | |
| Short-Term Investments | | | | | | | | | | | | | | | | |
| Money Market Funds | | $ | 7,830,866 | | | $ | — | | | $ | — | | | $ | 7,830,866 | |
| U.S. Treasury Bills | | | — | | | | 47,983,755 | | | | — | | | | 47,983,755 | |
| Total Short-Term Investments | | $ | 7,830,866 | | | $ | 47,983,755 | | | $ | — | | | $ | 55,814,621 | |
| Total Investments | | $ | 58,934,720 | | | $ | 47,983,755 | | | $ | — | | | $ | 106,918,475 | |
Transfers between levels are recognized at the end of the reporting period. During the six-month period ended April 30, 2016, the Fund recognized no transfers between levels.
Schedule of Reverse Repurchase Agreements
| | | | | | | Principal | Maturity | | Maturity | |
| Face Value | | Counterparty | | Rate | Trade Date | Date | | Amount | |
| $ | 7,196,000 | | Jefferies LLC | | | 0.75 | % | 2/19/16 | 5/19/16 | | $ | 7,209,493 | |
| | 10,794,000 | | Jefferies LLC | | | 0.75 | % | 3/28/16 | 6/23/16 | | | 10,813,564 | |
| | 10,794,000 | | Jefferies LLC | | | 0.75 | % | 4/29/16 | 7/21/16 | | | 10,812,665 | |
| $ | 28,784,000 | | | | | | | | | | $ | 28,835,721 | |
As of April 30, 2016, the fair value of securities held as collateral for reverse repurchase agreements was $47,983,755 as noted on the Schedule of Investments.
The accompanying notes are an integral part of these financial statements.
| HENNESSY FUNDS | 1-800-966-4354 | |
Financial Statements
Statement of Assets and Liabilities as of April 30, 2016 (Unaudited) |
| ASSETS: | | | |
| Investments in securities, at value (cost $100,366,596) | | $ | 106,918,475 | |
| Dividends and interest receivable | | | 143,184 | |
| Receivable for fund shares sold | | | 199,991 | |
| Prepaid expenses and other assets | | | 8,577 | |
| Total Assets | | | 107,270,227 | |
| | | | | |
| LIABILITIES: | | | | |
| Due to custodian | | | 4,997,694 | |
| Payable for fund shares redeemed | | | 1,047 | |
| Payable to advisor | | | 35,081 | |
| Payable to administrator | | | 17,236 | |
| Payable to auditor | | | 10,477 | |
| Accrued distribution fees | | | 58,666 | |
| Accrued service fees | | | 5,847 | |
| Reverse repurchase agreement | | | 28,784,000 | |
| Accrued interest payable | | | 17,866 | |
| Accrued trustees fees | | | 3,163 | |
| Accrued expenses and other payables | | | 41,792 | |
| Total Liabilities | | | 33,972,869 | |
| NET ASSETS | | $ | 73,297,358 | |
| | | | | |
| NET ASSETS CONSIST OF: | | | | |
| Capital stock | | $ | 65,333,101 | |
| Accumulated net investment income | | | 78,364 | |
| Accumulated net realized gain on investments | | | 1,334,014 | |
| Unrealized net appreciation on investments | | | 6,551,879 | |
| Total Net Assets | | $ | 73,297,358 | |
| | | | | |
| NET ASSETS | | | | |
| Investor Class: | | | | |
| Shares authorized (no par value) | | Unlimited | |
| Net assets applicable to outstanding Investor Class shares | | $ | 73,297,358 | |
| Shares issued and outstanding | | | 5,399,970 | |
| Net asset value, offering price and redemption price per share | | $ | 13.57 | |
The accompanying notes are an integral part of these financial statements.
Financial Statements
Statement of Operations for the six months ended April 30, 2016 (Unaudited) |
| INVESTMENT INCOME: | | | |
| Dividend income | | $ | 907,261 | |
| Interest income | | | 35,235 | |
| Total investment income | | | 942,496 | |
| | | | | |
| EXPENSES: | | | | |
| Investment advisory fees (See Note 5) | | | 203,583 | |
| Interest expense (See Notes 6 and 8) | | | 81,537 | |
| Distribution fees – Investor Class (See Note 5) | | | 50,896 | |
| Service fees – Investor Class (See Note 5) | | | 33,931 | |
| Administration, fund accounting, custody and transfer agent fees (See Note 5) | | | 33,251 | |
| Sub-transfer agent expenses – Investor Class (See Note 5) | | | 27,346 | |
| Compliance expense | | | 11,790 | |
| Audit fees | | | 11,047 | |
| Federal and state registration fees | | | 8,896 | |
| Reports to shareholders | | | 7,386 | |
| Trustees’ fees and expenses | | | 6,882 | |
| Legal fees | | | 252 | |
| Other expenses | | | 4,017 | |
| Total expenses | | | 480,814 | |
| NET INVESTMENT INCOME | | $ | 461,682 | |
| | | | | |
| REALIZED AND UNREALIZED GAINS: | | | | |
| Net realized gain on investments | | $ | 1,437,842 | |
| Net change in unrealized appreciation on investments | | | 1,819,528 | |
| Net gain on investments | | | 3,257,370 | |
| NET INCREASE IN NET ASSETS RESULTING FROM OPERATIONS | | $ | 3,719,052 | |
The accompanying notes are an integral part of these financial statements.
| HENNESSY FUNDS | 1-800-966-4354 | |
Financial Statements
| Statements of Changes in Net Assets |
| | | Six Months Ended | | | | |
| | | April 30, 2016 | | | Year Ended | |
| | | (Unaudited) | | | October 31, 2015 | |
| OPERATIONS: | | | | | | |
| Net investment income | | $ | 461,682 | | | $ | 1,074,164 | |
| Net realized gain on investments | | | 1,437,842 | | | | 5,969,412 | |
| Net change in unrealized | | | | | | | | |
| appreciation (depreciation) on investments | | | 1,819,528 | | | | (6,270,901 | ) |
| Net increase in net assets resulting from operations | | | 3,719,052 | | | | 772,675 | |
| | | | | | | | | |
| DISTRIBUTIONS TO SHAREHOLDERS FROM: | | | | | | | | |
| Net investment income – Investor Class | | | (484,053 | ) | | | (1,084,818 | ) |
| Net realized gains – Investor Class | | | (5,932,910 | ) | | | (5,767,007 | ) |
| Total distributions | | | (6,416,963 | ) | | | (6,851,825 | ) |
| | | | | | | | | |
| CAPITAL SHARE TRANSACTIONS: | | | | | | | | |
| Proceeds from shares subscribed – Investor Class | | | 5,588,476 | | | | 2,980,355 | |
| Dividends reinvested – Investor Class | | | 6,018,990 | | | | 6,420,583 | |
| Cost of shares redeemed – Investor Class | | | (5,028,274 | ) | | | (17,800,502 | ) |
| Net increase (decrease) in net assets derived | | | | | | | | |
| from capital share transactions | | | 6,579,192 | | | | (8,399,564 | ) |
| TOTAL INCREASE (DECREASE) IN NET ASSETS | | | 3,881,281 | | | | (14,478,714 | ) |
| | | | | | | | | |
| NET ASSETS: | | | | | | | | |
| Beginning of period | | | 69,416,077 | | | | 83,894,791 | |
| End of period | | $ | 73,297,358 | | | $ | 69,416,077 | |
| Undistributed net investment income, end of period | | $ | 78,364 | | | $ | 100,735 | |
| | | | | | | | | |
| CHANGES IN SHARES OUTSTANDING: | | | | | | | | |
| Shares sold – Investor Class | | | 419,027 | | | | 203,884 | |
| Shares issued to holders as reinvestment | | | | | | | | |
| of dividends – Investor Class | | | 468,744 | | | | 448,889 | |
| Shares redeemed – Investor Class | | | (379,551 | ) | | | (1,254,599 | ) |
| Net increase (decrease) in shares outstanding | | | 508,220 | | | | (601,826 | ) |
The accompanying notes are an integral part of these financial statements.
Financial Statements
Statement of Cash Flows for the six months ended April 30, 2016 (Unaudited) |
| Cash flows from operating activities: | | | |
| Net increase in net assets from operations | | $ | 3,719,052 | |
| Adjustments to reconcile net increase in net assets from | | | | |
| operations to net cash provided by operating activities: | | | | |
| Payments to purchase securities | | | (7,889,663 | ) |
| Proceeds from sale of securities | | | 8,555,470 | |
| (Purchase) sale of short term investments, net | | | (6,921,233 | ) |
| Realized gain on investments in securities | | | (1,437,842 | ) |
| Net accretion of discount on securities | | | (33,191 | ) |
| Change in unrealized depreciation on investments in securities | | | (1,819,528 | ) |
| (Increases) decreases in operating assets: | | | | |
| Decrease in dividends and interest receivable | | | 16,849 | |
| Decrease in prepaid expenses and other assets | | | 862 | |
| Increases (decreases) in operating liabilities: | | | | |
| Increase in payable to advisor | | | 199 | |
| Increase in payable to administrator | | | 5,813 | |
| Decrease in accrued distribution fees | | | (5,639 | ) |
| Increase in accrued service fees | | | 33 | |
| Increase in accrued interest payable | | | 6,437 | |
| Decrease in accrued audit fees | | | (11,123 | ) |
| Increase in accrued trustee fees | | | 1,503 | |
| Decrease in other accrued expenses and payables | | | (1,508 | ) |
| Net cash used in operating activities | | | (5,813,509 | ) |
| | | | | |
| Cash flows from financing activities: | | | | |
| Increase in reverse repurchase agreements | | | 899,500 | |
| Proceeds from shares sold | | | 5,389,214 | |
| Payment on shares redeemed | | | (5,074,925 | ) |
| Distributions paid in cash, net of reinvestments | | | (397,974 | ) |
| Net cash provided by financing activities | | | 815,815 | |
| Net increase in cash | | | (4,997,694 | ) |
| | | | | |
| Cash: | | | | |
| Beginning balance | | | — | |
| Ending balance | | $ | (4,997,694 | ) |
| | | | | |
| Supplemental information: | | | | |
| Non-cash financing activities not included herein consists | | | | |
| of dividend reinvestment of dividends and distributions | | $ | 6,018,990 | |
| Proceeds from securities litigation | | | 44 | |
| | | | | |
| Cash paid for interest | | $ | 75,100 | |
The accompanying notes are an integral part of these financial statements.
| HENNESSY FUNDS | 1-800-966-4354 | |
Financial Statements
For an Investor Class share outstanding throughout each period
| | | Six Months Ended | |
| | | April 30, 2016 | |
| | | (Unaudited) | |
| PER SHARE DATA: | | | |
| Net asset value, beginning of period | | $ | 14.19 | |
| | | | | |
| Income from investment operations: | | | | |
| Net investment income | | | 0.10 | |
| Net realized and unrealized gains (losses) on investments | | | 0.61 | |
| Total from investment operations | | | 0.71 | |
| | | | | |
| Less distributions: | | | | |
| Dividends from net investment income | | | (0.10 | ) |
| Dividends from net realized gains | | | (1.23 | ) |
| Total distributions | | | (1.33 | ) |
| Net asset value, end of period | | $ | 13.57 | |
| | | | | |
| TOTAL RETURN | | | 5.54 | %(1) |
| | | | | |
| SUPPLEMENTAL DATA AND RATIOS: | | | | |
| Net assets, end of period (millions) | | $ | 73.30 | |
| Ratio of expenses to average net assets | | | 1.42 | %(2) |
| Ratio of net investment income to average net assets | | | 1.36 | %(2) |
| Portfolio turnover rate | | | 35 | %(1) |
(1) | Not annualized. |
(2) | Annualized. |
The accompanying notes are an integral part of these financial statements.
| Year Ended October 31, | |
| 2015 | | | 2014 | | | 2013 | | | 2012 | | | 2011 | |
| | | | | | | | | | | | | | |
| $ | 15.27 | | | $ | 14.30 | | | $ | 12.64 | | | $ | 11.47 | | | $ | 10.57 | |
| | | | | | | | | | | | | | | | | | | |
| | | | | | | | | | | | | | | | | | | |
| | 0.20 | | | | 0.20 | | | | 0.16 | | | | 0.18 | | | | 0.18 | |
| | (0.02 | ) | | | 0.96 | | | | 1.66 | | | | 1.17 | | | | 0.89 | |
| | 0.18 | | | | 1.16 | | | | 1.82 | | | | 1.35 | | | | 1.07 | |
| | | | | | | | | | | | | | | | | | | |
| | | | | | | | | | | | | | | | | | | |
| | (0.20 | ) | | | (0.19 | ) | | | (0.16 | ) | | | (0.18 | ) | | | (0.17 | ) |
| | (1.06 | ) | | | — | | | | — | | | | — | | | | — | |
| | (1.26 | ) | | | (0.19 | ) | | | (0.16 | ) | | | (0.18 | ) | | | (0.17 | ) |
| $ | 14.19 | | | $ | 15.27 | | | $ | 14.30 | | | $ | 12.64 | | | $ | 11.47 | |
| | | | | | | | | | | | | | | | | | | |
| | 1.22 | % | | | 8.15 | % | | | 14.49 | % | | | 11.78 | % | | | 10.22 | % |
| | | | | | | | | | | | | | | | | | | |
| | | | | | | | | | | | | | | | | | | |
| $ | 69.42 | | | $ | 83.89 | | | $ | 90.24 | | | $ | 77.67 | | | $ | 64.13 | |
| | 1.28 | % | | | 1.34 | % | | | 1.37 | % | | | 1.37 | % | | | 1.34 | % |
| | 1.40 | % | | | 1.31 | % | | | 1.16 | % | | | 1.44 | % | | | 1.56 | % |
| | 27 | % | | | 23 | % | | | 31 | % | | | 22 | % | | | 21 | % |
The accompanying notes are an integral part of these financial statements.
| HENNESSY FUNDS | 1-800-966-4354 | |
Financial Statements
Notes to the Financial Statements April 30, 2016 (Unaudited) |
1). ORGANIZATION
The Hennessy Total Return Fund (the “Fund”) is a series of Hennessy Funds Trust (the “Trust”), which was organized as a Delaware statutory trust on September 17, 1992. The Fund is an open-end management investment company registered under the Investment Company Act of 1940, as amended. The Fund is a successor to a fund with the same name (the “Predecessor Fund”) that was a series of The Hennessy Funds, Inc., a Maryland corporation, pursuant to a reorganization that took place after the close of business on February 28, 2014. Prior to February 28, 2014, the Fund had no investment operations. As a result of the reorganization, holders of the Investor Class shares of the Predecessor Fund received Investor Class shares of the Fund (the Investor Class shares of the Fund are the successor to the accounting and performance information of the Predecessor Fund). The investment objective of the Fund is total return, consisting of capital appreciation and current income. The Fund is a non-diversified fund and offers Investor Class shares.
As an investment company, the Fund follows the investment company accounting and reporting guidance of the Financial Accounting Standards Board (“FASB”) Accounting Standard Codification Topic 946 “Financial Services—Investment Companies.”
2). SIGNIFICANT ACCOUNTING POLICIES
The following is a summary of significant accounting policies consistently followed by the Fund in the preparation of the financial statements. These policies are in conformity with U.S. generally accepted accounting principles (“GAAP”).
| a). | Investment Valuation – All investments in securities are recorded at their estimated fair value, as described in Note 3. |
| b). | Federal Income Taxes – Provision for federal income taxes or excise taxes has not been made since the Fund has elected to be taxed as a “regulated investment company” and intends to distribute substantially all of its taxable income to its shareholders and otherwise comply with the provisions of the Internal Revenue Code of 1986, as amended, applicable to regulated investment companies. Net investment income or loss and realized gains and losses for federal income tax purposes may differ from that reported on the financial statements because of temporary book and tax basis differences. Temporary differences are primarily the result of the treatment of wash sales for tax reporting purposes. The Fund recognizes interest and penalties related to income tax benefits, if any, in the statement of operations as an income tax expense. Distributions from net realized gains for book purposes may include short-term capital gains, which are included as ordinary income to shareholders for tax purposes. |
| c). | Income and Expenses – Dividend income is recognized on the ex-dividend date or as soon as information is available to the Fund. Interest income, which includes the amortization of premium and accretion of discount, is recognized on an accrual basis. The Fund is charged for those expenses that are directly attributable to the portfolio, such as advisory, administration, and certain shareholder service fees. |
| d). | Distributions to Shareholders – Dividends from net investment income for the Fund, if any, are declared and paid on a calendar quarter basis. Distributions of net realized capital gains, if any, are declared and paid annually, usually in December. |
| e). | Security Transactions – Investment and shareholder transactions are recorded on the trade date. The Fund determines the gain or loss realized from the investment transactions by comparing the original cost of the security lot sold with the net sale proceeds. Discounts and premiums on securities purchased are accreted/amortized over the life of the respective security. |
| f). | Use of Estimates – The preparation of financial statements in conformity with GAAP requires management to make estimates and assumptions that affect the reported amounts of assets and liabilities and disclosure of contingent assets and liabilities at the date of the financial statements and the reported change in net assets during the reporting period. Actual results could differ from those estimates. |
| g). | Share Valuation – The net asset value (“NAV”) per share of the Fund is calculated by dividing the sum of the value of the securities held by the Fund, plus cash or other assets, minus all liabilities (including estimated accrued expenses) by the total number of shares outstanding for the Fund, rounded to the nearest cent. The Fund’s shares will not be priced on days the New York Stock Exchange is closed for trading. The offering and redemption price per share for the Fund is equal to the Fund’s NAV per share. |
| h). | Repurchase Agreements – The Fund may enter into repurchase agreements with member banks or security dealers of the Federal Reserve Board whom the investment advisor deems creditworthy. The repurchase price generally equals the price paid by the Fund plus interest negotiated on the basis of current short-term rates. |
| | Securities pledged as collateral for repurchase agreements are held by the custodian bank until the respective agreements mature. Provisions of the repurchase agreements ensure that the market value of the collateral, including accrued interest thereon, is sufficient to cover the repurchase amount in the event of default of the counterparty. If the counterparty defaults and the value of the collateral declines or if the counterparty enters an insolvency proceeding, realization of the collateral by the Fund may be delayed or limited. |
| i). | Accounting for Uncertainty in Income Taxes – The Fund has accounting policies regarding recognition and measurement of tax positions taken or expected to be taken on a tax return. The tax returns of the Fund for the prior three fiscal years are open for examination. The Fund has reviewed all open tax years in major jurisdictions and concluded that there is no impact on the Fund’s net assets and no tax liability resulting from unrecognized tax benefits relating to uncertain income tax positions taken or expected to be taken on a tax return. The Fund’s major tax jurisdictions are U.S. federal and Delaware. |
| j). | Offsetting Assets and Liabilities – The Fund follows the financial reporting rules regarding offsetting assets and liabilities and related netting arrangements to enable users of its financial statements to understand the effect of those arrangements on its financial position. Reverse repurchase transactions are entered into by the Fund under Master Repurchase Agreements (“MRA”) that permit the Fund, under certain circumstances, including an event of default (such as bankruptcy or insolvency), to offset payables under the MRA with collateral held with the counterparty and create one single net payment from the Fund. Upon a bankruptcy or insolvency of the MRA counterparty, the Fund is considered an unsecured creditor with respect to excess collateral and, as such, the return of excess collateral may be delayed. In the event the buyer of securities under an MRA files for bankruptcy or becomes insolvent, the Fund’s use of the proceeds of the agreement may be restricted while the other party, or its trustee or receiver, determines whether or not to enforce the Fund’s obligation to repurchase the securities. For additional information regarding the offsetting of assets and liabilities at April 30, 2016, please reference the table in Note 8. |
| HENNESSY FUNDS | 1-800-966-4354 | |
| k). | New Accounting Pronouncements – In May 2015, the FASB issued ASU No. 2015-07 “Disclosure for Investments in Certain Entities that Calculate Net Asset Value per Share (or Its Equivalent).” The amendments in ASU No. 2015-07 remove the requirement to categorize within the fair value hierarchy investments measured at NAV and require the disclosure of sufficient information to reconcile the fair value of the remaining assets categorized within the fair value hierarchy to the financial statements. The amendments in ASU No. 2015-07 are effective for fiscal years beginning after December 15, 2015, and interim periods within those fiscal years. Management has reviewed the requirements and believes the adoption of ASU 2015-07 will not have a material impact on the Fund’s financial statements and related disclosures. |
3). SECURITIES VALUATION
The Fund follows authoritative fair valuation accounting standards that establish an authoritative definition of fair value and set out a hierarchy for measuring fair value. These standards require additional disclosures about the various inputs and valuation techniques used to develop the measurements of fair value and a discussion in changes in valuation techniques and related inputs during the period. These inputs are summarized in the three broad levels listed below:
| | Level 1 – | Unadjusted, quoted prices in active markets for identical instruments that the Fund has the ability to access at the date of measurement. |
| | Level 2 – | Other significant observable inputs (including, but not limited to, quoted prices in active markets for similar instruments, quoted prices in markets that are not active for identical or similar instruments, and model-derived valuations in which all significant inputs and significant value drivers are observable in active markets (such as interest rates, prepayment speeds, credit risk curves, default rates, and similar data)). |
| | Level 3 – | Significant unobservable inputs (including the Fund’s own assumptions about what market participants would use to price the asset or liability based on the best available information) when observable inputs are unavailable. |
Following is a description of the valuation techniques applied to the Fund’s major categories of assets and liabilities measured at fair value on a recurring basis.
Equity Securities – Equity securities, including common stocks, preferred stocks, exchange-traded funds, closed-end mutual funds, partnerships, rights, and real estate investment trusts, that are traded on a securities exchange for which a last-quoted sales price is readily available will generally be valued at the last sales price as reported by the primary exchange on which the securities are listed. Securities listed on The NASDAQ Stock Market (“NASDAQ”) will generally be valued at the NASDAQ Official Closing Price, which may differ from the last sales price reported. Securities traded on a securities exchange for which a last-quoted sales price is not readily available will generally be valued at the mean between the bid and ask prices. To the extent these securities are actively traded and valuation adjustments are not applied, they are classified in Level 1 of the fair value hierarchy.
Registered Investment Companies – Investments in registered investment companies (e.g., mutual funds) are generally priced at the ending NAV provided by the applicable registered investment company’s service agent and will be classified in Level 1 of the fair value hierarchy.
Debt Securities – Debt securities, including corporate bonds, asset-backed securities, mortgage-backed securities, municipal bonds, U.S. Treasuries, and U.S. government agency issues, are generally valued at market on the basis of valuations furnished by an
independent pricing service that utilizes both dealer-supplied valuations and formula-based techniques. The pricing service may consider recently executed transactions in securities of the issuer or comparable issuers, market price quotations (where observable), bond spreads, and fundamental data relating to the issuer. In addition, the model may incorporate observable market data such as reported sales of similar securities, broker quotes, yields, bids, offers, and reference data. Certain securities are valued primarily using dealer quotations. These securities are generally classified in Level 2 of the fair value hierarchy.
Short-Term Securities – Short-term equity investments, including money market funds, are valued in the manner specified above. Short-term debt investments with an original term to maturity of 60 days or less are valued at amortized cost, which approximates fair market value. If the original term to maturity of a short-term debt investment exceeded 60 days, then the values as of the 61st day prior to maturity are amortized. Amortized cost is not used if its use would be inappropriate due to credit or other impairments of the issuer, in which case the security’s fair value would be determined, as described below. Short-term securities are generally classified in Level 1 or Level 2 of the fair market hierarchy depending on the inputs used and market activity levels for specific securities.
The Board of Trustees of the Fund (the “Board”) has adopted fair value pricing procedures that are followed when a price for a security is not readily available or if a significant event has occurred that indicates the closing price of a security no longer represents the true value of that security. Fair value pricing determinations are made in good faith in accordance with these procedures. There are numerous criteria that will be given consideration in determining a fair value of a security such as the trading volume of a security and markets, the value of other like securities, and news events with direct bearing to a security or markets. Fair value pricing results in an estimated price for a security that reflects the amount the Fund might reasonably expect to receive in a current sale. Depending on the relative significance of the valuation inputs, these securities may be classified in either Level 2 or Level 3 of the fair value hierarchy.
The Board has delegated day-to-day valuation matters to a Valuation Committee comprised of one or more representatives from Hennessy Advisors, Inc., the Fund’s investment advisor. The function of the Valuation Committee is to value securities where current and reliable market quotations are not readily available. All actions taken by the Valuation Committee are reviewed by the Board.
The Fund has performed an analysis of all existing investments to determine the significance and character of all inputs to their fair value determination. Various inputs are used in determining the value of the Fund’s investments. The inputs or methodology used for valuing securities are not necessarily an indication of the risk associated with investing in those securities. Details related to the fair valuation hierarchy of the Fund’s securities as of April 30, 2016, are included in the Fund’s Schedule of Investments.
4). INVESTMENT TRANSACTIONS
Purchases and sales of investment securities (excluding government and short-term investments) for the Fund during the six months ended April 30, 2016, were $7,889,663 and $8,555,426, respectively.
There were no purchases or sales/maturities of long-term U.S. government securities for the Fund during the six months ended April 30, 2016.
5). INVESTMENT MANAGEMENT FEE AND OTHER TRANSACTIONS WITH AFFILIATES
Hennessy Advisors, Inc. (the “Advisor”) is the investment advisor of the Fund. The Advisor provides the Fund with investment management services under an Investment Advisory Agreement. The Advisor furnishes all investment advice, office space, facilities,
| HENNESSY FUNDS | 1-800-966-4354 | |
and provides most of the personnel needed by the Fund. As compensation for its services, the Advisor is entitled to a monthly fee from the Fund. The fee is based upon the average daily net assets of the Fund at the annual rate of 0.60%. The net investment advisory fees payable by the Fund as of April 30, 2016, were $35,081.
The Board has approved a Shareholder Servicing Agreement for the Fund, which was instituted to compensate the Advisor for the non-investment management services it provides to the Fund. The Shareholder Servicing Agreement provides for a monthly fee paid to the Advisor at an annual rate of 0.10% of the average daily net assets of the Fund. Shareholder service fees payable by the Fund as of April 30, 2016, were $5,847.
The Fund has adopted a plan pursuant to Rule 12b-1 under the Investment Company Act of 1940, as amended, that authorizes payments in connection with the distribution of the Fund’s shares at an annual rate of up to 0.25% of the Fund’s average daily net assets, although the Fund is currently only using up to 0.15% of its average daily net assets for such purpose. Amounts paid under the plan may be spent on any activities or expenses primarily intended to result in the sale of shares, including, but not limited to, advertising, shareholder account servicing, the printing and mailing of prospectuses to other than current shareholders, the printing and mailing of sales literature, and compensation for sales and marketing activities or to financial institutions and others, such as dealers and distributors.
The Fund has entered into agreements with various brokers, dealers, and financial intermediaries in connection with the sale of shares of the Fund. The agreements provide for periodic payments by the Fund to the brokers, dealers, and financial intermediaries for providing certain shareholder maintenance services (sub-transfer agent expenses). These shareholder services include the pre-processing and quality control of new accounts, shareholder correspondence, answering customer inquiries regarding account status, and facilitating shareholder telephone transactions. Fees paid by the Fund to various brokers, dealers, and financial intermediaries during the six months ended April 30, 2016, were $27,346.
U.S. Bancorp Fund Services, LLC (“USBFS”) provides the Fund with administrative, fund accounting, and transfer agent services and necessary office equipment. As administrator, USBFS is responsible for activities such as (i) preparing various federal and state regulatory filings, reports, and returns for the Fund, (ii) preparing reports and materials to be supplied to the Board, (iii) monitoring the activities of the Fund’s custodian, transfer agent, and accountants, and (iv) coordinating the preparation and payment of the Fund’s expenses and reviewing the Fund’s expense accruals. Fees paid to USBFS during the six months ended April 30, 2016, were $33,251.
U.S. Bank, N.A., an affiliate of USBFS, serves as the Fund’s custodian. Quasar Distributors, LLC acts as the Fund’s principal underwriter in a continuous public offering of the Fund’s shares. Quasar Distributors, LLC is an affiliate of USBFS and U.S. Bank, N.A.
6). LINE OF CREDIT
The Fund has an uncommitted line of credit with the other funds in the Hennessy Funds family of funds (the “Hennessy Funds”) in the amount of the lesser of (i) $100,000,000 or (ii) 33.33% of each Hennessy Fund’s net assets, or 30% for the Hennessy Gas Utility Fund and 10% for the Hennessy Balanced Fund, intended to provide short-term financing, if necessary, subject to certain restrictions, in connection with shareholder redemptions. The credit facility is with the Hennessy Funds’ custodian bank, U.S. Bank, N.A. Borrowings under this arrangement bear interest at the bank’s prime rate and are secured by all of the Fund’s assets (as to its own borrowings only). During the six months ended April 30, 2016, the Fund did not have any borrowings outstanding under the line of credit.
7). FEDERAL TAX INFORMATION
As of October 31, 2015, the Fund’s most recent fiscal year end, the components of accumulated earnings (losses) for income tax purposes were as follows:
| Cost of investments for tax purposes | | $ | 92,743,932 | |
| Gross tax unrealized appreciation | | $ | 6,417,649 | |
| Gross tax unrealized depreciation | | | (1,789,094 | ) |
| Net tax unrealized appreciation | | $ | 4,628,555 | |
| Undistributed ordinary income | | $ | 189,594 | |
| Undistributed long-term capital gains | | | 5,844,019 | |
| Total distributable earnings | | $ | 6,033,613 | |
| Other accumulated gain | | $ | — | |
| Total accumulated gain | | $ | 10,662,168 | |
The difference between book-basis unrealized appreciation/depreciation (as shown in the Statement of Assets and Liabilities) and tax-basis unrealized appreciation/depreciation (as shown above) is attributable primarily to wash sales.
At October 31, 2015, the Fund’s most recent fiscal year end, the Fund had no tax basis capital losses to offset future capital gains.
At October 31, 2015, the Fund’s most recent fiscal year end, the Fund did not defer, on a tax basis, any post-December late year ordinary loss deferrals.
The tax character of distributions paid during fiscal year 2016 (year to date) and fiscal year 2015 for the Fund were as follows:
| | | Six Months Ended | | | Year Ended | |
| | | April 30, 2016 | | | October 31, 2015 | |
| Ordinary income | | $ | 572,925 | | | $ | 1,084,818 | |
| Long-term capital gain | | | 5,844,038 | | | | 5,767,007 | |
| | | $ | 6,416,963 | | | $ | 6,851,825 | |
8). REVERSE REPURCHASE AGREEMENTS
The Fund may enter into reverse repurchase agreements with the same parties with whom it may enter into repurchase agreements. Under a reverse repurchase agreement, the Fund sells securities and agrees to repurchase them at a mutually agreed upon date and price. Reverse repurchase agreements are regarded as a form of secured borrowing by the Fund. Securities sold under reverse repurchase agreements are reflected as a liability on the Statement of Assets and Liabilities. Interest payments made are recorded as a component of interest expense on the Statement of Operations.
For the six months ended April 30, 2016, the average daily balance and average interest rate in effect for reverse repurchase agreements were $27,009,712 and 0.611%, respectively. At April 30, 2016, the interest rate in effect for the outstanding reverse repurchase agreements scheduled to mature on May 19, 2016 ($7,196,000), June 23, 2016 ($10,794,000), and July 21, 2016 ($10,794,000) was 0.75%, 0.75%, and 0.75%, respectively. Outstanding reverse repurchase agreements at April 30, 2016, were equal to 39.27% of the Fund’s net assets.
| HENNESSY FUNDS | 1-800-966-4354 | |
Below is information about instruments and transactions eligible for offset in the Statement of Assets and Liabilities, on both a gross and net basis, as well as instruments and transactions subject to an agreement similar to a master netting arrangement:
| | | | | | | | Gross | | | | Net | | | | | | | | | | | | | |
| | | | | | | | Amounts | | | | Amounts | | | | | | | | | | | | | |
| | | | | | | | Offset | | | | Presented | | | | Gross Amounts Not | | | | | |
| | | | | | | | in the | | | | in the | | | | Offset in the Statement | | | | | |
| | | | Gross | | | | Statement | | | | Statement | | | | of Assets and Liabilities | | | | | |
| | | | Amounts of | | | | of | | | | of | | | | | | | | Collateral | | | | | |
| | | | Recognized | | | | Assets and | | | | Assets and | | | | Financial | | | | Pledged | | | | Net | |
| Description | | | Liabilities | | | | Liabilities | | | | Liabilities | | | | Instruments | | | | (Received) | | | | Amount | |
| Reverse | | | | | | | | | | | | | | | | | | | | | | | | |
| Repurchase | | | | | | | | | | | | | | | | | | | | | | | | |
| Agreements | | $ | 28,784,000 | | | $ | — | | | $ | 28,784,000 | | | $ | 28,784,000 | | | $ | — | | | $ | — | |
| | | $ | 28,784,000 | | | $ | — | | | $ | 28,784,000 | | | $ | 28,784,000 | | | $ | — | | | $ | — | |
For additional information, please reference the “Offsetting Assets and Liabilities” section in Note 2.
Expense Example (Unaudited)
April 30, 2016
As a shareholder of the Fund, you incur two types of costs: (1) transaction costs, including sales charges (loads) on purchase payments, reinvested dividends, or other distributions; redemption fees; and exchange fees; and (2) ongoing costs, including management fees; service fees; and other Fund expenses. This Example is intended to help you understand your ongoing costs (in dollars) of investing in the Fund and to compare these costs with the ongoing costs of investing in other mutual funds. The Example is based on an investment of $1,000 invested at the beginning of the period and held for the entire period from November 1, 2015 through April 30, 2016.
Actual Expenses
The first line of the table below provides information about actual account values and actual expenses. Although the Fund charges no sales loads or transaction fees, you will be assessed fees for outgoing wire transfers, returned checks and stop payment orders at prevailing rates charged by U.S. Bancorp Fund Services, LLC, the Fund’s transfer agent. If you request that a redemption be made by wire transfer, currently a $15.00 fee is charged by the Fund’s transfer agent. IRA accounts will be charged a $15.00 annual maintenance fee. The example below includes, but is not limited to, management fees, shareholder servicing fees, fund accounting, custody, and transfer agent fees. However, the example below does not include portfolio trading commissions and related expenses, and other extraordinary expenses as determined under generally accepted accounting principles. You may use the information in this line, together with the amount you invested, to estimate the expenses that you paid over the period. Simply divide your account value by $1,000 (for example, an $8,600 account value divided by $1,000 = 8.6), then multiply the result by the number in the first line of the table under the heading entitled “Expenses Paid During Period” to estimate the expenses you paid on your account during this period.
Hypothetical Example for Comparison Purposes
The second line of the table below provides information about hypothetical account values and hypothetical expenses based on the Fund’s actual expense ratios and an assumed rate of return of 5% per year before expenses, which is not the Fund’s actual return. The hypothetical account values and expenses may not be used to estimate the actual ending account balance or expenses you paid for the period. You may use this information to compare the ongoing costs of investing in the Fund and other funds. To do so, compare this 5% hypothetical example with the 5% hypothetical examples that appear in the shareholder reports of the other funds. Please note that the expenses shown in the table are meant to highlight your ongoing costs only and do not reflect any transactional costs, such as sales charges (loads), or exchange fees. Therefore, the second line of the table is useful in comparing ongoing costs only, and will not help you determine the relative total costs of owning different funds. In addition, if these transactional costs were included, your costs would have been higher.
| | | | Expenses Paid |
| | Beginning | Ending | During Period(1) |
| | Account Value | Account Value | November 1, 2015 – |
| | November 1, 2015 | April 30, 2016 | April 30, 2016 |
| Investor Class | | | |
| Actual | $1,000.00 | $1,055.40 | $7.26 |
| Hypothetical (5% return before expenses) | $1,000.00 | $1,017.80 | $7.12 |
(1) | Expenses are equal to the Fund’s annualized expense ratio of 1.42%, multiplied by the average account value over the period, multiplied by 182/366 days (to reflect one-half year period). |
| HENNESSY FUNDS | 1-800-966-4354 | |
How to Obtain a Copy of the Fund’s
Proxy Voting Policy and Proxy Voting Records
A description of the policies and procedures the Fund uses to determine how to vote proxies relating to portfolio securities is available without charge: (1) by calling 1-800-966-4354; (2) on the Hennessy Funds’ website at hennessyfunds.com/proxy-voting/policy.fs; or (3) on the U.S. Securities and Exchange Commission’s website at www.sec.gov. The Fund’s proxy voting record is available without charge on both the Hennessy Funds’ website at hennessyfunds.com/proxy-voting/policy.fs and the SEC’s website at www.sec.gov no later than August 31 for the prior 12 months ending June 30.
Quarterly Filings on Form N-Q
The Fund files its complete schedule of portfolio holdings with the SEC for the first and third quarters of each fiscal year on Form N-Q. The Fund’s Form N-Q will be available on the SEC’s website at www.sec.gov. The Fund’s Form N-Q may be reviewed and copied at the SEC’s Public Reference Room in Washington, DC and information on the operation of the Public Reference Room may be obtained by calling 1-800-SEC-0330. Information included in the Fund’s N-Q will also be available upon request by calling 1-800-966-4354.
Federal Tax Distribution Information
(Unaudited)
For the fiscal year ended October 31, 2015, certain dividends paid by the Fund may be subject to a maximum tax rate of 23.8%, as provided for by the Jobs and Growth Tax Relief Reconciliation Act of 2003. The percentage of dividends declared from ordinary income designated as qualified dividend income was 100.00%.
For corporate shareholders, the percent of ordinary income distributions that qualified for the corporate dividends received deduction for the fiscal year ended October 31, 2015 was 100.00%.
The percentage of taxable ordinary income distributions that are designated as short-term capital gain distributions under Section 871(k)(2)(C) of the Internal Revenue Code of 1986, as amended, for the Fund was 0.00%.
Householding
To help keep the Fund’s costs as low as possible, we generally deliver a single copy of most financial reports and prospectuses to shareholders who share an address, even if the accounts are registered under different names. This process, known as “householding,” does not apply to account statements. You may, of course, request an individual copy of a prospectus or financial report at any time. If you would like to receive separate mailings, please call the Administrator at 1-800-261-6950 or 1-414-765-4124 and we will begin individual delivery within 30 days of your request. If your account is held through a financial institution or other intermediary, please contact them directly to request individual delivery.
Board Approval of Investment Advisory
Agreement
At its meeting on March 9, 2016, the Board of Trustees of the Fund (the “Board,” and the members thereof, the “Trustees”) unanimously approved the continuation of the investment advisory agreement of the Fund with Hennessy Advisors, Inc. (the “Advisor”). As part of the process of approving the continuation of the advisory agreement, the Trustees reviewed their fiduciary duties with respect to approving the advisory agreement and the relevant factors for them to consider. In addition, the Trustees who are not deemed “interested persons” (as that term is defined by the Investment Company Act of 1940) of the Fund (the “Independent Trustees”) met in executive session to discuss the approval of the advisory agreement.
In advance of the meeting, the Advisor sent detailed information to the Trustees to assist them in their evaluation of the advisory agreement. This information included, but was not limited to, (i) a memorandum from outside legal counsel that described the fiduciary duties of the Board with respect to approving the continuation of the advisory agreement and the relevant factors for consideration, (ii) a memorandum from the Advisor that listed the factors relevant to the Board’s approval of the continuation of the advisory agreement and also referenced the documents that had been provided to help the Board assess each such factor, (iii) an inventory of the range of services provided by the Advisor for the Fund, (iv) a written discussion of economies of scale, (v) the advisory agreement, (vi) a recent Fund fact sheet, (vii) a peer expense comparison, (viii) performance information, (ix) the Advisor’s most recent Form 10-K and Form 10-Q, which included information about the Advisor’s profitability, (x) information about brokerage commissions, (xi) information about the Fund’s compliance program, (xii) the Advisor’s current Form ADV Part I, and (xii) other information the Trustees believed was useful in evaluating the approval of the continuation of the advisory agreement.
All of the factors discussed by the Trustees were considered as a whole, and were considered separately by the Independent Trustees, meeting in executive session. The factors were viewed in their totality by the Trustees, with no single factor being the principal or determinative factor in the Trustees’ determination of whether to approve the continuation of the advisory agreement. The Trustees recognized that the management and fee arrangements for the Fund are the result of years of review and discussion between the Independent Trustees and the Advisor, that certain aspects of such arrangements may receive greater scrutiny in some years than in others, and that the Trustees’ conclusions may be based, in part, on their consideration of these same arrangements and information received during the course of the year and in prior years.
Prior to approving the continuation of the advisory agreement, the Trustees and the Independent Trustees in executive session considered, among other items:
| | • | The nature and quality of the advisory services provided by the Advisor. |
| | • | A comparison of the fees and expenses of the Fund to other similar funds. |
| | • | Whether economies of scale are recognized by the Fund. |
| | • | The costs and profitability of the Fund to the Advisor. |
| | • | The performance of the Fund. |
| | • | The other benefits to the Advisor from serving as an investment advisor to the Fund (in addition to the advisory fee). |
| HENNESSY FUNDS | 1-800-966-4354 | |
The material considerations and determinations of the Board of Trustees, including all of the Independent Trustees, are as follows:
| | • | The Board considered the services identified below that are provided by the Advisor. Based on this review, the Trustees believe that the Advisor provides high-quality services to the Fund, and they noted that their overall confidence in the Advisor is high. The Trustees also concluded that they were satisfied with the nature, extent, and quality of the advisory services provided to the Fund by the Advisor, and that the nature and extent of the services provided by the Advisor are appropriate to assure that the Fund’s operations are conducted in compliance with applicable laws, rules, and regulations. |
| | | • | The Advisor acts as the portfolio manager for the Fund. In this capacity, the Advisor does the following: |
| | | | • | manages the composition of the Fund’s portfolio, including the purchase, retention, and disposition of portfolio securities in accordance with the Fund’s investment objectives, policies, and restrictions; |
| | | | • | ensures compliance with “best execution” for the Fund’s portfolio; |
| | | | • | manages the use of soft dollars for the Fund. |
| | | • | The Advisor performs a daily reconciliation of portfolio positions and cash for the Fund. |
| | | • | The Advisor monitors the Fund’s compliance with its investment objectives and restrictions. |
| | | • | The Advisor monitors compliance with federal securities laws and performs activities such as maintaining a compliance program, conducting ongoing reviews of the compliance programs of the Fund’s service providers, conducting on-site visits to the Fund’s service providers, monitoring incidents of abusive trading practices, reviewing Fund expense accruals, payments, and fixed expense ratios, evaluating insurance providers for fidelity bond coverage and D&O/E&O insurance coverage, conducting employee compliance training, reviewing reports provided by service providers, maintaining books and records, and preparing an annual compliance report to the Board. |
| | | • | The Advisor oversees service providers that provide accounting, administration, distribution, transfer agency, custodial, sales and marketing, public relations, audit, information technology, and legal services to the Fund. |
| | | • | The Advisor maintains in-house marketing and distribution departments on behalf of the Fund. |
| | | • | The Advisor is actively involved with preparing regulatory filings for the Fund, including writing and annually updating the Fund’s prospectus and related documents. |
| | | • | The Advisor prepares a written summary of the Fund’s performance for the most recent six-month period or twelve-month period, as applicable, for each semi-annual and annual report of the Fund. |
| | | • | The Advisor oversees distribution of the Fund through third-party broker/dealers and independent financial institutions such as Charles Schwab, Inc., Fidelity, TD Waterhouse, and Pershing. The Advisor participates in “no transaction fee” (“NTF”) programs with these companies on behalf of the Fund, which allow customers to purchase the Fund through third-party distribution |
| | | | channels without paying a transaction fee. The Advisor compensates, in part, a number of these third-party providers of NTF programs out of its own revenues. |
| | | • | The Advisor pays the incentive compensation of the Fund’s compliance officers and employs other staff, such as management executives, legal personnel, marketing personnel, national accounts and distribution personnel, sales personnel, administrative personnel, and trading oversight personnel. |
| | | • | The Advisor provides a quarterly compliance certification to the Board. |
| | | • | The Advisor prepares or reviews Board materials, frequently presents to the Board or leads Board discussions, prepares or reviews meeting minutes, and arranges for Board training and education. |
| | • | The Board compared the performance of the Fund to benchmark indices over various periods of time and they noted that at each quarterly meeting, the Trustees review reports comparing the investment performance of the Fund to various indices. Based on the information provided at the meeting and the information and quarterly discussions regarding the Fund’s investment performance, the Trustees believe that the Advisor manages the Fund in a manner that is materially consistent with its stated investment objective and style. The Trustees concluded that the performance of the Fund over various time horizons warranted the continuation of the advisory agreement. |
| | • | The Board reviewed the advisory fees and overall expense ratios of the Fund and comparable funds using data from Morningstar with respect to funds similar in asset size and investment objective to the Fund. As part of the discussion with management, the Trustees ensured that they understood and were comfortable with the criteria used to determine the mutual funds included in the Morningstar categories for purposes of the materials considered at the meeting. The Board determined that the advisory fee and overall expense ratio of the Fund falls within the range of the advisory fees and overall expense ratios of other comparable funds and concluded that they are reasonable and warranted continuation of the advisory agreement. |
| | • | The Board also considered whether economies of scale were being realized by the Advisor that should be shared with the Fund’s shareholders. The Trustees noted that many of the expenses incurred to manage the Fund are asset-based fees and thus do not result in material economies of scale being realized as the net assets of the Fund increase. For example, intermediary service fees increase as the Fund’s assets grow. The Trustees also considered the Advisor’s efforts to contain expenses, and took into account the Advisor’s significant marketing efforts to increase Fund assets. The Board noted that at current asset levels it did not appear that there were economies of scale being realized by the Advisor and concluded that it would continue to monitor economies of scale in the future as circumstances changed. |
| | • | The Board considered the profitability of the Advisor, including the impact of intermediary service fees on the Advisor’s profitability, and also considered the resources and revenues that the Advisor has put into managing and distributing the Fund. The Board then concluded that the profits of the Advisor are reasonable and not excessive when compared to profitability guidelines set forth in relevant court cases. |
| HENNESSY FUNDS | 1-800-966-4354 | |
| | • | The Board considered the high level of professionalism and knowledge of the Advisor’s employees, along with a very low level of turnover, and concluded that this was beneficial to the Fund and its shareholders. |
| | • | The Board considered other benefits to the Advisor from serving as an advisor to the Fund (in addition to the advisory fee). The Board noted that the Advisor may derive ancillary benefits from, by way of example, its association with the Fund in the form of proprietary and third-party research products and services received from broker dealers that execute portfolio trades for the Fund. The Board determined that any such products and services have been used for legitimate purposes relating to the Fund by providing assistance in the investment decision-making process. The Trustees concluded that the other benefits realized by the Advisor from its relationship with the Fund were reasonable. |
After reviewing the materials provided at the meeting and management’s presentation, as well as other information regularly provided at the Board’s quarterly meetings throughout the year regarding the quality of services provided by the Advisor, the performance of the Fund, expense information, regulatory compliance issues, trading information and related matters, and other factors deemed relevant by the Board, the Trustees, including all of the Independent Trustees, approved the continuation of the advisory agreement.
(This Page Intentionally Left Blank.)
For information, questions or assistance, please call
The Hennessy Funds
1-800-966-4354 or 1-415-899-1555
INVESTMENT ADVISOR
Hennessy Advisors, Inc.
7250 Redwood Blvd., Suite 200
Novato, California 94945
ADMINISTRATOR,
TRANSFER AGENT,
DIVIDEND PAYING AGENT &
SHAREHOLDER SERVICING AGENT
U.S. Bancorp Fund Services, LLC
P.O. Box 701
Milwaukee, Wisconsin 53201-0701
CUSTODIAN
U.S. Bank N.A.
Custody Operations
1555 North River Center Dr., Suite 302
Milwaukee, Wisconsin 53212
TRUSTEES
Neil J. Hennessy
Robert T. Doyle
J. Dennis DeSousa
Gerald P. Richardson
COUNSEL
Foley & Lardner LLP
777 East Wisconsin Avenue
Milwaukee, Wisconsin 53202-5306
INDEPENDENT REGISTERED
PUBLIC ACCOUNTING FIRM
KPMG LLP
777 East Wisconsin Avenue
Milwaukee, Wisconsin 53202-5306
DISTRIBUTOR
Quasar Distributors, LLC
615 East Michigan Street
Milwaukee, Wisconsin 53202
hennessyfunds.com | 1-800-966-4354
This report has been prepared for shareholders and may be distributed to
others only if preceded or accompanied by a current prospectus.
SEMI-ANNUAL REPORT
APRIL 30, 2016
HENNESSY EQUITY AND
INCOME FUND
Investor Class HEIFX
Institutional Class HEIIX
hennessyfunds.com | 1-800-966-4354
(This Page Intentionally Left Blank.)
Contents
| Letter to Shareholders | 2 |
| Performance Overview | 4 |
| Financial Statements | |
| Schedule of Investments | 7 |
| Statement of Assets and Liabilities | 18 |
| Statement of Operations | 19 |
| Statements of Changes in Net Assets | 21 |
| Financial Highlights | 22 |
| Notes to the Financial Statements | 26 |
| Expense Example | 34 |
| Proxy Voting | 36 |
| Quarterly Filings on Form N-Q | 36 |
| Federal Tax Distribution Information | 36 |
| Householding | 36 |
| Board Approval of Investment Advisory Agreements | 37 |
| HENNESSY FUNDS | 1-800-966-4354 | |
June 2016
Dear Hennessy Funds Shareholder:
I used to tell my kids, “What doesn’t kill you makes you stronger.” Perhaps that is not the best analogy for investing, but in the face of such roller coaster volatility in the financial markets, it seems to me that what hasn’t killed this bull market rally may just make it stronger. The financial markets brought us flat to modest returns during the six months ended April 30, 2016, with the S&P 500 Index returning 0.43% and the Dow Jones Industrial Average (DJIA) returning 1.98% during the period. These six months were marked by high volatility, the onslaught of more and more regulatory hurdles, the Fed stuck in neutral, fears about the global economy, and wild political rhetoric — all headwinds that I believe could have significantly stalled any positive moves in the market, but didn’t. Even the aggressive pull back in January showed just how skittish the market can be, and yet again the markets showed great resiliency and marched right back.
I continue to be impressed with the persistence of the bull market in U.S. equities, now in its seventh year. Many commentators believe that the U.S. economy is due for a recession, and the market is due for a downturn. However, we find ourselves comparing today’s secular market to the bull run of 1982 to 2000, which was powered by a significant increase in valuations. On March 9th of this year, I took a moment to remember how we all felt seven years ago on March 9, 2009, at the bottom of the financial crisis downturn that had wiped out trillions of dollars’ worth of U.S. equities. I explained to our investors then, and I say the same thing today, I believe that if you invest in quality companies with good fundamentals, over the long term, you should do fine.
If history is any kind of guide, then I think this bull market has some room to run. Rising markets usually fall when there is extreme optimism or euphoria. I haven’t witnessed any of that as of yet. The volatility has unnerved many, but I encourage investors to try to remain focused on investment fundamentals. Many U.S. companies continue to find ways to make a profit and build their already strong balance sheets. Unemployment is low, and wages are rising in real terms, supporting consumer confidence and consumption. With an average price-to-sales ratio of only 1.7x and a dividend yield of approximately 2.5% for the Dow, I believe U.S. equities continue to be attractive. In my opinion, there are many compelling reasons why this market can continue to climb even higher.
The next six months may be fraught with more talk about what the Fed will do, who the next President of the United States will be, and what is happening in China and around the globe. Businesses in every industry, including the asset management business, have concerns about increasing regulatory burdens, taxes, and higher healthcare costs. But, I still believe the ingenuity and perseverance of American business will find ways to endure and to thrive.
Thank you for your continued confidence and investment in our products. If you have any questions or would like to speak with us directly, please don’t hesitate to call us at (800) 966-4354.
Best regards,
Neil J. Hennessy
President and Chief Investment Officer
Past performance does not guarantee future results.
Mutual fund investing involves risk. Principal loss is possible.
Opinions expressed are those of Neil Hennessy and are subject to change, are not guaranteed and should not be considered investment advice.
Price-to-sales ratio is a tool for calculating a stock’s valuation relative to other companies. It is calculated by dividing a stock’s current price by its revenue per share. Dividend yield is calculated as the annual dividends paid by a company divided by its market price per share.
The Dow Jones Industrial Average and S&P 500 Index are unmanaged indices commonly used to measure the performance of U.S. stocks. One cannot invest directly in an index.
| HENNESSY FUNDS | 1-800-966-4354 | |
Performance Overview (Unaudited)
AVERAGE ANNUAL TOTAL RETURN FOR PERIODS ENDED APRIL 30, 2016
| | Six | One | Five | Ten |
| | Months(1) | Year | Years | Years |
| Hennessy Equity and Income Fund – | | | | |
| Investor Class (HEIFX) | 0.32% | -1.48% | 7.19% | 6.57% |
| Hennessy Equity and Income Fund – | | | | |
| Institutional Class (HEIIX) | 0.47% | -1.15% | 7.49% | 6.84% |
Blended Balanced Index(2) | 1.19% | 1.91% | 7.87% | 6.19% |
| S&P 500 Index | 0.43% | 1.21% | 11.02% | 6.91% |
Expense ratios: 1.43% (Investor Class); 1.09% (Institutional Class)
Performance data quoted represents past performance; past performance does not guarantee future results. The investment return and principal value of an investment will fluctuate so that an investor’s shares, when redeemed, may be worth more or less than their original cost. The performance table does not reflect the deduction of taxes that a shareholder would pay on Fund distributions or the redemption of Fund shares. Current performance of the Fund may be lower or higher than the performance quoted. Performance data current to the most recent month end may be obtained by visiting hennessyfunds.com. Performance for the period from March 12, 2010, to October 26, 2012, is that of the FBR Balanced Fund and for the periods prior to March 12, 2010, is that of the AFBA 5 Star Balanced Fund.
The expense ratios presented are from the most recent prospectus.
(1) | Periods less than one year are not annualized. |
(2) | The Blended Balanced Index consists of 60% common stocks represented by the S&P 500 Index and 40% bonds represented by the Barclays Capital Intermediate U.S. Government/Credit Index. |
PERFORMANCE NARRATIVE
Portfolio Managers for Equity Allocation: Stephen M. Goddard, CFA (Lead Portfolio Manager), Jonathan T. Moody, CFA, J. Brian Campbell, CFA, and Mark E. DeVaul, CFA, CPA The London Company of Virginia, LLC (sub-advisor)
Portfolio Managers for Fixed Income Portion: Gary B. Cloud, CFA, and Peter G. Greig, CFA Financial Counselors, Inc. (sub-advisor)
Performance:
For the six-month period ended April 30, 2016, the Investor Class of the Hennessy Equity and Income Fund returned 0.32%, underperforming the Blended Balanced Index* and the S&P 500 Index, which returned 1.19% and 0.43% for the same period, respectively.
Equities: Stock selection accounted for the relative underperformance of the equity allocation of the Fund over the six-month period, while sector allocation had a slightly positive impact. At the sector level, an underweight position in Information Technology and overweight position in Industrials had a positive impact on relative performance, partially offset by the negative impact of underweight positions in Utilities and Energy.
On an individual stock level, the top contributors to the performance of the equity allocation of the Fund for the six-month period were Dollar Tree, Inc., Norfolk Southern Corp., Altria Group Inc., Deere & Co., and Berkshire Hathaway, Inc. The top detractors to performance were CarMax, Inc., Carnival Corp., ConocoPhillips, Eli Lilly & Co., and The Mosaic Co. The Fund no longer holds ConocoPhillips, but continues to hold the other named stocks.
Fixed Income: The overweight position in investment grade corporate credit accounted for most of the positive performance of the fixed income allocation of the Fund over the past six months. The income and aging of these higher-yielding investment grade securities over the period and the sectors and specific credits they represent, performed well compared to the benchmark. The Fund’s slight exposure to high-yield credit securities, or junk bonds, was the largest factor detracting from performance. Duration and yield curve-related factors were neutral drivers of relative performance of the fixed income allocation of the Fund for the period.
Portfolio Strategy:
The Fund seeks a balanced portfolio of 60% equities and 40% fixed income with the goal of maintaining broad market exposure, but with lower volatility. Our bottom-up equity selection strategy seeks companies with strong returns on capital and the flexibility to enhance shareholder value by using their balance sheets. The fixed income allocation of the portfolio focuses on high-quality domestic corporate, agency and government bonds.
Investment Outlook:
Equities: Based on recent economic news, it appears that the U.S. economy is continuing to grow at a low, single-digit rate. A healthy level of consumption is being supported by low unemployment and wage increases and, corporate balance sheets remain strong. Looking ahead, we believe continued concerns about slow growth, the potential for higher interest rates, volatility in commodity prices, and relatively high valuations may limit significant upside. Fortunately, we are still finding high-conviction investment ideas, with a focus on seeking to limit downside risk in each holding.
Low interest rates and relatively high equity risk premiums enable companies to increase shareholder value by adjusting their capital structures. Separately, with elevated cash levels on corporate balance sheets and dividend payout ratios near historic lows, we expect investors to reward companies that deploy capital wisely, using it to pay for higher dividends, share repurchases and merger and acquisition (M&A) activity. We believe our more conservative portfolio is well positioned for a slow growth environment that should reward sensible capital allocation.
Fixed Income: Many of the world’s large developed economies are burdened with debt-laden government balance sheets, troubling demographics, and undercapitalized financial systems. However, led by a steady expansion in payrolls, the U.S. remains one of the few bright spots for growth in a dull world economy. Still, domestic growth remains uneven with the first quarter only advancing about 0.5% after expanding about 2% on average since the recovery began in 2009. An increasing level of consumer confidence has been offset somewhat by declining business confidence and weak capital spending.
In part due to the impact of sluggish global growth and uncertain markets, the Fed reduced their consensus expectations for future rate increases at the March meeting of the Federal Open Market Committee. Fed expectations are still much too high in future years, in our opinion, but the directional change was noteworthy. We continue to believe that the Treasury market is more accurately reflecting the moderate pace of future rate increases by the Fed, but that yields may have moved a bit lower than they should have based on that change in expectations alone. Rates could move modestly higher, but we do not expect them to reach the levels at which they started the year.
| * | The Blended Balanced Index consists of 60% common stocks represented by the S&P 500 Index and 40% bonds represented by the Barclays Capital Intermediate U.S. Government/Credit Index. |
Opinions expressed are those of the Portfolio Managers as of the date written and are subject to change, are not guaranteed, and should not be considered investment advice or an indication of trading intent.
| HENNESSY FUNDS | 1-800-966-4354 | |
The S&P 500 Index is an unmanaged index commonly used to measure the performance of U.S. stocks. The Barclays Capital Intermediate U.S. Government/Credit Index is an unmanaged index commonly used to measure the performance of U.S. bonds. One cannot invest directly in an index.
Investments in debt securities typically decrease in value when interest rates rise. The risk is greater for longer-term debt securities. Investments by the Fund in lower-rated and non-rated securities presents a greater risk of loss to principal and interest than higher-rated securities. Investments in Asset-Backed and Mortgage-Backed securities include additional risks that investors should be aware of including credit risk, prepayment risk, possible illiquidity and default, as well as increased susceptibility to adverse economic developments. Investments in foreign securities may involve political, economic and currency risks, greater volatility and differences in accounting methods. The Fund may experience higher fees due to investments in pooled investment vehicles (including ETFs).
References to specific securities should not be considered a recommendation to buy or sell any security. Fund holdings and sector allocations are subject to change. Please refer to the Schedule of Investments included in this report for additional portfolio information.
Return on capital is a profitability ratio, which measures the return than an investment generates for shareholders. Dividend payout ratio is calculated as a company’s yearly dividend per share divided by its earnings per share.
Financial Statements
Schedule of Investments as of April 30, 2016 (Unaudited) |
HENNESSY EQUITY AND INCOME FUND
(% of Net Assets)
| TOP TEN HOLDINGS (EXCLUDING CASH/CASH EQUIVALENTS) | % NET ASSETS |
| Berkshire Hathaway, Inc., Class B | 4.25% |
| Visa, Inc., Class A | 3.01% |
| General Dynamics Corp. | 2.86% |
| Carnival Corp. | 2.81% |
| Dollar Tree, Inc. | 2.70% |
| Lowe’s Companies, Inc. | 2.64% |
| Altria Group, Inc. | 2.51% |
| CarMax, Inc. | 2.50% |
| Eli Lilly & Co. | 2.43% |
| Wells Fargo & Co. | 2.42% |
Note: For presentation purposes, the Fund has grouped some of the industry categories. For purposes of categorizing securities for compliance with section 8(b)(1) of the Investment Company Act of 1940, as amended, the Fund uses more specific industry classifications.
| HENNESSY FUNDS | 1-800-966-4354 | |
| | COMMON STOCKS – 60.11% | | Number | | | | | | % of | |
| | | | of Shares | | | Value | | | Net Assets | |
| | Consumer Discretionary – 12.64% | | | | | | | | | |
| | CarMax, Inc. (a) | | | 184,269 | | | $ | 9,757,044 | | | | 2.50 | % |
| | Carnival Corp. (b) | | | 223,200 | | | | 10,947,960 | | | | 2.81 | % |
| | Dollar Tree, Inc. (a) | | | 131,730 | | | | 10,500,198 | | | | 2.70 | % |
| | Lowe’s Companies, Inc. | | | 135,376 | | | | 10,291,283 | | | | 2.64 | % |
| | O’Reilly Automotive, Inc. (a) | | | 29,570 | | | | 7,767,448 | | | | 1.99 | % |
| | | | | | | | | 49,263,933 | | | | 12.64 | % |
| | | | | | | | | | | | | | |
| | Consumer Staples – 5.84% | | | | | | | | | | | | |
| | Altria Group, Inc. | | | 156,347 | | | | 9,804,520 | | | | 2.51 | % |
| | Edgewell Personal Care Co. | | | 88,652 | | | | 7,275,670 | | | | 1.87 | % |
| | The Coca-Cola Co. | | | 126,791 | | | | 5,680,237 | | | | 1.46 | % |
| | | | | | | | | 22,760,427 | | | | 5.84 | % |
| | | | | | | | | | | | | | |
| | Energy – 1.56% | | | | | | | | | | | | |
| | Chevron Corp. | | | 59,361 | | | | 6,065,507 | | | | 1.56 | % |
| | | | | | | | | | | | | | |
| | Financials – 15.04% | | | | | | | | | | | | |
| | Alleghany Corp. (a) | | | 16,480 | | | | 8,590,695 | | | | 2.21 | % |
| | Bank of America Corp. | | | 404,900 | | | | 5,895,344 | | | | 1.51 | % |
| | Berkshire Hathaway, Inc., Class B (a) | | | 113,829 | | | | 16,559,843 | | | | 4.25 | % |
| | BlackRock, Inc. | | | 26,288 | | | | 9,367,203 | | | | 2.40 | % |
| | The Progressive Corp. | | | 268,670 | | | | 8,758,642 | | | | 2.25 | % |
| | Wells Fargo & Co. | | | 189,033 | | | | 9,447,869 | | | | 2.42 | % |
| | | | | | | | | 58,619,596 | | | | 15.04 | % |
| | | | | | | | | | | | | | |
| | Health Care – 4.48% | | | | | | | | | | | | |
| | Bristol-Myers Squibb Co. | | | 110,623 | | | | 7,984,768 | | | | 2.05 | % |
| | Eli Lilly & Co. | | | 125,620 | | | | 9,488,079 | | | | 2.43 | % |
| | | | | | | | | 17,472,847 | | | | 4.48 | % |
| | | | | | | | | | | | | | |
| | Industrials – 9.75% | | | | | | | | | | | | |
| | Deere & Co. | | | 82,920 | | | | 6,974,402 | | | | 1.79 | % |
| | FedEx Corp. | | | 30,638 | | | | 5,058,640 | | | | 1.30 | % |
| | General Dynamics Corp. | | | 79,210 | | | | 11,130,589 | | | | 2.86 | % |
| | General Electric Co. | | | 232,260 | | | | 7,141,995 | | | | 1.83 | % |
| | Norfolk Southern Corp. | | | 85,310 | | | | 7,687,284 | | | | 1.97 | % |
| | | | | | | | | 37,992,910 | | | | 9.75 | % |
The accompanying notes are an integral part of these financial statements.
| | COMMON STOCKS | | Number | | | | | | % of | |
| | | | of Shares | | | Value | | | Net Assets | |
| | Information Technology – 6.50% | | | | | | | | | |
| | Cisco Systems, Inc. | | | 219,456 | | | $ | 6,032,845 | | | | 1.55 | % |
| | International Business Machines Corp. | | | 23,865 | | | | 3,482,858 | | | | 0.89 | % |
| | Microsoft Corp. | | | 82,233 | | | | 4,100,960 | | | | 1.05 | % |
| | Visa, Inc., Class A | | | 151,576 | | | | 11,707,730 | | | | 3.01 | % |
| | | | | | | | | 25,324,393 | | | | 6.50 | % |
| | | | | | | | | | | | | | |
| | Materials – 3.03% | | | | | | | | | | | | |
| | NewMarket Corp. | | | 20,080 | | | | 8,153,685 | | | | 2.09 | % |
| | The Mosaic Co. | | | 130,520 | | | | 3,653,255 | | | | 0.94 | % |
| | | | | | | | | 11,806,940 | | | | 3.03 | % |
| | | | | | | | | | | | | | |
| | Telecommunication Services – 1.27% | | | | | | | | | | | | |
| | Verizon Communications, Inc. | | | 97,358 | | | | 4,959,416 | | | | 1.27 | % |
| | | | | | | | | | | | | | |
| | Total Common Stocks | | | | | | | | | | | | |
| | (Cost $202,276,647) | | | | | | | 234,265,969 | | | | 60.11 | % |
| | | | | | | | | | | | | | |
| | PREFERRED STOCKS – 1.99% | | | | | | | | | | | | |
| | Construction – 0.09% | | | | | | | | | | | | |
| | SCE Trust I | | | 13,655 | | | | 349,431 | | | | 0.09 | % |
| | | | | | | | | | | | | | |
| | Consumer Staples – 0.08% | | | | | | | | | | | | |
| | CHS, Inc. | | | 10,960 | | | | 303,482 | | | | 0.08 | % |
| | | | | | | | | | | | | | |
| | Financials – 1.82% | | | | | | | | | | | | |
| | Aegon N.V. (b) | | | 3,070 | | | | 78,960 | | | | 0.02 | % |
| | Allstate Corp. | | | 12,395 | | | | 341,482 | | | | 0.09 | % |
| | Bank of America Corp. | | | 3,540 | | | | 94,589 | | | | 0.02 | % |
| | Bank of America Corp. (a) | | | 5,015 | | | | 126,579 | | | | 0.03 | % |
| | Bank of New York Mellon Corp. | | | 13,475 | | | | 345,634 | | | | 0.09 | % |
| | BB&T Corp. | | | 13,715 | | | | 346,989 | | | | 0.09 | % |
| | Capital One Financial Corp. | | | 6,805 | | | | 179,720 | | | | 0.05 | % |
| | Capital One Financial Corp. | | | 6,785 | | | | 175,732 | | | | 0.04 | % |
| | Citigroup, Inc. | | | 11,495 | | | | 298,640 | | | | 0.08 | % |
| | Discover Financial Services | | | 13,190 | | | | 348,876 | | | | 0.09 | % |
| | Fannie Mae Preferred (a) | | | 10,600 | | | | 41,234 | | | | 0.01 | % |
| | First Republic Bank San Francisco | | | 10,010 | | | | 264,865 | | | | 0.07 | % |
| | HSBC Finance Corp. | | | 3,090 | | | | 80,155 | | | | 0.02 | % |
| | Huntington Bancshares, Inc. (a) | | | 9,510 | | | | 250,398 | | | | 0.06 | % |
The accompanying notes are an integral part of these financial statements.
| HENNESSY FUNDS | 1-800-966-4354 | |
| | PREFERRED STOCKS | | Number of Shares/ | | | | | | % of | |
| | | | Par Amount | | | Value | | | Net Assets | |
| | Financials (Continued) | | | | | | | | | |
| | ING Groep N.V. (b) | | | 3,185 | | | $ | 81,568 | | | | 0.02 | % |
| | JPMorgan Chase & Co. | | | 13,430 | | | | 351,060 | | | | 0.09 | % |
| | MetLife, Inc. | | | 13,860 | | | | 348,025 | | | | 0.09 | % |
| | Morgan Stanley | | | 11,470 | | | | 304,184 | | | | 0.08 | % |
| | Northern Trust Corp. | | | 13,015 | | | | 351,535 | | | | 0.09 | % |
| | PNC Financial Services Group, Inc. | | | 13,430 | | | | 346,360 | | | | 0.09 | % |
| | Regions Financial Corp. | | | 6,650 | | | | 182,609 | | | | 0.05 | % |
| | Regions Financial Corp. | | | 6,790 | | | | 177,898 | | | | 0.04 | % |
| | State Street Corp. | | | 12,690 | | | | 344,787 | | | | 0.09 | % |
| | SunTrust Banks, Inc. | | | 13,540 | | | | 354,748 | | | | 0.09 | % |
| | The Charles Schwab Corp. | | | 6,765 | | | | 182,384 | | | | 0.05 | % |
| | The Charles Schwab Corp. (a) | | | 6,910 | | | | 179,453 | | | | 0.05 | % |
| | The Goldman Sachs Group, Inc. | | | 8,255 | | | | 211,823 | | | | 0.05 | % |
| | U.S. Bancorp (d) | | | 13,515 | | | | 354,769 | | | | 0.09 | % |
| | Wells Fargo & Co. | | | 13,210 | | | | 350,329 | | | | 0.09 | % |
| | | | | | | | | 7,095,385 | | | | 1.82 | % |
| | Total Preferred Stocks | | | | | | | | | | | | |
| | (Cost $7,741,082) | | | | | | | 7,748,298 | | | | 1.99 | % |
| | | | | | | | | | | | | | |
| | REITS – 0.26% | | | | | | | | | | | | |
| | Financials – 0.26% | | | | | | | | | | | | |
| | Apollo Commercial Real Estate Finance, Inc. | | | 28,000 | | | | 446,040 | | | | 0.12 | % |
| | Chimera Investment Corp. | | | 39,000 | | | | 553,800 | | | | 0.14 | % |
| | | | | | | | | | | | | | |
| | Total REITS | | | | | | | | | | | | |
| | (Cost $1,056,365) | | | | | | | 999,840 | | | | 0.26 | % |
| | | | | | | | | | | | | | |
| | CORPORATE BONDS – 22.41% | | | | | | | | | | | | |
| | Consumer Discretionary – 0.43% | | | | | | | | | | | | |
| | Amazon.com, Inc., 3.300%, 12/05/2021 | | | 1,000,000 | | | | 1,077,395 | | | | 0.28 | % |
| | Comcast Corp., 4.950%, 06/15/2016 | | | 600,000 | | | | 603,010 | | | | 0.15 | % |
| | | | | | | | | 1,680,405 | | | | 0.43 | % |
The accompanying notes are an integral part of these financial statements.
| | CORPORATE BONDS | | Par | | | | | | % of | |
| | | | Amount | | | Value | | | Net Assets | |
| | Consumer Staples – 1.05% | | | | | | | | | |
| | Anheuser-Busch InBev Worldwide, Inc., 7.750%, 01/15/2019 | | | 150,000 | | | $ | 174,740 | | | | 0.05 | % |
| | CVS Health Corp. | | | | | | | | | | | | |
| | 1.900%, 07/20/2018 | | | 1,300,000 | | | | 1,318,589 | | | | 0.34 | % |
| | 2.250%, 12/05/2018 | | | 500,000 | | | | 511,763 | | | | 0.13 | % |
| | 4.125%, 05/15/2021 | | | 1,000,000 | | | | 1,097,731 | | | | 0.28 | % |
| | 5.750%, 06/01/2017 | | | 600,000 | | | | 630,352 | | | | 0.16 | % |
| | Wal-Mart Stores, Inc., 5.000%, 10/25/2040 | | | 300,000 | | | | 363,877 | | | | 0.09 | % |
| | | | | | | | | 4,097,052 | | | | 1.05 | % |
| | | | | | | | | | | | | | |
| | Energy – 0.82% | | | | | | | | | | | | |
| | Canadian Natural Resources Ltd., 3.900%, 02/01/2025 (b) | | | 1,000,000 | | | | 947,008 | | | | 0.24 | % |
| | Chevron Corp., 2.355%, 12/05/2022 | | | 790,000 | | | | 794,199 | | | | 0.20 | % |
| | Encana Corp., 3.900%, 11/15/2021 (b) | | | 1,600,000 | | | | 1,466,000 | | | | 0.38 | % |
| | | | | | | | | 3,207,207 | | | | 0.82 | % |
| | | | | | | | | | | | | | |
| | Financials – 11.93% | | | | | | | | | | | | |
| | American Express Co., 6.150%, 08/28/2017 | | | 1,550,000 | | | | 1,645,657 | | | | 0.42 | % |
| | American International Group, Inc. | | | | | | | | | | | | |
| | 4.875%, 06/01/2022 | | | 1,600,000 | | | | 1,758,542 | | | | 0.45 | % |
| | 5.850%, 01/16/2018 | | | 1,075,000 | | | | 1,154,113 | | | | 0.30 | % |
| | Associates Corporation of North America, 6.950%, 11/01/2018 | | | 300,000 | | | | 334,680 | | | | 0.09 | % |
| | Bank of Montreal, 2.500%, 01/11/2017 (b) | | | 400,000 | | | | 404,249 | | | | 0.10 | % |
| | Bank of New York Mellon Corp., 1.969%, 06/20/2017 | | | 500,000 | | | | 505,483 | | | | 0.13 | % |
| | Bank of Nova Scotia, 2.550%, 01/12/2017 (b) | | | 1,000,000 | | | | 1,011,463 | | | | 0.26 | % |
| | BB&T Corp., 2.300%, 10/15/2018 | | | 1,000,000 | | | | 1,020,113 | | | | 0.26 | % |
| | BlackRock, Inc., 3.500%, 03/18/2024 | | | 1,000,000 | | | | 1,064,840 | | | | 0.27 | % |
| | Boston Properties, Inc., 5.875%, 10/15/2019 | | | 700,000 | | | | 786,446 | | | | 0.20 | % |
| | Capital One Financial Corp., 4.750%, 07/15/2021 | | | 1,500,000 | | | | 1,654,029 | | | | 0.42 | % |
| | Discover Financial Services, 5.200%, 04/27/2022 | | | 900,000 | | | | 974,741 | | | | 0.25 | % |
| | Fifth Third Bancorp | | | | | | | | | | | | |
| | 1.350%, 06/01/2017 | | | 1,000,000 | | | | 1,000,388 | | | | 0.26 | % |
| | 2.375%, 04/25/2019 | | | 1,775,000 | | | | 1,804,657 | | | | 0.46 | % |
| | First Niagara Financial Group, Inc., 6.750%, 03/19/2020 | | | 590,000 | | | | 666,017 | | | | 0.17 | % |
| | Ford Motor Credit Co. LLC, 3.000%, 06/12/2017 | | | 1,750,000 | | | | 1,778,248 | | | | 0.46 | % |
| | Franklin Resources, Inc., 1.375%, 09/15/2017 | | | 1,080,000 | | | | 1,084,089 | | | | 0.28 | % |
| | General Electric Capital Corp. | | | | | | | | | | | | |
| | 1.625%, 04/02/2018 | | | 500,000 | | | | 506,006 | | | | 0.13 | % |
| | 5.625%, 05/01/2018 | | | 550,000 | | | | 600,093 | | | | 0.15 | % |
| | 6.000%, 08/07/2019 | | | 1,610,000 | | | | 1,850,465 | | | | 0.48 | % |
| | JPMorgan Chase & Co., 6.000%, 01/15/2018 | | | 1,000,000 | | | | 1,074,654 | | | | 0.28 | % |
The accompanying notes are an integral part of these financial statements.
| HENNESSY FUNDS | 1-800-966-4354 | |
| | CORPORATE BONDS | | Par | | | | | | % of | |
| | | | Amount | | | Value | | | Net Assets | |
| | Financials (Continued) | | | | | | | | | |
| | KeyCorp | | | | | | | | | |
| | 2.300%, 12/13/2018 | | | 2,600,000 | | | $ | 2,625,069 | | | | 0.67 | % |
| | 5.100%, 03/24/2021 | | | 950,000 | | | | 1,059,515 | | | | 0.27 | % |
| | Lazard Group, 6.850%, 06/15/2017 | | | 56,000 | | | | 58,984 | | | | 0.01 | % |
| | Lincoln National Corp., 6.250%, 02/15/2020 | | | 780,000 | | | | 877,274 | | | | 0.22 | % |
| | Merrill Lynch & Company, Inc., 6.875%, 04/25/2018 | | | 955,000 | | | | 1,047,713 | | | | 0.27 | % |
| | MetLife, Inc., Series A, 6.817%, 08/15/2018 | | | 100,000 | | | | 112,160 | | | | 0.03 | % |
| | Morgan Stanley | | | | | | | | | | | | |
| | 5.500%, 07/28/2021 | | | 2,333,000 | | | | 2,653,426 | | | | 0.68 | % |
| | 6.625%, 04/01/2018 | | | 750,000 | | | | 818,528 | | | | 0.21 | % |
| | PNC Financial Services Group, Inc., 1.600%, 06/01/2018 | | | 1,000,000 | | | | 1,005,357 | | | | 0.26 | % |
| | Qwest Capital Funding, Inc., 6.500%, 11/15/2018 | | | 700,000 | | | | 729,750 | | | | 0.19 | % |
| | Raymond James Financial, Inc., 5.625%, 04/01/2024 | | | 700,000 | | | | 782,785 | | | | 0.20 | % |
| | Royal Bank of Canada, 2.200%, 07/27/2018 (b) | | | 1,000,000 | | | | 1,016,130 | | | | 0.26 | % |
| | Schlumberger Investment SA, 3.650%, 12/01/2023 (b) | | | 1,265,000 | | | | 1,340,150 | | | | 0.35 | % |
| | SunTrust Banks, Inc., 6.000%, 09/11/2017 | | | 250,000 | | | | 264,280 | | | | 0.07 | % |
| | Synchrony Financial, 3.750%, 08/15/2021 | | | 1,200,000 | | | | 1,236,540 | | | | 0.32 | % |
| | The Bear Stearns Companies, Inc., 6.400%, 10/02/2017 | | | 1,350,000 | | | | 1,442,533 | | | | 0.37 | % |
| | The Goldman Sachs Group, Inc. | | | | | | | | | | | | |
| | 5.375%, 03/15/2020 | | | 1,100,000 | | | | 1,223,677 | | | | 0.31 | % |
| | 6.000%, 06/15/2020 | | | 1,500,000 | | | | 1,710,098 | | | | 0.44 | % |
| | The Hartford Financial Services Group, Inc., 5.375%, 03/15/2017 | | | 300,000 | | | | 310,629 | | | | 0.08 | % |
| | Wachovia Corp., 5.750%, 06/15/2017 | | | 850,000 | | | | 892,835 | | | | 0.23 | % |
| | Wells Fargo & Co. | | | | | | | | | | | | |
| | 2.550%, 12/07/2020 | | | 1,000,000 | | | | 1,021,528 | | | | 0.26 | % |
| | 5.625%, 12/11/2017 | | | 1,000,000 | | | | 1,068,402 | | | | 0.28 | % |
| | Westpac Banking Corp., 4.875%, 11/19/2019 (b) | | | 450,000 | | | | 497,956 | | | | 0.13 | % |
| | | | | | | | | 46,474,292 | | | | 11.93 | % |
| | | | | | | | | | | | | | |
| | Health Care – 2.58% | | | | | | | | | | | | |
| | Agilent Technologies, Inc., 5.000%, 07/15/2020 | | | 650,000 | | | | 716,972 | | | | 0.18 | % |
| | Amgen, Inc. | | | | | | | | | | | | |
| | 3.450%, 10/01/2020 | | | 1,000,000 | | | | 1,071,752 | | | | 0.28 | % |
| | 3.625%, 05/22/2024 | | | 1,500,000 | | | | 1,607,642 | | | | 0.41 | % |
| | Anthem, Inc., 2.375%, 02/15/2017 | | | 960,000 | | | | 967,675 | | | | 0.25 | % |
| | Celgene Corp. | | | | | | | | | | | | |
| | 2.300%, 08/15/2018 | | | 1,000,000 | | | | 1,015,122 | | | | 0.26 | % |
| | 3.625%, 05/15/2024 | | | 1,600,000 | | | | 1,669,818 | | | | 0.43 | % |
The accompanying notes are an integral part of these financial statements.
| | CORPORATE BONDS | | Par | | | | | | % of | |
| | | | Amount | | | Value | | | Net Assets | |
| | Health Care (Continued) | | | | | | | | | |
| | Express Scripts Holding Co. | | | | | | | | | |
| | 1.250%, 06/02/2017 | | | 500,000 | | | $ | 499,849 | | | | 0.13 | % |
| | 2.250%, 06/15/2019 | | | 1,250,000 | | | | 1,265,502 | | | | 0.33 | % |
| | 3.500%, 06/15/2024 | | | 700,000 | | | | 712,424 | | | | 0.18 | % |
| | GlaxoSmithKline Capital, Inc., 1.500%, 05/08/2017 (b) | | | 500,000 | | | | 503,380 | | | | 0.13 | % |
| | | | | | | | | 10,030,136 | | | | 2.58 | % |
| | | | | | | | | | | | | | |
| | Information Technology – 1.08% | | | | | | | | | | | | |
| | Apple, Inc., 4.500%, 02/23/2036 | | | 250,000 | | | | 273,051 | | | | 0.07 | % |
| | Applied Materials, Inc., 4.300%, 06/15/2021 | | | 300,000 | | | | 330,754 | | | | 0.08 | % |
| | Corning, Inc. | | | | | | | | | | | | |
| | 1.500%, 05/08/2018 | | | 390,000 | | | | 388,686 | | | | 0.10 | % |
| | 6.625%, 05/15/2019 | | | 695,000 | | | | 783,963 | | | | 0.20 | % |
| | 6.850%, 03/01/2029 | | | 275,000 | | | | 336,495 | | | | 0.09 | % |
| | eBay, Inc., 3.250%, 10/15/2020 | | | 1,000,000 | | | | 1,037,371 | | | | 0.27 | % |
| | Juniper Networks, Inc., 4.600%, 03/15/2021 | | | 1,000,000 | | | | 1,067,464 | | | | 0.27 | % |
| | | | | | | | | 4,217,784 | | | | 1.08 | % |
| | | | | | | | | | | | | | |
| | Manufacturing – 0.36% | | | | | | | | | | | | |
| | Teva Pharmaceutical Financial Co. BV, 2.950%, 12/18/2022 (b) | | | 1,380,000 | | | | 1,388,294 | | | | 0.36 | % |
| | | | | | | | | | | | | | |
| | Materials – 2.17% | | | | | | | | | | | | |
| | Alcoa, Inc., 6.150%, 08/15/2020 | | | 625,000 | �� | | | 665,625 | | | | 0.17 | % |
| | AngloGold Ashanti Holdings PLC, 5.125%, 08/01/2022 (b) | | | 1,000,000 | | | | 1,016,250 | | | | 0.26 | % |
| | Goldcorp, Inc. (b) | | | | | | | | | | | | |
| | 2.125%, 03/15/2018 | | | 1,250,000 | | | | 1,241,577 | | | | 0.32 | % |
| | 3.625%, 06/09/2021 | | | 750,000 | | | | 763,168 | | | | 0.20 | % |
| | Newmont Mining Corp., 3.500%, 03/15/2022 | | | 1,000,000 | | | | 1,016,383 | | | | 0.26 | % |
| | Rio Tinto Finance USA Ltd., 3.750%, 06/15/2025 (b) | | | 1,000,000 | | | | 1,026,972 | | | | 0.26 | % |
| | Rio Tinto Finance USA PLC (b) | | | | | | | | | | | | |
| | 1.375%, 06/17/2016 | | | 1,000,000 | | | | 1,000,480 | | | | 0.26 | % |
| | 2.000%, 03/22/2017 | | | 640,000 | | | | 641,813 | | | | 0.16 | % |
| | The Dow Chemical Co., 4.250%, 11/15/2020 | | | 1,000,000 | | | | 1,091,402 | | | | 0.28 | % |
| | | | | | | | | 8,463,670 | | | | 2.17 | % |
| | | | | | | | | | | | | | |
| | Telecommunication Services – 1.99% | | | | | | | | | | | | |
| | AT&T, Inc. | | | | | | | | | | | | |
| | 3.000%, 02/15/2022 | | | 1,000,000 | | | | 1,024,165 | | | | 0.26 | % |
| | 5.350%, 09/01/2040 | | | 200,000 | | | | 216,155 | | | | 0.06 | % |
| | 5.500%, 02/01/2018 | | | 1,600,000 | | | | 1,713,904 | | | | 0.44 | % |
| | 5.800%, 02/15/2019 | | | 800,000 | | | | 889,225 | | | | 0.23 | % |
| | CenturyLink, Inc., 5.150%, 06/15/2017 | | | 400,000 | | | | 411,500 | | | | 0.10 | % |
| | Deutsche Telekom AG, 6.000%, 07/08/2019 (b) | | | 1,160,000 | | | | 1,309,228 | | | | 0.33 | % |
The accompanying notes are an integral part of these financial statements.
| HENNESSY FUNDS | 1-800-966-4354 | |
| | CORPORATE BONDS | | Par | | | | | | % of | |
| | | | Amount | | | Value | | | Net Assets | |
| | | | | | | | | | | |
| | Telecommunication Services (Continued) | | | | | | | | | |
| | | | | | | | | | | |
| | Verizon Communications, Inc., 2.450%, 11/01/2022 | | | 1,200,000 | | | $ | 1,199,174 | | | | 0.31 | % |
| | Vodafone Group PLC, 1.500%, 02/19/2018 (b) | | | 1,000,000 | | | | 1,000,546 | | | | 0.26 | % |
| | | | | | | | | 7,763,897 | | | | 1.99 | % |
| | Total Corporate Bonds | | | | | | | | | | | | |
| | (Cost $85,668,462) | | | | | | | 87,322,737 | | | | 22.41 | % |
| | | | | | | | | | | | | | |
| | MORTGAGE BACKED SECURITIES – 5.22% | | | | | | | | | | | | |
| | | | | | | | | | | | | | |
| | Federal Home Loan Mortgage Corp. | | | | | | | | | | | | |
| | 1.500%, 04/20/2021 | | | 1,500,000 | | | | 1,501,212 | | | | 0.39 | % |
| | 3.000%, 05/01/2042 | | | 1,238,125 | | | | 1,270,963 | | | | 0.32 | % |
| | 3.000%, 09/01/2042 | | | 2,388,212 | | | | 2,451,799 | | | | 0.63 | % |
| | 5.000%, 05/01/2020 | | | 60,940 | | | | 64,194 | | | | 0.02 | % |
| | 5.500%, 04/01/2037 | | | 127,711 | | | | 144,548 | | | | 0.04 | % |
| | Federal National Mortgage Association | | | | | | | | | | | | |
| | 1.250%, 06/25/2043 | | | 313,983 | | | | 309,357 | | | | 0.08 | % |
| | 1.500%, 03/30/2026 | | | 1,200,000 | | | | 1,197,907 | | | | 0.31 | % |
| | 1.500%, 04/18/2028 | | | 1,000,000 | | | | 991,728 | | | | 0.25 | % |
| | 1.500%, 10/15/2042 | | | 171,874 | | | | 170,591 | | | | 0.04 | % |
| | 1.750%, 02/16/2043 | | | 468,044 | | | | 464,243 | | | | 0.12 | % |
| | 2.000%, 05/23/2033 | | | 1,500,000 | | | | 1,501,131 | | | | 0.38 | % |
| | 2.000%, 11/25/2040 | | | 288,006 | | | | 288,148 | | | | 0.07 | % |
| | 2.000%, 11/25/2041 | | | 182,148 | | | | 183,703 | | | | 0.05 | % |
| | 2.000%, 10/15/2043 | | | 168,170 | | | | 168,160 | | | | 0.04 | % |
| | 2.250%, 03/25/2039 | | | 200,301 | | | | 203,441 | | | | 0.05 | % |
| | 2.400%, 11/07/2024 | | | 1,000,000 | | | | 998,638 | | | | 0.26 | % |
| | 2.500%, 08/15/2040 | | | 645,690 | | | | 659,594 | | | | 0.17 | % |
| | 2.750%, 01/15/2041 | | | 148,263 | | | | 151,076 | | | | 0.04 | % |
| | 3.000%, 09/15/2039 | | | 520,201 | | | | 536,723 | | | | 0.14 | % |
| | 3.000%, 05/15/2043 | | | 525,998 | | | | 545,851 | | | | 0.14 | % |
| | 3.000%, 10/01/2043 | | | 3,472,812 | | | | 3,568,796 | | | | 0.92 | % |
| | 3.500%, 01/01/2042 | | | 723,767 | | | | 760,036 | | | | 0.19 | % |
| | 4.000%, 10/01/2041 | | | 997,743 | | | | 1,069,635 | | | | 0.27 | % |
| | 4.000%, 12/01/2041 | | | 863,133 | | | | 925,324 | | | | 0.24 | % |
| | 4.500%, 08/01/2020 | | | 70,039 | | | | 72,895 | | | | 0.02 | % |
| | 6.000%, 10/01/2037 | | | 137,577 | | | | 157,125 | | | | 0.04 | % |
| | | | | | | | | | | | | | |
| | Total Mortgage Backed Securities | | | | | | | | | | | | |
| | (Cost $20,071,659) | | | | | | | 20,356,818 | | | | 5.22 | % |
| | | | | | | | | | | | | | |
| | U.S. TREASURY OBLIGATIONS – 7.18% | | | | | | | | | | | | |
| | U.S. Treasury Bonds – 0.86% | | | | | | | | | | | | |
| | U.S. Treasury Bonds, 3.625%, 02/15/2044 | | | 2,750,000 | | | | 3,308,594 | | | | 0.85 | % |
| | U.S. Treasury Inflation Index Bond, 0.125%, 07/15/2022 | | | 25,777 | | | | 26,296 | | | | 0.01 | % |
| | | | | | | | | 3,334,890 | | | | 0.86 | % |
The accompanying notes are an integral part of these financial statements.
| | U.S. TREASURY OBLIGATIONS | | Par | | | | | | % of | |
| | | | Amount | | | Value | | | Net Assets | |
| | U.S. Treasury Notes – 6.32% | | | | | | | | | |
| | U.S. Treasury Notes | | | | | | | | | |
| | 1.625%, 06/30/2019 | | | 3,000,000 | | | $ | 3,062,577 | | | | 0.79 | % |
| | 1.625%, 02/15/2026 | | | 3,000,000 | | | | 2,948,085 | | | | 0.75 | % |
| | 2.125%, 05/15/2025 | | | 2,100,000 | | | | 2,159,678 | | | | 0.55 | % |
| | 2.500%, 08/15/2023 | | | 1,835,000 | | | | 1,948,075 | | | | 0.50 | % |
| | 2.750%, 02/15/2024 | | | 6,350,000 | | | | 6,855,269 | | | | 1.76 | % |
| | 3.250%, 03/31/2017 | | | 7,500,000 | | | | 7,681,200 | | | | 1.97 | % |
| | | | | | | | | 24,654,884 | | | | 6.32 | % |
| | Total U.S. Treasury Obligations | | | | | | | | | | | | |
| | (Cost $27,510,665) | | | | | | | 27,989,774 | | | | 7.18 | % |
| | | | | | | | | | | | | | |
| | U.S. GOVERNMENT AGENCY ISSUES – 0.16% | | | | | | | | | | | | |
| | Finance and Insurance- 0.16% | | | | | | | | | | | | |
| | Federal Home Loan Banks, 5.750%, 06/15/2037 | | | 600,000 | | | | 623,411 | | | | 0.16 | % |
| | | | | | | | | | | | | | |
| | Total U.S. Government Agency Issues | | | | | | | | | | | | |
| | (Cost $693,002) | | | | | | | 623,411 | | | | 0.16 | % |
| | | | | | | | | | | | | | |
| | INVESTMENT COMPANIES (EXCLUDING | | | | | | | | | | | | |
| | MONEY MARKET FUNDS) – 0.62% | | | | | | | | | | | | |
| | Ares Capital Corp. | | | 33,000 | | | | 501,270 | | | | 0.13 | % |
| | Calamos Convertible Opportunity and Income Fund | | | 16,000 | | | | 154,400 | | | | 0.04 | % |
| | FS Investment Corp. | | | 78,000 | | | | 726,180 | | | | 0.19 | % |
| | Guggenheim Credit Allocation Fund | | | 34,000 | | | | 657,900 | | | | 0.17 | % |
| | Oha Investment Corp. | | | 8,000 | | | | 22,640 | | | | 0.00 | % |
| | SPDR Barclays Capital High Yield Bond | | | 2,600 | | | | 91,780 | | | | 0.02 | % |
| | SPDR Barclays Short Term High Yield | | | 9,700 | | | | 258,020 | | | | 0.07 | % |
| | Vanguard High-Yield Corporate Fund | | | 3,142 | | | | 17,939 | | | | 0.00 | % |
| | | | | | | | | | | | | | |
| | Total Investment Companies (Excluding | | | | | | | | | | | | |
| | Money Market Funds) | | | | | | | | | | | | |
| | (Cost $2,595,432) | | | | | | | 2,430,129 | | | | 0.62 | % |
The accompanying notes are an integral part of these financial statements.
| HENNESSY FUNDS | 1-800-966-4354 | |
| | SHORT-TERM INVESTMENTS – 0.59% | | Number | | | | | | % of | |
| | | | of Shares | | | Value | | | Net Assets | |
| | Money Market Funds – 0.59% | | | | | | | | | |
| | Fidelity Government Portfolio – Institutional Class, 0.23% (c) | | | 2,287,970 | | | $ | 2,287,970 | | | | 0.59 | % |
| | | | | | | | | | | | | | |
| | Total Short-Term Investments | | | | | | | | | | | | |
| | (Cost $2,287,970) | | | | | | | 2,287,970 | | | | 0.59 | % |
| | | | | | | | | | | | | | |
| | Total Investments | | | | | | | | | | | | |
| | (Cost $349,901,284) – 98.54% | | | | | | | 384,024,946 | | | | 98.54 | % |
| | Other Assets in | | | | | | | | | | | | |
| | Excess of Liabilities – 1.46% | | | | | | | 5,678,662 | | | | 1.46 | % |
| | | | | | | | | | | | | | |
| | TOTAL NET ASSETS – 100.00% | | | | | | $ | 389,703,608 | | | | 100.00 | % |
Percentages are stated as a percent of net assets.
REIT – Real Estate Investment Trust
| (a) | Non-income producing security. |
| (b) | U.S. traded security of a foreign corporation. |
| (c) | The rate listed is the fund’s 7-day yield as of April 30, 2016. |
| (d) | Investment in affiliated security. Quasar Distributors, LLC, which serves as the Fund’s distributor, is a subsidiary of U.S. Bancorp. Details of transactions with this affiliated company for the period ended April 30, 2016, are as follows: |
| | Issuer | | U.S. Bancorp | | |
| | Beginning Cost | | $ | 269,800 | | |
| | Purchase Cost | | $ | 172,068 | | |
| | Sales Cost | | $ | (100,735 | ) | |
| | Ending Cost | | $ | 341,133 | | |
| | Dividend Income | | $ | 7,262 | | |
| | Shares | | | 13,515 | | |
| | Market Value | | $ | 354,769 | | |
The accompanying notes are an integral part of these financial statements.
Summary of Fair Value Exposure at April 30, 2016
The following is a summary of the inputs used to value the Fund’s net assets as of April 30, 2016 (See Note 3 in the accompanying notes to the financial statements):
| Common Stocks | | Level 1 | | | Level 2 | | | Level 3 | | | Total | |
| Consumer Discretionary | | $ | 49,263,933 | | | $ | — | | | $ | — | | | $ | 49,263,933 | |
| Consumer Staples | | | 22,760,427 | | | | — | | | | — | | | | 22,760,427 | |
| Energy | | | 6,065,507 | | | | — | | | | — | | | | 6,065,507 | |
| Financials | | | 58,619,596 | | | | — | | | | — | | | | 58,619,596 | |
| Health Care | | | 17,472,847 | | | | — | | | | — | | | | 17,472,847 | |
| Industrials | | | 37,992,910 | | | | — | | | | — | | | | 37,992,910 | |
| Information Technology | | | 25,324,393 | | | | — | | | | — | | | | 25,324,393 | |
| Materials | | | 11,806,940 | | | | — | | | | — | | | | 11,806,940 | |
| Telecommunication Services | | | 4,959,416 | | | | — | | | | — | | | | 4,959,416 | |
| Total Common Stocks | | $ | 234,265,969 | | | $ | — | | | $ | — | | | $ | 234,265,969 | |
| Preferred Stocks | | | | | | | | | | | | | | | | |
| Construction | | $ | 349,431 | | | $ | — | | | $ | — | | | $ | 349,431 | |
| Consumer Staples | | | 303,482 | | | | — | | | | — | | | | 303,482 | |
| Financials | | | 7,095,385 | | | | — | | | | — | | | | 7,095,385 | |
| Total Preferred Stocks | | $ | 7,748,298 | | | $ | — | | | $ | — | | | $ | 7,748,298 | |
| REITS | | | | | | | | | | | | | | | | |
| Financials | | $ | 999,840 | | | $ | — | | | $ | — | | | $ | 999,840 | |
| Total REITS | | $ | 999,840 | | | $ | — | | | $ | — | | | $ | 999,840 | |
| Corporate Bonds | | | | | | | | | | | | | | | | |
| Consumer Discretionary | | $ | — | | | $ | 1,680,405 | | | $ | — | | | $ | 1,680,405 | |
| Consumer Staples | | | — | | | | 4,097,052 | | | | — | | | | 4,097,052 | |
| Energy | | | — | | | | 3,207,207 | | | | — | | | | 3,207,207 | |
| Financials | | | — | | | | 46,474,292 | | | | — | | | | 46,474,292 | |
| Health Care | | | — | | | | 10,030,136 | | | | — | | | | 10,030,136 | |
| Information Technology | | | — | | | | 4,217,784 | | | | — | | | | 4,217,784 | |
| Manufacturing | | | — | | | | 1,388,294 | | | | — | | | | 1,388,294 | |
| Materials | | | — | | | | 8,463,670 | | | | — | | | | 8,463,670 | |
| Telecommunication Services | | | — | | | | 7,763,897 | | | | — | | | | 7,763,897 | |
| Total Corporate Bonds | | $ | — | | | $ | 87,322,737 | | | $ | — | | | $ | 87,322,737 | |
| Mortgage Backed Securities | | $ | — | | | $ | 20,356,818 | | | $ | — | | | $ | 20,356,818 | |
| U.S. Treasury Obligations | | | | | | | | | | | | | | | | |
| U.S. Treasury Bonds | | $ | — | | | $ | 3,334,890 | | | $ | — | | | $ | 3,334,890 | |
| U.S. Treasury Notes | | | — | | | | 24,654,884 | | | | — | | | | 24,654,884 | |
| Total U.S. Treasury Obligations | | $ | — | | | $ | 27,989,774 | | | $ | — | | | $ | 27,989,774 | |
| U.S. Government Agency Issues | | $ | — | | | $ | 623,411 | | | $ | — | | | $ | 623,411 | |
| Investment Companies (Excluding | | | | | | | | | | | | | | | | |
| Money Market Funds) | | $ | 2,430,129 | | | $ | — | | | $ | — | | | $ | 2,430,129 | |
| Short-Term Investments | | | | | | | | | | | | | | | | |
| Money Market Funds | | $ | 2,287,970 | | | $ | — | | | $ | — | | | $ | 2,287,970 | |
| Total Short-Term Investments | | $ | 2,287,970 | | | $ | — | | | $ | — | | | $ | 2,287,970 | |
| Total Investments | | $ | 247,732,206 | | | $ | 136,292,740 | | | $ | — | | | $ | 384,024,946 | |
Transfers between levels are recognized at the end of the reporting period. During the six-month period ended April 30, 2016, the Fund recognized no transfers between levels.
The accompanying notes are an integral part of these financial statements.
| HENNESSY FUNDS | 1-800-966-4354 | |
Financial Statements
Statement of Assets and Liabilities as of April 30, 2016 (Unaudited) |
| ASSETS: | | | |
| Investments in securities, at value (cost $349,560,151) | | $ | 383,670,177 | |
| Investments in affiliated securities, at value (cost $341,133) | | | 354,769 | |
| Total Investments in securities, at value (cost $349,901,284) | | | 384,024,946 | |
| Dividends and interest receivable | | | 1,396,612 | |
| Receivable for fund shares sold | | | 342,384 | |
| Receivable for securities sold | | | 14,874,963 | |
| Prepaid expenses and other assets | | | 27,874 | |
| Total Assets | | | 400,666,779 | |
| | | | | |
| LIABILITIES: | | | | |
| Due to custodian | | | 13,696 | |
| Payable for fund shares redeemed | | | 171,943 | |
| Payable to advisor | | | 271,045 | |
| Payable to administrator | | | 103,193 | |
| Payable to auditor | | | 10,234 | |
| Accrued distribution fees | | | 31,824 | |
| Accrued service fees | | | 21,208 | |
| Loan payable | | | 10,223,000 | |
| Accrued interest payable | | | 5,360 | |
| Accrued trustees fees | | | 2,434 | |
| Accrued expenses and other payables | | | 109,234 | |
| Total Liabilities | | | 10,963,171 | |
| NET ASSETS | | $ | 389,703,608 | |
| | | | | |
| NET ASSETS CONSIST OF: | | | | |
| Capital stock | | $ | 343,473,479 | |
| Accumulated net investment income | | | 101,665 | |
| Accumulated net realized gain on investments | | | 12,004,802 | |
| Unrealized net appreciation on investments | | | 34,123,662 | |
| Total Net Assets | | $ | 389,703,608 | |
| | | | | |
| NET ASSETS | | | | |
| Investor Class: | | | | |
| Shares authorized (no par value) | | Unlimited | |
| Net assets applicable to outstanding Investor Class shares | | $ | 235,048,749 | |
| Shares issued and outstanding | | | 14,937,576 | |
| Net asset value, offering price and redemption price per share | | $ | 15.74 | |
| | | | | |
| Institutional Class: | | | | |
| Shares authorized (no par value) | | Unlimited | |
| Net assets applicable to outstanding Institutional Class shares | | $ | 154,654,859 | |
| Shares issued and outstanding | | | 10,390,449 | |
| Net asset value, offering price and redemption price per share | | $ | 14.88 | |
The accompanying notes are an integral part of these financial statements.
Financial Statements
Statement of Operations for the six months ended April 30, 2016 (Unaudited) |
| INVESTMENT INCOME: | | | |
| Dividend income | | $ | 3,093,166 | |
| Dividend income from affiliated securities | | | 7,262 | |
| Interest income | | | 1,834,077 | |
| Total investment income | | | 4,934,505 | |
| | | | | |
| EXPENSES: | | | | |
| Investment advisory fees (See Note 5) | | | 1,704,462 | |
| Sub-transfer agent expenses – Investor Class (See Note 5) | | | 331,262 | |
| Sub-transfer agent expenses – Institutional Class (See Note 5) | | | 80,892 | |
| Administration, fund accounting, custody and transfer agent fees (See Note 5) | | | 208,905 | |
| Distribution fees – Investor Class (See Note 5) | | | 202,528 | |
| Service fees – Investor Class (See Note 5) | | | 135,018 | |
| Reports to shareholders | | | 23,663 | |
| Federal and state registration fees | | | 22,967 | |
| Compliance expense | | | 11,790 | |
| Audit fees | | | 10,235 | |
| Trustees’ fees and expenses | | | 6,732 | |
| Interest expense (See Note 6) | | | 6,211 | |
| Legal fees | | | 2,992 | |
| Other expenses | | | 19,038 | |
| Total expenses | | | 2,766,695 | |
| NET INVESTMENT INCOME | | $ | 2,167,810 | |
| | | | | |
| REALIZED AND UNREALIZED GAINS (LOSSES): | | | | |
| Net realized gain on: | | | | |
| Unaffiliated Investments | | $ | 12,119,689 | |
| Affiliated investments | | | 6,789 | |
| Net change in unrealized depreciation on investments | | | (14,090,865 | ) |
| Net loss on investments | | | (1,964,387 | ) |
| NET INCREASE IN NET ASSETS RESULTING FROM OPERATIONS | | $ | 203,423 | |
The accompanying notes are an integral part of these financial statements.
| HENNESSY FUNDS | 1-800-966-4354 | |
(This Page Intentionally Left Blank.)
Financial Statements
| Statements of Changes in Net Assets |
| | | Six Months Ended | | | | |
| | | April 30, 2016 | | | Year Ended | |
| | | (Unaudited) | | | October 31, 2015 | |
| OPERATIONS: | | | | | | |
| Net investment income | | $ | 2,167,810 | | | $ | 4,479,495 | |
| Net realized gain on investments | | | 12,126,478 | | | | 10,940,484 | |
| Net change in unrealized depreciation on investments | | | (14,090,865 | ) | | | (11,492,039 | ) |
| Net increase in net assets resulting from operations | | | 203,423 | | | | 3,927,940 | |
| | | | | | | | | |
| DISTRIBUTIONS TO SHAREHOLDERS FROM: | | | | | | | | |
| Net investment income – Investor Class | | | (1,229,737 | ) | | | (2,652,418 | ) |
| Net investment income – Institutional Class | | | (1,079,859 | ) | | | (1,838,359 | ) |
| Net realized gains – Investor Class | | | (6,952,737 | ) | | | (11,372,184 | ) |
| Net realized gains – Institutional Class | | | (3,988,610 | ) | | | (4,128,029 | ) |
| Total distributions | | | (13,250,943 | ) | | | (19,990,990 | ) |
| | | | | | | | | |
| CAPITAL SHARE TRANSACTIONS: | | | | | | | | |
| Proceeds from shares subscribed – Investor Class | | | 22,899,079 | | | | 135,379,984 | |
| Proceeds from shares subscribed – Institutional Class | | | 18,336,087 | | | | 108,112,772 | |
| Dividends reinvested – Investor Class | | | 8,055,086 | | | | 13,787,702 | |
| Dividends reinvested – Institutional Class | | | 3,669,467 | | | | 4,360,249 | |
| Cost of shares redeemed – Investor Class | | | (80,468,203 | ) | | | (129,944,959 | ) |
| Cost of shares redeemed – Institutional Class | | | (31,422,774 | ) | | | (40,503,901 | ) |
| Net increase (decrease) in net assets derived | | | | | | | | |
| from capital share transactions | | | (58,931,258 | ) | | | 91,191,847 | |
| TOTAL INCREASE (DECREASE) IN NET ASSETS | | | (71,978,778 | ) | | | 75,128,797 | |
| | | | | | | | | |
| NET ASSETS: | | | | | | | | |
| Beginning of period | | | 461,682,386 | | | | 386,553,589 | |
| End of period | | $ | 389,703,608 | | | $ | 461,682,386 | |
| Undistributed net investment income, end of period | | $ | 101,665 | | | $ | 243,451 | |
| | | | | | | | | |
| CHANGES IN SHARES OUTSTANDING: | | | | | | | | |
| Shares sold – Investor Class | | | 1,471,874 | | | | 8,189,500 | |
| Shares sold – Institutional Class | | | 1,254,269 | | | | 6,931,570 | |
| Shares issued to holders as reinvestment | | | | | | | | |
| of dividends – Investor Class | | | 515,061 | | | | 839,879 | |
| Shares issued to holders as reinvestment | | | | | | | | |
| of dividends – Institutional Class | | | 247,862 | | | | 281,456 | |
| Shares redeemed – Investor Class | | | (5,186,399 | ) | | | (7,942,623 | ) |
| Shares redeemed – Institutional Class | | | (2,162,352 | ) | | | (2,624,280 | ) |
| Net increase (decrease) in shares outstanding | | | (3,859,685 | ) | | | 5,675,502 | |
The accompanying notes are an integral part of these financial statements.
| HENNESSY FUNDS | 1-800-966-4354 | |
Financial Statements
For an Investor Class share outstanding throughout each period
| | | Six Months Ended | |
| | | April 30, 2016 | |
| | | (Unaudited) | |
| PER SHARE DATA: | | | |
| Net asset value, beginning of period | | $ | 16.15 | |
| | | | | |
| Income from investment operations: | | | | |
| Net investment income | | | 0.07 | |
| Net realized and unrealized gains (losses) on investments | | | (0.02 | ) |
| Total from investment operations | | | 0.05 | |
| | | | | |
| Less distributions: | | | | |
| Dividends from net investment income | | | (0.07 | ) |
| Dividends from net realized gains | | | (0.39 | ) |
| Total distributions | | | (0.46 | ) |
| Net asset value, end of period | | $ | 15.74 | |
| | | | | |
| TOTAL RETURN | | | 0.32 | %(2) |
| | | | | |
| SUPPLEMENTAL DATA AND RATIOS: | | | | |
| Net assets, end of period (millions) | | $ | 235.05 | |
| Ratio of expenses to average net assets: | | | | |
| Before expense reimbursement | | | 1.44 | %(3) |
| After expense reimbursement | | | 1.44 | %(3) |
| Ratio of net investment income to average net assets: | | | | |
| Before expense reimbursement | | | 0.88 | %(3) |
| After expense reimbursement | | | 0.88 | %(3) |
Portfolio turnover rate(4) | | | 29 | %(2) |
(1) | Calculated based on average shares outstanding method. |
(2) | Not annualized. |
(3) | Annualized. |
(4) | Portfolio turnover is calculated on the basis of the Fund as a whole. |
The accompanying notes are an integral part of these financial statements.
| Year Ended October 31, | |
| 2015 | | | 2014 | | | 2013 | | | 2012 | | | 2011 | |
| | | | | | | | | | | | | | |
| $ | 16.68 | | | $ | 15.77 | | | $ | 13.96 | | | $ | 12.99 | | | $ | 11.93 | |
| | | | | | | | | | | | | | | | | | | |
| | | | | | | | | | | | | | | | | | | |
| | 0.13 | | | | 0.16 | | | | 0.23 | | | | 0.18 | | | | 0.29 | (1) |
| | 0.11 | | | | 1.41 | | | | 1.81 | | | | 0.99 | | | | 1.04 | |
| | 0.24 | | | | 1.57 | | | | 2.04 | | | | 1.17 | | | | 1.33 | |
| | | | | | | | | | | | | | | | | | | |
| | | | | | | | | | | | | | | | | | | |
| | (0.13 | ) | | | (0.16 | ) | | | (0.23 | ) | | | (0.20 | ) | | | (0.27 | ) |
| | (0.64 | ) | | | (0.50 | ) | | | — | | | | — | | | | — | |
| | (0.77 | ) | | | (0.66 | ) | | | (0.23 | ) | | | (0.20 | ) | | | (0.27 | ) |
| $ | 16.15 | | | $ | 16.68 | | | $ | 15.77 | | | $ | 13.96 | | | $ | 12.99 | |
| | | | | | | | | | | | | | | | | | | |
| | 1.43 | % | | | 10.28 | % | | | 14.72 | % | | | 9.01 | % | | | 11.30 | % |
| | | | | | | | | | | | | | | | | | | |
| | | | | | | | | | | | | | | | | | | |
| $ | 292.84 | | | $ | 284.45 | | | $ | 233.25 | | | $ | 196.92 | | | $ | 56.75 | |
| | | | | | | | | | | | | | | | | | | |
| | 1.38 | % | | | 1.33 | % | | | 1.36 | % | | | 1.33 | % | | | 1.54 | % |
| | 1.38 | % | | | 1.33 | % | | | 1.33 | % | | | 1.24 | % | | | 1.24 | % |
| | | | | | | | | | | | | | | | | | | |
| | 0.83 | % | | | 1.01 | % | | | 1.51 | % | | | 1.37 | % | | | 2.03 | % |
| | 0.83 | % | | | 1.01 | % | | | 1.54 | % | | | 1.46 | % | | | 2.33 | % |
| | 39 | % | | | 28 | % | | | 52 | % | | | 34 | % | | | 35 | % |
The accompanying notes are an integral part of these financial statements.
| HENNESSY FUNDS | 1-800-966-4354 | |
Financial Statements
For an Institutional Class share outstanding throughout each period
| | | Six Months Ended | |
| | | April 30, 2016 | |
| | | (Unaudited) | |
| PER SHARE DATA: | | | |
| Net asset value, beginning of period | | $ | 15.28 | |
| | | | | |
| Income from investment operations: | | | | |
| Net investment income | | | 0.09 | |
| Net realized and unrealized gains (losses) on investments | | | (0.02 | ) |
| Total from investment operations | | | 0.07 | |
| | | | | |
| Less distributions: | | | | |
| Dividends from net investment income | | | (0.10 | ) |
| Dividends from net realized gains | | | (0.37 | ) |
| Total distributions | | | (0.47 | ) |
| Net asset value, end of period | | $ | 14.88 | |
| | | | | |
| TOTAL RETURN | | | 0.47 | %(2) |
| | | | | |
| SUPPLEMENTAL DATA AND RATIOS: | | | | |
| Net assets, end of period (millions) | | $ | 154.65 | |
| Ratio of expenses to average net assets: | | | | |
| Before expense reimbursement | | | 1.05 | %(3) |
| After expense reimbursement | | | 1.05 | %(3) |
| Ratio of net investment income to average net assets: | | | | |
| Before expense reimbursement | | | 1.26 | %(3) |
| After expense reimbursement | | | 1.26 | %(3) |
Portfolio turnover rate(4) | | | 29 | %(2) |
(1) | Calculated based on average shares outstanding method. |
(2) | Not annualized. |
(3) | Annualized. |
(4) | Portfolio turnover is calculated on the basis of the Fund as a whole. |
The accompanying notes are an integral part of these financial statements.
| Year Ended October 31, | |
| 2015 | | | 2014 | | | 2013 | | | 2012 | | | 2011 | |
| | | | | | | | | | | | | | |
| $ | 15.80 | | | $ | 14.97 | | | $ | 13.29 | | | $ | 12.38 | | | $ | 11.38 | |
| | | | | | | | | | | | | | | | | | | |
| | | | | | | | | | | | | | | | | | | |
| | 0.19 | | | | 0.20 | | | | 0.25 | | | | 0.22 | | | | 0.32 | (1) |
| | 0.09 | | | | 1.33 | | | | 1.72 | | | | 0.92 | | | | 0.99 | |
| | 0.28 | | | | 1.53 | | | | 1.97 | | | | 1.14 | | | | 1.31 | |
| | | | | | | | | | | | | | | | | | | |
| | | | | | | | | | | | | | | | | | | |
| | (0.19 | ) | | | (0.20 | ) | | | (0.29 | ) | | | (0.23 | ) | | | (0.31 | ) |
| | (0.61 | ) | | | (0.50 | ) | | | — | | | | — | | | | — | |
| | (0.80 | ) | | | (0.70 | ) | | | (0.29 | ) | | | (0.23 | ) | | | (0.31 | ) |
| $ | 15.28 | | | $ | 15.80 | | | $ | 14.97 | | | $ | 13.29 | | | $ | 12.38 | |
| | | | | | | | | | | | | | | | | | | |
| | 1.75 | % | | | 10.60 | % | | | 14.99 | % | | | 9.23 | % | | | 11.62 | % |
| | | | | | | | | | | | | | | | | | | |
| | | | | | | | | | | | | | | | | | | |
| $ | 168.84 | | | $ | 102.10 | | | $ | 85.12 | | | $ | 108.49 | | | $ | 55.28 | |
| | | | | | | | | | | | | | | | | | | |
| | 1.04 | % | | | 1.05 | % | | | 1.06 | % | | | 1.06 | % | | | 1.12 | % |
| | 1.04 | % | | | 1.05 | % | | | 1.06 | % | | | 0.99 | % | | | 0.99 | % |
| | | | | | | | | | | | | | | | | | | |
| | 1.18 | % | | | 1.29 | % | | | 1.95 | % | | | 1.68 | % | | | 2.56 | % |
| | 1.18 | % | | | 1.29 | % | | | 1.95 | % | | | 1.75 | % | | | 2.69 | % |
| | 39 | % | | | 28 | % | | | 52 | % | | | 34 | % | | | 35 | % |
The accompanying notes are an integral part of these financial statements.
| HENNESSY FUNDS | 1-800-966-4354 | |
Financial Statements
Notes to the Financial Statements April 30, 2016 (Unaudited) |
1). ORGANIZATION
The Hennessy Equity and Income Fund (the “Fund”) is a series of Hennessy Funds Trust (the “Trust”), which was organized as a Delaware statutory trust on September 17, 1992. The Fund is an open-end management investment company registered under the Investment Company Act of 1940, as amended. The Fund is a successor to the FBR Balanced Fund (the “Predecessor FBR Fund”), a series of The FBR Funds, a Delaware statutory trust, pursuant to a reorganization that took place after the close of business on October 26, 2012. Prior to October 26, 2012, the Fund had no investment operations. As a result of the reorganization, holders of the Investor Class shares of the Predecessor FBR Fund received Investor Class shares of the Fund (the Investor Class shares of the Fund are the successor to the accounting and performance information of the Predecessor FBR Fund), and holders of the Institutional Class shares of the Predecessor FBR Fund received Institutional Class shares of the Fund (the Institutional Class shares of the Fund are the successor to the accounting and performance information of the Predecessor FBR Fund). The investment objective of the Fund is long-term capital growth and current income. The Fund is a diversified fund.
The Fund offers Investor Class and Institutional Class shares. Each class of shares differs principally in its respective administration, 12b-1 distribution and service, shareholder servicing, and transfer agent expenses and sales charges, if any. Each class has identical rights to earnings, assets, and voting privileges, except for class-specific expenses and exclusive rights to vote on matters affecting only an individual class.
As an investment company, the Fund follows the investment company accounting and reporting guidance of the Financial Accounting Standards Board (“FASB”) Accounting Standard Codification Topic 946 “Financial Services—Investment Companies.”
2). SIGNIFICANT ACCOUNTING POLICIES
The following is a summary of significant accounting policies consistently followed by the Fund in the preparation of the financial statements. These policies are in conformity with U.S. generally accepted accounting principles (“GAAP”).
| a). | Investment Valuation – All investments in securities are recorded at their estimated fair value, as described in Note 3. |
| b). | Federal Income Taxes – Provision for federal income taxes or excise taxes has not been made since the Fund has elected to be taxed as a “regulated investment company” and intends to distribute substantially all of its taxable income to its shareholders and otherwise comply with the provisions of the Internal Revenue Code of 1986, as amended, applicable to regulated investment companies. Net investment income or loss and realized gains and losses for federal income tax purposes may differ from that reported on the financial statements because of temporary book and tax basis differences. Temporary differences are primarily the result of the treatment of wash sales for tax reporting purposes. The Fund recognizes interest and penalties related to income tax benefits, if any, in the statement of operations as an income tax expense. Distributions from net realized gains for book purposes may include short-term capital gains, which are included as ordinary income to shareholders for tax purposes. |
| c). | Income and Expenses – Dividend income is recognized on the ex-dividend date or as soon as information is available to the Fund. Interest income, which includes the amortization of premium and accretion of discount, is recognized on an accrual basis. The Fund is charged for those expenses that are directly attributable to the portfolio, such as advisory, administration, and certain shareholder service fees. Income, expenses (other than expenses attributable to a specific class), and realized and unrealized gains or losses on investments are allocated to each class of shares based on its respective net assets. |
| d). | Distributions to Shareholders – Dividends from net investment income for the Fund, if any, are declared and paid on a calendar quarter basis. Distributions of net realized capital gains, if any, are declared and paid annually, usually in December. |
| e). | Security Transactions – Investment and shareholder transactions are recorded on the trade date. The Fund determines the gain or loss realized from the investment transactions by comparing the original cost of the security lot sold with the net sale proceeds. Discounts and premiums on securities purchased are accreted/amortized over the life of the respective security. |
| f). | Use of Estimates – The preparation of financial statements in conformity with GAAP requires management to make estimates and assumptions that affect the reported amounts of assets and liabilities and disclosure of contingent assets and liabilities at the date of the financial statements and the reported change in net assets during the reporting period. Actual results could differ from those estimates. |
| g). | Share Valuation – The net asset value (“NAV”) per share of the Fund is calculated by dividing the sum of the value of the securities held by the Fund, plus cash or other assets, minus all liabilities (including estimated accrued expenses) by the total number of shares outstanding for the Fund, rounded to the nearest cent. The Fund’s shares will not be priced on days the New York Stock Exchange is closed for trading. The offering and redemption price per share for the Fund is equal to the Fund’s NAV per share. |
| h). | Foreign Currency – Values of investments denominated in foreign currencies, if any, are converted into U.S. dollars using the spot market rate of exchange at the time of valuation. Purchases and sales of investments and income are translated into U.S. dollars using the spot market rate of exchange prevailing on the respective dates of such transactions. The Fund does not isolate the portion of the results of operations resulting from fluctuations in foreign exchange rates on investments from fluctuations resulting from changes in the market prices of securities held. Such fluctuations are included with the net realized and unrealized gain or loss on investments. Foreign investments present additional risks due to currency fluctuations, economic and political factors, lower liquidity, government regulations, differences in accounting standards, and other factors. |
| i). | Forward Contracts – The Fund may enter into forward currency contracts to reduce its exposure to changes in foreign currency exchange rates on its foreign holdings and to lock in the U.S. dollar cost of firm purchase and sale commitments for securities denominated in foreign currencies. A forward currency contract is a commitment to purchase or sell a foreign currency at a future date at a negotiated forward rate. The gain or loss arising from the difference between the U.S. dollar cost of the original contract and the value of the foreign currency in U.S. dollars upon closing of such contract is included in net realized gain or loss from foreign currency transactions. During the six months ended April 30, 2016, the Fund did not enter into any forward contracts. |
| HENNESSY FUNDS | 1-800-966-4354 | |
| j). | Repurchase Agreements – The Fund may enter into repurchase agreements with member banks or security dealers of the Federal Reserve Board whom the investment advisor deems creditworthy. The repurchase price generally equals the price paid by the Fund plus interest negotiated on the basis of current short-term rates. |
| | Securities pledged as collateral for repurchase agreements are held by the custodian bank until the respective agreements mature. Provisions of the repurchase agreements ensure that the market value of the collateral, including accrued interest thereon, is sufficient to cover the repurchase amount in the event of default of the counterparty. If the counterparty defaults and the value of the collateral declines or if the counterparty enters an insolvency proceeding, realization of the collateral by the Fund may be delayed or limited. |
| k). | Accounting for Uncertainty in Income Taxes – The Fund has accounting policies regarding recognition and measurement of tax positions taken or expected to be taken on a tax return. The tax returns of the Fund for the prior three fiscal years are open for examination. The Fund has reviewed all open tax years in major jurisdictions and concluded that there is no impact on the Fund’s net assets and no tax liability resulting from unrecognized tax benefits relating to uncertain income tax positions taken or expected to be taken on a tax return. The Fund’s major tax jurisdictions are U.S. federal and Delaware. |
| l). | Derivatives – The Fund may invest in, or enter into, derivatives, such as options, futures contracts, options on futures contracts, and swaps, for a variety of reasons, including to hedge certain risks, to provide a substitute for purchasing or selling particular securities, or to increase potential income gain. Derivatives are financial contracts based on an underlying or notional amount, require no initial investment or an initial net investment that is smaller than would normally be required to have a similar response to changes in market factors, and require or permit net settlement. Derivatives may allow the Fund to increase or decrease the level of risk to which the Fund is exposed more quickly and efficiently than transactions in other types of instruments. The main purpose of utilizing derivative instruments is for hedging purposes. |
| | The Fund follows the financial accounting reporting rules as required by the Derivatives and Hedging Topic of the FASB Accounting Standards Codification. Under such rules, the Fund is required to include enhanced disclosure that enables investors to understand how and why an entity uses derivatives, how derivatives are accounted for, and how derivatives instruments affect an entity’s results of operations and financial position. During the six months ended April 30, 2016, the Fund did not hold any derivative instruments. |
| m). | New Accounting Pronouncements – In May 2015, the FASB issued ASU No. 2015-07 “Disclosure for Investments in Certain Entities that Calculate Net Asset Value per Share (or Its Equivalent).” The amendments in ASU No. 2015-07 remove the requirement to categorize within the fair value hierarchy investments measured at NAV and require the disclosure of sufficient information to reconcile the fair value of the remaining assets categorized within the fair value hierarchy to the financial statements. The amendments in ASU No. 2015-07 are effective for fiscal years beginning after December 15, 2015, and interim periods within those fiscal years. Management has reviewed the requirements and believes the adoption of ASU 2015-07 will not have a material impact on the Fund’s financial statements and related disclosures. |
3). SECURITIES VALUATION
The Fund follows authoritative fair valuation accounting standards that establish an authoritative definition of fair value and set out a hierarchy for measuring fair value.
These standards require additional disclosures about the various inputs and valuation techniques used to develop the measurements of fair value and a discussion in changes in valuation techniques and related inputs during the period. These inputs are summarized in the three broad levels listed below:
| | Level 1 – | Unadjusted, quoted prices in active markets for identical instruments that the Fund has the ability to access at the date of measurement. |
| | Level 2 – | Other significant observable inputs (including, but not limited to, quoted prices in active markets for similar instruments, quoted prices in markets that are not active for identical or similar instruments, and model-derived valuations in which all significant inputs and significant value drivers are observable in active markets (such as interest rates, prepayment speeds, credit risk curves, default rates, and similar data)). |
| | Level 3 – | Significant unobservable inputs (including the Fund’s own assumptions about what market participants would use to price the asset or liability based on the best available information) when observable inputs are unavailable. |
Following is a description of the valuation techniques applied to the Fund’s major categories of assets and liabilities measured at fair value on a recurring basis.
Equity Securities – Equity securities, including common stocks, preferred stocks, foreign-issued common stocks, exchange-traded funds, closed-end mutual funds, partnerships, rights, and real estate investment trusts, that are traded on a securities exchange for which a last-quoted sales price is readily available will generally be valued at the last sales price as reported by the primary exchange on which the securities are listed. Securities listed on The NASDAQ Stock Market (“NASDAQ”) will generally be valued at the NASDAQ Official Closing Price, which may differ from the last sales price reported. Securities traded on a securities exchange for which a last-quoted sales price is not readily available will generally be valued at the mean between the bid and ask prices. To the extent these securities are actively traded and valuation adjustments are not applied, they are classified in Level 1 of the fair value hierarchy. Securities traded on foreign exchanges generally are not valued at the same time the Fund calculates its NAV because most foreign markets close well before such time. The earlier close of most foreign markets gives rise to the possibility that significant events, including broad market moves, may have occurred in the interim. In certain circumstances, it may be determined that a security needs to be fair valued because it appears that the value of the security might have been materially affected by events occurring after the close of the market in which the security is principally traded, but before the time the Fund calculates its NAV, such as by a development that affects an entire market or region (e.g., weather-related events) or a potentially global development (e.g., a terrorist attack that may be expected to have an effect on investor expectations worldwide).
Registered Investment Companies – Investments in registered investment companies (e.g., mutual funds) are generally priced at the ending NAV provided by the applicable registered investment company’s service agent and will be classified in Level 1 of the fair value hierarchy.
Debt Securities – Debt securities, including corporate bonds, asset-backed securities, mortgage-backed securities, municipal bonds, U.S. Treasuries, and U.S. government agency issues, are generally valued at market on the basis of valuations furnished by an independent pricing service that utilizes both dealer-supplied valuations and formula-based techniques. The pricing service may consider recently executed transactions in securities of the issuer or comparable issuers, market price quotations (where observable), bond spreads, and fundamental data relating to the issuer. In addition, the model may
| HENNESSY FUNDS | 1-800-966-4354 | |
incorporate observable market data, such as reported sales of similar securities, broker quotes, yields, bids, offers, and reference data. Certain securities are valued primarily using dealer quotations. These securities are generally classified in Level 2 of the fair value hierarchy.
Short-Term Securities – Short-term equity investments, including money market funds, are valued in the manner specified above. Short-term debt investments with an original term to maturity of 60 days or less are valued at amortized cost, which approximates fair market value. If the original term to maturity of a short-term debt investment exceeded 60 days, then the values as of the 61st day prior to maturity are amortized. Amortized cost is not used if its use would be inappropriate due to credit or other impairments of the issuer, in which case the security’s fair value would be determined, as described below. Short-term securities are generally classified in Level 1 or Level 2 of the fair market hierarchy depending on the inputs used and market activity levels for specific securities.
The Board of Trustees of the Fund (the “Board”) has adopted fair value pricing procedures that are followed when a price for a security is not readily available or if a significant event has occurred that indicates the closing price of a security no longer represents the true value of that security. Fair value pricing determinations are made in good faith in accordance with these procedures. There are numerous criteria that will be given consideration in determining a fair value of a security, such as the trading volume of a security and markets, the value of other like securities, and news events with direct bearing to a security or markets. Fair value pricing results in an estimated price for a security that reflects the amount the Fund might reasonably expect to receive in a current sale. Depending on the relative significance of the valuation inputs, these securities may be classified in either Level 2 or Level 3 of the fair value hierarchy.
The fair valuation of foreign securities may be determined with the assistance of a pricing service using correlations between the movement of prices of such securities and indices of domestic securities and other appropriate indicators, such as closing market prices of relevant American Depositary Receipts or futures contracts. The effect of using fair value pricing is that the Fund’s NAV will reflect the affected portfolio securities’ value as determined by the Board or its designee instead of being determined by the market. Using a fair value pricing methodology to price foreign securities may result in a value that is different from a foreign security’s most recent closing price and from the prices used by other investment companies to calculate their NAVs and are generally considered Level 2 prices in the fair valuation hierarchy. Because the Fund may invest in foreign securities, the value of the Fund’s portfolio securities may change on days when you will not be able to purchase or redeem your shares.
The Board has delegated day-to-day valuation matters to a Valuation Committee comprised of one or more representatives from Hennessy Advisors, Inc., the Fund’s investment advisor. The function of the Valuation Committee is to value securities where current and reliable market quotations are not readily available. All actions taken by the Valuation Committee are reviewed by the Board.
The Fund has performed an analysis of all existing investments to determine the significance and character of all inputs to their fair value determination. Various inputs are used in determining the value of the Fund’s investments. The inputs or methodology used for valuing securities are not necessarily an indication of the risk associated with investing in those securities. Details related to the fair valuation hierarchy of the Fund’s securities as of April 30, 2016, are included in the Fund’s Schedule of Investments.
4). INVESTMENT TRANSACTIONS
Purchases and sales of investment securities (excluding government and short-term investments) for the Fund during the six months ended April 30, 2016, were $44,350,305 and $103,029,963, respectively.
Purchases and sales/maturities of long-term U.S. government securities for the Fund during the six months ended April 30, 2016, were $12,006,128 and $25,385,501, respectively.
5). INVESTMENT MANAGEMENT FEE AND OTHER TRANSACTIONS WITH AFFILIATES
Hennessy Advisors, Inc. (the “Advisor”) is the investment advisor of the Fund. The Advisor provides the Fund with investment management services under an Investment Advisory Agreement. The Advisor furnishes all investment advice, office space, facilities, and provides most of the personnel needed by the Fund. As compensation for its services, the Advisor is entitled to a monthly fee from the Fund. The fee is based upon the average daily net assets of the Fund at the annual rate of 0.80%. The net investment advisory fees payable by the Fund as of April 30, 2016, were $271,045.
The Advisor has delegated the day-to-day management of the equity allocation of the Fund to The London Company of Virginia, LLC, and has delegated the day-to-day management of the fixed income allocation of the Fund to Financial Counselors, Inc. The Advisor pays the sub-advisor fees for the Fund from its own assets and these fees are not an additional expense of the Fund.
In the past, the Advisor had contractually agreed to limit the total annual operating expenses of the Fund to 1.08% of the Fund’s net assets for both the Investor Class shares and Institutional Class shares of the Fund (excluding interest, taxes, brokerage commissions, dividend expenses, 12b-1 fees, acquired fund fees and expenses, extraordinary legal expenses, or any other extraordinary expenses). The expense limitation agreement for the Fund expired as of February 28, 2015.
For a period of three years after the year in which the Advisor waived or reimbursed expenses, the Advisor may seek reimbursement from the Fund to the extent that total annual fund operating expenses are less than the expense limitation that was in effect at the time the Advisor waived or reimbursed expenses. As of April 30, 2016, cumulative expenses subject to potential recovery under the aforementioned conditions were $39,031 for Investor Class shares, which will expire on October 31, 2016.
The Board has approved a Shareholder Servicing Agreement for the Investor Class shares of the Fund, effective as of February 28, 2015, which was instituted to compensate the Advisor for the non-investment management services it provides to the Fund. The Shareholder Servicing Agreement provides for a monthly fee paid to the Advisor at an annual rate of 0.10% of the average daily net assets of the Fund attributable to Investor Class shares. Shareholder service fees payable by the Fund as of April 30, 2016, were $21,208.
The Fund has adopted a plan pursuant to Rule 12b-1 under the Investment Company Act of 1940, as amended, that authorizes payments in connection with the distribution of the Fund’s shares at an annual rate of up to 0.25% of the Fund’s average daily net assets attributable to Investor Class shares. Even though the authorized rate is up to 0.25%, the Fund has only used up to 0.15% of its average daily net assets attributable to Investor Class shares for such purpose since March 1, 2015. Amounts paid under the plan may be spent on any activities or expenses primarily intended to result in the sale of shares, including, but not limited to, advertising, shareholder account servicing, the printing and mailing of prospectuses to other than current shareholders, the printing and mailing of sales literature, and compensation for sales and marketing activities or to financial institutions and others, such as dealers and distributors.
| HENNESSY FUNDS | 1-800-966-4354 | |
The Fund has entered into agreements with various brokers, dealers, and financial intermediaries in connection with the sale of shares of the Fund. The agreements provide for periodic payments by the Fund to the brokers, dealers, and financial intermediaries for providing certain shareholder maintenance services (sub-transfer agent expenses). These shareholder services include the pre-processing and quality control of new accounts, shareholder correspondence, answering customer inquiries regarding account status, and facilitating shareholder telephone transactions. Fees paid by the Fund to various brokers, dealers, and financial intermediaries during the six months ended April 30, 2016, were $412,154.
U.S. Bancorp Fund Services, LLC (“USBFS”) provides the Fund with administrative, fund accounting, and transfer agent services, and necessary office equipment. As administrator, USBFS is responsible for activities such as (i) preparing various federal and state regulatory filings, reports, and returns for the Fund, (ii) preparing reports and materials to be supplied to the Board, (iii) monitoring the activities of the Fund’s custodian, transfer agent, and accountants, and (iv) coordinating the preparation and payment of the Fund’s expenses and reviewing the Fund’s expense accruals. Fees paid to USBFS during the six months ended April 30, 2016, were $208,905.
U.S. Bank, N.A., an affiliate of USBFS, serves as the Fund’s custodian. Quasar Distributors, LLC acts as the Fund’s principal underwriter in a continuous public offering of the Fund’s shares. Quasar Distributors, LLC is an affiliate of USBFS and U.S. Bank, N.A.
6). LINE OF CREDIT
The Fund has an uncommitted line of credit with the other funds in the Hennessy Funds family of funds (the “Hennessy Funds”) in the amount of the lesser of (i) $100,000,000 or (ii) 33.33% of each Hennessy Fund’s net assets, or 30% for the Hennessy Gas Utility Fund and 10% for the Hennessy Balanced Fund, intended to provide short-term financing, if necessary, subject to certain restrictions, in connection with shareholder redemptions. The credit facility is with the Hennessy Funds’ custodian bank, U.S. Bank, N.A. Borrowings under this arrangement bear interest at the bank’s prime rate and are secured by all of the Fund’s assets (as to its own borrowings only). During the six months ended April 30, 2016, the Fund had an outstanding average daily balance and a weighted average interest rate of $292,346 and 3.44%, respectively. The maximum amount outstanding for the Fund during the period was $13,622,000. At April 30, 2016, the Fund had borrowings of $10,223,000 outstanding under the line of credit.
7). FEDERAL TAX INFORMATION
As of October 31, 2015, the Fund’s most recent fiscal year end, the components of accumulated earnings (losses) for income tax purposes were as follows:
| | Cost of investments for tax purposes | | $ | 414,197,023 | |
| | Gross tax unrealized appreciation | | $ | 60,332,993 | |
| | Gross tax unrealized depreciation | | | (12,240,026 | ) |
| | Net tax unrealized appreciation | | $ | 48,092,967 | |
| | Undistributed ordinary income | | $ | 243,451 | |
| | Undistributed long-term capital gains | | | 10,941,231 | |
| | Total distributable earnings | | $ | 11,184,682 | |
| | Other accumulated gain | | $ | — | |
| | Total accumulated gain | | $ | 59,277,649 | |
The difference between book-basis unrealized appreciation/depreciation (as shown in the Statement of Assets and Liabilities) and tax-basis unrealized appreciation/depreciation (as shown above) is attributable primarily to wash sales.
At October 31, 2015, the Fund’s most recent fiscal year end, the Fund had no tax basis capital losses to offset future capital gains.
At October 31, 2015, the Fund’s most recent fiscal year end, the Fund did not defer, on a tax basis, any late year ordinary losses.
The tax character of distributions paid during fiscal year 2016 (year to date) and fiscal year 2015 for the Fund were as follows:
| | | | Six Months Ended | | | Year Ended | |
| | | | April 30, 2016 | | | October 31, 2015 | |
| | Ordinary income | | $ | 2,309,596 | | | $ | 4,605,202 | |
| | Long-term capital gain | | | 10,941,347 | | | | 15,385,788 | |
| | | | $ | 13,250,943 | | | $ | 19,990,990 | |
| HENNESSY FUNDS | 1-800-966-4354 | |
Expense Example (Unaudited)
April 30, 2016
As a shareholder of the Fund, you incur two types of costs: (1) transaction costs, including sales charges (loads) on purchase payments, reinvested dividends, or other distributions; redemption fees; and exchange fees; and (2) ongoing costs, including management fees; service fees; and other Fund expenses. This Example is intended to help you understand your ongoing costs (in dollars) of investing in the Fund and to compare these costs with the ongoing costs of investing in other mutual funds. The Example is based on an investment of $1,000 invested at the beginning of the period and held for the entire period from November 1, 2015 through April 30, 2016.
Actual Expenses
The first line of the table below under the “Investor Class” and “Institutional Class” headings provides information about actual account values and actual expenses. Although the Fund charges no sales loads or transaction fees, you will be assessed fees for outgoing wire transfers, returned checks and stop payment orders at prevailing rates charged by U.S. Bancorp Fund Services, LLC, the Fund’s transfer agent. If you request that a redemption be made by wire transfer, currently a $15.00 fee is charged by the Fund’s transfer agent. IRA accounts will be charged a $15.00 annual maintenance fee. The example below includes, but is not limited to, management fees, shareholder servicing fees, fund accounting, custody, and transfer agent fees. However, the example below does not include portfolio trading commissions and related expenses, and other extraordinary expenses as determined under generally accepted accounting principles. You may use the information in this line, together with the amount you invested, to estimate the expenses that you paid over the period. Simply divide your account value by $1,000 (for example, an $8,600 account value divided by $1,000 = 8.6), then multiply the result by the number in the first line of the table under the “Investor Class” and “Institutional Class” headings in the column entitled “Expenses Paid During Period” to estimate the expenses you paid on your account during this period.
Hypothetical Example for Comparison Purposes
The second line of the table below under the “Investor Class” and “Institutional Class” headings provides information about hypothetical account values and hypothetical expenses based on the Fund’s actual expense ratios and an assumed rate of return of 5% per year before expenses, which is not the Fund’s actual return. The hypothetical account values and expenses may not be used to estimate the actual ending account balance or expenses you paid for the period. You may use this information to compare the ongoing costs of investing in the Fund and other funds. To do so, compare this 5% hypothetical example with the 5% hypothetical examples that appear in the shareholder reports of the other funds. Please note that the expenses shown in the table are meant to highlight your ongoing costs only and do not reflect any transactional costs, such as sales charges (loads), or exchange fees. Therefore, the second line of the table under the “Investor Class” and “Institutional Class” headings is useful in comparing ongoing costs only, and will not help you determine the relative total costs of owning different funds. In addition, if these transactional costs were included, your costs would have been higher.
| | | | Expenses Paid |
| | Beginning | Ending | During Period(1) |
| | Account Value | Account Value | November 1, 2015 – |
| | November 1, 2015 | April 30, 2016 | April 30, 2016 |
| Investor Class | | | |
| Actual | $1,000.00 | $1,003.20 | $7.17 |
| Hypothetical (5% return before expenses) | $1,000.00 | $1,017.70 | $7.22 |
| | | | |
| Institutional Class | | | |
| Actual | $1,000.00 | $1,004.70 | $5.23 |
| Hypothetical (5% return before expenses) | $1,000.00 | $1,019.64 | $5.27 |
(1) | Expenses are equal to the Fund’s annualized expense ratio of 1.44% for Investor Class shares or 1.05% for Institutional Class shares, as applicable, multiplied by the average account value over the period, multiplied by 182/366 days (to reflect one-half year period). |
| HENNESSY FUNDS | 1-800-966-4354 | |
How to Obtain a Copy of the Fund’s
Proxy Voting Policy and Proxy Voting Records
A description of the policies and procedures the Fund uses to determine how to vote proxies relating to portfolio securities is available without charge: (1) by calling 1-800-966-4354; (2) on the Hennessy Funds’ website at hennessyfunds.com/proxy-voting/policy.fs; or (3) on the U.S. Securities and Exchange Commission’s website at www.sec.gov. The Fund’s proxy voting record is available without charge on both the Hennessy Funds’ website at hennessyfunds.com/proxy-voting/policy.fs and the SEC’s website at www.sec.gov no later than August 31 for the prior 12 months ending June 30.
Quarterly Filings on Form N-Q
The Fund files its complete schedule of portfolio holdings with the SEC for the first and third quarters of each fiscal year on Form N-Q. The Fund’s Form N-Q will be available on the SEC’s website at www.sec.gov. The Fund’s Form N-Q may be reviewed and copied at the SEC’s Public Reference Room in Washington, DC and information on the operation of the Public Reference Room may be obtained by calling 1-800-SEC-0330. Information included in the Fund’s N-Q will also be available upon request by calling 1-800-966-4354.
Federal Tax Distribution Information
(Unaudited)
For the fiscal year ended October 31, 2015, certain dividends paid by the Fund may be subject to a maximum tax rate of 23.8%, as provided for by the Jobs and Growth Tax Relief Reconciliation Act of 2003. The percentage of dividends declared from ordinary income designated as qualified dividend income was 100.00%.
For corporate shareholders, the percent of ordinary income distributions that qualified for the corporate dividends received deduction for the fiscal year ended October 31, 2015 was 100.00%.
The percentage of taxable ordinary income distributions that are designated as short-term capital gain distributions under Section 871(k)(2)(C) of the Internal Revenue Code of 1986, as amended, for the Fund was 2.48%.
Householding
To help keep the Fund’s costs as low as possible, we generally deliver a single copy of most financial reports and prospectuses to shareholders who share an address, even if the accounts are registered under different names. This process, known as “householding,” does not apply to account statements. You may, of course, request an individual copy of a prospectus or financial report at any time. If you would like to receive separate mailings, please call the Administrator at 1-800-261-6950 or 1-414-765-4124 and we will begin individual delivery within 30 days of your request. If your account is held through a financial institution or other intermediary, please contact them directly to request individual delivery.
Board Approval of Investment Advisory
Agreements
At its meeting on March 9, 2016, the Board of Trustees of the Fund (the “Board,” and the members thereof, the “Trustees”) unanimously approved the continuation of the investment advisory agreement of the Fund with Hennessy Advisors, Inc. (the “Advisor”) and the sub-advisory agreement for the equity allocation of the Fund between the Advisor and The London Company, LLC, and the sub-advisory agreement for the fixed income allocation of the Fund between the Advisor and Financial Counselors, Inc. (with The London Company, LLC and Financial Counselors, Inc. herein referred to as individually as a “Sub-Advisor” and together as the “Sub-Advisors”). As part of the process of approving the continuation of the advisory and sub-advisory agreements, the Trustees reviewed their fiduciary duties with respect to approving the advisory and sub-advisory agreements and the relevant factors for them to consider. In addition, the Trustees who are not deemed “interested persons” (as that term is defined by the Investment Company Act of 1940) of the Fund (the “Independent Trustees”) met in executive session to discuss the approval of the advisory and sub-advisory agreements.
In advance of the meeting, the Advisor sent detailed information to the Trustees to assist them in their evaluation of the advisory and sub-advisory agreements. This information included, but was not limited to, (i) a memorandum from outside legal counsel that described the fiduciary duties of the Board with respect to approving the continuation of the advisory and sub-advisory agreements and the relevant factors for consideration, (ii) a memorandum from the Advisor that listed the factors relevant to the Board’s approval of the continuation of the advisory and sub-advisory agreements and also referenced the documents that had been provided to help the Board assess each such factor, (iii) an inventory of the range of services provided by the Advisor and the Sub-Advisors for the Fund, (iv) a written discussion of economies of scale, (v) the advisory and sub-advisory agreements, (vi) a recent Fund fact sheet, (vii) a peer expense comparison, (viii) performance information, (ix) the Advisor’s most recent Form 10-K and Form 10-Q, which included information about the Advisor’s profitability, (x) information about brokerage commissions, (xi) information about the Fund’s compliance program, (xii) the Advisor’s current Form ADV Part I, (xiii) a completed questionnaire from each Sub-Advisor and summary thereof, (xiv) each Sub-Advisor’s Code of Ethics, and (xv) each Sub-Advisor’s Form ADV Parts I and II, and (xvi) other information the Trustees believed was useful in evaluating the approval of the continuation of the advisory and sub-advisory agreements.
All of the factors discussed by the Trustees were considered as a whole, and were considered separately by the Independent Trustees, meeting in executive session. The factors were viewed in their totality by the Trustees, with no single factor being the principal or determinative factor in the Trustees’ determination of whether to approve the continuation of the advisory and sub-advisory agreements. The Trustees recognized that the management and fee arrangements for the Fund are the result of years of review and discussion between the Independent Trustees and the Advisor, that certain aspects of such arrangements may receive greater scrutiny in some years than in others, and that the Trustees’ conclusions may be based, in part, on their consideration of these same arrangements and information received during the course of the year and in prior years.
Prior to approving the continuation of the advisory and sub-advisory agreements, the Trustees and the Independent Trustees in executive session considered, among other items:
| HENNESSY FUNDS | 1-800-966-4354 | |
| | • | The nature and quality of the advisory services provided by the Advisor and the Sub-Advisors. |
| | • | A comparison of the fees and expenses of the Fund to other similar funds. |
| | • | Whether economies of scale are recognized by the Fund. |
| | • | The costs and profitability of the Fund to the Advisor and the Sub-Advisors. |
| | • | The performance of the Fund. |
| | • | The other benefits to the Advisor and the Sub-Advisors from serving as an investment advisor to the Fund (in addition to the advisory and sub-advisory fees). |
The material considerations and determinations of the Board of Trustees, including all of the Independent Trustees, are as follows:
| | • | The Board considered the services identified below that are provided by the Advisor. Based on this review, the Trustees believe that the Advisor provides high-quality services to the Fund, and they noted that their overall confidence in the Advisor is high. The Trustees also concluded that they were satisfied with the nature, extent, and quality of the advisory services provided to the Fund by the Advisor, and that the nature and extent of the services provided by the Advisor are appropriate to assure that the Fund’s operations are conducted in compliance with applicable laws, rules, and regulations. |
| | | • | The Advisor oversees the Sub-Advisors for the Fund and the Sub-Advisors act as the portfolio manager for the Fund. |
| | | • | The Advisor performs a daily reconciliation of portfolio positions and cash for the Fund. |
| | | • | The Advisor monitors the Fund’s compliance with its investment objectives and restrictions. |
| | | • | The Advisor monitors compliance with federal securities laws and performs activities such as maintaining a compliance program, conducting ongoing reviews of the compliance programs of the Sub-Advisors and the Fund’s other service providers, conducting on-site visits to the Sub-Advisors and the Fund’s other service providers, monitoring incidents of abusive trading practices, reviewing Fund expense accruals, payments, and fixed expense ratios, evaluating insurance providers for fidelity bond coverage and D&O/E&O insurance coverage, conducting employee compliance training, reviewing reports provided by service providers, maintaining books and records, and preparing an annual compliance report to the Board. |
| | | • | The Advisor oversees the selection and continued employment of each Sub-Advisor, monitors each Sub-Advisor’s adherence to the Fund’s investment objectives, policies, and restrictions, and reviews the Fund’s investment performance. |
| | | • | The Advisor oversees service providers that provide accounting, administration, distribution, transfer agency, custodial, sales and marketing, public relations, audit, information technology, and legal services to the Fund. |
| | | • | The Advisor maintains in-house marketing and distribution departments on behalf of the Fund. |
| | | • | The Advisor is actively involved with preparing regulatory filings for the Fund, including writing and annually updating the Fund’s prospectus and related documents. |
| | | • | The Advisor reviews the written summaries prepared by the Sub-Advisors of the Fund’s performance for the most recent six-month period or twelve-month period, as applicable, for each semi-annual and annual report of the Fund. |
| | | • | The Advisor oversees distribution of the Fund through third-party broker/dealers and independent financial institutions such as Charles Schwab, Inc., Fidelity, TD Waterhouse, and Pershing. The Advisor participates in “no transaction fee” (“NTF”) programs with these companies on behalf of the Fund, which allow customers to purchase the Fund through third-party distribution channels without paying a transaction fee. The Advisor compensates, in part, a number of these third-party providers of NTF programs out of its own revenues. |
| | | • | The Advisor pays the incentive compensation of the Fund’s compliance officers and employs other staff, such as management executives, legal personnel, marketing personnel, national accounts and distribution personnel, sales personnel, administrative personnel, and trading oversight personnel. |
| | | • | The Advisor provides a quarterly compliance certification to the Board. |
| | | • | The Advisor prepares or reviews Board materials, frequently presents to the Board or leads Board discussions, prepares or reviews meeting minutes, and arranges for Board training and education. |
| | • | The Board considered the services identified below that are provided by each Sub-Advisor: |
| | | • | Each Sub-Advisor acts as the portfolio manager for the Fund. In this capacity, each Sub-Advisor does the following: |
| | | | • | manages the composition of the Fund’s portfolio, including the purchase, retention, and disposition of portfolio securities in accordance with the Fund’s investment objectives, policies, and restrictions; |
| | | | • | ensures compliance with “best execution” for the Fund’s portfolio; |
| | | | • | manages the use of soft dollars for the Fund; and |
| | | | • | manages proxy voting for the Fund. |
| | | • | Each Sub-Advisor ensures that its compliance program includes policies and procedures relevant to the Fund and the Sub-Advisor’s duties as a portfolio manager to the Fund. |
| | | • | Each Sub-Advisor prepares a written summary of the Fund’s performance (with respect to the equity allocation or the fixed income allocation, as applicable) for the most recent six-month period or twelve-month period, as applicable, for each semi-annual and annual report of the Fund. |
| | | • | Each Sub-Advisor provides a quarterly compliance certification to the Board regarding trading and allocation practices, supervisory matters, the Sub-Advisor’s compliance program (including its code of ethics), compliance with the Fund’s policies, and general firm updates. |
| | • | The Board considered the distinction between the services performed by the Advisor and the Sub-Advisors. It noted that the management of the Fund, including the oversight of the Sub-Advisors, involves more comprehensive and substantive duties than the duties of the Sub-Advisors. Specifically, the Board considered the lists of services identified above and concluded that the services performed by the Advisor for the Fund require a higher level of service and |
| HENNESSY FUNDS | 1-800-966-4354 | |
| | | oversight than the services performed by the Sub-Advisors. Based on this determination, the Board concluded that the differential in advisory fees between the Advisor and the Sub-Advisors is reasonable. |
| | • | The Board compared the performance of the Fund to benchmark indices over various periods of time and they noted that at each quarterly meeting, the Trustees review reports comparing the investment performance of the Fund to various indices. Based on the information provided at the meeting and the information and quarterly discussions regarding the Fund’s investment performance, the Trustees believe that the Advisor and the Sub-Advisors manage the Fund in a manner that is materially consistent with its stated investment objective and style. The Trustees concluded that the performance of the Fund over various time horizons warranted the continuation of the advisory and sub-advisory agreements. |
| | • | The Board reviewed the advisory fees and overall expense ratios of the Fund and comparable funds using data from Morningstar with respect to funds similar in asset size and investment objective to the Fund. As part of the discussion with management, the Trustees ensured that they understood and were comfortable with the criteria used to determine the mutual funds included in the Morningstar categories for purposes of the materials considered at the meeting. The Board determined that the advisory fee and overall expense ratio of the Fund falls within the range of the advisory fees and overall expense ratios of other comparable funds and concluded that they are reasonable and warranted continuation of the advisory and sub-advisory agreements. |
| | • | The Board also considered whether economies of scale were being realized by the Advisor that should be shared with the Fund’s shareholders. The Trustees noted that many of the expenses incurred to manage the Fund are asset-based fees and thus do not result in material economies of scale being realized as the net assets of the Fund increase. For example, intermediary service fees increase as the Fund’s assets grow. The Trustees also considered the Advisor’s efforts to contain expenses, and took into account the Advisor’s significant marketing efforts to increase Fund assets. The Board noted that at current asset levels it did not appear that there were economies of scale being realized by the Advisor and concluded that it would continue to monitor economies of scale in the future as circumstances changed. |
| | • | The Board considered the profitability of the Advisor and the Sub-Advisors, including the impact of intermediary service fees on the Advisor’s profitability, and also considered the resources and revenues that the Advisor has put into managing and distributing the Fund. The Board then concluded that the profits of the Advisor and the Sub-Advisors are reasonable and not excessive when compared to profitability guidelines set forth in relevant court cases. |
| | • | The Board considered the high level of professionalism and knowledge of the Advisor’s employees, along with a very low level of turnover, and concluded that this was beneficial to the Fund and its shareholders. |
| | • | The Board considered other benefits to the Advisor and the Sub-Advisors from serving as an advisor to the Fund (in addition to the advisory fee or sub-advisory fees). The Board noted that the Advisor and the Sub-Advisors may derive ancillary benefits from, by way of example, their association with the Fund in the form of proprietary and third-party research products and services received from broker dealers that execute portfolio trades for the Fund. The Board determined that any |
| | | such products and services have been used for legitimate purposes relating to the Fund by providing assistance in the investment decision-making process. The Trustees concluded that the other benefits realized by the Advisor and the Sub-Advisors from their relationship with the Fund were reasonable. |
After reviewing the materials provided at the meeting and management’s presentation, as well as other information regularly provided at the Board’s quarterly meetings throughout the year regarding the quality of services provided by the Advisor and the Sub-Advisors, the performance of the Fund, expense information, regulatory compliance issues, trading information and related matters, and other factors deemed relevant by the Board, the Trustees, including all of the Independent Trustees, approved the continuation of the advisory and sub-advisory agreements.
| HENNESSY FUNDS | 1-800-966-4354 | |
For information, questions or assistance, please call
The Hennessy Funds
1-800-966-4354 or 1-415-899-1555
INVESTMENT ADVISOR
Hennessy Advisors, Inc.
7250 Redwood Blvd., Suite 200
Novato, California 94945
ADMINISTRATOR,
TRANSFER AGENT,
DIVIDEND PAYING AGENT &
SHAREHOLDER SERVICING AGENT
U.S. Bancorp Fund Services, LLC
P.O. Box 701
Milwaukee, Wisconsin 53201-0701
CUSTODIAN
U.S. Bank N.A.
Custody Operations
1555 North River Center Dr., Suite 302
Milwaukee, Wisconsin 53212
TRUSTEES
Neil J. Hennessy
Robert T. Doyle
J. Dennis DeSousa
Gerald P. Richardson
COUNSEL
Foley & Lardner LLP
777 East Wisconsin Avenue
Milwaukee, Wisconsin 53202-5306
INDEPENDENT REGISTERED
PUBLIC ACCOUNTING FIRM
Tait, Weller & Baker LLP
1818 Market Street, Suite 2400
Philadelphia, Pennsylvania 19103
DISTRIBUTOR
Quasar Distributors, LLC
615 East Michigan Street
Milwaukee, Wisconsin 53202
hennessyfunds.com | 1-800-966-4354
This report has been prepared for shareholders and may be distributed to
others only if preceded or accompanied by a current prospectus.
SEMI-ANNUAL REPORT
APRIL 30, 2016
HENNESSY BALANCED
FUND
Investor Class HBFBX
hennessyfunds.com | 1-800-966-4354
(This Page Intentionally Left Blank.)
Contents
| Letter to Shareholders | 2 |
| Performance Overview | 4 |
| Financial Statements | |
| Schedule of Investments | 6 |
| Statement of Assets and Liabilities | 9 |
| Statement of Operations | 10 |
| Statements of Changes in Net Assets | 11 |
| Financial Highlights | 12 |
| Notes to the Financial Statements | 14 |
| Expense Example | 20 |
| Proxy Voting | 21 |
| Quarterly Filings on Form N-Q | 21 |
| Federal Tax Distribution Information | 21 |
| Householding | 21 |
| Board Approval of Investment Advisory Agreement | 22 |
| HENNESSY FUNDS | 1-800-966-4354 | |
June 2016
Dear Hennessy Funds Shareholder:
I used to tell my kids, “What doesn’t kill you makes you stronger.” Perhaps that is not the best analogy for investing, but in the face of such roller coaster volatility in the financial markets, it seems to me that what hasn’t killed this bull market rally may just make it stronger. The financial markets brought us flat to modest returns during the six months ended April 30, 2016, with the S&P 500 Index returning 0.43% and the Dow Jones Industrial Average (DJIA) returning 1.98% during the period. These six months were marked by high volatility, the onslaught of more and more regulatory hurdles, the Fed stuck in neutral, fears about the global economy, and wild political rhetoric — all headwinds that I believe could have significantly stalled any positive moves in the market, but didn’t. Even the aggressive pull back in January showed just how skittish the market can be, and yet again the markets showed great resiliency and marched right back.
I continue to be impressed with the persistence of the bull market in U.S. equities, now in its seventh year. Many commentators believe that the U.S. economy is due for a recession, and the market is due for a downturn. However, we find ourselves comparing today’s secular market to the bull run of 1982 to 2000, which was powered by a significant increase in valuations. On March 9th of this year, I took a moment to remember how we all felt seven years ago on March 9, 2009, at the bottom of the financial crisis downturn that had wiped out trillions of dollars’ worth of U.S. equities. I explained to our investors then, and I say the same thing today, I believe that if you invest in quality companies with good fundamentals, over the long term, you should do fine.
If history is any kind of guide, then I think this bull market has some room to run. Rising markets usually fall when there is extreme optimism or euphoria. I haven’t witnessed any of that as of yet. The volatility has unnerved many, but I encourage investors to try to remain focused on investment fundamentals. Many U.S. companies continue to find ways to make a profit and build their already strong balance sheets. Unemployment is low, and wages are rising in real terms, supporting consumer confidence and consumption. With an average price-to-sales ratio of only 1.7x and a dividend yield of approximately 2.5% for the Dow, I believe U.S. equities continue to be attractive. In my opinion, there are many compelling reasons why this market can continue to climb even higher.
The next six months may be fraught with more talk about what the Fed will do, who the next President of the United States will be, and what is happening in China and around the globe. Businesses in every industry, including the asset management business, have concerns about increasing regulatory burdens, taxes, and higher healthcare costs. But, I still believe the ingenuity and perseverance of American business will find ways to endure and to thrive.
Thank you for your continued confidence and investment in our products. If you have any questions or would like to speak with us directly, please don’t hesitate to call us at (800) 966-4354.
Best regards,
Neil J. Hennessy
President and Chief Investment Officer
Past performance does not guarantee future results.
Mutual fund investing involves risk. Principal loss is possible.
Opinions expressed are those of Neil Hennessy and are subject to change, are not guaranteed and should not be considered investment advice.
Price-to-sales ratio is a tool for calculating a stock’s valuation relative to other companies. It is calculated by dividing a stock’s current price by its revenue per share. Dividend yield is calculated as the annual dividends paid by a company divided by its market price per share.
The Dow Jones Industrial Average and S&P 500 Index are unmanaged indices commonly used to measure the performance of U.S. stocks. One cannot invest directly in an index.
| HENNESSY FUNDS | 1-800-966-4354 | |
Performance Overview (Unaudited)
AVERAGE ANNUAL TOTAL RETURN FOR PERIODS ENDED APRIL 30, 2016
| | Six | One | Five | Ten |
| | Months(1) | Year | Years | Years |
| Hennessy Balanced Fund (HBFBX) | 3.29% | 2.28% | 4.60% | 3.88% |
50/50 Blended DJIA/Treasury Index(2) | 1.25% | 1.60% | 5.00% | 4.77% |
| Dow Jones Industrial Average | 1.98% | 2.25% | 9.52% | 7.34% |
Expense ratio: 1.68%
Performance data quoted represents past performance; past performance does not guarantee future results. The investment return and principal value of an investment will fluctuate so that an investor’s shares, when redeemed, may be worth more or less than their original cost. The performance table does not reflect the deduction of taxes that a shareholder would pay on Fund distributions or the redemption of Fund shares. Current performance of the Fund may be lower or higher than the performance quoted. Performance data current to the most recent month end may be obtained by visiting hennessyfunds.com.
The expense ratio presented is from the most recent prospectus.
(1) | Periods less than one year are not annualized. |
(2) | The 50/50 Blended DJIA/Treasury Index consists of 50% common stocks represented by the Dow Jones Industrial Average and 50% short-duration Treasury securities represented by the BofA Merrill Lynch 1-year U.S. Treasury Note Index. |
PERFORMANCE NARRATIVE
Portfolio Managers Neil J.Hennessy and Brian E.Peery
Performance:
For the six-month period ended April 30, 2016, the Hennessy Balanced Fund returned 3.29%, outperforming both the 50/50 Blended DJIA/Treasury Index* and the Dow Jones Industrial Average, which returned 1.25% and 1.98% for the same period, respectively.
The Fund outperformed its primary benchmark, the 50/50 Blended DJIA/Treasury Index,* as a result of both sector allocation and stock selection. Two of the largest contributors to the Fund’s relative outperformance were McDonald’s Corporation and General Electric Company, both of which were overweight in the portfolio compared to the benchmark. Pfizer, Inc., which was also overweight versus the benchmark, was the largest detractor to overall performance. From a sector perspective, an overweight position in the Energy sector as oil prices rebounded, and an underweight position in the Financials sector, also aided performance. The Fund continues to hold General Electric, McDonald’s and Pfizer.
Good returns from the equity investments in the portfolio more than offset a negative relative contribution from the Government Securities portion of the portfolio.
Portfolio Strategy:
The Fund invests approximately 50% of its assets in the “Dogs of the Dow,” the 10 highest dividend-yielding Dow stocks, and 50% of its assets in U.S. Treasuries. As a result of this “balanced” strategy, the Fund may be expected to underperform equities in periods when markets rise and outperform in periods when markets fall. The Fund is designed to allow investors to gain some exposure to the equity market while maintaining a significant share of their investment in fixed income securities. We believe the Fund is well positioned for the more conservative investor, as the equity portion of the portfolio is
invested in what we would deem to be high-quality companies, each with a historically high dividend yield. The relatively short duration of the 50% weighting of U.S. Treasuries in the portfolio (all less than one year) may allow us the ability to roll into higher yielding Treasuries in the event yields rise.
Market Outlook:
Over the six-month period ended April 30, 2016, U.S. equities, as measured by the S&P 500 Index, produced an essentially flat return. The period was, however, once again marked by a great deal of volatility, with major market indices dropping more than 10% at one point early in the year before recovering all of their losses. Throughout this period, there have been concerns about interest rates, commodity prices, economic growth (both domestic and international) and the U.S. Presidential election. Many, if not all, of these concerns still exist in the marketplace today, but we have reasons to be hopeful for the remainder of the year.
We believe the basic fundamentals of the market are attractive, and we continue to be optimistic about the possibility of further moderate market advances over the course of the year. We do not believe stocks are expensive at this point, though many are probably fairly valued. The Dow Jones Industrial Average and the S&P 500 Index have forward PE ratios of 16.5x and 17x, respectively, close to long-term averages. Corporate balance sheets appear to be in excellent shape, and while executives have shown some reluctance to increase capital spending beyond maintenance levels this cycle, we believe companies outside of the Energy sector will eventually start investing for expansion.
| * | The 50/50 Blended DJIA/Treasury Index consists of 50% common stocks represented by the Dow Jones Industrial Average and 50% short duration Treasury securities represented by the BofA Merrill Lynch 1-Year U.S. Treasury Note Index. |
Opinions expressed are those of the Portfolio Managers as of the date written and are subject to change, are not guaranteed, and should not be considered investment advice or an indication of trading intent.
The S&P 500 Index and Dow Jones Industrial Average are unmanaged indices commonly used to measure the performance of U.S. stocks. The BofA Merrill Lynch 1-Year U.S. Treasury Note Index is an unmanaged index comprised of Treasury securities maturing in approximately one year. One cannot invest directly in an index.
The Fund is non-diversified, meaning it may concentrate its assets in fewer individual holdings than a diversified fund, making it more exposed to individual stock volatility than a diversified fund. The Fund’s formula-based strategy may cause the Fund to buy or sell securities at times when it may not be advantageous.
References to specific securities should not be considered a recommendation to buy or sell any security. Fund holdings and sector allocations are subject to change. Please refer to the Schedule of Investments included in this report for additional portfolio information.
Dividend yield is calculated as the annual dividends paid by a company divided by its market price per share. PE, or price to earnings, is calculated by dividing a company’s market price per share by its earnings per share.
| HENNESSY FUNDS | 1-800-966-4354 | |
Financial Statements
Schedule of Investments as of April 30, 2016 (Unaudited) |
HENNESSY BALANCED FUND
(% of Net Assets)
| TOP TEN HOLDINGS | % NET ASSETS |
| U.S. Treasury Bill, 0.530%, 02/02/2017 | 11.65% |
| U.S. Treasury Bill, 0.660%, 03/02/2017 | 11.64% |
| U.S. Treasury Bill, 0.300%, 06/23/2016 | 5.84% |
| U.S. Treasury Bill, 0.410%, 08/18/2016 | 5.84% |
| U.S. Treasury Bill, 0.660%, 03/30/2017 | 5.82% |
| Chevron Corp. | 5.41% |
| Exxon Mobil Corp. | 5.19% |
| Caterpillar, Inc. | 5.04% |
| Pfizer, Inc. | 4.89% |
| Verizon Communications, Inc. | 4.58% |
Note: For presentation purposes, the Fund has grouped some of the industry categories. For purposes of categorizing securities for compliance with Section 8(b)(1) of the Investment Company Act of 1940, as amended, the Fund uses more specific industry classifications.
| | COMMON STOCKS – 50.95% | | Number | | | | | | % of | |
| | | | of Shares | | | Value | | | Net Assets | |
| | Consumer Discretionary – 3.55% | | | | | | | | | |
| | McDonald’s Corp. | | | 4,800 | | | $ | 607,152 | | | | 3.55 | % |
| | | | | | | | | | | | | | |
| | Consumer Staples – 3.78% | | | | | | | | | | | | |
| | Procter & Gamble Co. | | | 7,050 | | | | 564,846 | | | | 3.30 | % |
| | The Coca-Cola Co. | | | 1,000 | | | | 44,800 | | | | 0.26 | % |
| | Wal-Mart Stores, Inc. | | | 550 | | | | 36,778 | | | | 0.22 | % |
| | | | | | | | | 646,424 | | | | 3.78 | % |
| | | | | | | | | | | | | | |
| | Energy – 10.60% | | | | | | | | | | | | |
| | Chevron Corp. | | | 9,050 | | | | 924,729 | | | | 5.41 | % |
| | Exxon Mobil Corp. | | | 10,050 | | | | 888,420 | | | | 5.19 | % |
| | | | | | | | | 1,813,149 | | | | 10.60 | % |
| | | | | | | | | | | | | | |
| | Health Care – 9.31% | | | | | | | | | | | | |
| | Merck & Co., Inc. | | | 13,800 | | | | 756,792 | | | | 4.42 | % |
| | Pfizer, Inc. | | | 25,550 | | | | 835,741 | | | | 4.89 | % |
| | | | | | | | | 1,592,533 | | | | 9.31 | % |
| | | | | | | | | | | | | | |
| | Industrials – 10.52% | | | | | | | | | | | | |
| | Caterpillar, Inc. | | | 11,100 | | | | 862,692 | | | | 5.04 | % |
| | General Electric Co. | | | 18,900 | | | | 581,175 | | | | 3.39 | % |
| | The Boeing Co. | | | 2,650 | | | | 357,220 | | | | 2.09 | % |
| | | | | | | | | 1,801,087 | | | | 10.52 | % |
| | | | | | | | | | | | | | |
| | Information Technology – 8.01% | | | | | | | | | | | | |
| | Cisco Systems, Inc. | | | 11,450 | | | | 314,760 | | | | 1.84 | % |
| | Intel Corp. | | | 10,300 | | | | 311,884 | | | | 1.82 | % |
| | International Business Machines Corp. | | | 5,100 | | | | 744,294 | | | | 4.35 | % |
| | | | | | | | | 1,370,938 | | | | 8.01 | % |
| | | | | | | | | | | | | | |
| | Materials – 0.60% | | | | | | | | | | | | |
| | E.I. du Pont de Nemours & Co. | | | 1,550 | | | | 102,161 | | | | 0.60 | % |
| | | | | | | | | | | | | | |
| | Telecommunication Services – 4.58% | | | | | | | | | | | | |
| | Verizon Communications, Inc. | | | 15,400 | | | | 784,476 | | | | 4.58 | % |
| | | | | | | | | | | | | | |
| | Total Common Stocks | | | | | | | | | | | | |
| | (Cost $7,631,670) | | | | | | | 8,717,920 | | | | 50.95 | % |
The accompanying notes are an integral part of these financial statements.
| HENNESSY FUNDS | 1-800-966-4354 | |
| | SHORT-TERM INVESTMENTS – 49.06% | | Number of Shares/ | | | | | | % of | |
| | | | Par Amount | | | Value | | | Net Assets | |
| | Money Market Funds – 4.76% | | | | | | | | | |
| | Fidelity Government Portfolio – Institutional Class, 0.23% (a) | | | 814,757 | | | $ | 814,757 | | | | 4.76 | % |
| | | | | | | | | | | | | | |
| | U.S. Treasury Bills – 44.30% | | | | | | | | | | | | |
| | 0.190%, 05/26/2016 (b) | | | 600,000 | | | | 599,899 | | | | 3.51 | % |
| | 0.300%, 06/23/2016 (b) | | | 1,000,000 | | | | 999,632 | | | | 5.84 | % |
| | 0.410%, 08/18/2016 (b) | | | 1,000,000 | | | | 999,265 | | | | 5.84 | % |
| | 0.530%, 02/02/2017 (b) | | | 2,000,000 | | | | 1,993,298 | | | | 11.65 | % |
| | 0.660%, 03/02/2017 (b) | | | 2,000,000 | | | | 1,992,028 | | | | 11.64 | % |
| | 0.660%, 03/30/2017 (b) | | | 1,000,000 | | | | 995,459 | | | | 5.82 | % |
| | | | | | | | | 7,579,581 | | | | 44.30 | % |
| | Total Short-Term Investments | | | | | | | | | | | | |
| | (Cost $8,389,025) | | | | | | | 8,394,338 | | | | 49.06 | % |
| | | | | | | | | | | | | | |
| | Total Investments | | | | | | | | | | | | |
| | (Cost $16,020,695) – 100.01% | | | | | | | 17,112,258 | | | | 100.01 | % |
| | | | | | | | | | | | | | |
| | Liabilities in Excess | | | | | | | | | | | | |
| | of Other Assets – (0.01)% | | | | | | | (2,178 | ) | | | (0.01 | )% |
| | | | | | | | | | | | | | |
| | TOTAL NET ASSETS – 100.00% | | | | | | $ | 17,110,080 | | | | 100.00 | % |
Percentages are stated as a percent of net assets.
| (a) | The rate listed is the fund’s 7-day yield as of April 30, 2016. |
| (b) | The rate listed is discount rate at issue. |
Summary of Fair Value Exposure at April 30, 2016
The following is a summary of the inputs used to value the Fund’s net assets as of April 30, 2016 (See Note 3 in the accompanying notes to the financial statements):
| Common Stocks | | Level 1 | | | Level 2 | | | Level 3 | | | Total | |
| Consumer Discretionary | | $ | 607,152 | | | $ | — | | | $ | — | | | $ | 607,152 | |
| Consumer Staples | | | 646,424 | | | | — | | | | — | | | | 646,424 | |
| Energy | | | 1,813,149 | | | | — | | | | — | | | | 1,813,149 | |
| Health Care | | | 1,592,533 | | | | — | | | | — | | | | 1,592,533 | |
| Industrials | | | 1,801,087 | | | | — | | | | — | | | | 1,801,087 | |
| Information Technology | | | 1,370,938 | | | | — | | | | — | | | | 1,370,938 | |
| Materials | | | 102,161 | | | | — | | | | — | | | | 102,161 | |
| Telecommunication Services | | | 784,476 | | | | — | | | | — | | | | 784,476 | |
| Total Common Stocks | | $ | 8,717,920 | | | $ | — | | | $ | — | | | $ | 8,717,920 | |
| Short-Term Investments | | | | | | | | | | | | | | | | |
| Money Market Funds | | $ | 814,757 | | | $ | — | | | $ | — | | | $ | 814,757 | |
| U.S. Treasury Bills | | | — | | | | 7,579,581 | | | | — | | | | 7,579,581 | |
| Total Short-Term Investments | | $ | 814,757 | | | $ | 7,579,581 | | | $ | — | | | $ | 8,394,338 | |
| Total Investments | | $ | 9,532,677 | | | $ | 7,579,581 | | | $ | — | | | $ | 17,112,258 | |
Transfers between levels are recognized at the end of the reporting period. During the six-month period ended April 30, 2016, the Fund recognized no transfers between levels.
The accompanying notes are an integral part of these financial statements.
Financial Statements
Statement of Assets and Liabilities as of April 30, 2016 (Unaudited) |
| ASSETS: | | | |
| Investments in securities, at value (cost $16,020,695) | | $ | 17,112,258 | |
| Dividends and interest receivable | | | 22,782 | |
| Receivable for fund shares sold | | | 25,973 | |
| Receivable for securities sold | | | 303 | |
| Prepaid expenses and other assets | | | 13,825 | |
| Total Assets | | | 17,175,141 | |
| | | | | |
| LIABILITIES: | | | | |
| Payable to advisor | | | 8,333 | |
| Payable to administrator | | | 3,986 | |
| Payable to auditor | | | 9,403 | |
| Accrued distribution fees | | | 30,506 | |
| Accrued service fees | | | 1,389 | |
| Accrued trustees fees | | | 3,257 | |
| Accrued expenses and other payables | | | 8,187 | |
| Total Liabilities | | | 65,061 | |
| NET ASSETS | | $ | 17,110,080 | |
| | | | | |
| NET ASSETS CONSIST OF: | | | | |
| Capital stock | | $ | 15,946,313 | |
| Accumulated net investment income | | | 6,830 | |
| Accumulated net realized gain on investments | | | 65,374 | |
| Unrealized net appreciation on investments | | | 1,091,563 | |
| Total Net Assets | | $ | 17,110,080 | |
| | | | | |
| NET ASSETS | | | | |
| Investor Class: | | | | |
| Shares authorized (no par value) | | Unlimited | |
| Net assets applicable to outstanding Investor Class shares | | $ | 17,110,080 | |
| Shares issued and outstanding | | | 1,371,135 | |
| Net asset value, offering price and redemption price per share | | $ | 12.48 | |
The accompanying notes are an integral part of these financial statements.
| HENNESSY FUNDS | 1-800-966-4354 | |
Financial Statements
Statement of Operations for the six months ended April 30, 2016 (Unaudited) |
| INVESTMENT INCOME: | | | |
| Dividend income | | $ | 118,299 | |
| Interest income | | | 11,805 | |
| Total investment income | | | 130,104 | |
| | | | | |
| EXPENSES: | | | | |
| Investment advisory fees (See Note 5) | | | 40,432 | |
| Compliance expense | | | 11,790 | |
| Distribution fees – Investor Class (See Note 5) | | | 10,108 | |
| Audit fees | | | 9,741 | |
| Federal and state registration fees | | | 7,874 | |
| Trustees’ fees and expenses | | | 6,783 | |
| Service fees – Investor Class (See Note 5) | | | 6,739 | |
| Administration, fund accounting, custody and transfer agent fees (See Note 5) | | | 6,594 | |
| Sub-transfer agent expenses – Investor Class (See Note 5) | | | 4,265 | |
| Reports to shareholders | | | 3,500 | |
| Legal fees | | | 63 | |
| Interest expense (See Note 6) | | | 24 | |
| Other expenses | | | 2,058 | |
| Net expenses | | | 109,971 | |
| NET INVESTMENT INCOME | | $ | 20,133 | |
| | | | | |
| REALIZED AND UNREALIZED GAINS: | | | | |
| Net realized gain on investments | | $ | 77,680 | |
| Net change in unrealized appreciation on investments | | | 491,954 | |
| Net gain on investments | | | 569,634 | |
| NET INCREASE IN NET ASSETS RESULTING FROM OPERATIONS | | $ | 589,767 | |
The accompanying notes are an integral part of these financial statements.
Financial Statements
| Statements of Changes in Net Assets |
| | | Six Months Ended | | | | |
| | | April 30, 2016 | | | Year Ended | |
| | | (Unaudited) | | | October 31, 2015 | |
| OPERATIONS: | | | | | | |
| Net investment income | | $ | 20,133 | | | $ | 24,074 | |
| Net realized gain on investments | | | 77,680 | | | | 250,576 | |
| Net change in unrealized | | | | | | | | |
| appreciation (depreciation) on investments | | | 491,954 | | | | (265,259 | ) |
| Net increase in net assets resulting from operations | | | 589,767 | | | | 9,391 | |
| | | | | | | | | |
| DISTRIBUTIONS TO SHAREHOLDERS FROM: | | | | | | | | |
| Net investment income – Investor Class | | | (15,193 | ) | | | (30,298 | ) |
| Net realized gains – Investor Class | | | (254,142 | ) | | | (571,934 | ) |
| Total distributions | | | (269,335 | ) | | | (602,232 | ) |
| | | | | | | | | |
| CAPITAL SHARE TRANSACTIONS: | | | | | | | | |
| Proceeds from shares subscribed – Investor Class | | | 6,545,935 | | | | 450,977 | |
| Dividends reinvested – Investor Class | | | 264,681 | | | | 589,193 | |
| Cost of shares redeemed – Investor Class | | | (1,648,574 | ) | | | (1,362,738 | ) |
| Net increase (decrease) in net assets derived | | | | | | | | |
| from capital share transactions | | | 5,162,042 | | | | (322,568 | ) |
| TOTAL INCREASE (DECREASE) IN NET ASSETS | | | 5,482,474 | | | | (915,409 | ) |
| | | | | | | | | |
| NET ASSETS: | | | | | | | | |
| Beginning of period | | | 11,627,606 | | | | 12,543,015 | |
| End of period | | $ | 17,110,080 | | | $ | 11,627,606 | |
| Undistributed net investment income, end of period | | $ | 6,830 | | | $ | 1,890 | |
| | | | | | | | | |
| CHANGES IN SHARES OUTSTANDING: | | | | | | | | |
| Shares sold – Investor Class | | | 543,584 | | | | 36,214 | |
| Shares issued to holders as reinvestment of dividends – | | | | | | | | |
| Investor Class | | | 22,070 | | | | 47,227 | |
| Shares redeemed – Investor Class | | | (134,822 | ) | | | (109,315 | ) |
| Net increase (decrease) in shares outstanding | | | 430,832 | | | | (25,874 | ) |
The accompanying notes are an integral part of these financial statements.
| HENNESSY FUNDS | 1-800-966-4354 | |
Financial Statements
For an Investor Class share outstanding throughout each period
| | | Six Months Ended | |
| | | April 30, 2016 | |
| | | (Unaudited) | |
| PER SHARE DATA: | | | |
| Net asset value, beginning of period | | $ | 12.37 | |
| | | | | |
| Income from investment operations: | | | | |
| Net investment income | | | 0.02 | |
| Net realized and unrealized gains (losses) on investments | | | 0.38 | |
| Total from investment operations | | | 0.40 | |
| | | | | |
| Less distributions: | | | | |
| Dividends from net investment income | | | (0.02 | ) |
| Dividends from net realized gains | | | (0.27 | ) |
| Total distributions | | | (0.29 | ) |
| Net asset value, end of period | | $ | 12.48 | |
| | | | | |
| TOTAL RETURN | | | 3.29 | %(1) |
| | | | | |
| SUPPLEMENTAL DATA AND RATIOS: | | | | |
| Net assets, end of period (millions) | | $ | 17.11 | |
| Ratio of expenses to average net assets | | | 1.63 | %(2) |
| Ratio of net investment income to average net assets | | | 0.30 | %(2) |
| Portfolio turnover rate | | | 37 | %(1) |
(1) | Not annualized. |
(2) | Annualized. |
The accompanying notes are an integral part of these financial statements.
| Year Ended October 31, | |
| 2015 | | | 2014 | | | 2013 | | | 2012 | | | 2011 | |
| | | | | | | | | | | | | | |
| $ | 12.98 | | | $ | 12.90 | | | $ | 11.88 | | | $ | 11.13 | | | $ | 10.43 | |
| | | | | | | | | | | | | | | | | | | |
| | | | | | | | | | | | | | | | | | | |
| | 0.03 | | | | 0.02 | | | | 0.02 | | | | 0.04 | | | | 0.05 | |
| | (0.01 | ) | | | 0.51 | | | | 1.02 | | | | 0.75 | | | | 0.70 | |
| | 0.02 | | | | 0.53 | | | | 1.04 | | | | 0.79 | | | | 0.75 | |
| | | | | | | | | | | | | | | | | | | |
| | | | | | | | | | | | | | | | | | | |
| | (0.03 | ) | | | (0.01 | ) | | | (0.02 | ) | | | (0.04 | ) | | | (0.05 | ) |
| | (0.60 | ) | | | (0.44 | ) | | | — | | | | — | | | | — | |
| | (0.63 | ) | | | (0.45 | ) | | | (0.02 | ) | | | (0.04 | ) | | | (0.05 | ) |
| $ | 12.37 | | | $ | 12.98 | | | $ | 12.90 | | | $ | 11.88 | | | $ | 11.13 | |
| | | | | | | | | | | | | | | | | | | |
| | 0.11 | % | | | 4.26 | % | | | 8.77 | % | | | 7.13 | % | | | 7.16 | % |
| | | | | | | | | | | | | | | | | | | |
| | | | | | | | | | | | | | | | | | | |
| $ | 11.63 | | | $ | 12.54 | | | $ | 12.21 | | | $ | 25.17 | | | $ | 18.02 | |
| | 1.68 | % | | | 1.75 | % | | | 1.75 | % | | | 1.54 | % | | | 1.61 | % |
| | 0.20 | % | | | 0.17 | % | | | 0.14 | % | | | 0.34 | % | | | 0.42 | % |
| | 34 | % | | | 23 | % | | | 22 | % | | | 17 | % | | | 39 | % |
The accompanying notes are an integral part of these financial statements.
| HENNESSY FUNDS | 1-800-966-4354 | |
Financial Statements
Notes to the Financial Statements April 30, 2016 (Unaudited) |
1). ORGANIZATION
The Hennessy Balanced Fund (the “Fund”) is a series of Hennessy Funds Trust (the “Trust”), which was organized as a Delaware statutory trust on September 17, 1992. The Fund is an open-end management investment company registered under the Investment Company Act of 1940, as amended. The Fund is a successor to a fund with the same name (the “Predecessor Fund”) that was a series of The Hennessy Funds, Inc., a Maryland corporation, pursuant to a reorganization that took place after the close of business on February 28, 2014. Prior to February 28, 2014, the Fund had no investment operations. As a result of the reorganization, holders of the Investor Class shares of the Predecessor Fund received Investor Class shares of the Fund (the Investor Class shares of the Fund are the successor to the accounting and performance information of the Predecessor Fund). The investment objective of the Fund is a combination of capital appreciation and current income. The Fund is a non-diversified fund and offers Investor Class shares.
As an investment company, the Fund follows the investment company accounting and reporting guidance of the Financial Accounting Standards Board (“FASB”) Accounting Standard Codification Topic 946 “Financial Services—Investment Companies.”
2). SIGNIFICANT ACCOUNTING POLICIES
The following is a summary of significant accounting policies consistently followed by the Fund in the preparation of the financial statements. These policies are in conformity with U.S. generally accepted accounting principles (“GAAP”).
| a). | Investment Valuation – All investments in securities are recorded at their estimated fair value, as described in Note 3. |
| b). | Federal Income Taxes – Provision for federal income taxes or excise taxes has not been made since the Fund has elected to be taxed as a “regulated investment company” and intends to distribute substantially all of its taxable income to its shareholders and otherwise comply with the provisions of the Internal Revenue Code of 1986, as amended, applicable to regulated investment companies. Net investment income or loss and realized gains and losses for federal income tax purposes may differ from that reported on the financial statements because of temporary book and tax basis differences. Temporary differences are primarily the result of the treatment of wash sales for tax reporting purposes. The Fund recognizes interest and penalties related to income tax benefits, if any, in the statement of operations as an income tax expense. Distributions from net realized gains for book purposes may include short-term capital gains, which are included as ordinary income to shareholders for tax purposes. |
| c). | Income and Expenses – Dividend income is recognized on the ex-dividend date or as soon as information is available to the Fund. Interest income, which includes the amortization of premium and accretion of discount, is recognized on an accrual basis. The Fund is charged for those expenses that are directly attributable to the portfolio, such as advisory, administration, and certain shareholder service fees. |
| d). | Distributions to Shareholders – Dividends from net investment income for the Fund, if any, are declared and paid on a calendar quarter basis. Distributions of net realized capital gains, if any, are declared and paid annually, usually in December. |
| e). | Security Transactions – Investment and shareholder transactions are recorded on the trade date. The Fund determines the gain or loss realized from the investment transactions by comparing the original cost of the security lot sold with the net sale proceeds. Discounts and premiums on securities purchased are accreted/amortized over the life of the respective security. |
| f). | Use of Estimates – The preparation of financial statements in conformity with GAAP requires management to make estimates and assumptions that affect the reported amounts of assets and liabilities and disclosure of contingent assets and liabilities at the date of the financial statements and the reported change in net assets during the reporting period. Actual results could differ from those estimates. |
| g). | Share Valuation – The net asset value (“NAV”) per share of the Fund is calculated by dividing the sum of the value of the securities held by the Fund, plus cash or other assets, minus all liabilities (including estimated accrued expenses) by the total number of shares outstanding for the Fund, rounded to the nearest cent. The Fund’s shares will not be priced on days the New York Stock Exchange is closed for trading. The offering and redemption price per share for the Fund is equal to the Fund’s NAV per share. |
| h). | Repurchase Agreements – The Fund may enter into repurchase agreements with member banks or security dealers of the Federal Reserve Board whom the investment advisor deems creditworthy. The repurchase price generally equals the price paid by the Fund plus interest negotiated on the basis of current short-term rates. |
| | Securities pledged as collateral for repurchase agreements are held by the custodian bank until the respective agreements mature. Provisions of the repurchase agreements ensure that the market value of the collateral, including accrued interest thereon, is sufficient to cover the repurchase amount in the event of default of the counterparty. If the counterparty defaults and the value of the collateral declines or if the counterparty enters an insolvency proceeding, realization of the collateral by the Fund may be delayed or limited. |
| i). | Accounting for Uncertainty in Income Taxes – The Fund has accounting policies regarding recognition and measurement of tax positions taken or expected to be taken on a tax return. The tax returns of the Fund for the prior three fiscal years are open for examination. The Fund has reviewed all open tax years in major jurisdictions and concluded that there is no impact on the Fund’s net assets and no tax liability resulting from unrecognized tax benefits relating to uncertain income tax positions taken or expected to be taken on a tax return. The Fund’s major tax jurisdictions are U.S. federal and Delaware. |
| j). | New Accounting Pronouncements – In May 2015, the FASB issued ASU No. 2015-07 “Disclosure for Investments in Certain Entities that Calculate Net Asset Value per Share (or Its Equivalent).” The amendments in ASU No. 2015-07 remove the requirement to categorize within the fair value hierarchy investments measured at NAV and require the disclosure of sufficient information to reconcile the fair value of the remaining assets categorized within the fair value hierarchy to the financial statements. The amendments in ASU No. 2015-07 are effective for fiscal years beginning after December 15, 2015, and interim periods within those fiscal years. Management has reviewed the requirements and believes the adoption of ASU 2015-07 will not have a material impact on the Fund’s financial statements and related disclosures. |
| HENNESSY FUNDS | 1-800-966-4354 | |
3). SECURITIES VALUATION
The Fund follows authoritative fair valuation accounting standards that establish an authoritative definition of fair value and set out a hierarchy for measuring fair value. These standards require additional disclosures about the various inputs and valuation techniques used to develop the measurements of fair value and a discussion in changes in valuation techniques and related inputs during the period. These inputs are summarized in the three broad levels listed below:
| | Level 1 – | Unadjusted, quoted prices in active markets for identical instruments that the Fund has the ability to access at the date of measurement. |
| | Level 2 – | Other significant observable inputs (including, but not limited to, quoted prices in active markets for similar instruments, quoted prices in markets that are not active for identical or similar instruments, and model-derived valuations in which all significant inputs and significant value drivers are observable in active markets (such as interest rates, prepayment speeds, credit risk curves, default rates, and similar data)). |
| | Level 3 – | Significant unobservable inputs (including the Fund’s own assumptions about what market participants would use to price the asset or liability based on the best available information) when observable inputs are unavailable. |
Following is a description of the valuation techniques applied to the Fund’s major categories of assets and liabilities measured at fair value on a recurring basis.
Equity Securities – Equity securities, including common stocks, preferred stocks, exchange-traded funds, closed-end mutual funds, partnerships, rights, and real estate investment trusts, that are traded on a securities exchange for which a last-quoted sales price is readily available will generally be valued at the last sales price as reported by the primary exchange on which the securities are listed. Securities listed on The NASDAQ Stock Market (“NASDAQ”) will generally be valued at the NASDAQ Official Closing Price, which may differ from the last sales price reported. Securities traded on a securities exchange for which a last-quoted sales price is not readily available will generally be valued at the mean between the bid and ask prices. To the extent these securities are actively traded and valuation adjustments are not applied, they are classified in Level 1 of the fair value hierarchy.
Registered Investment Companies – Investments in registered investment companies (e.g., mutual funds) are generally priced at the ending NAV provided by the applicable registered investment company’s service agent and will be classified in Level 1 of the fair value hierarchy.
Debt Securities – Debt securities, including corporate bonds, asset-backed securities, mortgage-backed securities, municipal bonds, U.S. Treasuries, and U.S. government agency issues, are generally valued at market on the basis of valuations furnished by an independent pricing service that utilizes both dealer-supplied valuations and formula-based techniques. The pricing service may consider recently executed transactions in securities of the issuer or comparable issuers, market price quotations (where observable), bond spreads, and fundamental data relating to the issuer. In addition, the model may incorporate observable market data such as reported sales of similar securities, broker quotes, yields, bids, offers, and reference data. Certain securities are valued primarily using dealer quotations. These securities are generally classified in Level 2 of the fair value hierarchy.
Short-Term Securities – Short-term equity investments, including money market funds, are valued in the manner specified above. Short-term debt investments with an original
term to maturity of 60 days or less are valued at amortized cost, which approximates fair market value. If the original term to maturity of a short-term debt investment exceeded 60 days, then the values as of the 61st day prior to maturity are amortized. Amortized cost is not used if its use would be inappropriate due to credit or other impairments of the issuer, in which case the security’s fair value would be determined, as described below. Short-term securities are generally classified in Level 1 or Level 2 of the fair market hierarchy depending on the inputs used and market activity levels for specific securities.
The Board of Trustees of the Fund (the “Board”) has adopted fair value pricing procedures that are followed when a price for a security is not readily available or if a significant event has occurred that indicates the closing price of a security no longer represents the true value of that security. Fair value pricing determinations are made in good faith in accordance with these procedures. There are numerous criteria that will be given consideration in determining a fair value of a security such as the trading volume of a security and markets, the value of other like securities, and news events with direct bearing to a security or markets. Fair value pricing results in an estimated price for a security that reflects the amount the Fund might reasonably expect to receive in a current sale. Depending on the relative significance of the valuation inputs, these securities may be classified in either Level 2 or Level 3 of the fair value hierarchy.
The Board has delegated day-to-day valuation matters to a Valuation Committee comprised of one or more representatives from Hennessy Advisors, Inc., the Fund’s investment advisor. The function of the Valuation Committee is to value securities where current and reliable market quotations are not readily available. All actions taken by the Valuation Committee are reviewed by the Board.
The Fund has performed an analysis of all existing investments to determine the significance and character of all inputs to their fair value determination. Various inputs are used in determining the value of the Fund’s investments. The inputs or methodology used for valuing securities are not necessarily an indication of the risk associated with investing in those securities. Details related to the fair valuation hierarchy of the Fund’s securities as of April 30, 2016, are included in the Fund’s Schedule of Investments.
4). INVESTMENT TRANSACTIONS
Purchases and sales of investment securities (excluding government and short-term investments) for the Fund during the six months ended April 30, 2016, were $2,624,893 and $348,879, respectively.
There were no purchases or sales/maturities of long-term U.S. government securities for the Fund during the six months ended April 30, 2016.
5). INVESTMENT MANAGEMENT FEE AND OTHER TRANSACTIONS WITH AFFILIATES
Hennessy Advisors, Inc. (the “Advisor”) is the investment advisor of the Fund. The Advisor provides the Fund with investment management services under an Investment Advisory Agreement. The Advisor furnishes all investment advice, office space, facilities, and provides most of the personnel needed by the Fund. As compensation for its services, the Advisor is entitled to a monthly fee from the Fund. The fee is based upon the average daily net assets of the Fund at the annual rate of 0.60%. The net investment advisory fees payable by the Fund as of April 30, 2016, were $8,333.
The Board has approved a Shareholder Servicing Agreement for the Fund, which was instituted to compensate the Advisor for the non-investment management services it provides to the Fund. The Shareholder Servicing Agreement provides for a monthly fee paid to the Advisor at an annual rate of 0.10% of the average daily net assets of the Fund. Shareholder service fees payable by the Fund as of April 30, 2016, were $1,389.
| HENNESSY FUNDS | 1-800-966-4354 | |
The Fund has adopted a plan pursuant to Rule 12b-1 under the Investment Company Act of 1940, as amended, that authorizes payments in connection with the distribution of the Fund’s shares at an annual rate of up to 0.25% of the Fund’s average daily net assets, although the Fund is currently only using up to 0.15% of its average daily net assets for such purpose. Amounts paid under the plan may be spent on any activities or expenses primarily intended to result in the sale of shares, including, but not limited to, advertising, shareholder account servicing, the printing and mailing of prospectuses to other than current shareholders, the printing and mailing of sales literature, and compensation for sales and marketing activities or to financial institutions and others, such as dealers and distributors.
The Fund has entered into agreements with various brokers, dealers, and financial intermediaries in connection with the sale of shares of the Fund. The agreements provide for periodic payments by the Fund to the brokers, dealers, and financial intermediaries for providing certain shareholder maintenance services (sub-transfer agent expenses). These shareholder services include the pre-processing and quality control of new accounts, shareholder correspondence, answering customer inquiries regarding account status, and facilitating shareholder telephone transactions. Fees paid by the Fund to various brokers, dealers, and financial intermediaries during the six months ended April 30, 2016, were $4,265.
U.S. Bancorp Fund Services, LLC (“USBFS”) provides the Fund with administrative, fund accounting, and transfer agent services and necessary office equipment. As administrator, USBFS is responsible for activities such as (i) preparing various federal and state regulatory filings, reports, and returns for the Fund, (ii) preparing reports and materials to be supplied to the Board, (iii) monitoring the activities of the Fund’s custodian, transfer agent, and accountants, and (iv) coordinating the preparation and payment of the Fund’s expenses and reviewing the Fund’s expense accruals. Fees paid to USBFS during the six months ended April 30, 2016, were $6,594.
U.S. Bank, N.A., an affiliate of USBFS, serves as the Fund’s custodian. Quasar Distributors, LLC acts as the Fund’s principal underwriter in a continuous public offering of the Fund’s shares. Quasar Distributors, LLC is an affiliate of USBFS and U.S. Bank, N.A.
6). LINE OF CREDIT
The Fund has an uncommitted line of credit with the other funds in the Hennessy Funds family of funds (the “Hennessy Funds”) in the amount of the lesser of (i) $100,000,000 or (ii) 33.33% of each Hennessy Fund’s net assets, or 30% for the Hennessy Gas Utility Fund and 10% for the Fund, intended to provide short-term financing, if necessary, subject to certain restrictions, in connection with shareholder redemptions. The credit facility is with the Hennessy Funds’ custodian bank, U.S. Bank, N.A. Borrowings under this arrangement bear interest at the bank’s prime rate and are secured by all of the Fund’s assets (as to its own borrowings only). During the six months ended April 30, 2016, the Fund had an outstanding average daily balance and a weighted average interest rate of $1,374 and 3.44%, respectively. The maximum amount outstanding for the Fund during the period was $250,000. At April 30, 2016, the Fund did not have any borrowings outstanding under the line of credit.
7). FEDERAL TAX INFORMATION
As of October 31, 2015, the Fund’s most recent fiscal year end, the components of accumulated earnings (losses) for income tax purposes were as follows:
| | Cost of investments for tax purposes | | $ | 11,035,916 | |
| | Gross tax unrealized appreciation | | $ | 769,738 | |
| | Gross tax unrealized depreciation | | | (182,426 | ) |
| | Net tax unrealized appreciation | | $ | 587,312 | |
| | Undistributed ordinary income | | $ | 17,561 | |
| | Undistributed long-term capital gains | | | 238,462 | |
| | Total distributable earnings | | $ | 256,023 | |
| | Other accumulated gain | | $ | — | |
| | Total accumulated gain | | $ | 843,335 | |
The difference between book-basis unrealized appreciation/depreciation (as shown in the Statement of Assets and Liabilities) and tax-basis unrealized appreciation/depreciation (as shown above) is attributable primarily to wash sales.
At October 31, 2015, the Fund’s most recent fiscal year end, the Fund had no tax basis capital losses to offset future capital gains.
At October 31, 2015, the Fund’s most recent fiscal year end, the Fund did not defer, on a tax basis, any post-December late year ordinary loss deferrals.
The tax character of distributions paid during fiscal year 2016 (year to date) and fiscal year 2015 for the Fund were as follows:
| | | | Six Months Ended | | | Year Ended | |
| | | | April 30, 2016 | | | October 31, 2015 | |
| | Ordinary income | | $ | 30,867 | | | $ | 39,518 | |
| | Long-term capital gain | | | 238,468 | | | | 562,714 | |
| | | | $ | 269,335 | | | $ | 602,232 | |
| HENNESSY FUNDS | 1-800-966-4354 | |
Expense Example (Unaudited)
April 30, 2016
As a shareholder of the Fund, you incur two types of costs: (1) transaction costs, including sales charges (loads) on purchase payments, reinvested dividends, or other distributions; redemption fees; and exchange fees; and (2) ongoing costs, including management fees; service fees; and other Fund expenses. This Example is intended to help you understand your ongoing costs (in dollars) of investing in the Fund and to compare these costs with the ongoing costs of investing in other mutual funds. The Example is based on an investment of $1,000 invested at the beginning of the period and held for the entire period from November 1, 2015 through April 30, 2016.
Actual Expenses
The first line of the table below provides information about actual account values and actual expenses. Although the Fund charges no sales loads or transaction fees, you will be assessed fees for outgoing wire transfers, returned checks and stop payment orders at prevailing rates charged by U.S. Bancorp Fund Services, LLC, the Fund’s transfer agent. If you request that a redemption be made by wire transfer, currently a $15.00 fee is charged by the Fund’s transfer agent. IRA accounts will be charged a $15.00 annual maintenance fee. The example below includes, but is not limited to, management fees, shareholder servicing fees, fund accounting, custody, and transfer agent fees. However, the example below does not include portfolio trading commissions and related expenses, and other extraordinary expenses as determined under generally accepted accounting principles. You may use the information in this line, together with the amount you invested, to estimate the expenses that you paid over the period. Simply divide your account value by $1,000 (for example, an $8,600 account value divided by $1,000 = 8.6), then multiply the result by the number in the first line of the table under the heading entitled “Expenses Paid During Period” to estimate the expenses you paid on your account during this period.
Hypothetical Example for Comparison Purposes
The second line of the table below provides information about hypothetical account values and hypothetical expenses based on the Fund’s actual expense ratios and an assumed rate of return of 5% per year before expenses, which is not the Fund’s actual return. The hypothetical account values and expenses may not be used to estimate the actual ending account balance or expenses you paid for the period. You may use this information to compare the ongoing costs of investing in the Fund and other funds. To do so, compare this 5% hypothetical example with the 5% hypothetical examples that appear in the shareholder reports of the other funds. Please note that the expenses shown in the table are meant to highlight your ongoing costs only and do not reflect any transactional costs, such as sales charges (loads), or exchange fees. Therefore, the second line of the table is useful in comparing ongoing costs only, and will not help you determine the relative total costs of owning different funds. In addition, if these transactional costs were included, your costs would have been higher.
| | | | Expenses Paid |
| | Beginning | Ending | During Period(1) |
| | Account Value | Account Value | November 1, 2015 – |
| | November 1, 2015 | April 30, 2016 | April 30, 2016 |
| Investor Class | | | |
| Actual | $1,000.00 | $1,032.90 | $8.24 |
| Hypothetical (5% return before expenses) | $1,000.00 | $1,016.76 | $8.17 |
(1) | Expenses are equal to the Fund’s annualized expense ratio of 1.63% multiplied by the average account value over the period, multiplied by 182/366 days (to reflect one-half year period). |
How to Obtain a Copy of the Fund’s
Proxy Voting Policy and Proxy Voting Records
A description of the policies and procedures the Fund uses to determine how to vote proxies relating to portfolio securities is available without charge: (1) by calling 1-800-966-4354; (2) on the Hennessy Funds’ website at hennessyfunds.com/proxy-voting/policy.fs; or (3) on the U.S. Securities and Exchange Commission’s website at www.sec.gov. The Fund’s proxy voting record is available without charge on both the Hennessy Funds’ website at hennessyfunds.com/proxy-voting/policy.fs and the SEC’s website at www.sec.gov no later than August 31 for the prior 12 months ending June 30.
Quarterly Filings on Form N-Q
The Fund files its complete schedule of portfolio holdings with the SEC for the first and third quarters of each fiscal year on Form N-Q. The Fund’s Form N-Q will be available on the SEC’s website at www.sec.gov. The Fund’s Form N-Q may be reviewed and copied at the SEC’s Public Reference Room in Washington, DC and information on the operation of the Public Reference Room may be obtained by calling 1-800-SEC-0330. Information included in the Fund’s N-Q will also be available upon request by calling 1-800-966-4354.
Federal Tax Distribution Information
(Unaudited)
For the fiscal year ended October 31, 2015, certain dividends paid by the Fund may be subject to a maximum tax rate of 23.8%, as provided for by the Jobs and Growth Tax Relief Reconciliation Act of 2003. The percentage of dividends declared from ordinary income designated as qualified dividend income was 100.00%.
For corporate shareholders, the percent of ordinary income distributions that qualified for the corporate dividends received deduction for the fiscal year ended October 31, 2015 was 100.00%.
The percentage of taxable ordinary income distributions that are designated as short-term capital gain distributions under Section 871(k)(2)(C) of the Internal Revenue Code of 1986, as amended, for the Fund was 23.33%.
Householding
To help keep the Fund’s costs as low as possible, we generally deliver a single copy of most financial reports and prospectuses to shareholders who share an address, even if the accounts are registered under different names. This process, known as “householding,” does not apply to account statements. You may, of course, request an individual copy of a prospectus or financial report at any time. If you would like to receive separate mailings, please call the Administrator at 1-800-261-6950 or 1-414-765-4124 and we will begin individual delivery within 30 days of your request. If your account is held through a financial institution or other intermediary, please contact them directly to request individual delivery.
| HENNESSY FUNDS | 1-800-966-4354 | |
Board Approval of Investment Advisory
Agreement
At its meeting on March 9, 2016, the Board of Trustees of the Fund (the “Board,” and the members thereof, the “Trustees”) unanimously approved the continuation of the investment advisory agreement of the Fund with Hennessy Advisors, Inc. (the “Advisor”). As part of the process of approving the continuation of the advisory agreement, the Trustees reviewed their fiduciary duties with respect to approving the advisory agreement and the relevant factors for them to consider. In addition, the Trustees who are not deemed “interested persons” (as that term is defined by the Investment Company Act of 1940) of the Fund (the “Independent Trustees”) met in executive session to discuss the approval of the advisory agreement.
In advance of the meeting, the Advisor sent detailed information to the Trustees to assist them in their evaluation of the advisory agreement. This information included, but was not limited to, (i) a memorandum from outside legal counsel that described the fiduciary duties of the Board with respect to approving the continuation of the advisory agreement and the relevant factors for consideration, (ii) a memorandum from the Advisor that listed the factors relevant to the Board’s approval of the continuation of the advisory agreement and also referenced the documents that had been provided to help the Board assess each such factor, (iii) an inventory of the range of services provided by the Advisor for the Fund, (iv) a written discussion of economies of scale, (v) the advisory agreement, (vi) a recent Fund fact sheet, (vii) a peer expense comparison, (viii) performance information, (ix) the Advisor’s most recent Form 10-K and Form 10-Q, which included information about the Advisor’s profitability, (x) information about brokerage commissions, (xi) information about the Fund’s compliance program, (xii) the Advisor’s current Form ADV Part I, and (xii) other information the Trustees believed was useful in evaluating the approval of the continuation of the advisory agreement.
All of the factors discussed by the Trustees were considered as a whole, and were considered separately by the Independent Trustees, meeting in executive session. The factors were viewed in their totality by the Trustees, with no single factor being the principal or determinative factor in the Trustees’ determination of whether to approve the continuation of the advisory agreement. The Trustees recognized that the management and fee arrangements for the Fund are the result of years of review and discussion between the Independent Trustees and the Advisor, that certain aspects of such arrangements may receive greater scrutiny in some years than in others, and that the Trustees’ conclusions may be based, in part, on their consideration of these same arrangements and information received during the course of the year and in prior years.
Prior to approving the continuation of the advisory agreement, the Trustees and the Independent Trustees in executive session considered, among other items:
| | • | The nature and quality of the advisory services provided by the Advisor. |
| | • | A comparison of the fees and expenses of the Fund to other similar funds. |
| | • | Whether economies of scale are recognized by the Fund. |
| | • | The costs and profitability of the Fund to the Advisor. |
| | • | The performance of the Fund. |
| | • | The other benefits to the Advisor from serving as an investment advisor to the Fund (in addition to the advisory fee). |
The material considerations and determinations of the Board of Trustees, including all of the Independent Trustees, are as follows:
| | • | The Board considered the services identified below that are provided by the Advisor. Based on this review, the Trustees believe that the Advisor provides high-quality services to the Fund, and they noted that their overall confidence in the Advisor is high. The Trustees also concluded that they were satisfied with the nature, extent, and quality of the advisory services provided to the Fund by the Advisor, and that the nature and extent of the services provided by the Advisor are appropriate to assure that the Fund’s operations are conducted in compliance with applicable laws, rules, and regulations. |
| | | • | The Advisor acts as the portfolio manager for the Fund. In this capacity, the Advisor does the following: |
| | | | • | manages the composition of the Fund’s portfolio, including the purchase, retention, and disposition of portfolio securities in accordance with the Fund’s investment objectives, policies, and restrictions; |
| | | | • | ensures compliance with “best execution” for the Fund’s portfolio; |
| | | | • | manages the use of soft dollars for the Fund. |
| | | • | The Advisor performs a daily reconciliation of portfolio positions and cash for the Fund. |
| | | • | The Advisor monitors the Fund’s compliance with its investment objectives and restrictions. |
| | | • | The Advisor monitors compliance with federal securities laws and performs activities such as maintaining a compliance program, conducting ongoing reviews of the compliance programs of the Fund’s service providers, conducting on-site visits to the Fund’s service providers, monitoring incidents of abusive trading practices, reviewing Fund expense accruals, payments, and fixed expense ratios, evaluating insurance providers for fidelity bond coverage and D&O/E&O insurance coverage, conducting employee compliance training, reviewing reports provided by service providers, maintaining books and records, and preparing an annual compliance report to the Board. |
| | | • | The Advisor oversees service providers that provide accounting, administration, distribution, transfer agency, custodial, sales and marketing, public relations, audit, information technology, and legal services to the Fund. |
| | | • | The Advisor maintains in-house marketing and distribution departments on behalf of the Fund. |
| | | • | The Advisor is actively involved with preparing regulatory filings for the Fund, including writing and annually updating the Fund’s prospectus and related documents. |
| | | • | The Advisor prepares a written summary of the Fund’s performance for the most recent six-month period or twelve-month period, as applicable, for each semi-annual and annual report of the Fund. |
| | | • | The Advisor oversees distribution of the Fund through third-party broker/dealers and independent financial institutions such as Charles Schwab, Inc., Fidelity, TD Waterhouse, and Pershing. The Advisor participates in “no transaction fee” (“NTF”) programs with these companies on behalf of the Fund, which allow customers to purchase the Fund through third-party distribution |
| HENNESSY FUNDS | 1-800-966-4354 | |
| | | | channels without paying a transaction fee. The Advisor compensates, in part, a number of these third-party providers of NTF programs out of its own revenues. |
| | | • | The Advisor pays the incentive compensation of the Fund’s compliance officers and employs other staff, such as management executives, legal personnel, marketing personnel, national accounts and distribution personnel, sales personnel, administrative personnel, and trading oversight personnel. |
| | | • | The Advisor provides a quarterly compliance certification to the Board. |
| | | • | The Advisor prepares or reviews Board materials, frequently presents to the Board or leads Board discussions, prepares or reviews meeting minutes, and arranges for Board training and education. |
| | • | The Board compared the performance of the Fund to benchmark indices over various periods of time and they noted that at each quarterly meeting, the Trustees review reports comparing the investment performance of the Fund to various indices. Based on the information provided at the meeting and the information and quarterly discussions regarding the Fund’s investment performance, the Trustees believe that the Advisor manages the Fund in a manner that is materially consistent with its stated investment objective and style. The Trustees concluded that the performance of the Fund over various time horizons warranted the continuation of the advisory agreement. |
| | • | The Board reviewed the advisory fees and overall expense ratios of the Fund and comparable funds using data from Morningstar with respect to funds similar in asset size and investment objective to the Fund. As part of the discussion with management, the Trustees ensured that they understood and were comfortable with the criteria used to determine the mutual funds included in the Morningstar categories for purposes of the materials considered at the meeting. The Board determined that the advisory fee and overall expense ratio of the Fund falls within the range of the advisory fees and overall expense ratios of other comparable funds and concluded that they are reasonable and warranted continuation of the advisory agreement. |
| | • | The Board also considered whether economies of scale were being realized by the Advisor that should be shared with the Fund’s shareholders. The Trustees noted that many of the expenses incurred to manage the Fund are asset-based fees and thus do not result in material economies of scale being realized as the net assets of the Fund increase. For example, intermediary service fees increase as the Fund’s assets grow. The Trustees also considered the Advisor’s efforts to contain expenses, and took into account the Advisor’s significant marketing efforts to increase Fund assets. The Board noted that at current asset levels it did not appear that there were economies of scale being realized by the Advisor and concluded that it would continue to monitor economies of scale in the future as circumstances changed. |
| | • | The Board considered the profitability of the Advisor, including the impact of intermediary service fees on the Advisor’s profitability, and also considered the resources and revenues that the Advisor has put into managing and distributing the Fund. The Board then concluded that the profits of the Advisor are reasonable and not excessive when compared to profitability guidelines set forth in relevant court cases. |
| | • | The Board considered the high level of professionalism and knowledge of the Advisor’s employees, along with a very low level of turnover, and concluded that this was beneficial to the Fund and its shareholders. |
| | • | The Board considered other benefits to the Advisor from serving as an advisor to the Fund (in addition to the advisory fee). The Board noted that the Advisor may derive ancillary benefits from, by way of example, its association with the Fund in the form of proprietary and third-party research products and services received from broker dealers that execute portfolio trades for the Fund. The Board determined that any such products and services have been used for legitimate purposes relating to the Fund by providing assistance in the investment decision-making process. The Trustees concluded that the other benefits realized by the Advisor from its relationship with the Fund were reasonable. |
After reviewing the materials provided at the meeting and management’s presentation, as well as other information regularly provided at the Board’s quarterly meetings throughout the year regarding the quality of services provided by the Advisor, the performance of the Fund, expense information, regulatory compliance issues, trading information and related matters, and other factors deemed relevant by the Board, the Trustees, including all of the Independent Trustees, approved the continuation of the advisory agreement.
| HENNESSY FUNDS | 1-800-966-4354 | |
For information, questions or assistance, please call
The Hennessy Funds
1-800-966-4354 or 1-415-899-1555
INVESTMENT ADVISOR
Hennessy Advisors, Inc.
7250 Redwood Blvd., Suite 200
Novato, California 94945
ADMINISTRATOR,
TRANSFER AGENT,
DIVIDEND PAYING AGENT &
SHAREHOLDER SERVICING AGENT
U.S. Bancorp Fund Services, LLC
P.O. Box 701
Milwaukee, Wisconsin 53201-0701
CUSTODIAN
U.S. Bank N.A.
Custody Operations
1555 North River Center Dr., Suite 302
Milwaukee, Wisconsin 53212
TRUSTEES
Neil J. Hennessy
Robert T. Doyle
J. Dennis DeSousa
Gerald P. Richardson
COUNSEL
Foley & Lardner LLP
777 East Wisconsin Avenue
Milwaukee, Wisconsin 53202-5306
INDEPENDENT REGISTERED
PUBLIC ACCOUNTING FIRM
KPMG LLP
777 East Wisconsin Avenue
Milwaukee, Wisconsin 53202-5306
DISTRIBUTOR
Quasar Distributors, LLC
615 East Michigan Street
Milwaukee, Wisconsin 53202
hennessyfunds.com | 1-800-966-4354
This report has been prepared for shareholders and may be distributed to
others only if preceded or accompanied by a current prospectus.
SEMI-ANNUAL REPORT
APRIL 30, 2016
HENNESSY CORE BOND FUND
Investor Class HCBFX
Institutional Class HCBIX
hennessyfunds.com | 1-800-966-4354
(This Page Intentionally Left Blank.)
Contents
| Letter to Shareholders | 2 |
| Performance Overview | 4 |
| Financial Statements | |
| Schedule of Investments | 6 |
| Statement of Assets and Liabilities | 12 |
| Statement of Operations | 13 |
| Statements of Changes in Net Assets | 14 |
| Financial Highlights | 16 |
| Notes to the Financial Statements | 20 |
| Expense Example | 28 |
| Proxy Voting | 30 |
| Quarterly Filings on Form N-Q | 30 |
| Federal Tax Distribution Information | 30 |
| Householding | 30 |
| Board Approval of Investment Advisory Agreements | 31 |
| HENNESSY FUNDS | 1-800-966-4354 | |
June 2016
Dear Hennessy Funds Shareholder:
I used to tell my kids, “What doesn’t kill you makes you stronger.” Perhaps that is not the best analogy for investing, but in the face of such roller coaster volatility in the financial markets, it seems to me that what hasn’t killed this bull market rally may just make it stronger. The financial markets brought us flat to modest returns during the six months ended April 30, 2016, with the S&P 500 Index returning 0.43% and the Dow Jones Industrial Average (DJIA) returning 1.98% during the period. These six months were marked by high volatility, the onslaught of more and more regulatory hurdles, the Fed stuck in neutral, fears about the global economy, and wild political rhetoric — all headwinds that I believe could have significantly stalled any positive moves in the market, but didn’t. Even the aggressive pull back in January showed just how skittish the market can be, and yet again the markets showed great resiliency and marched right back.
I continue to be impressed with the persistence of the bull market in U.S. equities, now in its seventh year. Many commentators believe that the U.S. economy is due for a recession, and the market is due for a downturn. However, we find ourselves comparing today’s secular market to the bull run of 1982 to 2000, which was powered by a significant increase in valuations. On March 9th of this year, I took a moment to remember how we all felt seven years ago on March 9, 2009, at the bottom of the financial crisis downturn that had wiped out trillions of dollars’ worth of U.S. equities. I explained to our investors then, and I say the same thing today, I believe that if you invest in quality companies with good fundamentals, over the long term, you should do fine.
If history is any kind of guide, then I think this bull market has some room to run. Rising markets usually fall when there is extreme optimism or euphoria. I haven’t witnessed any of that as of yet. The volatility has unnerved many, but I encourage investors to try to remain focused on investment fundamentals. Many U.S. companies continue to find ways to make a profit and build their already strong balance sheets. Unemployment is low, and wages are rising in real terms, supporting consumer confidence and consumption. With an average price-to-sales ratio of only 1.7x and a dividend yield of approximately 2.5% for the Dow, I believe U.S. equities continue to be attractive. In my opinion, there are many compelling reasons why this market can continue to climb even higher.
The next six months may be fraught with more talk about what the Fed will do, who the next President of the United States will be, and what is happening in China and around the globe. Businesses in every industry, including the asset management business, have concerns about increasing regulatory burdens, taxes, and higher healthcare costs. But, I still believe the ingenuity and perseverance of American business will find ways to endure and to thrive.
Thank you for your continued confidence and investment in our products. If you have any questions or would like to speak with us directly, please don’t hesitate to call us at (800) 966-4354.
Best regards,
Neil J. Hennessy
President and Chief Investment Officer
Past performance does not guarantee future results.
Mutual fund investing involves risk. Principal loss is possible.
Opinions expressed are those of Neil Hennessy and are subject to change, are not guaranteed and should not be considered investment advice.
Price-to-sales ratio is a tool for calculating a stock’s valuation relative to other companies. It is calculated by dividing a stock’s current price by its revenue per share. Dividend yield is calculated as the annual dividends paid by a company divided by its market price per share.
The Dow Jones Industrial Average and S&P 500 Index are unmanaged indices commonly used to measure the performance of U.S. stocks. One cannot invest directly in an index.
| HENNESSY FUNDS | 1-800-966-4354 | |
Performance Overview (Unaudited)
AVERAGE ANNUAL TOTAL RETURN FOR PERIODS ENDED APRIL 30, 2016
| | Six | One | Five | Ten |
| | Months(1) | Year | Years | Years |
| Hennessy Core Bond Fund – | | | | |
| Investor Class (HCBFX) | -0.14% | -1.68% | 2.11% | 3.94% |
| Hennessy Core Bond Fund – | | | | |
| Institutional Class (HCBIX) | 0.07% | -1.34% | 2.40% | 4.21% |
| Barclays Capital Intermediate | | | | |
| U.S. Government/Credit Index | 2.11% | 2.37% | 2.83% | 4.36% |
Expense ratios: 3.20% (Investor Class); 2.83% (Institutional Class)
Performance data quoted represents past performance; past performance does not guarantee future results. The investment return and principal value of an investment will fluctuate so that an investor’s shares, when redeemed, may be worth more or less than their original cost. The performance table does not reflect the deduction of taxes that a shareholder would pay on Fund distributions or the redemption of Fund shares. Current performance of the Fund may be lower or higher than the performance quoted. Performance data current to the most recent month end may be obtained by visiting hennessyfunds.com. Performance for the period from March 12, 2010, to October 26, 2012, is that of the FBR Core Bond Fund and for the periods prior to March 12, 2010, is that of the AFBA 5 Star Total Return Bond Fund.
The expense ratios presented are from the most recent prospectus.
(1) | Periods less than one year are not annualized. |
PERFORMANCE NARRATIVE
Portfolio Managers Gary B. Cloud, CFA, and Peter G. Greig, CFA
Financial Counselors, Inc. (sub-advisor)
Performance:
For the six-month period ended April 30, 2016, the Investor Class of the Hennessy Core Bond Fund returned -0.14%, underperforming the Barclays Intermediate U.S. Government/Credit Index, which returned 2.11% for the same period.
The overweight position in investment grade corporate credit accounted for most of the positive performance of the Fund over the past six months. The income and aging of these higher yielding investment grade securities over the period, as well as the sectors and specific credits they represent, performed well compared to the benchmark. The Fund’s slight exposure to high-yield credit securities, or junk bonds, was the largest detractor from performance. Duration and yield curve-related factors were neutral drivers on relative Fund performance for the period.
Investment Outlook:
Many of the world’s large developed economies are burdened with debt-laden government balance sheets, troubling demographics, and undercapitalized financial systems. However, led by a steady expansion in payrolls, the U.S. remains one of the few bright spots for growth in a dull world economy. Still, domestic growth remains uneven with the first quarter only advancing about 0.5% after expanding about 2% on average since the recovery began in 2009. An increasing level of consumer confidence has been offset somewhat by declining business confidence and weak capital spending.
In part due to the impact of sluggish global growth and uncertain markets, the Fed reduced their consensus expectations for future rate increases at the March meeting of the Federal Open Market Committee. Fed expectations are still much too high in future years, in our opinion, but the directional change was noteworthy. We continue to believe that the Treasury market is more accurately reflecting the moderate pace of future rate increases by the Fed, but that yields may have moved a bit lower than they should have based on that change in expectations alone. Rates could move modestly higher, but we do not expect them to reach the levels at which they started the year.
Opinions expressed are those of the Portfolio Managers as of the date written and are subject to change, are not guaranteed, and should not be considered investment advice or an indication of trading intent.
The Barclays Capital Intermediate U.S. Government/Credit Index is an unmanaged index commonly used to measure the performance of U.S. bonds. One cannot invest directly in an index.
Investments in debt securities typically decrease in value when interest rates rise. The risk is greater for longer-term debt securities. Investments by the Fund in lower-rated and non-rated securities presents a greater risk of loss to principal and interest than higher-rated securities. Investments in Asset-Backed and Mortgage-Backed securities include additional risks that investors should be aware of including credit risk, prepayment risk, possible illiquidity and default, as well as increased susceptibility to adverse economic developments. Investments in foreign securities may involve political, economic and currency risks, greater volatility and differences in accounting methods. The Fund may experience higher fees due to investments in pooled investment vehicles (including ETFs).
References to specific securities should not be considered a recommendation to buy or sell any security. Fund holdings and sector allocations are subject to change. Please refer to the Schedule of Investments included in this report for additional portfolio information.
| HENNESSY FUNDS | 1-800-966-4354 | |
Financial Statements
Schedule of Investments as of April 30, 2016 (Unaudited) |
HENNESSY CORE BOND FUND
(% of Net Assets)
| TOP TEN HOLDINGS (EXCLUDING CASH/CASH EQUIVALENTS) | % NET ASSETS |
| Federal National Mortgage Association, 3.000%, 08/01/2042 | 7.00% |
| U.S. Treasury Note, 2.125%, 05/15/2025 | 5.99% |
| U.S. Treasury Note, 1.625%, 04/30/2019 | 5.45% |
| U.S. Treasury Note, 2.625%, 11/15/2020 | 5.41% |
| Ford Motor Credit Co. LLC, 3.000%, 06/12/2017 | 5.06% |
| The Hartford Financial Services Group, Inc., 5.375%, 03/15/2017 | 5.03% |
| U.S. Treasury Note, 2.500%, 08/15/2023 | 4.90% |
| Associates Corporation of North America, 6.950%, 11/01/2018 | 4.74% |
| Agilent Technologies, Inc., 5.000%, 07/15/2020 | 4.69% |
| Discover Financial Services, 5.200%, 04/27/2022 | 4.60% |
Note: For presentation purposes, the Fund has grouped some of the industry categories. For purposes of categorizing securities for compliance with section 8(b)(1) of the Investment Company Act of 1940, as amended, the Fund uses more specific industry classifications.
| | PREFERRED STOCKS – 8.26% | | Number of Shares/ | | | | | | % of | |
| | | | Par Amount | | | Value | | | Net Assets | |
| | Construction – 0.34% | | | | | | | | | |
| | SCE Trust I | | | 540 | | | $ | 13,819 | | | | 0.34 | % |
| | | | | | | | | | | | | | |
| | Consumer Staples – 0.29% | | | | | | | | | | | | |
| | CHS, Inc. | | | 430 | | | | 11,907 | | | | 0.29 | % |
| | | | | | | | | | | | | | |
| | Financials – 7.63% | | | | | | | | | | | | |
| | Aegon N.V. (b) | | | 125 | | | | 3,215 | | | | 0.08 | % |
| | Allstate Corp. | | | 500 | | | | 13,775 | | | | 0.33 | % |
| | Bank of America Corp. (a) | | | 200 | | | | 5,048 | | | | 0.12 | % |
| | Bank of America Corp. | | | 145 | | | | 3,874 | | | | 0.09 | % |
| | Bank of New York Mellon Corp. | | | 540 | | | | 13,851 | | | | 0.34 | % |
| | BB&T Corp. | | | 555 | | | | 14,041 | | | | 0.34 | % |
| | Capital One Financial Corp. | | | 275 | | | | 7,263 | | | | 0.18 | % |
| | Capital One Financial Corp. | | | 275 | | | | 7,122 | | | | 0.17 | % |
| | Citigroup, Inc. | | | 460 | | | | 11,951 | | | | 0.29 | % |
| | Discover Financial Services | | | 510 | | | | 13,489 | | | | 0.33 | % |
| | Fannie Mae Preferred (a) | | | 7,900 | | | | 30,731 | | | | 0.75 | % |
| | First Republic Bank San Francisco | | | 410 | | | | 10,849 | | | | 0.26 | % |
| | HSBC Finance Corp. | | | 125 | | | | 3,243 | | | | 0.08 | % |
| | Huntington Bancshares, Inc. (a) | | | 385 | | | | 10,137 | | | | 0.25 | % |
| | ING Groep N.V. (b) | | | 130 | | | | 3,329 | | | | 0.08 | % |
| | JPMorgan Chase & Co. | | | 535 | | | | 13,985 | | | | 0.34 | % |
| | MetLife, Inc. | | | 550 | | | | 13,811 | | | | 0.33 | % |
| | Morgan Stanley | | | 460 | | | | 12,199 | | | | 0.30 | % |
| | Northern Trust Corp. | | | 525 | | | | 14,180 | | | | 0.34 | % |
| | PNC Financial Services Group, Inc. | | | 540 | | | | 13,927 | | | | 0.34 | % |
| | Regions Financial Corp. | | | 265 | | | | 7,277 | | | | 0.18 | % |
| | Regions Financial Corp. | | | 275 | | | �� | 7,205 | | | | 0.17 | % |
| | State Street Corp. | | | 520 | | | | 14,128 | | | | 0.34 | % |
| | SunTrust Banks, Inc. | | | 535 | | | | 14,017 | | | | 0.34 | % |
| | The Charles Schwab Corp. (a) | | | 280 | | | | 7,272 | | | | 0.18 | % |
| | The Charles Schwab Corp. | | | 275 | | | | 7,414 | | | | 0.18 | % |
| | The Goldman Sachs Group, Inc. | | | 330 | | | | 8,468 | | | | 0.21 | % |
| | U.S. Bancorp (d) | | | 545 | | | | 14,306 | | | | 0.35 | % |
The accompanying notes are an integral part of these financial statements.
| HENNESSY FUNDS | 1-800-966-4354 | |
| | PREFERRED STOCKS | | Number of Shares/ | | | | | | % of | |
| | | | Par Amount | | | Value | | | Net Assets | |
| | Financials (Continued) | | | | | | | | | |
| | Wells Fargo & Co. | | | 535 | | | $ | 14,188 | | | | 0.34 | % |
| | | | | | | | | | | | | | |
| | | | | | | | | 314,295 | | | | 7.63 | % |
| | Total Preferred Stocks | | | | | | | | | | | | |
| | (Cost $496,099) | | | | | | | 340,021 | | | | 8.26 | % |
| | | | | | | | | | | | | | |
| | REITS – 2.32% | | | | | | | | | | | | |
| | Financials – 2.32% | | | | | | | | | | | | |
| | Apollo Commercial Real Estate Finance, Inc. | | | 6,000 | | | | 95,580 | | | | 2.32 | % |
| | | | | | | | | | | | | | |
| | Total REITS | | | | | | | | | | | | |
| | (Cost $99,299) | | | | | | | 95,580 | | | | 2.32 | % |
| | | | | | | | | | | | | | |
| | CORPORATE BONDS – 44.65% | | | | | | | | | | | | |
| | Consumer Discretionary – 8.31% | | | | | | | | | | | | |
| | Amazon.com, Inc., 2.500%, 11/29/2022 | | | 75,000 | | | | 77,094 | | | | 1.87 | % |
| | Time Warner, Inc., 3.400%, 06/15/2022 | | | 75,000 | | | | 78,142 | | | | 1.90 | % |
| | YUM! Brands, Inc., 5.300%, 09/15/2019 | | | 175,000 | | | | 187,031 | | | | 4.54 | % |
| | | | | | | | | 342,267 | | | | 8.31 | % |
| | | | | | | | | | | | | | |
| | Financials – 25.48% | | | | | | | | | | | | |
| | Associates Corporation of North America, 6.950%, 11/01/2018 | | | 175,000 | | | | 195,230 | | | | 4.74 | % |
| | Discover Financial Services, 5.200%, 04/27/2022 | | | 175,000 | | | | 189,533 | | | | 4.60 | % |
| | Ford Motor Credit Co. LLC, 3.000%, 06/12/2017 | | | 205,000 | | | | 208,309 | | | | 5.06 | % |
| | Lazard Group, 6.850%, 06/15/2017 | | | 37,000 | | | | 38,972 | | | | 0.95 | % |
| | Merrill Lynch Co., Inc., 6.400%, 08/28/2017 | | | 70,000 | | | | 74,297 | | | | 1.80 | % |
| | The Goldman Sachs Group, Inc., 6.000%, 06/15/2020 | | | 70,000 | | | | 79,805 | | | | 1.94 | % |
| | The Hartford Financial Services Group, Inc., 5.375%, 03/15/2017 | | | 200,000 | | | | 207,086 | | | | 5.03 | % |
| | Wells Fargo & Co., 2.550%, 12/07/2020 | | | 55,000 | | | | 56,184 | | | | 1.36 | % |
| | | | | | | | | 1,049,416 | | | | 25.48 | % |
| | | | | | | | | | | | | | |
| | Health Care – 7.22% | | | | | | | | | | | | |
| | Agilent Technologies, Inc., 5.000%, 07/15/2020 | | | 175,000 | | | | 193,031 | | | | 4.69 | % |
| | Celgene Corp., 3.625%, 05/15/2024 | | | 100,000 | | | | 104,363 | | | | 2.53 | % |
| | | | | | | | | 297,394 | | | | 7.22 | % |
The accompanying notes are an integral part of these financial statements.
| | CORPORATE BONDS | | Number of Shares/ | | | | | | % of | |
| | | | Par Amount | | | Value | | | Net Assets | |
| | Telecommunication Services – 3.64% | | | | | | | | | |
| | AT&T, Inc., 5.500%, 02/01/2018 | | | 70,000 | | | $ | 74,983 | | | | 1.82 | % |
| | Verizon Communications, Inc., 2.450%, 11/01/2022 | | | 75,000 | | | | 74,949 | | | | 1.82 | % |
| | | | | | | | | | | | | | |
| | | | | | | | | 149,932 | | | | 3.64 | % |
| | Total Corporate Bonds | | | | | | | | | | | | |
| | (Cost $1,787,431) | | | | | | | 1,839,009 | | | | 44.65 | % |
| | | | | | | | | | | | | | |
| | MORTGAGE BACKED SECURITIES – 7.00% | | | | | | | | | | | | |
| | Federal National Mortgage Association, 3.000%, 08/01/2042 | | | 280,552 | | | | 288,358 | | | | 7.00 | % |
| | | | | | | | | | | | | | |
| | Total Mortgage Backed Securities | | | | | | | | | | | | |
| | (Cost $287,789) | | | | | | | 288,358 | | | | 7.00 | % |
| | | | | | | | | | | | | | |
| | U.S. TREASURY OBLIGATIONS – 32.48% | | | | | | | | | | | | |
| | U.S. Treasury Notes – 32.48% | | | | | | | | | | | | |
| | U.S. Treasury Notes | | | | | | | | | | | | |
| | 1.500%, 08/31/2018 | | | 120,000 | | | | 121,887 | | | | 2.96 | % |
| | 1.625%, 02/15/2026 | | | 150,000 | | | | 147,404 | | | | 3.58 | % |
| | 1.625%, 04/30/2019 | | | 220,000 | | | | 224,538 | | | | 5.45 | % |
| | 2.125%, 05/15/2025 | | | 240,000 | | | | 246,820 | | | | 5.99 | % |
| | 2.500%, 08/15/2023 | | | 190,000 | | | | 201,708 | | | | 4.90 | % |
| | 2.625%, 11/15/2020 | | | 210,000 | | | | 222,731 | | | | 5.41 | % |
| | 2.750%, 02/15/2024 | | | 160,000 | | | | 172,731 | | | | 4.19 | % |
| | | | | | | | | 1,337,819 | | | | 32.48 | % |
| | Total U.S. Treasury Obligations | | | | | | | | | | | | |
| | (Cost $1,321,419) | | | | | | | 1,337,819 | | | | 32.48 | % |
The accompanying notes are an integral part of these financial statements.
| HENNESSY FUNDS | 1-800-966-4354 | |
| | SHORT-TERM INVESTMENTS – 4.75% | | Number | | | | | | % of | |
| | | | of Shares | | | Value | | | Net Assets | |
| | Money Market Funds – 4.75% | | | | | | | | | |
| | Fidelity Government Portfolio, Institutional Class, 0.23% (c) | | | 195,690 | | | $ | 195,690 | | | | 4.75 | % |
| | | | | | | | | | | | | | |
| | Total Short-Term Investments | | | | | | | | | | | | |
| | (Cost $195,690) | | | | | | | 195,690 | | | | 4.75 | % |
| | | | | | | | | | | | | | |
| | Total Investments | | | | | | | | | | | | |
| | (Cost $4,187,727) – 99.46% | | | | | | | 4,096,477 | | | | 99.46 | % |
| | | | | | | | | | | | | | |
| | Other Assets in | | | | | | | | | | | | |
| | Excess of Liabilities – 0.54% | | | | | | | 22,339 | | | | 0.54 | % |
| | | | | | | | | | | | | | |
| | TOTAL NET ASSETS – 100.00% | | | | | | $ | 4,118,816 | | | | 100.00 | % |
Percentages are stated as a percent of net assets.
REIT – Real Estate Investment Trust
| (a) | Non-income producing security. |
| (b) | U.S. traded security of a foreign corporation. |
| (c) | The rate listed is the fund’s 7-day yield as of April 30, 2016. |
| (d) | Investment in affiliated security. Quasar Distributors, LLC, which serves as the Fund’s distributor, is a subsidiary of U.S. Bancorp. Details of transactions with this affiliated company for the period ended April 30, 2016, are as follows: |
| | Issuer | | U.S. Bancorp | | |
| | Beginning Cost | | $ | 13,348 | | |
| | Purchase Cost | | $ | 4,628 | | |
| | Sales Cost | | $ | (4,241 | ) | |
| | Ending Cost | | $ | 13,735 | | |
| | Dividend Income | | $ | 293 | | |
| | Shares | | | 545 | | |
| | Market Value | | $ | 14,306 | | |
The accompanying notes are an integral part of these financial statements.
Summary of Fair Value Exposure at April 30, 2016
The following is a summary of the inputs used to value the Fund’s net assets as of April 30, 2016 (See Note 3 in the accompanying notes to the financial statements):
| Preferred Stocks | | Level 1 | | | Level 2 | | | Level 3 | | | Total | |
| Construction | | $ | 13,819 | | | $ | — | | | $ | — | | | $ | 13,819 | |
| Consumer Staples | | | 11,907 | | | | — | | | | — | | | | 11,907 | |
| Financials | | | 314,295 | | | | — | | | | — | | | | 314,295 | |
| Total Preferred Stocks | | $ | 340,021 | | | $ | — | | | $ | — | | | $ | 340,021 | |
| REITS | | | | | | | | | | | | | | | | |
| Financials | | $ | 95,580 | | | $ | — | | | $ | — | | | $ | 95,580 | |
| Total REITS | | $ | 95,580 | | | $ | — | | | $ | — | | | $ | 95,580 | |
| Corporate Bonds | | | | | | | | | | | | | | | | |
| Consumer Discretionary | | $ | — | | | $ | 342,267 | | | $ | — | | | $ | 342,267 | |
| Financials | | | — | | | | 1,049,416 | | | | — | | | | 1,049,416 | |
| Health Care | | | — | | | | 297,394 | | | | — | | | | 297,394 | |
| Telecommunication Services | | | — | | | | 149,932 | | | | — | | | | 149,932 | |
| Total Corporate Bonds | | $ | — | | | $ | 1,839,009 | | | $ | — | | | $ | 1,839,009 | |
| Mortgage Backed Securities | | $ | — | | | $ | 288,358 | | | $ | — | | | $ | 288,358 | |
| U.S. Treasury Obligations | | | | | | | | | | | | | | | | |
| U.S. Treasury Notes | | $ | — | | | $ | 1,337,819 | | | $ | — | | | $ | 1,337,819 | |
| Total U.S. Treasury Obligations | | $ | — | | | $ | 1,337,819 | | | $ | — | | | $ | 1,337,819 | |
| Short-Term Investments | | | | | | | | | | | | | | | | |
| Money Market Funds | | $ | 195,690 | | | $ | — | | | $ | — | | | $ | 195,690 | |
| Total Short-Term Investments | | $ | 195,690 | | | $ | — | | | $ | — | | | $ | 195,690 | |
| Total Investments | | $ | 631,291 | | | $ | 3,465,186 | | | $ | — | | | $ | 4,096,477 | |
Transfers between levels are recognized at the end of the reporting period. During the six-month period ended April 30, 2016, the Fund recognized no transfers between levels.
The accompanying notes are an integral part of these financial statements.
| HENNESSY FUNDS | 1-800-966-4354 | |
Financial Statements
Statement of Assets and Liabilities as of April 30, 2016 (Unaudited) |
| ASSETS: | | | |
| Investments in securities, at value (cost $4,173,992) | | $ | 4,082,171 | |
| Investments in affiliated securities, at value (cost $13,735) | | | 14,306 | |
| Total investments in securities (cost $4,187,727) | | | 4,096,477 | |
| Dividends and interest receivable | | | 33,360 | |
| Receivable for fund shares sold | | | 1,500 | |
| Receivable for securities sold | | | 264 | |
| Prepaid expenses and other assets | | | 17,694 | |
| Total Assets | | | 4,149,295 | |
| | | | | |
| LIABILITIES: | | | | |
| Due to custodian | | | 375 | |
| Payable to advisor | | | 2,729 | |
| Payable to administrator | | | 1,144 | |
| Payable to auditor | | | 10,207 | |
| Accrued distribution fees | | | 4,387 | |
| Accrued service fees | | | 147 | |
| Accrued trustees fees | | | 3,333 | |
| Accrued expenses and other payables | | | 8,157 | |
| Total Liabilities | | | 30,479 | |
| NET ASSETS | | $ | 4,118,816 | |
| | | | | |
| NET ASSETS CONSIST OF: | | | | |
| Capital stock | | $ | 4,263,413 | |
| Accumulated net investment loss | | | (4,012 | ) |
| Accumulated net realized loss on investments | | | (49,335 | ) |
| Unrealized net depreciation on investments | | | (91,250 | ) |
| Total Net Assets | | $ | 4,118,816 | |
| | | | | |
| NET ASSETS | | | | |
| Investor Class: | | | | |
| Shares authorized (no par value) | | Unlimited | |
| Net assets applicable to outstanding Investor Class shares | | $ | 1,750,887 | |
| Shares issued and outstanding | | | 239,544 | |
| Net asset value, offering price and redemption price per share | | $ | 7.31 | |
| | | | | |
| Institutional Class: | | | | |
| Shares authorized (no par value) | | Unlimited | |
| Net assets applicable to outstanding Institutional Class shares | | $ | 2,367,929 | |
| Shares issued and outstanding | | | 367,681 | |
| Net asset value, offering price and redemption price per share | | $ | 6.44 | |
The accompanying notes are an integral part of these financial statements.
Financial Statements
Statement of Operations for the six months ended April 30, 2016 (Unaudited) |
| INVESTMENT INCOME: | | | |
| Dividend income | | $ | 19,086 | |
| Dividend income from affiliated securities | | | 293 | |
| Interest income | | | 49,889 | |
| Total investment income | | | 69,268 | |
| | | | | |
| EXPENSES: | | | | |
| Investment advisory fees (See Note 5) | | | 16,940 | |
| Federal and state registration fees | | | 13,778 | |
| Compliance expense | | | 11,790 | |
| Audit fees | | | 10,249 | |
| Trustees’ fees and expenses | | | 6,082 | |
| Reports to shareholders | | | 3,065 | |
| Administration, fund accounting, custody and transfer agent fees (See Note 5) | | | 2,075 | |
| Sub-transfer agent expenses – Investor Class (See Note 5) | | | 1,469 | |
| Distribution fees – Investor Class (See Note 5) | | | 1,345 | |
| Service fees – Investor Class (See Note 5) | | | 897 | |
| Other expenses | | | 2,006 | |
| Total expenses | | | 69,696 | |
| NET INVESTMENT LOSS | | $ | (428 | ) |
| | | | | |
| REALIZED AND UNREALIZED GAINS (LOSSES): | | | | |
| Net realized gain (loss) on: | | | | |
| Unaffiliated investments | | $ | (49,436 | ) |
| Affiliated investments | | | 110 | |
| Net change in unrealized depreciation on investments | | | 43,663 | |
| Net loss on investments | | | (5,663 | ) |
| NET DECREASE IN NET ASSETS RESULTING FROM OPERATIONS | | $ | (6,091 | ) |
The accompanying notes are an integral part of these financial statements.
| HENNESSY FUNDS | 1-800-966-4354 | |
Financial Statements
| Statements of Changes in Net Assets |
| | | Six Months Ended | | | | |
| | | April 30, 2016 | | | Year Ended | |
| | | (Unaudited) | | | October 31, 2015 | |
| OPERATIONS: | | | | | | |
| Net investment income (loss) | | $ | (428 | ) | | $ | 52,926 | |
| Net realized gain (loss) on investments | | | (49,326 | ) | | | 51,572 | |
| Net change in unrealized appreciation (depreciation) | | | | | | | | |
| on investments | | | 43,663 | | | | (121,931 | ) |
| Net decrease in net assets resulting from operations | | | (6,091 | ) | | | (17,433 | ) |
| | | | | | | | | |
| DISTRIBUTIONS TO SHAREHOLDERS FROM: | | | | | | | | |
| Net investment income | | | | | | | | |
| Investor Class | | | (715 | ) | | | (24,771 | ) |
| Institutional Class | | | (2,869 | ) | | | (30,102 | ) |
| Net realized gains | | | | | | | | |
| Investor Class | | | (19,448 | ) | | | (37,403 | ) |
| Institutional Class | | | (29,843 | ) | | | (30,800 | ) |
| Total distributions | | | (52,875 | ) | | | (123,076 | ) |
| | | | | | | | | |
| CAPITAL SHARE TRANSACTIONS: | | | | | | | | |
| Proceeds from shares subscribed – Investor Class | | | 296,398 | | | | 435,393 | |
| Proceeds from shares subscribed – Institutional Class | | | 715,636 | | | | 1,039,343 | |
| Dividends reinvested – Investor Class | | | 18,154 | | | | 56,956 | |
| Dividends reinvested – Institutional Class | | | 25,941 | | | | 60,107 | |
| Cost of shares redeemed – Investor Class | | | (407,635 | ) | | | (1,369,633 | ) |
| Cost of shares redeemed – Institutional Class | | | (731,252 | ) | | | (924,976 | ) |
| Net decrease in net assets derived | | | | | | | | |
| from capital share transactions | | | (82,758 | ) | | | (702,810 | ) |
| TOTAL DECREASE IN NET ASSETS | | | (141,724 | ) | | | (843,319 | ) |
| | | | | | | | | |
| NET ASSETS: | | | | | | | | |
| Beginning of period | | | 4,260,540 | | | | 5,103,859 | |
| End of period | | $ | 4,118,816 | | | $ | 4,260,540 | |
| Undistributed net investment loss, end of period | | $ | (4,012 | ) | | $ | — | |
The accompanying notes are an integral part of these financial statements.
| Statements of Changes in Net Assets – Continued |
| | | Six Months Ended | | | | |
| | | April 30, 2016 | | | Year Ended | |
| | | (Unaudited) | | | October 31, 2015 | |
| CHANGES IN SHARES OUTSTANDING: | | | | | | |
| Shares sold – Investor Class | | | 40,736 | | | | 58,095 | |
| Shares sold – Institutional Class | | | 110,535 | | | | 157,489 | |
| Shares issued to holders as reinvestment | | | | | | | | |
| of dividends – Investor Class | | | 2,491 | | | | 7,586 | |
| Shares issued to holders as reinvestment | | | | | | | | |
| of dividends – Institutional Class | | | 4,048 | | | | 9,104 | |
| Shares redeemed – Investor Class | | | (55,940 | ) | | | (183,613 | ) |
| Shares redeemed – Institutional Class | | | (114,321 | ) | | | (140,907 | ) |
| Net decrease in shares outstanding | | | (12,451 | ) | | | (92,246 | ) |
The accompanying notes are an integral part of these financial statements.
| HENNESSY FUNDS | 1-800-966-4354 | |
Financial Statements
For an Investor Class share outstanding throughout each period
| | | Six Months Ended | |
| | | April 30, 2016 | |
| | | (Unaudited) | |
| PER SHARE DATA: | | | |
| Net asset value, beginning of period | | $ | 7.40 | |
| | | | | |
| Income (loss) from investment operations: | | | | |
| Net investment income (loss) | | | (0.01 | ) |
| Net realized and unrealized gains (losses) on investments | | | (0.00 | )(2) |
| Total from investment operations | | | (0.01 | ) |
| | | | | |
| Less distributions: | | | | |
| Dividends from net investment income | | | (0.01 | ) |
| Dividends from net realized gains | | | (0.07 | ) |
| Total distributions | | | (0.08 | ) |
| Net asset value, end of period | | $ | 7.31 | |
| | | | | |
| TOTAL RETURN | | | (0.14 | )%(3) |
| | | | | |
| SUPPLEMENTAL DATA AND RATIOS: | | | | |
| Net assets, end of period (millions) | | $ | 1.75 | |
| Ratio of expenses to average net assets: | | | | |
| Before expense reimbursement | | | 3.53 | %(4) |
| After expense reimbursement | | | 3.53 | %(4) |
| Ratio of net investment income (loss) to average net assets: | | | | |
| Before expense reimbursement | | | (0.26 | )%(4) |
| After expense reimbursement | | | (0.26 | )%(4) |
Portfolio turnover rate(5) | | | 64 | %(3) |
(1) | Calculated based on average shares outstanding method. |
(2) | Amount is less than $0.01. |
(3) | Not annualized. |
(4) | Annualized. |
(5) | Portfolio turnover is calculated on the basis of the Fund as a whole. |
The accompanying notes are an integral part of these financial statements.
| Year Ended October 31, | |
| 2015 | | | 2014 | | | 2013 | | | 2012 | | | 2011 | |
| | | | | | | | | | | | | | |
| $ | 7.61 | | | $ | 9.56 | | | $ | 9.97 | | | $ | 9.56 | | | $ | 9.82 | |
| | | | | | | | | | | | | | | | | | | |
| | | | | | | | | | | | | | | | | | | |
| | 0.06 | | | | 0.17 | | | | 0.27 | | | | 0.28 | | | | 0.35 | (1) |
| | (0.10 | ) | | | (0.06 | ) | | | (0.23 | ) | | | 0.41 | | | | (0.14 | ) |
| | (0.04 | ) | | | 0.11 | | | | 0.04 | | | | 0.69 | | | | 0.21 | |
| | | | | | | | | | | | | | | | | | | |
| | | | | | | | | | | | | | | | | | | |
| | (0.07 | ) | | | (0.18 | ) | | | (0.27 | ) | | | (0.20 | ) | | | (0.32 | ) |
| | (0.10 | ) | | | (1.88 | ) | | | (0.18 | ) | | | (0.08 | ) | | | (0.15 | ) |
| | (0.17 | ) | | | (2.06 | ) | | | (0.45 | ) | | | (0.28 | ) | | | (0.47 | ) |
| $ | 7.40 | | | $ | 7.61 | | | $ | 9.56 | | | $ | 9.97 | | | $ | 9.56 | |
| | | | | | | | | | | | | | | | | | | |
| | (0.50 | )% | | | 1.41 | % | | | 0.41 | % | | | 7.38 | % | | | 2.35 | % |
| | | | | | | | | | | | | | | | | | | |
| | | | | | | | | | | | | | | | | | | |
| $ | 1.87 | | | $ | 2.82 | | | $ | 3.02 | | | $ | 3.57 | | | $ | 4.05 | |
| | | | | | | | | | | | | | | | | | | |
| | 3.16 | % | | | 2.85 | % | | | 2.26 | % | | | 2.12 | % | | | 2.38 | % |
| | 2.52 | % | | | 1.30 | % | | | 1.30 | % | | | 1.30 | % | | | 1.30 | % |
| | | | | | | | | | | | | | | | | | | |
| | 0.32 | % | | | 0.74 | % | | | 1.70 | % | | | 2.01 | % | | | 2.58 | % |
| | 0.96 | % | | | 2.29 | % | | | 2.66 | % | | | 2.83 | % | | | 3.66 | % |
| | 50 | % | | | 54 | % | | | 74 | % | | | 75 | % | | | 57 | % |
The accompanying notes are an integral part of these financial statements.
| HENNESSY FUNDS | 1-800-966-4354 | |
Financial Statements
For an Institutional Class share outstanding throughout each period
| | | Six Months Ended | |
| | | April 30, 2016 | |
| | | (Unaudited) | |
| PER SHARE DATA: | | | |
| Net asset value, beginning of period | | $ | 6.51 | |
| | | | | |
| Income from investment operations: | | | | |
| Net investment income (loss) | | | (0.00 | )(2) |
| Net realized and unrealized gains (losses) on investments | | | (0.00 | )(2) |
| Total from investment operations | | | 0.00 | |
| | | | | |
| Less distributions: | | | | |
| Dividends from net investment income | | | (0.00 | )(2) |
| Dividends from net realized gains | | | (0.07 | ) |
| Total distributions | | | (0.07 | ) |
| Net asset value, end of period | | $ | 6.44 | |
| | | | | |
| TOTAL RETURN | | | 0.07 | %(3) |
| | | | | |
| SUPPLEMENTAL DATA AND RATIOS: | | | | |
| Net assets, end of period (millions) | | $ | 2.37 | |
| Ratio of expenses to average net assets: | | | | |
| Before expense reimbursement | | | 3.12 | %(4) |
| After expense reimbursement | | | 3.12 | %(4) |
| Ratio of net investment income to average net assets: | | | | |
| Before expense reimbursement | | | 0.15 | %(4) |
| After expense reimbursement | | | 0.15 | %(4) |
Portfolio turnover rate(5) | | | 64 | %(3) |
(1) | Calculated based on average shares outstanding method. |
(2) | Amount is less than $0.01. |
(3) | Not annualized. |
(4) | Annualized. |
(5) | Portfolio turnover is calculated on the basis of the Fund as a whole. |
The accompanying notes are an integral part of these financial statements.
| Year Ended October 31, | |
| 2015 | | | 2014 | | | 2013 | | | 2012 | | | 2011 | |
| | | | | | | | | | | | | | |
| $ | 6.69 | | | $ | 8.65 | | | $ | 9.06 | | | $ | 8.77 | | | $ | 9.05 | |
| | | | | | | | | | | | | | | | | | | |
| | | | | | | | | | | | | | | | | | | |
| | 0.09 | | | | 0.16 | | | | 0.19 | | | | 0.27 | | | | 0.34 | (1) |
| | (0.09 | ) | | | (0.06 | ) | | | (0.13 | ) | | | 0.38 | | | | (0.12 | ) |
| | — | | | | 0.10 | | | | 0.06 | | | | 0.65 | | | | 0.22 | |
| | | | | | | | | | | | | | | | | | | |
| | | | | | | | | | | | | | | | | | | |
| | (0.09 | ) | | | (0.18 | ) | | | (0.29 | ) | | | (0.28 | ) | | | (0.35 | ) |
| | (0.09 | ) | | | (1.88 | ) | | | (0.18 | ) | | | (0.08 | ) | | | (0.15 | ) |
| | (0.18 | ) | | | (2.06 | ) | | | (0.47 | ) | | | (0.36 | ) | | | (0.50 | ) |
| $ | 6.51 | | | $ | 6.69 | | | $ | 8.65 | | | $ | 9.06 | | | $ | 8.77 | |
| | | | | | | | | | | | | | | | | | | |
| | (0.06 | )% | | | 1.53 | % | | | 0.69 | % | | | 7.63 | % | | | 2.62 | % |
| | | | | | | | | | | | | | | | | | | |
| | | | | | | | | | | | | | | | | | | |
| $ | 2.39 | | | $ | 2.29 | | | $ | 3.38 | | | $ | 33.34 | | | $ | 23.25 | |
| | | | | | | | | | | | | | | | | | | |
| | 2.79 | % | | | 2.53 | % | | | 1.67 | % | | | 1.31 | % | | | 1.43 | % |
| | 2.25 | % | | | 1.05 | % | | | 1.05 | % | | | 1.05 | % | | | 1.05 | % |
| | | | | | | | | | | | | | | | | | | |
| | 0.66 | % | | | 1.06 | % | | | 2.28 | % | | | 2.74 | % | | | 3.54 | % |
| | 1.20 | % | | | 2.54 | % | | | 2.90 | % | | | 3.00 | % | | | 3.92 | % |
| | 50 | % | | | 54 | % | | | 74 | % | | | 75 | % | | | 57 | % |
The accompanying notes are an integral part of these financial statements.
| HENNESSY FUNDS | 1-800-966-4354 | |
Financial Statements
Notes to the Financial Statements April 30, 2016 (Unaudited) |
1). ORGANIZATION
The Hennessy Core Bond Fund (the “Fund”) is a series of Hennessy Funds Trust (the “Trust”), which was organized as a Delaware statutory trust on September 17, 1992. The Fund is an open-end management investment company registered under the Investment Company Act of 1940, as amended. The Fund is a successor to the FBR Core Bond Fund (the “Predecessor FBR Fund”), a series of The FBR Funds, a Delaware statutory trust, pursuant to a reorganization that took place after the close of business on October 26, 2012. Prior to October 26, 2012, the Fund had no investment operations. As a result of the reorganization, holders of the Investor Class shares of the Predecessor FBR Fund received Investor Class shares of the Fund (the Investor Class shares of the Fund are the successor to the accounting and performance information of the Predecessor FBR Fund), and holders of the Institutional Class shares of the Predecessor FBR Fund received Institutional Class shares of the Fund (the Institutional Class shares of the Fund are the successor to the accounting and performance information of the Predecessor FBR Fund). The investment objective of the Fund is current income with capital growth as a secondary objective. The Fund is a diversified fund.
The Fund offers Investor Class and Institutional Class shares. Each class of shares differs principally in its respective administration, 12b-1 distribution and service, shareholder servicing, and transfer agent expenses and sales charges, if any. Each class has identical rights to earnings, assets, and voting privileges, except for class-specific expenses and exclusive rights to vote on matters affecting only an individual class.
As an investment company, the Fund follows the investment company accounting and reporting guidance of the Financial Accounting Standards Board (“FASB”) Accounting Standard Codification Topic 946 “Financial Services—Investment Companies.”
2). SIGNIFICANT ACCOUNTING POLICIES
The following is a summary of significant accounting policies consistently followed by the Fund in the preparation of the financial statements. These policies are in conformity with U.S. generally accepted accounting principles (“GAAP”).
| a). | Investment Valuation – All investments in securities are recorded at their estimated fair value, as described in Note 3. |
| b). | Federal Income Taxes – Provision for federal income taxes or excise taxes has not been made since the Fund has elected to be taxed as a “regulated investment company” and intends to distribute substantially all of its taxable income to its shareholders and otherwise comply with the provisions of the Internal Revenue Code of 1986, as amended, applicable to regulated investment companies. Net investment income or loss and realized gains and losses for federal income tax purposes may differ from that reported on the financial statements because of temporary book and tax basis differences. Temporary differences are primarily the result of the treatment of wash sales for tax reporting purposes. The Fund recognizes interest and penalties related to income tax benefits, if any, in the statement of operations as an income tax expense. Distributions from net realized gains for book purposes may include short-term capital gains, which are included as ordinary income to shareholders for tax purposes. |
| c). | Income and Expenses – Dividend income is recognized on the ex-dividend date or as soon as information is available to the Fund. Interest income, which includes the amortization of premium and accretion of discount, is recognized on an accrual basis. The Fund is charged for those expenses that are directly attributable to the portfolio, such as advisory, administration, and certain shareholder service fees. Income, expenses (other than expenses attributable to a specific class), and realized and unrealized gains or losses on investments are allocated to each class of shares based on its respective net assets. |
| d). | Distributions to Shareholders – Dividends from net investment income for the Fund, if any, are declared and paid monthly. Distributions of net realized capital gains, if any, are declared and paid annually, usually in December. |
| e). | Security Transactions – Investment and shareholder transactions are recorded on the trade date. The Fund determines the gain or loss realized from the investment transactions by comparing the original cost of the security lot sold with the net sale proceeds. Discounts and premiums on securities purchased are accreted/amortized over the life of the respective security. |
| f). | Use of Estimates – The preparation of financial statements in conformity with GAAP requires management to make estimates and assumptions that affect the reported amounts of assets and liabilities and disclosure of contingent assets and liabilities at the date of the financial statements and the reported change in net assets during the reporting period. Actual results could differ from those estimates. |
| g). | Share Valuation – The net asset value (“NAV”) per share of the Fund is calculated by dividing the sum of the value of the securities held by the Fund, plus cash or other assets, minus all liabilities (including estimated accrued expenses) by the total number of shares outstanding for the Fund, rounded to the nearest cent. The Fund’s shares will not be priced on days the New York Stock Exchange is closed for trading. The offering and redemption price per share for the Fund is equal to the Fund’s NAV per share. |
| h). | Foreign Currency – Values of investments denominated in foreign currencies, if any, are converted into U.S. dollars using the spot market rate of exchange at the time of valuation. Purchases and sales of investments and income are translated into U.S. dollars using the spot market rate of exchange prevailing on the respective dates of such transactions. The Fund does not isolate the portion of the results of operations resulting from fluctuations in foreign exchange rates on investments from fluctuations resulting from changes in the market prices of securities held. Such fluctuations are included with the net realized and unrealized gain or loss on investments. Foreign investments present additional risks due to currency fluctuations, economic and political factors, lower liquidity, government regulations, differences in accounting standards, and other factors. |
| i). | Forward Contracts – The Fund may enter into forward currency contracts to reduce its exposure to changes in foreign currency exchange rates on its foreign holdings and to lock in the U.S. dollar cost of firm purchase and sale commitments for securities denominated in foreign currencies. A forward currency contract is a commitment to purchase or sell a foreign currency at a future date at a negotiated forward rate. The gain or loss arising from the difference between the U.S. dollar cost of the original contract and the value of the foreign currency in U.S. dollars upon closing of such contract is included in net realized gain or loss from foreign currency transactions. During the six months ended April 30, 2016, the Fund did not enter into any forward contracts. |
| HENNESSY FUNDS | 1-800-966-4354 | |
| j). | Repurchase Agreements – The Fund may enter into repurchase agreements with member banks or security dealers of the Federal Reserve Board whom the investment advisor deems creditworthy. The repurchase price generally equals the price paid by the Fund plus interest negotiated on the basis of current short-term rates. |
| | Securities pledged as collateral for repurchase agreements are held by the custodian bank until the respective agreements mature. Provisions of the repurchase agreements ensure that the market value of the collateral, including accrued interest thereon, is sufficient to cover the repurchase amount in the event of default of the counterparty. If the counterparty defaults and the value of the collateral declines or if the counterparty enters an insolvency proceeding, realization of the collateral by the Fund may be delayed or limited. |
| k). | Accounting for Uncertainty in Income Taxes – The Fund has accounting policies regarding recognition and measurement of tax positions taken or expected to be taken on a tax return. The tax returns of the Fund for the prior three fiscal years are open for examination. The Fund has reviewed all open tax years in major jurisdictions and concluded that there is no impact on the Fund’s net assets and no tax liability resulting from unrecognized tax benefits relating to uncertain income tax positions taken or expected to be taken on a tax return. The Fund’s major tax jurisdictions are U.S. federal and Delaware. |
| l). | Derivatives – The Fund may invest in, or enter into, derivatives, such as options, futures contracts, options on futures contracts, and swaps, for a variety of reasons, including to hedge certain risks, to provide a substitute for purchasing or selling particular securities, or to increase potential income gain. Derivatives are financial contracts based on an underlying or notional amount, require no initial investment or an initial net investment that is smaller than would normally be required to have a similar response to changes in market factors, and require or permit net settlement. Derivatives may allow the Fund to increase or decrease the level of risk to which the Fund is exposed more quickly and efficiently than transactions in other types of instruments. The main purpose of utilizing derivative instruments is for hedging purposes. |
| | The Fund follows the financial accounting reporting rules as required by the Derivatives and Hedging Topic of the FASB Accounting Standards Codification. Under such rules, the Fund is required to include enhanced disclosure that enables investors to understand how and why an entity uses derivatives, how derivatives are accounted for, and how derivatives instruments affect an entity’s results of operations and financial position. During the six months ended April 30, 2016, the Fund did not hold any derivative instruments. |
| m). | New Accounting Pronouncements – In May 2015, the FASB issued ASU No. 2015-07 “Disclosure for Investments in Certain Entities that Calculate Net Asset Value per Share (or Its Equivalent).” The amendments in ASU No. 2015-07 remove the requirement to categorize within the fair value hierarchy investments measured at NAV and require the disclosure of sufficient information to reconcile the fair value of the remaining assets categorized within the fair value hierarchy to the financial statements. The amendments in ASU No. 2015-07 are effective for fiscal years beginning after December 15, 2015, and interim periods within those fiscal years. Management has reviewed the requirements and believes the adoption of ASU 2015-07 will not have a material impact on the Fund’s financial statements and related disclosures. |
3). SECURITIES VALUATION
The Fund follows authoritative fair valuation accounting standards that establish an authoritative definition of fair value and set out a hierarchy for measuring fair value.
These standards require additional disclosures about the various inputs and valuation techniques used to develop the measurements of fair value and a discussion in changes in valuation techniques and related inputs during the period. These inputs are summarized in the three broad levels listed below:
| | Level 1 – | Unadjusted, quoted prices in active markets for identical instruments that the Fund has the ability to access at the date of measurement. |
| | Level 2 – | Other significant observable inputs (including, but not limited to, quoted prices in active markets for similar instruments, quoted prices in markets that are not active for identical or similar instruments, and model-derived valuations in which all significant inputs and significant value drivers are observable in active markets (such as interest rates, prepayment speeds, credit risk curves, default rates, and similar data)). |
| | Level 3 – | Significant unobservable inputs (including the Fund’s own assumptions about what market participants would use to price the asset or liability based on the best available information) when observable inputs are unavailable. |
Following is a description of the valuation techniques applied to the Fund’s major categories of assets and liabilities measured at fair value on a recurring basis.
Equity Securities – Equity securities, including common stocks, preferred stocks, foreign-issued common stocks, exchange-traded funds, closed-end mutual funds, partnerships, rights, and real estate investment trusts, that are traded on a securities exchange for which a last-quoted sales price is readily available will generally be valued at the last sales price as reported by the primary exchange on which the securities are listed. Securities listed on The NASDAQ Stock Market (“NASDAQ”) will generally be valued at the NASDAQ Official Closing Price, which may differ from the last sales price reported. Securities traded on a securities exchange for which a last-quoted sales price is not readily available will generally be valued at the mean between the bid and ask prices. To the extent these securities are actively traded and valuation adjustments are not applied, they are classified in Level 1 of the fair value hierarchy. Securities traded on foreign exchanges generally are not valued at the same time the Fund calculates its NAV because most foreign markets close well before such time. The earlier close of most foreign markets gives rise to the possibility that significant events, including broad market moves, may have occurred in the interim. In certain circumstances, it may be determined that a security needs to be fair valued because it appears that the value of the security might have been materially affected by events occurring after the close of the market in which the security is principally traded, but before the time the Fund calculates its NAV, such as by a development that affects an entire market or region (e.g., weather-related events) or a potentially global development (e.g., a terrorist attack that may be expected to have an effect on investor expectations worldwide).
Registered Investment Companies – Investments in registered investment companies (e.g., mutual funds) are generally priced at the ending NAV provided by the applicable registered investment company’s service agent and will be classified in Level 1 of the fair value hierarchy.
Debt Securities – Debt securities, including corporate bonds, asset-backed securities, mortgage-backed securities, municipal bonds, U.S. Treasuries, and U.S. government agency issues, are generally valued at market on the basis of valuations furnished by an independent pricing service that utilizes both dealer-supplied valuations and formula-based techniques. The pricing service may consider recently executed transactions in securities of the issuer or comparable issuers, market price quotations (where observable), bond spreads, and fundamental data relating to the issuer. In addition, the model may
| HENNESSY FUNDS | 1-800-966-4354 | |
incorporate observable market data, such as reported sales of similar securities, broker quotes, yields, bids, offers, and reference data. Certain securities are valued primarily using dealer quotations. These securities are generally classified in Level 2 of the fair value hierarchy.
Short-Term Securities – Short-term equity investments, including money market funds, are valued in the manner specified above. Short-term debt investments with an original term to maturity of 60 days or less are valued at amortized cost, which approximates fair market value. If the original term to maturity of a short-term debt investment exceeded 60 days, then the values as of the 61st day prior to maturity are amortized. Amortized cost is not used if its use would be inappropriate due to credit or other impairments of the issuer, in which case the security’s fair value would be determined, as described below. Short-term securities are generally classified in Level 1 or Level 2 of the fair market hierarchy depending on the inputs used and market activity levels for specific securities.
The Board of Trustees of the Fund (the “Board”) has adopted fair value pricing procedures that are followed when a price for a security is not readily available or if a significant event has occurred that indicates the closing price of a security no longer represents the true value of that security. Fair value pricing determinations are made in good faith in accordance with these procedures. There are numerous criteria that will be given consideration in determining a fair value of a security, such as the trading volume of a security and markets, the value of other like securities, and news events with direct bearing to a security or markets. Fair value pricing results in an estimated price for a security that reflects the amount the Fund might reasonably expect to receive in a current sale. Depending on the relative significance of the valuation inputs, these securities may be classified in either Level 2 or Level 3 of the fair value hierarchy.
The fair valuation of foreign securities may be determined with the assistance of a pricing service using correlations between the movement of prices of such securities and indices of domestic securities and other appropriate indicators, such as closing market prices of relevant American Depositary Receipts or futures contracts. The effect of using fair value pricing is that the Fund’s NAV will reflect the affected portfolio securities’ value as determined by the Board or its designee instead of being determined by the market. Using a fair value pricing methodology to price foreign securities may result in a value that is different from a foreign security’s most recent closing price and from the prices used by other investment companies to calculate their NAVs and are generally considered Level 2 prices in the fair valuation hierarchy. Because the Fund may invest in foreign securities, the value of the Fund’s portfolio securities may change on days when you will not be able to purchase or redeem your shares.
The Board has delegated day-to-day valuation matters to a Valuation Committee comprised of one or more representatives from Hennessy Advisors, Inc., the Fund’s investment advisor. The function of the Valuation Committee is to value securities where current and reliable market quotations are not readily available. All actions taken by the Valuation Committee are reviewed by the Board.
The Fund has performed an analysis of all existing investments to determine the significance and character of all inputs to their fair value determination. Various inputs are used in determining the value of the Fund’s investments. The inputs or methodology used for valuing securities are not necessarily an indication of the risk associated with investing in those securities. Details related to the fair valuation hierarchy of the Fund’s securities as of April 30, 2016, are included in the Fund’s Schedule of Investments.
4). INVESTMENT TRANSACTIONS
Purchases and sales of investment securities (excluding government and short-term investments) for the Fund during the six months ended April 30, 2016 were $310,634 and $901,832, respectively.
Purchases and sales/maturities of long-term U.S. government securities for the Fund during the six months ended April 30, 2016, were $1,627,063 and $1,328,730, respectively.
5). INVESTMENT MANAGEMENT FEE AND OTHER TRANSACTIONS WITH AFFILIATES
Hennessy Advisors, Inc. (the “Advisor”) is the investment advisor of the Fund. The Advisor provides the Fund with investment management services under an Investment Advisory Agreement. The Advisor furnishes all investment advice, office space, facilities, and provides most of the personnel needed by the Fund. As compensation for its services, the Advisor is entitled to a monthly fee from the Fund. The fee is based upon the average daily net assets of the Fund at the annual rate of 0.80%. The net investment advisory fees payable by the Fund as of April 30, 2016, were $2,729.
The Advisor has delegated the day-to-day management of the Fund to a sub-advisor, Financial Counselors, Inc. The Advisor pays the sub-advisor fees for the Fund from its own assets and these fees are not an additional expense of the Fund.
In the past, the Advisor had contractually agreed to limit the total annual operating expenses of the Fund to 1.05% of the Fund’s net assets for both the Investor Class shares and Institutional Class shares of the Fund (excluding interest, taxes, brokerage commissions, dividend expenses, 12b-1 fees, acquired fund fees and expenses, extraordinary legal expenses, or any other extraordinary expenses). The expense limitation agreement for the Fund expired as of February 28, 2015.
For a period of three years after the year in which the Advisor waived or reimbursed expenses, the Advisor may seek reimbursement from the Fund to the extent that total annual fund operating expenses are less than the expense limitation that was in effect at the time the Advisor waived or reimbursed expenses. As of April 30, 2016, cumulative expenses subject to potential recovery under the aforementioned conditions and year of expiration were as follows:
| | | October 31, | October 31, | October 31, | |
| | | 2016 | 2017 | 2018 | Total |
| | Investor Class | $36,603 | $46,263 | $16,047 | $ 98,913 |
| | Institutional Class | $74,877 | $42,715 | $13,084 | $130,676 |
The Board has approved a Shareholder Servicing Agreement for the Investor Class shares of the Fund, effective as of February 28, 2015, which was instituted to compensate the Advisor for the non-investment management services it provides to the Fund. The Shareholder Servicing Agreement provides for a monthly fee paid to the Advisor at an annual rate of 0.10% of the average daily net assets of the Fund attributable to Investor Class shares. Shareholder service fees payable by the Fund as of April 30, 2016, were $147.
The Fund has adopted a plan pursuant to Rule 12b-1 under the Investment Company Act of 1940, as amended, that authorizes payments in connection with the distribution of the Fund’s shares at an annual rate of up to 0.25% of the Fund’s average daily net assets attributable to Investor Class shares. Even though the authorized rate is up to 0.25%, the Fund has only used up to 0.15% of its average daily net assets attributable to Investor Class shares for such purpose since March 1, 2015. Amounts paid under the plan may be spent on any activities or expenses primarily intended to result in the sale of shares, including, but not limited to, advertising, shareholder account servicing, the printing and mailing of prospectuses to other than current shareholders, the
| HENNESSY FUNDS | 1-800-966-4354 | |
printing and mailing of sales literature, and compensation for sales and marketing activities or to financial institutions and others, such as dealers and distributors.
The Fund has entered into agreements with various brokers, dealers, and financial intermediaries in connection with the sale of shares of the Fund. The agreements provide for periodic payments by the Fund to the brokers, dealers, and financial intermediaries for providing certain shareholder maintenance services (sub-transfer agent expenses). These shareholder services include the pre-processing and quality control of new accounts, shareholder correspondence, answering customer inquiries regarding account status, and facilitating shareholder telephone transactions. Fees paid by the Fund to various brokers, dealers, and financial intermediaries during the six months ended April 30, 2016, were $1,469.
U.S. Bancorp Fund Services, LLC (“USBFS”) provides the Fund with administrative, fund accounting, and transfer agent services and necessary office equipment. As administrator, USBFS is responsible for activities such as (i) preparing various federal and state regulatory filings, reports, and returns for the Fund, (ii) preparing reports and materials to be supplied to the Board, (iii) monitoring the activities of the Fund’s custodian, transfer agent, and accountants, and (iv) coordinating the preparation and payment of the Fund’s expenses and reviewing the Fund’s expense accruals. Fees paid to USBFS during the six months ended April 30, 2016, were $2,075.
U.S. Bank, N.A., an affiliate of USBFS, serves as the Fund’s custodian. Quasar Distributors, LLC acts as the Fund’s principal underwriter in a continuous public offering of the Fund’s shares. Quasar Distributors, LLC is an affiliate of USBFS and U.S. Bank, N.A.
6). LINE OF CREDIT
The Fund has an uncommitted line of credit with the other funds in the Hennessy Funds family of funds (the “Hennessy Funds”) in the amount of the lesser of (i) $100,000,000 or (ii) 33.33% of each Hennessy Fund’s net assets, or 30% for the Hennessy Gas Utility Fund and 10% for the Hennessy Balanced Fund, intended to provide short-term financing, if necessary, subject to certain restrictions, in connection with shareholder redemptions. The credit facility is with the Hennessy Funds’ custodian bank, U.S. Bank, N.A. Borrowings under this arrangement bear interest at the bank’s prime rate and are secured by all of the Fund’s assets (as to its own borrowings only). During the six months ended April 30, 2016, the Fund did not have any borrowings outstanding under the line of credit.
7). FEDERAL TAX INFORMATION
As of October 31, 2015, the Fund’s most recent fiscal year end, the components of accumulated earnings (losses) for income tax purposes were as follows:
| | Cost of investments for tax purposes | | $ | 4,543,719 | |
| | Gross tax unrealized appreciation | | $ | 62,956 | |
| | Gross tax unrealized depreciation | | | (197,869 | ) |
| | Net tax unrealized depreciation | | $ | (134,913 | ) |
| | Undistributed ordinary income | | $ | 2,398 | |
| | Undistributed long-term capital gains | | | 46,884 | |
| | Total distributable earnings | | $ | 49,282 | |
| | Other accumulated gain | | $ | — | |
| | Total accumulated loss | | $ | (85,631 | ) |
At October 31, 2015, the Fund’s most recent fiscal year end, the Fund had no tax basis capital losses to offset future capital gains.
At October 31, 2015, the Fund’s most recent fiscal year end, the Fund did not defer, on a tax basis, any late year ordinary losses.
The tax character of distributions paid during fiscal year 2016 (year to date) and fiscal year 2015 for the Fund were as follows:
| | | | Six Months Ended | | | Year Ended | |
| | | | April 30, 2016 | | | October 31, 2015 | |
| | Ordinary income | | $ | 5,988 | | | $ | 54,190 | |
| | Long-term capital gain | | | 46,887 | | | | 68,886 | |
| | | | $ | 52,875 | | | $ | 123,076 | |
| HENNESSY FUNDS | 1-800-966-4354 | |
Expense Example (Unaudited)
April 30, 2016
As a shareholder of the Fund, you incur two types of costs: (1) transaction costs, including sales charges (loads) on purchase payments, reinvested dividends, or other distributions; redemption fees; and exchange fees; and (2) ongoing costs, including management fees; service fees; and other Fund expenses. This Example is intended to help you understand your ongoing costs (in dollars) of investing in the Fund and to compare these costs with the ongoing costs of investing in other mutual funds. The Example is based on an investment of $1,000 invested at the beginning of the period and held for the entire period from November 1, 2015 through April 30, 2016.
Actual Expenses
The first line of the table below under the “Investor Class” and “Institutional Class” headings provides information about actual account values and actual expenses. Although the Fund charges no sales loads or transaction fees, you will be assessed fees for outgoing wire transfers, returned checks and stop payment orders at prevailing rates charged by U.S. Bancorp Fund Services, LLC, the Fund’s transfer agent. If you request that a redemption be made by wire transfer, currently a $15.00 fee is charged by the Fund’s transfer agent. IRA accounts will be charged a $15.00 annual maintenance fee. The example below includes, but is not limited to, management fees, shareholder servicing fees, fund accounting, custody, and transfer agent fees. However, the example below does not include portfolio trading commissions and related expenses, and other extraordinary expenses as determined under generally accepted accounting principles. You may use the information in this line, together with the amount you invested, to estimate the expenses that you paid over the period. Simply divide your account value by $1,000 (for example, an $8,600 account value divided by $1,000 = 8.6), then multiply the result by the number in the first line of the table under the “Investor Class” and “Institutional Class” headings in the column entitled “Expenses Paid During Period” to estimate the expenses you paid on your account during this period.
Hypothetical Example for Comparison Purposes
The second line of the table below under the “Investor Class” and “Institutional Class” headings provides information about hypothetical account values and hypothetical expenses based on the Fund’s actual expense ratios and an assumed rate of return of 5% per year before expenses, which is not the Fund’s actual return. The hypothetical account values and expenses may not be used to estimate the actual ending account balance or expenses you paid for the period. You may use this information to compare the ongoing costs of investing in the Fund and other funds. To do so, compare this 5% hypothetical example with the 5% hypothetical examples that appear in the shareholder reports of the other funds. Please note that the expenses shown in the table are meant to highlight your ongoing costs only and do not reflect any transactional costs, such as sales charges (loads), or exchange fees. Therefore, the second line of the table under the “Investor Class” and “Institutional Class” headings is useful in comparing ongoing costs only, and will not help you determine the relative total costs of owning different funds. In addition, if these transactional costs were included, your costs would have been higher.
| | | | Expenses Paid |
| | Beginning | Ending | During Period(1) |
| | Account Value | Account Value | November 1, 2015 – |
| | November 1, 2015 | April 30, 2016 | April 30, 2016 |
| Investor Class | | | |
| Actual | $1,000.00 | $998.60 | $17.54 |
| Hypothetical (5% return before expenses) | $1,000.00 | $1,007.31 | $17.62 |
| | | | |
| Institutional Class | | | |
| Actual | $1,000.00 | $1,000.70 | $15.52 |
| Hypothetical (5% return before expenses) | $1,000.00 | $1,009.35 | $15.59 |
(1) | Expenses are equal to the Fund’s annualized expense ratio of 3.53% for Investor Class shares or 3.12% for Institutional Class shares, as applicable, multiplied by the average account value over the period, multiplied by 182/366 days (to reflect one-half year period). |
| HENNESSY FUNDS | 1-800-966-4354 | |
How to Obtain a Copy of the Fund’s
Proxy Voting Policy and Proxy Voting Records
A description of the policies and procedures the Fund uses to determine how to vote proxies relating to portfolio securities is available without charge: (1) by calling 1-800-966-4354; (2) on the Hennessy Funds’ website at hennessyfunds.com/proxy-voting/policy.fs; or (3) on the U.S. Securities and Exchange Commission’s website at www.sec.gov. The Fund’s proxy voting record is available without charge on both the Hennessy Funds’ website at hennessyfunds.com/proxy-voting/policy.fs and the SEC’s website at www.sec.gov no later than August 31 for the prior 12 months ending June 30.
Quarterly Filings on Form N-Q
The Fund files its complete schedule of portfolio holdings with the SEC for the first and third quarters of each fiscal year on Form N-Q. The Fund’s Form N-Q will be available on the SEC’s website at www.sec.gov. The Fund’s Form N-Q may be reviewed and copied at the SEC’s Public Reference Room in Washington, DC and information on the operation of the Public Reference Room may be obtained by calling 1-800-SEC-0330. Information included in the Fund’s N-Q will also be available upon request by calling 1-800-966-4354.
Federal Tax Distribution Information
(Unaudited)
For the fiscal year ended October 31, 2015, certain dividends paid by the Fund may be subject to a maximum tax rate of 23.8%, as provided for by the Jobs and Growth Tax Relief Reconciliation Act of 2003. The percentage of dividends declared from ordinary income designated as qualified dividend income was 2.39%.
For corporate shareholders, the percent of ordinary income distributions that qualified for the corporate dividends received deduction for the fiscal year ended October 31, 2015 was 2.39%.
The percentage of taxable ordinary income distributions that are designated as short-term capital gain distributions under Section 871(k)(2)(C) of the Internal Revenue Code of 1986, as amended, for the Fund was 2.84%.
Householding
To help keep the Fund’s costs as low as possible, we generally deliver a single copy of most financial reports and prospectuses to shareholders who share an address, even if the accounts are registered under different names. This process, known as “householding,” does not apply to account statements. You may, of course, request an individual copy of a prospectus or financial report at any time. If you would like to receive separate mailings, please call the Administrator at 1-800-261-6950 or 1-414-765-4124 and we will begin individual delivery within 30 days of your request. If your account is held through a financial institution or other intermediary, please contact them directly to request individual delivery.
Board Approval of Investment Advisory
Agreements
At its meeting on March 9, 2016, the Board of Trustees of the Fund (the “Board,” and the members thereof, the “Trustees”) unanimously approved the continuation of the investment advisory agreement of the Fund with Hennessy Advisors, Inc. (the “Advisor”) and the sub-advisory agreement of the Fund between the Advisor and Financial Counselors, Inc. (the “Sub-Advisor”). As part of the process of approving the continuation of the advisory and sub-advisory agreements, the Trustees reviewed their fiduciary duties with respect to approving the advisory and sub-advisory agreements and the relevant factors for them to consider. In addition, the Trustees who are not deemed “interested persons” (as that term is defined by the Investment Company Act of 1940) of the Fund (the “Independent Trustees”) met in executive session to discuss the approval of the advisory and sub-advisory agreements.
In advance of the meeting, the Advisor sent detailed information to the Trustees to assist them in their evaluation of the advisory and sub-advisory agreements. This information included, but was not limited to, (i) a memorandum from outside legal counsel that described the fiduciary duties of the Board with respect to approving the continuation of the advisory and sub-advisory agreements and the relevant factors for consideration, (ii) a memorandum from the Advisor that listed the factors relevant to the Board’s approval of the continuation of the advisory and sub-advisory agreements and also referenced the documents that had been provided to help the Board assess each such factor, (iii) an inventory of the range of services provided by the Advisor and the Sub-Advisor for the Fund, (iv) a written discussion of economies of scale, (v) the advisory and sub-advisory agreements, (vi) a recent Fund fact sheet, (vii) a peer expense comparison, (viii) performance information, (ix) the Advisor’s most recent Form 10-K and Form 10-Q, which included information about the Advisor’s profitability, (x) information about brokerage commissions, (xi) information about the Fund’s compliance program, (xii) the Advisor’s current Form ADV Part I, (xiii) a completed questionnaire from the Sub-Advisor and summary thereof, (xiv) the Sub-Advisor’s Code of Ethics, and (xv) the Sub-Advisor’s Form ADV Parts I and II, and (xvi) other information the Trustees believed was useful in evaluating the approval of the continuation of the advisory and sub-advisory agreements.
All of the factors discussed by the Trustees were considered as a whole, and were considered separately by the Independent Trustees, meeting in executive session. The factors were viewed in their totality by the Trustees, with no single factor being the principal or determinative factor in the Trustees’ determination of whether to approve the continuation of the advisory and sub-advisory agreements. The Trustees recognized that the management and fee arrangements for the Fund are the result of years of review and discussion between the Independent Trustees and the Advisor, that certain aspects of such arrangements may receive greater scrutiny in some years than in others, and that the Trustees’ conclusions may be based, in part, on their consideration of these same arrangements and information received during the course of the year and in prior years.
Prior to approving the continuation of the advisory and sub-advisory agreements, the Trustees and the Independent Trustees in executive session considered, among other items:
| | • | The nature and quality of the advisory services provided by the Advisor and the Sub-Advisor. |
| | • | A comparison of the fees and expenses of the Fund to other similar funds. |
| HENNESSY FUNDS | 1-800-966-4354 | |
| | • | Whether economies of scale are recognized by the Fund. |
| | • | The costs and profitability of the Fund to the Advisor and the Sub-Advisor. |
| | • | The performance of the Fund. |
| | • | The other benefits to the Advisor and the Sub-Advisor from serving as an investment advisor to the Fund (in addition to the advisory and sub-advisory fees). |
The material considerations and determinations of the Board of Trustees, including all of the Independent Trustees, are as follows:
| | • | The Board considered the services identified below that are provided by the Advisor. Based on this review, the Trustees believe that the Advisor provides high-quality services to the Fund, and they noted that their overall confidence in the Advisor is high. The Trustees also concluded that they were satisfied with the nature, extent, and quality of the advisory services provided to the Fund by the Advisor, and that the nature and extent of the services provided by the Advisor are appropriate to assure that the Fund’s operations are conducted in compliance with applicable laws, rules, and regulations. |
| | | • | The Advisor oversees the Sub-Advisor for the Fund and the Sub-Advisor acts as the portfolio manager for the Fund. |
| | | • | The Advisor performs a daily reconciliation of portfolio positions and cash for the Fund. |
| | | • | The Advisor monitors the Fund’s compliance with its investment objectives and restrictions. |
| | | • | The Advisor monitors compliance with federal securities laws and performs activities such as maintaining a compliance program, conducting ongoing reviews of the compliance programs of the Sub-Advisor and the Fund’s other service providers, conducting on-site visits to the Sub-Advisor and the Fund’s other service providers, monitoring incidents of abusive trading practices, reviewing Fund expense accruals, payments, and fixed expense ratios, evaluating insurance providers for fidelity bond coverage and D&O/E&O insurance coverage, conducting employee compliance training, reviewing reports provided by service providers, maintaining books and records, and preparing an annual compliance report to the Board. |
| | | • | The Advisor oversees the selection and continued employment of the Sub-Advisor, monitors the Sub-Advisor’s adherence to the Fund’s investment objectives, policies, and restrictions, and reviews the Fund’s investment performance. |
| | | • | The Advisor oversees service providers that provide accounting, administration, distribution, transfer agency, custodial, sales and marketing, public relations, audit, information technology, and legal services to the Fund. |
| | | • | The Advisor maintains in-house marketing and distribution departments on behalf of the Fund. |
| | | • | The Advisor is actively involved with preparing regulatory filings for the Fund, including writing and annually updating the Fund’s prospectus and related documents. |
| | | • | The Advisor reviews the written summary prepared by the Sub-Advisor of the Fund’s performance for the most recent six-month period or twelve-month period, as applicable, for each semi-annual and annual report of the Fund. |
| | | • | The Advisor oversees distribution of the Fund through third-party broker/dealers and independent financial institutions such as Charles Schwab, Inc., Fidelity, TD Waterhouse, and Pershing. The Advisor participates in “no transaction fee” (“NTF”) programs with these companies on behalf of the Fund, which allow customers to purchase the Fund through third-party distribution channels without paying a transaction fee. The Advisor compensates, in part, a number of these third-party providers of NTF programs out of its own revenues. |
| | | • | The Advisor pays the incentive compensation of the Fund’s compliance officers and employs other staff, such as management executives, legal personnel, marketing personnel, national accounts and distribution personnel, sales personnel, administrative personnel, and trading oversight personnel. |
| | | • | The Advisor provides a quarterly compliance certification to the Board. |
| | | • | The Advisor prepares or reviews Board materials, frequently presents to the Board or leads Board discussions, prepares or reviews meeting minutes, and arranges for Board training and education. |
| | • | The Board considered the services identified below that are provided by the Sub-Advisor: |
| | | • | The Sub-Advisor acts as the portfolio manager for the Fund. In this capacity, the Sub-Advisor does the following: |
| | | | • | manages the composition of the Fund’s portfolio, including the purchase, retention, and disposition of portfolio securities in accordance with the Fund’s investment objectives, policies, and restrictions; |
| | | | • | ensures compliance with “best execution” for the Fund’s portfolio; |
| | | | • | manages the use of soft dollars for the Fund; and |
| | | | • | manages proxy voting for the Fund. |
| | | • | The Sub-Advisor ensures that its compliance program includes policies and procedures relevant to the Fund and the Sub-Advisor’s duties as a portfolio manager to the Fund. |
| | | • | The Sub-Advisor prepares a written summary of the Fund’s performance for the most recent six-month period or twelve-month period, as applicable, for each semi-annual and annual report of the Fund. |
| | | • | The Sub-Advisor provides a quarterly compliance certification to the Board regarding trading and allocation practices, supervisory matters, the Sub-Advisor’s compliance program (including its code of ethics), compliance with the Fund’s policies, and general firm updates. |
| | • | The Board considered the distinction between the services performed by the Advisor and the Sub-Advisor. It noted that the management of the Fund, including the oversight of the Sub-Advisor, involves more comprehensive and substantive duties than the duties of the Sub-Advisor. Specifically, the Board considered the lists of services identified above and concluded that the services performed by the Advisor for the Fund require a higher level of service and oversight than the services performed by the Sub-Advisor. Based on this determination, the Board concluded that the differential in advisory fees between the Advisor and the Sub-Advisor is reasonable. |
| HENNESSY FUNDS | 1-800-966-4354 | |
| | • | The Board compared the performance of the Fund to benchmark indices over various periods of time and they noted that at each quarterly meeting, the Trustees review reports comparing the investment performance of the Fund to various indices. Based on the information provided at the meeting and the information and quarterly discussions regarding the Fund’s investment performance, the Trustees believe that the Advisor and the Sub-Advisor manage the Fund in a manner that is materially consistent with its stated investment objective and style. The Trustees concluded that the performance of the Fund over various time horizons warranted the continuation of the advisory and sub-advisory agreements. |
| | • | The Board reviewed the advisory fees and overall expense ratios of the Fund and comparable funds using data from Morningstar with respect to funds similar in asset size and investment objective to the Fund. As part of the discussion with management, the Trustees ensured that they understood and were comfortable with the criteria used to determine the mutual funds included in the Morningstar categories for purposes of the materials considered at the meeting. The Board determined that the advisory fee and overall expense ratio of the Fund falls within the range of the advisory fees and overall expense ratios of other comparable funds and concluded that they are reasonable and warranted continuation of the advisory and sub-advisory agreements. |
| | • | The Board also considered whether economies of scale were being realized by the Advisor that should be shared with the Fund’s shareholders. The Trustees noted that many of the expenses incurred to manage the Fund are asset-based fees and thus do not result in material economies of scale being realized as the net assets of the Fund increase. For example, intermediary service fees increase as the Fund’s assets grow. The Trustees also considered the Advisor’s efforts to contain expenses, and took into account the Advisor’s significant marketing efforts to increase Fund assets. The Board noted that at current asset levels it did not appear that there were economies of scale being realized by the Advisor and concluded that it would continue to monitor economies of scale in the future as circumstances changed. |
| | • | The Board considered the profitability of the Advisor and the Sub-Advisor, including the impact of intermediary service fees on the Advisor’s profitability, and also considered the resources and revenues that the Advisor has put into managing and distributing the Fund. The Board then concluded that the profits of the Advisor and the Sub-Advisor are reasonable and not excessive when compared to profitability guidelines set forth in relevant court cases. |
| | • | The Board considered the high level of professionalism and knowledge of the Advisor’s employees, along with a very low level of turnover, and concluded that this was beneficial to the Fund and its shareholders. |
| | • | The Board considered other benefits to the Advisor and the Sub-Advisor from serving as an advisor to the Fund (in addition to the advisory fee or sub-advisory fee). The Board noted that the Advisor and the Sub-Advisor may derive ancillary benefits from, by way of example, its association with the Fund in the form of proprietary and third-party research products and services received from broker dealers that execute portfolio trades for the Fund. The Board determined that any such products and services have been used for legitimate purposes relating to the Fund by providing assistance in the investment decision-making process. The Trustees concluded that the other benefits realized by the Advisor and the Sub-Advisor from their relationship with the Fund were reasonable. |
After reviewing the materials provided at the meeting and management’s presentation, as well as other information regularly provided at the Board’s quarterly meetings throughout the year regarding the quality of services provided by the Advisor and the Sub-Advisor, the performance of the Fund, expense information, regulatory compliance issues, trading information and related matters, and other factors deemed relevant by the Board, the Trustees, including all of the Independent Trustees, approved the continuation of the advisory and sub-advisory agreements.
| HENNESSY FUNDS | 1-800-966-4354 | |
(This Page Intentionally Left Blank.)
For information, questions or assistance, please call
The Hennessy Funds
1-800-966-4354 or 1-415-899-1555
INVESTMENT ADVISOR
Hennessy Advisors, Inc.
7250 Redwood Blvd., Suite 200
Novato, California 94945
ADMINISTRATOR,
TRANSFER AGENT,
DIVIDEND PAYING AGENT &
SHAREHOLDER SERVICING AGENT
U.S. Bancorp Fund Services, LLC
P.O. Box 701
Milwaukee, Wisconsin 53201-0701
CUSTODIAN
U.S. Bank N.A.
Custody Operations
1555 North River Center Dr., Suite 302
Milwaukee, Wisconsin 53212
TRUSTEES
Neil J. Hennessy
Robert T. Doyle
J. Dennis DeSousa
Gerald P. Richardson
COUNSEL
Foley & Lardner LLP
777 East Wisconsin Avenue
Milwaukee, Wisconsin 53202-5306
INDEPENDENT REGISTERED
PUBLIC ACCOUNTING FIRM
Tait, Weller & Baker LLP
1818 Market Street, Suite 2400
Philadelphia, Pennsylvania 19103
DISTRIBUTOR
Quasar Distributors, LLC
615 East Michigan Street
Milwaukee, Wisconsin 53202
hennessyfunds.com | 1-800-966-4354
This report has been prepared for shareholders and may be distributed to
others only if preceded or accompanied by a current prospectus.
SEMI-ANNUAL REPORT
APRIL 30, 2016
HENNESSY GAS UTILITY FUND
Investor Class GASFX
hennessyfunds.com | 1-800-966-4354
(This Page Intentionally Left Blank.)
Contents
| Letter to Shareholders | 2 |
| Performance Overview | 4 |
| Financial Statements | |
| Schedule of Investments | 6 |
| Statement of Assets and Liabilities | 11 |
| Statement of Operations | 12 |
| Statements of Changes in Net Assets | 13 |
| Financial Highlights | 14 |
| Notes to the Financial Statements | 16 |
| Expense Example | 23 |
| Proxy Voting | 24 |
| Quarterly Filings on Form N-Q | 24 |
| Federal Tax Distribution Information | 24 |
| Householding | 24 |
| Board Approval of Investment Advisory Agreement | 25 |
| HENNESSY FUNDS | 1-800-966-4354 | |
June 2016
Dear Hennessy Funds Shareholder:
I used to tell my kids, “What doesn’t kill you makes you stronger.” Perhaps that is not the best analogy for investing, but in the face of such roller coaster volatility in the financial markets, it seems to me that what hasn’t killed this bull market rally may just make it stronger. The financial markets brought us flat to modest returns during the six months ended April 30, 2016, with the S&P 500 Index returning 0.43% and the Dow Jones Industrial Average (DJIA) returning 1.98% during the period. These six months were marked by high volatility, the onslaught of more and more regulatory hurdles, the Fed stuck in neutral, fears about the global economy, and wild political rhetoric — all headwinds that I believe could have significantly stalled any positive moves in the market, but didn’t. Even the aggressive pull back in January showed just how skittish the market can be, and yet again the markets showed great resiliency and marched right back.
I continue to be impressed with the persistence of the bull market in U.S. equities, now in its seventh year. Many commentators believe that the U.S. economy is due for a recession, and the market is due for a downturn. However, we find ourselves comparing today’s secular market to the bull run of 1982 to 2000, which was powered by a significant increase in valuations. On March 9th of this year, I took a moment to remember how we all felt seven years ago on March 9, 2009, at the bottom of the financial crisis downturn that had wiped out trillions of dollars’ worth of U.S. equities. I explained to our investors then, and I say the same thing today, I believe that if you invest in quality companies with good fundamentals, over the long term, you should do fine.
If history is any kind of guide, then I think this bull market has some room to run. Rising markets usually fall when there is extreme optimism or euphoria. I haven’t witnessed any of that as of yet. The volatility has unnerved many, but I encourage investors to try to remain focused on investment fundamentals. Many U.S. companies continue to find ways to make a profit and build their already strong balance sheets. Unemployment is low, and wages are rising in real terms, supporting consumer confidence and consumption. With an average price-to-sales ratio of only 1.7x and a dividend yield of approximately 2.5% for the Dow, I believe U.S. equities continue to be attractive. In my opinion, there are many compelling reasons why this market can continue to climb even higher.
The next six months may be fraught with more talk about what the Fed will do, who the next President of the United States will be, and what is happening in China and around the globe. Businesses in every industry, including the asset management business, have concerns about increasing regulatory burdens, taxes, and higher healthcare costs. But, I still believe the ingenuity and perseverance of American business will find ways to endure and to thrive.
Thank you for your continued confidence and investment in our products. If you have any questions or would like to speak with us directly, please don’t hesitate to call us at (800) 966-4354.
Best regards,
Neil J. Hennessy
President and Chief Investment Officer
Past performance does not guarantee future results.
Mutual fund investing involves risk. Principal loss is possible.
Opinions expressed are those of Neil Hennessy and are subject to change, are not guaranteed and should not be considered investment advice.
Price-to-sales ratio is a tool for calculating a stock’s valuation relative to other companies. It is calculated by dividing a stock’s current price by its revenue per share. Dividend yield is calculated as the annual dividends paid by a company divided by its market price per share.
The Dow Jones Industrial Average and S&P 500 Index are unmanaged indices commonly used to measure the performance of U.S. stocks. One cannot invest directly in an index.
| HENNESSY FUNDS | 1-800-966-4354 | |
Performance Overview (Unaudited)
AVERAGE ANNUAL TOTAL RETURN FOR PERIODS ENDED APRIL 30, 2016
| | Six | One | Five | Ten |
| | Months(1) | Year | Years | Years |
| Hennessy Gas Utility Fund – | | | | |
| Investor Class (GASFX) | 2.91% | -4.09% | 11.20% | 10.02% |
AGA Stock Index(2) | 3.74% | -2.69% | 11.94% | 10.77% |
| S&P 500 Index | 0.43% | 1.21% | 11.02% | 6.91% |
Expense ratio: 1.02%
Performance data quoted represents past performance; past performance does not guarantee future results. The investment return and principal value of an investment will fluctuate so that an investor’s shares, when redeemed, may be worth more or less than their original cost. The performance table does not reflect the deduction of taxes that a shareholder would pay on Fund distributions or the redemption of Fund shares. Current performance of the Fund may be lower or higher than the performance quoted. Performance data current to the most recent month end may be obtained by visiting hennessyfunds.com. Performance for periods prior to October 26, 2012, is that of the FBR Gas Utility Index Fund.
The expense ratio presented is from the most recent prospectus.
(1) | Periods less than one year are not annualized. |
(2) | The AGA Stock Index is a market capitalization-weighted index, adjusted monthly, consisting of member companies of the American Gas Association. Performance for the AGA Stock Index is provided monthly by the American Gas Association. |
PERFORMANCE NARRATIVE
Portfolio Managers Winsor H. (Skip) Aylesworth, Ryan C. Kelley and Brian E. Perry
Performance:
For the six-month period ended April 30, 2016, the Hennessy Gas Utility Fund returned 2.91%, outperforming the S&P 500 Index, which returned 0.43%, but underperforming the AGA Stock Index,* which returned 3.74%, for the same period.
The Fund performed well in the first six months of 2016, outperforming the overall market, as represented by the S&P 500 Index, and slightly underperforming its benchmark (the AGA Stock Index) after taking into account Fund expenses. A majority of the Fund’s investments, most of which are gas distribution companies and electric utilities with local gas distribution subsidiaries, performed well over the period. A smaller portion of the Fund’s investments, which are sensitive to commodity price movements, hampered overall returns for the Fund.
Portfolio Strategy:
The Fund’s investment goal is to provide investors with the return of the AGA Stock Index less expenses. The AGA Stock Index is comprised of publicly-traded members of the American Gas Association (AGA), a national trade association of natural gas distribution companies. The investment thesis of the Fund continues to be centered on the presence of abundant natural gas supplies here in the U.S. keeping natural gas prices relatively low. Low prices, as well as the environmental advantages of natural gas, should lead to a steady growth in demand for natural gas. This growth should continue to drive revenue growth for the natural gas distribution companies owned by the Fund.
For the six-month period ended April 30, 2016, there were two changes to the composition of the AGA Stock Index, and thus the Fund. On December 17, 2015, UIL Holdings Corporation was acquired by a subsidiary of Iberdrola, S.A., both AGA Stock Index constituents. On March 23, 2016, Exelon Corporation completed its long-awaited merger with Pepco Holdings, Inc., also both in the AGA Stock Index. In addition, there have been several acquisition announcements involving AGA member companies that have not yet been completed. Columbia Pipeline Group, Inc. agreed to be acquired by TransCanada Corporation, Dominion Resources, Inc. agreed to acquire Questar Corporation and Empire District Electric Company agreed to be acquired by Algonquin Power & Utilities Corporation. Algonquin Power is an AGA member but is not in the AGA Stock Index because it is not traded on a U.S. stock exchange. These transactions, as well as those previously announced in 2015, are all expected to close within the next year. This is an unusually high level of merger and acquisition activity in the sector and will cause changes in the composition and company weights of the AGA Stock Index and the Fund. We believe this activity illustrates the high level of interest in the natural gas distribution industry and bodes well for the future.
Investment Outlook:
Despite the volatility in commodity prices over the last six months, we believe the thesis of the Fund remains firmly intact. The low price and attractive environmental characteristics of natural gas should continue to drive demand growth, which we believe should drive long-term revenue and profit growth for the companies in the Fund.
| * | The AGA Stock Index is a market capitalization-weighted index, adjusted monthly, consisting of member companies of the American Gas Association. Performance for the AGA Stock Index is provided monthly by the American Gas Association. |
Opinions expressed are those of the Portfolio Managers as of the date written and are subject to change, are not guaranteed, and should not be considered investment advice or an indication of trading intent.
The S&P 500 Index is an unmanaged index commonly used to measure the performance of U.S. stocks. One cannot invest directly in an index.
The Fund is non-diversified, meaning it may concentrate its assets in fewer individual holdings than a diversified fund, making it more exposed to individual stock volatility than a diversified fund. Investments in foreign securities may involve political, economic and currency risks, greater volatility and differences in accounting methods. Investments are focused in the natural gas distribution and transmission industry; sector funds may be subject to a higher degree of market risk.
References to specific securities should not be considered a recommendation to buy or sell any security. Fund holdings and sector allocations are subject to change. Please refer to the Schedule of Investments included in this report for additional portfolio information.
| HENNESSY FUNDS | 1-800-966-4354 | |
Financial Statements
Schedule of Investments as of April 30, 2016 (Unaudited) |
HENNESSY GAS UTILITY FUND
(% of Net Assets)
| TOP TEN HOLDINGS (EXCLUDING CASH/CASH EQUIVALENTS) | % NET ASSETS |
| TransCanada Corp. | 4.99% |
| National Grid PLC | 4.97% |
| Columbia Pipeline Group, Inc. | 4.95% |
| Sempra Energy | 4.95% |
| Dominion Resources, Inc. | 4.92% |
| Spectra Energy Corp. | 4.92% |
| Kinder Morgan, Inc. | 4.88% |
| Enbridge, Inc. | 4.58% |
| Cheniere Energy, Inc. | 3.84% |
| The Williams Companies, Inc. | 3.81% |
Note: For presentation purposes, the Fund has grouped some of the industry categories. For purposes of categorizing securities for compliance with section 8(b)(1) of the Investment Company Act of 1940, as amended, the Fund uses more specific industry classifications.
| | COMMON STOCKS – 98.79% | | Number | | | | | | % of | |
| | | | of Shares | | | Value | | | Net Assets | |
| | Energy – 33.32% | | | | | | | | | |
| | Cheniere Energy, Inc. (a) | | | 1,433,117 | | | $ | 55,719,589 | | | | 3.84 | % |
| | Columbia Pipeline Group, Inc. | | | 2,802,782 | | | | 71,807,275 | | | | 4.95 | % |
| | Enbridge, Inc. (b) | | | 1,600,821 | | | | 66,498,105 | | | | 4.58 | % |
| | EQT Corp. | | | 280,232 | | | | 19,644,263 | | | | 1.35 | % |
| | Kinder Morgan, Inc. | | | 3,983,225 | | | | 70,742,076 | | | | 4.88 | % |
| | Spectra Energy Corp. | | | 2,283,915 | | | | 71,418,022 | | | | 4.92 | % |
| | The Williams Companies, Inc. | | | 2,847,557 | | | | 55,214,130 | | | | 3.81 | % |
| | TransCanada Corp. (b) | | | 1,746,368 | | | | 72,456,808 | | | | 4.99 | % |
| | | | | | | | | 483,500,268 | | | | 33.32 | % |
| | | | | | | | | | | | | | |
| | Financials – 0.42% | | | | | | | | | | | | |
| | Berkshire Hathaway, Inc., Class A (a) | | | 28 | | | | 6,132,000 | | | | 0.42 | % |
| | | | | | | | | | | | | | |
| | Utilities – 65.05% | | | | | | | | | | | | |
| | AGL Resources, Inc. | | | 771,730 | | | | 50,826,138 | | | | 3.50 | % |
| | ALLETE, Inc. | | | 2,400 | | | | 134,856 | | | | 0.01 | % |
| | Alliant Energy Corp. | | | 62,904 | | | | 4,435,990 | | | | 0.31 | % |
| | Ameren Corp. | | | 159,490 | | | | 7,655,520 | | | | 0.53 | % |
| | Atmos Energy Corp. | | | 755,786 | | | | 54,832,274 | | | | 3.78 | % |
| | Avista Corp. | | | 85,972 | | | | 3,444,898 | | | | 0.24 | % |
| | Black Hills Corp. | | | 78,959 | | | | 4,784,126 | | | | 0.33 | % |
| | Centerpoint Energy, Inc. | | | 754,726 | | | | 16,188,873 | | | | 1.12 | % |
| | Chesapeake Utilities Corp. | | | 90,908 | | | | 5,410,844 | | | | 0.37 | % |
| | CMS Energy Corp. | | | 630,148 | | | | 25,634,421 | | | | 1.77 | % |
| | Consolidated Edison, Inc. | | | 357,786 | | | | 26,690,836 | | | | 1.84 | % |
| | Corning Natural Gas Holding Corp. | | | 19,064 | | | | 311,696 | | | | 0.02 | % |
| | Delta Natural Gas Company, Inc. | | | 50,480 | | | | 1,292,288 | | | | 0.09 | % |
| | Dominion Resources, Inc. | | | 999,446 | | | | 71,430,406 | | | | 4.92 | % |
| | DTE Energy Co. | | | 252,954 | | | | 22,553,379 | | | | 1.55 | % |
| | Duke Energy Corp. | | | 106,337 | | | | 8,377,229 | | | | 0.58 | % |
| | Entergy Corp. | | | 10,400 | | | | 781,872 | | | | 0.05 | % |
| | Eversource Energy | | | 244,975 | | | | 13,826,389 | | | | 0.95 | % |
| | Exelon Corp. | | | 332,631 | | | | 11,672,022 | | | | 0.80 | % |
| | Gas Natural, Inc. | | | 46,439 | | | | 339,005 | | | | 0.02 | % |
| | Iberdrola SA – ADR (b) | | | 531,646 | | | | 15,151,911 | | | | 1.04 | % |
| | MDU Resources Group, Inc. | | | 561,407 | | | | 11,261,824 | | | | 0.78 | % |
The accompanying notes are an integral part of these financial statements.
| HENNESSY FUNDS | 1-800-966-4354 | |
| | COMMON STOCKS | | Number | | | | | | % of | |
| | | | of Shares | | | Value | | | Net Assets | |
| | Utilities (Continued) | | | | | | | | | |
| | MGE Energy, Inc. | | | 47,054 | | | $ | 2,345,642 | | | | 0.16 | % |
| | National Fuel Gas Co. | | | 301,924 | | | | 16,756,782 | | | | 1.15 | % |
| | National Grid PLC – ADR (b) | | | 1,000,558 | | | | 72,050,181 | | | | 4.97 | % |
| | New Jersey Resources Corp. | | | 437,884 | | | | 15,623,701 | | | | 1.08 | % |
| | NiSource, Inc. | | | 1,210,131 | | | | 27,482,075 | | | | 1.89 | % |
| | Northwest Natural Gas Co. | | | 205,786 | | | | 10,606,210 | | | | 0.73 | % |
| | Northwestern Corp. | | | 110,698 | | | | 6,292,074 | | | | 0.43 | % |
| | One Gas, Inc. | | | 387,625 | | | | 22,664,434 | | | | 1.56 | % |
| | PG&E Corp. | | | 924,299 | | | | 53,794,202 | | | | 3.71 | % |
| | Piedmont Natural Gas Company, Inc. | | | 571,361 | | | | 34,167,388 | | | | 2.35 | % |
| | PPL Corp. | | | 441,219 | | | | 16,607,483 | | | | 1.14 | % |
| | Public Service Enterprise Group, Inc. | | | 652,790 | | | | 30,113,203 | | | | 2.08 | % |
| | Questar Corp. | | | 961,426 | | | | 24,102,950 | | | | 1.66 | % |
| | RGC Resources, Inc. | | | 36,534 | | | | 820,554 | | | | 0.06 | % |
| | SCANA Corp. | | | 152,966 | | | | 10,507,234 | | | | 0.72 | % |
| | Sempra Energy | | | 694,340 | | | | 71,760,039 | | | | 4.95 | % |
| | South Jersey Industries, Inc. | | | 344,671 | | | | 9,619,768 | | | | 0.66 | % |
| | Southwest Gas Corp. | | | 318,317 | | | | 20,661,956 | | | | 1.42 | % |
| | Spire, Inc. | | | 291,791 | | | | 18,662,952 | | | | 1.29 | % |
| | TECO Energy, Inc. | | | 470,551 | | | | 13,067,201 | | | | 0.90 | % |
| | The Empire District Electric Co. | | | 18,325 | | | | 617,003 | | | | 0.04 | % |
| | UGI Corp. | | | 279,402 | | | | 11,243,136 | | | | 0.78 | % |
| | Unitil Corp. | | | 59,598 | | | | 2,355,313 | | | | 0.16 | % |
| | Vectren Corp. | | | 311,228 | | | | 15,203,488 | | | | 1.05 | % |
| | WEC Energy Group, Inc. | | | 720,590 | | | | 41,945,544 | | | | 2.89 | % |
| | WGL Holdings, Inc. | | | 304,592 | | | | 20,678,751 | | | | 1.43 | % |
| | Xcel Energy, Inc. | | | 430,399 | | | | 17,228,872 | | | | 1.19 | % |
| | | | | | | | | 944,014,933 | | | | 65.05 | % |
| | Total Common Stocks | | | | | | | | | | | | |
| | (Cost $999,900,258) | | | | | | | 1,433,647,201 | | | | 98.79 | % |
The accompanying notes are an integral part of these financial statements.
| | PARTNERSHIPS – 0.65% | | Number | | | | | | % of | |
| | | | of Shares | | | Value | | | Net Assets | |
| | Energy – 0.65% | | | | | | | | | |
| | Plains GP Holdings LP | | | 958,777 | | | $ | 9,491,892 | | | | 0.65 | % |
| | | | | | | | | | | | | | |
| | Total Partnerships | | | | | | | | | | | | |
| | (Cost $18,735,324) | | | | | | | 9,491,892 | | | | 0.65 | % |
| | | | | | | | | | | | | | |
| | SHORT-TERM INVESTMENTS – 0.34% | | | | | | | | | | | | |
| | Money Market Funds – 0.34% | | | | | | | | | | | | |
| | Fidelity Government Portfolio, Institutional Class, 0.23% (c) | | | 4,978,205 | | | | 4,978,205 | | | | 0.34 | % |
| | | | | | | | | | | | | | |
| | Total Short-Term Investments | | | | | | | | | | | | |
| | (Cost $4,978,205) | | | | | | | 4,978,205 | | | | 0.34 | % |
| | | | | | | | | | | | | | |
| | Total Investments | | | | | | | | | | | | |
| | (Cost $1,023,613,787) – 99.78% | | | | | | | 1,448,117,298 | | | | 99.78 | % |
| | | | | | | | | | | | | | |
| | Other Assets in | | | | | | | | | | | | |
| | Excess of Liabilities – 0.22% | | | | | | | 3,116,042 | | | | 0.22 | % |
| | | | | | | | | | | | | | |
| | TOTAL NET ASSETS – 100.00% | | | | | | $ | 1,451,233,340 | | | | 100.00 | % |
Percentages are stated as a percent of net assets.
ADR – American Depositary Receipt
| (a) | Non-income producing security. |
| (b) | U.S. traded security of a foreign corporation. |
| (c) | The rate listed is the fund’s 7-day yield as of April 30, 2016. |
Summary of Fair Value Exposure at April 30, 2016
The following is a summary of the inputs used to value the Fund’s net assets as of April 30, 2016 (See Note 3 in the accompanying notes to the financial statements):
| Common Stocks | | Level 1 | | | Level 2 | | | Level 3 | | | Total | |
| Energy | | $ | 483,500,268 | | | $ | — | | | $ | — | | | $ | 483,500,268 | |
| Financials | | | 6,132,000 | | | | — | | | | — | | | | 6,132,000 | |
| Utilities | | | 944,014,933 | | | | — | | | | — | | | | 944,014,933 | |
| Total Common Stocks | | $ | 1,433,647,201 | | | $ | — | | | $ | — | | | $ | 1,433,647,201 | |
| Partnerships | | | | | | | | | | | | | | | | |
| Energy | | $ | 9,491,892 | | | $ | — | | | $ | — | | | $ | 9,491,892 | |
| Total Partnerships | | $ | 9,491,892 | | | $ | — | | | $ | — | | | $ | 9,491,892 | |
| Short-Term Investments | | | | | | | | | | | | | | | | |
| Money Market Funds | | $ | 4,978,205 | | | $ | — | | | $ | — | | | $ | 4,978,205 | |
| Total Short-Term Investments | | $ | 4,978,205 | | | $ | — | | | $ | — | | | $ | 4,978,205 | |
| Total Investments | | $ | 1,448,117,298 | | | $ | — | | | $ | — | | | $ | 1,448,117,298 | |
Transfers between levels are recognized at the end of the reporting period. During the six-month period ended April 30, 2016, the Fund recognized no transfers between levels.
The accompanying notes are an integral part of these financial statements.
| HENNESSY FUNDS | 1-800-966-4354 | |
(This Page Intentionally Left Blank.)
Financial Statements
Statement of Assets and Liabilities as of April 30, 2016 (Unaudited) |
| ASSETS: | | | |
| Investments in securities, at value (cost $1,023,613,787) | | $ | 1,448,117,298 | |
| Dividends and interest receivable | | | 2,311,213 | |
| Receivable for fund shares sold | | | 1,344,213 | |
| Receivable for securities sold | | | 4,898,495 | |
| Prepaid expenses and other assets | | | 41,206 | |
| Segregated tax reclaim receivable | | | 4,644 | |
| Total Assets | | | 1,456,717,069 | |
| | | | | |
| LIABILITIES: | | | | |
| Payable for securities purchased | | | 2,391,434 | |
| Payable for fund shares redeemed | | | 1,099,864 | |
| Payable to advisor | | | 472,445 | |
| Payable to administrator | | | 343,383 | |
| Payable to auditor | | | 10,234 | |
| Accrued distribution fees | | | 533,472 | |
| Accrued service fees | | | 118,111 | |
| Accrued trustees fees | | | 2,363 | |
| Accrued expenses and other payables | | | 512,423 | |
| Total Liabilities | | | 5,483,729 | |
| NET ASSETS | | $ | 1,451,233,340 | |
| | | | | |
| NET ASSETS CONSIST OF: | | | | |
| Capital stock | | $ | 1,139,619,251 | |
| Accumulated net investment loss | | | (42,920 | ) |
| Accumulated net realized loss on investments | | | (112,850,499 | ) |
| Unrealized net appreciation on investments | | | 424,507,508 | |
| Total Net Assets | | $ | 1,451,233,340 | |
| | | | | |
| NET ASSETS | | | | |
| Investor Class: | | | | |
| Shares authorized (no par value) | | Unlimited | |
| Net assets applicable to outstanding Investor Class shares | | $ | 1,451,233,340 | |
| Shares issued and outstanding | | | 53,018,187 | |
| Net asset value, offering price and redemption price per share | | $ | 27.37 | |
The accompanying notes are an integral part of these financial statements.
| HENNESSY FUNDS | 1-800-966-4354 | |
Financial Statements
Statement of Operations for the six months ended April 30, 2016 (Unaudited) |
| INVESTMENT INCOME: | | | |
Dividend income(1) | | $ | 25,200,674 | |
| Interest income | | | 10,951 | |
| Total investment income | | | 25,211,625 | |
| | | | | |
| EXPENSES: | | | | |
| Investment advisory fees (See Note 5) | | | 2,818,882 | |
| Sub-transfer agent expenses – Investor Class (See Note 5) | | | 1,376,500 | |
| Distribution fees – Investor Class (See Note 5) | | | 1,057,081 | |
| Service fees – Investor Class (See Note 5) | | | 704,720 | |
| Administration, fund accounting, custody and transfer agent fees (See Note 5) | | | 690,779 | |
| Reports to shareholders | | | 78,285 | |
| Federal and state registration fees | | | 27,126 | |
| Legal fees | | | 13,978 | |
| Compliance expense | | | 11,790 | |
| Audit fees | | | 10,235 | |
| Trustees’ fees and expenses | | | 9,972 | |
| Interest expense (See Note 6) | | | 674 | |
| Other expenses | | | 347,088 | |
| Total expenses | | | 7,147,110 | |
| NET INVESTMENT INCOME | | $ | 18,064,515 | |
| | | | | |
| REALIZED AND UNREALIZED GAINS (LOSSES): | | | | |
| Net realized loss on investments | | $ | (66,323,328 | ) |
| Net change in unrealized appreciation on investments | | | 70,317,184 | |
| Net gain on investments | | | 3,993,856 | |
| NET INCREASE IN NET ASSETS RESULTING FROM OPERATIONS | | $ | 22,058,371 | |
(1) | Net of foreign taxes withheld and issuance fees of $425,334. |
The accompanying notes are an integral part of these financial statements.
Financial Statements
| Statements of Changes in Net Assets |
| | | Six Months Ended | | | | |
| | | April 30, 2016 | | | Year Ended | |
| | | (Unaudited) | | | October 31, 2015 | |
| OPERATIONS: | | | | | | |
| Net investment income | | $ | 18,064,515 | | | $ | 47,740,935 | |
| Net realized gain (loss) on investments | | | (66,323,328 | ) | | | 34,462,135 | |
| Net change in unrealized appreciation (depreciation) | | | | | | | | |
| on investments | | | 70,317,184 | | | | (223,791,585 | ) |
| Net increase (decrease) in net | | | | | | | | |
| assets resulting from operations | | | 22,058,371 | | | | (141,588,515 | ) |
| | | | | | | | | |
| DISTRIBUTIONS TO SHAREHOLDERS FROM: | | | | | | | | |
| Net investment income – Investor Class | | | (21,278,742 | ) | | | (48,567,636 | ) |
| Net realized gains – Investor Class | | | (35,850,694 | ) | | | (66,085,456 | ) |
| Total distributions | | | (57,129,436 | ) | | | (114,653,092 | ) |
| | | | | | | | | |
| CAPITAL SHARE TRANSACTIONS: | | | | | | | | |
| Proceeds from shares subscribed – Investor Class | | | 87,046,148 | | | | 442,529,547 | |
| Dividends reinvested – Investor Class | | | 53,893,968 | | | | 108,194,311 | |
| Cost of shares redeemed – Investor Class | | | (303,841,756 | ) | | | (900,257,726 | ) |
| Net decrease in net assets derived | | | | | | | | |
| from capital share transactions | | | (162,901,640 | ) | | | (349,533,868 | ) |
| TOTAL DECREASE IN NET ASSETS | | | (197,972,705 | ) | | | (605,775,475 | ) |
| | | | | | | | | |
| NET ASSETS: | | | | | | | | |
| Beginning of period | | | 1,649,206,045 | | | | 2,254,981,520 | |
| End of period | | $ | 1,451,233,340 | | | $ | 1,649,206,045 | |
| Undistributed net investment | | | | | | | | |
| income (loss), end of period | | $ | (42,920 | ) | | $ | 3,171,307 | |
| | | | | | | | | |
| CHANGES IN SHARES OUTSTANDING: | | | | | | | | |
| Shares sold – Investor Class | | | 3,391,601 | | | | 14,803,286 | |
| Shares issued to holders as reinvestment | | | | | | | | |
| of dividends – Investor Class | | | 2,167,189 | | | | 3,682,284 | |
| Shares redeemed – Investor Class | | | (12,106,875 | ) | | | (30,966,426 | ) |
| Net decrease in shares outstanding | | | (6,548,085 | ) | | | (12,480,856 | ) |
The accompanying notes are an integral part of these financial statements.
| HENNESSY FUNDS | 1-800-966-4354 | |
Financial Statements
For an Investor Class share outstanding throughout each period
| | | Six Months Ended | |
| | | April 30, 2016 | |
| | | (Unaudited) | |
| PER SHARE DATA: | | | |
| Net asset value, beginning of period | | $ | 27.69 | |
| | | | | |
| Income (loss) from investment operations: | | | | |
| Net investment income | | | 0.33 | |
| Net realized and unrealized gains (losses) on investments | | | 0.36 | |
| Total from investment operations | | | 0.69 | |
| | | | | |
| Less distributions: | | | | |
| Dividends from net investment income | | | (0.39 | ) |
| Dividends from net realized gains | | | (0.62 | ) |
| Total distributions | | | (1.01 | ) |
| Paid-in capital from redemption fees | | | — | |
| Net asset value, end of period | | $ | 27.37 | |
| | | | | |
| TOTAL RETURN | | | 2.91 | %(3) |
| | | | | |
| SUPPLEMENTAL DATA AND RATIOS: | | | | |
| Net assets, end of period (millions) | | $ | 1,451.23 | |
| Ratio of expenses to average net assets | | | 1.01 | %(4) |
| Ratio of net investment income to average net assets | | | 2.56 | %(4) |
| Portfolio turnover rate | | | 29 | %(3) |
(1) | Calculated based on average shares outstanding method. |
(2) | Amount is less than $0.01. |
(3) | Not annualized. |
(4) | Annualized. |
The accompanying notes are an integral part of these financial statements.
| Year Ended October 31, | |
| 2015 | | | 2014 | | | 2013 | | | 2012 | | | 2011 | |
| | | | | | | | | | | | | | |
| $ | 31.30 | | | $ | 26.69 | | | $ | 23.05 | | | $ | 21.21 | | | $ | 17.83 | |
| | | | | | | | | | | | | | | | | | | |
| | | | | | | | | | | | | | | | | | | |
| | 0.69 | | | | 0.62 | | | | 0.62 | | | | 0.58 | | | | 0.51 | (1) |
| | (2.69 | ) | | | 5.18 | | | | 4.18 | | | | 1.99 | | | | 3.59 | |
| | (2.00 | ) | | | 5.80 | | | | 4.80 | | | | 2.57 | | | | 4.10 | |
| | | | | | | | | | | | | | | | | | | |
| | | | | | | | | | | | | | | | | | | |
| | (0.70 | ) | | | (0.59 | ) | | | (0.61 | ) | | | (0.58 | ) | | | (0.51 | ) |
| | (0.91 | ) | | | (0.60 | ) | | | (0.55 | ) | | | (0.16 | ) | | | (0.21 | ) |
| | (1.61 | ) | | | (1.19 | ) | | | (1.16 | ) | | | (0.74 | ) | | | (0.72 | ) |
| | — | | | | 0.00 | (2) | | | 0.00 | (2) | | | 0.01 | | | | 0.00 | (2) |
| $ | 27.69 | | | $ | 31.30 | | | $ | 26.69 | | | $ | 23.05 | | | $ | 21.21 | |
| | | | | | | | | | | | | | | | | | | |
| | (6.59 | )% | | | 22.49 | % | | | 21.70 | % | | | 12.41 | % | | | 23.54 | % |
| | | | | | | | | | | | | | | | | | | |
| | | | | | | | | | | | | | | | | | | |
| $ | 1,649.21 | | | $ | 2,254.98 | | | $ | 1,182.79 | | | $ | 746.82 | | | $ | 433.78 | |
| | 0.93 | % | | | 0.77 | % | | | 0.80 | % | | | 0.69 | % | | | 0.71 | % |
| | 2.33 | % | | | 2.26 | % | | | 2.56 | % | | | 2.72 | % | | | 2.68 | % |
| | 37 | % | | | 20 | % | | | 18 | % | | | 16 | % | | | 17 | % |
The accompanying notes are an integral part of these financial statements.
| HENNESSY FUNDS | 1-800-966-4354 | |
Financial Statements
Notes to the Financial Statements April 30, 2016 (Unaudited) |
1). ORGANIZATION
The Hennessy Gas Utility Fund (the “Fund”) is a series of Hennessy Funds Trust (the “Trust”), which was organized as a Delaware statutory trust on September 17, 1992. The Fund is an open-end management investment company registered under the Investment Company Act of 1940, as amended. The Fund is a successor to the FBR Gas Utility Index Fund (the “Predecessor FBR Fund”), a series of The FBR Funds, a Delaware statutory trust, pursuant to a reorganization that took place after the close of business on October 26, 2012. Prior to October 26, 2012, the Fund had no investment operations. As a result of the reorganization, holders of the Investor Class shares of the Predecessor FBR Fund received Investor Class shares of the Fund (the Investor Class shares of the Fund are the successor to the accounting and performance information of the Predecessor FBR Fund). The investment objective of the Fund is income and capital appreciation. The Fund is a non-diversified fund and offers Investor Class shares.
As an investment company, the Fund follows the investment company accounting and reporting guidance of the Financial Accounting Standards Board (“FASB”) Accounting Standard Codification Topic 946 “Financial Services—Investment Companies.”
2). SIGNIFICANT ACCOUNTING POLICIES
The following is a summary of significant accounting policies consistently followed by the Fund in the preparation of the financial statements. These policies are in conformity with U.S. generally accepted accounting principles (“GAAP”).
| a). | Investment Valuation – All investments in securities are recorded at their estimated fair value, as described in Note 3. |
| b). | Federal Income Taxes – Provision for federal income taxes or excise taxes has not been made since the Fund has elected to be taxed as a “regulated investment company” and intends to distribute substantially all of its taxable income to its shareholders and otherwise comply with the provisions of the Internal Revenue Code of 1986, as amended, applicable to regulated investment companies. Net investment income or loss and realized gains and losses for federal income tax purposes may differ from that reported on the financial statements because of temporary book and tax basis differences. Temporary differences are primarily the result of the treatment of wash sales for tax reporting purposes. The Fund recognizes interest and penalties related to income tax benefits, if any, in the statement of operations as an income tax expense. Distributions from net realized gains for book purposes may include short-term capital gains, which are included as ordinary income to shareholders for tax purposes. |
| c). | Income and Expenses – Dividend income is recognized on the ex-dividend date or as soon as information is available to the Fund. Interest income, which includes the amortization of premium and accretion of discount, is recognized on an accrual basis. The Fund is charged for those expenses that are directly attributable to the portfolio, such as advisory, administration, and certain shareholder service fees. |
| d). | Distributions to Shareholders – Dividends from net investment income for the Fund, if any, are declared and paid on a calendar quarter basis. Distributions of net realized capital gains, if any, are declared and paid annually, usually in December. |
| e). | Security Transactions – Investment and shareholder transactions are recorded on the trade date. The Fund determines the gain or loss realized from the investment transactions by comparing the original cost of the security lot sold with the net sale proceeds. Discounts and premiums on securities purchased are accreted/amortized over the life of the respective security. |
| f). | Use of Estimates – The preparation of financial statements in conformity with GAAP requires management to make estimates and assumptions that affect the reported amounts of assets and liabilities and disclosure of contingent assets and liabilities at the date of the financial statements and the reported change in net assets during the reporting period. Actual results could differ from those estimates. |
| g). | Share Valuation – The net asset value (“NAV”) per share of the Fund is calculated by dividing the sum of the value of the securities held by the Fund, plus cash or other assets, minus all liabilities (including estimated accrued expenses) by the total number of shares outstanding for the Fund, rounded to the nearest cent. The Fund’s shares will not be priced on days the New York Stock Exchange is closed for trading. The offering and redemption price per share for the Fund is equal to the Fund’s NAV per share. |
| h). | Foreign Currency – Values of investments denominated in foreign currencies, if any, are converted into U.S. dollars using the spot market rate of exchange at the time of valuation. Purchases and sales of investments and income are translated into U.S. dollars using the spot market rate of exchange prevailing on the respective dates of such transactions. The Fund does not isolate the portion of the results of operations resulting from fluctuations in foreign exchange rates on investments from fluctuations resulting from changes in the market prices of securities held. Such fluctuations are included with the net realized and unrealized gain or loss on investments. Foreign investments present additional risks due to currency fluctuations, economic and political factors, lower liquidity, government regulations, differences in accounting standards, and other factors. |
| i). | Forward Contracts – The Fund may enter into forward currency contracts to reduce its exposure to changes in foreign currency exchange rates on its foreign holdings and to lock in the U.S. dollar cost of firm purchase and sale commitments for securities denominated in foreign currencies. A forward currency contract is a commitment to purchase or sell a foreign currency at a future date at a negotiated forward rate. The gain or loss arising from the difference between the U.S. dollar cost of the original contract and the value of the foreign currency in U.S. dollars upon closing of such contract is included in net realized gain or loss from foreign currency transactions. During the six months ended April 30, 2016, the Fund did not enter into any forward contracts. |
| j). | Repurchase Agreements – The Fund may enter into repurchase agreements with member banks or security dealers of the Federal Reserve Board whom the investment advisor deems creditworthy. The repurchase price generally equals the price paid by the Fund plus interest negotiated on the basis of current short-term rates. |
| | Securities pledged as collateral for repurchase agreements are held by the custodian bank until the respective agreements mature. Provisions of the repurchase agreements ensure that the market value of the collateral, including accrued interest thereon, is sufficient to cover the repurchase amount in the event of default of the counterparty. If the counterparty defaults and the value of the collateral declines or if the counterparty enters an insolvency proceeding, realization of the collateral by the Fund may be delayed or limited. |
| HENNESSY FUNDS | 1-800-966-4354 | |
| k). | Accounting for Uncertainty in Income Taxes – The Fund has accounting policies regarding recognition and measurement of tax positions taken or expected to be taken on a tax return. The tax returns of the Fund for the prior three fiscal years are open for examination. The Fund has reviewed all open tax years in major jurisdictions and concluded that there is no impact on the Fund’s net assets and no tax liability resulting from unrecognized tax benefits relating to uncertain income tax positions taken or expected to be taken on a tax return. The Fund’s major tax jurisdictions are U.S. federal and Delaware. |
| l). | New Accounting Pronouncements – In May 2015, the FASB issued ASU No. 2015-07 “Disclosure for Investments in Certain Entities that Calculate Net Asset Value per Share (or Its Equivalent).” The amendments in ASU No. 2015-07 remove the requirement to categorize within the fair value hierarchy investments measured at NAV and require the disclosure of sufficient information to reconcile the fair value of the remaining assets categorized within the fair value hierarchy to the financial statements. The amendments in ASU No. 2015-07 are effective for fiscal years beginning after December 15, 2015, and interim periods within those fiscal years. Management has reviewed the requirements and believes the adoption of ASU 2015-07 will not have a material impact on the Fund’s financial statements and related disclosures. |
3). SECURITIES VALUATION
The Fund follows authoritative fair valuation accounting standards that establish an authoritative definition of fair value and set out a hierarchy for measuring fair value. These standards require additional disclosures about the various inputs and valuation techniques used to develop the measurements of fair value and a discussion in changes in valuation techniques and related inputs during the period. These inputs are summarized in the three broad levels listed below:
| | Level 1 – | Unadjusted, quoted prices in active markets for identical instruments that the Fund has the ability to access at the date of measurement. |
| | Level 2 – | Other significant observable inputs (including, but not limited to, quoted prices in active markets for similar instruments, quoted prices in markets that are not active for identical or similar instruments, and model-derived valuations in which all significant inputs and significant value drivers are observable in active markets (such as interest rates, prepayment speeds, credit risk curves, default rates, and similar data)). |
| | Level 3 – | Significant unobservable inputs (including the Fund’s own assumptions about what market participants would use to price the asset or liability based on the best available information) when observable inputs are unavailable. |
Following is a description of the valuation techniques applied to the Fund’s major categories of assets and liabilities measured at fair value on a recurring basis.
Equity Securities – Equity securities, including common stocks, preferred stocks, foreign-issued common stocks, exchange-traded funds, closed-end mutual funds, partnerships, rights, and real estate investment trusts, that are traded on a securities exchange for which a last-quoted sales price is readily available will generally be valued at the last sales price as reported by the primary exchange on which the securities are listed. Securities listed on The NASDAQ Stock Market (“NASDAQ”) will generally be valued at the NASDAQ Official Closing Price, which may differ from the last sales price reported. Securities traded on a securities exchange for which a last-quoted sales price is not readily available will generally be valued at the mean between the bid and ask prices. To the extent these securities are actively traded and valuation adjustments are not applied, they
are classified in Level 1 of the fair value hierarchy. Securities traded on foreign exchanges generally are not valued at the same time the Fund calculates its NAV because most foreign markets close well before such time. The earlier close of most foreign markets gives rise to the possibility that significant events, including broad market moves, may have occurred in the interim. In certain circumstances, it may be determined that a security needs to be fair valued because it appears that the value of the security might have been materially affected by events occurring after the close of the market in which the security is principally traded, but before the time the Fund calculates its NAV, such as by a development that affects an entire market or region (e.g., weather-related events) or a potentially global development (e.g., a terrorist attack that may be expected to have an effect on investor expectations worldwide).
Registered Investment Companies – Investments in registered investment companies (e.g., mutual funds) are generally priced at the ending NAV provided by the applicable registered investment company’s service agent and will be classified in Level 1 of the fair value hierarchy.
Debt Securities – Debt securities, including corporate bonds, asset-backed securities, mortgage-backed securities, municipal bonds, U.S. Treasuries, and U.S. government agency issues, are generally valued at market on the basis of valuations furnished by an independent pricing service that utilizes both dealer-supplied valuations and formula-based techniques. The pricing service may consider recently executed transactions in securities of the issuer or comparable issuers, market price quotations (where observable), bond spreads, and fundamental data relating to the issuer. In addition, the model may incorporate observable market data, such as reported sales of similar securities, broker quotes, yields, bids, offers, and reference data. Certain securities are valued primarily using dealer quotations. These securities are generally classified in Level 2 of the fair value hierarchy.
Short-Term Securities – Short-term equity investments, including money market funds, are valued in the manner specified above. Short-term debt investments with an original term to maturity of 60 days or less are valued at amortized cost, which approximates fair market value. If the original term to maturity of a short-term debt investment exceeded 60 days, then the values as of the 61st day prior to maturity are amortized. Amortized cost is not used if its use would be inappropriate due to credit or other impairments of the issuer, in which case the security’s fair value would be determined, as described below. Short-term securities are generally classified in Level 1 or Level 2 of the fair market hierarchy depending on the inputs used and market activity levels for specific securities.
The Board of Trustees of the Fund (the “Board”) has adopted fair value pricing procedures that are followed when a price for a security is not readily available or if a significant event has occurred that indicates the closing price of a security no longer represents the true value of that security. Fair value pricing determinations are made in good faith in accordance with these procedures. There are numerous criteria that will be given consideration in determining a fair value of a security, such as the trading volume of a security and markets, the value of other like securities, and news events with direct bearing to a security or markets. Fair value pricing results in an estimated price for a security that reflects the amount the Fund might reasonably expect to receive in a current sale. Depending on the relative significance of the valuation inputs, these securities may be classified in either Level 2 or Level 3 of the fair value hierarchy.
The fair valuation of foreign securities may be determined with the assistance of a pricing service using correlations between the movement of prices of such securities and indices of domestic securities and other appropriate indicators, such as closing market
| HENNESSY FUNDS | 1-800-966-4354 | |
prices of relevant American Depositary Receipts or futures contracts. The effect of using fair value pricing is that the Fund’s NAV will reflect the affected portfolio securities’ value as determined by the Board or its designee instead of being determined by the market. Using a fair value pricing methodology to price foreign securities may result in a value that is different from a foreign security’s most recent closing price and from the prices used by other investment companies to calculate their NAVs and are generally considered Level 2 prices in the fair valuation hierarchy. Because the Fund may invest in foreign securities, the value of the Fund’s portfolio securities may change on days when you will not be able to purchase or redeem your shares.
The Board has delegated day-to-day valuation matters to a Valuation Committee comprised of one or more representatives from Hennessy Advisors, Inc., the Fund’s investment advisor. The function of the Valuation Committee is to value securities where current and reliable market quotations are not readily available. All actions taken by the Valuation Committee are reviewed by the Board.
The Fund has performed an analysis of all existing investments to determine the significance and character of all inputs to their fair value determination. Various inputs are used in determining the value of the Fund’s investments. The inputs or methodology used for valuing securities are not necessarily an indication of the risk associated with investing in those securities. Details related to the fair valuation hierarchy of the Fund’s securities as of April 30, 2016, are included in the Fund’s Schedule of Investments.
4). INVESTMENT TRANSACTIONS
Purchases and sales of investment securities (excluding government and short-term investments) for the Fund during the six months ended April 30, 2016, were $186,478,521 and $377,194,618, respectively.
There were no purchases or sales/maturities of long-term U.S. government securities for the Fund during the six months ended April 30, 2016.
5). INVESTMENT MANAGEMENT FEE AND OTHER TRANSACTIONS WITH AFFILIATES
Hennessy Advisors, Inc. (the “Advisor”) is the investment advisor of the Fund. The Advisor provides the Fund with investment management services under an Investment Advisory Agreement. The Advisor furnishes all investment advice, office space, facilities, and provides most of the personnel needed by the Fund. As compensation for its services, the Advisor is entitled to a monthly fee from the Fund. The fee is based upon the average daily net assets of the Fund at the annual rate of 0.40%. The net investment advisory fees payable by the Fund as of April 30, 2016, were $472,445.
In the past, the Advisor had contractually agreed to limit the total annual operating expenses of the Fund to 0.85% of the Fund’s net assets (excluding interest, taxes, brokerage commissions, dividend expenses, acquired fund fees and expenses, extraordinary legal expenses, or any other extraordinary expenses and, from and after November 1, 2014, 12b-1 fees). The expense limitation agreement for the Fund expired as of February 28, 2015.
For a period of three years after the year in which the Advisor waived or reimbursed expenses, the Advisor may seek reimbursement from the Fund to the extent that total annual fund operating expenses are less than the expense limitation that was in effect at the time the Advisor waived or reimbursed expenses. During the three years ended October 31, 2015, no expenses were waived or reimbursed by the Advisor and therefore no expenses are subject to potential recovery.
The Board has approved a Shareholder Servicing Agreement for the Fund, effective as of February 28, 2015, which was instituted to compensate the Advisor for the non-investment management services it provides to the Fund. The Shareholder Servicing Agreement provides for a monthly fee paid to the Advisor at an annual rate of 0.10% of the average daily net assets of the Fund. Shareholder service fees payable by the Fund as of April 30, 2016, were $118,111.
The Fund has adopted a plan pursuant to Rule 12b-1 under the Investment Company Act of 1940, as amended, that authorizes payments in connection with the distribution of the Fund’s shares at an annual rate of up to 0.25% of the Fund’s average daily net assets attributable to Investor Class shares. Even though the authorized rate is up to 0.25%, the Fund has only used up to 0.15% of its average daily net assets attributable to Investor Class shares for such purpose since the plan was implemented on March 1, 2015. Amounts paid under the plan may be spent on any activities or expenses primarily intended to result in the sale of shares, including, but not limited to, advertising, shareholder account servicing, the printing and mailing of prospectuses to other than current shareholders, the printing and mailing of sales literature, and compensation for sales and marketing activities or to financial institutions and others, such as dealers and distributors.
The Fund has entered into agreements with various brokers, dealers, and financial intermediaries in connection with the sale of shares of the Fund. The agreements provide for periodic payments by the Fund to the brokers, dealers, and financial intermediaries for providing certain shareholder maintenance services (sub-transfer agent expenses). These shareholder services include the pre-processing and quality control of new accounts, shareholder correspondence, answering customer inquiries regarding account status, and facilitating shareholder telephone transactions. Fees paid by the Fund to various brokers, dealers, and financial intermediaries during the six months ended April 30, 2016, were $1,376,500.
The Fund has entered into an Administrative Services Agreement among the Fund, the Advisor, and the American Gas Association (“AGA”), pursuant to which the AGA provides administrative services to the Fund. These administrative services include overseeing the calculation of the AGA Stock Index. Prior to January 1, 2015, AUS Consultants Utility Services performed the actual computations required to produce the AGA Stock Index and received a fee for such calculations pursuant to a contractual arrangement with AGA. As of January 1, 2015, AUS Consultants Utility Services was replaced by Sussex Economic Advisors, LLC. AGA does not furnish other securities advice to the Fund or the Advisor or make recommendations regarding the purchase or sale of securities by the Fund. Under the terms of the Administrative Services Agreement, which has been approved by the Board, AGA provides the Fund with current information regarding the common stock composition of the AGA Stock Index at least monthly. In addition, upon request, AGA provides the Fund and the Advisor with information on the natural gas industry. The Fund pays AGA a fee at an annual rate of 0.04% of the average daily net assets of the Fund.
U.S. Bancorp Fund Services, LLC (“USBFS”) provides the Fund with administrative, fund accounting, and transfer agent services, and necessary office equipment. As administrator, USBFS is responsible for activities such as (i) preparing various federal and state regulatory filings, reports, and returns for the Fund, (ii) preparing reports and materials to be supplied to the Board, (iii) monitoring the activities of the Fund’s custodian, transfer agent, and accountants, and (iv) coordinating the preparation and payment of the Fund’s expenses and reviewing the Fund’s expense accruals. Fees paid to USBFS during the six months ended April 30, 2016, were $690,779.
| HENNESSY FUNDS | 1-800-966-4354 | |
U.S. Bank, N.A., an affiliate of USBFS, serves as the Fund’s custodian. Quasar Distributors, LLC acts as the Fund’s principal underwriter in a continuous public offering of the Fund’s shares. Quasar Distributors, LLC is an affiliate of USBFS and U.S. Bank, N.A.
6). LINE OF CREDIT
The Fund has an uncommitted line of credit with the other funds in the Hennessy Funds family of funds (the “Hennessy Funds”) in the amount of the lesser of (i) $100,000,000 or (ii) 33.33% of each Hennessy Fund’s net assets, or 30% for the Fund and 10% for the Hennessy Balanced Fund, intended to provide short-term financing, if necessary, subject to certain restrictions, in connection with shareholder redemptions. The credit facility is with the Hennessy Funds’ custodian bank, U.S. Bank, N.A. Borrowings under this arrangement bear interest at the bank’s prime rate and are secured by all of the Fund’s assets (as to its own borrowings only). During the six months ended April 30, 2016, the Fund had an outstanding average daily balance and a weighted average interest rate of $41,016 and 3.44%, respectively. The maximum amount outstanding for the Fund during the period was $4,678,000. At April 30, 2016, the Fund did not have any borrowings outstanding under the line of credit.
7). FEDERAL TAX INFORMATION
As of October 31, 2015, the Fund’s most recent fiscal year end, the components of accumulated earnings (losses) for income tax purposes were as follows:
| | Cost of investments for tax purposes | | $ | 1,340,351,568 | |
| | Gross tax unrealized appreciation | | $ | 431,871,765 | |
| | Gross tax unrealized depreciation | | | (124,203,990 | ) |
| | Net tax unrealized appreciation | | $ | 307,667,775 | |
| | Undistributed ordinary income | | $ | 3,171,307 | |
| | Undistributed long-term capital gains | | | 35,846,072 | |
| | Total distributable earnings | | $ | 39,017,379 | |
| | Other accumulated gain | | $ | — | |
| | Total accumulated gain | | $ | 346,685,154 | |
The difference between book-basis unrealized appreciation/depreciation (as shown in the Statement of Assets and Liabilities) and tax-basis unrealized appreciation/depreciation (as shown above) is attributable primarily to wash sales and partnership adjustments.
At October 31, 2015, the Fund’s most recent fiscal year end, the Fund had no tax basis capital losses to offset future capital gains.
At October 31, 2015, the Fund’s most recent fiscal year end, the Fund did not defer, on a tax basis, any late year ordinary losses.
The tax character of distributions paid during fiscal year 2016 (year to date) and fiscal year 2015 for the Fund were as follows:
| | | Six Months Ended | | | Year Ended | |
| | | April 30, 2016 | | | October 31, 2015 | |
| Ordinary income | | $ | 21,278,742 | | | $ | 90,813,646 | |
| Long-term capital gain | | | 35,850,694 | | | | 23,839,446 | |
| | | $ | 57,129,436 | | | $ | 114,653,092 | |
Expense Example (Unaudited)
April 30, 2016
As a shareholder of the Fund, you incur two types of costs: (1) transaction costs, including sales charges (loads) on purchase payments, reinvested dividends, or other distributions; redemption fees; and exchange fees; and (2) ongoing costs, including management fees; service fees; and other Fund expenses. This Example is intended to help you understand your ongoing costs (in dollars) of investing in the Fund and to compare these costs with the ongoing costs of investing in other mutual funds. The Example is based on an investment of $1,000 invested at the beginning of the period and held for the entire period from November 1, 2015 through April 30, 2016.
Actual Expenses
The first line of the table below provides information about actual account values and actual expenses. Although the Fund charges no sales loads or transaction fees, you will be assessed fees for outgoing wire transfers, returned checks and stop payment orders at prevailing rates charged by U.S. Bancorp Fund Services, LLC, the Fund’s transfer agent. If you request that a redemption be made by wire transfer, currently a $15.00 fee is charged by the Fund’s transfer agent. IRA accounts will be charged a $15.00 annual maintenance fee. The example below includes, but is not limited to, management fees, shareholder servicing fees, fund accounting, custody, and transfer agent fees. However, the example below does not include portfolio trading commissions and related expenses, and other extraordinary expenses as determined under generally accepted accounting principles. You may use the information in this line, together with the amount you invested, to estimate the expenses that you paid over the period. Simply divide your account value by $1,000 (for example, an $8,600 account value divided by $1,000 = 8.6), then multiply the result by the number in the first line of the table under the heading entitled “Expenses Paid During Period” to estimate the expenses you paid on your account during this period.
Hypothetical Example for Comparison Purposes
The second line of the table below provides information about hypothetical account values and hypothetical expenses based on the Fund’s actual expense ratios and an assumed rate of return of 5% per year before expenses, which is not the Fund’s actual return. The hypothetical account values and expenses may not be used to estimate the actual ending account balance or expenses you paid for the period. You may use this information to compare the ongoing costs of investing in the Fund and other funds. To do so, compare this 5% hypothetical example with the 5% hypothetical examples that appear in the shareholder reports of the other funds. Please note that the expenses shown in the table are meant to highlight your ongoing costs only and do not reflect any transactional costs, such as sales charges (loads), or exchange fees. Therefore, the second line of the table is useful in comparing ongoing costs only, and will not help you determine the relative total costs of owning different funds. In addition, if these transactional costs were included, your costs would have been higher.
| | | | Expenses Paid |
| | Beginning | Ending | During Period(1) |
| | Account Value | Account Value | November 1, 2015 – |
| | November 1, 2015 | April 30, 2016 | April 30, 2016 |
| Investor Class | | | |
| Actual | $1,000.00 | $1,029.10 | $5.10 |
| Hypothetical (5% return before expenses) | $1,000.00 | $1,019.84 | $5.07 |
(1) | Expenses are equal to the Fund’s annualized expense ratio of 1.01%, multiplied by the average account value over the period, multiplied by 182/366 days (to reflect one-half year period). |
| HENNESSY FUNDS | 1-800-966-4354 | |
How to Obtain a Copy of the Fund’s
Proxy Voting Policy and Proxy Voting Records
A description of the policies and procedures the Fund uses to determine how to vote proxies relating to portfolio securities is available without charge: (1) by calling 1-800-966-4354; (2) on the Hennessy Funds’ website at hennessyfunds.com/proxy-voting/policy.fs; or (3) on the U.S. Securities and Exchange Commission’s website at www.sec.gov. The Fund’s proxy voting record is available without charge on both the Hennessy Funds’ website at hennessyfunds.com/proxy-voting/policy.fs and the SEC’s website at www.sec.gov no later than August 31 for the prior 12 months ending June 30.
Quarterly Filings on Form N-Q
The Fund files its complete schedule of portfolio holdings with the SEC for the first and third quarters of each fiscal year on Form N-Q. The Fund’s Form N-Q will be available on the SEC’s website at www.sec.gov. The Fund’s Form N-Q may be reviewed and copied at the SEC’s Public Reference Room in Washington, DC and information on the operation of the Public Reference Room may be obtained by calling 1-800-SEC-0330. Information included in the Fund’s N-Q will also be available upon request by calling 1-800-966-4354.
Federal Tax Distribution Information
(Unaudited)
For the fiscal year ended October 31, 2015, certain dividends paid by the Fund may be subject to a maximum tax rate of 23.8%, as provided for by the Jobs and Growth Tax Relief Reconciliation Act of 2003. The percentage of dividends declared from ordinary income designated as qualified dividend income was 83.89%.
For corporate shareholders, the percent of ordinary income distributions that qualified for the corporate dividends received deduction for the fiscal year ended October 31, 2015 was 78.02%.
The percentage of taxable ordinary income distributions that are designated as short-term capital gain distributions under Section 871(k)(2)(C) of the Internal Revenue Code of 1986, as amended, for the Fund was 46.09%.
Householding
To help keep the Fund’s costs as low as possible, we generally deliver a single copy of most financial reports and prospectuses to shareholders who share an address, even if the accounts are registered under different names. This process, known as “householding,” does not apply to account statements. You may, of course, request an individual copy of a prospectus or financial report at any time. If you would like to receive separate mailings, please call the Administrator at 1-800-261-6950 or 1-414-765-4124 and we will begin individual delivery within 30 days of your request. If your account is held through a financial institution or other intermediary, please contact them directly to request individual delivery.
Board Approval of Investment Advisory
Agreement
At its meeting on March 9, 2016, the Board of Trustees of the Fund (the “Board,” and the members thereof, the “Trustees”) unanimously approved the continuation of the investment advisory agreement of the Fund with Hennessy Advisors, Inc. (the “Advisor”). As part of the process of approving the continuation of the advisory agreement, the Trustees reviewed their fiduciary duties with respect to approving the advisory agreement and the relevant factors for them to consider. In addition, the Trustees who are not deemed “interested persons” (as that term is defined by the Investment Company Act of 1940) of the Fund (the “Independent Trustees”) met in executive session to discuss the approval of the advisory agreement.
In advance of the meeting, the Advisor sent detailed information to the Trustees to assist them in their evaluation of the advisory agreement. This information included, but was not limited to, (i) a memorandum from outside legal counsel that described the fiduciary duties of the Board with respect to approving the continuation of the advisory agreement and the relevant factors for consideration, (ii) a memorandum from the Advisor that listed the factors relevant to the Board’s approval of the continuation of the advisory agreement and also referenced the documents that had been provided to help the Board assess each such factor, (iii) an inventory of the range of services provided by the Advisor for the Fund, (iv) a written discussion of economies of scale, (v) the advisory agreement, (vi) a recent Fund fact sheet, (vii) a peer expense comparison, (viii) performance information, (ix) the Advisor’s most recent Form 10-K and Form 10-Q, which included information about the Advisor’s profitability, (x) information about brokerage commissions, (xi) information about the Fund’s compliance program, (xii) the Advisor’s current Form ADV Part I, and (xii) other information the Trustees believed was useful in evaluating the approval of the continuation of the advisory agreement.
All of the factors discussed by the Trustees were considered as a whole, and were considered separately by the Independent Trustees, meeting in executive session. The factors were viewed in their totality by the Trustees, with no single factor being the principal or determinative factor in the Trustees’ determination of whether to approve the continuation of the advisory agreement. The Trustees recognized that the management and fee arrangements for the Fund are the result of years of review and discussion between the Independent Trustees and the Advisor, that certain aspects of such arrangements may receive greater scrutiny in some years than in others, and that the Trustees’ conclusions may be based, in part, on their consideration of these same arrangements and information received during the course of the year and in prior years.
Prior to approving the continuation of the advisory agreement, the Trustees and the Independent Trustees in executive session considered, among other items:
| | • | The nature and quality of the advisory services provided by the Advisor. |
| | • | A comparison of the fees and expenses of the Fund to other similar funds. |
| | • | Whether economies of scale are recognized by the Fund. |
| | • | The costs and profitability of the Fund to the Advisor. |
| | • | The performance of the Fund. |
| | • | The other benefits to the Advisor from serving as an investment advisor to the Fund (in addition to the advisory fee). |
| HENNESSY FUNDS | 1-800-966-4354 | |
The material considerations and determinations of the Board of Trustees, including all of the Independent Trustees, are as follows:
| | • | The Board considered the services identified below that are provided by the Advisor. Based on this review, the Trustees believe that the Advisor provides high-quality services to the Fund, and they noted that their overall confidence in the Advisor is high. The Trustees also concluded that they were satisfied with the nature, extent, and quality of the advisory services provided to the Fund by the Advisor, and that the nature and extent of the services provided by the Advisor are appropriate to assure that the Fund’s operations are conducted in compliance with applicable laws, rules, and regulations. |
| | | • | The Advisor acts as the portfolio manager for the Fund. In this capacity, the Advisor does the following: |
| | | | • | manages the composition of the Fund’s portfolio, including the purchase, retention, and disposition of portfolio securities in accordance with the Fund’s investment objectives, policies, and restrictions; |
| | | | • | ensures compliance with “best execution” for the Fund’s portfolio; |
| | | | • | manages the use of soft dollars for the Fund. |
| | | • | The Advisor performs a daily reconciliation of portfolio positions and cash for the Fund. |
| | | • | The Advisor monitors the Fund’s compliance with its investment objectives and restrictions. |
| | | • | The Advisor monitors compliance with federal securities laws and performs activities such as maintaining a compliance program, conducting ongoing reviews of the compliance programs of the Fund’s service providers, conducting on-site visits to the Fund’s service providers, monitoring incidents of abusive trading practices, reviewing Fund expense accruals, payments, and fixed expense ratios, evaluating insurance providers for fidelity bond coverage and D&O/E&O insurance coverage, conducting employee compliance training, reviewing reports provided by service providers, maintaining books and records, and preparing an annual compliance report to the Board. |
| | | • | The Advisor oversees service providers that provide accounting, administration, distribution, transfer agency, custodial, sales and marketing, public relations, audit, information technology, and legal services to the Fund. |
| | | • | The Advisor maintains in-house marketing and distribution departments on behalf of the Fund. |
| | | • | The Advisor is actively involved with preparing regulatory filings for the Fund, including writing and annually updating the Fund’s prospectus and related documents. |
| | | • | The Advisor prepares a written summary of the Fund’s performance for the most recent six-month period or twelve-month period, as applicable, for each semi-annual and annual report of the Fund. |
| | | • | The Advisor oversees distribution of the Fund through third-party broker/dealers and independent financial institutions such as Charles Schwab, Inc., Fidelity, TD Waterhouse, and Pershing. The Advisor participates in “no transaction fee” (“NTF”) programs with these companies on behalf of the Fund, which allow customers to purchase the Fund through third-party distribution |
| | | | channels without paying a transaction fee. The Advisor compensates, in part, a number of these third-party providers of NTF programs out of its own revenues. |
| | | • | The Advisor pays the incentive compensation of the Fund’s compliance officers and employs other staff, such as management executives, legal personnel, marketing personnel, national accounts and distribution personnel, sales personnel, administrative personnel, and trading oversight personnel. |
| | | • | The Advisor provides a quarterly compliance certification to the Board. |
| | | • | The Advisor prepares or reviews Board materials, frequently presents to the Board or leads Board discussions, prepares or reviews meeting minutes, and arranges for Board training and education. |
| | • | The Board compared the performance of the Fund to benchmark indices over various periods of time and they noted that at each quarterly meeting, the Trustees review reports comparing the investment performance of the Fund to various indices. Based on the information provided at the meeting and the information and quarterly discussions regarding the Fund’s investment performance, the Trustees believe that the Advisor manages the Fund in a manner that is materially consistent with its stated investment objective and style. The Trustees concluded that the performance of the Fund over various time horizons warranted the continuation of the advisory agreement. |
| | • | The Board reviewed the advisory fees and overall expense ratios of the Fund and comparable funds using data from Morningstar with respect to funds similar in asset size and investment objective to the Fund. As part of the discussion with management, the Trustees ensured that they understood and were comfortable with the criteria used to determine the mutual funds included in the Morningstar categories for purposes of the materials considered at the meeting. The Board determined that the advisory fee and overall expense ratio of the Fund falls within the range of the advisory fees and overall expense ratios of other comparable funds and concluded that they are reasonable and warranted continuation of the advisory agreement. |
| | • | The Board also considered whether economies of scale were being realized by the Advisor that should be shared with the Fund’s shareholders. The Trustees noted that many of the expenses incurred to manage the Fund are asset-based fees and thus do not result in material economies of scale being realized as the net assets of the Fund increase. For example, intermediary service fees increase as the Fund’s assets grow. The Trustees also considered the Advisor’s efforts to contain expenses, and took into account the Advisor’s significant marketing efforts to increase Fund assets. The Board determined that it did not appear that there were significant economies of scale being realized by the Advisor and concluded that it would continue to monitor economies of scale in the future as circumstances changed. |
| | • | The Board considered the profitability of the Advisor, including the impact of intermediary service fees on the Advisor’s profitability, and also considered the resources and revenues that the Advisor has put into managing and distributing the Fund. The Board then concluded that the profits of the Advisor are reasonable and not excessive when compared to profitability guidelines set forth in relevant court cases. |
| | • | The Board considered the high level of professionalism and knowledge of the Advisor’s employees, along with a very low level of turnover, and concluded that this was beneficial to the Fund and its shareholders. |
| HENNESSY FUNDS | 1-800-966-4354 | |
| | • | The Board considered other benefits to the Advisor from serving as an advisor to the Fund (in addition to the advisory fee). The Board noted that the Advisor may derive ancillary benefits from, by way of example, its association with the Fund in the form of proprietary and third-party research products and services received from broker dealers that execute portfolio trades for the Fund. The Board determined that any such products and services have been used for legitimate purposes relating to the Fund by providing assistance in the investment decision-making process. The Trustees concluded that the other benefits realized by the Advisor from its relationship with the Fund were reasonable. |
After reviewing the materials provided at the meeting and management’s presentation, as well as other information regularly provided at the Board’s quarterly meetings throughout the year regarding the quality of services provided by the Advisor, the performance of the Fund, expense information, regulatory compliance issues, trading information and related matters, and other factors deemed relevant by the Board, the Trustees, including all of the Independent Trustees, approved the continuation of the advisory agreement.
(This Page Intentionally Left Blank.)
For information, questions or assistance, please call
The Hennessy Funds
1-800-966-4354 or 1-415-899-1555
INVESTMENT ADVISOR
Hennessy Advisors, Inc.
7250 Redwood Blvd., Suite 200
Novato, California 94945
ADMINISTRATOR,
TRANSFER AGENT,
DIVIDEND PAYING AGENT &
SHAREHOLDER SERVICING AGENT
U.S. Bancorp Fund Services, LLC
P.O. Box 701
Milwaukee, Wisconsin 53201-0701
CUSTODIAN
U.S. Bank N.A.
Custody Operations
1555 North River Center Dr., Suite 302
Milwaukee, Wisconsin 53212
TRUSTEES
Neil J. Hennessy
Robert T. Doyle
J. Dennis DeSousa
Gerald P. Richardson
COUNSEL
Foley & Lardner LLP
777 East Wisconsin Avenue
Milwaukee, Wisconsin 53202-5306
INDEPENDENT REGISTERED
PUBLIC ACCOUNTING FIRM
Tait, Weller & Baker LLP
1818 Market Street, Suite 2400
Philadelphia, Pennsylvania 19103
DISTRIBUTOR
Quasar Distributors, LLC
615 East Michigan Street
Milwaukee, Wisconsin 53202
hennessyfunds.com | 1-800-966-4354
This report has been prepared for shareholders and may be distributed to
others only if preceded or accompanied by a current prospectus.
SEMI-ANNUAL REPORT
APRIL 30, 2016
HENNESSY SMALL CAP
FINANCIAL FUND
Investor Class HSFNX
Institutional Class HISFX
hennessyfunds.com | 1-800-966-4354
(This Page Intentionally Left Blank.)
Contents
| Letter to Shareholders | 2 |
| Performance Overview | 4 |
| Financial Statements | |
| Schedule of Investments | 6 |
| Statement of Assets and Liabilities | 9 |
| Statement of Operations | 10 |
| Statements of Changes in Net Assets | 12 |
| Financial Highlights | 14 |
| Notes to the Financial Statements | 18 |
| Expense Example | 26 |
| Proxy Voting | 28 |
| Quarterly Filings on Form N-Q | 28 |
| Householding | 28 |
| Board Approval of Investment Advisory Agreement | 29 |
| HENNESSY FUNDS | 1-800-966-4354 | |
June 2016
Dear Hennessy Funds Shareholder:
I used to tell my kids, “What doesn’t kill you makes you stronger.” Perhaps that is not the best analogy for investing, but in the face of such roller coaster volatility in the financial markets, it seems to me that what hasn’t killed this bull market rally may just make it stronger. The financial markets brought us flat to modest returns during the six months ended April 30, 2016, with the S&P 500 Index returning 0.43% and the Dow Jones Industrial Average (DJIA) returning 1.98% during the period. These six months were marked by high volatility, the onslaught of more and more regulatory hurdles, the Fed stuck in neutral, fears about the global economy, and wild political rhetoric — all headwinds that I believe could have significantly stalled any positive moves in the market, but didn’t. Even the aggressive pull back in January showed just how skittish the market can be, and yet again the markets showed great resiliency and marched right back.
I continue to be impressed with the persistence of the bull market in U.S. equities, now in its seventh year. Many commentators believe that the U.S. economy is due for a recession, and the market is due for a downturn. However, we find ourselves comparing today’s secular market to the bull run of 1982 to 2000, which was powered by a significant increase in valuations. On March 9th of this year, I took a moment to remember how we all felt seven years ago on March 9, 2009, at the bottom of the financial crisis downturn that had wiped out trillions of dollars’ worth of U.S. equities. I explained to our investors then, and I say the same thing today, I believe that if you invest in quality companies with good fundamentals, over the long term, you should do fine.
If history is any kind of guide, then I think this bull market has some room to run. Rising markets usually fall when there is extreme optimism or euphoria. I haven’t witnessed any of that as of yet. The volatility has unnerved many, but I encourage investors to try to remain focused on investment fundamentals. Many U.S. companies continue to find ways to make a profit and build their already strong balance sheets. Unemployment is low, and wages are rising in real terms, supporting consumer confidence and consumption. With an average price-to-sales ratio of only 1.7x and a dividend yield of approximately 2.5% for the Dow, I believe U.S. equities continue to be attractive. In my opinion, there are many compelling reasons why this market can continue to climb even higher.
The next six months may be fraught with more talk about what the Fed will do, who the next President of the United States will be, and what is happening in China and around the globe. Businesses in every industry, including the asset management business, have concerns about increasing regulatory burdens, taxes, and higher healthcare costs. But, I still believe the ingenuity and perseverance of American business will find ways to endure and to thrive.
Thank you for your continued confidence and investment in our products. If you have any questions or would like to speak with us directly, please don’t hesitate to call us at (800) 966-4354.
Best regards,
Neil J. Hennessy
President and Chief Investment Officer
Past performance does not guarantee future results.
Mutual fund investing involves risk. Principal loss is possible.
Opinions expressed are those of Neil Hennessy and are subject to change, are not guaranteed and should not be considered investment advice.
Price-to-sales ratio is a tool for calculating a stock’s valuation relative to other companies. It is calculated by dividing a stock’s current price by its revenue per share. Dividend yield is calculated as the annual dividends paid by a company divided by its market price per share.
The Dow Jones Industrial Average and S&P 500 Index are unmanaged indices commonly used to measure the performance of U.S. stocks. One cannot invest directly in an index.
| HENNESSY FUNDS | 1-800-966-4354 | |
Performance Overview (Unaudited)
AVERAGE ANNUAL TOTAL RETURN FOR PERIODS ENDED APRIL 30, 2016
| | Six | One | Five | Ten |
| | Months(1) | Year | Years | Years |
| Hennessy Small Cap Financial Fund – | | | | |
| Investor Class (HSFNX) | -0.64% | 9.12% | 7.99% | 4.56% |
| Hennessy Small Cap Financial Fund – | | | | |
Institutional Class (HISFX)(2) | -0.43% | 9.55% | 8.31% | 4.79% |
Russell 2000® Financial | | | | |
| Services Index | 0.30% | 2.73% | 10.30% | 3.59% |
Russell 2000® Index | -1.90% | -5.94% | 6.98% | 5.42% |
Expense ratios: 1.50% (Investor Class); 1.17% (Institutional Class)
Performance data quoted represents past performance; past performance does not guarantee future results. The investment return and principal value of an investment will fluctuate so that an investor’s shares, when redeemed, may be worth more or less than their original cost. The performance table does not reflect the deduction of taxes that a shareholder would pay on Fund distributions or the redemption of Fund shares. Current performance of the Fund may be lower or higher than the performance quoted. Performance data current to the most recent month end may be obtained by visiting hennessyfunds.com. Performance for periods prior to October 26, 2012, is that of the FBR Small Cap Financial Fund.
The expense ratios presented are from the most recent prospectus.
(1) | Periods less than one year are not annualized. |
(2) | The inception date of the Institutional Class shares is May 30, 2008. Performance shown prior to the inception of the Institutional Class shares reflects the performance of the Investor Class shares and includes expenses that are not applicable to and are higher than those of the Institutional Class shares. |
PERFORMANCE NARRATIVE
Portfolio Managers David H. Ellison and Ryan C. Kelley
Performance:
For the six-month period ended April 30, 2016, the Investor Class of the Hennessy Small Cap Financial Fund returned -0.64%, outperforming the Russell 2000® Index, which returned -1.90%, but underperforming the Russell 2000® Financial Services Index, which returned 0.30%, for the same period.
The Fund’s slight underperformance versus its primary benchmark index was principally due to the Fund’s concentration in small and regional banks and thrifts, which underperformed other areas of the broader Financials sector, primarily Real Estate Investment Trusts (REITs). Renewed uncertainty surrounding Federal Reserve rate policy in light of softer economic signals at home and limp growth abroad,together with generally weak financial market conditions, combined to dampen the returns of the group and the market overall. Leading contributors to Fund performance included First BanCorp., ServisFirst Bancshares, Inc. and WSFS Financial Corporation, all of which the Fund continues to own. Companies with the weakest performance during the six-month period were Banner Corporation, BankUnited, Inc. and Investors Bancorp, Inc. The Fund continues to hold these three companies as well.
Portfolio Strategy:
Generally, the Fund tilts its investments more heavily toward regional banks, thrifts and, at times, mortgage finance companies. Within these preferred sub-industries, we seek companies that we believe have high-quality management teams, uncomplicated business models and sustainable earnings growth opportunities. Moreover, we identify companies expected to do well in the current environment, which is characterized by low interest rates, competitive loan markets and heightened regulatory control. We are less interested in companies that appear to promise an increase in profitability when interest rates rise or loan demand and pricing become more favorable, since these industry dynamics are difficult to predict.
Investment Outlook:
After half a decade of credit troubles, costly regulatory mandates, low rates pressuring lending margins and a sluggish economic recovery, headwinds for financial companies appear to be abating. Industry measures of liquidity, capital, credit, reserves, book value and earnings are all showing steady improvement. We believe the industry will begin to see improved lending margins and earnings if interest rates rise, as expected, in the coming year.
Finally, we believe the condition of the financial system in the U.S. today is one of the best we have seen in quite some time. With improving fundamentals and increased mergers and acquisition activity in the banking sector, the outlook for small financials appears favorable.
Opinions expressed are those of the Portfolio Managers as of the date written and are subject to change, are not guaranteed, and should not be considered investment advice or an indication of trading intent.
The Russell 2000® Financial Services Index is an unmanaged index commonly used to measure the performance of U.S. small-capitalization financial sector stocks. The Russell 2000® Index is an unmanaged index commonly used to measure the performance of U.S. small-capitalization stocks. One cannot invest directly in an index.
The Fund is non-diversified, meaning it may concentrate its assets in fewer individual holdings than a diversified fund, making it more exposed to individual stock volatility than a diversified fund. Investments are focused in the financial services industry; sector funds may be subject to a higher degree of market risk. The Fund invests in smaller companies, which may have more limited liquidity and greater volatility compared to larger companies.
References to specific securities should not be considered a recommendation to buy or sell any security. Fund holdings and sector allocations are subject to change. Please refer to the Schedule of Investments included in this report for additional portfolio information.
Earnings growth is not a measure of the Fund’s future performance. Book value is the net asset value of a company, calculated by total assets minus liabilities.
| HENNESSY FUNDS | 1-800-966-4354 | |
Financial Statements
Schedule of Investments as of April 30, 2016 (Unaudited) |
HENNESSY SMALL CAP FINANCIAL FUND
(% of Net Assets)
| TOP TEN HOLDINGS (EXCLUDING CASH/CASH EQUIVALENTS) | % NET ASSETS |
| Hingham Institution for Savings | 4.85% |
| Yadkin Financial Corp. | 4.74% |
| Washington Federal, Inc. | 4.72% |
| Independent Bank Corp. | 4.57% |
| Kearny Financial Corp. of Maryland | 4.56% |
| Brookline Bancorp, Inc. | 4.42% |
| Flushing Financial Corp. | 4.31% |
| Clifton Bancorp, Inc. | 4.30% |
| Wintrust Financial Corp. | 3.91% |
| Provident Financial Services, Inc. | 3.88% |
Note: For presentation purposes, the Fund has grouped some of the industry categories. For purposes of categorizing securities for compliance with section 8(b)(1) of the Investment Company Act of 1940, as amended, the Fund uses more specific industry classifications.
| | COMMON STOCKS – 93.65% | | Number | | | | | | % of | |
| | | | of Shares | | | Value | | | Net Assets | |
| | Financials – 93.65% | | | | | | | | | |
| | Astoria Financial Corp. | | | 290,000 | | | $ | 4,361,600 | | | | 2.12 | % |
| | BankUnited, Inc. | | | 187,500 | | | | 6,468,750 | | | | 3.14 | % |
| | Banner Corp. | | | 167,500 | | | | 7,165,650 | | | | 3.48 | % |
| | Beneficial Bancorp, Inc. (a) | | | 190,000 | | | | 2,639,100 | | | | 1.28 | % |
| | Brookline Bancorp, Inc. | | | 800,000 | | | | 9,104,000 | | | | 4.42 | % |
| | Capital Bank Financial Corp. | | | 107,500 | | | | 3,249,725 | | | | 1.58 | % |
| | Clifton Bancorp, Inc. | | | 595,000 | | | | 8,853,600 | | | | 4.30 | % |
| | Customers Bancorp, Inc. (a) | | | 30,000 | | | | 779,400 | | | | 0.38 | % |
| | Eagle Bancorp, Inc. (a) | | | 29,021 | | | | 1,471,365 | | | | 0.71 | % |
| | FCB Financial Holdings, Inc., Class A (a) | | | 60,000 | | | | 2,097,000 | | | | 1.02 | % |
| | First BanCorp. (a) (b) | | | 1,100,000 | | | | 4,290,000 | | | | 2.08 | % |
| | First Connecticut Bancorp, Inc. | | | 155,670 | | | | 2,682,194 | | | | 1.30 | % |
| | Flushing Financial Corp. | | | 445,000 | | | | 8,877,750 | | | | 4.31 | % |
| | Fulton Financial Corp. | | | 130,000 | | | | 1,818,700 | | | | 0.88 | % |
| | Hingham Institution for Savings | | | 78,000 | | | | 9,983,220 | | | | 4.85 | % |
| | IBERIABANK Corp. | | | 67,500 | | | | 3,981,825 | | | | 1.93 | % |
| | Independent Bank Corp. | | | 200,000 | | | | 9,406,000 | | | | 4.57 | % |
| | Investors Bancorp, Inc. | | | 430,000 | | | | 4,966,500 | | | | 2.41 | % |
| | Kearny Financial Corp. of Maryland | | | 745,000 | | | | 9,401,900 | | | | 4.56 | % |
| | Meridian Bancorp, Inc. | | | 510,000 | | | | 7,456,200 | | | | 3.62 | % |
| | OceanFirst Financial Corp. | | | 325,000 | | | | 6,331,000 | | | | 3.07 | % |
| | Opus Bank | | | 135,000 | | | | 4,876,200 | | | | 2.37 | % |
| | PacWest Bancorp | | | 170,000 | | | | 6,796,600 | | | | 3.30 | % |
| | Provident Financial Services, Inc. | | | 400,000 | | | | 7,992,000 | | | | 3.88 | % |
| | Servisfirst Bancshares, Inc. | | | 100,000 | | | | 4,928,000 | | | | 2.39 | % |
| | Synovus Financial Corp. | | | 200,000 | | | | 6,232,000 | | | | 3.03 | % |
| | Umpqua Holdings Corp. | | | 65,000 | | | | 1,028,950 | | | | 0.50 | % |
| | United Financial Bancorp, Inc. | | | 355,000 | | | | 4,607,900 | | | | 2.24 | % |
| | Washington Federal, Inc. | | | 400,000 | | | | 9,716,000 | | | | 4.72 | % |
| | Western Alliance Bancorp (a) | | | 130,000 | | | | 4,755,400 | | | | 2.31 | % |
| | Wilshire Bancorp, Inc. | | | 115,000 | | | | 1,238,550 | | | | 0.60 | % |
| | Wintrust Financial Corp. | | | 155,000 | | | | 8,063,100 | | | | 3.91 | % |
| | WSFS Financial Corp. | | | 220,000 | | | | 7,510,800 | | | | 3.65 | % |
The accompanying notes are an integral part of these financial statements.
| HENNESSY FUNDS | 1-800-966-4354 | |
| | COMMON STOCKS | | Number | | | | | | % of | |
| | | | of Shares | | | Value | | | Net Assets | |
| | Financials (Continued) | | | | | | | | | |
| | Yadkin Financial Corp. | | | 390,000 | | | $ | 9,757,800 | | | | 4.74 | % |
| | | | | | | | | | | | | | |
| | Total Common Stocks | | | | | | | | | | | | |
| | (Cost $164,378,297) | | | | | | | 192,888,779 | | | | 93.65 | % |
| | | | | | | | | | | | | | |
| | SHORT-TERM INVESTMENTS – 7.57% | | | | | | | | | | | | |
| | Money Market Funds – 7.57% | | | | | | | | | | | | |
| | Federated Government Obligations Fund, Class I, 0.21% (c) | | | 5,270,382 | | | | 5,270,382 | | | | 2.56 | % |
| | Fidelity Government Portfolio, Institutional Class, 0.23% (c) | | | 10,320,000 | | | | 10,320,000 | | | | 5.01 | % |
| | | | | | | | | 15,590,382 | | | | 7.57 | % |
| | Total Short-Term Investments | | | | | | | | | | | | |
| | (Cost $15,590,382) | | | | | | | 15,590,382 | | | | 7.57 | % |
| | | | | | | | | | | | | | |
| | Total Investments | | | | | | | | | | | | |
| | (Cost $179,968,679) – 101.22% | | | | | | | 208,479,161 | | | | 101.22 | % |
| | | | | | | | | | | | | | |
| | Liabilities in Excess | | | | | | | | | | | | |
| | of Other Assets – (1.22)% | | | | | | | (2,516,377 | ) | | | (1.22 | )% |
| | | | | | | | | | | | | | |
| | TOTAL NET ASSETS – 100.00% | | | | | | $ | 205,962,784 | | | | 100.00 | % |
Percentages are stated as a percent of net assets.
| (a) | Non-income producing security. |
| (b) | U.S. traded security of a foreign corporation. |
| (c) | The rate listed is the fund’s 7-day yield as of April 30, 2016. |
Summary of Fair Value Exposure at April 30, 2016
The following is a summary of the inputs used to value the Fund’s net assets as of April 30, 2016 (See Note 3 in the accompanying notes to the financial statements):
| Common Stocks | | Level 1 | | | Level 2 | | | Level 3 | | | Total | |
| Financials | | $ | 192,888,779 | | | $ | — | | | $ | — | | | $ | 192,888,779 | |
| Total Common Stocks | | $ | 192,888,779 | | | $ | — | | | $ | — | | | $ | 192,888,779 | |
| Short-Term Investments | | | | | | | | | | | | | | | | |
| Money Market Funds | | $ | 15,590,382 | | | $ | — | | | $ | — | | | $ | 15,590,382 | |
| Total Short-Term Investments | | $ | 15,590,382 | | | $ | — | | | $ | — | | | $ | 15,590,382 | |
| Total Investments | | $ | 208,479,161 | | | $ | — | | | $ | — | | | $ | 208,479,161 | |
Transfers between levels are recognized at the end of the reporting period. During the six-month period ended April 30, 2016, the Fund recognized no transfers between levels.
The accompanying notes are an integral part of these financial statements.
Financial Statements
Statement of Assets and Liabilities as of April 30, 2016 (Unaudited) |
| ASSETS: | | | |
| Investments in securities, at value (cost $179,968,679) | | $ | 208,479,161 | |
| Dividends and interest receivable | | | 101,623 | |
| Receivable for fund shares sold | | | 60,750 | |
| Receivable for securities sold | | | 1,391,527 | |
| Prepaid expenses and other assets | | | 23,506 | |
| Total Assets | | | 210,056,567 | |
| | | | | |
| LIABILITIES: | | | | |
| Payable for securities purchased | | | 3,616,516 | |
| Payable for fund shares redeemed | | | 157,054 | |
| Payable to advisor | | | 156,827 | |
| Payable to administrator | | | 54,919 | |
| Payable to auditor | | | 10,236 | |
| Accrued distribution fees | | | 25,195 | |
| Accrued service fees | | | 15,665 | |
| Accrued trustees fees | | | 2,579 | |
| Accrued expenses and other payables | | | 54,792 | |
| Total Liabilities | | | 4,093,783 | |
| NET ASSETS | | $ | 205,962,784 | |
| | | | | |
| NET ASSETS CONSIST OF: | | | | |
| Capital stock | | $ | 168,638,430 | |
| Accumulated net investment income | | | 305,431 | |
| Accumulated net realized gain on investments | | | 8,508,441 | |
| Unrealized net appreciation on investments | | | 28,510,482 | |
| Total Net Assets | | $ | 205,962,784 | |
| | | | | |
| NET ASSETS | | | | |
| Investor Class: | | | | |
| Shares authorized (no par value) | | Unlimited | |
| Net assets applicable to outstanding Investor Class shares | | $ | 187,031,005 | |
| Shares issued and outstanding | | | 8,480,389 | |
| Net asset value, offering price and redemption price per share | | $ | 22.05 | |
| | | | | |
| Institutional Class: | | | | |
| Shares authorized (no par value) | | Unlimited | |
| Net assets applicable to outstanding Institutional Class shares | | $ | 18,931,779 | |
| Shares issued and outstanding | | | 1,418,954 | |
| Net asset value, offering price and redemption price per share | | $ | 13.34 | |
The accompanying notes are an integral part of these financial statements.
| HENNESSY FUNDS | 1-800-966-4354 | |
Financial Statements
Statement of Operations for the six months ended April 30, 2015 (Unaudited) |
| INVESTMENT INCOME: | | | |
Dividend income(1) | | $ | 2,434,847 | |
| Interest income | | | 16,153 | |
| Total investment income | | | 2,451,000 | |
| | | | | |
| EXPENSES: | | | | |
| Investment advisory fees (See Note 5) | | | 1,085,558 | |
| Sub-transfer agent expenses – Investor Class (See Note 5) | | | 235,550 | |
| Sub-transfer agent expenses – Institutional Class (See Note 5) | | | 12,438 | |
| Distribution fees – Investor Class (See Note 5) | | | 160,836 | |
| Administration, fund accounting, custody and transfer agent fees (See Note 5) | | | 118,296 | |
| Service fees – Investor Class (See Note 5) | | | 107,224 | |
| Federal and state registration fees | | | 18,008 | |
| Compliance expense | | | 11,790 | |
| Audit fees | | | 10,235 | |
| Reports to shareholders | | | 10,157 | |
| Trustees’ fees and expenses | | | 6,234 | |
| Legal fees | | | 459 | |
| Interest expense (See Note 6) | | | 128 | |
| Other expenses | | | 8,206 | |
| Total expenses | | | 1,785,119 | |
| NET INVESTMENT INCOME | | $ | 665,881 | |
| | | | | |
| REALIZED AND UNREALIZED GAINS (LOSSES): | | | | |
| Net realized gain on investments | | $ | 9,119,936 | |
| Net change in unrealized appreciation on investments | | | (15,403,061 | ) |
| Net loss on investments | | | (6,283,125 | ) |
| NET DECREASE IN NET ASSETS RESULTING FROM OPERATIONS | | $ | (5,617,244 | ) |
(1) | Net of foreign taxes withheld of $1,425. |
The accompanying notes are an integral part of these financial statements.
(This Page Intentionally Left Blank.)
| HENNESSY FUNDS | 1-800-966-4354 | |
Financial Statements
| Statements of Changes in Net Assets |
| | | Six Months Ended | | | | |
| | | April 30, 2016 | | | Year Ended | |
| | | (Unaudited) | | | October 31, 2015 | |
| OPERATIONS: | | | | | | |
| Net investment income | | $ | 665,881 | | | $ | 408,940 | |
| Net realized gain on investments | | | 9,119,936 | | | | 18,278,191 | |
| Net change in unrealized appreciation (depreciation) | | | | | | | | |
| on investments | | | (15,403,061 | ) | | | 8,241,257 | |
| Net increase (decrease) in net assets resulting from operations | | | (5,617,244 | ) | | | 26,928,388 | |
| | | | | | | | | |
| DISTRIBUTIONS TO SHAREHOLDERS FROM: | | | | | | | | |
| Net investment income | | | | | | | | |
| Investor Class | | | (267,832 | ) | | | — | |
| Institutional Class | | | (92,618 | ) | | | — | |
| Net realized gains | | | | | | | | |
| Investor Class | | | (15,913,393 | ) | | | (25,724,771 | ) |
| Institutional Class | | | (2,010,713 | ) | | | (5,914,515 | ) |
| Total distributions | | | (18,284,556 | ) | | | (31,639,286 | ) |
| | | | | | | | | |
| CAPITAL SHARE TRANSACTIONS: | | | | | | | | |
| Proceeds from shares subscribed – Investor Class | | | 36,154,872 | | | | 54,313,216 | |
| Proceeds from shares subscribed – Institutional Class | | | 8,312,992 | | | | 13,953,486 | |
| Dividends reinvested – Investor Class | | | 15,949,973 | | | | 25,337,010 | |
| Dividends reinvested – Institutional Class | | | 1,873,063 | | | | 3,720,941 | |
| Cost of shares redeemed – Investor Class | | | (62,628,384 | ) | | | (53,885,643 | ) |
| Cost of shares redeemed – Institutional Class | | | (14,244,289 | ) | | | (29,606,425 | ) |
| Net increase (decrease) in net assets derived | | | | | | | | |
| from capital share transactions | | | (14,581,773 | ) | | | 13,832,585 | |
| TOTAL INCREASE (DECREASE) IN NET ASSETS | | | (38,483,573 | ) | | | 9,121,687 | |
| | | | | | | | | |
| NET ASSETS: | | | | | | | | |
| Beginning of period | | | 244,446,357 | | | | 235,324,670 | |
| End of period | | $ | 205,962,784 | | | $ | 244,446,357 | |
| Undistributed net investment income, end of period | | $ | 305,431 | | | $ | — | |
The accompanying notes are an integral part of these financial statements.
| Statements of Changes in Net Assets – Continued |
| | | Six Months Ended | | | | |
| | | April 30, 2016 | | | Year Ended | |
| | | (Unaudited) | | | October 31, 2015 | |
| CHANGES IN SHARES OUTSTANDING: | | | | | | |
| Shares sold – Investor Class | | | 1,547,642 | | | | 2,361,827 | |
| Shares sold – Institutional Class | | | 591,565 | | | | 1,012,204 | |
| Shares issued to holders as reinvestment | | | | | | | | |
| of dividends – Investor Class | | | 712,600 | | | | 1,216,371 | |
| Shares issued to holders as reinvestment | | | | | | | | |
| of dividends – Institutional Class | | | 138,300 | | | | 296,489 | |
| Shares redeemed – Investor Class | | | (2,955,672 | ) | | | (2,404,812 | ) |
| Shares redeemed – Institutional Class | | | (1,113,110 | ) | | | (2,412,721 | ) |
| Net increase (decrease) in shares outstanding | | | (1,078,675 | ) | | | 69,358 | |
The accompanying notes are an integral part of these financial statements.
| HENNESSY FUNDS | 1-800-966-4354 | |
Financial Statements
For an Investor Class share outstanding throughout each period
| | | Six Months Ended | |
| | | April 30, 2016 | |
| | | (Unaudited) | |
| PER SHARE DATA: | | | |
| Net asset value, beginning of period | | $ | 23.81 | |
| | | | | |
| Income (loss) from investment operations: | | | | |
| Net investment income (loss) | | | 0.06 | |
| Net realized and unrealized gains (losses) on investments | | | (0.19 | ) |
| Total from investment operations | | | (0.13 | ) |
| | | | | |
| Less distributions: | | | | |
| Dividends from net investment income | | | (0.03 | ) |
| Dividends from net realized gains | | | (1.60 | ) |
| Total distributions | | | (1.63 | ) |
| Paid-in capital from redemption fees | | | — | |
| Net asset value, end of period | | $ | 22.05 | |
| | | | | |
| TOTAL RETURN | | | (0.64 | )%(3) |
| | | | | |
| SUPPLEMENTAL DATA AND RATIOS: | | | | |
| Net assets, end of period (millions) | | $ | 187.03 | |
| Ratio of expenses to average net assets | | | 1.52 | %(4) |
| Ratio of net investment income (loss) to average net assets | | | 0.51 | %(4) |
Portfolio turnover rate(5) | | | 66 | %(3) |
(1) | Calculated based on average shares outstanding method. |
(2) | Amount is less than $0.01. |
(3) | Not annualized. |
(4) | Annualized. |
(5) | Portfolio turnover is calculated on the basis of the Fund as a whole. |
The accompanying notes are an integral part of these financial statements.
| Year Ended October 31, | |
| 2015 | | | 2014 | | | 2013 | | | 2012 | | | 2011 | |
| | | | | | | | | | | | | | |
| $ | 24.13 | | | $ | 25.40 | | | $ | 19.54 | | | $ | 16.48 | | | $ | 18.11 | |
| | | | | | | | | | | | | | | | | | | |
| | | | | | | | | | | | | | | | | | | |
| | 0.03 | (1) | | | (0.10 | ) | | | 0.10 | | | | 0.11 | | | | 0.21 | (1) |
| | 2.99 | | | | 0.49 | | | | 5.88 | | | | 3.24 | | | | (1.66 | ) |
| | 3.02 | | | | 0.39 | | | | 5.98 | | | | 3.35 | | | | (1.45 | ) |
| | | | | | | | | | | | | | | | | | | |
| | | | | | | | | | | | | | | | | | | |
| | — | | | | (0.06 | ) | | | (0.12 | ) | | | (0.29 | ) | | | (0.06 | ) |
| | (3.34 | ) | | | (1.60 | ) | | | — | | | | — | | | | (0.13 | ) |
| | (3.34 | ) | | | (1.66 | ) | | | (0.12 | ) | | | (0.29 | ) | | | (0.19 | ) |
| | — | | | | 0.00 | (2) | | | 0.00 | (2) | | | 0.00 | (2) | | | 0.01 | |
| $ | 23.81 | | | $ | 24.13 | | | $ | 25.40 | | | $ | 19.54 | | | $ | 16.48 | |
| | | | | | | | | | | | | | | | | | | |
| | 14.51 | % | | | 1.40 | % | | | 30.80 | % | | | 20.65 | % | | | (8.12 | )% |
| | | | | | | | | | | | | | | | | | | |
| | | | | | | | | | | | | | | | | | | |
| $ | 218.50 | | | $ | 193.09 | | | $ | 243.42 | | | $ | 167.20 | | | $ | 154.21 | |
| | 1.50 | % | | | 1.44 | % | | | 1.46 | % | | | 1.45 | % | | | 1.52 | % |
| | 0.17 | % | | | (0.36 | )% | | | 0.48 | % | | | 0.56 | % | | | 0.81 | % |
| | 49 | % | | | 47 | % | | | 57 | % | | | 43 | % | | | 70 | % |
The accompanying notes are an integral part of these financial statements.
| HENNESSY FUNDS | 1-800-966-4354 | |
Financial Statements
For an Institutional Class share outstanding throughout each period
| | | Six Months Ended | |
| | | April 30, 2016 | |
| | | (Unaudited) | |
| PER SHARE DATA: | | | |
| Net asset value, beginning of period | | $ | 14.39 | |
| | | | | |
| Income (loss) from investment operations: | | | | |
| Net investment income (loss) | | | 0.06 | |
| Net realized and unrealized gains (losses) on investments | | | (0.11 | ) |
| Total from investment operations | | | (0.05 | ) |
| | | | | |
| Less distributions: | | | | |
| Dividends from net investment income | | | (0.04 | ) |
| Dividends from net realized gains | | | (0.96 | ) |
| Total distributions | | | (1.00 | ) |
| Net asset value, end of period | | $ | 13.34 | |
| | | | | |
| TOTAL RETURN | | | (0.43 | )%(2) |
| | | | | |
| SUPPLEMENTAL DATA AND RATIOS: | | | | |
| Net assets, end of period (millions) | | $ | 18.93 | |
| Ratio of expenses to average net assets | | | 1.14 | %(3) |
| Ratio of net investment income (loss) to average net assets | | | 0.89 | %(3) |
Portfolio turnover rate(4) | | | 66 | %(2) |
(1) | Calculated based on average shares outstanding method. |
(2) | Not annualized. |
(3) | Annualized. |
(4) | Portfolio turnover is calculated on the basis of the Fund as a whole. |
The accompanying notes are an integral part of these financial statements.
| Year Ended October 31, | |
| 2015 | | | 2014 | | | 2013 | | | 2012 | | | 2011 | |
| | | | | | | | | | | | | | |
| $ | 14.53 | | | $ | 15.96 | | | $ | 12.34 | | | $ | 10.55 | | | $ | 11.70 | |
| | | | | | | | | | | | | | | | | | | |
| | | | | | | | | | | | | | | | | | | |
| | 0.06 | (1) | | | (0.09 | ) | | | 0.14 | | | | 0.16 | | | | 0.19 | (1) |
| | 1.81 | | | | 0.40 | | | | 3.66 | | | | 1.98 | | | | (1.09 | ) |
| | 1.87 | | | | 0.31 | | | | 3.80 | | | | 2.14 | | | | (0.90 | ) |
| | | | | | | | | | | | | | | | | | | |
| | | | | | | | | | | | | | | | | | | |
| | — | | | | (0.14 | ) | | | (0.18 | ) | | | (0.35 | ) | | | (0.12 | ) |
| | (2.01 | ) | | | (1.60 | ) | | | — | | | | — | | | | (0.13 | ) |
| | (2.01 | ) | | | (1.74 | ) | | | (0.18 | ) | | | 0.35 | | | | (0.25 | ) |
| $ | 14.39 | | | $ | 14.53 | | | $ | 15.96 | | | $ | 12.34 | | | $ | 10.55 | |
| | | | | | | | | | | | | | | | | | | |
| | 14.91 | % | | | 1.70 | % | | | 31.18 | % | | | 20.95 | % | | | (8.00 | )% |
| | | | | | | | | | | | | | | | | | | |
| | | | | | | | | | | | | | | | | | | |
| $ | 25.94 | | | $ | 42.23 | | | $ | 68.80 | | | $ | 43.79 | | | $ | 19.89 | |
| | 1.17 | % | | | 1.12 | % | | | 1.15 | % | | | 1.25 | % | | | 1.34 | % |
| | 0.48 | % | | | (0.04 | )% | | | 0.74 | % | | | 0.72 | % | | | 1.00 | % |
| | 49 | % | | | 47 | % | | | 57 | % | | | 43 | % | | | 70 | % |
The accompanying notes are an integral part of these financial statements.
| HENNESSY FUNDS | 1-800-966-4354 | |
Financial Statements
Notes to the Financial Statements April 30, 2016 (Unaudited) |
1). ORGANIZATION
The Hennessy Small Cap Financial Fund (the “Fund”) is a series of Hennessy Funds Trust (the “Trust”), which was organized as a Delaware statutory trust on September 17, 1992. The Fund is an open-end management investment company registered under the Investment Company Act of 1940, as amended. The Fund is a successor to the FBR Small Cap Financial Fund (the “Predecessor FBR Fund”), a series of The FBR Funds, a Delaware statutory trust, pursuant to a reorganization that took place after the close of business on October 26, 2012. Prior to October 26, 2012, the Fund had no investment operations. As a result of the reorganization, holders of the Investor Class shares of the Predecessor FBR Fund received Investor Class shares of the Fund (the Investor Class shares of the Fund are the successor to the accounting and performance information of the Predecessor FBR Fund), and holders of the Institutional Class shares of the Predecessor FBR Fund received Institutional Class shares of the Fund (the Institutional Class shares of the Fund are the successor to the accounting and performance information of the Predecessor FBR Fund). The investment objective of the Fund is capital appreciation. The Fund is a non-diversified fund.
The Fund offers Investor Class and Institutional Class shares. Each class of shares differs principally in its respective administration, 12b-1 distribution and service, shareholder servicing, and transfer agent expenses and sales charges, if any. Each class has identical rights to earnings, assets, and voting privileges, except for class-specific expenses and exclusive rights to vote on matters affecting only an individual class.
As an investment company, the Fund follows the investment company accounting and reporting guidance of the Financial Accounting Standards Board (“FASB”) Accounting Standard Codification Topic 946 “Financial Services—Investment Companies.”
2). SIGNIFICANT ACCOUNTING POLICIES
The following is a summary of significant accounting policies consistently followed by the Fund in the preparation of the financial statements. These policies are in conformity with U.S. generally accepted accounting principles (“GAAP”).
| a). | Investment Valuation – All investments in securities are recorded at their estimated fair value, as described in Note 3. |
| b). | Federal Income Taxes – Provision for federal income taxes or excise taxes has not been made since the Fund has elected to be taxed as a “regulated investment company” and intends to distribute substantially all of its taxable income to its shareholders and otherwise comply with the provisions of the Internal Revenue Code of 1986, as amended, applicable to regulated investment companies. Net investment income or loss and realized gains and losses for federal income tax purposes may differ from that reported on the financial statements because of temporary book and tax basis differences. Temporary differences are primarily the result of the treatment of wash sales for tax reporting purposes. The Fund recognizes interest and penalties related to income tax benefits, if any, in the statement of operations as an income tax expense. Distributions from net realized gains for book purposes may include short-term capital gains, which are included as ordinary income to shareholders for tax purposes. |
| c). | Income and Expenses – Dividend income is recognized on the ex-dividend date or as soon as information is available to the Fund. Interest income, which includes the amortization of premium and accretion of discount, is recognized on an accrual basis. The Fund is charged for those expenses that are directly attributable to the portfolio, such as advisory, administration, and certain shareholder service fees. Income, expenses (other than expenses attributable to a specific class), and realized and unrealized gains or losses on investments are allocated to each class of shares based on its respective net assets. |
| d). | Distributions to Shareholders – Dividends from net investment income for the Fund, if any, are declared and paid annually, usually in December. Distributions of net realized capital gains, if any, are declared and paid annually, usually in December. |
| e). | Security Transactions – Investment and shareholder transactions are recorded on the trade date. The Fund determines the gain or loss realized from the investment transactions by comparing the original cost of the security lot sold with the net sale proceeds. Discounts and premiums on securities purchased are accreted/amortized over the life of the respective security. |
| f). | Use of Estimates – The preparation of financial statements in conformity with GAAP requires management to make estimates and assumptions that affect the reported amounts of assets and liabilities and disclosure of contingent assets and liabilities at the date of the financial statements and the reported change in net assets during the reporting period. Actual results could differ from those estimates. |
| g). | Share Valuation – The net asset value (“NAV”) per share of the Fund is calculated by dividing the sum of the value of the securities held by the Fund, plus cash or other assets, minus all liabilities (including estimated accrued expenses) by the total number of shares outstanding for the Fund, rounded to the nearest cent. The Fund’s shares will not be priced on days the New York Stock Exchange is closed for trading. The offering and redemption price per share for the Fund is equal to the Fund’s NAV per share. |
| h). | Foreign Currency – Values of investments denominated in foreign currencies, if any, are converted into U.S. dollars using the spot market rate of exchange at the time of valuation. Purchases and sales of investments and income are translated into U.S. dollars using the spot market rate of exchange prevailing on the respective dates of such transactions. The Fund does not isolate the portion of the results of operations resulting from fluctuations in foreign exchange rates on investments from fluctuations resulting from changes in the market prices of securities held. Such fluctuations are included with the net realized and unrealized gain or loss on investments. Foreign investments present additional risks due to currency fluctuations, economic and political factors, lower liquidity, government regulations, differences in accounting standards, and other factors. |
| i). | Forward Contracts – The Fund may enter into forward currency contracts to reduce its exposure to changes in foreign currency exchange rates on its foreign holdings and to lock in the U.S. dollar cost of firm purchase and sale commitments for securities denominated in foreign currencies. A forward currency contract is a commitment to purchase or sell a foreign currency at a future date at a negotiated forward rate. The gain or loss arising from the difference between the U.S. dollar cost of the original contract and the value of the foreign currency in U.S. dollars upon closing of such contract is included in net realized gain or loss from foreign currency transactions. During the six months ended April 30, 2016, the Fund did not enter into any forward contracts. |
| HENNESSY FUNDS | 1-800-966-4354 | |
| j). | Repurchase Agreements – The Fund may enter into repurchase agreements with member banks or security dealers of the Federal Reserve Board whom the investment advisor deems creditworthy. The repurchase price generally equals the price paid by the Fund plus interest negotiated on the basis of current short-term rates. |
| | Securities pledged as collateral for repurchase agreements are held by the custodian bank until the respective agreements mature. Provisions of the repurchase agreements ensure that the market value of the collateral, including accrued interest thereon, is sufficient to cover the repurchase amount in the event of default of the counterparty. If the counterparty defaults and the value of the collateral declines or if the counterparty enters an insolvency proceeding, realization of the collateral by the Fund may be delayed or limited. |
| k). | Accounting for Uncertainty in Income Taxes – The Fund has accounting policies regarding recognition and measurement of tax positions taken or expected to be taken on a tax return. The tax returns of the Fund for the prior three fiscal years are open for examination. The Fund has reviewed all open tax years in major jurisdictions and concluded that there is no impact on the Fund’s net assets and no tax liability resulting from unrecognized tax benefits relating to uncertain income tax positions taken or expected to be taken on a tax return. The Fund’s major tax jurisdictions are U.S. federal and Delaware. |
| l). | Derivatives – The Fund may invest in, or enter into, derivatives, such as options, futures contracts, options on futures contracts, and swaps, for a variety of reasons, including to hedge certain risks, to provide a substitute for purchasing or selling particular securities, or to increase potential income gain. Derivatives are financial contracts based on an underlying or notional amount, require no initial investment or an initial net investment that is smaller than would normally be required to have a similar response to changes in market factors, and require or permit net settlement. Derivatives may allow the Fund to increase or decrease the level of risk to which the Fund is exposed more quickly and efficiently than transactions in other types of instruments. The main purpose of utilizing derivative instruments is for hedging purposes. |
| | The Fund follows the financial accounting reporting rules as required by the Derivatives and Hedging Topic of the FASB Accounting Standards Codification. Under such rules, the Fund is required to include enhanced disclosure that enables investors to understand how and why an entity uses derivatives, how derivatives are accounted for, and how derivatives instruments affect an entity’s results of operations and financial position. During the six months ended April 30, 2016, the Fund did not hold any derivative instruments. |
| m). | New Accounting Pronouncements – In May 2015, the FASB issued ASU No. 2015-07 “Disclosure for Investments in Certain Entities that Calculate Net Asset Value per Share (or Its Equivalent).” The amendments in ASU No. 2015-07 remove the requirement to categorize within the fair value hierarchy investments measured at NAV and require the disclosure of sufficient information to reconcile the fair value of the remaining assets categorized within the fair value hierarchy to the financial statements. The amendments in ASU No. 2015-07 are effective for fiscal years beginning after December 15, 2015, and interim periods within those fiscal years. Management has reviewed the requirements and believes the adoption of ASU 2015-07 will not have a material impact on the Fund’s financial statements and related disclosures. |
3). SECURITIES VALUATION
The Fund follows authoritative fair valuation accounting standards that establish an authoritative definition of fair value and set out a hierarchy for measuring fair value. These standards require additional disclosures about the various inputs and valuation techniques used to develop the measurements of fair value and a discussion in changes in valuation techniques and related inputs during the period. These inputs are summarized in the three broad levels listed below:
| | Level 1 – | Unadjusted, quoted prices in active markets for identical instruments that the Fund has the ability to access at the date of measurement. |
| | Level 2 – | Other significant observable inputs (including, but not limited to, quoted prices in active markets for similar instruments, quoted prices in markets that are not active for identical or similar instruments, and model-derived valuations in which all significant inputs and significant value drivers are observable in active markets (such as interest rates, prepayment speeds, credit risk curves, default rates, and similar data)). |
| | Level 3 – | Significant unobservable inputs (including the Fund’s own assumptions about what market participants would use to price the asset or liability based on the best available information) when observable inputs are unavailable. |
Following is a description of the valuation techniques applied to the Fund’s major categories of assets and liabilities measured at fair value on a recurring basis.
Equity Securities – Equity securities, including common stocks, preferred stocks, foreign-issued common stocks, exchange-traded funds, closed-end mutual funds, partnerships, rights, and real estate investment trusts, that are traded on a securities exchange for which a last-quoted sales price is readily available will generally be valued at the last sales price as reported by the primary exchange on which the securities are listed. Securities listed on The NASDAQ Stock Market (“NASDAQ”) will generally be valued at the NASDAQ Official Closing Price, which may differ from the last sales price reported. Securities traded on a securities exchange for which a last-quoted sales price is not readily available will generally be valued at the mean between the bid and ask prices. To the extent these securities are actively traded and valuation adjustments are not applied, they are classified in Level 1 of the fair value hierarchy. Securities traded on foreign exchanges generally are not valued at the same time the Fund calculates its NAV because most foreign markets close well before such time. The earlier close of most foreign markets gives rise to the possibility that significant events, including broad market moves, may have occurred in the interim. In certain circumstances, it may be determined that a security needs to be fair valued because it appears that the value of the security might have been materially affected by events occurring after the close of the market in which the security is principally traded, but before the time the Fund calculates its NAV, such as by a development that affects an entire market or region (e.g., weather-related events) or a potentially global development (e.g., a terrorist attack that may be expected to have an effect on investor expectations worldwide).
Registered Investment Companies – Investments in registered investment companies (e.g., mutual funds) are generally priced at the ending NAV provided by the applicable registered investment company’s service agent and will be classified in Level 1 of the fair value hierarchy.
Debt Securities – Debt securities, including corporate bonds, asset-backed securities, mortgage-backed securities, municipal bonds, U.S. Treasuries, and U.S. government agency issues, are generally valued at market on the basis of valuations furnished by an
| HENNESSY FUNDS | 1-800-966-4354 | |
independent pricing service that utilizes both dealer-supplied valuations and formula-based techniques. The pricing service may consider recently executed transactions in securities of the issuer or comparable issuers, market price quotations (where observable), bond spreads, and fundamental data relating to the issuer. In addition, the model may incorporate observable market data, such as reported sales of similar securities, broker quotes, yields, bids, offers, and reference data. Certain securities are valued primarily using dealer quotations. These securities are generally classified in Level 2 of the fair value hierarchy.
Short-Term Securities – Short-term equity investments, including money market funds, are valued in the manner specified above. Short-term debt investments with an original term to maturity of 60 days or less are valued at amortized cost, which approximates fair market value. If the original term to maturity of a short-term debt investment exceeded 60 days, then the values as of the 61st day prior to maturity are amortized. Amortized cost is not used if its use would be inappropriate due to credit or other impairments of the issuer, in which case the security’s fair value would be determined, as described below. Short-term securities are generally classified in Level 1 or Level 2 of the fair market hierarchy depending on the inputs used and market activity levels for specific securities.
The Board of Trustees of the Fund (the “Board”) has adopted fair value pricing procedures that are followed when a price for a security is not readily available or if a significant event has occurred that indicates the closing price of a security no longer represents the true value of that security. Fair value pricing determinations are made in good faith in accordance with these procedures. There are numerous criteria that will be given consideration in determining a fair value of a security, such as the trading volume of a security and markets, the value of other like securities, and news events with direct bearing to a security or markets. Fair value pricing results in an estimated price for a security that reflects the amount the Fund might reasonably expect to receive in a current sale. Depending on the relative significance of the valuation inputs, these securities may be classified in either Level 2 or Level 3 of the fair value hierarchy.
The fair valuation of foreign securities may be determined with the assistance of a pricing service using correlations between the movement of prices of such securities and indices of domestic securities and other appropriate indicators, such as closing market prices of relevant American Depositary Receipts or futures contracts. The effect of using fair value pricing is that the Fund’s NAV will reflect the affected portfolio securities’ value as determined by the Board or its designee instead of being determined by the market. Using a fair value pricing methodology to price foreign securities may result in a value that is different from a foreign security’s most recent closing price and from the prices used by other investment companies to calculate their NAVs and are generally considered Level 2 prices in the fair valuation hierarchy. Because the Fund may invest in foreign securities, the value of the Fund’s portfolio securities may change on days when you will not be able to purchase or redeem your shares.
The Board has delegated day-to-day valuation matters to a Valuation Committee comprised of one or more representatives from Hennessy Advisors, Inc., the Fund’s investment advisor. The function of the Valuation Committee is to value securities where current and reliable market quotations are not readily available. All actions taken by the Valuation Committee are reviewed by the Board.
The Fund has performed an analysis of all existing investments to determine the significance and character of all inputs to their fair value determination. Various inputs are used in determining the value of the Fund’s investments. The inputs or methodology used for valuing securities are not necessarily an indication of the risk associated with
investing in those securities. Details related to the fair valuation hierarchy of the Fund’s securities as of April 30, 2016, are included in the Fund’s Schedule of Investments.
4). INVESTMENT TRANSACTIONS
Purchases and sales of investment securities (excluding government and short-term investments) for the Fund during the six months ended April 30, 2016, were $65,770,608 and $96,331,490, respectively.
There were no purchases or sales/maturities of long-term U.S. government securities for the Fund during the six months ended April 30, 2016.
5). INVESTMENT MANAGEMENT FEE AND OTHER TRANSACTIONS WITH AFFILIATES
Hennessy Advisors, Inc. (the “Advisor”) is the investment advisor of the Fund. The Advisor provides the Fund with investment management services under an Investment Advisory Agreement. The Advisor furnishes all investment advice, office space, facilities, and provides most of the personnel needed by the Fund. As compensation for its services, the Advisor is entitled to a monthly fee from the Fund. The fee is based upon the average daily net assets of the Fund at the annual rate of 0.90%. The net investment advisory fees payable by the Fund as of April 30, 2016, were $156,827.
In the past, the Advisor had contractually agreed to limit the total annual operating expenses of the Fund to 1.95% and 1.70% of the Fund’s net assets for the Investor Class shares and Institutional Class shares of the Fund, respectively (excluding interest, taxes, brokerage commissions, dividend expenses, acquired fund fees and expenses, extraordinary legal expenses, or any other extraordinary expenses and, from and after November 1, 2014, 12b-1 fees). The expense limitation agreement for the Fund expired as of February 28, 2015.
For a period of three years after the year in which the Advisor waived or reimbursed expenses, the Advisor may seek reimbursement from the Fund to the extent that total annual fund operating expenses are less than the expense limitation that was in effect at the time the Advisor waived or reimbursed expenses. During the three years ended October 31, 2015, no expenses were waived or reimbursed by the Advisor and therefore no expenses are subject to potential recovery.
The Board has approved a Shareholder Servicing Agreement for the Investor Class shares of the Fund, effective as of February 28, 2015, which was instituted to compensate the Advisor for the non-investment management services it provides to the Fund. The Shareholder Servicing Agreement provides for a monthly fee paid to the Advisor at an annual rate of 0.10% of the average daily net assets of the Fund attributable to Investor Class shares. Shareholder service fees payable by the Fund as of April 30, 2016, were $15,665.
The Fund has adopted a plan pursuant to Rule 12b-1 under the Investment Company Act of 1940, as amended, that authorizes payments in connection with the distribution of the Fund’s shares at an annual rate of up to 0.25% of the Fund’s average daily net assets attributable to Investor Class shares. Even though the authorized rate is up to 0.25%, the Fund has only used up to 0.15% of its average daily net assets attributable to Investor Class shares for such purpose since March 1, 2015. Amounts paid under the plan may be spent on any activities or expenses primarily intended to result in the sale of shares, including, but not limited to, advertising, shareholder account servicing, the printing and mailing of prospectuses to other than current shareholders, the printing and mailing of sales literature, and compensation for sales and marketing activities or to financial institutions and others, such as dealers and distributors.
| HENNESSY FUNDS | 1-800-966-4354 | |
The Fund has entered into agreements with various brokers, dealers, and financial intermediaries in connection with the sale of shares of the Fund. The agreements provide for periodic payments by the Fund to the brokers, dealers, and financial intermediaries for providing certain shareholder maintenance services (sub-transfer agent expenses). These shareholder services include the pre-processing and quality control of new accounts, shareholder correspondence, answering customer inquiries regarding account status, and facilitating shareholder telephone transactions. Fees paid by the Fund to various brokers, dealers, and financial intermediaries during the six months ended April 30, 2016, were $247,988.
U.S. Bancorp Fund Services, LLC (“USBFS”) provides the Fund with administrative, fund accounting, and transfer agent services, and necessary office equipment. As administrator, USBFS is responsible for activities such as (i) preparing various federal and state regulatory filings, reports, and returns for the Fund, (ii) preparing reports and materials to be supplied to the Board, (iii) monitoring the activities of the Fund’s custodian, transfer agent, and accountants, and (iv) coordinating the preparation and payment of the Fund’s expenses and reviewing the Fund’s expense accruals. Fees paid to USBFS during the six months ended April 30, 2016, were $118,296.
U.S. Bank, N.A., an affiliate of USBFS, serves as the Fund’s custodian. Quasar Distributors, LLC acts as the Fund’s principal underwriter in a continuous public offering of the Fund’s shares. Quasar Distributors, LLC is an affiliate of USBFS and U.S. Bank, N.A.
6). LINE OF CREDIT
The Fund has an uncommitted line of credit with the other funds in the Hennessy Funds family of funds (the “Hennessy Funds”) in the amount of the lesser of (i) $100,000,000 or (ii) 33.33% of each Hennessy Fund’s net assets, or 30% for the Hennessy Gas Utility Fund and 10% for the Hennessy Balanced Fund, intended to provide short-term financing, if necessary, subject to certain restrictions, in connection with shareholder redemptions. The credit facility is with the Hennessy Funds’ custodian bank, U.S. Bank, N.A. Borrowings under this arrangement bear interest at the bank’s prime rate and are secured by all of the Fund’s assets (as to its own borrowings only). During the six months ended April 30, 2016, the Fund did not have any borrowings outstanding under the line of credit.
7). FEDERAL TAX INFORMATION
As of October 31, 2015, the Fund’s most recent fiscal year end, the components of accumulated earnings (losses) for income tax purposes were as follows:
| Cost of investments for tax purposes | | $ | 203,653,547 | |
| Gross tax unrealized appreciation | | $ | 44,784,928 | |
| Gross tax unrealized depreciation | | | (1,108,972 | ) |
| Net tax unrealized appreciation | | $ | 43,675,956 | |
| Undistributed ordinary income | | $ | 1,736,875 | |
| Undistributed long-term capital gains | | | 15,813,323 | |
| Total distributable earnings | | $ | 17,550,198 | |
| Other accumulated loss | | $ | — | |
| Total accumulated gain | | $ | 61,226,154 | |
The difference between book-basis unrealized appreciation/depreciation (as shown in the Statement of Assets and Liabilities) and tax-basis unrealized appreciation/depreciation (as shown above) is attributable primarily to wash sales.
At October 31, 2015, the Fund’s most recent fiscal year end, the Fund had no tax basis capital losses to offset future capital gains.
At October 31, 2015, the Fund’s most recent fiscal year end, the Fund did not defer, on a tax basis, any late year ordinary losses.
The tax character of distributions paid during fiscal year 2016 (year to date) and fiscal year 2015 for the Fund were as follows:
| | | Six Months Ended | | | Year Ended | |
| | | April 30, 2016 | | | October 31, 2015 | |
| Ordinary income | | $ | 2,097,406 | | | $ | — | |
| Long-term capital gain | | | 16,187,150 | | | | 31,639,286 | |
| | | $ | 18,284,556 | | | $ | 31,639,286 | |
| HENNESSY FUNDS | 1-800-966-4354 | |
Expense Example (Unaudited)
April 30, 2016
As a shareholder of the Fund, you incur two types of costs: (1) transaction costs, including sales charges (loads) on purchase payments, reinvested dividends, or other distributions; redemption fees; and exchange fees; and (2) ongoing costs, including management fees; service fees; and other Fund expenses. This Example is intended to help you understand your ongoing costs (in dollars) of investing in the Fund and to compare these costs with the ongoing costs of investing in other mutual funds. The Example is based on an investment of $1,000 invested at the beginning of the period and held for the entire period from November 1, 2015 through April 30, 2016.
Actual Expenses
The first line of the table below under the “Investor Class” and “Institutional Class” headings provides information about actual account values and actual expenses. Although the Fund charges no sales loads or transaction fees, you will be assessed fees for outgoing wire transfers, returned checks and stop payment orders at prevailing rates charged by U.S. Bancorp Fund Services, LLC, the Fund’s transfer agent. If you request that a redemption be made by wire transfer, currently a $15.00 fee is charged by the Fund’s transfer agent. IRA accounts will be charged a $15.00 annual maintenance fee. The example below includes, but is not limited to, management fees, shareholder servicing fees, fund accounting, custody, and transfer agent fees. However, the example below does not include portfolio trading commissions and related expenses, and other extraordinary expenses as determined under generally accepted accounting principles. You may use the information in this line, together with the amount you invested, to estimate the expenses that you paid over the period. Simply divide your account value by $1,000 (for example, an $8,600 account value divided by $1,000 = 8.6), then multiply the result by the number in the first line of the table under the “Investor Class” and “Institutional Class” headings in the column entitled “Expenses Paid During Period” to estimate the expenses you paid on your account during this period.
Hypothetical Example for Comparison Purposes
The second line of the table below under the “Investor Class” and “Institutional Class” headings provides information about hypothetical account values and hypothetical expenses based on the Fund’s actual expense ratios and an assumed rate of return of 5% per year before expenses, which is not the Fund’s actual return. The hypothetical account values and expenses may not be used to estimate the actual ending account balance or expenses you paid for the period. You may use this information to compare the ongoing costs of investing in the Fund and other funds. To do so, compare this 5% hypothetical example with the 5% hypothetical examples that appear in the shareholder reports of the other funds. Please note that the expenses shown in the table are meant to highlight your ongoing costs only and do not reflect any transactional costs, such as sales charges (loads), or exchange fees. Therefore, the second line of the table under the “Investor Class” and “Institutional Class” headings is useful in comparing ongoing costs only, and will not help you determine the relative total costs of owning different funds. In addition, if these transactional costs were included, your costs would have been higher.
| | | | Expenses Paid |
| | Beginning | Ending | During Period(1) |
| | Account Value | Account Value | November 1, 2015 – |
| | November 1, 2015 | April 30, 2016 | April 30, 2016 |
| Investor Class | | | |
| Actual | $1,000.00 | $ 993.60 | $7.53 |
| Hypothetical (5% return before expenses) | $1,000.00 | $1,017.30 | $7.62 |
| | | | |
| Institutional Class | | | |
| Actual | $1,000.00 | $ 995.00 | $5.65 |
| Hypothetical (5% return before expenses) | $1,000.00 | $1,019.19 | $5.72 |
(1) | Expenses are equal to the Fund’s annualized expense ratio of 1.52% for Investor Class shares or 1.14% for Institutional Class shares, as applicable, multiplied by the average account value over the period, multiplied by 182/366 days (to reflect one-half year period). |
| HENNESSY FUNDS | 1-800-966-4354 | |
How to Obtain a Copy of the Fund’s
Proxy Voting Policy and Proxy Voting Records
A description of the policies and procedures the Fund uses to determine how to vote proxies relating to portfolio securities is available without charge: (1) by calling 1-800-966-4354; (2) on the Hennessy Funds’ website at hennessyfunds.com/proxy-voting/policy.fs; or (3) on the U.S. Securities and Exchange Commission’s website at www.sec.gov. The Fund’s proxy voting record is available without charge on both the Hennessy Funds’ website at hennessyfunds.com/proxy-voting/policy.fs and the SEC’s website at www.sec.gov no later than August 31 for the prior 12 months ending June 30.
Quarterly Filings on Form N-Q
The Fund files its complete schedule of portfolio holdings with the SEC for the first and third quarters of each fiscal year on Form N-Q. The Fund’s Form N-Q will be available on the SEC’s website at www.sec.gov. The Fund’s Form N-Q may be reviewed and copied at the SEC’s Public Reference Room in Washington, DC and information on the operation of the Public Reference Room may be obtained by calling 1-800-SEC-0330. Information included in the Fund’s N-Q will also be available upon request by calling 1-800-966-4354.
Householding
To help keep the Fund’s costs as low as possible, we generally deliver a single copy of most financial reports and prospectuses to shareholders who share an address, even if the accounts are registered under different names. This process, known as “householding,” does not apply to account statements. You may, of course, request an individual copy of a prospectus or financial report at any time. If you would like to receive separate mailings, please call the Administrator at 1-800-261-6950 or 1-414-765-4124 and we will begin individual delivery within 30 days of your request. If your account is held through a financial institution or other intermediary, please contact them directly to request individual delivery.
Board Approval of Investment Advisory
Agreement
At its meeting on March 9, 2016, the Board of Trustees of the Fund (the “Board,” and the members thereof, the “Trustees”) unanimously approved the continuation of the investment advisory agreement of the Fund with Hennessy Advisors, Inc. (the “Advisor”). As part of the process of approving the continuation of the advisory agreement, the Trustees reviewed their fiduciary duties with respect to approving the advisory agreement and the relevant factors for them to consider. In addition, the Trustees who are not deemed “interested persons” (as that term is defined by the Investment Company Act of 1940) of the Fund (the “Independent Trustees”) met in executive session to discuss the approval of the advisory agreement.
In advance of the meeting, the Advisor sent detailed information to the Trustees to assist them in their evaluation of the advisory agreement. This information included, but was not limited to, (i) a memorandum from outside legal counsel that described the fiduciary duties of the Board with respect to approving the continuation of the advisory agreement and the relevant factors for consideration, (ii) a memorandum from the Advisor that listed the factors relevant to the Board’s approval of the continuation of the advisory agreement and also referenced the documents that had been provided to help the Board assess each such factor, (iii) an inventory of the range of services provided by the Advisor for the Fund, (iv) a written discussion of economies of scale, (v) the advisory agreement, (vi) a recent Fund fact sheet, (vii) a peer expense comparison, (viii) performance information, (ix) the Advisor’s most recent Form 10-K and Form 10-Q, which included information about the Advisor’s profitability, (x) information about brokerage commissions, (xi) information about the Fund’s compliance program, (xii) the Advisor’s current Form ADV Part I, and (xii) other information the Trustees believed was useful in evaluating the approval of the continuation of the advisory agreement.
All of the factors discussed by the Trustees were considered as a whole, and were considered separately by the Independent Trustees, meeting in executive session. The factors were viewed in their totality by the Trustees, with no single factor being the principal or determinative factor in the Trustees’ determination of whether to approve the continuation of the advisory agreement. The Trustees recognized that the management and fee arrangements for the Fund are the result of years of review and discussion between the Independent Trustees and the Advisor, that certain aspects of such arrangements may receive greater scrutiny in some years than in others, and that the Trustees’ conclusions may be based, in part, on their consideration of these same arrangements and information received during the course of the year and in prior years.
Prior to approving the continuation of the advisory agreement, the Trustees and the Independent Trustees in executive session considered, among other items:
| | • | The nature and quality of the advisory services provided by the Advisor. |
| | • | A comparison of the fees and expenses of the Fund to other similar funds. |
| | • | Whether economies of scale are recognized by the Fund. |
| | • | The costs and profitability of the Fund to the Advisor. |
| | • | The performance of the Fund. |
| | • | The other benefits to the Advisor from serving as an investment advisor to the Fund (in addition to the advisory fee). |
| HENNESSY FUNDS | 1-800-966-4354 | |
The material considerations and determinations of the Board of Trustees, including all of the Independent Trustees, are as follows:
| | • | The Board considered the services identified below that are provided by the Advisor. Based on this review, the Trustees believe that the Advisor provides high-quality services to the Fund, and they noted that their overall confidence in the Advisor is high. The Trustees also concluded that they were satisfied with the nature, extent, and quality of the advisory services provided to the Fund by the Advisor, and that the nature and extent of the services provided by the Advisor are appropriate to assure that the Fund’s operations are conducted in compliance with applicable laws, rules, and regulations. |
| | | • | The Advisor acts as the portfolio manager for the Fund. In this capacity, the Advisor does the following: |
| | | | • | manages the composition of the Fund’s portfolio, including the purchase, retention, and disposition of portfolio securities in accordance with the Fund’s investment objectives, policies, and restrictions; |
| | | | • | ensures compliance with “best execution” for the Fund’s portfolio; |
| | | | • | manages the use of soft dollars for the Fund. |
| | | • | The Advisor performs a daily reconciliation of portfolio positions and cash for the Fund. |
| | | • | The Advisor monitors the Fund’s compliance with its investment objectives and restrictions. |
| | | • | The Advisor monitors compliance with federal securities laws and performs activities such as maintaining a compliance program, conducting ongoing reviews of the compliance programs of the Fund’s service providers, conducting on-site visits to the Fund’s service providers, monitoring incidents of abusive trading practices, reviewing Fund expense accruals, payments, and fixed expense ratios, evaluating insurance providers for fidelity bond coverage and D&O/E&O insurance coverage, conducting employee compliance training, reviewing reports provided by service providers, maintaining books and records, and preparing an annual compliance report to the Board. |
| | | • | The Advisor oversees service providers that provide accounting, administration, distribution, transfer agency, custodial, sales and marketing, public relations, audit, information technology, and legal services to the Fund. |
| | | • | The Advisor maintains in-house marketing and distribution departments on behalf of the Fund. |
| | | • | The Advisor is actively involved with preparing regulatory filings for the Fund, including writing and annually updating the Fund’s prospectus and related documents. |
| | | • | The Advisor prepares a written summary of the Fund’s performance for the most recent six-month period or twelve-month period, as applicable, for each semi-annual and annual report of the Fund. |
| | | • | The Advisor oversees distribution of the Fund through third-party broker/dealers and independent financial institutions such as Charles Schwab, Inc., Fidelity, TD Waterhouse, and Pershing. The Advisor participates in “no transaction fee” (“NTF”) programs with these companies on behalf of the Fund, which allow customers to purchase the Fund through third-party distribution |
| | | | channels without paying a transaction fee. The Advisor compensates, in part, a number of these third-party providers of NTF programs out of its own revenues. |
| | | • | The Advisor pays the incentive compensation of the Fund’s compliance officers and employs other staff, such as management executives, legal personnel, marketing personnel, national accounts and distribution personnel, sales personnel, administrative personnel, and trading oversight personnel. |
| | | • | The Advisor provides a quarterly compliance certification to the Board. |
| | | • | The Advisor prepares or reviews Board materials, frequently presents to the Board or leads Board discussions, prepares or reviews meeting minutes, and arranges for Board training and education. |
| | • | The Board compared the performance of the Fund to benchmark indices over various periods of time and they noted that at each quarterly meeting, the Trustees review reports comparing the investment performance of the Fund to various indices. Based on the information provided at the meeting and the information and quarterly discussions regarding the Fund’s investment performance, the Trustees believe that the Advisor manages the Fund in a manner that is materially consistent with its stated investment objective and style. The Trustees concluded that the performance of the Fund over various time horizons warranted the continuation of the advisory agreement. |
| | • | The Board reviewed the advisory fees and overall expense ratios of the Fund and comparable funds using data from Morningstar with respect to funds similar in asset size and investment objective to the Fund. As part of the discussion with management, the Trustees ensured that they understood and were comfortable with the criteria used to determine the mutual funds included in the Morningstar categories for purposes of the materials considered at the meeting. The Board determined that the advisory fee and overall expense ratio of the Fund falls within the range of the advisory fees and overall expense ratios of other comparable funds and concluded that they are reasonable and warranted continuation of the advisory agreement. |
| | • | The Board also considered whether economies of scale were being realized by the Advisor that should be shared with the Fund’s shareholders. The Trustees noted that many of the expenses incurred to manage the Fund are asset-based fees and thus do not result in material economies of scale being realized as the net assets of the Fund increase. For example, intermediary service fees increase as the Fund’s assets grow. The Trustees also considered the Advisor’s efforts to contain expenses, and took into account the Advisor’s significant marketing efforts to increase Fund assets. The Board noted that at current asset levels it did not appear that there were economies of scale being realized by the Advisor and concluded that it would continue to monitor economies of scale in the future as circumstances changed. |
| | • | The Board considered the profitability of the Advisor, including the impact of intermediary service fees on the Advisor’s profitability, and also considered the resources and revenues that the Advisor has put into managing and distributing the Fund. The Board then concluded that the profits of the Advisor are reasonable and not excessive when compared to profitability guidelines set forth in relevant court cases. |
| HENNESSY FUNDS | 1-800-966-4354 | |
| | • | The Board considered the high level of professionalism and knowledge of the Advisor’s employees, along with a very low level of turnover, and concluded that this was beneficial to the Fund and its shareholders. |
| | • | The Board considered other benefits to the Advisor from serving as an advisor to the Fund (in addition to the advisory fee). The Board noted that the Advisor may derive ancillary benefits from, by way of example, its association with the Fund in the form of proprietary and third-party research products and services received from broker dealers that execute portfolio trades for the Fund. The Board determined that any such products and services have been used for legitimate purposes relating to the Fund by providing assistance in the investment decision-making process. The Trustees concluded that the other benefits realized by the Advisor from its relationship with the Fund were reasonable. |
After reviewing the materials provided at the meeting and management’s presentation, as well as other information regularly provided at the Board’s quarterly meetings throughout the year regarding the quality of services provided by the Advisor, the performance of the Fund, expense information, regulatory compliance issues, trading information and related matters, and other factors deemed relevant by the Board, the Trustees, including all of the Independent Trustees, approved the continuation of the advisory agreement.
(This Page Intentionally Left Blank.)
For information, questions or assistance, please call
The Hennessy Funds
1-800-966-4354 or 1-415-899-1555
INVESTMENT ADVISOR
Hennessy Advisors, Inc.
7250 Redwood Blvd., Suite 200
Novato, California 94945
ADMINISTRATOR,
TRANSFER AGENT,
DIVIDEND PAYING AGENT &
SHAREHOLDER SERVICING AGENT
U.S. Bancorp Fund Services, LLC
P.O. Box 701
Milwaukee, Wisconsin 53201-0701
CUSTODIAN
U.S. Bank N.A.
Custody Operations
1555 North River Center Dr., Suite 302
Milwaukee, Wisconsin 53212
TRUSTEES
Neil J. Hennessy
Robert T. Doyle
J. Dennis DeSousa
Gerald P. Richardson
COUNSEL
Foley & Lardner LLP
777 East Wisconsin Avenue
Milwaukee, Wisconsin 53202-5306
INDEPENDENT REGISTERED
PUBLIC ACCOUNTING FIRM
Tait, Weller & Baker LLP
1818 Market Street, Suite 2400
Philadelphia, Pennsylvania 19103
DISTRIBUTOR
Quasar Distributors, LLC
615 East Michigan Street
Milwaukee, Wisconsin 53202
hennessyfunds.com | 1-800-966-4354
This report has been prepared for shareholders and may be distributed to
others only if preceded or accompanied by a current prospectus.
SEMI-ANNUAL REPORT
APRIL 30, 2016
HENNESSY LARGE CAP
FINANCIAL FUND
Investor Class HLFNX
Institutional Class HILFX
hennessyfunds.com | 1-800-966-4354
(This Page Intentionally Left Blank.)
Contents
| Letter to Shareholders | 2 |
| Performance Overview | 4 |
| Financial Statements | |
| Schedule of Investments | 6 |
| Statement of Assets and Liabilities | 9 |
| Statement of Operations | 10 |
| Statements of Changes in Net Assets | 11 |
| Financial Highlights | 12 |
| Notes to the Financial Statements | 15 |
| Expense Example | 22 |
| Proxy Voting | 24 |
| Quarterly Filings on Form N-Q | 24 |
| Federal Tax Distribution Information | 24 |
| Householding | 24 |
| Board Approval of Investment Advisory Agreement | 25 |
| HENNESSY FUNDS | 1-800-966-4354 | |
June 2016
Dear Hennessy Funds Shareholder:
I used to tell my kids, “What doesn’t kill you makes you stronger.” Perhaps that is not the best analogy for investing, but in the face of such roller coaster volatility in the financial markets, it seems to me that what hasn’t killed this bull market rally may just make it stronger. The financial markets brought us flat to modest returns during the six months ended April 30, 2016, with the S&P 500 Index returning 0.43% and the Dow Jones Industrial Average (DJIA) returning 1.98% during the period. These six months were marked by high volatility, the onslaught of more and more regulatory hurdles, the Fed stuck in neutral, fears about the global economy, and wild political rhetoric — all headwinds that I believe could have significantly stalled any positive moves in the market, but didn’t. Even the aggressive pull back in January showed just how skittish the market can be, and yet again the markets showed great resiliency and marched right back.
I continue to be impressed with the persistence of the bull market in U.S. equities, now in its seventh year. Many commentators believe that the U.S. economy is due for a recession, and the market is due for a downturn. However, we find ourselves comparing today’s secular market to the bull run of 1982 to 2000, which was powered by a significant increase in valuations. On March 9th of this year, I took a moment to remember how we all felt seven years ago on March 9, 2009, at the bottom of the financial crisis downturn that had wiped out trillions of dollars’ worth of U.S. equities. I explained to our investors then, and I say the same thing today, I believe that if you invest in quality companies with good fundamentals, over the long term, you should do fine.
If history is any kind of guide, then I think this bull market has some room to run. Rising markets usually fall when there is extreme optimism or euphoria. I haven’t witnessed any of that as of yet. The volatility has unnerved many, but I encourage investors to try to remain focused on investment fundamentals. Many U.S. companies continue to find ways to make a profit and build their already strong balance sheets. Unemployment is low, and wages are rising in real terms, supporting consumer confidence and consumption. With an average price-to-sales ratio of only 1.7x and a dividend yield of approximately 2.5% for the Dow, I believe U.S. equities continue to be attractive. In my opinion, there are many compelling reasons why this market can continue to climb even higher.
The next six months may be fraught with more talk about what the Fed will do, who the next President of the United States will be, and what is happening in China and around the globe. Businesses in every industry, including the asset management business, have concerns about increasing regulatory burdens, taxes, and higher healthcare costs. But, I still believe the ingenuity and perseverance of American business will find ways to endure and to thrive.
Thank you for your continued confidence and investment in our products. If you have any questions or would like to speak with us directly, please don’t hesitate to call us at (800) 966-4354.
Best regards,
Neil J. Hennessy
President and Chief Investment Officer
Past performance does not guarantee future results.
Mutual fund investing involves risk. Principal loss is possible.
Opinions expressed are those of Neil Hennessy and are subject to change, are not guaranteed and should not be considered investment advice.
Price-to-sales ratio is a tool for calculating a stock’s valuation relative to other companies. It is calculated by dividing a stock’s current price by its revenue per share. Dividend yield is calculated as the annual dividends paid by a company divided by its market price per share.
The Dow Jones Industrial Average and S&P 500 Index are unmanaged indices commonly used to measure the performance of U.S. stocks. One cannot invest directly in an index.
| HENNESSY FUNDS | 1-800-966-4354 | |
Performance Overview (Unaudited)
AVERAGE ANNUAL TOTAL RETURN FOR PERIODS ENDED APRIL 30, 2016
| | Six | One | Five | Ten |
| | Months(1) | Year | Years | Years |
| Hennessy Large Cap Financial Fund – | | | | |
| Investor Class (HLFNX) | -6.23% | -9.25% | 6.88% | 3.04% |
| Hennessy Large Cap Financial Fund – | | | | |
Institutional Class (HILFX)(2) | -6.00% | -8.87% | 6.97% | 3.08% |
Russell 1000® Financial | | | | |
| Services Index | -1.59% | 0.24% | 10.32% | 0.35% |
Russell 1000® Index | 0.22% | 0.34% | 10.81% | 6.99% |
Expense ratios: 1.58% (Investor Class); 1.20% (Institutional Class)
Performance data quoted represents past performance; past performance does not guarantee future results. The investment return and principal value of an investment will fluctuate so that an investor’s shares, when redeemed, may be worth more or less than their original cost. The performance table does not reflect the deduction of taxes that a shareholder would pay on Fund distributions or the redemption of Fund shares. Current performance of the Fund may be lower or higher than the performance quoted. Performance data current to the most recent month end may be obtained by visiting hennessyfunds.com. Performance for periods prior to October 26, 2012, is that of the FBR Large Cap Financial Fund.
The expense ratios presented are from the most recent prospectus.
(1) | Periods less than one year are not annualized. |
(2) | The inception date of the Institutional Class shares is June 15, 2015. Performance shown prior to the inception of the Institutional Class shares reflects the performance of the Investor Class shares and includes expenses that are not applicable to and are higher than those of the Institutional Class shares. |
PERFORMANCE NARRATIVE
Portfolio Managers David H. Ellison and Ryan C. Kelley
Performance:
For the six-month period ended April 30, 2016, the Investor Class of the Hennessy Large Cap Financial Fund returned -6.23%, underperforming the Russell 1000® Financial Services Index and the Russell 1000® Index, which returned -1.59% and 0.22% for the same period, respectively.
The Fund’s underperformance versus its benchmark index was principally due to the Fund’s overweight positions in diversified global banks and large brokerage firms, which performed poorly relative to other financial companies over the period. Renewed uncertainty surrounding Federal Reserve rate policy in light of softer economic signals at home and limp growth abroad, together with generally weak financial market conditions, combined to dampen the returns of the group and the market overall.
Leading contributors to Fund performance included Lincoln National Corporation, Voya Financial, Inc. and Zions Bancorporation. The Fund continues to own Lincoln National. Companies with the weakest performance contributions to the Fund included Morgan Stanley, Citigroup, Inc. and Bank of America Corporation. The Fund continues to hold all of these positions.
Portfolio Strategy:
Traditionally, the Fund tilts its investments more heavily toward regional banks, diversified global banks, and to a lesser degree, insurance companies, Real Estate Investment Trusts (REITs) and asset managers. We generally do not diversify the Fund’s investments over all the different sub-industries of the Financial sector. We seek companies with what we believe are high-quality management teams, less complicated business models and sustainable earnings growth opportunities over time. Moreover, we identify companies expected to do well in the current environment, which is characterized by low interest rates, competitive loan markets and heightened regulatory control. We are less interested in companies that appear to promise an increase in profitability when interest rates rise or loan demand and pricing become more favorable, since these industry dynamics are difficult to predict.
Investment Outlook:
We believe that the financial industry as a whole continues to recover well from the financial crisis. Larger financial companies in the U.S. are generally profitable and continue to make improvements to their operations. However, investors remain concerned about global growth, additional regulatory burdens, the negative impact on lending margins of low interest rates and the possibility of damage to credit quality as a result of the volatility in energy prices. Nevertheless, we continue to see improvement in many industry measures, including liquidity, capital, credit, reserves, book value and cost controls. As a result, profits, as measured by returns on assets and equity, have become more sustainable in our opinion, and we expect any upward movement in interest rates to improve lending and investing spreads and add to profitability.
We believe the condition of the financial system in the U.S. today is one of the best we have seen in quite some time and that the outlook for stocks in the Financial sector is bright.
Opinions expressed are those of the Portfolio Managers as of the date written and are subject to change, are not guaranteed, and should not be considered investment advice or an indication of trading intent.
The Russell 1000® Financial Services Index is an unmanaged index commonly used to measure the performance of large-capitalization financial sector stocks. The Russell 1000® Index is an unmanaged index commonly used to measure the performance of U.S. stocks. One cannot invest directly in an index.
The Fund is non-diversified, meaning it may concentrate its assets in fewer individual holdings than a diversified fund, making it more exposed to individual stock volatility than a diversified fund. Investments are focused in the financial services industry; sector funds may be subject to a higher degree of market risk. The Fund invests in medium sized companies, which may have limited liquidity and greater volatility compared to larger companies.
References to specific securities should not be considered a recommendation to buy or sell any security. Fund holdings and sector allocations are subject to change. Please refer to the Schedule of Investments included in this report for additional portfolio information.
Book value is the net asset value of a company, calculated by total assets minus liabilities. Return on assets is an indicator of how profitable a company is relative to its total assets. Return on equity shows how much profit a company generates with the money shareholders have invested. Earnings growth is not a measure of the Fund’s future performance.
| HENNESSY FUNDS | 1-800-966-4354 | |
Financial Statements
Schedule of Investments as of April 30, 2016 (Unaudited) |
HENNESSY LARGE CAP FINANCIAL FUND
(% of Net Assets)
| TOP TEN HOLDINGS (EXCLUDING CASH/CASH EQUIVALENTS) | % NET ASSETS |
| JPMorgan Chase & Co. | 4.25% |
| Synchrony Financial | 4.24% |
| Fifth Third Bancorp | 4.19% |
| Citigroup, Inc. | 4.17% |
| Bank of America Corp. | 4.12% |
| SunTrust Banks, Inc. | 4.10% |
| Wells Fargo & Co. | 4.04% |
| U.S. Bancorp | 3.96% |
| Visa, Inc., Class A | 3.95% |
| Citizens Financial Group, Inc. | 3.87% |
Note: For presentation purposes, the Fund has grouped some of the industry categories. For purposes of categorizing securities for compliance with section 8(b)(1) of the Investment Company Act of 1940, as amended, the Fund uses more specific industry classifications.
| | COMMON STOCKS – 86.39% | | Number | | | | | | % of | |
| | | | of Shares | | | Value | | | Net Assets | |
| | Financials – 67.28% | | | | | | | | | |
| | Bank of America Corp. | | | 210,000 | | | $ | 3,057,600 | | | | 4.12 | % |
| | Berkshire Hathaway, Inc., Class B (a) | | | 13,000 | | | | 1,891,240 | | | | 2.55 | % |
| | Capital One Financial Corp. | | | 27,000 | | | | 1,954,530 | | | | 2.63 | % |
| | Citigroup, Inc. | | | 67,000 | | | | 3,100,760 | | | | 4.17 | % |
| | Citizens Financial Group, Inc. | | | 126,000 | | | | 2,879,100 | | | | 3.87 | % |
| | Fifth Third Bancorp | | | 170,000 | | | | 3,112,700 | | | | 4.19 | % |
| | JPMorgan Chase & Co. | | | 50,000 | | | | 3,160,000 | | | | 4.25 | % |
| | KeyCorp | | | 174,000 | | | | 2,138,460 | | | | 2.88 | % |
| | Lincoln National Corp. | | | 45,000 | | | | 1,955,250 | | | | 2.63 | % |
| | M&T Bank Corp. | | | 14,000 | | | | 1,656,480 | | | | 2.23 | % |
| | Morgan Stanley | | | 90,000 | | | | 2,435,400 | | | | 3.28 | % |
| | New York Community Bancorp, Inc. | | | 121,000 | | | | 1,818,630 | | | | 2.45 | % |
| | Prudential Financial, Inc. | | | 15,000 | | | | 1,164,600 | | | | 1.57 | % |
| | Regions Financial Corp. | | | 250,000 | | | | 2,345,000 | | | | 3.16 | % |
| | SunTrust Banks, Inc. | | | 73,000 | | | | 3,047,020 | | | | 4.10 | % |
| | Synchrony Financial (a) | | | 103,000 | | | | 3,148,710 | | | | 4.24 | % |
| | The Goldman Sachs Group, Inc. | | | 16,000 | | | | 2,625,760 | | | | 3.53 | % |
| | The PNC Financial Services Group, Inc. | | | 29,000 | | | | 2,545,620 | | | | 3.43 | % |
| | U.S. Bancorp (c) | | | 69,000 | | | | 2,945,610 | | | | 3.96 | % |
| | Wells Fargo & Co. | | | 60,000 | | | | 2,998,800 | | | | 4.04 | % |
| | | | | | | | | 49,981,270 | | | | 67.28 | % |
| | | | | | | | | | | | | | |
| | Information Technology – 19.11% | | | | | | | | | | | | |
| | Euronet Worldwide, Inc. (a) | | | 25,000 | | | | 1,927,500 | | | | 2.59 | % |
| | First Data Corp., Class A (a) | | | 145,000 | | | | 1,651,550 | | | | 2.22 | % |
| | Global Payments, Inc. | | | 25,000 | | | | 1,804,500 | | | | 2.43 | % |
| | PayPal Holdings, Inc. (a) | | | 50,000 | | | | 1,959,000 | | | | 2.64 | % |
| | Square, Inc. (a) | | | 135,000 | | | | 2,010,150 | | | | 2.71 | % |
| | Vantiv, Inc., Class A (a) | | | 35,000 | | | | 1,908,900 | | | | 2.57 | % |
| | Visa, Inc., Class A | | | 38,000 | | | | 2,935,120 | | | | 3.95 | % |
| | | | | | | | | 14,196,720 | | | | 19.11 | % |
| | Total Common Stocks | | | | | | | | | | | | |
| | (Cost $63,130,635) | | | | | | | 64,177,990 | | | | 86.39 | % |
The accompanying notes are an integral part of these financial statements.
| HENNESSY FUNDS | 1-800-966-4354 | |
| | SHORT-TERM INVESTMENTS – 13.54% | | Number | | | | | | % of | |
| | | | of Shares | | | Value | | | Net Assets | |
| | Money Market Funds – 13.54% | | | | | | | | | |
| | Federated Government Obligations Fund, Class I, 0.21% (b) | | | 3,633,000 | | | $ | 3,633,000 | | | | 4.89 | % |
| | Federated Treasury Obligations Fund, 0.17% (b) | | | 2,790,667 | | | | 2,790,667 | | | | 3.76 | % |
| | Fidelity Government Portfolio, Institutional Class, 0.23% (b) | | | 3,633,000 | | | | 3,633,000 | | | | 4.89 | % |
| | | | | | | | | 10,056,667 | | | | 13.54 | % |
| | Total Short-Term Investments | | | | | | | | | | | | |
| | (Cost $10,056,667) | | | | | | | 10,056,667 | | | | 13.54 | % |
| | | | | | | | | | | | | | |
| | Total Investments | | | | | | | | | | | | |
| | (Cost $73,187,302) – 99.93% | | | | | | | 74,234,657 | | | | 99.93 | % |
| | | | | | | | | | | | | | |
| | Other Assets in Excess | | | | | | | | | | | | |
| | of Liabilities – 0.07% | | | | | | | 53,965 | | | | 0.07 | % |
| | | | | | | | | | | | | | |
| | TOTAL NET ASSETS – 100.00% | | | | | | $ | 74,288,622 | | | | 100.00 | % |
Percentages are stated as a percent of net assets.
| (a) | Non-income producing security. |
| (b) | The rate listed is the fund’s 7-day yield as of April 30, 2016. |
| (c) | Investment in affiliated security. Quasar Distributors, LLC, which serves as the Fund’s distributor, is a subsidiary of U.S. Bancorp. Details of transactions with this affiliated company for the period ended April 30, 2016, are as follows: |
| | Issuer | | U.S. Bancorp | | |
| | Beginning Cost | | $ | 4,466,872 | | |
| | Purchase Cost | | $ | 964,985 | | |
| | Sales Cost | | $ | (2,455,132 | ) | |
| | Ending Cost | | $ | 2,976,725 | | |
| | Dividend Income | | $ | 48,705 | | |
| | Shares | | | 69,000 | | |
| | Market Value | | $ | 2,945,610 | | |
Summary of Fair Value Exposure at April 30, 2016
The following is a summary of the inputs used to value the Fund’s net assets as of April 30, 2016 (See Note 3 in the accompanying notes to the financial statements):
| Common Stocks | | Level 1 | | | Level 2 | | | Level 3 | | | Total | |
| Financials | | $ | 49,981,270 | | | $ | — | | | $ | — | | | $ | 49,981,270 | |
| Information Technology | | | 14,196,720 | | | | — | | | | — | | | | 14,196,720 | |
| Total Common Stocks | | $ | 64,177,990 | | | $ | — | | | $ | — | | | $ | 64,177,990 | |
| Short-Term Investments | | | | | | | | | | | | | | | | |
| Money Market Funds | | $ | 10,056,667 | | | $ | — | | | $ | — | | | $ | 10,056,667 | |
| Total Short-Term Investments | | $ | 10,056,667 | | | $ | — | | | $ | — | | | $ | 10,056,667 | |
| Total Investments | | $ | 74,234,657 | | | $ | — | | | $ | — | | | $ | 74,234,657 | |
Transfers between levels are recognized at the end of the reporting period. During the six-month period ended April 30, 2016, the Fund recognized no transfers between levels.
The accompanying notes are an integral part of these financial statements.
Financial Statements
Statement of Assets and Liabilities as of April 30, 2016 (Unaudited) |
| ASSETS: | | | |
| Investments in securities, at value (cost $70,210,577) | | $ | 71,289,047 | |
| Investments in affiliated securities, at value (cost $2,976,725) | | | 2,945,610 | |
| Total Investments in securities, at value (cost $73,187,302) | | | 74,234,657 | |
| Dividends and interest receivable | | | 75,864 | |
| Receivable for fund shares sold | | | 2,032,789 | |
| Receivable for securities sold | | | 624 | |
| Prepaid expenses and other assets | | | 18,050 | |
| Total Assets | | | 76,361,984 | |
| | | | | |
| LIABILITIES: | | | | |
| Payable for securities purchased | | | 1,812,502 | |
| Payable for fund shares redeemed | | | 131,618 | |
| Payable to advisor | | | 50,783 | |
| Payable to administrator | | | 21,752 | |
| Payable to auditor | | | 10,235 | |
| Accrued distribution fees | | | 8,426 | |
| Accrued service fees | | | 5,600 | |
| Accrued interest payable | | | 1,212 | |
| Accrued trustees fees | | | 2,974 | |
| Accrued expenses and other payables | | | 28,260 | |
| Total Liabilities | | | 2,073,362 | |
| NET ASSETS | | $ | 74,288,622 | |
| | | | | |
| NET ASSETS CONSIST OF: | | | | |
| Capital stock | | $ | 75,576,965 | |
| Accumulated net investment income | | | 73,998 | |
| Accumulated net realized loss on investments | | | (2,409,696 | ) |
| Unrealized net appreciation on investments | | | 1,047,355 | |
| Total Net Assets | | $ | 74,288,622 | |
| | | | | |
| NET ASSETS | | | | |
| Investor Class: | | | | |
| Shares authorized (no par value) | | Unlimited | |
| Net assets applicable to outstanding Investor Class shares | | $ | 73,752,303 | |
| Shares issued and outstanding | | | 4,721,621 | |
| Net asset value, offering price and redemption price per share | | $ | 15.62 | |
| | | | | |
| Institutional Class: | | | | |
| Shares authorized (no par value) | | Unlimited | |
| Net assets applicable to outstanding Institutional Class shares | | $ | 536,319 | |
| Shares issued and outstanding | | | 34,336 | |
| Net asset value, offering price and redemption price per share | | $ | 15.62 | |
The accompanying notes are an integral part of these financial statements.
| HENNESSY FUNDS | 1-800-966-4354 | |
Financial Statements
Statement of Operations for the six months ended April 30, 2016 (Unaudited) |
| INVESTMENT INCOME: | | | |
| Dividend income from unaffiliated securities | | $ | 796,410 | |
| Dividend income from affiliated securities | | | 48,705 | |
| Interest income | | | 9,633 | |
| Total investment income | | | 854,748 | |
| | | | | |
| EXPENSES: | | | | |
| Investment advisory fees (See Note 5) | | | 432,410 | |
| Sub-transfer agent expenses – Investor Class (See Note 5) | | | 116,129 | |
| Sub-transfer agent expenses – Institutional Class (See Note 5) | | | 137 | |
| Distribution fees – Investor Class (See Note 5) | | | 71,658 | |
| Service fees – Investor Class (See Note 5) | | | 47,772 | |
| Administration, fund accounting, custody and transfer agent fees (See Note 5) | | | 47,126 | |
| Federal and state registration fees | | | 18,442 | |
| Compliance expense | | | 11,790 | |
| Audit fees | | | 10,235 | |
| Interest expense (See Note 6) | | | 6,688 | |
| Reports to shareholders | | | 6,662 | |
| Trustees’ fees and expenses | | | 6,082 | |
| Legal fees | | | 1,047 | |
| Other expenses | | | 4,572 | |
| Total expenses | | | 780,750 | |
| NET INVESTMENT INCOME | | $ | 73,998 | |
| | �� | | | |
| REALIZED AND UNREALIZED LOSSES: | | | | |
| Net realized loss on: | | | | |
| Unaffiliated Investments | | $ | (2,238,844 | ) |
| Affiliated investments | | | (1,670 | ) |
| Net change in unrealized appreciation on investments | | | (4,314,614 | ) |
| Net loss on investments | | | (6,555,128 | ) |
| NET DECREASE IN NET ASSETS RESULTING FROM OPERATIONS | | $ | (6,481,130 | ) |
The accompanying notes are an integral part of these financial statements.
Financial Statements
| Statements of Changes in Net Assets |
| | | Six Months Ended | | | | |
| | | April 30, 2016 | | | Year Ended | |
| | | (Unaudited) | | | October 31, 2015(1) | |
| OPERATIONS: | | | | | | |
| Net investment income | | $ | 73,998 | | | $ | 27,847 | |
| Net realized gain (loss) on investments | | | (2,240,514 | ) | | | 10,567,773 | |
| Net change in unrealized depreciation on investments | | | (4,314,614 | ) | | | (13,399,391 | ) |
| Net decrease in net assets resulting from operations | | | (6,481,130 | ) | | | (2,803,771 | ) |
| | | | | | | | | |
| DISTRIBUTIONS TO SHAREHOLDERS FROM: | | | | | | | | |
| Net investment income | | | | | | | | |
| Investor Class | | | (132,180 | ) | | | — | |
| Institutional Class | | | (3,703 | ) | | | — | |
| Net realized gains | | | | | | | | |
| Investor Class | | | (9,653,373 | ) | | | (9,953,546 | ) |
| Institutional Class | | | (61,676 | ) | | | — | |
| Total distributions | | | (9,850,932 | ) | | | (9,953,546 | ) |
| | | | | | | | | |
| CAPITAL SHARE TRANSACTIONS: | | | | | | | | |
| Proceeds from shares subscribed – Investor Class | | | 80,129,991 | | | | 45,802,881 | |
| Proceeds from shares subscribed – Institutional Class | | | 415,240 | | | | 352,187 | |
| Dividends reinvested – Investor Class | | | 9,523,602 | | | | 9,642,825 | |
| Dividends reinvested – Institutional Class | | | 65,379 | | | | — | |
| Cost of shares redeemed – Investor Class | | | (100,414,678 | ) | | | (40,051,718 | ) |
| Cost of shares redeemed – Institutional Class | | | (123,663 | ) | | | (38,886 | ) |
| Net increase (decrease) in net assets derived | | | | | | | | |
| from capital share transactions | | | (10,404,129 | ) | | | 15,707,289 | |
| TOTAL INCREASE (DECREASE) IN NET ASSETS | | | (26,736,191 | ) | | | 2,949,972 | |
| | | | | | | | | |
| NET ASSETS: | | | | | | | | |
| Beginning of period | | | 101,024,813 | | | | 98,074,841 | |
| End of period | | $ | 74,288,622 | | | $ | 101,024,813 | |
| Undistributed net investment income, end of period | | $ | 73,998 | | | $ | 135,883 | |
| | | | | | | | | |
| CHANGES IN SHARES OUTSTANDING: | | | | | | | | |
| Shares sold – Investor Class | | | 5,131,348 | | | | 2,388,963 | |
| Shares sold – Institutional Class | | | 22,056 | | | | 17,958 | |
| Shares issued to holders as reinvestment | | | | | | | | |
| of dividends – Investor Class | | | 567,448 | | | | 489,235 | |
| Shares issued to holders as reinvestment | | | | | | | | |
| of dividends – Institutional Class | | | 3,885 | | | | — | |
| Shares redeemed – Investor Class | | | (6,463,711 | ) | | | (2,090,781 | ) |
| Shares redeemed – Institutional Class | | | (7,418 | ) | | | (2,145 | ) |
| Net increase (decrease) in shares outstanding | | | (746,392 | ) | | | 803,230 | |
(1) | Institutional Class shares commenced operations on June 15, 2015. |
The accompanying notes are an integral part of these financial statements.
| HENNESSY FUNDS | 1-800-966-4354 | |
Financial Statements
For an Investor Class share outstanding throughout each period
| | | Six Months Ended | |
| | | April 30, 2016 | |
| | | (Unaudited) | |
| PER SHARE DATA: | | | |
| Net asset value, beginning of period | | $ | 18.36 | |
| | | | | |
| Income (loss) from investment operations: | | | | |
| Net investment income (loss) | | | 0.01 | |
| Net realized and unrealized gains (losses) on investments | | | (1.04 | ) |
| Total from investment operations | | | (1.03 | ) |
| | | | | |
| Less distributions: | | | | |
| Dividends from net investment income | | | (0.02 | ) |
| Dividends from net realized gains | | | (1.69 | ) |
| Total distributions | | | (1.71 | ) |
| Net asset value, end of period | | $ | 15.62 | |
| | | | | |
| TOTAL RETURN | | | (6.23 | )%(3) |
| Net assets, end of period (millions) | | $ | 73.75 | |
| Ratio of expenses to average net assets | | | 1.63 | %(4) |
| Ratio of net investment income (loss) to average net assets | | | 0.15 | %(4) |
Portfolio turnover rate(5) | | | 117 | %(3) |
(1) | Calculated based on average shares outstanding method. |
(2) | Amount is less than $0.01. |
(3) | Not annualized. |
(4) | Annualized. |
(5) | Portfolio turnover is calculated on the basis of the Fund as a whole. |
The accompanying notes are an integral part of these financial statements.
| Year Ended October 31, | |
| 2015 | | | 2014 | | | 2013 | | | 2012 | | | 2011 | |
| | | | | | | | | | | | | | |
| $ | 20.87 | | | $ | 19.01 | | | $ | 14.16 | | | $ | 11.91 | | | $ | 12.88 | |
| | | | | | | | | | | | | | | | | | | |
| | | | | | | | | | | | | | | | | | | |
| | 0.01 | | | | 0.00 | (2) | | | (0.03 | ) | | | 0.01 | | | | (0.04 | )(1) |
| | (0.40 | ) | | | 2.44 | | | | 4.89 | | | | 2.24 | | | | (0.93 | ) |
| | (0.39 | ) | | | 2.44 | | | | 4.86 | | | | 2.25 | | | | (0.97 | ) |
| | | | | | | | | | | | | | | | | | | |
| | | | | | | | | | | | | | | | | | | |
| | — | | | | — | | | | (0.01 | ) | | | — | | | | — | |
| | (2.12 | ) | | | (0.58 | ) | | | — | | | | — | | | | — | |
| | (2.12 | ) | | | (0.58 | ) | | | (0.01 | ) | | | — | | | | — | |
| $ | 18.36 | | | $ | 20.87 | | | $ | 19.01 | | | $ | 14.16 | | | $ | 11.91 | |
| | | | | | | | | | | | | | | | | | | |
| | (2.57 | )% | | | 13.04 | % | | | 34.37 | % | | | 18.89 | % | | | (7.53 | )% |
| $ | 100.73 | | | $ | 98.07 | | | $ | 88.30 | | | $ | 64.66 | | | $ | 55.68 | |
| | 1.57 | % | | | 1.49 | % | | | 1.57 | % | | | 1.57 | % | | | 1.61 | % |
| | 0.03 | % | | | (0.01 | )% | | | (0.22 | )% | | | 0.09 | % | | | (0.34 | )% |
| | 74 | % | | | 58 | % | | | 75 | % | | | 93 | % | | | 97 | % |
The accompanying notes are an integral part of these financial statements.
| HENNESSY FUNDS | 1-800-966-4354 | |
Financial Statements
For an Institutional Class share outstanding throughout each period
| | | Six Months Ended | | | | |
| | | April 30, 2016 | | | Period Ended | |
| | | (Unaudited) | | | October 31, 2015(1) | |
| PER SHARE DATA: | | | | | | |
| Net asset value, beginning of period | | $ | 18.39 | | | $ | 19.72 | |
| | | | | | | | | |
| Income (loss) from investment operations: | | | | | | | | |
| Net investment income | | | 0.03 | | | | 0.01 | |
| Net realized and unrealized losses on investments | | | (1.01 | ) | | | (1.34 | ) |
| Total from investment operations | | | (0.98 | ) | | | (1.33 | ) |
| | | | | | | | | |
| Less distributions: | | | | | | | | |
| Dividends from net investment income | | | (0.09 | ) | | | — | |
| Dividends from net realized gains | | | (1.70 | ) | | | — | |
| Total distributions | | | (1.79 | ) | | | — | |
| Net asset value, end of period | | $ | 15.62 | | | $ | 18.39 | |
| | | | | | | | | |
| TOTAL RETURN | | | (6.00 | )%(2) | | | (6.74 | )%(2) |
| Net assets, end of period (millions) | | $ | 0.54 | | | $ | 0.29 | |
| Ratio of expenses to average net assets | | | 1.20 | %(3) | | | 1.19 | %(3) |
| Ratio of net investment income to average net assets | | | 0.45 | %(3) | | | 0.25 | %(3) |
Portfolio turnover rate(4) | | | 117 | %(2) | | | 74 | %(2) |
(1) | Institutional Class shares commenced operations on June 15, 2015. |
(2) | Not annualized. |
(3) | Annualized. |
(4) | Portfolio turnover is calculated on the basis of the Fund as a whole. |
The accompanying notes are an integral part of these financial statements.
Financial Statements
Notes to the Financial Statements April 30, 2016 (Unaudited) |
1). ORGANIZATION
The Hennessy Large Cap Financial Fund (the “Fund”) is a series of Hennessy Funds Trust (the “Trust”), which was organized as a Delaware statutory trust on September 17, 1992. The Fund is an open-end management investment company registered under the Investment Company Act of 1940, as amended. The Fund is a successor to the FBR Large Cap Financial Fund (the “Predecessor FBR Fund”), a series of The FBR Funds, a Delaware statutory trust, pursuant to a reorganization that took place after the close of business on October 26, 2012. Prior to October 26, 2012, the Fund had no investment operations. As a result of the reorganization, holders of the Investor Class shares of the Predecessor FBR Fund received Investor Class shares of the Fund (the Investor Class shares of the Fund are the successor to the accounting and performance information of the Predecessor FBR Fund). The Fund did not have Institutional Class shares until June 15, 2015. The investment objective of the Fund is capital appreciation. The Fund is a non-diversified fund.
The Fund offers Investor Class and Institutional Class shares. Each class of shares differs principally in its respective administration, 12b-1 distribution and service, shareholder servicing, and transfer agent expenses and sales charges, if any. Each class has identical rights to earnings, assets, and voting privileges, except for class-specific expenses and exclusive rights to vote on matters affecting only an individual class.
As an investment company, the Fund follows the investment company accounting and reporting guidance of the Financial Accounting Standards Board (“FASB”) Accounting Standard Codification Topic 946 “Financial Services—Investment Companies.”
2). SIGNIFICANT ACCOUNTING POLICIES
The following is a summary of significant accounting policies consistently followed by the Fund in the preparation of the financial statements. These policies are in conformity with U.S. generally accepted accounting principles (“GAAP”).
| a). | Investment Valuation – All investments in securities are recorded at their estimated fair value, as described in Note 3. |
| b). | Federal Income Taxes – Provision for federal income taxes or excise taxes has not been made since the Fund has elected to be taxed as a “regulated investment company” and intends to distribute substantially all of its taxable income to its shareholders and otherwise comply with the provisions of the Internal Revenue Code of 1986, as amended, applicable to regulated investment companies. Net investment income or loss and realized gains and losses for federal income tax purposes may differ from that reported on the financial statements because of temporary book and tax basis differences. Temporary differences are primarily the result of the treatment of wash sales for tax reporting purposes. The Fund recognizes interest and penalties related to income tax benefits, if any, in the statement of operations as an income tax expense. Distributions from net realized gains for book purposes may include short-term capital gains, which are included as ordinary income to shareholders for tax purposes. |
| c). | Income and Expenses – Dividend income is recognized on the ex-dividend date or as soon as information is available to the Fund. Interest income, which includes the amortization of premium and accretion of discount, is recognized on an accrual basis. The Fund is charged for those expenses that are directly attributable to the portfolio, |
| HENNESSY FUNDS | 1-800-966-4354 | |
| | such as advisory, administration, and certain shareholder service fees. Income, expenses (other than expenses attributable to a specific class), and realized and unrealized gains or losses on investments are allocated to each class of shares based on its respective net assets. |
| d). | Distributions to Shareholders – Dividends from net investment income for the Fund, if any, are declared and paid annually, usually in December. Distributions of net realized capital gains, if any, are declared and paid annually, usually in December. |
| e). | Security Transactions – Investment and shareholder transactions are recorded on the trade date. The Fund determines the gain or loss realized from the investment transactions by comparing the original cost of the security lot sold with the net sale proceeds. Discounts and premiums on securities purchased are accreted/amortized over the life of the respective security. |
| f). | Use of Estimates – The preparation of financial statements in conformity with GAAP requires management to make estimates and assumptions that affect the reported amounts of assets and liabilities and disclosure of contingent assets and liabilities at the date of the financial statements and the reported change in net assets during the reporting period. Actual results could differ from those estimates. |
| g). | Share Valuation – The net asset value (“NAV”) per share of the Fund is calculated by dividing the sum of the value of the securities held by the Fund, plus cash or other assets, minus all liabilities (including estimated accrued expenses) by the total number of shares outstanding for the Fund, rounded to the nearest cent. The Fund’s shares will not be priced on days the New York Stock Exchange is closed for trading. The offering and redemption price per share for the Fund is equal to the Fund’s NAV per share. |
| h). | Foreign Currency – Values of investments denominated in foreign currencies, if any, are converted into U.S. dollars using the spot market rate of exchange at the time of valuation. Purchases and sales of investments and income are translated into U.S. dollars using the spot market rate of exchange prevailing on the respective dates of such transactions. The Fund does not isolate the portion of the results of operations resulting from fluctuations in foreign exchange rates on investments from fluctuations resulting from changes in the market prices of securities held. Such fluctuations are included with the net realized and unrealized gain or loss on investments. Foreign investments present additional risks due to currency fluctuations, economic and political factors, lower liquidity, government regulations, differences in accounting standards, and other factors. |
| i). | Forward Contracts – The Fund may enter into forward currency contracts to reduce its exposure to changes in foreign currency exchange rates on its foreign holdings and to lock in the U.S. dollar cost of firm purchase and sale commitments for securities denominated in foreign currencies. A forward currency contract is a commitment to purchase or sell a foreign currency at a future date at a negotiated forward rate. The gain or loss arising from the difference between the U.S. dollar cost of the original contract and the value of the foreign currency in U.S. dollars upon closing of such contract is included in net realized gain or loss from foreign currency transactions. During the six months ended April 30, 2016, the Fund did not enter into any forward contracts. |
| j). | Repurchase Agreements – The Fund may enter into repurchase agreements with member banks or security dealers of the Federal Reserve Board whom the investment advisor deems creditworthy. The repurchase price generally equals the price paid by the Fund plus interest negotiated on the basis of current short-term rates. |
| | Securities pledged as collateral for repurchase agreements are held by the custodian bank until the respective agreements mature. Provisions of the repurchase agreements ensure that the market value of the collateral, including accrued interest thereon, is sufficient to cover the repurchase amount in the event of default of the counterparty. If the counterparty defaults and the value of the collateral declines or if the counterparty enters an insolvency proceeding, realization of the collateral by the Fund may be delayed or limited. |
| k). | Accounting for Uncertainty in Income Taxes – The Fund has accounting policies regarding recognition and measurement of tax positions taken or expected to be taken on a tax return. The tax returns of the Fund for the prior three fiscal years are open for examination. The Fund has reviewed all open tax years in major jurisdictions and concluded that there is no impact on the Fund’s net assets and no tax liability resulting from unrecognized tax benefits relating to uncertain income tax positions taken or expected to be taken on a tax return. The Fund’s major tax jurisdictions are U.S. federal and Delaware. |
| l). | Derivatives – The Fund may invest in, or enter into, derivatives, such as options, futures contracts, options on futures contracts, and swaps, for a variety of reasons, including to hedge certain risks, to provide a substitute for purchasing or selling particular securities, or to increase potential income gain. Derivatives are financial contracts based on an underlying or notional amount, require no initial investment or an initial net investment that is smaller than would normally be required to have a similar response to changes in market factors, and require or permit net settlement. Derivatives may allow the Fund to increase or decrease the level of risk to which the Fund is exposed more quickly and efficiently than transactions in other types of instruments. The main purpose of utilizing derivative instruments is for hedging purposes. |
| | The Fund follows the financial accounting reporting rules as required by the Derivatives and Hedging Topic of the FASB Accounting Standards Codification. Under such rules, the Fund is required to include enhanced disclosure that enables investors to understand how and why an entity uses derivatives, how derivatives are accounted for, and how derivatives instruments affect an entity’s results of operations and financial position. During the six months ended April 30, 2016, the Fund did not hold any derivative instruments. |
| m). | New Accounting Pronouncements – In May 2015, the FASB issued ASU No. 2015-07 “Disclosure for Investments in Certain Entities that Calculate Net Asset Value per Share (or Its Equivalent).” The amendments in ASU No. 2015-07 remove the requirement to categorize within the fair value hierarchy investments measured at NAV and require the disclosure of sufficient information to reconcile the fair value of the remaining assets categorized within the fair value hierarchy to the financial statements. The amendments in ASU No. 2015-07 are effective for fiscal years beginning after December 15, 2015, and interim periods within those fiscal years. Management has reviewed the requirements and believes the adoption of ASU 2015-07 will not have a material impact on the Fund’s financial statements and related disclosures. |
3). SECURITIES VALUATION
The Fund follows authoritative fair valuation accounting standards that establish an authoritative definition of fair value and set out a hierarchy for measuring fair value. These standards require additional disclosures about the various inputs and valuation techniques used to develop the measurements of fair value and a discussion in changes in valuation techniques and related inputs during the period. These inputs are summarized in the three broad levels listed below:
| HENNESSY FUNDS | 1-800-966-4354 | |
| | Level 1 – | Unadjusted, quoted prices in active markets for identical instruments that the Fund has the ability to access at the date of measurement. |
| | Level 2 – | Other significant observable inputs (including, but not limited to, quoted prices in active markets for similar instruments, quoted prices in markets that are not active for identical or similar instruments, and model-derived valuations in which all significant inputs and significant value drivers are observable in active markets (such as interest rates, prepayment speeds, credit risk curves, default rates, and similar data)). |
| | Level 3 – | Significant unobservable inputs (including the Fund’s own assumptions about what market participants would use to price the asset or liability based on the best available information) when observable inputs are unavailable. |
Following is a description of the valuation techniques applied to the Fund’s major categories of assets and liabilities measured at fair value on a recurring basis.
Equity Securities – Equity securities, including common stocks, preferred stocks, foreign-issued common stocks, exchange-traded funds, closed-end mutual funds, partnerships, rights, and real estate investment trusts, that are traded on a securities exchange for which a last-quoted sales price is readily available will generally be valued at the last sales price as reported by the primary exchange on which the securities are listed. Securities listed on The NASDAQ Stock Market (“NASDAQ”) will generally be valued at the NASDAQ Official Closing Price, which may differ from the last sales price reported. Securities traded on a securities exchange for which a last-quoted sales price is not readily available will generally be valued at the mean between the bid and ask prices. To the extent these securities are actively traded and valuation adjustments are not applied, they are classified in Level 1 of the fair value hierarchy. Securities traded on foreign exchanges generally are not valued at the same time the Fund calculates its NAV because most foreign markets close well before such time. The earlier close of most foreign markets gives rise to the possibility that significant events, including broad market moves, may have occurred in the interim. In certain circumstances, it may be determined that a security needs to be fair valued because it appears that the value of the security might have been materially affected by events occurring after the close of the market in which the security is principally traded, but before the time the Fund calculates its NAV, such as by a development that affects an entire market or region (e.g., weather-related events) or a potentially global development (e.g., a terrorist attack that may be expected to have an effect on investor expectations worldwide).
Registered Investment Companies – Investments in registered investment companies (e.g., mutual funds) are generally priced at the ending NAV provided by the applicable registered investment company’s service agent and will be classified in Level 1 of the fair value hierarchy.
Debt Securities – Debt securities, including corporate bonds, asset-backed securities, mortgage-backed securities, municipal bonds, U.S. Treasuries, and U.S. government agency issues, are generally valued at market on the basis of valuations furnished by an independent pricing service that utilizes both dealer-supplied valuations and formula-based techniques. The pricing service may consider recently executed transactions in securities of the issuer or comparable issuers, market price quotations (where observable), bond spreads, and fundamental data relating to the issuer. In addition, the model may incorporate observable market data, such as reported sales of similar securities, broker quotes, yields, bids, offers, and reference data. Certain securities are valued primarily using dealer quotations. These securities are generally classified in Level 2 of the fair value hierarchy.
Short-Term Securities – Short-term equity investments, including money market funds, are valued in the manner specified above. Short-term debt investments with an original term to maturity of 60 days or less are valued at amortized cost, which approximates fair market value. If the original term to maturity of a short-term debt investment exceeded 60 days, then the values as of the 61st day prior to maturity are amortized. Amortized cost is not used if its use would be inappropriate due to credit or other impairments of the issuer, in which case the security’s fair value would be determined, as described below. Short-term securities are generally classified in Level 1 or Level 2 of the fair market hierarchy depending on the inputs used and market activity levels for specific securities.
The Board of Trustees of the Fund (the “Board”) has adopted fair value pricing procedures that are followed when a price for a security is not readily available or if a significant event has occurred that indicates the closing price of a security no longer represents the true value of that security. Fair value pricing determinations are made in good faith in accordance with these procedures. There are numerous criteria that will be given consideration in determining a fair value of a security, such as the trading volume of a security and markets, the value of other like securities, and news events with direct bearing to a security or markets. Fair value pricing results in an estimated price for a security that reflects the amount the Fund might reasonably expect to receive in a current sale. Depending on the relative significance of the valuation inputs, these securities may be classified in either Level 2 or Level 3 of the fair value hierarchy.
The fair valuation of foreign securities may be determined with the assistance of a pricing service using correlations between the movement of prices of such securities and indices of domestic securities and other appropriate indicators, such as closing market prices of relevant American Depositary Receipts or futures contracts. The effect of using fair value pricing is that the Fund’s NAV will reflect the affected portfolio securities’ value as determined by the Board or its designee instead of being determined by the market. Using a fair value pricing methodology to price foreign securities may result in a value that is different from a foreign security’s most recent closing price and from the prices used by other investment companies to calculate their NAVs and are generally considered Level 2 prices in the fair valuation hierarchy. Because the Fund may invest in foreign securities, the value of the Fund’s portfolio securities may change on days when you will not be able to purchase or redeem your shares.
The Board has delegated day-to-day valuation matters to a Valuation Committee comprised of one or more representatives from Hennessy Advisors, Inc., the Fund’s investment advisor. The function of the Valuation Committee is to value securities where current and reliable market quotations are not readily available. All actions taken by the Valuation Committee are reviewed by the Board.
The Fund has performed an analysis of all existing investments to determine the significance and character of all inputs to their fair value determination. Various inputs are used in determining the value of the Fund’s investments. The inputs or methodology used for valuing securities are not necessarily an indication of the risk associated with investing in those securities. Details related to the fair valuation hierarchy of the Fund’s securities as of April 30, 2016, are included in the Fund’s Schedule of Investments.
4). INVESTMENT TRANSACTIONS
Purchases and sales of investment securities (excluding government and short-term investments) for the Fund during the six months ended April 30, 2016, were $57,972,515 and $81,086,607, respectively.
There were no purchases or sales/maturities of long-term U.S. government securities for the Fund during the six months ended April 30, 2016.
| HENNESSY FUNDS | 1-800-966-4354 | |
5). INVESTMENT MANAGEMENT FEE AND OTHER TRANSACTIONS WITH AFFILIATES
Hennessy Advisors, Inc. (the “Advisor”) is the investment advisor of the Fund. The Advisor provides the Fund with investment management services under an Investment Advisory Agreement. The Advisor furnishes all investment advice, office space, facilities, and provides most of the personnel needed by the Fund. As compensation for its services, the Advisor is entitled to a monthly fee from the Fund. The fee is based upon the average daily net assets of the Fund at the annual rate of 0.90%. The net investment advisory fees payable by the Fund as of April 30, 2016, were $50,783.
In the past, the Advisor had contractually agreed to limit the total annual operating expenses of the Fund to 1.95% of the Fund’s net assets for the Investor Class shares of the Fund (excluding interest, taxes, brokerage commissions, dividend expenses, acquired fund fees and expenses, extraordinary legal expenses, or any other extraordinary expenses and, from and after November 1, 2014, 12b-1 fees). The expense limitation agreement for the Fund expired as of February 28, 2015.
For a period of three years after the year in which the Advisor waived or reimbursed expenses, the Advisor may seek reimbursement from the Fund to the extent that total annual fund operating expenses are less than the expense limitation that was in effect at the time the Advisor waived or reimbursed expenses. During the three years ended October 31, 2015, no expenses were waived or reimbursed by the Advisor and therefore no expenses are subject to potential recovery.
The Board has approved a Shareholder Servicing Agreement for the Investor Class shares of the Fund, effective as of February 28, 2015, which was instituted to compensate the Advisor for the non-investment management services it provides to the Fund. The Shareholder Servicing Agreement provides for a monthly fee paid to the Advisor at an annual rate of 0.10% of the average daily net assets of the Fund attributable to Investor Class shares. Shareholder service fees payable by the Fund as of April 30, 2016, were $5,600.
The Fund has adopted a plan pursuant to Rule 12b-1 under the Investment Company Act of 1940, as amended, that authorizes payments in connection with the distribution of the Fund’s shares at an annual rate of up to 0.25% of the Fund’s average daily net assets attributable to Investor Class shares. Even though the authorized rate is up to 0.25%, the Fund has only used up to 0.15% of its average daily net assets attributable to Investor Class shares for such purpose since March 1, 2015. Amounts paid under the plan may be spent on any activities or expenses primarily intended to result in the sale of shares, including, but not limited to, advertising, shareholder account servicing, the printing and mailing of prospectuses to other than current shareholders, the printing and mailing of sales literature, and compensation for sales and marketing activities or to financial institutions and others, such as dealers and distributors.
The Fund has entered into agreements with various brokers, dealers, and financial intermediaries in connection with the sale of shares of the Fund. The agreements provide for periodic payments by the Fund to the brokers, dealers, and financial intermediaries for providing certain shareholder maintenance services (sub-transfer agent expenses). These shareholder services include the pre-processing and quality control of new accounts, shareholder correspondence, answering customer inquiries regarding account status, and facilitating shareholder telephone transactions. Fees paid by the Fund to various brokers, dealers, and financial intermediaries during the six months ended April 30, 2016, were $116,266.
U.S. Bancorp Fund Services, LLC (“USBFS”) provides the Fund with administrative, fund accounting, and transfer agent services, and necessary office equipment. As administrator, USBFS is responsible for activities such as (i) preparing various federal and
state regulatory filings, reports, and returns for the Fund, (ii) preparing reports and materials to be supplied to the Board, (iii) monitoring the activities of the Fund’s custodian, transfer agent, and accountants, and (iv) coordinating the preparation and payment of the Fund’s expenses and reviewing the Fund’s expense accruals. Fees paid to USBFS during the six months ended April 30, 2016, were $47,126.
U.S. Bank, N.A., an affiliate of USBFS, serves as the Fund’s custodian. Quasar Distributors, LLC acts as the Fund’s principal underwriter in a continuous public offering of the Fund’s shares. Quasar Distributors, LLC is an affiliate of USBFS and U.S. Bank, N.A.
6). LINE OF CREDIT
The Fund has an uncommitted line of credit with the other funds in the Hennessy Funds family of funds (the “Hennessy Funds”) in the amount of the lesser of (i) $100,000,000 or (ii) 33.33% of each Hennessy Fund’s net assets, or 30% for the Hennessy Gas Utility Fund and 10% for the Hennessy Balanced Fund, intended to provide short-term financing, if necessary, subject to certain restrictions, in connection with shareholder redemptions. The credit facility is with the Hennessy Funds’ custodian bank, U.S. Bank, N.A. Borrowings under this arrangement bear interest at the bank’s prime rate and are secured by all of the Fund’s assets (as to its own borrowings only). During the six months ended April 30, 2016, the Fund had an outstanding average daily balance and a weighted average interest rate of $377,951 and 3,44%, respectively. The maximum amount outstanding for the Fund during the period was $14,077,000. At April 30, 2016, the Fund did not have any borrowings outstanding under the line of credit.
7). FEDERAL TAX INFORMATION
As of October 31, 2015, the Fund’s most recent fiscal year end, the components of accumulated earnings (losses) for income tax purposes were as follows:
| | Cost of investments for tax purposes | | $ | 96,665,852 | |
| | Gross tax unrealized appreciation | | $ | 7,731,086 | |
| | Gross tax unrealized depreciation | | | (2,538,279 | ) |
| | Net tax unrealized appreciation | | $ | 5,192,807 | |
| | Undistributed ordinary income | | $ | 135,883 | |
| | Undistributed long-term capital gains | | | 9,715,029 | |
| | Total distributable earnings | | $ | 9,850,912 | |
| | Other accumulated gain | | $ | — | |
| | Total accumulated gain | | $ | 15,043,719 | |
The difference between book-basis unrealized appreciation/depreciation (as shown in the Statement of Assets and Liabilities) and tax-basis unrealized appreciation/depreciation (as shown above) is attributable primarily to wash sales and partnership adjustments.
At October 31, 2015, the Fund’s most recent fiscal year end, the Fund had no tax basis capital losses to offset future capital gains.
At October 31, 2015, the Fund’s most recent fiscal year end, the Fund did not defer, on a tax basis, any late year ordinary losses.
The tax character of distributions paid during fiscal year 2016 (year to date) and fiscal year 2015 for the Fund were as follows:
| | | Six Months Ended | | | Year Ended | |
| | | April 30, 2016 | | | October 31, 2015 | |
| Ordinary income | | $ | 135,883 | | | $ | 485,376 | |
| Long-term capital gain | | | 9,715,049 | | | | 9,468,170 | |
| | | $ | 9,850,932 | | | $ | 9,953,546 | |
| HENNESSY FUNDS | 1-800-966-4354 | |
Expense Example (Unaudited)
April 30, 2016
As a shareholder of the Fund, you incur two types of costs: (1) transaction costs, including sales charges (loads) on purchase payments, reinvested dividends, or other distributions; redemption fees; and exchange fees; and (2) ongoing costs, including management fees; service fees; and other Fund expenses. This Example is intended to help you understand your ongoing costs (in dollars) of investing in the Fund and to compare these costs with the ongoing costs of investing in other mutual funds. The Example is based on an investment of $1,000 invested at the beginning of the period and held for the entire period from November 1, 2015 through April 30, 2016.
Actual Expenses
The first line of the table below under the “Investor Class” and “Institutional Class” headings provides information about actual account values and actual expenses. Although the Fund charges no sales loads or transaction fees, you will be assessed fees for outgoing wire transfers, returned checks and stop payment orders at prevailing rates charged by U.S. Bancorp Fund Services, LLC, the Fund’s transfer agent. If you request that a redemption be made by wire transfer, currently a $15.00 fee is charged by the Fund’s transfer agent. IRA accounts will be charged a $15.00 annual maintenance fee. The example below includes, but is not limited to, management fees, shareholder servicing fees, fund accounting, custody, and transfer agent fees. However, the example below does not include portfolio trading commissions and related expenses, and other extraordinary expenses as determined under generally accepted accounting principles. You may use the information in this line, together with the amount you invested, to estimate the expenses that you paid over the period. Simply divide your account value by $1,000 (for example, an $8,600 account value divided by $1,000 = 8.6), then multiply the result by the number in the first line of the table under the “Investor Class” and “Institutional Class” headings in the column entitled “Expenses Paid During Period” to estimate the expenses you paid on your account during this period.
Hypothetical Example for Comparison Purposes
The second line of the table below under the “Investor Class” and “Institutional Class” headings provides information about hypothetical account values and hypothetical expenses based on the Fund’s actual expense ratios and an assumed rate of return of 5% per year before expenses, which is not the Fund’s actual return. The hypothetical account values and expenses may not be used to estimate the actual ending account balance or expenses you paid for the period. You may use this information to compare the ongoing costs of investing in the Fund and other funds. To do so, compare this 5% hypothetical example with the 5% hypothetical examples that appear in the shareholder reports of the other funds. Please note that the expenses shown in the table are meant to highlight your ongoing costs only and do not reflect any transactional costs, such as sales charges (loads), or exchange fees. Therefore, the second line of the table under the “Investor Class” and “Institutional Class” headings is useful in comparing ongoing costs only, and will not help you determine the relative total costs of owning different funds. In addition, if these transactional costs were included, your costs would have been higher.
| | | | Expenses Paid |
| | Beginning | Ending | During Period(1) |
| | Account Value | Account Value | November 1, 2015 – |
| | November 1, 2015 | April 30, 2016 | April 30, 2016 |
| Investor Class | | | |
| Actual | $1,000.00 | $ 937.70 | $7.85 |
| Hypothetical (5% return before expenses) | $1,000.00 | $1,016.76 | $8.17 |
| | | | |
| Institutional Class | | | |
| Actual | $1,000.00 | $ 940.00 | $5.79 |
| Hypothetical (5% return before expenses) | $1,000.00 | $1,018.90 | $6.02 |
(1) | Expenses are equal to the Fund’s annualized expense ratio of 1.63% for Investor Class shares or 1.20% for Institutional Class shares, as applicable, multiplied by the average account value over the period, multiplied by 182/366 days (to reflect one-half year period). |
| HENNESSY FUNDS | 1-800-966-4354 | |
How to Obtain a Copy of the Fund’s
Proxy Voting Policy and Proxy Voting Records
A description of the policies and procedures the Fund uses to determine how to vote proxies relating to portfolio securities is available without charge: (1) by calling 1-800-966-4354; (2) on the Hennessy Funds’ website at hennessyfunds.com/proxy-voting/policy.fs; or (3) on the U.S. Securities and Exchange Commission’s website at www.sec.gov. The Fund’s proxy voting record is available without charge on both the Hennessy Funds’ website at hennessyfunds.com/proxy-voting/policy.fs and the SEC’s website at www.sec.gov no later than August 31 for the prior 12 months ending June 30.
Quarterly Filings on Form N-Q
The Fund files its complete schedule of portfolio holdings with the SEC for the first and third quarters of each fiscal year on Form N-Q. The Fund’s Form N-Q will be available on the SEC’s website at www.sec.gov. The Fund’s Form N-Q may be reviewed and copied at the SEC’s Public Reference Room in Washington, DC and information on the operation of the Public Reference Room may be obtained by calling 1-800-SEC-0330. Information included in the Fund’s N-Q will also be available upon request by calling 1-800-966-4354.
Federal Tax Distribution Information
(Unaudited)
For the fiscal year ended October 31, 2015, certain dividends paid by the Fund may be subject to a maximum tax rate of 23.8%, as provided for by the Jobs and Growth Tax Relief Reconciliation Act of 2003. The percentage of dividends declared from ordinary income designated as qualified dividend income was 100.00%.
For corporate shareholders, the percent of ordinary income distributions that qualified for the corporate dividends received deduction for the fiscal year ended October 31, 2015 was 100.00%.
The percentage of taxable ordinary income distributions that are designated as short-term capital gain distributions under Section 871(k)(2)(C) of the Internal Revenue Code of 1986, as amended, for the Fund was 100.00%.
Householding
To help keep the Fund’s costs as low as possible, we generally deliver a single copy of most financial reports and prospectuses to shareholders who share an address, even if the accounts are registered under different names. This process, known as “householding,” does not apply to account statements. You may, of course, request an individual copy of a prospectus or financial report at any time. If you would like to receive separate mailings, please call the Administrator at 1-800-261-6950 or 1-414-765-4124 and we will begin individual delivery within 30 days of your request. If your account is held through a financial institution or other intermediary, please contact them directly to request individual delivery.
Board Approval of Investment Advisory
Agreement
At its meeting on March 9, 2016, the Board of Trustees of the Fund (the “Board,” and the members thereof, the “Trustees”) unanimously approved the continuation of the investment advisory agreement of the Fund with Hennessy Advisors, Inc. (the “Advisor”). As part of the process of approving the continuation of the advisory agreement, the Trustees reviewed their fiduciary duties with respect to approving the advisory agreement and the relevant factors for them to consider. In addition, the Trustees who are not deemed “interested persons” (as that term is defined by the Investment Company Act of 1940) of the Fund (the “Independent Trustees”) met in executive session to discuss the approval of the advisory agreement.
In advance of the meeting, the Advisor sent detailed information to the Trustees to assist them in their evaluation of the advisory agreement. This information included, but was not limited to, (i) a memorandum from outside legal counsel that described the fiduciary duties of the Board with respect to approving the continuation of the advisory agreement and the relevant factors for consideration, (ii) a memorandum from the Advisor that listed the factors relevant to the Board’s approval of the continuation of the advisory agreement and also referenced the documents that had been provided to help the Board assess each such factor, (iii) an inventory of the range of services provided by the Advisor for the Fund, (iv) a written discussion of economies of scale, (v) the advisory agreement, (vi) a recent Fund fact sheet, (vii) a peer expense comparison, (viii) performance information, (ix) the Advisor’s most recent Form 10-K and Form 10-Q, which included information about the Advisor’s profitability, (x) information about brokerage commissions, (xi) information about the Fund’s compliance program, (xii) the Advisor’s current Form ADV Part I, and (xii) other information the Trustees believed was useful in evaluating the approval of the continuation of the advisory agreement.
All of the factors discussed by the Trustees were considered as a whole, and were considered separately by the Independent Trustees, meeting in executive session. The factors were viewed in their totality by the Trustees, with no single factor being the principal or determinative factor in the Trustees’ determination of whether to approve the continuation of the advisory agreement. The Trustees recognized that the management and fee arrangements for the Fund are the result of years of review and discussion between the Independent Trustees and the Advisor, that certain aspects of such arrangements may receive greater scrutiny in some years than in others, and that the Trustees’ conclusions may be based, in part, on their consideration of these same arrangements and information received during the course of the year and in prior years.
Prior to approving the continuation of the advisory agreement, the Trustees and the Independent Trustees in executive session considered, among other items:
| | • | The nature and quality of the advisory services provided by the Advisor. |
| | • | A comparison of the fees and expenses of the Fund to other similar funds. |
| | • | Whether economies of scale are recognized by the Fund. |
| | • | The costs and profitability of the Fund to the Advisor. |
| | • | The performance of the Fund. |
| | • | The other benefits to the Advisor from serving as an investment advisor to the Fund (in addition to the advisory fee). |
| HENNESSY FUNDS | 1-800-966-4354 | |
The material considerations and determinations of the Board of Trustees, including all of the Independent Trustees, are as follows:
| | • | The Board considered the services identified below that are provided by the Advisor. Based on this review, the Trustees believe that the Advisor provides high-quality services to the Fund, and they noted that their overall confidence in the Advisor is high. The Trustees also concluded that they were satisfied with the nature, extent, and quality of the advisory services provided to the Fund by the Advisor, and that the nature and extent of the services provided by the Advisor are appropriate to assure that the Fund’s operations are conducted in compliance with applicable laws, rules, and regulations. |
| | | • | The Advisor acts as the portfolio manager for the Fund. In this capacity, the Advisor does the following: |
| | | | • | manages the composition of the Fund’s portfolio, including the purchase, retention, and disposition of portfolio securities in accordance with the Fund’s investment objectives, policies, and restrictions; |
| | | | • | ensures compliance with “best execution” for the Fund’s portfolio; |
| | | | • | manages the use of soft dollars for the Fund. |
| | | • | The Advisor performs a daily reconciliation of portfolio positions and cash for the Fund. |
| | | • | The Advisor monitors the Fund’s compliance with its investment objectives and restrictions. |
| | | • | The Advisor monitors compliance with federal securities laws and performs activities such as maintaining a compliance program, conducting ongoing reviews of the compliance programs of the Fund’s service providers, conducting on-site visits to the Fund’s service providers, monitoring incidents of abusive trading practices, reviewing Fund expense accruals, payments, and fixed expense ratios, evaluating insurance providers for fidelity bond coverage and D&O/E&O insurance coverage, conducting employee compliance training, reviewing reports provided by service providers, maintaining books and records, and preparing an annual compliance report to the Board. |
| | | • | The Advisor oversees service providers that provide accounting, administration, distribution, transfer agency, custodial, sales and marketing, public relations, audit, information technology, and legal services to the Fund. |
| | | • | The Advisor maintains in-house marketing and distribution departments on behalf of the Fund. |
| | | • | The Advisor is actively involved with preparing regulatory filings for the Fund, including writing and annually updating the Fund’s prospectus and related documents. |
| | | • | The Advisor prepares a written summary of the Fund’s performance for the most recent six-month period or twelve-month period, as applicable, for each semi-annual and annual report of the Fund. |
| | | • | The Advisor oversees distribution of the Fund through third-party broker/dealers and independent financial institutions such as Charles Schwab, Inc., Fidelity, TD Waterhouse, and Pershing. The Advisor participates in “no transaction fee” (“NTF”) programs with these companies on behalf of the Fund, which allow customers to purchase the Fund through third-party distribution |
| | | | channels without paying a transaction fee. The Advisor compensates, in part, a number of these third-party providers of NTF programs out of its own revenues. |
| | | • | The Advisor pays the incentive compensation of the Fund’s compliance officers and employs other staff, such as management executives, legal personnel, marketing personnel, national accounts and distribution personnel, sales personnel, administrative personnel, and trading oversight personnel. |
| | | • | The Advisor provides a quarterly compliance certification to the Board. |
| | | • | The Advisor prepares or reviews Board materials, frequently presents to the Board or leads Board discussions, prepares or reviews meeting minutes, and arranges for Board training and education. |
| | • | The Board compared the performance of the Fund to benchmark indices over various periods of time and they noted that at each quarterly meeting, the Trustees review reports comparing the investment performance of the Fund to various indices. Based on the information provided at the meeting and the information and quarterly discussions regarding the Fund’s investment performance, the Trustees believe that the Advisor manages the Fund in a manner that is materially consistent with its stated investment objective and style. The Trustees concluded that the performance of the Fund over various time horizons warranted the continuation of the advisory agreement. |
| | • | The Board reviewed the advisory fees and overall expense ratios of the Fund and comparable funds using data from Morningstar with respect to funds similar in asset size and investment objective to the Fund. As part of the discussion with management, the Trustees ensured that they understood and were comfortable with the criteria used to determine the mutual funds included in the Morningstar categories for purposes of the materials considered at the meeting. The Board determined that the advisory fee and overall expense ratio of the Fund falls within the range of the advisory fees and overall expense ratios of other comparable funds and concluded that they are reasonable and warranted continuation of the advisory agreement. |
| | • | The Board also considered whether economies of scale were being realized by the Advisor that should be shared with the Fund’s shareholders. The Trustees noted that many of the expenses incurred to manage the Fund are asset-based fees and thus do not result in material economies of scale being realized as the net assets of the Fund increase. For example, intermediary service fees increase as the Fund’s assets grow. The Trustees also considered the Advisor’s efforts to contain expenses, and took into account the Advisor’s significant marketing efforts to increase Fund assets. The Board noted that at current asset levels it did not appear that there were economies of scale being realized by the Advisor and concluded that it would continue to monitor economies of scale in the future as circumstances changed. |
| | • | The Board considered the profitability of the Advisor, including the impact of intermediary service fees on the Advisor’s profitability, and also considered the resources and revenues that the Advisor has put into managing and distributing the Fund. The Board then concluded that the profits of the Advisor are reasonable and not excessive when compared to profitability guidelines set forth in relevant court cases. |
| HENNESSY FUNDS | 1-800-966-4354 | |
| | • | The Board considered the high level of professionalism and knowledge of the Advisor’s employees, along with a very low level of turnover, and concluded that this was beneficial to the Fund and its shareholders. |
| | • | The Board considered other benefits to the Advisor from serving as an advisor to the Fund (in addition to the advisory fee). The Board noted that the Advisor may derive ancillary benefits from, by way of example, its association with the Fund in the form of proprietary and third-party research products and services received from broker dealers that execute portfolio trades for the Fund. The Board determined that any such products and services have been used for legitimate purposes relating to the Fund by providing assistance in the investment decision-making process. The Trustees concluded that the other benefits realized by the Advisor from its relationship with the Fund were reasonable. |
After reviewing the materials provided at the meeting and management’s presentation, as well as other information regularly provided at the Board’s quarterly meetings throughout the year regarding the quality of services provided by the Advisor, the performance of the Fund, expense information, regulatory compliance issues, trading information and related matters, and other factors deemed relevant by the Board, the Trustees, including all of the Independent Trustees, approved the continuation of the advisory agreement.
(This Page Intentionally Left Blank.)-
For information, questions or assistance, please call
The Hennessy Funds
1-800-966-4354 or 1-415-899-1555
INVESTMENT ADVISOR
Hennessy Advisors, Inc.
7250 Redwood Blvd., Suite 200
Novato, California 94945
ADMINISTRATOR,
TRANSFER AGENT,
DIVIDEND PAYING AGENT &
SHAREHOLDER SERVICING AGENT
U.S. Bancorp Fund Services, LLC
P.O. Box 701
Milwaukee, Wisconsin 53201-0701
CUSTODIAN
U.S. Bank N.A.
Custody Operations
1555 North River Center Dr., Suite 302
Milwaukee, Wisconsin 53212
TRUSTEES
Neil J. Hennessy
Robert T. Doyle
J. Dennis DeSousa
Gerald P. Richardson
COUNSEL
Foley & Lardner LLP
777 East Wisconsin Avenue
Milwaukee, Wisconsin 53202-5306
INDEPENDENT REGISTERED
PUBLIC ACCOUNTING FIRM
Tait, Weller & Baker LLP
1818 Market Street, Suite 2400
Philadelphia, Pennsylvania 19103
DISTRIBUTOR
Quasar Distributors, LLC
615 East Michigan Street
Milwaukee, Wisconsin 53202
hennessyfunds.com | 1-800-966-4354
This report has been prepared for shareholders and may be distributed to
others only if preceded or accompanied by a current prospectus.
SEMI-ANNUAL REPORT
APRIL 30, 2016
HENNESSY TECHNOLOGY FUND
Investor Class HTECX
Institutional Class HTCIX
hennessyfunds.com | 1-800-966-4354
(This Page Intentionally Left Blank.)
Contents
| Letter to Shareholders | 2 |
| Performance Overview | 4 |
| Financial Statements | |
| Schedule of Investments | 6 |
| Statement of Assets and Liabilities | 10 |
| Statement of Operations | 11 |
| Statements of Changes in Net Assets | 13 |
| Financial Highlights | 14 |
| Notes to the Financial Statements | 18 |
| Expense Example | 26 |
| Proxy Voting | 28 |
| Quarterly Filings on Form N-Q | 28 |
| Householding | 28 |
| Board Approval of Investment Advisory Agreement | 29 |
| HENNESSY FUNDS | 1-800-966-4354 | |
June 2016
Dear Hennessy Funds Shareholder:
I used to tell my kids, “What doesn’t kill you makes you stronger.” Perhaps that is not the best analogy for investing, but in the face of such roller coaster volatility in the financial markets, it seems to me that what hasn’t killed this bull market rally may just make it stronger. The financial markets brought us flat to modest returns during the six months ended April 30, 2016, with the S&P 500 Index returning 0.43% and the Dow Jones Industrial Average (DJIA) returning 1.98% during the period. These six months were marked by high volatility, the onslaught of more and more regulatory hurdles, the Fed stuck in neutral, fears about the global economy, and wild political rhetoric — all headwinds that I believe could have significantly stalled any positive moves in the market, but didn’t. Even the aggressive pull back in January showed just how skittish the market can be, and yet again the markets showed great resiliency and marched right back.
I continue to be impressed with the persistence of the bull market in U.S. equities, now in its seventh year. Many commentators believe that the U.S. economy is due for a recession, and the market is due for a downturn. However, we find ourselves comparing today’s secular market to the bull run of 1982 to 2000, which was powered by a significant increase in valuations. On March 9th of this year, I took a moment to remember how we all felt seven years ago on March 9, 2009, at the bottom of the financial crisis downturn that had wiped out trillions of dollars’ worth of U.S. equities. I explained to our investors then, and I say the same thing today, I believe that if you invest in quality companies with good fundamentals, over the long term, you should do fine.
If history is any kind of guide, then I think this bull market has some room to run. Rising markets usually fall when there is extreme optimism or euphoria. I haven’t witnessed any of that as of yet. The volatility has unnerved many, but I encourage investors to try to remain focused on investment fundamentals. Many U.S. companies continue to find ways to make a profit and build their already strong balance sheets. Unemployment is low, and wages are rising in real terms, supporting consumer confidence and consumption. With an average price-to-sales ratio of only 1.7x and a dividend yield of approximately 2.5% for the Dow, I believe U.S. equities continue to be attractive. In my opinion, there are many compelling reasons why this market can continue to climb even higher.
The next six months may be fraught with more talk about what the Fed will do, who the next President of the United States will be, and what is happening in China and around the globe. Businesses in every industry, including the asset management business, have concerns about increasing regulatory burdens, taxes, and higher healthcare costs. But, I still believe the ingenuity and perseverance of American business will find ways to endure and to thrive.
Thank you for your continued confidence and investment in our products. If you have any questions or would like to speak with us directly, please don’t hesitate to call us at (800) 966-4354.
Best regards,
Neil J. Hennessy
President and Chief Investment Officer
Past performance does not guarantee future results.
Mutual fund investing involves risk. Principal loss is possible.
Opinions expressed are those of Neil Hennessy and are subject to change, are not guaranteed and should not be considered investment advice.
Price-to-sales ratio is a tool for calculating a stock’s valuation relative to other companies. It is calculated by dividing a stock’s current price by its revenue per share. Dividend yield is calculated as the annual dividends paid by a company divided by its market price per share.
The Dow Jones Industrial Average and S&P 500 Index are unmanaged indices commonly used to measure the performance of U.S. stocks. One cannot invest directly in an index.
| HENNESSY FUNDS | 1-800-966-4354 | |
Performance Overview (Unaudited)
AVERAGE ANNUAL TOTAL RETURN FOR PERIODS ENDED APRIL 30, 2016
| | Six | One | Five | Ten |
| | Months(1) | Year | Years | Years |
| Hennessy Technology Fund – | | | | |
| Investor Class (HTECX) | -5.21% | -4.71% | 3.28% | 3.25% |
| Hennessy Technology Fund – | | | | |
Institutional Class (HTCIX)(2) | -5.01% | -4.33% | 3.57% | 3.42% |
| NASDAQ Composite Index | -4.91% | -2.19% | 12.11% | 8.65% |
| S&P 500 Index | 0.43% | 1.21% | 11.02% | 6.91% |
Expense ratios: 3.14% (Investor Class); 2.77% (Institutional Class)
Performance data quoted represents past performance; past performance does not guarantee future results. The investment return and principal value of an investment will fluctuate so that an investor’s shares, when redeemed, may be worth more or less than their original cost. The performance table does not reflect the deduction of taxes that a shareholder would pay on Fund distributions or the redemption of Fund shares. Current performance of the Fund may be lower or higher than the performance quoted. Performance data current to the most recent month end may be obtained by visiting hennessyfunds.com. Performance for periods prior to October 26, 2012, is that of the FBR Technology Fund.
The expense ratios presented are from the most recent prospectus.
(1) | Periods less than one year are not annualized. |
(2) | The inception date of the Institutional Class shares is March 12, 2010. Performance shown prior to the inception of the Institutional Class shares reflects the performance of the Investor Class shares and includes expenses that are not applicable to and are higher than those of the Institutional Class shares. |
PERFORMANCE NARRATIVE
Portfolio Managers Winsor H. (Skip) Aylesworth and David H. Ellison
Performance:
For the six-month period ended April 30, 2016, the Investor Class of the Hennessy Technology Fund returned -5.21%, slightly underperforming the NASDAQ Composite Index and trailing the S&P 500 Index, which returned -4.91% and 0.43%, respectively, for the period.
Sector allocation accounted for most of the Fund’s underperformance over the period versus its primary benchmark. Investments in the Information Technology and Biotechnology sectors were the primary detractors from the Fund’s relative performance. The Social Networking segment included both winners and losers for the Fund over the period, while our investments in the Consumer Discretionary sector had the greatest contribution to positive relative performance.
One of the Fund’s top-performing investments was Facebook, Inc., which was up over 15% for the six-month period. A small holding, DreamWorks Animation SKG, Inc. produced the Fund’s greatest six-month return of 60%, the result of a purchase offer by Comcast Corp. Two large positions in the Fund that hurt performance were Apple, Inc. and Gilead Sciences, Inc. Apple slipped over 20% on evidence of slower growth for the iPhone, and Gilead Sciences retreated 18% on concerns the stock was getting overvalued. Two smaller positions in Social Media, LinkedIn Corp and Twitter, Inc., also declined over
the period. Both companies reported disappointing sales growth. As of the date of this report, we continue to own all the companies mentioned except DreamWorks Animation and Comcast.
Portfolio Strategy:
The Fund’s investment strategy is based on identifying Technology-related stocks with a history of growing revenue, profit and tangible book value. We focus on companies that we believe have strong business models and sustainable competitive advantages, which are difficult characteristics to find sometimes in an industry where innovation moves so quickly. We believe the Fund’s holdings are representative of the Technology sector as a whole, as it owns not only large, well-known names, but also a collection of smaller companies that are growing quickly. We think this approach meets our goal of offering a conservative way to invest in a highly volatile area of the market.
Investment Outlook:
The last six months was a difficult period for Technology and the sector underperformed the overall market. While research and development continues behind the scenes, no significant new products were launched over the period to attract investor attention. Revenue growth generally was disappointing, which some investors interpreted as a sign of general economic weakness, both domestically and around the world. Nevertheless, the Fund continues to offer investors exposure to companies that are working on innovative solutions to common problems, developing products to increase productivity and in bringing new and attractive consumer products to market. We remain confident and optimistic for the future.
Opinions expressed are those of the Portfolio Managers as of the date written and are subject to change, are not guaranteed, and should not be considered investment advice or an indication of trading intent.
The NASDAQ Composite Index is a broad-based capitalization-weighted index of all the NASDAQ National Market and Small Cap stocks. The S&P 500 Index is an unmanaged index commonly used to measure the performance of U.S. stocks. One cannot invest directly in an index.
The Fund is non-diversified, meaning it may concentrate its assets in fewer individual holdings than a diversified fund, making it more exposed to individual stock volatility than a diversified fund. Investments are focused in the technology industry; sector funds may be subject to a higher degree of market risk. Investments in foreign securities may involve political, economic and currency risks, greater volatility and differences in accounting methods. The Fund invests in small and medium sized companies, which may have more limited liquidity and greater volatility compared to larger companies.
References to specific securities should not be considered a recommendation to buy or sell any security. Fund holdings and sector allocations are subject to change. Please refer to the Schedule of Investments included in this report for additional portfolio information.
Tangible book value is a method of valuing a company by measuring its equity after removing any intangible assets.
| HENNESSY FUNDS | 1-800-966-4354 | |
Financial Statements
Schedule of Investments as of April 30, 2016 (Unaudited) |
HENNESSY TECHNOLOGY FUND
(% of Net Assets)
| TOP TEN HOLDINGS (EXCLUDING CASH/CASH EQUIVALENTS) | % NET ASSETS |
| Amazon.com, Inc. | 4.10% |
| Alibaba Group Holding Ltd. | 3.92% |
| Facebook, Inc. | 3.74% |
| Apple, Inc. | 3.48% |
| Tencent Holdings Ltd. | 3.44% |
| Visa, Inc., Class A | 3.34% |
| Alphabet, Inc., Class C | 3.32% |
| Oracle Corp. | 3.24% |
| Intel Corp. | 2.59% |
| Cisco Systems, Inc. | 2.51% |
Note: For presentation purposes, the Fund has grouped some of the industry categories. For purposes of categorizing securities for compliance with section 8(b)(1) of the Investment Company Act of 1940, as amended, the Fund uses more specific industry classifications.
| | COMMON STOCKS – 89.87% | | Number | | | | | | % of | |
| | | | of Shares | | | Value | | | Net Assets | |
| | Consumer Discretionary – 9.80% | | | | | | | | | |
| | Amazon.com, Inc. (a) | | | 286 | | | $ | 188,643 | | | | 4.10 | % |
| | Ctrip.com International Ltd. – ADR (a) (b) | | | 955 | | | | 41,647 | | | | 0.90 | % |
| | Dish Network Corp. (a) | | | 820 | | | | 40,418 | | | | 0.88 | % |
| | IMAX Corp. (a) (b) | | | 1,315 | | | | 42,080 | | | | 0.91 | % |
| | Netflix, Inc. (a) | | | 455 | | | | 40,964 | | | | 0.89 | % |
| | priceline.com, Inc. (a) | | | 42 | | | | 56,434 | | | | 1.23 | % |
| | Wayfair, Inc., Class A (a) | | | 1,090 | | | | 41,147 | | | | 0.89 | % |
| | | | | | | | | 451,333 | | | | 9.80 | % |
| | | | | | | | | | | | | | |
| | Health Care – 17.49% | | | | | | | | | | | | |
| | Alexion Pharmaceuticals, Inc. (a) | | | 267 | | | | 37,188 | | | | 0.81 | % |
| | Amgen, Inc. | | | 664 | | | | 105,111 | | | | 2.28 | % |
| | Biogen, Inc. (a) | | | 195 | | | | 53,623 | | | | 1.16 | % |
| | Celgene Corp. (a) | | | 689 | | | | 71,250 | | | | 1.55 | % |
| | DexCom, Inc. (a) | | | 685 | | | | 44,100 | | | | 0.96 | % |
| | Gilead Sciences, Inc. | | | 1,188 | | | | 104,794 | | | | 2.27 | % |
| | Illumina, Inc. (a) | | | 274 | | | | 36,987 | | | | 0.80 | % |
| | Incyte Corp. (a) | | | 615 | | | | 44,446 | | | | 0.96 | % |
| | Intuitive Surgical, Inc. (a) | | | 70 | | | | 43,845 | | | | 0.95 | % |
| | McKesson Corp. | | | 248 | | | | 41,619 | | | | 0.90 | % |
| | Medtronic PLC (b) | | | 1,170 | | | | 92,606 | | | | 2.01 | % |
| | Regeneron Pharmaceuticals (a) | | | 100 | | | | 37,671 | | | | 0.82 | % |
| | Thermo Fisher Scientific, Inc. | | | 335 | | | | 48,324 | | | | 1.05 | % |
| | Zimmer Biomet Holdings, Inc. | | | 385 | | | | 44,571 | | | | 0.97 | % |
| | | | | | | | | 806,135 | | | | 17.49 | % |
| | | | | | | | | | | | | | |
| | Industrials – 1.30% | | | | | | | | | | | | |
| | Danaher Corp. | | | 621 | | | | 60,082 | | | | 1.30 | % |
| | | | | | | | | | | | | | |
| | Information Technology – 60.39% | | | | | | | | | | | | |
| | Activision Blizzard, Inc. | | | 1,195 | | | | 41,192 | | | | 0.89 | % |
| | Acxiom Corp. (a) | | | 2,165 | | | | 47,565 | | | | 1.03 | % |
| | Adobe Systems, Inc. (a) | | | 430 | | | | 40,515 | | | | 0.88 | % |
| | Alibaba Group Holding Ltd. – ADR (a) (b) | | | 2,345 | | | | 180,424 | | | | 3.92 | % |
| | Alphabet, Inc., Class C (a) | | | 221 | | | | 153,155 | | | | 3.32 | % |
| | Apple, Inc. | | | 1,711 | | | | 160,389 | | | | 3.48 | % |
| | ARM Holdings PLC – ADR (b) | | | 975 | | | | 40,160 | | | | 0.87 | % |
The accompanying notes are an integral part of these financial statements.
| HENNESSY FUNDS | 1-800-966-4354 | |
| | COMMON STOCKS | | Number | | | | | | % of | |
| | | | of Shares | | | Value | | | Net Assets | |
| | Information Technology (Continued) | | | | | | | | | |
| | Baidu, Inc. – ADR (a) (b) | | | 225 | | | $ | 43,718 | | | | 0.95 | % |
| | Broadcom Ltd. (b) | | | 261 | | | | 38,041 | | | | 0.83 | % |
| | Cisco Systems, Inc. | | | 4,210 | | | | 115,733 | | | | 2.51 | % |
| | Cognizant Technology Solutions Corp., Class A (a) | | | 730 | | | | 42,610 | | | | 0.93 | % |
| | Demandware, Inc. (a) | | | 1,080 | | | | 49,766 | | | | 1.08 | % |
| | Facebook, Inc. (a) | | | 1,465 | | | | 172,255 | | | | 3.74 | % |
| | FireEye, Inc. (a) | | | 2,141 | | | | 37,146 | | | | 0.81 | % |
| | Fitbit, Inc. (a) | | | 2,460 | | | | 44,895 | | | | 0.97 | % |
| | Fortinet, Inc. (a) | | | 1,410 | | | | 45,839 | | | | 1.00 | % |
| | Guidewire Software, Inc. (a) | | | 755 | | | | 43,012 | | | | 0.93 | % |
| | Imperva, Inc. (a) | | | 955 | | | | 44,388 | | | | 0.96 | % |
| | Infosys Ltd. – ADR (b) | | | 2,130 | | | | 40,044 | | | | 0.87 | % |
| | Intel Corp. | | | 3,940 | | | | 119,303 | | | | 2.59 | % |
| | JinkoSolar Holding Co. Ltd. – ADR (a) (b) | | | 2,030 | | | | 45,208 | | | | 0.98 | % |
| | MasterCard, Inc., Class A | | | 980 | | | | 95,050 | | | | 2.06 | % |
| | NetEase, Inc. – ADR (b) | | | 320 | | | | 45,024 | | | | 0.98 | % |
| | NetScout Systems, Inc. (a) | | | 1,970 | | | | 43,852 | | | | 0.95 | % |
| | Oracle Corp. | | | 3,750 | | | | 149,475 | | | | 3.24 | % |
| | Palo Alto Networks, Inc. (a) | | | 255 | | | | 38,472 | | | | 0.84 | % |
| | Paycom Software, Inc. (a) | | | 1,170 | | | | 44,706 | | | | 0.97 | % |
| | PayPal Holdings, Inc. (a) | | | 1,052 | | | | 41,217 | | | | 0.89 | % |
| | Pure Storage, Inc. (a) | | | 3,170 | | | | 46,124 | | | | 1.00 | % |
| | Qlik Technologies, Inc. (a) | | | 1,534 | | | | 47,232 | | | | 1.03 | % |
| | salesforce.com, Inc. (a) | | | 552 | | | | 41,842 | | | | 0.91 | % |
| | SAP SE – ADR (b) | | | 1,025 | | | | 80,586 | | | | 1.75 | % |
| | ServiceNow, Inc. (a) | | | 570 | | | | 40,744 | | | | 0.88 | % |
| | Splunk, Inc. (a) | | | 830 | | | | 43,143 | | | | 0.94 | % |
| | SS&C Technologies Holdings, Inc. | | | 655 | | | | 40,053 | | | | 0.87 | % |
| | Tencent Holdings Ltd. – ADR (b) | | | 7,810 | | | | 158,543 | | | | 3.44 | % |
| | TTM Technologies , Inc. (a) | | | 6,135 | | | | 40,000 | | | | 0.87 | % |
| | Twitter, Inc. (a) | | | 2,810 | | | | 41,082 | | | | 0.89 | % |
| | Visa, Inc., Class A | | | 1,995 | | | | 154,094 | | | | 3.34 | % |
| | VMware, Inc., Class A (a) | | | 810 | | | | 46,097 | | | | 1.00 | % |
| | | | | | | | | 2,782,694 | | | | 60.39 | % |
The accompanying notes are an integral part of these financial statements.
| | COMMON STOCKS | | Number | | | | | | % of | |
| | | | of Shares | | | Value | | | Net Assets | |
| | Telecommunication Services – 0.89% | | | | | | | | | |
| | T- Mobile US, Inc. (a) | | | 1,040 | | | $ | 40,851 | | | | 0.89 | % |
| | | | | | | | | | | | | | |
| | Total Common Stocks | | | | | | | | | | | | |
| | (Cost $4,072,606) | | | | | | | 4,141,095 | | | | 89.87 | % |
| | | | | | | | | | | | | | |
| | SHORT-TERM INVESTMENTS – 9.00% | | | | | | | | | | | | |
| | Money Market Funds – 9.00% | | | | | | | | | | | | |
| | Federated Government Obligations Fund, Class I, 0.21% (c) | | | 183,682 | | | | 183,682 | | | | 3.99 | % |
| | Fidelity Government Portfolio, Institutional Class, 0.23% (c) | | | 231,000 | | | | 231,000 | | | | 5.01 | % |
| | | | | | | | | 414,682 | | | | 9.00 | % |
| | Total Short-Term Investments | | | | | | | | | | | | |
| | (Cost $414,682) | | | | | | | 414,682 | | | | 9.00 | % |
| | | | | | | | | | | | | | |
| | Total Investments | | | | | | | | | | | | |
| | (Cost $4,487,288) – 98.87% | | | | | | | 4,555,777 | | | | 98.87 | % |
| | | | | | | | | | | | | | |
| | Other Assets in | | | | | | | | | | | | |
| | Excess of Liabilities – 1.13% | | | | | | | 52,102 | | | | 1.13 | % |
| | | | | | | | | | | | | | |
| | TOTAL NET ASSETS – 100.00% | | | | | | $ | 4,607,879 | | | | 100.00 | % |
Percentages are stated as a percent of net assets.
ADR – American Depositary Receipt
| (a) | Non-income producing security. |
| (b) | U.S. traded security of a foreign corporation. |
| (c) | The rate listed is the fund’s 7-day yield as of April 30, 2016. |
Summary of Fair Value Exposure at April 30, 2016
The following is a summary of the inputs used to value the Fund’s net assets as of April 30, 2016 (See Note 3 in the accompanying notes to the financial statements):
| Common Stocks | | Level 1 | | | Level 2 | | | Level 3 | | | Total | |
| Consumer Discretionary | | $ | 451,333 | | | $ | — | | | $ | — | | | $ | 451,333 | |
| Health Care | | | 806,135 | | | | — | | | | — | | | | 806,135 | |
| Industrials | | | 60,082 | | | | — | | | | — | | | | 60,082 | |
| Information Technology | | | 2,782,694 | | | | — | | | | — | | | | 2,782,694 | |
| Telecommunication Services | | | 40,851 | | | | — | | | | — | | | | 40,851 | |
| Total Common Stocks | | $ | 4,141,095 | | | $ | — | | | $ | — | | | $ | 4,141,095 | |
| Short-Term Investments | | | | | | | | | | | | | | | | |
| Money Market Funds | | $ | 414,682 | | | $ | — | | | $ | — | | | $ | 414,682 | |
| Total Short-Term Investments | | $ | 414,682 | | | $ | — | | | $ | — | | | $ | 414,682 | |
| Total Investments | | $ | 4,555,777 | | | $ | — | | | $ | — | | | $ | 4,555,777 | |
Transfers between levels are recognized at the end of the reporting period. During the six-month period ended April 30, 2016, the Fund recognized no transfers between levels.
The accompanying notes are an integral part of these financial statements.
| HENNESSY FUNDS | 1-800-966-4354 | |
Financial Statements
Statement of Assets and Liabilities as of April 30, 2016 (Unaudited) |
| ASSETS: | | | |
| Investments in securities, at value (cost $4,487,288) | | $ | 4,555,777 | |
| Dividends and interest receivable | | | 906 | |
| Receivable for fund shares sold | | | 15,207 | |
| Receivable for securities sold | | | 62,116 | |
| Prepaid expenses and other assets | | | 18,398 | |
| Total Assets | | | 4,652,404 | |
| | | | | |
| LIABILITIES: | | | | |
| Payable for securities purchased | | | 10,136 | |
| Payable to advisor | | | 3,398 | |
| Payable to administrator | | | 1,439 | |
| Payable to auditor | | | 10,236 | |
| Accrued distribution fees | | | 8,129 | |
| Accrued service fees | | | 301 | |
| Accrued trustees fees | | | 3,231 | |
| Accrued expenses and other payables | | | 7,655 | |
| Total Liabilities | | | 44,525 | |
| NET ASSETS | | $ | 4,607,879 | |
| | | | | |
| NET ASSETS CONSIST OF: | | | | |
| Capital stock | | $ | 4,973,316 | |
| Accumulated net investment loss | | | (147,659 | ) |
| Accumulated net realized loss on investments | | | (286,267 | ) |
| Unrealized net appreciation on investments | | | 68,489 | |
| Total Net Assets | | $ | 4,607,879 | |
| | | | | |
| NET ASSETS | | | | |
| Investor Class: | | | | |
| Shares authorized (no par value) | | Unlimited | |
| Net assets applicable to outstanding Investor Class shares | | $ | 3,678,814 | |
| Shares issued and outstanding | | | 252,639 | |
| Net asset value, offering price and redemption price per share | | $ | 14.56 | |
| | | | | |
| Institutional Class: | | | | |
| Shares authorized (no par value) | | Unlimited | |
| Net assets applicable to outstanding Institutional Class shares | | $ | 929,065 | |
| Shares issued and outstanding | | | 62,793 | |
| Net asset value, offering price and redemption price per share | | $ | 14.80 | |
The accompanying notes are an integral part of these financial statements.
Financial Statements
Statement of Operations for the six months ended April 30, 2016 (Unaudited) |
| INVESTMENT INCOME: | | | |
Dividend income(1) | | $ | 15,325 | |
| Interest income | | | 188 | |
| Total investment income | | | 15,513 | |
| | | | | |
| EXPENSES: | | | | |
| Investment advisory fees (See Note 5) | | | 20,654 | |
| Federal and state registration fees | | | 13,643 | |
| Compliance expense | | | 11,790 | |
| Audit fees | | | 10,235 | |
| Trustees’ fees and expenses | | | 5,984 | |
| Reports to shareholders | | | 4,363 | |
| Distribution fees – Investor Class (See Note 5) | | | 2,765 | |
| Sub-transfer agent expenses – Investor Class (See Note 5) | | | 2,267 | |
| Sub-transfer agent expenses – Institutional Class (See Note 5) | | | 103 | |
| Administration, fund accounting, custody and transfer agent fees | | | 2,250 | |
| Service fees – Investor Class (See Note 5) | | | 1,843 | |
| Other expenses | | | 1,876 | |
| Total expenses | | | 77,773 | |
| NET INVESTMENT LOSS | | $ | (62,260 | ) |
| | | | | |
| REALIZED AND UNREALIZED GAINS (LOSSES): | | | | |
| Net realized gain on investments | | $ | 13,716 | |
| Net change in unrealized appreciation on investments | | | (208,153 | ) |
| Net loss on investments | | | (194,437 | ) |
| NET DECREASE IN NET ASSETS RESULTING FROM OPERATIONS | | $ | (256,697 | ) |
(1) | Net of foreign taxes withheld and issuance fees of $31. |
The accompanying notes are an integral part of these financial statements.
| HENNESSY FUNDS | 1-800-966-4354 | |
(This Page Intentionally Left Blank.)
Financial Statements
| Statements of Changes in Net Assets |
| | | Six Months Ended | | | | |
| | | April 30, 2016 | | | Year Ended | |
| | | (Unaudited) | | | October 31, 2015 | |
| OPERATIONS: | | | | | | |
| Net investment loss | | $ | (62,260 | ) | | $ | (98,868 | ) |
| Net realized gain on investments | | | 13,716 | | | | 422,069 | |
| Net change in unrealized depreciation on investments | | | (208,153 | ) | | | (136,502 | ) |
| Net increase (decrease) in net assets resulting from operations | | | (256,697 | ) | | | 186,699 | |
| | | | | | | | | |
| CAPITAL SHARE TRANSACTIONS: | | | | | | | | |
| Proceeds from shares subscribed – Investor Class | | | 182,092 | | | | 406,595 | |
| Proceeds from shares subscribed – Institutional Class | | | 31,572 | | | | 59,079 | |
| Cost of shares redeemed – Investor Class | | | (330,381 | ) | | | (1,513,565 | ) |
| Cost of shares redeemed – Institutional Class | | | (5,218 | ) | | | (78,903 | ) |
| Net decrease in net assets derived | | | | | | | | |
| from capital share transactions | | | (121,935 | ) | | | (1,126,794 | ) |
| TOTAL DECREASE IN NET ASSETS | | | (378,632 | ) | | | (940,095 | ) |
| | | | | | | | | |
| NET ASSETS: | | | | | | | | |
| Beginning of period | | | 4,986,511 | | | | 5,926,606 | |
| End of period | | $ | 4,607,879 | | | $ | 4,986,511 | |
| Undistributed net investment loss, end of period | | $ | (147,659 | ) | | $ | (85,399 | ) |
| | | | | | | | | |
| CHANGES IN SHARES OUTSTANDING: | | | | | | | | |
| Shares sold – Investor Class | | | 12,769 | | | | 26,994 | |
| Shares sold – Institutional Class | | | 2,181 | | | | 3,902 | |
| Shares redeemed – Investor Class | | | (22,962 | ) | | | (100,179 | ) |
| Shares redeemed – Institutional Class | | | (377 | ) | | | (5,099 | ) |
| Net decrease in shares outstanding | | | (8,389 | ) | | | (74,382 | ) |
The accompanying notes are an integral part of these financial statements.
| HENNESSY FUNDS | 1-800-966-4354 | |
Financial Statements
For an Investor Class share outstanding throughout each period
| | | Six Months Ended | |
| | | April 30, 2016 | |
| | | (Unaudited) | |
| PER SHARE DATA: | | | |
| Net asset value, beginning of period | | $ | 15.36 | |
| | | | | |
| Income (loss) from investment operations: | | | | |
| Net investment loss | | | (0.22 | ) |
| Net realized and unrealized gains (losses) on investments | | | (0.58 | ) |
| Total from investment operations | | | (0.80 | ) |
| Net asset value, end of period | | $ | 14.56 | |
| | | | | |
| TOTAL RETURN | | | (5.21 | )%(2) |
| | | | | |
| SUPPLEMENTAL DATA AND RATIOS: | | | | |
| Net assets, end of period (millions) | | $ | 3.68 | |
| Ratio of expenses to average net assets: | | | | |
| Before expense reimbursement | | | 3.46 | %(3) |
| After expense reimbursement | | | 3.46 | %(3) |
| Ratio of net investment loss to average net assets: | | | | |
| Before expense reimbursement | | | (2.78 | )%(3) |
| After expense reimbursement | | | (2.78 | )%(3) |
Portfolio turnover rate(4) | | | 82 | %(2) |
(1) | Calculated based on average shares outstanding method. |
(2) | Not annualized. |
(3) | Annualized. |
(4) | Portfolio turnover is calculated on the basis of the Fund as a whole. |
The accompanying notes are an integral part of these financial statements.
| Year Ended October 31, | |
| 2015 | | | 2014 | | | 2013 | | | 2012 | | | 2011 | |
| | | | | | | | | | | | | | |
| $ | 14.86 | | | $ | 13.57 | | | $ | 10.67 | | | $ | 10.86 | | | $ | 11.00 | |
| | | | | | | | | | | | | | | | | | | |
| | | | | | | | | | | | | | | | | | | |
| | (0.38 | ) | | | (0.23 | ) | | | (0.20 | ) | | | (0.15 | ) | | | (0.17 | )(1) |
| | 0.88 | | | | 1.52 | | | | 3.10 | | | | (0.04 | ) | | | 0.03 | |
| | 0.50 | | | | 1.29 | | | | 2.90 | | | | (0.19 | ) | | | (0.14 | ) |
| $ | 15.36 | | | $ | 14.86 | | | $ | 13.57 | | | $ | 10.67 | | | $ | 10.86 | |
| | | | | | | | | | | | | | | | | | | |
| | 3.36 | % | | | 9.51 | % | | | 27.18 | % | | | (1.75 | )% | | | (1.27 | )% |
| | | | | | | | | | | | | | | | | | | |
| | | | | | | | | | | | | | | | | | | |
| $ | 4.04 | | | $ | 4.99 | | | $ | 4.49 | | | $ | 4.44 | | | $ | 5.70 | |
| | | | | | | | | | | | | | | | | | | |
| | 3.13 | % | | | 2.92 | % | | | 3.04 | % | | | 3.20 | % | | | 2.79 | % |
| | 2.75 | % | | | 1.95 | % | | | 1.95 | % | | | 1.95 | % | | | 1.95 | % |
| | | | | | | | | | | | | | | | | | | |
| | (2.30 | )% | | | (2.53 | )% | | | (2.36 | )% | | | (2.39 | )% | | | (2.38 | )% |
| | (1.92 | )% | | | (1.55 | )% | | | (1.27 | )% | | | (1.14 | )% | | | (1.54 | )% |
| | 163 | % | | | 204 | % | | | 164 | % | | | 138 | % | | | 141 | % |
The accompanying notes are an integral part of these financial statements.
| HENNESSY FUNDS | 1-800-966-4354 | |
Financial Statements
For an Institutional Class share outstanding throughout each period
| | | Six Months Ended | |
| | | April 30, 2016 | |
| | | (Unaudited) | |
| PER SHARE DATA: | | | |
| Net asset value, beginning of period | | $ | 15.58 | |
| | | | | |
| Income (loss) from investment operations: | | | | |
| Net investment loss | | | (0.17 | ) |
| Net realized and unrealized gains (losses) on investments | | | (0.61 | ) |
| Total from investment operations | | | (0.78 | ) |
| Net asset value, end of period | | $ | 14.80 | |
| | | | | |
| TOTAL RETURN | | | (5.01 | )%(2) |
| | | | | |
| SUPPLEMENTAL DATA AND RATIOS: | | | | |
| Net assets, end of period (millions) | | $ | 0.93 | |
| Ratio of expenses to average net assets: | | | | |
| Before expense reimbursement | | | 3.11 | %(3) |
| After expense reimbursement | | | 3.11 | %(3) |
| Ratio of net investment loss to average net assets: | | | | |
| Before expense reimbursement | | | (2.44 | )%(3) |
| After expense reimbursement | | | (2.44 | )%(3) |
Portfolio turnover rate(4) | | | 82 | %(2) |
(1) | Calculated based on average shares outstanding method. |
(2) | Not annualized. |
(3) | Annualized. |
(4) | Portfolio turnover is calculated on the basis of the Fund as a whole. |
The accompanying notes are an integral part of these financial statements.
| Year Ended October 31, | |
| 2015 | | | 2014 | | | 2013 | | | 2012 | | | 2011 | |
| | | | | | | | | | | | | | |
| $ | 15.02 | | | $ | 13.68 | | | $ | 10.73 | | | $ | 10.89 | | | $ | 11.00 | |
| | | | | | | | | | | | | | | | | | | |
| | | | | | | | | | | | | | | | | | | |
| | (0.25 | ) | | | (0.26 | ) | | | (0.12 | ) | | | (0.11 | ) | | | (0.14 | )(1) |
| | 0.81 | | | | 1.60 | | | | 3.07 | | | | (0.05 | ) | | | 0.03 | |
| | 0.56 | | | | 1.34 | | | | 2.95 | | | | (0.16 | ) | | | (0.11 | ) |
| $ | 15.58 | | | $ | 15.02 | | | $ | 13.68 | | | $ | 10.73 | | | $ | 10.89 | |
| | | | | | | | | | | | | | | | | | | |
| | 3.73 | % | | | 9.80 | % | | | 27.49 | % | | | (1.47 | )% | | | (1.00 | )% |
| | | | | | | | | | | | | | | | | | | |
| | | | | | | | | | | | | | | | | | | |
| $ | 0.95 | | | $ | 0.93 | | | $ | 1.19 | | | $ | 0.93 | | | $ | 1.16 | |
| | | | | | | | | | | | | | | | | | | |
| | 2.76 | % | | | 2.60 | % | | | 2.76 | % | | | 4.11 | % | | | 3.45 | % |
| | 2.44 | % | | | 1.70 | % | | | 1.70 | % | | | 1.70 | % | | | 1.70 | % |
| | | | | | | | | | | | | | | | | | | |
| | (1.92 | )% | | | (2.23 | )% | | | (2.10 | )% | | | (3.31 | )% | | | (2.99 | )% |
| | (1.60 | )% | | | (1.33 | )% | | | (1.04 | )% | | | (0.90 | )% | | | (1.24 | )% |
| | 163 | % | | | 204 | % | | | 164 | % | | | 138 | % | | | 141 | % |
The accompanying notes are an integral part of these financial statements.
| HENNESSY FUNDS | 1-800-966-4354 | |
Financial Statements
Notes to the Financial Statements April 30, 2016 (Unaudited) |
1). ORGANIZATION
The Hennessy Technology Fund (the “Fund”) is a series of Hennessy Funds Trust (the “Trust”), which was organized as a Delaware statutory trust on September 17, 1992. The Fund is an open-end management investment company registered under the Investment Company Act of 1940, as amended. The Fund is a successor to the FBR Technology Fund (the “Predecessor FBR Fund”), a series of The FBR Funds, a Delaware statutory trust, pursuant to a reorganization that took place after the close of business on October 26, 2012. Prior to October 26, 2012, the Fund had no investment operations. As a result of the reorganization, holders of the Investor Class shares of the Predecessor FBR Fund received Investor Class shares of the Fund (the Investor Class shares of the Fund are the successor to the accounting and performance information of the Predecessor FBR Fund), and holders of the Institutional Class shares of the Predecessor FBR Fund received Institutional Class shares of the Fund (the Institutional Class shares of the Fund are the successor to the accounting and performance information of the Predecessor FBR Fund). The investment objective of the Fund is capital appreciation. The Fund is a non-diversified fund.
The Fund offers Investor Class and Institutional Class shares. Each class of shares differs principally in its respective administration, 12b-1 distribution and service, shareholder servicing, and transfer agent expenses and sales charges, if any. Each class has identical rights to earnings, assets, and voting privileges, except for class-specific expenses and exclusive rights to vote on matters affecting only an individual class.
As an investment company, the Fund follows the investment company accounting and reporting guidance of the Financial Accounting Standards Board (“FASB”) Accounting Standard Codification Topic 946 “Financial Services—Investment Companies.”
2). SIGNIFICANT ACCOUNTING POLICIES
The following is a summary of significant accounting policies consistently followed by the Fund in the preparation of the financial statements. These policies are in conformity with U.S. generally accepted accounting principles (“GAAP”).
| a). | Investment Valuation – All investments in securities are recorded at their estimated fair value, as described in Note 3. |
| b). | Federal Income Taxes – Provision for federal income taxes or excise taxes has not been made since the Fund has elected to be taxed as a “regulated investment company” and intends to distribute substantially all of its taxable income to its shareholders and otherwise comply with the provisions of the Internal Revenue Code of 1986, as amended, applicable to regulated investment companies. Net investment income or loss and realized gains and losses for federal income tax purposes may differ from that reported on the financial statements because of temporary book and tax basis differences. Temporary differences are primarily the result of the treatment of wash sales for tax reporting purposes. The Fund recognizes interest and penalties related to income tax benefits, if any, in the statement of operations as an income tax expense. Distributions from net realized gains for book purposes may include short-term capital gains, which are included as ordinary income to shareholders for tax purposes. |
| c). | Income and Expenses – Dividend income is recognized on the ex-dividend date or as soon as information is available to the Fund. Interest income, which includes the amortization of premium and accretion of discount, is recognized on an accrual basis. The Fund is charged for those expenses that are directly attributable to the portfolio, such as advisory, administration, and certain shareholder service fees. Income, expenses (other than expenses attributable to a specific class), and realized and unrealized gains or losses on investments are allocated to each class of shares based on its respective net assets. |
| d). | Distributions to Shareholders – Dividends from net investment income for the Fund, if any, are declared and paid annually, usually in December. Distributions of net realized capital gains, if any, are declared and paid annually, usually in December. |
| e). | Security Transactions – Investment and shareholder transactions are recorded on the trade date. The Fund determines the gain or loss realized from the investment transactions by comparing the original cost of the security lot sold with the net sale proceeds. Discounts and premiums on securities purchased are accreted/amortized over the life of the respective security. |
| f). | Use of Estimates – The preparation of financial statements in conformity with GAAP requires management to make estimates and assumptions that affect the reported amounts of assets and liabilities and disclosure of contingent assets and liabilities at the date of the financial statements and the reported change in net assets during the reporting period. Actual results could differ from those estimates. |
| g). | Share Valuation – The net asset value (“NAV”) per share of the Fund is calculated by dividing the sum of the value of the securities held by the Fund, plus cash or other assets, minus all liabilities (including estimated accrued expenses) by the total number of shares outstanding for the Fund, rounded to the nearest cent. The Fund’s shares will not be priced on days the New York Stock Exchange is closed for trading. The offering and redemption price per share for the Fund is equal to the Fund’s NAV per share. |
| h). | Foreign Currency – Values of investments denominated in foreign currencies, if any, are converted into U.S. dollars using the spot market rate of exchange at the time of valuation. Purchases and sales of investments and income are translated into U.S. dollars using the spot market rate of exchange prevailing on the respective dates of such transactions. The Fund does not isolate the portion of the results of operations resulting from fluctuations in foreign exchange rates on investments from fluctuations resulting from changes in the market prices of securities held. Such fluctuations are included with the net realized and unrealized gain or loss on investments. Foreign investments present additional risks due to currency fluctuations, economic and political factors, lower liquidity, government regulations, differences in accounting standards, and other factors. |
| i). | Forward Contracts – The Fund may enter into forward currency contracts to reduce its exposure to changes in foreign currency exchange rates on its foreign holdings and to lock in the U.S. dollar cost of firm purchase and sale commitments for securities denominated in foreign currencies. A forward currency contract is a commitment to purchase or sell a foreign currency at a future date at a negotiated forward rate. The gain or loss arising from the difference between the U.S. dollar cost of the original contract and the value of the foreign currency in U.S. dollars upon closing of such contract is included in net realized gain or loss from foreign currency transactions. During the six months ended April 30, 2016, the Fund did not enter into any forward contracts. |
| HENNESSY FUNDS | 1-800-966-4354 | |
| j). | Repurchase Agreements – The Fund may enter into repurchase agreements with member banks or security dealers of the Federal Reserve Board whom the investment advisor deems creditworthy. The repurchase price generally equals the price paid by the Fund plus interest negotiated on the basis of current short-term rates. |
| | Securities pledged as collateral for repurchase agreements are held by the custodian bank until the respective agreements mature. Provisions of the repurchase agreements ensure that the market value of the collateral, including accrued interest thereon, is sufficient to cover the repurchase amount in the event of default of the counterparty. If the counterparty defaults and the value of the collateral declines or if the counterparty enters an insolvency proceeding, realization of the collateral by the Fund may be delayed or limited. |
| k). | Accounting for Uncertainty in Income Taxes – The Fund has accounting policies regarding recognition and measurement of tax positions taken or expected to be taken on a tax return. The tax returns of the Fund for the prior three fiscal years are open for examination. The Fund has reviewed all open tax years in major jurisdictions and concluded that there is no impact on the Fund’s net assets and no tax liability resulting from unrecognized tax benefits relating to uncertain income tax positions taken or expected to be taken on a tax return. The Fund’s major tax jurisdictions are U.S. federal and Delaware. |
| l). | Derivatives – The Fund may invest in, or enter into, derivatives, such as options, futures contracts, options on futures contracts, and swaps, for a variety of reasons, including to hedge certain risks, to provide a substitute for purchasing or selling particular securities, or to increase potential income gain. Derivatives are financial contracts based on an underlying or notional amount, require no initial investment or an initial net investment that is smaller than would normally be required to have a similar response to changes in market factors, and require or permit net settlement. Derivatives may allow the Fund to increase or decrease the level of risk to which the Fund is exposed more quickly and efficiently than transactions in other types of instruments. The main purpose of utilizing derivative instruments is for hedging purposes. |
| | The Fund follows the financial accounting reporting rules as required by the Derivatives and Hedging Topic of the FASB Accounting Standards Codification. Under such rules, the Fund is required to include enhanced disclosure that enables investors to understand how and why an entity uses derivatives, how derivatives are accounted for, and how derivatives instruments affect an entity’s results of operations and financial position. During the six months ended April 30, 2016, the Fund did not hold any derivative instruments. |
| m). | New Accounting Pronouncements – In May 2015, the FASB issued ASU No. 2015-07 “Disclosure for Investments in Certain Entities that Calculate Net Asset Value per Share (or Its Equivalent).” The amendments in ASU No. 2015-07 remove the requirement to categorize within the fair value hierarchy investments measured at NAV and require the disclosure of sufficient information to reconcile the fair value of the remaining assets categorized within the fair value hierarchy to the financial statements. The amendments in ASU No. 2015-07 are effective for fiscal years beginning after December 15, 2015, and interim periods within those fiscal years. Management has reviewed the requirements and believes the adoption of ASU 2015-07 will not have a material impact on the Fund’s financial statements and related disclosures. |
3). SECURITIES VALUATION
The Fund follows authoritative fair valuation accounting standards that establish an authoritative definition of fair value and set out a hierarchy for measuring fair value.
These standards require additional disclosures about the various inputs and valuation techniques used to develop the measurements of fair value and a discussion in changes in valuation techniques and related inputs during the period. These inputs are summarized in the three broad levels listed below:
| | Level 1 – | Unadjusted, quoted prices in active markets for identical instruments that the Fund has the ability to access at the date of measurement. |
| | Level 2 – | Other significant observable inputs (including, but not limited to, quoted prices in active markets for similar instruments, quoted prices in markets that are not active for identical or similar instruments, and model-derived valuations in which all significant inputs and significant value drivers are observable in active markets (such as interest rates, prepayment speeds, credit risk curves, default rates, and similar data)). |
| | Level 3 – | Significant unobservable inputs (including the Fund’s own assumptions about what market participants would use to price the asset or liability based on the best available information) when observable inputs are unavailable. |
Following is a description of the valuation techniques applied to the Fund’s major categories of assets and liabilities measured at fair value on a recurring basis.
Equity Securities – Equity securities, including common stocks, preferred stocks, foreign-issued common stocks, exchange-traded funds, closed-end mutual funds, partnerships, rights, and real estate investment trusts, that are traded on a securities exchange for which a last-quoted sales price is readily available will generally be valued at the last sales price as reported by the primary exchange on which the securities are listed. Securities listed on The NASDAQ Stock Market (“NASDAQ”) will generally be valued at the NASDAQ Official Closing Price, which may differ from the last sales price reported. Securities traded on a securities exchange for which a last-quoted sales price is not readily available will generally be valued at the mean between the bid and ask prices. To the extent these securities are actively traded and valuation adjustments are not applied, they are classified in Level 1 of the fair value hierarchy. Securities traded on foreign exchanges generally are not valued at the same time the Fund calculates its NAV because most foreign markets close well before such time. The earlier close of most foreign markets gives rise to the possibility that significant events, including broad market moves, may have occurred in the interim. In certain circumstances, it may be determined that a security needs to be fair valued because it appears that the value of the security might have been materially affected by events occurring after the close of the market in which the security is principally traded, but before the time the Fund calculates its NAV, such as by a development that affects an entire market or region (e.g., weather-related events) or a potentially global development (e.g., a terrorist attack that may be expected to have an effect on investor expectations worldwide).
Registered Investment Companies – Investments in registered investment companies (e.g., mutual funds) are generally priced at the ending NAV provided by the applicable registered investment company’s service agent and will be classified in Level 1 of the fair value hierarchy.
Debt Securities – Debt securities, including corporate bonds, asset-backed securities, mortgage-backed securities, municipal bonds, U.S. Treasuries, and U.S. government agency issues, are generally valued at market on the basis of valuations furnished by an independent pricing service that utilizes both dealer-supplied valuations and formula-based techniques. The pricing service may consider recently executed transactions in securities of the issuer or comparable issuers, market price quotations (where observable), bond spreads, and fundamental data relating to the issuer. In addition, the model may
| HENNESSY FUNDS | 1-800-966-4354 | |
incorporate observable market data, such as reported sales of similar securities, broker quotes, yields, bids, offers, and reference data. Certain securities are valued primarily using dealer quotations. These securities are generally classified in Level 2 of the fair value hierarchy.
Short-Term Securities – Short-term equity investments, including money market funds, are valued in the manner specified above. Short-term debt investments with an original term to maturity of 60 days or less are valued at amortized cost, which approximates fair market value. If the original term to maturity of a short-term debt investment exceeded 60 days, then the values as of the 61st day prior to maturity are amortized. Amortized cost is not used if its use would be inappropriate due to credit or other impairments of the issuer, in which case the security’s fair value would be determined, as described below. Short-term securities are generally classified in Level 1 or Level 2 of the fair market hierarchy depending on the inputs used and market activity levels for specific securities.
The Board of Trustees of the Fund (the “Board”) has adopted fair value pricing procedures that are followed when a price for a security is not readily available or if a significant event has occurred that indicates the closing price of a security no longer represents the true value of that security. Fair value pricing determinations are made in good faith in accordance with these procedures. There are numerous criteria that will be given consideration in determining a fair value of a security, such as the trading volume of a security and markets, the value of other like securities, and news events with direct bearing to a security or markets. Fair value pricing results in an estimated price for a security that reflects the amount the Fund might reasonably expect to receive in a current sale. Depending on the relative significance of the valuation inputs, these securities may be classified in either Level 2 or Level 3 of the fair value hierarchy.
The fair valuation of foreign securities may be determined with the assistance of a pricing service using correlations between the movement of prices of such securities and indices of domestic securities and other appropriate indicators, such as closing market prices of relevant American Depositary Receipts or futures contracts. The effect of using fair value pricing is that the Fund’s NAV will reflect the affected portfolio securities’ value as determined by the Board or its designee instead of being determined by the market. Using a fair value pricing methodology to price foreign securities may result in a value that is different from a foreign security’s most recent closing price and from the prices used by other investment companies to calculate their NAVs and are generally considered Level 2 prices in the fair valuation hierarchy. Because the Fund may invest in foreign securities, the value of the Fund’s portfolio securities may change on days when you will not be able to purchase or redeem your shares.
The Board has delegated day-to-day valuation matters to a Valuation Committee comprised of one or more representatives from Hennessy Advisors, Inc., the Fund’s investment advisor. The function of the Valuation Committee is to value securities where current and reliable market quotations are not readily available. All actions taken by the Valuation Committee are reviewed by the Board.
The Fund has performed an analysis of all existing investments to determine the significance and character of all inputs to their fair value determination. Various inputs are used in determining the value of the Fund’s investments. The inputs or methodology used for valuing securities are not necessarily an indication of the risk associated with investing in those securities. Details related to the fair valuation hierarchy of the Fund’s securities as of April 30, 2016, are included in the Fund’s Schedule of Investments.
4). INVESTMENT TRANSACTIONS
Purchases and sales of investment securities (excluding government and short-term investments) for the Fund during the six months ended April 30, 2016, were $1,824,099 and $2,063,846, respectively.
There were no purchases or sales/maturities of long-term U.S. government securities for the Fund during the six months ended April 30, 2016.
5). INVESTMENT MANAGEMENT FEE AND OTHER TRANSACTIONS WITH AFFILIATES
Hennessy Advisors, Inc. (the “Advisor”) is the investment advisor of the Fund. The Advisor provides the Fund with investment management services under an Investment Advisory Agreement. The Advisor furnishes all investment advice, office space, facilities, and provides most of the personnel needed by the Fund. As compensation for its services, the Advisor is entitled to a monthly fee from the Fund. The fee is based upon the average daily net assets of the Fund at the annual rate of 0.90%. The net investment advisory fees payable by the Fund as of April 30, 2016, were $3,398.
In the past, the Advisor had contractually agreed to limit the total annual operating expenses of the Fund to 1.95% and 1.70% of the Fund’s net assets for the Investor Class shares and Institutional Class shares of the Fund, respectively (excluding interest, taxes, brokerage commissions, dividend expenses, acquired fund fees and expenses, extraordinary legal expenses, or any other extraordinary expenses and, from and after November 1, 2014, 12b-1 fees). The expense limitation agreement for the Fund expired as of February 28, 2015.
For a period of three years after the year in which the Advisor waived or reimbursed expenses, the Advisor may seek reimbursement from the Fund to the extent that total annual fund operating expenses are less than the expense limitation that was in effect at the time the Advisor waived or reimbursed expenses. As of April 30, 2016, cumulative expenses subject to potential recovery under the aforementioned conditions and year of expiration were as follows:
| | October 31, | October 31, | October 31, | |
| | 2016 | 2017 | 2018 | Total |
| Investor Class | $48,568 | $48,732 | $16,551 | $113,851 |
| Institutional Class | $10,931 | $ 9,989 | $ 3,036 | $ 23,956 |
The Board has approved a Shareholder Servicing Agreement for the Investor Class shares of the Fund, effective as of February 28, 2015, which was instituted to compensate the Advisor for the non-investment management services it provides to the Fund. The Shareholder Servicing Agreement provides for a monthly fee paid to the Advisor at an annual rate of 0.10% of the average daily net assets of the Fund attributable to Investor Class shares. Shareholder service fees payable by the Fund as of April 30, 2016, were $301.
The Fund has adopted a plan pursuant to Rule 12b-1 under the Investment Company Act of 1940, as amended, that authorizes payments in connection with the distribution of the Fund’s shares at an annual rate of up to 0.25% of the Fund’s average daily net assets attributable to Investor Class shares. Even though the authorized rate is up to 0.25%, the Fund has only used up to 0.15% of its average daily net assets attributable to Investor Class shares for such purpose since March 1, 2015. Amounts paid under the plan may be spent on any activities or expenses primarily intended to result in the sale of shares, including, but not limited to, advertising, shareholder account servicing, the printing and mailing of prospectuses to other than current shareholders, the printing and mailing of sales literature, and compensation for sales and marketing activities or to financial institutions and others, such as dealers and distributors.
| HENNESSY FUNDS | 1-800-966-4354 | |
The Fund has entered into agreements with various brokers, dealers, and financial intermediaries in connection with the sale of shares of the Fund. The agreements provide for periodic payments by the Fund to the brokers, dealers, and financial intermediaries for providing certain shareholder maintenance services (sub-transfer agent expenses). These shareholder services include the pre-processing and quality control of new accounts, shareholder correspondence, answering customer inquiries regarding account status, and facilitating shareholder telephone transactions. Fees paid by the Fund to various brokers, dealers, and financial intermediaries during the six months ended April 30, 2016, were $2,370.
U.S. Bancorp Fund Services, LLC (“USBFS”) provides the Fund with administrative, fund accounting, and transfer agent services, and necessary office equipment. As administrator, USBFS is responsible for activities such as (i) preparing various federal and state regulatory filings, reports, and returns for the Fund, (ii) preparing reports and materials to be supplied to the Board, (iii) monitoring the activities of the Fund’s custodian, transfer agent, and accountants, and (iv) coordinating the preparation and payment of the Fund’s expenses and reviewing the Fund’s expense accruals. Fees paid to USBFS during the six months ended April 30, 2016, were $2,250.
U.S. Bank, N.A., an affiliate of USBFS, serves as the Fund’s custodian. Quasar Distributors, LLC acts as the Fund’s principal underwriter in a continuous public offering of the Fund’s shares. Quasar Distributors, LLC is an affiliate of USBFS and U.S. Bank, N.A.
6). LINE OF CREDIT
The Fund has an uncommitted line of credit with the other funds in the Hennessy Funds family of funds (the “Hennessy Funds”) in the amount of the lesser of (i) $100,000,000 or (ii) 33.33% of each Hennessy Fund’s net assets, or 30% for the Hennessy Gas Utility Fund and 10% for the Hennessy Balanced Fund, intended to provide short-term financing, if necessary, subject to certain restrictions, in connection with shareholder redemptions. The credit facility is with the Hennessy Funds’ custodian bank, U.S. Bank, N.A. Borrowings under this arrangement bear interest at the bank’s prime rate and are secured by all of the Fund’s assets (as to its own borrowings only). During the six months ended April 30, 2016, the Fund did not have any borrowings outstanding under the line of credit.
7). FEDERAL TAX INFORMATION
As of October 31, 2015, the Fund’s most recent fiscal year end, the components of accumulated earnings (losses) for income tax purposes were as follows:
| | Cost of investments for tax purposes | | $ | 4,756,621 | |
| | Gross tax unrealized appreciation | | $ | 493,274 | |
| | Gross tax unrealized depreciation | | | (239,862 | ) |
| | Net tax unrealized appreciation | | $ | 253,412 | |
| | Undistributed ordinary income | | $ | — | |
| | Undistributed long-term capital gains | | | — | |
| | Total distributable earnings | | $ | — | |
| | Other accumulated loss | | $ | (362,152 | ) |
| | Total accumulated loss | | $ | (108,740 | ) |
The difference between book-basis unrealized appreciation/depreciation (as shown in the Statement of Assets and Liabilities) and tax-basis unrealized appreciation/depreciation (as shown above) is attributable primarily to capital loss carryforwards, wash sales, and partnership adjustments.
At October 31, 2015, the Fund’s most recent fiscal year end, the Fund had capital loss carryforwards of $276,753 that expire on October 31, 2017.
During the fiscal year ended October 31, 2015, the Fund’s most recent fiscal year, the capital loss carryforwards utilized for the Fund were $351,125.
Capital losses sustained in the fiscal year ended October 31, 2012, and in future taxable years will not expire and may be carried over by the Fund without limitation; however, they will retain the character of the original loss. Furthermore, any loss incurred during those taxable years will be required to be utilized prior to the losses incurred in taxable years prior to 2012. As a result of this ordering rule, pre-enactment capital loss carryforwards may be more likely to expire unused. Under pre-enactment law, capital losses could be carried forward for eight years, and carried forward as short-term capital losses, irrespective of the character of the original loss.
At October 31, 2015, the Fund’s most recent fiscal year end, the Fund deferred, on a tax basis, a late year ordinary loss of $85,399.
The Fund did not pay any distributions during fiscal year 2016 (year to date) or fiscal year 2015.
| HENNESSY FUNDS | 1-800-966-4354 | |
Expense Example (Unaudited)
April 30, 2016
As a shareholder of the Fund, you incur two types of costs: (1) transaction costs, including sales charges (loads) on purchase payments, reinvested dividends, or other distributions; redemption fees; and exchange fees; and (2) ongoing costs, including management fees; service fees; and other Fund expenses. This Example is intended to help you understand your ongoing costs (in dollars) of investing in the Fund and to compare these costs with the ongoing costs of investing in other mutual funds. The Example is based on an investment of $1,000 invested at the beginning of the period and held for the entire period from November 1, 2015 through April 30, 2016.
Actual Expenses
The first line of the table below under the “Investor Class” and “Institutional Class” headings provides information about actual account values and actual expenses. Although the Fund charges no sales loads or transaction fees, you will be assessed fees for outgoing wire transfers, returned checks and stop payment orders at prevailing rates charged by U.S. Bancorp Fund Services, LLC, the Fund’s transfer agent. If you request that a redemption be made by wire transfer, currently a $15.00 fee is charged by the Fund’s transfer agent. IRA accounts will be charged a $15.00 annual maintenance fee. The example below includes, but is not limited to, management fees, shareholder servicing fees, fund accounting, custody, and transfer agent fees. However, the example below does not include portfolio trading commissions and related expenses, and other extraordinary expenses as determined under generally accepted accounting principles. You may use the information in this line, together with the amount you invested, to estimate the expenses that you paid over the period. Simply divide your account value by $1,000 (for example, an $8,600 account value divided by $1,000 = 8.6), then multiply the result by the number in the first line of the table under the “Investor Class” and “Institutional Class” headings in the column entitled “Expenses Paid During Period” to estimate the expenses you paid on your account during this period.
Hypothetical Example for Comparison Purposes
The second line of the table below under the “Investor Class” and “Institutional Class” headings provides information about hypothetical account values and hypothetical expenses based on the Fund’s actual expense ratios and an assumed rate of return of 5% per year before expenses, which is not the Fund’s actual return. The hypothetical account values and expenses may not be used to estimate the actual ending account balance or expenses you paid for the period. You may use this information to compare the ongoing costs of investing in the Fund and other funds. To do so, compare this 5% hypothetical example with the 5% hypothetical examples that appear in the shareholder reports of the other funds. Please note that the expenses shown in the table are meant to highlight your ongoing costs only and do not reflect any transactional costs, such as sales charges (loads), or exchange fees. Therefore, the second line of the table under the “Investor Class” and “Institutional Class” headings is useful in comparing ongoing costs only, and will not help you determine the relative total costs of owning different funds. In addition, if these transactional costs were included, your costs would have been higher.
| | | | Expenses Paid |
| | Beginning | Ending | During Period(1) |
| | Account Value | Account Value | November 1, 2015 – |
| | November 1, 2015 | April 30, 2016 | April 30, 2016 |
| Investor Class | | | |
| Actual | $1,000.00 | $ 947.90 | $16.76 |
| Hypothetical (5% return before expenses) | $1,000.00 | $1,007.66 | $17.27 |
| | | | |
| Institutional Class | | | |
| Actual | $1,000.00 | $ 949.90 | $15.08 |
| Hypothetical (5% return before expenses) | $1,000.00 | $1,009.40 | $15.54 |
(1) | Expenses are equal to the Fund’s annualized expense ratio of 3.46% for Investor Class shares or 3.11% for Institutional Class shares, as applicable, multiplied by the average account value over the period, multiplied by 182/366 days (to reflect one-half year period). |
| HENNESSY FUNDS | 1-800-966-4354 | |
How to Obtain a Copy of the Fund’s
Proxy Voting Policy and Proxy Voting Records
A description of the policies and procedures the Fund uses to determine how to vote proxies relating to portfolio securities is available without charge: (1) by calling 1-800-966-4354; (2) on the Hennessy Funds’ website at hennessyfunds.com/proxy-voting/policy.fs; or (3) on the U.S. Securities and Exchange Commission’s website at www.sec.gov. The Fund’s proxy voting record is available without charge on both the Hennessy Funds’ website at hennessyfunds.com/proxy-voting/policy.fs and the SEC’s website at www.sec.gov no later than August 31 for the prior 12 months ending June 30.
Quarterly Filings on Form N-Q
The Fund files its complete schedule of portfolio holdings with the SEC for the first and third quarters of each fiscal year on Form N-Q. The Fund’s Form N-Q will be available on the SEC’s website at www.sec.gov. The Fund’s Form N-Q may be reviewed and copied at the SEC’s Public Reference Room in Washington, DC and information on the operation of the Public Reference Room may be obtained by calling 1-800-SEC-0330. Information included in the Fund’s N-Q will also be available upon request by calling 1-800-966-4354.
Householding
To help keep the Fund’s costs as low as possible, we generally deliver a single copy of most financial reports and prospectuses to shareholders who share an address, even if the accounts are registered under different names. This process, known as “householding,” does not apply to account statements. You may, of course, request an individual copy of a prospectus or financial report at any time. If you would like to receive separate mailings, please call the Administrator at 1-800-261-6950 or 1-414-765-4124 and we will begin individual delivery within 30 days of your request. If your account is held through a financial institution or other intermediary, please contact them directly to request individual delivery.
Board Approval of Investment Advisory
Agreement
At its meeting on March 9, 2016, the Board of Trustees of the Fund (the “Board,” and the members thereof, the “Trustees”) unanimously approved the continuation of the investment advisory agreement of the Fund with Hennessy Advisors, Inc. (the “Advisor”). As part of the process of approving the continuation of the advisory agreement, the Trustees reviewed their fiduciary duties with respect to approving the advisory agreement and the relevant factors for them to consider. In addition, the Trustees who are not deemed “interested persons” (as that term is defined by the Investment Company Act of 1940) of the Fund (the “Independent Trustees”) met in executive session to discuss the approval of the advisory agreement.
In advance of the meeting, the Advisor sent detailed information to the Trustees to assist them in their evaluation of the advisory agreement. This information included, but was not limited to, (i) a memorandum from outside legal counsel that described the fiduciary duties of the Board with respect to approving the continuation of the advisory agreement and the relevant factors for consideration, (ii) a memorandum from the Advisor that listed the factors relevant to the Board’s approval of the continuation of the advisory agreement and also referenced the documents that had been provided to help the Board assess each such factor, (iii) an inventory of the range of services provided by the Advisor for the Fund, (iv) a written discussion of economies of scale, (v) the advisory agreement, (vi) a recent Fund fact sheet, (vii) a peer expense comparison, (viii) performance information, (ix) the Advisor’s most recent Form 10-K and Form 10-Q, which included information about the Advisor’s profitability, (x) information about brokerage commissions, (xi) information about the Fund’s compliance program, (xii) the Advisor’s current Form ADV Part I, and (xii) other information the Trustees believed was useful in evaluating the approval of the continuation of the advisory agreement.
All of the factors discussed by the Trustees were considered as a whole, and were considered separately by the Independent Trustees, meeting in executive session. The factors were viewed in their totality by the Trustees, with no single factor being the principal or determinative factor in the Trustees’ determination of whether to approve the continuation of the advisory agreement. The Trustees recognized that the management and fee arrangements for the Fund are the result of years of review and discussion between the Independent Trustees and the Advisor, that certain aspects of such arrangements may receive greater scrutiny in some years than in others, and that the Trustees’ conclusions may be based, in part, on their consideration of these same arrangements and information received during the course of the year and in prior years.
Prior to approving the continuation of the advisory agreement, the Trustees and the Independent Trustees in executive session considered, among other items:
| | • | The nature and quality of the advisory services provided by the Advisor. |
| | • | A comparison of the fees and expenses of the Fund to other similar funds. |
| | • | Whether economies of scale are recognized by the Fund. |
| | • | The costs and profitability of the Fund to the Advisor. |
| | • | The performance of the Fund. |
| | • | The other benefits to the Advisor from serving as an investment advisor to the Fund (in addition to the advisory fee). |
| HENNESSY FUNDS | 1-800-966-4354 | |
The material considerations and determinations of the Board of Trustees, including all of the Independent Trustees, are as follows:
| | • | The Board considered the services identified below that are provided by the Advisor. Based on this review, the Trustees believe that the Advisor provides high-quality services to the Fund, and they noted that their overall confidence in the Advisor is high. The Trustees also concluded that they were satisfied with the nature, extent, and quality of the advisory services provided to the Fund by the Advisor, and that the nature and extent of the services provided by the Advisor are appropriate to assure that the Fund’s operations are conducted in compliance with applicable laws, rules, and regulations. |
| | | • | The Advisor acts as the portfolio manager for the Fund. In this capacity, the Advisor does the following: |
| | | | • | manages the composition of the Fund’s portfolio, including the purchase, retention, and disposition of portfolio securities in accordance with the Fund’s investment objectives, policies, and restrictions; |
| | | | • | ensures compliance with “best execution” for the Fund’s portfolio; |
| | | | • | manages the use of soft dollars for the Fund. |
| | | • | The Advisor performs a daily reconciliation of portfolio positions and cash for the Fund. |
| | | • | The Advisor monitors the Fund’s compliance with its investment objectives and restrictions. |
| | | • | The Advisor monitors compliance with federal securities laws and performs activities such as maintaining a compliance program, conducting ongoing reviews of the compliance programs of the Fund’s service providers, conducting on-site visits to the Fund’s service providers, monitoring incidents of abusive trading practices, reviewing Fund expense accruals, payments, and fixed expense ratios, evaluating insurance providers for fidelity bond coverage and D&O/E&O insurance coverage, conducting employee compliance training, reviewing reports provided by service providers, maintaining books and records, and preparing an annual compliance report to the Board. |
| | | • | The Advisor oversees service providers that provide accounting, administration, distribution, transfer agency, custodial, sales and marketing, public relations, audit, information technology, and legal services to the Fund. |
| | | • | The Advisor maintains in-house marketing and distribution departments on behalf of the Fund. |
| | | • | The Advisor is actively involved with preparing regulatory filings for the Fund, including writing and annually updating the Fund’s prospectus and related documents. |
| | | • | The Advisor prepares a written summary of the Fund’s performance for the most recent six-month period or twelve-month period, as applicable, for each semi-annual and annual report of the Fund. |
| | | • | The Advisor oversees distribution of the Fund through third-party broker/dealers and independent financial institutions such as Charles Schwab, Inc., Fidelity, TD Waterhouse, and Pershing. The Advisor participates in “no transaction fee” (“NTF”) programs with these companies on behalf of the Fund, which allow customers to purchase the Fund through third-party distribution |
| | | | channels without paying a transaction fee. The Advisor compensates, in part, a number of these third-party providers of NTF programs out of its own revenues. |
| | | • | The Advisor pays the incentive compensation of the Fund’s compliance officers and employs other staff, such as management executives, legal personnel, marketing personnel, national accounts and distribution personnel, sales personnel, administrative personnel, and trading oversight personnel. |
| | | • | The Advisor provides a quarterly compliance certification to the Board. |
| | | • | The Advisor prepares or reviews Board materials, frequently presents to the Board or leads Board discussions, prepares or reviews meeting minutes, and arranges for Board training and education. |
| | • | The Board compared the performance of the Fund to benchmark indices over various periods of time and they noted that at each quarterly meeting, the Trustees review reports comparing the investment performance of the Fund to various indices. Based on the information provided at the meeting and the information and quarterly discussions regarding the Fund’s investment performance, the Trustees believe that the Advisor manages the Fund in a manner that is materially consistent with its stated investment objective and style. The Trustees concluded that the performance of the Fund over various time horizons warranted the continuation of the advisory agreement. |
| | • | The Board reviewed the advisory fees and overall expense ratios of the Fund and comparable funds using data from Morningstar with respect to funds similar in asset size and investment objective to the Fund. As part of the discussion with management, the Trustees ensured that they understood and were comfortable with the criteria used to determine the mutual funds included in the Morningstar categories for purposes of the materials considered at the meeting. The Board determined that the advisory fee and overall expense ratio of the Fund falls within the range of the advisory fees and overall expense ratios of other comparable funds and concluded that they are reasonable and warranted continuation of the advisory agreement. |
| | • | The Board also considered whether economies of scale were being realized by the Advisor that should be shared with the Fund’s shareholders. The Trustees noted that many of the expenses incurred to manage the Fund are asset-based fees and thus do not result in material economies of scale being realized as the net assets of the Fund increase. For example, intermediary service fees increase as the Fund’s assets grow. The Trustees also considered the Advisor’s efforts to contain expenses, and took into account the Advisor’s significant marketing efforts to increase Fund assets. The Board noted that at current asset levels it did not appear that there were economies of scale being realized by the Advisor and concluded that it would continue to monitor economies of scale in the future as circumstances changed. |
| | • | The Board considered the profitability of the Advisor, including the impact of intermediary service fees on the Advisor’s profitability, and also considered the resources and revenues that the Advisor has put into managing and distributing the Fund. The Board then concluded that the profits of the Advisor are reasonable and not excessive when compared to profitability guidelines set forth in relevant court cases. |
| HENNESSY FUNDS | 1-800-966-4354 | |
| | • | The Board considered the high level of professionalism and knowledge of the Advisor’s employees, along with a very low level of turnover, and concluded that this was beneficial to the Fund and its shareholders. |
| | • | The Board considered other benefits to the Advisor from serving as an advisor to the Fund (in addition to the advisory fee). The Board noted that the Advisor may derive ancillary benefits from, by way of example, its association with the Fund in the form of proprietary and third-party research products and services received from broker dealers that execute portfolio trades for the Fund. The Board determined that any such products and services have been used for legitimate purposes relating to the Fund by providing assistance in the investment decision-making process. The Trustees concluded that the other benefits realized by the Advisor from its relationship with the Fund were reasonable. |
After reviewing the materials provided at the meeting and management’s presentation, as well as other information regularly provided at the Board’s quarterly meetings throughout the year regarding the quality of services provided by the Advisor, the performance of the Fund, expense information, regulatory compliance issues, trading information and related matters, and other factors deemed relevant by the Board, the Trustees, including all of the Independent Trustees, approved the continuation of the advisory agreement.
(This Page Intentionally Left Blank.)
For information, questions or assistance, please call
The Hennessy Funds
1-800-966-4354 or 1-415-899-1555
INVESTMENT ADVISOR
Hennessy Advisors, Inc.
7250 Redwood Blvd., Suite 200
Novato, California 94945
ADMINISTRATOR,
TRANSFER AGENT,
DIVIDEND PAYING AGENT &
SHAREHOLDER SERVICING AGENT
U.S. Bancorp Fund Services, LLC
P.O. Box 701
Milwaukee, Wisconsin 53201-0701
CUSTODIAN
U.S. Bank N.A.
Custody Operations
1555 North River Center Dr., Suite 302
Milwaukee, Wisconsin 53212
TRUSTEES
Neil J. Hennessy
Robert T. Doyle
J. Dennis DeSousa
Gerald P. Richardson
COUNSEL
Foley & Lardner LLP
777 East Wisconsin Avenue
Milwaukee, Wisconsin 53202-5306
INDEPENDENT REGISTERED
PUBLIC ACCOUNTING FIRM
Tait, Weller & Baker LLP
1818 Market Street, Suite 2400
Philadelphia, Pennsylvania 19103
DISTRIBUTOR
Quasar Distributors, LLC
615 East Michigan Street
Milwaukee, Wisconsin 53202
hennessyfunds.com | 1-800-966-4354
This report has been prepared for shareholders and may be distributed to
others only if preceded or accompanied by a current prospectus.
SEMI-ANNUAL REPORT
APRIL 30, 2016
HENNESSY JAPAN FUND
Investor Class HJPNX
Institutional Class HJPIX
hennessyfunds.com | 1-800-966-4354
(This Page Intentionally Left Blank.)
Contents
| Letter to Shareholders | 2 |
| Performance Overview | 4 |
| Financial Statements | |
| Schedule of Investments | 6 |
| Statement of Assets and Liabilities | 10 |
| Statement of Operations | 11 |
| Statements of Changes in Net Assets | 13 |
| Financial Highlights | 14 |
| Notes to the Financial Statements | 18 |
| Expense Example | 26 |
| Proxy Voting | 28 |
| Quarterly Filings on Form N-Q | 28 |
| Householding | 28 |
| Matters Submitted to a Shareholder Vote | 28 |
| Board Approval of Investment Advisory Agreements | 29 |
| HENNESSY FUNDS | 1-800-966-4354 | |
June 2016
Dear Hennessy Funds Shareholder:
Over the last six months, investors again witnessed significant swings in global equity prices as investors reacted to fluctuations in the oil price and changing policy forecasts from the Federal Reserve, among other considerations. For Japanese equities, both developments in the global macroeconomic landscape as well as domestic issues combined to lead stock prices lower over the period.
During the six-month period ended April 30, 2016, the Japanese stock market, as measured by the Tokyo Stock Price Index, declined approximately 13% in yen terms and approximately 3% in U.S. Dollar terms. Several factors contributed to the decline in equity prices over the period, including a rise in the yen (following almost three years of decline), in part due to renewed uncertainty over the timing of additional interest rate increases in the U.S. Forecasts of slower corporate profits growth in Japan in the coming year and worry over the global consequences of a deceleration of economic growth in China also affected investor sentiment. Furthermore, at the end of January, the Bank of Japan introduced a negative interest rate policy aimed at boosting lending growth but which also caused confusion, as market participants struggled to understand the broader effects of such a policy.
In our opinion, the Japanese economy will continue to recover for three principal reasons. First, we believe Japan will be successful in ending deflation. Although the reported inflation rate has been lower than had been expected over the last twelve months, the core rate has been steadily trending upward since 2011. The population appears to be slowly shedding its deflationary mindset, with businesses becoming more optimistic about pricing power. Rising real estate prices and wages are also helping
to dissipate lingering deflationary pressures. Second, we believe the government is enacting reforms that will have a meaningful effect on growth in the medium term. The government is making steady progress on deregulation and encouraging investment funds to target fields such as healthcare, social welfare, and agriculture. We believe the impact of such investment flows will become more evident with time. Third, consumer sentiment is improving. Major corporations are raising wages for a third consecutive year and college graduate hiring rates have been approaching historic highs. We believe that large corporations’ decision to increase wages may set a precedent for other companies and as sentiment improves with higher incomes, we believe that consumption will start to rise.
In summary, we believe that although the stronger yen may have a negative short-term impact on exporters’ profits, corporate earnings overall will continue to grow as long as the yen does not surge rapidly. We believe we are well positioned to seize the opportunities borne out of the market’s recent setback.
We remain optimistic about the long-term prospects for Japan and its stock market. Thank you for your continued confidence and investment in our Funds. If you have any questions or would like to speak with us directly, please don’t hesitate to call us at (800) 966-4354.
Sincerely,
Neil J. Hennessy
President and Chief Investment Officer
Hennessy Funds
 |  |
| Tadahiro Fujimura | Masakazu Takeda |
| Portfolio Manager, | Portfolio Manager, |
| Hennessy Japan Small Cap Fund; | Hennessy Japan Fund; |
| Head of Investment & Research | Fund Manager |
| and Sr. Portfolio Manager | SPARX Asset Management Co., Ltd. |
| SPARX Asset Management Co., Ltd. | |
SPARX Asset Management Co., Ltd., located in Tokyo, Japan, is the sub-advisor to the Hennessy Japan Fund and the Hennessy Japan Small Cap Fund.
Past performance does not guarantee future results.
Mutual fund investing involves risk. Principal loss is possible.
Opinions expressed are those of Neil Hennessy, Tadahiro Fujimura and Masakazu Takeda and are subject to change, are not guaranteed and should not be considered investment advice.
The Tokyo Stock Price Index (TOPIX) is an unmanaged index commonly used to measure the performance of Japanese stocks. One cannot invest directly in an index.
| HENNESSY FUNDS | 1-800-966-4354 | |
Performance Overview (Unaudited)
AVERAGE ANNUAL TOTAL RETURN FOR PERIODS ENDED APRIL 30, 2016
| | Six | One | Five | Ten |
| | Months(1) | Year | Years | Years |
| Hennessy Japan Fund – | | | | |
| Investor Class (HJPNX) | 1.37% | 3.65% | 10.47% | 2.25% |
| Hennessy Japan Fund – | | | | |
| Institutional Class (HJPIX) | 1.51% | 3.96% | 10.73% | 2.44% |
| Russell/Nomura Total | | | | |
MarketTM Index | -2.83% | -5.43% | 5.66% | 0.08% |
| Tokyo Price Index (TOPIX) | -3.14% | -5.39% | 5.45% | -0.14% |
Expense ratios: 1.49% (Investor Class); 1.08% (Institutional Class)
Performance data quoted represents past performance; past performance does not guarantee future results. The investment return and principal value of an investment will fluctuate so that an investor’s shares, when redeemed, may be worth more or less than their original cost. The performance table does not reflect the deduction of taxes that a shareholder would pay on Fund distributions or the redemption of Fund shares. Current performance of the Fund may be lower or higher than the performance quoted. Performance data current to the most recent month end may be obtained by visiting hennessyfunds.com.
The expense ratios presented are from the most recent prospectus.
(1) | Periods less than one year are not annualized. |
PERFORMANCE NARRATIVE
Portfolio Managers Masakazu Takeda, CFA and CMA*, and Yu Shimizu, CMA*
SPARX Asset Management Co., Ltd. (sub-advisor)
Performance:
For the six-month period ended April 30, 2016, the Investor Class of the Hennessy Japan Fund returned 1.37%, outperforming both the Russell/Nomura Total Market™ Index and the Tokyo Stock Price Index (TOPIX), which returned -2.83% and -3.14% for the same period, respectively, in U.S. Dollar terms.
The largest positive contributors to the Fund’s performance among the 33 TOPIX sub-industries were investments in Precision Instruments, Electric Appliances, and Machinery. Conversely, our investments in Other Products, Banks and Transportation Equipment hampered Fund performance.
Among the biggest contributors to performance over the six-month period were Terumo Corp., Japan’s largest medical device manufacturer, Keyence Corp., a leading supplier of factory automation related sensors, and Ryohin Keikaku Co. Ltd., the operator of the Japanese retail company “MUJI,” which sells a wide variety of household and consumer goods. Ryohin Keikaku’s share price has been performing well as a result of strong earnings and operating profits. Shares of Keyence have performed well, as management has been able to maintain stable growth and high profitability. Terumo has performed particularly well with its mainstay cardiovascular device business enjoying sales growth of more than 10% per year and its new products seeing wider applications.
Among the largest negative contributors to the Fund’s performance for the period were Shimano, Inc., a global bicycle parts manufacturer, and ASICS Corp., a footwear and
sports equipment manufacturer. Shares of Asics fell in response to a slowdown in their running shoe division. Nevertheless, ASICS’ strong brand is delivering growth in other areas of its business, and as a result, we think that overall growth for the company should remain strong. Shimano’s share price fell after its Q1 2016 results disappointed consensus estimates. Nevertheless, we believe that long-term prospects for Shimano, supported by its decade-long unchallenged global market share and the promising future growth of the bicycle market, continue to be favorable. We continue to hold all the stocks mentioned.
Market Outlook:
We expect that the stronger yen could hurt exporters’ earnings in the short run. However, we want to draw attention to the fact that over the last decade Japanese exporters have decreased their sensitivity to currency movements considerably. For example, Toyota has stated that its efforts to diversify its production base globally and to streamline its cost structure now allow it to remain profitable at even 75 to 80 yen per U.S. dollar. The case is similar for many other exporters, who are able to stay profitable at the current exchange rate and continue to generate abundant cash flows, which they can, in turn, invest back into their growth strategies. Furthermore, we believe that over the longer term, currency movements become less relevant to investors. In the last 30 years, although the yen has more than doubled against the U.S. Dollar, many globally-established Japanese companies have multiplied their earnings several-fold. Toyota’s pre-tax profit grew almost six-fold in the same period. In our view, what determines the future success of a company is the underlying secular, long-term volume growth of the business. We continue to invest in what we believe are businesses with time-tested business models and smart management teams, which together can achieve long-term volume growth.
* Chartered Member of the Security Analysts Association of Japan
Opinions expressed are those of the Portfolio Managers as of the date written and are subject to change, are not guaranteed, and should not be considered investment advice or an indication of trading intent.
The Russell/Nomura Total Market™ Index contains the top 98% of all stocks listed on Japan’s stock exchange and registered on Japan’s OTC market in terms of market capitalization. The Tokyo Price Index (TOPIX) is a market capitalization-weighted index of all companies listed on the First Section of the Tokyo Stock Exchange. One cannot invest directly in an index.
The Fund invests in small and medium capitalized companies, which may have more limited liquidity and greater price volatility than large capitalization companies. The Fund invests in the stocks of companies operating in Japan; single-country funds may be subject to a higher degree of risk. The Fund may experience higher fees due to investments in pooled investment vehicles (including ETFs).
References to specific securities should not be considered a recommendation to buy or sell any security. Fund holdings and sector allocations are subject to change. Please refer to the Schedule of Investments included in this report for additional portfolio information.
Cash flow refers to the net amount of cash and cash equivalents moving into and out of a company.
| HENNESSY FUNDS | 1-800-966-4354 | |
Financial Statements
Schedule of Investments as of April 30, 2016 (Unaudited) |
HENNESSY JAPAN FUND
(% of Net Assets)
| TOP TEN HOLDINGS (EXCLUDING CASH/CASH EQUIVALENTS) | % NET ASSETS |
| Terumo Corp. | 7.95% |
| Keyence Corp. | 7.45% |
| Ryohin Keikaku Co., Ltd. | 6.61% |
| Shimano, Inc. | 6.18% |
| Kao Corp. | 6.04% |
| Daikin Industries | 5.92% |
| Asics Corp. | 5.82% |
| Softbank Group Co. | 5.82% |
| Misumi Group, Inc. | 5.80% |
| Nidec Corp. | 5.80% |
Note: For presentation purposes, the Fund has grouped some of the industry categories. For purposes of categorizing securities for compliance with Section 8(b)(1) of the Investment Company Act of 1940, as amended, the Fund uses more specific industry classifications.
| | COMMON STOCKS – 99.67% | | Number | | | | | | % of | |
| | | | of Shares | | | Value | | | Net Assets | |
| | Consumer Discretionary – 24.09% | | | | | | | | | |
| | Asics Corp. | | | 336,100 | | | $ | 6,656,585 | | | | 5.82 | % |
| | Isuzu Motors, Ltd. | | | 469,500 | | | | 5,023,782 | | | | 4.40 | % |
| | Ryohin Keikaku Co., Ltd. | | | 33,900 | | | | 7,551,693 | | | | 6.61 | % |
| | Shimano, Inc. | | | 49,200 | | | | 7,058,794 | | | | 6.18 | % |
| | Toyota Motor Corp. | | | 24,400 | | | | 1,236,830 | | | | 1.08 | % |
| | | | | | | | | 27,527,684 | | | | 24.09 | % |
| | | | | | | | | | | | | | |
| | Consumer Staples – 14.00% | | | | | | | | | | | | |
| | Kao Corp. | | | 124,700 | | | | 6,898,027 | | | | 6.04 | % |
| | Pigeon Corp. | | | 97,000 | | | | 2,547,769 | | | | 2.23 | % |
| | Unicharm Corp. | | | 316,800 | | | | 6,548,599 | | | | 5.73 | % |
| | | | | | | | | 15,994,395 | | | | 14.00 | % |
| | | | | | | | | | | | | | |
| | Financials – 2.61% | | | | | | | | | | | | |
| | Mizuho Financial Group | | | 596,700 | | | | 894,401 | | | | 0.78 | % |
| | Sumitomo Mitsui Financial Group, Inc. | | | 69,600 | | | | 2,094,383 | | | | 1.83 | % |
| | | | | | | | | 2,988,784 | | | | 2.61 | % |
| | | | | | | | | | | | | | |
| | Health Care – 13.38% | | | | | | | | | | | | |
| | Rohto Pharmaceutical Co., Ltd. | | | 364,400 | | | | 6,202,619 | | | | 5.43 | % |
| | Terumo Corp. | | | 239,000 | | | | 9,085,665 | | | | 7.95 | % |
| | | | | | | | | 15,288,284 | | | | 13.38 | % |
| | | | | | | | | | | | | | |
| | Industrials – 28.01% | | | | | | | | | | | | |
| | Daikin Industries | | | 85,200 | | | | 6,763,093 | | | | 5.92 | % |
| | Kubota Corp. | | | 354,000 | | | | 5,156,667 | | | | 4.51 | % |
| | Misumi Group, Inc. | | | 480,000 | | | | 6,628,693 | | | | 5.80 | % |
| | Mitsubishi Corp. | | | 370,200 | | | | 6,222,545 | | | | 5.45 | % |
| | Nidec Corp. | | | 90,400 | | | | 6,623,976 | | | | 5.80 | % |
| | Sumitomo Corp. | | | 57,600 | | | | 608,962 | | | | 0.53 | % |
| | | | | | | | | 32,003,936 | | | | 28.01 | % |
| | | | | | | | | | | | | | |
| | Information Technology – 7.45% | | | | | | | | | | | | |
| | Keyence Corp. | | | 14,200 | | | | 8,511,381 | | | | 7.45 | % |
| | | | | | | | | | | | | | |
| | Materials – 4.31% | | | | | | | | | | | | |
| | Fuji Seal International, Inc. | | | 144,800 | | | | 4,925,859 | | | | 4.31 | % |
The accompanying notes are an integral part of these financial statements.
| HENNESSY FUNDS | 1-800-966-4354 | |
| | COMMON STOCKS | | Number | | | | | | % of | |
| | | | of Shares | | | Value | | | Net Assets | |
| | Telecommunication Services – 5.82% | | | | | | | | | |
| | Softbank Group Co. | | | 123,600 | | | $ | 6,646,034 | | | | 5.82 | % |
| | | | | | | | | | | | | | |
| | Total Common Stocks | | | | | | | | | | | | |
| | (Cost $91,202,082) | | | | | | | 113,886,357 | | | | 99.67 | % |
| | | | | | | | | | | | | | |
| | SHORT-TERM INVESTMENTS – 5.32% | | | | | | | | | | | | |
| | Money Market Funds – 5.32% | | | | | | | | | | | | |
| | Fidelity Government Portfolio, Institutional Class, 0.23% (a) | | | 6,082,813 | | | | 6,082,813 | | | | 5.32 | % |
| | | | | | | | | | | | | | |
| | Total Short-Term Investments | | | | | | | | | | | | |
| | (Cost $6,082,813) | | | | | | | 6,082,813 | | | | 5.32 | % |
| | | | | | | | | | | | | | |
| | Total Investments | | | | | | | | | | | | |
| | (Cost $97,284,895) – 104.99% | | | | | | | 119,969,170 | | | | 104.99 | % |
| | | | | | | | | | | | | | |
| | Liabilities in Excess of Other Assets – (4.99)% | | | | | | | (5,704,029 | ) | | | (4.99 | )% |
| | | | | | | | | | | | | | |
| | TOTAL NET ASSETS – 100.00% | | | | | | $ | 114,265,141 | | | | 100.00 | % |
Percentages are stated as a percent of net assets.
| (a) | The rate listed is the fund’s 7-day yield as of April 30, 2016. |
The accompanying notes are an integral part of these financial statements.
Summary of Fair Value Exposure at April 30, 2016
The following is a summary of the inputs used to value the Fund’s net assets as of April 30, 2016 (See Note 3 in the accompanying notes to the financial statements):
| Common Stocks | | Level 1 | | | Level 2 | | | Level 3 | | | Total | |
| Consumer Discretionary | | $ | — | | | $ | 27,527,684 | | | $ | — | | | $ | 27,527,684 | |
| Consumer Staples | | | — | | | | 15,994,395 | | | | — | | | | 15,994,395 | |
| Financials | | | — | | | | 2,988,784 | | | | — | | | | 2,988,784 | |
| Health Care | | | — | | | | 15,288,284 | | | | — | | | | 15,288,284 | |
| Industrials | | | — | | | | 32,003,936 | | | | — | | | | 32,003,936 | |
| Information Technology | | | — | | | | 8,511,381 | | | | — | | | | 8,511,381 | |
| Materials | | | — | | | | 4,925,859 | | | | — | | | | 4,925,859 | |
| Telecommunication Services | | | — | | | | 6,646,034 | | | | — | | | | 6,646,034 | |
| Total Common Stocks | | $ | — | | | $ | 113,886,357 | | | $ | — | | | $ | 113,886,357 | |
| Short-Term Investments | | | | | | | | | | | | | | | | |
| Money Market Funds | | $ | 6,082,813 | | | $ | — | | | $ | — | | | $ | 6,082,813 | |
| Total Short-Term Investments | | $ | 6,082,813 | | | $ | — | | | $ | — | | | $ | 6,082,813 | |
| Total Investments | | $ | 6,082,813 | | | $ | 113,886,357 | | | $ | — | | | $ | 119,969,170 | |
Transfers between levels are recognized at the end of the reporting period. During the six months ended April 30, 2016, the Fund recognized no transfers between levels.
Transfers between Level 1 and Level 2 relate to the use of fair valuation pricing service. On days when the fair valuation pricing service is used, non-U.S. dollar denominated securities move from a Level 1 to a Level 2 classification.
The accompanying notes are an integral part of these financial statements.
| HENNESSY FUNDS | 1-800-966-4354 | |
Financial Statements
Statement of Assets and Liabilities as of April 30, 2016 (Unaudited) |
| ASSETS: | | | |
| Investments in securities, at value (cost $97,284,895) | | $ | 119,969,170 | |
| Dividends and interest receivable | | | 568,792 | |
| Receivable for fund shares sold | | | 240,803 | |
| Receivable for securities sold | | | 894,782 | |
| Prepaid expenses and other assets | | | 29,817 | |
| Total Assets | | | 121,703,364 | |
| | | | | |
| LIABILITIES: | | | | |
| Payable for fund shares redeemed | | | 7,275,135 | |
| Payable to advisor | | | 82,474 | |
| Payable to administrator | | | 28,864 | |
| Payable to auditor | | | 10,700 | |
| Accrued distribution fees | | | 10,791 | |
| Accrued service fees | | | 4,991 | |
| Accrued trustees fees | | | 2,827 | |
| Accrued expenses and other payables | | | 22,441 | |
| Total Liabilities | | | 7,438,223 | |
| NET ASSETS | | $ | 114,265,141 | |
| | | | | |
| NET ASSETS CONSIST OF: | | | | |
| Capital stock | | $ | 121,288,618 | |
| Accumulated net investment loss | | | (333,040 | ) |
| Accumulated net realized loss on investments | | | (29,419,943 | ) |
| Unrealized net appreciation on investments | | | 22,729,506 | |
| Total Net Assets | | $ | 114,265,141 | |
| | | | | |
| NET ASSETS | | | | |
| Investor Class: | | | | |
| Shares authorized (no par value) | | Unlimited | |
| Net assets applicable to outstanding Investor Class shares | | $ | 59,932,233 | |
| Shares issued and outstanding | | | 2,456,047 | |
| Net asset value, offering price and redemption price per share | | $ | 24.40 | |
| | | | | |
| Institutional Class: | | | | |
| Shares authorized (no par value) | | Unlimited | |
| Net assets applicable to outstanding Institutional Class shares | | $ | 54,332,908 | |
| Shares issued and outstanding | | | 2,180,367 | |
| Net asset value, offering price and redemption price per share | | $ | 24.92 | |
The accompanying notes are an integral part of these financial statements.
Financial Statements
Statement of Operations for the six months ended April 30, 2016 (Unaudited) |
| INVESTMENT INCOME: | | | |
Dividend income(1) | | $ | 687,537 | |
| Interest income | | | 6,780 | |
| Total investment income | | | 694,317 | |
| | | | | |
| EXPENSES: | | | | |
| Investment advisory fees (See Note 5) | | | 563,076 | |
| Sub-transfer agent expenses – Investor Class (See Note 5) | | | 66,613 | |
| Sub-transfer agent expenses – Institutional Class (See Note 5) | | | 24,845 | |
| Administration, fund accounting, custody and transfer agent fees (See Note 5) | | | 59,208 | |
| Service fees – Investor Class (See Note 5) | | | 30,439 | |
| Federal and state registration fees | | | 19,727 | |
| Distribution fees – Investor Class (See Note 5) | | | 15,161 | |
| Reports to shareholders | | | 12,481 | |
| Compliance expense | | | 11,790 | |
| Audit fees | | | 11,301 | |
| Trustees’ fees and expenses | | | 6,033 | |
| Legal fees | | | 504 | |
| Other expenses | | | 6,581 | |
| Total expenses | | | 827,759 | |
| NET INVESTMENT LOSS | | $ | (133,442 | ) |
| | | | | |
| REALIZED AND UNREALIZED GAINS: | | | | |
| Net realized gain on investments | | $ | 258,841 | |
| Net change in unrealized appreciation on investments | | | 535,619 | |
| Net gain on investments | | | 794,460 | |
| NET INCREASE IN NET ASSETS RESULTING FROM OPERATIONS | | $ | 661,018 | |
(1) | Net of foreign taxes withheld of $76,393. |
The accompanying notes are an integral part of these financial statements.
| HENNESSY FUNDS | 1-800-966-4354 | |
(This Page Intentionally Left Blank.)
Financial Statements
| Statements of Changes in Net Assets |
| | | Six Months Ended | | | | |
| | | April 30, 2016 | | | Year Ended | |
| | | (Unaudited) | | | October 31, 2015 | |
| OPERATIONS: | | | | | | |
| Net investment loss | | $ | (133,442 | ) | | $ | (282,380 | ) |
| Net realized gain (loss) on investments | | | 258,841 | | | | (1,416,806 | ) |
| Net change in unrealized appreciation on investments | | | 535,619 | | | | 8,195,283 | |
| Net increase in net assets resulting from operations | | | 661,018 | | | | 6,496,097 | |
| | | | | | | | | |
| CAPITAL SHARE TRANSACTIONS: | | | | | | | | |
| Proceeds from shares subscribed – Investor Class | | | 15,772,303 | | | | 81,988,307 | |
| Proceeds from shares subscribed – Institutional Class | | | 27,698,035 | | | | 51,273,095 | |
| Cost of shares redeemed – Investor Class | | | (17,648,311 | ) | | | (51,758,304 | ) |
| Cost of shares redeemed – Institutional Class | | | (27,906,438 | ) | | | (25,324,220 | ) |
| Net increase (decrease) in net assets derived | | | | | | | | |
| from capital share transactions | | | (2,084,411 | ) | | | 56,178,878 | |
| TOTAL INCREASE (DECREASE) IN NET ASSETS | | | (1,423,393 | ) | | | 62,674,975 | |
| | | | | | | | | |
| NET ASSETS: | | | | | | | | |
| Beginning of period | | | 115,688,534 | | | | 53,013,559 | |
| End of period | | $ | 114,265,141 | | | $ | 115,688,534 | |
| Undistributed net investment loss, end of period | | $ | (333,040 | ) | | $ | (199,598 | ) |
| | | | | | | | | |
| CHANGES IN SHARES OUTSTANDING: | | | | | | | | |
| Shares sold – Investor Class | | | 667,352 | | | | 3,548,664 | |
| Shares sold – Institutional Class | | | 1,134,723 | | | | 2,147,233 | |
| Shares redeemed – Investor Class | | | (768,197 | ) | | | (2,244,158 | ) |
| Shares redeemed – Institutional Class | | | (1,159,384 | ) | | | (1,104,942 | ) |
| Net increase (decrease) in shares outstanding | | | (125,506 | ) | | | 2,346,797 | |
The accompanying notes are an integral part of these financial statements.
| HENNESSY FUNDS | 1-800-966-4354 | |
Financial Statements
For an Investor Class share outstanding throughout each period
| | | Six Months Ended | |
| | | April 30, 2016 | |
| | | (Unaudited) | |
| PER SHARE DATA: | | | |
| Net asset value, beginning of period | | $ | 24.07 | |
| | | | | |
| Income from investment operations: | | | | |
| Net investment loss | | | (0.05 | ) |
| Net realized and unrealized gains on investments | | | 0.38 | |
| Total from investment operations | | | 0.33 | |
| | | | | |
| Less distributions: | | | | |
| Dividends from net investment income | | | — | |
| Dividends from return of capital | | | — | |
| Total distributions | | | — | |
| Net asset value, end of period | | $ | 24.40 | |
| | | | | |
| TOTAL RETURN | | | 1.37 | %(1) |
| | | | | |
| SUPPLEMENTAL DATA AND RATIOS: | | | | |
| Net assets, end of period (millions) | | $ | 59.93 | |
| Ratio of expenses to average net assets | | | 1.51 | %(2) |
| Ratio of net investment income (loss) to average net assets | | | (0.38 | )%(2) |
Portfolio turnover rate(3) | | | 15 | %(1) |
(1) | Not annualized. |
(2) | Annualized. |
(3) | Portfolio turnover is calculated on the basis of the Fund as a whole. |
The accompanying notes are an integral part of these financial statements.
| Year Ended October 31, | |
| 2015 | | | 2014 | | | 2013 | | | 2012 | | | 2011 | |
| | | | | | | | | | | | | | |
| $ | 21.77 | | | $ | 19.68 | | | $ | 15.40 | | | $ | 13.99 | | | $ | 12.58 | |
| | | | | | | | | | | | | | | | | | | |
| | | | | | | | | | | | | | | | | | | |
| | (0.10 | ) | | | (0.06 | ) | | | (0.04 | ) | | | (0.02 | ) | | | (0.10 | ) |
| | 2.40 | | | | 2.15 | | | | 4.33 | | | | 1.43 | | | | 1.51 | |
| | 2.30 | | | | 2.09 | | | | 4.29 | | | | 1.41 | | | | 1.41 | |
| | | | | | | | | | | | | | | | | | | |
| | | | | | | | | | | | | | | | | | | |
| | — | | | | — | | | | — | | | | — | | | | — | |
| | — | | | | — | | | | (0.01 | ) | | | — | | | | — | |
| | — | | | | — | | | | (0.01 | ) | | | — | | | | — | |
| $ | 24.07 | | | $ | 21.77 | | | $ | 19.68 | | | $ | 15.40 | | | $ | 13.99 | |
| | | | | | | | | | | | | | | | | | | |
| | 10.56 | % | | | 10.62 | % | | | 27.87 | % | | | 10.08 | % | | | 11.21 | % |
| | | | | | | | | | | | | | | | | | | |
| | | | | | | | | | | | | | | | | | | |
| $ | 61.56 | | | $ | 27.26 | | | $ | 31.32 | | | $ | 10.38 | | | $ | 14.81 | |
| | 1.53 | % | | | 1.70 | % | | | 1.90 | % | | | 2.03 | % | | | 1.86 | % |
| | (0.44 | )% | | | (0.18 | )% | | | (0.35 | )% | | | (0.09 | )% | | | (0.54 | )% |
| | 21 | % | | | 22 | % | | | 6 | % | | | 2 | % | | | 166 | % |
The accompanying notes are an integral part of these financial statements.
| HENNESSY FUNDS | 1-800-966-4354 | |
Financial Statements
For an Institutional Class share outstanding throughout each period
| | | Six Months Ended | |
| | | April 30, 2016 | |
| | | (Unaudited) | |
| PER SHARE DATA: | | | |
| Net asset value, beginning of period | | $ | 24.55 | |
| | | | | |
| Income from investment operations: | | | | |
| Net investment income (loss) | | | (0.01 | ) |
| Net realized and unrealized gains on investments | | | 0.38 | |
| Total from investment operations | | | 0.37 | |
| | | | | |
| Less distributions: | | | | |
| Dividends from net investment income | | | — | |
| Dividends from return of capital | | | — | |
| Total distributions | | | — | |
| Net asset value, end of period | | $ | 24.92 | |
| | | | | |
| TOTAL RETURN | | | 1.51 | %(1) |
| | | | | |
| SUPPLEMENTAL DATA AND RATIOS: | | | | |
| Net assets, end of period (millions) | | $ | 54.33 | |
| Ratio of expenses to average net assets | | | 1.23 | %(2) |
| Ratio of net investment income (loss) to average net assets | | | (0.06 | )%(2) |
Portfolio turnover rate(3) | | | 15 | %(1) |
(1) | Not annualized. |
(2) | Annualized. |
(3) | Portfolio turnover is calculated on the basis of the Fund as a whole. |
The accompanying notes are an integral part of these financial statements.
| Year Ended October 31, | |
| 2015 | | | 2014 | | | 2013 | | | 2012 | | | 2011 | |
| | | | | | | | | | | | | | |
| $ | 22.15 | | | $ | 19.98 | | | $ | 15.60 | | | $ | 14.14 | | | $ | 12.66 | |
| | | | | | | | | | | | | | | | | | | |
| | | | | | | | | | | | | | | | | | | |
| | (0.02 | ) | | | 0.07 | | | | (0.03 | ) | | | 0.02 | | | | 0.03 | |
| | 2.42 | | | | 2.10 | | | | 4.42 | | | | 1.44 | | | | 1.45 | |
| | 2.40 | | | | 2.17 | | | | 4.39 | | | | 1.46 | | | | 1.48 | |
| | | | | | | | | | | | | | | | | | | |
| | | | | | | | | | | | | | | | | | | |
| | — | | | | — | | | | — | | | | — | | | | — | |
| | — | | | | — | | | | (0.01 | ) | | | — | | | | — | |
| | — | | | | — | | | | (0.01 | ) | | | — | | | | — | |
| $ | 24.55 | | | $ | 22.15 | | | $ | 19.98 | | | $ | 15.60 | | | $ | 14.14 | |
| | | | | | | | | | | | | | | | | | | |
| | 10.84 | % | | | 10.86 | % | | | 28.19 | % | | | 10.33 | % | | | 11.69 | % |
| | | | | | | | | | | | | | | | | | | |
| | | | | | | | | | | | | | | | | | | |
| $ | 54.13 | | | $ | 25.75 | | | $ | 9.07 | | | $ | 8.94 | | | $ | 9.70 | |
| | 1.27 | % | | | 1.50 | % | | | 1.66 | % | | | 1.85 | % | | | 1.64 | % |
| | (0.08 | )% | | | 0.26 | % | | | (0.20 | )% | | | 0.13 | % | | | 0.19 | % |
| | 21 | % | | | 22 | % | | | 6 | % | | | 2 | % | | | 166 | % |
The accompanying notes are an integral part of these financial statements.
| HENNESSY FUNDS | 1-800-966-4354 | |
Financial Statements
Notes to the Financial Statements April 30, 2016 (Unaudited) |
1). ORGANIZATION
The Hennessy Japan Fund (the “Fund”) is a series of Hennessy Funds Trust (the “Trust”), which was organized as a Delaware statutory trust on September 17, 1992. The Fund is an open-end management investment company registered under the Investment Company Act of 1940, as amended. The Fund is a successor to a fund with the same name (the “Predecessor Fund”) that was a series of Hennessy SPARX Funds Trust, a Massachusetts business trust, pursuant to a reorganization that took place after the close of business on February 28, 2014. Prior to February 28, 2014, the Fund had no investment operations. As a result of the reorganization, holders of the Investor Class shares of the Predecessor Fund received Investor Class shares of the Fund (the Investor Class shares of the Fund are the successor to the accounting and performance information of the Predecessor Fund), and holders of the Institutional Class shares of the Predecessor Fund received Institutional Class shares of the Fund (the Institutional Class shares of the Fund are the successor to the accounting and performance information of the Predecessor Fund). The investment objective of the Fund is long-term capital appreciation. The Fund is a diversified fund, but may employ a relatively focused investment strategy and may hold securities of fewer issuers than other diversified funds.
The Fund offers Investor Class and Institutional Class shares. Each class of shares differs principally in its respective administration, 12b-2 distribution and service, shareholder servicing, and transfer agent expenses and sales charges, if any. Each class has identical rights to earnings, assets, and voting privileges, except for class-specific expenses and exclusive rights to vote on matters affecting only an individual class.
As an investment company, the Fund follows the investment company accounting and reporting guidance of the Financial Accounting Standards Board (“FASB”) Accounting Standard Codification Topic 946 “Financial Services—Investment Companies.”
2). SIGNIFICANT ACCOUNTING POLICIES
The following is a summary of significant accounting policies consistently followed by the Fund in the preparation of the financial statements. These policies are in conformity with U.S. generally accepted accounting principles (“GAAP”).
| a). | Investment Valuation – All investments in securities are recorded at their estimated fair value, as described in Note 3. |
| b). | Federal Income Taxes – Provision for federal income taxes or excise taxes has not been made since the Fund has elected to be taxed as a “regulated investment company” and intends to distribute substantially all of its taxable income to its shareholders and otherwise comply with the provisions of the Internal Revenue Code of 1986, as amended, applicable to regulated investment companies. Net investment income or loss and realized gains and losses for federal income tax purposes may differ from that reported on the financial statements because of temporary book and tax basis differences. Temporary differences are primarily the result of the treatment of wash sales for tax reporting purposes. The Fund recognizes interest and penalties related to income tax benefits, if any, in the statement of operations as an income tax expense. Distributions from net realized gains for book purposes may include short-term capital gains, which are included as ordinary income to shareholders for tax purposes. |
| c). | Income and Expenses – Dividend income is recognized on the ex-dividend date or as soon as information is available to the Fund. Interest income, which includes the amortization of premium and accretion of discount, is recognized on an accrual basis. The Fund is charged for those expenses that are directly attributable to the portfolio, such as advisory, administration, and certain shareholder service fees. Income, expenses (other than expenses attributable to a specific class), and realized and unrealized gains or losses on investments are allocated to each class of shares based on its respective net assets. |
| d). | Distributions to Shareholders – Dividends from net investment income for the Fund, if any, are declared and paid annually, usually in December. Distributions of net realized capital gains, if any, are declared and paid annually, usually in December. |
| e). | Security Transactions – Investment and shareholder transactions are recorded on the trade date. The Fund determines the gain or loss realized from the investment transactions by comparing the original cost of the security lot sold with the net sale proceeds. Discounts and premiums on securities purchased are accreted/amortized over the life of the respective security. |
| f). | Use of Estimates – The preparation of financial statements in conformity with GAAP requires management to make estimates and assumptions that affect the reported amounts of assets and liabilities and disclosure of contingent assets and liabilities at the date of the financial statements and the reported change in net assets during the reporting period. Actual results could differ from those estimates. |
| g). | Share Valuation – The net asset value (“NAV”) per share of the Fund is calculated by dividing the sum of the value of the securities held by the Fund, plus cash or other assets, minus all liabilities (including estimated accrued expenses) by the total number of shares outstanding for the Fund, rounded to the nearest cent. The Fund’s shares will not be priced on days the New York Stock Exchange is closed for trading. The offering and redemption price per share for the Fund is equal to the Fund’s NAV per share. |
| h). | Foreign Currency – Values of investments denominated in foreign currencies are converted into U.S. dollars using the spot market rate of exchange at the time of valuation. Purchases and sales of investments and income are translated into U.S. dollars using the spot market rate of exchange prevailing on the respective dates of such transactions. The Fund does not isolate the portion of the results of operations resulting from fluctuations in foreign exchange rates on investments from fluctuations resulting from changes in the market prices of securities held. Such fluctuations are included with the net realized and unrealized gain or loss on investments. Foreign investments present additional risks due to currency fluctuations, economic and political factors, lower liquidity, government regulations, differences in accounting standards, and other factors. |
| i). | Forward Contracts – The Fund may enter into forward currency contracts to reduce its exposure to changes in foreign currency exchange rates on its foreign holdings and to lock in the U.S. dollar cost of firm purchase and sale commitments for securities denominated in foreign currencies. A forward currency contract is a commitment to purchase or sell a foreign currency at a future date at a negotiated forward rate. The gain or loss arising from the difference between the U.S. dollar cost of the original contract and the value of the foreign currency in U.S. dollars upon closing of such contract is included in net realized gain or loss from foreign currency transactions. During the six months ended April 30, 2016, the Fund did not enter into any forward contracts. |
| HENNESSY FUNDS | 1-800-966-4354 | |
| j). | Repurchase Agreements – The Fund may enter into repurchase agreements with member banks or security dealers of the Federal Reserve Board whom the investment advisor deems creditworthy. The repurchase price generally equals the price paid by the Fund plus interest negotiated on the basis of current short-term rates. |
| | Securities pledged as collateral for repurchase agreements are held by the custodian bank until the respective agreements mature. Provisions of the repurchase agreements ensure that the market value of the collateral, including accrued interest thereon, is sufficient to cover the repurchase amount in the event of default of the counterparty. If the counterparty defaults and the value of the collateral declines or if the counterparty enters an insolvency proceeding, realization of the collateral by the Fund may be delayed or limited. |
| k). | Accounting for Uncertainty in Income Taxes – The Fund has accounting policies regarding recognition and measurement of tax positions taken or expected to be taken on a tax return. The tax returns of the Fund for the prior three fiscal years are open for examination. The Fund has reviewed all open tax years in major jurisdictions and concluded that there is no impact on the Fund’s net assets and no tax liability resulting from unrecognized tax benefits relating to uncertain income tax positions taken or expected to be taken on a tax return. The Fund’s major tax jurisdictions are U.S. federal and Delaware. |
| l). | Derivatives – The Fund may invest in, or enter into, derivatives, such as options, futures contracts, options on futures contracts, and swaps, for a variety of reasons, including to hedge certain risks, to provide a substitute for purchasing or selling particular securities, or to increase potential income gain. Derivatives are financial contracts based on an underlying or notional amount, require no initial investment or an initial net investment that is smaller than would normally be required to have a similar response to changes in market factors, and require or permit net settlement. Derivatives may allow the Fund to increase or decrease the level of risk to which the Fund is exposed more quickly and efficiently than transactions in other types of instruments. The main purpose of utilizing derivative instruments is for hedging purposes. |
| | The Fund follows the financial accounting reporting rules as required by the Derivatives and Hedging Topic of the FASB Accounting Standards Codification. Under such rules, the Fund is required to include enhanced disclosure that enables investors to understand how and why an entity uses derivatives, how derivatives are accounted for, and how derivatives instruments affect an entity’s results of operations and financial position. During the six months ended April 30, 2016, the Fund did not hold any derivative instruments. |
| m). | New Accounting Pronouncements – In May 2015, the FASB issued ASU No. 2015-07 “Disclosure for Investments in Certain Entities that Calculate Net Asset Value per Share (or Its Equivalent).” The amendments in ASU No. 2015-07 remove the requirement to categorize within the fair value hierarchy investments measured at NAV and require the disclosure of sufficient information to reconcile the fair value of the remaining assets categorized within the fair value hierarchy to the financial statements. The amendments in ASU No. 2015-07 are effective for fiscal years beginning after December 15, 2015, and interim periods within those fiscal years. Management has reviewed the requirements and believes the adoption of ASU 2015-07 will not have a material impact on the Fund’s financial statements and related disclosures. |
3). SECURITIES VALUATION
The Fund follows authoritative fair valuation accounting standards that establish an authoritative definition of fair value and set out a hierarchy for measuring fair value.
These standards require additional disclosures about the various inputs and valuation techniques used to develop the measurements of fair value and a discussion in changes in valuation techniques and related inputs during the period. These inputs are summarized in the three broad levels listed below:
| | Level 1 – | Unadjusted, quoted prices in active markets for identical instruments that the Fund has the ability to access at the date of measurement. |
| | Level 2 – | Other significant observable inputs (including, but not limited to, quoted prices in active markets for similar instruments, quoted prices in markets that are not active for identical or similar instruments, and model-derived valuations in which all significant inputs and significant value drivers are observable in active markets (such as interest rates, prepayment speeds, credit risk curves, default rates, and similar data)). |
| | Level 3 – | Significant unobservable inputs (including the Fund’s own assumptions about what market participants would use to price the asset or liability based on the best available information) when observable inputs are unavailable. |
Following is a description of the valuation techniques applied to the Fund’s major categories of assets and liabilities measured at fair value on a recurring basis.
Equity Securities – Equity securities, including common stocks, preferred stocks, foreign-issued common stocks, exchange-traded funds, closed-end mutual funds, partnerships, rights, and real estate investment trusts, that are traded on a securities exchange for which a last-quoted sales price is readily available will generally be valued at the last sales price as reported by the primary exchange on which the securities are listed. Securities listed on The NASDAQ Stock Market (“NASDAQ”) will generally be valued at the NASDAQ Official Closing Price, which may differ from the last sales price reported. Securities traded on a securities exchange for which a last-quoted sales price is not readily available will generally be valued at the mean between the bid and ask prices. To the extent these securities are actively traded and valuation adjustments are not applied, they are classified in Level 1 of the fair value hierarchy. Securities traded on foreign exchanges generally are not valued at the same time the Fund calculates its NAV because most foreign markets close well before such time. The earlier close of most foreign markets gives rise to the possibility that significant events, including broad market moves, may have occurred in the interim. In certain circumstances, it may be determined that a security needs to be fair valued because it appears that the value of the security might have been materially affected by events occurring after the close of the market in which the security is principally traded, but before the time the Fund calculates its NAV, such as by a development that affects an entire market or region (e.g., weather-related events) or a potentially global development (e.g., a terrorist attack that may be expected to have an effect on investor expectations worldwide).
Registered Investment Companies – Investments in registered investment companies (e.g., mutual funds) are generally priced at the ending NAV provided by the applicable registered investment company’s service agent and will be classified in Level 1 of the fair value hierarchy.
Debt Securities – Debt securities, including corporate bonds, asset-backed securities, mortgage-backed securities, municipal bonds, U.S. Treasuries, and U.S. government agency issues, are generally valued at market on the basis of valuations furnished by an independent pricing service that utilizes both dealer-supplied valuations and formula-based techniques. The pricing service may consider recently executed transactions in securities of the issuer or comparable issuers, market price quotations (where observable), bond spreads, and fundamental data relating to the issuer. In addition, the model may
| HENNESSY FUNDS | 1-800-966-4354 | |
incorporate observable market data, such as reported sales of similar securities, broker quotes, yields, bids, offers, and reference data. Certain securities are valued primarily using dealer quotations. These securities are generally classified in Level 2 of the fair value hierarchy.
Short-Term Securities – Short-term equity investments, including money market funds, are valued in the manner specified above. Short-term debt investments with an original term to maturity of 60 days or less are valued at amortized cost, which approximates fair market value. If the original term to maturity of a short-term debt investment exceeded 60 days, then the values as of the 61st day prior to maturity are amortized. Amortized cost is not used if its use would be inappropriate due to credit or other impairments of the issuer, in which case the security’s fair value would be determined, as described below. Short-term securities are generally classified in Level 1 or Level 2 of the fair market hierarchy depending on the inputs used and market activity levels for specific securities.
The Board of Trustees of the Fund (the “Board”) has adopted fair value pricing procedures that are followed when a price for a security is not readily available or if a significant event has occurred that indicates the closing price of a security no longer represents the true value of that security. Fair value pricing determinations are made in good faith in accordance with these procedures. There are numerous criteria that will be given consideration in determining a fair value of a security, such as the trading volume of a security and markets, the value of other like securities, and news events with direct bearing to a security or markets. Fair value pricing results in an estimated price for a security that reflects the amount the Fund might reasonably expect to receive in a current sale. Depending on the relative significance of the valuation inputs, these securities may be classified in either Level 2 or Level 3 of the fair value hierarchy.
The fair valuation of foreign securities may be determined with the assistance of a pricing service using correlations between the movement of prices of such securities and indices of domestic securities and other appropriate indicators, such as closing market prices of relevant American Depositary Receipts or futures contracts. The effect of using fair value pricing is that the Fund’s NAV will reflect the affected portfolio securities’ value as determined by the Board or its designee instead of being determined by the market. Using a fair value pricing methodology to price foreign securities may result in a value that is different from a foreign security’s most recent closing price and from the prices used by other investment companies to calculate their NAVs and are generally considered Level 2 prices in the fair valuation hierarchy. Because the Fund may invest in foreign securities, the value of the Fund’s portfolio securities may change on days when you will not be able to purchase or redeem your shares.
The Board has delegated day-to-day valuation matters to a Valuation Committee comprised of one or more representatives from Hennessy Advisors, Inc., the Fund’s investment advisor. The function of the Valuation Committee is to value securities where current and reliable market quotations are not readily available. All actions taken by the Valuation Committee are reviewed by the Board.
The Fund has performed an analysis of all existing investments to determine the significance and character of all inputs to their fair value determination. Various inputs are used in determining the value of the Fund’s investments. The inputs or methodology used for valuing securities are not necessarily an indication of the risk associated with investing in those securities. Details related to the fair valuation hierarchy of the Fund’s securities as of April 30, 2016, are included in the Fund’s Schedule of Investments.
4). INVESTMENT TRANSACTIONS
Purchases and sales of investment securities (excluding government and short-term investments) for the Fund during the six months ended April 30, 2016, were $5,181,675 and $877,681, respectively.
There were no purchases or sales/maturities of long-term U.S. government securities for the Fund during the six months ended April 30, 2016.
5). INVESTMENT MANAGEMENT FEE AND OTHER TRANSACTIONS WITH AFFILIATES
Hennessy Advisors, Inc. (the “Advisor”) is the investment advisor of the Fund. The Advisor provides the Fund with investment management services under an Investment Advisory Agreement. The Advisor furnishes all investment advice, office space, facilities, and provides most of the personnel needed by the Fund. As compensation for its services, the Advisor is entitled to a monthly fee from the Fund. The fee is based upon the average daily net assets of the Fund at the annual rate of 1.00% until March 1, 2016, at which time the fee was reduced to an annual rate of 0.80%. The net investment advisory fees payable by the Fund as of April 30, 2016, were $82,474.
The Advisor has delegated the day-to-day management of the Fund to a sub-advisor, SPARX Asset Management Co., Ltd. The Advisor pays the sub-advisor fees for the Fund from its own assets and these fees are not an additional expense of the Fund.
The Board has approved a Shareholder Servicing Agreement for the Investor Class shares of the Fund, which was instituted to compensate the Advisor for the non-investment management services it provides to the Fund. The Shareholder Servicing Agreement provides for a monthly fee paid to the Advisor at an annual rate of 0.10% of the average daily net assets of the Fund attributable to Investor Class shares. Shareholder service fees payable by the Fund as of April 30, 2016, were $4,991.
The Fund has adopted a plan pursuant to Rule 12b-1 under the Investment Company Act of 1940, as amended, that authorizes payments in connection with the distribution of the Fund’s shares at an annual rate of up to 0.25% of the Fund’s average daily net assets attributable to Investor Class shares. Even though the authorized rate is up to 0.25%, the Fund has only used up to 0.15% of its average daily net assets attributable to Investor Class shares for such purpose since the plan was implemented on March 1, 2016. Amounts paid under the plan may be spent on any activities or expenses primarily intended to result in the sale of shares, including, but not limited to, advertising, shareholder account servicing, the printing and mailing of prospectuses to other than current shareholders, the printing and mailing of sales literature, and compensation for sales and marketing activities or to financial institutions and others, such as dealers and distributors.
The Fund has entered into agreements with various brokers, dealers, and financial intermediaries in connection with the sale of shares of the Fund. The agreements provide for periodic payments by the Fund to the brokers, dealers, and financial intermediaries for providing certain shareholder maintenance services (sub-transfer agent expenses). These shareholder services include the pre-processing and quality control of new accounts, shareholder correspondence, answering customer inquiries regarding account status, and facilitating shareholder telephone transactions. Fees paid by the Fund to various brokers, dealers, and financial intermediaries during the six months ended April 30, 2016, were $91,458.
U.S. Bancorp Fund Services, LLC (“USBFS”) provides the Fund with administrative, fund accounting, and transfer agent services, and necessary office equipment. As administrator, USBFS is responsible for activities such as (i) preparing various federal and
| HENNESSY FUNDS | 1-800-966-4354 | |
state regulatory filings, reports, and returns for the Fund, (ii) preparing reports and materials to be supplied to the Board, (iii) monitoring the activities of the Fund’s custodian, transfer agent, and accountants, and (iv) coordinating the preparation and payment of the Fund’s expenses and reviewing the Fund’s expense accruals. Fees paid to USBFS during the six months ended April 30, 2016, were $59,208.
U.S. Bank, N.A., an affiliate of USBFS, serves as the Fund’s custodian. Quasar Distributors, LLC acts as the Fund’s principal underwriter in a continuous public offering of the Fund’s shares. Quasar Distributors, LLC is an affiliate of USBFS and U.S. Bank, N.A.
6). LINE OF CREDIT
The Fund has an uncommitted line of credit with the other funds in the Hennessy Funds family of funds (the “Hennessy Funds”) in the amount of the lesser of (i) $100,000,000 or (ii) 33.33% of each Hennessy Fund’s net assets, or 30% for the Hennessy Gas Utility Fund and 10% for the Hennessy Balanced Fund, intended to provide short-term financing, if necessary, subject to certain restrictions, in connection with shareholder redemptions. The credit facility is with the Hennessy Funds’ custodian bank, U.S. Bank, N.A. Borrowings under this arrangement bear interest at the bank’s prime rate and are secured by all of the Fund’s assets (as to its own borrowings only). During the six months ended April 30, 2016, the Fund did not have any borrowings outstanding under the line of credit.
7). FEDERAL TAX INFORMATION
As of October 31, 2015, the Fund’s most recent fiscal year end, the components of accumulated earnings (losses) for income tax purposes were as follows:
| Cost of investments for tax purposes | | $ | 92,889,189 | |
| Gross tax unrealized appreciation | | $ | 24,599,430 | |
| Gross tax unrealized depreciation | | | (2,571,754 | ) |
| Net tax unrealized appreciation | | $ | 22,027,676 | |
| Undistributed ordinary income | | $ | — | |
| Undistributed long-term capital gains | | | — | |
| Total distributable earnings | | $ | — | |
| Other accumulated loss | | $ | (29,712,171 | ) |
| Total accumulated loss | | $ | (7,684,495 | ) |
The difference between book-basis unrealized appreciation/depreciation (as shown in the Statement of Assets and Liabilities) and tax-basis unrealized appreciation/depreciation (as shown above) is attributable primarily to wash sales.
At October 31, 2015, the Fund’s most recent fiscal year end, the Fund had capital loss carryforwards that expire as follows:
| | $ | 6,231,544 | | 10/31/16 |
| | $ | 15,450,664 | | 10/31/17 |
| | $ | 6,121,138 | | 10/31/18 |
| | $ | 1,274,960 | | Indefinite ST |
| | $ | 428,519 | | Indefinite LT |
During the fiscal year ended October 31, 2015, the Fund’s most recent fiscal year, the capital loss carryforwards utilized for the Fund were $590,302.
Capital losses sustained in the fiscal year ended October 31, 2012, and in future taxable years will not expire and may be carried over by the Fund without limitation; however, they will retain the character of the original loss. Furthermore, any loss incurred during those taxable years will be required to be utilized prior to the losses incurred in taxable years prior to 2012. As a result of this ordering rule, pre-enactment
capital loss carryforwards may be more likely to expire unused. Under pre-enactment law, capital losses could be carried forward for eight years, and carried forward as short-term capital losses, irrespective of the character of the original loss.
At October 31, 2015, the Fund’s most recent fiscal year end, the Fund deferred, on a tax basis, a post-December late year ordinary loss deferral of $199,598.
The Fund did not pay any distributions during fiscal year 2016 (year to date) or fiscal year 2015.
| HENNESSY FUNDS | 1-800-966-4354 | |
Expense Example (Unaudited)
April 30, 2016
As a shareholder of the Fund, you incur two types of costs: (1) transaction costs, including sales charges (loads) on purchase payments, reinvested dividends, or other distributions; redemption fees; and exchange fees; and (2) ongoing costs, including management fees; service fees; and other Fund expenses. This Example is intended to help you understand your ongoing costs (in dollars) of investing in the Fund and to compare these costs with the ongoing costs of investing in other mutual funds. The Example is based on an investment of $1,000 invested at the beginning of the period and held for the entire period from November 1, 2015 through April 30, 2016.
Actual Expenses
The first line of the table below under the “Investor Class” and “Institutional Class” headings provides information about actual account values and actual expenses. Although the Fund charges no sales loads or transaction fees, you will be assessed fees for outgoing wire transfers, returned checks and stop payment orders at prevailing rates charged by U.S. Bancorp Fund Services, LLC, the Fund’s transfer agent. If you request that a redemption be made by wire transfer, currently a $15.00 fee is charged by the Fund’s transfer agent. IRA accounts will be charged a $15.00 annual maintenance fee. The example below includes, but is not limited to, management fees, shareholder servicing fees, fund accounting, custody, and transfer agent fees. However, the example below does not include portfolio trading commissions and related expenses, and other extraordinary expenses as determined under generally accepted accounting principles. You may use the information in this line, together with the amount you invested, to estimate the expenses that you paid over the period. Simply divide your account value by $1,000 (for example, an $8,600 account value divided by $1,000 = 8.6), then multiply the result by the number in the first line of the table under the “Investor Class” and “Institutional Class” headings in the column entitled “Expenses Paid During Period” to estimate the expenses you paid on your account during this period.
Hypothetical Example for Comparison Purposes
The second line of the table below under the “Investor Class” and “Institutional Class” headings provides information about hypothetical account values and hypothetical expenses based on the Fund’s actual expense ratios and an assumed rate of return of 5% per year before expenses, which is not the Fund’s actual return. The hypothetical account values and expenses may not be used to estimate the actual ending account balance or expenses you paid for the period. You may use this information to compare the ongoing costs of investing in the Fund and other funds. To do so, compare this 5% hypothetical example with the 5% hypothetical examples that appear in the shareholder reports of the other funds. Please note that the expenses shown in the table are meant to highlight your ongoing costs only and do not reflect any transactional costs, such as sales charges (loads), or exchange fees. Therefore, the second line of the table under the “Investor Class” and “Institutional Class” headings is useful in comparing ongoing costs only, and will not help you determine the relative total costs of owning different funds. In addition, if these transactional costs were included, your costs would have been higher.
| | | | Expenses Paid |
| | Beginning | Ending | During Period(1) |
| | Account Value | Account Value | November 1, 2015 – |
| | November 1, 2015 | April 30, 2016 | April 30, 2016 |
| Investor Class | | | |
| Actual | $1,000.00 | $1,013.70 | $7.56 |
| Hypothetical (5% return before expenses) | $1,000.00 | $1,017.35 | $7.57 |
| | | | |
| Institutional Class | | | |
| Actual | $1,000.00 | $1,015.10 | $6.16 |
| Hypothetical (5% return before expenses) | $1,000.00 | $1,018.75 | $6.17 |
(1) | Expenses are equal to the Fund’s annualized expense ratio of 1.51% for Investor Class shares or 1.23% for Institutional Class shares, as applicable, multiplied by the average account value over the period, multiplied by 182/366 days (to reflect one-half year period). |
| HENNESSY FUNDS | 1-800-966-4354 | |
How to Obtain a Copy of the Fund’s
Proxy Voting Policy and Proxy Voting Records
A description of the policies and procedures the Fund uses to determine how to vote proxies relating to portfolio securities is available without charge: (1) by calling 1-800-966-4354; (2) on the Hennessy Funds’ website at hennessyfunds.com/proxy-voting/policy.fs; or (3) on the U.S. Securities and Exchange Commission’s website at www.sec.gov. The Fund’s proxy voting record is available without charge on both the Hennessy Funds’ website at hennessyfunds.com/proxy-voting/policy.fs and the SEC’s website at www.sec.gov no later than August 31 for the prior 12 months ending June 30.
Quarterly Filings on Form N-Q
The Fund files its complete schedule of portfolio holdings with the SEC for the first and third quarters of each fiscal year on Form N-Q. The Fund’s Form N-Q will be available on the SEC’s website at www.sec.gov. The Fund’s Form N-Q may be reviewed and copied at the SEC’s Public Reference Room in Washington, DC and information on the operation of the Public Reference Room may be obtained by calling 1-800-SEC-0330. Information included in the Fund’s N-Q will also be available upon request by calling 1-800-966-4354.
Householding
To help keep the Fund’s costs as low as possible, we generally deliver a single copy of most financial reports and prospectuses to shareholders who share an address, even if the accounts are registered under different names. This process, known as “householding,” does not apply to account statements. You may, of course, request an individual copy of a prospectus or financial report at any time. If you would like to receive separate mailings, please call the Administrator at 1-800-261-6950 or 1-414-765-4124 and we will begin individual delivery within 30 days of your request. If your account is held through a financial institution or other intermediary, please contact them directly to request individual delivery.
Matters Submitted to a Shareholder Vote
A special meeting of shareholders of the Investor Class shares of the Fund was held on January 14, 2016, and the following matters were approved by the Fund’s voting Investor Class shares:
| | | | | Broker |
| | For | Against | Abstain | Nonvotes |
| To approve a distribution | | | | |
| (Rule 12b-1) plan for the | | | | |
| Investor Class shares of the Fund | 947,801.625 | 127,344.237 | 127,283.514 | 185,790.000 |
Board Approval of Investment Advisory
Agreements
At its meeting on March 9, 2016, the Board of Trustees of the Fund (the “Board,” and the members thereof, the “Trustees”) unanimously approved the continuation of the investment advisory agreement of the Fund with Hennessy Advisors, Inc. (the “Advisor”) and the sub-advisory agreement of the Fund between the Advisor and SPARX Asset Management Co., Ltd. (the “Sub-Advisor”). As part of the process of approving the continuation of the advisory and sub-advisory agreements, the Trustees reviewed their fiduciary duties with respect to approving the advisory and sub-advisory agreements and the relevant factors for them to consider. In addition, the Trustees who are not deemed “interested persons” (as that term is defined by the Investment Company Act of 1940) of the Fund (the “Independent Trustees”) met in executive session to discuss the approval of the advisory and sub-advisory agreements.
In advance of the meeting, the Advisor sent detailed information to the Trustees to assist them in their evaluation of the advisory and sub-advisory agreements. This information included, but was not limited to, (i) a memorandum from outside legal counsel that described the fiduciary duties of the Board with respect to approving the continuation of the advisory and sub-advisory agreements and the relevant factors for consideration, (ii) a memorandum from the Advisor that listed the factors relevant to the Board’s approval of the continuation of the advisory and sub-advisory agreements and also referenced the documents that had been provided to help the Board assess each such factor, (iii) an inventory of the range of services provided by the Advisor and the Sub-Advisor for the Fund, (iv) a written discussion of economies of scale, (v) the advisory and sub-advisory agreements, (vi) a recent Fund fact sheet, (vii) a peer expense comparison, (viii) performance information, (ix) the Advisor’s most recent Form 10-K and Form 10-Q, which included information about the Advisor’s profitability, (x) information about brokerage commissions, (xi) information about the Fund’s compliance program, (xii) the Advisor’s current Form ADV Part I, (xiii) a completed questionnaire from the Sub-Advisor and summary thereof, (xiv) the Sub-Advisor’s Code of Ethics, and (xv) the Sub-Advisor’s Form ADV Parts I and II, and (xvi) other information the Trustees believed was useful in evaluating the approval of the continuation of the advisory and sub-advisory agreements.
All of the factors discussed by the Trustees were considered as a whole, and were considered separately by the Independent Trustees, meeting in executive session. The factors were viewed in their totality by the Trustees, with no single factor being the principal or determinative factor in the Trustees’ determination of whether to approve the continuation of the advisory and sub-advisory agreements. The Trustees recognized that the management and fee arrangements for the Fund are the result of years of review and discussion between the Independent Trustees and the Advisor, that certain aspects of such arrangements may receive greater scrutiny in some years than in others, and that the Trustees’ conclusions may be based, in part, on their consideration of these same arrangements and information received during the course of the year and in prior years.
Prior to approving the continuation of the advisory and sub-advisory agreements, the Trustees and the Independent Trustees in executive session considered, among other items:
| | • | The nature and quality of the advisory services provided by the Advisor and the Sub-Advisor. |
| | • | A comparison of the fees and expenses of the Fund to other similar funds. |
| | • | Whether economies of scale are recognized by the Fund. |
| HENNESSY FUNDS | 1-800-966-4354 | |
| | • | The costs and profitability of the Fund to the Advisor and the Sub-Advisor. |
| | • | The performance of the Fund. |
| | • | The other benefits to the Advisor and the Sub-Advisor from serving as an investment advisor to the Fund (in addition to the advisory and sub-advisory fees). |
The material considerations and determinations of the Board of Trustees, including all of the Independent Trustees, are as follows:
| | • | The Board considered the services identified below that are provided by the Advisor. Based on this review, the Trustees believe that the Advisor provides high-quality services to the Fund, and they noted that their overall confidence in the Advisor is high. The Trustees also concluded that they were satisfied with the nature, extent, and quality of the advisory services provided to the Fund by the Advisor, and that the nature and extent of the services provided by the Advisor are appropriate to assure that the Fund’s operations are conducted in compliance with applicable laws, rules, and regulations. |
| | | • | The Advisor oversees the Sub-Advisor for the Fund and the Sub-Advisor acts as the portfolio manager for the Fund. |
| | | • | The Advisor performs a daily reconciliation of portfolio positions and cash for the Fund. |
| | | • | The Advisor monitors the Fund’s compliance with its investment objectives and restrictions. |
| | | • | The Advisor monitors compliance with federal securities laws and performs activities such as maintaining a compliance program, conducting ongoing reviews of the compliance programs of the Sub-Advisor and the Fund’s other service providers, conducting on-site visits to the Sub-Advisor and the Fund’s other service providers, monitoring incidents of abusive trading practices, reviewing Fund expense accruals, payments, and fixed expense ratios, evaluating insurance providers for fidelity bond coverage and D&O/E&O insurance coverage, conducting employee compliance training, reviewing reports provided by service providers, maintaining books and records, and preparing an annual compliance report to the Board. |
| | | • | The Advisor oversees the selection and continued employment of the Sub-Advisor, monitors the Sub-Advisor’s adherence to the Fund’s investment objectives, policies, and restrictions, and reviews the Fund’s investment performance. |
| | | • | The Advisor oversees service providers that provide accounting, administration, distribution, transfer agency, custodial, sales and marketing, public relations, audit, information technology, and legal services to the Fund. |
| | | • | The Advisor maintains in-house marketing and distribution departments on behalf of the Fund. |
| | | • | The Advisor is actively involved with preparing regulatory filings for the Fund, including writing and annually updating the Fund’s prospectus and related documents. |
| | | • | The Advisor reviews the written summary prepared by the Sub-Advisor of the Fund’s performance for the most recent six-month period or twelve-month period, as applicable, for each semi-annual and annual report of the Fund. |
| | | • | The Advisor oversees distribution of the Fund through third-party broker/dealers and independent financial institutions such as Charles Schwab, Inc., Fidelity, TD Waterhouse, and Pershing. The Advisor participates in “no |
| | | | transaction fee” (“NTF”) programs with these companies on behalf of the Fund, which allow customers to purchase the Fund through third-party distribution channels without paying a transaction fee. The Advisor compensates, in part, a number of these third-party providers of NTF programs out of its own revenues. |
| | | • | The Advisor pays the incentive compensation of the Fund’s compliance officers and employs other staff, such as management executives, legal personnel, marketing personnel, national accounts and distribution personnel, sales personnel, administrative personnel, and trading oversight personnel. |
| | | • | The Advisor provides a quarterly compliance certification to the Board. |
| | | • | The Advisor prepares or reviews Board materials, frequently presents to the Board or leads Board discussions, prepares or reviews meeting minutes, and arranges for Board training and education. |
| | • | The Board considered the services identified below that are provided by the Sub-Advisor: |
| | | • | The Sub-Advisor acts as the portfolio manager for the Fund. In this capacity, the Sub-Advisor does the following: |
| | | | • | manages the composition of the Fund’s portfolio, including the purchase, retention, and disposition of portfolio securities in accordance with the Fund’s investment objectives, policies, and restrictions; |
| | | | • | ensures compliance with “best execution” for the Fund’s portfolio; and |
| | | | • | manages proxy voting for the Fund. |
| | | • | The Sub-Advisor ensures that its compliance program includes policies and procedures relevant to the Fund and the Sub-Advisor’s duties as a portfolio manager to the Fund. |
| | | • | The Sub-Advisor prepares a written summary of the Fund’s performance for the most recent six-month period or twelve-month period, as applicable, for each semi-annual and annual report of the Fund. |
| | | • | The Sub-Advisor provides a quarterly compliance certification to the Board regarding trading and allocation practices, supervisory matters, the Sub-Advisor’s compliance program (including its code of ethics), compliance with the Fund’s policies, and general firm updates. |
| | • | The Board considered the distinction between the services performed by the Advisor and the Sub-Advisor. It noted that the management of the Fund, including the oversight of the Sub-Advisor, involves more comprehensive and substantive duties than the duties of the Sub-Advisor. Specifically, the Board considered the lists of services identified above and concluded that the services performed by the Advisor for the Fund require a higher level of service and oversight than the services performed by the Sub-Advisor. Based on this determination, the Board concluded that the differential in advisory fees between the Advisor and the Sub-Advisor is reasonable. |
| | • | The Board compared the performance of the Fund to benchmark indices over various periods of time and they noted that at each quarterly meeting, the Trustees review reports comparing the investment performance of the Fund to various indices. Based on the information provided at the meeting and the information and quarterly discussions regarding the Fund’s investment performance, the Trustees believe that the Advisor and the Sub-Advisor manage the Fund in a manner that is materially consistent with its stated investment objective and style. |
| HENNESSY FUNDS | 1-800-966-4354 | |
| | | The Trustees concluded that the performance of the Fund over various time horizons warranted the continuation of the advisory and sub-advisory agreements. |
| | • | The Board reviewed the advisory fees and overall expense ratios of the Fund and comparable funds using data from Morningstar with respect to funds similar in asset size and investment objective to the Fund. As part of the discussion with management, the Trustees ensured that they understood and were comfortable with the criteria used to determine the mutual funds included in the Morningstar categories for purposes of the materials considered at the meeting. The Board determined that the advisory fee and overall expense ratio of the Fund falls within the range of the advisory fees and overall expense ratios of other comparable funds and concluded that they are reasonable and warranted continuation of the advisory and sub-advisory agreements. |
| | • | The Board also considered whether economies of scale were being realized by the Advisor that should be shared with the Fund’s shareholders. The Trustees noted that many of the expenses incurred to manage the Fund are asset-based fees and thus do not result in material economies of scale being realized as the net assets of the Fund increase. For example, intermediary service fees increase as the Fund’s assets grow. The Trustees also considered the Advisor’s efforts to contain expenses, and took into account the Advisor’s significant marketing efforts to increase Fund assets. The Board noted that at current asset levels it did not appear that there were economies of scale being realized by the Advisor and concluded that it would continue to monitor economies of scale in the future as circumstances changed. |
| | • | The Board considered the profitability of the Advisor and the Sub-Advisor, including the impact of intermediary service fees on the Advisor’s profitability, and also considered the resources and revenues that the Advisor has put into managing and distributing the Fund. The Board then concluded that the profits of the Advisor and the Sub-Advisor are reasonable and not excessive when compared to profitability guidelines set forth in relevant court cases. |
| | • | The Board considered the high level of professionalism and knowledge of the Advisor’s employees, along with a very low level of turnover, and concluded that this was beneficial to the Fund and its shareholders. |
| | • | The Board considered other benefits to the Advisor and the Sub-Advisor from serving as an advisor to the Fund (in addition to the advisory fee or sub-advisory fee). The Board noted that the Advisor and the Sub-Advisor may derive ancillary benefits from, by way of example, its association with the Fund in the form of proprietary and third-party research products and services received from broker dealers that execute portfolio trades for the Fund. The Board determined that any such products and services have been used for legitimate purposes relating to the Fund by providing assistance in the investment decision-making process. The Trustees concluded that the other benefits realized by the Advisor and the Sub-Advisor from their relationship with the Fund were reasonable. |
After reviewing the materials provided at the meeting and management’s presentation, as well as other information regularly provided at the Board’s quarterly meetings throughout the year regarding the quality of services provided by the Advisor and the Sub-Advisor, the performance of the Fund, expense information, regulatory compliance issues, trading information and related matters, and other factors deemed relevant by the Board, the Trustees, including all of the Independent Trustees, approved the continuation of the advisory and sub-advisory agreements.
(This Page Intentionally Left Blank.)
For information, questions or assistance, please call
The Hennessy Funds
1-800-966-4354 or 1-415-899-1555
INVESTMENT ADVISOR
Hennessy Advisors, Inc.
7250 Redwood Blvd., Suite 200
Novato, California 94945
ADMINISTRATOR,
TRANSFER AGENT,
DIVIDEND PAYING AGENT &
SHAREHOLDER SERVICING AGENT
U.S. Bancorp Fund Services, LLC
P.O. Box 701
Milwaukee, Wisconsin 53201-0701
CUSTODIAN
U.S. Bank N.A.
Custody Operations
1555 North River Center Dr., Suite 302
Milwaukee, Wisconsin 53212
TRUSTEES
Neil J. Hennessy
Robert T. Doyle
J. Dennis DeSousa
Gerald P. Richardson
COUNSEL
Foley & Lardner LLP
777 East Wisconsin Avenue
Milwaukee, Wisconsin 53202-5306
INDEPENDENT REGISTERED
PUBLIC ACCOUNTING FIRM
KPMG LLP
777 East Wisconsin Avenue
Milwaukee, Wisconsin 53202-5306
DISTRIBUTOR
Quasar Distributors, LLC
615 East Michigan Street
Milwaukee, Wisconsin 53202
hennessyfunds.com | 1-800-966-4354
This report has been prepared for shareholders and may be distributed to
others only if preceded or accompanied by a current prospectus.

SEMI-ANNUAL REPORT
APRIL 30, 2016
HENNESSY JAPAN SMALL CAP FUND
Investor Class HJPSX
Institutional Class HJSIX
hennessyfunds.com | 1-800-966-4354
(This Page Intentionally Left Blank.)
Contents
| Letter to Shareholders | 2 |
| Performance Overview | 4 |
| Financial Statements | |
| Schedule of Investments | 6 |
| Statement of Assets and Liabilities | 10 |
| Statement of Operations | 11 |
| Statements of Changes in Net Assets | 13 |
| Financial Highlights | 14 |
| Notes to the Financial Statements | 17 |
| Expense Example | 24 |
| Proxy Voting | 26 |
| Quarterly Filings on Form N-Q | 26 |
| Federal Tax Distribution Information | 26 |
| Householding | 26 |
| Matters Submitted to a Shareholder Vote | 27 |
| Board Approval of Investment Advisory Agreements | 28 |
| HENNESSY FUNDS | 1-800-966-4354 | |
June 2016
Dear Hennessy Funds Shareholder:
Over the last six months, investors again witnessed significant swings in global equity prices as investors reacted to fluctuations in the oil price and changing policy forecasts from the Federal Reserve, among other considerations. For Japanese equities, both developments in the global macroeconomic landscape as well as domestic issues combined to lead stock prices lower over the period.
During the six-month period ended April 30, 2016, the Japanese stock market, as measured by the Tokyo Stock Price Index, declined approximately 13% in yen terms and approximately 3% in U.S. Dollar terms. Several factors contributed to the decline in equity prices over the period, including a rise in the yen (following almost three years of decline), in part due to renewed uncertainty over the timing of additional interest rate increases in the U.S. Forecasts of slower corporate profits growth in Japan in the coming year and worry over the global consequences of a deceleration of economic growth in China also affected investor sentiment. Furthermore, at the end of January, the Bank of Japan introduced a negative interest rate policy aimed at boosting lending growth but which also caused confusion, as market participants struggled to understand the broader effects of such a policy.
In our opinion, the Japanese economy will continue to recover for three principal reasons. First, we believe Japan will be successful in ending deflation. Although the reported inflation rate has been lower than had been expected over the last twelve months, the core rate has been steadily trending upward since 2011. The population appears to be slowly shedding its deflationary mindset, with businesses becoming more optimistic about pricing power. Rising real estate prices and wages are also helping to dissipate lingering deflationary pressures. Second, we believe the government is enacting reforms that will have a meaningful effect on growth in the medium term. The government is making steady progress on deregulation and encouraging investment funds to target fields such as healthcare, social welfare, and agriculture. We believe the impact of such investment flows will become more evident with time. Third, consumer sentiment is improving. Major corporations are raising wages for a third consecutive year and college graduate hiring rates have been approaching historic highs. We believe that large corporations’ decision to increase wages may set a precedent for other companies and as sentiment improves with higher incomes, we believe that consumption will start to rise.
In summary, we believe that although the stronger yen may have a negative short-term impact on exporters’ profits, corporate earnings overall will continue to grow as long as the yen does not surge rapidly. We believe we are well positioned to seize the opportunities borne out of the market’s recent setback.
We remain optimistic about the long-term prospects for Japan and its stock market. Thank you for your continued confidence and investment in our Funds. If you have any questions or would like to speak with us directly, please don’t hesitate to call us at (800) 966-4354.
Sincerely,
Neil J. Hennessy
President and Chief Investment Officer
Hennessy Funds
| |
| Tadahiro Fujimura | Masakazu Takeda |
| Portfolio Manager, | Portfolio Manager, |
| Hennessy Japan Small Cap Fund; | Hennessy Japan Fund; |
| Head of Investment & Research | Fund Manager |
| and Sr. Portfolio Manager | SPARX Asset Management Co., Ltd. |
| SPARX Asset Management Co., Ltd. | |
SPARX Asset Management Co., Ltd., located in Tokyo, Japan, is the sub-advisor to the Hennessy Japan Fund and the Hennessy Japan Small Cap Fund.
Past performance does not guarantee future results.
Mutual fund investing involves risk. Principal loss is possible.
Opinions expressed are those of Neil Hennessy, Tadahiro Fujimura and Masakazu Takeda and are subject to change, are not guaranteed and should not be considered investment advice.
The Tokyo Stock Price Index (TOPIX) is an unmanaged index commonly used to measure the performance of Japanese stocks. One cannot invest directly in an index.
| HENNESSY FUNDS | 1-800-966-4354 | |
Performance Overview (Unaudited)
AVERAGE ANNUAL TOTAL RETURN FOR PERIODS ENDED APRIL 30, 2016
| | | | | Since |
| | Six | One | Five | Inception |
| | Months(1) | Year | Years | (8/31/2007) |
| Hennessy Japan Small | | | | |
| Cap Fund (HJPSX) | 2.89% | 3.59% | 12.16% | 8.18% |
| Hennessy Japan Small Cap Fund – | | | | |
Institutional Class (HJSIX)(2) | 2.99% | 3.80% | 12.20% | 8.21% |
| Russell/Nomura Small Cap™ Index | 3.15% | 4.53% | 8.80% | 4.56% |
| Tokyo Price Index (TOPIX) | -3.14% | -5.39% | 5.45% | 0.66% |
Expense ratios: 1.88% (Investor Class); 1.47% (Institutional Class)
Performance data quoted represents past performance; past performance does not guarantee future results. The investment return and principal value of an investment will fluctuate so that an investor’s shares, when redeemed, may be worth more or less than their original cost. The performance table does not reflect the deduction of taxes that a shareholder would pay on Fund distributions or the redemption of Fund shares. Current performance of the Fund may be lower or higher than the performance quoted. Performance data current to the most recent month end may be obtained by visiting hennessyfunds.com.
The expense ratios presented are from the most recent prospectus.
(1) | Periods less than one year are not annualized. |
(2) | The inception date of the Institutional Class shares is June 15, 2015. Performance shown prior to the inception of the Institutional Class shares reflects the performance of the Investor Class shares and includes expenses that are not applicable to and are higher than those of the Institutional Class shares. |
PERFORMANCE NARRATIVE
Portfolio Managers Tadahiro Fujimura, CFA and CMA*, and Tetsuya Hirano, CMA* SPARX Asset Management Co., Ltd. (sub-advisor)
Performance:
For the six-month period ended April 30, 2016, the Investor Class of the Hennessy Japan Small Cap Fund returned 2.89%, underperforming the Russell/Nomura Small Cap™ Index, which returned 3.15%, but outperforming the Tokyo Stock Price Index (TOPIX), which returned -3.14%, for the same period, all in U.S. Dollar terms.
The largest positive contributors to the Fund’s performance among the 33 TOPIX sub-industries were Information & Communication, Electric appliances, and Real Estate. The worst performers were Glass and Ceramic Products, Construction and Banks.
The best performing stock in the portfolio over the six-month period was Nihon Trim Co. Ltd., a manufacturer of water purification systems. The stock advanced on news of increasing demand for clean water globally, forecasts from management highlighting Chinese hospitals as a growing market opportunity for the company and strong reported earnings. Another important contributor to performance was Elecom Co. Ltd., a vendor of accessories for personal computers and smartphones, whose share price advanced primarily on expectations of robust third-quarter earnings and prospects of a dividend increase.
One of the most significant negative contributors to the Fund’s performance was Nakano Corp., a multinational construction contractor whose stock succumbed to profit taking following good results. Bell System24 Holdings Inc., a call center operator, also
performed poorly, reflecting a decline in profits in the year just ended. We believe the company’s difficulties have been resolved and expect revenue and profits growth to resume in the coming year. We continue to hold all the stocks mentioned.
Market Outlook:
The Bank of Japan (BOJ) introduced a negative interest rate policy in February 2016 in an effort to counter strength in the currency and to encourage lending. In response, Financials stocks, whose earnings are sensitive to interest rates, were sold off and consumer sentiment indicators declined. However, we believe that the actual effect on lending institutions’ earnings will be relatively limited, as only a small portion of the total deposits constituent banks hold with the BOJ is subject to negative rates.
Against this backdrop of accommodative monetary policy and slow growth, we are making no changes to our investment strategy. We will continue to pursue opportunities in what we determine are undervalued companies that we expect will generate strong profits growth in the next couple of years. We will also search out companies with new technologies whose stock prices are depressed. We will also research other types of companies, particularly those that should benefit from the recovery in consumption that we hope to see as a result of the resumption of wage growth with a stronger labor market. Finally, we will be investigating companies that struggled last year but that we believe have good prospects for a return to growth this year, such as construction companies or commodity-related companies.
* Chartered Member of the Security Analysts Association of Japan
Opinions expressed are those of the Portfolio Managers as of the date written and are subject to change, are not guaranteed, and should not be considered investment advice or an indication of trading intent.
The Russell/Nomura Small Cap™ Index contains the bottom 15% of the Russell/Nomura Total Market™ Index, which contains the top 98% of all stocks listed on Japan’s stock exchange and registered on Japan’s OTC market in terms of market capitalization. The Tokyo Price Index (TOPIX) is a market capitalization-weighted index of all companies listed on the First Section of the Tokyo Stock Exchange. One cannot invest directly in an index.
The Fund invests in small and medium capitalized companies, which may have more limited liquidity and greater price volatility than large capitalization companies. The Fund invests in the stocks of companies operating in Japan; single-country funds may be subject to a higher degree of risk. The Fund may experience higher fees due to investments in pooled investment vehicles (including ETFs).
References to specific securities should not be considered a recommendation to buy or sell any security. Fund holdings and sector allocations are subject to change. Please refer to the Schedule of Investments included in this report for additional portfolio information.
| HENNESSY FUNDS | 1-800-966-4354 | |
Financial Statements
Schedule of Investments as of April 30, 2016 (Unaudited) |
HENNESSY JAPAN SMALL CAP FUND
(% of Net Assets)
| TOP TEN HOLDINGS (EXCLUDING CASH/CASH EQUIVALENTS) | % NET ASSETS |
| Nihon Trim Co., Ltd. | 2.65% |
| Starts Corp., Inc. | 2.55% |
| DCM Holdings Co., Ltd. | 2.37% |
| Daihen Corp. | 2.19% |
| Elecom Co., Ltd. | 2.17% |
| Takeei Corp. | 2.11% |
| Hagihara Industries, Inc. | 2.09% |
| Amano Corp. | 2.06% |
| Hanwa Co., Ltd. | 2.05% |
| Nihon Unisys, Ltd. | 2.04% |
Note: For presentation purposes, the Fund has grouped some of the industry categories. For purposes of categorizing securities for compliance with Section 8(b)(1) of the Investment Company Act of 1940, as amended, the Fund uses more specific industry classifications.
| | COMMON STOCKS – 97.71% | | Number | | | | | | % of | |
| | | | of Shares | | | Value | | | Net Assets | |
| | Consumer Discretionary – 18.22% | | | | | | | | | |
| | Aeon Fantasy Co. | | | 15,700 | | | $ | 346,142 | �� | | | 1.35 | % |
| | DCM Holdings Co., Ltd. | | | 80,500 | | | | 608,585 | | | | 2.37 | % |
| | Doshisha Co., Ltd. | | | 24,100 | | | | 452,494 | | | | 1.76 | % |
| | Fujibo Holdings, Inc. | | | 220,000 | | | | 427,692 | | | | 1.66 | % |
| | Hagihara Industries, Inc. | | | 22,800 | | | | 538,067 | | | | 2.09 | % |
| | Komeri Co., Ltd. | | | 16,000 | | | | 401,226 | | | | 1.56 | % |
| | Parco Co., Ltd. | | | 51,400 | | | | 432,893 | | | | 1.69 | % |
| | Seiren Co., Ltd. | | | 35,100 | | | | 360,901 | | | | 1.40 | % |
| | Starts Corp., Inc. | | | 31,500 | | | | 654,602 | | | | 2.55 | % |
| | Tasaki & Co., Ltd. | | | 32,600 | | | | 459,954 | | | | 1.79 | % |
| | | | | | | | | 4,682,556 | | | | 18.22 | % |
| | | | | | | | | | | | | | |
| | Consumer Staples – 1.14% | | | | | | | | | | | | |
| | Yamaya Corp. | | | 16,000 | | | | 294,347 | | | | 1.14 | % |
| | | | | | | | | | | | | | |
| | Financials – 3.89% | | | | | | | | | | | | |
| | INTELLEX Co., Ltd. | | | 63,200 | | | | 499,243 | | | | 1.94 | % |
| | Tokai Tokyo Financial Holdings, Inc. | | | 96,600 | | | | 500,660 | | | | 1.95 | % |
| | | | | | | | | 999,903 | | | | 3.89 | % |
| | | | | | | | | | | | | | |
| | Industrials – 38.66% | | | | | | | | | | | | |
| | BELLSYSTEM24 Holdings, Inc. | | | 53,400 | | | | 470,270 | | | | 1.83 | % |
| | Benefit One, Inc. | | | 16,600 | | | | 376,415 | | | | 1.46 | % |
| | Daihen Corp. | | | 113,000 | | | | 562,932 | | | | 2.19 | % |
| | Daiichi Jitsugyo, Inc. | | | 77,000 | | | | 350,075 | | | | 1.36 | % |
| | Hanwa Co., Ltd. | | | 118,000 | | | | 527,348 | | | | 2.05 | % |
| | Hito Communication, Inc. | | | 25,800 | | | | 476,593 | | | | 1.85 | % |
| | Kanematsu Corp. | | | 223,000 | | | | 335,825 | | | | 1.31 | % |
| | Kito Corp. | | | 65,800 | | | | 453,559 | | | | 1.76 | % |
| | Kitz Corp. | | | 126,500 | | | | 512,765 | | | | 2.00 | % |
| | Kondotec, Inc. | | | 57,100 | | | | 461,374 | | | | 1.80 | % |
| | Miyaji Engineering Group, Inc. | | | 173,000 | | | | 236,656 | | | | 0.92 | % |
| | Nakano Corp. | | | 88,800 | | | | 407,078 | | | | 1.58 | % |
| | Nihon Trim Co., Ltd. | | | 10,000 | | | | 681,760 | | | | 2.65 | % |
| | Nissei ASB Machine Co., Ltd. | | | 20,600 | | | | 389,442 | | | | 1.52 | % |
| | Nittoku Engineering Co., Ltd. | | | 43,000 | | | | 390,096 | | | | 1.52 | % |
The accompanying notes are an integral part of these financial statements.
| HENNESSY FUNDS | 1-800-966-4354 | |
| | COMMON STOCKS | | Number | | | | | | % of | |
| | | | of Shares | | | Value | | | Net Assets | |
| | Industrials (Continued) | | | | | | | | | |
| | Okamura Corp. | | | 51,600 | | | $ | 477,122 | | | | 1.86 | % |
| | Ryobi, Ltd. | | | 101,000 | | | | 366,391 | | | | 1.43 | % |
| | Sanko Gosei, Ltd. | | | 134,000 | | | | 376,615 | | | | 1.47 | % |
| | Sinfonia Technology Co., Ltd. | | | 232,000 | | | | 308,316 | | | | 1.20 | % |
| | Sumitomo Densetsu Co., Ltd. | | | 42,400 | | | | 521,502 | | | | 2.03 | % |
| | Takeei Corp. | | | 60,000 | | | | 542,801 | | | | 2.11 | % |
| | Tocalo Co., Ltd. | | | 15,300 | | | | 275,223 | | | | 1.07 | % |
| | Toppan Forms Co., Ltd. | | | 39,600 | | | | 435,551 | | | | 1.69 | % |
| | | | | | | | | 9,935,709 | | | | 38.66 | % |
| | | | | | | | | | | | | | |
| | Information Technology – 29.95% | | | | | | | | | | | | |
| | Aichi Tokei Denki Co., Ltd. | | | 156,000 | | | | 441,575 | | | | 1.72 | % |
| | Aiphone Co., Ltd. | | | 26,300 | | | | 420,464 | | | | 1.64 | % |
| | Amano Corp. | | | 32,300 | | | | 528,404 | | | | 2.06 | % |
| | Anritsu Corp. | | | 36,500 | | | | 217,096 | | | | 0.84 | % |
| | Digital Garage, Inc. | | | 25,400 | | | | 508,644 | | | | 1.98 | % |
| | Elecom Co., Ltd. | | | 33,200 | | | | 556,983 | | | | 2.17 | % |
| | Information Services International – Dentsu, Ltd. | | | 28,100 | | | | 515,236 | | | | 2.00 | % |
| | Itfor, Inc. | | | 91,500 | | | | 400,486 | | | | 1.56 | % |
| | Koa Corp. | | | 67,200 | | | | 472,940 | | | | 1.84 | % |
| | Kyosan Electric Manufacturing Co., Ltd. | | | 164,000 | | | | 511,272 | | | | 1.99 | % |
| | Marubun Corp. | | | 35,200 | | | | 241,977 | | | | 0.94 | % |
| | Mimaki Engineering Co., Ltd. | | | 60,000 | | | | 289,485 | | | | 1.13 | % |
| | Nihon Unisys, Ltd. | | | 42,800 | | | | 524,127 | | | | 2.04 | % |
| | Soliton Systems K.K. | | | 44,900 | | | | 425,032 | | | | 1.65 | % |
| | TKC Corp. | | | 15,000 | | | | 407,529 | | | | 1.59 | % |
| | Towa Corp. | | | 79,500 | | | | 506,996 | | | | 1.97 | % |
| | V-cube, Inc. | | | 28,400 | | | | 313,382 | | | | 1.22 | % |
| | Yokowo Co., Ltd. | | | 91,100 | | | | 414,229 | | | | 1.61 | % |
| | | | | | | | | 7,695,857 | | | | 29.95 | % |
| | | | | | | | | | | | | | |
| | Materials – 5.85% | | | | | | | | | | | | |
| | Aichi Steel Corp. | | | 114,000 | | | | 483,119 | | | | 1.88 | % |
| | Asia Pile Holdings Co. | | | 55,500 | | | | 207,128 | | | | 0.80 | % |
| | Fujikura Kasei Co., Ltd. | | | 42,200 | | | | 190,109 | | | | 0.74 | % |
| | Hakudo Co., Ltd. | | | 52,000 | | | | 491,871 | | | | 1.91 | % |
The accompanying notes are an integral part of these financial statements.
| | COMMON STOCKS | | Number | | | | | | % of | |
| | | | of Shares | | | Value | | | Net Assets | |
| | Materials (Continued) | | | | | | | | | |
| | Shinagawa Refractories, Ltd. | | | 74,000 | | | $ | 132,621 | | | | 0.52 | % |
| | | | | | | | | 1,504,848 | | | | 5.85 | % |
| | Total Common Stocks | | | | | | | | | | | | |
| | (Cost $23,264,682) | | | | | | | 25,113,220 | | | | 97.71 | % |
| | | | | | | | | | | | | | |
| | SHORT-TERM INVESTMENTS – 1.04% | | | | | | | | | | | | |
| | Money Market Funds – 1.04% | | | | | | | | | | | | |
| | Fidelity Government Portfolio – Institutional Class, 0.23% (a) | | | 266,065 | | | | 266,065 | | | | 1.04 | % |
| | | | | | | | | | | | | | |
| | Total Short-Term Investments | | | | | | | | | | | | |
| | (Cost $266,065) | | | | | | | 266,065 | | | | 1.04 | % |
| | | | | | | | | | | | | | |
| | Total Investments | | | | | | | | | | | | |
| | (Cost $23,530,747) – 98.75% | | | | | | | 25,379,285 | | | | 98.75 | % |
| | | | | | | | | | | | | | |
| | Other Assets in | | | | | | | | | | | | |
| | Excess of Liabilities – 1.25% | | | | | | | 321,162 | | | | 1.25 | % |
| | | | | | | | | | | | | | |
| | TOTAL NET ASSETS – 100.00% | | | | | | $ | 25,700,447 | | | | 100.00 | % |
Percentages are stated as a percent of net assets.
(a) The rate listed is the fund’s 7-day yield as of April 30, 2016.
Summary of Fair Value Exposure at April 30, 2016
The following is a summary of the inputs used to value the Fund’s net assets as of April 30, 2016 (See Note 3 in the accompanying notes to the financial statements):
| Common Stocks | | Level 1 | | | Level 2 | | | Level 3 | | | Total | |
| Consumer Discretionary | | $ | — | | | $ | 4,682,556 | | | $ | — | | | $ | 4,222,602 | |
| Consumer Staples | | | — | | | | 294,347 | | | | — | | | | 294,347 | |
| Financials | | | — | | | | 999,903 | | | | — | | | | 999,903 | |
| Industrials | | | — | | | | 9,935,709 | | | | — | | | | 9,935,709 | |
| Information Technology | | | — | | | | 7,695,857 | | | | — | | | | 7,406,372 | |
| Materials | | | — | | | | 1,504,848 | | | | — | | | | 1,504,848 | |
| Total Common Stocks | | $ | — | | | $ | 25,113,220 | | | $ | — | | | $ | 25,113,220 | |
| Short-Term Investments | | | | | | | | | | | | | | | | |
| Money Market Funds | | $ | 266,065 | | | $ | — | | | $ | — | | | $ | 266,065 | |
| Total Short-Term Investments | | $ | 266,065 | | | $ | — | | | $ | — | | | $ | 266,065 | |
| Total Investments | | $ | 266,065 | | | $ | 25,113,220 | | | $ | — | | | $ | 25,379,285 | |
Transfers between levels are recognized at the end of the reporting period. During the six-month period ended April 30, 2016, the Fund recognized no transfers between levels.
Transfers between Level 1 and Level 2 relate to the use of fair valuation pricing service. On days when the fair valuation pricing service is used, non-U.S. dollar denominated securities move from a Level 1 to a Level 2 classification.
The accompanying notes are an integral part of these financial statements.
| HENNESSY FUNDS | 1-800-966-4354 | |
Financial Statements
Statement of Assets and Liabilities as of April 30, 2016 (Unaudited) |
| ASSETS: | | | |
| Investments in securities, at value (cost $23,530,747) | | $ | 25,379,285 | |
| Dividends and interest receivable | | | 306,811 | |
| Receivable for fund shares sold | | | 13,645 | |
| Receivable for securities sold | | | 238,114 | |
| Prepaid expenses and other assets | | | 17,402 | |
| Total Assets | | | 25,955,257 | |
| | | | | |
| LIABILITIES: | | | | |
| Payable for fund shares redeemed | | | 204,334 | |
| Payable to advisor | | | 17,542 | |
| Payable to administrator | | | 6,849 | |
| Payable to auditor | | | 9,709 | |
| Accrued distribution fees | | | 5,030 | |
| Accrued service fees | | | 1,952 | |
| Accrued trustees fees | | | 3,138 | |
| Accrued expenses and other payables | | | 6,256 | |
| Total Liabilities | | | 254,810 | |
| NET ASSETS | | $ | 25,700,447 | |
| | | | | |
| NET ASSETS CONSIST OF: | | | | |
| Capital stock | | $ | 23,913,111 | |
| Accumulated net investment loss | | | (30,397 | ) |
| Accumulated net realized loss on investments | | | (57,632 | ) |
| Unrealized net appreciation on investments | | | 1,875,365 | |
| Total Net Assets | | $ | 25,700,447 | |
| | | | | |
| NET ASSETS | | | | |
| Investor Class: | | | | |
| Shares authorized (no par value) | | Unlimited | |
| Net assets applicable to outstanding Investor Class shares | | $ | 22,884,269 | |
| Shares issued and outstanding | | | 2,235,673 | |
| Net asset value, offering price and redemption price per share | | $ | 10.24 | |
| | | | | |
| Institutional Class: | | | | |
| Shares authorized (no par value) | | Unlimited | |
| Net assets applicable to outstanding Institutional Class shares | | $ | 2,816,178 | |
| Shares issued and outstanding | | | 274,564 | |
| Net asset value, offering price and redemption price per share | | $ | 10.26 | |
The accompanying notes are an integral part of these financial statements.
Financial Statements
Statement of Operations for the six months ended April 30, 2016 (Unaudited) |
| INVESTMENT INCOME: | | | |
Dividend income(1) | | $ | 308,662 | |
| Interest income | | | 1,086 | |
| Total investment income | | | 309,748 | |
| | | | | |
| EXPENSES: | | | | |
| Investment advisory fees (See Note 5) | | | 142,324 | |
| Sub-transfer agent expenses – Investor Class (See Note 5) | | | 28,390 | |
| Sub-transfer agent expenses – Institutional Class (See Note 5) | | | 2,855 | |
| Federal and state registration fees | | | 17,299 | |
| Administration, fund accounting, custody and transfer agent fees (See note 5) | | | 13,101 | |
| Compliance expense | | | 11,790 | |
| Service fees – Investor Class (See Note 5) | | | 11,789 | |
| Audit fees | | | 10,311 | |
| Trustees’ fees and expenses | | | 5,984 | |
| Distribution fees - Investor Class (See Note 5) | | | 5,941 | |
| Reports to shareholders | | | 4,992 | |
| Legal fees | | | 1,247 | |
| Interest expense (See Note 6) | | | 144 | |
| Other expenses | | | 2,406 | |
| Total expenses | | | 258,573 | |
| NET INVESTMENT INCOME | | $ | 51,175 | |
| | | | | |
| REALIZED AND UNREALIZED GAINS: | | | | |
| Net realized gain on investments | | $ | 34,294 | |
| Net change in unrealized appreciation on investments | | | 625,452 | |
| Net gain on investments | | | 659,746 | |
| NET INCREASE IN NET ASSETS RESULTING FROM OPERATIONS | | $ | 710,921 | |
(1) | Net of foreign taxes withheld of $34,296. |
The accompanying notes are an integral part of these financial statements.
| HENNESSY FUNDS | 1-800-966-4354 | |
(This Page Intentionally Left Blank.)
Financial Statements
| Statements of Changes in Net Assets |
| | | Six Months Ended | | | | |
| | | April 30, 2016 | | | Year Ended | |
| | | (Unaudited) | | | October 31, 2015(1) | |
| OPERATIONS: | | | | | | |
| Net investment income (loss) | | $ | 51,175 | | | $ | (71,370 | ) |
| Net realized gain on investments | | | 34,294 | | | | 980,030 | |
| Net change in unrealized appreciation (depreciation) | | | | | | | | |
| on investments | | | 625,452 | | | | (324,113 | ) |
| Net increase in net assets resulting from operations | | | 710,921 | | | | 584,547 | |
| | | | | | | | | |
| DISTRIBUTIONS TO SHAREHOLDERS FROM: | | | | | | | | |
| Net realized gains | | | | | | | | |
| Investor Class | | | (821,234 | ) | | | (1,537,113 | ) |
| Institutional Class | | | (94,663 | ) | | | — | |
| Total distributions | | | (915,897 | ) | | | (1,537,113 | ) |
| | | | | | | | | |
| CAPITAL SHARE TRANSACTIONS: | | | | | | | | |
| Proceeds from shares subscribed – Investor Class | | | 6,613,328 | | | | 19,602,053 | |
| Proceeds from shares subscribed – Institutional Class | | | 1,315,806 | | | | 3,944,130 | |
| Dividends reinvested – Investor Class | | | 815,922 | | | | 1,515,157 | |
| Dividends reinvested – Institutional Class | | | 94,663 | | | | — | |
| Cost of shares redeemed – Investor Class | | | (6,999,336 | ) | | | (16,864,362 | ) |
| Cost of shares redeemed – Institutional Class | | | (1,264,301 | ) | | | (1,278,434 | ) |
| Net increase in net assets derived | | | | | | | | |
| from capital share transactions | | | 576,082 | | | | 6,918,544 | |
| TOTAL INCREASE IN NET ASSETS | | | 371,106 | | | | 5,965,978 | |
| | | | | | | | | |
| NET ASSETS: | | | | | | | | |
| Beginning of period | | | 25,329,341 | | | | 19,363,363 | |
| End of period | | $ | 25,700,447 | | | $ | 25,329,341 | |
| Undistributed net investment loss, end of period | | $ | (30,397 | ) | | $ | (81,572 | ) |
| | | | | | | | | |
| CHANGES IN SHARES OUTSTANDING: | | | | | | | | |
| Shares sold – Investor Class | | | 650,224 | | | | 1,882,041 | |
| Shares sold – Institutional Class | | | 133,613 | | | | 375,953 | |
| Shares issued to holders as | | | | | | | | |
| reinvestment of dividends – Investor Class | | | 81,186 | | | | 160,845 | |
| Shares issued to holders as | | | | | | | | |
| reinvestment of dividends – Institutional Class | | | 9,401 | | | | — | |
| Shares redeemed – Investor Class | | | (700,982 | ) | | | (1,679,167 | ) |
| Shares redeemed – Institutional Class | | | (125,637 | ) | | | (118,766 | ) |
| Net increase in shares outstanding | | | 47,805 | | | | 620,906 | |
(1) | Institutional Class shares commenced operations on June 15, 2015. |
The accompanying notes are an integral part of these financial statements.
| HENNESSY FUNDS | 1-800-966-4354 | |
Financial Statements
For an Investor Class share outstanding throughout each period
| | | Six Months Ended | |
| | | April 30, 2016 | |
| | | (Unaudited) | |
| PER SHARE DATA: | | | |
| Net asset value, beginning of period | | $ | 10.29 | |
| | | | | |
| Income from investment operations: | | | | |
| Net investment income (loss) | | | 0.02 | |
| Net realized and unrealized gains (losses) on investments | | | 0.27 | |
| Total from investment operations | | | 0.29 | |
| | | | | |
| Less distributions: | | | | |
| Dividends from net investment income | | | — | |
| Dividends from net realized gains | | | (0.34 | ) |
| Total distributions | | | (0.34 | ) |
| Net asset value, end of period | | $ | 10.24 | |
| | | | | |
| TOTAL RETURN | | | 2.89 | %(1) |
| | | | | |
| SUPPLEMENTAL DATA AND RATIOS: | | | | |
| Net assets, end of period (millions) | | $ | 22.88 | |
| Ratio of expenses to average net assets | | | 1.96 | %(2) |
| Ratio of net investment income (loss) to average net assets | | | 0.34 | %(2) |
Portfolio turnover rate(3) | | | 37 | %(1) |
(1) | Not annualized. |
(2) | Annualized. |
(3) | Portfolio turnover is calculated on the basis of the Fund as a whole. |
The accompanying notes are an integral part of these financial statements.
| Year Ended October 31, | |
| 2015 | | | 2014 | | | 2013 | | | 2012 | | | 2011 | |
| | | | | | | | | | | | | | |
| $ | 10.51 | | | $ | 11.70 | | | $ | 10.54 | | | $ | 10.09 | | | $ | 9.23 | |
| | | | | | | | | | | | | | | | | | | |
| | | | | | | | | | | | | | | | | | | |
| | 0.02 | | | | (0.04 | ) | | | 0.06 | | | | (0.68 | ) | | | 0.06 | |
| | (0.71 | ) | | | 1.36 | | | | 3.44 | | | | 1.17 | | | | 0.80 | |
| | 0.69 | | | | 1.32 | | | | 3.50 | | | | 0.49 | | | | 0.86 | |
| | | | | | | | | | | | | | | | | | | |
| | | | | | | | | | | | | | | | | | | |
| | — | | | | — | | | | — | | | | (0.04 | ) | | | — | |
| | (0.91 | ) | | | (2.51 | ) | | | (2.34 | ) | | | — | | | | — | |
| | (0.91 | ) | | | (2.51 | ) | | | (2.34 | ) | | | (0.04 | ) | | | — | |
| $ | 10.29 | | | $ | 10.51 | | | $ | 11.70 | | | $ | 10.54 | | | $ | 10.09 | |
| | | | | | | | | | | | | | | | | | | |
| | 7.37 | % | | | 13.99 | % | | | 40.59 | % | | | 4.91 | % | | | 9.32 | % |
| | | | | | | | | | | | | | | | | | | |
| | | | | | | | | | | | | | | | | | | |
| $ | 22.68 | | | $ | 19.36 | | | $ | 14.82 | | | $ | 5.11 | | | $ | 24.08 | |
| | 2.12 | % | | | 2.24 | % | | | 2.39 | % | | | 2.33 | % | | | 2.10 | % |
| | (0.38 | )% | | | (0.39 | )% | | | (0.11 | )% | | | (0.66 | )% | | | 0.17 | % |
| | 75 | % | | | 63 | % | | | 141 | % | | | 49 | % | | | 61 | % |
The accompanying notes are an integral part of these financial statements.
| HENNESSY FUNDS | 1-800-966-4354 | |
Financial Statements
For an Institutional Class share outstanding throughout each period
| | | Six Months Ended | | | | |
| | | April 30, 2016 | | | Period Ended | |
| | | (Unaudited) | | | October 31, 2015(1) | |
| PER SHARE DATA: | | | | | | |
| Net asset value, beginning of period | | $ | 10.30 | | | $ | 10.89 | |
| | | | | | | | | |
| Income from investment operations: | | | | | | | | |
| Net investment income (loss) | | | 0.09 | | | | (0.01 | ) |
| Net realized and unrealized gains (losses) on investments | | | 0.21 | | | | (0.58 | ) |
| Total from investment operations | | | 0.30 | | | | (0.59 | ) |
| | | | | | | | | |
| Less distributions: | | | | | | | | |
| Dividends from net investment income | | | — | | | | — | |
| Dividends from net realized gains | | | (0.34 | ) | | | — | |
| Total distributions | | | (0.34 | ) | | | — | |
| Net asset value, end of period | | $ | 10.26 | | | $ | 10.30 | |
| | | | | | | | | |
| TOTAL RETURN | | | 2.99 | %(2) | | | (5.42 | )%(2) |
| | | | | | | | | |
| SUPPLEMENTAL DATA AND RATIOS: | | | | | | | | |
| Net assets, end of period (millions) | | $ | 2.82 | | | $ | 2.65 | |
| Ratio of expenses to average net assets | | | 1.74 | %(3) | | | 1.86 | %(3) |
| Ratio of net investment income (loss) to average net assets | | | 0.70 | %(3) | | | (1.04 | )%(3) |
Portfolio turnover rate(4) | | | 37 | %(2) | | | 75 | %(2) |
(1) | Institutional Class shares commenced operations on June 15, 2015. |
(2) | Not annualized. |
(3) | Annualized. |
(4) | Portfolio turnover is calculated on the basis of the Fund as a whole. |
The accompanying notes are an integral part of these financial statements.
Financial Statements
Notes to the Financial Statements April 30, 2016 (Unaudited) |
1). ORGANIZATION
The Hennessy Japan Small Cap Fund (the “Fund”) is a series of Hennessy Funds Trust (the “Trust”), which was organized as a Delaware statutory trust on September 17, 1992. The Fund is an open-end management investment company registered under the Investment Company Act of 1940, as amended. The Fund is a successor to a fund with the same name (the “Predecessor Fund”) that was a series of Hennessy SPARX Funds Trust, a Massachusetts business trust, pursuant to a reorganization that took place after the close of business on February 28, 2014. Prior to February 28, 2014, the Fund had no investment operations. As a result of the reorganization, holders of the Investor Class shares of the Predecessor Fund received Investor Class shares of the Fund (the Investor Class shares of the Fund are the successor to the accounting and performance information of the Predecessor Fund). The Fund did not have Institutional Class shares until June 15, 2015. The investment objective of the Fund is long-term capital appreciation. The Fund is a diversified fund.
The Fund offers Investor Class and Institutional Class shares. Each class of shares differs principally in its respective administration, 12b-1 distribution and service, shareholder servicing, and transfer agent expenses and sales charges, if any. Each class has identical rights to earnings, assets, and voting privileges, except for class-specific expenses and exclusive rights to vote on matters affecting only an individual class.
As an investment company, the Fund follows the investment company accounting and reporting guidance of the Financial Accounting Standards Board (“FASB”) Accounting Standard Codification Topic 946 “Financial Services—Investment Companies.”
2). SIGNIFICANT ACCOUNTING POLICIES
The following is a summary of significant accounting policies consistently followed by the Fund in the preparation of the financial statements. These policies are in conformity with U.S. generally accepted accounting principles (“GAAP”).
| a). | Investment Valuation – All investments in securities are recorded at their estimated fair value, as described in Note 3. |
| b). | Federal Income Taxes – Provision for federal income taxes or excise taxes has not been made since the Fund has elected to be taxed as a “regulated investment company” and intends to distribute substantially all of its taxable income to its shareholders and otherwise comply with the provisions of the Internal Revenue Code of 1986, as amended, applicable to regulated investment companies. Net investment income or loss and realized gains and losses for federal income tax purposes may differ from that reported on the financial statements because of temporary book and tax basis differences. Temporary differences are primarily the result of the treatment of wash sales for tax reporting purposes. The Fund recognizes interest and penalties related to income tax benefits, if any, in the statement of operations as an income tax expense. Distributions from net realized gains for book purposes may include short-term capital gains, which are included as ordinary income to shareholders for tax purposes. |
| c). | Income and Expenses – Dividend income is recognized on the ex-dividend date or as soon as information is available to the Fund. Interest income, which includes the amortization of premium and accretion of discount, is recognized on an accrual basis. |
| HENNESSY FUNDS | 1-800-966-4354 | |
| | The Fund is charged for those expenses that are directly attributable to the portfolio, such as advisory, administration, and certain shareholder service fees. Income, expenses (other than expenses attributable to a specific class), and realized and unrealized gains or losses on investments are allocated to each class of shares based on its respective net assets. |
| d). | Distributions to Shareholders – Dividends from net investment income for the Fund, if any, are declared and paid annually, usually in December. Distributions of net realized capital gains, if any, are declared and paid annually, usually in December. |
| e). | Security Transactions – Investment and shareholder transactions are recorded on the trade date. The Fund determines the gain or loss realized from the investment transactions by comparing the original cost of the security lot sold with the net sale proceeds. Discounts and premiums on securities purchased are accreted/amortized over the life of the respective security. |
| f). | Use of Estimates – The preparation of financial statements in conformity with GAAP requires management to make estimates and assumptions that affect the reported amounts of assets and liabilities and disclosure of contingent assets and liabilities at the date of the financial statements and the reported change in net assets during the reporting period. Actual results could differ from those estimates. |
| g). | Share Valuation – The net asset value (“NAV”) per share of the Fund is calculated by dividing the sum of the value of the securities held by the Fund, plus cash or other assets, minus all liabilities (including estimated accrued expenses) by the total number of shares outstanding for the Fund, rounded to the nearest cent. The Fund’s shares will not be priced on days the New York Stock Exchange is closed for trading. The offering and redemption price per share for the Fund is equal to the Fund’s NAV per share. |
| h). | Foreign Currency – Values of investments denominated in foreign currencies are converted into U.S. dollars using the spot market rate of exchange at the time of valuation. Purchases and sales of investments and income are translated into U.S. dollars using the spot market rate of exchange prevailing on the respective dates of such transactions. The Fund does not isolate the portion of the results of operations resulting from fluctuations in foreign exchange rates on investments from fluctuations resulting from changes in the market prices of securities held. Such fluctuations are included with the net realized and unrealized gain or loss on investments. Foreign investments present additional risks due to currency fluctuations, economic and political factors, lower liquidity, government regulations, differences in accounting standards, and other factors. |
| i). | Forward Contracts – The Fund may enter into forward currency contracts to reduce its exposure to changes in foreign currency exchange rates on its foreign holdings and to lock in the U.S. dollar cost of firm purchase and sale commitments for securities denominated in foreign currencies. A forward currency contract is a commitment to purchase or sell a foreign currency at a future date at a negotiated forward rate. The gain or loss arising from the difference between the U.S. dollar cost of the original contract and the value of the foreign currency in U.S. dollars upon closing of such contract is included in net realized gain or loss from foreign currency transactions. During the six months ended April 30, 2016, the Fund did not enter into any forward contracts. |
| j). | Repurchase Agreements – The Fund may enter into repurchase agreements with member banks or security dealers of the Federal Reserve Board whom the investment advisor deems creditworthy. The repurchase price generally equals the price paid by the Fund plus interest negotiated on the basis of current short-term rates. |
| | Securities pledged as collateral for repurchase agreements are held by the custodian bank until the respective agreements mature. Provisions of the repurchase agreements ensure that the market value of the collateral, including accrued interest thereon, is sufficient to cover the repurchase amount in the event of default of the counterparty. If the counterparty defaults and the value of the collateral declines or if the counterparty enters an insolvency proceeding, realization of the collateral by the Fund may be delayed or limited. |
| k). | Accounting for Uncertainty in Income Taxes – The Fund has accounting policies regarding recognition and measurement of tax positions taken or expected to be taken on a tax return. The tax returns of the Fund for the prior three fiscal years are open for examination. The Fund has reviewed all open tax years in major jurisdictions and concluded that there is no impact on the Fund’s net assets and no tax liability resulting from unrecognized tax benefits relating to uncertain income tax positions taken or expected to be taken on a tax return. The Fund’s major tax jurisdictions are U.S. federal and Delaware. |
| l). | Derivatives – The Fund may invest in, or enter into, derivatives, such as options, futures contracts, options on futures contracts, and swaps, for a variety of reasons, including to hedge certain risks, to provide a substitute for purchasing or selling particular securities, or to increase potential income gain. Derivatives are financial contracts based on an underlying or notional amount, require no initial investment or an initial net investment that is smaller than would normally be required to have a similar response to changes in market factors, and require or permit net settlement. Derivatives may allow the Fund to increase or decrease the level of risk to which the Fund is exposed more quickly and efficiently than transactions in other types of instruments. The main purpose of utilizing derivative instruments is for hedging purposes. |
| | The Fund follows the financial accounting reporting rules as required by the Derivatives and Hedging Topic of the FASB Accounting Standards Codification. Under such rules, the Fund is required to include enhanced disclosure that enables investors to understand how and why an entity uses derivatives, how derivatives are accounted for, and how derivatives instruments affect an entity’s results of operations and financial position. During the six months ended April 30, 2016, the Fund did not hold any derivative instruments. |
| m). | New Accounting Pronouncements – In May 2015, the FASB issued ASU No. 2015-07 “Disclosure for Investments in Certain Entities that Calculate Net Asset Value per Share (or Its Equivalent).” The amendments in ASU No. 2015-07 remove the requirement to categorize within the fair value hierarchy investments measured at NAV and require the disclosure of sufficient information to reconcile the fair value of the remaining assets categorized within the fair value hierarchy to the financial statements. The amendments in ASU No. 2015-07 are effective for fiscal years beginning after December 15, 2015, and interim periods within those fiscal years. Management has reviewed the requirements and believes the adoption of ASU 2015-07 will not have a material impact on the Fund’s financial statements and related disclosures. |
3). SECURITIES VALUATION
The Fund follows authoritative fair valuation accounting standards that establish an authoritative definition of fair value and set out a hierarchy for measuring fair value. These standards require additional disclosures about the various inputs and valuation techniques used to develop the measurements of fair value and a discussion in changes in valuation techniques and related inputs during the period. These inputs are summarized in the three broad levels listed below:
| HENNESSY FUNDS | 1-800-966-4354 | |
| | Level 1 – | Unadjusted, quoted prices in active markets for identical instruments that the Fund has the ability to access at the date of measurement. |
| | Level 2 – | Other significant observable inputs (including, but not limited to, quoted prices in active markets for similar instruments, quoted prices in markets that are not active for identical or similar instruments, and model-derived valuations in which all significant inputs and significant value drivers are observable in active markets (such as interest rates, prepayment speeds, credit risk curves, default rates, and similar data)). |
| | Level 3 – | Significant unobservable inputs (including the Fund’s own assumptions about what market participants would use to price the asset or liability based on the best available information) when observable inputs are unavailable. |
Following is a description of the valuation techniques applied to the Fund’s major categories of assets and liabilities measured at fair value on a recurring basis.
Equity Securities – Equity securities, including common stocks, preferred stocks, foreign-issued common stocks, exchange-traded funds, closed-end mutual funds, partnerships, rights, and real estate investment trusts, that are traded on a securities exchange for which a last-quoted sales price is readily available will generally be valued at the last sales price as reported by the primary exchange on which the securities are listed. Securities listed on The NASDAQ Stock Market (“NASDAQ”) will generally be valued at the NASDAQ Official Closing Price, which may differ from the last sales price reported. Securities traded on a securities exchange for which a last-quoted sales price is not readily available will generally be valued at the mean between the bid and ask prices. To the extent these securities are actively traded and valuation adjustments are not applied, they are classified in Level 1 of the fair value hierarchy. Securities traded on foreign exchanges generally are not valued at the same time the Fund calculates its NAV because most foreign markets close well before such time. The earlier close of most foreign markets gives rise to the possibility that significant events, including broad market moves, may have occurred in the interim. In certain circumstances, it may be determined that a security needs to be fair valued because it appears that the value of the security might have been materially affected by events occurring after the close of the market in which the security is principally traded, but before the time the Fund calculates its NAV, such as by a development that affects an entire market or region (e.g., weather-related events) or a potentially global development (e.g., a terrorist attack that may be expected to have an effect on investor expectations worldwide).
Registered Investment Companies – Investments in registered investment companies (e.g., mutual funds) are generally priced at the ending NAV provided by the applicable registered investment company’s service agent and will be classified in Level 1 of the fair value hierarchy.
Debt Securities – Debt securities, including corporate bonds, asset-backed securities, mortgage-backed securities, municipal bonds, U.S. Treasuries, and U.S. government agency issues, are generally valued at market on the basis of valuations furnished by an independent pricing service that utilizes both dealer-supplied valuations and formula-based techniques. The pricing service may consider recently executed transactions in securities of the issuer or comparable issuers, market price quotations (where observable), bond spreads, and fundamental data relating to the issuer. In addition, the model may incorporate observable market data, such as reported sales of similar securities, broker quotes, yields, bids, offers, and reference data. Certain securities are valued primarily using dealer quotations. These securities are generally classified in Level 2 of the fair value hierarchy.
Short-Term Securities – Short-term equity investments, including money market funds, are valued in the manner specified above. Short term debt investments with an original term to maturity of 60 days or less are valued at amortized cost, which approximates fair market value. If the original term to maturity of a short term debt investment exceeded 60 days, then the values as of the 61st day prior to maturity are amortized. Amortized cost is not used if its use would be inappropriate due to credit or other impairments of the issuer, in which case the security’s fair value would be determined, as described below. Short-term securities are generally classified in Level 1 or Level 2 of the fair market hierarchy depending on the inputs used and market activity levels for specific securities.
The Board of Trustees of the Fund (the “Board”) has adopted fair value pricing procedures that are followed when a price for a security is not readily available or if a significant event has occurred that indicates the closing price of a security no longer represents the true value of that security. Fair value pricing determinations are made in good faith in accordance with these procedures. There are numerous criteria that will be given consideration in determining a fair value of a security, such as the trading volume of a security and markets, the value of other like securities, and news events with direct bearing to a security or markets. Fair value pricing results in an estimated price for a security that reflects the amount the Fund might reasonably expect to receive in a current sale. Depending on the relative significance of the valuation inputs, these securities may be classified in either Level 2 or Level 3 of the fair value hierarchy.
The fair valuation of foreign securities may be determined with the assistance of a pricing service using correlations between the movement of prices of such securities and indices of domestic securities and other appropriate indicators, such as closing market prices of relevant American Depositary Receipts or futures contracts. The effect of using fair value pricing is that the Fund’s NAV will reflect the affected portfolio securities’ value as determined by the Board or its designee instead of being determined by the market. Using a fair value pricing methodology to price foreign securities may result in a value that is different from a foreign security’s most recent closing price and from the prices used by other investment companies to calculate their NAVs and are generally considered Level 2 prices in the fair valuation hierarchy. Because the Fund may invest in foreign securities, the value of the Fund’s portfolio securities may change on days when you will not be able to purchase or redeem your shares.
The Board has delegated day-to-day valuation matters to a Valuation Committee comprised of one or more representatives from Hennessy Advisors, Inc., the Fund’s investment advisor. The function of the Valuation Committee is to value securities where current and reliable market quotations are not readily available. All actions taken by the Valuation Committee are reviewed by the Board.
The Fund has performed an analysis of all existing investments to determine the significance and character of all inputs to their fair value determination. Various inputs are used in determining the value of the Fund’s investments. The inputs or methodology used for valuing securities are not necessarily an indication of the risk associated with investing in those securities. Details related to the fair valuation hierarchy of the Fund’s securities as of April 30, 2016, are included in the Fund’s Schedule of Investments.
4). INVESTMENT TRANSACTIONS
Purchases and sales of investment securities (excluding government and short-term investments) for the Fund during the six months ended April 30, 2016, were $4,434,674 and $2,875,848, respectively.
There were no purchases or sales/maturities of long-term U.S. government securities for the Fund during the six months ended April 30, 2016.
| HENNESSY FUNDS | 1-800-966-4354 | |
5). INVESTMENT MANAGEMENT FEE AND OTHER TRANSACTIONS WITH AFFILIATES
Hennessy Advisors, Inc. (the “Advisor”) is the investment advisor of the Fund. The Advisor provides the Fund with investment management services under an Investment Advisory Agreement. The Advisor furnishes all investment advice, office space, facilities, and provides most of the personnel needed by the Fund. As compensation for its services, the Advisor is entitled to a monthly fee from the Fund. The fee is based upon the average daily net assets of the Fund at the annual rate of 1.20% until March 1, 2016, at which time the fee was reduced to an annual rate of 0.80%. The net investment advisory fees payable by the Fund as of April 30, 2016, were $17,542.
The Advisor has delegated the day-to-day management of the Fund to a sub-advisor, SPARX Asset Management Co., Ltd. The Advisor pays the sub-advisor fees for the Fund from its own assets and these fees are not an additional expense of the Fund.
The Board has approved a Shareholder Servicing Agreement for the Investor Class shares of the Fund, which was instituted to compensate the Advisor for the non-investment management services it provides to the Fund. The Shareholder Servicing Agreement provides for a monthly fee paid to the Advisor at an annual rate of 0.10% of the average daily net assets of the Fund attributable to Investor Class shares. Shareholder service fees payable by the Fund as of April 30, 2016, were $1,952.
The Fund has adopted a plan pursuant to Rule 12b-1 under the Investment Company Act of 1940, as amended, that authorizes payments in connection with the distribution of the Fund’s shares at an annual rate of up to 0.25% of the Fund’s average daily net assets attributable to Investor Class shares. Even though the authorized rate is up to 0.25%, the Fund has only used up to 0.15% of its average daily net assets attributable to Investor Class shares for such purpose since the plan was implemented on March 1, 2016. Amounts paid under the plan may be spent on any activities or expenses primarily intended to result in the sale of shares, including, but not limited to, advertising, shareholder account servicing, the printing and mailing of prospectuses to other than current shareholders, the printing and mailing of sales literature, and compensation for sales and marketing activities or to financial institutions and others, such as dealers and distributors.
The Fund has entered into agreements with various brokers, dealers, and financial intermediaries in connection with the sale of shares of the Fund. The agreements provide for periodic payments by the Fund to the brokers, dealers, and financial intermediaries for providing certain shareholder maintenance services (sub-transfer agent expenses). These shareholder services include the pre-processing and quality control of new accounts, shareholder correspondence, answering customer inquiries regarding account status, and facilitating shareholder telephone transactions. Fees paid by the Fund to various brokers, dealers, and financial intermediaries during the six months ended April 30, 2016, were $31,245.
U.S. Bancorp Fund Services, LLC (“USBFS”) provides the Fund with administrative, fund accounting, and transfer agent services, and necessary office equipment. As administrator, USBFS is responsible for activities such as (i) preparing various federal and state regulatory filings, reports, and returns for the Fund, (ii) preparing reports and materials to be supplied to the Board, (iii) monitoring the activities of the Fund’s custodian, transfer agent, and accountants, and (iv) coordinating the preparation and payment of the Fund’s expenses and reviewing the Fund’s expense accruals. Fees paid to USBFS during the six months ended April 30, 2016, were $13,101.
U.S. Bank, N.A., an affiliate of USBFS, serves as the Fund’s custodian. Quasar Distributors, LLC acts as the Fund’s principal underwriter in a continuous public offering of the Fund’s shares. Quasar Distributors, LLC is an affiliate of USBFS and U.S. Bank, N.A.
6). LINE OF CREDIT
The Fund has an uncommitted line of credit with the other funds in the Hennessy Funds family of funds (the “Hennessy Funds”) in the amount of the lesser of (i) $100,000,000 or (ii) 33.33% of each Hennessy Fund’s net assets, or 30% for the Hennessy Gas Utility Fund and 10% for the Hennessy Balanced Fund, intended to provide short-term financing, if necessary, subject to certain restrictions, in connection with shareholder redemptions. The credit facility is with the Hennessy Funds’ custodian bank, U.S. Bank, N.A. Borrowings under this arrangement bear interest at the bank’s prime rate and are secured by all of the Fund’s assets (as to its own borrowings only). During the six months ended April 30, 2016, the Fund had an outstanding average daily balance and a weighted average interest rate of $8,148 and 3.44%, respectively. The maximum amount outstanding for the Fund during the period was $326,000. At April 30, 2016, the Fund did not have any borrowings outstanding under the line of credit.
7). FEDERAL TAX INFORMATION
As of October 31, 2015, the Fund’s most recent fiscal year end, the components of accumulated earnings (losses) for income tax purposes were as follows:
| Cost of investments for tax purposes | | $ | 24,829,568 | |
| Gross tax unrealized appreciation | | $ | 2,290,616 | |
| Gross tax unrealized depreciation | | | (1,194,574 | ) |
| Net tax unrealized appreciation | | $ | 1,096,042 | |
| Undistributed ordinary income | | $ | — | |
| Undistributed long-term capital gains | | | 915,894 | |
| Total distributable earnings | | $ | 915,894 | |
| Other accumulated loss | | $ | (19,624 | ) |
| Total accumulated gain | | $ | 1,992,312 | |
The difference between book-basis unrealized appreciation/depreciation (as shown in the Statement of Assets and Liabilities) and tax-basis unrealized appreciation/depreciation (as shown above) is attributable primarily to wash sales and passive foreign investment companies.
At October 31, 2015, the Fund’s most recent fiscal year end, the Fund had no tax basis capital losses to offset future capital gains.
At October 31, 2015, the Fund’s most recent fiscal year end, the Fund deferred, on a tax basis, a post-December late year ordinary loss deferral of $18,482.
The tax character of distributions paid during fiscal year 2016 (year to date) and fiscal year 2015 for the Fund were as follows:
| | | Six Months Ended | | | Year Ended | |
| | | April 30, 2016 | | | October 31, 2015 | |
| Ordinary income | | $ | — | | | $ | 362,445 | |
| Long-term capital gain | | | 915,897 | | | | 1,174,668 | |
| | | $ | 915,897 | | | $ | 1,537,113 | |
| HENNESSY FUNDS | 1-800-966-4354 | |
Expense Example (Unaudited)
April 30, 2016
As a shareholder of the Fund, you incur two types of costs: (1) transaction costs, including sales charges (loads) on purchase payments, reinvested dividends, or other distributions; redemption fees; and exchange fees; and (2) ongoing costs, including management fees; service fees; and other Fund expenses. This Example is intended to help you understand your ongoing costs (in dollars) of investing in the Fund and to compare these costs with the ongoing costs of investing in other mutual funds. The Example is based on an investment of $1,000 invested at the beginning of the period and held for the entire period from November 1, 2015 through April 30, 2016.
Actual Expenses
The first line of the table below under the “Investor Class” and “Institutional Class” headings provides information about actual account values and actual expenses. Although the Fund charges no sales loads or transaction fees, you will be assessed fees for outgoing wire transfers, returned checks and stop payment orders at prevailing rates charged by U.S. Bancorp Fund Services, LLC, the Fund’s transfer agent. If you request that a redemption be made by wire transfer, currently a $15.00 fee is charged by the Fund’s transfer agent. IRA accounts will be charged a $15.00 annual maintenance fee. The example below includes, but is not limited to, management fees, shareholder servicing fees, fund accounting, custody, and transfer agent fees. However, the example below does not include portfolio trading commissions and related expenses, and other extraordinary expenses as determined under generally accepted accounting principles. You may use the information in this line, together with the amount you invested, to estimate the expenses that you paid over the period. Simply divide your account value by $1,000 (for example, an $8,600 account value divided by $1,000 = 8.6), then multiply the result by the number in the first line of the table under the “Investor Class” and “Institutional Class” headings in the column entitled “Expenses Paid During Period” to estimate the expenses you paid on your account during this period.
Hypothetical Example for Comparison Purposes
The second line of the table below under the “Investor Class” and “Institutional Class” headings provides information about hypothetical account values and hypothetical expenses based on the Fund’s actual expense ratios and an assumed rate of return of 5% per year before expenses, which is not the Fund’s actual return. The hypothetical account values and expenses may not be used to estimate the actual ending account balance or expenses you paid for the period. You may use this information to compare the ongoing costs of investing in the Fund and other funds. To do so, compare this 5% hypothetical example with the 5% hypothetical examples that appear in the shareholder reports of the other funds. Please note that the expenses shown in the table are meant to highlight your ongoing costs only and do not reflect any transactional costs, such as sales charges (loads), or exchange fees. Therefore, the second line of the table under the “Investor Class” and “Institutional Class” headings is useful in comparing ongoing costs only, and will not help you determine the relative total costs of owning different funds. In addition, if these transactional costs were included, your costs would have been higher.
| | | | Expenses Paid |
| | Beginning | Ending | During Period(1) |
| | Account Value | Account Value | November 1, 2015 – |
| | November 1, 2015 | April 30, 2016 | April 30, 2016 |
| Investor Class | | | |
| Actual | $1,000.00 | $1,027.90 | $8.97 |
| Hypothetical (5% return | | | |
| before expenses) | $1,000.00 | $1,016.01 | $8.92 |
| | | | |
| Institutional Class | | | |
| Actual | $1,000.00 | $1,028.90 | $8.12 |
| Hypothetical (5% return | | | |
| before expenses) | $1,000.00 | $1,016.86 | $8.07 |
(1) | Expenses are equal to the Fund’s annualized expense ratio of 1.78% for Investor Class shares or 1.61% for Institutional Class shares, as applicable, multiplied by the average account value over the period, multiplied by 182/366 days (to reflect one-half year period). |
| HENNESSY FUNDS | 1-800-966-4354 | |
How to Obtain a Copy of the Fund’s
Proxy Voting Policy and Proxy Voting Records
A description of the policies and procedures the Fund uses to determine how to vote proxies relating to portfolio securities is available without charge: (1) by calling 1-800-966-4354; (2) on the Hennessy Funds’ website at hennessyfunds.com/proxy-voting/policy.fs; or (3) on the U.S. Securities and Exchange Commission’s website at www.sec.gov. The Fund’s proxy voting record is available without charge on both the Hennessy Funds’ website at hennessyfunds.com/proxy-voting/policy.fs and the SEC’s website at www.sec.gov no later than August 31 for the prior 12 months ending June 30.
Quarterly Filings on Form N-Q
The Fund files its complete schedule of portfolio holdings with the SEC for the first and third quarters of each fiscal year on Form N-Q. The Fund’s Form N-Q will be available on the SEC’s website at www.sec.gov. The Fund’s Form N-Q may be reviewed and copied at the SEC’s Public Reference Room in Washington, DC and information on the operation of the Public Reference Room may be obtained by calling 1-800-SEC-0330. Information included in the Fund’s N-Q will also be available upon request by calling 1-800-966-4354.
Federal Tax Distribution Information
(Unaudited)
For the fiscal year ended October 31, 2015, certain dividends paid by the Fund may be subject to a maximum tax rate of 23.8%, as provided for by the Jobs and Growth Tax Relief Reconciliation Act of 2003. The percentage of dividends declared from ordinary income designated as qualified dividend income was 91.81%.
For corporate shareholders, the percent of ordinary income distributions that qualified for the corporate dividends received deduction for the fiscal year ended October 31, 2015 was 0.00%.
The percentage of taxable ordinary income distributions that are designated as short-term capital gain distributions under Section 871(k)(2)(C) of the Internal Revenue Code of 1986, as amended, for the Fund was 100.00%.
Householding
To help keep the Fund’s costs as low as possible, we generally deliver a single copy of most financial reports and prospectuses to shareholders who share an address, even if the accounts are registered under different names. This process, known as “householding,” does not apply to account statements. You may, of course, request an individual copy of a prospectus or financial report at any time. If you would like to receive separate mailings, please call the Administrator at 1-800-261-6950 or 1-414-765-4124 and we will begin individual delivery within 30 days of your request. If your account is held through a financial institution or other intermediary, please contact them directly to request individual delivery.
Matters Submitted to a Shareholder Vote
A special meeting of shareholders of the Investor Class shares of the Fund was held on January 14, 2016, and the following matters were approved by the Fund’s voting Investor Class shares:
| | For | Against | Abstain |
| To approve a distribution | | | |
| (Rule 12b-1) plan for the | | | |
| Investor Class shares of the Fund | 824,118.174 | 161,208.018 | 23,193.448 |
| HENNESSY FUNDS | 1-800-966-4354 | |
Board Approval of Investment Advisory
Agreements
At its meeting on March 9, 2016, the Board of Trustees of the Fund (the “Board,” and the members thereof, the “Trustees”) unanimously approved the continuation of the investment advisory agreement of the Fund with Hennessy Advisors, Inc. (the “Advisor”) and the sub-advisory agreement of the Fund between the Advisor and SPARX Asset Management Co., Ltd. (the “Sub-Advisor”). As part of the process of approving the continuation of the advisory and sub-advisory agreements, the Trustees reviewed their fiduciary duties with respect to approving the advisory and sub-advisory agreements and the relevant factors for them to consider. In addition, the Trustees who are not deemed “interested persons” (as that term is defined by the Investment Company Act of 1940) of the Fund (the “Independent Trustees”) met in executive session to discuss the approval of the advisory and sub-advisory agreements.
In advance of the meeting, the Advisor sent detailed information to the Trustees to assist them in their evaluation of the advisory and sub-advisory agreements. This information included, but was not limited to, (i) a memorandum from outside legal counsel that described the fiduciary duties of the Board with respect to approving the continuation of the advisory and sub-advisory agreements and the relevant factors for consideration, (ii) a memorandum from the Advisor that listed the factors relevant to the Board’s approval of the continuation of the advisory and sub-advisory agreements and also referenced the documents that had been provided to help the Board assess each such factor, (iii) an inventory of the range of services provided by the Advisor and the Sub-Advisor for the Fund, (iv) a written discussion of economies of scale, (v) the advisory and sub-advisory agreements, (vi) a recent Fund fact sheet, (vii) a peer expense comparison, (viii) performance information, (ix) the Advisor’s most recent Form 10-K and Form 10-Q, which included information about the Advisor’s profitability, (x) information about brokerage commissions, (xi) information about the Fund’s compliance program, (xii) the Advisor’s current Form ADV Part I, (xiii) a completed questionnaire from the Sub-Advisor and summary thereof, (xiv) the Sub-Advisor’s Code of Ethics, and (xv) the Sub-Advisor’s Form ADV Parts I and II, and (xvi) other information the Trustees believed was useful in evaluating the approval of the continuation of the advisory and sub-advisory agreements.
All of the factors discussed by the Trustees were considered as a whole, and were considered separately by the Independent Trustees, meeting in executive session. The factors were viewed in their totality by the Trustees, with no single factor being the principal or determinative factor in the Trustees’ determination of whether to approve the continuation of the advisory and sub-advisory agreements. The Trustees recognized that the management and fee arrangements for the Fund are the result of years of review and discussion between the Independent Trustees and the Advisor, that certain aspects of such arrangements may receive greater scrutiny in some years than in others, and that the Trustees’ conclusions may be based, in part, on their consideration of these same arrangements and information received during the course of the year and in prior years.
Prior to approving the continuation of the advisory and sub-advisory agreements, the Trustees and the Independent Trustees in executive session considered, among other items:
| | • | The nature and quality of the advisory services provided by the Advisor and the Sub-Advisor. |
| | • | A comparison of the fees and expenses of the Fund to other similar funds. |
| | • | Whether economies of scale are recognized by the Fund. |
| | • | The costs and profitability of the Fund to the Advisor and the Sub-Advisor. |
| | • | The performance of the Fund. |
| | • | The other benefits to the Advisor and the Sub-Advisor from serving as an investment advisor to the Fund (in addition to the advisory and sub-advisory fees). |
The material considerations and determinations of the Board of Trustees, including all of the Independent Trustees, are as follows:
| | • | The Board considered the services identified below that are provided by the Advisor. Based on this review, the Trustees believe that the Advisor provides high-quality services to the Fund, and they noted that their overall confidence in the Advisor is high. The Trustees also concluded that they were satisfied with the nature, extent, and quality of the advisory services provided to the Fund by the Advisor, and that the nature and extent of the services provided by the Advisor are appropriate to assure that the Fund’s operations are conducted in compliance with applicable laws, rules, and regulations. |
| | | • | The Advisor oversees the Sub-Advisor for the Fund and the Sub-Advisor acts as the portfolio manager for the Fund. |
| | | • | The Advisor performs a daily reconciliation of portfolio positions and cash for the Fund. |
| | | • | The Advisor monitors the Fund’s compliance with its investment objectives and restrictions. |
| | | • | The Advisor monitors compliance with federal securities laws and performs activities such as maintaining a compliance program, conducting ongoing reviews of the compliance programs of the Sub-Advisor and the Fund’s other service providers, conducting on-site visits to the Sub-Advisor and the Fund’s other service providers, monitoring incidents of abusive trading practices, reviewing Fund expense accruals, payments, and fixed expense ratios, evaluating insurance providers for fidelity bond coverage and D&O/E&O insurance coverage, conducting employee compliance training, reviewing reports provided by service providers, maintaining books and records, and preparing an annual compliance report to the Board. |
| | | • | The Advisor oversees the selection and continued employment of the Sub-Advisor, monitors the Sub-Advisor’s adherence to the Fund’s investment objectives, policies, and restrictions, and reviews the Fund’s investment performance. |
| | | • | The Advisor oversees service providers that provide accounting, administration, distribution, transfer agency, custodial, sales and marketing, public relations, audit, information technology, and legal services to the Fund. |
| | | • | The Advisor maintains in-house marketing and distribution departments on behalf of the Fund. |
| | | • | The Advisor is actively involved with preparing regulatory filings for the Fund, including writing and annually updating the Fund’s prospectus and related documents. |
| | | • | The Advisor reviews the written summary prepared by the Sub-Advisor of the Fund’s performance for the most recent six-month period or twelve-month period, as applicable, for each semi-annual and annual report of the Fund. |
| | | • | The Advisor oversees distribution of the Fund through third-party broker/dealers and independent financial institutions such as Charles Schwab, Inc., Fidelity, TD Waterhouse, and Pershing. The Advisor participates in “no |
| HENNESSY FUNDS | 1-800-966-4354 | |
| | | | transaction fee” (“NTF”) programs with these companies on behalf of the Fund, which allow customers to purchase the Fund through third-party distribution channels without paying a transaction fee. The Advisor compensates, in part, a number of these third-party providers of NTF programs out of its own revenues. |
| | | • | The Advisor pays the incentive compensation of the Fund’s compliance officers and employs other staff, such as management executives, legal personnel, marketing personnel, national accounts and distribution personnel, sales personnel, administrative personnel, and trading oversight personnel. |
| | | • | The Advisor provides a quarterly compliance certification to the Board. |
| | | • | The Advisor prepares or reviews Board materials, frequently presents to the Board or leads Board discussions, prepares or reviews meeting minutes, and arranges for Board training and education. |
| | • | The Board considered the services identified below that are provided by the Sub-Advisor: |
| | | • | The Sub-Advisor acts as the portfolio manager for the Fund. In this capacity, the Sub-Advisor does the following: |
| | | | • | manages the composition of the Fund’s portfolio, including the purchase, retention, and disposition of portfolio securities in accordance with the Fund’s investment objectives, policies, and restrictions; |
| | | | • | ensures compliance with “best execution” for the Fund’s portfolio; and |
| | | | • | manages proxy voting for the Fund. |
| | | • | The Sub-Advisor ensures that its compliance program includes policies and procedures relevant to the Fund and the Sub-Advisor’s duties as a portfolio manager to the Fund. |
| | | • | The Sub-Advisor prepares a written summary of the Fund’s performance for the most recent six-month period or twelve-month period, as applicable, for each semi-annual and annual report of the Fund. |
| | | • | The Sub-Advisor provides a quarterly compliance certification to the Board regarding trading and allocation practices, supervisory matters, the Sub-Advisor’s compliance program (including its code of ethics), compliance with the Fund’s policies, and general firm updates. |
| | • | The Board considered the distinction between the services performed by the Advisor and the Sub-Advisor. It noted that the management of the Fund, including the oversight of the Sub-Advisor, involves more comprehensive and substantive duties than the duties of the Sub-Advisor. Specifically, the Board considered the lists of services identified above and concluded that the services performed by the Advisor for the Fund require a higher level of service and oversight than the services performed by the Sub-Advisor. Based on this determination, the Board concluded that the differential in advisory fees between the Advisor and the Sub-Advisor is reasonable. |
| | • | The Board compared the performance of the Fund to benchmark indices over various periods of time and they noted that at each quarterly meeting, the Trustees review reports comparing the investment performance of the Fund to various indices. Based on the information provided at the meeting and the information and quarterly discussions regarding the Fund’s investment performance, the Trustees believe that the Advisor and the Sub-Advisor manage the Fund in a manner that is materially consistent with its stated investment objective and style. |
| | | The Trustees concluded that the performance of the Fund over various time horizons warranted the continuation of the advisory and sub-advisory agreements. |
| | • | The Board reviewed the advisory fees and overall expense ratios of the Fund and comparable funds using data from Morningstar with respect to funds similar in asset size and investment objective to the Fund. As part of the discussion with management, the Trustees ensured that they understood and were comfortable with the criteria used to determine the mutual funds included in the Morningstar categories for purposes of the materials considered at the meeting. The Board determined that the advisory fee and overall expense ratio of the Fund falls within the range of the advisory fees and overall expense ratios of other comparable funds and concluded that they are reasonable and warranted continuation of the advisory and sub-advisory agreements. |
| | • | The Board also considered whether economies of scale were being realized by the Advisor that should be shared with the Fund’s shareholders. The Trustees noted that many of the expenses incurred to manage the Fund are asset-based fees and thus do not result in material economies of scale being realized as the net assets of the Fund increase. For example, intermediary service fees increase as the Fund’s assets grow. The Trustees also considered the Advisor’s efforts to contain expenses, and took into account the Advisor’s significant marketing efforts to increase Fund assets. The Board noted that at current asset levels it did not appear that there were economies of scale being realized by the Advisor and concluded that it would continue to monitor economies of scale in the future as circumstances changed. |
| | • | The Board considered the profitability of the Advisor and the Sub-Advisor, including the impact of intermediary service fees on the Advisor’s profitability, and also considered the resources and revenues that the Advisor has put into managing and distributing the Fund. The Board then concluded that the profits of the Advisor and the Sub-Advisor are reasonable and not excessive when compared to profitability guidelines set forth in relevant court cases. |
| | • | The Board considered the high level of professionalism and knowledge of the Advisor’s employees, along with a very low level of turnover, and concluded that this was beneficial to the Fund and its shareholders. |
| | • | The Board considered other benefits to the Advisor and the Sub-Advisor from serving as an advisor to the Fund (in addition to the advisory fee or sub-advisory fee). The Board noted that the Advisor and the Sub-Advisor may derive ancillary benefits from, by way of example, its association with the Fund in the form of proprietary and third-party research products and services received from broker dealers that execute portfolio trades for the Fund. The Board determined that any such products and services have been used for legitimate purposes relating to the Fund by providing assistance in the investment decision-making process. The Trustees concluded that the other benefits realized by the Advisor and the Sub-Advisor from their relationship with the Fund were reasonable. |
After reviewing the materials provided at the meeting and management’s presentation, as well as other information regularly provided at the Board’s quarterly meetings throughout the year regarding the quality of services provided by the Advisor and the Sub-Advisor, the performance of the Fund, expense information, regulatory compliance issues, trading information and related matters, and other factors deemed relevant by the Board, the Trustees, including all of the Independent Trustees, approved the continuation of the advisory and sub-advisory agreements.
| HENNESSY FUNDS | 1-800-966-4354 | |
(This Page Intentionally Left Blank.)
For information, questions or assistance, please call
The Hennessy Funds
1-800-966-4354 or 1-415-899-1555
INVESTMENT ADVISOR
Hennessy Advisors, Inc.
7250 Redwood Blvd., Suite 200
Novato, California 94945
ADMINISTRATOR,
TRANSFER AGENT,
DIVIDEND PAYING AGENT &
SHAREHOLDER SERVICING AGENT
U.S. Bancorp Fund Services, LLC
P.O. Box 701
Milwaukee, Wisconsin 53201-0701
CUSTODIAN
U.S. Bank N.A.
Custody Operations
1555 North River Center Dr., Suite 302
Milwaukee, Wisconsin 53212
TRUSTEES
Neil J. Hennessy
Robert T. Doyle
J. Dennis DeSousa
Gerald P. Richardson
COUNSEL
Foley & Lardner LLP
777 East Wisconsin Avenue
Milwaukee, Wisconsin 53202-5306
INDEPENDENT REGISTERED
PUBLIC ACCOUNTING FIRM
KPMG LLP
777 East Wisconsin Avenue
Milwaukee, Wisconsin 53202-5306
DISTRIBUTOR
Quasar Distributors, LLC
615 East Michigan Street
Milwaukee, Wisconsin 53202
hennessyfunds.com | 1-800-966-4354
This report has been prepared for shareholders and may be distributed to
others only if preceded or accompanied by a current prospectus.
Item 2. Code of Ethics.
Not applicable for semi-annual reports.
Item 3. Audit Committee Financial Expert.
Not applicable for semi-annual reports.
Item 4. Principal Accountant Fees and Services.
Not applicable for semi-annual reports.
Item 5. Audit Committee of Listed Registrants.
Not applicable to registrants who are not listed issuers (as defined in Rule 10A-3 under the Securities Exchange Act of 1934).
Item 6. Investments.
The Schedules of Investments are included as part of the reports to stockholders filed under Item 1 of this Form.
Item 7. Disclosure of Proxy Voting Policies and Procedures for Closed-End Management Investment Companies.
Not applicable to open-end investment companies.
Item 8. Portfolio Managers of Closed-End Management Investment Companies.
Not applicable to open-end investment companies.
Item 9. Purchases of Equity Securities by Closed‑End Management Investment Company and Affiliated Purchasers.
Not applicable to open-end investment companies.
Item 10. Submission of Matters to a Vote of Security Holders.
None.
Item 11. Controls and Procedures.
| (a) | The Registrant’s President and Treasurer have reviewed the Registrant’s disclosure controls and procedures (as defined in Rule 30a-3(c) under the Investment Company Act of 1940 (the “Act”)) as of a date within 90 days of the filing of this report, as required by Rule 30a-3(b) under the Act and Rules 13a-15(b) or 15d‑15(b) under the Securities Exchange Act of 1934. Based on their review, such officers have concluded that the disclosure controls and procedures are effective in ensuring that information required to be disclosed in this report is appropriately recorded, processed, summarized and reported and made known to them by others within the Registrant and by the Registrant’s service providers. |
| (b) | There were no changes in the Registrant’s internal control over financial reporting (as defined in Rule 30a-3(d) under the Act) that occurred during the second fiscal quarter of the period covered by this report that has materially affected, or is reasonably likely to materially affect, the Registrant’s internal control over financial reporting. |
Item 12. Exhibits.
| (a) | (1)(A) Code of ethics that is the subject of the disclosure required by Item 2, to the extent that the registrant intends to satisfy Item 2 requirements through filing of an exhibit. Not applicable. |
(1)(B) Amendments to code of ethics that is the subject of the disclosure required by Item 2, to the extent that the registrant intends to satisfy Item 2 requirements through filing of an exhibit. Not applicable.
(2) A separate certification for each principal executive and principal financial officer pursuant to Rule 30a‑2(a) under the Act and Section 302 of the Sarbanes-Oxley Act of 2002. Filed herewith.
(3) Any written solicitation to purchase securities under Rule 23c‑1 under the Act sent or given during the period covered by the report by or on behalf of the registrant to 10 or more persons. Not applicable to open-end investment companies.
| (b) | Certifications pursuant to Rule 30a‑2(b) under the Act and Section 906 of the Sarbanes‑Oxley Act of 2002. Furnished herewith. |
SIGNATURES
Pursuant to the requirements of the Securities Exchange Act of 1934 and the Investment Company Act of 1940, the registrant has duly caused this report to be signed on its behalf by the undersigned, thereunto duly authorized.
(Registrant) Hennessy Funds Trust
By (Signature and Title)* /s/Neil J. Hennessy
Neil J. Hennessy, President
Date: July 8, 2016
Pursuant to the requirements of the Securities Exchange Act of 1934 and the Investment Company Act of 1940, this report has been signed below by the following persons on behalf of the registrant and in the capacities and on the dates indicated.
By (Signature and Title)* /s/Neil J. Hennessy
Neil J. Hennessy, President
Date: July 8, 2016
By (Signature and Title)* /s/Teresa M. Nilsen
Teresa M. Nilsen, Treasurer
Date: July 8, 2016