UNITED STATES
SECURITIES AND EXCHANGE COMMISSION
Washington, D.C. 20549
FORM N-CSR
CERTIFIED SHAREHOLDER REPORT OF REGISTERED
MANAGEMENT INVESTMENT COMPANIES
Investment Company Act file number (811-07168)
Hennessy Funds Trust
(Exact name of registrant as specified in charter)
7250 Redwood Blvd., Suite 200
Novato, CA 94945
(Address of principal executive offices) (Zip code)
Neil J. Hennessy
7250 Redwood Blvd., Suite 200
Novato, CA 94945
(Name and address of agent for service)
800-966-4354
Registrant's telephone number, including area code
Date of fiscal year end: October 31, 2013
Date of reporting period: April 30, 2013
Item 1. Reports to Stockholders.
SEMI-ANNUAL REPORT
APRIL 30, 2013
DOMESTIC EQUITY
Hennessy Cornerstone Growth Fund
Hennessy Focus Fund
Hennessy Cornerstone Mid Cap 30 Fund
Hennessy Cornerstone Large Growth Fund
Hennessy Cornerstone Value Fund
Hennessy Large Value Fund
Hennessy Total Return Fund
BALANCED & FIXED INCOME
Hennessy Equity and Income Fund
Hennessy Balanced Fund
Hennessy Core Bond Fund
SECTOR & SPECIALTY
Hennessy Gas Utility Index Fund
Hennessy Small Cap Financial Fund
Hennessy Large Cap Financial Fund
Hennessy Technology Fund
Hennessy Japan Fund
Hennessy Japan Small Cap Fund
www.hennessyfunds.com|1-800-966-4354
(This Page Intentionally Left Blank.)
Contents
| Letter to shareholders | 2 |
| Performance overview | 4-21 |
| Financial statements | |
| Schedules of investments | |
| Domestic Equity | |
| Hennessy Cornerstone Growth Fund | 22 |
| Hennessy Focus Fund | 26 |
| Hennessy Cornerstone Mid Cap 30 Fund | 29 |
| Hennessy Cornerstone Large Growth Fund | 32 |
| Hennessy Cornerstone Value Fund | 35 |
| Hennessy Large Value Fund | 38 |
| Hennessy Total Return Fund | 41 |
| Hennessy Total Return Fund – Schedule of Reverse Repurchase Agreements | 44 |
| Balanced & Fixed Income | |
| Hennessy Equity and Income Fund | 45 |
| Hennessy Balanced Fund | 51 |
| Hennessy Core Bond Fund | 54 |
| Sector & Specialty | |
| Hennessy Gas Utility Index Fund | 58 |
| Hennessy Small Cap Financial Fund | 61 |
| Hennessy Large Cap Financial Fund | 64 |
| Hennessy Technology Fund | 67 |
| Hennessy Japan Fund | 70 |
| Hennessy Japan Small Cap Fund | 73 |
| Statements of assets and liabilities | 76 |
| Statements of operations | 80 |
| Statements of changes in net assets | 84 |
| Statements of cash flows – Hennessy Total Return Fund | 92 |
| Financial highlights | 94-124 |
| Notes to the financial statements | 125 |
| Expense example | 136 |
| Proxy voting policy | 139 |
| Quarterly Filings on Form N-Q | 139 |
| Federal Tax Distribution Information | 139 |
| Householding | 140 |
| Board approval of continuation of investment advisory agreements | 141 |
HENNESSY FUNDS 1-800-966-4354
June, 2013
Dear Hennessy Funds Shareholder:
Over the past six months our economy and our world have gone through many changes. We’ve climbed over fiscal cliffs, wrung our hands worrying about tax rates, witnessed a Presidential inauguration, sighed relief that our home values were returning, watched our investment portfolios improve, and for some of us, shook our heads in disbelief when our hometown San Francisco 49ers were defeated in the Super Bowl.
Each day there are more sensational headlines in the financial news. How in the world can investors and financial professionals keep all of this straight? To keep on top of the securities industry, I read every kind of publication: our local newspaper, the Wall Street Journal, Barron’s, compliance publications, and my staff likes to tease me because yes, I even read the New York Post. I also watch the financial news on CNBC, Bloomberg and Fox Business. Once I assimilate all of this information, I call upon my 33 years of industry experience to cut through the din for nuggets of common sense and sanity. And it is those nuggets of common sense that I try to provide to the investing public, and you, the shareholders of the Hennessy Funds.
I am often interviewed by financial reporters, and I was recently asked, “Neil, when do you think we will get some ‘euphoria’ in this market?”
I had to pause. To me, euphoria is something that is short lived and not sustainable, and I believe this bull market is just the opposite. I answered the reporter’s question and said, “You know, we don’t really want ‘euphoria’ in this market. We want investors who believe in the fundamentals of this market. I know that many business leaders and investors are still awaiting clear direction from Washington on taxes, unemployment, regulation and healthcare, but once retail investors fully re-enter the equity market, it should continue to thrive.”
After this interview, I started to think about the history of the stock market and its correlation to euphoria. Here at Hennessy, we use history as our guide, so I have pondered the history of euphoria’s effect on the economy, and my conclusion is that rather than seeking euphoria, we want good old fashioned investor confidence, and here’s why.
In the early 1980’s, there was euphoria in the real estate market. I remember friends telling me I couldn’t lose if I invested in real estate. The stock market was providing reasonable returns, yet real estate was all the rage. The real estate market was oversold and it took a terrible tumble in 1987 to 1989. And most equity investors suffered from the euphoria surrounding that real estate downturn.
We then entered another market where euphoria reigned supreme. Remember the “dot com” bubble in the late 90’s? Investors were gobbling up anything that had a “dot com” at the end of its name in the hopes to become an instant millionaire. Another market fueled by euphoria that came to a dismal end.
And none of us will ever forget the euphoria that reigned again in real estate in 2004 to 2007. The returns of the stock market were strong, and yet they could not keep pace with real estate. And through that time, a real estate buyer didn’t even need a down payment to buy a piece of property. We all remember how that euphoria driven market faltered and fell so dramatically by 2008. All investors suffered in that downturn.
What does that mean for investors today? Well, as I write this letter, I am very confident that we are in a long-term secular bull market fueled by strong fundamentals. In fact, this market reminds me of the bull market from 1982 to 2000; when the Dow Jones Industrial Average provided a positive return every year except for 1990, where it was down just -0.5%. Today, much like during the long bull market in the 80’s and 90’s, many major American companies have strong balance sheets, respectable fundamentals and reasonable returns. U.S. corporations are saving money, initiating or increasing dividends, strategically reorganizing and making accretive acquisitions. In December’s annual shareholder letter, I told you that the major obstacle facing the U.S. economy and the stock market, in my opinion, was clarity from our leaders in Washington on taxes, regulation and healthcare. Those issues remain, but the stock market and the housing sector are showing signs of life because you can’t keep good fundamentals and smart long-term investors on the sidelines forever.
Already, year-to-date through the end of this semi-annual reporting period ended April 30, 2013, the Dow Jones Industrial Average was going strong, returning over 14%. Despite a slow economic growth environment, if investors return to equities, buy based on fundamentals and maintain reasonable returns expectations, this bull market should have a long way to go. So, let’s leave euphoria on the sideline, and allow solid investor confidence to fuel this sustainable market.
Japanese Market
Our positive view on the Japanese equity market remains unchanged. Much of the sentiment I shared with you about the U.S. financial markets is true for the Japanese market, with companies hoarding cash, paying dividends and making
strategic acquisitions. Corporate Japan has been focused on long term structural improvements, and those efforts appear to finally be paying off. Japan’s new prime minister, Shinzo Abe, and his cabinet support Japanese companies, want Japanese citizens to prosper and are making bold policy moves. Since the onset of “Abenomics”, we feel that consumers have gained tremendous confidence, which is leading to improved retail sales, especially consumer goods. Japan’s overall economy has been moving in a positive direction, and the Japanese equity market has been one of the strongest performers in the world in 2013.
High quality Japanese products are coveted throughout the world, particularly among emerging middle class Asian consumers. A weaker yen could result in higher revenue and profit for Japanese companies that derive a meaningful percentage of their operating results from exports. However, while the weakening of the yen may be a catalyst to attract investors to Japan, we have never believed that the Japanese equity market is simply a yen play. We believe that, much like in the U.S. equity markets, there are incredible values in good Japanese companies today and for the long-term.
At Hennessy Funds, we are committed to investing with fundamentals, not investing by reacting to headlines. We remain focused on our proven investment strategies. We will not compromise our long-standing commitment to manage our portfolios in the best interest of our shareholders. As investors regain their confidence and return to investing based on facts and fundamentals, I believe we should return to steady, long-term market gains.
I would like to take a moment to reach out to the victims of the terrible events at the Boston Marathon. Throughout history, Americans remain resilient through good and bad times, and through unspeakable tragedies. No words can express the sorrow we feel for those who lost their lives, those injured or the families who lost loved ones.
Thank you for your continued confidence and investment in the Hennessy Funds. If you have any questions or want to speak with us directly, please don’t hesitate to call us at (800) 966-4354.
Best regards,
Neil J. Hennessy
President and Chief Investment Officer
Past performance does not guarantee future results.
Mutual fund investing involves risk. Principal loss is possible. Small and medium-capitalization companies tend to have more limited liquidity and greater price volatility than large-capitalization companies. Investments in foreign securities may involve greater volatility and political, economic and currency risk and differences in accounting methods. A non-diversified fund, one that may concentrate its assets in fewer individual holdings than a diversified fund, is more exposed to individual stock volatility than a diversified fund. A fund that concentrates its investments within one or a small group of industries may be more volatile than a fund that invests in a broader range of industries. Real estate values (and the values of real estate-related securities) fluctuate with changes in general and local economic conditions and are particularly sensitive to economic downturns. IPO shares are subject to market risk and liquidity risk. The yields and principal values of debt securities will also fluctuate. Generally, values of debt securities change inversely with interest rates. Some of the Hennessy Funds may invest a portion of their assets in lower rated, high-yielding bonds (commonly known as “junk bonds”). Mortgage- and asset-backed securities are subject to prepayment risk, which is the risk that the borrower will prepay some or all of the principal owed to the issuer.
Opinions expressed are those of Neil Hennessy and are subject to change, are not guaranteed and should not be considered investment advice.
The Dow Jones Industrial Average is an unmanaged index of common stocks comprised of major U.S. companies. You cannot invest directly in an index.
Correlation is a statistical measure of how two securities move in relation to each other.
HENNESSY FUNDS 1-800-966-4354
Performance Overview (Unaudited)
The opinions expressed in the following commentaries reflect those of the Portfolio Managers as of the date written. Any such opinions are subject to change based on market or other conditions. These opinions may not be relied upon as investment advice. Investment decisions for the Hennessy Funds are based on several factors, and may not be relied upon as an indication of trading intent on behalf of any Hennessy Fund. Security positions can and do change.
Hennessy Cornerstone Growth Fund
AVERAGE ANNUAL TOTAL RETURN PERIODS ENDED APRIL 30, 2013*
| | Six Months | One Year | Five Years | Ten Years |
| Hennessy Cornerstone Growth Fund – Investor Class | 11.79% | 17.09% | 0.81% | 5.70% |
Hennessy Cornerstone Growth Fund – Institutional Class1 | 12.01% | 17.43% | 1.15% | 5.88% |
| Russell 2000 Index | 16.58% | 17.69% | 7.27% | 10.47% |
| S&P 500 Index | 14.42% | 16.89% | 5.21% | 7.88% |
| Expense ratio: 1.35% (Investor Class) | | | Expense ratio: Gross 1.12%, Net 0.99%2 (Institutional Class) |
Performance data quoted represents past performance; past performance does not guarantee future results. The investment return and principal value of an investment will fluctuate so that an investor’s shares, when redeemed, may be worth more or less than their original cost. Current performance of the Fund may be lower or higher than the performance quoted. Performance data current to the most recent month end may be obtained by visiting www.hennessyfunds.com.
The expense ratios presented are from the most recent prospectus.
| * | Periods less than one year are not annualized. |
| 1 | Represents the performance of the Institutional Class shares after March 3, 2008 (inception of the share class) and Investor Class for periods prior to that date. |
| 2 | With regard to Institutional Class shares, the investment advisor has contractually agreed to waive a portion of its expenses indefinitely. |
PERFORMANCE NARRATIVE
Portfolio Manager, Neil Hennessy, and Co-Portfolio Manager, Brian Peery
Over the previous six months, how did the Fund perform and what factors contributed to this performance?
For the six-month period ended April 30, 2013, the Investor Class of the Hennessy Cornerstone Growth Fund returned 11.79%, underperforming the Russell 2000 Index, the S&P 500 Index and the Morningstar Small Blend Category Average, which returned 16.58%, 14.42% and 16.46% for the same period, respectively.
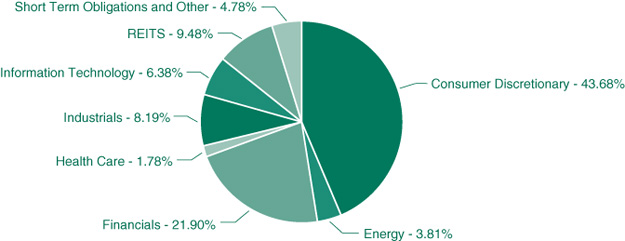
The Fund’s performance was hampered by both stock selection and asset allocation. Stock selection and relative overweighting in the Materials sector, combined with underperformance in stock selection in the Consumer Discretionary sector were the primary drivers of the Fund’s relative underperformance for the six–month period. The Fund’s single largest performance detractor was American Vanguard. The agricultural chemical manufacturer’s stock fell on earnings worries compounded by increased competition from other major agrichemical companies. The Fund no longer holds the stock. The biggest contributor to performance, and a stock still held in the Fund’s portfolio, was Hertz Global, which was up over 81% for the six-month period due to stronger than expected earnings and higher revenues.
Additional Portfolio Manager commentary and related investment outlook:
During the last six months, we saw a continuing trend of companies beating earnings expectations, but not quite meeting revenue targets. We believe that this trend is beginning to abate and we should see better earnings and revenue numbers as we progress through the rest of the year. While top line revenue growth is muted due to a slow growth environment, companies are still doing well. Corporate profits are hitting new highs as companies have deferred hiring, choosing to keep their costs down. This means any incremental gains in revenue can be impactful to a company’s bottom line earnings.
We are confident that there are opportunities in the Small-Cap and Mid-Cap space, especially in some of the more cyclical sectors. As the economy continues to improve we feel that the cyclical companies, those most sensitive to an economic recovery, should do well. The Fund is currently overweight cyclical stocks versus the benchmarks and will remain so until its portfolio is rebalanced in the winter.
The Russell 2000 Index and S&P 500 Index are unmanaged indices commonly used to measure the performance of U.S. stocks. You cannot invest directly in an index. Performance data for an index does not reflect any deductions for fees, expenses or taxes. The Fund may invest in small- and medium-capitalization companies which tend to have limited liquidity and greater price volatility than large-capitalization companies. Investments in foreign securities involve greater volatility and political, economic and currency risk and differences in accounting methods. References to specific securities should not be considered a recommendation to buy or sell any security. Fund holdings and sector allocations are subject to change. Please refer to the Schedule of Investments included in this report for additional portfolio information.
Each Morningstar category average represents a universe of funds with similar investment objectives. © Morningstar, Inc. All Rights Reserved. The information contained herein: 1) is proprietary to Morningstar; 2) may not be copied or distributed and 3) is not
warranted to be accurate, complete or timely. Neither Morningstar nor its content providers are responsible for any damages or losses arising from any use of this information. Past performance does not guarantee future results.
Hennessy Focus Fund
AVERAGE ANNUAL TOTAL RETURN PERIODS ENDED APRIL 30, 2013*
| | Six Months | One Year | Five Years | Ten Years |
| Hennessy Focus Fund – Investor Class | 18.56% | 20.54% | 10.69% | 13.10% |
Hennessy Focus Fund – Institutional Class1 | 18.71% | 20.89% | 11.04% | 13.29% |
| Russell 2000 Index | 16.58% | 17.69% | 7.27% | 10.47% |
| Russell Midcap Growth Index | 17.75% | 14.42% | 6.79% | 10.96% |
| Expense ratio: 1.43% (Investor Class) | | | Expense ratio: 1.14% (Institutional Class) |
Performance data quoted represents past performance; past performance does not guarantee future results. The investment return and principal value of an investment will fluctuate so that an investor’s shares, when redeemed, may be worth more or less than their original cost. Current performance of the Fund may be lower or higher than the performance quoted. Performance data current to the most recent month end may be obtained by visiting www.hennessyfunds.com. Performance for periods prior to October 26, 2012 is that of the FBR Focus Fund.
The expense ratios presented are from the most recent prospectus.
| * | Periods less than one year are not annualized. |
| 1 | Represents the performance of the Institutional Class shares after May 30, 2008 (inception of the share class) and Investor Class for periods prior to that date. |
PERFORMANCE NARRATIVE
BROAD RUN INVESTMENT MANAGEMENT, LLC, SUB-ADVISOR
Portfolio Managers Brian Macauley, CFA, David Rainey, CFA, and Ira Rothberg, CFA, Broad Run Investment Management, LLC (sub-advisor)
Over the previous six months, how did the Fund perform and what factors contributed to this performance?
For the six-month period ended April 30, 2013, the Investor Class of the Hennessy Focus Fund returned 18.56%, outperforming the Russell 2000 Index, Russell Midcap Growth Index and the Morningstar Mid-Cap Growth Category Average, which returned 16.58%, 17.75%, and 14.80% for the same period, respectively.
The Fund’s return during the period was the result of improved business prospects for its key holdings, owing to a better overall economic outlook and company specific developments. Leading contributors to the Fund’s performance were Penn National Gaming, Inc., CarMax, Inc., O’Reilly Automotive, Inc., News Corp, and American Tower Corp. The leading detractor from the Fund’s performance was Simpson Manufacturing Co., Inc. We continue to hold all these stocks in the Fund’s portfolio.
We invest with a long-term time horizon and encourage shareholders to do the same. Despite the discussion of six-month results referenced above, we urge investors to evaluate the Fund’s performance over three-, five-, and ten-year periods since shorter time frames can be influenced by many transitory issues unrelated to the growth in intrinsic value of the Fund’s holdings. Long-term performance metrics for the Fund can be found in the table above.
Additional Portfolio Manager commentary and related investment outlook:
We continue to have a positive long-term outlook for the Fund. We have this view not because of an ebullient macroeconomic or equity market forecast, but rather because we have a favorable view of the fundamental outlook for each of the Fund’s individual companies in the portfolio. We believe that if the companies in the Fund’s portfolio remain reasonably valued, our long-term investment outlook should be shaped by the prospects for growth in intrinsic value per share for each holding.
We believe that many of the Fund’s largest holdings are well positioned to potentially grow cash earnings per share over the next several years, even if we remain stuck in a low-growth economic environment. These companies have their own profit drivers that are largely independent of the overall economy. For example, American Tower’s growth is driven by the adoption of data intensive smartphones in the U.S. and a rapidly growing subscriber base across its international markets. CarMax’s growth is driven by geographic expansion and market share gains as it takes its no-haggle model nationwide. O’Reilly Automotive’s growth is driven by its continued consolidation of the aftermarket auto parts distribution industry.
Valuation multiples for the Fund’s holdings remain generally in-line with long-term historical levels. We think that these valuations are reasonable, particularly in today’s low interest rate environment. We believe that reasonable valuations, in combination with a positive outlook for the cash earnings per share growth of the Fund’s holdings, should allow for a favorable rate of capital appreciation over the long-term.
The Russell 2000 Index and Russell Midcap Growth Index are unmanaged indices commonly used to measure the performance of U.S. stocks. You cannot invest directly in an index. Performance data for an index does not reflect any deductions for fees, expenses or taxes. The Fund is non-diversified, meaning it concentrates its assets in fewer holdings than a diversified fund and is therefore more exposed to individual stock volatility than a diversified fund. The Fund may invest in small- and medium-capitalization companies, which involve additional risks such as more limited liquidity and greater volatility than large-capitalization companies. References
HENNESSY FUNDS 1-800-966-4354
to specific securities should not be considered a recommendation to buy or sell any security. Fund holdings and sector allocations are subject to change. Please refer to the Schedule of Investments included in this report for additional portfolio information.
Each Morningstar category average represents a universe of funds with similar investment objectives. © Morningstar, Inc. All Rights Reserved. The information contained herein: 1) is proprietary to Morningstar; 2) may not be copied or distributed and 3) is not warranted to be accurate, complete or timely. Neither Morningstar nor its content providers are responsible for any damages or losses arising from any use of this information. Past performance does not guarantee future results.
Hennessy Cornerstone Mid Cap 30 Fund
AVERAGE ANNUAL TOTAL RETURN PERIODS ENDED APRIL 30, 2013*
| | | | | Since Inception |
| | Six Months | One Year | Five Years | (9/17/03) |
| Hennessy Cornerstone Mid Cap 30 Fund – Investor Class | 17.43% | 20.78% | 6.81% | 11.23% |
Hennessy Cornerstone Mid Cap 30 Fund – Institutional Class1 | 17.55% | 21.10% | 7.19% | 11.44% |
| S&P Midcap 400 Index | 19.23% | 18.84% | 8.37% | 10.09% |
| S&P 500 Index | 14.42% | 16.89% | 5.21% | 6.87% |
| Expense ratio: 1.38% (Investor Class) | | | Expense ratio: Gross 1.17%, Net 0.99%2 (Institutional Class) |
Performance data quoted represents past performance; past performance does not guarantee future results. The investment return and principal value of an investment will fluctuate so that an investor’s shares, when redeemed, may be worth more or less than their original cost. Current performance of the Fund may be lower or higher than the performance quoted. Performance data current to the most recent month end may be obtained by visiting www.hennessyfunds.com.
The expense ratios presented are from the most recent prospectus.
| * | Periods less than one year are not annualized. |
| 1 | Represents the performance of the Institutional Class shares after March 3, 2008 (inception of the share class) and Investor Class for periods prior to that date. |
| 2 | With regard to Institutional Class shares, the investment advisor has contractually agreed to waive a portion of its expenses indefinitely. |
PERFORMANCE NARRATIVE
Portfolio Manager, Neil Hennessy, and Co-Portfolio Manager, Brian Peery
Over the previous six months, how did the Fund perform and what factors contributed to this performance?
For the six-month period ended April 30, 2013, the Investor Class of the Hennessy Cornerstone Mid Cap 30 Fund returned 17.43%, underperforming the S&P Midcap 400 Index and the Morningstar Mid Cap Blend Category Average, which returned 19.23%, and 17.71% for the same period, respectively, but outperforming the S&P 500 Index, which returned 14.42%, for the same period.
The Fund’s performance benefited from stock selection within the Energy and Materials sectors, but sector allocation to Utilities versus the benchmark indices (S&P Midcap 400 Index and Morningstar Mid Cap Blend Category Average) created the relative underperformance. The best performing stock in the portfolio was KB Homes, up 41% for the six-month period, as housing stocks continued to perform well during the emerging recovery in the Housing sector. Thor Industries was the single largest detractor to performance during the period, but has since recovered nicely. We continue to hold both stocks within the Fund’s portfolio.
Additional Portfolio Manager commentary and related investment outlook:
During the last six months, we witnessed a solid reemergence of the Housing sector, as well as improved performance of peripheral housing stocks. We remain confident that we are still in the very early stages of this economic recovery and that consumers are just now starting to put money back into the Housing sector after avoiding it for several years. The homebuilders are now poised to do well with the improvement of this beleaguered sector. But we’ve consistently believed that the last several years of deferred home maintenance has created a backlog of consumer spending and as that backlog begins to flow back into remodeling and maintenance, it will positively impact peripheral housing stocks.
We believe the attractiveness of stock prices in general, coupled with the low interest rate environment and quantitative easing from the Federal Reserve Board, have aligned to form an extremely attractive opportunity for equities going forward. We feel there are excellent opportunities in the Mid-Cap space, between $1 billion and $10 billion in market-capitalization, especially within some of the more cyclical sectors like the Consumer Discretionary and Industrial sectors. As the economy continues to improve, we feel that the cyclical companies, those most sensitive to economic recovery, will do well. The Fund is currently overweight cyclical stocks versus the benchmarks and will remain so until its portfolio is rebalanced in the fall.
The S&P Midcap 400 Index and S&P 500 Index are unmanaged indices commonly used to measure the performance of U.S. stocks. You cannot invest directly in an index. Performance data for an index does not reflect any deductions for fees, expenses or taxes. The Fund may invest in small- and medium-capitalization companies which tend to have more limited liquidity and greater price volatility than large-capitalization companies. References to specific securities should not be considered a recommendation to buy or sell any security. Fund holdings and sector allocations are subject to change. Please refer to the Schedule of Investments included in this report for additional portfolio information.
Each Morningstar category average represents a universe of funds with similar investment objectives. © Morningstar, Inc. All Rights Reserved. The information contained herein: 1) is proprietary to Morningstar; 2) may not be copied or distributed and 3) is not warranted to be accurate, complete or timely. Neither Morningstar nor its content providers are responsible for any damages or losses arising from any use of this information. Past performance does not guarantee future results.
Hennessy Cornerstone Large Growth Fund
AVERAGE ANNUAL TOTAL RETURN PERIODS ENDED APRIL 30, 2013*
| | | | | Since Inception |
| | Six Months | One Year | Three Years | (3/20/09) |
| Hennessy Cornerstone Large Growth Fund – Investor Class | 11.64% | 10.10% | 10.81% | 22.07% |
| Hennessy Cornerstone Large Growth Fund – Institutional Class | 11.77% | 10.35% | 11.11% | 22.42% |
| S&P 500 Index | 14.42% | 16.89% | 12.80% | 22.04% |
| Russell 1000 Index | 15.05% | 17.17% | 12.91% | 22.58% |
| Expense ratio: 1.27% (Investor Class) | | | Expense ratio: Gross 1.41%, Net 0.98%1 (Institutional Class) |
Performance data quoted represents past performance; past performance does not guarantee future results. The investment return and principal value of an investment will fluctuate so that an investor’s shares, when redeemed, may be worth more or less than their original cost. Current performance of the Fund may be lower or higher than the performance quoted. Performance data current to the most recent month end may be obtained by visiting www.hennessyfunds.com.
The expense ratios presented are from the most recent prospectus.
| * | Periods less than one year are not annualized. |
| 1 | With regard to Institutional Class shares, the investment advisor has contractually agreed to waive a portion of its expenses indefinitely. |
PERFORMANCE NARRATIVE
Portfolio Manager, Neil Hennessy, and Co-Portfolio Manager, Brian Peery
Over the previous six months, how did the Fund perform and what factors contributed to this performance?
For the six-month period ended April 30, 2013, the Investor Class of the Hennessy Cornerstone Large Growth Fund returned 11.64%, underperforming the S&P 500 Index, the Russell 1000 Index and the Morningstar Large Blend Category Average, which returned 14.42, 15.05% and 14.54% for the same period, respectively.
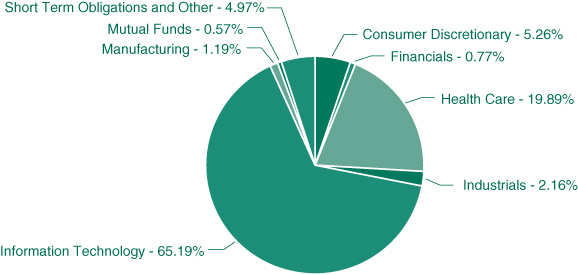
The Fund’s performance benefited from stock selection within the Information Technology, Consumer Staples and Energy sectors, but the stock selection within the Consumer Discretionary and Materials sectors hampered overall performance. The single largest detractor to performance during the period was Freeport-McMoRan, the gold and copper miner. The company was hurt in December after it announced two acquisitions within the Oil and Gas sector, and the stock never recovered to previous levels. The best performing stock in the period was Western Digital, which posted a 63% gain amid a stabilizing pricing environment and improving margins, despite weak PC sales. We continue to hold both stocks within the Fund’s portfolio.
Additional Portfolio Manager commentary and related investment outlook:
While top line revenue growth was muted during the previous six-month period due to a slow growth environment, many companies are providing strong financial results. Corporate profits are hitting new highs as companies have deferred hiring, choosing to keep their costs down. This means any incremental gains in revenue can be impactful to a company’s bottom line earnings and has translated into many companies posting healthy profits.
We believe the attractiveness of equity prices in general, coupled with an extremely low interest rate environment have many investors seeking high quality, dividend-paying companies as a means of generating current income. Until the uncertainty surrounding fiscal policy, taxes, healthcare costs and the debacle in Europe lifts, we feel corporate capital expenditures are essentially in a holding pattern. We anticipate that excess cash will instead be used for buying back stock, paying dividends or accretive merger and acquisition (M&A) activity, all of which should have a positive effect for a company’s shareholders.
In our opinion, the financial markets are beginning to reward companies who return money to shareholders in the form of higher dividends and we expect this trend to continue. While not part of our selection process in the Fund’s portfolio, 45 out of the 50 stocks within its portfolio currently pay dividends. This is a trend we do not believe we would have seen just a few short years ago within this asset class.
We continue to believe being over invested in bonds and underinvested in equities is risky, especially since there are many companies whose stock yields are currently higher than that of a 10-Year U.S. Treasury. Investing in a high dividend-paying stock also allows for potential capital appreciation. As investors continue to seek out opportunities to generate income while having exposure to the upside potential of the equity markets, we believe that large capitalization, dividend-paying companies will continue to do well, especially if they continue the trend of rewarding shareholders by increasing dividends.
The S&P 500 Index and Russell 1000 Index are unmanaged indices commonly used to measure the performance of U.S. stocks. You cannot invest directly in an index. Performance data for an index does not reflect any deductions for fees, expenses or taxes. The Fund may invest in medium-capitalization companies, which tend to have more limited liquidity and greater price volatility than
HENNESSY FUNDS 1-800-966-4354
large-capitalization companies. References to specific securities should not be considered a recommendation to buy or sell any security. Fund holdings and sector allocations are subject to change. Please refer to the Schedule of Investments included in this report for additional portfolio information.
Each Morningstar category average represents a universe of funds with similar investment objectives. © Morningstar, Inc. All Rights Reserved. The information contained herein: 1) is proprietary to Morningstar; 2) may not be copied or distributed and 3) is not warranted to be accurate, complete or timely. Neither Morningstar nor its content providers are responsible for any damages or losses arising from any use of this information. Past performance does not guarantee future results.
Hennessy Cornerstone Value Fund
AVERAGE ANNUAL TOTAL RETURN PERIODS ENDED APRIL 30, 2013*
| | Six Months | One Year | Five Years | Ten Years |
| Hennessy Cornerstone Value Fund – Investor Class | 14.24% | 18.38% | 5.88% | 8.07% |
Hennessy Cornerstone Value Fund – Institutional Class1 | 14.38% | 18.69% | 6.20% | 8.23% |
| Russell 1000 Value Index | 16.31% | 21.80% | 4.17% | 8.42% |
| S&P 500 Index | 14.42% | 16.89% | 5.21% | 7.88% |
| Expense ratio: 1.26% (Investor Class) | | | Expense ratio: Gross 1.20%, Net 0.98%2 (Institutional Class) |
Performance data quoted represents past performance; past performance does not guarantee future results. The investment return and principal value of an investment will fluctuate so that an investor’s shares, when redeemed, may be worth more or less than their original cost. Current performance of the Fund may be lower or higher than the performance quoted. Performance data current to the most recent month end may be obtained by visiting www.hennessyfunds.com.
The expense ratios presented are from the most recent prospectus.
| * | Periods less than one year are not annualized. |
| 1 | Represents the performance of the Institutional Class shares after March 3, 2008 (inception of the share class) and Investor Class for periods prior to that date. |
| 2 | With regard to Institutional Class shares, the investment advisor has contractually agreed to waive a portion of its expenses indefinitely. |
PERFORMANCE NARRATIVE
Portfolio Manager, Neil Hennessy, and Co-Portfolio Manager, Brian Peery
Over the previous six months, how did the Fund perform and what factors contributed to this performance?
For the six-month period ended April 30, 2013, the Investor Class of the Hennessy Cornerstone Value Fund returned 14.24%, underperforming the Russell 1000 Index, the S&P 500 Index and the Morningstar Large Value Category Average, which returned 16.31%, 14.42% and 15.17% for the same period, respectively.
The Fund’s performance was aided by stock selection but hindered by asset allocation. Relative overweighting in the Materials sector and underweighting in the Financials sectors contributed to most of the underperformance. Stock selection within the Consumer Staples and Information Technology sectors was nearly offset by stock selection within the Energy and Consumer Discretionary sectors. DuPont (up nearly 25%) was a significant contributor to overall Fund performance. During the last six months, the company continued to buy back its stock, strengthen its balance sheet and increase its dividend. We believe DuPont’s desire to reward its shareholders aided in driving the stock price higher. The Fund’s performance was hampered by positions in Newmont Mining and Freeport-McMoRan (down 40% and 20%, respectively) as the stocks fell alongside gold’s significant downward move during the second week of April.
Additional Portfolio Manager commentary and related investment outlook:
What we are seeing in the economy and in the financial markets in general can be easily summed up by the actions of a company like DuPont. While top line revenue growth is muted due to a slow economic growth environment, many companies are still doing exceptionally well. Corporate profits continue to hit new highs as companies have deferred hiring, choosing to keep their costs down. This means any incremental gains in revenue can be impactful to a company’s bottom line earnings. So the question begs, what do you do with the profits?
Until the uncertainty surrounding fiscal policy, taxes, healthcare costs and the debacle in Europe subsides, we feel corporate capital expenditures are in a holding pattern. We anticipate that excess cash will instead be used for buying back stock, paying dividends or accretive mergers and acquisitions (M&A) activity, all of which should have a positive effect for a company’s shareholders.
We believe the attractiveness of equity prices in general, coupled with an extremely low interest rate environment, have many investors seeking high quality, dividend paying companies as a means of generating current income. We continue to believe being overly invested in bonds and under-invested in equities is risky, especially since there are many firms with dividend yields higher than that of a 10-Year U.S. Treasury. And investing in a high dividend-paying stock also allows for potential capital appreciation. As investors continue to seek out opportunities to generate income while having exposure to the upside potential of the equity markets, we believe that large capitalization, high dividend-paying companies should continue to do well, especially if they continue the trend of rewarding shareholders by increasing dividends.
The S&P 500 Index and Russell 1000 Value Index are unmanaged indices commonly used to measure the performance of U.S. stocks. You cannot invest directly in an index. Performance data for an index does not reflect any deductions for fees, expenses or taxes. The Fund may invest in medium-capitalization companies, which tend to have more limited liquidity and greater price volatility than large-capitalization companies. Investments in foreign securities involve greater volatility and political, economic and currency risk and differences in accounting methods. References to specific securities should not be considered a recommendation to buy or sell any security. Fund holdings and sector allocations are subject to change. Please refer to the Schedule of Investments included in this report for additional portfolio information.
Each Morningstar category average represents a universe of funds with similar investment objectives. © Morningstar, Inc. All Rights Reserved. The information contained herein: 1) is proprietary to Morningstar; 2) may not be copied or distributed and 3) is not warranted to be accurate, complete or timely. Neither Morningstar nor its content providers are responsible for any damages or losses arising from any use of this information. Past performance does not guarantee future results.
Hennessy Large Value Fund
AVERAGE ANNUAL TOTAL RETURN PERIODS ENDED APRIL 30, 2013*
| | Six Months | One Year | Five Years | Ten Years |
| Hennessy Large Value Fund – Investor Class | 15.28% | 18.35% | 3.07% | 6.71% |
Hennessy Large Value Fund – Institutional Class1 | 15.49% | 18.79% | 3.40% | 6.88% |
| Russell 1000 Value Index | 16.31% | 21.80% | 4.17% | 8.42% |
| S&P 500 Index | 14.42% | 16.89% | 5.21% | 7.88% |
| Expense ratio: 1.40% (Investor Class) | | | Expense ratio: Gross 1.22%, Net 0.98%2 (Institutional Class) |
Performance data quoted represents past performance; past performance does not guarantee future results. The investment return and principal value of an investment will fluctuate so that an investor’s shares, when redeemed, may be worth more or less than their original cost. Current performance of the Fund may be lower or higher than the performance quoted. Performance for periods prior to March 20, 2009 reflects the performance of the Tamarack Value Fund, the predecessor to the Hennessy Select Large Value Fund. Performance data current to the most recent month end may be obtained by visiting www.hennessyfunds.com.
The expense ratios presented are from the most recent prospectus.
| * | Periods less than one year are not annualized. |
| 1 | Represents the performance of the Institutional Class shares after March 20, 2009 (inception of the share class) and Investor Class for periods prior to that date. |
| 2 | With regard to Institutional Class shares, the investment advisor has contractually agreed to waive a portion of its expenses indefinitely. |
PERFORMANCE NARRATIVE
RBC GLOBAL ASSET MANAGEMENT (U.S.) INC., SUB-ADVISOR
Portfolio Managers Stuart Lippe, Barbara Browning, CFA, and Adam Scheiner, CFA, RBC Global Asset Management (U.S.) Inc. (sub-advisor)
Over the previous six months, how did the Fund perform and what factors contributed to this performance?
For the six-month period ended April 30, 2013, the Investor Class of the Hennessy Large Value Fund returned 15.28%, underperforming its benchmark the Russell 1000 Value Index, which returned 16.31% for the same period, but outperforming the S&P 500 Index and Morningstar Large Value Category Average, which returned 14.42% and 15.17% for the same period, respectively.
The Fund’s strong absolute performance was the result of stock selection across a number of sectors, led by Energy, Materials and Consumer Discretionary, while stock selection in Information Technology and Financials detracted from performance. Sector allocation decisions, when excluding the portfolio’s modest cash position (which can hinder performance in a significantly up market), detracted modestly from performance as the Fund’s sector neutral mandate, by design, limits the impact of sector weighting decisions. The Fund’s managers instead make investment decisions at the industry level.
The largest contributor to the Fund’s performance for the period was the Energy sector as the portfolio benefited from its significant underweight position to underperforming integrated oil company Exxon and overweight position to oil refiner Valero Energy Corp. Exxon shares declined in value due to softer than expected energy prices, while Valero benefited from declining feedstock prices/costs, in this case natural gas, a theme that contributed to strength across the refining industry.
Within the Materials sector, the portfolio benefited both from what it owned, coatings producer PPG, and what it successfully avoided, which was gold miner Newmont Mining Corp. Newmont sold off as the price of gold significantly weakened over the period while PPG’s residential paint business benefited from the ongoing housing recovery. PPG was also able to sell-off its commodity chemicals business, using the proceeds to strengthen its position in the housing paint market by acquiring AkzoNobel. The Fund no longer holds PPG in its portfolio.
Consumer Discretionary was led by retailer Abercrombie & Fitch, as well as media companies CBS and Time Warner. Abercrombie and Fitch reported better than expected comps signaling the early stages of a turnaround in the company’s domestic operations. CBS benefited from maintaining its position as the #1 rated broadcast network with an additional catalyst in the monetization of its outdoor advertising business. Time Warner benefited from improved ratings for the Turner Networks, which will drive higher affiliate fees as the company enters its renegotiation cycle.
HENNESSY FUNDS 1-800-966-4354
On the negative side of the ledger, Information Technology firm EMC detracted from the Fund’s performance for the period, as uncertainty surrounding future enterprise spending caused VMWare, of which EMC owns 80%, to announce a slowdown in its core business. This same theme also hurt EMC’s core businesses. Within Financials, the portfolio was negatively impacted by an underweight position in outperforming Bank of America and Berkshire Hathaway. The Fund has since used weakness in these names to selectively add to these positions.
Additional Portfolio Manager commentary and related investment outlook:
With markets having recouped virtually all of the losses resulting from the 2008 financial crisis and sitting at, or near, all time highs, we remain cautiously optimistic regarding performance going forward. Our near term cautious outlook is the result of a market that has the appearance of being slightly over bought following its rapid ascent, leaving us wary of the potential for a significant correction. Despite our near term call for caution, we believe any correction should be short lived and we remain confident in our stock selection driven process and our ability to find special situation stocks that will outperform regardless of market environment. While investment decisions are the result of bottoms up stock selection and our sector neutral mandate requires investment in all ten major economic sectors, there are a number of industry-based themes that we believe have the potential for outperformance in 2013, including the following: continued improvement in housing, which positively impacts our holdings in money center banks, chemical companies, and other second derivative housing names; property and casualty insurance companies benefiting from pricing power; HMO strength as “Obamacare” drives increased health care spending; a potential pickup in gas drilling activity off of a depressed base should gas prices rebound in the last half of 2013; and a pickup in corporate IT spending driven by increased storage demands, desktop virtualization, and proliferation of cloud computing.
The S&P 500 Index and Russell 1000 Value Index are unmanaged indices commonly used to measure the performance of U.S. stocks. The Russell 1000 Value measures large-cap, value-oriented stocks. You cannot invest directly in an index. Performance data for an index does not reflect any deductions for fees, expenses or taxes. The Fund may invest in medium-capitalization companies, which tend to have more limited liquidity and greater price volatility than large-capitalization companies. References to specific securities should not be considered a recommendation to buy or sell any security. Fund holdings and sector allocations are subject to change. Please refer to the Schedule of Investments included in this report for additional portfolio information.
Each Morningstar category average represents a universe of funds with similar investment objectives. © Morningstar, Inc. All Rights Reserved. The information contained herein: 1) is proprietary to Morningstar; 2) may not be copied or distributed and 3) is not warranted to be accurate, complete or timely. Neither Morningstar nor its content providers are responsible for any damages or losses arising from any use of this information. Past performance does not guarantee future results.
Hennessy Total Return Fund
AVERAGE ANNUAL TOTAL RETURN PERIODS ENDED APRIL 30, 2013*
| | Six Months | One Year | Five Years | Ten Years |
| Hennessy Total Return Fund | 11.31% | 14.50% | 4.97% | 6.39% |
| Dow Jones Industrial Average | 14.86% | 15.39% | 5.93% | 8.49% |
| S&P 500 Index | 14.42% | 16.89% | 5.21% | 7.88% |
Expense ratio: 1.38%
Performance data quoted represents past performance; past performance does not guarantee future results. The investment return and principal value of an investment will fluctuate so that an investor’s shares, when redeemed, may be worth more or less than their original cost. Current performance of the Fund may be lower or higher than the performance quoted. Performance data current to the most recent month end may be obtained by visiting www.hennessyfunds.com.
The expense ratio presented is from the most recent prospectus.
*Periods less than one year are not annualized.
PERFORMANCE NARRATIVE
Portfolio Manager, Neil Hennessy, and Co-Portfolio Manager, Brian Peery
Over the previous six months, how did the Fund perform and what factors contributed to this performance?
For the six-month period ended April 30, 2013, the Hennessy Total Return Fund returned 11.31%, underperforming the Dow Jones Industrial Average, the S&P 500 Index and the Morningstar Mid Large Value Category Average, which returned 14.86%, 14.42% and 15.17% for the same period, respectively.
The Fund’s roughly 25% weighting of U.S. Treasuries was detrimental to overall performance, as yields continued near historic lows. The Fund’s approximately 75% equity weighting was able to capture nearly the weighted return of the Dow Jones Industrial Average.
During the six months ended April 30, 2013, each of the Fund’s 17 equity positions had positive returns, with Hewlett-Packard and DuPont leading the way with returns of 47% and 21% for the six-month period, respectively. The two worst performers in the Fund for the period were Merck and General Electric, although both had positive returns (2% and 5%, respectively).
While the Fund’s portfolio may underperform the indices in periods where equities rise sharply, the strategy is geared to capture near market returns with a lower risk profile, since only three-quarters of the assets are invested in equities. Conversely, if equity markets were to fall sharply, we would expect the Fund to perform better than the indices due to its 25% exposure to short-term U.S. Treasuries that are held to maturity. Ultimately, the overall goal of this portfolio is to capture near-market upside performance while mitigating some of the potential market downside risk.
Additional Portfolio Manager commentary and related investment outlook:
We continue to believe that the Dow Jones Industrial Average stocks, and in particular the stocks that comprise the “Dogs of the Dow” (the methodology employed within the Hennessy Total Return Fund) provide an excellent way to gain equity exposure to the markets. With U.S. Treasury yields still trading near historic lows, many investors are seeking high quality, dividend-paying companies as a means of generating current income. We continue to believe the strategy of swapping out of bonds and into equities, where investors have historically received higher yields as well as the potential for capital appreciation, will continue.
As the market reaches new highs and investors become more wary of a potential pullback, we believe that a trend of moving some money away from more risky asset classes and into what we believe is the relative safety of very large dividend-paying companies will prevail. We believe the Fund is well positioned for the more moderately conservative investor as the equity portion of the portfolio holds what we would deem to be high quality, high dividend-paying companies, while the short duration of the Treasury component (all less than three months) will allow us the ability to roll into higher yielding treasuries, should U.S. Government yields rise.
The Dow Jones Industrial Average and S&P 500 Index are unmanaged indices commonly used to measure the performance of U.S. Stocks. You cannot invest directly in an index. Performance data for an index does not reflect any deductions for fees, expenses or taxes. The Fund is non-diversified, meaning it concentrates its assets in fewer individual holdings than a diversified fund and is therefore more exposed to individual stock volatility than a diversified fund. References to specific securities should not be considered a recommendation to buy or sell any security. Fund holdings and sector allocations are subject to change. Please refer to the Schedule of Investments included in this report for additional portfolio information.
The Dogs of the Dow are the ten highest dividend-yielding stocks in the Dow Jones Industrial Average.
Each Morningstar category average represents a universe of funds with similar investment objectives. © Morningstar, Inc. All Rights Reserved. The information contained herein: 1) is proprietary to Morningstar; 2) may not be copied or distributed and 3) is not warranted to be accurate, complete or timely. Neither Morningstar nor its content providers are responsible for any damages or losses arising from any use of this information. Past performance does not guarantee future results.
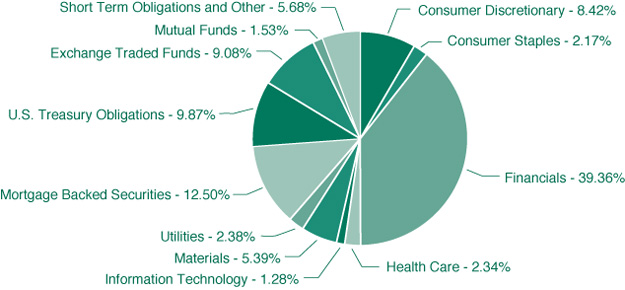
Hennessy Equity and Income Fund
AVERAGE ANNUAL TOTAL RETURN PERIODS ENDED APRIL 30, 2013*
| | Six Months | One Year | Five Years | Ten Years |
| Hennessy Equity and Income Fund – Investor Class | 9.81% | 10.73% | 6.82% | 9.32% |
| Hennessy Equity and Income Fund – Institutional Class | 9.98% | 11.06% | 7.10% | 9.58% |
Blended Balanced Index1 | 8.95% | 11.38% | 5.53% | 6.80% |
| S&P 500 Index | 14.42% | 16.89% | 5.21% | 7.88% |
| Expense ratio: 1.35% (Investor Class) | | | Expense ratio: 1.08% (Institutional Class) |
Performance data quoted represents past performance; past performance does not guarantee future results. The investment return and principal value of an investment will fluctuate so that an investor’s shares, when redeemed, may be worth more or less than their original cost. Current performance of the fund may be lower or higher than the performance quoted. Performance data current to the most recent month end may be obtained by visiting www.hennessyfunds.com. Performance for periods prior to October 26, 2012 is that of the FBR Balanced Fund from March 12, 2010 to October 25, 2012 and that of the AFBA 5 Star Balanced Fund for periods prior to March 12, 2010.
The expense ratios presented are from the most recent prospectus.
| * | Periods less than one year are not annualized. |
| 1 | The Blended Balanced Index consists of 60% common stocks represented by the S&P 500 Index and 40% bonds represented by the Barclays Capital Intermediate U.S. Government/Credit Index. |
PERFORMANCE NARRATIVE
THE LONDON COMPANY, SUB-ADVISOR (EQUITY PORTION)
FINANCIAL COUNSELORS, INC., SUB-ADVISOR (FIXED INCOME PORTION)
For the six-month period ended April 30, 2013, the Investor Class of the Hennessy Equity and Income Fund returned 9.81%, outperforming the Blended Balanced Index1 and the Morningstar Moderate Allocation Category Average, which returned 8.95% and 9.17% for the same period, respectively, but underperforming the S&P 500 Index, which returned 14.42% for the same period.
Portfolio Managers Stephen M. Goddard, CFA (Lead Portfolio Manager for the Fund), Jonathan T. Moody, CFA, J. Brian Campbell, CFA, Mark DeVaul, CFA, CPA, The London Company (sub-advisor of the equity portion of the Fund).
HENNESSY FUNDS 1-800-966-4354
What factors contributed to the performance of the equity portion of the Hennessy Equity and Income Fund?
The focus on higher quality and generally less volatile companies within the Fund helped performance, and the equity portion of the portfolio outpaced the S&P 500 Index during the six-month period. The predominant driver of performance was stock selection. The top performing sectors for the market during the six-month period were Consumer Discretionary, Healthcare and Financials. The Fund was underweight the Consumer Discretionary and Healthcare sectors, but overweight the Financials sector. The bottom performing sectors were Information Technology, Energy and Materials, and the Fund was underweight the Information Technology and Energy sectors, but overweight the Materials sector. The combined effect of sector allocation was a detractor from performance during the period.
The weak sector allocation was, however, more than offset by strong stock selection, with notably strong stock selection in the Financials, Information Technology and Consumer Discretionary sectors. The top contributors to performance in the period were Eaton Vance, CarMax Inc., BlackRock, Inc., Energizer Holdings, Inc. and Berkshire Hathaway, Inc. The Fund still holds these stocks in its portfolio.
The top equity detractors to performance during the period were EMC Corporation, UDR Inc., Matson Inc., Hatteras Financial Corporation and ConocoPhillips. The Fund no longer owns UDR Inc. or Hatteras Financial Corporation in its portfolio.
Additional Portfolio Manager commentary on the equity portion of the Fund and related investment outlook:
We believe the Fund’s strong performance in the current period illustrates the perils of market timing and the benefits of our discipline to remain fully invested at all times.
At its core, investing of any sort requires overcoming some level of uncertainty, an actuality we have faced plenty of times in the last few years. Unfortunately, just believing in a better future doesn’t yield investment success. The current gains of the market have been achieved by increased clarity but also by tangible fundamental improvements. Simply put, Corporate America is doing well and operating profits are 13% higher than their pre-crisis peak. Leverage among the S&P 500 companies has been cut in half and historically low interest rates are slowly shifting assets into equities for income and capital appreciation. Free cash flow yields are at 50-year highs and the allocation of capital back to shareholders through dividends and stock repurchases continues to grow. Help from the Federal Reserve also creates a favorable investment environment. When easy monetary policy is both vast and transparent, it removes the typical ambiguity associated with policies of the Federal Reserve Board. Furthermore, central bankers around the world are now reading from the same playbook, and many global investors still portray the U.S. as the best house in a bad neighborhood.
On the negative side, organic growth is stagnant, both domestically and abroad. First quarter global GDP estimates are a meek 2.5%. Capital allocation, while improving, has a long way to go. The S&P 500 dividend payout ratio is still near its 60-year low at just 32%, and corporate balance sheets remain bloated with record high cash balances.
In a slow growth world with incredibly low interest rates, we believe efficient capital allocation will be vital to maximizing wealth. The valuation levels of companies are being influenced by whether management teams part with or hoard cash. Research suggests that large-capitalization companies with favorable capital use profiles have outperformed the market over the last ten years while those with the worst capital use profiles have lagged.
The other outlet for capital allocation is mergers and acquisitions (M&A) activity and leveraged buyouts. While we have been surprised by the slow uptake of deals, the transactions being completed are often instantly accretive, expressed by the unusual accompaniment of both the acquired and acquirer appreciating on the announcement.
Longer-term, we believe the over-arching landscape for equities remains favorable. When market sentiment changes in the short-term and uncertainty reappears, it offers us opportunities to actively select superior companies with shareholder-oriented management teams. By avoiding speculation and having a tangible sense of real risk, we remain optimistic in our ability to earn above average returns.
Portfolio Managers Gary B. Cloud, CFA, and Peter G. Greig, CFA, Financial Counselors, Inc. (sub-advisor of the fixed income portion of the Fund)
What factors contributed to the performance of the fixed income portion of the Hennessy Equity and Income Fund?
The fixed income portion of the Fund performed in-line with the Barclays Capital Intermediate U.S. Government/Credit Index over the previous six months. The main driver of this result was the Fund’s overweight position in investment grade credit. Corporate credit returned 1.49% over the last six months, compared to 0.79% from Treasuries. The portfolio’s modest allocation to the high yield sector also contributed positively to overall returns.
The Fund’s sector overweight position in corporate debt obligations, combined with the higher income component from these securities, were the two largest positive factors impacting relative performance. Security premium amortization and effective duration categories were the two most notable negative factors impacting performance compared to the benchmark.
Additional Portfolio Manager commentary on the fixed income portion of the Fund and related investment outlook:
The Treasury market has been in a trading range with 10-year yields bracketing 1.60% and 2.10% for the last six months. The global economic growth outlook on one hand seems to be slowing, while prospects for a sustained U.S. upturn look to be improving. That development may lead the Federal Reserve Board to begin adjusting its monthly outright Treasury and Mortgage purchases later this year. This could lead to higher 10-year Treasury yields that approach the higher 2012 level of 2.40%.
Higher relative bond yields in the U.S. should lead to a strengthening dollar, making U.S. exports less competitive and impacting multinational corporate sales and earnings. This could lead to slower U.S. growth, resulting in Treasury rates returning to their recent ranges with a slight upward bias. Therefore, we believe that the rates markets will remain well anchored and historically very low, with an upside skew. This type of environment historically has favored an out performance in investment grade and high yield credit and we remain overweight these sectors.
The Blended Balance Index (which consists of 60% common stocks represented by the S&P 500 Index and 40% bonds represented by the Barclays Capital Intermediate U.S. Government/Credit Index) and S&P 500 Index are unmanaged indices commonly used to measure the performance of U.S. stocks. The Barclays Capital Intermediate U.S. Government/Credit Index is an unmanaged index commonly used to measure the performance of U.S. bonds. You cannot invest directly in an index. Performance data for an index does not reflect any deductions for fees, expenses or taxes. The Fund may invest in debt securities, which typically decrease in value when interest rates rise. The risk is greater for longer term debt securities. Investments by the Fund in lower-rated and non-rated securities presents a greater risk of loss to principal and interest than higher-rated securities. Investments in Asset-Backed and Mortgage-Backed securities include additional risks that investors should be aware of, including credit risk, prepayment risk, possible illiquidity and default, as well as increased susceptibility to adverse economic developments. Investments in foreign securities may involve greater volatility and political, economic and currency risk and differences in accounting methods. The Fund may invest in IPOs, which may fluctuate considerably due to the absence of a prior public market and may have a magnified impact on the Fund. References to specific securities should not be considered a recommendation to buy or sell any security. Fund holdings and sector allocations are subject to change. Please refer to the Schedule of Investments included in this report for additional portfolio information.
Duration is a commonly used measure of the potential volatility of the price of a debt security or the aggregate market value of a portfolio of debt securities prior to maturity. Securities with a longer duration generally have more volatile prices than securities of comparable quality with a shorter duration.
Each Morningstar category average represents a universe of funds with similar investment objectives. © Morningstar, Inc. All Rights Reserved. The information contained herein: 1) is proprietary to Morningstar; 2) may not be copied or distributed and 3) is not warranted to be accurate, complete or timely. Neither Morningstar nor its content providers are responsible for any damages or losses arising from any use of this information. Past performance does not guarantee future results.
Hennessy Balanced Fund
AVERAGE ANNUAL TOTAL RETURN PERIODS ENDED APRIL 30, 2013*
| | Six Months | One Year | Five Years | Ten Years |
| Hennessy Balanced Fund | 7.00% | 8.80% | 3.84% | 4.39% |
| Dow Jones Industrial Average | 14.86% | 15.39% | 5.93% | 8.49% |
| S&P 500 Index | 14.42% | 16.89% | 5.21% | 7.88% |
Expense ratio: 1.55%
Performance data quoted represents past performance; past performance does not guarantee future results. The investment return and principal value of an investment will fluctuate so that an investor’s shares, when redeemed, may be worth more or less than their original cost. Current performance of the Fund may be lower or higher than the performance quoted. Performance data current to the most recent month end may be obtained by visiting www.hennessyfunds.com.
The expense ratio presented is from the most recent prospectus.
*Periods less than one year are not annualized.
PERFORMANCE NARRATIVE
Portfolio Manager, Neil Hennessy, and Co-Portfolio Manager, Brian Peery
Over the previous six months, how did the Fund perform and what factors contributed to this performance?
For the six-month period ended April 30, 2013, the Hennessy Balanced Fund returned 7.00%, underperforming the Dow Jones Industrial Average, the S&P 500 Index and the Morningstar Moderate Allocation Category Average, which returned 14.86%, 14.42% and 9.17% for the same period, respectively.
The Fund’s relative underperformance to its benchmarks is due primarily to the continued low yields on Treasury Bills. The Fund’s position of approximately 50% in U.S. Treasuries did not allow it to fully capture the performance of the equity markets over the year. While the portfolio may underperform the indices in periods where equities rise sharply, the strategy is geared to capture near market returns with a potentially lower risk profile, since only half of the assets are invested in equities. Conversely, if equity markets were to fall sharply, we would expect the Fund to perform better than the indices. Ultimately, the overall goal of this portfolio is to capture upside performance while mitigating downside risk.
During the six-month period ended April 30, 2013, each of the Fund’s 15 equity positions had positive returns, with Hewlett-Packard and DuPont leading the way with returns of 47% and 21%, respectively. The two worst performers in the Fund for the period were Merck and General Electric, although both had positive returns (2% and 5%, respectively).
HENNESSY FUNDS 1-800-966-4354
Additional Portfolio Manager commentary and related investment outlook:
We continue to believe that the Dow Jones Industrial Average stocks, and in particular the stocks that comprise the “Dogs of the Dow” (the methodology employed within the Hennessy Balanced Fund) provide an excellent way to gain equity exposure to the markets.
With U.S. Treasury yields still trading near historic lows, many investors are seeking high quality, dividend-paying companies as a means of generating current income. We continue to believe the strategy of swapping out of bonds and into equities, where investors have historically received higher yields as well as the potential for capital appreciation, will continue.
As the overall markets reach new highs and investors become more wary of a potential pullback, we believe that a trend of moving some money away from more risky asset classes and into the relative safety of very large dividend-paying companies will prevail. We believe the Fund is well positioned for the more conservative investor as the equity portion of the portfolio holds what we would deem to be high quality, high-dividend paying companies, while the relatively short duration of the Treasury component (all less than one year) should allow us the ability to roll into higher yielding treasuries in the event U.S. Government yields rise.
The Dow Jones Industrial Average and S&P 500 Index are unmanaged indices commonly used to measure the performance of U.S. stocks. You cannot invest directly in an index. Performance data for an index does not reflect any deductions for fees, expenses or taxes. The Fund is non-diversified, meaning it concentrates its assets in fewer individual holdings than a diversified fund and is therefore more exposed to individual stock volatility than a diversified fund. References to specific securities should not be considered a recommendation to buy or sell any security. Fund holdings and sector allocations are subject to change. Please refer to the Schedule of Investments included in this report for additional portfolio information.
The Dogs of the Dow are the ten highest dividend-yielding stocks in the Dow Jones Industrial Average.
Each Morningstar category average represents a universe of funds with similar investment objectives. © Morningstar, Inc. All Rights Reserved. The information contained herein: 1) is proprietary to Morningstar; 2) may not be copied or distributed and 3) is not warranted to be accurate, complete or timely. Neither Morningstar nor its content providers are responsible for any damages or losses arising from any use of this information. Past performance does not guarantee future results.
Hennessy Core Bond Fund
AVERAGE ANNUAL TOTAL RETURN PERIODS ENDED APRIL 30, 2013*
| | Six Months | One Year | Five Years | Ten Years |
| Hennessy Core Bond Fund – Investor Class | 1.38% | 5.29% | 5.92% | 6.26% |
| Hennessy Core Bond Fund – Institutional Class | 1.47% | 5.49% | 6.17% | 6.52% |
| Barclays Capital Intermediate U.S. Government/Credit Index | 1.09% | 3.23% | 4.90% | 4.48% |
Expense ratio: Gross 2.22%, Net 1.40%1 (Investor Class) | | | Expense ratio: Gross 1.41%, Net 1.15%1 (Institutional Class) |
Performance data quoted represents past performance; past performance does not guarantee future results. The investment return and principal value of an investment will fluctuate so that an investor’s shares, when redeemed, may be worth more or less than their original cost. Current performance of the fund may be lower or higher than the performance quoted. Performance data current to the most recent month end may be obtained by visiting www.hennessyfunds.com. Performance for periods prior to October 26, 2012 is that of the FBR Core Bond Fund from March 12, 2010 to October 25, 2012 and that of the AFBA 5 Star Total Return Bond Fund prior to March 12, 2010. Investment performance reflects fee waivers in effect. In the absence of such waivers, total return would be reduced.
The expense ratios presented are from the most recent prospectus.
| * | Periods less than one year are not annualized. |
| 1 | The investment advisor has contractually agreed to waive a portion of its expenses through February 28, 2015. |
PERFORMANCE NARRATIVE
FINANCIAL COUNSELORS, INC., SUB-ADVISOR
Portfolio Managers Gary B. Cloud, CFA, and Peter G. Greig, CFA, Financial Counselors, Inc. (sub-advisor)
Over the previous twelve months, how did the Fund perform and what factors contributed to this performance?
For the six-month period ended April 30, 2013, the Investor Class of the Hennessy Core Bond Fund returned 1.38%, outperforming the Barclays Capital Intermediate U.S. Government/Credit Index, which returned 1.09% for the same period, but underperforming the Morningstar Intermediate Term Bond Category Average, which returned 1.72% for the same period.
The Fund performed well over the previous six months compared to a representative mix of Intermediate Term Bond Indices. The main contributor to this performance was the Fund’s overweight position in investment grade credit. Corporate credit returned 1.49% over the last six months, compared to 0.79% from Treasuries. The portfolio’s modest allocation to the high yield sector also contributed positively to overall returns.
The sector overweight in corporate debt obligations, combined with the higher income component from these securities, were the two largest positive factors impacting relative performance. Security premium amortization and effective duration categories were the two most notable negative factors impacting Fund performance compared to the benchmark.
Additional Portfolio Manager commentary and related investment outlook:
The Treasury market has been in a trading range with 10-year yields bracketing 1.60% and 2.10% for the last six months. The global economic growth outlook on one hand seems to be slowing, while prospects for a sustained U.S. upturn look to be improving. That development may lead the Federal Reserve Board to begin adjusting its monthly outright Treasury and Mortgage purchases later this year. This could lead to higher 10-year Treasury yields that approach the higher 2012 level of 2.40%.
Higher relative bond yields in the U.S. should lead to a strengthening dollar, making U.S. exports less competitive and impacting multinational corporate sales and earnings. This could lead to slower U.S. growth resulting in Treasury rates returning to their recent ranges with a slight upward bias. Therefore, we believe that the rates markets will remain well anchored and historically very low, with an upside skew. This type of environment historically has favored an out performance in investment grade and high yield credit, and we remain overweight these sectors.
The Barclays Capital Intermediate U.S. Government/Credit Index is an unmanaged index commonly used to measure the performance of U.S. bonds. You cannot invest directly in an index. The Fund may invest in debt securities, which typically decrease in value when interest rates rise. The risk is greater for longer term debt securities. Investments by the Fund in lower-rated and non-rated securities presents a greater risk of loss to principal and interest than higher-rated securities. Investments in Asset-Backed and Mortgage-Backed securities include additional risks that investors should be aware of including credit risk, prepayment risk, possible illiquidity and default, as well as increased susceptibility to adverse economic developments. Investments in foreign securities may involve greater volatility and political, economic and currency risk and differences in accounting methods. The Fund may invest in IPOs, which may fluctuate considerably due to the absence of a prior public market and may have a magnified impact on the Fund. References to specific securities should not be considered a recommendation to buy or sell any security. Fund holdings and sector allocations are subject to change. Please refer to the Schedule of Investments included in this report for additional portfolio information.
Duration is a commonly used measure of the potential volatility of the price of a debt security, or the aggregate market value of a portfolio of debt securities, prior to maturity. Securities with a longer duration generally have more volatile prices than securities of comparable quality with a shorter duration.
Each Morningstar category average represents a universe of funds with similar investment objectives. © Morningstar, Inc. All Rights Reserved. The information contained herein: 1) is proprietary to Morningstar; 2) may not be copied or distributed and 3) is not warranted to be accurate, complete or timely. Neither Morningstar nor its content providers are responsible for any damages or losses arising from any use of this information. Past performance does not guarantee future results.
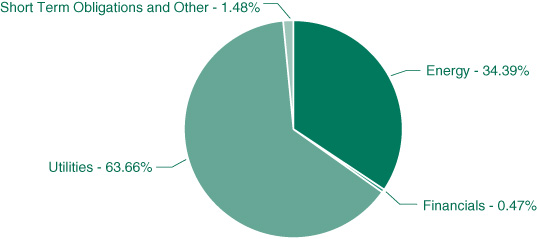
Hennessy Gas Utility Index Fund
AVERAGE ANNUAL TOTAL RETURN PERIODS ENDED APRIL 30, 2013*
| | Six Months | One Year | Five Years | Ten Years |
| Hennessy Gas Utility Index Fund – Investor Class | 17.91% | 23.43% | 10.64% | 13.98% |
AGA Stock Index1 | 18.39% | 23.36% | 9.69% | 13.01% |
| S&P 500 Index | 14.42% | 16.89% | 5.21% | 7.88% |
Expense ratio: 0.69%
Performance data quoted represents past performance; past performance does not guarantee future results. The investment return and principal value of an investment will fluctuate so that an investor’s shares, when redeemed, may be worth more or less than their original cost. Current performance of the Fund may be lower or higher than the performance quoted. Performance data current to the most recent month end may be obtained by visiting www.hennessyfunds.com. Performance for periods prior to October 26, 2012 is that of the FBR Gas Utility Index Fund.
The expense ratio presented is from the most recent prospectus.
| * | Periods less than one year are not annualized. |
| 1 | Source: American Gas Association. As calculated by the American Gas Association, the total return of the AGA Stock Index reflects the appreciation or depreciation of the stocks in the AGA Stock Index plus all dividends paid on such stocks, but does not assume that the dividends are reinvested and compounded. |
PERFORMANCE NARRATIVE
Portfolio Manager, Winsor (Skip) Aylesworth, and Co-Portfolio Manager, Ryan Kelley
Over the previous six months, how did the Fund perform and what factors contributed to this performance?
For the six-month period ended April 30, 2013, the Hennessy Gas Utility Index Fund returned 17.91%, outperforming the S&P 500 Index and the Morningstar Utilities Category Average, which returned 14.42%, and 14.79% for the same period, respectively, and slightly underperforming the American Gas Association (AGA) Stock Index, which returned 18.39% for the same period. In the most recent Annual Report, we mentioned that it is more an exception than the rule for the Fund to outperform its benchmark. For this period we slightly underperformed against the Fund’s primary benchmark, the AGA Stock Index, which is expected because returns for the AGA Stock Index do not take into account Fund expenses.
Two of the Fund’s best performers for the period were Cheniere Energy, Inc (+77%) and Equity Transfer Equity, L.P. (+36%). Cheniere was a Fund top performer last year and it continued its run as the company focuses on Liquid Natural Gas (LNG), which can
HENNESSY FUNDS 1-800-966-4354
be exported overseas. There is significant investor interest in LNG as the U.S. enjoys a significantly lower natural gas price versus Europe and Asia. Cheniere continued to benefit from this as it will be one of the first companies to export LNG beginning next year. Energy Transfer Equity is a Master Limited Partnership (MLP) that joined the AGA Stock Index as a result of its purchase of Southern Union last year. The firm specializes in the storage and transportation of natural gas, and as an MLP it pays the bulk of its cash flow out in distributions to avoid paying taxes at the corporate level. This makes it particularly attractive to income oriented investors. The underlying business should do well as the demand for natural gas increases.
One of the worst Fund performers was Northwest Natural Gas (-3%), which is a natural gas distributor, pipeline and storage operator located in the Pacific Northwest. The stock’s underperformance appears to be more tied to the impact of recent regulatory rate cases than economic issues in the region.
Additional Portfolio Manager commentary and related investment outlook:
The Fund’s investment in the natural gas distribution industry continued to serve shareholders well. The improvement in the American economy and stock markets can be tied in part to the natural gas revolution. New natural gas exploration and production technologies have resulted in abundant supplies with historically low prices, which in turn continues to fuel demand and a general lowering of overall energy costs for individuals and businesses alike. Next year we anticipate that natural gas companies will begin exporting energy to the world. So, unless there is a disruption in the supply of gas, and as long as prices don’t increase significantly, we expect to see increased demand and potentially upward earnings for the Fund’s portfolio of companies.
The AGA Stock Index is a market capitalization weighted index, adjusted monthly, consisting of member companies of the AGA. The S&P 500 Index is an unmanaged index commonly used to measure the performance of U.S. stocks. You cannot invest directly in an index. Performance data for an index does not reflect any deductions for fees, expenses or taxes. The Fund is non-diversified, meaning it concentrates its assets in fewer holdings than a diversified fund and is therefore more exposed to individual stock volatility than a diversified fund. Investments are focused in the natural gas distribution and transmission industry, which may be adversely affected by rising interest rates, weather, and the wholesale pricing of alternative fuels. Investments in foreign securities may involve greater volatility and political, economic and currency risk and differences in accounting methods. References to specific securities should not be considered a recommendation to buy or sell any security. Fund holdings and sector allocations are subject to change. Please refer to the Schedule of Investments included in this report for additional portfolio information.
Cash flow measures the cash generated by a business after paying all operating costs, interest expense and taxes.
Each Morningstar category average represents a universe of funds with similar investment objectives. © Morningstar, Inc. All Rights Reserved. The information contained herein: 1) is proprietary to Morningstar; 2) may not be copied or distributed and 3) is not warranted to be accurate, complete or timely. Neither Morningstar nor its content providers are responsible for any damages or losses arising from any use of this information. Past performance is no guarantee of future results.
Hennessy Small Cap Financial Fund
AVERAGE ANNUAL TOTAL RETURN PERIODS ENDED APRIL 30, 2013*
| | Six Months | One Year | Five Years | Ten Years |
| Hennessy Small Cap Financial Fund – Investor Class | 13.49% | 21.72% | 8.07% | 6.76% |
Hennessy Small Cap Financial Fund – Institutional Class1 | 13.59% | 21.99% | 8.31% | 6.88% |
| Russell 2000 Index | 16.58% | 17.69% | 7.27% | 10.47% |
| NASDAQ Bank Index | 11.53% | 15.66% | -1.99% | 1.27% |
| Expense ratio: 1.51% (Investor Class) | | | Expense ratio: 1.31% (Institutional Class) |
Performance data quoted represents past performance; past performance does not guarantee future results. The investment return and principal value of an investment will fluctuate so that an investor’s shares, when redeemed, may be worth more or less than their original cost. Current performance of the Fund may be lower or higher than the performance quoted. Performance data current to the most recent month end may be obtained by visiting www.hennessyfunds.com. Performance for periods prior to October 26, 2012 is that of the FBR Small Cap Financial Fund.
The expense ratios presented are from the most recent prospectus.
| * | Periods less than one year are not annualized. |
| 1 | Represents the performance of the Institutional Class shares after May 30, 2008 (inception of the share class) and Investor Class for periods prior to that date. |
PERFORMANCE NARRATIVE
Portfolio Manager, David Ellison, and Co-Portfolio Manager, Ryan Kelley
Over the previous six months, how did the Fund perform and what factors contributed to this performance?
For the six-month period ended April 30, 2013, the Investor Class of the Hennessy Small Cap Financial Fund returned 13.49%, outperforming the NASDAQ Bank Index, which returned 11.53% for the same period, but underperforming the Russell 2000 Index and the Morningstar Financial Category Average, which returned 16.58% and 16.88% for the same period, respectively.
The Fund continues to be positioned for an improving housing market, which should lead to better loan demand and reduced delinquent credit expenses. The Fund has been positioned this way for approximately 18 months.
The companies with the strongest performance contribution during the six-month period were in the mortgage and debt insurance businesses. These included MGIC Investment Corp., Radian Group and Genworth Financial.
Companies detracting from performance the most during the period were in the more traditional deposit and lending businesses. These included Flagstar Bancorp, HomeStreet and Wintrust Financial.
Additional Portfolio Manager commentary and related investment outlook:
The industry continued to benefit from the slow improvement in housing and the economy in general. This improvement is driving lower delinquent credit costs and some improvement in loan demand. Deposit costs remain low and the supply available to lend is ample. Lending spreads are under pressure and we can expect some challenges for a portion of the industry going forward. Regulatory compliance costs are rising, but appear manageable at this point. Industry consolidation activity remains subdued and will probably remain so until the economy and housing are on a more stable footing.
Current valuations among small cap financial companies, as measured by price to book and price to earnings, are at about historical averages. We believe the industry has much work to do as it recovers from the severe housing recession that began in 2007. We have put together a portfolio of companies that we believe offer the best opportunity for outperformance as the economy continues to recover.
The Russell 2000® Index is an unmanaged total return index of the smallest 2000 companies in the Russell 3000 Index, as ranked by total market capitalization. The NASDAQ Bank Index is a capitalization weighted index of domestic and foreign common stocks of banks that are traded on the NASDAQ National Market System. You cannot invest directly in an index. Performance data for an index does not reflect any deductions for fees, expenses or taxes. The Fund is non-diversified, meaning it concentrates its assets in fewer holdings than a diversified fund and is therefore more exposed to individual stock volatility than a diversified fund. The Fund invests in smaller-capitalization companies, which involves additional risks such as more limited liquidity and greater volatility than large-capitalization companies. Investors are focused in the financial services industry, which may be adversely affected by regulatory or other market conditions such as rising interest rates. References to specific securities should not be considered a recommendation to buy or sell any security. Fund holdings and sector allocations are subject to change. Please refer to the Schedule of Investments included in this report for additional portfolio information.
Price to book is a ratio used to compare a stock’s market value to its book value and is calculated by dividing the current closing price of such stock by the most recent quarter’s book value per share of such stock. Price to earnings is a ratio used to compare a stock’s market value to its per-share earnings and is calculated by dividing the current closing price of such stock by the most recent quarter’s earnings per share of such stock.
Each Morningstar category average represents a universe of funds with similar investment objectives. © Morningstar, Inc. All Rights Reserved. The information contained herein: 1) is proprietary to Morningstar; 2) may not be copied or distributed and 3) is not warranted to be accurate, complete or timely. Neither Morningstar nor its content providers are responsible for any damages or losses arising from any use of this information. Past performance does not guarantee future results.
Hennessy Large Cap Financial Fund
AVERAGE ANNUAL TOTAL RETURN PERIODS ENDED APRIL 30, 2013*
| | Six Months | One Year | Five Years | Ten Years |
| Hennessy Large Cap Financial Fund – Investor Class | 16.98% | 19.00% | 4.42% | 5.65% |
| KBW Bank Index | 15.78% | 20.22% | -5.24% | -0.54% |
| S&P 500 Index | 14.42% | 16.89% | 5.21% | 7.88% |
Expense ratio: 1.57%
Performance data quoted represents past performance; past performance does not guarantee future results. The investment return and principal value of an investment will fluctuate so that an investor’s shares, when redeemed, may be worth more or less than their original cost. Current performance of the Fund may be lower or higher than the performance quoted. Performance data current to the most recent month end may be obtained by visiting www.hennessyfunds.com. Performance for periods prior to October 26, 2012 is that of the FBR Large Cap Financial Fund.
The expense ratio presented is that from the most recent prospectus.
*Periods less than one year are not annualized.
PERFORMANCE NARRATIVE
Portfolio Manager, David Ellison, and Co-Portfolio Manager, Ryan Kelley
Over the previous six months, how did the Fund perform and what factors contributed to this performance?
For the six-month period ended April 30, 2013, the Investor Class of the Hennessy Large Cap Financial Fund returned 16.98%, outperforming the KBW Bank Index, the S&P 500 Index and the Morningstar Financial Category Average, which returned 15.78%, 14.42% and 16.88% for the same period, respectively.
The Fund remains concentrated in large domestic financial service companies. Improvement in the housing market, commercial real estate, investment banking, certain areas of securities trading, business loan demand and credit conditions have all contributed to the Fund’s positive performance.
HENNESSY FUNDS 1-800-966-4354
The companies with the strongest performance contribution during the six-month period included those that underperformed during the financial crisis, which began in 2007. They include Blackstone Group, Morgan Stanley and Citicorp.
Companies detracting the most from performance during the period include Discover Financial Services, Capital One Financial and U.S. Bancorp. The first two companies are credit card companies and the last company is a regional bank, all of which are all less leveraged to the improving economy.
Additional Portfolio Manager commentary and related investment outlook:
Overall industry conditions continued to improve during the six-month period ended April 30, 2013. This improvement has been ongoing for the last two years. Balance sheets are being de-levered, de-complicated and de-risked. This process has produced strong balance sheets with the potential for more sustainable growth in book value and earnings going forward. We expect this process to continue as these big balance sheets and cost structures are rationalized.
Valuations among large cap financial companies, as measured by price to book and price to earnings, are currently below historical averages. As near term and longer term concerns abate, we believe valuations will recover to at least historical averages. We have put together a portfolio of companies that we believe will continue to improve and offer much opportunity as the economy recovers.
The KBW Bank Index measures Bank stock performance. The S&P 500 Index is an unmanaged index commonly used to measure the performance of U.S. stocks. You cannot invest directly in an index. Performance data for an index does not reflect any deductions for fees, expenses or taxes. The Fund is non-diversified, meaning it concentrates its assets in fewer holdings that a diversified fund and is therefore more exposed to individual stock volatility than a diversified fund. Investors are focused in the financial services industry, which may be adversely affected by regulatory or other market conditions such as rising interest rates. The Fund invests in small- and medium-capitalization companies, which involves additional risks such as more limited liquidity and greater volatility than large-capitalization companies. References to specific securities should not be considered a recommendation to buy or sell any security. Fund holdings and sector allocations are subject to change. Please refer to the Schedule of Investments included in this report for additional portfolio information.
Book value is the value at which a company carries an asset on its balance sheet. Price to book is a ratio used to compare a stock’s market value to its book value and is calculated by dividing the current closing price of such stock by the most recent quarter’s book value per share of such stock. Price to earnings is a ratio used to compare a stock’s market value to its per-share earnings and is calculated by dividing the current closing price of such stock by the most recent quarter’s earnings per share of such stock.
Each Morningstar category average represents a universe of funds with similar investment objectives. © Morningstar, Inc. All Rights Reserved. The information contained herein: 1) is proprietary to Morningstar; 2) may not be copied or distributed and 3) is not warranted to be accurate, complete or timely. Neither Morningstar nor its content providers are responsible for any damages or losses arising from any use of this information. Past performance does not guarantee future results.
Hennessy Technology Fund
AVERAGE ANNUAL TOTAL RETURN PERIODS ENDED APRIL 30, 2013*
| | Six Months | One Year | Five Years | Ten Years |
| Hennessy Technology Fund – Investor Class | 8.81% | -2.35% | 2.03% | 7.16% |
Hennessy Technology Fund – Institutional Class1 | 8.95% | -2.26% | 2.17% | 7.23% |
| NASDAQ Composite Index | 12.84% | 11.01% | 7.86% | 9.54% |
| S&P 500 Index | 14.42% | 16.89% | 5.21% | 7.88% |
Expense ratio: Gross 3.21%, Net 1.96%2 (Investor Class) | | | Expense ratio: Gross 4.12%, Net 1.71%2 (Institutional Class) |
Performance data quoted represents past performance; past performance does not guarantee future results. The investment return and principal value of an investment will fluctuate so that an investor’s shares, when redeemed, may be worth more or less than their original cost. Current performance of the Fund may be lower or higher than the performance quoted. Performance data current to the most recent month end may be obtained by visiting www.hennessyfunds.com. Performance for periods prior to October 26, 2012 is that of the FBR Technology Fund. Investment performance reflects fee waivers in effect. In the absence of such waivers, total return would be reduced.
The expense ratios presented are from the most recent prospectus.
| * | Periods less than one year are not annualized. |
| 1 | Represents the performance of the Institutional Class shares after March 12, 2010 (inception of the share class) and Investor Class for periods prior to that date. |
| 2 | The investment advisor has contractually agreed to waive a portion of its expenses through February 28, 2015. |
PERFORMANCE NARRATIVE
Portfolio Managers Winsor (Skip) Aylesworth and David Ellison
Over the previous six months, how did the Fund perform and what factors contributed to this performance?
For the six-month period ended April 30, 2013, the Investor Class of the Hennessy Technology Fund returned 8.81%, underperforming the NASDAQ Composite Index, the S&P 500 Index and the Morningstar Technology Category Average, which returned 12.84%, 14.42% and 11.10% for the same period, respectively.
While the Fund’s performance improved over the last reporting period, it still underperformed against its benchmarks. As measured by the Morningstar Category Average, the Technology sector in general underperformed broader-based market indices. The Healthcare, Consumer Cyclical and Financial sectors appeared to draw the most investment interest for the period while the Technology sector seemed to be more on hold as Apple retrenched from its previous performance and seemed to be indicative of most Technology stocks.
Several of the Fund’s holdings had exceptional performance over the period. Two of these are First Solar, Inc. (+92%) and Western Digital Corp. (+59%). First Solar is a fully integrated solar power manufacturer and systems provider and has benefited from the industry shake-out, emerging as a global competitor. Western Digital is a digital storage manufacturer and a leader in external storage devices, with a presence in Cloud Computing. As we become a more digital society, companies like Western Digital should participate in this inherent growth and continue to do well.
Intuitive Surgical Corp., which designs and builds robotic surgical systems, disappointed during the period (-9%). Questions about the firm’s systems have negatively impacted the stock price, although this has not impacted sales. The Fund has been a long term holder in the company and the company was, and continues to be, one of the Fund’s largest holdings. Hence, Intuitive’s negative performance significantly impacted the Fund’s performance during the six-month period.
Additional Portfolio Manager commentary and related investment outlook:
The market seems to be telling us that America is in rebound and we can expect things to continue. Although the Technology sector has temporarily underperformed the overall market, we believe this is just a pause that will reward investors going forward. We believe technology will continue to be one of the major factors in making America competitive and with our prosperity will come our desire for all things technologically advanced. We will continue to invest in companies with a record of growing earnings, profits and book value.
The NASDAQ Composite Index is a broad-based capitalization-weighted index of all the NASDAQ National Market and Small Cap stocks. The S&P 500 Index is an unmanaged index commonly used to measure the performance of U.S. stocks. You cannot invest directly in an index. Performance data for an index does not reflect any deductions for fees, expenses or taxes. The Fund is non-diversified, meaning it concentrates its assets in fewer holdings than a diversified fund and is therefore more exposed to individual stock volatility than a diversified fund. Investments are focused in the technology industry, which may be adversely affected by rapidly changing technology, availability of capital, R&D, government regulation and the relatively high risks of obsolescence caused by scientific and technological advances. Investments in foreign securities may involve greater volatility and political, economic and currency risk and differences in accounting methods. The Fund may invest in IPOs, which may fluctuate considerably due to the absence of a prior public market and may have a magnified impact on the Fund. The Fund invests in small- and medium-capitalization companies, which involves additional risks such as more limited liquidity and greater volatility than large-capitalization companies. References to specific securities should not be considered a recommendation to buy or sell any security. Fund holdings and sector allocations are subject to change. Please refer to the Schedule of Investments included in this report for additional portfolio information.
Each Morningstar category average represents a universe of funds with similar investment objectives. © Morningstar, Inc. All Rights Reserved. The information contained herein: 1) is proprietary to Morningstar; 2) may not be copied or distributed and 3) is not warranted to be accurate, complete or timely. Neither Morningstar nor its content providers are responsible for any damages or losses arising from any use of this information. Past performance does not guarantee future results.
Hennessy Japan Fund
AVERAGE ANNUAL TOTAL RETURN PERIODS ENDED APRIL 30, 2013*
| | | | | Since Inception |
| | Six Months | One Year | Five Years | (10/31/03) |
| Hennessy Japan Fund – Investor Class | 19.75% | 22.70% | 4.74% | 7.76% |
| Hennessy Japan Fund – Institutional Class | 19.85% | 22.92% | 4.91% | 7.92% |
| Russell/Nomura Total Market Index | 28.94% | 21.92% | 0.35% | 4.31% |
| Tokyo Price Index (TOPIX) | 29.84% | 22.00% | 0.25% | 4.05% |
| Expense ratio: 2.04% (Investor Class) | | | Expense ratio: 1.86% (Institutional Class) |
Performance data quoted represents past performance; past performance does not guarantee future results. The investment return and principal value of an investment will fluctuate so that an investor’s shares, when redeemed, may be worth more or less than their original cost. Current performance of the Fund may be lower or higher than the performance quoted. Performance data current to the most recent month end may be obtained by visiting www.hennessyfunds.com.
The expense ratios presented are from the most recent prospectus.
*Periods less than one year are not annualized.
HENNESSY FUNDS 1-800-966-4354
PERFORMANCE NARRATIVE
SPARX ASSET MANAGEMENT CO., LTD., SUB-ADVISOR
Portfolio Managers Masakazu Takeda, CMA, and Yu Shimizu, CMA, SPARX Asset Management Company, Ltd. (sub-advisor)
Over the previous six months, how did the Fund perform and what factors contributed to this performance?
For the six-month period ended April 30, 2013, the Investor Class of the Hennessy Japan Fund returned 19.75%, underperforming the Russell/Nomura Total Market Index, the Tokyo Price Index (TOPIX) and the Morningstar Japan Category Average, which returned 28.94%, 29.84% and 37.49% for the same period, respectively.
The largest positive contributors to the Fund’s performance among the TOPIX 33 sub-industries were miscellaneous manufacturers, transportation equipment firms and retailers. Conversely, there were no major sectors that performed negatively during the same period.
Among the strongest performing stocks during the six-month period ended April 30, 2013 were Ryohin Keikaku Co., Ltd., the operator of the “MUJI” brand retail chain, Pigeon Corporation, a manufacturer of baby care goods, and Misumi Group Inc., Japan’s distinct precision machinery parts distributor. Shares of Ryohin Keikaku jumped +74% following the positive release of its full year earnings results for its 2012 fiscal year, which ended in February 2013. Shares of Pigeon climbed +127% due to positive full year earnings results for fiscal year 2012, which ended in January 2013. Finally, shares of Misumi surged +52% as investors’ risk appetite returned amid expectations for monetary easing in Japan, as well as its positive release of monthly sales figures.
Conversely, there were no major detractors that negatively affected the Fund’s performance during the period.
Additional Portfolio Manager commentary and related investment outlook:
Going forward, we will continue to increase our exposure to companies with a distinct manufacturing edge, high quality craftsmanship or energy-efficient technologies that may benefit from growing developing countries, such as China. We will also continue to favor general trading firms that span those technologies to emerging nations.
The Russell/Nomura Total Market Index contains the top 98% of all stocks listed on Japan’s stock exchange and registered on Japan’s OTC market in terms of market capitalization. The Tokyo Price Index (TOPIX) is a market capitalization-weighted index of all companies listed on the First Section of the Tokyo Stock Exchange. The Russell/Nomura Total Market and TOPIX indices are presented in U.S. dollar terms and take into account reinvestment of dividends. You cannot invest directly in an index. Performance data for an index does not reflect any deductions for fees, expenses or taxes. The Fund may invest in small- and medium-capitalization companies, which involves additional risks such as more limited liquidity and more volatility than large-capitalization companies. Investments in foreign securities involve greater volatility and political, economic and currency risk and differences in accounting methods. The Fund may invest in IPOs, which may fluctuate considerably due to the absence of a prior public market and may have a magnified impact on the Fund. References to specific securities should not be considered a recommendation to buy or sell any security. Fund holdings and sector allocations are subject to change. Please refer to the Schedule of Investments included in this report for additional portfolio information.
Each Morningstar category average represents a universe of funds with similar investment objectives. © Morningstar, Inc. All Rights Reserved. The information contained herein: 1) is proprietary to Morningstar; 2) may not be copied or distributed and 3) is not warranted to be accurate, complete or timely. Neither Morningstar nor its content providers are responsible for any damages or losses arising from any use of this information. Past performance does not guarantee future results.
Hennessy Japan Small Cap Fund
AVERAGE ANNUAL TOTAL RETURN PERIODS ENDED APRIL 30, 2013
| | | | | Since Inception |
| | Six Months | One Year | Five Years | (8/31/07) |
| Hennessy Japan Small Cap Fund – Investor Class | 36.03% | 27.22% | 7.60% | 7.66% |
| Russell/Nomura Small Cap Index | 28.44% | 22.29% | 5.90% | 3.91% |
| Tokyo Price Index (TOPIX) | 29.84% | 22.00% | 0.25% | -0.66% |
Expense ratio: 2.34%
Performance data quoted represents past performance; past performance does not guarantee future results. The investment return and principal value of an investment will fluctuate so that an investor’s shares, when redeemed, may be worth more or less than their original cost. Current performance of the Fund may be lower or higher than the performance quoted. Performance data current to the most recent month end may be obtained by visiting www.hennessyfunds.com.
The expense ratio presented is from the most recent prospectus.
PERFORMANCE NARRATIVE
SPARX ASSET MANAGEMENT CO., LTD., SUB-ADVISOR
Portfolio Managers Tadahiro Fujimura, CFA and CMA, and Hidehiro Moriya, SPARX Asset Management Company, Ltd. (sub-advisor)
Over the previous six months, how did the Fund perform and what factors contributed to this performance?
For the six-month period ended April 30, 2013, the Hennessy Japan Small Cap Fund returned 36.03%, outperforming the Russell/Nomura Japan Small Cap Index and the Tokyo Price Index (TOPIX), which returned 28.44% and 29.84% for the same period, respectively, but underperformed the Morningstar Japan Category Average, which returned 37.49% for the same period.
The largest positive contributors to the Fund’s performance among the TOPIX 33 sub-industries were service industry firms, electronic appliance makers and other financial businesses. Conversely, there were no major sectors that performed negatively during the same period.
Among the strongest performing stocks during the six-month period ended April 30, 2013 were Kenedix, Inc., a Japanese real estate investment asset manager, NEC Capital Solutions, Ltd., a financial services and leasing company for computer-related items, and Seiko Holdings Corporation, one of Japan’s leading watchmakers. Shares of Kenedix and NEC Capital Solutions advanced 581% and 221%, respectively. Both names surged, particularly since March, when financial and property-related companies performed very well due to aggressive monetary easing policy by the Bank of Japan. We also believe that the stock price of NEC Capital Solutions surged on optimism that its consolidated subsidiary, Risa Partners, a real estate fund operator, will grow its earning. Finally, shares of Seiko Holdings advanced 172% on the back of expectations that the value of the company’s real estate holdings will increase. The Fund no longer holds these stocks in its portfolio.
Conversely, there were no major detractors that negatively affected the Fund’s performance during the period.
Additional Portfolio Manager commentary and related investment outlook:
Our investment strategy is to reduce the Fund’s exposure to companies that have risen rapidly to potentially limit downside risk and replace those names with companies whose future earnings, we believe, will exceed market expectations. In particular, we will focus on underperforming industries, such as manufacturers that have their production facilities in Japan. We do not anticipate increasing positions in auto related companies, retailers or real estate companies, which all have already experienced growing expectations. As for small-cap stocks, funds have been flowing into some bio-tech and internet related stocks, and we think that it can flow into other stocks in the same industries. Overall, liquidity has also improved. As a result, we intend to actively add small-cap stocks to the Fund’s portfolio that we believe have been overlooked by investors.
The Russell/Nomura Small Cap Index contains the bottom 15% of the Russell/Nomura Total Market Index, which contains the top 98% of all stocks listed on Japan’s stock exchange and registered on Japan’s OTC market in terms of market capitalization. The Tokyo Price Index (TOPIX) is a market capitalization-weighted index of all companies listed on the First Section of the Tokyo Stock Exchange. The Russell/Nomura Small Cap and TOPIX indices are presented in U.S. dollar terms and take into account reinvestment of dividends. You cannot invest directly in an index. Performance data for an index does not reflect any deductions for fees, expenses or taxes. The Fund invests in small- and medium-capitalization companies, which involves additional risks such as more limited liquidity and greater price volatility than large-capitalization companies. Investments in foreign securities involve greater volatility and political, economic and currency risk and differences in accounting methods. References to specific securities should not be considered a recommendation to buy or sell any security. Fund holdings and sector allocations are subject to change. Please refer to the Schedule of Investments included in this report for additional portfolio information.
Each Morningstar category average represents a universe of funds with similar investment objectives. © Morningstar, Inc. All Rights Reserved. The information contained herein: 1) is proprietary to Morningstar; 2) may not be copied or distributed and 3) is not warranted to be accurate, complete or timely. Neither Morningstar nor its content providers are responsible for any damages or losses arising from any use of this information. Past performance does not guarantee future results.
HENNESSY FUNDS 1-800-966-4354
Schedule of Investments
HENNESSY CORNERSTONE GROWTH FUND
As of April 30, 2013 (Unaudited)
(% of Net Assets)
| | TOP TEN EQUITY HOLDINGS | % net assets |
| | Cabelas, Inc. | 2.61% |
| | Hertz Global Holdings, Inc. | 2.42% |
| | Avis Budget Group, Inc. | 2.37% |
| | Fifth & Pacific Companies, Inc. | 2.36% |
| | Delta Air Lines, Inc. | 2.32% |
| | Lithia Motors, Inc. | 2.27% |
| | Papa Johns International, Inc. | 2.24% |
| | Jarden Corp. | 2.20% |
| | Worthington Industries, Inc. | 2.17% |
| | DXP Enterprises, Inc. | 2.17% |
Note: For presentation purposes, the Fund has grouped some of the industry categories. For purposes of categorizing securities for compliance with Section 8(b)(1) of the Investment Company Act of 1940, the Fund uses more specific industry classifications.
| | COMMON STOCKS – 95.31% | | Number | | | | | | % of | |
| | | | of Shares | | | Value | | | Net Assets | |
| | Consumer Discretionary – 29.15% | | | | | | | | | |
| | Brunswick Corp. | | | 168,300 | | | $ | 5,328,378 | | | | 1.71 | % |
| | Cabelas, Inc. (a) | | | 126,800 | | | | 8,140,560 | | | | 2.61 | % |
| | DineEquity, Inc. | | | 81,100 | | | | 5,777,564 | | | | 1.85 | % |
| | Drew Industries, Inc. | | | 159,000 | | | | 5,739,900 | | | | 1.84 | % |
| | Fifth & Pacific Companies, Inc. (a) | | | 358,100 | | | | 7,384,022 | | | | 2.36 | % |
| | Jarden Corp. (a) | | | 152,900 | | | | 6,882,029 | | | | 2.20 | % |
| | Lithia Motors, Inc. | | | 143,300 | | | | 7,096,216 | | | | 2.27 | % |
| | Lowes Companies, Inc. | | | 156,300 | | | | 6,005,046 | | | | 1.92 | % |
| | Mohawk Industries, Inc. (a) | | | 56,700 | | | | 6,286,896 | | | | 2.01 | % |
| | Papa Johns International, Inc. (a) | | | 110,900 | | | | 6,986,700 | | | | 2.24 | % |
| | Pier 1 Imports, Inc. | | | 271,800 | | | | 6,308,478 | | | | 2.02 | % |
| | PVH Corp. | | | 50,900 | | | | 5,874,369 | | | | 1.88 | % |
| | Service Corp International | | | 389,300 | | | | 6,571,384 | | | | 2.11 | % |
| | The Home Depot, Inc. | | | 90,600 | | | | 6,645,510 | | | | 2.13 | % |
| | | | | | | | | 91,027,052 | | | | 29.15 | % |
| | | | | | | | | | | | | | |
| | Energy – 2.05% | | | | | | | | | | | | |
| | Targa Resources Corp. | | | 97,500 | | | | 6,411,600 | | | | 2.05 | % |
| | | | | | | | | | | | | | |
| | Financials – 6.15% | | | | | | | | | | | | |
| | American International Group, Inc. (a) | | | 159,500 | | | | 6,606,490 | | | | 2.12 | % |
| | Fidelity National Financial, Inc. – Class A | | | 236,600 | | | | 6,352,710 | | | | 2.03 | % |
| | Stewart Information Services Corp. | | | 231,300 | | | | 6,261,291 | | | | 2.00 | % |
| | | | | | | | | 19,220,491 | | | | 6.15 | % |
| | | | | | | | | | | | | | |
| | Health Care – 7.84% | | | | | | | | | | | | |
| | Brookdale Senior Living, Inc. (a) | | | 214,100 | | | | 5,521,639 | | | | 1.77 | % |
| | Catamaran Corp. (a)(b) | | | 114,000 | | | | 6,581,220 | | | | 2.11 | % |
| | CIGNA Corp. | | | 100,100 | | | | 6,623,617 | | | | 2.12 | % |
| | MWI Veterinary Supply, Inc. (a) | | | 48,900 | | | | 5,756,019 | | | | 1.84 | % |
| | | | | | | | | 24,482,495 | | | | 7.84 | % |
| | | | | | | | | | | | | | |
| | Industrials – 40.75% | | | | | | | | | | | | |
| | American Woodmark Corp. (a) | | | 192,600 | | | | 6,480,990 | | | | 2.08 | % |
| | Apogee Enterprises, Inc. | | | 244,437 | | | | 6,228,255 | | | | 1.99 | % |
| | Avery Dennison Corp. | | | 153,000 | | | | 6,341,850 | | | | 2.03 | % |
| | Avis Budget Group, Inc. (a) | | | 256,500 | | | | 7,397,460 | | | | 2.37 | % |
| | Beacon Roofing Supply, Inc. (a) | | | 159,000 | | | | 6,062,670 | | | | 1.94 | % |
| | Carlisle Companies, Inc. | | | 90,000 | | | | 5,838,300 | | | | 1.87 | % |
| | Celadon Group, Inc. | | | 295,300 | | | | 4,958,087 | | | | 1.59 | % |
| | Delta Air Lines, Inc. (a) | | | 423,300 | | | | 7,255,362 | | | | 2.32 | % |
| | DXP Enterprises, Inc. (a) | | | 101,400 | | | | 6,781,632 | | | | 2.17 | % |
| | Emcor Group, Inc. | | | 159,400 | | | | 5,961,560 | | | | 1.91 | % |
| | Hertz Global Holdings, Inc. (a) | | | 313,500 | | | | 7,549,080 | | | | 2.42 | % |
| | Innerworkings, Inc. (a) | | | 442,565 | | | | 4,456,629 | | | | 1.43 | % |
| | Lennox International, Inc. | | | 103,000 | | | | 6,386,000 | | | | 2.05 | % |
| | Steelcase, Inc. | | | 458,500 | | | | 5,822,950 | | | | 1.86 | % |
| | Team, Inc. (a) | | | 135,900 | | | | 5,267,484 | | | | 1.69 | % |
| | Terex Corp. (a) | | | 175,100 | | | | 5,007,860 | | | | 1.60 | % |
| | Toro Co. | | | 133,500 | | | | 6,008,835 | | | | 1.92 | % |
| | Trimas Corp. (a) | | | 196,500 | | | | 5,993,250 | | | | 1.92 | % |
| | UniFirst Corp. | | | 72,700 | | | | 6,619,335 | | | | 2.12 | % |
| | USG Corp. (a) | | | 200,900 | | | | 5,221,391 | | | | 1.67 | % |
| | Valmont Industries, Inc. | | | 38,500 | | | | 5,610,605 | | | | 1.80 | % |
| | | | | | | | | 127,249,585 | | | | 40.75 | % |
| | | | | | | | | | | | | | |
| | Materials – 9.37% | | | | | | | | | | | | |
| | A Schulman, Inc. | | | 190,400 | | | | 4,944,688 | | | | 1.58 | % |
| | Axiall Corp. | | | 102,800 | | | | 5,391,860 | | | | 1.73 | % |
| | Innospec, Inc. | | | 148,700 | | | | 6,544,287 | | | | 2.10 | % |
| | Stepan Co. | | | 98,100 | | | | 5,585,814 | | | | 1.79 | % |
| | Worthington Industries, Inc. | | | 211,000 | | | | 6,789,980 | | | | 2.17 | % |
| | | | | | | | | 29,256,629 | | | | 9.37 | % |
| | Total Common Stocks | | | | | | | | | | | | |
| | (Cost $278,799,857) | | | | | | | 297,647,852 | | | | 95.31 | % |
| | | | | | | | | | | | | | |
| | RIGHTS – 0.00% | | | | | | | | | | | | |
| | Forest Laboratories, Inc. (a)(c) | | | 5,500 | | | | 5,225 | | | | 0.00 | % |
| | | | | | | | | | | | | | |
| | Total Rights | | | | | | | | | | | | |
| | (Cost $0) | | | | | | | 5,225 | | | | 0.00 | % |
| | | | | | | | | | | | | | |
| | PARTNERSHIPS – 4.16% | | | | | | | | | | | | |
| | | | | | | | | | | | | | |
| | Energy – 4.16% | | | | | | | | | | | | |
| | Calumet Specialty Products Partners L.P. | | | 169,200 | | | | 6,388,992 | | | | 2.05 | % |
| | Genesis Energy L.P. | | | 137,100 | | | | 6,590,397 | | | | 2.11 | % |
| | | | | | | | | | | | | | |
| | Total Partnerships | | | | | | | | | | | | |
| | (Cost $11,608,716) | | | | | | | 12,979,389 | | | | 4.16 | % |
The accompanying notes are an integral part of these financial statements.
HENNESSY FUNDS 1-800-966-4354
| | SHORT-TERM INVESTMENTS – 0.97% | | Number | | | | | | % of | |
| | | | of Shares | | | Value | | | Net Assets | |
| | Money Market Funds – 0.97% | | | | | | | | | |
| | Fidelity Government Portfolio – | | | | | | | | | |
| | Institutional Class, 0.01% (d) | | | 3,016,423 | | | $ | 3,016,423 | | | | 0.97 | % |
| | | | | | | | | | | | | | |
| | Total Money Market Funds | | | | | | | | | | | | |
| | (Cost $3,016,423) | | | | | | | 3,016,423 | | | | 0.97 | % |
| | | | | | | | | | | | | | |
| | Total Short-Term Investments | | | | | | | | | | | | |
| | (Cost $3,016,423) | | | | | | | 3,016,423 | | | | 0.97 | % |
| | | | | | | | | | | | | | |
| | Total Investments | | | | | | | | | | | | |
| | (Cost $293,424,996) – 100.44% | | | | | | | 313,648,889 | | | | 100.44 | % |
| | | | | | | | | | | | | | |
| | Liabilities in Excess of | | | | | | | | | | | | |
| | Other Assets – (0.44)% | | | | | | | (1,367,754 | ) | | | (0.44 | )% |
| | TOTAL NET ASSETS – 100.00% | | | | | | $ | 312,281,135 | | | | 100.00 | % |
Percentages are stated as a percent of net assets.
| | (a) | Non-income producing security. |
| | (b) | U.S. traded security of a foreign corporation. |
| | (c) | Security is fair valued. |
| | (d) | The rate listed is the fund’s 7-day yield as of April 30, 2013. |
The accompanying notes are an integral part of these financial statements.
Summary of Fair Value Exposure at April 30, 2013
The following is a summary of the inputs used to value the Fund’s net assets as of April 30, 2013 (See Note 3 in the accompanying notes to the financial statements):
| | Common Stock | | Level 1 | | | Level 2 | | | Level 3 | | | Total | |
| | Consumer Discretionary | | $ | 91,027,052 | | | $ | — | | | $ | — | | | $ | 91,027,052 | |
| | Energy | | | 6,411,600 | | | | — | | | | — | | | | 6,411,600 | |
| | Financials | | | 19,220,491 | | | | — | | | | — | | | | 19,220,491 | |
| | Health Care | | | 24,482,495 | | | | — | | | | — | | | | 24,482,495 | |
| | Industrials | | | 127,249,585 | | | | — | | | | — | | | | 127,249,585 | |
| | Materials | | | 29,256,629 | | | | — | | | | — | | | | 29,256,629 | |
| | Total Common Stock | | $ | 297,647,852 | | | $ | — | | | $ | — | | | $ | 297,647,852 | |
| | Rights | | $ | — | | | $ | — | | | $ | 5,225 | * | | $ | 5,225 | |
| | Partnerships | | | | | | | | | | | | | | | | |
| | Energy | | $ | 12,979,389 | | | $ | — | | | $ | — | | | $ | 12,979,389 | |
| | Total Partnerships | | $ | 12,979,389 | | | $ | — | | | $ | — | | | $ | 12,979,389 | |
| | Short-Term Investments | | | | | | | | | | | | | | | | |
| | Money Market Funds | | $ | 3,016,423 | | | $ | — | | | $ | — | | | $ | 3,016,423 | |
| | Total Short-Term Investments | | $ | 3,016,423 | | | $ | — | | | $ | — | | | $ | 3,016,423 | |
| | Total Investments in Securities | | $ | 313,643,664 | | | $ | — | | | $ | 5,225 | | | $ | 313,648,889 | |
Transfers between levels are recognized at the end of the reporting period. During the six-month period ended April 30, 2013, the Fund recognized no transfers between levels.
Level 3 Reconciliation Disclosure
Following is a reconciliation of level 3 assets for which significant unobservable inputs were used to determine fair value.
| | | | Rights | | |
| | Balance as of October 31, 2012 | | $ | 5,225 | | |
| | Accrued discounts/premiums | | | — | | |
| | Realized gain (loss) | | | — | | |
| | Change in unrealized appreciation (depreciation) | | | — | | |
| | Purchases | | | — | | |
| | (Sales) | | | — | | |
| | Transfer in and/or out of Level 3 | | | — | | |
| | Balance as of April 30, 2013 | | $ | 5,225 | | |
| | Net in unrealized appreciation/depreciation during | | | | | |
| | the year for level 3 investments held at April 30, 2013 | | $ | 5,225 | | |
* Acquired in merger.
The accompanying notes are an integral part of these financial statements.
HENNESSY FUNDS 1-800-966-4354
HENNESSY FOCUS FUND
As of April 30, 2013 (Unaudited)
(% of Net Assets)
| | TOP TEN EQUITY HOLDINGS | % net assets |
| | American Tower Corp. | 9.48% |
| | CarMax, Inc. | 9.25% |
| | Penn National Gaming, Inc. | 8.91% |
| | O’Reilly Automotive, Inc. | 8.56% |
| | Markel Corp. | 8.00% |
| | Bally Technologies, Inc. | 6.81% |
| | News Corp. | 6.38% |
| | Google, Inc. | 5.18% |
| | Aon PLC | 4.98% |
| | World Fuel Services Corp. | 3.81% |
Note: For presentation purposes, the Fund has grouped some of the industry categories. For purposes of categorizing securities for compliance with Section 8(b)(1) of the Investment Company Act of 1940, the Fund uses more specific industry classifications.
| | COMMON STOCKS – 85.74% | | Number | | | | | | % of | |
| | | | of Shares | | | Value | | | Net Assets | |
| | Consumer Discretionary – 43.68% | | | | | | | | | |
| | Bally Technologies, Inc. (a) | | | 1,169,000 | | | $ | 62,284,320 | | | | 6.81 | % |
| | CarMax, Inc. (a) | | | 1,840,088 | | | | 84,717,652 | | | | 9.25 | % |
| | Dick’s Sporting Goods, Inc. | | | 105,000 | | | | 5,050,500 | | | | 0.55 | % |
| | Lamar Advertising Co., Class A (a) | | | 630,000 | | | | 29,496,600 | | | | 3.22 | % |
| | News Corp., Class A | | | 1,886,000 | | | | 58,409,420 | | | | 6.38 | % |
| | O’Reilly Automotive, Inc. (a) | | | 730,000 | | | | 78,343,600 | | | | 8.56 | % |
| | Penn National Gaming, Inc. (a) | | | 1,393,670 | | | | 81,599,378 | | | | 8.91 | % |
| | | | | | | | | 399,901,470 | | | | 43.68 | % |
| | | | | | | | | | | | | | |
| | Energy – 3.81% | | | | | | | | | | | | |
| | World Fuel Services Corp. | | | 859,150 | | | | 34,838,532 | | | | 3.81 | % |
| | | | | | | | | | | | | | |
| | Financials – 21.90% | | | | | | | | | | | | |
| | Aon PLC (b) | | | 755,000 | | | | 45,564,250 | | | | 4.98 | % |
| | Diamond Hill Investment Group, Inc. | | | 83,945 | | | | 6,336,588 | | | | 0.69 | % |
| | Encore Capital Group, Inc. (a) | | | 739,573 | | | | 21,070,435 | | | | 2.30 | % |
| | Markel Corp. (a) | | | 136,640 | | | | 73,273,200 | | | | 8.00 | % |
| | Marlin Business Services Corp. | | | 454,839 | | | | 11,020,749 | | | | 1.20 | % |
| | T. Rowe Price Group, Inc. | | | 125,000 | | | | 9,062,500 | | | | 0.99 | % |
| | The Charles Schwab Corp. | | | 2,017,000 | | | | 34,208,320 | | | | 3.74 | % |
| | | | | | | | | 200,536,042 | | | | 21.90 | % |
| | | | | | | | | | | | | | |
| | Health Care – 1.78% | | | | | | | | | | | | |
| | Henry Schein, Inc. (a) | | | 180,000 | | | | 16,272,000 | | | | 1.78 | % |
| | | | | | | | | | | | | | |
| | Industrials – 8.19% | | | | | | | | | | | | |
| | American Woodmark Corp. (a) | | | 680,160 | | | | 22,887,384 | | | | 2.50 | % |
| | Roadrunner Transportation | | | | | | | | | | | | |
| | Systems, Inc. (a) | | | 904,200 | | | | 20,353,542 | | | | 2.22 | % |
| | Simpson Manufacturing Company, Inc. | | | 850,000 | | | | 24,429,000 | | | | 2.67 | % |
| | UTi Worldwide, Inc. (b) | | | 500,000 | | | | 7,345,000 | | | | 0.80 | % |
| | | | | | | | | 75,014,926 | | | | 8.19 | % |
| | | | | | | | | | | | | | |
| | Information Technology – 6.38% | | | | | | | | | | | | |
| | Google, Inc., Class A (a) | | | 57,500 | | | | 47,412,775 | | | | 5.18 | % |
| | MICROS Systems, Inc. (a) | | | 259,800 | | | | 11,018,118 | | | | 1.20 | % |
| | | | | | | | | 58,430,893 | | | | 6.38 | % |
| | Total Common Stocks | | | | | | | | | | | | |
| | (Cost $380,000,257) | | | | | | | 784,993,863 | | | | 85.74 | % |
| | | | | | | | | | | | | | |
| | REITS – 9.48% | | | | | | | | | | | | |
| | | | | | | | | | | | | | |
| | Financials – 9.48% | | | | | | | | | | | | |
| | American Tower Corp., Class A | | | 1,034,000 | | | | 86,845,660 | | | | 9.48 | % |
| | | | | | | | | | | | | | |
| | Total Reits | | | | | | | | | | | | |
| | (Cost $5,433,992) | | | | | | | 86,845,660 | | | | 9.48 | % |
| | | | | | | | | | | | | | |
| | SHORT-TERM INVESTMENTS – 4.66% | | | | | | | | | | | | |
| | | | | | | | | | | | | | |
| | Money Market Funds – 4.66% | | | | | | | | | | | | |
| | Fidelity Government Portfolio – | | | | | | | | | | | | |
| | Institutional Class, 0.01 (c) | | | 42,651,597 | | | $ | 42,651,597 | | | | 4.66 | % |
| | | | | | | | | | | | | | |
| | Total Money Market Funds | | | | | | | | | | | | |
| | (Cost $42,651,597) | | | | | | | 42,651,597 | | | | 4.66 | % |
| | | | | | | | | | | | | | |
| | Total Short-Term Investments | | | | | | | | | | | | |
| | (Cost $42,651,597) | | | | | | | 42,651,597 | | | | 4.66 | % |
| | | | | | | | | | | | | | |
| | Total Investments | | | | | | | | | | | | |
| | (Cost $428,085,846) – 99.88% | | | | | | | 914,491,120 | | | | 99.88 | % |
| | | | | | | | | | | | | | |
| | Other Assets in Excess | | | | | | | | | | | | |
| | of Liabilities – 0.12% | | | | | | | 1,059,397 | | | | 0.12 | % |
| | TOTAL NET ASSETS – 100.00% | | | | | | $ | 915,550,517 | | | | 100.00 | % |
Percentages are stated as a percent of net assets.
| | (a) | Non-income producing security. |
| | (b) | U.S. traded security of a foreign corporation. |
| | (c) | The rate listed is the fund’s 7-day yield as of April 30, 2013. |
The accompanying notes are an integral part of these financial statements.
HENNESSY FUNDS 1-800-966-4354
Summary of Fair Value Exposure at April 30, 2013
The following is a summary of the inputs used to value the Fund’s net assets as of April 30, 2013 (See Note 3 in the accompanying notes to the financial statements):
| | Common Stock | | Level 1 | | | Level 2 | | | Level 3 | | | Total | |
| | Consumer Discretionary | | $ | 399,901,470 | | | $ | — | | | $ | — | | | $ | 399,901,470 | |
| | Energy | | | 34,838,532 | | | | — | | | | — | | | | 34,838,532 | |
| | Financials | | | 200,536,042 | | | | — | | | | — | | | | 200,536,042 | |
| | Health Care | | | 16,272,000 | | | | — | | | | — | | | | 16,272,000 | |
| | Industrials | | | 75,014,926 | | | | — | | | | — | | | | 75,014,926 | |
| | Information Technology | | | 58,430,893 | | | | — | | | | — | | | | 58,430,893 | |
| | Total Common Stock | | $ | 784,993,863 | | | $ | — | | | $ | — | | | $ | 784,993,863 | |
| | REITS | | | | | | | | | | | | | | | | |
| | Financials | | $ | 86,845,660 | | | $ | — | | | $ | — | | | $ | 86,845,660 | |
| | Total REITS | | $ | 86,845,660 | | | $ | — | | | $ | — | | | $ | 86,845,660 | |
| | Short-Term Investments | | | | | | | | | | | | | | | | |
| | Money Market Funds | | $ | 42,651,597 | | | $ | — | | | $ | — | | | $ | 42,651,597 | |
| | Total Short-Term Investments | | $ | 42,651,597 | | | $ | — | | | $ | — | | | $ | 42,651,597 | |
| | Total Investments in Securities | | $ | 914,491,120 | | | $ | — | | | $ | — | | | $ | 914,491,120 | |
Transfers between levels are recognized at the end of the reporting period. During the six-month period ended April 30, 2013, the Fund recognized no transfers between levels.
The accompanying notes are an integral part of these financial statements.
HENNESSY CORNERSTONE MID CAP 30 FUND
As of April 30, 2013 (Unaudited)
(% of Net Assets)
| | TOP TEN EQUITY HOLDINGS | % net assets |
| | The Geo Group, Inc. | 4.33% |
| | KB Home | 3.83% |
| | Parexel International Corp. | 3.79% |
| | Axiall Corp. | 3.72% |
| | Jarden Corp. | 3.70% |
| | Standard Pacific Corp. | 3.69% |
| | Exterran Holdings, Inc. | 3.63% |
| | Meritage Homes Corp. | 3.61% |
| | US Airways Group, Inc. | 3.58% |
| | Mohawk Industries, Inc. | 3.56% |
Note: For presentation purposes, the Fund has grouped some of the industry categories. For purposes of categorizing securities for compliance with Section 8(b)(1) of the Investment Company Act of 1940, the Fund uses more specific industry classifications.
HENNESSY FUNDS 1-800-966-4354
| | COMMON STOCKS – 92.97% | | Number | | | | | | % of | |
| | | | of Shares | | | Value | | | Net Assets | |
| | Consumer Discretionary – 38.42% | | | | | | | | | |
| | Chico’s FAS, Inc. | | | 310,200 | | | $ | 5,667,354 | | | | 2.70 | % |
| | Cooper Tire and Rubber Co. | | | 245,900 | | | | 6,120,451 | | | | 2.91 | % |
| | Dillards, Inc. | | | 68,900 | | | | 5,678,049 | | | | 2.70 | % |
| | Jarden Corp. (a) | | | 172,750 | | | | 7,775,478 | | | | 3.70 | % |
| | KB Home | | | 356,400 | | | | 8,033,256 | | | | 3.83 | % |
| | Meritage Homes Corp. (a) | | | 155,500 | | | | 7,586,845 | | | | 3.61 | % |
| | Mohawk Industries, Inc. (a) | | | 67,400 | | | | 7,473,312 | | | | 3.56 | % |
| | Pier 1 Imports, Inc. | | | 289,500 | | | | 6,719,295 | | | | 3.20 | % |
| | PVH Corp. | | | 52,500 | | | | 6,059,025 | | | | 2.89 | % |
| | Standard Pacific Corp. (a) | | | 857,000 | | | | 7,755,850 | | | | 3.69 | % |
| | Thor Industries, Inc. | | | 135,800 | | | | 5,036,822 | | | | 2.40 | % |
| | Whirlpool Corp. | | | 59,400 | | | | 6,788,232 | | | | 3.23 | % |
| | | | | | | | | 80,693,969 | | | | 38.42 | % |
| | | | | | | | | | | | | | |
| | Energy – 7.00% | | | | | | | | | | | | |
| | Exterran Holdings, Inc. (a) | | | 288,900 | | | | 7,632,738 | | | | 3.63 | % |
| | HollyFrontier Corp. | | | 143,000 | | | | 7,071,350 | | | | 3.37 | % |
| | | | | | | | | 14,704,088 | | | | 7.00 | % |
| | | | | | | | | | | | | | |
| | Financials – 7.53% | | | | | | | | | | | | |
| | First American Corp. | | | 251,000 | | | | 6,719,270 | | | | 3.20 | % |
| | The Geo Group, Inc. | | | 242,793 | | | | 9,092,598 | | | | 4.33 | % |
| | | | | | | | | 15,811,868 | | | | 7.53 | % |
| | | | | | | | | | | | | | |
| | Health Care – 3.79% | | | | | | | | | | | | |
| | Parexel International Corp. (a) | | | 194,200 | | | | 7,952,490 | | | | 3.79 | % |
| | | | | | | | | | | | | | |
| | Industrials – 22.71% | | | | | | | | | | | | |
| | A.O. Smith Corp. | | | 97,100 | | | | 7,324,253 | | | | 3.49 | % |
| | Beacon Roofing Supply, Inc. (a) | | | 185,300 | | | | 7,065,489 | | | | 3.36 | % |
| | Masco Corp. | | | 368,700 | | | | 7,167,528 | | | | 3.41 | % |
| | Snap-On, Inc. | | | 75,100 | | | | 6,473,620 | | | | 3.08 | % |
| | US Airways Group, Inc. (a) | | | 444,300 | | | | 7,508,670 | | | | 3.58 | % |
| | USG Corp. (a) | | | 221,500 | | | | 5,756,785 | | | | 2.74 | % |
| | Valmont Industries, Inc. | | | 43,900 | | | | 6,397,547 | | | | 3.05 | % |
| | | | | | | | | 47,693,892 | | | | 22.71 | % |
| | | | | | | | | | | | | | |
| | Materials – 13.52% | | | | | | | | | | | | |
| | Axiall Corp. | | | 149,100 | | | | 7,820,295 | | | | 3.72 | % |
| | Chemtura Corp. (a) | | | 334,900 | | | | 7,119,974 | | | | 3.39 | % |
| | Huntsman Corp. | | | 346,200 | | | | 6,529,332 | | | | 3.11 | % |
| | W.R. Grace & Co. (a) | | | 89,900 | | | | 6,932,189 | | | | 3.30 | % |
| | | | | | | | | 28,401,790 | | | | 13.52 | % |
| | Total Common Stocks | | | | | | | | | | | | |
| | (Cost $165,339,397) | | | | | | | 195,258,097 | | | | 92.97 | % |
| | | | | | | | | | | | | | |
| | PARTNERSHIPS – 3.36% | | | | | | | | | | | | |
| | | | | | | | | | | | | | |
| | Energy – 3.36% | | | | | | | | | | | | |
| | Calumet Specialty Products Partners L.P. | | | 186,800 | | | $ | 7,053,568 | | | | 3.36 | % |
| | | | | | | | | | | | | | |
| | Total Partnerships | | | | | | | | | | | | |
| | (Cost $5,766,860) | | | | | | | 7,053,568 | | | | 3.36 | % |
| | | | | | | | | | | | | | |
| | SHORT-TERM INVESTMENTS – 3.51% | | | | | | | | | | | | |
| | | | | | | | | | | | | | |
| | Money Market Funds – 3.51% | | | | | | | | | | | | |
| | Fidelity Government Portfolio – | | | | | | | | | | | | |
| | Institutional Class, 0.01% (b) | | | 7,378,209 | | | | 7,378,209 | | | | 3.51 | % |
| | | | | | | | | | | | | | |
| | Total Money Market Funds | | | | | | | | | | | | |
| | (Cost $7,378,209) | | | | | | | 7,378,209 | | | | 3.51 | % |
| | | | | | | | | | | | | | |
| | Total Short-Term Investments | | | | | | | | | | | | |
| | (Cost $7,378,209) | | | | | | | 7,378,209 | | | | 3.51 | % |
| | | | | | | | | | | | | | |
| | Total Investments | | | | | | | | | | | | |
| | (Cost $178,484,466) – 99.84% | | | | | | | 209,689,874 | | | | 99.84 | % |
| | | | | | | | | | | | | | |
| | Other Assets in Excess | | | | | | | | | | | | |
| | of Liabilities – 0.16% | | | | | | | 339,034 | | | | 0.16 | % |
| | TOTAL NET ASSETS – 100.00% | | | | | | $ | 210,028,908 | | | | 100.00 | % |
Percentages are stated as a percent of net assets.
| | (a) | Non-income producing security. |
| | (b) | The rate listed is the fund’s 7-day yield as of April 30, 2013. |
The accompanying notes are an integral part of these financial statements.
Summary of Fair Value Exposure at April 30, 2013
The following is a summary of the inputs used to value the Fund’s net assets as of April 30, 2013 (See Note 3 in the accompanying notes to the financial statements):
| | Common Stock | | Level 1 | | | Level 2 | | | Level 3 | | | Total | |
| | Consumer Discretionary | | $ | 80,693,969 | | | $ | — | | | $ | — | | | $ | 80,693,969 | |
| | Energy | | | 14,704,088 | | | | — | | | | — | | | | 14,704,088 | |
| | Financials | | | 15,811,868 | | | | — | | | | — | | | | 15,811,868 | |
| | Health Care | | | 7,952,490 | | | | — | | | | — | | | | 7,952,490 | |
| | Industrials | | | 47,693,892 | | | | — | | | | — | | | | 47,693,892 | |
| | Materials | | | 28,401,790 | | | | — | | | | — | | | | 28,401,790 | |
| | Total Common Stock | | $ | 195,258,097 | | | $ | — | | | $ | — | | | $ | 195,258,097 | |
| | Partnerships | | | | | | | | | | | | | | | | |
| | Energy | | $ | 7,053,568 | | | $ | — | | | $ | — | | | $ | 7,053,568 | |
| | Short-Term Investments | | | | | | | | | | | | | | | | |
| | Money Market Funds | | $ | 7,378,209 | | | $ | — | | | $ | — | | | $ | 7,378,209 | |
| | Total Short-Term Investments | | $ | 7,378,209 | | | $ | — | | | $ | — | | | $ | 7,378,209 | |
| | Total Investments in Securities | | $ | 209,689,874 | | | $ | — | | | $ | — | | | $ | 209,689,874 | |
Transfers between levels are recognized at the end of the reporting period. During the six-month period ended April 30, 2013, the Fund recognized no transfers between levels.
The accompanying notes are an integral part of these financial statements.
HENNESSY FUNDS 1-800-966-4354
HENNESSY CORNERSTONE LARGE GROWTH FUND
As of April 30, 2013 (Unaudited)
(% of Net Assets)
| | TOP TEN EQUITY HOLDINGS | % net assets |
| | Delta Air Lines, Inc. | 2.68% |
| | Western Digital Corp. | 2.58% |
| | Kroger Co. | 2.31% |
| | Campbell Soup Co. | 2.29% |
| | HCA Holdings, Inc. | 2.29% |
| | Halliburton Co. | 2.26% |
| | Marathon Petroleum Corp. | 2.24% |
| | The Boeing Co. | 2.17% |
| | Dollar Tree, Inc. | 2.17% |
| | The Gap, Inc. | 2.13% |
Note: For presentation purposes, the Fund has grouped some of the industry categories. For purposes of categorizing securities for compliance with Section 8(b)(1) of the Investment Company Act of 1940, the Fund uses more specific industry classifications.
| | COMMON STOCKS – 98.96% | | Number | | | | | | % of | |
| | | | of Shares | | | Value | | | Net Assets | |
| | Consumer Discretionary – 21.92% | | | | | | | | | |
| | Advance Auto Parts, Inc. | | | 23,400 | | | $ | 1,962,792 | | | | 2.03 | % |
| | Autozone, Inc. (a) | | | 4,800 | | | | 1,963,632 | | | | 2.03 | % |
| | Bed Bath & Beyond, Inc. (a) | | | 29,400 | | | | 2,022,720 | | | | 2.09 | % |
| | DIRECTV (a) | | | 34,300 | | | | 1,940,008 | | | | 2.00 | % |
| | Dollar Tree, Inc. (a) | | | 44,100 | | | | 2,097,396 | | | | 2.17 | % |
| | Family Dollar Stores, Inc. | | | 26,000 | | | | 1,595,620 | | | | 1.65 | % |
| | Foot Locker, Inc. | | | 52,500 | | | | 1,830,675 | | | | 1.89 | % |
| | Kohl’s Corp. | | | 39,000 | | | | 1,835,340 | | | | 1.89 | % |
| | Nordstrom, Inc. | | | 32,800 | | | | 1,856,152 | | | | 1.92 | % |
| | The Gap, Inc. | | | 54,400 | | | | 2,066,656 | | | | 2.13 | % |
| | Viacom, Inc. | | | 32,100 | | | | 2,054,079 | | | | 2.12 | % |
| | | | | | | | | 21,225,070 | | | | 21.92 | % |
| | | | | | | | | | | | | | |
| | Consumer Staples – 6.54% | | | | | | | | | | | | |
| | Campbell Soup Co. | | | 47,800 | | | | 2,218,398 | | | | 2.29 | % |
| | Dr. Pepper Snapple Group, Inc. | | | 38,500 | | | | 1,879,955 | | | | 1.94 | % |
| | Kroger Co. | | | 65,000 | | | | 2,234,700 | | | | 2.31 | % |
| | | | | | | | | 6,333,053 | | | | 6.54 | % |
| | | | | | | | | | | | | | |
| | Energy – 15.88% | | | | | | | | | | | | |
| | Chevron Corp. | | | 15,900 | | | | 1,939,959 | | | | 2.01 | % |
| | ConocoPhillips | | | 29,600 | | | | 1,789,320 | | | | 1.85 | % |
| | Exxon Mobil Corp. | | | 19,300 | | | | 1,717,507 | | | | 1.77 | % |
| | Halliburton Co. | | | 51,100 | | | | 2,185,547 | | | | 2.26 | % |
| | Helmerich & Payne, Inc. | | | 31,600 | | | | 1,852,392 | | | | 1.91 | % |
| | HollyFrontier Corp. | | | 37,800 | | | | 1,869,210 | | | | 1.93 | % |
| | Marathon Oil Corp. | | | 56,700 | | | | 1,852,389 | | | | 1.91 | % |
| | Marathon Petroleum Corp. | | | 27,700 | | | | 2,170,572 | | | | 2.24 | % |
| | | | | | | | | 15,376,896 | | | | 15.88 | % |
| | | | | | | | | | | | | | |
| | Health Care – 10.01% | | | | | | | | | | | | |
| | Baxter International, Inc. | | | 26,075 | | | | 1,821,860 | | | | 1.88 | % |
| | Cardinal Health, Inc. | | | 40,800 | | | | 1,804,176 | | | | 1.86 | % |
| | Eli Lilly & Co. | | | 35,500 | | | | 1,965,990 | | | | 2.03 | % |
| | HCA Holdings, Inc. | | | 55,500 | | | | 2,213,895 | | | | 2.29 | % |
| | UnitedHealth Group, Inc. | | | 31,500 | | | | 1,887,795 | | | | 1.95 | % |
| | | | | | | | | 9,693,716 | | | | 10.01 | % |
| | | | | | | | | | | | | | |
| | Industrials – 29.30% | | | | | | | | | | | | |
| | 3M Co. | | | 18,500 | | | | 1,937,135 | | | | 2.00 | % |
| | Caterpillar, Inc. | | | 19,400 | | | | 1,642,598 | | | | 1.70 | % |
| | Cummins, Inc. | | | 16,200 | | | | 1,723,518 | | | | 1.78 | % |
| | Deere & Co. | | | 20,000 | | | | 1,786,000 | | | | 1.85 | % |
| | Delta Air Lines, Inc. (a) | | | 151,600 | | | | 2,598,424 | | | | 2.68 | % |
| | Fluor Corp. | | | 30,000 | | | | 1,709,400 | | | | 1.77 | % |
| | General Dynamics Corp. | | | 25,200 | | | | 1,863,792 | | | | 1.92 | % |
| | Joy Global, Inc. | | | 28,300 | | | | 1,599,516 | | | | 1.65 | % |
| | Lockheed Martin Corp. | | | 19,000 | | | | 1,882,710 | | | | 1.94 | % |
| | PACCAR, Inc. | | | 39,000 | | | | 1,941,420 | | | | 2.01 | % |
| | Parker Hannifin Corp. | | | 20,600 | | | | 1,824,542 | | | | 1.88 | % |
| | Raytheon Co. | | | 29,800 | | | | 1,829,124 | | | | 1.89 | % |
| | Rockwell Collins, Inc. | | | 30,300 | | | | 1,906,476 | | | | 1.97 | % |
| | The Boeing Co. | | | 23,000 | | | | 2,102,430 | | | | 2.17 | % |
| | Union Pacific Corp. | | | 13,700 | | | | 2,027,052 | | | | 2.09 | % |
| | | | | | | | | 28,374,137 | | | | 29.30 | % |
| | | | | | | | | | | | | | |
| | Information Technology – 12.02% | | | | | | | | | | | | |
| | Apple, Inc. | | | 3,250 | | | | 1,438,938 | | | | 1.48 | % |
| | Intel Corp. | | | 83,500 | | | | 1,999,825 | | | | 2.06 | % |
| | International Business Machines Corp. | | | 8,900 | | | | 1,802,606 | | | | 1.86 | % |
| | KLA-Tencor Corp. | | | 36,700 | | | | 1,990,975 | | | | 2.06 | % |
| | Western Digital Corp. | | | 45,200 | | | | 2,498,656 | | | | 2.58 | % |
| | Western Union Co. | | | 129,200 | | | | 1,913,452 | | | | 1.98 | % |
| | | | | | | | | 11,644,452 | | | | 12.02 | % |
| | | | | | | | | | | | | | |
| | Materials – 3.29% | | | | | | | | | | | | |
| | CF Industries Holdings, Inc. | | | 8,500 | | | | 1,585,335 | | | | 1.64 | % |
| | Freeport-McMoRan Copper & Gold, Inc. | | | 52,700 | | | | 1,603,661 | | | | 1.65 | % |
| | | | | | | | | 3,188,996 | | | | 3.29 | % |
| | Total Common Stocks | | | | | | | | | | | | |
| | (Cost $81,921,276) | | | | | | | 95,836,320 | | | | 98.96 | % |
| | | | | | | | | | | | | | |
| | SHORT-TERM INVESTMENTS – 1.06% | | | | | | | | | | | | |
| | | | | | | | | | | | | | |
| | Money Market Funds – 1.06% | | | | | | | | | | | | |
| | Fidelity Government Portfolio – | | | | | | | | | | | | |
| | Institutional Class, 0.01% (b) | | | 1,030,909 | | | | 1,030,909 | | | | 1.06 | % |
| | | | | | | | | | | | | | |
| | Total Money Market Funds | | | | | | | | | | | | |
| | (Cost $1,030,909) | | | | | | | 1,030,909 | | | | 1.06 | % |
| | | | | | | | | | | | | | |
| | Total Short-Term Investments | | | | | | | | | | | | |
| | (Cost $1,030,909) | | | | | | | 1,030,909 | | | | 1.06 | % |
| | | | | | | | | | | | | | |
| | Total Investments | | | | | | | | | | | | |
| | (Cost $82,952,185) – 100.02% | | | | | | | 96,867,229 | | | | 100.02 | % |
| | | | | | | | | | | | | | |
| | Liabilities in Excess of | | | | | | | | | | | | |
| | Other Assets – (0.02)% | | | | | | | (20,377 | ) | | | (0.02 | )% |
| | TOTAL NET ASSETS – 100.00% | | | | | | $ | 96,846,852 | | | | 100.00 | % |
Percentages are stated as a percent of net assets.
| | (a) | Non-income producing security. |
| | (b) | The rate listed is the fund’s 7-day yield as of April 30, 2013. |
The accompanying notes are an integral part of these financial statements.
HENNESSY FUNDS 1-800-966-4354
Summary of Fair Value Exposure at April 30, 2013
The following is a summary of the inputs used to value the Fund’s net assets as of April 30, 2013 (See Note 3 in the accompanying notes to the financial statements):
| | Common Stock | | Level 1 | | | Level 2 | | | Level 3 | | | Total | |
| | Consumer Discretionary | | $ | 21,225,070 | | | $ | — | | | $ | — | | | $ | 21,225,070 | |
| | Consumer Staples | | | 6,333,053 | | | | — | | | | — | | | | 6,333,053 | |
| | Energy | | | 15,376,896 | | | | — | | | | — | | | | 15,376,896 | |
| | Health Care | | | 9,693,716 | | | | — | | | | — | | | | 9,693,716 | |
| | Industrials | | | 28,374,137 | | | | — | | | | — | | | | 28,374,137 | |
| | Information Technology | | | 11,644,452 | | | | — | | | | — | | | | 11,644,452 | |
| | Materials | | | 3,188,996 | | | | — | | | | — | | | | 3,188,996 | |
| | Total Common Stock | | $ | 95,836,320 | | | $ | — | | | $ | — | | | $ | 95,836,320 | |
| | Short-Term Investments | | | | | | | | | | | | | | | | |
| | Money Market Funds | | $ | 1,030,909 | | | $ | — | | | $ | — | | | $ | 1,030,909 | |
| | Total Short-Term Investments | | $ | 1,030,909 | | | $ | — | | | $ | — | | | $ | 1,030,909 | |
| | Total Investments in Securities | | $ | 96,867,229 | | | $ | — | | | $ | — | | | $ | 96,867,229 | |
Transfers between levels are recognized at the end of the reporting period. During the six-month period ended April 30, 2013, the Fund recognized no transfers between levels.
The accompanying notes are an integral part of these financial statements.
HENNESSY CORNERSTONE VALUE FUND
As of April 30, 2013 (Unaudited)
(% of Net Assets)
| | TOP TEN EQUITY HOLDINGS | % net assets |
| | Verizon Communications, Inc. | 2.31% |
| | General Mills, Inc. | 2.28% |
| | Microsoft Corp. | 2.26% |
| | Raytheon Co. | 2.23% |
| | Johnson & Johnson | 2.19% |
| | Kimberly Clark Corp. | 2.19% |
| | Lockheed Martin Corp. | 2.17% |
| | EI Du Pont de Nemours & Co. | 2.17% |
| | Pepsico, Inc. | 2.17% |
| | GlaxoSmithKline PLC - ADR | 2.16% |
Note: For presentation purposes, the Fund has grouped some of the industry categories. For purposes of categorizing securities for compliance with Section 8(b)(1) of the Investment Company Act of 1940, the Fund uses more specific industry classifications.
HENNESSY FUNDS 1-800-966-4354
| | COMMON STOCKS – 98.29% | | Number | | | | | | % of | |
| | | | of Shares | | | Value | | | Net Assets | |
| | Consumer Discretionary – 6.02% | | | | | | | | | |
| | Ford Motor Co. | | | 204,100 | | | $ | 2,798,211 | | | | 2.01 | % |
| | McDonald’s Corp. | | | 27,700 | | | | 2,829,278 | | | | 2.03 | % |
| | Time Warner Cable, Inc. | | | 29,400 | | | | 2,760,366 | | | | 1.98 | % |
| | | | | | | | | 8,387,855 | | | | 6.02 | % |
| | | | | | | | | | | | | | |
| | Consumer Staples – 25.02% | | | | | | | | | | | | |
| | Altria Group, Inc. | | | 77,700 | | | | 2,836,827 | | | | 2.04 | % |
| | ConAgra Foods, Inc. | | | 80,400 | | | | 2,843,748 | | | | 2.04 | % |
| | General Mills, Inc. | | | 63,100 | | | | 3,181,502 | | | | 2.28 | % |
| | Kellogg Co. | | | 45,300 | | | | 2,946,312 | | | | 2.11 | % |
| | Kimberly Clark Corp. | | | 29,500 | | | | 3,044,105 | | | | 2.19 | % |
| | Kraft Foods Group, Inc. | | | 57,000 | | | | 2,934,930 | | | | 2.11 | % |
| | Pepsico, Inc. | | | 36,600 | | | | 3,018,402 | | | | 2.17 | % |
| | Philip Morris International, Inc. | | | 30,200 | | | | 2,886,818 | | | | 2.07 | % |
| | Procter & Gamble Co. | | | 35,000 | | | | 2,686,950 | | | | 1.93 | % |
| | Sysco Corp. | | | 82,800 | | | | 2,886,408 | | | | 2.07 | % |
| | Unilever NV – ADR | | | 65,200 | | | | 2,769,696 | | | | 1.99 | % |
| | Unilever PLC – ADR | | | 64,900 | | | | 2,811,468 | | | | 2.02 | % |
| | | | | | | | | 34,847,166 | | | | 25.02 | % |
| | | | | | | | | | | | | | |
| | Energy – 9.40% | | | | | | | | | | | | |
| | BP PLC – ADR | | | 59,400 | | | | 2,589,840 | | | | 1.86 | % |
| | Chevron Corp. | | | 22,800 | | | | 2,781,828 | | | | 2.00 | % |
| | ConocoPhillips | | | 45,200 | | | | 2,732,340 | | | | 1.96 | % |
| | Royal Dutch Shell PLC – ADR | | | 36,500 | | | | 2,547,335 | | | | 1.83 | % |
| | Total SA – ADR | | | 48,400 | | | | 2,431,616 | | | | 1.75 | % |
| | | | | | | | | 13,082,959 | | | | 9.40 | % |
| | | | | | | | | | | | | | |
| | Financials – 5.58% | | | | | | | | | | | | |
| | Banco Santander SA – ADR | | | 321,300 | | | | 2,329,425 | | | | 1.67 | % |
| | HSBC Holdings PLC – ADR | | | 46,800 | | | | 2,567,448 | | | | 1.85 | % |
| | Wells Fargo & Co. | | | 75,600 | | | | 2,871,288 | | | | 2.06 | % |
| | | | | | | | | 7,768,161 | | | | 5.58 | % |
| | | | | | | | | | | | | | |
| | Health Care – 12.50% | | | | | | | | | | | | |
| | Bristol-Myers Squibb Co. | | | 72,000 | | | | 2,859,840 | | | | 2.05 | % |
| | Eli Lilly & Co. | | | 49,000 | | | | 2,713,620 | | | | 1.95 | % |
| | GlaxoSmithKline PLC – ADR | | | 58,200 | | | | 3,005,448 | | | | 2.16 | % |
| | Johnson & Johnson | | | 35,800 | | | | 3,051,234 | | | | 2.19 | % |
| | Merck & Co., Inc. | | | 63,500 | | | | 2,984,500 | | | | 2.14 | % |
| | Pfizer, Inc. | | | 96,200 | | | | 2,796,534 | | | | 2.01 | % |
| | | | | | | | | 17,411,176 | | | | 12.50 | % |
| | | | | | | | | | | | | | |
| | Industrials – 14.74% | | | | | | | | | | | | |
| | General Dynamics Corp. | | | 40,300 | | | | 2,980,588 | | | | 2.14 | % |
| | General Electric Co. | | | 117,500 | | | | 2,619,075 | | | | 1.88 | % |
| | Lockheed Martin Corp. | | | 30,500 | | | | 3,022,245 | | | | 2.17 | % |
| | Norfolk Southern Corp. | | | 38,200 | | | | 2,957,444 | | | | 2.12 | % |
| | Raytheon Co. | | | 50,500 | | | | 3,099,690 | | | | 2.23 | % |
| | United Parcel Service, Inc. | | | 33,200 | | | | 2,849,888 | | | | 2.05 | % |
| | Waste Management, Inc. | | | 73,200 | | | | 2,999,736 | | | | 2.15 | % |
| | | | | | | | | 20,528,666 | | | | 14.74 | % |
| | | | | | | | | | | | | | |
| | Information Technology – 6.52% | | | | | | | | | | | | |
| | Automatic Data Processing, Inc. | | | 43,800 | | | | 2,949,492 | | | | 2.12 | % |
| | Intel Corp. | | | 124,400 | | | | 2,979,380 | | | | 2.14 | % |
| | Microsoft Corp. | | | 95,100 | | | | 3,147,810 | | | | 2.26 | % |
| | | | | | | | | 9,076,682 | | | | 6.52 | % |
| | | | | | | | | | | | | | |
| | Materials – 12.45% | | | | | | | | | | | | |
| | Arcelormittal SA Luxembourg – ADR | | | 152,100 | | | | 1,899,729 | | | | 1.36 | % |
| | EI Du Pont de Nemours & Co. | | | 55,400 | | | | 3,019,854 | | | | 2.17 | % |
| | Freeport-McMoRan Copper & Gold, Inc. | | | 74,400 | | | | 2,263,992 | | | | 1.63 | % |
| | International Paper Co. | | | 62,700 | | | | 2,945,646 | | | | 2.12 | % |
| | Newmont Mining Corp. | | | 60,800 | | | | 1,969,920 | | | | 1.42 | % |
| | Nucor Corp. | | | 56,600 | | | | 2,468,892 | | | | 1.77 | % |
| | The Dow Chemical Co. | | | 81,500 | | | | 2,763,665 | | | | 1.98 | % |
| | | | | | | | | 17,331,698 | | | | 12.45 | % |
| | | | | | | | | | | | | | |
| | Telecommunication Services – 6.06% | | | | | | | | | | | | |
| | AT&T, Inc. | | | 74,800 | | | | 2,802,008 | | | | 2.01 | % |
| | CenturyLink, Inc. | | | 64,600 | | | | 2,427,022 | | | | 1.74 | % |
| | Verizon Communications, Inc. | | | 59,600 | | | | 3,213,036 | | | | 2.31 | % |
| | | | | | | | | 8,442,066 | | | | 6.06 | % |
| | Total Common Stocks | | | | | | | | | | | | |
| | (Cost $113,815,736) | | | | | | | 136,876,429 | | | | 98.29 | % |
| | | | | | | | | | | | | | |
| | SHORT-TERM INVESTMENTS – 1.59% | | | | | | | | | | | | |
| | | | | | | | | | | | | | |
| | Money Market Funds – 1.59% | | | | | | | | | | | | |
| | Fidelity Government Portfolio – | | | | | | | | | | | | |
| | Institutional Class, 0.01% (a) | | | 2,207,625 | | | | 2,207,625 | | | | 1.59 | % |
| | | | | | | | | | | | | | |
| | Total Money Market Funds | | | | | | | | | | | | |
| | (Cost $2,207,625) | | | | | | | 2,207,625 | | | | 1.59 | % |
| | | | | | | | | | | | | | |
| | Total Short-Term Investments | | | | | | | | | | | | |
| | (Cost $2,207,625) | | | | | | | 2,207,625 | | | | 1.59 | % |
| | | | | | | | | | | | | | |
| | Total Investments | | | | | | | | | | | | |
| | (Cost $116,023,361) – 99.88% | | | | | | | 139,084,054 | | | | 99.88 | % |
| | | | | | | | | | | | | | |
| | Other Assets in Excess | | | | | | | | | | | | |
| | of Liabilities – 0.12% | | | | | | | 171,170 | | | | 0.12 | % |
| | TOTAL NET ASSETS – 100.00% | | | | | | $ | 139,255,224 | | | | 100.00 | % |
Percentages are stated as a percent of net assets.
ADR – American Depositary Receipt
(a)The rate listed is the fund’s 7-day yield as of April 30, 2013.
The accompanying notes are an integral part of these financial statements.
Summary of Fair Value Exposure at April 30, 2013
The following is a summary of the inputs used to value the Fund’s net assets as of April 30, 2013 (See Note 3 in the accompanying notes to the financial statements):
| | Common Stock | | Level 1 | | | Level 2 | | | Level 3 | | | Total | |
| | Consumer Discretionary | | $ | 8,387,855 | | | $ | — | | | $ | — | | | $ | 8,387,855 | |
| | Consumer Staples | | | 34,847,166 | | | | — | | | | — | | | | 34,847,166 | |
| | Energy | | | 13,082,959 | | | | — | | | | — | | | | 13,082,959 | |
| | Financials | | | 7,768,161 | | | | — | | | | — | | | | 7,768,161 | |
| | Health Care | | | 17,411,176 | | | | — | | | | — | | | | 17,411,176 | |
| | Industrials | | | 20,528,666 | | | | — | | | | — | | | | 20,528,666 | |
| | Information Technology | | | 9,076,682 | | | | — | | | | — | | | | 9,076,682 | |
| | Materials | | | 17,331,698 | | | | — | | | | — | | | | 17,331,698 | |
| | Telecommunication Services | | | 8,442,066 | | | | — | | | | — | | | | 8,442,066 | |
| | Total Common Stock | | $ | 136,876,429 | | | $ | — | | | $ | — | | | $ | 136,876,429 | |
| | Short-Term Investments | | | | | | | | | | | | | | | | |
| | Money Market Funds | | $ | 2,207,625 | | | $ | — | | | $ | — | | | $ | 2,207,625 | |
| | Total Short-Term Investments | | $ | 2,207,625 | | | $ | — | | | $ | — | | | $ | 2,207,625 | |
| | Total Investments in Securities | | $ | 139,084,054 | | | $ | — | | | $ | — | | | $ | 139,084,054 | |
Transfers between levels are recognized at the end of the reporting period. During the six-month period ended April 30, 2013, the Fund recognized no transfers between levels.
The accompanying notes are an integral part of these financial statements.
HENNESSY FUNDS 1-800-966-4354
HENNESSY LARGE VALUE FUND
As of April 30, 2013 (Unaudited)
(% of Net Assets)
| | TOP TEN EQUITY HOLDINGS | % net assets |
| | Chevron Corp. | 4.85% |
| | Wells Fargo & Co. | 4.14% |
| | Johnson & Johnson | 3.57% |
| | Pfizer, Inc. | 3.53% |
| | Exxon Mobil Corp. | 3.20% |
| | J.P. Morgan Chase & Co. | 3.19% |
| | General Electric Co. | 2.84% |
| | Cisco Systems, Inc. | 2.35% |
| | UnitedHealth Group, Inc. | 2.17% |
| | Dominion Resources, Inc. | 2.13% |
Note: For presentation purposes, the Fund has grouped some of the industry categories. For purposes of categorizing securities for compliance with Section 8(b)(1) of the Investment Company Act of 1940, the Fund uses more specific industry classifications.
| | COMMON STOCKS – 95.60% | | Number | | | | | | % of | |
| | | | of Shares | | | Value | | | Net Assets | |
| | Consumer Discretionary – 9.16% | | | | | | | | | |
| | Abercrombie & Fitch Co., Class A | | | 27,270 | | | $ | 1,351,501 | | | | 0.98 | % |
| | Coach, Inc. | | | 16,335 | | | | 961,478 | | | | 0.70 | % |
| | Comcast Corp. | | | 57,310 | | | | 2,366,903 | | | | 1.71 | % |
| | Ford Motor Co. | | | 79,890 | | | | 1,095,292 | | | | 0.79 | % |
| | Lowes Companies, Inc. | | | 34,930 | | | | 1,342,011 | | | | 0.97 | % |
| | Macy’s, Inc. | | | 30,510 | | | | 1,360,746 | | | | 0.98 | % |
| | Pulte Homes, Inc. (a) | | | 36,585 | | | | 767,919 | | | | 0.56 | % |
| | Target Corp. | | | 16,770 | | | | 1,183,291 | | | | 0.86 | % |
| | Time Warner, Inc. | | | 37,225 | | | | 2,225,311 | | | | 1.61 | % |
| | | | | | | | | 12,654,452 | | | | 9.16 | % |
| | | | | | | | | | | | | | |
| | Consumer Staples – 8.19% | | | | | | | | | | | | |
| | Altria Group, Inc. | | | 26,315 | | | | 960,761 | | | | 0.70 | % |
| | Bunge Ltd. (b) | | | 12,915 | | | | 932,592 | | | | 0.68 | % |
| | CVS Caremark Corp. | | | 31,810 | | | | 1,850,706 | | | | 1.34 | % |
| | Kroger Co. | | | 41,950 | | | | 1,442,241 | | | | 1.04 | % |
| | Lorillard, Inc. | | | 23,875 | | | | 1,023,999 | | | | 0.74 | % |
| | Mondelez International, Inc. | | | 78,515 | | | | 2,469,297 | | | | 1.79 | % |
| | Procter & Gamble Co. | | | 34,245 | | | | 2,628,988 | | | | 1.90 | % |
| | | | | | | | | 11,308,584 | | | | 8.19 | % |
| | | | | | | | | | | | | | |
| | Energy – 14.09% | | | | | | | | | | | | |
| | Anadarko Petroleum Corp. | | | 13,340 | | | | 1,130,698 | | | | 0.82 | % |
| | Atwood Oceanics, Inc. (a) | | | 11,140 | | | | 546,417 | | | | 0.40 | % |
| | Chevron Corp. | | | 54,900 | | | | 6,698,349 | | | | 4.85 | % |
| | Exxon Mobil Corp. | | | 49,735 | | | | 4,425,918 | | | | 3.20 | % |
| | Helmerich & Payne, Inc. | | | 30,030 | | | | 1,760,358 | | | | 1.27 | % |
| | Hess Corp. | | | 7,555 | | | | 545,320 | | | | 0.39 | % |
| | Marathon Oil Corp. | | | 52,795 | | | | 1,724,813 | | | | 1.25 | % |
| | Marathon Petroleum Corp. | | | 8,725 | | | | 683,691 | | | | 0.50 | % |
| | Occidental Petroleum Corp. | | | 14,885 | | | | 1,328,635 | | | | 0.96 | % |
| | Valero Energy Corp. | | | 15,450 | | | | 622,944 | | | | 0.45 | % |
| | | | | | | | | 19,467,143 | | | | 14.09 | % |
| | | | | | | | | | | | | | |
| | Financials – 23.17% | | | | | | | | | | | | |
| | Ace Ltd. (b) | | | 25,765 | | | | 2,296,692 | | | | 1.66 | % |
| | Allstate Corp. | | | 49,625 | | | | 2,444,528 | | | | 1.77 | % |
| | American International Group, Inc. (a) | | | 30,165 | | | | 1,249,434 | | | | 0.90 | % |
| | Bank of America Corp. | | | 73,010 | | | | 898,753 | | | | 0.65 | % |
| | Berkshire Hathaway, Inc., Class B (a) | | | 18,715 | | | | 1,989,779 | | | | 1.44 | % |
| | Blackrock, Inc. | | | 7,625 | | | | 2,032,063 | | | | 1.47 | % |
| | CIT Group, Inc. (a) | | | 24,185 | | | | 1,028,104 | | | | 0.74 | % |
| | Citigroup, Inc. | | | 58,070 | | | | 2,709,546 | | | | 1.96 | % |
| | J.P. Morgan Chase & Co. | | | 89,840 | | | | 4,403,058 | | | | 3.19 | % |
| | Lincoln National Corp. | | | 14,505 | | | | 493,315 | | | | 0.36 | % |
| | State Street Corp. | | | 34,075 | | | | 1,992,365 | | | | 1.44 | % |
| | The Goldman Sachs Group, Inc. | | | 12,820 | | | | 1,872,617 | | | | 1.36 | % |
| | The PNC Financial Services Group, Inc. | | | 17,260 | | | | 1,171,609 | | | | 0.85 | % |
| | Travelers Companies, Inc. | | | 19,995 | | | | 1,707,773 | | | | 1.24 | % |
| | Wells Fargo & Co. | | | 150,410 | | | | 5,712,572 | | | | 4.14 | % |
| | | | | | | | | 32,002,208 | | | | 23.17 | % |
| | | | | | | | | | | | | | |
| | Health Care – 12.60% | | | | | | | | | | | | |
| | Covidien PLC (b) | | | 35,375 | | | | 2,258,340 | | | | 1.64 | % |
| | Johnson & Johnson | | | 57,785 | | | | 4,925,016 | | | | 3.57 | % |
| | Life Technologies Corp. (a) | | | 17,880 | | | | 1,317,577 | | | | 0.95 | % |
| | McKesson Corp. | | | 9,690 | | | | 1,025,396 | | | | 0.74 | % |
| | Pfizer, Inc. | | | 167,600 | | | | 4,872,132 | | | | 3.53 | % |
| | UnitedHealth Group, Inc. | | | 50,125 | | | | 3,003,991 | | | | 2.17 | % |
| | | | | | | | | 17,402,452 | | | | 12.60 | % |
| | | | | | | | | | | | | | |
| | Industrials – 8.79% | | | | | | | | | | | | |
| | Alaska Air Group, Inc. (a) | | | 8,015 | | | | 494,045 | | | | 0.36 | % |
| | CSX Corp. | | | 30,100 | | | | 740,159 | | | | 0.54 | % |
| | Cummins, Inc. | | | 5,995 | | | | 637,808 | | | | 0.46 | % |
| | Danaher Corp. | | | 21,670 | | | | 1,320,570 | | | | 0.96 | % |
| | Eaton Corp. (b) | | | 15,605 | | | | 958,303 | | | | 0.69 | % |
| | General Electric Co. | | | 176,025 | | | | 3,923,597 | | | | 2.84 | % |
| | Honeywell International, Inc. | | | 22,875 | | | | 1,682,227 | | | | 1.22 | % |
| | Ingersoll-Rand PLC (b) | | | 12,655 | | | | 680,839 | | | | 0.49 | % |
| | Lockheed Martin Corp. | | | 17,195 | | | | 1,703,853 | | | | 1.23 | % |
| | | | | | | | | 12,141,401 | | | | 8.79 | % |
| | | | | | | | | | | | | | |
| | Information Technology – 6.14% | | | | | | | | | | | | |
| | Apple, Inc. | | | 1,715 | | | | 759,316 | | | | 0.55 | % |
| | Cisco Systems, Inc. | | | 155,355 | | | | 3,250,027 | | | | 2.35 | % |
| | EMC Corp. (a) | | | 40,815 | | | | 915,480 | | | | 0.66 | % |
| | Intel Corp. | | | 49,880 | | | | 1,194,626 | | | | 0.87 | % |
| | LAM Research Corp. (a) | | | 13,150 | | | | 607,793 | | | | 0.44 | % |
| | Texas Instruments, Inc. | | | 48,295 | | | | 1,748,762 | | | | 1.27 | % |
| | | | | | | | | 8,476,004 | | | | 6.14 | % |
| | | | | | | | | | | | | | |
| | Manufacturing – 0.44% | | | | | | | | | | | | |
| | Skyworks Solutions, Inc. (a) | | | 27,475 | | | | 606,373 | | | | 0.44 | % |
| | | | | | | | | | | | | | |
| | Materials – 3.50% | | | | | | | | | | | | |
| | Eastman Chemical Co. | | | 21,730 | | | | 1,448,304 | | | | 1.05 | % |
| | Lyondellbasell Industries NV | | | 24,865 | | | | 1,509,305 | | | | 1.09 | % |
| | Reliance Steel & Aluminum Co. | | | 12,680 | | | | 825,088 | | | | 0.60 | % |
| | The Mosaic Co. | | | 17,125 | | | | 1,054,729 | | | | 0.76 | % |
| | | | | | | | | 4,837,426 | | | | 3.50 | % |
| | | | | | | | | | | | | | |
| | Telecommunication Services – 2.90% | | | | | | | | | | | | |
| | AT&T, Inc. | | | 74,020 | | | | 2,772,789 | | | | 2.01 | % |
| | Verizon Communications, Inc. | | | 22,830 | | | | 1,230,766 | | | | 0.89 | % |
| | | | | | | | | 4,003,555 | | | | 2.90 | % |
The accompanying notes are an integral part of these financial statements.
HENNESSY FUNDS 1-800-966-4354
| | COMMON STOCKS | | Number | | | | | | % of | |
| | | | of Shares | | | Value | | | Net Assets | |
| | Utilities – 6.62% | | | | | | | | | |
| | Dominion Resources, Inc. | | | 47,775 | | | $ | 2,946,762 | | | | 2.13 | % |
| | Great Plains Energy, Inc. | | | 67,125 | | | | 1,619,726 | | | | 1.17 | % |
| | Northeast Utilities | | | 62,880 | | | | 2,850,351 | | | | 2.07 | % |
| | NRG Energy, Inc. | | | 61,905 | | | | 1,725,292 | | | | 1.25 | % |
| | | | | | | | | 9,142,131 | | | | 6.62 | % |
| | Total Common Stocks | | | | | | | | | | | | |
| | (Cost $106,539,861) | | | | | | | 132,041,729 | | | | 95.60 | % |
| | | | | | | | | | | | | | |
| | REITS – 3.35% | | | | | | | | | | | | |
| | | | | | | | | | | | | | |
| | Health Care – 0.85% | | | | | | | | | | | | |
| | Health Care REIT, Inc. | | | 15,560 | | | | 1,166,533 | | | | 0.85 | % |
| | | | | | | | | | | | | | |
| | Financials -2.50% | | | | | | | | | | | | |
| | Simon Property Group, Inc. | | | 14,868 | | | | 2,647,545 | | | | 1.91 | % |
| | Weyerhaeuser Co. | | | 26,745 | | | | 815,990 | | | | 0.59 | % |
| | | | | | | | | | | | | | |
| | Total Reits | | | | | | | | | | | | |
| | (Cost $3,191,097) | | | | | | | 4,630,068 | | | | 3.35 | % |
| | | | | | | | | | | | | | |
| | SHORT-TERM INVESTMENTS – 1.08% | | | | | | | | | | | | |
| | | | | | | | | | | | | | |
| | Money Market Funds – 1.08% | | | | | | | | | | | | |
| | Fidelity Government Portfolio – | | | | | | | | | | | | |
| | Institutional Class, 0.01% (c) | | | 1,489,090 | | | | 1,489,090 | | | | 1.08 | % |
| | | | | | | | | | | | | | |
| | Total Money Market Funds | | | | | | | | | | | | |
| | (Cost $1,489,090) | | | | | | | 1,489,090 | | | | 1.08 | % |
| | | | | | | | | | | | | | |
| | Total Short-Term Investments | | | | | | | | | | | | |
| | (Cost $1,489,090) | | | | | | | 1,489,090 | | | | 1.08 | % |
| | | | | | | | | | | | | | |
| | Total Investments | | | | | | | | | | | | |
| | (Cost $111,220,048) – 100.03% | | | | | | | 138,160,887 | | | | 100.03 | % |
| | | | | | | | | | | | | | |
| | Liabilities in Excess of | | | | | | | | | | | | |
| | Other Assets – (0.03)% | | | | | | | (35,220 | ) | | | (0.03 | )% |
| | TOTAL NET ASSETS – 100.00% | | | | | | $ | 138,125,667 | | | | 100.00 | % |
Percentages are stated as a percent of net assets.
| | (a) | Non-income producing security. |
| | (b) | U.S. traded security of a foreign corporation. |
| | (c) | The rate listed is the fund’s 7-day yield as of April 30, 2013. |
Summary of Fair Value Exposure at April 30, 2013
The following is a summary of the inputs used to value the Fund’s net assets as of April 30, 2013 (See Note 3 in the accompanying notes to the financial statements):
| | Common Stock | | Level 1 | | | Level 2 | | | Level 3 | | | Total | |
| | Consumer Discretionary | | $ | 12,654,452 | | | $ | — | | | $ | — | | | $ | 12,654,452 | |
| | Consumer Staples | | | 11,308,584 | | | | — | | | | — | | | | 11,308,584 | |
| | Energy | | | 19,467,143 | | | | — | | | | — | | | | 19,467,143 | |
| | Financials | | | 32,002,208 | | | | — | | | | — | | | | 32,002,208 | |
| | Health Care | | | 17,402,452 | | | | — | | | | — | | | | 17,402,452 | |
| | Industrials | | | 12,141,401 | | | | — | | | | — | | | | 12,141,401 | |
| | Information Technology | | | 8,476,004 | | | | — | | | | — | | | | 8,476,004 | |
| | Manufacturing | | | 606,373 | | | | — | | | | — | | | | 606,373 | |
| | Materials | | | 4,837,426 | | | | — | | | | — | | | | 4,837,426 | |
| | Telecommunication Services | | | 4,003,555 | | | | — | | | | — | | | | 4,003,555 | |
| | Utilities | | | 9,142,131 | | | | — | | | | — | | | | 9,142,131 | |
| | Total Common Stock | | $ | 132,041,729 | | | $ | — | | | $ | — | | | $ | 132,041,729 | |
| | REITS | | | | | | | | | | | | | | | | |
| | Health Care | | $ | 1,166,533 | | | $ | — | | | $ | — | | | $ | 1,166,533 | |
| | Financials | | | 3,463,535 | | | | — | | | | — | | | | 3,463,535 | |
| | Total REITS | | $ | 4,630,068 | | | $ | — | | | $ | — | | | $ | 4,630,068 | |
| | Short-Term Investments | | | | | | | | | | | | | | | | |
| | Money Market Funds | | $ | 1,489,090 | | | $ | — | | | $ | — | | | $ | 1,489,090 | |
| | Total Short-Term Investments | | $ | 1,489,090 | | | $ | — | | | $ | — | | | $ | 1,489,090 | |
| | Total Investments in Securities | | $ | 138,160,887 | | | $ | — | | | $ | — | | | $ | 138,160,887 | |
Transfers between levels are recognized at the end of the reporting period. During the six-month period ended April 30, 2013, the Fund recognized no transfers between levels.
The accompanying notes are an integral part of these financial statements.
HENNESSY TOTAL RETURN FUND
As of April 30, 2013 (Unaudited)
(% of Net Assets)
| | TOP TEN EQUITY HOLDINGS | % net assets |
| | Verizon Communications, Inc. | 7.77% |
| | Pfizer Inc. | 7.38% |
| | Johnson & Johnson | 6.91% |
| | Merck & Co., Inc. | 6.84% |
| | EI Du Pont de Nemours & Co. | 6.64% |
| | AT&T, Inc. | 6.41% |
| | Intel Corp. | 6.38% |
| | Proctor & Gamble Co. | 4.75% |
| | McDonald’s Corp. | 4.22% |
| | Chevron Corp. | 4.08% |
Note: For presentation purposes, the Fund has grouped some of the industry categories. For purposes of categorizing securities for compliance with Section 8(b)(1) of the Investment Company Act of 1940, the Fund uses more specific industry classifications.
HENNESSY FUNDS 1-800-966-4354
| | COMMON STOCKS – 73.18% | | Number | | | | | | % of | |
| | | | of Shares | | | Value | | | Net Assets | |
| | Consumer Discretionary – 4.22% | | | | | | | | | |
| | McDonald’s Corp. | | | 33,900 | | | $ | 3,462,546 | | | | 4.22 | % |
| | | | | | | | | | | | | | |
| | Consumer Staples – 5.39% | | | | | | | | | | | | |
| | Kraft Foods Group, Inc. | | | 3,601 | | | | 185,415 | | | | 0.23 | % |
| | Mondelez International, Inc. | | | 10,800 | | | | 339,660 | | | | 0.41 | % |
| | Procter & Gamble Co. | | | 50,700 | | | | 3,892,239 | | | | 4.75 | % |
| | | | | | | | | 4,417,314 | | | | 5.39 | % |
| | | | | | | | | | | | | | |
| | Energy – 4.08% | | | | | | | | | | | | |
| | Chevron Corp. | | | 27,400 | | | | 3,343,074 | | | | 4.08 | % |
| | | | | | | | | | | | | | |
| | Financials – 3.30% | | | | | | | | | | | | |
| | J.P. Morgan Chase & Co. | | | 55,100 | | | | 2,700,451 | | | | 3.30 | % |
| | | | | | | | | | | | | | |
| | Health Care – 21.13% | | | | | | | | | | | | |
| | Johnson & Johnson | | | 66,400 | | | | 5,659,272 | | | | 6.91 | % |
| | Merck & Co., Inc. | | | 119,300 | | | | 5,607,100 | | | | 6.84 | % |
| | Pfizer, Inc. | | | 208,100 | | | | 6,049,467 | | | | 7.38 | % |
| | | | | | | | | 17,315,839 | | | | 21.13 | % |
| | | | | | | | | | | | | | |
| | Industrials – 4.07% | | | | | | | | | | | | |
| | General Electric Co. | | | 149,500 | | | | 3,332,355 | | | | 4.07 | % |
| | | | | | | | | | | | | | |
| | Information Technology – 10.17% | | | | | | | | | | | | |
| | Cisco Systems, Inc. | | | 9,100 | | | | 190,372 | | | | 0.23 | % |
| | Hewlett-Packard Co. | | | 70,600 | | | | 1,454,360 | | | | 1.77 | % |
| | Intel Corp. | | | 218,200 | | | | 5,225,890 | | | | 6.38 | % |
| | Microsoft Corp. | | | 44,300 | | | | 1,466,330 | | | | 1.79 | % |
| | | | | | | | | 8,336,952 | | | | 10.17 | % |
| | | | | | | | | | | | | | |
| | Materials – 6.64% | | | | | | | | | | | | |
| | EI Du Pont de Nemours & Co. | | | 99,900 | | | | 5,445,549 | | | | 6.64 | % |
| | | | | | | | | | | | | | |
| | Telecommunication Services – 14.18% | | | | | | | | | | | | |
| | AT&T, Inc. | | | 140,200 | | | | 5,251,892 | | | | 6.41 | % |
| | Verizon Communications, Inc. | | | 118,200 | | | | 6,372,162 | | | | 7.77 | % |
| | | | | | | | | 11,624,054 | | | | 14.18 | % |
| | Total Common Stocks | | | | | | | | | | | | |
| | (Cost $45,500,058) | | | | | | | 59,978,134 | | | | 73.18 | % |
| | | | | | | | | | | | | | |
| | SHORT-TERM INVESTMENTS – 66.25% | | | | | | | | | | | | |
| | | | | | | | | | | | | | |
| | U.S. Treasury Bills – 64.67% | | | | | | | | | | | | |
| | 0.033%, 05/16/2013 (b) | | | 21,000,000 | | | | 20,999,213 | | | | 25.63 | % |
| | 0.013%, 06/13/2013 (b) | | | 16,000,000 | | | | 15,999,044 | | | | 19.52 | % |
| | 0.043%, 07/18/2013 (b) | | | 16,000,000 | | | | 15,998,528 | | | | 19.52 | % |
| | | | | | | | | | | | | | |
| | Total U.S. Treasury Bill | | | | | | | | | | | | |
| | (Cost $52,997,044) | | | | | | | 52,996,785 | | | | 64.67 | % |
| | | | | | | | | | | | | | |
| | Money Market Funds – 1.58% | | | | | | | | | | | | |
| | Fidelity Government Portfolio – | | | | | | | | | | | | |
| | Institutional Class, 0.01% (a) | | | 1,298,316 | | | | 1,298,316 | | | | 1.58 | % |
| | | | | | | | | | | | | | |
| | Total Money Market Funds | | | | | | | | | | | | |
| | (Cost $1,298,316) | | | | | | | 1,298,316 | | | | 1.58 | % |
| | | | | | | | | | | | | | |
| | Total Short-Term Investments | | | | | | | | | | | | |
| | (Cost $54,295,360) | | | | | | | 54,295,101 | | | | 66.25 | % |
| | | | | | | | | | | | | | |
| | Total Investments | | | | | | | | | | | | |
| | (Cost $99,795,418) – 139.43% | | | | | | | 114,273,235 | | | | 139.43 | % |
| | | | | | | | | | | | | | |
| | Liabilities in Excess of | | | | | | | | | | | | |
| | Other Assets – (39.43)% | | | | | | | (32,315,670 | ) | | | (39.43 | )% |
| | TOTAL NET ASSETS – 100.00% | | | | | | $ | 81,957,565 | | | | 100.00 | % |
Percentages are stated as a percent of net assets.
| | (a) | The rate listed is the fund’s 7-day yield as of April 30, 2013. |
| | (b) | The rate listed is discount rate at issue. |
The accompanying notes are an integral part of these financial statements.
Summary of Fair Value Exposure at April 30, 2013
The following is a summary of the inputs used to value the Fund’s net assets as of April 30, 2013 (See Note 3 in the accompanying notes to the financial statements):
| | Common Stock | | Level 1 | | | Level 2 | | | Level 3 | | | Total | |
| | Consumer Discretionary | | $ | 3,462,546 | | | $ | — | | | $ | — | | | $ | 3,462,546 | |
| | Consumer Staples | | | 4,417,314 | | | | — | | | | — | | | | 4,417,314 | |
| | Energy | | | 3,343,074 | | | | — | | | | — | | | | 3,343,074 | |
| | Financials | | | 2,700,451 | | | | — | | | | — | | | | 2,700,451 | |
| | Health Care | | | 17,315,839 | | | | — | | | | — | | | | 17,315,839 | |
| | Industrials | | | 3,332,355 | | | | — | | | | — | | | | 3,332,355 | |
| | Information Technology | | | 8,336,952 | | | | — | | | | — | | | | 8,336,952 | |
| | Materials | | | 5,445,549 | | | | — | | | | — | | | | 5,445,549 | |
| | Telecommunication Services | | | 11,624,054 | | | | — | | | | — | | | | 11,624,054 | |
| | Total Common Stock | | $ | 59,978,134 | | | $ | — | | | $ | — | | | $ | 59,978,134 | |
| | Short-Term Investments | | | | | | | | | | | | | | | | |
| | Money Market Funds | | $ | 1,298,316 | | | $ | — | | | $ | — | | | $ | 1,298,316 | |
| | U.S. Treasury Bills | | | — | | | | 52,996,785 | | | | — | | | | 52,996,785 | |
| | Total Short-Term Investments | | $ | 1,298,316 | | | $ | 52,996,785 | | | $ | — | | | $ | 54,295,101 | |
| | Total Investments in Securities | | $ | 61,276,450 | | | $ | 52,996,785 | | | $ | — | | | $ | 114,273,235 | |
Transfers between levels are recognized at the end of the reporting period. During the six-month period ended April 30, 2013, the Fund recognized no transfers between levels.
Reverse repurchase agreements are carried at face value; hence, they are not included in the fair valuation hierarchy. The face value of the reverse repurchase agreements at April 30, 2013 was $32,382,000. Due to the short term nature of the reverse repurchase agreements, face value approximates fair value. The face value plus interest due at maturity is equal to $32,401,770.
The accompanying notes are an integral part of these financial statements.
HENNESSY FUNDS 1-800-966-4354
Schedule of Reverse Repurchase Agreements
Hennessy Total Return Fund as of April 30, 2013 (Unaudited) |
| Face | | | | | | Principal | Maturity | | Maturity | |
| Value | | Counterparty | | Rate | Trade Date | Date | | Amount | |
| $ | 12,593,000 | | UBS Financial Services, Inc. | | | 0.27 | % | 2/22/13 | 5/16/13 | | $ | 12,600,839 | |
| | 8,995,000 | | UBS Financial Services, Inc. | | | 0.25 | % | 3/22/13 | 6/13/13 | | | 9,000,185 | |
| | 10,794,000 | | UBS Financial Services, Inc. | | | 0.25 | % | 4/19/13 | 7/18/13 | | | 10,800,746 | |
| $ | 32,382,000 | | | | | | | | | | $ | 32,401,770 | |
As of April 30, 2013, the fair value of securities held as collateral for reverse repurchase agreements was $52,996,785 as noted on the Schedule of Investments.
The accompanying notes are an integral part of these financial statements.
HENNESSY EQUITY AND INCOME FUND
As of April 30, 2013 (Unaudited)
(% of Net Assets)
| | TOP TEN HOLDINGS | % net assets |
| | U.S. Treasury Note, 4.125%, 05/15/2015 | 3.47% |
| | CarMax, Inc. | 2.76% |
| | NewMarket Corp. | 2.66% |
| | Eaton Vance Corp. | 2.43% |
| | Bristol-Myers Squibb Co. | 2.37% |
| | U.S. Treasury Note, 2.375%, 03/31/2016 | 2.34% |
| | Verizon Communications, Inc. | 2.33% |
| | Wells Fargo & Co. | 2.31% |
| | Chevron Corp. | 2.31% |
| | Dominion Resources, Inc. | 2.28% |
Note: For presentation purposes, the Fund has grouped some of the industry categories. For purposes of categorizing securities for compliance with Section 8(b)(1) of the Investment Company Act of 1940, the Fund uses more specific industry classifications.
HENNESSY FUNDS 1-800-966-4354
| | COMMON STOCKS – 59.10% | | Number | | | | | | % of | |
| | | | of Shares | | | Value | | | Net Assets | |
| | Consumer Discretionary – 4.39% | | | | | | | | | |
| | CarMax, Inc. (a) | | | 167,699 | | | $ | 7,720,862 | | | | 2.76 | % |
| | Lowes Companies, Inc. | | | 119,216 | | | | 4,580,279 | | | | 1.63 | % |
| | | | | | | | | 12,301,141 | | | | 4.39 | % |
| | | | | | | | | | | | | | |
| | Consumer Staples – 11.96% | | | | | | | | | | | | |
| | Altria Group, Inc. | | | 141,549 | | | | 5,167,954 | | | | 1.84 | % |
| | Brown-Forman Corp., Class B | | | 26,646 | | | | 1,878,543 | | | | 0.67 | % |
| | Energizer Holdings, Inc. | | | 55,442 | | | | 5,355,143 | | | | 1.91 | % |
| | Lorillard, Inc. | | | 61,626 | | | | 2,643,139 | | | | 0.94 | % |
| | Philip Morris International, Inc. | | | 32,583 | | | | 3,114,609 | | | | 1.11 | % |
| | Reynolds American, Inc. | | | 80,951 | | | | 3,838,696 | | | | 1.37 | % |
| | The Coca-Cola Co. | | | 112,941 | | | | 4,780,793 | | | | 1.71 | % |
| | The Hershey Co. | | | 23,358 | | | | 2,082,599 | | | | 0.74 | % |
| | Wal-Mart Stores, Inc. | | | 60,162 | | | | 4,675,791 | | | | 1.67 | % |
| | | | | | | | | 33,537,267 | | | | 11.96 | % |
| | | | | | | | | | | | | | |
| | Energy – 3.95% | | | | | | | | | | | | |
| | Chevron Corp. | | | 53,101 | | | | 6,478,853 | | | | 2.31 | % |
| | ConocoPhillips | | | 76,078 | | | | 4,598,915 | | | | 1.64 | % |
| | | | | | | | | 11,077,768 | | | | 3.95 | % |
| | | | | | | | | | | | | | |
| | Financials – 9.90% | | | | | | | | | | | | |
| | Berkshire Hathaway, Inc., Class B (a) | | | 56,969 | | | | 6,056,944 | | | | 2.16 | % |
| | Blackrock, Inc. | | | 22,838 | | | | 6,086,327 | | | | 2.17 | % |
| | Eaton Vance Corp. | | | 170,570 | | | | 6,802,331 | | | | 2.43 | % |
| | Wells Fargo & Co. | | | 170,593 | | | | 6,479,122 | | | | 2.31 | % |
| | Insurance Group Ltd. (b) | | | 4,031 | | | | 2,331,168 | | | | 0.83 | % |
| | | | | | | | | 27,755,892 | | | | 9.90 | % |
| | | | | | | | | | | | | | |
| | Health Care – 3.64% | | | | | | | | | | | | |
| | Bristol-Myers Squibb Co. | | | 167,078 | | | | 6,636,338 | | | | 2.37 | % |
| | Pfizer, Inc. | | | 122,835 | | | | 3,570,814 | | | | 1.27 | % |
| | | | | | | | | 10,207,152 | | | | 3.64 | % |
| | | | | | | | | | | | | | |
| | Industrials – 2.94% | | | | | | | | | | | | |
| | FedEx Corp. | | | 31,258 | | | | 2,938,564 | | | | 1.05 | % |
| | General Dynamics Corp. | | | 71,800 | | | | 5,310,328 | | | | 1.89 | % |
| | | | | | | | | 8,248,892 | | | | 2.94 | % |
| | | | | | | | | | | | | | |
| | Information Technology – 10.14% | | | | | | | | | | | | |
| | Cisco Systems, Inc. | | | 193,306 | | | | 4,043,962 | | | | 1.44 | % |
| | Corning, Inc. | | | 319,037 | | | | 4,626,036 | | | | 1.65 | % |
| | EMC Corp. (a) | | | 208,543 | | | | 4,677,619 | | | | 1.67 | % |
| | Intel Corp. | | | 189,349 | | | | 4,534,909 | | | | 1.62 | % |
| | International Business Machines Corp. | | | 16,735 | | | | 3,389,507 | | | | 1.21 | % |
| | Microsoft Corp. | | | 82,383 | | | | 2,726,877 | | | | 0.97 | % |
| | Visa, Inc., Class A | | | 26,249 | | | | 4,421,907 | | | | 1.58 | % |
| | | | | | | | | 28,420,817 | | | | 10.14 | % |
| | | | | | | | | | | | | | |
| | Materials – 6.80% | | | | | | | | | | | | |
| | Albemarle Corp. | | | 101,175 | | | | 6,196,969 | | | | 2.21 | % |
| | MeadWestvaco Corp. | | | 156,997 | | | | 5,413,256 | | | | 1.93 | % |
| | NewMarket Corp. | | | 27,680 | | | | 7,437,616 | | | | 2.66 | % |
| | | | | | | | | 19,047,841 | | | | 6.80 | % |
| | | | | | | | | | | | | | |
| | Telecommunication Services – 2.33% | | | | | | | | | | | | |
| | Verizon Communications, Inc. | | | 121,048 | | | | 6,525,698 | | | | 2.33 | % |
| | | | | | | | | | | | | | |
| | Utilities – 3.05% | | | | | | | | | | | | |
| | Dominion Resources, Inc. | | | 103,401 | | | | 6,377,774 | | | | 2.28 | % |
| | Duke Energy Corp. | | | 28,692 | | | | 2,157,638 | | | | 0.77 | % |
| | | | | | | | | 8,535,412 | | | | 3.05 | % |
| | Total Common Stocks | | | | | | | | | | | | |
| | (Cost $132,608,374) | | | | | | | 165,657,880 | | | | 59.10 | % |
| | | | | | | | | | | | | | |
| | PREFERRED STOCKS – 0.02% | | | | | | | | | | | | |
| | | | | | | | | | | | | | |
| | Financials – 0.02% | | | | | | | | | | | | |
| | Fannie Mae Preferred (a) | | | 10,600 | | | | 48,548 | | | | 0.02 | % |
| | | | | | | | | | | | | | |
| | Total Preferred Stocks | | | | | | | | | | | | |
| | (Cost $265,000) | | | | | | | 48,548 | | | | 0.02 | % |
| | | | | | | | | | | | | | |
| | REITS – 0.12% | | | | | | | | | | | | |
| | | | | | | | | | | | | | |
| | Financials – 0.12% | | | | | | | | | | | | |
| | Apollo Commercial | | | | | | | | | | | | |
| | Real Estate Finance, Inc. | | | 19,000 | | | | 337,060 | | | | 0.12 | % |
| | | | | | | | | | | | | | |
| | Total Reits | | | | | | | | | | | | |
| | (Cost $321,799) | | | | | | | 337,060 | | | | 0.12 | % |
| | | | | | | | | | | | | | |
| | CORPORATE BONDS – 19.73% | | | | | | | | | | | | |
| | | | | | | | | | | | | | |
| | Consumer Discretionary – 0.84% | | | | | | | | | | | | |
| | Best Buy Company, Inc. | | | | | | | | | | | | |
| | 7.250%, 07/15/2013 | | | 300,000 | | | | 305,250 | | | | 0.11 | % |
| | Comcast Corp. | | | | | | | | | | | | |
| | 4.950%, 06/15/2016 | | | 600,000 | | | | 675,638 | | | | 0.24 | % |
| | Ford Motor Credit Co LLC | | | | | | | | | | | | |
| | 3.000%, 06/12/2017 | | | 750,000 | | | | 778,137 | | | | 0.28 | % |
| | Starbucks Corp. | | | | | | | | | | | | |
| | 6.250%, 08/15/2017 | | | 300,000 | | | | 360,652 | | | | 0.13 | % |
| | The Home Depot, Inc. | | | | | | | | | | | | |
| | 5.400%, 03/01/2016 | | | 200,000 | | | | 226,134 | | | | 0.08 | % |
| | | | | | | | | 2,345,811 | | | | 0.84 | % |
| | | | | | | | | | | | | | |
| | Consumer Staples – 0.75% | | | | | | | | | | | | |
| | Anheuser-Busch InBev Worldwide, Inc. | | | | | | | | | | | | |
| | 7.750%, 01/15/2019 | | | 150,000 | | | | 198,109 | | | | 0.07 | % |
| | CVS Caremark Corp. | | | | | | | | | | | | |
| | 4.750%, 05/18/2020 | | | 400,000 | | | | 469,046 | | | | 0.17 | % |
| | 5.750%, 06/01/2017 | | | 600,000 | | | | 710,082 | | | | 0.25 | % |
| | Diageo Capital PLC -ADR (b) | | | | | | | | | | | | |
| | 7.375%, 01/15/2014 | | | 350,000 | | | | 366,719 | | | | 0.13 | % |
| | Wal-Mart Stores, Inc. | | | | | | | | | | | | |
| | 5.000%, 10/25/2040 | | | 300,000 | | | | 354,940 | | | | 0.13 | % |
| | | | | | | | | 2,098,896 | | | | 0.75 | % |
The accompanying notes are an integral part of these financial statements.
| | CORPORATE BONDS | | Number | | | | | | % of | |
| | | | of Shares | | | Value | | | Net Assets | |
| | Energy – 0.13% | | | | | | | | | |
| | Devon Energy Corp. | | | | | | | | | |
| | 5.625%, 01/15/2014 | | | 200,000 | | | $ | 207,071 | | | | 0.07 | % |
| | Husky Energy, Inc.- ADR (b) | | | | | | | | | | | | |
| | 5.900%, 06/15/2014 | | | 150,000 | | | | 158,424 | | | | 0.06 | % |
| | | | | | | | | 365,495 | | | | 0.13 | % |
| | | | | | | | | | | | | | |
| | Financials – 11.44% | | | | | | | | | | | | |
| | Aflac, Inc. | | | | | | | | | | | | |
| | 8.500%, 05/15/2019 | | | 650,000 | | | | 883,562 | | | | 0.32 | % |
| | American Express Co. | | | | | | | | | | | | |
| | 6.150%, 08/28/2017 | | | 800,000 | | | | 960,466 | | | | 0.34 | % |
| | American Express Credit Corp. | | | | | | | | | | | | |
| | 2.750%, 09/15/2015 | | | 650,000 | | | | 681,281 | | | | 0.24 | % |
| | American International Group, Inc. | | | | | | | | | | | | |
| | 5.850%, 01/16/2018 | | | 575,000 | | | | 675,903 | | | | 0.24 | % |
| | American International Group, Inc. | | | | | | | | | | | | |
| | 4.875%, 06/01/2022 | | | 600,000 | | | | 692,416 | | | | 0.25 | % |
| | Associated Banc-Corp | | | | | | | | | | | | |
| | 5.125%, 03/28/2016 | | | 700,000 | | | | 768,104 | | | | 0.27 | % |
| | Associates Corporation of North America | | | | | | | | | | | | |
| | 6.950%, 11/01/2018 | | | 300,000 | | | | 370,168 | | | | 0.13 | % |
| | Bank New York Mellon Corp. | | | | | | | | | | | | |
| | 1.969%, 06/20/2017 | | | 500,000 | | | | 517,846 | | | | 0.18 | % |
| | Bank of Montreal – ADR (b) | | | | | | | | | | | | |
| | 2.500%, 01/11/2017 | | | 400,000 | | | | 419,992 | | | | 0.15 | % |
| | Capital One Financial Corp. | | | | | | | | | | | | |
| | 4.750%, 07/15/2021 | | | 1,000,000 | | | | 1,149,852 | | | | 0.41 | % |
| | Caterpillar Financial Services Corp. | | | | | | | | | | | | |
| | 4.900%, 08/15/2013 | | | 325,000 | | | | 329,226 | | | | 0.12 | % |
| | Citigroup, Inc. | | | | | | | | | | | | |
| | 6.125%, 11/21/2017 | | | 1,455,000 | | | | 1,732,013 | | | | 0.62 | % |
| | CME Group, Inc. | | | | | | | | | | | | |
| | 5.750%, 02/15/2014 | | | 375,000 | | | | 390,343 | | | | 0.14 | % |
| | Credit Suisse USA, Inc. | | | | | | | | | | | | |
| | 5.125%, 08/15/2015 | | | 575,000 | | | | 630,654 | | | | 0.22 | % |
| | Discover Financial Services | | | | | | | | | | | | |
| | 5.200%, 04/27/2022 | | | 900,000 | | | | 1,033,507 | | | | 0.37 | % |
| | Fifth Third Bancorp | | | | | | | | | | | | |
| | 3.625%, 01/25/2016 | | | 700,000 | | | | 749,258 | | | | 0.27 | % |
| | First Niagara Financial Group, Inc. | | | | | | | | | | | | |
| | 6.750%, 03/19/2020 | | | 590,000 | | | | 722,851 | | | | 0.26 | % |
| | General Electric Capital Corp. | | | | | | | | | | | | |
| | 0.000%, 04/02/2018 | | | 500,000 | | | | 504,300 | | | | 0.18 | % |
| | General Electric Capital Corp. | | | | | | | | | | | | |
| | 5.500%, 06/04/2014 | | | 250,000 | | | | 263,673 | | | | 0.09 | % |
| | 5.625%, 05/01/2018 | | | 1,050,000 | | | | 1,250,253 | | | | 0.45 | % |
| | Genworth Financial, Inc. | | | | | | | | | | | | |
| | 6.515%, 05/22/2018 | | | 500,000 | | | | 581,745 | | | | 0.21 | % |
| | HSBC Finance Corp. | | | | | | | | | | | | |
| | 2.375%, 02/13/2015 | | | 1,000,000 | | | | 1,030,688 | | | | 0.37 | % |
| | 5.000%, 06/30/2015 | | | 700,000 | | | | 756,246 | | | | 0.27 | % |
| | JPMorgan Chase & Co. | | | | | | | | | | | | |
| | 5.125%, 09/15/2014 | | | 650,000 | | | | 688,901 | | | | 0.25 | % |
| | KeyCorp | | | | | | | | | | | | |
| | 3.750%, 08/13/2015 | | | 400,000 | | | | 426,240 | | | | 0.15 | % |
| | 5.100%, 03/24/2021 | | | 450,000 | | | | 532,252 | | | | 0.19 | % |
| | Lazard Group | | | | | | | | | | | | |
| | 6.850%, 06/15/2017 | | | 320,000 | | | | 368,394 | | | | 0.13 | % |
| | Lincoln National Corp. | | | | | | | | | | | | |
| | 6.250%, 02/15/2020 | | | 780,000 | | | | 958,146 | | | | 0.34 | % |
| | Manulife Financial Corp. – ADR (b) | | | | | | | | | | | | |
| | 3.400%, 09/17/2015 | | | 300,000 | | | | 317,009 | | | | 0.11 | % |
| | Merrill Lynch & Company, Inc. | | | | | | | | | | | | |
| | 6.875%, 04/25/2018 | | | 455,000 | | | | 553,739 | | | | 0.20 | % |
| | Merrill Lynch & Company, | | | | | | | | | | | | |
| | Inc., Series MTNC (c) | | | | | | | | | | | | |
| | 0.737%, 01/15/2015 | | | 250,000 | | | | 248,886 | | | | 0.09 | % |
| | MetLife, Inc., Series A | | | | | | | | | | | | |
| | 6.817%, 08/15/2018 | | | 100,000 | | | | 125,846 | | | | 0.04 | % |
| | Morgan Stanley | | | | | | | | | | | | |
| | 4.750%, 04/01/2014 | | | 250,000 | | | | 257,963 | | | | 0.09 | % |
| | 5.750%, 01/25/2021 | | | 250,000 | | | | 298,044 | | | | 0.11 | % |
| | 6.625%, 04/01/2018 | | | 250,000 | | | | 300,024 | | | | 0.11 | % |
| | Northern Trust Corp. | | | | | | | | | | | | |
| | 3.375%, 08/23/2021 | | | 500,000 | | | | 542,386 | | | | 0.19 | % |
| | Prudential Financial, Inc. | | | | | | | | | | | | |
| | 5.500%, 03/15/2016 | | | 310,000 | | | | 348,824 | | | | 0.12 | % |
| | Prudential Financial, Inc., Series MTNB | | | | | | | | | | | | |
| | 5.100%, 09/20/2014 | | | 285,000 | | | | 302,294 | | | | 0.11 | % |
| | Qwest Capital Funding, Inc. | | | | | | | | | | | | |
| | 6.500%, 11/15/2018 | | | 700,000 | | | | 791,856 | | | | 0.28 | % |
| | Raymond James Financial, Inc. | | | | | | | | | | | | |
| | 5.625%, 04/01/2024 | | | 700,000 | | | | 811,176 | | | | 0.29 | % |
| | Simon Property Group, Inc. | | | | | | | | | | | | |
| | 6.100%, 05/01/2016 | | | 1,010,000 | | | | 1,152,577 | | | | 0.41 | % |
| | St. Paul Travelers, Inc. | | | | | | | | | | | | |
| | 5.500%, 12/01/2015 | | | 275,000 | | | | 308,993 | | | | 0.11 | % |
| | SunTrust Banks, Inc. | | | | | | | | | | | | |
| | 3.600%, 04/15/2016 | | | 250,000 | | | | 268,220 | | | | 0.10 | % |
| | 6.000%, 09/11/2017 | | | 250,000 | | | | 296,177 | | | | 0.11 | % |
| | The Bear Stearns Companies, Inc. | | | | | | | | | | | | |
| | 6.400%, 10/02/2017 | | | 1,350,000 | | | | 1,621,045 | | | | 0.58 | % |
| | The Goldman Sachs Group, Inc. | | | | | | | | | | | | |
| | 5.375%, 03/15/2020 | | | 1,100,000 | | | | 1,285,312 | | | | 0.46 | % |
| | The Hartford Financial | | | | | | | | | | | | |
| | Services Group, Inc. | | | | | | | | | | | | |
| | 5.375%, 03/15/2017 | | | 300,000 | | | | 344,201 | | | | 0.12 | % |
| | The Royal Bank of Scotland PLC (b) | | | | | | | | | | | | |
| | 4.375%, 03/16/2016 | | | 400,000 | | | | 436,744 | | | | 0.16 | % |
| | Wachovia Corp. | | | | | | | | | | | | |
| | 5.250%, 08/01/2014 | | | 300,000 | | | | 316,818 | | | | 0.11 | % |
| | Westpac Banking Corp. – ADR (b) | | | | | | | | | | | | |
| | 4.200%, 02/27/2015 | | | 500,000 | | | | 533,166 | | | | 0.19 | % |
| | 4.875%, 11/19/2019 | | | 450,000 | | | | 532,533 | | | | 0.19 | % |
| | | | | | | | | 32,062,113 | | | | 11.44 | % |
The accompanying notes are an integral part of these financial statements.
HENNESSY FUNDS 1-800-966-4354
| | CORPORATE BONDS | | Number | | | | | | % of | |
| | | | of Shares | | | Value | | | Net Assets | |
| | Health Care – 1.40% | | | | | | | | | |
| | Agilent Technologies, Inc. | | | | | | | | | |
| | 5.000%, 07/15/2020 | | | 650,000 | | | $ | 743,545 | | | | 0.26 | % |
| | GlaxoSmithKline Capital, Inc. – ADR (b) | | | | | | | | | | | | |
| | 1.500%, 05/08/2017 | | | 500,000 | | | | 510,348 | | | | 0.18 | % |
| | 2.850%, 05/08/2022 | | | 1,000,000 | | | | 1,040,402 | | | | 0.37 | % |
| | 4.850%, 05/15/2013 | | | 325,000 | | | | 324,747 | | | | 0.12 | % |
| | Merck and Co., Inc. | | | | | | | | | | | | |
| | 6.000%, 09/15/2017 | | | 850,000 | | | | 1,034,266 | | | | 0.37 | % |
| | UnitedHealth Group, Inc. | | | | | | | | | | | | |
| | 5.375%, 03/15/2016 | | | 250,000 | | | | 281,717 | | | | 0.10 | % |
| | | | | | | | | 3,935,025 | | | | 1.40 | % |
| | | | | | | | | | | | | | |
| | Industrials – 0.63% | | | | | | | | | | | | |
| | John Deere Capital Corp. | | | | | | | | | | | | |
| | 1.850%, 09/15/2016 | | | 1,000,000 | | | | 1,034,704 | | | | 0.37 | % |
| | FedEx Corp. | | | | | | | | | | | | |
| | 7.375%, 01/15/2014 | | | 300,000 | | | | 314,312 | | | | 0.11 | % |
| | GE Global Insurance Holding Corp. | | | | | | | | | | | | |
| | 7.000%, 02/15/2026 | | | 150,000 | | | | 197,877 | | | | 0.07 | % |
| | The Boeing Co. | | | | | | | | | | | | |
| | 5.000%, 03/15/2014 | | | 220,000 | | | | 228,773 | | | | 0.08 | % |
| | | | | | | | | 1,775,666 | | | | 0.63 | % |
| | | | | | | | | | | | | | |
| | Information Technology – 1.80% | | | | | | | | | | | | |
| | Altera Corp. | | | | | | | | | | | | |
| | 1.750%, 05/15/2017 | | | 1,000,000 | | | | 1,023,460 | | | | 0.36 | % |
| | Applied Materials, Inc. | | | | | | | | | | | | |
| | 4.300%, 06/15/2021 | | | 300,000 | | | | 338,735 | | | | 0.12 | % |
| | Corning, Inc. | | | | | | | | | | | | |
| | 6.850%, 03/01/2029 | | | 275,000 | | | | 353,523 | | | | 0.13 | % |
| | eBay, Inc. | | | | | | | | | | | | |
| | 3.250%, 10/15/2020 | | | 250,000 | | | | 271,210 | | | | 0.10 | % |
| | Intel Corp. | | | | | | | | | | | | |
| | 3.300%, 10/01/2021 | | | 250,000 | | | | 266,649 | | | | 0.09 | % |
| | Juniper Networks, Inc. | | | | | | | | | | | | |
| | 4.600%, 03/15/2021 | | | 1,000,000 | | | | 1,093,013 | | | | 0.39 | % |
| | KLA-Tencor Corp. | | | | | | | | | | | | |
| | 6.900%, 05/01/2018 | | | 650,000 | | | | 783,398 | | | | 0.28 | % |
| | Symantec Corp. | | | | | | | | | | | | |
| | 3.950%, 06/15/2022 | | | 500,000 | | | | 520,900 | | | | 0.19 | % |
| | 4.200%, 09/15/2020 | | | 350,000 | | | | 379,975 | | | | 0.14 | % |
| | | | | | | | | 5,030,863 | | | | 1.80 | % |
| | | | | | | | | | | | | | |
| | Materials – 1.52% | | | | | | | | | | | | |
| | Alcoa, Inc. | | | | | | | | | | | | |
| | 6.150%, 08/15/2020 | | | 625,000 | | | | 682,308 | | | | 0.24 | % |
| | AngloGold Ashanti Holdings | | | | | | | | | | | | |
| | PLC – ADR (b) | | | | | | | | | | | | |
| | 5.125%, 08/01/2022 | | | 1,000,000 | | | | 1,009,084 | | | | 0.36 | % |
| | Barrick Gold Financeco LLC – ADR (b) | | | | | | | | | | | | |
| | 6.125%, 09/15/2013 | | | 350,000 | | | | 356,823 | | | | 0.13 | % |
| | BHP Billiton Finance USA Ltd.- ADR (b) | | | | | | | | | | | | |
| | 6.750%, 11/01/2013 | | | 250,000 | | | | 257,892 | | | | 0.09 | % |
| | El du Pont de Nemours & Co. | | | | | | | | | | | | |
| | 4.750%, 03/15/2015 | | | 315,000 | | | | 339,436 | | | | 0.12 | % |
| | International Paper Co. | | | | | | | | | | | | |
| | 9.375%, 05/15/2019 | | | 250,000 | | | | 346,836 | | | | 0.13 | % |
| | Rio Tinto Finance USA PLC – ADR (b) | | | | | | | | | | | | |
| | 2.000%, 03/22/2017 | | | 640,000 | | | | 657,583 | | | | 0.23 | % |
| | The Dow Chemical Co. | | | | | | | | | | | | |
| | 4.250%, 11/15/2020 | | | 550,000 | | | | 612,715 | | | | 0.22 | % |
| | | | | | | | | 4,262,677 | | | | 1.52 | % |
| | | | | | | | | | | | | | |
| | Telecommunication Services – 1.11% | | | | | | | | | | | | |
| | AT&T, Inc. | | | | | | | | | | | | |
| | 5.800%, 02/15/2019 | | | 300,000 | | | | 365,197 | | | | 0.13 | % |
| | AT&T, Inc. | | | | | | | | | | | | |
| | 2.950%, 05/15/2016 | | | 275,000 | | | | 291,551 | | | | 0.10 | % |
| | 3.000%, 02/15/2022 | | | 250,000 | | | | 260,198 | | | | 0.09 | % |
| | 5.350%, 09/01/2040 | | | 200,000 | | | | 226,670 | | | | 0.08 | % |
| | CenturyLink, Inc. | | | | | | | | | | | | |
| | 5.150%, 06/15/2017 | | | 400,000 | | | | 433,010 | | | | 0.15 | % |
| | Deutsche Telekom | | | | | | | | | | | | |
| | International Finance BV – ADR (b) | | | | | | | | | | | | |
| | 5.875%, 08/20/2013 | | | 400,000 | | | | 406,326 | | | | 0.15 | % |
| | Verizon Communications, Inc. | | | | | | | | | | | | |
| | 6.350%, 04/01/2019 | | | 600,000 | | | | 744,701 | | | | 0.27 | % |
| | 8.750%, 11/01/2018 | | | 292,000 | | | | 394,926 | | | | 0.14 | % |
| | | | | | | | | 3,122,579 | | | | 1.11 | % |
| | | | | | | | | | | | | | |
| | Utilities – 0.11% | | | | | | | | | | | | |
| | Sempra Energy | | | | | | | | | | | | |
| | 6.500%, 06/01/2016 | | | 275,000 | | | | 319,970 | | | | 0.11 | % |
| | | | | | | | | | | | | | |
| | Total Corporate Bonds | | | | | | | | | | | | |
| | (Cost $52,175,123) | | | | | | | 55,319,095 | | | | 19.73 | % |
| | | | | | | | | | | | | | |
| | MORTGAGE BACKED SECURITIES – 5.06% | | | | | | | | | | | | |
| | | | | | | | | | | | | | |
| | Federal Home Loan Mortgage Corp. | | | | | | | | | | | | |
| | 3.000%, 05/01/2042 | | | 4,581,849 | | | | 4,779,755 | | | | 1.70 | % |
| | 3.000%, 09/01/2042 | | | 2,955,568 | | | | 3,083,229 | | | | 1.10 | % |
| | 5.000%, 05/01/2020 | | | 179,210 | | | | 193,604 | | | | 0.07 | % |
| | 5.500%, 04/01/2037 | | | 344,667 | | | | 384,284 | | | | 0.14 | % |
| | | | | | | | | | | | | | |
| | Federal National Mortgage Association | | | | | | | | | | | | |
| | 2.400%, 11/07/2024 | | | 1,000,000 | | | | 1,008,333 | | | | 0.36 | % |
| | 3.500%, 01/01/2042 | | | 1,041,137 | | | | 1,110,682 | | | | 0.40 | % |
| | 4.000%, 12/01/2041 | | | 1,441,203 | | | | 1,544,213 | | | | 0.55 | % |
| | 4.000%, 10/01/2041 | | | 1,451,445 | | | | 1,555,187 | | | | 0.55 | % |
| | 4.500%, 08/01/2020 | | | 195,862 | | | | 210,563 | | | | 0.08 | % |
| | 6.000%, 10/01/2037 | | | 279,566 | | | | 306,510 | | | | 0.11 | % |
| | | | | | | | | | | | | | |
| | Total Mortgage Backed Securities | | | | | | | | | | | | |
| | (Cost $13,886,268) | | | | | | | 14,176,360 | | | | 5.06 | % |
| | | | | | | | | | | | | | |
| | U.S. GOVERNMENT AGENCY ISSUE – 0.26% | | | | | | | | | | | | |
| | | | | | | | | | | | | | |
| | Federal Home Loan Banks | | | | | | | | | | | | |
| | 5.750%, 06/15/2037 | | | 600,000 | | | | 720,079 | | | | 0.26 | % |
| | | | | | | | | | | | | | |
| | Total U.S. Government Agency Issue | | | | | | | | | | | | |
| | (Cost $700,356) | | | | | | | 720,079 | | | | 0.26 | % |
The accompanying notes are an integral part of these financial statements.
| | U.S. TREASURY OBLIGATIONS – 9.74% | | Number | | | | | | % of | |
| | | | of Shares | | | Value | | | Net Assets | |
| | U.S. Treasury Bonds – 0.67% | | | | | | | | | |
| | U.S. Treasury Inflation Index Bond | | | | | | | | | |
| | 0.125%, 07/15/2022 | | | 984,341 | | | $ | 1,074,470 | | | | 0.38 | % |
| | United States Treasury Bond | | | | | | | | | | | | |
| | 3.125%, 02/15/2042 | | | 765,000 | | | | 803,847 | | | | 0.29 | % |
| | | | | | | | | 1,878,317 | | | | 0.67 | % |
| | | | | | | | | | | | | | |
| | U.S. Treasury Notes – 9.07% | | | | | | | | | | | | |
| | U.S. Treasury Note | | | | | | | | | | | | |
| | 2.250%, 05/31/2014 | | | 5,000,000 | | | | 5,114,065 | | | | 1.82 | % |
| | 2.375%, 03/31/2016 | | | 6,190,000 | | | | 6,563,820 | | | | 2.34 | % |
| | 4.125%, 05/15/2015 | | | 9,000,000 | | | | 9,712,971 | | | | 3.47 | % |
| | 3.125%, 05/15/2021 | | | 1,250,000 | | | | 1,423,438 | | | | 0.51 | % |
| | 2.000%, 02/15/2022 | | | 2,500,000 | | | | 2,606,250 | | | | 0.93 | % |
| | | | | | | | | 25,420,544 | | | | 9.07 | % |
| | Total U.S. Treasury Obligations | | | | | | | | | | | | |
| | (Cost $27,255,292) | | | | | | | 27,298,861 | | | | 9.74 | % |
| | | | | | | | | | | | | | |
| | EXCHANGE TRADED FUNDS – 3.11% | | | | | | | | | | | | |
| | | | | | | | | | | | | | |
| | iShares iBoxx $High Yield | | | | | | | | | | | | |
| | Corporation Bond Fund (a) | | | 33,000 | | | | 3,163,050 | | | | 1.13 | % |
| | iShares S&P U.S. Preferred | | | | | | | | | | | | |
| | Stock Index Fund (a) | | | 14,500 | | | | 591,165 | | | | 0.21 | % |
| | PowerShares Senior Loan Portfolio (a) | | | 50,000 | | | | 1,259,500 | | | | 0.45 | % |
| | SPDR Barclays Capital High Yield Bond (a) | | | 70,000 | | | | 2,922,500 | | | | 1.04 | % |
| | SPDR Barclays Short Term | | | | | | | | | | | | |
| | High Yield Bond (a) | | | 25,000 | | | | 778,500 | | | | 0.28 | % |
| | | | | | | | | | | | | | |
| | Total Exchange Traded Funds | | | | | | | | | | | | |
| | (Cost $8,484,846) | | | | | | | 8,714,715 | | | | 3.11 | % |
| | | | | | | | | | | | | | |
| | MUTUAL FUNDS – 0.24% | | | | | | | | | | | | |
| | | | | | | | | | | | | | |
| | Calamos Convertible | | | | | | | | | | | | |
| | Opportunity And Income Fund | | | 26,000 | | | | 332,280 | | | | 0.12 | % |
| | NGP Capital Resources Co. | | | 8,000 | | | | 53,280 | | | | 0.02 | % |
| | PennantPark Investment Corp. | | | 19,000 | | | | 222,300 | | | | 0.08 | % |
| | Wells Fargo Advantage | | | | | | | | | | | | |
| | Income Opportunities Fund | | | 8,000 | | | | 81,840 | | | | 0.02 | % |
| | | | | | | | | | | | | | |
| | Total Mutual Funds | | | | | | | | | | | | |
| | (Cost $682,661) | | | | | | | 689,700 | | | | 0.24 | % |
| | | | | | | | | | | | | | |
| | SHORT-TERM INVESTMENT – 2.46% | | | | | | | | | | | | |
| | | | | | | | | | | | | | |
| | Money Market Funds – 2.46% | | | | | | | | | | | | |
| | Fidelity Government Portfolio – | | | | | | | | | | | | |
| | Institutional Class, 0.01 (d) | | | 6,889,413 | | | | 6,889,413 | | | | 2.46 | % |
| | | | | | | | | | | | | | |
| | Total Money Market Funds | | | | | | | | | | | | |
| | (Cost $6,889,413) | | | | | | | 6,889,413 | | | | 2.46 | % |
| | | | | | | | | | | | | | |
| | Total Short-Term Investments | | | | | | | | | | | | |
| | (Cost $6,889,413) | | | | | | | 6,889,413 | | | | 2.46 | % |
| | | | | | | | | | | | | | |
| | Total Investments | | | | | | | | | | | | |
| | (Cost $243,269,132) – 99.84% | | | | | | | 279,851,711 | | | | 99.84 | % |
| | Other Assets in Excess | | | | | | | | | | | | |
| | of Liabilities – 0.16% | | | | | | | 446,511 | | | | 0.16 | % |
| | TOTAL NET ASSETS – 100.00% | | | | | | $ | 280,298,222 | | | | 100.00 | % |
Percentages are stated as a percent of net assets.
ADR – American Depositary Receipt
| | (a) | Non-income producing security. |
| | (b) | U.S. traded security of a foreign corporation. |
| | (c) | Variable/floating rate security |
| | (d) | The rate listed is the fund’s 7-day yield as of April 30, 2013. |
The accompanying notes are an integral part of these financial statements.
HENNESSY FUNDS 1-800-966-4354
Summary of Fair Value Exposure at April 30, 2013
The following is a summary of the inputs used to value the Fund’s net assets as of April 30, 2013 (See Note 3 in the accompanying notes to the financial statements):
| | Common Stock | | Level 1 | | | Level 2 | | | Level 3 | | | Total | |
| | Consumer Discretionary | | $ | 12,301,141 | | | $ | — | | | $ | — | | | $ | 12,301,141 | |
| | Consumer Staples | | | 33,537,267 | | | | — | | | | — | | | | 33,537,267 | |
| | Energy | | | 11,077,768 | | | | — | | | | — | | | | 11,077,768 | |
| | Financials | | | 27,755,892 | | | | — | | | | — | | | | 27,755,892 | |
| | Health Care | | | 10,207,152 | | | | — | | | | — | | | | 10,207,152 | |
| | Industrials | | | 8,248,892 | | | | — | | | | — | | | | 8,248,892 | |
| | Information Technology | | | 28,420,817 | | | | — | | | | — | | | | 28,420,817 | |
| | Materials | | | 19,047,841 | | | | — | | | | — | | | | 19,047,841 | |
| | Telecommunication Services | | | 6,525,698 | | | | — | | | | — | | | | 6,525,698 | |
| | Utilities | | | 8,535,412 | | | | — | | | | — | | | | 8,535,412 | |
| | Total Common Stock | | $ | 165,657,880 | | | $ | — | | | $ | — | | | $ | 165,657,880 | |
| | Preferred Stock | | $ | 48,548 | | | $ | — | | | $ | — | | | $ | 48,548 | |
| | REITS | | | | | | | | | | | | | | | | |
| | Financials | | $ | 337,060 | | | $ | — | | | $ | — | | | $ | 337,060 | |
| | Corporate Bonds | | | | | | | | | | | | | | | | |
| | Consumer Discretionary | | $ | — | | | $ | 2,345,811 | | | $ | — | | | $ | 2,345,811 | |
| | Consumer Staples | | | — | | | | 2,098,896 | | | | — | | | | 2,098,896 | |
| | Energy | | | — | | | | 365,495 | | | | — | | | | 365,495 | |
| | Financials | | | — | | | | 32,062,113 | | | | — | | | | 32,062,113 | |
| | Health Care | | | — | | | | 3,935,025 | | | | — | | | | 3,935,025 | |
| | Industrials | | | — | | | | 1,775,666 | | | | — | | | | 1,775,666 | |
| | Information Technology | | | — | | | | 5,030,863 | | | | — | | | | 5,030,863 | |
| | Materials | | | — | | | | 4,262,677 | | | | — | | | | 4,262,677 | |
| | Telecommunication Services | | | — | | | | 3,122,579 | | | | — | | | | 3,122,579 | |
| | Utilities | | | — | | | | 319,970 | | | | — | | | | 319,970 | |
| | Total Corporate Bonds | | $ | — | | | $ | 55,319,095 | | | $ | — | | | $ | 55,319,095 | |
| | Mortgage Backed Securities | | $ | — | | | $ | 14,176,360 | | | $ | — | | | $ | 14,176,360 | |
| | U.S. Government Agency Issues | | $ | — | | | $ | 720,079 | | | $ | — | | | $ | 720,079 | |
| | U.S. Treasury Obligations | | | | | | | | | | | | | | | | |
| | U.S. Treasury Bonds | | $ | — | | | $ | 1,878,317 | | | $ | — | | | $ | 1,878,317 | |
| | U.S. Treasury Notes | | | — | | | | 25,420,544 | | | | — | | | | 25,420,544 | |
| | Total U.S. Treasury Obligations | | $ | — | | | $ | 27,298,861 | | | $ | — | | | $ | 27,298,861 | |
| | Exchange Traded Funds | | $ | 8,714,715 | | | $ | — | | | $ | — | | | $ | 8,714,715 | |
| | Mutual Funds | | $ | 689,700 | | | $ | — | | | $ | — | | | $ | 689,700 | |
| | Short-Term Investments | | | | | | | | | | | | | | | | |
| | Money Market Funds | | $ | 6,889,413 | | | $ | — | | | $ | — | | | $ | 6,889,413 | |
| | Total Short-Term Investments | | $ | 6,889,413 | | | $ | — | | | $ | — | | | $ | 6,889,413 | |
| | Total Investments in Securities | | $ | 182,337,316 | | | $ | 97,514,395 | | | $ | — | | | $ | 279,851,711 | |
Transfers between levels are recognized at the end of the reporting period. During the six-month period ended April 30, 2013, the Fund recognized no transfers between levels.
The accompanying notes are an integral part of these financial statements.
HENNESSY BALANCED FUND
As of April 30, 2013 (Unaudited)
(% of Net Assets)
| | TOP TEN EQUITY HOLDINGS | % net assets |
| | EI Du Pont de Nemours & Co. | 5.30% |
| | Merck & Co., Inc. | 5.21% |
| | Chevron Corp. | 5.18% |
| | Verizon Communications, Inc. | 4.96% |
| | Johnson & Johnson | 4.86% |
| | Pfizer, Inc. | 4.86% |
| | Intel Corp. | 4.76% |
| | Procter & Gamble Co. | 4.24% |
| | AT&T, Inc. | 4.20% |
| | General Electric Co. | 3.42% |
Note: For presentation purposes, the Fund has grouped some of the industry categories. For purposes of categorizing securities for compliance with Section 8(b)(1) of the Investment Company Act of 1940, the Fund uses more specific industry classifications.
HENNESSY FUNDS 1-800-966-4354
| | COMMON STOCKS – 52.39% | | Number | | | | | | % of | |
| | | | of Shares | | | Value | | | Net Assets | |
| | Consumer Discretionary – 0.27% | | | | | | | | | |
| | McDonald’s Corp. | | | 350 | | | $ | 35,749 | | | | 0.27 | % |
| | | | | | | | | | | | | | |
| | Consumer Staples – 4.24% | | | | | | | | | | | | |
| | Procter & Gamble Co. | | | 7,350 | | | | 564,259 | | | | 4.24 | % |
| | | | | | | | | | | | | | |
| | Energy – 5.18% | | | | | | | | | | | | |
| | Chevron Corp. | | | 5,650 | | | | 689,357 | | | | 5.18 | % |
| | | | | | | | | | | | | | |
| | Financials – 2.65% | | | | | | | | | | | | |
| | J.P. Morgan Chase & Co. | | | 7,200 | | | | 352,872 | | | | 2.65 | % |
| | | | | | | | | | | | | | |
| | Health Care – 14.93% | | | | | | | | | | | | |
| | Johnson & Johnson | | | 7,600 | | | | 647,748 | | | | 4.86 | % |
| | Merck & Co., Inc. | | | 14,750 | | | | 693,250 | | | | 5.21 | % |
| | Pfizer, Inc. | | | 22,250 | | | | 646,807 | | | | 4.86 | % |
| | | | | | | | | 1,987,805 | | | | 14.93 | % |
| | | | | | | | | | | | | | |
| | Industrials – 3.42% | | | | | | | | | | | | |
| | General Electric Co. | | | 20,450 | | | | 455,830 | | | | 3.42 | % |
| | | | | | | | | | | | | | |
| | Information Technology – 7.24% | | | | | | | | | | | | |
| | Cisco Systems, Inc. | | | 5,850 | | | | 122,382 | | | | 0.92 | % |
| | Hewlett-Packard Co. | | | 3,350 | | | | 69,010 | | | | 0.52 | % |
| | Intel Corp. | | | 26,450 | | | | 633,478 | | | | 4.76 | % |
| | Microsoft Corp. | | | 4,200 | | | | 139,020 | | | | 1.04 | % |
| | | | | | | | | 963,890 | | | | 7.24 | % |
| | | | | | | | | | | | | | |
| | Materials – 5.30% | | | | | | | | | | | | |
| | EI Du Pont de Nemours & Co. | | | 12,950 | | | | 705,905 | | | | 5.30 | % |
| | | | | | | | | | | | | | |
| | Telecommunication Services – 9.16% | | | | | | | | | | | | |
| | AT&T, Inc. | | | 14,950 | | | | 560,027 | | | | 4.20 | % |
| | Verizon Communications, Inc. | | | 12,250 | | | | 660,398 | | | | 4.96 | % |
| | | | | | | | | 1,220,425 | | | | 9.16 | % |
| | Total Common Stocks | | | | | | | | | | | | |
| | (Cost $5,725,746) | | | | | | | 6,976,092 | | | | 52.39 | % |
| | | | | | | | | | | | | | |
| | SHORT-TERM INVESTMENTS – 47.72% | | | | | | | | | | | | |
| | | | | | | | | | | | | | |
| | U.S. Treasury Bills – 43.54% | | | | | | | | | | | | |
| | 0.070%, 05/02/2013 (b) | | | 200,000 | | | | 200,000 | | | | 1.50 | % |
| | 0.025%, 05/30/2013 (b) | | | 700,000 | | | | 699,993 | | | | 5.25 | % |
| | 0.030%, 06/27/2013 (b) | | | 800,000 | | | | 799,974 | | | | 6.01 | % |
| | 0.045%, 08/22/2013 (b) | | | 1,000,000 | | | | 999,835 | | | | 7.51 | % |
| | 0.110%, 09/19/2013 (b) | | | 800,000 | | | | 799,781 | | | | 6.01 | % |
| | 0.145%, 02/06/2014 (b) | | | 2,000,000 | | | | 1,998,518 | | | | 15.01 | % |
| | 0.150%, 03/06/2014 (b) | | | 300,000 | | | | 299,749 | | | | 2.25 | % |
| | | | | | | | | | | | | | |
| | Total U.S. Treasury Bill | | | | | | | | | | | | |
| | (Cost $5,798,137) | | | | | | | 5,797,850 | | | | 43.54 | % |
| | | | | | | | | | | | | | |
| | Money Market Funds – 4.18% | | | | | | | | | | | | |
| | Fidelity Government Portfolio – | | | | | | | | | | | | |
| | Institutional Class, 0.01% (a) | | | 556,711 | | | | 556,711 | | | | 4.18 | % |
| | | | | | | | | | | | | | |
| | Total Money Market Funds | | | | | | | | | | | | |
| | (Cost $556,711) | | | | | | | 556,711 | | | | 4.18 | % |
| | | | | | | | | | | | | | |
| | Total Short-Term Investments | | | | | | | | | | | | |
| | (Cost $6,354,848) | | | | | | | 6,354,561 | | | | 47.72 | % |
| | | | | | | | | | | | | | |
| | Total Investments | | | | | | | | | | | | |
| | (Cost $12,080,594) – 100.11% | | | | | | | 13,330,653 | | | | 100.11 | % |
| | | | | | | | | | | | | | |
| | Liabilities in Excess of | | | | | | | | | | | | |
| | Other Assets – (0.11)% | | | | | | | (14,548 | ) | | | (0.11 | )% |
| | TOTAL NET ASSETS – 100.00% | | | | | | $ | 13,316,105 | | | | 100.00 | % |
Percentages are stated as a percent of net assets.
| | (a) | The rate listed is the fund’s 7-day yield as of April 30, 2013. |
| | (b) | The rate listed is discount rate at issue. |
The accompanying notes are an integral part of these financial statements.
Summary of Fair Value Exposure at April 30, 2013
The following is a summary of the inputs used to value the Fund’s net assets as of April 30, 2013 (See Note 3 in the accompanying notes to the financial statements):
| | Common Stock | | Level 1 | | | Level 2 | | | Level 3 | | | Total | |
| | Consumer Discretionary | | $ | 35,749 | | | $ | — | | | $ | — | | | $ | 35,749 | |
| | Consumer Staples | | | 564,259 | | | | — | | | | — | | | | 564,259 | |
| | Energy | | | 689,357 | | | | — | | | | — | | | | 689,357 | |
| | Financials | | | 352,872 | | | | — | | | | — | | | | 352,872 | |
| | Health Care | | | 1,987,805 | | | | — | | | | — | | | | 1,987,805 | |
| | Industrials | | | 455,830 | | | | — | | | | — | | | | 455,830 | |
| | Information Technology | | | 963,890 | | | | — | | | | — | | | | 963,890 | |
| | Materials | | | 705,905 | | | | — | | | | — | | | | 705,905 | |
| | Telecommunication Services | | | 1,220,425 | | | | — | | | | — | | | | 1,220,425 | |
| | Total Common Stock | | $ | 6,976,092 | | | $ | — | | | $ | — | | | $ | 6,976,092 | |
| | Short-Term Investments | | | | | | | | | | | | | | | | |
| | Money Market Funds | | $ | 556,711 | | | $ | — | | | $ | — | | | $ | 556,711 | |
| | U.S. Treasury Bills | | | — | | | | 5,797,850 | | | | — | | | | 5,797,850 | |
| | Total Short-Term Investments | | $ | 556,711 | | | $ | 5,797,850 | | | $ | — | | | $ | 6,354,561 | |
| | Total Investments in Securities | | $ | 7,532,803 | | | $ | 5,797,850 | | | $ | — | | | $ | 13,330,653 | |
Transfers between levels are recognized at the end of the reporting period. During the six-month period ended April 30, 2013, the Fund recognized no transfers between levels.
The accompanying notes are an integral part of these financial statements.
HENNESSY FUNDS 1-800-966-4354
HENNESSY CORE BOND FUND
As of April 30, 2013 (Unaudited)
(% of Net Assets)
| | TOP TEN HOLDINGS* | % net assets |
| | Federal National Mortgage Association, 4.000%, 12/1/2041 | 4.73% |
| | Boston Private Capital Trust I | 4.72% |
| | Federal National Mortgage Association, 3.000%, 08/1/2042 | 4.64% |
| | iShares iBoxx $High Yield Corporation Bond Fund | 3.60% |
| | American International Group, Inc., 5.850%, 01/16/2018 | 3.36% |
| | Discover Financial Services, 5.200%, 04/27/2022 | 3.29% |
| | Federal National Mortgage Association, 6.000%, 10/01/2037 | 3.13% |
| | Ford Motor Credit Co LLC, 3.000%, 06/12/2017 | 2.97% |
| | AngloGold Ashanti Holdings PLC - ADR, 5.125%, 08/01/2022 | 2.88% |
| | YUM! Brands, Inc., 5.300%, 09/15/2019 | 2.88% |
* Excludes short-term investments.
Note: For presentation purposes, the Fund has grouped some of the industry categories. For purposes of categorizing securities for compliance with Section 8(b)(1) of the Investment Company Act of 1940, the Fund uses more specific industry classifications.
| | CONVERTIBLE PREFERRED | | Number | | | | | | % of | |
| | STOCKS – 4.72% | | of Shares | | | Value | | | Net Assets | |
| | | | | | | | | | | |
| | Financials – 4.72% | | | | | | | | | |
| | Boston Private Capital Trust I (a) | | | 13,350 | | | $ | 577,388 | | | | 4.72 | % |
| | | | | | | | | | | | | | |
| | Total Convertible Preferred Stocks | | | | | | | | | | | | |
| | (Cost $638,782) | | | | | | | 577,388 | | | | 4.72 | % |
| | | | | | | | | | | | | | |
| | PREFERRED STOCKS – 0.29% | | | | | | | | | | | | |
| | | | | | | | | | | | | | |
| | Financials – 0.29% | | | | | | | | | | | | |
| | Fannie Mae Preferred (a) | | | 7,900 | | | | 36,182 | | | | 0.29 | % |
| | | | | | | | | | | | | | |
| | Total Preferred Stocks | | | | | | | | | | | | |
| | (Cost $197,500) | | | | | | | 36,182 | | | | 0.29 | % |
| | | | | | | | | | | | | | |
| | REITS – 1.74% | | | | | | | | | | | | |
| | | | | | | | | | | | | | |
| | Financials – 1.74% | | | | | | | | | | | | |
| | Apollo Commercial | | | | | | | | | | | | |
| | Real Estate Finance, Inc. | | | 12,000 | | | | 212,880 | | | | 1.74 | % |
| | | | | | | | | | | | | | |
| | Total Reits | | | | | | | | | | | | |
| | (Cost $195,112) | | | | | | | 212,880 | | | | 1.74 | % |
| | | | | | | | | | | | | | |
| | CORPORATE BONDS – 54.59% | | | | | | | | | | | | |
| | | | | | | | | | | | | | |
| | Consumer Discretionary – 8.42% | | | | | | | | | | | | |
| | Ford Motor Credit Co LLC | | | | | | | | | | | | |
| | 3.000%, 06/12/2017 | | | 350,000 | | | | 363,130 | | | | 2.97 | % |
| | Royal Caribbean Cruises Ltd. – ADR (b) | | | | | | | | | | | | |
| | 7.500%, 10/15/2027 | | | 275,000 | | | | 314,875 | | | | 2.57 | % |
| | YUM! Brands, Inc. | | | | | | | | | | | | |
| | 5.300%, 09/15/2019 | | | 300,000 | | | | 352,176 | | | | 2.88 | % |
| | | | | | | | | 1,030,181 | | | | 8.42 | % |
| | | | | | | | | | | | | | |
| | Consumer Staples – 2.17% | | | | | | | | | | | | |
| | CVS Caremark Corporation | | | | | | | | | | | | |
| | 5.750%, 06/01/2017 | | | 225,000 | | | | 266,281 | | | | 2.17 | % |
| | | | | | | | | | | | | | |
| | Financials – 32.61% | | | | | | | | | | | | |
| | American International Group, Inc. | | | | | | | | | | | | |
| | 5.850%, 01/16/2018 | | | 350,000 | | | | 411,419 | | | | 3.36 | % |
| | Associated Banc-Corp | | | | | | | | | | | | |
| | 5.125%, 03/28/2016 | | | 250,000 | | | | 274,323 | | | | 2.24 | % |
| | Associates Corporation | | | | | | | | | | | | |
| | of North America | | | | | | | | | | | | |
| | 6.950%, 11/01/2018 | | | 250,000 | | | | 308,473 | | | | 2.52 | % |
| | Citigroup, Inc. | | | | | | | | | | | | |
| | 6.125%, 11/21/2017 | | | 250,000 | | | | 297,597 | | | | 2.43 | % |
| | Discover Financial Services | | | | | | | | | | | | |
| | 5.200%, 04/27/2022 | | | 350,000 | | | | 401,919 | | | | 3.29 | % |
| | Lazard Group | | | | | | | | | | | | |
| | 6.850%, 06/15/2017 | | | 300,000 | | | | 345,370 | | | | 2.82 | % |
| | Manulife Financial Corp.- ADR (b) | | | | | | | | | | | | |
| | 3.400%, 09/17/2015 | | | 300,000 | | | | 317,009 | | | | 2.59 | % |
| | Morgan Stanley | | | | | | | | | | | | |
| | 6.625%, 04/01/2018 | | | 250,000 | | | | 300,025 | | | | 2.45 | % |
| | Prudential Financial, Inc. | | | | | | | | | | | | |
| | 5.500%, 03/15/2016 | | | 288,000 | | | | 324,068 | | | | 2.65 | % |
| | Qwest Capital Funding, Inc. | | | | | | | | | | | | |
| | 6.500%, 11/15/2018 | | | 300,000 | | | | 339,367 | | | | 2.77 | % |
| | The Hartford Financial Services Group, Inc. | | | | | | | | | | | | |
| | 5.375%, 03/15/2017 | | | 300,000 | | | | 344,201 | | | | 2.81 | % |
| | The Royal Bank of Scotland PLC (b) | | | | | | | | | | | | |
| | 4.375%, 03/16/2016 | | | 300,000 | | | | 327,558 | | | | 2.68 | % |
| | | | | | | | | 3,991,329 | | | | 32.61 | % |
| | | | | | | | | | | | | | |
| | Health Care – 2.34% | | | | | | | | | | | | |
| | Agilent Technologies, Inc. | | | | | | | | | | | | |
| | 5.000%, 07/15/2020 | | | 250,000 | | | | 285,979 | | | | 2.34 | % |
| | | | | | | | | | | | | | |
| | Information Technology – 1.28% | | | | | | | | | | | | |
| | KLA-Tencor Corp. | | | | | | | | | | | | |
| | 6.900%, 05/01/2018 | | | 130,000 | | | | 156,680 | | | | 1.28 | % |
| | | | | | | | | | | | | | |
| | Materials – 5.39% | | | | | | | | | | | | |
| | AngloGold Ashanti Holdings PLC – ADR (b) | | | | | | | | | | | | |
| | 5.125%, 08/01/2022 | | | 350,000 | | | | 353,179 | | | | 2.88 | % |
| | El du Pont de Nemours & Co. | | | | | | | | | | | | |
| | 4.750%, 03/15/2015 | | | 285,000 | | | | 307,109 | | | | 2.51 | % |
| | | | | | | | | 660,288 | | | | 5.39 | % |
| | | | | | | | | | | | | | |
| | Utilities – 2.38% | | | | | | | | | | | | |
| | Sempra Energy | | | | | | | | | | | | |
| | 6.500%, 06/01/2016 | | | 250,000 | | | | 290,882 | | | | 2.38 | % |
| | | | | | | | | | | | | | |
| | Total Corporate Bonds | | | | | | | | | | | | |
| | (Cost $6,071,231) | | | | | | | 6,681,620 | | | | 54.59 | % |
| | | | | | | | | | | | | | |
| | MORTGAGE BACKED SECURITIES – 12.50% | | | | | | | | | | | | |
| | | | | | | | | | | | | | |
| | U.S. Government Agency Issues – 12.50% | | | | | | | | | | | | |
| | Federal National Mortgage Association | | | | | | | | | | | | |
| | 3.000%, 08/01/2042 | | | 542,298 | | | | 567,951 | | | | 4.64 | % |
| | 4.000%, 12/01/2041 | | | 540,451 | | | | 579,080 | | | | 4.73 | % |
| | 6.000%, 10/01/2037 | | | 349,458 | | | | 383,138 | | | | 3.13 | % |
| | | | | | | | | | | | | | |
| | Total U.S. Government | | | | | | | | | | | | |
| | Agency Issues | | | | | | | | | | | | |
| | (Cost $1,478,604) | | | | | | | 1,530,169 | | | | 12.50 | % |
| | | | | | | | | | | | | | |
| | Total Mortgage Backed Securities | | | | | | | | | | | | |
| | (Cost $1,478,604) | | | | | | | 1,530,169 | | | | 12.50 | % |
| | | | | | | | | | | | | | |
| | U.S. TREASURY OBLIGATIONS – 9.87% | | | | | | | | | | | | |
| | | | | | | | | | | | | | |
| | U.S. Treasury Bonds – 2.46% | | | | | | | | | | | | |
| | 6.250%, 08/15/2023 | | | 210,000 | | | | 301,186 | | | | 2.46 | % |
| | | | | | | | | | | | | | |
| | Total U.S. Treasury Bonds | | | | | | | | | | | | |
| | (Cost $295,678) | | | | | | | 301,186 | | | | 2.46 | % |
| | | | | | | | | | | | | | |
| | U.S. Treasury Notes – 7.41% | | | | | | | | | | | | |
| | 2.375%, 03/31/2016 | | | 220,000 | | | | 233,286 | | | | 1.91 | % |
| | 3.500%, 05/15/2020 | | | 300,000 | | | | 349,289 | | | | 2.85 | % |
| | 4.125%, 05/15/2015 | | | 300,000 | | | | 323,766 | | | | 2.65 | % |
| | | | | | | | | | | | | | |
| | Total U.S. Treasury Notes | | | | | | | | | | | | |
| | (Cost $904,682) | | | | | | | 906,341 | | | | 7.41 | % |
| | | | | | | | | | | | | | |
| | Total U.S. Treasury Obligations | | | | | | | | | | | | |
| | (Cost $1,200,361) | | | | | | | 1,207,527 | | | | 9.87 | % |
The accompanying notes are an integral part of these financial statements.
HENNESSY FUNDS 1-800-966-4354
| | EXCHANGE TRADED FUNDS – 9.08% | | Number | | | | | | % of | |
| | | | of Shares | | | Value | | | Net Assets | |
| | iShares iBoxx $High Yield | | | | | | | | | |
| | Corporation Bond Fund (a) | | | 4,600 | | | $ | 440,910 | | | | 3.60 | % |
| | iShares S&P U.S. Preferred | | | | | | | | | | | | |
| | Stock Index Fund (a) | | | 8,250 | | | | 336,352 | | | | 2.75 | % |
| | SPDR Barclays Capital | | | | | | | | | | | | |
| | High Yield Bond (a) | | | 8,000 | | | | 334,000 | | | | 2.73 | % |
| | | | | | | | | | | | | | |
| | Total Exchange Traded Funds | | | | | | | | | | | | |
| | (Cost $1,075,803) | | | | | | | 1,111,262 | | | | 9.08 | % |
| | | | | | | | | | | | | | |
| | MUTUAL FUNDS – 1.53% | | | | | | | | | | | | |
| | PennantPark Investment Corp. | | | 16,000 | | | | 187,200 | | | | 1.53 | % |
| | | | | | | | | | | | | | |
| | Total Mutual Funds | | | | | | | | | | | | |
| | (Cost $176,399) | | | | | | | 187,200 | | | | 1.53 | % |
| | | | | | | | | | | | | | |
| | SHORT-TERM INVESTMENTS – 2.74% | | | | | | | | | | | | |
| | | | | | | | | | | | | | |
| | Money Market Funds – 2.74% | | | | | | | | | | | | |
| | Fidelity Government Portfolio – | | | | | | | | | | | | |
| | Institutional Class, 0.01 (c) | | | 334,809 | | | | 334,809 | | | | 2.74 | % |
| | | | | | | | | | | | | | |
| | Total Money Market Funds | | | | | | | | | | | | |
| | (Cost $334,809) | | | | | | | 334,809 | | | | 2.74 | % |
| | | | | | | | | | | | | | |
| | Total Short-Term Investments | | | | | | | | | | | | |
| | (Cost $334,809) | | | | | | | 334,809 | | | | 2.74 | % |
| | | | | | | | | | | | | | |
| | Total Investments | | | | | | | | | | | | |
| | (Cost $11,368,601) – 97.06% | | | | | | | 11,879,037 | | | | 97.06 | % |
| | | | | | | | | | | | | | |
| | Other Assets in Excess | | | | | | | | | | | | |
| | of Liabilities – 2.94% | | | | | | | 360,040 | | | | 2.94 | % |
| | TOTAL NET ASSETS – 100.00% | | | | | | $ | 12,239,077 | | | | 100.00 | % |
Percentages are stated as a percent of net assets.
ADR – American Depositary Receipt
| | (a) | Non-income producing security. |
| | (b) | U.S. traded security of a foreign corporation. |
| | (c) | The rate listed is the fund’s 7-day yield as of April 30, 2013. |
The accompanying notes are an integral part of these financial statements.
Summary of Fair Value Exposure at April 30, 2013
The following is a summary of the inputs used to value the Fund’s net assets as of April 30, 2013 (See Note 3 in the accompanying notes to the financial statements):
| | | | Level 1 | | | Level 2 | | | Level 3 | | | Total | |
| | Convertible Preferred Stock | | $ | — | | | $ | 577,388 | | | $ | — | | | $ | 577,388 | |
| | Preferred Stock | | $ | 36,182 | | | $ | — | | | $ | — | | | $ | 36,182 | |
| | REITS | | | | | | | | | | | | | | | | |
| | Financials | | $ | 212,880 | | | $ | — | | | $ | — | | | $ | 212,880 | |
| | Corporate Bonds | | | | | | | | | | | | | | | | |
| | Consumer Discretionary | | $ | — | | | $ | 1,030,181 | | | $ | — | | | $ | 1,030,181 | |
| | Consumer Staples | | | — | | | | 266,281 | | | | — | | | | 266,281 | |
| | Financials | | | — | | | | 3,991,329 | | | | — | | | | 3,991,329 | |
| | Health Care | | | — | | | | 285,979 | | | | — | | | | 285,979 | |
| | Information Technology | | | — | | | | 156,680 | | | | — | | | | 156,680 | |
| | Materials | | | — | | | | 660,288 | | | | — | | | | 660,288 | |
| | Utilities | | | — | | | | 290,882 | | | | — | | | | 290,882 | |
| | Total Corporate Bonds | | $ | — | | | $ | 6,681,620 | | | $ | — | | | $ | 6,681,620 | |
| | Mortgage Backed Securities | | $ | — | | | $ | 1,530,169 | | | $ | — | | | $ | 1,530,169 | |
| | U.S. Treasury Obligations | | | | | | | | | | | | | | | | |
| | U.S. Treasury Bonds | | $ | — | | | $ | 301,186 | | | $ | — | | | $ | 301,186 | |
| | U.S. Treasury Notes | | | — | | | | 906,341 | | | | — | | | | 906,341 | |
| | Total U.S. Treasury Obligations | | $ | — | | | $ | 1,207,527 | | | $ | — | | | $ | 1,207,527 | |
| | Exchange Traded Funds | | $ | 1,111,262 | | | $ | — | | | $ | — | | | $ | 1,111,262 | |
| | Mutual Funds | | $ | 187,200 | | | $ | — | | | $ | — | | | $ | 187,200 | |
| | Short-Term Investments | | | | | | | | | | | | | | | | |
| | Money Market Funds | | $ | 334,809 | | | $ | — | | | $ | — | | | $ | 334,809 | |
| | Total Short-Term Investments | | $ | 334,809 | | | $ | — | | | $ | — | | | $ | 334,809 | |
| | Total Investments in Securities | | $ | 1,882,333 | | | $ | 9,996,704 | | | $ | — | | | $ | 11,879,037 | |
Transfers between levels are recognized at the end of the reporting period. During the six-month period ended April 30, 2013, the Fund recognized no transfers between levels.
The accompanying notes are an integral part of these financial statements.
HENNESSY FUNDS 1-800-966-4354
HENNESSY GAS UTILITY INDEX FUND
As of April 30, 2013 (Unaudited)
(% of Net Assets)
| | TOP TEN EQUITY HOLDINGS | % net assets |
| | Enbridge, Inc. | 5.02% |
| | National Grid PLC - ADR | 4.98% |
| | Spectra Energy Corp. | 4.94% |
| | TransCanada Corp. | 4.94% |
| | Kinder Morgan, Inc. | 4.92% |
| | The Williams Companies, Inc. | 4.86% |
| | Energy Transfer Equity, L.P. | 4.85% |
| | Sempra Energy | 4.70% |
| | ONEOK, Inc. | 4.33% |
| | Dominion Resources, Inc. | 4.31% |
Note: For presentation purposes, the Fund has grouped some of the industry categories. For purposes of categorizing securities for compliance with Section 8(b)(1) of the Investment Company Act of 1940, the Fund uses more specific industry classifications.
| | COMMON STOCKS – 98.52% | | Number | | | | | | % of | |
| | | | of Shares | | | Value | | | Net Assets | |
| | Energy – 34.39% | | | | | | | | | |
| | Cheniere Energy, Inc. (a) | | | 1,297,692 | | | $ | 36,958,268 | | | | 3.66 | % |
| | Enbridge, Inc. (b) | | | 1,066,151 | | | | 50,748,788 | | | | 5.02 | % |
| | Energen Corp. | | | 102,192 | | | | 4,845,945 | | | | 0.48 | % |
| | Energy Transfer Equity, L.P. | | | 834,420 | | | | 48,963,765 | | | | 4.85 | % |
| | EQT Corp. | | | 96,960 | | | | 7,283,635 | | | | 0.72 | % |
| | Kinder Morgan, Inc. | | | 1,269,475 | | | | 49,636,472 | | | | 4.92 | % |
| | Spectra Energy Corp. | | | 1,582,122 | | | | 49,884,307 | | | | 4.94 | % |
| | The Williams Companies, Inc. | | | 1,287,829 | | | | 49,104,920 | | | | 4.86 | % |
| | TransCanada Corp. (b) | | | 1,006,718 | | | | 49,842,608 | | | | 4.94 | % |
| | | | | | | | | 347,268,708 | | | | 34.39 | % |
| | | | | | | | | | | | | | |
| | Financials – 0.47% | | | | | | | | | | | | |
| | Berkshire Hathaway, Inc., Class A (a) | | | 30 | | | | 4,770,000 | | | | 0.47 | % |
| | | | | | | | | | | | | | |
| | Utilities – 63.66% | | | | | | | | | | | | |
| | AGL Resources, Inc. | | | 604,916 | | | | 26,525,567 | | | | 2.63 | % |
| | ALLETE, Inc. | | | 1,875 | | | | 96,281 | | | | 0.01 | % |
| | Alliant Energy Corp. | | | 60,492 | | | | 3,236,927 | | | | 0.32 | % |
| | Ameren Corp. | | | 97,890 | | | | 3,548,513 | | | | 0.35 | % |
| | Atmos Energy Corp. | | | 544,362 | | | | 24,153,342 | | | | 2.39 | % |
| | Avista Corp. | | | 69,972 | | | | 1,962,715 | | | | 0.19 | % |
| | Black Hills Corp. | | | 50,100 | | | | 2,349,189 | | | | 0.23 | % |
| | CenterPoint Energy, Inc. | | | 924,898 | | | | 22,826,483 | | | | 2.26 | % |
| | CH Energy Group, Inc. | | | 20,780 | | | | 1,350,077 | | | | 0.13 | % |
| | Chesapeake Utilities Corp. | | | 42,679 | | | | 2,277,351 | | | | 0.22 | % |
| | CMS Energy Corp. | | | 525,148 | | | | 15,722,931 | | | | 1.56 | % |
| | Consolidated Edison, Inc. | | | 299,281 | | | | 19,049,236 | | | | 1.89 | % |
| | Corning Natural Gas Corp. | | | 15135 | | | | 241,399 | | | | 0.02 | % |
| | Delta Natural Gas Company, Inc. | | | 40,791 | | | | 884,349 | | | | 0.09 | % |
| | Dominion Resources, Inc. | | | 705,514 | | | | 43,516,104 | | | | 4.31 | % |
| | DTE Energy Co. | | | 213,765 | | | | 15,579,193 | | | | 1.54 | % |
| | Duke Energy Corp. | | | 98,837 | | | | 7,432,542 | | | | 0.74 | % |
| | Entergy Corp. | | | 9,400 | | | | 669,562 | | | | 0.07 | % |
| | Exelon Corp. | | | 288,381 | | | | 10,817,171 | | | | 1.07 | % |
| | Gas Natural, Inc. | | | 33,162 | | | | 342,563 | | | | 0.03 | % |
| | Integrys Energy Group, Inc. | | | 241,521 | | | | 14,868,033 | | | | 1.47 | % |
| | MDU Resources Group, Inc. | | | 402,607 | | | | 10,045,045 | | | | 0.99 | % |
| | MGE Energy, Inc. | | | 23,017 | | | | 1,285,499 | | | | 0.13 | % |
| | National Fuel Gas Co. | | | 325,825 | | | | 20,435,744 | | | | 2.02 | % |
| | National Grid PLC – ADR (b) | | | 788,479 | | | | 50,289,191 | | | | 4.98 | % |
| | New Jersey Resources Corp. | | | 190,142 | | | | 8,974,702 | | | | 0.89 | % |
| | NiSource, Inc. | | | 1,135,831 | | | | 34,904,087 | | | | 3.46 | % |
| | Northeast Utilities | | | 133,475 | | | | 6,050,422 | | | | 0.60 | % |
| | Northwest Natural Gas Co. | | | 156,564 | | | | 6,962,401 | | | | 0.69 | % |
| | Northwestern Corp. | | | 71,398 | | | | 3,071,542 | | | | 0.30 | % |
| | NV Energy, Inc. | | | 41,450 | | | | 896,563 | | | | 0.09 | % |
| | ONEOK, Inc. | | | 852,441 | | | | 43,781,370 | | | | 4.33 | % |
| | Pepco Holdings, Inc. | | | 52,204 | | | | 1,179,810 | | | | 0.12 | % |
| | PG&E Corp. | | | 681,055 | | | | 32,990,304 | | | | 3.27 | % |
| | Piedmont Natural Gas Company, Inc. | | | 477,544 | | | | 16,441,840 | | | | 1.63 | % |
| | PPL Corp. | | | 78,235 | | | | 2,611,484 | | | | 0.26 | % |
| | Public Service Enterprise Group, Inc. | | | 540,488 | | | | 19,787,266 | | | | 1.96 | % |
| | Questar Corp. | | | 879,215 | | | | 22,323,269 | | | | 2.21 | % |
| | RGC Resources, Inc. | | | 28,768 | | | | 575,072 | | | | 0.06 | % |
| | SCANA Corp. | | | 138,823 | | | | 7,524,207 | | | | 0.75 | % |
| | Sempra Energy | | | 572,955 | | | | 47,469,322 | | | | 4.70 | % |
| | South Jersey Industries, Inc. | | | 145,485 | | | | 8,976,424 | | | | 0.89 | % |
| | Southwest Gas Corp. | | | 277,723 | | | | 14,072,224 | | | | 1.39 | % |
| | TECO Energy, Inc. | | | 175,890 | | | | 3,364,776 | | | | 0.33 | % |
| | The Empire District Electric Co. | | | 19,500 | | | | 449,865 | | | | 0.04 | % |
| | The Laclede Group, Inc. | | | 121,849 | | | | 5,691,567 | | | | 0.56 | % |
| | UGI Corp. | | | 208,735 | | | | 8,553,960 | | | | 0.85 | % |
| | UIL Holdings Corp. | | | 130,804 | | | | 5,446,679 | | | | 0.54 | % |
| | Unitil Corp. | | | 43,858 | | | | 1,329,336 | | | | 0.13 | % |
| | UNS Energy Corp. | | | 15,880 | | | | 809,245 | | | | 0.08 | % |
| | Vectren Corp. | | | 208,916 | | | | 7,846,885 | | | | 0.78 | % |
| | WGL Holdings, Inc. | | | 290,165 | | | | 13,411,426 | | | | 1.33 | % |
| | Wisconsin Energy Corp. | | | 149,460 | | | | 6,716,732 | | | | 0.67 | % |
| | Xcel Energy, Inc. | | | 352,291 | | | | 11,199,331 | | | | 1.11 | % |
| | | | | | | | | 642,917,118 | | | | 63.66 | % |
| | | | | | | | | | | | | | |
| | Total Common Stocks | | | | | | | | | | | | |
| | (Cost $668,125,381) | | | | | | | 994,955,826 | | | | 98.52 | % |
The accompanying notes are an integral part of these financial statements.
HENNESSY FUNDS 1-800-966-4354
| | SHORT-TERM INVESTMENTS – 1.21% | | Number | | | | | | % of | |
| | | | of Shares | | | Value | | | Net Assets | |
| | Money Market Funds – 1.21% | | | | | | | | | |
| | Fidelity Government Portfolio – | | | | | | | | | |
| | Institutional Class, 0.01 (c) | | | 12,249,977 | | | $ | 12,249,977 | | | | 1.21 | % |
| | | | | | | | | | | | | | |
| | Total Money Market Funds | | | | | | | | | | | | |
| | (Cost $12,249,977) | | | | | | | 12,249,977 | | | | 1.21 | % |
| | | | | | | | | | | | | | |
| | Total Short-Term Investments | | | | | | | | | | | | |
| | (Cost $12,249,977) | | | | | | | 12,249,977 | | | | 1.21 | % |
| | | | | | | | | | | | | | |
| | Total Investments | | | | | | | | | | | | |
| | (Cost $680,375,358) – 99.73% | | | | | | | 1,007,205,803 | | | | 99.73 | % |
| | | | | | | | | | | | | | |
| | Other Assets in Excess | | | | | | | | | | | | |
| | of Liabilities – 0.27% | | | | | | | 2,722,224 | | | | 0.27 | % |
| | TOTAL NET ASSETS – 100.00% | | | | | | $ | 1,009,928,027 | | | | 100.00 | % |
Percentages are stated as a percent of net assets.
ADR – American Depositary Receipt
| | (a) | Non-income producing security. |
| | (b) | U.S. traded security of a foreign corporation. |
| | (c) | The rate listed is the fund’s 7-day yield as of April 30, 2013. |
Summary of Fair Value Exposure at April 30, 2013
The following is a summary of the inputs used to value the Fund’s net assets as of April 30, 2013 (See Note 3 in the accompanying notes to the financial statements):
| | Common Stock | | Level 1 | | | Level 2 | | | Level 3 | | | Total | |
| | Energy | | $ | 347,268,708 | | | $ | — | | | $ | — | | | $ | 347,268,708 | |
| | Financials | | | 4,770,000 | | | | — | | | | — | | | | 4,770,000 | |
| | Utilities | | | 642,917,118 | | | | — | | | | — | | | | 642,917,118 | |
| | Total Common Stock | | $ | 994,955,826 | | | $ | — | | | $ | — | | | $ | 994,955,826 | |
| | Short-Term Investments | | | | | | | | | | | | | | | | |
| | Money Market Funds | | $ | 12,249,977 | | | $ | — | | | $ | — | | | $ | 12,249,977 | |
| | Total Short-Term Investments | | $ | 12,249,977 | | | $ | — | | | $ | — | | | $ | 12,249,977 | |
| | Total Investments in Securities | | $ | 1,007,205,803 | | | $ | — | | | $ | — | | | $ | 1,007,205,803 | |
Transfers between levels are recognized at the end of the reporting period. During the six-month period ended April 30, 2013, the Fund recognized transfers between levels 1 and 2. Below is a reconciliation that details the transfer of securities between Level 1 and Level 2 during the reporting period.
Level 1 Reconciliation Disclosure
The following amounts were transferred in (out) of Level 1 assets:
| | | Total Common Stock | |
| | Transfers into Level 1 | | $ | 241,399 | | |
| | Transfers out of Level 1 | | | — | | |
| | Net transfers in and/or (out) of Level 1 | | $ | 241,399 | | |
| | | | | | | |
| | Transfers into Level 2 | | $ | — | | |
| | Transfers out of Level 2 | | | (241,399 | ) | |
| | Net transfers in and/or (out) of Level 1 | | $ | (241,399 | ) | |
The Fund transferred $241,399 from Level 2 to Level 1 at April 30, 2013. The security was transferred due to lack of an active market on October 31, 2012, but actively traded on April 30, 2013.
The accompanying notes are an integral part of these financial statements.
HENNESSY SMALL CAP FINANCIAL FUND
As of April 30, 2013 (Unaudited)
(% of Net Assets)
| | TOP TEN EQUITY HOLDINGS | % net assets |
| | MGIC Investment Corp. | 2.75% |
| | KB Home | 2.74% |
| | RAIT Financial Trust | 2.71% |
| | Nationstar Mortgage Holdings, Inc. | 2.66% |
| | Popular, Inc. | 2.62% |
| | MBIA, Inc. | 2.59% |
| | NorthStar Realty Finance Corp. | 2.58% |
| | HomeStreet, Inc. | 2.53% |
| | Hingham Institution for Savings | 2.50% |
| | BankUnited, Inc. | 2.48% |
Note: For presentation purposes, the Fund has grouped some of the industry categories. For purposes of categorizing securities for compliance with Section 8(b)(1) of the Investment Company Act of 1940, the Fund uses more specific industry classifications.
HENNESSY FUNDS 1-800-966-4354
| | COMMON STOCKS – 92.24% | | Number | | | | | | % of | |
| | | | of Shares | | | Value | | | Net Assets | |
| | Consumer Discretionary – 2.74% | | | | | | | | | |
| | KB Home | | | 310,000 | | | $ | 6,987,400 | | | | 2.74 | % |
| | | | | | | | | | | | | | |
| | Financials – 87.73% | | | | | | | | | | | | |
| | American Capital Ltd. (a) | | | 180,000 | | | | 2,723,400 | | | | 1.07 | % |
| | Associated Banc-Corp. | | | 90,000 | | | | 1,284,300 | | | | 0.50 | % |
| | Astoria Financial Corp. | | | 490,000 | | | | 4,699,100 | | | | 1.84 | % |
| | Bancorp Inc. Del (a) | | | 109,600 | | | | 1,424,800 | | | | 0.56 | % |
| | BankUnited, Inc. | | | 250,000 | | | | 6,337,500 | | | | 2.48 | % |
| | Banner Corp. | | | 145,000 | | | | 4,737,150 | | | | 1.85 | % |
| | Brookline Bancorp, Inc. | | | 210,000 | | | | 1,764,000 | | | | 0.69 | % |
| | Capital Bank Financial Corp. (a) | | | 20,000 | | | | 357,400 | | | | 0.14 | % |
| | CapitalSource, Inc. | | | 630,000 | | | | 5,638,500 | | | | 2.21 | % |
| | Cowen Group Inc. (a) | | | 500,000 | | | | 1,280,000 | | | | 0.50 | % |
| | Encore Capital Group, Inc. (a) | | | 200,000 | | | | 5,698,000 | | | | 2.23 | % |
| | Everbank Financial Corp. | | | 270,000 | | | | 4,320,000 | | | | 1.69 | % |
| | First Bancorp (a)(b) | | | 1,070,000 | | | | 6,323,700 | | | | 2.48 | % |
| | First Connecticut Bancorp, Inc. | | | 189,700 | | | | 2,815,148 | | | | 1.10 | % |
| | First Horizon National Corp. | | | 200,000 | | | | 2,080,000 | | | | 0.81 | % |
| | First Niagara Financial Group, Inc. | | | 315,000 | | | | 2,995,650 | | | | 1.17 | % |
| | Flagstar Bancorp, Inc. (a) | | | 505,000 | | | | 6,267,050 | | | | 2.45 | % |
| | Flushing Financial Corp. | | | 300,000 | | | | 4,554,000 | | | | 1.78 | % |
| | Forestar Group, Inc. (a) | | | 175,000 | | | | 3,769,500 | | | | 1.48 | % |
| | Fulton Financial Corp. | | | 385,000 | | | | 4,258,100 | | | | 1.67 | % |
| | Genworth Financial, Inc. (a) | | | 450,000 | | | | 4,513,500 | | | | 1.77 | % |
| | Green Dot Corp., Class A (a) | | | 100,000 | | | | 1,571,000 | | | | 0.62 | % |
| | Greenhill & Co, Inc. | | | 4,700 | | | | 217,093 | | | | 0.08 | % |
| | Hingham Institution for Savings | | | 94,000 | | | | 6,392,940 | | | | 2.50 | % |
| | Home Loan Servicing Solutions LTD (b) | | | 260,000 | | | | 5,889,000 | | | | 2.31 | % |
| | HomeStreet, Inc. | | | 300,000 | | | | 6,450,000 | | | | 2.53 | % |
| | Independent Bank Corp. | | | 50,000 | | | | 1,552,000 | | | | 0.61 | % |
| | Investors Bancorp, Inc. | | | 71,300 | | | | 1,411,740 | | | | 0.55 | % |
| | JMP Group, Inc. | | | 33,656 | | | | 217,418 | | | | 0.09 | % |
| | KeyCorp | | | 130,000 | | | | 1,296,100 | | | | 0.51 | % |
| | KKR Financial Holdings LLC | | | 560,000 | | | | 5,986,400 | | | | 2.34 | % |
| | Ladenburg Thalman | | | | | | | | | | | | |
| | Financial Services, Inc. (a) | | | 62,700 | | | | 92,169 | | | | 0.04 | % |
| | MBIA, Inc. (a) | | | 700,000 | | | | 6,622,000 | | | | 2.59 | % |
| | MGIC Investment Corp. (a) | | | 1,300,000 | | | | 7,020,000 | | | | 2.75 | % |
| | Nationstar Mortgage Holdings, Inc. (a) | | | 185,000 | | | | 6,802,450 | | | | 2.66 | % |
| | Netspend Holdings, Inc. (a) | | | 360,000 | | | | 5,745,600 | | | | 2.25 | % |
| | NorthStar Realty Finance Corp. | | | 660,000 | | | | 6,580,200 | | | | 2.58 | % |
| | Northwest Bancshares, Inc. | | | 55,000 | | | | 673,750 | | | | 0.26 | % |
| | OceanFirst Financial Corp. | | | 230,000 | | | | 3,268,300 | | | | 1.28 | % |
| | Ocwen Financial Corp. (a) | | | 165,000 | | | | 6,035,700 | | | | 2.36 | % |
| | Oppenheimer Holdings, Inc. | | | 123,306 | | | | 2,281,161 | | | | 0.89 | % |
| | PHH Corp. (a) | | | 285,000 | | | | 6,007,800 | | | | 2.35 | % |
| | Piper Jaffray Companies, Inc. (a) | | | 40,000 | | | | 1,350,400 | | | | 0.53 | % |
| | Popular, Inc. (a)(b) | | | 235,000 | | | | 6,695,150 | | | | 2.62 | % |
| | Portfolio Recovery Associates, Inc. (a) | | | 16,000 | | | | 1,964,000 | | | | 0.77 | % |
| | PrivateBancorp, Inc. | | | 90,000 | | | | 1,726,200 | | | | 0.68 | % |
| | Radian Group, Inc. | | | 425,000 | | | | 5,078,750 | | | | 1.99 | % |
| | RAIT Financial Trust | | | 810,000 | | | | 6,917,400 | | | | 2.71 | % |
| | Rockville Financial, Inc. | | | 230,000 | | | | 2,990,000 | | | | 1.17 | % |
| | Sterling Financial Corp. | | | 275,000 | | | | 5,995,000 | | | | 2.35 | % |
| | Susquehanna Bancshares, Inc. | | | 180,000 | | | | 2,100,600 | | | | 0.82 | % |
| | SWS Group, Inc. (a) | | | 176,000 | | | | 1,001,440 | | | | 0.39 | % |
| | Synovus Financial Corp. | | | 2,225,000 | | | | 5,985,250 | | | | 2.34 | % |
| | TCF Financial Corp. | | | 155,000 | | | | 2,255,250 | | | | 0.88 | % |
| | Territorial Bancorp, Inc. | | | 110,000 | | | | 2,571,800 | | | | 1.01 | % |
| | United Financial Bancorp, Inc. | | | 200,294 | | | | 2,966,354 | | | | 1.16 | % |
| | Walter Investment | | | | | | | | | | | | |
| | Management Corp. (a) | | | 170,000 | | | | 5,705,200 | | | | 2.23 | % |
| | Washington Federal, Inc. | | | 135,000 | | | | 2,317,950 | | | | 0.91 | % |
| | Wintrust Financial Corp. | | | 90,000 | | | | 3,227,400 | | | | 1.26 | % |
| | WSFS Financial Corp. | | | 59,900 | | | | 2,931,506 | | | | 1.15 | % |
| | Zions Bancorp. | | | 15,000 | | | | 369,300 | | | | 0.14 | % |
| | | | | | | | | 224,102,569 | | | | 87.73 | % |
| | | | | | | | | | | | | | |
| | Information Technology – 1.77% | | | | | | | | | | | | |
| | Heartland Payment Systems, Inc. | | | 110,000 | | | | 3,617,900 | | | | 1.41 | % |
| | MoneyGram International, Inc. (a) | | | 55,000 | | | | 908,050 | | | | 0.36 | % |
| | | | | | | | | 4,525,950 | | | | 1.77 | % |
| | Total Common Stocks | | | | | | | | | | | | |
| | (Cost $196,522,341) | | | | | | | 235,615,919 | | | | 92.24 | % |
| | | | | | | | | | | | | | |
| | REITS – 3.13% | | | | | | | | | | | | |
| | | | | | | | | | | | | | |
| | Financials – 3.13% | | | | | | | | | | | | |
| | Gramercy Property Trust, Inc. (a) | | | 352,800 | | | | 1,675,800 | | | | 0.66 | % |
| | Pennymac Mortgage Investment Trust | | | 250,000 | | | | 6,312,500 | | | | 2.47 | % |
| | | | | | | | | 7,988,300 | | | | 3.13 | % |
| | Total Reits | | | | | | | | | | | | |
| | (Cost $7,338,679) | | | | | | | 7,988,300 | | | | 3.13 | % |
The accompanying notes are an integral part of these financial statements.
| | SHORT-TERM INVESTMENTS – 4.89% | | Number | | | | | | % of | |
| | | | of Shares | | | Value | | | Net Assets | |
| | Money Market Funds – 4.89% | | | | | | | | | |
| | Fidelity Government Portfolio – | | | | | | | | | |
| | Institutional Class, 0.01 (c) | | | 12,503,040 | | | $ | 12,503,040 | | | | 4.89 | % |
| | | | | | | | | | | | | | |
| | Total Money Market Funds | | | | | | | | | | | | |
| | (Cost $12,503,040) | | | | | | | 12,503,040 | | | | 4.89 | % |
| | | | | | | | | | | | | | |
| | Total Short-Term Investments | | | | | | | | | | | | |
| | (Cost $12,503,040) | | | | | | | 12,503,040 | | | | 4.89 | % |
| | | | | | | | | | | | | | |
| | Total Investments | | | | | | | | | | | | |
| | (Cost $216,364,060) – 100.26% | | | | | | | 256,107,259 | | | | 100.26 | % |
| | | | | | | | | | | | | | |
| | Liabilities in Excess of | | | | | | | | | | | | |
| | Other Assets – (0.26)% | | | | | | | (673,462 | ) | | | (0.26 | )% |
| | TOTAL NET ASSETS – 100.00% | | | | | | $ | 255,433,797 | | | | 100.00 | % |
Percentages are stated as a percent of net assets.
| | (a) | Non-income producing security. |
| | (b) | U.S. traded security of a foreign corporation. |
| | (c) | The rate listed is the fund’s 7-day yield as of April 30, 2013. |
Summary of Fair Value Exposure at April 30, 2013
The following is a summary of the inputs used to value the Fund’s net assets as of April 30, 2013 (See Note 3 in the accompanying notes to the financial statements):
| | Common Stock | | Level 1 | | | Level 2 | | | Level 3 | | | Total | |
| | Consumer Discretionary | | $ | 6,987,400 | | | $ | — | | | $ | — | | | $ | 6,987,400 | |
| | Financials | | | 224,102,569 | | | | — | | | | — | | | | 224,102,569 | |
| | Information Technology | | | 4,525,950 | | | | — | | | | — | | | | 4,525,950 | |
| | Total Common Stock | | $ | 235,615,919 | | | $ | — | | | $ | — | | | $ | 235,615,919 | |
| | REITS | | | | | | | | | | | | | | | | |
| | Financials | | $ | 7,988,300 | | | $ | — | | | $ | — | | | $ | 7,988,300 | |
| | Total REITS | | $ | 7,988,300 | | | $ | — | | | $ | — | | | $ | 7,988,300 | |
| | Short-Term Investments | | | | | | | | | | | | | | | | |
| | Money Market Funds | | $ | 12,503,040 | | | $ | — | | | $ | — | | | $ | 12,503,040 | |
| | Total Short-Term Investments | | $ | 12,503,040 | | | $ | — | | | $ | — | | | $ | 12,503,040 | |
| | Total Investments in Securities | | $ | 256,107,259 | | | $ | — | | | $ | — | | | $ | 256,107,259 | |
Transfers between levels are recognized at the end of the reporting period. During the six-month period ended April 30, 2013, the Fund recognized no transfers between levels.
The accompanying notes are an integral part of these financial statements.
HENNESSY FUNDS 1-800-966-4354
HENNESSY LARGE CAP FINANCIAL FUND
As of April 30, 2013 (Unaudited)
(% of Net Assets)
| | TOP TEN EQUITY HOLDINGS | % net assets |
| | American International Group, Inc. | 5.53% |
| | Citigroup, Inc. | 5.45% |
| | Capital One Financial Corp. | 5.40% |
| | Bank of America Corp. | 5.34% |
| | Discover Financial Services | 5.33% |
| | Blackstone Group L.P. | 5.28% |
| | JP Morgan Chase & Co. | 5.15% |
| | Regions Financial Corp. | 5.10% |
| | The PNC Financial Services Group, Inc. | 5.10% |
| | The Goldman Sachs Group, Inc. | 4.88% |
Note: For presentation purposes, the Fund has grouped some of the industry categories. For purposes of categorizing securities for compliance with Section 8(b)(1) of the Investment Company Act of 1940, the Fund uses more specific industry classifications.
| | COMMON STOCKS – 99.09% | | Number | | | | | | % of | |
| | | | of Shares | | | Value | | | Net Assets | |
| | Financials – 89.98% | | | | | | | | | |
| | American Express Co. | | | 30,000 | | | $ | 2,052,300 | | | | 3.43 | % |
| | American International Group, Inc. (a) | | | 80,000 | | | | 3,313,600 | | | | 5.53 | % |
| | Bank of America Corp. | | | 260,000 | | | | 3,200,600 | | | | 5.34 | % |
| | Blackrock, Inc. | | | 6,000 | | | | 1,599,000 | | | | 2.67 | % |
| | Blackstone Group L.P. | | | 154,000 | | | | 3,164,700 | | | | 5.28 | % |
| | Capital One Financial Corp. | | | 56,000 | | | | 3,235,680 | | | | 5.40 | % |
| | CIT Group, Inc. (a) | | | 63,000 | | | | 2,678,130 | | | | 4.47 | % |
| | Citigroup, Inc. | | | 70,000 | | | | 3,266,200 | | | | 5.45 | % |
| | Discover Financial Services | | | 73,000 | | | | 3,193,020 | | | | 5.33 | % |
| | Fifth Third Bancorp | | | 80,000 | | | | 1,362,400 | | | | 2.27 | % |
| | Huntington Bancshares, Inc. | | | 315,000 | | | | 2,258,550 | | | | 3.77 | % |
| | JP Morgan Chase & Co. | | | 63,000 | | | | 3,087,630 | | | | 5.15 | % |
| | KeyCorp | | | 180,000 | | | | 1,794,600 | | | | 3.00 | % |
| | LPL Financial Holdings, Inc. | | | 10,000 | | | | 345,600 | | | | 0.58 | % |
| | Morgan Stanley | | | 130,000 | | | | 2,879,500 | | | | 4.81 | % |
| | Regions Financial Corp. | | | 360,000 | | | | 3,056,400 | | | | 5.10 | % |
| | SunTrust Banks, Inc. | | | 95,000 | | | | 2,778,750 | | | | 4.64 | % |
| | The Bank of New York Mellon Corp. | | | 10,000 | | | | 282,200 | | | | 0.47 | % |
| | The Goldman Sachs Group, Inc. | | | 20,000 | | | | 2,921,400 | | | | 4.88 | % |
| | The PNC Financial Services Group, Inc. | | | 45,000 | | | | 3,054,600 | | | | 5.10 | % |
| | U.S. Bancorp (b) | | | 55,000 | | | | 1,830,400 | | | | 3.06 | % |
| | Wells Fargo & Co. | | | 67,000 | | | | 2,544,660 | | | | 4.25 | % |
| | | | | | | | | 53,899,920 | | | | 89.98 | % |
| | | | | | | | | | | | | | |
| | Information Technology – 9.11% | | | | | | | | | | | | |
| | MasterCard, Inc., Class A | | | 5,000 | | | | 2,764,650 | | | | 4.61 | % |
| | Visa, Inc., Class A | | | 16,000 | | | | 2,695,360 | | | | 4.50 | % |
| | | | | | | | | 5,460,010 | | | | 9.11 | % |
| | Total Common Stocks | | | | | | | | | | | | |
| | (Cost $47,550,459) | | | | | | | 59,359,930 | | | | 99.09 | % |
| | | | | | | | | | | | | | |
| | SHORT-TERM INVESTMENTS – 0.20% | | | | | | | | | | | | |
| | | | | | | | | | | | | | |
| | Money Market Funds – 0.20% | | | | | | | | | | | | |
| | Fidelity Government Portfolio – | | | | | | | | | | | | |
| | Institutional Class, 0.01 (c) | | | 119,358 | | | $ | 119,358 | | | | 0.20 | % |
| | | | | | | | | | | | | | |
| | Total Money Market Funds | | | | | | | | | | | | |
| | (Cost $119,358) | | | | | | | 119,358 | | | | 0.20 | % |
| | | | | | | | | | | | | | |
| | Total Short-Term Investments | | | | | | | | | | | | |
| | (Cost $119,358) | | | | | | | 119,358 | | | | 0.20 | % |
| | | | | | | | | | | | | | |
| | Total Investments | | | | | | | | | | | | |
| | (Cost $47,669,817) – 99.29% | | | | | | | 59,479,288 | | | | 99.29 | % |
| | | | | | | | | | | | | | |
| | Other Assets in Excess | | | | | | | | | | | | |
| | of Liabilities – 0.71% | | | | | | | 426,337 | | | | 0.71 | % |
| | TOTAL NET ASSETS – 100.00% | | | | | | $ | 59,905,625 | | | | 100.00 | % |
Percentages are stated as a percent of net assets.
| | (a) | Non-income producing security. | | | |
| | (b) | Investment in affiliated security. Quasar Distributors, LLC, which serves as the Fund’s distributor, is a subsidiary of U.S. Bancorp. Details of transactions with this affiliated company for the year ended April 30, 2013, are as follows: |
| | | Issuer | | U.S. Bancorp | |
| | | Beginning Cost | | $ | 1,688,883 | |
| | | Purchase Cost | | $ | 646,227 | |
| | | Sales Cost | | $ | 783,705 | |
| | | Ending Cost | | $ | 1,551,405 | |
| | | Dividend Income | | $ | 27,300 | |
| | | Shares | | | 55,000 | |
| | | Market Value | | $ | 1,830,400 | |
| | (c) | The rate listed is the fund’s 7-day yield as of April 30, 2013. | | | | |
The accompanying notes are an integral part of these financial statements.
HENNESSY FUNDS 1-800-966-4354
Summary of Fair Value Exposure at April 30, 2013
The following is a summary of the inputs used to value the Fund’s net assets as of April 30, 2013 (See Note 3 in the accompanying notes to the financial statements):
| | Common Stock | | Level 1 | | | Level 2 | | | Level 3 | | | Total | |
| | Financials | | $ | 53,899,920 | | | $ | — | | | $ | — | | | $ | 53,899,920 | |
| | Information Technology | | | 5,460,010 | | | | — | | | | — | | | | 5,460,010 | |
| | Total Common Stock | | $ | 59,359,930 | | | $ | — | | | $ | — | | | $ | 59,359,930 | |
| | Short-Term Investments | | | | | | | | | | | | | | | | |
| | Money Market Funds | | $ | 119,358 | | | $ | — | | | $ | — | | | $ | 119,358 | |
| | Total Short-Term Investments | | $ | 119,358 | | | $ | — | | | $ | — | | | $ | 119,358 | |
| | Total Investments in Securities | | $ | 59,479,288 | | | $ | — | | | $ | — | | | $ | 59,479,288 | |
Transfers between levels are recognized at the end of the reporting period. During the six-month period ended April 30, 2013, the Fund recognized no transfers between levels.
The accompanying notes are an integral part of these financial statements.
HENNESSY TECHNOLOGY FUND
As of April 30, 2013 (Unaudited)
(% of Net Assets)
| | TOP TEN EQUITY HOLDINGS | % net assets |
| | Catamaran Corp. | 4.36% |
| | Intuitive Surgical, Inc. | 4.35% |
| | Cognizant Technology Solutions Corp. | 4.35% |
| | Alexion Pharmaceuticals, Inc. | 4.29% |
| | QUALCOMM, Inc. | 4.24% |
| | Google, Inc. | 4.23% |
| | Cisco Systems, Inc. | 4.22% |
| | Cerner Corp. | 4.19% |
| | NetApp, Inc. | 4.18% |
| | Oracle Corp. | 4.17% |
Note: For presentation purposes, the Fund has grouped some of the industry categories. For purposes of categorizing securities for compliance with Section 8(b)(1) of the Investment Company Act of 1940, the Fund uses more specific industry classifications.
HENNESSY FUNDS 1-800-966-4354
| | COMMON STOCKS – 94.46% | | Number | | | | | | % of | |
| | | | of Shares | | | Value | | | Net Assets | |
| | Consumer Discretionary – 5.26% | | | | | | | | | |
| | Imax Corp. (a)(b) | | | 1,250 | | | $ | 31,913 | | | | 0.59 | % |
| | priceline.com, Inc. (a) | | | 316 | | | | 219,933 | | | | 4.08 | % |
| | Shutterfly, Inc. (a) | | | 710 | | | | 31,616 | | | | 0.59 | % |
| | | | | | | | | 283,462 | | | | 5.26 | % |
| | | | | | | | | | | | | | |
| | Financials – 0.77% | | | | | | | | | | | | |
| | Zillow, Inc. (a) | | | 710 | | | | 41,769 | | | | 0.77 | % |
| | | | | | | | | | | | | | |
| | Health Care – 19.89% | | | | | | | | | | | | |
| | Alexion Pharmaceuticals, Inc. (a) | | | 2,360 | | | | 231,280 | | | | 4.29 | % |
| | athenahealth, Inc. (a) | | | 700 | | | | 67,382 | | | | 1.25 | % |
| | Catamaran Corp. (a)(b) | | | 4,070 | | | | 234,961 | | | | 4.36 | % |
| | Cerner Corp. (a) | | | 2,335 | | | | 225,958 | | | | 4.19 | % |
| | HealthStream, Inc. (a) | | | 1,350 | | | | 30,996 | | | | 0.57 | % |
| | Intuitive Surgical, Inc. (a) | | | 477 | | | | 234,822 | | | | 4.35 | % |
| | Myriad Genetics, Inc. (a) | | | 1,695 | | | | 47,206 | | | | 0.88 | % |
| | | | | | | | | 1,072,605 | | | | 19.89 | % |
| | | | | | | | | | | | | | |
| | Industrials – 2.16% | | | | | | | | | | | | |
| | Quanta Services, Inc. (a) | | | 4,230 | | | | 116,240 | | | | 2.16 | % |
| | | | | | | | | | | | | | |
| | Information Technology – 65.19% | | | | | | | | | | | | |
| | 3D Systems Corp. (a) | | | 1,842 | | | | 70,438 | | | | 1.31 | % |
| | Aruba Networks, Inc. (a) | | | 2,160 | | | | 48,578 | | | | 0.90 | % |
| | Cisco Systems, Inc. | | | 10,880 | | | | 227,609 | | | | 4.22 | % |
| | Cognizant Technology | | | | | | | | | | | | |
| | Solutions Corp., Class A (a) | | | 3,617 | | | | 234,382 | | | | 4.35 | % |
| | CoStar Group, Inc. (a) | | | 590 | | | | 63,962 | | | | 1.19 | % |
| | Datawatch Corp. (a) | | | 2,175 | | | | 27,405 | | | | 0.51 | % |
| | Equinix, Inc. (a) | | | 985 | | | | 210,888 | | | | 3.91 | % |
| | Fabrinet (a)(b) | | | 2,100 | | | | 28,833 | | | | 0.53 | % |
| | First Solar, Inc. (a) | | | 1,785 | | | | 83,110 | | | | 1.54 | % |
| | Fortinet, Inc. (a) | | | 3,285 | | | | 58,999 | | | | 1.09 | % |
| | Google, Inc., Class A (a) | | | 277 | | | | 228,406 | | | | 4.23 | % |
| | IAC Interactivecorp | | | 1,740 | | | | 81,902 | | | | 1.52 | % |
| | Interdigital, Inc. | | | 855 | | | | 37,970 | | | | 0.70 | % |
| | IPG Photonics Corp. | | | 1,079 | | | | 68,711 | | | | 1.27 | % |
| | IXIA (a) | | | 1,810 | | | | 29,811 | | | | 0.55 | % |
| | LivePerson, Inc. (a) | | | 2,210 | | | | 28,332 | | | | 0.53 | % |
| | MICROS Systems, Inc. (a) | | | 1,640 | | | | 69,552 | | | | 1.29 | % |
| | Monotype Imaging Holdings, Inc. | | | 1,325 | | | | 30,727 | | | | 0.57 | % |
| | NetApp, Inc. (a) | | | 6,465 | | | | 225,564 | | | | 4.18 | % |
| | NetSuite, Inc. (a) | | | 1,500 | | | | 131,940 | | | | 2.45 | % |
| | NeuStar, Inc. (a) | | | 1,270 | | | | 55,715 | | | | 1.03 | % |
| | OmniVision Technologies, Inc. (a) | | | 2,310 | | | | 30,977 | | | | 0.57 | % |
| | Oracle Corp. | | | 6,860 | | | | 224,871 | | | | 4.17 | % |
| | PROS Holdings, Inc. (a) | | | 1,138 | | | | 29,497 | | | | 0.55 | % |
| | QUALCOMM, Inc. | | | 3,710 | | | | 228,610 | | | | 4.24 | % |
| | Rackspace Hosting, Inc. (a) | | | 2,865 | | | | 138,093 | | | | 2.56 | % |
| | RF Industries Ltd. | | | 4,908 | | | | 29,399 | | | | 0.55 | % |
| | Rudolph Technologies, Inc. (a) | | | 2,790 | | | | 32,559 | | | | 0.60 | % |
| | salesforce.com, Inc. (a) | | | 5,380 | | | | 221,172 | | | | 4.10 | % |
| | Semtech Corp. (a) | | | 1,375 | | | | 44,096 | | | | 0.82 | % |
| | SolarWinds, Inc. (a) | | | 1,540 | | | | 78,309 | | | | 1.45 | % |
| | Sourcefire, Inc. (a) | | | 615 | | | | 29,372 | | | | 0.55 | % |
| | SS&C Technologies Holdings, Inc. (a) | | | 1,615 | | | | 49,564 | | | | 0.92 | % |
| | Syntel, Inc. | | | 799 | | | | 50,473 | | | | 0.94 | % |
| | Tangoe, Inc. (a) | | | 2,450 | | | | 31,507 | | | | 0.58 | % |
| | Ultratech, Inc. (a) | | | 1,025 | | | | 30,207 | | | | 0.56 | % |
| | Western Digital Corp. | | | 4,060 | | | | 224,437 | | | | 4.16 | % |
| | | | | | | | | 3,515,977 | | | | 65.19 | % |
| | | | | | | | | | | | | | |
| | Manufacturing – 1.19% | | | | | | | | | | | | |
| | Stratasys Ltd. (a)(b) | | | 775 | | | | 64,365 | | | | 1.19 | % |
| | | | | | | | | | | | | | |
| | Total Common Stocks | | | | | | | | | | | | |
| | (Cost $4,657,993) | | | | | | | 5,094,418 | | | | 94.46 | % |
| | | | | | | | | | | | | | |
| | MUTUAL FUNDS – 0.57% | | | | | | | | | | | | |
| | | | | | | | | | | | | | |
| | Hercules Technology Growth Capital, Inc. | | | 2,320 | | | | 30,856 | | | | 0.57 | % |
| | | | | | | | | | | | | | |
| | Total Mutual Funds | | | | | | | | | | | | |
| | (Cost $30,635) | | | | | | | 30,856 | | | | 0.57 | % |
| | | | | | | | | | | | | | |
| | SHORT-TERM INVESTMENTS – 5.51% | | | | | | | | | | | | |
| | | | | | | | | | | | | | |
| | Money Market Funds – 5.51% | | | | | | | | | | | | |
| | Federated Government | | | | | | | | | | | | |
| | Obligations Fund – Class I, 0.01 (c) | | | 37,373 | | | | 37,373 | | | | 0.69 | % |
| | Fidelity Government Portfolio – | | | | | | | | | | | | |
| | Institutional Class, 0.01 (c) | | | 260,000 | | | | 260,000 | | | | 4.82 | % |
| | | | | | | | | | | | | | |
| | Total Money Market Funds | | | | | | | | | | | | |
| | (Cost $297,373) | | | | | | | 297,373 | | | | 5.51 | % |
| | | | | | | | | | | | | | |
| | Total Short-Term Investments | | | | | | | | | | | | |
| | (Cost $297,373) | | | | | | | 297,373 | | | | 5.51 | % |
| | | | | | | | | | | | | | |
| | Total Investments | | | | | | | | | | | | |
| | (Cost $4,986,001) – 100.54% | | | | | | | 5,422,647 | | | | 100.54 | % |
| | | | | | | | | | | | | | |
| | Liabilities in Excess of | | | | | | | | | | | | |
| | Other Assets – (0.54)% | | | | | | | (29,120 | ) | | | (0.54 | )% |
| | TOTAL NET ASSETS – 100.00% | | | | | | $ | 5,393,527 | | | | 100.00 | % |
Percentages are stated as a percent of net assets.
| | (a) | Non-income producing security. |
| | (b) | U.S. traded security of a foreign corporation. |
| | (c) | The rate listed is the fund’s 7-day yield as of April 30, 2013. |
The accompanying notes are an integral part of these financial statements.
Summary of Fair Value Exposure at April 30, 2013
The following is a summary of the inputs used to value the Fund’s net assets as of April 30, 2013 (See Note 3 in the accompanying notes to the financial statements):
| | Common Stock | | Level 1 | | | Level 2 | | | Level 3 | | | Total | |
| | Consumer Discretionary | | $ | 283,462 | | | $ | — | | | $ | — | | | $ | 283,462 | |
| | Financials | | | 41,769 | | | | — | | | | — | | | | 41,769 | |
| | Health Care | | | 1,072,605 | | | | — | | | | — | | | | 1,072,605 | |
| | Industrials | | | 116,240 | | | | — | | | | — | | | | 116,240 | |
| | Information Technology | | | 3,515,977 | | | | — | | | | — | | | | 3,515,977 | |
| | Manufacturing | | | 64,365 | | | | — | | | | — | | | | 64,365 | |
| | Total Common Stock | | $ | 5,094,418 | | | $ | — | | | $ | — | | | $ | 5,094,418 | |
| | Mutual Funds | | | | | | | | | | | | | | | | |
| | Mutual Funds | | $ | 30,856 | | | $ | — | | | $ | — | | | $ | 30,856 | |
| | Total Mutual Funds | | $ | 30,856 | | | $ | — | | | $ | — | | | $ | 30,856 | |
| | Short-Term Investments | | | | | | | | | | | | | | | | |
| | Money Market Funds | | $ | 297,373 | | | $ | — | | | $ | — | | | $ | 297,373 | |
| | Total Short-Term Investments | | $ | 297,373 | | | $ | — | | | $ | — | | | $ | 297,373 | |
| | Total Investments in Securities | | $ | 5,422,647 | | | $ | — | | | $ | — | | | $ | 5,422,647 | |
Transfers between levels are recognized at the end of the reporting period. During the six-month period ended April 30, 2013, the Fund recognized no transfers between levels.
The accompanying notes are an integral part of these financial statements.
HENNESSY FUNDS 1-800-966-4354
HENNESSY JAPAN FUND
As of April 30, 2013 (Unaudited)
(% of Net Assets)
| | TOP TEN EQUITY HOLDINGS | % net assets |
| | Ryohin Keikaku Co., Ltd. | 7.16% |
| | Shimano, Inc. | 5.64% |
| | Misumi Group, Inc. | 5.43% |
| | Keyence Corp. | 5.41% |
| | Nidec Corp. | 4.80% |
| | Rohto Pharmaceutical Co., Ltd. | 4.79% |
| | Kao Corp. | 4.75% |
| | Mitsubishi Corp. | 4.43% |
| | Asics Corp. | 4.10% |
| | Sumitomo Corp. | 4.08% |
Note: For presentation purposes, the Fund has grouped some of the industry categories. For purposes of categorizing securities for compliance with Section 8(b)(1) of the Investment Company Act of 1940, the Fund uses more specific industry classifications.
| | COMMON STOCKS – 80.60% | | Number | | | | | | % of | |
| | | | of Shares | | | Value | | | Net Assets | |
| | Consumer Discretionary – 21.11% | | | | | | | | | |
| | Asics Corp. | | | 68,000 | | | $ | 1,225,584 | | | | 4.10 | % |
| | Isuzu Motors, Ltd. | | | 189,000 | | | | 1,258,255 | | | | 4.21 | % |
| | Ryohin Keikaku Co., Ltd. | | | 22,700 | | | | 2,142,278 | | | | 7.16 | % |
| | Shimano, Inc. | | | 19,400 | | | | 1,685,572 | | | | 5.64 | % |
| | | | | | | | | 6,311,689 | | | | 21.11 | % |
| | | | | | | | | | | | | | |
| | Consumer Staples – 10.95% | | | | | | | | | | | | |
| | Kao Corp. | | | 41,100 | | | | 1,420,803 | | | | 4.75 | % |
| | Pigeon Corp. | | | 11,200 | | | | 961,625 | | | | 3.22 | % |
| | Unicharm Corp. | | | 13,800 | | | | 891,829 | | | | 2.98 | % |
| | | | | | | | | 3,274,257 | | | | 10.95 | % |
| | | | | | | | | | | | | | |
| | Financials – 4.16% | | | | | | | | | | | | |
| | Mizuho Financial Group | | | 238,500 | | | | 526,004 | | | | 1.76 | % |
| | Sumitomo Mitsui Financial Group, Inc. | | | 15,200 | | | | 718,018 | | | | 2.40 | % |
| | | | | | | | | 1,244,022 | | | | 4.16 | % |
| | | | | | | | | | | | | | |
| | Health Care – 10.59% | | | | | | | | | | | | |
| | Mani, Inc. | | | 12,700 | | | | 429,261 | | | | 1.43 | % |
| | Rohto Pharmaceutical Co., Ltd. | | | 102,000 | | | | 1,431,358 | | | | 4.79 | % |
| | Terumo Corp. | | | 26,300 | | | | 1,305,760 | | | | 4.37 | % |
| | | | | | | | | 3,166,379 | | | | 10.59 | % |
| | | | | | | | | | | | | | |
| | Industrials – 26.57% | | | | | | | | | | | | |
| | Daikin Industries | | | 19,700 | | | | 790,142 | | | | 2.64 | % |
| | Itochu Corp. | | | 52,500 | | | | 648,946 | | | | 2.17 | % |
| | Komatsu, Ltd. | | | 11,300 | | | | 308,219 | | | | 1.03 | % |
| | Marubeni Corp. | | | 83,000 | | | | 593,435 | | | | 1.99 | % |
| | Misumi Group, Inc. | | | 53,300 | | | | 1,624,396 | | | | 5.43 | % |
| | Mitsubishi Corp. | | | 73,800 | | | | 1,323,305 | | | | 4.43 | % |
| | Nidec Corp. | | | 21,100 | | | | 1,435,021 | | | | 4.80 | % |
| | Sumitomo Corp. | | | 97,900 | | | | 1,221,177 | | | | 4.08 | % |
| | | | | | | | | 7,944,641 | | | | 26.57 | % |
| | | | | | | | | | | | | | |
| | Information Technology – 5.41% | | | | | | | | | | | | |
| | Keyence Corp. | | | 5,100 | | | | 1,616,556 | | | | 5.41 | % |
| | | | | | | | | | | | | | |
| | Materials – 1.81% | | | | | | | | | | | | |
| | Fuji Seal International, Inc. | | | 19,300 | | | | 543,057 | | | | 1.81 | % |
| | | | | | | | | | | | | | |
| | Total Common Stocks | | | | | | | | | | | | |
| | (Cost $16,562,758) | | | | | | | 24,100,601 | | | | 80.60 | % |
| | | | | | | | | | | | | | |
| | SHORT-TERM INVESTMENTS – 20.95% | | | | | | | | | | | | |
| | | | | | | | | | | | | | |
| | Money Market Funds – 20.95% | | | | | | | | | | | | |
| | Dreyfus Government Cash | | | | | | | | | | | | |
| | Management, 0.01% (a) | | | 1,350,000 | | | $ | 1,350,000 | | | | 4.51 | % |
| | Fidelity Institutional Money | | | | | | | | | | | | |
| | Market Portfolio, 0.043% (a) | | | 865,849 | | | | 865,849 | | | | 2.91 | % |
| | Federated Government | | | | | | | | | | | | |
| | Obligations Fund – Class I, 0.01% (a) | | | 1,350,000 | | | | 1,350,000 | | | | 4.51 | % |
| | Federated Treasury | | | | | | | | | | | | |
| | Obligations Fund, 0.01% (a) | | | 1,350,000 | | | | 1,350,000 | | | | 4.51 | % |
| | Fidelity Government Portfolio – | | | | | | | | | | | | |
| | Institutional Class, 0.01% (a) | | | 1,350,000 | | | | 1,350,000 | | | | 4.51 | % |
| | | | | | | | | | | | | | |
| | Total Money Market Funds | | | | | | | | | | | | |
| | (Cost $6,265,849) | | | | | | | 6,265,849 | | | | 20.95 | % |
| | | | | | | | | | | | | | |
| | Total Short-Term Investments | | | | | | | | | | | | |
| | (Cost $6,265,849) | | | | | | | 6,265,849 | | | | 20.95 | % |
| | | | | | | | | | | | | | |
| | Total Investments | | | | | | | | | | | | |
| | (Cost $22,828,607) – 101.55% | | | | | | | 30,366,450 | | | | 101.55 | % |
| | | | | | | | | | | | | | |
| | Liabilities in Excess of | | | | | | | | | | | | |
| | Other Assets – (1.55)% | | | | | | | (465,098 | ) | | | (1.55 | )% |
| | TOTAL NET ASSETS – 100.00% | | | | | | $ | 29,901,352 | | | | 100.00 | % |
Percentages are stated as a percent of net assets.
| | (a) | The rate listed is the fund’s 7-day yield as of April 30, 2013. |
The accompanying notes are an integral part of these financial statements.
HENNESSY FUNDS 1-800-966-4354
Summary of Fair Value Exposure at April 30, 2013
The following is a summary of the inputs used to value the Fund’s net assets as of April 30, 2013 (See Note 3 in the accompanying notes to the financial statements):
| | Common Stock | | Level 1 | | | Level 2 | | | Level 3 | | | Total | |
| | Consumer Discretionary | | $ | 6,311,689 | | | $ | — | | | $ | — | | | $ | 6,311,689 | |
| | Consumer Staples | | | 3,274,257 | | | | — | | | | — | | | | 3,274,257 | |
| | Financials | | | 1,244,022 | | | | — | | | | — | | | | 1,244,022 | |
| | Health Care | | | 3,166,379 | | | | — | | | | — | | | | 3,166,379 | |
| | Industrials | | | 7,944,641 | | | | — | | | | — | | | | 7,944,641 | |
| | Information Technology | | | 1,616,556 | | | | — | | | | — | | | | 1,616,556 | |
| | Materials | | | 543,057 | | | | — | | | | — | | | | 543,057 | |
| | Total Common Stock | | $ | 24,100,601 | | | $ | — | | | $ | — | | | $ | 24,100,601 | |
| | Short-Term Investments | | | | | | | | | | | | | | | | |
| | Money Market Funds | | $ | 6,265,849 | | | $ | — | | | $ | — | | | $ | 6,265,849 | |
| | Total Short-Term Investments | | $ | 6,265,849 | | | $ | — | | | $ | — | | | $ | 6,265,849 | |
| | Total Investments in Securities | | $ | 30,366,450 | | | $ | — | | | $ | — | | | $ | 30,366,450 | |
Transfers between levels are recognized at the end of the reporting period. During the six-month period ended April 30, 2013, the Fund recognized no transfers between levels.
The accompanying notes are an integral part of these financial statements.
HENNESSY JAPAN SMALL CAP FUND
As of April 30, 2013 (Unaudited)
(% of Net Assets)
| | TOP TEN EQUITY HOLDINGS | % net assets |
| | Seiko Holdings | 2.44% |
| | Obara Group, Inc. | 2.29% |
| | Village Vanguard Co., Ltd. | 2.23% |
| | D.A. Consortium, Inc. | 2.03% |
| | UT Holdings Co., Ltd. | 2.01% |
| | Elecom Co., Ltd. | 1.93% |
| | Central Glass Co. | 1.91% |
| | Prestige International, Inc. | 1.89% |
| | Iriso Electronics | 1.87% |
| | Sankyo Seiko Co. | 1.83% |
Note: For presentation purposes, the Fund has grouped some of the industry categories. For purposes of categorizing securities for compliance with Section 8(b)(1) of the Investment Company Act of 1940, the Fund uses more specific industry classifications.
HENNESSY FUNDS 1-800-966-4354
| | COMMON STOCKS – 89.54% | | Number | | | | | | % of | |
| | | | of Shares | | | Value | | | Net Assets | |
| | Consumer Discretionary – 23.91% | | | | | | | | | |
| | Accordia Golf Co., Ltd. | | | 268 | | | $ | 304,330 | | | | 1.46 | % |
| | Ahresty Corp. | | | 43,000 | | | | 293,768 | | | | 1.41 | % |
| | Alpen Co. Ltd. | | | 8,900 | | | | 185,788 | | | | 0.89 | % |
| | D.A. Consortium, Inc. | | | 97,200 | | | | 423,757 | | | | 2.03 | % |
| | Doshisha Co., Ltd. | | | 18,400 | | | | 289,915 | | | | 1.39 | % |
| | Faltec Co., Ltd. | | | 8,000 | | | | 377,494 | | | | 1.81 | % |
| | Gulliver International Co., Ltd. | | | 29,100 | | | | 233,433 | | | | 1.12 | % |
| | Hagihara Industries Inc. | | | 15,700 | | | | 286,831 | | | | 1.37 | % |
| | Mitsui Home Co. | | | 69,000 | | | | 414,772 | | | | 1.99 | % |
| | Nippon Seiki Co., Ltd. | | | 27,000 | | | | 355,901 | | | | 1.70 | % |
| | Sankyo Seiko Co. | | | 100,000 | | | | 382,623 | | | | 1.83 | % |
| | Seiko Holdings | | | 87,000 | | | | 509,586 | | | | 2.44 | % |
| | Seiren Co Ltd | | | 43,200 | | | | 287,601 | | | | 1.38 | % |
| | Tohokushinsha Film Corp. | | | 18,100 | | | | 179,171 | | | | 0.86 | % |
| | Village Vanguard Co., Ltd. | | | 221 | | | | 466,552 | | | | 2.23 | % |
| | | | | | | | | 4,991,522 | | | | 23.91 | % |
| | | | | | | | | | | | | | |
| | Consumer Staples – 1.45% | | | | | | | | | | | | |
| | S Foods, Inc. | | | 30,000 | | | | 302,200 | | | | 1.45 | % |
| | | | | | | | | | | | | | |
| | Financials – 1.56% | | | | | | | | | | | | |
| | Kenedix, Inc. | | | 451 | | | | 326,158 | | | | 1.56 | % |
| | | | | | | | | | | | | | |
| | Industrials – 34.27% | | | | | | | | | | | | |
| | Anest Iwata Corp. | | | 75,000 | | | | 328,512 | | | | 1.57 | % |
| | Central Glass Co. | | | 113,000 | | | | 398,749 | | | | 1.91 | % |
| | Fuji Machine Manufacturing Co., Ltd. | | | 22,000 | | | | 191,147 | | | | 0.92 | % |
| | Hanwa Co., Ltd. | | | 93,000 | | | | 350,116 | | | | 1.68 | % |
| | Japan Pulp & Paper Co., Ltd. | | | 98,000 | | | | 299,574 | | | | 1.43 | % |
| | Kito Corp. | | | 30,600 | | | | 324,881 | | | | 1.56 | % |
| | Kitz Corp. | | | 65,600 | | | | 378,183 | | | | 1.81 | % |
| | Kyosan Electric Manufacturing Co., Ltd. | | | 108,000 | | | | 357,840 | | | | 1.71 | % |
| | NEC Capital Solutions Ltd. | | | 9,400 | | | | 346,648 | | | | 1.66 | % |
| | Nichiha Corp. | | | 18,700 | | | | 299,246 | | | | 1.43 | % |
| | Nihon Trim Co., Ltd. | | | 6,650 | | | | 375,186 | | | | 1.80 | % |
| | Nippon Koei Co. | | | 64,000 | | | | 251,444 | | | | 1.20 | % |
| | Nittoku Engineering Co., Ltd. | | | 22,900 | | | | 226,451 | | | | 1.08 | % |
| | Obara Group, Inc. | | | 19,800 | | | | 477,507 | | | | 2.29 | % |
| | Prestige International, Inc. | | | 31,100 | | | | 393,994 | | | | 1.89 | % |
| | Sankyu, Inc. | | | 55,000 | | | | 245,422 | | | | 1.18 | % |
| | Sanwa Holdings Corp. | | | 51,000 | | | | 309,186 | | | | 1.48 | % |
| | SBS Holdings, Inc. | | | 21,500 | | | | 295,312 | | | | 1.41 | % |
| | Shin Nippon Air Technologies Co., Ltd. | | | 61,900 | | | | 367,012 | | | | 1.76 | % |
| | Teikoku Electric Manufacturing Co., Ltd. | | | 13,900 | | | | 263,927 | | | | 1.26 | % |
| | Tocalo Co., Ltd. | | | 22,000 | | | | 321,588 | | | | 1.54 | % |
| | Tomoe Engineering Co., Ltd. | | | 14,700 | | | | 302,339 | | | | 1.45 | % |
| | Toshin Group Co., Ltd. | | | 2,200 | | | | 52,334 | | | | 0.25 | % |
| | | | | | | | | 7,156,598 | | | | 34.27 | % |
| | | | | | | | | | | | | | |
| | Information Technology – 20.11% | | | | | | | | | | | | |
| | Asahi Net, Inc. | | | 50,000 | | | | 255,937 | | | | 1.23 | % |
| | Broadleaf Co., Ltd. | | | 15,000 | | | | 277,273 | | | | 1.33 | % |
| | Elecom Co., Ltd. | | | 29,000 | | | | 403,683 | | | | 1.93 | % |
| | Hakuto Co., Ltd. | | | 31,900 | | | | 325,921 | | | | 1.56 | % |
| | Iriso Electronics | | | 17,400 | | | | 391,426 | | | | 1.87 | % |
| | Macnica, Inc. | | | 15,100 | | | | 308,242 | | | | 1.48 | % |
| | Nippon Chemi-Con Corp. | | | 79,000 | | | | 269,047 | | | | 1.29 | % |
| | SIIX Corp. | | | 18,900 | | | | 284,998 | | | | 1.37 | % |
| | SRA Holdings, Inc. | | | 26,200 | | | | 298,323 | | | | 1.43 | % |
| | Sumida Corp. | | | 44,400 | | | | 226,361 | | | | 1.08 | % |
| | Tamura Corp. | | | 61,000 | | | | 126,399 | | | | 0.61 | % |
| | Towa Corp. | | | 56,600 | | | | 348,942 | | | | 1.67 | % |
| | UT Holdings Co., Ltd. | | | 465 | | | | 420,234 | | | | 2.01 | % |
| | Yokowo Co., Ltd. | | | 44,800 | | | | 261,488 | | | | 1.25 | % |
| | | | | | | | | 4,198,274 | | | | 20.11 | % |
| | | | | | | | | | | | | | |
| | Materials – 7.50% | | | | | | | | | | | | |
| | Fujikura Kasei Co., Ltd. | | | 33,500 | | | | 138,488 | | | | 0.66 | % |
| | Fujimori Kogyo Co. | | | 10,000 | | | | 319,023 | | | | 1.53 | % |
| | Harima Chemicals Group, Inc. | | | 51,100 | | | | 246,366 | | | | 1.18 | % |
| | Hodogaya Chemical Co., Ltd. | | | 80,000 | | | | 180,540 | | | | 0.87 | % |
| | Konishi Co., Ltd. | | | 6,000 | | | | 111,279 | | | | 0.53 | % |
| | Ube Material Industries, Ltd. | | | 102,000 | | | | 244,838 | | | | 1.17 | % |
| | Yushiro Chemical Industry Co., Ltd. | | | 33,800 | | | | 325,917 | | | | 1.56 | % |
| | | | | | | | | 1,566,451 | | | | 7.50 | % |
| | | | | | | | | | | | | | |
| | Utilities – 0.74% | | | | | | | | | | | | |
| | Shizuokagas Co. | | | 19,500 | | | | 154,423 | | | | 0.74 | % |
| | | | | | | | | | | | | | |
| | Total Common Stocks | | | | | | | | | | | | |
| | (Cost $15,228,009) | | | | | | | 18,695,626 | | | | 89.54 | % |
The accompanying notes are an integral part of these financial statements.
| | SHORT-TERM INVESTMENTS – 10.90% | | Number | | | | | | % of | |
| | | | of Shares | | | Value | | | Net Assets | |
| | Money Market Funds – 10.90% | | | | | | | | | |
| | Federated Government | | | | | | | | | |
| | Obligations Fund – Class I, 0.01% (a) | | | 950,000 | | | $ | 950,000 | | | | 4.55 | % |
| | Federated Treasury | | | | | | | | | | | | |
| | Obligations Fund, 0.01% (a) | | | 374,990 | | | | 374,990 | | | | 1.80 | % |
| | Fidelity Government Portfolio – | | | | | | | | | | | | |
| | Institutional Class, 0.01% (a) | | | 950,000 | | | | 950,000 | | | | 4.55 | % |
| | | | | | | | | | | | | | |
| | Total Money Market Funds | | | | | | | | | | | | |
| | (Cost $2,274,990) | | | | | | | 2,274,990 | | | | 10.90 | % |
| | | | | | | | | | | | | | |
| | Total Short-Term Investments | | | | | | | | | | | | |
| | (Cost $2,274,990) | | | | | | | 2,274,990 | | | | 10.90 | % |
| | | | | | | | | | | | | | |
| | Total Investments | | | | | | | | | | | | |
| | (Cost $17,502,999) – 100.44% | | | | | | | 20,970,616 | | | | 100.44 | % |
| | | | | | | | | | | | | | |
| | Liabilities in Excess of | | | | | | | | | | | | |
| | Other Assets – (0.44)% | | | | | | | (90,899 | ) | | | (0.44 | )% |
| | TOTAL NET ASSETS – 100.00% | | | | | | $ | 20,879,717 | | | | 100.00 | % |
Percentages are stated as a percent of net assets.
| | (a) | The rate listed is the fund’s 7-day yield as of April 30, 2013. |
Summary of Fair Value Exposure at April 30, 2013
The following is a summary of the inputs used to value the Fund’s net assets as of April 30, 2013 (See Note 3 in the accompanying notes to the financial statements):
| | Common Stock | | Level 1 | | | Level 2 | | | Level 3 | | | Total | |
| | Consumer Discretionary | | $ | 4,991,522 | | | $ | — | | | $ | — | | | $ | 4,991,522 | |
| | Consumer Staples | | | 302,200 | | | | — | | | | — | | | | 302,200 | |
| | Financials | | | 326,158 | | | | — | | | | — | | | | 326,158 | |
| | Industrials | | | 7,156,598 | | | | — | | | | — | | | | 7,156,598 | |
| | Information Technology | | | 4,198,274 | | | | — | | | | — | | | | 4,198,274 | |
| | Materials | | | 1,566,451 | | | | — | | | | — | | | | 1,566,451 | |
| | Utilities | | | 154,423 | | | | — | | | | — | | | | 154,423 | |
| | Total Common Stock | | $ | 18,695,626 | | | $ | — | | | $ | — | | | $ | 18,695,626 | |
| | Short-Term Investments | | | | | | | | | | | | | | | | |
| | Money Market Funds | | $ | 2,274,990 | | | $ | — | | | $ | — | | | $ | 2,274,990 | |
| | Total Short-Term Investments | | $ | 2,274,990 | | | $ | — | | | $ | — | | | $ | 2,274,990 | |
| | Total Investments in Securities | | $ | 20,970,616 | | | $ | — | | | $ | — | | | $ | 20,970,616 | |
Transfers between levels are recognized at the end of the reporting period. During the six-month period ended April 30, 2013, the Fund recognized no transfers between levels.
The accompanying notes are an integral part of these financial statements.
HENNESSY FUNDS 1-800-966-4354
Financial Statements
Statements of Assets and Liabilities as of April 30, 2013 (Unaudited) |
| | | | | | | | | | HENNESSY | |
| | | | HENNESSY | | | HENNESSY | | | CORNERSTONE | |
| | | | CORNERSTONE | | | FOCUS | | | MID CAP 30 | |
| | | | GROWTH FUND | | | FUND | | | FUND | |
| ASSETS: | | | | | | | | | | |
| Investments in securities, at value (cost $293,424,996, $428,085,846, | | | | | | | | | | |
| $178,484,466, $82,952,185, $116,023,361, $111,220,048, $99,795,418, | | | | | | | | | | |
| $243,269,132, $12,080,594 and $11,368,601, respectively) | | | $ | 313,648,889 | | | $ | 914,491,120 | | | $ | 209,689,874 | |
| Dividends and interest receivable | | | | 125,605 | | | | 132,442 | | | | 77,723 | |
| Receivable for fund shares sold | | | | 107,044 | | | | 3,380,655 | | | | 762,018 | |
| Receivable for securities sold | | | | — | | | | — | | | | — | |
| Return of capital receivable | | | | 68,207 | | | | — | | | | — | |
| Prepaid expenses and other assets | | | | 35,499 | | | | 41,077 | | | | 38,588 | |
| Due from Advisor | | | | — | | | | — | | | | — | |
| Total Assets | | | | 313,985,244 | | | | 918,045,294 | | | | 210,568,203 | |
| | | | | | | | | | | | | | | |
| LIABILITIES: | | | | | | | | | | | | | |
| Payable for securities purchased | | | | — | | | | 820,597 | | | | — | |
| Payable for fund shares redeemed | | | | 1,224,824 | | | | 329,833 | | | | 247,499 | |
| Payable to Advisor | | | | 194,349 | | | | 654,456 | | | | 123,284 | |
| Payable to Administrator | | | | 97,566 | | | | 178,891 | | | | 58,005 | |
| Payable to Auditor | | | | 26,410 | | | | 9,628 | | | | 21,717 | |
| Distribution payable | | | | — | | | | — | | | | — | |
| Accrued distribution fees | | | | — | | | | 307,561 | | | | — | |
| Accrued service fees | | | | 23,918 | | | | — | | | | 12,874 | |
| Reverse repurchase agreement | | | | — | | | | — | | | | — | |
| Accrued interest payable | | | | 157 | | | | — | | | | 551 | |
| Accrued directors fees | | | | — | | | | — | | | | — | |
| Accrued expenses and other payables | | | | 136,885 | | | | 193,811 | | | | 75,365 | |
| Total Liabilities | | | | 1,704,109 | | | | 2,494,777 | | | | 539,295 | |
| NET ASSETS | | | $ | 312,281,135 | | | $ | 915,550,517 | | | $ | 210,028,908 | |
| | | | | | | | | | | | | | | |
| NET ASSETS CONSIST OF: | | | | | | | | | | | | | |
| Capital stock | | | $ | 495,154,115 | | | $ | 437,318,651 | | | $ | 200,367,901 | |
| Accumulated net investment income (loss) | | | | (2,505,221 | ) | | | (8,757,936 | ) | | | 105,558 | |
| Accumulated net realized gain (loss) on investments | | | | (200,591,652 | ) | | | 584,528 | | | | (21,649,959 | ) |
| Unrealized net appreciation on investments | | | | 20,223,893 | | | | 486,405,274 | | | | 31,205,408 | |
| Total Net Assets | | | $ | 312,281,135 | | | $ | 915,550,517 | | | $ | 210,028,908 | |
| | | | | | | | | | | | | | | |
| NET ASSETS | | | | | | | | | | | | | |
| Investor Class: | | | | | | | | | | | | | |
| Shares authorized ($.0001 par value) | | | | 25,000,000,000 | | | Unlimited | | | | 25,000,000,000 | |
| Net assets applicable to outstanding Investor Class shares | | | | 284,037,900 | | | | 848,453,804 | | | | 162,988,228 | |
| Shares issued and outstanding | | | | 20,522,991 | | | | 15,030,712 | | | | 10,001,721 | |
| Net asset value, offering price and redemption price per share | | | $ | 13.84 | | | $ | 56.45 | | | $ | 16.30 | |
| | | | | | | | | | | | | | | |
| Institutional Class: | | | | | | | | | | | | | |
| Shares authorized ($.0001 par value) | | | | 25,000,000,000 | | | Unlimited | | | | 25,000,000,000 | |
| Net assets applicable to outstanding Institutional Class shares | | | | 28,243,235 | | | | 67,096,713 | | | | 47,040,680 | |
| Shares issued and outstanding | | | | 2,005,685 | | | | 1,176,908 | | | | 2,841,564 | �� |
| Net asset value, offering price and redemption price per share | | | $ | 14.08 | | | $ | 57.01 | | | $ | 16.55 | |
The accompanying notes are an integral part of these financial statements.
| HENNESSY | | | | | | | | | | | | | | | | | | | |
| CORNERSTONE | | | HENNESSY | | | HENNESSY | | | HENNESSY | | | HENNESSY | | | HENNESSY | | | HENNESSY | |
| LARGE GROWTH | | | CORNERSTONE | | | LARGE VALUE | | | TOTAL RETURN | | | EQUITY AND | | | BALANCED | | | CORE BOND | |
| FUND | | | VALUE FUND | | | FUND | | | FUND | | | INCOME FUND | | | FUND | | | FUND | |
| | | | | | | | | | | | | | | | | | | | |
| | | | | | | | | | | | | | | | | | | | |
| | | | | | | | | | | | | | | | | | | | |
| $ | 96,867,229 | | | $ | 139,084,054 | | | $ | 138,160,887 | | | $ | 114,273,235 | | | $ | 279,851,711 | | | $ | 13,330,653 | | | $ | 11,879,037 | |
| | 85,931 | | | | 343,929 | | | | 134,459 | | | | 154,954 | | | | 1,233,618 | | | | 17,636 | | | | 100,658 | |
| | 4,831 | | | | 17,196 | | | | 1,343 | | | | 97,113 | | | | 1,007,077 | | | | 100 | | | | 37,794 | |
| | — | | | | — | | | | 1,580,956 | | | | — | | | | — | | | | — | | | | 259,353 | |
| | — | | | | — | | | | — | | | | — | | | | — | | | | — | | | | — | |
| | 28,285 | | | | 24,898 | | | | 29,153 | | | | 13,502 | | | | 37,667 | | | | 16,555 | | | | 23,327 | |
| | — | | | | — | | | | — | | | | — | | | | — | | | | — | | | | 1,336 | |
| | 96,986,276 | | | | 139,470,077 | | | | 139,906,798 | | | | 114,538,804 | | | | 282,130,073 | | | | 13,364,944 | | | | 12,301,505 | |
| | | | | | | | | | | | | | | | | | | | | | | | | | | |
| | | | | | | | | | | | | | | | | | | | | | | | | | | |
| | — | | | | — | | | | 1,575,078 | | | | — | | | | 1,408,864 | | | | — | | | | — | |
| | 5,327 | | | | 23,389 | | | | 5,630 | | | | 19,933 | | | | 86,566 | | | | — | | | | 765 | |
| | 58,042 | | | | 83,086 | | | | 95,418 | | | | 39,730 | | | | 175,708 | | | | 6,534 | | | | — | |
| | 30,173 | | | | 45,269 | | | | 46,604 | | | | 27,199 | | | | 55,135 | | | | 4,516 | | | | 5,187 | |
| | 23,022 | | | | 16,014 | | | | 13,954 | | | | 14,949 | | | | 9,685 | | | | 13,214 | | | | 9,682 | |
| | — | | | | — | | | | — | | | | — | | | | — | | | | — | | | | 1,481 | |
| | — | | | | — | | | | — | | | | 44,906 | | | | 85,302 | | | | 15,311 | | | | 39,197 | |
| | 6,550 | | | | 10,894 | | | | 11,186 | | | | 6,622 | | | | — | | | | 1,089 | | | | — | |
| | — | | | | — | | | | — | | | | 32,382,000 | | | | — | | | | — | | | | — | |
| | 70 | | | | — | | | | — | | | | 9,989 | | | | — | | | | — | | | | — | |
| | 400 | | | | 2,519 | | | | 339 | | | | 525 | | | | — | | | | 923 | | | | — | |
| | 15,840 | | | | 33,682 | | | | 32,922 | | | | 35,386 | | | | 10,591 | | | | 7,252 | | | | 6,116 | |
| | 139,424 | | | | 214,853 | | | | 1,781,131 | | | | 32,581,239 | | | | 1,831,851 | | | | 48,839 | | | | 62,428 | |
| $ | 96,846,852 | | | $ | 139,255,224 | | | $ | 138,125,667 | | | $ | 81,957,565 | | | $ | 280,298,222 | | | $ | 13,316,105 | | | $ | 12,239,077 | |
| | | | | | | | | | | | | | | | | | | | | | | | | | | |
| | | | | | | | | | | | | | | | | | | | | | | | | | | |
| $ | 80,949,405 | | | $ | 147,591,126 | | | $ | 130,963,974 | | | $ | 72,833,948 | | | $ | 235,851,464 | | | $ | 12,159,727 | | | $ | 10,561,696 | |
| | 702,282 | | | | 866,410 | | | | 309,869 | | | | 69,334 | | | | 494,485 | | | | (5,968 | ) | �� | | (8,011 | ) |
| | 1,280,121 | | | | (32,263,005 | ) | | | (20,089,015 | ) | | | (5,423,534 | ) | | | 7,369,694 | | | | (87,713 | ) | | | 1,174,956 | |
| | 13,915,044 | | | | 23,060,693 | | | | 26,940,839 | | | | 14,477,817 | | | | 36,582,579 | | | | 1,250,059 | | | | 510,436 | |
| $ | 96,846,852 | | | $ | 139,255,224 | | | $ | 138,125,667 | | | $ | 81,957,565 | | | $ | 280,298,222 | | | $ | 13,316,105 | | | $ | 12,239,077 | |
| | | | | | | | | | | | | | | | | | | | | | | | | | | |
| | | | | | | | | | | | | | | | | | | | | | | | | | | |
| | | | | | | | | | | | | | | | | | | | | | | | | | | |
| Unlimited | | | | 25,000,000,000 | | | Unlimited | | | | 100,000,000 | | | Unlimited | | | | 100,000,000 | | | Unlimited | |
| | 80,958,914 | | | | 135,100,794 | | | | 137,638,770 | | | | 81,957,565 | | | | 203,039,278 | | | | 13,316,105 | | | | 3,828,353 | |
| | 6,810,138 | | | | 8,663,114 | | | | 4,886,783 | | | | 5,862,421 | | | | 13,363,063 | | | | 1,049,330 | | | | 391,204 | |
| $ | 11.89 | | | $ | 15.59 | | | $ | 28.17 | | | $ | 13.98 | | | $ | 15.19 | | | $ | 12.69 | | | $ | 9.79 | |
| | | | | | | | | | | | | | | | | | | | | | | | | | | |
| | | | | | | | | | | | | | | | | | | | | | | | | | | |
| Unlimited | | | | 25,000,000,000 | | | Unlimited | | | | N/A | | | Unlimited | | | | N/A | | | Unlimited | |
| | 15,887,938 | | | | 4,154,430 | | | | 486,897 | | | | N/A | | | | 77,258,944 | | | | N/A | | | | 8,410,724 | |
| | 1,326,106 | | | | 266,461 | | | | 17,242 | | | | N/A | | | | 5,354,361 | | | | N/A | | | | 949,420 | |
| $ | 11.98 | | | $ | 15.59 | | | $ | 28.24 | | | | N/A | | | $ | 14.43 | | | | N/A | | | $ | 8.86 | |
HENNESSY FUNDS 1-800-966-4354
Financial Statements
Statements of Assets and Liabilities as of April 30, 2013 (Unaudited) |
| | | | | | HENNESSY | | | HENNESSY | |
| | | HENNESSY | | | SMALL CAP | | | LARGE CAP | |
| | | GAS UTILITY | | | FINANCIAL | | | FINANCIAL | |
| | | INDEX FUND | | | FUND | | | FUND | |
| ASSETS: | | | | | | | | | |
| Investments in securities, at value (cost $680,375,358, $216,364,060, | | | | | | | | | |
| $46,118,412, $4,986,001, $22,828,607 and $17,502,999 respectively) | | $ | 1,007,205,803 | | | $ | 256,107,259 | | | $ | 57,648,888 | |
| Investments in affiliated securities, at value | | | | | | | | | | | | |
| (cost $0, $0, $1,551,405, $0, $0 and $0, respectively) | | | — | | | | — | | | | 1,830,400 | |
| Cash | | | 1,492 | | | | — | | | | — | |
| Dividends and interest receivable | | | 1,627,449 | | | | 123,227 | | | | 38,565 | |
| Receivable for fund shares sold | | | 8,981,998 | | | | 367,925 | | | | 59,935 | |
| Receivable for securities sold | | | — | | | | 1,731,980 | | | | 1,195,380 | |
| Return of capital receivable | | | — | | | | — | | | | 46,200 | |
| Prepaid expenses and other assets | | | 45,665 | | | | 22,748 | | | | 14,648 | |
| Due from Advisor | | | — | | | | — | | | | — | |
| Total Assets | | | 1,017,862,407 | | | | 258,353,139 | | | | 60,834,016 | |
| | | | | | | | | | | | | |
| LIABILITIES: | | | | | | | | | | | | |
| Payable for securities purchased | | | 6,601,597 | | | | 2,353,642 | | | | 780,065 | |
| Payable for fund shares redeemed | | | 615,722 | | | | 206,726 | | | | 50,453 | |
| Payable to Advisor | | | 309,838 | | | | 188,330 | | | | 43,473 | |
| Payable to Administrator | | | 171,697 | | | | 53,134 | | | | 12,534 | |
| Payable to Auditor | | | 9,624 | | | | 9,626 | | | | 9,624 | |
| Distribution payable | | | — | | | | — | | | | — | |
| Accrued distribution fees | | | — | | | | 65,578 | | | | 18,074 | |
| Accrued service fees | | | — | | | | — | | | | — | |
| Accrued interest payable | | | — | | | | — | | | | — | |
| Accrued directors fees | | | — | | | | — | | | | 752 | |
| Accrued expenses and other payables | | | 225,902 | | | | 42,306 | | | | 13,416 | |
| Total Liabilities | | | 7,934,380 | | | | 2,919,342 | | | | 928,391 | |
| NET ASSETS | | $ | 1,009,928,027 | | | $ | 255,433,797 | | | $ | 59,905,625 | |
| | | | | | | | | | | | | |
| NET ASSETS CONSIST OF: | | | | | | | | | | | | |
| Capital stock | | $ | 700,432,666 | | | $ | 211,370,943 | | | $ | 50,773,050 | |
| Accumulated net investment income (loss) | | | 516,922 | | | | 80,429 | | | | (74,294 | ) |
| Accumulated net realized gain (loss) on investments | | | (17,856,666 | ) | | | 4,239,226 | | | | (2,602,602 | ) |
| Unrealized net appreciation on investments | | | 326,835,105 | | | | 39,743,199 | | | | 11,809,471 | |
| Total Net Assets | | $ | 1,009,928,027 | | | $ | 255,433,797 | | | $ | 59,905,625 | |
| | | | | | | | | | | | | |
| NET ASSETS | | | | | | | | | | | | |
| Investor Class: | | | | | | | | | | | | |
| Shares authorized ($.0001 par value) | | Unlimited | | | Unlimited | | | Unlimited | |
| Net assets applicable to outstanding Investor Class shares | | | 1,009,928,027 | | | | 211,860,266 | | | | 59,905,625 | |
| Shares issued and outstanding | | | 38,572,152 | | | | 9,614,259 | | | | 3,619,006 | |
| Net asset value, offering price and redemption price per share | | $ | 26.18 | | | $ | 22.04 | | | $ | 16.55 | |
| | | | | | | | | | | | | |
| Institutional Class: | | | | | | | | | | | | |
| Shares authorized ($.0001 par value) | | | N/A | | | Unlimited | | | | N/A | |
| Net assets applicable to outstanding Institutional Class shares | | | N/A | | | | 43,573,531 | | | | N/A | |
| Shares issued and outstanding | | | N/A | | | | 3,152,314 | | | | N/A | |
| Net asset value, offering price and redemption price per share | | | N/A | | | $ | 13.82 | | | | N/A | |
The accompanying notes are an integral part of these financial statements.
| | | | | | | HENNESSY | | |
| HENNESSY | | | HENNESSY | | | JAPAN | | |
| TECHNOLOGY | | | JAPAN | | | SMALL CAP | | |
| FUND | | | FUND | | | FUND | | |
| | | | | | | | | |
| | | | | | | | | |
| $ | 5,422,647 | | | $ | 30,366,450 | | | $ | 20,970,616 | | |
| | | | | | | | | | | | |
| | — | | | | — | | | | — | | |
| | — | | | | — | | | | — | | |
| | 3 | | | | 127,370 | | | | 182,917 | | |
| | 75 | | | | 1,106,253 | | | | 321,032 | | |
| | 26,480 | | | | — | | | | 7,011 | | |
| | — | | | | — | | | | — | | |
| | 17,028 | | | | 18,880 | | | | 12,556 | | |
| | 3,515 | | | | — | | | | — | | |
| | 5,469,748 | | | | 31,618,953 | | | | 21,494,132 | | |
| | | | | | | | | | | | |
| | | | | | | | | | | | |
| | 44,553 | | | | 1,601,594 | | | | 563,437 | | |
| | 14,937 | | | | 55,290 | | | | 1,025 | | |
| | — | | | | 21,217 | | | | 17,167 | | |
| | 2,783 | | | | 8,260 | | | | 5,584 | | |
| | 9,626 | | | | 13,205 | | | | 11,333 | | |
| | — | | | | — | | | | — | | |
| | 2,921 | | | | — | | | | — | | |
| | — | | | | 1,528 | | | | 1,430 | | |
| | — | | | | 19 | | | | — | | |
| | — | | | | 978 | | | | 1,014 | | |
| | 1,401 | | | | 15,510 | | | | 13,425 | | |
| | 76,221 | | | | 1,717,601 | | | | 614,415 | | |
| $ | 5,393,527 | | | $ | 29,901,352 | | | $ | 20,879,717 | | |
| | | | | | | | | | | | |
| | | | | | | | | | | | |
| $ | 7,252,122 | | | $ | 55,789,205 | | | $ | 16,790,677 | | |
| | (91,520 | ) | | | (52,870 | ) | | | (1,235 | ) | |
| | (2,203,721 | ) | | | (33,362,598 | ) | | | 628,344 | | |
| | 436,646 | | | | 7,527,615 | | | | 3,461,931 | | |
| $ | 5,393,527 | | | $ | 29,901,352 | | | $ | 20,879,717 | | |
| | | | | | | | | | | | |
| | | | | | | | | | | | |
| | | | | | | | | | | | |
| Unlimited | | | Unlimited | | | Unlimited | | |
| | 4,355,875 | | | | 22,298,161 | | | | 20,879,717 | | |
| | 375,200 | | | | 1,210,097 | | | | 1,845,172 | | |
| $ | 11.61 | | | $ | 18.43 | | | $ | 11.32 | | |
| | | | | | | | | | | | |
| | | | | | | | | | | | |
| Unlimited | | | Unlimited | | | | N/A | | |
| | 1,037,652 | | | | 7,603,191 | | | | N/A | | |
| | 88,766 | | | | 406,988 | | | | N/A | | |
| $ | 11.69 | | | $ | 18.68 | | | | N/A | | |
HENNESSY FUNDS �� 1-800-966-4354
Financial Statements
Statements of Operations as of April 30, 2013 (Unaudited) |
| | | | | | | | | HENNESSY | |
| | | HENNESSY | | | HENNESSY | | | CORNERSTONE | |
| | | CORNERSTONE | | | FOCUS | | | MID CAP 30 | |
| | | GROWTH FUND | | | FUND | | | FUND | |
| INVESTMENT INCOME: | | | | | | | | | |
Dividend income(1) | | $ | 2,053,014 | | | $ | 2,484,055 | | | $ | 2,526,281 | |
| Interest income | | | 490 | | | | 2,040 | | | | 286 | |
| Total investment income | | | 2,053,504 | | | | 2,486,095 | | | | 2,526,567 | |
| | | | | | | | | | | | | |
| EXPENSES: | | | | | | | | | | | | |
| Investment advisory fees | | | 1,157,957 | | | | 3,676,812 | | | | 678,059 | |
| Administration, fund accounting, custody and transfer agent fees | | | 328,610 | | | | 490,242 | | | | 186,422 | |
| Distribution fees – Investor Class (See Note 6) | | | — | | | | 943,049 | | | | — | |
| Service fees – Investor Class (See Note 6) | | | 141,384 | | | | — | | | | 70,702 | |
| Federal and state registration fees | | | 21,687 | | | | 27,020 | | | | 22,337 | |
| Audit fees | | | 3,302 | | | | 9,624 | | | | — | |
| Legal fees | | | 3,719 | | | | 4,219 | | | | 3,720 | |
| Compliance expense | | | 3,566 | | | | 2,952 | | | | 3,508 | |
| Consulting expense | | | 4,529 | | | | 3,767 | | | | 3,841 | |
| Reports to shareholders | | | 36,979 | | | | 60,874 | | | | 16,429 | |
| Directors’ fees and expenses | | | 5,667 | | | | 9,598 | | | | 5,896 | |
| Sub-transfer agent expenses – Investor Class (See Note 6) | | | 246,151 | | | | 385,702 | | | | 129,533 | |
| Sub-transfer agent expenses – Institutional Class (See Note 6) | | | 14,328 | | | | 24,155 | | | | 12,574 | |
| Interest expense (See Note 4) | | | — | | | | — | | | | — | |
| Other | | | 16,745 | | | | 50,145 | | | | 12,651 | |
| Total expenses before reimbursement from advisor | | | 1,984,624 | | | | 5,688,159 | | | | 1,145,672 | |
| Expense reimbursement from advisor – Investor Class | | | — | | | | — | | | | — | |
| Expense reimbursement from advisor – Institutional Class | | | — | | | | — | | | | — | |
| Administration expense waiver (See Note 6) | | | (18,771 | ) | | | — | | | | (20,670 | ) |
| Net expenses | | | 1,965,853 | | | | 5,688,159 | | | | 1,125,002 | |
| NET INVESTMENT INCOME (LOSS) | | $ | 87,651 | | | $ | (3,202,064 | ) | | $ | 1,401,565 | |
| | | | | | | | | | | | | |
| REALIZED AND UNREALIZED GAINS (LOSSES): | | | | | | | | | | | | |
| Net realized gain (loss) on investments | | $ | 43,913,466 | | | $ | 867,200 | | | $ | 23,475,586 | |
| Change in unrealized appreciation on investments | | | (8,810,433 | ) | | | 143,259,556 | | | | 3,753,164 | |
| Net gain (loss) on investments | | | 35,103,033 | | | | 144,126,756 | | | | 27,228,750 | |
| NET INCREASE IN NET ASSETS RESULTING FROM OPERATIONS | | $ | 35,190,684 | | | $ | 140,924,692 | | | $ | 28,630,315 | |
| (1) | Net of foreign taxes withheld of $0, $0, $0, $0, $67,429, $0, $0, $0 $0 and $0, respectively. |
The accompanying notes are an integral part of these financial statements.
| HENNESSY | | | | | | | | | | | | | | | | | | | |
| CORNERSTONE | | | HENNESSY | | | HENNESSY | | | HENNESSY | | | HENNESSY | | | HENNESSY | | | HENNESSY | |
| LARGE GROWTH | | | CORNERSTONE | | | LARGE VALUE | | | TOTAL RETURN | | | EQUITY AND | | | BALANCED | | | CORE BOND | |
| FUND | | | VALUE FUND | | | FUND | | | FUND | | | INCOME FUND | | | FUND | | | FUND | |
| | | | | | | | | | | | | | | | | | | | |
| $ | 1,276,928 | | | $ | 2,552,090 | | | $ | 1,553,499 | | | $ | 1,004,783 | | | $ | 3,600,285 | | | $ | 146,241 | | | $ | 105,057 | |
| | 140 | | | | 195 | | | | 72 | | | | 19,240 | | | | 1,288,054 | | | | 1,434 | | | | 381,847 | |
| | 1,277,068 | | | | 2,552,285 | | | | 1,553,571 | | | | 1,024,023 | | | | 4,888,339 | | | | 147,675 | | | | 486,904 | |
| | | | | | | | | | | | | | | | | | | | | | | | | | | |
| | | | | | | | | | | | | | | | | | | | | | | | | | | |
| | 374,804 | | | | 477,850 | | | | 551,219 | | | | 229,974 | | | | 1,114,991 | | | | 46,327 | | | | 97,575 | |
| | 106,363 | | | | 137,606 | | | | 136,184 | | | | 80,491 | | | | 167,248 | | | | 16,214 | | | | 14,727 | |
| | — | | | | — | | | | — | | | | 57,493 | | | | 232,271 | | | | 11,582 | | | | 5,218 | |
| | 38,390 | | | | 63,056 | | | | 64,782 | | | | 38,329 | | | | — | | | | 7,721 | | | | — | |
| | 19,171 | | | | 19,538 | | | | 19,722 | | | | 13,759 | | | | 43,959 | | | | 12,171 | | | | 25,892 | |
| | 765 | | | | 12,708 | | | | 10,598 | | | | 11,594 | | | | 9,681 | | | | 10,357 | | | | 9,681 | |
| | 3,472 | | | | 1,720 | | | | 1,972 | | | | 2,976 | | | | 3,720 | | | | 2,854 | | | | 3,720 | |
| | 3,508 | | | | 3,487 | | | | 3,508 | | | | 3,508 | | | | 3,508 | | | | 3,508 | | | | 3,508 | |
| | 4,529 | | | | 3,583 | | | | 3,582 | | | | 3,585 | | | | 4,448 | | | | 3,581 | | | | 3,584 | |
| | 7,074 | | | | 12,404 | | | | 12,841 | | | | 7,004 | | | | 6,340 | | | | 2,301 | | | | 2,134 | |
| | 5,909 | | | | 8,117 | | | | 5,829 | | | | 4,303 | | | | 5,598 | | | | 4,298 | | | | 5,598 | |
| | 11,517 | | | | 43,112 | | | | 45,348 | | | | 29,895 | | | | 73,408 | | | | 8,264 | | | | 567 | |
| | 4,480 | | | | 269 | | | | — | | | | N/A | | | | 24,544 | | | | N/A | | | | 10,476 | |
| | — | | | | — | | | | — | | | | 42,233 | | | | — | | | | — | | | | — | |
| | 7,996 | | | | 10,304 | | | | 10,111 | | | | 6,661 | | | | 33,567 | | | | 4,307 | | | | 6,117 | |
| | 587,978 | | | | 793,754 | | | | 865,696 | | | | 531,805 | | | | 1,723,283 | | | | 133,485 | | | | 188,797 | |
| | — | | | | — | | | | — | | | | — | | | | (3,667 | ) | | | — | | | | (10,747 | ) |
| | — | | | | — | | | | — | | | | N/A | | | | — | | | | N/A | | | | (44,729 | ) |
| | (13,207 | ) | | | (1,603 | ) | | | (118 | ) | | | — | | | | — | | | | — | | | | — | |
| | 574,771 | | | | 792,151 | | | | 865,578 | | | | 531,805 | | | | 1,719,616 | | | | 133,485 | | | | 133,321 | |
| $ | 702,297 | | | $ | 1,760,134 | | | $ | 687,993 | | | $ | 492,218 | | | $ | 3,168,723 | | | $ | 14,190 | | | $ | 353,583 | |
| | | | | | | | | | | | | | | | | | | | | | | | | | | |
| | | | | | | | | | | | | | | | | | | | | | | | | | | |
| $ | 5,349,649 | | | $ | 12,007,219 | | | $ | 9,806,588 | | | $ | 1,756,172 | | | $ | 10,349,886 | | | $ | 1,181,557 | | | $ | 1,185,677 | |
| | 5,343,469 | | | | 3,710,139 | | | | 8,097,497 | | | | 6,083,060 | | | | 12,806,228 | | | | (392,661 | ) | | | (1,316,059 | ) |
| | 10,693,118 | | | | 15,717,358 | | | | 17,904,085 | | | | 7,839,232 | | | | 23,156,114 | | | | 788,896 | | | | (130,382 | ) |
| $ | 11,395,415 | | | $ | 17,477,492 | | | $ | 18,592,078 | | | $ | 8,331,450 | | | $ | 26,324,837 | | | $ | 803,086 | | | $ | 223,201 | |
HENNESSY FUNDS 1-800-966-4354
Financial Statements
Statements of Operations as of April 30, 2013 (Unaudited) |
| | | | | | HENNESSY | | | HENNESSY | |
| | | HENNESSY | | | SMALL CAP | | | LARGE CAP | |
| | | GAS UTILITY | | | FINANCIAL | | | FINANCIAL | |
| | | INDEX FUND | | | FUND | | | FUND | |
| INVESTMENT INCOME: | | | | | | | | | |
Dividend income from unaffiliated securities(1) | | $ | 13,363,897 | | | $ | 2,633,666 | | | $ | 370,654 | |
| Dividend income from affiliated securities | | | — | | | | — | | | | 27,300 | |
| Interest income | | | 443 | | | | 505 | | | | 57 | |
| Total investment income | | | 13,364,340 | | | | 2,634,171 | | | | 398,011 | |
| EXPENSES: | | | | | | | | | | | | |
| Investment advisory fees | | | 1,568,331 | | | | 1,052,083 | | | | 269,164 | |
| Administration, fund accounting, custody and transfer agent fees | | | 470,499 | | | | 140,278 | | | | 35,889 | |
| Distribution fees – Investor Class (See Note 6) | | | — | | | | 240,709 | | | | 74,768 | |
| Service fees – Investor Class (See Note 6) | | | — | | | | — | | | | — | |
| Federal and state registration fees | | | 39,581 | | | | 16,384 | | | | 16,565 | |
| Audit fees | | | 9,624 | | | | 9,624 | | | | 9,624 | |
| Legal fees | | | 5,719 | | | | 4,720 | | | | 3,719 | |
| Compliance expense | | | 36,448 | | | | 3,508 | | | | 3,508 | |
| Consulting expense | | | 3,727 | | | | 3,971 | | | | 3,647 | |
| Reports to shareholders | | | 95,145 | | | | 16,601 | | | | 3,907 | |
| Directors’ fees and expenses | | | 10,098 | | | | 7,198 | | | | 8,098 | |
| Sub-transfer agent expenses – Investor Class (See Note 6) | | | 617,315 | | | | 100,366 | | | | 35,817 | |
| Sub-transfer agent expenses – Institutional Class (See Note 6) | | | N/A | | | | 14,515 | | | | N/A | |
| Interest expense (See Note 4) | | | — | | | | — | | | | — | |
| Other | | | 173,322 | | | | 19,111 | | | | 7,599 | |
| Total expenses before reimbursement from advisor | | | 3,029,809 | | | | 1,629,068 | | | | 472,305 | |
| Expense reimbursement from advisor – Investor Class | | | — | | | | — | | | | — | |
| Expense reimbursement from advisor – Institutional Class | | | N/A | | | | — | | | | N/A | |
| Administration expense waiver (See Note 6) | | | — | | | | — | | | | — | |
| Net expenses | | | 3,029,809 | | | | 1,629,068 | | | | 472,305 | |
| NET INVESTMENT INCOME (LOSS) | | $ | 10,334,531 | | | $ | 1,005,103 | | | $ | (74,294 | ) |
| REALIZED AND UNREALIZED GAINS (LOSSES): | | | | | | | | | | | | |
| Net realized gain (loss) on: | | | | | | | | | | | | |
| Investments from unaffiliated securities | | $ | (398,488 | ) | | $ | 12,251,216 | | | $ | 4,843,850 | |
| Investments from affiliated securities | | | — | | | | — | | | | 227,487 | |
| Change in unrealized appreciation on investments | | | 128,870,676 | | | | 15,609,309 | | | | 4,210,555 | |
| Net gain (loss) on investments | | | 128,472,188 | | | | 27,860,525 | | | | 9,281,892 | |
| NET INCREASE IN NET ASSETS RESULTING FROM OPERATIONS | | $ | 138,806,719 | | | $ | 28,865,628 | | | $ | 9,207,598 | |
| (1) | Net of foreign taxes withheld of $189,860, $0, $0, $0, $12,375 and $15,406, respectively. |
The accompanying notes are an integral part of these financial statements.
| | | | | | | HENNESSY | | |
| HENNESSY | | | HENNESSY | | | JAPAN | | |
| TECHNOLOGY | | | JAPAN | | | SMALL CAP | | |
| FUND | | | FUND | | | FUND | | |
| | | | | | | | | |
| $ | 24,253 | | | $ | 159,393 | | | $ | 199,630 | | |
| | — | | | | — | | | | — | | |
| | 19 | | | | 140 | | | | 53 | | |
| | 24,272 | | | | 159,533 | | | | 199,683 | | |
| | | | | | | | | | | | |
| | 24,446 | | | | 104,552 | | | | 70,147 | | |
| | 3,259 | | | | 22,656 | | | | 12,276 | | |
| | 5,587 | | | | — | | | | — | | |
| | — | | | | 6,760 | | | | 5,846 | | |
| | 14,492 | | | | 17,216 | | | | 12,019 | | |
| | 9,624 | | | | 9,850 | | | | 7,721 | | |
| | 4,220 | | | | 2,472 | | | | 972 | | |
| | 3,508 | | | | 3,508 | | | | 3,508 | | |
| | 3,588 | | | | 3,584 | | | | 3,580 | | |
| | 1,219 | | | | 297 | | | | 2,596 | | |
| | 5,598 | | | | 5,835 | | | | 5,837 | | |
| | 1,075 | | | | 15,445 | | | | 15,384 | | |
| | 241 | | | | 3,093 | | | | N/A | | |
| | — | | | | — | | | | — | | |
| | 4,893 | | | | 4,267 | | | | 3,297 | | |
| | 81,750 | | | | 199,535 | | | | 143,183 | | |
| | (24,617 | ) | | | — | | | | — | | |
| | (5,371 | ) | | | — | | | | N/A | | |
| | — | | | | — | | | | — | | |
| | 51,762 | | | | 199,535 | | | | 143,183 | | |
| $ | (27,490 | ) | | $ | (40,002 | ) | | $ | 56,500 | | |
| | | | | | | | | | | | |
| | | | | | | | | | | | |
| $ | 141,810 | | | $ | 73,847 | | | $ | 631,103 | | |
| | — | | | | — | | | | — | | |
| | 346,949 | | | | 4,069,160 | | | | 3,323,871 | | |
| | 488,759 | | | | 4,143,007 | | | | 3,954,974 | | |
| $ | 461,269 | | | $ | 4,103,005 | | | $ | 4,011,474 | | |
HENNESSY FUNDS 1-800-966-4354
Financial Statements
| Statements of Changes in Net Assets |
| | | Hennessy Cornerstone Growth Fund | |
| | | | | | | |
| | | Six Months Ended | | | | |
| | | April 30, 2013 | | | Year Ended | |
| | | (Unaudited) | | | October 31, 2012 | |
| OPERATIONS: | | | | | | |
| Net investment income (loss) | | $ | 87,651 | | | $ | (1,428,623 | ) |
| Net realized gain on securities | | | 43,913,466 | | | | 3,675,303 | |
| Long-term capital gain distributions from regulated investment companies | | | — | | | | — | |
| Change in unrealized appreciation (depreciation) on securities | | | (8,810,433 | ) | | | 43,342,497 | |
| Net increase (decrease) in net assets resulting from operations | | | 35,190,684 | | | | 45,589,177 | |
| | | | | | | | | |
| DISTRIBUTIONS TO SHAREHOLDERS FROM: | | | | | | | | |
| Net investment income – Investor Class | | | — | | | | — | |
| Net investment income – Institutional Class | | | — | | | | — | |
| Net realized gains – Investor Class | | | — | | | | — | |
| Net realized gains – Institutional Class | | | — | | | | — | |
| Total distributions | | | — | | | | — | |
| | | | | | | | | |
| CAPITAL SHARE TRANSACTIONS: | | | | | | | | |
| Proceeds from shares issued in the Reorganization – Investor Class (See Note 8) | | | — | | | | — | |
| Proceeds from shares issued in the Reorganization – Institutional Class (See Note 8) | | | — | | | | 34,071,809 | |
| Proceeds from shares subscribed – Investor Class | | | 36,786,218 | | | | 90,544,279 | |
| Proceeds from shares subscribed – Institutional Class | | | 2,485,512 | | | | 418,215 | |
| Dividends reinvested – Investor Class | | | — | | | | — | |
| Dividends reinvested – Institutional Class | | | — | | | | — | |
| Cost of shares redeemed – Investor Class | | | (50,246,276 | ) | | | (54,063,454 | ) |
| Cost of shares redeemed – Institutional Class | | | (14,645,922 | ) | | | (778,530 | ) |
| Net increase (decrease) in net assets derived from capital share transactions | | | (25,620,468 | ) | | | 70,192,319 | |
| TOTAL INCREASE (DECREASE) IN NET ASSETS | | | 9,570,216 | | | | 115,781,496 | |
| | | | | | | | | |
| NET ASSETS: | | | | | | | | |
| Beginning of period | | | 302,710,919 | | | | 186,929,423 | |
| End of period | | $ | 312,281,135 | | | $ | 302,710,919 | |
| Accumulated net investment income (loss), end of period | | $ | (2,505,221 | ) | | $ | (2,592,872 | ) |
| | | | | | | | | |
| CHANGES IN SHARES OUTSTANDING: | | | | | | | | |
| Shares issued in connection with Reorganization – Investor Class (See Note 8) | | | — | | | | — | |
| Shares issued in connection with Reorganization – Institutional Class (See Note 8) | | | — | | | | 2,732,499 | |
| Shares sold – Investor Class | | | 2,852,678 | | | | 7,702,040 | |
| Shares sold – Institutional Class | | | 180,713 | | | | 35,989 | |
| Shares issued to holders as reinvestment of dividends – Investor Class | | | — | | | | — | |
| Shares issued to holders as reinvestment of dividends – Institutional Class | | | — | | | | — | |
| Shares redeemed – Investor Class | | | (3,788,867 | ) | | | (4,743,651 | ) |
| Shares redeemed – Institutional Class | | | (1,126,353 | ) | | | (67,781 | ) |
| Net increase (decrease) in shares outstanding | | | (1,881,829 | ) | | | 5,659,096 | |
The accompanying notes are an integral part of these financial statements.
| Hennessy Focus Fund | | | Hennessy Cornerstone Mid Cap 30 Fund | | | Hennessy Cornerstone Large Growth Fund | |
| | | | | | | | | | | | | | | | | |
| Six Months Ended | | | | | | Six Months Ended | | | | | | Six Months Ended | | | | |
| April 30, 2013 | | | Year Ended | | | April 30, 2013 | | | Year Ended | | | April 30, 2013 | | | Year Ended | |
| (Unaudited) | | | October 31, 2012 | | | (Unaudited) | | | October 31, 2012 | | | (Unaudited) | | | October 31, 2012 | |
| | | | | | | | | | | | | | | | | |
| $ | (3,202,064 | ) | | $ | (5,598,569 | ) | | $ | 1,401,565 | | | $ | 1,069,445 | | | $ | 702,297 | | | $ | 1,080,454 | |
| | 867,200 | | | | 63,683,118 | | | | 23,475,586 | | | | 465,078 | | | | 5,349,649 | | | | 171,724 | |
| | — | | | | — | | | | — | | | | — | | | | — | | | | — | |
| | 143,259,556 | | | | 49,854,427 | | | | 3,753,164 | | | | 21,872,356 | | | | 5,343,469 | | | | 5,528,323 | |
| | 140,924,692 | | | | 107,938,976 | | | | 28,630,315 | | | | 23,406,879 | | | | 11,395,415 | | | | 6,780,501 | |
| | | | | | | | | | | | | | | | | | | | | | | |
| | | | | | | | | | | | | | | | | | | | | | | |
| | — | | | | — | | | | (1,650,619 | ) | | | — | | | | (719,396 | ) | | | (557,836 | ) |
| | — | | | | — | | | | (675,237 | ) | | | — | | | | (361,073 | ) | | | (1,312 | ) |
| | (58,291,075 | ) | | | (63,544,133 | ) | | | — | | | | — | | | | (117,309 | ) | | | (15,350,002 | ) |
| | (5,349,797 | ) | | | (5,298,059 | ) | | | — | | | | — | | | | (52,077 | ) | | | (25,963 | ) |
| | (63,640,872 | ) | | | (68,842,192 | ) | | | (2,325,856 | ) | | | — | | | | (1,249,855 | ) | | | (15,935,113 | ) |
| | | | | | | | | | | | | | | | | | | | | | | |
| | | | | | | | | | | | | | | | | | | | | | | |
| | — | | | | — | | | | — | | | | — | | | | — | | | | — | |
| | — | | | | — | | | | — | | | | 16,374,686 | | | | — | | | | 33,698,161 | |
| | 108,385,145 | | | | 179,555,653 | | | | 35,213,684 | | | | 61,505,408 | | | | 1,256,533 | | | | 2,170,407 | |
| | 16,541,545 | | | | 31,219,319 | | | | 14,207,767 | | | | 4,266,258 | | | | 514,904 | | | | 51,923 | |
| | 56,748,943 | | | | 61,703,733 | | | | 1,616,989 | | | | — | | | | 780,066 | | | | 14,646,437 | |
| | 4,791,826 | | | | 4,808,848 | | | | 657,114 | | | | — | | | | 406,311 | | | | 27,274 | |
| | (96,104,811 | ) | | | (179,761,921 | ) | | | (40,152,596 | ) | | | (81,736,037 | ) | | | (4,675,106 | ) | | | (9,670,991 | ) |
| | (36,981,144 | ) | | | (12,079,868 | ) | | | (15,290,159 | ) | | | (6,640,858 | ) | | | (21,356,602 | ) | | | (16,525 | ) |
| | 53,381,504 | | | | 85,445,764 | | | | (3,747,201 | ) | | | (6,230,543 | ) | | | (23,073,894 | ) | | | 40,906,686 | |
| | 130,665,324 | | | | 124,542,548 | | | | 22,557,258 | | | | 17,176,336 | | | | (12,928,334 | ) | | | 31,752,074 | |
| | | | | | | | | | | | | | | | | | | | | | | |
| | | | | | | | | | | | | | | | | | | | | | | |
| | 784,885,193 | | | | 660,342,645 | | | | 187,471,650 | | | | 170,295,314 | | | | 109,775,186 | | | | 78,023,112 | |
| $ | 915,550,517 | | | $ | 784,885,193 | | | $ | 210,028,908 | | | $ | 187,471,650 | | | $ | 96,846,852 | | | $ | 109,775,186 | |
| $ | (8,757,936 | ) | | $ | (5,555,872 | ) | | $ | 105,558 | | | $ | 1,029,849 | | | $ | 702,282 | | | $ | 1,080,454 | |
| | | | | | | | | | | | | | | | | | | | | | | |
| | | | | | | | | | | | | | | | | | | | | | | |
| | — | | | | — | | | | — | | | | — | | | | — | | | | — | |
| | — | | | | — | | | | — | | | | 1,154,875 | | | | — | | | | 3,110,613 | |
| | 2,052,208 | | | | 3,675,823 | | | | 2,245,880 | | | | 4,595,496 | | | | 111,841 | | | | 204,448 | |
| | 309,015 | | | | 640,920 | | | | 886,089 | | | | 312,388 | | | | 45,071 | | | | 4,836 | |
| | 1,149,695 | | | | 1,379,779 | | | | 114,114 | | | | — | | | | 72,353 | | | | 1,455,027 | |
| | 96,221 | | | | 106,958 | | | | 45,696 | | | | — | | | | 37,405 | | | | 2,689 | |
| | (1,836,644 | ) | | | (3,665,085 | ) | | | (2,728,708 | ) | | | (6,262,135 | ) | | | (417,141 | ) | | | (911,650 | ) |
| | (709,085 | ) | | | (246,768 | ) | | | (998,475 | ) | | | (512,726 | ) | | | (1,884,359 | ) | | | (1,399 | ) |
| | 1,061,410 | | | | 1,891,627 | | | | (435,404 | ) | | | (712,102 | ) | | | (2,034,830 | ) | | | 3,864,564 | |
HENNESSY FUNDS 1-800-966-4354
Financial Statements
| Statements of Changes in Net Assets |
| | | Hennessy Cornerstone Value Fund | |
| | | | | | | |
| | | Six Months Ended | | | | |
| | | April 30, 2013 | | | Year Ended | |
| | | (Unaudited) | | | October 31, 2012 | |
| OPERATIONS: | | | | | | |
| Net investment income (loss) | | $ | 1,760,134 | | | $ | 3,298,953 | |
| Net realized gain on securities | | | 12,007,219 | | | | 3,221,518 | |
| Long-term capital gain distributions from regulated investment companies | | | — | | | | — | |
| Change in unrealized appreciation (depreciation) on securities | | | 3,710,139 | | | | 8,250,584 | |
| Net increase (decrease) in net assets resulting from operations | | | 17,477,492 | | | | 14,771,055 | |
| | | | | | | | | |
| DISTRIBUTIONS TO SHAREHOLDERS FROM: | | | | | | | | |
| Net investment income – Investor Class | | | (3,262,318 | ) | | | (3,784,445 | ) |
| Net investment income – Institutional Class | | | (77,674 | ) | | | (49,840 | ) |
| Net realized gains – Investor Class | | | — | | | | — | |
| Net realized gains – Institutional Class | | | — | | | | — | |
| Total distributions | | | (3,339,992 | ) | | | (3,834,285 | ) |
| | | | | | | | | |
| CAPITAL SHARE TRANSACTIONS: | | | | | | | | |
| Proceeds from shares issued in the Reorganization – Investor Class (See Note 8) | | | — | | | | — | |
| Proceeds from shares issued in the Reorganization – Institutional Class (See Note 8) | | | — | | | | — | |
| Proceeds from shares subscribed – Investor Class | | | 4,587,900 | | | | 16,434,099 | |
| Proceeds from shares subscribed – Institutional Class | | | 1,527,398 | | | | 1,336,353 | |
| Dividends reinvested – Investor Class | | | 2,900,074 | | | | 3,373,717 | |
| Dividends reinvested – Institutional Class | | | 66,521 | | | | 37,743 | |
| Cost of shares redeemed – Investor Class | | | (11,167,756 | ) | | | (21,987,512 | ) |
| Cost of shares redeemed – Institutional Class | | | (317,718 | ) | | | (188,855 | ) |
| Net increase (decrease) in net assets derived from capital share transactions | | | (2,403,581 | ) | | | (994,455 | ) |
| TOTAL INCREASE (DECREASE) IN NET ASSETS | | | 11,733,919 | | | | 9,942,315 | |
| | | | | | | | | |
| NET ASSETS: | | | | | | | | |
| Beginning of period | | | 127,521,305 | | | | 117,578,990 | |
| End of period | | $ | 139,255,224 | | | $ | 127,521,305 | |
| Accumulated net investment income (loss), end of period | | $ | 866,410 | | | $ | 2,446,268 | |
| | | | | | | | | |
| CHANGES IN SHARES OUTSTANDING: | | | | | | | | |
| Shares issued in connection with Reorganization – Investor Class (See Note 8) | | | — | | | | — | |
| Shares issued in connection with Reorganization – Institutional Class (See Note 8) | | | — | | | | — | |
| Shares sold – Investor Class | | | 9,242,978 | | | | 1,221,855 | |
| Shares sold – Institutional Class | | | 102,465 | | | | 100,889 | |
| Shares issued to holders as reinvestment of dividends – Investor Class | | | 209,090 | | | | 264,813 | |
| Shares issued to holders as reinvestment of dividends – Institutional Class | | | 4,803 | | | | 2,967 | |
| Shares redeemed – Investor Class | | | (9,702,723 | ) | | | (1,636,482 | ) |
| Shares redeemed – Institutional Class | | | (21,144 | ) | | | (14,382 | ) |
| Net increase (decrease) in shares outstanding | | | (164,531 | ) | | | (60,340 | ) |
The accompanying notes are an integral part of these financial statements.
| Hennessy Large Value Fund | | | Hennessy Total Return Fund | | | Hennessy Equity and Income Fund | |
| | | | | | | | | | | | | | | | | |
| Six Months Ended | | | | | | Six Months Ended | | | | | | Six Months Ended | | | | |
| April 30, 2013 | | | Year Ended | | | April 30, 2013 | | | Year Ended | | | April 30, 2013 | | | Year Ended | |
| (Unaudited) | | | October 31, 2012 | | | (Unaudited) | | | October 31, 2012 | | | (Unaudited) | | | October 31, 2012 | |
| | | | | | | | | | | | | | | | | |
| $ | 687,993 | | | $ | 1,452,637 | | | $ | 492,218 | | | $ | 1,016,797 | | | $ | 3,168,723 | | | $ | 3,387,255 | |
| | 9,806,588 | | | | 9,806,738 | | | | 1,756,172 | | | | 3,337,953 | | | | 10,349,886 | | | | 1,448,410 | |
| | — | | | | — | | | | — | | | | — | | | | — | | | | 3,301 | |
| | 8,097,497 | | | | 7,541,982 | | | | 6,083,060 | | | | 3,331,681 | | | | 12,806,228 | | | | 10,755,082 | |
| | 18,592,078 | | | | 18,801,357 | | | | 8,331,450 | | | | 7,686,431 | | | | 26,324,837 | | | | 15,594,048 | |
| | | | | | | | | | | | | | | | | | | | | | | |
| | | | | | | | | | | | | | | | | | | | | | | |
| | (1,437,942 | ) | | | (1,007,288 | ) | | | (501,289 | ) | | | (1,013,041 | ) | | | (1,694,173 | ) | | | (1,939,551 | ) |
| | (921 | ) | | | (471 | ) | | | N/A | | | | N/A | | | | (1,292,710 | ) | | | (1,382,811 | ) |
| | — | | | | — | | | | — | | | | — | | | | — | | | | — | |
| | — | | | | — | | | | N/A | | | | N/A | | | | — | | | | — | |
| | (1,438,863 | ) | | | (1,007,759 | ) | | | (501,289 | ) | | | (1,013,041 | ) | | | (2,986,883 | ) | | | (3,322,362 | ) |
| | | | | | | | | | | | | | | | | | | | | | | |
| | | | | | | | | | | | | | | | | | | | | | | |
| | — | | | | — | | | | — | | | | — | | | | — | | | | — | |
| | — | | | | — | | | | — | | | | — | | | | — | | | | — | |
| | 2,015,097 | | | | 1,325,949 | | | | 4,985,372 | | | | 29,998,535 | | | | 45,856,829 | | | | 186,044,450 | |
| | 434,869 | | | | 13,303 | | | | N/A | | | | N/A | | | | 9,648,789 | | | | 58,487,290 | |
| | 1,378,307 | | | | 961,881 | | | | 455,713 | | | | 923,418 | | | | 1,618,823 | | | | 1,782,862 | |
| | 921 | | | | 471 | | | | N/A | | | | N/A | | | | 1,051,558 | | | | 787,199 | |
| | (7,926,644 | ) | | | (19,010,445 | ) | | | (8,984,468 | ) | | | (24,056,017 | ) | | | (57,093,428 | ) | | | (55,147,222 | ) |
| | (20,543 | ) | | | (289 | ) | | | N/A | | | | N/A | | | | (49,527,518 | ) | | | (10,854,505 | ) |
| | (4,117,993 | ) | | | (16,709,130 | ) | | | (3,543,383 | ) | | | 6,865,936 | | | | (48,444,947 | ) | | | 181,100,074 | |
| | 13,035,222 | | | | 1,084,468 | | | | 4,286,778 | | | | 13,539,326 | | | | (25,106,993 | ) | | | 193,371,760 | |
| | | | | | | | | | | | | | | | | | | | | | | |
| | | | | | | | | | | | | | | | | | | | | | | |
| | 125,090,445 | | | | 124,005,977 | | | | 77,670,787 | | | | 64,131,461 | | | | 305,405,215 | | | | 112,033,455 | |
| $ | 138,125,667 | | | $ | 125,090,445 | | | $ | 81,957,565 | | | $ | 77,670,787 | | | $ | 280,298,222 | | | $ | 305,405,215 | |
| $ | 309,869 | | | $ | 1,060,739 | | | $ | 69,334 | | | $ | 78,405 | | | $ | 494,485 | | | $ | 312,645 | |
| | | | | | | | | | | | | | | | | | | | | | | |
| | | | | | | | | | | | | | | | | | | | | | | |
| | — | | | | — | | | | — | | | | — | | | | — | | | | — | |
| | — | | | | — | | | | N/A | | | | N/A | | | | — | | | | — | |
| | 5,137,931 | | | | 56,881 | | | | 381,598 | | | | 2,462,738 | | | | 3,153,291 | | | | 13,582,962 | |
| | 15,698 | | | | 579 | | | | N/A | | | | N/A | | | | 699,197 | | | | 4,455,425 | |
| | 55,132 | | | | 43,942 | | | | 34,219 | | | | 74,537 | | | | 113,616 | | | | 129,222 | |
| | 37 | | | | 21 | | | | N/A | | | | N/A | | | | 78,056 | | | | 60,174 | |
| | (5,365,369 | ) | | | (817,082 | ) | | | (697,764 | ) | | | (1,983,914 | ) | | | (4,007,121 | ) | | | (3,976,644 | ) |
| | (772 | ) | | | (13 | ) | | | N/A | | | | N/A | | | | (3,586,391 | ) | | | (818,985 | ) |
| | (157,343 | ) | | | (715,672 | ) | | | (281,947 | ) | | | 553,361 | | | | (3,549,352 | ) | | | 13,432,154 | |
HENNESSY FUNDS 1-800-966-4354
Financial Statements
| Statements of Changes in Net Assets |
| | | Hennessy Balanced Fund | |
| | | | | | | |
| | | Six Months Ended | | | | |
| | | April 30, 2013 | | | Year Ended | |
| | | (Unaudited) | | | October 31, 2012 | |
| OPERATIONS: | | | | | | |
| Net investment income (loss) | | $ | 14,190 | | | $ | 78,381 | |
| Net realized gain on securities | | | 1,181,557 | | | | 493,334 | |
| Long-term capital gain distributions from regulated investment companies | | | — | | | | — | |
| Change in unrealized appreciation (depreciation) on securities | | | (392,661 | ) | | | 918,830 | |
| Net increase (decrease) in net assets resulting from operations | | | 803,086 | | | | 1,490,545 | |
| | | | | | | | | |
| DISTRIBUTIONS TO SHAREHOLDERS FROM: | | | | | | | | |
| Net investment income – Investor Class | | | (23,090 | ) | | | (81,724 | ) |
| Net investment income – Institutional Class | | | N/A | | | | N/A | |
| Net realized gains – Investor Class | | | — | | | | — | |
| Net realized gains – Institutional Class | | | N/A | | | | N/A | |
| Total distributions | | | (23,090 | ) | | | (81,724 | ) |
| | | | | | | | | |
| CAPITAL SHARE TRANSACTIONS: | | | | | | | | |
| Proceeds from shares issued in the Reorganization – Investor Class (See Note 8) | | | — | | | | — | |
| Proceeds from shares issued in the Reorganization – Institutional Class (See Note 8) | | | — | | | | — | |
| Proceeds from shares subscribed – Investor Class | | | 567,771 | | | | 13,386,838 | |
| Proceeds from shares subscribed – Institutional Class | | | N/A | | | | N/A | |
| Dividends reinvested – Investor Class | | | 21,765 | | | | 77,883 | |
| Dividends reinvested – Institutional Class | | | N/A | | | | N/A | |
| Cost of shares redeemed – Investor Class | | | (13,223,203 | ) | | | (7,726,009 | ) |
| Cost of shares redeemed – Institutional Class | | | N/A | | | | N/A | |
| Net increase (decrease) in net assets derived from capital share transactions | | | (12,633,667 | ) | | | 5,738,712 | |
| TOTAL INCREASE (DECREASE) IN NET ASSETS | | | (11,853,671 | ) | | | 7,147,533 | |
| | | | | | | | | |
| NET ASSETS: | | | | | | | | |
| Beginning of period | | | 25,169,776 | | | | 18,022,243 | |
| End of period | | $ | 13,316,105 | | | $ | 25,169,776 | |
| Accumulated net investment income (loss), end of period | | $ | (5,968 | ) | | $ | 2,932 | |
| | | | | | | | | |
| CHANGES IN SHARES OUTSTANDING: | | | | | | | | |
| Shares issued in connection with Reorganization – Investor Class (See Note 8) | | | — | | | | — | |
| Shares issued in connection with Reorganization – Institutional Class (See Note 8) | | | N/A | | | | N/A | |
| Shares sold – Investor Class | | | 47,361 | | | | 1,156,321 | |
| Shares sold – Institutional Class | | | N/A | | | | N/A | |
| Shares issued to holders as reinvestment of dividends – Investor Class | | | 1,841 | | | | 6,678 | |
| Shares issued to holders as reinvestment of dividends – Institutional Class | | | N/A | | | | N/A | |
| Shares redeemed – Investor Class | | | (1,118,266 | ) | | | (663,666 | ) |
| Shares redeemed – Institutional Class | | | N/A | | | | N/A | |
| Net increase (decrease) in shares outstanding | | | (1,069,064 | ) | | | 499,333 | |
The accompanying notes are an integral part of these financial statements.
| Hennessy Core Bond Fund | | | Hennessy Gas Utility Index Fund | | | Hennessy Small Cap Financial Fund | |
| | | | | | | | | | | | | | | | | |
| Six Months Ended | | | | | | Six Months Ended | | | | | | Six Months Ended | | | | |
| April 30, 2013 | | | Year Ended | | | April 30, 2013 | | | Year Ended | | | April 30, 2013 | | | Year Ended | |
| (Unaudited) | | | October 31, 2012 | | | (Unaudited) | | | October 31, 2012 | | | (Unaudited) | | | October 31, 2012 | |
| | | | | | | | | | | | | | | | | |
| $ | 353,583 | | | $ | 936,641 | | | $ | 10,334,531 | | | $ | 16,503,223 | | | $ | 1,005,103 | | | $ | 1,061,732 | |
| | 1,185,677 | | | | 730,827 | | | | (398,488 | ) | | | 15,896,840 | | | | 12,251,216 | | | | 1,944,040 | |
| | — | | | | 2,641 | | | | — | | | | — | | | | — | | | | — | |
| | (1,316,059 | ) | | | 675,399 | | | | 128,870,676 | | | | 38,631,748 | | | | 15,609,309 | | | | 30,826,479 | |
| | 223,201 | | | | 2,345,508 | | | | 138,806,719 | | | | 71,031,811 | | | | 28,865,628 | | | | 33,832,251 | |
| | | | | | | | | | | | | | | | | | | | | | | |
| | | | | | | | | | | | | | | | | | | | | | | |
| | (56,312 | ) | | | (79,978 | ) | | | (10,270,374 | ) | | | (16,153,180 | ) | | | (1,118,881 | ) | | | (2,581,343 | ) |
| | (307,591 | ) | | | (855,949 | ) | | | — | | | | — | | | | (520,872 | ) | | | (600,281 | ) |
| | (74,517 | ) | | | (35,520 | ) | | | (17,562,108 | ) | | | (3,837,545 | ) | | | — | | | | — | |
| | (670,866 | ) | | | (224,731 | ) | | | — | | | | — | | | | — | | | | — | |
| | (1,109,286 | ) | | | (1,196,178 | ) | | | (27,832,482 | ) | | | (19,990,725 | ) | | | (1,639,753 | ) | | | (3,181,624 | ) |
| | | | | | | | | | | | | | | | | | | | | | | |
| | | | | | | | | | | | | | | | | | | | | | | |
| | — | | | | — | | | | — | | | | — | | | | — | | | | — | |
| | — | | | | — | | | | — | | | | — | | | | — | | | | — | |
| | 1,826,238 | | | | 750,864 | | | | 246,359,468 | | | | 455,625,004 | | | | 45,901,030 | | | | 35,833,043 | |
| | 1,114,376 | | | | 9,744,071 | | | | N/A | | | | N/A | | | | 5,975,172 | | | | 29,798,695 | |
| | 116,426 | | | | 100,421 | | | | 26,329,242 | | | | 18,728,680 | | | | 1,096,037 | | | | 2,505,214 | |
| | 976,666 | | | | 276,637 | | | | N/A | | | | N/A | | | | 123,116 | | | | 541,245 | |
| | (1,600,408 | ) | | | (1,491,425 | ) | | | (120,555,352 | ) | | | (212,356,106 | ) | | | (25,093,063 | ) | | | (52,499,033 | ) |
| | (26,217,038 | ) | | | (915,194 | ) | | | N/A | | | | N/A | | | | (10,789,437 | ) | | | (9,935,564 | ) |
| | (23,783,740 | ) | | | 8,465,374 | | | | 152,133,358 | | | | 261,997,578 | | | | 17,212,855 | | | | 6,243,600 | |
| | (24,669,825 | ) | | | 9,614,704 | | | | 263,107,595 | | | | 313,038,664 | | | | 44,438,730 | | | | 36,894,227 | |
| | | | | | | | | | | | | | | | | | | | | | | |
| | | | | | | | | | | | | | | | | | | | | | | |
| | 36,908,902 | | | | 27,294,198 | | | | 746,820,432 | | | | 433,781,768 | | | | 210,995,067 | | | | 174,100,840 | |
| $ | 12,239,077 | | | $ | 36,908,902 | | | $ | 1,009,928,027 | | | $ | 746,820,432 | | | $ | 255,433,797 | | | $ | 210,995,067 | |
| $ | (8,011 | ) | | $ | 2,309 | | | $ | 516,922 | | | $ | 452,765 | | | $ | 80,429 | | | $ | 715,079 | |
| | | | | | | | | | | | | | | | | | | | | | | |
| | | | | | | | | | | | | | | | | | | | | | | |
| | — | | | | — | | | | — | | | | — | | | | — | | | | — | |
| | — | | | | — | | | | N/A | | | | N/A | | | | — | | | | — | |
| | 185,389 | | | | 77,850 | | | | 10,221,504 | | | | 20,822,498 | | | | 2,218,998 | | | | 2,027,671 | |
| | 125,929 | | | | 1,098,239 | | | | N/A | | | | N/A | | | | 464,241 | | | | 2,516,251 | |
| | 11,885 | | | | 10,455 | | | | 1,162,059 | | | | 855,456 | | | | 55,050 | | | | 151,831 | |
| | 109,868 | | | | 31,173 | | | | N/A | | | | N/A | | | | 9,865 | | | | 52,043 | |
| | (164,044 | ) | | | (153,825 | ) | | | (5,212,495 | ) | | | (9,730,123 | ) | | | (1,216,213 | ) | | | (2,981,029 | ) |
| | (2,965,464 | ) | | | (102,473 | ) | | | N/A | | | | N/A | | | | (871,057 | ) | | | (904,613 | ) |
| | (2,696,437 | ) | | | 961,419 | | | | 6,171,068 | | | | 11,947,831 | | | | 660,884 | | | | 862,154 | |
HENNESSY FUNDS 1-800-966-4354
Financial Statements
| Statements of Changes in Net Assets |
| | | Hennessy Large Cap Financial Fund | |
| | | | | | | |
| | | Six Months Ended | | | | |
| | | April 30, 2013 | | | Year Ended | |
| | | (Unaudited) | | | October 31, 2012 | |
| OPERATIONS: | | | | | | |
| Net investment income (loss) | | $ | (74,294 | ) | | $ | 51,832 | |
| Net realized gain on securities | | | 5,071,337 | | | | (2,869,863 | ) |
| Long-term capital gain distributions from regulated investment companies | | | — | | | | — | |
| Change in unrealized appreciation (depreciation) on securities | | | 4,210,555 | | | | 13,073,690 | |
| Net increase (decrease) in net assets resulting from operations | | | 9,207,598 | | | | 10,255,659 | |
| | | | | | | | | |
| DISTRIBUTIONS TO SHAREHOLDERS FROM: | | | | | | | | |
| Net investment income – Investor Class | | | (50,837 | ) | | | — | |
| Net investment income – Institutional Class | | | — | | | | — | |
| Net realized gains – Investor Class | | | — | | | | — | |
| Net realized gains – Institutional Class | | | — | | | | — | |
| Total distributions | | | (50,837 | ) | | | — | |
| | | | | | | | | |
| CAPITAL SHARE TRANSACTIONS: | | | | | | | | |
| Proceeds from shares issued in the Reorganization – Investor Class (See Note 8) | | | — | | | | — | |
| Proceeds from shares issued in the Reorganization – Institutional Class (See Note 8) | | | N/A | | | | N/A | |
| Proceeds from shares subscribed – Investor Class | | | 9,650,235 | | | | 16,478,942 | |
| Proceeds from shares subscribed – Institutional Class | | | N/A | | | | N/A | |
| Dividends reinvested – Investor Class | | | 49,255 | | | | — | |
| Dividends reinvested – Institutional Class | | | N/A | | | | N/A | |
| Cost of shares redeemed – Investor Class | | | (23,606,517 | ) | | | (17,762,354 | ) |
| Cost of shares redeemed – Institutional Class | | | N/A | | | | N/A | |
| Net increase (decrease) in net assets derived from capital share transactions | | | (13,907,027 | ) | | | (1,283,412 | ) |
| TOTAL INCREASE (DECREASE) IN NET ASSETS | | | (4,750,266 | ) | | | 8,972,247 | |
| | | | | | | | | |
| NET ASSETS: | | | | | | | | |
| Beginning of period | | | 64,655,891 | | | | 55,683,644 | |
| End of period | | $ | 59,905,625 | | | $ | 64,655,891 | |
| Accumulated net investment income (loss), end of period | | $ | (74,294 | ) | | $ | 50,837 | |
| | | | | | | | | |
| CHANGES IN SHARES OUTSTANDING: | | | | | | | | |
| Shares issued in connection with Reorganization – Investor Class (See Note 8) | | | — | | | | — | |
| Shares issued in connection with Reorganization – Institutional Class (See Note 8) | | | N/A | | | | N/A | |
| Shares sold – Investor Class | | | 630,799 | | | | 1,270,324 | |
| Shares sold – Institutional Class | | | N/A | | | | N/A | |
| Shares issued to holders as reinvestment of dividends – Investor Class | | | 3,367 | | | | — | |
| Shares issued to holders as reinvestment of dividends – Institutional Class | | | N/A | | | | N/A | |
| Shares redeemed – Investor Class | | | (1,581,705 | ) | | | (1,379,184 | ) |
| Shares redeemed – Institutional Class | | | N/A | | | | N/A | |
| Net increase (decrease) in shares outstanding | | | (947,539 | ) | | | (108,860 | ) |
The accompanying notes are an integral part of these financial statements.
| Hennessy Technology Fund | | | Hennessy Japan Fund | | | Hennessy Japan Small Cap Fund | |
| | | | | | | | | | | | | | | | | |
| Six Months Ended | | | | | | Six Months Ended | | | | | | Six Months Ended | | | | |
| April 30, 2013 | | | Year Ended | | | April 30, 2013 | | | Year Ended | | | April 30, 2013 | | | Year Ended | |
| (Unaudited) | | | October 31, 2012 | | | (Unaudited) | | | October 31, 2012 | | | (Unaudited) | | | October 31, 2012 | |
| | | | | | | | | | | | | | | | | |
| $ | (27,490 | ) | | $ | (73,791 | ) | | $ | (40,002 | ) | | $ | 1,984 | | | $ | 56,500 | | | $ | (99,955 | ) |
| | 141,810 | | | | 105,389 | | | | 73,847 | | | | (816,325 | ) | | | 631,103 | | | | 2,043,302 | |
| | — | | | | — | | | | — | | | | — | | | | — | | | | — | |
| | 346,949 | | | | (96,492 | ) | | | 4,069,160 | | | | 2,653,253 | | | | 3,323,871 | | | | (380,675 | ) |
| | 461,269 | | | | (64,894 | ) | | | 4,103,005 | | | | 1,838,912 | | | | 4,011,474 | | | | 1,562,672 | |
| | | | | | | | | | | | | | | | | | | | | | | |
| | | | | | | | | | | | | | | | | | | | | | | |
| | — | | | | — | | | | (7,343 | ) | | | — | | | | — | | | | (99,101 | ) |
| | — | | | | — | | | | (5,525 | ) | | | — | | | | N/A | | | | N/A | |
| | — | | | | — | | | | — | | | | — | | | | (1,115,069 | ) | | | — | |
| | — | | | | — | | | | — | | | | — | | | | N/A | | | | N/A | |
| | — | | | | — | | | | (12,868 | ) | | | — | | | | (1,115,069 | ) | | | (99,101 | ) |
| | | | | | | | | | | | | | | | | | | | | | | |
| | | | | | | | | | | | | | | | | | | | | | | |
| | — | | | | — | | | | — | | | | — | | | | — | | | | — | |
| | — | | | | — | | | | — | | | | — | | | | — | | | | — | |
| | 448,287 | | | | 1,102,171 | | | | 14,693,131 | | | | 6,766,669 | | | | 14,151,663 | | | | 2,526,353 | |
| | 109,209 | | | | 117,282 | | | | 415,425 | | | | 157,102 | | | | N/A | | | | N/A | |
| | — | | | | — | | | | 7,134 | | | | — | | | | 1,067,157 | | | | 95,320 | |
| | — | | | | — | | | | 5,425 | | | | — | | | | N/A | | | | N/A | |
| | (914,277 | ) | | | (2,317,205 | ) | | | (5,630,014 | ) | | | (12,101,974 | ) | | | (2,342,030 | ) | | | (23,061,781 | ) |
| | (85,005 | ) | | | (318,228 | ) | | | (2,998,107 | ) | | | (1,853,965 | ) | | | N/A | | | | N/A | |
| | (441,786 | ) | | | (1,415,980 | ) | | | 6,492,994 | | | | (7,032,168 | ) | | | 12,876,790 | | | | (20,440,108 | ) |
| | 19,483 | | | | (1,480,874 | ) | | | 10,583,131 | | | | (5,193,256 | ) | | | 15,773,195 | | | | (18,976,537 | ) |
| | | | | | | | | | | | | | | | | | | | | | | |
| | | | | | | | | | | | | | | | | | | | | | | |
| | 5,374,044 | | | | 6,854,918 | | | | 19,318,221 | | | | 24,511,477 | | | | 5,106,522 | | | | 24,083,059 | |
| $ | 5,393,527 | | | $ | 5,374,044 | | | $ | 29,901,352 | | | $ | 19,318,221 | | | $ | 20,879,717 | | | $ | 5,106,522 | |
| $ | (91,520 | ) | | $ | (64,030 | ) | | $ | (52,870 | ) | | $ | — | | | $ | (1,235 | ) | | $ | (57,735 | ) |
| | | | | | | | | | | | | | | | | | | | | | | |
| | | | | | | | | | | | | | | | | | | | | | | |
| | — | | | | — | | | | — | | | | — | | | | — | | | | — | |
| | — | | | | — | | | | — | | | | — | | | | — | | | | — | |
| | 39,198 | | | | 100,084 | | | | 1,562,279 | | | | 460,787 | | | | 1,480,435 | | | | 235,392 | |
| | 9,418 | | | | 10,510 | | | | 24,289 | | | | 10,560 | | | | N/A | | | | N/A | |
| | — | | | | — | | | | 459 | | | | — | | | | 121,406 | | | | 9,570 | |
| | — | | | | — | | | | 344 | | | | — | | | | N/A | | | | N/A | |
| | (80,425 | ) | | | (208,443 | ) | | | (1,026,679 | ) | | | (845,443 | ) | | | (241,077 | ) | | | (2,148,260 | ) |
| | (7,596 | ) | | | (29,733 | ) | | | (190,333 | ) | | | (124,185 | ) | | | N/A | | | | N/A | |
| | (39,405 | ) | | | (127,582 | ) | | | 370,359 | | | | (498,281 | ) | | | 1,360,764 | | | | (1,903,298 | ) |
HENNESSY FUNDS 1-800-966-4354
Statement of Cash Flows
Hennessy Total Return Fund For the Six Months Ended April 30, 2013 (Unaudited) |
| Cash Flows From Operating Activities: | | | |
| | | | |
| Net increase in net assets from operations | | $ | 8,331,450 | |
| Adjustments to reconcile net increase in net assets from operations to net cash provided by operating activities: | | | | |
| Purchase of investment securities | | | (53,336,791 | ) |
| Proceeds on sale of securities | | | 53,397,392 | |
| Decrease in other receivables, net | | | 151,071 | |
| Decrease in other assets | | | 3,218 | |
| Decrease in accrued expenses and other payables | | | (235,288 | ) |
| Net accretion of discount on securities | | | (19,148 | ) |
| Net realized gain on investments | | | (1,756,172 | ) |
| Unrealized appreciation on securities | | | (6,083,060 | ) |
| Net cash provided by operating activities | | $ | 452,672 | |
| | | | | |
| Cash Flows From Financing Activities: | | | | |
| | | | | |
| Increase in reverse repurchase agreements | | $ | 3,592,000 | |
| Proceeds on shares sold | | | 4,985,372 | |
| Payment on shares repurchased | | | (8,984,468 | ) |
| Cash dividends paid, net of dividends reinvested | | | (45,576 | ) |
| Net cash used in financing activities | | $ | (452,672 | ) |
| | | | | |
| Cash at beginning of period | | | — | |
| Cash at end of period | | | — | |
| Net increase (decrease) in cash | | $ | — | |
| | | | | |
| Cash paid for interest | | $ | 42,307 | |
The accompanying notes are an integral part of these financial statements.
(This Page Intentionally Left Blank.)
HENNESSY FUNDS 1-800-966-4354
Financial Highlights
| Hennessy Cornerstone Growth Fund |
For an Investor Class share outstanding throughout each period
| | | Six Months | | | | | | | | | | | | | | | | |
| | | Ended | | | | | | | | | | | | | | | | |
| | | April 30, | | | | | | | | | | | | | | | | |
| | | 2013 | | | Year Ended October 31, | |
| | | (Unaudited) | | | 2012 | | | 2011 | | | 2010 | | | 2009 | | | 2008 | |
| PER SHARE DATA: | | | | | | | | | | | | | | | | | | |
| Net asset value, beginning of period | | $ | 12.38 | | | $ | 9.97 | | | $ | 10.28 | | | $ | 8.81 | | | $ | 8.80 | | | $ | 19.41 | |
| | | | | | | | | | | | | | | | | | | | | | | | | |
| Income from investment operations: | | | | | | | | | | | | | | | | | | | | | | | | |
| Net investment loss | | | 0.00 | | | | (0.07 | ) | | | (0.08 | ) | | | (0.10 | ) | | | (0.04 | ) | | | (0.05 | ) |
| Net realized and unrealized gains (losses) on securities | | 1.46 | | | | 2.48 | | | | (0.23 | ) | | | 1.57 | | | | 0.05 | | | | (8.32 | ) |
| Total from investment operations | | | 1.46 | | | | 2.41 | | | | (0.31 | ) | | | 1.47 | | | | 0.01 | | | | (8.37 | ) |
| | | | | | | | | | | | | | | | | | | | | | | | | |
| Less Distributions: | | | | | | | | | | | | | | | | | | | | | | | | |
| Dividends from net investment income | | | — | | | | — | | | | — | | | | — | | | | — | | | | — | |
| Dividends from net realized gains | | | — | | | | — | | | | — | | | | — | | | | — | | | | (2.24 | ) |
| Total distributions | | | — | | | | — | | | | — | | | | — | | | | — | | | | (2.24 | ) |
| Net asset value, end of period | | $ | 13.84 | | | $ | 12.38 | | | $ | 9.97 | | | $ | 10.28 | | | $ | 8.81 | | | $ | 8.80 | |
| | | | | | | | | | | | | | | | | | | | | | | | | |
| TOTAL RETURN | | | 11.79 | %(1) | | | 24.17 | % | | | (3.02 | )% | | | 16.69 | % | | | 0.11 | % | | | (48.00 | )% |
| | | | | | | | | | | | | | | | | | | | | | | | | |
| SUPPLEMENTAL DATA AND RATIOS: | | | | | | | | | | | | | | | | | | | | | | | | |
| Net assets, end of period (millions) | | $ | 284.04 | | | $ | 265.60 | | | $ | 184.40 | | | $ | 207.11 | | | $ | 228.96 | | | $ | 312.50 | |
| Ratio of expenses to average net assets | | | 1.29 | %(2) | | | 1.34 | % | | | 1.33 | % | | | 1.34 | % | | | 1.36 | % | | | 1.25 | % |
| Ratio of net investment loss to average net assets | | | 0.01 | %(2) | | | (0.66 | )% | | | (0.78 | )% | | | (0.89 | )% | | | (0.42 | )% | | | (0.29 | )% |
Portfolio turnover rate(3) | | | 96 | %(1) | | | 90 | % | | | 106 | % | | | 103 | % | | | 108 | % | | | 103 | % |
| (1) | Not Annualized. |
| (2) | Annualized. |
| (3) | Portfolio turnover is calculated on the basis of the Fund as a whole. |
The accompanying notes are an integral part of these financial statements.
Financial Highlights
| Hennessy Cornerstone Growth Fund |
For an Institutional Class share outstanding throughout each period
| | | Six Months | | | | | | | | | | | | | | | | |
| | | Ended | | | | | | | | | | | | | | | Period | |
| | | April 30, | | | | | | | | | | | | | | | Ended | |
| | | 2013 | | | Year Ended October 31, | | | October 31, | |
| | | (Unaudited) | | | 2012 | | | 2011 | | | 2010 | | | 2009 | | | 2008(1) | |
| PER SHARE DATA: | | | | | | | | | | | | | | | | | | |
| Net asset value, beginning of period | | $ | 12.57 | | | $ | 10.09 | | | $ | 10.37 | | | $ | 8.86 | | | $ | 8.82 | | | $ | 13.29 | |
| | | | | | | | | | | | | | | | | | | | | | | | | |
| Income from investment operations: | | | | | | | | | | | | | | | | | | | | | | | | |
| Net investment income (loss) | | | 0.03 | | | | (0.04 | ) | | | (0.05 | ) | | | (0.07 | ) | | | — | | | | 0.01 | |
| Net realized and unrealized gains (losses) on securities | | 1.48 | | | | 2.52 | | | | (0.23 | ) | | | 1.58 | | | | 0.04 | | | | (4.48 | ) |
| Total from investment operations | | | 1.51 | | | | 2.48 | | | | (0.28 | ) | | | 1.51 | | | | 0.04 | | | | (4.47 | ) |
| | | | | | | | | | | | | | | | | | | | | | | | | |
| Less Distributions: | | | | | | | | | | | | | | | | | | | | | | | | |
| Dividends from net investment income | | | — | | | | — | | | | — | | | | — | | | | — | | | | — | |
| Dividends from net realized gains | | | — | | | | — | | | | — | | | | — | | | | — | | | | — | |
| Total distributions | | | — | | | | — | | | | — | | | | — | | | | — | | | | — | |
| Net asset value, end of period | | $ | 14.08 | | | $ | 12.57 | | | $ | 10.09 | | | $ | 10.37 | | | $ | 8.86 | | | $ | 8.82 | |
| | | | | | | | | | | | | | | | | | | | | | | | | |
| TOTAL RETURN | | | 12.01 | %(2) | | | 24.58 | % | | | (2.70 | )% | | | 17.04 | % | | | 0.45 | % | | | (34.13 | )%(2) |
| | | | | | | | | | | | | | | | | | | | | | | | | |
| SUPPLEMENTAL DATA AND RATIOS: | | | | | | | | | | | | | | | | | | | | | | | | |
| Net assets, end of period (millions) | | $ | 28.24 | | | $ | 37.11 | | | $ | 2.53 | | | $ | 3.12 | | | $ | 4.68 | | | $ | 5.09 | |
| Ratio of expenses to average net assets: | | | | | | | | | | | | | | | | | | | | | | | | |
| Before expense reimbursement | | | 1.10 | %(3) | | | 1.11 | % | | | 1.09 | % | | | 1.09 | % | | | 1.11 | % | | | 1.12 | %(3) |
| After expense reimbursement | | | 0.98 | %(3) | | | 0.98 | % | | | 0.98 | % | | | 0.98 | % | | | 0.98 | % | | | 0.98 | %(3) |
| Ratio of net investment income (loss) to average net assets: | | | | | | | | | | | | | | | | | | | | | |
| Before expense reimbursement | | | 0.34 | %(3) | | | (0.51 | )% | | | (0.55 | )% | | | (0.64 | )% | | | (0.17 | )% | | | 0.15 | %(3) |
| After expense reimbursement | | | 0.47 | %(3) | | | (0.38 | )% | | | (0.44 | )% | | | (0.53 | )% | | | (0.04 | )% | | | 0.29 | %(3) |
Portfolio turnover rate(4) | | | 96 | %(2) | | | 90 | % | | | 106 | % | | | 103 | % | | | 108 | % | | | 103 | %(2) |
| (1) | Institutional Class shares commenced operations on March 3, 2008. |
| (2) | Not Annualized. |
| (3) | Annualized. |
| (4) | Portfolio turnover is calculated on the basis of the Fund as a whole. |
The accompanying notes are an integral part of these financial statements.
HENNESSY FUNDS 1-800-966-4354
Financial Highlights
For an Investor Class share outstanding throughout each period
| | | Six Months | | | | | | | | | | | | | | | | |
| | | Ended | | | | | | | | | | | | | | | | |
| | | April 30, | | | | | | | | | | | | | | | | |
| | | 2013 | | | Year Ended October 31, | |
| | | (Unaudited) | | | 2012 | | | 2011 | | | 2010 | | | 2009 | | | 2008 | |
| PER SHARE DATA: | | | | | | | | | | | | | | | | | | |
| Net asset value, beginning of period | | $ | 51.78 | | | $ | 49.80 | | | $ | 47.57 | | | $ | 37.56 | | | $ | 37.40 | | | $ | 57.97 | |
| | | | | | | | | | | | | | | | | | | | | | | | | |
| Income from investment operations: | | | | | | | | | | | | | | | | | | | | | | | | |
| Net investment income (loss) | | | (0.17 | ) | | | (0.39 | ) | | | (0.50 | )(1) | | | (0.64 | ) | | | (0.42 | ) | | | (0.44 | ) |
| Net realized and unrealized gains (losses) on securities | | 9.16 | | | | 7.61 | | | | 4.44 | | | | 10.65 | | | | 5.76 | | | | (19.51 | ) |
| Total from investment operations | | | 8.99 | | | | 7.22 | | | | 3.94 | | | | 10.01 | | | | 5.34 | | | | (19.95 | ) |
| | | | | | | | | | | | | | | | | | | | | | | | | |
| Less Distributions: | | | | | | | | | | | | | | | | | | | | | | | | |
| Dividends from net investment income | | | — | | | | — | | | | — | | | | — | | | | — | | | | (0.12 | ) |
| Dividends from net realized gains | | | (4.32 | ) | | | (5.24 | ) | | | (1.72 | ) | | | — | | | | (5.19 | ) | | | (0.51 | ) |
| Total distributions | | | (4.32 | ) | | | (5.24 | ) | | | (1.72 | ) | | | — | | | | (5.19 | ) | | | (0.63 | ) |
| Paid-in capital from redemption fees | | | — | | | | 0.00 | (2) | | | 0.01 | | | | 0.00 | (2) | | | 0.01 | | | | 0.01 | |
| Net asset value, end of period | | $ | 56.45 | | | $ | 51.78 | | | $ | 49.80 | | | $ | 47.57 | | | $ | 37.56 | | | $ | 37.40 | |
| | | | | | | | | | | | | | | | | | | | | | | | | |
| TOTAL RETURN | | | 18.56 | %(3) | | | 16.17 | % | | | 8.35 | % | | | 26.65 | % | | | 17.74 | % | | | (34.73 | )% |
| | | | | | | | | | | | | | | | | | | | | | | | | |
| SUPPLEMENTAL DATA AND RATIOS: | | | | | | | | | | | | | | | | | | | | | | | | |
| Net assets, end of period (millions) | | | 848.45 | | | $ | 707.61 | | | $ | 611.34 | | | $ | 670.84 | | | $ | 759.77 | | | $ | 717.78 | |
| Ratio of expenses to average net assets | | | 1.41 | %(4) | | | 1.41 | % | | | 1.44 | % | | | 1.51 | % | | | 1.43 | % | | | 1.42 | % |
| Ratio of net investment loss to average net assets | | | (0.81 | )%(4) | | | (0.79 | )% | | | (1.01 | )% | | | (1.31 | )% | | | (1.16 | )% | | | (0.67 | )% |
Portfolio turnover rate(5) | | | 0 | %(3) | | | 13 | % | | | 13 | % | | | 5 | % | | | 5 | % | | | 17 | % |
| (1) | Calculated based on average shares outstanding method. |
| (2) | Amount is less than $0.01. |
| (3) | Not Annualized. |
| (4) | Annualized. |
| (5) | Portfolio turnover is calculated on the basis of the Fund as a whole. |
The accompanying notes are an integral part of these financial statements.
Financial Highlights
For an Institutional Class share outstanding throughout each period*
| | | Six Months | | | | | | | | | | | | | | | | |
| | | Ended | | | | | | | | | | | | | | | Period | |
| | | April 30, | | | | | | | | | | | | | | | Ended | |
| | | 2013 | | | Year Ended October 31, | | | October 31, | |
| | | (Unaudited) | | | 2012 | | | 2011 | | | 2010 | | | 2009 | | | 2008(1) | |
| PER SHARE DATA: | | | | | | | | | | | | | | | | | | |
| Net asset value, beginning of period | | $ | 52.19 | | | $ | 50.02 | | | $ | 47.64 | | | $ | 37.84 | | | $ | 130.93 | | | $ | 180.00 | |
| | | | | | | | | | | | | | | | | | | | | | | | | |
| Income from investment operations: | | | | | | | | | | | | | | | | | | | | | | | | |
| Net investment income (loss) | | | (0.15 | ) | | | (0.22 | ) | | | (0.37 | )(2) | | | (0.41 | ) | | | (0.25 | ) | | | (0.20 | ) |
| Net realized and unrealized gains (losses) on securities | | 9.29 | | | | 7.63 | | | | 4.47 | | | | 10.58 | | | | 0.59 | | | | (49.05 | ) |
| Total from investment operations | | | 9.14 | | | | 7.41 | | | | 4.10 | �� | | | 10.17 | | | | 0.34 | | | | (49.25 | ) |
| | | | | | | | | | | | | | | | | | | | | | | | | |
| Less Distributions: | | | | | | | | | | | | | | | | | | | | | | | | |
| Dividends from net investment income | | | — | | | | — | | | | — | | | | (0.37 | ) | | | — | | | | — | |
| Dividends from net realized gains | | | (4.32 | ) | | | (5.24 | ) | | | (1.72 | ) | | | — | | | | (93.45 | ) | | | — | |
| Total distributions | | | (4.32 | ) | | | (5.24 | ) | | | (1.72 | ) | | | (0.37 | ) | | | (93.45 | ) | | | — | |
| Paid-in capital from redemption fees | | | — | | | | 0.00 | (3) | | | 0.00 | (3) | | | 0.00 | (3) | | | 0.02 | | | | 0.18 | |
| Net asset value, end of period | | $ | 57.01 | | | $ | 52.19 | | | $ | 50.02 | | | $ | 47.64 | | | $ | 37.84 | | | $ | 130.93 | |
| | | | | | | | | | | | | | | | | | | | | | | | | |
| TOTAL RETURN | | | 18.71 | %(4) | | | 16.51 | % | | | 8.53 | % | | | 27.32 | % | | | 18.15 | % | | | (27.30 | )%(4) |
| | | | | | | | | | | | | | | | | | | | | | | | | |
| SUPPLEMENTAL DATA AND RATIOS: | | | | | | | | | | | | | | | | | | | | | | | | |
| Net assets, end of period (millions) | | $ | 67.10 | | | $ | 77.28 | | | $ | 49.01 | | | $ | 36.81 | | | $ | 34.23 | | | $ | 16.83 | |
| Ratio of expenses to average net assets | | | 1.14 | %(5) | | | 1.12 | % | | | 1.15 | % | | | 1.26 | % | | | 1.15 | % | | | 1.05 | %(5) |
| Ratio of net investment income (loss) to average net assets | (0.52 | )%(5) | | | (0.52 | )% | | | (0.76 | )% | | | (1.06 | )% | | | (0.88 | )% | | | (0.70 | )%(5) |
Portfolio turnover rate(6) | | | 0 | %(4) | | | 13 | % | | | 13 | % | | | 5 | % | | | 5 | % | | | 17 | %(4) |
| * | Per share amounts have been restated on a retroactive basis to reflect a 1:18 reverse stock split effective December 10, 2010. |
| (1) | Institutional Class shares commenced operations on May 30, 2008. |
| (2) | Calculated based on average shares outstanding method. |
| (3) | Amount is less than $0.01. |
| (4) | Not Annualized. |
| (5) | Annualized. |
| (6) | Portfolio turnover is calculated on the basis of the Fund as a whole. |
The accompanying notes are an integral part of these financial statements.
HENNESSY FUNDS 1-800-966-4354
Financial Highlights
| Hennessy Cornerstone Mid Cap 30 Fund |
For an Investor Class share outstanding throughout each period
| | | Six Months | | | | | | | | | | | | | | | | |
| | | Ended | | | | | | | | | | | | | | | | |
| | | April 30, | | | | | | | | | | | | | | | | |
| | | 2013 | | | Year Ended October 31, | |
| | | (Unaudited) | | | 2012 | | | 2011 | | | 2010 | | | 2009 | | | 2008 | |
| PER SHARE DATA: | | | | | | | | | | | | | | | | | | |
| Net asset value, beginning of period | | $ | 14.06 | | | $ | 12.15 | | | $ | 11.18 | | | $ | 8.73 | | | $ | 8.02 | | | $ | 13.67 | |
| | | | | | | | | | | | | | | | | | | | | | | | | |
| Income from investment operations: | | | | | | | | | | | | | | | | | | | | | | | | |
| Net investment income (loss) | | | 0.12 | | | | 0.08 | | | | (0.09 | ) | | | (0.03 | ) | | | (0.02 | ) | | | (0.06 | ) |
| Net realized and unrealized gains (losses) on investments | | 2.30 | | | | 1.83 | | | | 1.06 | | | | 2.48 | | | | 0.73 | | | | (3.57 | ) |
| Total from investment operations | | | 2.42 | | | | 1.91 | | | | 0.97 | | | | 2.45 | | | | 0.71 | | | | (3.63 | ) |
| | | | | | | | | | | | | | | | | | | | | | | | | |
| Less Distributions: | | | | | | | | | | | | | | | | | | | | | | | | |
| Dividends from net investment income | | | (0.18 | ) | | | — | | | | — | | | | — | | | | — | | | | — | |
| Dividends from net realized gains | | | — | | | | — | | | | — | | | | — | | | | — | | | | (2.02 | ) |
| Total distributions | | | (0.18 | ) | | | — | | | | — | | | | — | | | | — | | | | (2.02 | ) |
| Net asset value, end of period | | $ | 16.30 | | | $ | 14.06 | | | $ | 12.15 | | | $ | 11.18 | | | $ | 8.73 | | | $ | 8.02 | |
| | | | | | | | | | | | | | | | | | | | | | | | | |
| TOTAL RETURN | | | 17.43 | %(1) | | | 15.72 | % | | | 8.68 | % | | | 28.06 | % | | | 8.85 | % | | | (30.81 | )% |
| | | | | | | | | | | | | | | | | | | | | | | | | |
| SUPPLEMENTAL DATA AND RATIOS: | | | | | | | | | | | | | | | | | | | | | | | | |
| Net assets, end of period (millions) | | $ | 162.99 | | | $ | 145.85 | | | $ | 146.23 | | | $ | 123.20 | | | $ | 128.36 | | | $ | 167.32 | |
| Ratio of expenses to average net assets | | | 1.30 | %(2) | | | 1.37 | % | | | 1.36 | % | | | 1.39 | % | | | 1.39 | % | | | 1.27 | % |
| Ratio of net investment income (loss) to average net assets | 1.44 | %(2) | | | 0.59 | % | | | (0.79 | )% | | | (0.26 | )% | | | (0.20 | )% | | | (0.62 | )% |
Portfolio turnover rate(3) | | | 108 | %(1) | | | 25 | % | | | 107 | % | | | 87 | % | | | 90 | % | | | 123 | % |
| (1) | Not Annualized. |
| (2) | Annualized. |
| (3) | Portfolio turnover is calculated on the basis of the Fund as a whole. |
The accompanying notes are an integral part of these financial statements.
Financial Highlights
| Hennessy Cornerstone Mid Cap 30 Fund |
For an Institutional Class share outstanding throughout each period
| | | Six Months | | | | | | | | | | | | | | | | |
| | | Ended | | | | | | | | | | | | | | | Period | |
| | | April 30, | | | | | | | | | | | | | | | Ended | |
| | | 2013 | | | Year Ended October 31, | | | October 31, | |
| | | (Unaudited) | | | 2012 | | | 2011 | | | 2010 | | | 2009 | | | 2008(1) | |
| PER SHARE DATA: | | | | | | | | | | | | | | | | | | |
| Net asset value, beginning of period | | $ | 14.31 | | | $ | 12.32 | | | $ | 11.29 | | | $ | 8.78 | | | $ | 8.04 | | | $ | 11.15 | |
| | | | | | | | | | | | | | | | | | | | | | | | | |
| Income from investment operations: | | | | | | | | | | | | | | | | | | | | | | | | |
| Net investment income (loss) | | | 0.14 | | | | 0.09 | | | | (0.05 | ) | | | 0.02 | | | | 0.02 | | | | (0.02 | ) |
| Net realized and unrealized gains (losses) on investments | | | 2.34 | | | | 1.90 | | | | 1.08 | | | | 2.49 | | | | 0.72 | | | | (3.09 | ) |
| Total from investment operations | | | 2.48 | | | | 1.99 | | | | 1.03 | | | | 2.51 | | | | 0.74 | | | | (3.11 | ) |
| | | | | | | | | | | | | | | | | | | | | | | | | |
| Less Distributions: | | | | | | | | | | | | | | | | | | | | | | | | |
| Dividends from net investment income | | | (0.24 | ) | | | — | | | | — | | | | — | | | | — | | | | — | |
| Dividends from net realized gains | | | — | | | | — | | | | — | | | | — | | | | — | | | | — | |
| Total distributions | | | (0.24 | ) | | | — | | | | — | | | | — | | | | — | | | | — | |
| Net asset value, end of period | | $ | 16.55 | | | $ | 14.31 | | | $ | 12.32 | | | $ | 11.29 | | | $ | 8.78 | | | $ | 8.04 | |
| | | | | | | | | | | | | | | | | | | | | | | | | |
| TOTAL RETURN | | | 17.55 | %(2) | | | 16.15 | % | | | 9.12 | % | | | 28.59 | % | | | 9.20 | % | | | (27.89 | )%(2) |
| | | | | | | | | | | | | | | | | | | | | | | | | |
| SUPPLEMENTAL DATA AND RATIOS: | | | | | | | | | | | | | | | | | | | | | | | | |
| Net assets, end of period (millions) | | $ | 47.04 | | | $ | 41.62 | | | $ | 24.06 | | | $ | 21.38 | | | $ | 27.44 | | | $ | 26.78 | |
| Ratio of expenses to average net assets: | | | | | | | | | | | | | | | | | | | | | | | | |
| Before expense reimbursement | | | 1.08 | %(3) | | | 1.16 | % | | | 1.14 | % | | | 1.16 | % | | | 1.15 | % | | | 1.13 | %(3) |
| After expense reimbursement | | | 0.98 | %(3) | | | 0.98 | % | | | 0.98 | % | | | 0.98 | % | | | 0.98 | % | | | 0.98 | %(3) |
| Ratio of net investment income (loss) to average net assets: | | | | | | | | | | | | | | | | | | | | | | | | |
| Before expense reimbursement | | | 1.72 | %(3) | | | 0.90 | % | | | (0.41 | )% | | | (0.03 | )% | | | 0.04 | % | | | (0.28 | )%(3) |
| After expense reimbursement | | | 1.82 | %(3) | | | 1.08 | % | | | (0.57 | )% | | | 0.15 | % | | | 0.21 | % | | | (0.13 | )%(3) |
Portfolio turnover rate(4) | | | 108 | %(2) | | | 25 | % | | | 107 | % | | | 87 | % | | | 90 | % | | | 123 | %(2) |
| (1) | Institutional Class shares commenced operations on March 3, 2008. |
| (2) | Not Annualized. |
| (3) | Annualized. |
| (4) | Portfolio turnover is calculated on the basis of the Fund as a whole. |
The accompanying notes are an integral part of these financial statements.
HENNESSY FUNDS 1-800-966-4354
Financial Highlights
| Hennessy Cornerstone Large Growth Fund |
For an Investor Class share outstanding throughout each period
| | | Six Months | | | | | | | | | | | | | | | | | | | |
| | | Ended | | | | | | | | | | | | One Month | | | | | | | |
| | | April 30, | | | | | | | | | | | | Ended | | | Year Ended | |
| | | 2013 | | | Year Ended October 31, | | | October 31, | | | September 30, | |
| | | (Unaudited) | | | 2012 | | | 2011 | | | 2010 | | | 2009(1) | | | 2009(2) | | | 2008(2) | |
| PER SHARE DATA: | | | | | | | | | | | | | | | | | | | | | |
| Net asset value, beginning of period | | $ | 10.77 | | | $ | 12.37 | | | $ | 11.70 | | | $ | 9.49 | | | $ | 9.60 | | | $ | 10.09 | | | $ | 12.61 | |
| | | | | | | | | | | | | | | | | | | | | | | | | | | | | |
| Income from investment operations: | | | | | | | | | | | | | | | | | | | | | | | | | | | | |
| Net investment income (loss) | | | 0.08 | | | | 0.13 | | | | 0.09 | | | | 0.09 | | | | — | (3) | | | 0.05 | | | | — | (3)(4) |
Net realized and unrealized gains (losses) on securities | | | 1.16 | | | | 0.80 | | | | 0.69 | | | | 2.17 | | | | (0.11 | ) | | | (0.54 | ) | | | (2.52 | ) |
| Total from investment operations | | | 1.24 | | | | 0.93 | | | | 0.78 | | | | 2.26 | | | | (0.11 | ) | | | (0.49 | ) | | | (2.52 | ) |
| | | | | | | | | | | | | | | | | | | | | | | | | | | | | |
| Less Distributions: | | | | | | | | | | | | | | | | | | | | | | | | | | | | |
| Dividends from net investment income | | | (0.10 | ) | | | (0.07 | ) | | | (0.09 | ) | | | (0.05 | ) | | | — | | | | — | | | | — | |
| Dividends from net realized gains | | | (0.02 | ) | | | (2.46 | ) | | | (0.02 | ) | | | — | | | | — | | | | — | | | | — | |
| Total distributions | | | (0.12 | ) | | | (2.53 | ) | | | (0.11 | ) | | | (0.05 | ) | | | — | | | | — | | | | — | |
| Net asset value, end of period | | $ | 11.89 | | | $ | 10.77 | | | $ | 12.37 | | | $ | 11.70 | | | $ | 9.49 | | | $ | 9.60 | | | $ | 10.09 | |
| | | | | | | | | | | | | | | | | | | | | | | | | | | | | |
| TOTAL RETURN | | | 11.64 | %(5) | | | 9.14 | % | | | 6.70 | % | | | 23.88 | % | | | (1.15 | )%(5) | | | (4.86 | )% | | | (19.98 | )% |
| | | | | | | | | | | | | | | | | | | | | | | | | | | | | |
| SUPPLEMENTAL DATA AND RATIOS: | | | | | | | | | | | | | | | | | | | | | | | | | | | | |
| Net assets, end of period (millions) | | $ | 80.96 | | | $ | 75.83 | | | $ | 77.88 | | | $ | 78.83 | | | $ | 69.41 | | | $ | 70.61 | | | $ | 80.91 | |
| Ratio of expenses to average net assets: | | | | | | | | | | | | | | | | | | | | | | | | | | | | |
| Before expense reimbursement/recoupment | 1.18 | %(6) | | | 1.27 | % | | | 1.26 | % | | | 1.30 | % | | | 1.26 | %(6) | | | 1.40 | % | | | 1.16 | % |
| After expense reimbursement/recoupment | 1.18 | %(6) | | | 1.27 | % | | | 1.30 | % | | | 1.30 | % | | | 1.30 | %(6) | | | 1.17 | % | | | 0.98 | % |
Ratio of net investment income to average net assets: | | | | | | | | | | | | | | | | | | | | | | | | | | | | |
| Before expense reimbursement/recoupment | 1.28 | %(6) | | | 1.35 | % | | | 0.72 | % | | | 0.84 | % | | | (0.01 | )%(6) | | | 0.36 | % | | | (0.19 | )% |
| After expense reimbursement/recoupment | 1.28 | %(6) | | | 1.35 | % | | | 0.68 | % | | | 0.84 | % | | | (0.05 | )%(6) | | | 0.59 | % | | | (0.01 | )% |
Portfolio turnover rate(7) | | | 72 | %(5) | | | 0 | % | | | 70 | % | | | 83 | % | | | 0 | %(5) | | | 116 | % | | | 38 | % |
| (1) | For the one month period ended October 31, 2009. Effective October 31, 2009, the Fund changed its fiscal year end to October 31st from September 30th. |
| (2) | The financial highlights set forth for periods prior to March 20, 2009 represent the historical financial highlights of the Tamarack Large Cap Growth Fund, Class S shares. The assets of the Tamarack Large Cap Growth Fund were acquired by the Hennessy Cornerstone Large Growth Fund on March 20, 2009. At the time, RBC Global Asset Management (U.S.), Inc. (formerly known as Voyageur Asset Management Inc.) ceased to be investment advisor and Hennessy Advisors, Inc. became investment advisor. The return of the Tamarack Large Cap Growth Fund, Class S shares during the period October 1, 2008 through March 20, 2009 was (33.30)%. The return of the Hennessy Cornerstone Large Growth Fund, Original Class shares during the period March 20, 2009 through September 30, 2009 was 42.64%. |
| (3) | Amount is less than $0.01 or ($0.01) per share. |
| (4) | Per share net investment income (loss) has been calculated using the average daily shares method. |
| (5) | Not Annualized. |
| (6) | Annualized. |
| (7) | Portfolio turnover is calculated on the basis of the Fund as a whole. |
The accompanying notes are an integral part of these financial statements.
Financial Highlights
| Hennessy Cornerstone Large Growth Fund |
For an Institutional Class share outstanding throughout each period
| | | Six Months | | | | | | | | | | | | | | | | |
| | | Ended | | | | | | | | | | | | One Month | | | Period | |
| | | April 30, | | | | | | | | | | | | Ended | | | Ended | |
| | | 2013 | | | Year Ended October 31, | | | October 31, | | | September 30, | |
| | | (Unaudited) | | | 2012 | | | 2011 | | | 2010 | | | 2009(1) | | | 2009 | |
| PER SHARE DATA: | | | | | | | | | | | | | | | | | | |
| Net asset value, beginning of period | | $ | 10.85 | | | $ | 12.44 | | | $ | 11.76 | | | $ | 9.51 | | | $ | 9.61 | | | $ | 6.73 | |
| | | | | | | | | | | | | | | | | | | | | | | | | |
| Income from investment operations: | | | | | | | | | | | | | | | | | | | | | | | | |
| Net investment income | | | 0.02 | | | | 0.07 | | | | 0.08 | | | | 0.10 | | | | — | (3) | | | 0.03 | |
| Net realized and unrealized gains (losses) on securities | | | 1.24 | | | | 0.89 | | | | 0.74 | | | | 2.20 | | | | (0.10 | ) | | | 2.85 | |
| Total from investment operations | | | 1.26 | | | | 0.96 | | | | 0.82 | | | | 2.30 | | | | (0.10 | ) | | | 2.88 | |
| | | | | | | | | | | | | | | | | | | | | | | | | |
| Less Distributions: | | | | | | | | | | | | | | | | | | | | | | | | |
| Dividends from net investment income | | | (0.11 | ) | | | (0.09 | ) | | | (0.12 | ) | | | (0.05 | ) | | | — | | | | — | |
| Dividends from net realized gains | | | (0.02 | ) | | | (2.46 | ) | | | (0.02 | ) | | | — | | | | — | | | | — | |
| Total distributions | | | (0.13 | ) | | | (2.55 | ) | | | (0.14 | ) | | | (0.05 | ) | | | — | | | | — | |
| Net asset value, end of period | | $ | 11.98 | | | $ | 10.85 | | | $ | 12.44 | | | $ | 11.76 | | | $ | 9.51 | | | $ | 9.61 | |
| | | | | | | | | | | | | | | | | | | | | | | | | |
| TOTAL RETURN | | | 11.77 | %(4) | | | 9.43 | % | | | 6.99 | % | | | 24.26 | % | | | (1.04 | )%(4) | | | 42.79 | %(4) |
| | | | | | | | | | | | | | | | | | | | | | | | | |
| SUPPLEMENTAL DATA AND RATIOS: | | | | | | | | | | | | | | | | | | | | | | | | |
| Net assets, end of period (millions) | | $ | 15.89 | | | $ | 33.94 | | | $ | 0.14 | | | $ | 0.07 | | | $ | 0.04 | | | $ | 0.04 | |
| Ratio of expenses to average net assets: | | | | | | | | | | | | | | | | | | | | | | | | |
| Before expense reimbursement | | | 1.09 | %(5) | | | 1.41 | % | | | 1.14 | % | | | 1.16 | % | | | 1.14 | %(5) | | | 16.51 | %(5) |
| After expense reimbursement | | | 0.98 | %(5) | | | 0.98 | % | | | 0.98 | % | | | 0.98 | % | | | 0.98 | %(5) | | | 0.98 | %(5) |
| Ratio of net investment income to average net assets: | | | | | | | | | | | | | | | | | | | | | | | | |
| Before expense reimbursement | | | 1.62 | %(5) | | | 6.44 | % | | | 0.81 | % | | | 0.90 | % | | | 0.12 | %(5) | | | (14.54 | )%(5) |
| After expense reimbursement | | | 1.73 | %(5) | | | 6.87 | % | | | 0.97 | % | | | 1.08 | % | | | 0.28 | %(5) | | | 0.99 | %(5) |
Portfolio turnover rate(6) | | | 72 | %(4) | | | 0 | % | | | 70 | % | | | 83 | % | | | 0 | %(4) | | | 116 | %(4) |
| (1) | For the one month period ended October 31, 2009. Effective October 31, 2009, the Fund changed its fiscal year end to October 31st from September 30th. |
| (2) | Institutional Class shares commenced operations on March 20, 2009. |
| (3) | Amount is less than $0.01 or ($0.01) per share. |
| (4) | Not Annualized. |
| (5) | Annualized. |
| (6) | Portfolio turnover is calculated on the basis of the Fund as a whole. |
The accompanying notes are an integral part of these financial statements.
HENNESSY FUNDS 1-800-966-4354
Financial Highlights
| Hennessy Cornerstone Value Fund |
For an Investor Class share outstanding throughout each period
| | | Six Months | | | | | | | | | | | | | | | | |
| | | Ended | | | | | | | | | | | | | | | | |
| | | April 30, | | | | | | | | | | | | | | | | |
| | | 2013 | | | Year Ended October 31, | |
| | | (Unaudited) | | | 2012 | | | 2011 | | | 2010 | | | 2009 | | | 2008 | |
| PER SHARE DATA: | | | | | | | | | | | | | | | | | | |
| Net asset value, beginning of period | | $ | 14.02 | | | $ | 12.84 | | | $ | 12.53 | | | $ | 10.63 | | | $ | 9.05 | | | $ | 17.06 | |
| | | | | | | | | | | | | | | | | | | | | | | | | |
| Income from investment operations: | | | | | | | | | | | | | | | | | | | | | | | | |
| Net investment income | | | 0.21 | | | | 0.37 | | | | 0.45 | | | | 0.29 | | | | 0.24 | | | | 0.55 | |
| Net realized and unrealized gains (losses) on investments | | | 1.74 | | | | 1.23 | | | | 0.23 | | | | 1.81 | | | | 1.87 | | | | (8.15 | ) |
| Total from investment operations | | | 1.95 | | | | 1.60 | | | | 0.68 | | | | 2.10 | | | | 2.11 | | | | (7.60 | ) |
| | | | | | | | | | | | | | | | | | | | | | | | | |
| Less Distributions: | | | | | | | | | | | | | | | | | | | | | | | | |
| Dividends from net investment income | | | (0.38 | ) | | | (0.42 | ) | | | (0.37 | ) | | | (0.20 | ) | | | (0.53 | ) | | | (0.41 | ) |
| Dividends from net realized gains | | | — | | | | — | | | | — | | | | — | | | | — | | | | — | |
| Total distributions | | | (0.38 | ) | | | (0.42 | ) | | | (0.37 | ) | | | (0.20 | ) | | | (0.53 | ) | | | (0.41 | ) |
| Net asset value, end of period | | $ | 15.59 | | | $ | 14.02 | | | $ | 12.84 | | | $ | 12.53 | | | $ | 10.63 | | | $ | 9.05 | |
| | | | | | | | | | | | | | | | | | | | | | | | | |
| TOTAL RETURN | | | 14.24 | %(1) | | | 12.79 | % | | | 5.58 | % | | | 19.98 | % | | | 25.51 | % | | | (45.50 | )% |
| | | | | | | | | | | | | | | | | | | | | | | | | |
| SUPPLEMENTAL DATA AND RATIOS: | | | | | | | | | | | | | | | | | | | | | | | | |
| Net assets, end of period (millions) | | $ | 135.10 | | | $ | 124.99 | | | $ | 116.41 | | | $ | 155.87 | | | $ | 145.91 | | | $ | 97.10 | |
| Ratio of expenses to average net assets | | | 1.23 | %(2) | | | 1.26 | % | | | 1.31 | % | | | 1.29 | % | | | 1.27 | % | | | 1.20 | % |
| Ratio of net investment income to average net assets | | | 2.72 | %(2) | | | 2.67 | % | | | 2.94 | % | | | 2.33 | % | | | 3.19 | % | | | 3.92 | % |
Portfolio turnover rate(3) | | | 42 | %(1) | | | 47 | % | | | 40 | % | | | 91 | % | | | 59 | % | | | 53 | % |
| (1) | Not Annualized. |
| (2) | Annualized. |
| (3) | Portfolio turnover is calculated on the basis of the Fund as a whole. |
The accompanying notes are an integral part of these financial statements.
Financial Highlights
| Hennessy Cornerstone Value Fund |
For an Institutional Class share outstanding throughout each period
| | | Six Months | | | | | | | | | | | | | | | | |
| | | Ended | | | | | | | | | | | | | | | Period | |
| | | April 30, | | | | | | | | | | | | | | | Ended | |
| | | 2013 | | | Year Ended October 31, | | | October 31, | |
| | | (Unaudited) | | | 2012 | | | 2011 | | | 2010 | | | 2009 | | | 2008(1) | |
| PER SHARE DATA: | | | | | | | | | | | | | | | | | | |
| Net asset value, beginning of period | | $ | 14.04 | | | $ | 12.86 | | | $ | 12.54 | | | $ | 10.63 | | | $ | 9.06 | | | $ | 13.79 | |
| | | | | | | | | | | | | | | | | | | | | | | | | |
| Income from investment operations: | | | | | | | | | | | | | | | | | | | | | | | | |
| Net investment income | | | 0.28 | | | | 0.45 | | | | 0.36 | | | | 0.30 | | | | 0.30 | | | | 0.34 | |
| Net realized and unrealized gains (losses) on investments | | | 1.69 | | | | 1.19 | | | | 0.37 | | | | 1.83 | | | | 1.83 | | | | (5.07 | ) |
| Total from investment operations | | | 1.97 | | | | 1.64 | | | | 0.73 | | | | 2.13 | | | | 2.13 | | | | (4.73 | ) |
| | | | | | | | | | | | | | | | | | | | | | | | | |
| Less Distributions: | | | | | | | | | | | | | | | | | | | | | | | | |
| Dividends from net investment income | | | (0.42 | ) | | | (0.46 | ) | | | (0.41 | ) | | | (0.22 | ) | | | (0.56 | ) | | | — | |
| Dividends from net realized gains | | | — | | | | — | | | | — | | | | — | | | | — | | | | — | |
| Total distributions | | | (0.42 | ) | | | (0.46 | ) | | | (0.41 | ) | | | (0.22 | ) | | | (0.56 | ) | | | — | |
| Net asset value, end of period | | $ | 15.59 | | | $ | 14.04 | | | $ | 12.86 | | | $ | 12.54 | | | $ | 10.63 | | | $ | 9.06 | |
| | | | | | | | | | | | | | | | | | | | | | | | | |
| TOTAL RETURN | | | 14.38 | %(2) | | | 13.13 | % | | | 6.00 | % | | | 20.31 | % | | | 25.87 | % | | | (34.30 | )%(2) |
| | | | | | | | | | | | | | | | | | | | | | | | | |
| SUPPLEMENTAL DATA AND RATIOS: | | | | | | | | | | | | | | | | | | | | | | | | |
| Net assets, end of period (millions) | | $ | 4.15 | | | $ | 2.53 | | | $ | 1.17 | | | $ | 1.35 | | | $ | 1.11 | | | $ | 0.87 | |
| Ratio of expenses to average net assets: | | | | | | | | | | | | | | | | | | | | | | | | |
| Before expense reimbursement | | | 1.09 | %(3) | | | 1.20 | % | | | 1.14 | % | | | 1.10 | % | | | 1.13 | % | | | 1.14 | %(3) |
| After expense reimbursement | | | 0.98 | %(3) | | | 0.98 | % | | | 0.98 | % | | | 0.98 | % | | | 0.98 | % | | | 0.98 | %(3) |
| Ratio of net investment income to average net assets: | | | | | | | | | | | | | | | | | | | | | | | | |
| Before expense reimbursement | | | 2.72 | %(3) | | | 2.72 | % | | | 3.04 | % | | | 2.52 | % | | | 3.33 | % | | | 4.94 | %(3) |
| After expense reimbursement | | | 2.83 | %(3) | | | 2.94 | % | | | 3.20 | % | | | 2.64 | % | | | 3.48 | % | | | 5.10 | %(3) |
Portfolio turnover rate(4) | | | 42 | %(2) | | | 47 | % | | | 40 | % | | | 91 | % | | | 59 | % | | | 53 | %(2) |
| (1) | Institutional Class shares commenced operations on March 3, 2008. |
| (2) | Not Annualized. |
| (3) | Annualized. |
| (4) | Portfolio turnover is calculated on the basis of the Fund as a whole. |
The accompanying notes are an integral part of these financial statements.
HENNESSY FUNDS 1-800-966-4354
Financial Highlights
| Hennessy Large Value Fund |
For an Investor Class share outstanding throughout each period
| | | Six Months | | | | | | | | | | | | | | | | | | | |
| | | Ended | | | | | | | | | | | | One Month | | | | | | | |
| | | April 30, | | | | | | | | | | | | Ended | | | Year Ended | |
| | | 2013 | | | Year Ended October 31, | | | October 31, | | | September 30, | |
| | | (Unaudited) | | | 2012 | | | 2011 | | | 2010 | | | 2009(1) | | | 2009(2) | | | 2008(2) | |
| PER SHARE DATA: | | | | | | | | | | | | | | | | | | | | | |
| Net asset value, beginning of period | | $ | 24.71 | | | $ | 21.47 | | | $ | 20.57 | | | $ | 18.88 | | | $ | 19.49 | | | $ | 21.80 | | | $ | 43.12 | |
| | | | | | | | | | | | | | | | | | | | | | | | | | | | | |
| Income from investment operations: | | | | | | | | | | | | | | | | | | | | | | | | | | | | |
| Net investment income (loss) | | | 0.14 | | | | 0.28 | | | | 0.22 | | | | 0.14 | | | | 0.01 | | | | 0.31 | | | | 0.42 | (3) |
Net realized and unrealized gains (losses) on securities | | | 3.61 | | | | 3.14 | | | | 0.89 | | | | 1.78 | | | | (0.62 | ) | | | (2.21 | ) | | | (7.43 | ) |
| Total from investment operations | | | 3.75 | | | | 3.42 | | | | 1.11 | | | | 1.92 | | | | (0.61 | ) | | | (1.90 | ) | | | (7.01 | ) |
| | | | | | | | | | | | | | | | | | | | | | | | | | | | | |
| Less Distributions: | | | | | | | | | | | | | | | | | | | | | | | | | | | | |
| Dividends from net investment income | | | (0.29 | ) | | | (0.18 | ) | | | (0.21 | ) | | | (0.23 | ) | | | — | | | | (0.41 | ) | | | (0.78 | ) |
| Dividends from net realized gains | | | — | | | | — | | | | — | | | | — | | | | — | | | | — | | | | (13.53 | ) |
| Total distributions | | | (0.29 | ) | | | (0.18 | ) | | | (0.21 | ) | | | (0.23 | ) | | | — | | | | (0.41 | ) | | | (14.31 | ) |
| Net asset value, end of period | | $ | 28.17 | | | $ | 24.71 | | | $ | 21.47 | | | $ | 20.57 | | | $ | 18.88 | | | $ | 19.49 | | | $ | 21.80 | |
| | | | | | | | | | | | | | | | | | | | | | | | | | | | | |
| TOTAL RETURN | | | 15.28 | %(5) | | | 16.07 | % | | | 5.36 | % | | | 10.22 | % | | | (3.13 | )%(5) | | | (8.43 | )% | | | (22.42 | )% |
| | | | | | | | | | | | | | | | | | | | | | | | | | | | | |
| SUPPLEMENTAL DATA AND RATIOS: | | | | | | | | | | | | | | | | | | | | | | | | | | | | |
| Net assets, end of period (millions) | | $ | 137.64 | | | $ | 125.00 | | | $ | 123.97 | | | $ | 131.54 | | | $ | 132.77 | | | $ | 138.34 | | | $ | 174.23 | |
| Ratio of expenses to average net assets: | | | | | | | | | | | | | | | | | | | | | | | | | | | | |
| Before expense reimbursement | | | 1.34 | %(6) | | | 1.40 | % | | | 1.38 | % | | | 1.41 | % | | | 1.37 | %(6) | | | 1.42 | % | | | 1.22 | % |
| After expense reimbursement | | | 1.34 | %(6) | | | 1.40 | % | | | 1.38 | % | | | 1.38 | % | | | 1.30 | %(6) | | | 1.17 | % | | | 1.02 | % |
Ratio of net investment income to average net assets: | | | | | | | | | | | | | | | | | | | | | | | | | | | | |
| Before expense reimbursement | | | 1.06 | %(6) | | | 1.16 | % | | | 0.97 | % | | | 0.64 | % | | | 0.28 | %(6) | | | 1.46 | % | | | 1.32 | % |
| After expense reimbursement | | | 1.06 | %(6) | | | 1.16 | % | | | 0.97 | % | | | 0.67 | % | | | 0.35 | %(6) | | | 1.71 | % | | | 1.52 | % |
Portfolio turnover rate(4) | | | 50 | %(5) | | | 111 | % | | | 149 | % | | | 146 | % | | | 10 | %(5) | | | 142 | % | | | 162 | % |
| (1) | For the one month ended October 31, 2009. Effective October 31, 2009, the Fund changed its fiscal year end to October 31st from September 30th. |
| (2) | The financial highlights set forth for periods prior to March 20, 2009 represent the historical financial highlights of the Tamarack Value Fund, Class S shares. The assets of the Tamarack Value Fund were acquired by the Hennessy Large Value Fund on March 20, 2009 (formerly known as the Hennessy Select Large Value Fund). Prior to the reorganization, Tamarack Value Fund also offered Class A, Class C and R shares. At that time, RBC Global Asset Management (U.S.), Inc., (formerly known as Voyageur Asset Management Inc.) ceased to be investment advisor and Hennessy Advisors, Inc. became investment advisor. The return of the Tamarack Value Fund, Class S shares during the period October 1, 2008 through March 20, 2009 was (33.09)%. The return of the Hennessy Large Value Fund, Original Class shares during the period March 20, 2009 through September 30, 2009 was 36.84%. |
| (3) | Per share net investment income (loss) has been calculated using the average daily shares method. |
| (4) | Portfolio turnover is calculated on the basis of the Fund as a whole. |
| (5) | Not Annualized. |
| (6) | Annualized. |
The accompanying notes are an integral part of these financial statements.
Financial Highlights
| Hennessy Large Value Fund |
For an Institutional Class share outstanding throughout each period
| | | Six Months | | | | | | | | | | | | | | | | |
| | | Ended | | | | | | | | | | | | One Month | | | Period | |
| | | April 30, | | | | | | | | | | | | Ended | | | Ended | |
| | | 2013 | | | Year Ended October 31, | | | October 31, | | | September 30, | |
| | | (Unaudited) | | | 2012 | | | 2011 | | | 2010 | | | 2009(1) | | | 2009(2) | |
| PER SHARE DATA: | | | | | | | | | | | | | | | | | | |
| Net asset value, beginning of period | | $ | 24.83 | | | $ | 21.56 | | | $ | 20.65 | | | $ | 18.92 | | | $ | 19.53 | | | $ | 14.25 | |
| | | | | | | | | | | | | | | | | | | | | | | | | |
| Income from investment operations: | | | | | | | | | | | | | | | | | | | | | | | | |
| Net investment income (loss) | | | 0.28 | | | | 0.39 | | | | 0.27 | | | | 0.21 | | | | — | (3) | | | 0.08 | |
| Net realized and unrealized gains (losses) on securities | | | 3.52 | | | | 3.15 | | | | 0.92 | | | | 1.80 | | | | (0.61 | ) | | | 5.20 | |
| Total from investment operations | | | 3.80 | | | | 3.54 | | | | 1.19 | | | | 2.01 | | | | (0.61 | ) | | | 5.28 | |
| | | | | | | | | | | | | | | | | | | | | | | | | |
| Less Distributions: | | | | | | | | | | | | | | | | | | | | | | | | |
| Dividends from net investment income | | | (0.39 | ) | | | (0.27 | ) | | | (0.28 | ) | | | (0.28 | ) | | | — | | | | — | |
| Dividends from net realized gains | | | — | | | | — | | | | — | | | | — | | | | — | | | | — | |
| Total distributions | | | (0.39 | ) | | | (0.27 | ) | | | (0.28 | ) | | | (0.28 | ) | | | — | | | | — | |
| Net asset value, end of period | | $ | 28.24 | | | $ | 24.83 | | | $ | 21.56 | | | $ | 20.65 | | | $ | 18.92 | | | $ | 19.53 | |
| | | | | | | | | | | | | | | | | | | | | | | | | |
| TOTAL RETURN | | | 15.49 | %(4) | | | 16.58 | % | | | 5.76 | % | | | 10.65 | % | | | (3.12 | )%(4) | | | 37.05 | %(4) |
| | | | | | | | | | | | | | | | | | | | | | | | | |
| SUPPLEMENTAL DATA AND RATIOS: | | | | | | | | | | | | | | | | | | | | | | | | |
| Net assets, end of period (millions) | | $ | 0.49 | | | $ | 0.06 | | | $ | 0.04 | | | $ | 0.04 | | | $ | 0.03 | | | $ | 0.03 | |
| Ratio of expenses to average net assets: | | | | | | | | | | | | | | | | | | | | | | | | |
| Before expense reimbursement | | | 1.16 | %(5) | | | 1.22 | % | | | 1.21 | % | | | 1.22 | % | | | 1.20 | %(5) | | | 26.18 | %(5) |
| After expense reimbursement | | | 0.98 | %(5) | | | 0.98 | % | | | 0.98 | % | | | 0.98 | % | | | 0.98 | %(5) | | | 0.98 | %(5) |
| Ratio of net investment income to average net assets: | | | | | | | | | | | | | | | | | | | | | | | | |
| Before expense reimbursement | | | 0.83 | %(5) | | | 1.29 | % | | | 1.13 | % | | | 0.80 | % | | | 0.44 | %(5) | | | (24.06 | )%(5) |
| After expense reimbursement | | | 1.01 | %(5) | | | 1.53 | % | | | 1.36 | % | | | 1.04 | % | | | 0.66 | %(5) | | | 1.14 | %(5) |
Portfolio turnover rate(6) | | | 50 | %(4) | | | 111 | % | | | 149 | % | | | 146 | % | | | 10 | %(4) | | | 142 | %(4) |
| (1) | For the one month ended October 31, 2009. Effective October 31, 2009, the Fund changed its fiscal year end to October 31st from September 30th. |
| (2) | Institutional Class shares commenced operations on March 20, 2009. |
| (3) | Amount is less than $0.01 or $(0.01). |
| (4) | Not Annualized. |
| (5) | Annualized. |
| (6) | Portfolio turnover is calculated on the basis of the Fund as a whole. |
The accompanying notes are an integral part of these financial statements.
HENNESSY FUNDS 1-800-966-4354
Financial Highlights
| Hennessy Total Return Fund |
For an Investor Class share outstanding throughout each period
| | | Six Months | | | | | | | | | | | | | | | | |
| | | Ended | | | | | | | | | | | | | | | | |
| | | April 30, | | | | | | | | | | | | | | | | |
| | | 2013 | | | Year Ended October 31, | |
| | | (Unaudited) | | | 2012 | | | 2011 | | | 2010 | | | 2009 | | | 2008 | |
| PER SHARE DATA: | | | | | | | | | | | | | | | | | | |
| Net asset value, beginning of period | | $ | 12.64 | | | $ | 11.47 | | | $ | 10.57 | | | $ | 9.10 | | | $ | 9.22 | | | $ | 13.73 | |
| | | | | | | | | | | | | | | | | | | | | | | | | |
| Income from investment operations: | | | | | | | | | | | | | | | | | | | | | | | | |
| Net investment income | | | 0.08 | | | | 0.18 | | | | 0.18 | | | | 0.16 | | | | 0.18 | | | | 0.28 | |
| Net realized and unrealized gains (losses) on securities | | | 1.34 | | | | 1.17 | | | | 0.89 | | | | 1.48 | | | | (0.14 | ) | | | (4.49 | ) |
| Total from investment operations | | | 1.42 | | | | 1.35 | | | | 1.07 | | | | 1.64 | | | | 0.04 | | | | (4.21 | ) |
| | | | | | | | | | | | | | | | | | | | | | | | | |
| Less Distributions: | | | | | | | | | | | | | | | | | | | | | | | | |
| Dividends from net investment income | | | (0.08 | ) | | | (0.18 | ) | | | (0.17 | ) | | | (0.17 | ) | | | (0.16 | ) | | | (0.30 | ) |
| Dividends from realized capital gains | | | — | | | | — | | | | — | | | | — | | | | — | | | | — | |
| Total distributions | | | (0.08 | ) | | | (0.18 | ) | | | (0.17 | ) | | | (0.17 | ) | | | (0.16 | ) | | | (0.30 | ) |
| Net asset value, end of period | | $ | 13.98 | | | $ | 12.64 | | | $ | 11.47 | | | $ | 10.57 | | | $ | 9.10 | | | $ | 9.22 | |
| | | | | | | | | | | | | | | | | | | | | | | | | |
| TOTAL RETURN | | | 11.31 | %(1) | | | 11.78 | % | | | 10.22 | % | | | 18.09 | % | | | 0.69 | % | | | (30.97 | )% |
| | | | | | | | | | | | | | | | | | | | | | | | | |
| SUPPLEMENTAL DATA AND RATIOS: | | | | | | | | | | | | | | | | | | | | | | | | |
| Net assets, end of period (millions) | | $ | 81.96 | | | $ | 77.67 | | | $ | 64.13 | | | $ | 69.08 | | | $ | 52.38 | | | $ | 58.22 | |
Gross ratio of expenses, including interest expense, to average net assets | | | 1.39 | %(2) | | | 1.37 | % | | | 1.34 | % | | | 1.33 | % | | | 1.56 | % | | | 2.36 | % |
| Ratio of interest expense to average net assets | | | 0.11 | %(2) | | | 0.08 | % | | | 0.10 | % | | | 0.08 | % | | | 0.29 | % | | | 1.16 | % |
Net ratio of expenses, excluding interest expense, to average net assets | | | 1.28 | %(2) | | | 1.29 | % | | | 1.24 | % | | | 1.25 | % | | | 1.27 | % | | | 1.20 | % |
| Ratio of net investment income to average net assets | | | 1.28 | %(2) | | | 1.44 | % | | | 1.56 | % | | | 1.62 | % | | | 2.12 | % | | | 2.43 | % |
| Portfolio turnover rate | | | 12 | %(1) | | | 22 | % | | | 21 | % | | | 41 | % | | | 41 | % | | | 16 | % |
| (1) | Not Annualized. |
| (2) | Annualized. |
The accompanying notes are an integral part of these financial statements.
(This Page Intentionally Left Blank.)
HENNESSY FUNDS 1-800-966-4354
Financial Highlights
| Hennessy Equity and Income Fund |
For an Investor Class share outstanding throughout each period
| | | | | | | | | | | | For the | | | | | | | | | | |
| | | Six Months | | | | | | | | | Period | | | | | | | | | | |
| | | Ended | | | | | | | | | April 1, | | | | | | | | | | |
| | | April 30, | | | For the Year Ended | | | 2010 to | | | | | | | | | | |
| | | 2013 | | | October 31, | | | October 31, | | | Year Ended March 31, | |
| | | (Unaudited) | | | 2012 | | | 2011 | | | 2010(1) | | | 2010 | | | 2009 | | | 2008 | |
| PER SHARE DATA: | | | | | | | | | | | | | | | | | | | | | |
| Net asset value, beginning of period | | $ | 13.96 | | | $ | 12.99 | | | $ | 11.93 | | | $ | 11.52 | | | $ | 8.92 | | | $ | 12.27 | | | $ | 14.48 | |
| | | | | | | | | | | | | | | | | | | | | | | | | | | | | |
| Income from investment operations: | | | | | | | | | | | | | | | | | | | | | | | | | | | | |
| Net investment income | | | 0.15 | | | | 0.18 | | | | 0.29 | (2) | | | 0.17 | (2) | | | 0.29 | (2) | | | 0.32 | (2) | | | 0.39 | (2) |
Net realized and unrealized gains (losses) on securities | | | 1.21 | | | | 0.99 | | | | 1.04 | | | | 0.40 | | | | 2.61 | | | | (3.23 | ) | | | 0.34 | |
| Total from investment operations | | | 1.36 | | | | 1.17 | | | | 1.33 | | | | 0.57 | | | | 2.90 | | | | (2.91 | ) | | | 0.73 | |
| | | | | | | | | | | | | | | | | | | | | | | | | | | | | |
| Less Distributions: | | | | | | | | | | | | | | | | | | | | | | | | | | | | |
| Dividends from net investment income | | | (0.13 | ) | | | (0.20 | ) | | | (0.27 | ) | | | (0.16 | ) | | | (0.30 | ) | | | (0.25 | ) | | | (0.37 | ) |
| Dividends from realized capital gains | | | — | | | | 0.00 | | | | — | | | | — | | | | — | | | | (0.17 | ) | | | (2.57 | ) |
| Return of capital | | | — | | | | — | | | | — | | | | — | | | | — | | | | (0.03 | ) | | | — | |
| Total distributions | | | (0.13 | ) | | | (0.20 | ) | | | (0.27 | ) | | | (0.16 | ) | | | (0.30 | ) | | | (0.45 | ) | | | (2.94 | ) |
| Paid-in capital from redemption fees | | | — | | | | 0.00 | (3) | | | 0.00 | (3) | | | 0.00 | (3) | | | 0.00 | (3) | | | 0.01 | | | | — | |
| Net asset value, end of period | | $ | 15.19 | | | $ | 13.96 | | | $ | 12.99 | | | $ | 11.93 | | | $ | 11.52 | | | $ | 8.92 | | | $ | 12.27 | |
| | | | | | | | | | | | | | | | | | | | | | | | | | | | | |
| TOTAL RETURN | | | 9.81 | %(4) | | | 9.01 | % | | | 11.30 | % | | | 5.04 | %(4) | | | 32.76 | % | | | (24.28 | )% | | | 4.45 | % |
| | | | | | | | | | | | | | | | | | | | | | | | | | | | | |
| SUPPLEMENTAL DATA AND RATIOS: | | | | | | | | | | | | | | | | | | | | | | | | | | | | |
| Net assets, end of period (millions) | | $ | 203.04 | | | $ | 196.92 | | | $ | 56.75 | | | $ | 41.50 | | | $ | 46.81 | | | $ | 18.86 | | | $ | 21.70 | |
| Ratio of expenses to average net assets: | | | | | | | | | | | | | | | | | | | | | | | | | | | | |
| Before expense reimbursement | | | 1.34 | %(5) | | | 1.33 | % | | | 1.54 | % | | | 1.60 | %(5) | | | 1.69 | % | | | 1.84 | % | | | 1.66 | % |
| After expense reimbursement | | | 1.34 | %(5) | | | 1.24 | % | | | 1.24 | % | | | 1.24 | %(5) | | | 1.25 | % | | | 1.32 | % | | | 1.33 | % |
Ratio of net investment income to average net assets: | | | | | | | | | | | | | | | | | | | | | | | | | | | | |
| Before expense reimbursement | | | 2.13 | %(5) | | | 1.37 | % | | | 2.03 | % | | | 2.21 | %(5) | | | 2.26 | % | | | 2.50 | % | | | 2.42 | % |
| After expense reimbursement | | | 2.13 | %(5) | | | 1.46 | % | | | 2.33 | % | | | 2.56 | %(5) | | | 2.70 | % | | | 3.03 | % | | | 2.75 | % |
Portfolio turnover rate(6) | | | 25 | %(4) | | | 34 | % | | | 35 | % | | | 27 | %(4) | | | 26 | % | | | 32 | % | | | 110 | % |
| (1) | For the seven-month period ended October 31, 2010. Effective October 31, 2010, the Fund changed its fiscal year end from March 31 to October 31. |
| (2) | Calculated based on average shares outstanding method. |
| (3) | Amount is less than $0.01. |
| (4) | Not Annualized. |
| (5) | Annualized. |
| (6) | Portfolio turnover is calculated on the basis of the Fund as a whole. |
The accompanying notes are an integral part of these financial statements.
Financial Highlights
| Hennessy Equity and Income Fund |
For an Institutional Class share outstanding throughout each period
| | | | | | | | | | | | For the | | | | | | | | | | |
| | | Six Months | | | | | | | | | Period | | | | | | | | | | |
| | | Ended | | | | | | | | | April 1, | | | | | | | | | | |
| | | April 30, | | | For the Year Ended | | | 2010 to | | | | | | | | | | |
| | | 2013 | | | October 31, | | | October 31, | | | Year Ended March 31, | |
| | | (Unaudited) | | | 2012 | | | 2011 | | | 2010(1) | | | 2010 | | | 2009 | | | 2008 | |
| PER SHARE DATA: | | | | | | | | | | | | | | | | | | | | | |
| Net asset value, beginning of period | | $ | 13.29 | | | $ | 12.38 | | | $ | 11.38 | | | $ | 10.99 | | | $ | 8.52 | | | $ | 11.75 | | | $ | 13.98 | |
| | | | | | | | | | | | | | | | | | | | | | | | | | | | | |
| Income from investment operations: | | | | | | | | | | | | | | | | | | | | | | | | | | | | |
| Net investment income (loss) | | | 0.16 | | | | 0.22 | | | | 0.32 | (2) | | | 0.18 | (2) | | | 0.30 | (2) | | | 0.33 | (2) | | | 0.42 | (2) |
Net realized and unrealized gains (losses) on investments | | | 1.15 | | | | 0.92 | | | | 0.99 | | | | 0.38 | | | | 2.50 | | | | (3.10 | ) | | | 0.33 | |
| Total from investment operations | | | 1.31 | | | | 1.14 | | | | 1.31 | | | | 0.56 | | | | 2.80 | | | | (2.77 | ) | | | 0.75 | |
| | | | | | | | | | | | | | | | | | | | | | | | | | | | | |
| Less Distributions: | | | | | | | | | | | | | | | | | | | | | | | | | | | | |
| Dividends from net investment income | | | (0.17 | ) | | | (0.23 | ) | | | (0.31 | ) | | | (0.17 | ) | | | (0.33 | ) | | | (0.26 | ) | | | (0.41 | ) |
| Dividends from net realized gains | | | — | | | | — | | | | — | | | | — | | | | — | | | | (0.17 | ) | | | (2.57 | ) |
| Return of Capital | | | — | | | | — | | | | — | | | | — | | | | — | | | | (0.04 | ) | | | — | |
| Total distributions | | | (0.17 | ) | | | (0.23 | ) | | | (0.31 | ) | | | (0.17 | ) | | | (0.33 | ) | | | (0.47 | ) | | | (2.98 | ) |
| Paid-in capital from redemption fees | | | — | | | | 0.00 | (3) | | | 0.00 | (3) | | | 0.00 | (3) | | | 0.00 | (3) | | | 0.01 | | | | — | |
| Net asset value, end of period | | $ | 14.43 | | | $ | 13.29 | | | $ | 12.38 | | | $ | 11.38 | | | $ | 10.99 | | | $ | 8.52 | | | $ | 11.75 | |
| | | | | | | | | | | | | | | | | | | | | | | | | | | | | |
| TOTAL RETURN | | | 9.98 | %(4) | | | 9.23 | % | | | 11.62 | % | | | 5.19 | %(4) | | | 33.10 | % | | | (24.13 | )% | | | 4.75 | % |
| | | | | | | | | | | | | | | | | | | | | | | | | | | | | |
| SUPPLEMENTAL DATA AND RATIOS: | | | | | | | | | | | | | | | | | | | | | | | | | | | | |
| Net assets, end of period (millions) | | $ | 77.26 | | | $ | 108.49 | | | $ | 55.28 | | | $ | 42.17 | | | $ | 39.40 | | | $ | 31.13 | | | $ | 41.21 | |
| Ratio of expenses to average net assets: | | | | | | | | | | | | | | | | | | | | | | | | | | | | |
| Before expense reimbursement | | | 1.03 | %(5) | | | 1.06 | % | | | 1.12 | % | | | 1.20 | %(5) | | | 1.43 | % | | | 1.58 | % | | | 1.41 | % |
| After expense reimbursement | | | 1.03 | %(5) | | | 0.99 | % | | | 0.99 | % | | | 0.99 | %(5) | | | 0.99 | % | | | 1.07 | % | | | 1.08 | % |
Ratio of net investment income to average net assets: | | | | | | | | | | | | | | | | | | | | | | | | | | | | |
| Before expense reimbursement | | | 2.55 | %(5) | | | 1.68 | % | | | 2.56 | % | | | 2.60 | %(5) | | | 2.57 | % | | | 2.73 | % | | | 2.67 | % |
| After expense reimbursement | | | 2.55 | %(5) | | | 1.75 | % | | | 2.69 | % | | | 2.82 | %(5) | | | 3.01 | % | | | 3.24 | % | | | 3.00 | % |
Portfolio turnover rate(6) | | | 25 | %(4) | | | 34 | % | | | 35 | % | | | 27 | %(4) | | | 26 | % | | | 32 | % | | | 110 | % |
| (1) | For the seven-month period ended October 31, 2010. Effective October 31, 2010, the Fund changed its fiscal year end from March 31 to October 31. |
| (2) | Calculated based on average shares outstanding method. |
| (3) | Amount is less than $0.01. |
| (4) | Not Annualized. |
| (5) | Annualized. |
| (6) | Portfolio turnover is calculated on the basis of the Fund as a whole. |
The accompanying notes are an integral part of these financial statements.
HENNESSY FUNDS 1-800-966-4354
Financial Highlights
For an Investor Class share outstanding throughout each period
| | | Six Months | | | | | | | | | | | | | | | | |
| | | Ended | | | | | | | | | | | | | | | | |
| | | April 30, | | | | | | | | | | | | | | | | |
| | | 2013 | | | Year Ended October 31, | |
| | | (Unaudited) | | | 2012 | | | 2011 | | | 2010 | | | 2009 | | | 2008 | |
| PER SHARE DATA: | | | | | | | | | | | | | | | | | | |
| Net asset value, beginning of period | | $ | 11.88 | | | $ | 11.13 | | | $ | 10.43 | | | $ | 9.48 | | | $ | 9.11 | | | $ | 12.51 | |
| | | | | | | | | | | | | | | | | | | | | | | | | |
| Income from investment operations: | | | | | | | | | | | | | | | | | | | | | | | | |
| Net investment income | | | 0.01 | | | | 0.04 | | | | 0.05 | | | | 0.05 | | | | 0.10 | | | | 0.25 | |
| Net realized and unrealized gains (losses) on securities | | | 0.82 | | | | 0.75 | | | | 0.70 | | | | 0.95 | | | | 0.38 | | | | (2.80 | ) |
| Total from investment operations | | | 0.83 | | | | 0.79 | | | | 0.75 | | | | 1.00 | | | | 0.48 | | | | (2.55 | ) |
| | | | | | | | | | | | | | | | | | | | | | | | | |
| Less Distributions: | | | | | | | | | | | | | | | | | | | | | | | | |
| Dividends from net investment income | | | (0.02 | ) | | | (0.04 | ) | | | (0.05 | ) | | | (0.05 | ) | | | (0.11 | ) | | | (0.26 | ) |
| Dividends from realized capital gains | | | — | | | | — | | | | — | | | | — | | | | — | | | | (0.59 | ) |
| Total distributions | | | (0.02 | ) | | | (0.04 | ) | | | (0.05 | ) | | | (0.05 | ) | | | (0.11 | ) | | | (0.85 | ) |
| Net asset value, end of period | | $ | 12.69 | | | $ | 11.88 | | | $ | 11.13 | | | $ | 10.43 | | | $ | 9.48 | | | $ | 9.11 | |
| | | | | | | | | | | | | | | | | | | | | | | | | |
| TOTAL RETURN | | | 7.00 | %(1) | | | 7.13 | % | | | 7.16 | % | | | 10.53 | % | | | 5.46 | % | | | (21.55 | )% |
| | | | | | | | | | | | | | | | | | | | | | | | | |
| SUPPLEMENTAL DATA AND RATIOS: | | | | | | | | | | | | | | | | | | | | | | | | |
| Net assets, end of period (millions) | | $ | 13.32 | | | $ | 25.17 | | | $ | 18.02 | | | $ | 12.50 | | | $ | 11.47 | | | $ | 11.46 | |
| Ratio of net expenses to average net assets | | | 1.73 | %(2) | | | 1.54 | % | | | 1.61 | % | | | 1.65 | % | | | 1.73 | % | | | 1.56 | % |
| Ratio of net investment income to average net assets | | | 0.18 | %(2) | | | 0.34 | % | | | 0.42 | % | | | 0.45 | % | | | 1.17 | % | | | 2.31 | % |
| Portfolio turnover rate | | | 7 | %(1) | | | 17 | % | | | 39 | % | | | 57 | % | | | 46 | % | | | 13 | % |
| (1) | Not Annualized. |
| (2) | Annualized. |
The accompanying notes are an integral part of these financial statements.
(This Page Intentionally Left Blank.)
HENNESSY FUNDS 1-800-966-4354
Financial Highlights
For an Investor Class share outstanding throughout each period
| | | | | | | | | | | | For the | | | | | | | | | | |
| | | Six Months | | | | | | | | | Period | | | | | | | | | | |
| | | Ended | | | | | | | | | April 1, | | | | | | | | | | |
| | | April 30, | | | For the Year Ended | | | 2010 to | | | | | | | | | | |
| | | 2013 | | | October 31, | | | October 31, | | | Year Ended March 31, | |
| | | (Unaudited) | | | 2012 | | | 2011 | | | 2010(1) | | | 2010 | | | 2009 | | | 2008 | |
| PER SHARE DATA: | | | | | | | | | | | | | | | | | | | | | |
| Net asset value, beginning of period | | $ | 9.97 | | | $ | 9.56 | | | $ | 9.82 | | | $ | 9.39 | | | $ | 8.75 | | | $ | 9.16 | | | $ | 9.71 | |
| | | | | | | | | | | | | | | | | | | | | | | | | | | | | |
| Income from investment operations: | | | | | | | | | | | | | | | | | | | | | | | | | | | | |
| Net investment income (loss) | | | 0.13 | | | | 0.28 | | | | 0.35 | (2) | | | 0.23 | (2) | | | 0.38 | (2) | | | 0.35 | (2) | | | 0.42 | (2) |
Net realized and unrealized gains (losses) on investments | | | 0.00 | (3) | | | 0.41 | | | | (0.14 | ) | | | 0.42 | | | | 0.69 | | | | (0.44 | ) | | | — | |
| Total from investment operations | | | 0.13 | | | | 0.69 | | | | 0.21 | | | | 0.65 | | | | 1.07 | | | | (0.09 | ) | | | 0.42 | |
| | | | | | | | | | | | | | | | | | | | | | | | | | | | | |
| Less Distributions: | | | | | | | | | | | | | | | | | | | | | | | | | | | | |
| Dividends from net investment income | | | (0.13 | ) | | | (0.20 | ) | | | (0.32 | ) | | | (0.22 | ) | | | (0.38 | ) | | | (0.32 | ) | | | (0.39 | ) |
| Dividends from net realized gains | | | (0.18 | ) | | | (0.08 | ) | | | (0.15 | ) | | | — | | | | (0.05 | ) | | | — | | | | (0.58 | ) |
| Total distributions | | | (0.31 | ) | | | (0.28 | ) | | | (0.47 | ) | | | (0.22 | ) | | | (0.43 | ) | | | (0.32 | ) | | | (0.97 | ) |
| Paid-in capital from redemption fees | | | — | | | | 0.00 | (3) | | | 0.00 | (3) | | | 0.00 | (3) | | | 0.00 | (3) | | | 0.00 | (3) | | | — | |
| Net asset value, end of period | | $ | 9.79 | | | $ | 9.97 | | | $ | 9.56 | | | $ | 9.82 | | | $ | 9.39 | | | $ | 8.75 | | | $ | 9.16 | |
| | | | | | | | | | | | | | | | | | | | | | | | | | | | | |
| TOTAL RETURN | | | 1.38 | %(4) | | | 7.38 | % | | | 2.35 | % | | | 6.98 | %(4) | | | 12.33 | % | | | (0.93 | )% | | | 4.48 | % |
| | | | | | | | | | | | | | | | | | | | | | | | | | | | | |
| SUPPLEMENTAL DATA AND RATIOS: | | | | | | | | | | | | | | | | | | | | | | | | | | | | |
| Net assets, end of period (millions) | | $ | 3.83 | | | $ | 3.57 | | | $ | 4.05 | | | $ | 4.45 | | | $ | 4.62 | | | $ | 2.06 | | | $ | 2.03 | |
| Ratio of expenses to average net assets: | | | | | | | | | | | | | | | | | | | | | | | | | | | | |
| Before expense reimbursement | | | 1.82 | %(5) | | | 2.12 | % | | | 2.38 | % | | | 2.10 | %(5) | | | 1.93 | % | | | 2.14 | % | | | 2.19 | % |
| After expense reimbursement | | | 1.30 | %(5) | | | 1.30 | % | | | 1.30 | % | | | 1.30 | %(5) | | | 1.31 | % | | | 1.33 | % | | | 1.33 | % |
Ratio of net investment income to average net assets: | | | | | | | | | | | | | | | | | | | | | | | | | | | | |
| Before expense reimbursement | | | 2.25 | %(5) | | | 2.01 | % | | | 2.58 | % | | | 3.37 | %(5) | | | 3.49 | % | | | 3.21 | % | | | 3.53 | % |
| After expense reimbursement | | | 2.77 | %(5) | | | 2.83 | % | | | 3.66 | % | | | 4.17 | %(5) | | | 4.11 | % | | | 4.02 | % | | | 4.40 | % |
Portfolio turnover rate(6) | | | 40 | %(4) | | | 75 | % | | | 57 | % | | | 46 | %(4) | | | 28 | % | | | 39 | % | | | 102 | % |
| (1) | For the seven-month period ended October 31, 2010. Effective October 31, 2010, the Fund changed its fiscal year end from March 31 to October 31. |
| (2) | Calculated based on average shares outstanding method. |
| (3) | Amount is less than $0.01. |
| (4) | Not Annualized. |
| (5) | Annualized. |
| (6) | Portfolio turnover is calculated on the basis of the Fund as a whole. |
The accompanying notes are an integral part of these financial statements.
Financial Highlights
For an Institutional Class share outstanding throughout each period
| | | | | | | | | | | | For the | | | | | | | | | | |
| | | Six Months | | | | | | | | | Period | | | | | | | | | | |
| | | Ended | | | | | | | | | April 1, | | | | | | | | | | |
| | | April 30, | | | For the Year Ended | | | 2010 to | | | | | | | | | | |
| | | 2013 | | | October 31, | | | October 31, | | | Year Ended March 31, | |
| | | (Unaudited) | | | 2012 | | | 2011 | | | 2010(1) | | | 2010 | | | 2009 | | | 2008 | |
| PER SHARE DATA: | | | | | | | | | | | | | | | | | | | | | |
| Net asset value, beginning of period | | $ | 9.06 | | | $ | 8.77 | | | $ | 9.05 | | | $ | 8.67 | | | $ | 8.11 | | | $ | 8.52 | | | $ | 9.10 | |
| | | | | | | | | | | | | | | | | | | | | | | | | | | | | |
| Income from investment operations: | | | | | | | | | | | | | | | | | | | | | | | | | | | | |
| Net investment income (loss) | | | 0.11 | | | | 0.27 | | | | 0.34 | (2) | | | 0.23 | (2) | | | 0.37 | (2) | | | 0.35 | (2) | | | 0.39 | (2) |
Net realized and unrealized gains (losses) on investments | | | 0.02 | | | | 0.38 | | | | (0.12 | ) | | | 0.38 | | | | 0.64 | | | | (0.42 | ) | | | 0.03 | |
| Total from investment operations | | | 0.13 | | | | 0.65 | | | | 0.22 | | | | 0.61 | | | | 1.01 | | | | (0.07 | ) | | | 0.42 | |
| | | | | | | | | | | | | | | | | | | | | | | | | | | | | |
| Less Distributions: | | | | | | | | | | | | | | | | | | | | | | | | | | | | |
| Dividends from net investment income | | | (0.15 | ) | | | (0.28 | ) | | | (0.35 | ) | | | (0.23 | ) | | | (0.40 | ) | | | (0.34 | ) | | | (0.42 | ) |
| Dividends from net realized gains | | | (0.18 | ) | | | (0.08 | ) | | | (0.15 | ) | | | — | | | | (0.05 | ) | | | — | | | | (0.58 | ) |
| Total distributions | | | (0.33 | ) | | | (0.36 | ) | | | (0.50 | ) | | | (0.23 | ) | | | (0.45 | ) | | | (0.34 | ) | | | (1.00 | ) |
| Paid-in capital from redemption fees | | | — | | | | 0.00 | (3) | | | 0.00 | (3) | | | 0.00 | (3) | | | 0.00 | (3) | | | 0.00 | (3) | | | — | |
| Net asset value, end of period | | $ | 8.86 | | | $ | 9.06 | | | $ | 8.77 | | | $ | 9.05 | | | $ | 8.67 | | | $ | 8.11 | | | $ | 8.52 | |
| | | | | | | | | | | | | | | | | | | | | | | | | | | | | |
| TOTAL RETURN | | | 1.47 | %(4) | | | 7.63 | % | | | 2.62 | % | | | 7.15 | %(4) | | | 12.62 | % | | | (0.74 | )% | | | 4.78 | % |
| | | | | | | | | | | | | | | | | | | | | | | | | | | | | |
| SUPPLEMENTAL DATA AND RATIOS: | | | | | | | | | | | | | | | | | | | | | | | | | | | | |
| Net assets, end of period (millions) | | $ | 8.41 | | | $ | 33.34 | | | $ | 23.25 | | | $ | 24.25 | | | $ | 23.89 | | | $ | 22.05 | | | $ | 21.95 | |
| Ratio of expenses to average net assets: | | | | | | | | | | | | | | | | | | | | | | | | | | | | |
| Before expense reimbursement | | | 1.49 | %(5) | | | 1.31 | % | | | 1.43 | % | | | 1.47 | %(5) | | | 1.69 | % | | | 1.89 | % | | | 1.94 | % |
| After expense reimbursement | | | 1.05 | %(5) | | | 1.05 | % | | | 1.05 | % | | | 1.05 | %(5) | | | 1.06 | % | | | 1.08 | % | | | 1.08 | % |
Ratio of net investment income to average net assets: | | | | | | | | | | | | | | | | | | | | | | | | | | | | |
| Before expense reimbursement | | | 2.48 | %(5) | | | 2.74 | % | | | 3.54 | % | | | 4.00 | %(5) | | | 3.74 | % | | | 3.46 | % | | | 3.60 | % |
| After expense reimbursement | | | 2.92 | %(5) | | | 3.00 | % | | | 3.92 | % | | | 4.41 | %(5) | | | 4.37 | % | | | 4.27 | % | | | 4.46 | % |
Portfolio turnover rate(6) | | | 40 | %(4) | | | 75 | % | | | 57 | % | | | 46 | %(4) | | | 28 | % | | | 39 | % | | | 102 | % |
| (1) | For the seven-month period ended October 31, 2010. Effective October 31, 2010, the Fund changed its fiscal year end from March 31 to October 31. |
| (2) | Calculated based on average shares outstanding method. |
| (3) | Amount is less than $0.01. |
| (4) | Not Annualized. |
| (5) | Annualized. |
| (6) | Portfolio turnover is calculated on the basis of the Fund as a whole. |
The accompanying notes are an integral part of these financial statements.
HENNESSY FUNDS 1-800-966-4354
Financial Highlights
| Hennessy Gas Utility Index Fund |
For an Investor Class share outstanding throughout each period
| | | Six Months | | | | | | | | | | | | | | | | |
| | | Ended | | | | | | | | | | | | | | | | |
| | | April 30, | | | | | | | | | | | | | | | | |
| | | 2013 | | | Year Ended October 31, | |
| | | (Unaudited) | | | 2012 | | | 2011 | | | 2010 | | | 2009 | | | 2008 | |
| PER SHARE DATA: | | | | | | | | | | | | | | | | | | |
| Net asset value, beginning of period | | $ | 23.05 | | | $ | 21.21 | | | $ | 17.83 | | | $ | 15.13 | | | $ | 15.26 | | | $ | 23.14 | |
| | | | | | | | | | | | | | | | | | | | | | | | | |
| Income from investment operations: | | | | | | | | | | | | | | | | | | | | | | | | |
| Net investment income | | | 0.30 | | | | 0.58 | | | | 0.51 | (1) | | | 0.58 | | | | 0.49 | | | | 0.47 | |
| Net realized and unrealized gains (losses) on securities | | 3.68 | | | | 1.99 | | | | 3.59 | | | | 2.72 | | | | 0.60 | | | | (6.13 | ) |
| Total from investment operations | | | 3.98 | | | | 2.57 | | | | 4.10 | | | | 3.30 | | | | 1.09 | | | | (5.66 | ) |
| | | | | | | | | | | | | | | | | | | | | | | | | |
| Less Distributions: | | | | | | | | | | | | | | | | | | | | | | | | |
| Dividends from net investment income | | | (0.30 | ) | | | (0.58 | ) | | | (0.51 | ) | | | (0.58 | ) | | | (0.49 | ) | | | (0.47 | ) |
| Dividends from realized capital gains | | | (0.55 | ) | | | (0.16 | ) | | | (0.21 | ) | | | (0.02 | ) | | | (0.74 | ) | | | (1.75 | ) |
| Total distributions | | | (0.85 | ) | | | (0.74 | ) | | | (0.72 | ) | | | (0.60 | ) | | | (1.23 | ) | | | (2.22 | ) |
| Paid-in capital from redemption fees | | | — | | | | 0.01 | | | | 0.00 | (2) | | | 0.00 | (2) | | | 0.01 | | | | 0.00 | (2) |
| Net asset value, end of period | | $ | 26.18 | | | $ | 23.05 | | | $ | 21.21 | | | $ | 17.83 | | | $ | 15.13 | | | $ | 15.26 | |
| | | | | | | | | | | | | | | | | | | | | | | | | |
| TOTAL RETURN | | | 17.91 | %(3) | | | 12.41 | % | | | 23.54 | % | | | 22.25 | % | | | 8.18 | % | | | (26.81 | )% |
| | | | | | | | | | | | | | | | | | | | | | | | | |
| SUPPLEMENTAL DATA AND RATIOS: | | | | | | | | | | | | | | | | | | | | | | | | |
| Net assets, end of period (millions) | | $ | 1,009.93 | | | $ | 746.82 | | | $ | 433.78 | | | $ | 244.04 | | | $ | 193.68 | | | $ | 198.57 | |
| Ratio of expenses to average net assets: | | | | | | | | | | | | | | | | | | | | | | | | |
| Before expense reimbursement | | | 0.77 | %(4) | | | 0.69 | % | | | 0.71 | % | | | 0.77 | % | | | 0.76 | % | | | 0.70 | % |
| After expense reimbursement | | | 0.77 | %(4) | | | 0.69 | % | | | 0.71 | % | | | 0.76 | % | | | 0.76 | % | | | 0.70 | % |
| Ratio of net investment income to average net assets: | | | | | | | | | | | | | | | | | | | | | | |
| Before expense reimbursement | | | 2.64 | %(4) | | | 2.72 | % | | | 2.68 | % | | | 3.50 | % | | | 3.51 | % | | | 2.39 | % |
| After expense reimbursement | | | 2.64 | %(4) | | | 2.72 | % | | | 2.68 | % | | | 3.51 | % | | | 3.51 | % | | | 2.39 | % |
| Portfolio turnover rate | | | 6 | %(3) | | | 16 | % | | | 17 | % | | | 16 | % | | | 26 | % | | | 27 | % |
| (1) | Calculated based on average shares outstanding method. |
| (2) | Amount is less than $0.01. |
| (3) | Not Annualized. |
| (4) | Annualized. |
The accompanying notes are an integral part of these financial statements.
(This Page Intentionally Left Blank.)
HENNESSY FUNDS 1-800-966-4354
Financial Highlights
| Hennessy Small Cap Financial Fund |
For an Investor Class share outstanding throughout each period
| | | Six Months | | | | | | | | | | | | | | | | |
| | | Ended | | | | | | | | | | | | | | | | |
| | | April 30, | | | | | | | | | | | | | | | | |
| | | 2013 | | | Year Ended October 31, | |
| | | (Unaudited) | | | 2012 | | | 2011 | | | 2010 | | | 2009 | | | 2008 | |
| PER SHARE DATA: | | | | | | | | | | | | | | | | | | |
| Net asset value, beginning of period | | $ | 19.54 | | | $ | 16.48 | | | $ | 18.11 | | | $ | 15.91 | | | $ | 15.22 | | | $ | 23.18 | |
| | | | | | | | | | | | | | | | | | | | | | | | | |
| Income from investment operations: | | | | | | | | | | | | | | | | | | | | | | | | |
| Net investment income (loss) | | | 0.08 | | | | 0.11 | | | | 0.21 | (1) | | | 0.08 | | | | 0.06 | | | | 0.24 | |
| Net realized and unrealized gains (losses) on securities | | 2.54 | | | | 3.24 | | | | (1.66 | ) | | | 2.17 | | | | 0.81 | | | | (1.69 | ) |
| Total from investment operations | | | 2.62 | | | | 3.35 | | | | (1.45 | ) | | | 2.25 | | | | 0.87 | | | | (1.45 | ) |
| | | | | | | | | | | | | | | | | | | | | | | | | |
| Less Distributions: | | | | | | | | | | | | | | | | | | | | | | | | |
| Dividends from net investment income | | | (0.12 | ) | | | (0.29 | ) | | | (0.06 | ) | | | (0.07 | ) | | | (0.19 | ) | | | (0.28 | ) |
| Dividends from net realized gains | | | — | | | | — | | | | (0.13 | ) | | | — | | | | — | | | | (6.24 | ) |
| Total distributions | | | (0.12 | ) | | | (0.29 | ) | | | (0.19 | ) | | | (0.07 | ) | | | (0.19 | ) | | | (6.52 | ) |
| Paid-in capital from redemption fees | | | — | | | | 0.00 | (2) | | | 0.01 | | | | 0.02 | | | | 0.01 | | | | 0.01 | |
| Net asset value, end of period | | $ | 22.04 | | | $ | 19.54 | | | $ | 16.48 | | | $ | 18.11 | | | $ | 15.91 | | | $ | 15.22 | |
| | | | | | | | | | | | | | | | | | | | | | | | | |
| TOTAL RETURN | | | 13.49 | %(3) | | | 20.65 | % | | | (8.12 | )% | | | 14.27 | % | | | 5.89 | % | | | (6.76 | )% |
| | | | | | | | | | | | | | | | | | | | | | | | | |
| SUPPLEMENTAL DATA AND RATIOS: | | | | | | | | | | | | | | | | | | | | | | | | |
| Net assets, end of period (millions) | | $ | 211.86 | | | $ | 167.20 | | | $ | 154.21 | | | $ | 216.75 | | | $ | 187.56 | | | $ | 181.80 | |
| Ratio of expenses to average net assets | | | 1.44 | %(4) | | | 1.45 | % | | | 1.52 | % | | | 1.51 | % | | | 1.51 | % | | | 1.49 | % |
| Ratio of net investment income to average net assets | | 0.81 | %(4) | | | 0.56 | % | | | 0.81 | % | | | 0.35 | % | | | 0.50 | % | | | 1.48 | % |
Portfolio turnover rate(5) | | | 35 | %(3) | | | 43 | % | | | 70 | % | | | 89 | % | | | 118 | % | | | 147 | % |
| (1) | Calculated based on average shares outstanding method. |
| (2) | Amount is less than $0.01. |
| (3) | Not Annualized. |
| (4) | Annualized. |
| (5) | Portfolio turnover is calculated on the basis of the Fund as a whole. |
The accompanying notes are an integral part of these financial statements.
Financial Highlights
| Hennessy Small Cap Financial Fund |
For an Institutional Class share outstanding throughout each period
| | | Six Months | | | | | | | | | | | | | | | | |
| | | Ended | | | | | | | | | | | | | | | Period | |
| | | April 30, | | | | | | | | | | | | | | | Ended | |
| | | 2013 | | | Year Ended October 31, | | | October 31, | |
| | | (Unaudited) | | | 2012 | | | 2011 | | | 2010 | | | 2009 | | | 2008(1) | |
| PER SHARE DATA: | | | | | | | | | | | | | | | | | | |
| Net asset value, beginning of period | | $ | 12.34 | | | $ | 10.55 | | | $ | 11.70 | | | $ | 10.34 | | | $ | 9.96 | | | $ | 10.00 | |
| | | | | | | | | | | | | | | | | | | | | | | | | |
| Income from investment operations: | | | | | | | | | | | | | | | | | | | | | | | | |
| Net investment income | | | 0.09 | | | | 0.16 | | | | 0.19 | (2) | | | 0.09 | | | | 0.19 | | | | 0.02 | |
| Net realized and unrealized gains (losses) on securities | | 1.57 | | | | 1.98 | | | | (1.09 | ) | | | 1.40 | | | | 0.40 | | | | (0.06 | ) |
| Total from investment operations | | | 1.66 | | | | 2.14 | | | | (0.90 | ) | | | 1.49 | | | | 0.59 | | | | (0.04 | ) |
| | | | | | | | | | | | | | | | | | | | | | | | | |
| Less Distributions: | | | | | | | | | | | | | | | | | | | | | | | | |
| Dividends from net investment income | | | (0.18 | ) | | | (0.35 | ) | | | (0.12 | ) | | | (0.13 | ) | | | (0.21 | ) | | | — | |
| Dividends from net realized gains | | | — | | | | — | | | | (0.13 | ) | | | — | | | | — | | | | — | |
| Total distributions | | | (0.18 | ) | | | (0.35 | ) | | | (0.25 | ) | | | (0.13 | ) | | | (0.21 | ) | | | — | |
| Paid-in capital from redemption fees | | | — | | | | 0.00 | (3) | | | — | | | | 0.00 | (3) | | | — | | | | — | |
| Net asset value, end of period | | $ | 13.82 | | | $ | 12.34 | | | $ | 10.55 | | | $ | 11.70 | | | $ | 10.34 | | | $ | 9.96 | |
| | | | | | | | | | | | | | | | | | | | | | | | | |
| TOTAL RETURN | | | 13.59 | %(4) | | | 20.95 | % | | | (8.00 | )% | | | 14.52 | % | | | 6.14 | % | | | (0.40 | )%(4) |
| | | | | | | | | | | | | | | | | | | | | | | | | |
| SUPPLEMENTAL DATA AND RATIOS: | | | | | | | | | | | | | | | | | | | | | | | | |
| Net assets, end of period (millions) | | $ | 43.57 | | | $ | 43.79 | | | $ | 19.89 | | | $ | 25.01 | | | $ | 10.64 | | | $ | 3.95 | |
| Ratio of expenses to average net assets | | | 1.16 | %(5) | | | 1.25 | % | | | 1.34 | % | | | 1.23 | % | | | 1.56 | % | | | 1.31 | %(5) |
| Ratio of net investment income to average net assets | | | 1.11 | %(5) | | | 0.72 | % | | | 1.00 | % | | | 0.61 | % | | | 0.04 | % | | | 1.49 | %(5) |
Portfolio turnover rate(6) | | | 35 | %(4) | | | 43 | % | | | 70 | % | | | 89 | % | | | 118 | % | | | 147 | %(4) |
| (1) | Institutional Class shares commenced operations on May 30, 2008. |
| (2) | Calculated based on average shares outstanding method. |
| (3) | Amount is less than $0.01. |
| (4) | Not Annualized. |
| (5) | Annualized. |
| (6) | Portfolio turnover is calculated on the basis of the Fund as a whole. |
The accompanying notes are an integral part of these financial statements.
HENNESSY FUNDS 1-800-966-4354
Financial Highlights
| Hennessy Large Cap Financial Fund |
For an Investor Class share outstanding throughout each period
| | | Six Months | | | | | | | | | | | | | | | | |
| | | Ended | | | | | | | | | | | | | | | | |
| | | April 30, | | | | | | | | | | | | | | | | |
| | | 2013 | | | Year Ended October 31, | |
| | | (Unaudited) | | | 2012 | | | 2011 | | | 2010 | | | 2009 | | | 2008 | |
| PER SHARE DATA: | | | | | | | | | | | | | | | | | | |
| Net asset value, beginning of period | | $ | 14.16 | | | $ | 11.91 | | | $ | 12.88 | | | $ | 12.61 | | | $ | 11.14 | | | $ | 18.71 | |
| | | | | | | | | | | | | | | | | | | | | | | | | |
| Income from investment operations: | | | | | | | | | | | | | | | | | | | | | | | | |
| Net investment income (loss) | | | (0.02 | ) | | | 0.01 | | | | (0.04 | )(1) | | | (0.08 | ) | | | 0.00 | (2) | | | 0.14 | |
| Net realized and unrealized gains (losses) on investments | | | 2.42 | | | | 2.24 | | | | (0.93 | ) | | | 0.35 | | | | 1.58 | | | | (3.86 | ) |
| Total from investment operations | | | 2.40 | | | | 2.25 | | | | (0.97 | ) | | | 0.27 | | | | 1.58 | | | | (3.72 | ) |
| | | | | | | | | | | | | | | | | | | | | | | | | |
| Less Distributions: | | | | | | | | | | | | | | | | | | | | | | | | |
| Dividends from net investment income | | | (0.01 | ) | | | — | | | | — | | | | — | | | | (0.10 | ) | | | (0.18 | ) |
| Distribution in excess of net investment income | | | — | | | | — | | | | — | | | | — | | | | (0.02 | ) | | | — | |
| Dividends from net realized gains | | | — | | | | — | | | | — | | | | — | | | | — | | | | (3.68 | ) |
| Total distributions | | | (0.01 | ) | | | — | | | | — | | | | — | | | | (0.12 | ) | | | (3.86 | ) |
| Paid-in capital from redemption fees | | | — | | | | 0.00 | (2) | | | 0.00 | (2) | | | 0.00 | (2) | | | 0.01 | | | | 0.01 | |
| Net asset value, end of period | | $ | 16.55 | | | $ | 14.16 | | | $ | 11.91 | | | $ | 12.88 | | | $ | 12.61 | | | $ | 11.14 | |
| | | | | | | | | | | | | | | | | | | | | | | | | |
| TOTAL RETURN | | | 16.98 | %(3) | | | 18.89 | % | | | (7.53 | )% | | | 2.14 | % | | | 14.52 | % | | | (23.76 | )% |
| | | | | | | | | | | | | | | | | | | | | | | | | |
| SUPPLEMENTAL DATA AND RATIOS: | | | | | | | | | | | | | | | | | | | | | | | | |
| Net assets, end of period (millions) | | $ | 59.91 | | | $ | 64.66 | | | $ | 55.68 | | | $ | 48.72 | | | $ | 37.20 | | | $ | 24.27 | |
| Ratio of expenses to average net assets: | | | | | | | | | | | | | | | | | | | | | | | | |
| Before expense reimbursement | | | 1.58 | %(4) | | | 1.57 | % | | | 1.61 | % | | | 1.78 | % | | | 1.81 | % | | | 2.01 | % |
| After expense reimbursement | | | 1.58 | %(4) | | | 1.57 | % | | | 1.61 | % | | | 1.78 | % | | | 1.81 | % | | | 1.88 | % |
| Ratio of net investment income/(loss) to average net assets: | | | | | | | | | | | | | | | | | | | | | | | | |
| Before expense reimbursement | | | (0.25 | )%(4) | | | 0.09 | % | | | (0.34 | )% | | | (0.73 | )% | | | (0.08 | )% | | | 1.50 | % |
| After expense reimbursement | | | (0.25 | )%(4) | | | 0.09 | % | | | (0.34 | )% | | | (0.73 | )% | | | (0.08 | )% | | | 1.63 | % |
| Portfolio turnover rate | | | 37 | %(3) | | | 93 | % | | | 97 | % | | | 150 | % | | | 220 | % | | | 509 | % |
| (1) | Calculated based on average shares outstanding method. |
| (2) | Amount is less than $0.01. |
| (3) | Not Annualized. |
| (4) | Annualized. |
The accompanying notes are an integral part of these financial statements.
(This Page Intentionally Left Blank.)
HENNESSY FUNDS 1-800-966-4354
Financial Highlights
For an Investor Class share outstanding throughout each period
| | | Six Months | | | | | | | | | | | | | | | | |
| | | Ended | | | | | | | | | | | | | | | | |
| | | April 30, | | | | | | | | | | | | | | | | |
| | | 2013 | | | Year Ended October 31, | |
| | | (Unaudited) | | | 2012 | | | 2011 | | | 2010 | | | 2009 | | | 2008 | |
| PER SHARE DATA: | | | | | | | | | | | | | | | | | | |
| Net asset value, beginning of period | | $ | 10.67 | | | $ | 10.86 | | | $ | 11.00 | | | $ | 9.05 | | | $ | 6.96 | | | $ | 13.34 | |
| | | | | | | | | | | | | | | | | | | | | | | | | |
| Income from investment operations: | | | | | | | | | | | | | | | | | | | | | | | | |
| Net investment income (loss) | | | (0.09 | ) | | | (0.15 | ) | | | (0.17 | )(1) | | | (0.14 | ) | | | (0.08 | ) | | | (0.12 | ) |
| Net realized and unrealized gains (losses) on investments | | | 1.03 | | | | (0.04 | ) | | | 0.03 | | | | 2.08 | | | | 2.16 | | | | (5.03 | ) |
| Total from investment operations | | | 0.94 | | | | (0.19 | ) | | | (0.14 | ) | | | 1.94 | | | | 2.08 | | | | (5.15 | ) |
| | | | | | | | | | | | | | | | | | | | | | | | | |
| Less Distributions: | | | | | | | | | | | | | | | | | | | | | | | | |
| Dividends from net investment income | | | — | | | | — | | | | — | | | | — | | | | — | | | | — | |
| Dividends from net realized gains | | | — | | | | — | | | | — | | | | — | | | | — | | | | (1.23 | ) |
| Total distributions | | | — | | | | — | | | | — | | | | — | | | | — | | | | (1.23 | ) |
| Paid-in capital from redemption fees | | | — | | | | 0.00 | (2) | | | 0.00 | (2) | | | 0.01 | | | | 0.01 | | | | 0.00 | (2) |
| Net asset value, end of period | | $ | 11.61 | | | $ | 10.67 | | | $ | 10.86 | | | $ | 11.00 | | | $ | 9.05 | | | $ | 6.96 | |
| | | | | | | | | | | | | | | | | | | | | | | | | |
| TOTAL RETURN | | | 8.81 | %(3) | | | (1.75 | )% | | | (1.27 | )% | | | 21.55 | % | | | 30.03 | % | | | (42.30 | )% |
| | | | | | | | | | | | | | | | | | | | | | | | | |
| SUPPLEMENTAL DATA AND RATIOS: | | | | | | | | | | | | | | | | | | | | | | | | |
| Net assets, end of period (millions) | | $ | 4.36 | | | $ | 4.44 | | | $ | 5.70 | | | $ | 8.21 | | | $ | 8.39 | | | $ | 7.69 | |
| Ratio of expenses to average net assets: | | | | | | | | | | | | | | | | | | | | | | | | |
| Before expense reimbursement | | | 3.05 | %(4) | | | 3.20 | % | | | 2.79 | % | | | 2.50 | % | | | 3.00 | % | | | 1.92 | % |
| After expense reimbursement | | | 1.95 | %(4) | | | 1.95 | % | | | 1.95 | % | | | 1.95 | % | | | 1.95 | % | | | 1.84 | % |
| Ratio of net investment income/(loss) to average net assets: | | | | | | | | | | | | | | | | | | | | | | | | |
| Before expense reimbursement | | | (2.15 | )%(4) | | | (2.39 | )% | | | (2.38 | )% | | | (1.64 | )% | | | (2.10 | )% | | | (0.68 | )% |
| After expense reimbursement | | | (1.05 | )%(4) | | | (1.14 | )% | | | (1.54 | )% | | | (1.10 | )% | | | (1.05 | )% | | | (0.60 | )% |
Portfolio turnover rate(5) | | | 64 | %(3) | | | 138 | % | | | 141 | % | | | 353 | % | | | 211 | % | | | 175 | % |
| (1) | Calculated based on average shares outstanding method. |
| (2) | Amount is less than $0.01. |
| (3) | Not Annualized. |
| (4) | Annualized. |
| (5) | Portfolio turnover is calculated on the basis of the Fund as a whole. |
The accompanying notes are an integral part of these financial statements.
Financial Highlights
For an Institutional Class share outstanding throughout each period
| | | Six Months | | | | | | | | | | |
| | | Ended | | | | | | | | | Period | |
| | | April 30, | | | For the Year Ended | | | Ended | |
| | | 2013 | | | October 31, | | | October 31, | |
| | | (Unaudited) | | | 2012 | | | 2011 | | | 2010(1) | |
| PER SHARE DATA: | | | | | | | | | | | | |
| Net asset value, beginning of period | | $ | 10.73 | | | $ | 10.89 | | | $ | 11.00 | | | $ | 10.46 | |
| | | | | | | | | | | | | | | | | |
| Income from investment operations: | | | | | | | | | | | | | | | | |
| Net investment income (loss) | | | (0.05 | ) | | | (0.11 | ) | | | (0.14 | )(2) | | | (0.07 | ) |
| Net realized and unrealized gains (losses) on investments | | | 1.01 | | | | (0.05 | ) | | | 0.03 | | | | 0.61 | |
| Total from investment operations | | | 0.96 | | | | (0.16 | ) | | | (0.11 | ) | | | 0.54 | |
| Paid-in capital from redemption fees | | | — | | | | 0.00 | (3) | | | 0.00 | (3) | | | 0.00 | (3) |
| Net asset value, end of period | | $ | 11.69 | | | $ | 10.73 | | | $ | 10.89 | | | $ | 11.00 | |
| | | | | | | | | | | | | | | | | |
| TOTAL RETURN | | | 8.95 | %(4) | | | (1.47 | )% | | | (1.00 | )% | | | 5.16 | %(4) |
| | | | | | | | | | | | | | | | | |
| SUPPLEMENTAL DATA AND RATIOS: | | | | | | | | | | | | | | | | |
| Net assets, end of period (millions) | | $ | 1.04 | | | $ | 0.93 | | | $ | 1.16 | | | $ | 4.61 | |
| Ratio of expenses to average net assets: | | | | | | | | | | | | | | | | |
| Before expense reimbursement | | | 2.82 | %(5) | | | 4.11 | % | | | 3.45 | % | | | 2.34 | %(5) |
| After expense reimbursement | | | 1.70 | %(5) | | | 1.70 | % | | | 1.70 | % | | | 1.70 | %(5) |
| Ratio of net investment income/(loss) to average net assets: | | | | | | | | | | | | | | | | |
| Before expense reimbursement | | | (1.94 | )%(5) | | | (3.31 | )% | | | (2.99 | )% | | | (1.41 | )%(5) |
| After expense reimbursement | | | (0.82 | )%(5) | | | (0.90 | )% | | | (1.24 | )% | | | (0.77 | )%(5) |
Portfolio turnover rate(6) | | | 64 | %(4) | | | 138 | % | | | 141 | % | | | 353 | %(4) |
| (1) | Institutional Class shares commenced operations on March 12, 2010. |
| (2) | Calculated based on average shares outstanding method. |
| (3) | Amount is less than $0.01. |
| (4) | Not Annualized. |
| (5) | Annualized. |
| (6) | Portfolio turnover is calculated on the basis of the Fund as a whole. |
The accompanying notes are an integral part of these financial statements.
HENNESSY FUNDS 1-800-966-4354
Financial Highlights
For an Investor Class share outstanding throughout each period
| | | Six Months | | | | | | | | | | | | | | | | |
| | | Ended | | | | | | | | | | | | | | | | |
| | | April 30, | | | | | | | | | | | | | | | | |
| | | 2013 | | | Year Ended October 31, | |
| | | (Unaudited) | | | 2012 | | | 2011 | | | 2010 | | | 2009(1) | | | 2008(1) | |
| PER SHARE DATA: | | | | | | | | | | | | | | | | | | |
| Net asset value, beginning of period | | $ | 15.40 | | | $ | 13.99 | | | $ | 12.58 | | | $ | 11.38 | | | $ | 9.73 | | | $ | 16.24 | |
| | | | | | | | | | | | | | | | | | | | | | | | | |
| Income from investment operations: | | | | | | | | | | | | | | | | | | | | | | | | |
| Net investment income (loss) | | | (0.01 | ) | | | (0.02 | ) | | | (0.10 | ) | | | (0.04 | ) | | | 0.02 | | | | 0.05 | |
| Net realized and unrealized gains (losses) on securities | | | 3.05 | | | | 1.43 | | | | 1.51 | | | | 1.25 | | | | 1.66 | | | | (6.56 | ) |
| Total from investment operations | | | 3.04 | | | | 1.41 | | | | 1.41 | | | | 1.21 | | | | 1.68 | | | | (6.51 | ) |
| | | | | | | | | | | | | | | | | | | | | | | | | |
| Less Distributions: | | | | | | | | | | | | | | | | | | | | | | | | |
| Dividends from net investment income | | | (0.01 | ) | | | — | | | | — | | | | (0.01 | ) | | | (0.03 | ) | | | — | |
| Dividends from net realized gains | | | — | | | | — | | | | — | | | | — | | | | — | | | | — | |
| Return of capital | | | — | | | | — | | | | — | | | | (0.01 | ) | | | — | | | | — | |
| Total distributions | | | (0.01 | ) | | | — | | | | — | | | | (0.02 | ) | | | (0.03 | ) | | | — | |
| Paid-in capital from redemption fees | | | — | | | | — | | | | — | | | | 0.01 | | | | 0.00 | (2) | | | 0.00 | (2) |
| Net asset value, end of period | | $ | 18.43 | | | $ | 15.40 | | | $ | 13.99 | | | $ | 12.58 | | | $ | 11.38 | | | $ | 9.73 | |
| | | | | | | | | | | | | | | | | | | | | | | | | |
| TOTAL RETURN | | | 19.75 | %(3) | | | 10.08 | % | | | 11.21 | % | | | 11.04 | % | | | 17.36 | % | | | (40.09 | )% |
| | | | | | | | | | | | | | | | | | | | | | | | | |
| SUPPLEMENTAL DATA AND RATIOS: | | | | | | | | | | | | | | | | | | | | | | | | |
| Net assets, end of period (millions) | | $ | 22.30 | | | $ | 10.38 | | | $ | 14.81 | | | $ | 20.01 | | | $ | 28.29 | | | $ | 15.86 | |
| Ratio of expenses to average net assets: | | | | | | | | | | | | | | | | | | | | | | | | |
| Before expense reimbursement | | | 1.99 | %(4) | | | 2.03 | % | | | 1.86 | % | | | 1.71 | % | | | 1.75 | % | | | 1.72 | % |
| After expense reimbursement | | | 1.99 | %(4) | | | 2.03 | % | | | 1.86 | % | | | 1.59 | % | | | 1.24 | % | | | 1.25 | % |
| Ratio of net investment income (loss) to average net assets: | | | | | | | | | | | | | | | | | | | | | | | | |
| Before expense reimbursement | | | (0.40 | )%(4) | | | (0.09 | )% | | | (0.54 | )% | | | (0.27 | )% | | | (0.34 | )% | | | (0.10 | )% |
| After expense reimbursement | | | (0.40 | )%(4) | | | (0.09 | )% | | | (0.54 | )% | | | (0.15 | )% | | | 0.17 | % | | | 0.37 | % |
Portfolio turnover rate(5) | | | 7 | %(3) | | | 2 | % | | | 166 | % | | | 8 | % | | | 17 | % | | | 35 | % |
| (1) | The financial highlights set forth for periods prior to September 17, 2009 represent the historical financial highlights of the SPARX Japan Fund. On September 17, 2009, Hennessy Advisors, Inc. became the investment advisor to the Fund and the Fund changed its name to the Hennessy Select SPARX Japan Fund. In October 2012, the Fund changed its name to the Hennessy Japan Fund. |
| (2) | Amount is less than $0.01. |
| (3) | Not Annualized. |
| (4) | Annualized. |
| (5) | Portfolio turnover is calculated on the basis of the Fund as a whole. |
The accompanying notes are an integral part of these financial statements.
Financial Highlights
For an Institutional Class share outstanding throughout each period
| | | Six Months | | | | | | | | | | | | | | | | |
| | | Ended | | | | | | | | | | | | | | | | |
| | | April 30, | | | | | | | | | | | | | | | | |
| | | 2013 | | | Year Ended October 31, | |
| | | (Unaudited) | | | 2012 | | | 2011 | | | 2010 | | | 2009(1) | | | 2008(1) | |
| PER SHARE DATA: | | | | | | | | | | | | | | | | | | |
| Net asset value, beginning of period | | $ | 15.60 | | | $ | 14.14 | | | $ | 12.66 | | | $ | 11.44 | | | $ | 9.78 | | | $ | 16.33 | |
| | | | | | | | | | | | | | | | | | | | | | | | | |
| Income from investment operations: | | | | | | | | | | | | | | | | | | | | | | | | |
| Net investment income (loss) | | | (0.03 | ) | | | 0.02 | | | | 0.03 | | | | 0.01 | | | | 0.03 | | | | 0.05 | |
| Net realized and unrealized gains (losses) on securities | | | 3.12 | | | | 1.44 | | | | 1.45 | | | | 1.23 | | | | 1.66 | | | | (6.60 | ) |
| Total from investment operations | | | 3.09 | | | | 1.46 | | | | 1.48 | | | | 1.24 | | | | 1.69 | | | | (6.55 | ) |
| | | | | | | | | | | | | | | | | | | | | | | | | |
| Less Distributions: | | | | | | | | | | | | | | | | | | | | | | | | |
| Dividends from net investment income | | | (0.01 | ) | | | — | | | | — | | | | (0.01 | ) | | | (0.03 | ) | | | — | |
| Dividends from net realized gains | | | — | | | | — | | | | — | | | | — | | | | — | | | | — | |
| Return of capital | | | — | | | | — | | | | — | | | | (0.01 | ) | | | — | | | | — | |
| Total distributions | | | (0.01 | ) | | | — | | | | — | | | | (0.02 | ) | | | (0.03 | ) | | | — | |
| Paid-in capital from redemption fees | | | — | | | | — | | | | — | | | | — | | | | 0.00 | (2) | | | 0.00 | (2) |
| Net asset value, end of period | | $ | 18.68 | | | $ | 15.60 | | | $ | 14.14 | | | $ | 12.66 | | | $ | 11.44 | | | $ | 9.78 | |
| | | | | | | | | | | | | | | | | | | | | | | | | |
| TOTAL RETURN | | | 19.85 | %(3) | | | 10.33 | % | | | 11.69 | % | | | 11.07 | % | | | 17.37 | % | | | (40.11 | )% |
| | | | | | | | | | | | | | | | | | | | | | | | | |
| SUPPLEMENTAL DATA AND RATIOS: | | | | | | | | | | | | | | | | | | | | | | | | |
| Net assets, end of period (millions) | | $ | 7.60 | | | $ | 8.94 | | | $ | 9.70 | | | $ | 23.57 | | | $ | 25.55 | | | $ | 37.03 | |
| Ratio of expenses to average net assets: | | | | | | | | | | | | | | | | | | | | | | | | |
| Before expense reimbursement | | | 1.76 | %(4) | | | 1.85 | % | | | 1.64 | % | | | 1.45 | % | | | 1.75 | % | | | 1.72 | % |
| After expense reimbursement | | | 1.76 | %(4) | | | 1.85 | % | | | 1.64 | % | | | 1.40 | % | | | 1.24 | % | | | 1.25 | % |
| Ratio of net investment income (loss) to average net assets: | | | | | | | | | | | | | | | | | | | | | | | | |
| Before expense reimbursement | | | (0.35 | )%(4) | | | 0.13 | % | | | 0.19 | % | | | 0.02 | % | | | (0.34 | )% | | | (0.10 | )% |
| After expense reimbursement | | | (0.35 | )%(4) | | | 0.13 | % | | | 0.19 | % | | | 0.07 | % | | | 0.17 | % | | | 0.37 | % |
Portfolio turnover rate(5) | | | 7 | %(3) | | | 2 | % | | | 166 | % | | | 8 | % | | | 17 | % | | | 35 | % |
| (1) | The financial highlights set forth for periods prior to September 17, 2009 represent the historical financial highlights of the SPARX Japan Fund. On September 17, 2009, Hennessy Advisors, Inc. became the investment advisor to the Fund and the Fund changed its name to the Hennessy Select SPARX Japan Fund. In October 2012, the Fund changed its name to the Hennessy Japan Fund. |
| (2) | Amount is less than $0.01 or $(0.01). |
| (3) | Not Annualized. |
| (4) | Annualized. |
| (5) | Portfolio turnover is calculated on the basis of the Fund as a whole. |
The accompanying notes are an integral part of these financial statements.
HENNESSY FUNDS 1-800-966-4354
Financial Highlights
| Hennessy Japan Small Cap Fund |
For an Investor Class share outstanding throughout each period
| | | Six Months | | | | | | | | | | | | | | | | |
| | | Ended | | | | | | | | | | | | | | | | |
| | | April 30, | | | | | | | | | | | | | | | | |
| | | 2013 | | | Year Ended October 31, | |
| | | (Unaudited) | | | 2012 | | | 2011 | | | 2010 | | | 2009(1) | | | 2008(1) | |
| PER SHARE DATA: | | | | | | | | | | | | | | | | | | |
| Net asset value, beginning of period | | $ | 10.54 | | | $ | 10.09 | | | $ | 9.23 | | | $ | 9.74 | | | $ | 6.87 | | | $ | 10.98 | |
| | | | | | | | | | | | | | | | | | | | | | | | | |
| Income from investment operations: | | | | | | | | | | | | | | | | | | | | | | | | |
| Net investment income (loss) | | | 0.12 | | | | 0.68 | | | | 0.06 | | | | — | (2) | | | 0.07 | | | | 0.02 | (3) |
| Net realized and unrealized gains (losses) on securities | | | 3.00 | | | | 1.17 | | | | 0.80 | | | | (0.10 | ) | | | 2.80 | | | | (4.08 | ) |
| Total from investment operations | | | 3.12 | | | | 0.49 | | | | 0.86 | | | | (0.10 | ) | | | 2.87 | | | | (4.06 | ) |
| | | | | | | | | | | | | | | | | | | | | | | | | |
| Less Distributions: | | | | | | | | | | | | | | | | | | | | | | | | |
| Dividends from net investment income | | | — | | | | (0.04 | ) | | | — | | | | (0.42 | ) | | | — | | | | (0.07 | ) |
| Dividends from net realized gains | | | (2.34 | ) | | | — | | | | — | | | | — | | | | — | | | | — | |
| Total distributions | | | (2.34 | ) | | | (0.04 | ) | | | — | | | | (0.42 | ) | | | — | | | | (0.07 | ) |
| Paid-in capital from redemption fees | | | — | | | | — | | | | — | | | | 0.01 | | | | 0.00 | (2) | | | 0.02 | |
| Net asset value, end of period | | $ | 11.32 | | | $ | 10.54 | | | $ | 10.09 | | | $ | 9.23 | | | $ | 9.74 | | | $ | 6.87 | |
| | | | | | | | | | | | | | | | | | | | | | | | | |
| TOTAL RETURN | | | 36.03 | %(4) | | | 4.91 | % | | | 9.32 | % | | | (0.72 | )% | | | 41.78 | % | | | (37.00 | )% |
| | | | | | | | | | | | | | | | | | | | | | | | | |
| SUPPLEMENTAL DATA AND RATIOS: | | | | | | | | | | | | | | | | | | | | | | | | |
| Net assets, end of period (millions) | | $ | 20.88 | | | $ | 5.11 | | | $ | 24.08 | | | $ | 15.17 | | | $ | 16.20 | | | $ | 11.74 | |
| Ratio of expenses to average net assets: | | | | | | | | | | | | | | | | | | | | | | | | |
| Before expense reimbursement | | | 2.45 | %(5) | | | 2.33 | % | | | 2.10 | % | | | 2.14 | % | | | 3.10 | % | | | 4.47 | % |
| After expense reimbursement | | | 2.45 | %(5) | | | 2.33 | % | | | 2.10 | % | | | 2.01 | % | | | 1.60 | % | | | 1.60 | % |
| Ratio of net investment income (loss) to average net assets: | | | | | | | | | | | | | | | | | | | | | | | | |
| Before expense reimbursement | | | 0.97 | %(5) | | | (0.66 | )% | | | 0.17 | % | | | (0.14 | )% | | | (0.86 | )% | | | (2.60 | )% |
| After expense reimbursement | | | 0.97 | %(5) | | | (0.66 | )% | | | 0.17 | % | | | (0.01 | )% | | | 0.64 | % | | | 0.26 | % |
| Portfolio turnover rate | | | 37 | %(4) | | | 49 | % | | | 61 | % | | | 100 | % | | | 138 | % | | | 55 | % |
| (1) | The financial highlights set forth for periods prior to September 17, 2009 represent the historical financial highlights of the SPARX Japan Smaller Companies Fund. On September 17, 2009, Hennessy Advisors, Inc. became the investment advisor to the Fund and the Fund changed its name to the Hennessy Select SPARX Japan Smaller Companies Fund. In October 2012, the Fund changed its name to the Hennessy Japan Small Cap Fund. |
| (2) | Amount is less than $0.01 or $(0.01). |
| (3) | Calculated based on average shares outstanding. |
| (4) | Not Annualized. |
| (5) | Annualized. |
The accompanying notes are an integral part of these financial statements.
Notes to the Financial Statements
April 30, 2013 (Unaudited)
1). ORGANIZATION
The Hennessy Cornerstone Growth Fund (the “Growth Fund”), Hennessy Cornerstone Mid Cap 30 Fund (the “Mid Cap 30 Fund”) and Hennessy Cornerstone Value Fund (the “Value Fund”) (collectively, the “HMFI Funds”) are each series of Hennessy Mutual Funds, Inc., which was organized as a Maryland corporation on May 20, 1996. The HMFI Funds are open-end, diversified management investment companies registered under the Investment Company Act of 1940, as amended (the “1940 Act”). The investment objective of both the Growth Fund and Mid Cap 30 Fund is long-term growth of capital. The investment objective of the Value Fund is total return, consisting of capital appreciation and current income.
The Hennessy Cornerstone Large Growth Fund (the “Large Growth Fund”), Hennessy Large Value Fund (the “Large Value Fund”), Hennessy Focus Fund (the “Focus Fund”), Hennessy Gas Utility Index Fund (the “Gas Fund”), Hennessy Small Cap Financial Fund (the “Small Cap Financial Fund”), Hennessy Large Cap Financial Fund (the “Large Cap Financial Fund”), Hennessy Technology Fund (the “Technology Fund”), Hennessy Equity and Income Fund (the “Equity and Income Fund”), and Hennessy Core Bond Fund (the “Core Bond Fund”) (collectively, the “HFT Funds”), are each a series of the Hennessy Funds Trust, which was organized as a Delaware statutory trust on September 17, 1992. The Focus Fund, Gas Fund, Small Cap Financial Fund, Large Cap Financial Fund, Technology Fund, Equity and Income Fund and Core Bond Fund are each a successor to a series of The FBR Funds, a Delaware statutory trust, pursuant to a reorganization that took place after the close of business on October 26, 2012. The Focus Fund, Gas Fund, Small Cap Financial Fund, Large Cap Financial Fund, Technology Fund, Equity and Income Fund and Core Bond Fund are the successors to the FBR Focus Fund, FBR Gas Utility Index Fund, FBR Small Cap Financial Fund, FBR Large Cap Financial Fund, FBR Technology Fund, FBR Balanced Fund and the FBR Core Bond Fund, respectively (each, a “Predecessor FBR Fund” and collectively, the “Predecessor FBR Funds”). Prior to October 26, 2012, each successor HFT Fund had no investment operations. As a result of the reorganization, holders of the Investor Class shares of the Predecessor FBR Funds received Investor Class shares of the corresponding HFT Fund (the Investor Class shares of each HFT Fund are the successor to the accounting and performance information of the corresponding Predecessor FBR Fund), and holders of the Institutional Class shares of the Predecessor FBR Funds received Institutional Class shares of the corresponding HFT Fund (the Institutional Class shares of each HFT Fund are the successor to the accounting and performance information of the corresponding Predecessor FBR Fund). The Large Growth Fund, Large Value Fund, Equity and Income Fund and Core Bond Fund are open-end, diversified management investment companies registered under the 1940 Act. The Focus Fund, Gas Fund, Small Cap Financial Fund, Large Cap Financial Fund and Technology Fund are open-end, non-diversified management investment companies registered under the 1940 Act. The investment objective of the Large Growth Fund is long-term growth of capital. The investment objective of the Large Value Fund is long-term growth of capital and current income. The investment objective of the Focus Fund, Small Cap Financial Fund, Large Cap Financial Fund and Technology Fund is capital appreciation. The investment objective of the Gas Fund is income and capital appreciation. The investment objective of the Equity and Income Fund is long-term capital growth and current income. The investment objective of the Core Bond Fund is current income with capital growth as a secondary objective.
The Hennessy Balanced Fund (the “Balanced Fund”) and Hennessy Total Return Fund (the “Total Return Fund”) (together, the “HFI Funds”) are each series of Hennessy Funds, Inc., which was organized as a Maryland corporation on January 11, 1996. The HFI Funds are open-end, non-diversified management investment companies registered under the 1940 Act. The investment objective of the Balanced Fund is a combination of capital appreciation and current income. The investment objective of the Total Return Fund is total return, consisting of capital appreciation and current income.
The Hennessy Japan Fund (the “Japan Fund”) and the Hennessy Japan Small Cap Fund (the “Japan Small Cap Fund”) (together, the “HSFT Funds”) are each a series of Hennessy SPARX Funds Trust, which was organized as a Massachusetts business trust on July 24, 1995. The HSFT Funds are open-end, diversified management investment companies registered under the 1940 Act. Although each of the HSFT Funds will be considered a “diversified” mutual fund, they may employ relatively focused investment strategies and may hold securities of fewer issuers than other diversified funds. The investment objective of the HSFT Funds is long-term capital appreciation.
The Growth Fund, Focus Fund, Mid Cap 30 Fund, Large Growth Fund, Value Fund, Large Value Fund, Equity and Income Fund, Core Bond Fund, Small Cap Financial Fund, Technology Fund and Japan Fund offer Investor and Institutional Class shares. Prior to October 26, 2012, the Investor Class shares were known as Original Class shares. Each class of shares differs principally in its respective administration, 12b-1 distribution and service fees, shareholder servicing and transfer agent expenses and sales charges, if any. Each class has identical rights to earnings, assets and voting privileges, except for class-specific expenses and exclusive rights to vote on matters affecting only individual classes. The Total Return Fund, Balanced Fund, Gas Fund, Large Cap Financial Fund and Japan Small Cap Fund offer only Investor Class shares.
The HMFI Funds, HFT Funds, HFI Funds and HSFT Funds collectively comprise the Hennessy Funds (each, a “Fund”, and collectively the “Funds”).
2). SIGNIFICANT ACCOUNTING POLICIES
The following is a summary of significant accounting policies consistently followed by the Funds in the preparation of the financial statements. These policies are in conformity with U.S. generally accepted accounting principles (“GAAP”).
HENNESSY FUNDS 1-800-966-4354
| a). | Investment Valuation – All investments in securities are recorded at their estimated fair value, as described in Note 3. |
| | |
| b). | Federal Income Taxes – Provision for Federal income taxes or excise taxes has not been made since the Funds have elected to be taxed as “regulated investment companies” and intend to distribute substantially all taxable income to shareholders and otherwise comply with the provisions of the Internal Revenue Code applicable to regulated investment companies. Net investment income or loss and realized gains and losses for federal income tax purposes may differ from that reported on the financial statements because of temporary book and tax basis differences. Temporary differences are primarily the result of the treatment of wash sales for tax reporting purposes. Distributions from net realized gains for book purposes may include short-term capital gains, which are included as ordinary income to shareholders for tax purposes. |
| | |
| c). | Income and Expenses – Dividend income is recognized on the ex-dividend date or as soon as information is available to the Funds. Interest income, which includes the amortization of premium and accretion of discount, is recognized on an accrual basis. Income, expenses (other than expenses attributable to a specific class) and realized and unrealized gains or losses on investments are allocated to each class of shares based on its respective net assets. |
| | |
| d). | Distributions to Shareholders – Dividends from net investment income for the Growth Fund, Focus Fund, Mid Cap 30 Fund, Large Growth Fund, Value Fund, Large Value Fund, Small Cap Financial Fund, Large Cap Financial Fund, Technology Fund, Japan Fund and Japan Small Cap Fund, if any, are declared and paid out annually, usually in November or December of each year. Dividends from net investment income for the Total Return Fund, Gas Fund, Equity and Income Fund and Balanced Fund are declared and paid on a calendar quarter basis. The Core Bond Fund declares and pays net investment income, if any, monthly. Distributions of net realized capital gains, if any, are declared and paid annually, usually in November or December of each year, for all of the Funds. |
| | |
| e). | Security Transactions – Investment and shareholder transactions are recorded on the trade date. The Funds determine the gain or loss realized from the investment transactions by comparing the original cost of the security lot sold with the net sale proceeds. Discounts and premiums on securities purchased are accreted/amortized over the life of the respective security. |
| | |
| f). | Use of Estimates – The preparation of financial statements in conformity with GAAP requires management to make estimates and assumptions that affect the reported amounts of assets and liabilities and disclosure of contingent assets and liabilities at the date of the financial statements and the reported change in net assets during the reporting period. Actual results could differ from those estimates. |
| | |
| g). | Share Valuation – The net asset value (“NAV”) per share of each Fund is calculated by dividing the sum of the value of the securities held by such Fund, plus cash or other assets, minus all liabilities (including estimated accrued expenses) by the total number of shares outstanding for such Fund, rounded to the nearest cent. The Funds’ shares will not be priced on days on which the New York Stock Exchange is closed for trading. The offering and redemption price per share for each Fund is equal to each Fund’s net asset value per share. |
| | |
| h). | Foreign Currency – Values of investments denominated in foreign currencies are converted into U.S. dollars using the spot market rate of exchange at the time of valuation. Purchases and sales of investments and income are translated into U.S. dollars using the spot market rate of exchange prevailing on the respective dates of such transactions. The effect of changes in foreign exchange rates on realized and unrealized security gains and losses is reflected as a component of such gains or losses. Foreign investments present additional risks due to currency fluctuations, economic and political factors, lower liquidity, government regulations, differences in accounting standards and other factors. |
| | |
| i). | Forward Contracts – The Funds may enter into forward currency contracts to reduce their exposure to changes in foreign currency exchange rates on their foreign holdings and to lock in the U.S. dollar cost of firm purchase and sale commitments for securities denominated in foreign currencies. A forward currency contract is a commitment to purchase or sell a foreign currency at a future date at a negotiated forward rate. The gain or loss arising from the difference between the U.S. dollar cost of the original contract and the value of the foreign currency in U.S. dollars upon closing of such contract is included in net realized gain or loss from foreign currency transactions. During the six months ended April 30, 2013, the Funds did not enter into any forward contracts. |
| | |
| j). | Repurchase Agreements – The Funds may enter into repurchase agreements with member banks or security dealers of the Federal Reserve Board whom the investment advisor deems creditworthy. The repurchase price generally equals the price paid by the Fund plus interest negotiated on the basis of current short-term rates. |
| | |
| | Securities pledged as collateral for repurchase agreements are held by the custodian bank until the respective agreements mature. Provisions of the repurchase agreements ensure that the market value of the collateral, including accrued interest thereon, is sufficient, in the event of default of the counterparty. If the counterparty defaults and the value of the collateral declines or if the counterparty enters an insolvency proceeding, realization of the collateral by the Fund may be delayed or limited. |
| | |
| k). | Accounting for Uncertainty in Income Taxes – The Funds have adopted accounting policies regarding recognition and measurement of tax positions taken or expected to be taken on a tax return. The Funds have reviewed all open tax years in major jurisdictions and concluded that there is no impact on the Funds’ net assets and no tax liability resulting from unrecognized tax benefits relating to uncertain income tax positions taken or expected to be taken on a tax return. As of April 30, 2013, open Federal and state tax years for the Funds include the tax years ended October 31, 2010 through 2012. |
| | |
| l). | Derivatives – The Funds may invest in, or enter into, derivatives, such as options, futures contracts, options on futures contracts and swaps, for a variety of reasons, including to hedge certain risks, to provide a substitute for purchasing or selling particular securities or to increase potential income gain. Derivatives may provide a cheaper, quicker or more specifically focused way for a Fund to invest than “traditional” securities would. The main purpose of utilizing these derivative instruments is for hedging purposes. |
| | The Funds have adopted the financial accounting reporting rules as required by the Derivatives and Hedging Topic of the FASB Accounting Standards Codification. The Funds are required to include enhanced disclosure that enables investors to understand how and why an entity uses derivatives, how derivatives are accounted for and how derivatives instruments affect an entity’s results of operations and financial position. During the six months ended April 30, 2013, the Funds did not hold any derivative instruments. |
| | |
| m). | Events Subsequent to the Fiscal Period End – The Funds have adopted financial reporting rules regarding subsequent events that require an entity to recognize in the financial statements the effects of all subsequent events that provide additional evidence about conditions that existed at the date of the balance sheet. Management has evaluated the Funds’ related events and transactions that occurred subsequent to April 30, 2013 through the date of issuance of the Funds’ financial statements. There were no events or transactions that occurred during this period that materially impacted the amounts or disclosures in the Funds’ financial statements. |
| | |
| n). | New Accounting Pronouncements – In December 2011, FASB issued Accounting Standards Update (“ASU”) No. 2011-11 related to disclosures about offsetting assets and liabilities. The amendments in this ASU require an entity to disclose information about offsetting and related arrangements to enable users of its financial statements to understand the effect of those arrangements on its financial position. The ASU is effective for annual reporting periods beginning on or after January 1, 2013 and interim periods within those annual periods. The guidance requires retrospective applications for all comparative periods presented. Management is currently evaluating the impact ASU No. 2011-11 will have on the financial statements disclosures. |
3). SECURITIES VALUATION
The Funds have adopted authoritative fair valuation accounting standards that establish an authoritative definition of fair value and set out a hierarchy for measuring fair value. These standards require additional disclosures about the various inputs and valuation techniques used to develop the measurements of fair value and a discussion in changes in valuation techniques and related inputs during the period. These inputs are summarized in the three broad levels listed below:
| Level 1 – | Quoted unadjusted prices for identical instruments in active markets to which the Fund has access at the date of measurement. |
| | |
| Level 2 – | Quoted prices for similar instruments in active markets; quoted prices for identical or similar instruments in markets that are not active; and model-derived valuations in which all significant inputs and significant value drivers are observable in active markets. Level 2 inputs are those in markets for which there are few transactions, the prices are not current, the prices are fair value adjusted due to post market close subsequent events (foreign markets), little public information exists or instances where prices vary substantially over time or among brokered market makers. These inputs may also include interest rates, prepayment speeds, credit risk curves, default rates and similar data. |
| | |
| Level 3 – | Model-derived valuations in which one or more significant inputs or significant value drivers are unobservable. Unobservable inputs are those inputs that reflect the Funds’ own assumptions about what market participants would use to price the asset or liability based on the best available information. |
Following is a description of the valuation techniques applied to the Funds’ major categories of assets and liabilities measured at fair value on a recurring basis.
Equity Securities – Equity securities, including common stocks, preferred stocks, foreign issued common stocks, exchange traded funds, closed-end mutual funds and real estate investment trusts, which are traded on a securities exchange for which a last-quoted sales price is readily available will be valued at the last sales price as reported by the primary exchange on which the securities are listed. Securities listed on the Nasdaq National Market System (“Nasdaq”) will be valued at the Nasdaq Official Closing Price, which may differ from the last sales price reported. Securities traded on a securities exchange for which a last-quoted sales price is not readily available will be valued at the mean between the bid and ask prices. To the extent these securities are actively traded and valuation adjustments are not applied, they are categorized in Level 1 of the fair value hierarchy.
Investment Companies – Investments in investment companies (e.g., mutual funds and exchange traded funds) are generally priced at the ending net asset value (NAV) provided by the service agent of the Funds and will be classified in Level 1 of the fair value hierarchy.
Debt Securities – Debt securities, such as corporate bonds, asset backed securities, mortgage backed securities, municipal bonds, U.S. Treasuries and U.S. government agency issues are valued at market on the basis of valuations furnished by an independent pricing service that utilizes both dealer-supplied valuations and formula-based techniques. The pricing service may consider recently executed transactions in securities of the issuer or comparable issuers, market price quotations (where observable), bond spreads and fundamental data relating to the issuer. In addition, the model may incorporate market observable data such as reported sales of similar securities, broker quotes, yields, bids, offers, and reference data. Certain securities are valued principally using dealer quotations. These securities will generally be classified in level 2 of the fair value hierarchy.
Short-Term Securities – Short-term equity investments, including money market funds, are valued in the manner specified above. Short-term debt investments are valued at amortized cost, if their original maturity was 60 days or less, or by amortizing the values as of the 61st day prior to maturity, if their original term to maturity exceeded 60 days. Short-term securities are generally in Level 1 or Level 2 of the fair market hierarchy depending on the inputs used and market activity levels for specific securities.
The Board of Directors/Trustees of the Funds (the “Board”) has adopted fair value pricing procedures that are followed when a price for a security is not readily available or if a significant event has occurred that indicates the closing price of a security no longer
HENNESSY FUNDS 1-800-966-4354
represents the true value of that security. Fair value pricing determinations are made in good faith in accordance with these procedures. There are numerous criteria that will be given consideration in determining a fair value of a security. Some of these criteria are trading volume of security and markets, value of other like securities and news events with direct bearing to security or market. Fair value pricing results in an estimated price that reasonably reflects the current market conditions in order to rate the portfolio holdings such that shareholder transactions receive a fair net asset value. Depending on the relative significance of the valuation inputs, these securities may be classified in either Level 2 or Level 3 of the fair value hierarchy.
Fair valuing of foreign securities may be determined with the assistance of a pricing service using correlations between the movement of prices of such securities and indices of domestic securities and other appropriate indicators, such as closing market prices of relevant American Depositary Receipts or futures contracts. The effect of using fair value pricing is that the Funds’ NAVs will reflect the affected portfolio securities’ value as determined in the judgment of the Board or its designee instead of being determined by the market. Using a fair value pricing methodology to price securities may result in a value that is different from a security’s most recent closing price and from the prices used by other investment companies to calculate their net asset values and are considered Level 2 prices in the fair valuation hierarchy. Because the Funds invest in foreign securities, the value of the Funds’ portfolio securities may change on days when you will not be able to purchase or redeem your shares. Depending on the relative significance of the valuation inputs, these securities may be classified in either Level 2 or Level 3 of the fair value hierarchy.
The Board has delegated day-to-day valuation issues to a Valuation Committee comprised of one or more representatives from Hennessy Advisors, Inc., the Funds’ investment advisor. The function of the Valuation Committee is to value securities where current and reliable market quotations are not readily available. All actions taken by the Valuation Committee are reviewed by the Board.
The Funds have performed an analysis of all existing investments to determine the significance and character of all inputs to their fair value determination. Various inputs are used in determining the value of each Fund’s investments. The inputs or methodology used for valuing securities are not necessarily an indication of the risk associated with investing in those securities. Details related to the fair valuation hierarchy of the Funds’ securities as of April 30, 2013 are included with each Fund’s Schedule of Investments.
4). REVERSE REPURCHASE AGREEMENTS
The Total Return Fund may enter into reverse repurchase agreements with the same parties with whom it may enter into repurchase agreements. Under a reverse repurchase agreement, the Fund sells securities and agrees to repurchase them at a mutually agreed upon date and price. Reverse repurchase agreements are regarded as a form of secured borrowing by the Fund. Securities sold under reverse repurchase agreements are reflected as a liability on the Statement of Assets and Liabilities. Interest payments made are recorded as a component of interest expense on the Statement of Operations.
For the six months ended April 30, 2013, the average daily balance and average interest rate in effect for reverse repurchase agreements were $29,947,122 and 0.28%, respectively. At April 30, 2013, the interest rate in effect for the outstanding reverse repurchase agreements, which were scheduled to mature on May 16, 2013, ($12,593,000), June 13, 2013 ($8,995,000), and July 18, 2013 ($10,794,000), were 0.27%, 0.25% and 0.25%, respectively. Outstanding reverse repurchase agreements at April 30, 2013 were equal to 39.51% of the Total Return Fund’s net assets.
5). INVESTMENT TRANSACTIONS
Purchases and sales of investment securities (excluding government and short-term investments) during the six months ended April 30, 2013, were as follows:
| | | Growth | | | Focus | | | Mid Cap 30 | | | Large Growth | |
| | | Fund | | | Fund | | | Fund | | | Fund | |
| Purchase | | $ | 292,040,641 | | | $ | 19,897,120 | | | $ | 198,150,897 | | | $ | 71,640,034 | |
| Sales | | $ | 299,378,393 | | | $ | 878,023 | | | $ | 205,991,112 | | | $ | 93,240,710 | |
| | | | | | | | | | | | | | | | |
| | | | | | | | | | | | | | | Equity and | |
| | | Value | | | Large Value | | | Total Return | | | Income | |
| | | Fund | | | Fund | | | Fund | | | Fund | |
| Purchase | | $ | 53,889,536 | | | $ | 64,362,342 | | | $ | 6,768,355 | | | $ | 28,167,117 | |
| Sales | | $ | 59,095,002 | | | $ | 69,921,547 | | | $ | 6,845,108 | | | $ | 50,873,115 | |
| | | | | | | | | | | | | | | | |
| | | | | | | | | | | | | | | Small Cap | |
| | | Balanced | | | Core Bond | | | Gas | | | Financial | |
| | | Fund | | | Fund | | | Fund | | | Fund | |
| Purchase | | $ | 548,456 | | | $ | 1,086,683 | | | $ | 172,186,958 | | | $ | 100,207,694 | |
| Sales | | $ | 2,503,134 | | | $ | 12,688,303 | | | $ | 45,502,650 | | | $ | 78,942,694 | |
| | | | | | | | | | | | | | | | |
| | | Large Cap | | | | | | | | | | | | | |
| | | Financial | | | Technology | | | Japan | | | Japan Small | |
| | | Fund | | | Fund | | | Fund | | | Cap | |
| Purchase | | $ | 21,861,944 | | | $ | 3,269,730 | | | $ | 4,013,744 | | | $ | 13,776,008 | |
| Sales | | $ | 35,242,317 | | | $ | 3,683,637 | | | $ | 1,392,443 | | | $ | 4,181,173 | |
Purchases and sales/maturities of long-term U.S. Government Securities for the Equity and Income Fund were $30,625,903 and $58,968,331, respectively, for the six months ended April 30, 2013. Purchases and sales/maturities of long-term U.S. Government Securities for the Balanced Fund were $0 and $4,700,000, respectively, for the six months ended April 30, 2013. Purchases and
sales/maturities of long-term U.S. Government Securities for the Core Bond Fund were $8,201,671 and $20,808,913, respectively, for the six months ended April 30, 2013. There were no purchases or sales/maturities of long-term U.S. Government Securities for the Growth Fund, Focus Fund, Mid Cap 30 Fund, Large Growth Fund, Value Fund, Large Value Fund, Total Return Fund, Gas Fund, Small Cap Financial Fund, Large Cap Financial Fund, Technology Fund, Japan Fund or Japan Small Cap Fund for the six months ended April 30, 2013.
6). INVESTMENT MANAGEMENT FEE AND OTHER TRANSACTIONS WITH AFFILIATES
Hennessy Advisors, Inc. (the “Advisor”) is the investment advisor of the Funds. The Advisor provides the Funds with investment management services under a Management Agreement. The Advisor furnishes all investment advice, office space, facilities, and provides most of the personnel needed by the Funds. As compensation for its services, the Advisor is entitled to a monthly fee from each Fund. The fee is based upon the average daily net assets of the Funds at the annual rate of:
| | Growth Fund | 0.74% | | Core Bond Fund | 0.80% | |
| | Focus Fund | 0.90% | | Balanced Fund | 0.60% | |
| | Mid Cap 30 Fund | 0.74% | | Gas Fund | 0.40% | |
| | Large Growth Fund | 0.74% | | Small Cap Financial Fund | 0.90% | |
| | Value Fund | 0.74% | | Large Cap Financial Fund | 0.90% | |
| | Large Value Fund | 0.85% | | Technology Fund | 0.90% | |
| | Total Return Fund | 0.60% | | Japan Fund | 1.00% | |
| | Equity and Income Fund | 0.80% | | Japan Small Cap Fund | 1.20% | |
Net Advisor fees payable for the Funds as of April 30, 2013, were:
| | Growth Fund | | $ | 194,349 | | Balanced Fund | | $ | 6,534 | |
| | Focus Fund | | $ | 654,456 | | Core Bond Fund | | $ | — | |
| | Mid Cap 30 Fund | | $ | 123,284 | | Gas Fund | | $ | 309,838 | |
| | Large Growth Fund | | $ | 58,042 | | Small Cap Financial Fund | | $ | 188,330 | |
| | Value Fund | | $ | 83,086 | | Large Cap Financial Fund | | $ | 43,473 | |
| | Large Value Fund | | $ | 95,418 | | Technology Fund | | $ | — | |
| | Total Return Fund | | $ | 39,730 | | Japan Fund | | $ | 21,217 | |
| | Equity and Income Fund | | $ | 175,708 | | Japan Small Cap Fund | | $ | 17,167 | |
The Advisor has delegated the day-to-day management of the Focus Fund to a sub-advisor, Broad Run Investment Management, LLC. The Advisor has delegated the day-to-day management of the Large Value Fund to RBC Global Asset Management (U.S.), Inc.. The Advisor has delegated the day-to-day management of the Equity and Income Fund to Financial Counselors, Inc. (“FCI”) and The London Company. The Advisor has delegated the day-to-day management of the Core Bond Fund to FCI. The Advisor has delegated the day-to-day management of the Japan Fund and Japan Small Cap Fund to SPARX Asset Management Co. Ltd.. The Advisor pays the sub-advisor fees for each of the Funds from its own assets and these fees are not an additional expense of the Funds.
The Advisor has agreed to waive its fees and absorb expenses to the extent that the total annual operating expenses (excluding all Federal, state and local taxes, interest, brokerage commissions, acquired fund fees and expenses and other costs incurred in connection with the purchase and sale of securities and extraordinary items) do not exceed 0.98% of the Funds’ net assets for the Institutional Class shares of the Growth Fund, Mid Cap 30 Fund, Large Growth Fund, Value Fund and Large Value Fund. The expense limitation agreement for the Institutional Class shares can only be terminated by the Board. For a period of three years after the year in which the Advisor waives or reimburses expenses, the Advisor may seek reimbursement from the Funds to the extent that total annual Fund operating expenses are less than the expense limitation in effect at the time of the reimbursement. During the three years ended October 31, 2012, no Advisor fees were waived and therefore no expenses are subject to potential recovery.
The Advisor has contractually agreed to limit each class of shares of the Focus Fund, Gas Fund, Small Cap Financial Fund, Large Cap Financial Fund, Technology Fund, Equity and Income Fund and Core Bond Fund total operating expenses and to maintain these limitations with regard to each class of shares of each Fund through February 28, 2015. The following are the limits for the Funds, based on average daily net assets (excluding interest, taxes, brokerage commissions, dividend expenses, acquired fund fees and expenses, extraordinary legal expenses, or any other extraordinary expenses, and for the Equity and Income Fund and Core Bond Fund, also excluding 12b-1 fees):
| | | Investor Class | Institutional Class | |
| | Focus Fund | 1.95% | 1.70% | |
| | Gas Fund | 0.85% | N/A | |
| | Small Cap Financial Fund | 1.95% | 1.70% | |
| | Large Cap Financial Fund | 1.95% | N/A | |
| | Technology Fund | 1.95% | 1.70% | |
| | Equity and Income Fund | 1.08%* | 1.08% | |
| | Core Bond Fund | 1.05%* | 1.05% | |
| | * | Amount shown excludes the 12b-1 fee. Including the 12b-1 fee, the amounts are 1.33% and 1.30% for the Equity and Income Fund and Core Bond Fund, respectively. |
HENNESSY FUNDS 1-800-966-4354
For a period of three years after the year in which the Advisor waives or reimburses expenses, the Advisor may seek reimbursement from the Funds to the extent that total annual Fund operating expenses are less than the expense limitation in effect at the time of the reimbursement. The Advisor waived or reimbursed expenses of $3,667, $55,476 and $29,988 for the Equity and Income, Core Bond and Technology Funds, respectively, during the period ended April 30, 2013. As of April 30, 2013, cumulative expenses subject to potential recovery to the aforementioned conditions and year of expiration are as follows:
| | | Oct. 31, 2015 | | Oct. 31, 2016 | | Total |
| | Equity and Income Fund – Inv. Class | | $ | — | | | | $ | 3,667 | | | | $ | 3,667 | |
| | Equity and Income Fund – Inst. Class | | $ | — | | | | $ | — | | | | $ | — | |
| | Core Bond Fund – Inv. Class | | $ | 755 | | | | $ | 10,747 | | | | $ | 11,502 | |
| | Core Bond Fund – Inst. Class | | $ | 4 | | | | $ | 44,729 | | | | $ | 44,733 | |
| | Technology Fund – Inv. Class | | $ | 619 | | | | $ | 24,617 | | | | $ | 5,236 | |
| | Technology Fund – Inst. Class | | $ | 151 | | | | $ | 5,371 | | | | $ | 5,522 | |
The Large Value Fund, Japan Fund and Japan Small Cap Fund each have operating expense limitation agreements that have since expired or have been terminated by the Board. As of April 30, 2013, cumulative expenses subject to potential recovery to the aforementioned conditions and year of expiration are as follows:
| | | Oct. 31, 2013 | | Total |
| | Large Value Fund – Inv. Class | | $ | 38,444 | | | | $ | 38,444 | |
| | Japan Fund – Inv. Class | | $ | 37,425 | | | | $ | 37,425 | |
| | Japan Fund – Inst. Class | | $ | 12,915 | | | | $ | 12,915 | |
| | Japan Small Cap Fund – Inv. Class | | $ | 19,527 | | | | $ | 19,527 | |
The Board has approved a Shareholder Servicing Plan for the Investor Class shares of each of the Growth Fund, Mid Cap 30 Fund, Large Growth Fund, Value Fund, Large Value Fund, Total Return Fund, Balanced Fund, Japan Fund and Japan Small Cap Fund, which was instituted to compensate the Advisor for the non-investment management services it provides to the Funds. The Plan provides for a monthly fee paid to the Advisor at an annual rate of 0.10% of the average daily net assets of the Funds.
Service fees payable for the Funds as of April 30, 2013 were:
| | Growth Fund | | $ | 23,918 | | Total Return Fund | | $ | 6,622 | |
| | Mid Cap 30 Fund | | $ | 12,874 | | Balanced Fund | | $ | 1,089 | |
| | Large Growth Fund | | $ | 6,550 | | Japan Fund | | $ | 1,528 | |
| | Value Fund | | $ | 10,894 | | Japan Small Cap Fund | | $ | 1,430 | |
| | Large Value Fund | | $ | 11,186 | | | | | | |
The Total Return Fund and Balanced Fund have adopted a plan pursuant to Rule 12b-1 that authorizes payments in connection with the distribution of each such Fund’s shares at an annual rate not to exceed 0.15% of each such Fund’s average daily net assets. The Focus Fund, Small Cap Financial Fund, Large Cap Financial Fund, Technology Fund, Equity and Income Fund and Core Bond Fund have adopted a plan pursuant to Rule 12b-1 that authorizes payments in connection with the distribution of these Funds’ shares at an annual rate of up to 0.25% of each such Fund’s average daily net assets attributable to Investor Class shares. Amounts paid under the plan may be spent on any activities or expenses primarily intended to result in the sale of shares, including but not limited to, advertising, compensation for sales and marketing activities or financial institutions and others such as dealers and distributors, shareholder account servicing, the printing and mailing of prospectuses to other than current shareowners and the printing and mailing of sales literature. The Gas Fund has adopted a plan pursuant to Rule 12b-1 but it will not be implemented prior to October 29, 2014.
The Funds have entered into agreements with various brokers, dealers and financial intermediaries in connection with the sale of shares of the Funds. The agreements provide for periodic payments by the Funds to the brokers, dealers and financial intermediaries for providing certain shareholder maintenance services (sub-transfer agent expenses). These shareholder services include the pre-processing and quality control of new accounts, shareholder correspondence, answering customer inquiries regarding account status and facilitating shareholder telephone transactions. Fees paid by the Funds to various brokers, dealers and financial intermediaries for the six months ended April 30, 2013 were:
| | Growth Fund | | $ | 260,479 | | Balanced Fund | | $ | 8,264 | |
| | Focus Fund | | $ | 409,857 | | Core Bond Fund | | $ | 11,043 | |
| | Mid Cap 30 Fund | | $ | 142,107 | | Gas Fund | | $ | 617,315 | |
| | Large Growth Fund | | $ | 15,997 | | Small Cap Financial Fund | | $ | 114,881 | |
| | Value Fund | | $ | 43,381 | | Large Cap Financial Fund | | $ | 35,817 | |
| | Large Value Fund | | $ | 45,348 | | Technology Fund | | $ | 1,316 | |
| | Total Return Fund | | $ | 29,895 | | Japan Fund | | $ | 18,538 | |
| | Equity and Income Fund | | $ | 97,952 | | Japan Small Cap Fund | | $ | 15,384 | |
U.S. Bancorp Fund Services, LLC (the “Administrator”) acts as the Funds’ Administrator under an Administration Agreement. Administrative services under this agreement include custody, distribution, fund accounting, fund administration and transfer agent services. In addition, the Administrator does the following: prepares various federal and state regulatory filings, reports and returns for the Funds; prepares reports and materials to be supplied to the Board; monitors the activities of the Funds’ custodian, transfer agent and accountants; and coordinates the preparation and payment of the Funds’ expenses and reviews the Funds’ expense accruals. Fees paid to the Administrator for the six months ended April 30, 2013 were:
| | Growth Fund | | $ | 328,610 | | Balanced Fund | | $ | 16,214 | |
| | Focus Fund | | $ | 490,242 | | Core Bond Fund | | $ | 14,727 | |
| | Mid Cap 30 Fund | | $ | 186,422 | | Gas Fund | | $ | 470,499 | |
| | Large Growth Fund | | $ | 106,363 | | Small Cap Financial Fund | | $ | 140,278 | |
| | Value Fund | | $ | 137,606 | | Large Cap Financial Fund | | $ | 35,889 | |
| | Large Value Fund | | $ | 136,184 | | Technology Fund | | $ | 3,259 | |
| | Total Return Fund | | $ | 80,491 | | Japan Fund | | $ | 22,656 | |
| | Equity and Income Fund | | $ | 167,248 | | Japan Small Cap Fund | | $ | 12,276 | |
The Administrator has voluntarily waived all or a portion of its administration fees allocated to the Institutional Class shares of the Growth Fund, Mid Cap 30 Fund, Large Growth Fund, Value Fund and Large Value Fund. The administration fees voluntarily waived by the Administrator during the six months ended April 30, 2013 were $18,771, $20,670, $13,207, $1,603 and $118, respectively.
Quasar Distributors, LLC (the “Distributor”) acts as the Funds’ principal underwriter in a continuous public offering of the Funds’ shares. The Distributor is an affiliated company of U.S. Bank, N.A., the Fund’s Administrator.
7). FEDERAL TAX INFORMATION
As of October 31, 2012, the Funds’ most recent fiscal year end, the components of accumulated earnings (losses) for income tax purposes were as follows:
| | | | Growth | | | Focus | | | Mid Cap 30 | | | Large Growth | |
| | | | Fund | | | Fund | | | Fund | | | Fund | |
| | Cost of investments for tax purposes | | $ | 272,787,207 | | | $ | 442,578,126 | | | $ | 162,770,617 | | | $ | 101,226,194 | |
| | Gross tax unrealized appreciation | | | 44,200,587 | | | | 357,306,224 | | | | 30,575,395 | | | | 18,829,340 | |
| | Gross tax unrealized depreciation | | | (15,674,995 | ) | | | (14,160,506 | ) | | | (3,255,399 | ) | | | (10,266,235 | ) |
| | Net tax unrealized appreciation/depreciation | | $ | 28,525,592 | | | $ | 343,145,718 | | | $ | 27,319,996 | | | $ | 8,563,105 | |
| | Undistributed ordinary income | | $ | — | | | $ | — | | | $ | 1,029,849 | | | $ | 1,080,454 | |
| | Undistributed long-term capital gains | | | — | | | | 63,358,200 | | | | — | | | | 169,340 | |
| | Total distributable earnings | | $ | — | | | $ | 63,358,200 | | | $ | 1,029,849 | | | $ | 1,249,794 | |
| | Other accumulated gain/(loss) | | $ | (246,589,256 | ) | | $ | (5,555,872 | ) | | $ | (44,993,297 | ) | | $ | (4,061,012 | ) |
| | Total accumulated gain/(loss) | | $ | (218,063,664 | ) | | $ | 400,948,046 | | | $ | (16,643,452 | ) | | $ | 5,751,887 | |
| | | | | | | | | | | | | | | | | | |
| | | | | | | | | | | | | | | | Equity and | |
| | | | Value | | | Large Value | | | Total Return | | | Income | |
| | | | Fund | | | Fund | | | Fund | | | Fund | |
| | Cost of investments for tax purposes | | $ | 108,730,517 | | | $ | 107,067,386 | | | $ | 98,251,218 | | | $ | 279,885,717 | |
| | Gross tax unrealized appreciation | | | 21,078,375 | | | | 20,433,398 | | | | 8,394,757 | | | | 28,255,283 | |
| | Gross tax unrealized depreciation | | | (2,156,189 | ) | | | (2,008,917 | ) | | | (170,519 | ) | | | (4,545,755 | ) |
| | Net tax unrealized appreciation/depreciation | | $ | 18,922,186 | | | $ | 18,424,481 | | | $ | 8,224,238 | | | $ | 23,709,528 | |
| | Undistributed ordinary income | | $ | 2,446,268 | | | $ | 1,060,739 | | | $ | 78,405 | | | $ | 312,645 | |
| | Undistributed long-term capital gains | | | — | | | | — | | | | — | | | | — | |
| | Total distributable earnings | | $ | 2,446,268 | | | $ | 1,060,739 | | | $ | 78,405 | | | $ | 312,645 | |
| | Other accumulated gain/(loss) | | $ | (43,841,856 | ) | | $ | (29,476,742 | ) | | $ | (7,009,187 | ) | | $ | (2,913,369 | ) |
| | Total accumulated gain/(loss) | | $ | (22,473,402 | ) | | $ | (9,991,522 | ) | | $ | 1,293,456 | | | $ | 21,108,804 | |
| | | | | | | | | | | | | | | | | | |
| | | | | | | | | | | | | | | | Small Cap | |
| | | | Balanced | | | Core Bond | | | Gas | | | Financial | |
| | | | Fund | | | Fund | | | Fund | | | Fund | |
| | Cost of investments for tax purposes | | $ | 23,578,357 | | | $ | 34,804,033 | | | $ | 564,677,823 | | | $ | 191,400,745 | |
| | Gross tax unrealized appreciation | | | 1,793,810 | | | | 2,158,247 | | | | 201,268,754 | | | | 33,959,132 | |
| | Gross tax unrealized depreciation | | | (186,959 | ) | | | (342,459 | ) | | | (20,757,180 | ) | | | (14,179,104 | ) |
| | Net tax unrealized appreciation/depreciation | | $ | 1,606,851 | | | $ | 1,815,788 | | | $ | 180,511,574 | | | $ | 19,780,028 | |
| | Net unrealized gain/loss - foreign currency | | | — | | | | — | | | | (5,245 | ) | | | — | |
| | Undistributed ordinary income | | $ | 2,932 | | | $ | 379,230 | | | $ | 3,186,762 | | | $ | 715,079 | |
| | Undistributed long-term capital gains | | | — | | | | 368,448 | | | | 14,828,033 | | | | — | |
| | Total distributable earnings | | $ | 2,932 | | | $ | 747,678 | | | $ | 18,014,795 | | | $ | 715,079 | |
| | Other accumulated gain/(loss) | | $ | (1,233,401 | ) | | $ | — | | | $ | — | | | $ | (3,658,128 | ) |
| | Total accumulated gain/(loss) | | $ | 376,382 | | | $ | 2,563,466 | | | $ | 198,521,124 | | | $ | 16,836,979 | |
HENNESSY FUNDS 1-800-966-4354
| | | | Large Cap | | | | | | | | | | |
| | | | Financial | | | Technology | | | Japan | | | Japan Small | |
| | | | Fund | | | Fund | | | Fund | | | Cap | |
| | Cost of investments for tax purposes | | $ | 61,160,366 | | | $ | 5,457,305 | | | $ | 15,823,302 | | | $ | 5,091,643 | |
| | Gross tax unrealized appreciation | | | 9,016,974 | | | | 326,484 | | | | 4,105,359 | | | | 590,961 | |
| | Gross tax unrealized depreciation | | | (5,456,894 | ) | | | (373,173 | ) | | | (677,280 | ) | | | (454,726 | ) |
| | Net tax unrealized appreciation/depreciation | | $ | 3,560,080 | | | $ | (46,689 | ) | | $ | 3,428,079 | | | $ | 136,235 | |
| | Undistributed ordinary income | | $ | 50,837 | | | $ | — | | | $ | — | | | $ | — | |
| | Undistributed long-term capital gains | | | — | | | | — | | | | — | | | | 1,115,067 | |
| | Total distributable earnings | | $ | 50,837 | | | $ | — | | | $ | — | | | $ | 1,115,067 | |
| | Other accumulated gain/(loss) | | $ | (3,635,103 | ) | | $ | (2,273,175 | ) | | $ | (33,406,069 | ) | | $ | (58,667 | ) |
| | Total accumulated gain/(loss) | | $ | (24,186 | ) | | $ | (2,319,864 | ) | | $ | (29,977,990 | ) | | $ | 1,192,635 | |
The difference between book-basis and tax-basis unrealized appreciation is attributable primarily to capital loss carry overs, wash sales, and partnership adjustments.
At October 31, 2012, the Funds had capital loss carryforwards that expire as follows:
| | Growth Fund | $ 60,841,121 | 10/31/16 | |
| | | 183,155,263 | 10/31/17 | |
| | Mid Cap 30 Fund | 3,858,159 | 10/31/16 | |
| | | 41,135,138 | 10/31/17 | |
| | Large Growth Fund | 4,061,012 | 10/31/16 | |
| | Value Fund | 43,841,856 | 10/31/17 | |
| | Large Value Fund | 29,468,928 | 10/31/17 | |
| | Total Return Fund | 7,009,187 | 10/31/17 | |
| | Equity and Income Fund | 2,913,369 | 10/31/17 | |
| | Balanced Fund | 1,233,401 | 10/31/17 | |
| | Small Cap Financial Fund | 3,568,128 | 10/31/19 | |
| | Large Cap Financial Fund | 10,229 | 10/31/16 | |
| | | 1,162,148 | 10/31/17 | |
| | | 874,811 | 10/31/19 | |
| | | 398,257 | indefinite (ST) | |
| | | 1,189,658 | indefinite (LT) | |
| | Technology Fund | 237,174 | 10/31/16 | |
| | | 1,908,045 | 10/31/17 | |
| | | 60,544 | indefinite (LT) | |
| | Japan Fund | 4,786,618 | 10/31/15 | |
| | | 6,231,544 | 10/31/16 | |
| | | 15,450,664 | 10/31/17 | |
| | | 6,121,138 | 10/31/18 | |
| | | 373,080 | Indefinite ST | |
| | | 439,149 | Indefinite LT | |
At October 31, 2012, the Focus Fund, Core Bond Fund, Gas Fund and Japan Small Cap Fund had no tax basis capital losses to offset future capital gains.
During the year ended October 31, 2012, the capital loss carry forwards utilized for each Fund were as follows:
| | Growth Fund | | $ | 5,439,299 | | Total Return Fund | | $ | 3,320,669 | |
| | Mid Cap 30 Fund | | $ | 573,537 | | Equity and Income Fund | | $ | 1,432,437 | |
| | Large Growth Fund | | $ | 2,352 | | Balanced Fund | | $ | 502,700 | |
| | Value Fund | | $ | 2,872,985 | | Small Cap Financial Fund | | $ | 2,807,880 | |
| | Large Value Fund | | $ | 9,750,615 | | Japan Small Cap Fund | | $ | 694,391 | |
Under recently enacted legislation, capital losses sustained in the year ended December 31, 2011 and in future taxable years will not expire and may be carried over by the Fund without limitation; however, they will retain the character of the original loss. Furthermore, any losses incurred during those taxable years will be required to be utilized prior to the losses incurred in the pre-enactment taxable years. As a result of this ordering rule, pre-enactment capital loss carryforwards may be more likely to expire unused. Under pre-enactment law, capital losses could be carried forward for eight years, and carried forward as short-term capital losses, irrespective of the character of the original loss.
At October 31, 2012, the following Funds deferred, on a tax basis, post-October losses of:
| | | Post October Late Year | | Post October | | |
| | | Ordinary Loss Deferral | | Loss Deferral | | |
| | Growth Fund | | $ | 2,592,872 | | | — | | |
| | Focus Fund | | $ | (5,555,872 | ) | | — | | |
| | Mid Cap 30 Fund | | | — | | | — | | |
| | Large Growth Fund | | | — | | | — | | |
| | Value Fund | | | — | | | — | | |
| | Large Value Fund | | | — | | | — | | |
| | Total Return Fund | | | — | | | — | | |
| | Equity and Income Fund | | | — | | | — | | |
| | Balanced Fund | | | — | | | — | | |
| | Core Bond Fund | | | — | | | — | | |
| | Gas Fund | | | — | | | — | | |
| | Small Cap Financial Fund | | | — | | | — | | |
| | Large Cap Financial Fund | | | — | | | — | | |
| | Technology Fund | | $ | (64,030 | ) | | — | | |
| | Japan Fund | | | — | | | — | | |
| | Japan Small Cap Fund | | $ | 57,735 | | | — | | |
The tax character of distributions paid during 2013 and 2012 for the Funds were as follows:
| | | Six Months Ended | | Year Ended | |
| | Growth Fund | April 30, 2013 | | October 31, 2012 | |
| | Ordinary Income | | $ | — | | | | $ | — | | |
| | Long-term capital gain | | | — | | | | | — | | |
| | | | $ | — | | | | $ | — | | |
| | | | | | | | | | |
| | | Six Months Ended | | Year Ended | |
| | Focus Fund | April 30, 2013 | | October 31, 2012 | |
| | Ordinary Income | | $ | — | | | | $ | — | | |
| | Long-term capital gain | | | 63,640,872 | | | | | 68,842,192 | | |
| | | | $ | 63,640,872 | | | | $ | 68,842,192 | | |
| | | | | | | | | | |
| | | Six Months Ended | | | Year Ended | | |
| | Mid Cap 30 Fund | April 30, 2013 | | October 31, 2012 | |
| | Ordinary Income | | $ | 2,325,856 | | | | $ | — | | |
| | Long-term capital gain | | | — | | | | | — | | |
| | | | $ | 2,325,856 | | | | $ | — | | |
| | | | | | | | | | |
| | | Six Months Ended | | | Year Ended | | |
| | Large Growth Fund | April 30, 2013 | | October 31, 2012 | |
| | Ordinary Income | | $ | 1,080,469 | | | | $ | 559,148 | | |
| | Long-term capital gain | | | 169,386 | | | | | 15,375,965 | | |
| | | | $ | 1,249,855 | | | | $ | 15,935,113 | | |
| | | | | | | | | | |
| | | Six Months Ended | | | Year Ended | | |
| | Value Fund | April 30, 2013 | | October 31, 2012 | |
| | Ordinary Income | | $ | 3,339,992 | | | | $ | 3,834,285 | | |
| | Long-term capital gain | | | — | | | | | — | | |
| | | | $ | 3,339,992 | | | | $ | 3,834,285 | | |
| | | | | | | | | | |
| | | Six Months Ended | | | Year Ended | | |
| | Large Value Fund | April 30, 2013 | | October 31, 2012 | |
| | Ordinary Income | | $ | 1,438,863 | | | | $ | 1,007,759 | | |
| | Long-term capital gain | | | — | | | | | — | | |
| | | | $ | 1,438,863 | | | | $ | 1,007,759 | | |
| | | | | | | | | | |
| | | Six Months Ended | | | Year Ended | | |
| | Total Return Fund | April 30, 2013 | | October 31, 2012 | |
| | Ordinary Income | | $ | 501,289 | | | | $ | 1,013,041 | | |
| | Long-term capital gain | | | — | | | | | — | | |
| | | | $ | 501,289 | | | | $ | 1,013,041 | | |
HENNESSY FUNDS 1-800-966-4354
| | | Six Months Ended | | | Year Ended | | |
| | Equity and Income Fund | April 30, 2013 | | October 31, 2012 | |
| | Ordinary Income | | $ | 2,986,883 | | | | $ | 3,322,362 | | |
| | Long-term capital gain | | | — | | | | | — | | |
| | | | $ | 2,986,883 | | | | $ | 3,322,362 | | |
| | | | | | | | | | |
| | | Six Months Ended | | | Year Ended | | |
| | Balanced Fund | April 30, 2013 | | October 31, 2012 | |
| | Ordinary Income | | $ | 23,090 | | | | $ | 81,724 | | |
| | Long-term capital gain | | | — | | | | | — | | |
| | | | $ | 23,090 | | | | $ | 81,724 | | |
| | | | | | | | | | |
| | | Six Months Ended | | | Year Ended | | |
| | Core Bond Fund | April 30, 2013 | | October 31, 2012 | |
| | Ordinary Income | | $ | 363,903 | | | | $ | 1,054,980 | | |
| | Long-term capital gain | | | 745,383 | | | | | 141,198 | | |
| | | | $ | 1,109,286 | | | | $ | 1,196,178 | | |
| | | | | | | | | | |
| | | Six Months Ended | | | Year Ended | | |
| | Gas Fund | April 30, 2013 | | October 31, 2012 | |
| | Ordinary Income | | $ | 10,270,374 | | | | $ | 18,087,340 | | |
| | Long-term capital gain | | | 17,562,108 | | | | | 1,903,385 | | |
| | | | $ | 27,832,482 | | | | $ | 19,990,725 | | |
| | | | | | | | | | |
| | | Six Months Ended | | | Year Ended | | |
| | Small Cap Financial Fund | April 30, 2013 | | October 31, 2012 | |
| | Ordinary Income | | $ | 1,639,753 | | | | $ | 3,181,624 | | |
| | Long-term capital gain | | | — | | | | | — | | |
| | | | $ | 1,639,753 | | | | $ | 3,181,624 | | |
| | | | | | | | | | |
| | | Six Months Ended | | Year Ended | |
| | Large Cap Financial Fund | April 30, 2013 | | October 31, 2012 | |
| | Ordinary Income | | $ | 50,837 | | | | $ | — | | |
| | Long-term capital gain | | | — | | | | | — | | |
| | | | $ | 50,837 | | | | $ | — | | |
| | | | | | | | | | |
| | | Six Months Ended | | | Year Ended | | |
| | Technology Fund | April 30, 2013 | | October 31, 2012 | |
| | Ordinary Income | | $ | — | | | | $ | — | | |
| | Long-term capital gain | | | — | | | | | — | | |
| | | | $ | — | | | | $ | — | | |
| | | | | | | | | | |
| | | Six Months Ended | | | Year Ended | | |
| | Japan Fund | April 30, 2013 | | October 31, 2012 | |
| | Ordinary Income | | $ | 12,868 | | | | $ | — | | |
| | Long-term capital gain | | | — | | | | | — | | |
| | | | $ | 12,868 | | | | $ | — | | |
| | | | | | | | | | |
| | | Six Months Ended | | | Year Ended | | |
| | Japan Small Cap Fund | April 30, 2013 | | October 31, 2012 | |
| | Ordinary Income | | $ | — | | | | $ | 99,101 | | |
| | Long-term capital gain | | | 1,115,069 | | | | | — | | |
| | | | $ | 1,115,069 | | | | $ | 99,101 | | |
8). FUND REORGANIZATIONS
On October 25, 2012, the shareholders of the FBR Large Cap Fund, FBR Mid Cap Fund and FBR Small Cap Fund approved the agreement and plan of reorganization providing for the transfer of assets and the assumption of liabilities of such funds by each of the Hennessy Cornerstone Large Growth Fund, the Hennessy Cornerstone Mid Cap 30 Fund, and the Hennessy Cornerstone Growth Fund, respectively. The reorganization was effective as of the close of business on October 26, 2012. The following tables illustrate the specifics of each Fund’s reorganization:
| | FBR Large Cap | Shares issued to Shareholders | Hennessy Cornerstone | | |
| | Fund Net Assets | of FBR Large Cap Fund | Large Growth Fund Net Assets | Combined Net Assets | Tax Status of Transfer |
| | $33,698,161(1) | 3,110,613 | $75,963,129 | $109,661,290 | Non-taxable |
| | (1) | Includes accumulated realized losses and unrealized appreciation in the amounts of ($8,751,401) and $4,423,584 respectively. |
| | FBR Mid Cap | Shares issued to Shareholders | Hennessy Cornerstone | | |
| | Fund Net Assets | of FBR Mid Cap Fund | Mid Cap 30 Fund Net Assets | Combined Net Assets | Tax Status of Transfer |
| | $16,374,686(1) | 1,154,875 | $171,822,952 | $188,197,638 | Non-taxable |
| | (1) | Includes accumulated realized losses and unrealized appreciation in the amounts of ($3,572,309) and $2,496,269 respectively. |
| | FBR Small Cap | Shares issued to Shareholders | Hennessy Cornerstone | | |
| | Fund Net Assets | of FBR Small Cap Fund | Growth Fund Net Assets | Combined Net Assets | Tax Status of Transfer |
| | $34,071,809(1) | 2,732,499 | $265,131,165 | $299,202,974 | Non-taxable |
| | (1) | Includes accumulated realized losses and unrealized appreciation in the amounts of ($5,680,576) and $1,928,859 respectively. |
Assuming the reorganization had been completed on November 1, 2011, the beginning of the annual reporting period of each of the respective Funds, the pro forma results of operations (unaudited) for the year ended October 31, 2012, would have been as follows:
| | | Hennessy Cornerstone | | Hennessy Cornerstone | | Hennessy Cornerstone | |
| | | Growth Fund | | Mid Cap 30 Fund | | Large Growth Fund | |
| | Net investment income/(loss) | | $ | (1,277,452 | ) | | | $ | 1,183,817 | | | | $ | 1,514,359 | | |
| | Net realized gain/(loss) on investments | | $ | 6,068,686 | | | | $ | 415,390 | | | | $ | 501,406 | | |
| | Change in unrealized appreciation/depreciation on investments | | $ | 46,095,075 | | | | $ | 22,755,030 | | | | $ | 7,914,251 | | |
| | Net increase/(decrease) in net assets resulting from operations | | $ | 50,886,309 | | | | $ | 24,354,237 | | | | $ | 9,930,016 | | |
Because the combined investment portfolios have been managed as a single integrated portfolio since the reorganization was completed, it is not practicable to separate the amounts of revenue and earnings for the respective FBR Funds that have been included in each of the Funds’ statement of operations since October 26, 2012.
On October 25, 2012, the shareholders of the FBR Focus Fund, FBR Gas Utility Index Fund, FBR Small Cap Financial Fund, FBR Large Cap Financial Fund, FBR Technology Fund, FBR Balanced Fund and FBR Core Bond Fund approved the agreement and plan of reorganization providing for the transfer of assets and the assumption of liabilities of such funds by each of the Hennessy Focus Fund, Hennessy Gas Utility Index Fund, Hennessy Small Cap Financial Fund, Hennessy Large Cap Financial Fund, Hennessy Technology Fund, Hennessy Equity and Income Fund and Hennessy Core Bond Fund, respectively. Each of the FBR Funds was reorganized into a Fund created to carry out the reorganizations, with each Fund having the same investment objective and substantially similar principal investment strategies as its corresponding FBR Fund. The reorganization was effective as of the close of business on October 26, 2012. The following tables illustrate the specifics of each Fund’s reorganization:
| | FBR Focus Fund | Shares issued to Shareholders | Hennessy Focus Fund | | |
| | Net Assets | of FBR Focus Fund | Net Assets | Combined Net Assets | Tax Status of Transfer |
| | $778,311,000(1) | 15,154,076 | $0 | $778,311,000 | Non-taxable |
| | (1) | Includes accumulated realized gains and unrealized appreciation in the amounts of $132,243,088 and $336,125,053 respectively. |
| | FBR Gas Utility Index | Shares issued to Shareholders | Hennessy Gas Utility Index | | |
| | Fund Net Assets | of FBR Gas Utility Index Fund | Fund Net Assets | Combined Net Assets | Tax Status of Transfer |
| | $741,949,009(2) | 32,378,877 | $0 | $741,949,009 | Non-taxable |
| | (2) | Includes accumulated realized gains and unrealized appreciation in the amounts of $3,950,643 and $194,357,194 respectively. |
| | FBR Small Cap Financial | Shares issued to Shareholders | Hennessy Small Cap | | |
| | Fund Net Assets | of FBR Small Cap Financial Fund | Financial Fund Net Assets | Combined Net Assets | Tax Status of Transfer |
| | $210,320,731(3) | 12,112,883 | $0 | $210,320,883 | Non-taxable |
| | (3) | Includes accumulated realized losses and unrealized appreciation in the amounts of ($7,187,955) and $22,624,133 respectively. |
| | FBR Large Cap Financial | Shares issued to Shareholders | Hennessy Large Cap | | |
| | Fund Net Assets | of FBR Large Cap Financial Fund | Financial Fund Net Assets | Combined Net Assets | Tax Status of Transfer |
| | $64,199,213(4) | 4,567,064 | $0 | $64,199,213 | Non-taxable |
| | (4) | Includes accumulated realized losses and unrealized appreciation in the amounts of ($7,700,523) and $7,128,156 respectively. |
| | FBR Technology | Shares issued to Shareholders | Hennessy Technology | | |
| | Fund Net Assets | of FBR Technology Fund | Fund Net Assets | Combined Net Assets | Tax Status of Transfer |
| | $5,413,138(5) | 504,081 | $0 | $5,413,138 | Non-taxable |
| | (5) | Includes accumulated realized losses and unrealized appreciation in the amounts of ($2,345,527) and $119,831 respectively. |
| | FBR Balanced Fund | Shares issued to Shareholders | Hennessy Equity and | | |
| | Net Assets | of FBR Balanced Fund | Income Fund Net Assets | Combined Net Assets | Tax Status of Transfer |
| | $304,557,978(6) | 22,268,632 | $0 | $304,557,978 | Non-taxable |
| | (6) | Includes accumulated realized losses and unrealized appreciation in the amounts of ($2,836,830) and $22,782,279 respectively. |
| | FBR Core Bond | Shares issued to Shareholders | Hennessy Core Bond | | |
| | Fund Net Assets | of FBR Core Bond Fund | Fund Net Assets | Combined Net Assets | Tax Status of Transfer |
| | $36,814,419(7) | 4,033,537 | $0 | $36,814,419 | Non-taxable |
| | (7) | Includes accumulated realized gains and unrealized appreciation in the amounts of $1,455,845 and $1,687,723 respectively. |
HENNESSY FUNDS 1-800-966-4354
Expense Example (Unaudited)
April 30, 2013
As a shareholder of the Funds, you incur two types of costs: (1) transaction costs, including sales charges (loads) on purchase payments, reinvested dividends, or other distributions; redemption fees; and exchange fees; and (2) ongoing costs, including management fees, service fees and other Fund expenses. This example is intended to help you understand your ongoing costs (in dollars) of investing in each of the Funds and to compare these costs with the ongoing costs of investing in other mutual funds. The example is based on an investment of $1,000 invested at the beginning of the period and held for the entire period from November 1, 2012 through April 30, 2013.
Actual Expenses
The first set of lines of the table below provide information about actual account values and actual expenses. Although the Funds charge no sales loads or transaction fees, you will be assessed fees for outgoing wire transfers, returned checks and stop payment orders at prevailing rates charged by the Administrator acting in its capacity as transfer agent. If you request that a redemption be made by wire transfer, currently a $15.00 fee is charged by the Funds’ transfer agent. IRA accounts will be charged a $15.00 annual maintenance fee. The example below includes, but is not limited to, management fees, shareholder servicing fees, fund accounting, custody and transfer agent fees. However, the example below does not include portfolio trading commissions and related expenses, and other extraordinary expenses as determined under GAAP. You may use the information within these lines, together with the amount you invested, to estimate the expenses that you paid over the six-month period. Simply divide your account value by $1,000 (for example, an $8,600 account value divided by $1,000 = 8.6), then multiply the result by the number in the first line under the heading entitled “Expenses Paid During Period” to estimate the expenses you paid on your account during this period.
Hypothetical Example for Comparison Purposes
The second set of lines within the table below provide information about hypothetical account values and hypothetical expenses based on the Funds’ actual expense ratios and an assumed rate of return of 5% per year before expenses, which is not the actual return of any Fund. The hypothetical account values and expenses may not be used to estimate the actual ending account balance or expenses you paid for the period. You may use this information to compare the ongoing costs of investing in the Funds and other funds. To do so, compare this 5% hypothetical example with the 5% hypothetical examples that appear in the shareholder reports of the other funds. Please note that the expenses shown in the table are meant to highlight your ongoing costs only and do not reflect any transactional costs, such as sales charges (loads) or exchange fees. Therefore, the second line of the table is useful in comparing ongoing costs only and will not help you determine the relative total costs of owning different funds. In addition, if these transactional costs were included, your costs would have been higher.
| | Beginning | Ending | Expenses Paid |
| | Account Value | Account Value | During Period(1) |
| Investor Class | 11/1/12 | 4/30/13 | 11/1/12 – 4/30/13 |
| | | | |
| Actual | | | |
| Growth Fund – Investor Class | $1,000.00 | $1,117.90 | $ 6.77 |
| Focus Fund – Investor Class | $1,000.00 | $1,185.60 | $ 7.64 |
| Mid Cap 30 Fund – Investor Class | $1,000.00 | $1,174.30 | $ 7.01 |
| Large Growth Fund – Investor Class | $1,000.00 | $1,116.40 | $ 6.19 |
| Value Fund – Investor Class | $1,000.00 | $1,142.40 | $ 6.53 |
| Large Value Fund – Investor Class | $1,000.00 | $1,152.80 | $ 7.15 |
| Total Return Fund – Investor Class | $1,000.00 | $1,113.10 | $ 6.71 |
| Equity and Income Fund – Investor Class | $1,000.00 | $1,098.10 | $ 6.97 |
| Balanced Fund – Investor Class | $1,000.00 | $1,070.00 | $ 8.88 |
| Core Bond Fund – Investor Class | $1,000.00 | $1,013.80 | $ 6.49 |
| Gas Utility Index Fund – Investor Class | $1,000.00 | $1,179.10 | $ 4.16 |
| Small Cap Financial Fund – Investor Class | $1,000.00 | $1,134.90 | $ 7.62 |
| Large Cap Financial Fund – Investor Class | $1,000.00 | $1,169.80 | $ 8.50 |
| Technology Fund – Investor Class | $1,000.00 | $1,088.10 | $10.10 |
| Japan Fund – Investor Class | $1,000.00 | $1,197.50 | $10.84 |
| Japan Small Cap Fund – Investor Class | $1,000.00 | $1,360.30 | $14.34 |
| | | | |
| Hypothetical (5% return before expenses) | | | |
| Growth Fund – Investor Class | $1,000.00 | $1,018.40 | $ 6.46 |
| Focus Fund – Investor Class | $1,000.00 | $1,017.80 | $ 7.05 |
| Mid Cap 30 Fund – Investor Class | $1,000.00 | $1,018.35 | $ 6.51 |
| Large Growth Fund – Investor Class | $1,000.00 | $1,018.94 | $ 5.91 |
| Value Fund – Investor Class | $1,000.00 | $1,018.70 | $ 6.16 |
| Large Value Fund – Investor Class | $1,000.00 | $1,018.15 | $ 6.71 |
| Total Return Fund – Investor Class | $1,000.00 | $1,018.45 | $ 6.41 |
| Equity and Income Fund – Investor Class | $1,000.00 | $1,018.15 | $ 6.71 |
| Balanced Fund – Investor Class | $1,000.00 | $1,016.22 | $ 8.65 |
| Core Bond Fund – Investor Class | $1,000.00 | $1,018.35 | $ 6.51 |
| Gas Utility Index Fund – Investor Class | $1,000.00 | $1,020.98 | $ 3.86 |
| Small Cap Financial Fund – Investor Class | $1,000.00 | $1,017.65 | $ 7.20 |
| Large Cap Financial Fund – Investor Class | $1,000.00 | $1,016.96 | $ 7.90 |
| Technology Fund – Investor Class | $1,000.00 | $1,015.12 | $ 9.74 |
| Japan Fund – Investor Class | $1,000.00 | $1,014.93 | $ 9.94 |
| Japan Small Cap Fund – Investor Class | $1,000.00 | $1,012.65 | $12.23 |
| (1) | Expenses are equal to the Growth Fund’s expense ratio of 1.29%, the Focus Fund’s expense ratio of 1.41% the Mid Cap 30 Fund’s expense ratio of 1.30%, the Large Growth Fund’s expense ratio of 1.18%, the Value Fund’s expense ratio of 1.23%, the Large Value Fund’s expense ratio of 1.34%, the Total Return Fund’s expense ratio of 1.28%, the Equity and Income Fund’s expense ratio of 1.34%, the Balanced Fund’s expense ratio of 1.73%, the Core Bond Fund’s Expense ratio of 1.30%, the Gas Fund’s expense ratio of 0.77%, the Small Cap Financial Fund’s expense ratio of 1.44%, the Large Cap Financial Fund’s expense ratio of 1.58%, the Technology Fund’s expense ratio of 1.95%, the Japan Fund’s expense ratio of 1.99%, and the Japan Small Cap Fund’s expense ratio of 2.45% multiplied by the average account value over the period, multiplied by 181/365 days (to reflect one-half year period). |
HENNESSY FUNDS 1-800-966-4354
| | Beginning | Ending | Expenses Paid |
| | Account Value | Account Value | During Period(2) |
| Institutional Class | 11/1/12 | 4/30/13 | 11/1/12 – 4/30/13 |
| | | | |
| Actual | | | |
| Growth Fund – Institutional Class | $1,000.00 | $1,120.10 | $ 5.15 |
| Focus Fund – Institutional Class Class | $1,000.00 | $1,187.10 | $ 6.18 |
| Mid Cap 30 Fund – Institutional Class | $1,000.00 | $1,175.50 | $ 5.29 |
| Large Growth Fund – Institutional Class | $1,000.00 | $1,117.70 | $ 5.15 |
| Value Fund – Institutional Class | $1,000.00 | $1,143.80 | $ 5.21 |
| Large Value Fund – Institutional Class | $1,000.00 | $1,154.90 | $ 5.24 |
| Equity and Income Fund – Institutional Class | $1,000.00 | $1,099.80 | $ 5.36 |
| Core Bond Fund – Institutional Class | $1,000.00 | $1,014.70 | $ 5.25 |
| Small Cap Financial Fund – Institutional Class | $1,000.00 | $1,135.90 | $ 6.14 |
| Technology Fund – Institutional Class | $1,000.00 | $1,089.50 | $ 8.81 |
| Japan Fund – Institutional Class | $1,000.00 | $1,198.50 | $ 9.59 |
| | | | |
| Hypothetical (5% return before expenses) | | | |
| Growth Fund – Institutional Class | $1,000.00 | $1,019.93 | $ 4.91 |
| Focus Fund – Institutional Class Class | $1,000.00 | $1,019.14 | $ 5.71 |
| Mid Cap 30 Fund – Institutional Class | $1,000.00 | $1,019.93 | $ 4.91 |
| Large Growth Fund – Institutional Class | $1,000.00 | $1,019.93 | $ 4.91 |
| Value Fund – Institutional Class | $1,000.00 | $1,019.93 | $ 4.91 |
| Large Value Fund – Institutional Class | $1,000.00 | $1,019.93 | $ 4.91 |
| Equity and Income Fund – Institutional Class | $1,000.00 | $1,019.69 | $ 5.16 |
| Core Bond Fund – Institutional Class | $1,000.00 | $1,019.59 | $ 5.26 |
| Small Cap Financial Fund – Institutional Class | $1,000.00 | $1,019.04 | $ 5.81 |
| Technology Fund – Institutional Class | $1,000.00 | $1,016.36 | $ 8.50 |
| Japan Fund – Institutional Class | $1,000.00 | $1,016.07 | $ 8.80 |
| (2) | Expenses are equal to the Growth Fund’s expense ratio of 0.98%, the Focus Fund’s expense ratio of 1.14%, the Mid Cap 30 Fund’s expense ratio of 0.98%, the Large Growth Fund’s expense ratio of 0.98%, the Value Fund’s expense ratio of 0.98%, the Large Value Fund’s expense ratio of 0.98%, the Equity and Income Fund’s expense ratio of 1.03%, the Core Bond Fund’s expense ratio of 1.05%, the Small Cap Financial Fund’s expense ratio of 1.16%, the Technology Fund’s expense ratio of 1.70%, and the Japan Fund’s expense ratio of 1.76%, multiplied by the average account value over the period, multiplied by 181/365 days (to reflect one-half year period). |
How to Obtain a Copy of the Funds’ Proxy Voting Policy and Proxy Voting Records
A description of the policies and procedures that the Funds use to determine how to vote proxies relating to portfolio securities is available without charge: (1) by calling 1-800-966-4354; (2) on the Hennessy Funds website at www.hennessyfunds.com; or (3) on the U.S. Securities and Exchange Commission’s website at www.sec.gov. Hennessy Funds’ proxy voting record is available on the SEC’s website at www.sec.gov no later than August 31 for the prior 12 months ending June 30.
Quarterly Filings on Form N-Q
The Funds file their complete schedule of portfolio holdings with the SEC for the first and third quarters of each fiscal year on Form N-Q. The Funds’ Form N-Q will be available on the SEC’s website at www.sec.gov. The Funds’ Form N-Q may be reviewed and copied at the SEC’s Public Reference Room in Washington, DC and information on the operation of the Public Reference Room may be obtained by calling 1-800-SEC-0330. Information included in the Funds’ N-Q will also be available upon request by calling 1-800-966-4354.
Federal Tax Distribution Information (Unaudited)
For the fiscal year ended October 31, 2012, certain dividends paid by the Funds may be subject to a maximum tax rate of 15%, as provided for by the Jobs and Growth Tax Relief Reconciliation Act of 2003.
The percentage of dividends declared from ordinary income designated as qualified dividend income was as follows:
| | Growth Fund | 0.00% | |
| | Focus Fund | 0.00% | |
| | Mid Cap 30 Fund | 0.00% | |
| | Large Growth Fund | 100.00% | |
| | Value Fund | 100.00% | |
| | Large Value Fund | 100.00% | |
| | Total Return Fund | 100.00% | |
| | Equity and Income Fund | 80.59% | |
| | Balanced Fund | 100.00% | |
| | Core Bond Fund | 16.15% | |
| | Gas Fund | 98.42% | |
| | Small Cap Financial Fund | 100.00% | |
| | Large Cap Financial Fund | 0.00% | |
| | Technology Fund | 0.00% | |
| | Japan Fund | 0.00% | |
| | Japan Small Cap Fund | 100.00% | |
For corporate shareholders, the percent of ordinary income distributions qualifying for the corporate dividends received deduction for the fiscal year ended October 31, 2012, was as follows:
| | Growth Fund | 0.00% | |
| | Focus Fund | 0.00% | |
| | Mid Cap 30 Fund | 0.00% | |
| | Large Growth Fund | 100.00% | |
| | Value Fund | 100.00% | |
| | Large Value Fund | 100.00% | |
| | Total Return Fund | 100.00% | |
| | Equity and Income Fund | 80.80% | |
| | Balanced Fund | 100.00% | |
| | Core Bond Fund | 15.75% | |
| | Gas Fund | 94.00% | |
| | Small Cap Financial Fund | 100.00% | |
| | Large Cap Financial Fund | 0.00% | |
| | Technology Fund | 0.00% | |
| | Japan Fund | 0.00% | |
| | Japan Small Cap Fund | 0.00% | |
HENNESSY FUNDS 1-800-966-4354
The percentage of taxable ordinary income distributions that are designated as short-term capital gain distributions under Internal Revenue Section 871(k)(2)(C) for each Fund were as follows:
| | Growth Fund | 0.00% | |
| | Focus Fund | 0.00% | |
| | Mid Cap 30 Fund | 0.00% | |
| | Large Growth Fund | 100.00% | |
| | Value Fund | 100.00% | |
| | Large Value Fund | 100.00% | |
| | Total Return Fund | 100.00% | |
| | Equity and Income Fund | 0.00% | |
| | Balanced Fund | 100.00% | |
| | Core Bond Fund | 13.00% | |
| | Gas Fund | 11.00% | |
| | Small Cap Financial Fund | 0.00% | |
| | Large Cap Financial Fund | 0.00% | |
| | Technology Fund | 0.00% | |
| | Japan Fund | 0.00% | |
| | Japan Small Cap Fund | 0.00% | |
Householding
To help keep the Funds’ costs as low as possible, we generally deliver a single copy of most financial reports and prospectuses to shareholders who share an address, even if the accounts are registered under different names. This process, known as “householding,” does not apply to account statements. You may, of course, request an individual copy of a prospectus or financial report at any time. If you would like to receive separate mailings, please call the Administrator at 1-800-261-6950 or 1-414-765-4124 and we will begin individual delivery within 30 days of your request. If your account is held through a financial institution or other intermediary, please contact them directly to request individual delivery.
Board Approval of Continuation of Investment Advisory Agreements
At its meeting on March 6, 2013, the Board unanimously approved the continuation of the investment advisory agreements and, as applicable, sub-advisory agreements (collectively, referred to as the “advisory agreements”) of the following funds (for purposes of this section only, each a “Fund” and, collectively, the “Funds”):
| | • | Hennessy Balanced Fund |
| | • | Hennessy Total Return Fund |
| | • | Hennessy Cornerstone Growth Fund |
| | • | Hennessy Cornerstone Value Fund |
| | • | Hennessy Cornerstone Mid Cap 30 Fund |
| | • | Hennessy Cornerstone Large Growth Fund |
| | • | Hennessy Large Value Fund |
| | • | Hennessy Japan Fund |
| | • | Hennessy Japan Small Cap Fund |
The Board noted that the Advisor performs the services identified below for the Funds (the Board also noted that the sub-advisors for certain of the Funds perform certain services). In assessing these services, the Advisor and the sub-advisors, the Board referenced the Advisor’s Form ADV, the sub-advisors’ Form ADVs and copies of the advisory agreements.
| | • | Acts as portfolio manager for the Funds (other than the Hennessy Large Value Fund, the Hennessy Japan Fund and the Hennessy Japan Small Cap Fund) and the following additional funds: Hennessy Large Cap Financial Fund, Hennessy Small Cap Financial Fund, Hennessy Technology Fund and Hennessy Gas Utility Index Fund. The Advisor holds the patent rights to the formulas used for the Hennessy Cornerstone Growth Fund and the Hennessy Cornerstone Value Fund. In providing investment management services, the Advisor manages the composition of the portfolio of these funds, including the purchase, retention and disposition thereof, in accordance with their investment objectives, policies and restrictions. |
| | | |
| | • | Oversees the sub-advisors for the Hennessy Large Value Fund, the Hennessy Japan Fund, the Hennessy Japan Small Cap Fund, the Hennessy Focus Fund, the Hennessy Core Bond Fund, and the Hennessy Equity and Income Fund. The sub-advisors act as portfolio managers to these funds, managing the composition of the portfolio of these funds, including the purchase, retention and disposition thereof, in accordance with their investment objectives, policies and restrictions. |
| | | |
| | • | Pays the incentive compensation of the Funds’ Chief Compliance Officer. |
| | | |
| | • | Provides responsive customer and shareholder servicing, which consists of providing a call center to respond to shareholder inquiries, including specific mutual fund account information. Shareholders can contact the Advisor directly during office hours. The Advisor endeavors to answer all calls in person within two rings of the telephone. |
| | | |
| | • | Oversees distribution of the Funds through third-party broker/dealers and independent financial institutions such as Charles Schwab, Inc., Fidelity, TD Waterhouse and Pershing. The Advisor participates in “no transaction fee” (“NTF”) programs with these companies on behalf of the Funds, which allows customers to purchase the Funds through third party distribution channels without paying a transaction fee. The Advisor compensates a number of these third-party providers of NTF programs out of its own revenues and not those of the Funds. |
| | | |
| | • | Oversees those third-party service providers that support the Funds in providing fund accounting, fund administration, fund distribution, transfer agency and custodial services. |
The Board compared the performance of each Fund to benchmark indices over various periods of time and concluded that the positive performance of each Fund warranted the continuation of the advisory agreements.
The Board reviewed the Funds’ expense ratios and comparable expense ratios for funds comparable to the nine Funds being reviewed. The Board used data from Morningstar as presented in the charts in the Board materials provided to the Directors/ Trustees showing funds similar in asset size and investment objective to each of the Funds. After reviewing and discussing these materials, the Board determined that the expense ratios of the Funds fall within the range of the ratios of other comparable funds and concluded that the expenses of each Fund were reasonable.
The Board considered the fees charged by the Advisor and the sub-advisors to those of funds similar in asset size and investment objective to each of the Funds and concluded the advisory fees of each Fund were reasonable and warranted continuation of the advisory agreements. The Directors/Trustees noted that the investment advisory fees are not adjusted if economies of scale are realized as the Funds grow, but did not consider that factor to be significant in light of the other factors considered.
The Board considered the profitability of the Advisor with respect to each Fund and the profitability of the sub-advisors with respect to the sub-advised Funds and concluded the profits were reasonable and not excessive when compared to profitability guidelines set forth in relevant court cases.
The Board considered the high level of professionalism and knowledge of the Advisor’s employees, along with an extremely low level of turnover of the employees of the Advisor, and concluded that this was beneficial to the Funds and their shareholders, as it ensures that the Funds are operated efficiently.
All of the factors above were considered separately by the Directors/Trustees who are not “interested persons” (as defined in the Investment Company Act of 1940) of the Funds (the “Independent Directors/Trustees”) in an executive session during which management of the Advisor was not present. The factors were viewed in their totality by the Board, with no single factor being the principal or determinative factor in the Board’s determination of whether to approve the continuation of the advisory agreements. The Board was also assisted in its review, consideration and discussion of the advisory agreements by a memorandum prepared by legal counsel that summarized the Board’s obligations. Based on the factors discussed above, the Board, including all of the Independent Directors/Trustees, recommended continuation of the advisory agreements.
HENNESSY FUNDS 1-800-966-4354
For information, questions or assistance, please call
The Hennessy Funds
1-800-966-4354 or 1-415-899-1555
INVESTMENT ADVISOR
Hennessy Advisors, Inc.
7250 Redwood Blvd., Suite 200
Novato, California 94945
ADMINISTRATOR,
TRANSFER AGENT,
DIVIDEND PAYING AGENT &
SHAREHOLDER SERVICING AGENT
U.S. Bancorp Fund Services, LLC
P.O. Box 701
Milwaukee, Wisconsin 53201-0701
CUSTODIAN
U.S. Bank N.A.
Custody Operations
1555 North River Center Dr., Suite 302
Milwaukee, Wisconsin 53212
DIRECTORS/TRUSTEES
Neil J. Hennessy
Robert T. Doyle
J. Dennis DeSousa
Gerald P. Richardson
COUNSEL
Foley & Lardner LLP
777 East Wisconsin Avenue
Milwaukee, Wisconsin 53202-5306
INDEPENDENT REGISTERED
PUBLIC ACCOUNTING FIRMS
KPMG LLP
777 East Wisconsin Avenue
Milwaukee, Wisconsin 53202-5306
Tait, Weller & Baker LLP
1818 Market Street, Suite 2400
Philadelphia, Pennsylvania 19103
DISTRIBUTOR
Quasar Distributors, LLC
615 East Michigan Street
Milwaukee, Wisconsin 53202
www.hennessyfunds.com|1-800-966-4354
This report has been prepared for shareholders and may be distributed to
others only if preceded or accompanied by a current prospectus.
Item 2. Code of Ethics.
Not applicable for semi-annual reports.
Item 3. Audit Committee Financial Expert.
Not applicable for semi-annual reports.
Item 4. Principal Accountant Fees and Services.
Not applicable for semi-annual reports.
Item 5. Audit Committee of Listed Registrants.
Not applicable to registrants who are not listed issuers (as defined in Rule 10A-3 under the Securities Exchange Act of 1934).
Item 6. Investments.
Schedules of Investments are included as part of the report to stockholders filed under Item 1 of this report.
Item 7. Disclosure of Proxy Voting Policies and Procedures for Closed-End Management Investment Companies.
Not applicable to open-end investment companies.
Item 8. Portfolio Managers of Closed-End Management Investment Companies.
Not applicable to open-end investment companies.
Item 9. Purchases of Equity Securities by Closed-End Management Investment Company and Affiliated Purchasers.
Not applicable to open-end investment companies.
Item 10. Submission of Matters to a Vote of Security Holders.
None.
Item 11. Controls and Procedures.
| (a) | The Registrant’s President and Treasurer have reviewed the Registrant's disclosure controls and procedures (as defined in Rule 30a-3(c) under the Investment Company Act of 1940 (the “Act”)) as of a date within 90 days of the filing of this report, as required by Rule 30a-3(b) under the Act and Rules 13a-15(b) or 15d-15(b) under the Securities Exchange Act of 1934. Based on their review, such officers have concluded that the disclosure controls and procedures are effectively designed to ensure that information required to be disclosed in this report is appropriately recorded, processed, summarized and reported and made known to them by others within the Registrant and by the Registrant’s service provider. |
| (b) | There were no changes in the Registrant's internal control over financial reporting (as defined in Rule 30a-3(d) under the Act) that occurred during the second fiscal quarter of the period covered by this report that has materially affected, or is reasonably likely to materially affect, the Registrant's internal control over financial reporting. |
Item 12. Exhibits.
| (a) | (1) Any code of ethics or amendment thereto, that is the subject of the disclosure required by Item 2, to the extent that the registrant intends to satisfy Item 2 requirements through filing an exhibit. Not applicable. |
(2) A separate certification for each principal executive and principal financial officer of the Registrant pursuant to Section 302 of the Sarbanes-Oxley Act of 2002. Filed herewith.
(3) Any written solicitation to purchase securities under Rule 23c-1 under the Act sent or given during the period covered by the report by or on behalf of the registrant to 10 or more persons. Not applicable to open-end investment companies.
| (b) | Certifications pursuant to Section 906 of the Sarbanes-Oxley Act of 2002. Furnished herewith. |
SIGNATURES
Pursuant to the requirements of the Securities Exchange Act of 1934 and the Investment Company Act of 1940, the registrant has duly caused this report to be signed on its behalf by the undersigned, thereunto duly authorized.
(Registrant) Hennessy Funds Trust
By (Signature and Title) /s/Neil J. Hennessy
Neil J. Hennessy, President
Date July 9, 2013
Pursuant to the requirements of the Securities Exchange Act of 1934 and the Investment Company Act of 1940, this report has been signed below by the following persons on behalf of the registrant and in the capacities and on the dates indicated.
By (Signature and Title) /s/Neil J. Hennessy
Neil J. Hennessy, President
Date July 9, 2013
By (Signature and Title) /s/Teresa M. Nilsen
Teresa M. Nilsen, Treasurer
Date July 9, 2013