UNITED STATES
SECURITIES AND EXCHANGE COMMISSION
Washington, D.C. 20549
FORM N-CSR
CERTIFIED SHAREHOLDER REPORT OF REGISTERED
MANAGEMENT INVESTMENT COMPANIES
Investment Company Act file number (811-07168)
Hennessy Funds Trust
(Exact name of registrant as specified in charter)
7250 Redwood Blvd., Suite 200
(Address of principal executive offices) (Zip code)
Neil J. Hennessy
Hennessy Advisor, Inc.
7250 Redwood Blvd., Suite 200
Novato, CA 94945
(Name and address of agent for service)
800-966-4354
Registrant's telephone number, including area code
Date of fiscal year end: October 31, 2012
Date of reporting period: April 30, 2012
Item 1. Reports to Stockholders.
HENNESSY FUNDS
SEMI-ANNUAL REPORT
APRIL 30, 2012
Hennessy Cornerstone Growth Fund
Hennessy Focus 30 Fund
Hennessy Cornerstone Large Growth Fund
Hennessy Cornerstone Value Fund
Hennessy Total Return Fund
Hennessy Balanced Fund
Contents
| Letter to shareholders | 1 |
| Performance overview (unaudited) | |
| Hennessy Cornerstone Growth Fund | 4 |
| Hennessy Focus 30 Fund | 6 |
| Hennessy Cornerstone Large Growth Fund | 8 |
| Hennessy Cornerstone Value Fund | 10 |
| Hennessy Total Return Fund | 12 |
| Hennessy Balanced Fund | 13 |
| Financial statements | |
| Schedules of investments | |
| Hennessy Cornerstone Growth Fund | 15 |
| Hennessy Focus 30 Fund | 20 |
| Hennessy Cornerstone Large Growth Fund | 24 |
| Hennessy Cornerstone Value Fund | 28 |
| Hennessy Total Return Fund | 33 |
| Schedule of Reverse Repurchase Agreements | 37 |
| Hennessy Balanced Fund | 38 |
| Statements of assets and liabilities | 42 |
| Statements of operations | 44 |
| Statements of changes in net assets | 46 |
| Statement of cash flows – Hennessy Total Return Fund | 53 |
| Financial highlights | |
| Hennessy Cornerstone Growth Fund | 54 |
| Hennessy Focus 30 Fund | 58 |
| Hennessy Cornerstone Large Growth Fund | 62 |
| Hennessy Cornerstone Value Fund | 66 |
| Hennessy Total Return Fund | 70 |
| Hennessy Balanced Fund | 72 |
| Notes to the financial statements | 75 |
| Expense example | 86 |
| Proxy voting policy | 88 |
| Quarterly Filings on Form N-Q | 88 |
| Directors and Officers | 88 |
| Federal Tax Distribution Information | 88 |
| Board approval of continuation | |
| of investment advisory agreements | 90 |
LETTER TO SHAREHOLDERS
June, 2012
Dear Hennessy Funds Shareholder:
The more things change, the more they stay the same. When I last wrote to you, I described two themes that were dominating the investing atmosphere: low consumer confidence with a perception that the financial markets were in a free fall and a crisis of clarity from Washington on issues such as taxes, healthcare, and regulation. Those themes are still in play. Although consumer confidence is on the rise, we still have no real clarity on many of the major issues facing our economy. Add those dynamics to a Presidential Election year and that can equal emotional turmoil for the markets. I have stated for the record that I believe the markets will experience moderate growth this year, in the range of 8-12%, and even with the hurdles of investor perception, lack of clarity, and all the noise generated by an election year, I stand by that prediction.
In February, I wrote a commentary suggesting that the U.S. economy was in the midst of a recovery, and I still believe that is true. Americans continue to be adaptable and resilient. We listen to the financial news and worry about our home values, pension cuts, and employment figures, but we keep pulling ourselves up by our bootstraps and persevering. And, U.S. corporations are persevering, too. Even with global turmoil and no clear direction on whether our government supports “business” or not, U.S. corporations are doing well. They’ve trimmed costs, closed unprofitable business lines, saved bundles of cash and now many are even bringing their manufacturing back to the U.S. By doing all of these things, I believe we have avoided a depression, and are instead experiencing a slow, but steady, recovery.
Don’t just take my word for it. Many CEOs across the country are optimistic as well. In its April issue, the headline of The Conference Board’s* newsletter read, “CEO Confidence Increases.” The Conference Board Measure of CEO Confidence™, which had improved in the fourth quarter of last year, increased further in the first quarter of 2012. The Measure now reads 63, up from 49 last quarter. Corporations have been hoarding cash, and once these executives, who are optimistic about growth prospects and our economy, receive clear guidelines on tax rates, healthcare, and regulation, I strongly believe that they will put their cash to work and begin to hire in the later part of 2012. That is exactly what we need to get this economy moving.
| * | The Conference Board is a global, independent business membership and research association working in the public interest. |
HENNESSY FUNDS 1-800-966-4354
For the six months ended April 30, 2012 the Dow Jones Industrial Average returned 12.04% while the S&P 500 Index earned 12.77%. Those are strong six months numbers. We saw solid performance across a wide range of asset classes and sectors, which signals to me that is strength throughout the market, not just in pockets. We just need investor perception to catch up with the reality of strong market fundamentals. Once investors embrace the idea of consistent but moderate performance and return to utilizing basic fundamentals, I do believe they will return to investing in equities.
I want cooler heads to prevail. I want Washington to provide us with straightforward leadership and to give us all clear direction on the issues I have outlined. But even just giving us clarity on the fate of the Bush Tax Cuts would show every investor that there are level heads and that we have leaders among our government officials. As long-term, conservative and disciplined investors, we need to know what treatment our capital gains and dividends will receive. We need leadership that will make the tough decisions to move our nation and our economy forward.
What can we look forward to in the last six months of our fiscal year? I predict there will be a lot of debate, rhetoric, and posturing from Washington. I also believe that corporate leaders in America will continue to work hard to provide value and moderate returns to their shareholders, while waiting out the results of the election and hoping for clarity from Washington.
We will also continue to work hard to provide value and returns to each of our shareholders. At Hennessy Funds, we serve our shareholders directly, so that we can provide answers to shareholder questions and concerns, so please don’t hesitate to contact us at (800) 966-4354.
Best regards,
Neil J. Hennessy
Portfolio Manager & Chief Investment Officer
Past performance does not guarantee future results.
Mutual fund investing involves risk. Principal loss is possible.
Opinions expressed are those of Neil Hennessy and are subject to change, are not guaranteed and should not be considered investment advice.
The Dow Jones Industrial Average and the S&P 500 are unmanaged indices of common stocks comprised of major industrial companies and assume reinvestment of dividends. You cannot invest directly in an index.
(This Page Intentionally Left Blank.)
HENNESSY FUNDS 1-800-966-4354
Hennessy Cornerstone Growth Fund
Original Class Shares (HFCGX)
AVERAGE ANNUAL TOTAL RETURN PERIODS ENDED APRIL 30, 2012
| | Six | One | Five | Ten | Since Inception |
| | Months | Year | Years | Years | (11/1/96) |
| Hennessy Cornerstone | | | | | |
| Growth Fund – Original Class | 18.56% | -4.21% | -6.68% | 2.61% | 8.06% |
| Russell 2000 Index | 11.02% | -4.25% | 1.45% | 6.19% | 7.22% |
| S&P 500 Index | 12.77% | 4.76% | 1.01% | 4.71% | 6.41% |
Gross expense ratio: 1.33%
Performance data quoted represents past performance; past performance does not guarantee future results. The investment return and principal value of an investment will fluctuate so that an investor’s shares, when redeemed, may be worth more or less than their original cost. Current performance of the Fund may be lower or higher than the performance quoted. Performance data current to the most recent month end may be obtained by visiting www.hennessyfunds.com. The gross expense ratio presented is that from the most recent prospectus.
PERFORMANCE NARRATIVE
The Hennessy Cornerstone Growth Fund returned 18.56% for the six-month period ended April 30, 2012, outperforming both the Russell 2000 Index, which returned 11.02%, and the S&P 500 benchmark, which returned 12.77%, for the same period. The Fund’s outperformance to the Russell 2000 Index is primarily due to stock selection within the Industrial, Consumer Discretionary and Materials sectors. This offset negative stock selection and sector allocation within Health Care and Financial stocks. Within the Industrials sector, United Rentals (up nearly 100%) was the biggest positive contributor. The equipment rental company posted very good numbers in the first quarter of this year, surpassing all previous first quarter results on record fleet growth and margins. Our best performing stock in the portfolio during the first half of the year was Cost Plus (up approximately 145%) as the company agreed to be acquired in a friendly takeover by Bed, Bath & Beyond for $22 per share in cash, with the purchase closing in late June. Automotive parts company, Standard Motor Parts, was the worst performing stock in the portfolio during the period (down approximately 3%) despite generally good performance in the automotive space overall. While the company posted records in the 4th quarter for both sales and profit, its outlook for the first quarter of the year was lowered and subsequently caused the stock to drop.
Hennessy Cornerstone Growth Fund
Institutional Class Shares (HICGX)
AVERAGE ANNUAL TOTAL RETURN PERIODS ENDED APRIL 30, 2012
| | Six | One | Three | Since Inception |
| | Months | Year | Years | (3/3/08) |
| Hennessy Cornerstone | | | | |
| Growth Fund – Institutional Class | 18.83% | -3.85% | 14.20% | -2.62% |
| Russell 2000 Index | 11.02% | -4.25% | 20.34% | 5.84% |
| S&P 500 Index | 12.77% | 4.76% | 19.46% | 3.44% |
Gross expense ratio: 1.09%. Net expense ratio: 0.98%. The expense ratio is contractually capped at 0.98% indefinitely.
Performance data quoted represents past performance; past performance does not guarantee future results. The investment return and principal value of an investment will fluctuate so that an investor’s shares, when redeemed, may be worth more or less than their original cost. Current performance of the Fund may be lower or higher than the performance quoted. Performance data current to the most recent month end may be obtained by visiting www.hennessyfunds.com. Investment performance reflects fee waivers in effect. In the absence of such waivers, total return would be reduced. The expense ratios presented are that from the most recent prospectus.
The S&P 500 Index and Russell 2000 Index are unmanaged indices commonly used to measure the performance of U.S. Stocks. You cannot invest directly in an index. Small and medium-capitalization companies tend to have limited liquidity and greater price volatility than large-capitalization companies. Investments in foreign securities involve greater volatility and political, economic and currency risk and differences in accounting methods. References to specific securities should not be considered a recommendation to buy or sell any security. Fund holdings and sector allocations are subject to change. Please refer to the included Schedule of Investments.
HENNESSY FUNDS 1-800-966-4354
Hennessy Focus 30 Fund
Original Class Shares (HFTFX)
AVERAGE ANNUAL TOTAL RETURN PERIODS ENDED APRIL 30, 2012
| | Six | One | Five | Since Inception |
| | Months | Year | Years | (9/17/03) |
| Hennessy Focus 30 Fund – | | | | |
| Original Class | 12.51% | -0.36% | 2.56% | 10.17% |
| S&P Midcap 400 Index | 12.48% | -0.94% | 4.11% | 9.12% |
| S&P 500 Index | 12.77% | 4.76% | 1.01% | 5.77% |
Gross expense ratio: 1.36%
Performance data quoted represents past performance; past performance does not guarantee future results. The investment return and principal value of an investment will fluctuate so that an investor’s shares, when redeemed, may be worth more or less than their original cost. Current performance of the Fund may be lower or higher than the performance quoted. Performance data current to the most recent month end may be obtained by visiting www.hennessyfunds.com. The gross expense ratio presented is that from the most recent prospectus.
PERFORMANCE NARRATIVE
The Hennessy Focus 30 Fund returned 12.51% for the six-month period ended April 30, 2012, performing roughly in line with both the S&P Midcap 400 and the S&P 500 Index, which returned 12.48% and 12.77% respectively, for the same period. The Fund was aided by stock selection within the Consumer Discretionary, Energy and Utility Sectors, but performance was dragged down due to our relative weighting within the Utility and Financial sectors, which were overweighted and underweighted, respectively, versus the benchmarks. Ross Stores and Sally Beauty Holdings, both in the Consumer Discretionary sector, were the largest contributors to Fund performance, with each stock up approximately 40% during the period. Within the Energy sector, Sunoco Logistics (up 27%) was our largest performance contributor. Our largest negative contributor in performance, Tesoro (down approximately 10%), was also within the Energy sector. While the company’s stocks price underperformed relative to their peers in the refining business, they recently won a nearly $300 million contract with the Department of Defense. With a Price to Earnings multiple of approximately 6, and improving cash flows, we like the prospects of the company and continue to hold the stock within the portfolio.
Hennessy Focus 30 Fund
Institutional Class Shares (HIFTX)
AVERAGE ANNUAL TOTAL RETURN PERIODS ENDED APRIL 30, 2012
| | Six | One | Three | Since Inception |
| | Months | Year | Years | (3/3/08) |
| Hennessy Focus 30 Fund – | | | | |
| Institutional Class | 12.74% | 0.00% | 22.42% | 5.43% |
| S&P Midcap 400 Index | 12.48% | -0.94% | 22.65% | 7.26% |
| S&P 500 Index | 12.77% | 4.76% | 19.46% | 3.44% |
Gross expense ratio: 1.14%. Net expense ratio: 0.98%. The expense ratio is contractually capped at 0.98% indefinitely (not including acquired fund fees and expenses).
Performance data quoted represents past performance; past performance does not guarantee future results. The investment return and principal value of an investment will fluctuate so that an investor’s shares, when redeemed, may be worth more or less than their original cost. Current performance of the Fund may be lower or higher than the performance quoted. Performance data current to the most recent month end may be obtained by visiting www.hennessyfunds.com. Investment performance reflects fee waivers in effect. In the absence of such waivers, total return would be reduced. The expense ratios presented are that from the most recent prospectus.
The Price to Earnings Ratio reflects the multiple of earnings at which a stock sells.
The S&P 500 Index and S&P Midcap 400 Index are unmanaged indices commonly used to measure the performance of U.S. Stocks. You cannot invest directly in an index. Small and medium-capitalization companies tend to have limited liquidity and greater price volatility than large-capitalization companies. References to specific securities should not be considered a recommendation to buy or sell any security. Fund holdings and sector allocations are subject to change. Please refer to the included Schedule of Investments.
HENNESSY FUNDS 1-800-966-4354
Hennessy Cornerstone Large Growth Fund
Original Class Shares (HFLGX)
AVERAGE ANNUAL TOTAL RETURN PERIODS ENDED APRIL 30, 2012
| | Six | One | Three | Since Inception |
| | Months | Year | Years | (3/20/09) |
| Hennessy Cornerstone Large | | | | |
| Growth Fund – Original Class* | 10.66% | 1.55% | 21.39% | 26.19% |
| Russell 1000 Index | 12.89% | 4.11% | 19.88% | 24.37% |
| S&P 500 Index | 12.77% | 4.76% | 19.46% | 23.74% |
Gross expense ratio: 1.26%
Performance data quoted represents past performance; past performance does not guarantee future results. The investment return and principal value of an investment will fluctuate so that an investor’s shares, when redeemed, may be worth more or less than their original cost. Current performance of the Fund may be lower or higher than the performance quoted. Performance data current to the most recent month end may be obtained by visiting www.hennessyfunds.com. The gross expense ratio presented is that from the most recent prospectus.
| * | On March 20, 2009, the Tamarack Large Cap Growth Fund was reorganized into the Hennessy Cornerstone Large Growth Fund. At that time, the Fund began utilizing a purely quantitative formula to choose stocks for the portfolio, which differs from the investment strategy employed by the previous investment manager. Accordingly, performance is being reported for the period after the reorganization. |
PERFORMANCE NARRATIVE
The Hennessy Cornerstone Large Growth Fund returned 10.66% for the six-month period ended April 30, 2012, underperforming both the Russell 1000 and the S&P 500 Index, which returned 12.89% and 12.77% respectively, for the same period. The largest contributors to the Fund’s performance during the period were stock selection in the Industrials sector and both allocation and stock selection in the Energy sector. Stock selection within the Materials and Information Technology sectors were negative contributors to overall performance, as was our relative underweighting of the Financials sector. The biggest drawdown on performance was from our investment in Apollo Group (down roughly 26%), the educational program provider perhaps best known for their University of Phoenix division. The stock suffered in March of this year after an improving labor market and heightened competition led the company to cut its new enrollment expectations for the fiscal second quarter to essentially flat. This came only two months after signaling to investors that they expected new enrollment would roughly match the first quarter’s growth rate of approximately 13%. The single largest contributor to Fund performance was Gap, Inc. (up 52%) which started trending higher in February after announcing that earnings would be better than expected.
Hennessy Cornerstone Large Growth Fund
Institutional Class Shares (HILGX)
AVERAGE ANNUAL TOTAL RETURN PERIODS ENDED APRIL 30, 2012
| | Six | One | Three | Since Inception |
| | Months | Year | Years | (3/20/09) |
| Hennessy Cornerstone Large | | | | |
| Growth Fund – Institutional Class | 10.85% | 1.84% | 21.78% | 26.58% |
| Russell 1000 Index | 12.89% | 4.11% | 19.88% | 24.37% |
| S&P 500 Index | 12.77% | 4.76% | 19.46% | 23.74% |
Gross expense ratio: 1.14%. Net expense ratio: 0.98%. The expense ratio is contractually capped at 0.98% indefinitely.
Performance data quoted represents past performance; past performance does not guarantee future results. The investment return and principal value of an investment will fluctuate so that an investor’s shares, when redeemed, may be worth more or less than their original cost. Current performance of the Fund may be lower or higher than the performance quoted. Performance data current to the most recent month end may be obtained by visiting www.hennessyfunds.com. Investment performance reflects fee waivers in effect. In the absence of such waivers, total return would be reduced. The expense ratios presented are that from the most recent prospectus.
The S&P 500 and Russell 1000 are unmanaged indices commonly used to measure the performance of U.S. stocks. One cannot invest directly in an index. The Fund may invest in medium-capitalization companies, which tend to have limited liquidity and greater price volatility than large-capitalization companies. References to specific securities should not be considered a recommendation to buy or sell any security. Fund holdings and sector allocations are subject to change. Please refer to the included Schedule of Investments.
HENNESSY FUNDS 1-800-966-4354
Hennessy Cornerstone Value Fund
Original Class Shares (HFCVX)
AVERAGE ANNUAL TOTAL RETURN PERIODS ENDED APRIL 30, 2012
| | Six | One | Five | Ten | Since Inception |
| | Months | Year | Years | Years | (11/1/96) |
| Hennessy Cornerstone | | | | | |
| Value Fund – Original Class | 8.84% | 3.99% | -0.02% | 4.50% | 5.68% |
| Russell 1000 Value Index | 11.62% | 1.03% | -1.73% | 4.83% | 7.10% |
| S&P 500 Index | 12.77% | 4.76% | 1.01% | 4.71% | 6.41% |
Gross expense ratio: 1.31%
Performance data quoted represents past performance; past performance does not guarantee future results. The investment return and principal value of an investment will fluctuate so that an investor’s shares, when redeemed, may be worth more or less than their original cost. Current performance of the Fund may be lower or higher than the performance quoted. Performance data current to the most recent month end may be obtained by visiting www.hennessyfunds.com. The gross expense ratio presented is that from the most recent prospectus.
PERFORMANCE NARRATIVE
The Hennessy Cornerstone Value Fund returned 8.84% for the six-month period ended April 30, 2012, underperforming the Russell 1000 Value Index, which returned 11.62%, and the S&P 500 Index, which returned 12.77% for the same period. The Fund’s performance was aided by both asset allocation and stock selection in the Information Technology and our relative underweighting in the Utilities sector. Stock selection within the Energy sector was offset by weak stock selection within the Telecom Service sector. The Fund’s overall performance was hurt by positions in France Telecom and Spanish telecommunications provider, Telefonica, (down 23% and 28% respectively) as continued concerns over European affairs weighed heavily on those stocks. The Fund no longer holds positions in either of these stocks. The best performing stock in the Fund and largest single contributor to performance was Seagate Technologies (up 96%) which raised 2012 revenue guidance significantly higher than analyst expectations. This increase in revenue guidance was buoyed by disk drive shortages due to floods in Thailand, which subsequently drove both disk drive prices and earnings higher. We continue to hold our position in Seagate.
Hennessy Cornerstone Value Fund
Institutional Class Shares (HICVX)
AVERAGE ANNUAL TOTAL RETURN PERIODS ENDED APRIL 30, 2012
| | Six | One | Three | Since Inception |
| | Months | Year | Years | (3/3/08) |
| Hennessy Cornerstone Value | | | | |
| Fund – Institutional Class | 9.02% | 4.32% | 22.05% | 3.41% |
| Russell 1000 Value Index | 11.62% | 1.03% | 18.32% | 1.13% |
| S&P 500 Index | 12.77% | 4.76% | 19.46% | 3.44% |
Gross expense ratio: 1.14%. Net expense ratio: 0.98%. The expense ratio is contractually capped at 0.98% indefinitely (not including acquired fund fees and expenses).
Performance data quoted represents past performance; past performance does not guarantee future results. The investment return and principal value of an investment will fluctuate so that an investor’s shares, when redeemed, may be worth more or less than their original cost. Current performance of the Fund may be lower or higher than the performance quoted. Performance data current to the most recent month end may be obtained by visiting www.hennessyfunds.com. Investment performance reflects fee waivers in effect. In the absence of such waivers, total return would be reduced. The expense ratios presented are that from the most recent prospectus.
The Russell 1000 Value Index and S&P 500 Index are unmanaged indices commonly used to measure the performance of U.S. Stocks. You cannot invest directly in an index. The Fund may invest in medium-capitalization companies which tend to have limited liquidity and greater price volatility than large-capitalization companies. Investments in foreign securities involve greater volatility and political, economic and currency risk and differences in accounting methods. References to specific securities should not be considered a recommendation to buy or sell any security. Fund holdings and sector allocations are subject to change. Please refer to the included Schedule of Investments.
HENNESSY FUNDS 1-800-966-4354
Hennessy Total Return Fund
Original Class Shares (HDOGX)
AVERAGE ANNUAL TOTAL RETURN PERIODS ENDED APRIL 30, 2012
| | Six | One | Five | Ten | Since Inception |
| | Months | Year | Years | Years | (7/29/98) |
| Hennessy Total Return Fund | 8.67% | 8.30% | 0.65% | 3.83% | 3.64% |
| Dow Jones Industrial Average | 12.04% | 5.97% | 3.04% | 5.50% | 5.27% |
| S&P 500 Index | 12.77% | 4.76% | 1.01% | 4.71% | 3.43% |
Gross expense ratio: 1.34%
Expenses net of interest expense: 1.24%
Performance data quoted represents past performance; past performance does not guarantee future results. The investment return and principal value of an investment will fluctuate so that an investor’s shares, when redeemed, may be worth more or less than their original cost. Current performance of the Fund may be lower or higher than the performance quoted. Performance data current to the most recent month end may be obtained by visiting www.hennessyfunds.com. The gross expense ratio presented is that from the most recent prospectus.
PERFORMANCE NARRATIVE
The Hennessy Total Return Fund returned 8.67% for the six-month period ended April 30, 2012, underperforming the Dow Jones Industrial Average, which returned 12.04%, and the S&P 500 Index, which returned 12.77%, for the same period. The Fund’s roughly 25% weighting in Treasury Bills hurt overall performance as yields flirted with historic lows, at times essentially equaling zero. The Fund’s approximately 75% equity weighting was able to nearly capture the weighted return of the Dow Jones Industrial Average, with the Fund’s three largest holdings (Intel, DuPont & General Electric) all posting double-digit returns during the period. With dividends taken into account, which is a large part of the basis for the Fund, all of the companies in the top ten holdings posted gains during the six-month period.
The Dow Jones Industrial Average and S&P 500 Index are unmanaged indices commonly used to measure the performance of U.S. Stocks. You cannot invest directly in an index. The Hennessy Total Return Fund is non-diversified, meaning it may concentrate its assets in fewer individual holdings than a diversified fund, making it more exposed to individual stock volatility than a diversified fund. References to specific securities should not be considered a recommendation to buy or sell any security. Fund holdings are subject to change. Please refer to the included Schedule of Investments.
Hennessy Balanced Fund
Original Class Shares (HBFBX)
AVERAGE ANNUAL TOTAL RETURN PERIODS ENDED APRIL 30, 2012
| | Six | One | Five | Ten | Since Inception |
| | Months | Year | Years | Years | (3/8/96) |
| Hennessy Balanced Fund | 5.35% | 4.98% | 1.40% | 2.81% | 4.19% |
| Dow Jones Industrial Average | 12.04% | 5.97% | 3.04% | 5.50% | 7.97% |
| S&P 500 Index | 12.77% | 4.76% | 1.01% | 4.71% | 6.93% |
Gross expense ratio: 1.62%
Performance data quoted represents past performance; past performance does not guarantee future results. The investment return and principal value of an investment will fluctuate so that an investor’s shares, when redeemed, may be worth more or less than their original cost. Current performance of the Fund may be lower or higher than the performance quoted. Performance data current to the most recent month end may be obtained by visiting www.hennessyfunds.com. The gross expense ratio presented is that from the most recent prospectus.
PERFORMANCE NARRATIVE
The Hennessy Balanced Fund returned 5.35% for the six-month period ended April 30, 2012, lagging both the Dow Jones Industrial Average, which returned 12.04%, and the S&P 500 Index, which returned 12.77%, for the same period. The Fund’s relative underperformance to its benchmarks is due primarily to the continued low yields on Treasury Bills. The Fund’s position of approximately 50% in Treasuries did not allow it to fully capture the performance of the equity markets over the period. While the portfolio may underperform the indices in periods where equities rise sharply, the strategy is geared to capture near market returns with a lower risk profile, since only half of the assets are invested in equities. Conversely, if equity markets were to fall sharply, we would expect the Fund to perform better than the indices. With dividends taken into account, which is a large part of the basis for the Fund, all of the companies in the top ten holdings posted gains during the six-month period.
The Dow Jones Industrial Average and S&P 500 Index are unmanaged indices commonly used to measure the performance of U.S. Stocks. You cannot invest directly in an index. The Hennessy Balanced Fund is non-diversified, meaning it may concentrate its assets in fewer individual holdings than a diversified fund, making it more exposed to individual stock volatility than a diversified fund. References to specific securities should not be considered a recommendation to buy or sell any security. Fund holdings are subject to change. Please refer to the included Schedule of Investments.
HENNESSY FUNDS 1-800-966-4354
(This Page Intentionally Left Blank.)
Schedules of Investments
HENNESSY CORNERSTONE GROWTH FUND
As of April 30, 2012 (Unaudited)
(% of Net Assets)
| TOP TEN EQUITY HOLDINGS | % of net assets |
| American Vanguard Corp. | 2.95% |
| Leapfrog Enterprises, Inc. | 2.52% |
| Arctic Cat, Inc. | 2.40% |
| Cost Plus, Inc. | 2.37% |
| Sally Beauty Holdings, Inc. | 2.36% |
| TJX Companies, Inc. | 2.22% |
| Ross Stores, Inc. | 2.18% |
| DXP Enterprises, Inc. | 2.15% |
| Genesco, Inc. | 2.14% |
| Tractor Supply Co. | 2.13% |
HENNESSYFUNDS 1-800-966-4354
| | COMMON STOCKS – 96.30% | | Number of | | | | | | % of | |
| | | | Shares | | | Value | | | Net Assets | |
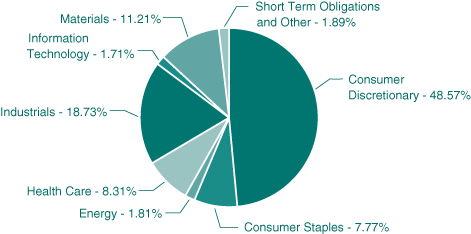
| | Consumer Discretionary – 48.57% | | | | | | | | | |
| | Arctic Cat, Inc. (a) | | | 114,700 | | | $ | 5,074,328 | | | | 2.40 | % |
| | Caribou Coffee, Inc. (a) | | | 221,500 | | | | 3,634,815 | | | | 1.72 | % |
| | Churchill Downs, Inc. | | | 68,696 | | | | 4,077,795 | | | | 1.92 | % |
| | Cost Plus, Inc. (a) | | | 259,100 | | | | 5,018,767 | | | | 2.37 | % |
| | Dollar General Corp (a) | | | 92,085 | | | | 4,370,354 | | | | 2.06 | % |
| | Dominos Pizza, Inc. (a) | | | 117,400 | | | | 4,438,894 | | | | 2.09 | % |
| | Foot Locker, Inc. | | | 145,900 | | | | 4,463,081 | | | | 2.11 | % |
| | Genesco, Inc. (a) | | | 60,400 | | | | 4,530,000 | | | | 2.14 | % |
| | Group 1 Automotive, Inc. | | | 69,800 | | | | 4,040,024 | | | | 1.91 | % |
| | La-Z-Boy, Inc. (a) | | | 281,600 | | | | 4,243,712 | | | | 2.00 | % |
| | Leapfrog Enterprises, Inc. (a) | | | 571,800 | | | | 5,340,612 | | | | 2.52 | % |
| | Lithia Motors, Inc. | | | 158,900 | | | | 4,263,287 | | | | 2.01 | % |
| | Macy’s, Inc. | | | 108,900 | | | | 4,467,078 | | | | 2.11 | % |
| | Mens Wearhouse, Inc. | | | 104,850 | | | | 3,883,644 | | | | 1.83 | % |
| | Oxford Industries, Inc. | | | 77,550 | | | | 3,721,624 | | | | 1.76 | % |
| | Papa Johns International, Inc. (a) | | | 98,100 | | | | 3,951,468 | | | | 1.86 | % |
| | Pier 1 Imports, Inc. | | | 233,100 | | | | 4,004,658 | | | | 1.89 | % |
| | Pool Corp. | | | 112,009 | | | | 4,134,252 | | | | 1.95 | % |
| | Ross Stores, Inc. | | | 75,140 | | | | 4,627,873 | | | | 2.18 | % |
| | Sally Beauty Holdings, Inc. (a) | | | 187,600 | | | | 4,990,160 | | | | 2.36 | % |
| | Standard Motor Products, Inc. | | | 171,400 | | | | 2,582,998 | | | | 1.22 | % |
| | TJX Companies, Inc. | | | 112,830 | | | | 4,706,139 | | | | 2.22 | % |
| | Tractor Supply Co. | | | 45,900 | | | | 4,517,019 | | | | 2.13 | % |
| | VOXX International Corp. (a) | | | 301,800 | | | | 3,829,842 | | | | 1.81 | % |
| | | | | | | | | 102,912,424 | | | | 48.57 | % |
| | | | | | | | | | | | | | |
| | Consumer Staples – 7.77% | | | | | | | | | | | | |
| | CVS Caremark Corp. | | | 90,600 | | | | 4,042,572 | | | | 1.91 | % |
| | Elizabeth Arden, Inc. (a) | | | 98,500 | | | | 3,839,530 | | | | 1.81 | % |
| | Susser Holdings Corp. (a) | | | 160,900 | | | | 4,294,421 | | | | 2.03 | % |
| | Whole Foods Market, Inc. | | | 51,550 | | | | 4,282,259 | | | | 2.02 | % |
| | | | | | | | | 16,458,782 | | | | 7.77 | % |
| | | | | | | | | | | | | | |
| | Health Care – 8.31% | | | | | | | | | | | | |
| | Cambrex Corp. (a) | | | 574,300 | | | | 3,721,464 | | | | 1.76 | % |
The accompanying notes are an integral part of these financial statements.
| | COMMON STOCKS | | Number of | | | | | | % of | |
| | | | Shares | | | Value | | | Net Assets | |
| | Health Care (Continued) | | | | | | | | | |
| | Centene Corp. (a) | | | 85,300 | | | $ | 3,377,027 | | | | 1.59 | % |
| | Metropolitan Health Networks, Inc. (a) | | | 469,914 | | | | 3,514,957 | | | | 1.66 | % |
| | Molina Healthcare, Inc. (a) | | | 120,500 | | | | 3,090,825 | | | | 1.46 | % |
| | Wellcare Health Plans, Inc. (a) | | | 63,800 | | | | 3,903,284 | | | | 1.84 | % |
| | | | | | | | | 17,607,557 | | | | 8.31 | % |
| | | | | | | | | | | | | | |
| | Industrials – 18.73% | | | | | | | | | | | | |
| | Cintas Corp. | | | 102,500 | | | | 4,014,925 | | | | 1.89 | % |
| | DXP Enterprises, Inc. (a) | | | 105,000 | | | | 4,553,850 | | | | 2.15 | % |
| | Dycom Industries, Inc. (a) | | | 168,100 | | | | 3,931,859 | | | | 1.86 | % |
| | Innerworkings, Inc. (a) | | | 336,965 | | | | 3,878,467 | | | | 1.83 | % |
| | Mueller Industries, Inc. | | | 80,150 | | | | 3,663,657 | | | | 1.73 | % |
| | Navigant Consulting, Inc. (a) | | | 285,100 | | | | 3,968,592 | | | | 1.87 | % |
| | Old Dominion Freight Line, Inc. (a) | | | 88,600 | | | | 3,940,042 | | | | 1.86 | % |
| | Primoris Services Corp. | | | 241,200 | | | | 3,478,104 | | | | 1.64 | % |
| | Triumph Group, Inc. | | | 60,400 | | | | 3,794,328 | | | | 1.79 | % |
| | United Rentals, Inc. (a) | | | 95,600 | | | | 4,462,608 | | | | 2.11 | % |
| | | | | | | | | 39,686,432 | | | | 18.73 | % |
| | | | | | | | | | | | | | |
| | Information Technology – 1.71% | | | | | | | | | | | | |
| | Netgear, Inc. (a) | | | 94,000 | | | | 3,619,000 | | | | 1.71 | % |
| | | | | | | | | | | | | | |
| | Materials – 11.21% | | | | | | | | | | | | |
| | American Vanguard Corp. | | | 249,700 | | | | 6,242,500 | | | | 2.95 | % |
| | H.B. Fuller Co. | | | 132,200 | | | | 4,349,380 | | | | 2.05 | % |
| | Neenah Paper, Inc. | | | 157,105 | | | | 4,486,919 | | | | 2.12 | % |
| | NewMarket Corp. | | | 19,900 | | | | 4,442,078 | | | | 2.09 | % |
| | W.R. Grace & Co. (a) | | | 71,250 | | | | 4,247,212 | | | | 2.00 | % |
| | | | | | | | | 23,768,089 | | | | 11.21 | % |
| | | | | | | | | | | | | | |
| | Total Common Stocks (Cost $188,310,746) | | | | | | | 204,052,284 | | | | 96.30 | % |
| | PARTNERSHIPS – 1.81% | | | | | | | | | |
| | Energy – 1.81% | | | | | | | | | |
| | Oneok Partners L.P. | | | 68,600 | | | | 3,825,136 | | | | 1.81 | % |
| | | | | | | | | | | | | | |
| | Total Partnerships (Cost $3,960,624) | | | | | | | 3,825,136 | | | | 1.81 | % |
The accompanying notes are an integral part of these financial statements.
HENNESSY FUNDS 1-800-966-4354
| | SHORT-TERM INVESTMENTS – 2.20% | | Principal | | | | | | % of | |
| | | | Value | | | Value | | | Net Assets | |
| | Demand Note# – 0.88% | | | | | | | | | |
| | American Family Financial Services, 0.100% | | $ | 1,877,620 | | | $ | 1,877,620 | | | | 0.88 | % |
| | | | | | | | | | | | | | |
| | Total Demand Note (Cost $1,877,620) | | | | | | | 1,877,620 | | | | 0.88 | % |
| | | | | | | | | | | | | | |
| | | | Number of | | | | | | | | | |
| | | | Shares | | | | | | | | | |
| | Money Market Fund – 1.32% | | | | | | | | | | | | |
| | Fidelity Government Portfolio – | | | | | | | | | | | | |
| | Institutional Class, 0.010% (b) | | | 2,791,135 | | | | 2,791,135 | | | | 1.32 | % |
| | | | | | | | | | | | | | |
| | Total Money Market Funds | | | | | | | | | | | | |
| | (Cost $2,791,135) | | | | | | | 2,791,135 | | | | 1.32 | % |
| | | | | | | | | | | | | | |
| | Total Short-Term Investments | | | | | | | | | | | | |
| | (Cost $4,668,755) | | | | | | | 4,668,755 | | | | 2.20 | % |
| | | | | | | | | | | | | | |
| | Total Investments – 100.31% | | | | | | | | | | | | |
| | (Cost $196,940,125) | | | | | | | 212,546,175 | | | | 100.31 | % |
| | | | | | | | | | | | | | |
| | Liabilities in Excess of Other Assets – (0.31)% | | | | | | | (661,225 | ) | | | (0.31 | )% |
| | TOTAL NET ASSETS – 100.00% | | | | | | $ | 211,884,950 | | | | 100.00 | % |
Percentages are stated as a percent of net assets.
| (a) | | Non-income producing security. |
| (b) | | The rate listed is the fund’s 7-day yield as of April 30, 2012. |
| # | | Variable rate demand notes are considered short-term obligations and are payable on demand. Interest rates change periodically on specified dates. Interest rates listed are as of April 30, 2012. |
The accompanying notes are an integral part of these financial statements.
Summary of Fair Value Exposure at April 30, 2012
The following is a summary of the inputs used to value the Fund’s net assets as of April 30, 2012 (See Note 3 in the accompanying notes to the financial statements):
| Common Stock | | Level 1 | | | Level 2 | | | Level 3 | | | Total | |
| Consumer Discretionary | | $ | 102,912,424 | | | $ | — | | | $ | — | | | $ | 102,912,424 | |
| Consumer Staples | | | 16,458,782 | | | | — | | | | — | | | | 16,458,782 | |
| Health Care | | | 17,607,557 | | | | — | | | | — | | | | 17,607,557 | |
| Industrials | | | 39,686,432 | | | | — | | | | — | | | | 39,686,432 | |
| Information Technology | | | 3,619,000 | | | | — | | | | — | | | | 3,619,000 | |
| Materials | | | 23,768,089 | | | | — | | | | — | | | | 23,768,089 | |
| Total Common Stock | | $ | 204,052,284 | | | $ | — | | | $ | — | | | $ | 204,052,284 | |
| Partnerships | | | | | | | | | | | | | | | | |
| Energy | | $ | 3,825,136 | | | $ | — | | | $ | — | | | $ | 3,825,136 | |
| Total Partnerships | | $ | 3,825,136 | | | $ | — | | | $ | — | | | $ | 3,825,136 | |
| Short-Term Investments | | | | | | | | | | | | | | | | |
| Money Market Funds | | $ | 2,791,135 | | | $ | — | | | $ | — | | | $ | 2,791,135 | |
| Demand Notes | | | — | | | | 1,877,620 | | | | — | | | | 1,877,620 | |
| Total Short-Term Investments | | $ | 2,791,135 | | | $ | 1,877,620 | | | $ | — | | | $ | 4,668,755 | |
| Total Investments in Securities | | $ | 210,668,555 | | | $ | 1,877,620 | | | $ | — | | | $ | 212,546,175 | |
Transfers between levels are recognized at the end of the reporting period. During the period ended April 30, 2012, the Fund recognized no transfers between levels.
The accompanying notes are an integral part of these financial statements.
HENNESSY FUNDS 1-800-966-4354
HENNESSY FOCUS 30 FUND
As of April 30, 2012 (Unaudited)
(% of Net Assets)
| TOP TEN EQUITY HOLDINGS | % of net assets |
| Sally Beauty Holdings, Inc. | 4.22% |
| Ross Stores, Inc. | 4.08% |
| Genesco, Inc. | 3.74% |
| Sunoco Logistics Partners L.P. | 3.58% |
| Petsmart, Inc. | 3.53% |
| Triumph Group, Inc. | 3.48% |
| Dominos Pizza, Inc. | 3.45% |
| Teledyne Technologies, Inc. | 3.43% |
| Casey’s General Stores, Inc. | 3.42% |
| Jabil Circuit, Inc. | 3.39% |
| | COMMON STOCKS – 90.92% | | Number of | | | | | | % of | |
| | | | Shares | | | Value | | | Net Assets | |
| | Consumer Discretionary – 32.12% | | | | | | | | | |
| | Dominos Pizza, Inc. (a) | | | 132,700 | | | $ | 5,017,387 | | | | 3.45 | % |
| | Family Dollar Stores, Inc. | | | 71,400 | | | | 4,823,070 | | | | 3.31 | % |
| | Genesco, Inc. (a) | | | 72,700 | | | | 5,452,500 | | | | 3.74 | % |
| | Genuine Parts Co. | | | 73,800 | | | | 4,780,764 | | | | 3.28 | % |
| | HSN, Inc. | | | 117,800 | | | | 4,558,860 | | | | 3.13 | % |
| | LKQ Corp. (a) | | | 147,200 | | | | 4,923,840 | | | | 3.38 | % |
| | Petsmart, Inc. | | | 88,100 | | | | 5,132,706 | | | | 3.53 | % |
| | Ross Stores, Inc. | | | 96,500 | | | | 5,943,435 | | | | 4.08 | % |
| | Sally Beauty Holdings, Inc. (a) | | | 230,800 | | | | 6,139,280 | | | | 4.22 | % |
| | | | | | | | | 46,771,842 | | | | 32.12 | % |
| | | | | | | | | | | | | | |
| | Consumer Staples – 9.65% | | | | | | | | | | | | |
| | Casey’s General Stores, Inc. | | | 88,500 | | | | 4,986,975 | | | | 3.42 | % |
| | Dr. Pepper Snapple Group, Inc. | | | 105,000 | | | | 4,260,900 | | | | 2.93 | % |
| | PriceSmart, Inc. | | | 58,300 | | | | 4,812,082 | | | | 3.30 | % |
| | | | | | | | | 14,059,957 | | | | 9.65 | % |
| | | | | | | | | | | | | | |
| | Energy – 5.90% | | | | | | | | | | | | |
| | Tesoro Corp. (a) | | | 163,100 | | | | 3,792,075 | | | | 2.60 | % |
| | World Fuel Services Corp. | | | 108,900 | | | | 4,798,134 | | | | 3.30 | % |
| | | | | | | | | 8,590,209 | | | | 5.90 | % |
| | | | | | | | | | | | | | |
| | Industrials – 12.84% | | | | | | | | | | | | |
| | Mueller Industries, Inc. | | | 94,600 | | | | 4,324,166 | | | | 2.97 | % |
| | Teledyne Technologies, Inc. (a) | | | 77,200 | | | | 4,988,664 | | | | 3.43 | % |
| | Towers Watson & Co. | | | 65,932 | | | | 4,311,952 | | | | 2.96 | % |
| | Triumph Group, Inc. | | | 80,600 | | | | 5,063,292 | | | | 3.48 | % |
| | | | | | | | | 18,688,074 | | | | 12.84 | % |
| | | | | | | | | | | | | | |
| | Information Technology – 3.39% | | | | | | | | | | | | |
| | Jabil Circuit, Inc. | | | 210,700 | | | | 4,940,915 | | | | 3.39 | % |
| | | | | | | | | | | | | | |
| | Utilities – 27.02% | | | | | | | | | | | | |
| | Alliant Energy Corp. | | | 101,400 | | | | 4,587,336 | | | | 3.15 | % |
| | Centerpoint Energy, Inc. | | | 199,200 | | | | 4,025,832 | | | | 2.76 | % |
| | CMS Energy Corp. | | | 200,900 | | | | 4,618,691 | | | | 3.17 | % |
| | New Jersey Resources Corp. | | | 91,700 | | | | 3,965,108 | | | | 2.72 | % |
| | NiSource, Inc. | | | 185,100 | | | | 4,562,715 | | | | 3.13 | % |
The accompanying notes are an integral part of these financial statements.
HENNESSY FUNDS 1-800-966-4354
| | COMMON STOCKS | | Number of | | | | | | % of | |
| | | | Shares | | | Value | | | Net Assets | |
| | Utilities (Continued) | | | | | | | | | |
| | Pinnacle West Capital Corp. | | | 90,900 | | | $ | 4,395,015 | | | | 3.02 | % |
| | Scana Corp. | | | 99,000 | | | | 4,565,880 | | | | 3.14 | % |
| | UIL Holdings Corp. | | | 124,700 | | | | 4,285,939 | | | | 2.94 | % |
| | Westar Energy, Inc. | | | 151,900 | | | | 4,358,011 | | | | 2.99 | % |
| | | | | | | | | 39,364,527 | | | | 27.02 | % |
| | | | | | | | | | | | | | |
| | Total Common Stocks (Cost $115,702,001) | | | | | | | 132,415,524 | | | | 90.92 | % |
| | | | | | | | | | | | | | |
| | PARTNERSHIPS – 6.90% | | | | | | | | | | | | |
| | Energy – 6.90% | | | | | | | | | | | | |
| | Oneok Partners L.P. | | | 86,700 | | | | 4,834,392 | | | | 3.32 | % |
| | Sunoco Logistics Partners L.P. | | | 128,100 | | | | 5,212,389 | | | | 3.58 | % |
| | | | | | | | | 10,046,781 | | | | 6.90 | % |
| | | | | | | | | | | | | | |
| | Total Partnerships (Cost $8,098,361) | | | | | | | 10,046,781 | | | | 6.90 | % |
| | | | | | | | | | | | | | |
| | SHORT-TERM INVESTMENTS – 2.19% | | | | | | | | | | | | |
| | Money Market Fund – 2.19% | | | | | | | | | | | | |
| | Fidelity Government Portfolio – | | | | | | | | | | | | |
| | Institutional Class, 0.010% (b) | | | 3,182,672 | | | | 3,182,672 | | | | 2.19 | % |
| | | | | | | | | | | | | | |
| | Total Money Market Fund | | | | | | | | | | | | |
| | (Cost $3,182,672) | | | | | | | 3,182,672 | | | | 2.19 | % |
| | | | | | | | | | | | | | |
| | Total Short-Term Investments | | | | | | | | | | | | |
| | (Cost $3,182,672) | | | | | | | 3,182,672 | | | | 2.19 | % |
| | | | | | | | | | | | | | |
| | Total Investments – 100.01% | | | | | | | | | | | | |
| | (Cost $126,983,034) | | | | | | | 145,644,977 | | | | 100.01 | % |
| | | | | | | | | | | | | | |
| | Liabilities in Excess of Other Assets – (0.01)% | | | | | | | (18,066 | ) | | | (0.01 | )% |
| | TOTAL NET ASSETS – 100.00% | | | | | | $ | 145,626,911 | | | | 100.00 | % |
Percentages are stated as a percent of net assets.
| (a) | Non-income producing security. |
| (b) | The rate listed is the fund’s 7-day yield as of April 30, 2012. |
The accompanying notes are an integral part of these financial statements.
Summary of Fair Value Exposure at April 30, 2012
The following is a summary of the inputs used to value the Fund’s net assets as of April 30, 2012 (See Note 3 in the accompanying notes to the financial statements):
| Common Stock | | Level 1 | | | Level 2 | | | Level 3 | | | Total | |
| Consumer Discretionary | | $ | 46,771,842 | | | $ | — | | | $ | — | | | $ | 46,771,842 | |
| Consumer Staples | | | 14,059,957 | | | | — | | | | — | | | | 14,059,957 | |
| Energy | | | 8,590,209 | | | | — | | | | — | | | | 8,590,209 | |
| Industrials | | | 18,688,074 | | | | — | | | | — | | | | 18,688,074 | |
| Information Technology | | | 4,940,915 | | | | — | | | | — | | | | 4,940,915 | |
| Utilities | | | 39,364,527 | | | | — | | | | — | | | | 39,364,527 | |
| Total Common Stock | | $ | 132,415,524 | | | $ | — | | | $ | — | | | $ | 132,415,524 | |
| Partnerships | | | | | | | | | | | | | | | | |
| Energy | | $ | 10,046,781 | | | $ | — | | | $ | — | | | $ | 10,046,781 | |
| Total Partnerships | | $ | 10,046,781 | | | $ | — | | | $ | — | | | $ | 10,046,781 | |
| Short-Term Investments | | | | | | | | | | | | | | | | |
| Money Market Funds | | $ | 3,182,672 | | | $ | — | | | $ | — | | | $ | 3,182,672 | |
| Total Short-Term Investments | | $ | 3,182,672 | | | $ | — | | | $ | — | | | $ | 3,182,672 | |
| Total Investments in Securities | | $ | 145,644,977 | | | $ | — | | | $ | — | | | $ | 145,644,977 | |
Transfers between levels are recognized at the end of the reporting period. During the period ended April 30, 2012, the Fund recognized no transfers between levels.
The accompanying notes are an integral part of these financial statements.
HENNESSY FUNDS 1-800-966-4354
HENNESSY CORNERSTONE
LARGE GROWTH FUND
As of April 30, 2012 (Unaudited)
(% of Net Assets)
| TOP TEN EQUITY HOLDINGS | % of net assets |
| TJX Companies, Inc. | 3.01% |
| Advance Auto Parts, Inc. | 2.57% |
| Gilead Sciences, Inc. | 2.46% |
| Mattel, Inc. | 2.45% |
| Microsoft Corp. | 2.43% |
| The Gap, Inc. | 2.41% |
| International Business Machines Corp. | 2.36% |
| Intel Corp. | 2.34% |
| Limited Brands, Inc. | 2.29% |
| Kimberly Clark Corp. | 2.25% |
| | COMMON STOCKS – 96.75% | | Number of | | | | | | % of | |
| | | | Shares | | | Value | | | Net Assets | |
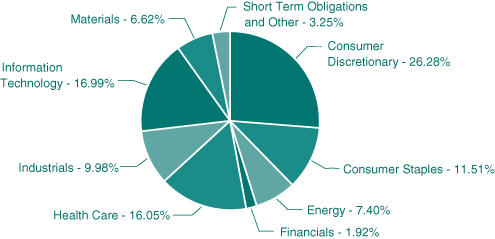
| | Consumer Discretionary – 26.28% | | | | | | | | | |
| | Advance Auto Parts, Inc. | | | 22,400 | | | $ | 2,056,320 | | | | 2.57 | % |
| | AMC Networks, Inc. (a) | | | 10,925 | | | | 464,313 | | | | 0.58 | % |
| | Apollo Group, Inc. (a) | | | 36,900 | | | | 1,299,618 | | | | 1.63 | % |
| | Autoliv, Inc. | | | 20,000 | | | | 1,254,800 | | | | 1.57 | % |
| | Best Buy Co., Inc. | | | 50,700 | | | | 1,118,949 | | | | 1.40 | % |
| | Cablevision Systems Corp. | | | 32,800 | | | | 486,096 | | | | 0.61 | % |
| | DIRECTV (a) | | | 31,200 | | | | 1,537,224 | | | | 1.92 | % |
| | Dish Network Corp. | | | 52,600 | | | | 1,681,622 | | | | 2.10 | % |
| | Limited Brands, Inc. | | | 36,800 | | | | 1,828,960 | | | | 2.29 | % |
| | Mattel, Inc. | | | 58,300 | | | | 1,958,880 | | | | 2.45 | % |
| | Nordstrom, Inc. | | | 31,700 | | | | 1,770,762 | | | | 2.21 | % |
| | The Gap, Inc. | | | 67,500 | | | | 1,923,750 | | | | 2.41 | % |
| | TJX Companies, Inc. | | | 57,800 | | | | 2,410,838 | | | | 3.01 | % |
| | TRW Automotive Holdings Corp. (a) | | | 26,700 | | | | 1,220,457 | | | | 1.53 | % |
| | | | | | | | | 21,012,589 | | | | 26.28 | % |
| | | | | | | | | | | | | | |
| | Consumer Staples – 11.51% | | | | | | | | | | | | |
| | Campbell Soup Co. | | | 45,800 | | | | 1,549,414 | | | | 1.94 | % |
| | General Mills, Inc. | | | 39,800 | | | | 1,547,822 | | | | 1.94 | % |
| | Kimberly Clark Corp. | | | 22,900 | | | | 1,796,963 | | | | 2.25 | % |
| | Sysco Corp. | | | 49,500 | | | | 1,430,550 | | | | 1.79 | % |
| | Walgreen Co. | | | 35,000 | | | | 1,227,100 | | | | 1.53 | % |
| | Wal-Mart Stores, Inc. | | | 28,000 | | | | 1,649,480 | | | | 2.06 | % |
| | | | | | | | | 9,201,329 | | | | 11.51 | % |
| | | | | | | | | | | | | | |
| | Energy – 7.40% | | | | | | | | | | | | |
| | Chevron Corp. | | | 15,100 | | | | 1,609,056 | | | | 2.01 | % |
| | Cimarex Energy Co. | | | 16,700 | | | | 1,154,137 | | | | 1.44 | % |
| | Diamond Offshore Drilling, Inc. | | | 22,100 | | | | 1,514,955 | | | | 1.90 | % |
| | Exxon Mobil Corp. | | | 19,000 | | | | 1,640,460 | | | | 2.05 | % |
| | | | | | | | | 5,918,608 | | | | 7.40 | % |
| | | | | | | | | | | | | | |
| | Financials – 1.92% | | | | | | | | | | | | |
| | The Progressive Corp. | | | 72,100 | | | | 1,535,730 | | | | 1.92 | % |
| | | | | | | | | | | | | | |
| | Health Care – 16.05% | | | | | | | | | | | | |
| | Aetna, Inc. | | | 36,100 | | | | 1,589,844 | | | | 1.99 | % |
The accompanying notes are an integral part of these financial statements.
HENNESSY FUNDS 1-800-966-4354
| | COMMON STOCKS | | Number of | | | | | | % of | |
| | | | Shares | | | Value | | | Net Assets | |
| | Health Care (Continued) | | | | | | | | | |
| | CIGNA Corp. | | | 32,300 | | | $ | 1,493,229 | | | | 1.87 | % |
| | Eli Lilly & Co. | | | 40,300 | | | | 1,668,017 | | | | 2.08 | % |
| | Forest Laboratories, Inc. (a) | | | 45,900 | | | | 1,598,697 | | | | 2.00 | % |
| | Gilead Sciences, Inc. (a) | | | 37,800 | | | | 1,965,978 | | | | 2.46 | % |
| | HCA Holdings, Inc. | | | 44,700 | | | | 1,203,324 | | | | 1.50 | % |
| | Humana, Inc. | | | 19,700 | | | | 1,589,396 | | | | 1.99 | % |
| | UnitedHealth Group, Inc. | | | 30,800 | | | | 1,729,420 | | | | 2.16 | % |
| | | | | | | | | 12,837,905 | | | | 16.05 | % |
| | | | | | | | | | | | | | |
| | Industrials – 9.98% | | | | | | | | | | | | |
| | General Dynamics Corp. | | | 20,600 | | | | 1,390,500 | | | | 1.74 | % |
| | Lockheed Martin Corp. | | | 19,400 | | | | 1,756,476 | | | | 2.19 | % |
| | Raytheon Co. | | | 31,300 | | | | 1,694,582 | | | | 2.12 | % |
| | The Boeing Co. | | | 19,500 | | | | 1,497,600 | | | | 1.87 | % |
| | The Timken Co. | | | 29,100 | | | | 1,644,441 | | | | 2.06 | % |
| | | | | | | | | 7,983,599 | | | | 9.98 | % |
| | | | | | | | | | | | | | |
| | Information Technology – 16.99% | | | | | | | | | | | | |
| | Applied Materials, Inc. | | | 103,400 | | | | 1,239,766 | | | | 1.55 | % |
| | Dell, Inc. (a) | | | 92,200 | | | | 1,509,314 | | | | 1.89 | % |
| | Harris Corp. | | | 31,500 | | | | 1,434,510 | | | | 1.79 | % |
| | Hewlett-Packard Co. | | | 37,600 | | | | 930,976 | | | | 1.16 | % |
| | Intel Corp. | | | 65,900 | | | | 1,871,560 | | | | 2.34 | % |
| | International Business Machines Corp. | | | 9,100 | | | | 1,884,428 | | | | 2.36 | % |
| | LAM Research Corp. (a) | | | 32,600 | | | | 1,357,790 | | | | 1.70 | % |
| | Microsoft Corp. | | | 60,800 | | | | 1,946,816 | | | | 2.43 | % |
| | Texas Instruments, Inc. | | | 44,200 | | | | 1,411,748 | | | | 1.77 | % |
| | | | | | | | | 13,586,908 | | | | 16.99 | % |
| | | | | | | | | | | | | | |
| | Materials – 6.62% | | | | | | | | | | | | |
| | Cliffs Natural Resources Inc. | | | 18,000 | | | | 1,120,680 | | | | 1.40 | % |
| | Eastman Chemical Co. | | | 29,100 | | | | 1,570,527 | | | | 1.97 | % |
| | Freeport-McMoRan Copper & Gold, Inc. | | | 32,000 | | | | 1,225,600 | | | | 1.53 | % |
| | Newmont Mining Corp. | | | 28,900 | | | | 1,377,085 | | | | 1.72 | % |
| | | | | | | | | 5,293,892 | | | | 6.62 | % |
| | | | | | | | | | | | | | |
| | Total Common Stocks (Cost $71,542,390) | | | | | | | 77,370,560 | | | | 96.75 | % |
The accompanying notes are an integral part of these financial statements.
| | SHORT-TERM INVESTMENTS – 3.27% | | Number of | | | | | | % of | |
| | | | Shares | | | Value | | | Net Assets | |
| | Money Market Fund – 3.27% | | | | | | | | | |
| | Fidelity Government Portfolio – | | | | | | | | | |
| | Institutional Class, 0.010% (b) | | | 2,613,905 | | | $ | 2,613,905 | | | | 3.27 | % |
| | | | | | | | | | | | | | |
| | Total Money Market Fund | | | | | | | | | | | | |
| | (Cost $2,613,905) | | | | | | | 2,613,905 | | | | 3.27 | % |
| | | | | | | | | | | | | | |
| | Total Short-Term Investments | | | | | | | | | | | | |
| | (Cost $2,613,905) | | | | | | | 2,613,905 | | | | 3.27 | % |
| | | | | | | | | | | | | | |
| | Total Investments – 100.02% | | | | | | | | | | | | |
| | (Cost $74,156,295) | | | | | | | 79,984,465 | | | | 100.02 | % |
| | | | | | | | | | | | | | |
| | Liabilities in Excess of Other Assets – (0.02)% | | | | | | | (13,461 | ) | | | (0.02 | )% |
| | TOTAL NET ASSETS – 100.00% | | | | | | $ | 79,971,004 | | | | 100.00 | % |
Percentages are stated as a percent of net assets.
| (a) | Non-income producing security. |
| (b) | The rate listed is the fund’s 7-day yield as of April 30, 2012. |
Summary of Fair Value Exposure at April 30, 2012
The following is a summary of the inputs used to value the Fund’s net assets as of April 30, 2012 (See Note 3 in the accompanying notes to the financial statements):
| Common Stock | | Level 1 | | | Level 2 | | | Level 3 | | | Total | |
| Consumer Discretionary | | $ | 21,012,589 | | | $ | — | | | $ | — | | | $ | 21,012,589 | |
| Consumer Staples | | | 9,201,329 | | | | — | | | | — | | | | 9,201,329 | |
| Energy | | | 5,918,608 | | | | — | | | | — | | | | 5,918,608 | |
| Financials | | | 1,535,730 | | | | — | | | | — | | | | 1,535,730 | |
| Health Care | | | 12,837,905 | | | | — | | | | — | | | | 12,837,905 | |
| Industrials | | | 7,983,599 | | | | — | | | | — | | | | 7,983,599 | |
| Information Technology | | | 13,586,908 | | | | — | | | | — | | | | 13,586,908 | |
| Materials | | | 5,293,892 | | | | — | | | | — | | | | 5,293,892 | |
| Total Common Stock | | $ | 77,370,560 | | | $ | — | | | $ | — | | | $ | 77,370,560 | |
| Short-Term Investments | | | | | | | | | | | | | | | | |
| Money Market Funds | | $ | 2,613,905 | | | $ | — | | | $ | — | | | $ | 2,613,905 | |
| Total Short-Term Investments | | $ | 2,613,905 | | | $ | — | | | $ | — | | | $ | 2,613,905 | |
| Total Investments in Securities | | $ | 79,984,465 | | | $ | — | | | $ | — | | | $ | 79,984,465 | |
Transfers between levels are recognized at the end of the reporting period. During the period ended April 30, 2012, the Fund recognized no transfers between levels.
The accompanying notes are an integral part of these financial statements.
HENNESSY FUNDS 1-800-966-4354
HENNESSY CORNERSTONE VALUE FUND
As of April 30, 2012 (Unaudited)
(% of Net Assets)
| TOP TEN EQUITY HOLDINGS | % of net assets |
| Seagate Technology PLC | 2.90% |
| Sun Life Financial, Inc. | 2.28% |
| Philip Morris International, Inc. | 2.28% |
| Avon Products, Inc. | 2.25% |
| Encana Corp. | 2.22% |
| Mattel, Inc. | 2.17% |
| Transocean Ltd. | 2.15% |
| HSBC Holdings PLC | 2.10% |
| Abbott Laboratories | 2.09% |
| Intel Corp. | 2.08% |
| | COMMON STOCKS – 97.67% | | Number of | | | | | | % of | |
| | | | Shares | | | Value | | | Net Assets | |
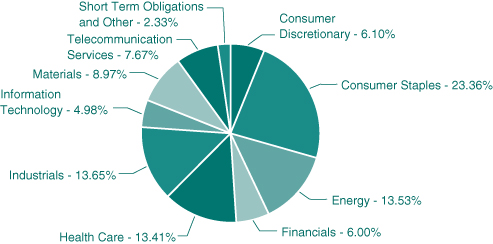
| | Consumer Discretionary – 6.10% | | | | | | | | | |
| | Carnival Corp. | | | 76,200 | | | $ | 2,475,738 | | | | 1.98 | % |
| | Mattel, Inc. | | | 80,800 | | | | 2,714,880 | | | | 2.17 | % |
| | Thomson Reuters Corp. (b) | | | 81,700 | | | | 2,436,294 | | | | 1.95 | % |
| | | | | | | | | 7,626,912 | | | | 6.10 | % |
| | | | | | | | | | | | | | |
| | Consumer Staples – 23.36% | | | | | | | | | | | | |
| | Altria Group, Inc. | | | 80,300 | | | | 2,586,463 | | | | 2.07 | % |
| | Avon Products, Inc. | | | 130,400 | | | | 2,816,640 | | | | 2.25 | % |
| | Campbell Soup Co. | | | 72,700 | | | | 2,459,441 | | | | 1.97 | % |
| | ConAgra Foods, Inc. | | | 85,800 | | | | 2,215,356 | | | | 1.77 | % |
| | H.J. Heinz Co. | | | 43,500 | | | | 2,318,985 | | | | 1.86 | % |
| | Kellogg Co. | | | 45,500 | | | | 2,300,935 | | | | 1.84 | % |
| | Kimberly Clark Corp. | | | 31,500 | | | | 2,471,805 | | | | 1.98 | % |
| | Pepsico, Inc. | | | 35,900 | | | | 2,369,400 | | | | 1.90 | % |
| | Philip Morris International, Inc. | | | 31,800 | | | | 2,846,418 | | | | 2.28 | % |
| | Procter & Gamble Co. | | | 35,200 | | | | 2,240,128 | | | | 1.79 | % |
| | Reynolds American, Inc. | | | 56,500 | | | | 2,306,895 | | | | 1.85 | % |
| | Sysco Corp. | | | 78,000 | | | | 2,254,200 | | | | 1.80 | % |
| | | | | | | | | 29,186,666 | | | | 23.36 | % |
| | | | | | | | | | | | | | |
| | Energy – 13.53% | | | | | | | | | | | | |
| | BP PLC – ADR (b) | | | 52,200 | | | | 2,266,002 | | | | 1.81 | % |
| | Chevron Corp. | | | 21,800 | | | | 2,323,008 | | | | 1.86 | % |
| | ConocoPhillips | | | 32,500 | | | | 2,327,975 | | | | 1.86 | % |
| | Encana Corp. (b) | | | 132,700 | | | | 2,778,738 | | | | 2.22 | % |
| | Royal Dutch Shell PLC – ADR (b) | | | 33,100 | | | | 2,367,974 | | | | 1.90 | % |
| | Total SA – ADR (b) | | | 45,000 | | | | 2,164,950 | | | | 1.73 | % |
| | Transocean Ltd. (b) | | | 53,400 | | | | 2,690,826 | | | | 2.15 | % |
| | | | | | | | | 16,919,473 | | | | 13.53 | % |
| | | | | | | | | | | | | | |
| | Financials – 6.00% | | | | | | | | | | | | |
| | Banco Santander SA – ADR (b) | | | 319,600 | | | | 2,023,068 | | | | 1.62 | % |
| | HSBC Holdings PLC – ADR (b) | | | 58,000 | | | | 2,619,860 | | | | 2.10 | % |
| | Sun Life Financial, Inc. (b) | | | 116,300 | | | | 2,849,350 | | | | 2.28 | % |
| | | | | | | | | 7,492,278 | | | | 6.00 | % |
The accompanying notes are an integral part of these financial statements.
HENNESSY FUNDS 1-800-966-4354
| | COMMON STOCKS | | Number of | | | | | | % of | |
| | | | Shares | | | Value | | | Net Assets | |
| | Health Care – 13.41% | | | | | | | | | |
| | Abbott Laboratories | | | 42,000 | | | $ | 2,606,520 | | | | 2.09 | % |
| | Bristol-Myers Squibb Co. | | | 69,000 | | | | 2,302,530 | | | | 1.84 | % |
| | Eli Lilly & Co. | | | 57,900 | | | | 2,396,481 | | | | 1.92 | % |
| | GlaxoSmithKline PLC – ADR (b) | | | 51,100 | | | | 2,362,353 | | | | 1.89 | % |
| | Johnson & Johnson | | | 35,600 | | | | 2,317,204 | | | | 1.85 | % |
| | Merck & Co., Inc. | | | 59,900 | | | | 2,350,476 | | | | 1.88 | % |
| | Pfizer, Inc. | | | 105,900 | | | | 2,428,287 | | | | 1.94 | % |
| | | | | | | | | 16,763,851 | | | | 13.41 | % |
| | | | | | | | | | | | | | |
| | Industrials – 13.65% | | | | | | | | | | | | |
| | Emerson Electric Co. | | | 46,700 | | | | 2,453,618 | | | | 1.96 | % |
| | General Electric Co. | | | 122,300 | | | | 2,394,634 | | | | 1.92 | % |
| | Lockheed Martin Corp. | | | 28,300 | | | | 2,562,282 | | | | 2.05 | % |
| | Northrop Grumman Corp. | | | 38,700 | | | | 2,448,936 | | | | 1.96 | % |
| | Raytheon Co. | | | 46,900 | | | | 2,539,166 | | | | 2.03 | % |
| | Republic Services, Inc. | | | 84,100 | | | | 2,301,817 | | | | 1.84 | % |
| | Waste Management, Inc. | | | 69,100 | | | | 2,363,220 | | | | 1.89 | % |
| | | | | | | | | 17,063,673 | | | | 13.65 | % |
| | | | | | | | | | | | | | |
| | Information Technology – 4.98% | | | | | | | | | | | | |
| | Intel Corp. | | | 91,600 | | | | 2,601,440 | | | | 2.08 | % |
| | Seagate Technology PLC (b) | | | 117,800 | | | | 3,623,528 | | | | 2.90 | % |
| | | | | | | | | 6,224,968 | | | | 4.98 | % |
| | | | | | | | | | | | | | |
| | Materials – 8.97% | | | | | | | | | | | | |
| | Arcelormittal SA Luxembourg – ADR (b) | | | 114,000 | | | | 1,975,620 | | | | 1.58 | % |
| | EI Du Pont de Nemours & Co. | | | 47,000 | | | | 2,512,620 | | | | 2.01 | % |
| | International Paper Co. | | | 72,500 | | | | 2,414,975 | | | | 1.93 | % |
| | Nucor Corp. | | | 54,600 | | | | 2,140,866 | | | | 1.71 | % |
| | Southern Copper Corp. | | | 66,200 | | | | 2,176,656 | | | | 1.74 | % |
| | | | | | | | | 11,220,737 | | | | 8.97 | % |
| | | | | | | | | | | | | | |
| | Telecommunication Services – 7.67% | | | | | | | | | | | | |
| | AT&T, Inc. | | | 76,700 | | | | 2,524,197 | | | | 2.02 | % |
| | BCE, Inc. (b) | | | 55,600 | | | | 2,253,468 | | | | 1.80 | % |
| | CenturyLink, Inc. | | | 62,100 | | | | 2,394,576 | | | | 1.92 | % |
| | Telefonica De Argentina (a)(c)(d)(e) | | | 100 | | | | — | | | | 0.00 | % |
The accompanying notes are an integral part of these financial statements.
| | COMMON STOCKS | | Number of | | | | | | % of | |
| | | | Shares | | | Value | | | Net Assets | |
| | Telecommunication Services (Continued) | | | | | | | | | |
| | Verizon Communications, Inc. | | | 59,600 | | | $ | 2,406,648 | | | | 1.93 | % |
| | | | | | | | | 9,578,889 | | | | 7.67 | % |
| | | | | | | | | | | | | | |
| | Total Common Stocks (Cost $105,258,805) | | | | | | | 122,077,447 | | | | 97.67 | % |
| | | | | | | | | | | | | | |
| | SHORT-TERM INVESTMENTS – 2.05% | | | | | | | | | | | | |
| | Money Market Fund – 2.05% | | | | | | | | | | | | |
| | Fidelity Government Portfolio – | | | | | | | | | | | | |
| | Institutional Class, 0.010% (f) | | | 2,558,747 | | | | 2,558,747 | | | | 2.05 | % |
| | | | | | | | | | | | | | |
| | Total Money Market Fund | | | | | | | | | | | | |
| | (Cost $2,558,747) | | | | | | | 2,558,747 | | | | 2.05 | % |
| | | | | | | | | | | | | | |
| | Total Short-Term Investments | | | | | | | | | | | | |
| | (Cost $2,558,747) | | | | | | | 2,558,747 | | | | 2.05 | % |
| | | | | | | | | | | | | | |
| | Total Investments – 99.72% | | | | | | | | | | | | |
| | (Cost $107,817,552) | | | | | | | 124,636,194 | | | | 99.72 | % |
| | | | | | | | | | | | | | |
| | Other Assets in Excess of Liabilities – 0.28% | | | | | | | 346,294 | | | | 0.28 | % |
| | TOTAL NET ASSETS – 100.00% | | | | | | $ | 124,982,488 | | | | 100.00 | % |
Percentages are stated as a percent of net assets.
| (a) | Non-income producing security. |
| (b) | U.S. traded security of a foreign corporation |
| (c) | Illiquid security. |
| (d) | Foreign issued security. |
| (e) | Security is fair valued. |
| (f) | The rate listed is the fund’s 7-day yield as of April 30, 2012. |
The accompanying notes are an integral part of these financial statements.
HENNESSY FUNDS 1-800-966-4354
Summary of Fair Value Exposure at April 30, 2012
The following is a summary of the inputs used to value the Fund’s net assets as of April 30, 2012 (See Note 3 in the accompanying notes to the financial statements):
| Common Stock | | Level 1 | | | Level 2 | | | Level 3 | | | Total | |
| Consumer Discretionary | | $ | 7,626,912 | | | $ | — | | | $ | — | | | $ | 7,626,912 | |
| Consumer Staples | | | 29,186,666 | | | | — | | | | — | | | | 29,186,666 | |
| Energy | | | 16,919,473 | | | | — | | | | — | | | | 16,919,473 | |
| Financials | | | 7,492,278 | | | | — | | | | — | | | | 7,492,278 | |
| Health Care | | | 16,763,851 | | | | — | | | | — | | | | 16,763,851 | |
| Industrials | | | 17,063,673 | | | | — | | | | — | | | | 17,063,673 | |
| Information Technology | | | 6,224,968 | | | | — | | | | — | | | | 6,224,968 | |
| Materials | | | 11,220,737 | | | | — | | | | — | | | | 11,220,737 | |
| Telecommunication Services | | | 9,578,889 | | | | — | | | | — | (1) | | | 9,578,889 | |
| Total Common Stock | | $ | 122,077,447 | | | $ | — | | | $ | — | | | $ | 122,077,447 | |
| Short-Term Investments | | | | | | | | | | | | | | | | |
| Money Market Funds | | $ | 2,558,747 | | | $ | — | | | $ | — | | | $ | 2,558,747 | |
| Total Short-Term Investments | | $ | 2,558,747 | | | $ | — | | | $ | — | | | $ | 2,558,747 | |
| Total Investments in Securities | | $ | 124,636,194 | | | $ | — | | | $ | — | | | $ | 124,636,194 | |
Transfers between levels are recognized at the end of the reporting period. During the period ended April 30, 2012, the Fund recognized no transfers between levels.
| (1) | If Telefonica de Argentina would have had a value, it would have been a Level 3 fair value. The security has been fair valued at $0 during the entire period. |
Level 3 Reconciliation Disclosure
Following is a reconciliation of level 3 assets for which significant unobservable inputs were used to determine fair value.
| | | Common Stock | |
| Balance as of 10/31/11 | | $ | — | |
| Accrued discounts/premiums | | | — | |
| Realized gain (loss) | | | — | |
| Change in unrealized appreciation (depreciation) | | | — | |
| Purchases | | | — | |
| (Sales) | | | — | |
| Transfer in and/or out of Level 3 | | | — | |
| Balance as of 4/30/12 | | $ | — | |
| Change in unrealized appreciation/depreciation during | | | | |
| the year for level 3 investments held at April 30, 2012 | | $ | — | |
The accompanying notes are an integral part of these financial statements.
HENNESSY TOTAL RETURN FUND
As of April 30, 2012 (Unaudited)
(% of Net Assets)
| TOP TEN EQUITY HOLDINGS | % of net assets |
| Intel Corp. | 7.41% |
| EI Du Pont de Nemours & Co. | 7.31% |
| AT&T, Inc. | 7.13% |
| Pfizer, Inc. | 7.06% |
| Verizon Communications, Inc. | 6.88% |
| General Electric Co. | 6.82% |
| Kraft Foods, Inc. | 6.51% |
| Johnson & Johnson | 6.48% |
| Merck & Co., Inc. | 6.39% |
| Procter & Gamble Co. | 5.42% |
HENNESSY FUNDS 1-800-966-4354
| | COMMON STOCKS – 75.23% | | Number of | | | | | | % of | |
| | | | Shares | | | Value | | | Net Assets | |
| | Consumer Discretionary – 1.69% | | | | | | | | | |
| | McDonald’s Corp. | | | 12,100 | | | $ | 1,179,145 | | | | 1.69 | % |
| | | | | | | | | | | | | | |
| | Consumer Staples – 11.93% | | | | | | | | | | | | |
| | Kraft Foods, Inc. | | | 113,800 | | | | 4,537,206 | | | | 6.51 | % |
| | Procter & Gamble Co. | | | 59,400 | | | | 3,780,216 | | | | 5.42 | % |
| | | | | | | | | 8,317,422 | | | | 11.93 | % |
| | | | | | | | | | | | | | |
| | Energy – 3.91% | | | | | | | | | | | | |
| | Chevron Corp. | | | 25,600 | | | | 2,727,936 | | | | 3.91 | % |
| | | | | | | | | | | | | | |
| | Financials – 2.22% | | | | | | | | | | | | |
| | Travelers Companies, Inc. | | | 24,000 | | | | 1,543,680 | | | | 2.22 | % |
| | | | | | | | | | | | | | |
| | Health Care – 19.93% | | | | | | | | | | | | |
| | Johnson & Johnson | | | 69,400 | | | | 4,517,246 | | | | 6.48 | % |
| | Merck & Co., Inc. | | | 113,600 | | | | 4,457,664 | | | | 6.39 | % |
| | Pfizer, Inc. | | | 214,500 | | | | 4,918,485 | | | | 7.06 | % |
| | | | | | | | | 13,893,395 | | | | 19.93 | % |
| | | | | | | | | | | | | | |
| | Industrials – 6.82% | | | | | | | | | | | | |
| | General Electric Co. | | | 242,700 | | | | 4,752,066 | | | | 6.82 | % |
| | | | | | | | | | | | | | |
| | Information Technology – 7.41% | | | | | | | | | | | | |
| | Intel Corp. | | | 181,800 | | | | 5,163,120 | | | | 7.41 | % |
| | | | | | | | | | | | | | |
| | Materials – 7.31% | | | | | | | | | | | | |
| | EI Du Pont de Nemours & Co. | | | 95,300 | | | | 5,094,738 | | | | 7.31 | % |
| | | | | | | | | | | | | | |
| | Telecommunication Services – 14.01% | | | | | | | | | | | | |
| | AT&T, Inc. | | | 151,000 | | | | 4,969,410 | | | | 7.13 | % |
| | Verizon Communications, Inc. | | | 118,700 | | | | 4,793,106 | | | | 6.88 | % |
| | | | | | | | | 9,762,516 | | | | 14.01 | % |
| | | | | | | | | | | | | | |
| | Total Common Stocks (Cost $43,322,063) | | | | | | | 52,434,018 | | | | 75.23 | % |
The accompanying notes are an integral part of these financial statements.
| | SHORT-TERM INVESTMENTS – 54.33% | | Number of | | | | | | % of | |
| | | | Shares | | | Value | | | Net Assets | |
| | Money Market Fund – 2.69% | | | | | | | | | |
| | Fidelity Government Portfolio – | | | | | | | | | |
| | Institutional Class, 0.010%(a) | | | 1,876,375 | | | $ | 1,876,375 | | | | 2.69 | % |
| | | | | | | | | | | | | | |
| | Total Money Market Fund | | | | | | | | | | | | |
| | (Cost $1,876,375) | | | | | | | 1,876,375 | | | | 2.69 | % |
| | | | | | | | | | | | | | |
| | | | Principal | | | | | | | | | |
| | | | Value | | | | | | | | | |
| | U.S. Treasury Bills *- 51.64% | | | | | | | | | | | | |
| | 0.065%, 05/17/2012 (b) | | $ | 11,000,000 | | | | 10,999,707 | | | | 15.78 | % |
| | 0.065%, 06/21/2012 (b) | | | 10,000,000 | | | | 9,998,867 | | | | 14.34 | % |
| | 0.080%, 07/19/2012 (b) | | | 15,000,000 | | | | 14,997,284 | | | | 21.52 | % |
| | | | | | | | | | | | | | |
| | Total U.S. Treasury Bills | | | | | | | | | | | | |
| | (Cost $35,997,092) | | | | | | | 35,995,858 | | | | 51.64 | % |
| | | | | | | | | | | | | | |
| | Total Short-Term Investments | | | | | | | | | | | | |
| | (Cost $37,873,467) | | | | | | | 37,872,233 | | | | 54.33 | % |
| | | | | | | | | | | | | | |
| | Total Investments – 129.56% | | | | | | | | | | | | |
| | (Cost $81,195,530) | | | | | | | 90,306,251 | | | | 129.56 | % |
| | | | | | | | | | | | | | |
| | Liabilities in Excess of Other Assets – (29.56)% | | | | | | | (20,606,555 | ) | | | (29.56 | )% |
| | TOTAL NET ASSETS – 100.00% | | | | | | $ | 69,699,696 | | | | 100.00 | % |
Percentages are stated as a percent of net assets.
| (a) | | The rate listed is the fund’s 7-day yield as of April 30, 2012. |
| (b) | | The rate listed is discount rate at issue. |
| * | | Collateral or partial collateral for securities sold subject to repurchase. |
The accompanying notes are an integral part of these financial statements.
HENNESSY FUNDS 1-800-966-4354
Summary of Fair Value Exposure at April 30, 2012
The following is a summary of the inputs used to value the Fund’s net assets as of April 30, 2012 (See Note 3 in the accompanying notes to the financial statements):
| Common Stock | | Level 1 | | | Level 2 | | | Level 3 | | | Total | |
| Consumer Discretionary | | $ | 1,179,145 | | | $ | — | | | $ | — | | | $ | 1,179,145 | |
| Consumer Staples | | | 8,317,422 | | | | — | | | | — | | | | 8,317,422 | |
| Energy | | | 2,727,936 | | | | — | | | | — | | | | 2,727,936 | |
| Financials | | | 1,543,680 | | | | — | | | | — | | | | 1,543,680 | |
| Health Care | | | 13,893,395 | | | | — | | | | — | | | | 13,893,395 | |
| Industrials | | | 4,752,066 | | | | — | | | | — | | | | 4,752,066 | |
| Information Technology | | | 5,163,120 | | | | — | | | | — | | | | 5,163,120 | |
| Materials | | | 5,094,738 | | | | — | | | | — | | | | 5,094,738 | |
| Telecommunication Services | | | 9,762,516 | | | | — | | | | — | | | | 9,762,516 | |
| Total Common Stock | | $ | 52,434,018 | | | $ | — | | | $ | — | | | $ | 52,434,018 | |
| Short-Term Investments | | | | | | | | | | | | | | | | |
| Money Market Funds | | $ | 1,876,375 | | | $ | — | | | $ | — | | | $ | 1,876,375 | |
| U.S. Treasury Bills | | | — | | | | 35,995,858 | | | | — | | | | 35,995,858 | |
| Total Short-Term Investments | | $ | 1,876,375 | | | $ | 35,995,858 | | | $ | — | | | $ | 37,872,233 | |
| Total Investments in Securities | | $ | 54,310,393 | | | $ | 35,995,858 | | | $ | — | | | $ | 90,306,251 | |
Transfers between levels are recognized at the end of the reporting period. During the period ended April 30, 2012, the Fund recognized no transfers between levels.
Reverse repurchase agreements are carried at face value, hence, are not included in the fair valuation hierarchy. The face vale of the reverse repurchase agreements at April 30, 2012, was $20,700,000. Due to the short term nature of the reverse repurchase agreements, face value approximates fair value. The face value plus interest due at maturity is equal to $20,712,128.
The accompanying notes are an integral part of these financial statements.
Schedule of Reverse Repurchase Agreements
Hennessy Total Return Fund as of April 30, 2012 |
| Face | | | | | | Principal | Maturity | | Maturity | |
| Value | | Counterparty | | Rate | Trade Date | Date | | Amount | |
| $ | 7,200,000 | | UBS Financial Services, Inc. | | | 0.22 | % | 2/10/12 | 5/17/12 | | $ | 7,204,268 | |
| $ | 4,500,000 | | UBS Financial Services, Inc. | | | 0.24 | % | 3/16/12 | 6/21/12 | | | 4,502,910 | |
| $ | 9,000,000 | | UBS Financial Services, Inc. | | | 0.22 | % | 4/20/12 | 7/19/12 | | | 9,004,950 | |
| $ | 20,700,000 | | | | | | | | | | $ | 20,712,128 | |
As of April 30, 2012, the fair value of securities held as collateral for reverse repurchase agreements was $35,995,858 as noted on the Schedule of Investments.
The accompanying notes are an integral part of these financial statements.
HENNESSY FUNDS 1-800-966-4354
HENNESSY BALANCED FUND
As of April 30, 2012 (Unaudited)
(% of Net Assets)
| TOP TEN EQUITY HOLDINGS | % of net assets |
| AT&T, Inc. | 4.97% |
| Verizon Communications, Inc. | 4.89% |
| Pfizer, Inc. | 4.89% |
| EI Du Pont de Nemours & Co. | 4.85% |
| Merck & Co., Inc. | 4.67% |
| General Electric Co. | 4.57% |
| Johnson & Johnson | 4.56% |
| Kraft Foods, Inc. | 4.41% |
| Intel Corp. | 4.33% |
| Procter & Gamble Co. | 4.29% |
| | COMMON STOCKS – 48.50% | | Number of | | | | | | % of | |
| | | | Shares | | | Value | | | Net Assets | |
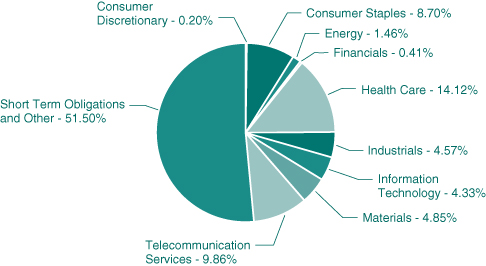
| | Consumer Discretionary – 0.20% | | | | | | | | | |
| | McDonald’s Corp. | | | 500 | | | $ | 48,725 | | | | 0.20 | % |
| | | | | | | | | | | | | | |
| | Consumer Staples – 8.70% | | | | | | | | | | | | |
| | Kraft Foods, Inc. | | | 26,250 | | | | 1,046,587 | | | | 4.41 | % |
| | Procter & Gamble Co. | | | 16,000 | | | | 1,018,240 | | | | 4.29 | % |
| | | | | | | | | 2,064,827 | | | | 8.70 | % |
| | | | | | | | | | | | | | |
| | Energy – 1.46% | | | | | | | | | | | | |
| | Chevron Corp. | | | 3,250 | | | | 346,320 | | | | 1.46 | % |
| | | | | | | | | | | | | | |
| | Financials – 0.41% | | | | | | | | | | | | |
| | Travelers Companies, Inc. | | | 1,500 | | | | 96,480 | | | | 0.41 | % |
| | | | | | | | | | | | | | |
| | Health Care – 14.12% | | | | | | | | | | | | |
| | Johnson & Johnson | | | 16,600 | | | | 1,080,494 | | | | 4.56 | % |
| | Merck & Co., Inc. | | | 28,250 | | | | 1,108,530 | | | | 4.67 | % |
| | Pfizer, Inc. | | | 50,600 | | | | 1,160,258 | | | | 4.89 | % |
| | | | | | | | | 3,349,282 | | | | 14.12 | % |
| | | | | | | | | | | | | | |
| | Industrials – 4.57% | | | | | | | | | | | | |
| | General Electric Co. | | | 55,350 | | | | 1,083,753 | | | | 4.57 | % |
| | | | | | | | | | | | | | |
| | Information Technology – 4.33% | | | | | | | | | | | | |
| | Intel Corp. | | | 36,150 | | | | 1,026,660 | | | | 4.33 | % |
| | | | | | | | | | | | | | |
| | Materials – 4.85% | | | | | | | | | | | | |
| | EI Du Pont de Nemours & Co. | | | 21,550 | | | | 1,152,063 | | | | 4.85 | % |
| | | | | | | | | | | | | | |
| | Telecommunication Services – 9.86% | | | | | | | | | | | | |
| | AT&T, Inc. | | | 35,800 | | | | 1,178,178 | | | | 4.97 | % |
| | Verizon Communications, Inc. | | | 28,750 | | | | 1,160,925 | | | | 4.89 | % |
| | | | | | | | | 2,339,103 | | | | 9.86 | % |
| | | | | | | | | | | | | | |
| | Total Common Stocks (Cost $10,038,110) | | | | | | | 11,507,213 | | | | 48.50 | % |
The accompanying notes are an integral part of these financial statements.
HENNESSY FUNDS 1-800-966-4354
| | SHORT-TERM INVESTMENTS – 51.36% | | Number of | | | | | | % of | |
| | | | Shares | | | Value | | | Net Assets | |
| | Money Market Fund – 3.35% | | | | | | | | | |
| | Fidelity Government Portfolio – | | | | | | | | | |
| | Institutional Class, 0.010%(a) | | | 793,641 | | | $ | 793,641 | | | | 3.35 | % |
| | | | | | | | | | | | | | |
| | Total Money Market Fund | | | | | | | | | | | | |
| | (Cost $793,641) | | | | | | | 793,641 | | | | 3.35 | % |
| | | | | | | | | | | | | | |
| | U.S. Treasury Bills – 48.01% | | | | | | | | | | | | |
| | 0.550%, 05/03/2012 (b) | | | 200,000 | | | | 200,000 | | | | 0.84 | % |
| | 0.080%, 05/31/2012 (b) | | | 300,000 | | | | 299,996 | | | | 1.26 | % |
| | 0.085%, 08/23/2012 (b) | | | 700,000 | | | | 699,768 | | | | 2.95 | % |
| | 0.150%, 09/20/2012 (b) | | | 600,000 | | | | 599,704 | | | | 2.53 | % |
| | 0.145%, 11/15/2012 (b) | | | 2,600,000 | | | | 2,597,928 | | | | 10.95 | % |
| | 0.110%, 12/13/2012 (b) | | | 2,900,000 | | | | 2,897,317 | | | | 12.21 | % |
| | 0.105%, 01/10/2013 (b) | | | 2,600,000 | | | | 2,597,252 | | | | 10.95 | % |
| | 0.140%, 02/07/2013 (b) | | | 800,000 | | | | 799,014 | | | | 3.37 | % |
| | 0.170%, 03/07/2013 (b) | | | 700,000 | | | | 698,992 | | | | 2.95 | % |
| | | | | | | | | | | | | | |
| | Total U.S. Treasury Bills | | | | | | | | | | | | |
| | (Cost $11,394,524) | | | | | | | 11,389,971 | | | | 48.01 | % |
| | | | | | | | | | | | | | |
| | Total Short-Term Investments | | | | | | | | | | | | |
| | (Cost $12,188,165) | | | | | | | 12,183,612 | | | | 51.36 | % |
| | | | | | | | | | | | | | |
| | Total Investments – 99.86% | | | | | | | | | | | | |
| | (Cost $22,226,275) | | | | | | | 23,690,825 | | | | 99.86 | % |
| | | | | | | | | | | | | | |
| | Other Assets in Excess of Liabilities – 0.14% | | | | | | | 32,440 | | | | 0.14 | % |
| | TOTAL NET ASSETS – 100.00% | | | | | | $ | 23,723,265 | | | | 100.00 | % |
Percentages are stated as a percent of net assets.
| (a) | The rate listed is the fund’s 7-day yield as of April 30, 2012. |
| (b) | The rate listed is discount rate at issue. |
The accompanying notes are an integral part of these financial statements.
Summary of Fair Value Exposure at April 30, 2012
The following is a summary of the inputs used to value the Fund’s net assets as of April 30, 2012 (See Note 3 in the accompanying notes to the financial statements):
| Common Stock | | Level 1 | | | Level 2 | | | Level 3 | | | Total | |
| Consumer Discretionary | | $ | 48,725 | | | $ | — | | | $ | — | | | $ | 48,725 | |
| Consumer Staples | | | 2,064,827 | | | | — | | | | — | | | | 2,064,827 | |
| Energy | | | 346,320 | | | | — | | | | — | | | | 346,320 | |
| Financials | | | 96,480 | | | | — | | | | — | | | | 96,480 | |
| Health Care | | | 3,349,282 | | | | — | | | | — | | | | 3,349,282 | |
| Industrials | | | 1,083,753 | | | | — | | | | — | | | | 1,083,753 | |
| Information Technology | | | 1,026,660 | | | | — | | | | — | | | | 1,026,660 | |
| Materials | | | 1,152,063 | | | | — | | | | — | | | | 1,152,063 | |
| Telecommunication Services | | | 2,339,103 | | | | — | | | | — | | | | 2,339,103 | |
| Total Common Stock | | $ | 11,507,213 | | | $ | — | | | $ | — | | | $ | 11,507,213 | |
| Short-Term Investments | | | | | | | | | | | | | | | | |
| Money Market Funds | | $ | 793,641 | | | $ | — | | | $ | — | | | $ | 793,641 | |
| U.S. Treasury Bills | | | — | | | | 11,389,971 | | | | — | | | | 11,389,971 | |
| Total Short-Term Investments | | $ | 793,641 | | | $ | 11,389,971 | | | $ | — | | | $ | 12,183,612 | |
| Total Investments in Securities | | $ | 12,300,854 | | | $ | 11,389,971 | | | $ | — | | | $ | 23,690,825 | |
Transfers between levels are recognized at the end of the reporting period. During the period ended April 30, 2012, the Fund recognized no transfers between levels.
The accompanying notes are an integral part of these financial statements.
HENNESSY FUNDS 1-800-966-4354
Financial Statements
Statements of Assets and Liabilities as of April 30, 2012 (Unaudited) |
ASSETS:
Investments in securities, at value (cost $196,940,125, $126,983,034, $74,156,295,
$107,817,552, $81,195,530 and $22,226,275, respectively)
Dividends and interest receivable
Receivable for fund shares sold
Prepaid expenses and other assets
Total Assets
LIABILITIES:
Payable for securities purchased
Payable for fund shares redeemed
Payable to Advisor
Payable to Administrator
Payable to auditor
Reverse repurchase agreement
Accrued interest payable
Accrued directors fees
Accrued service fees
Accrued expenses and other payables
Total Liabilities
NET ASSETS
NET ASSETS CONSIST OF:
Capital stock
Accumulated net investment income (loss)
Accumulated net realized gain (loss) on investments
Unrealized net appreciation (depreciation) on investments
Total Net Assets
NET ASSETS
Original Class:
Shares authorized ($.0001 par value)
Net assets applicable to outstanding Original Class shares
Shares issued and outstanding
Net asset value, offering price and redemption price per share
Institutional Class:
Shares authorized ($.0001 par value)
Net assets applicable to outstanding Institutional Class shares
Shares issued and outstanding
Net asset value, offering price and redemption price per share
The accompanying notes are an integral part of these financial statements.
| | | | | | | HENNESSY | | | | | | | | | | |
| HENNESSY | | | HENNESSY | | | CORNERSTONE | | | HENNESSY | | | HENNESSY | | | HENNESSY | |
| CORNERSTONE | | | FOCUS 30 | | | LARGE GROWTH | | | CORNERSTONE | | | TOTAL RETURN | | | BALANCED | |
| GROWTH FUND | | | FUND | | | FUND | | | VALUE FUND | | | FUND | | | FUND | |
| | | | | | | | | | | | | | | | | |
| | �� | | | | | | | | | | | | | | | |
| $ | 212,546,175 | | | $ | 145,644,977 | | | $ | 79,984,465 | | | $ | 124,636,194 | | | $ | 90,306,251 | | | $ | 23,690,825 | |
| | 78,155 | | | | 216,896 | | | | 94,533 | | | | 341,921 | | | | 158,559 | | | | 36,791 | |
| | 137,150 | | | | 156,673 | | | | 18,664 | | | | 218,269 | | | | 116,391 | | | | 22,050 | |
| | 22,054 | | | | 26,990 | | | | 20,086 | | | | 22,179 | | | | 14,310 | | | | 18,819 | |
| | 212,783,534 | | | | 146,045,536 | | | | 80,117,748 | | | | 125,218,563 | | | | 90,595,511 | | | | 23,768,485 | |
| | | | | | | | | | | | | | | | | | | | | | | |
| | | | | | | | | | | | | | | | | | | | | | | |
| | — | | | | — | | | | 17,766 | | | | — | | | | — | | | | — | |
| | 547,933 | | | | 171,167 | | | | — | | | | 36,791 | | | | 67,309 | | | | — | |
| | 127,361 | | | | 86,973 | | | | 48,308 | | | | 74,795 | | | | 33,705 | | | | 11,409 | |
| | 127,149 | | | | 84,132 | | | | 50,778 | | | | 75,113 | | | | 43,484 | | | | 13,911 | |
| | 14,037 | | | | 8,576 | | | | 8,733 | | | | 9,894 | | | | 9,206 | | | | 7,745 | |
| | — | | | | — | | | | — | | | | — | | | | 20,700,000 | | | | — | |
| | 157 | | | | 23 | | | | — | | | | 1 | | | | 6,347 | | | | — | |
| | — | | | | — | | | | — | | | | 202 | | | | 470 | | | | 97 | |
| | 16,993 | | | | 9,880 | | | | 6,515 | | | | 9,969 | | | | 5,618 | | | | 1,902 | |
| | 64,954 | | | | 57,874 | | | | 14,644 | | | | 29,310 | | | | 29,676 | | | | 10,156 | |
| | 898,584 | | | | 418,625 | | | | 146,744 | | | | 236,075 | | | | 20,895,815 | | | | 45,220 | |
| $ | 211,884,950 | | | $ | 145,626,911 | | | $ | 79,971,004 | | | $ | 124,982,488 | | | $ | 69,699,696 | | | $ | 23,723,265 | |
| | | | | | | | | | | | | | | | | | | | | | | |
| | | | | | | | | | | | | | | | | | | | | | | |
| $ | 440,660,726 | | | $ | 168,996,792 | | | $ | 73,424,186 | | | $ | 151,893,972 | | | $ | 69,976,235 | | | $ | 23,756,617 | |
| | (301,935 | ) | | | 711,489 | | | | 617,232 | | | | 1,089,084 | | | | 81,679 | | | | 9,150 | |
| | (244,079,891 | ) | | | (42,743,313 | ) | | | 101,416 | | | | (44,819,210 | ) | | | (9,468,939 | ) | | | (1,507,052 | ) |
| | 15,606,050 | | | | 18,661,943 | | | | 5,828,170 | | | | 16,818,642 | | | | 9,110,721 | | | | 1,464,550 | |
| $ | 211,884,950 | | | $ | 145,626,911 | | | $ | 79,971,004 | | | $ | 124,982,488 | | | $ | 69,699,696 | | | $ | 23,723,265 | |
| | | | | | | | | | | | | | | | | | | | | | | |
| | | | | | | | | | | | | | | | | | | | | | | |
| | | | | | | | | | | | | | | | | | | | | | | |
| | 25,000,000,000 | | | | 25,000,000,000 | | | Unlimited | | | | 25,000,000,000 | | | | 100,000,000 | | | | 100,000,000 | |
| | 209,189,908 | | | | 122,158,593 | | | | 79,811,597 | | | | 122,586,671 | | | | 69,699,696 | | | | 23,723,265 | |
| | 17,696,475 | | | | 8,935,908 | | | | 7,308,607 | | | | 9,058,230 | | | | 5,636,699 | | | | 2,027,927 | |
| $ | 11.82 | | | $ | 13.67 | | | $ | 10.92 | | | $ | 13.53 | | | $ | 12.37 | | | $ | 11.70 | |
| | | | | | | | | | | | | | | | | | | | | | | |
| | 25,000,000,000 | | | | 25,000,000,000 | | | Unlimited | | | | 25,000,000,000 | | | | N/A | | | | N/A | |
| | 2,695,042 | | | | 23,468,318 | | | | 159,407 | | | | 2,395,817 | | | | | | | | | |
| | 224,799 | | | | 1,690,018 | | | | 14,506 | | | | 177,090 | | | | | | | | | |
| $ | 11.99 | | | $ | 13.89 | | | $ | 10.99 | | | $ | 13.53 | | | | | | | | | |
HENNESSY FUNDS 1-800-966-4354
Financial Statements
Statements of Operations Six Months Ended April 30, 2012 (Unaudited) |
INVESTMENT INCOME:
Dividend income(1)
Interest income
Total investment income
EXPENSES:
Investment advisory fees
Administration, fund accounting, custody and transfer agent fees
Distribution fees – Original Class (See Note 6)
Service fees – Original Class (See Note 6)
Federal and state registration fees
Audit fees
Legal fees
Compliance expense
Reports to shareholders
Directors’ fees and expenses
Sub-transfer agent expenses – Original Class (See Note 6)
Sub-transfer agent expenses – Institutional Class (See Note 6)
Interest expense (See Notes 4 and 7)
Other
Total expenses before reimbursement/waiver
Administration expense waiver (See Note 6)
Net expenses
NET INVESTMENT INCOME (LOSS)
REALIZED AND UNREALIZED GAINS (LOSSES):
Net realized gain (loss) on investments
Change in unrealized appreciation (depreciation) on investments
Net gain (loss) on investments
NET INCREASE (DECREASE) IN NET ASSETS RESULTING FROM OPERATIONS
| (1) | Net of foreign taxes withheld of $0, $0, $0, $99,440, $$0 and $0 respectively. |
The accompanying notes are an integral part of these financial statements.
| | | | | | | HENNESSY | | | | | | | | | | |
| HENNESSY | | | HENNESSY | | | CORNERSTONE | | | HENNESSY | | | HENNESSY | | | HENNESSY | |
| CORNERSTONE | | | FOCUS 30 | | | LARGE GROWTH | | | CORNERSTONE | | | TOTAL RETURN | | | BALANCED | |
| GROWTH FUND | | | FUND | | | FUND | | | VALUE FUND | | | FUND | | | FUND | |
| | | | | | | | | | | | | | | | | |
| $ | 952,942 | | | $ | 1,700,195 | | | $ | 1,108,484 | | | $ | 2,352,795 | | | $ | 973,711 | | | $ | 189,240 | |
| | 998 | | | | 491 | | | | 120 | | | | 1,665 | | | | 3,490 | | | | 4,202 | |
| | 953,940 | | | | 1,700,686 | | | | 1,108,604 | | | | 2,354,460 | | | | 977,201 | | | | 193,442 | |
| | | | | | | | | | | | | | | | | | | | | | | |
| | | | | | | | | | | | | | | | | | | | | | | |
| | 705,843 | | | | 553,100 | | | | 288,153 | | | | 444,645 | | | | 202,716 | | | | 60,852 | |
| | 243,229 | | | | 190,595 | | | | 99,296 | | | | 153,222 | | | | 86,154 | | | | 25,862 | |
| | — | | | | — | | | | — | | | | — | | | | 50,679 | | | | 15,213 | |
| | 94,133 | | | | 63,623 | | | | 38,868 | | | | 59,376 | | | | 33,786 | | | | 10,142 | |
| | 15,389 | | | | 18,269 | | | | 16,846 | | | | 18,089 | | | | 12,869 | | | | 10,848 | |
| | 12,198 | | | | 10,131 | | | | 9,685 | | | | 10,863 | | | | 9,912 | | | | 8,562 | |
| | 3,740 | | | | 3,740 | | | | 3,491 | | | | 3,740 | | | | 2,743 | | | | 2,743 | |
| | 5,433 | | | | 5,433 | | | | 5,433 | | | | 5,433 | | | | 5,433 | | | | 5,433 | |
| | 30,416 | | | | 21,192 | | | | 7,480 | | | | 14,959 | | | | 6,732 | | | | 1,247 | |
| | 5,258 | | | | 5,258 | | | | 4,987 | | | | 5,644 | | | | 4,071 | | | | 3,776 | |
| | 147,639 | | | | 119,220 | | | | 12,043 | | | | 37,957 | | | | — | | | | — | |
| | 306 | | | | 6,581 | | | | — | | | | — | | | | — | | | | — | |
| | 500 | | | | 3,411 | | | | — | | | | 500 | | | | 26,950 | | | | — | |
| | 10,054 | | | | 8,319 | | | | 5,200 | | | | 7,388 | | | | 4,196 | | | | 1,337 | |
| | 1,274,138 | | | | 1,008,872 | | | | 491,482 | | | | 761,816 | | | | 446,241 | | | | 146,015 | |
| | (1,575 | ) | | | (19,675 | ) | | | (110 | ) | | | (918 | ) | | | — | | | | — | |
| | 1,272,563 | | | | 989,197 | | | | 491,372 | | | | 760,898 | | | | 446,241 | | | | 146,015 | |
| $ | (318,623 | ) | | $ | 711,489 | | | $ | 617,232 | | | $ | 1,593,562 | | | $ | 530,960 | | | $ | 47,427 | |
| | | | | | | | | | | | | | | | | | | | | | | |
| | | | | | | | | | | | | | | | | | | | | | | |
| $ | 1,186,588 | | | $ | 842,460 | | | $ | 101,448 | | | $ | 2,979,019 | | | $ | 1,048,720 | | | $ | 255,552 | |
| | 31,843,080 | | | | 15,578,324 | | | | 7,208,502 | | | | 5,718,672 | | | | 4,047,645 | | | | 740,660 | |
| | 33,029,668 | | | | 16,420,784 | | | | 7,309,950 | | | | 8,697,691 | | | | 5,096,365 | | | | 996,212 | |
| $ | 32,711,045 | | | $ | 17,132,273 | | | $ | 7,927,182 | | | $ | 10,291,253 | | | $ | 5,627,325 | | | $ | 1,043,639 | |
HENNESSY FUNDS 1-800-966-4354
Financial Statements
| Statements of Changes in Net Assets |
OPERATIONS:
Net investment income (loss)
Net realized gain (loss)
Change in unrealized appreciation (depreciation)
Net increase (decrease) in net assets resulting from operations
CAPITAL SHARE TRANSACTIONS:
Proceeds from shares issued in the Acquisition – Original Class (See Note 9)
Proceeds from shares issued in the Acquisition – Institutional Class (See Note 9)
Proceeds from shares subscribed – Original Class
Proceeds from shares subscribed – Institutional Class
Cost of shares redeemed – Original Class
Cost of shares redeemed – Institutional Class
Net increase (decrease) in net assets derived from capital share transactions
TOTAL INCREASE (DECREASE) IN NET ASSETS
NET ASSETS:
Beginning of period
End of period
Accumulated net investment income (loss), end of period
CHANGES IN SHARES OUTSTANDING:
Shares issued in connection with Acquisition – Original Class (See Note 9)
Shares issued in connection with Acquisition – Institutional Class (See Note 9)
Shares sold – Original Class
Shares sold – Institutional Class
Shares redeemed – Original Class
Shares redeemed – Institutional Class
Net increase (decrease) in shares outstanding
The accompanying notes are an integral part of these financial statements.
| Hennessy Cornerstone | | | | | | | |
| Growth Fund | | | Hennessy Focus 30 Fund | |
| Six Months Ended | | | | | | Six Months Ended | | | | |
| April 30, 2012 | | | Year Ended | | | April 30, 2012 | | | Year Ended | |
| (Unaudited) | | | October 31, 2011 | | | (Unaudited) | | | October 31, 2011 | |
| | | | | | | | | | | |
| $ | (318,623 | ) | | $ | (1,513,994 | ) | | $ | 711,489 | | | $ | (1,184,998 | ) |
| | 1,186,588 | | | | 39,880,443 | | | | 842,460 | | | | 21,853,896 | |
| | 31,843,080 | | | | (41,240,390 | ) | | | 15,578,324 | | | | (10,298,635 | ) |
| | 32,711,045 | | | | (2,873,941 | ) | | | 17,132,273 | | | | 10,370,263 | |
| | | | | | | | | | | | | | | |
| | | | | | | | | | | | | | | |
| | — | | | | 25,825,466 | | | | — | | | | — | |
| | — | | | | 339,345 | | | | — | | | | — | |
| | 14,058,293 | | | | 5,686,546 | | | | 6,904,600 | | | | 59,931,720 | |
| | 233,041 | | | | 120,828 | | | | 1,510,960 | | | | 7,761,938 | |
| | (21,535,965 | ) | | | (51,326,442 | ) | | | (45,419,144 | ) | | | (45,594,300 | ) |
| | (510,887 | ) | | | (1,075,812 | ) | | | (4,797,092 | ) | | | (6,751,235 | ) |
| | (7,755,518 | ) | | | (20,430,069 | ) | | | (41,800,676 | ) | | | 15,348,123 | |
| | 24,955,527 | | | | (23,304,010 | ) | | | (24,668,403 | ) | | | 25,718,386 | |
| | | | | | | | | | | | | | | |
| | | | | | | | | | | | | | | |
| | 186,929,423 | | | | 210,233,433 | | | | 170,295,314 | | | | 144,576,928 | |
| $ | 211,884,950 | | | $ | 186,929,423 | | | $ | 145,626,911 | | | $ | 170,295,314 | |
| $ | (301,935 | ) | | $ | 16,688 | | | $ | 711,489 | | | $ | — | |
| | | | | | | | | | | | | | | |
| | | | | | | | | | | | | | | |
| | — | | | | 2,524,476 | | | | — | | | | — | |
| | — | | | | 32,783 | | | | — | | | | — | |
| | 1,217,633 | | | | 536,989 | | | | 546,818 | | | | 4,688,679 | |
| | 20,328 | | | | 11,197 | | | | 117,037 | | | | 598,584 | |
| | (2,021,949 | ) | | | (4,705,581 | ) | | | (3,647,984 | ) | | | (3,673,362 | ) |
| | (46,147 | ) | | | (94,611 | ) | | | (380,736 | ) | | | (538,511 | ) |
| | (830,135 | ) | | | (1,694,747 | ) | | | (3,364,865 | ) | | | 1,075,390 | |
HENNESSY FUNDS 1-800-966-4354
Financial Statements
| Statements of Changes in Net Assets |
OPERATIONS:
Net investment income (loss)
Net realized gain (loss) on securities
Change in unrealized appreciation (depreciation) on securities
Net increase (decrease) in net assets resulting from operations
DISTRIBUTIONS TO SHAREHOLDERS FROM:
Net investment income – Original Class
Net investment income – Institutional Class
Net realized gains – Original Class
Net realized gains – Institutional Class
Total distributions
CAPITAL SHARE TRANSACTIONS:
Proceeds from shares subscribed – Original Class
Proceeds from shares subscribed – Institutional Class
Dividends reinvested – Original Class
Dividends reinvested – Institutional Class
Cost of shares redeemed – Original Class
Cost of shares redeemed – Institutional Class
Net increase (decrease) in net assets derived from capital share transactions
TOTAL INCREASE (DECREASE) IN NET ASSETS
NET ASSETS:
Beginning of period
End of period
Accumulated net investment income (loss), end of period
CHANGES IN SHARES OUTSTANDING:
Shares sold – Original Class
Shares sold – Institutional Class
Shares issued to holders as reinvestment of dividends – Original Class
Shares issued to holders as reinvestment of dividends – Institutional Class
Shares redeemed – Original Class
Shares redeemed – Institutional Class
Net increase (decrease) in shares outstanding
The accompanying notes are an integral part of these financial statements.
| Hennessy Cornerstone | | | Hennessy Cornerstone | |
| Large Growth Fund | | | Value Fund | |
| Six Months Ended | | | | | | Six Months Ended | | | | |
| April 30, 2012 | | | Year Ended | | | April 30, 2012 | | | Year Ended | |
| (Unaudited) | | | October 31, 2011 | | | (Unaudited) | | | October 31, 2011 | |
| | | | | | | | | | | |
| $ | 617,232 | | | $ | 559,148 | | | $ | 1,593,562 | | | $ | 4,048,072 | |
| | 101,448 | | | | 15,375,964 | | | | 2,979,019 | | | | 10,696,825 | |
| | 7,208,502 | | | | (10,653,411 | ) | | $ | 5,718,672 | | | | (7,231,439 | ) |
| | 7,927,182 | | | | 5,281,701 | | | | 10,291,253 | | | | 7,513,458 | |
| | | | | | | | | | | | | | | |
| | | | | | | | | | | | | | | |
| | (557,836 | ) | | | (626,839 | ) | | | (3,784,445 | ) | | | (4,238,610 | ) |
| | (1,312 | ) | | | (968 | ) | | | (49,840 | ) | | | (44,764 | ) |
| | (15,350,002 | ) | | | (109,149 | ) | | | — | | | | — | |
| | (25,963 | ) | | | (99 | ) | | | — | | | | — | |
| | (15,935,113 | ) | | | (737,055 | ) | | | (3,834,285 | ) | | | (4,283,374 | ) |
| | | | | | | | | | | | | | | |
| | | | | | | | | | | | | | | |
| | 1,027,072 | | | | 1,432,151 | | | | 5,882,455 | | | | 10,694,626 | |
| | 14,218 | | | | 88,409 | | | | 1,207,979 | | | | 83,602 | |
| | 14,646,437 | | | | 671,356 | | | | 3,373,717 | | | | 3,846,379 | |
| | 27,274 | | | | 1,067 | | | | 37,742 | | | | 25,543 | |
| | (5,749,531 | ) | | | (7,591,682 | ) | | | (9,446,377 | ) | | | (57,199,244 | ) |
| | (9,647 | ) | | | (21,081 | ) | | | (108,986 | ) | | | (323,943 | ) |
| | 9,955,823 | | | | (5,419,780 | ) | | | 946,530 | | | | (42,873,037 | ) |
| | 1,947,892 | | | | (875,134 | ) | | | 7,403,498 | | | | (39,642,953 | ) |
| | | | | | | | | | | | | | | |
| | | | | | | | | | | | | | | |
| | 78,023,112 | | | | 78,898,246 | | | | 117,578,990 | | | | 157,221,943 | |
| $ | 79,971,004 | | | $ | 78,023,112 | | | $ | 124,982,488 | | | $ | 117,578,990 | |
| $ | 617,232 | | | $ | 559,148 | | | $ | 1,089,084 | | | $ | 3,329,807 | |
| | | | | | | | | | | | | | | |
| | | | | | | | | | | | | | | |
| | 95,679 | | | | 113,003 | | | | 452,480 | | | | 847,873 | |
| | 1,332 | | | | 7,307 | | | | 91,717 | | | | 6,843 | |
| | 1,455,027 | | | | 55,671 | | | | 264,813 | | | | 312,206 | |
| | 2,689 | | | | 88 | | | | 2,967 | | | | 2,077 | |
| | (537,359 | ) | | | (610,123 | ) | | | (722,646 | ) | | | (4,539,225 | ) |
| | (765 | ) | | | (1,715 | ) | | | (8,457 | ) | | | (25,568 | ) |
| | 1,016,603 | | | | (435,769 | ) | | | 80,874 | | | | (3,395,794 | ) |
HENNESSY FUNDS 1-800-966-4354
Financial Statements
| Statements of Changes in Net Assets |
OPERATIONS:
Net investment income (loss)
Net realized gain (loss) on securities
Change in unrealized appreciation (depreciation) on securities
Net increase (decrease) in net assets resulting from operations
DISTRIBUTIONS TO SHAREHOLDERS FROM:
Net investment income – Original Class
Total distributions
CAPITAL SHARE TRANSACTIONS:
Proceeds from shares subscribed – Original Class
Dividends reinvested – Original Class
Cost of shares redeemed – Original Class
Net increase (decrease) in net assets derived from capital share transactions
TOTAL INCREASE (DECREASE) IN NET ASSETS
NET ASSETS:
Beginning of period
End of period
Accumulated net investment income (loss), end of period
CHANGES IN SHARES OUTSTANDING:
Shares sold – Original Class
Shares issued to holders as reinvestment of dividends – Original Class
Shares redeemed – Original Class
Net increase (decrease) in shares outstanding
The accompanying notes are an integral part of these financial statements.
| Hennessy Total Return Fund | | | Hennessy Balanced Fund | |
| Six Months Ended | | | | | | Six Months Ended | | | | |
| April 30, 2012 | | | Year Ended | | | April 30, 2012 | | | Year Ended | |
| (Unaudited) | | | October 31, 2011 | | | (Unaudited) | | | October 31, 2011 | |
| | | | | | | | | | | |
| $ | 530,960 | | | $ | 1,021,401 | | | $ | 47,427 | | | $ | 57,635 | |
| | 1,048,720 | | | | 3,288,471 | | | | 255,552 | | | | 498,835 | |
| | 4,047,645 | | | | 2,165,518 | | | | 740,660 | | | | 310,456 | |
| | 5,627,325 | | | | 6,475,390 | | | | 1,043,639 | | | | 866,926 | |
| | | | | | | | | | | | | | | |
| | | | | | | | | | | | | | | |
| | (523,930 | ) | | | (1,003,505 | ) | | | (44,552 | ) | | | (55,526 | ) |
| | (523,930 | ) | | | (1,003,505 | ) | | | (44,552 | ) | | | (55,526 | ) |
| | | | | | | | | | | | | | | |
| | | | | | | | | | | | | | | |
| | 16,235,097 | | | | 11,718,225 | | | | 8,094,022 | | | | 8,374,392 | |
| | 478,184 | | | | 905,737 | | | | 42,158 | | | | 53,435 | |
| | (16,248,441 | ) | | | (23,040,187 | ) | | | (3,434,245 | ) | | | (3,720,748 | ) |
| | 464,840 | | | | (10,416,225 | ) | | | 4,701,935 | | | | 4,707,079 | |
| | 5,568,235 | | | | (4,944,340 | ) | | | 5,701,022 | | | | 5,518,479 | |
| | | | | | | | | | | | | | | |
| | | | | | | | | | | | | | | |
| | 64,131,461 | | | | 69,075,801 | | | | 18,022,243 | | | | 12,503,764 | |
| $ | 69,699,696 | | | $ | 64,131,461 | | | $ | 23,723,265 | | | $ | 18,022,243 | |
| $ | 81,679 | | | $ | 74,649 | | | $ | 9,150 | | | $ | 6,275 | |
| | | | | | | | | | | | | | | |
| | | | | | | | | | | | | | | |
| | 1,371,824 | | | | 1,061,206 | | | | 707,837 | | | | 760,081 | |
| | 39,371 | | | | 81,262 | | | | 3,671 | | | | 4,931 | |
| | (1,365,503 | ) | | | (2,087,396 | ) | | | (302,642 | ) | | | (344,283 | ) |
| | 45,692 | | | | (944,928 | ) | | | 408,866 | | | | 420,729 | |
HENNESSY FUNDS 1-800-966-4354
(This Page Intentionally Left Blank.)
Statement of Cash Flows
Hennessy Total Return Fund For the Six Months Ended April 30, 2012 (Unaudited) |
| Cash Flows From Operating Activities: | | | |
| | | | |
| Net increase in net assets from operations | | $ | 5,627,325 | |
| Adjustments to reconcile net increase in net assets from | | | | |
| operations to net cash used in operating activities: | | | | |
| Purchase of investment securities | | | (127,683,962 | ) |
| Proceeds on sale of securities | | | 124,494,229 | |
| Decrease in other receivables, net | | | 878,236 | |
| Decrease in other assets | | | 2,350 | |
| Increase in accrued expenses and other payables | | | 37,668 | |
| Net accretion of discount on securities | | | (3,391 | ) |
| Net realized gain on investments | | | (1,048,720 | ) |
| Unrealized appreciation on securities | | | (4,047,645 | ) |
| Net cash used in operating activities | | $ | (1,743,910 | ) |
| | | | | |
| Cash Flows From Financing Activities: | | | | |
| | | | | |
| Increase in reverse repurchase agreements | | $ | 1,803,000 | |
| Proceeds on shares sold | | | 16,235,097 | |
| Payment on shares repurchased | | | (16,248,441 | ) |
| Cash dividends paid | | | (45,746 | ) |
| Net cash provided by financing activities | | $ | 1,743,910 | |
| | | | | |
| Cash at beginning of period | | | — | |
| Cash at end of period | | | — | |
| Net increase (decrease) in cash | | $ | — | |
| | | | | |
| Cash paid for interest | | $ | 25,982 | |
The accompanying notes are an integral part of these financial statements.
HENNESSY FUNDS 1-800-966-4354
Financial Highlights
| Hennessy Cornerstone Growth Fund |
For an Original Class share outstanding throughout each period
| | | Six Months Ended | |
| | | April 30, 2012 | |
| | | (Unaudited) | |
| PER SHARE DATA: | | | |
| Net asset value, beginning of period | | $ | 9.97 | |
| | | | | |
| Income from investment operations: | | | | |
| Net investment income (loss) | | | (0.02 | ) |
| Net realized and unrealized gains (losses) on securities | | | 1.87 | |
| Total from investment operations | | | 1.85 | |
| | | | | |
| Less Distributions: | | | | |
| Dividends from net investment income | | | — | |
| Dividends from net realized gains | | | — | |
| Total distributions | | | — | |
| Net asset value, end of period | | $ | 11.82 | |
| | | | | |
| TOTAL RETURN | | | 18.56 | %(1) |
| | | | | |
| SUPPLEMENTAL DATA AND RATIOS: | | | | |
| Net assets, end of period (millions) | | $ | 209.19 | |
| Ratio of expenses to average net assets: | | | 1.34 | %(2) |
| Ratio of net investment loss to average net assets | | | (0.17 | )%(2) |
Portfolio turnover rate(3) | | | 94 | %(1) |
| (1) | Not Annualized. |
| (2) | Annualized. |
| (3) | Portfolio turnover is calculated on the basis of the Fund as a whole. |
The accompanying notes are an integral part of these financial statements.
| Year Ended October 31, | |
| 2011 | | | 2010 | | | 2009 | | | 2008 | | | 2007 | |
| | | | | | | | | | | | | | |
| $ | 10.28 | | | $ | 8.81 | | | $ | 8.80 | | | $ | 19.41 | | | $ | 20.77 | |
| | | | | | | | | | | | | | | | | | | |
| | | | | | | | | | | | | | | | | | | |
| | (0.08 | ) | | | (0.10 | ) | | | (0.04 | ) | | | (0.05 | ) | | | (0.07 | ) |
| | (0.23 | ) | | | 1.57 | | | | 0.05 | | | | (8.32 | ) | | | 1.82 | |
| | (0.31 | ) | | | 1.47 | | | | 0.01 | | | | (8.37 | ) | | | 1.75 | |
| | | | | | | | | | | | | | | | | | | |
| | | | | | | | | | | | | | | | | | | |
| | — | | | | — | | | | — | | | | — | | | | — | |
| | — | | | | — | | | | — | | | | (2.24 | ) | | | (3.11 | ) |
| | — | | | | — | | | | — | | | | (2.24 | ) | | | (3.11 | ) |
| $ | 9.97 | | | $ | 10.28 | | | $ | 8.81 | | | $ | 8.80 | | | $ | 19.41 | |
| | | | | | | | | | | | | | | | | | | |
| | (3.02 | )% | | | 16.69 | % | | | 0.11 | % | | | (48.00 | )% | | | 9.65 | % |
| | | | | | | | | | | | | | | | | | | |
| | | | | | | | | | | | | | | | | | | |
| $ | 184.40 | | | $ | 207.11 | | | $ | 228.96 | | | $ | 312.50 | | | $ | 990.43 | |
| | 1.33 | % | | | 1.34 | % | | | 1.36 | % | | | 1.25 | % | | | 1.20 | % |
| | (0.78 | )% | | | (0.89 | )% | | | (0.42 | )% | | | (0.29 | )% | | | (0.32 | )% |
| | 106 | % | | | 103 | % | | | 108 | % | | | 103 | % | | | 97 | % |
The accompanying notes are an integral part of these financial statements.
HENNESSY FUNDS 1-800-966-4354
Financial Highlights
| Hennessy Cornerstone Growth Fund |
For an Institutional Class share outstanding throughout each period
| | | Six Months Ended | |
| | | April 30, 2012 | |
| | | (Unaudited) | |
| PER SHARE DATA: | | | |
| Net asset value, beginning of period | | $ | 10.09 | |
| | | | | |
| Income from investment operations: | | | | |
| Net investment income (loss) | | | 0.01 | |
| Net realized and unrealized gains (losses) on securities | | | 1.89 | |
| Total from investment operations | | | 1.90 | |
| | | | | |
| Less Distributions: | | | | |
| Dividends from net investment income | | | — | |
| Dividends from net realized gains | | | — | |
| Total distributions | | | — | |
| Net asset value, end of period | | $ | 11.99 | |
| | | | | |
| TOTAL RETURN | | | 18.83 | %(2) |
| | | | | |
| SUPPLEMENTAL DATA AND RATIOS: | | | | |
| Net assets, end of period (millions) | | $ | 2.70 | |
| Ratio of expenses to average net assets: | | | | |
| Before expense reimbursement | | | 1.10 | %(3) |
| After expense reimbursement | | | 0.98 | %(3) |
| Ratio of net investment income (loss) to average net assets | | | | |
| Before expense reimbursement | | | (0.11 | )%(3) |
| After expense reimbursement | | | 0.01 | %(3) |
Portfolio turnover rate(4) | | | 94 | %(2) |
| (1) | Institutional Class shares commenced operations on March 3, 2008. |
| (2) | Not Annualized. |
| (3) | Annualized. |
| (4) | Portfolio turnover is calculated on the basis of the Fund as a whole. |
The accompanying notes are an integral part of these financial statements.
| | | | | | | | | | Period Ended | |
| Year Ended October 31, | | | October 31, | |
| 2011 | | | 2010 | | | 2009 | | | 2008(1) | |
| | | | | | | | | | | |
| $ | 10.37 | | | $ | 8.86 | | | $ | 8.82 | | | $ | 13.29 | |
| | | | | | | | | | | | | | | |
| | | | | | | | | | | | | | | |
| | (0.05 | ) | | | (0.07 | ) | | | — | | | | 0.01 | |
| | (0.23 | ) | | | 1.58 | | | | 0.04 | | | | (4.48 | ) |
| | (0.28 | ) | | | 1.51 | | | | 0.04 | | | | (4.47 | ) |
| | | | | | | | | | | | | | | |
| | | | | | | | | | | | | | | |
| | — | | | | — | | | | — | | | | — | |
| | — | | | | — | | | | — | | | | — | |
| | — | | | | — | | | | — | | | | — | |
| $ | 10.09 | | | $ | 10.37 | | | $ | 8.86 | | | $ | 8.82 | |
| | | | | | | | | | | | | | | |
| | (2.70 | )% | | | 17.04 | % | | | 0.45 | % | | | (34.13 | )%(2) |
| | | | | | | | | | | | | | | |
| | | | | | | | | | | | | | | |
| $ | 2.53 | | | $ | 3.12 | | | $ | 4.68 | | | $ | 5.09 | |
| | | | | | | | | | | | | | | |
| | 1.09 | % | | | 1.09 | % | | | 1.11 | % | | | 1.12 | %(3) |
| | 0.98 | % | | | 0.98 | % | | | 0.98 | % | | | 0.98 | %(3) |
| | | | | | | | | | | | | | | |
| | (0.55 | )% | | | (0.64 | )% | | | (0.17 | )% | | | 0.15 | %(3) |
| | (0.44 | )% | | | (0.53 | )% | | | (0.04 | )% | | | 0.29 | %(3) |
| | 106 | % | | | 103 | % | | | 108 | % | | | 103 | %(2) |
HENNESSY FUNDS 1-800-966-4354
Financial Highlights
For an Original Class share outstanding throughout each period
| | | Six Months Ended | |
| | | April 30, 2012 | |
| | | (Unaudited) | |
| PER SHARE DATA: | | | |
| Net asset value, beginning of period | | $ | 12.15 | |
| | | | | |
| Income from investment operations: | | | | |
| Net investment income (loss) | | | 0.06 | |
| Net realized and unrealized gains (losses) on investments | | | 1.46 | |
| Total from investment operations | | | 1.52 | |
| | | | | |
| Less Distributions: | | | | |
| Dividends from net investment income | | | — | |
| Dividends from net realized gains | | | — | |
| Total distributions | | | — | |
| Net asset value, end of period | | $ | 13.67 | |
| | | | | |
| TOTAL RETURN | | | 12.51 | %(1) |
| | | | | |
| SUPPLEMENTAL DATA AND RATIOS: | | | | |
| Net assets, end of period (millions) | | $ | 122.16 | |
| Ratio of expenses to average net assets: | | | 1.38 | %(2) |
| Ratio of net investment loss to average net assets: | | | 0.88 | %(2) |
Portfolio turnover rate(3) | | | 0 | %(1) |
| (1) | Not Annualized. |
| (2) | Annualized. |
| (3) | Portfolio turnover is calculated on the basis of the Fund as a whole. |
The accompanying notes are an integral part of these financial statements.
| Year Ended October 31, | |
| 2011 | | | 2010 | | | 2009 | | | 2008 | | | 2007 | |
| | | | | | | | | | | | | | |
| $ | 11.18 | | | $ | 8.73 | | | $ | 8.02 | | | $ | 13.67 | | | $ | 12.39 | |
| | | | | | | | | | | | | | | | | | | |
| | (0.09 | ) | | | (0.03 | ) | | | (0.02 | ) | | | (0.06 | ) | | | (0.09 | ) |
| | 1.06 | | | | 2.48 | | | | 0.73 | | | | (3.57 | ) | | | 1.47 | |
| | 0.97 | | | | 2.45 | | | | 0.71 | | | | (3.63 | ) | | | 1.38 | |
| | | | | | | | | | | | | | | | | | | |
| | — | | | | — | | | | — | | | | — | | | | — | |
| | — | | | | — | | | | — | | | | (2.02 | ) | | | (0.10 | ) |
| | — | | | | — | | | | — | | | | (2.02 | ) | | | (0.10 | ) |
| $ | 12.15 | | | $ | 11.18 | | | $ | 8.73 | | | $ | 8.02 | | | $ | 13.67 | |
| | 8.68 | % | | | 28.06 | % | | | 8.85 | % | | | (30.81 | )% | | | 11.30 | % |
| | | | | | | | | | | | | | | | | | | |
| | | | | | | | | | | | | | | | | | | |
| $ | 146.23 | | | $ | 123.20 | | | $ | 128.36 | | | $ | 167.32 | | | $ | 233.37 | |
| | 1.36 | % | | | 1.39 | % | | | 1.39 | % | | | 1.27 | % | | | 1.23 | % |
| | (0.79 | )% | | | (0.26 | )% | | | (0.20 | )% | | | (0.62 | )% | | | (0.61 | )% |
| | 107 | % | | | 87 | % | | | 90 | % | | | 123 | % | | | 112 | % |
HENNESSY FUNDS 1-800-966-4354
Financial Highlights
For an Institutional Class share outstanding throughout each period
| | | Six Months Ended | |
| | | April 30, 2012 | |
| | | (Unaudited) | |
| | | | |
| PER SHARE DATA: | | | |
| Net asset value, beginning of period | | $ | 12.32 | |
| | | | | |
| Income from investment operations: | | | | |
| Net investment income (loss) | | | 0.09 | |
| Net realized and unrealized gains (losses) on investments | | | 1.48 | |
| Total from investment operations | | | 1.57 | |
| | | | | |
| Less Distributions: | | | | |
| Dividends from net investment income | | | — | |
| Dividends from net realized gains | | | — | |
| Total distributions | | | — | |
| Net asset value, end of period | | $ | 13.89 | |
| | | | | |
| TOTAL RETURN | | | 12.74 | %(2) |
| | | | | |
| SUPPLEMENTAL DATA AND RATIOS: | | | | |
| Net assets, end of period (millions) | | $ | 23.47 | |
| Ratio of expenses to average net assets: | | | | |
| Before expense reimbursement | | | 1.15 | %(3) |
| After expense reimbursement | | | 0.98 | %(3) |
| Ratio of net investment income (loss) to average net assets: | | | | |
| Before expense reimbursement | | | 1.15 | %(3) |
| After expense reimbursement | | | 1.32 | %(3) |
Portfolio turnover rate(4) | | | 0 | %(2) |
| (1) | Institutional Class shares commenced operations on March 3, 2008. |
| (2) | Not Annualized. |
| (3) | Annualized. |
| (4) | Portfolio turnover is calculated on the basis of the Fund as a whole. |
The accompanying notes are an integral part of these financial statements.
| | | | | | | | | | Period Ended | |
| Year Ended October 31, | | | October 31, | |
| 2011 | | | 2010 | | | 2009 | | | 2008(1) | |
| | | | | | | | | | | |
| $ | 11.29 | | | $ | 8.78 | | | $ | 8.04 | | | $ | 11.15 | |
| | | | | | | | | | | | | | | |
| | | | | | | | | | | | | | | |
| | (0.05 | ) | | | 0.02 | | | | 0.02 | | | | (0.02 | ) |
| | 1.08 | | | | 2.49 | | | | 0.72 | | | | (3.09 | ) |
| | 1.03 | | | | 2.51 | | | | 0.74 | | | | (3.11 | ) |
| | | | | | | | | | | | | | | |
| | | | | | | | | | | | | | | |
| | — | | | | — | | | | — | | | | — | |
| | — | | | | — | | | | — | | | | — | |
| | — | | | | — | | | | — | | | | — | |
| $ | 12.32 | | | $ | 11.29 | | | $ | 8.78 | | | $ | 8.04 | |
| | | | | | | | | | | | | | | |
| | 9.12 | % | | | 28.59 | % | | | 9.20 | % | | | (27.89 | )%(2) |
| | | | | | | | | | | | | | | |
| | | | | | | | | | | | | | | |
| $ | 24.06 | | | $ | 21.38 | | | $ | 27.44 | | | $ | 26.78 | |
| | | | | | | | | | | | | | | |
| | 1.14 | % | | | 1.16 | % | | | 1.15 | % | | | 1.13 | %(3) |
| | 0.98 | % | | | 0.98 | % | | | 0.98 | % | | | 0.98 | %(3) |
| | | | | | | | | | | | | | | |
| | (0.57 | )% | | | (0.03 | )% | | | 0.04 | % | | | (0.28 | )%(3) |
| | (0.41 | )% | | | 0.15 | % | | | 0.21 | % | | | (0.13 | )%(3) |
| | 107 | % | | | 87 | % | | | 90 | % | | | 123 | %(2) |
HENNESSY FUNDS 1-800-966-4354
Financial Highlights
| Hennessy Cornerstone Large Growth Fund |
For an Original Class share outstanding throughout each period
| | | Six Months Ended | |
| | | April 30, 2012 | |
| | | (Unaudited) | |
| PER SHARE DATA: | | | |
| Net asset value, beginning of period | | $ | 12.37 | |
| Income from investment operations: | | | | |
| Net investment income (loss) | | | 0.07 | |
| Net realized and unrealized gains (losses) on securities | | | 1.01 | |
| Total from investment operations | | | 1.08 | |
| Less Distributions: | | | | |
| Dividends from net investment income | | | (0.07 | ) |
| Dividends from net realized gains | | | (2.46 | ) |
| Total distributions | | | (2.53 | ) |
| Net asset value, end of period | | $ | 10.92 | |
| TOTAL RETURN | | | 10.66 | %(5) |
| SUPPLEMENTAL DATA AND RATIOS: | | | | |
| Net assets, end of period (millions) | | $ | 79.81 | |
| Ratio of expenses to average net assets: | | | | |
| Before expense reimbursement/recoupment | | | 1.26 | %(6) |
| After expense reimbursement/recoupment | | | 1.26 | %(6) |
| Ratio of net investment income to average net assets | | | | |
| Before expense reimbursement/recoupment | | | 1.58 | %(6) |
| After expense reimbursement/recoupment | | | 1.58 | %(6) |
Portfolio turnover rate(7) | | | 0 | %(5) |
| (1) | For the one month period ended October 31, 2009. Effective October 31, 2009, the Fund changed its fiscal year end to October 31st from September 30th. |
| (2) | The financial highlights set forth for periods prior to March 20, 2009 represent the historical financial highlights of the Tamarack Large Cap Growth Fund, Class S shares. The assets of the Tamarack Large Cap Growth Fund were acquired by the Hennessy Cornerstone Large Growth Fund on March 20, 2009. At the time RBC Global Asset Management (U.S.), Inc. (formerly known as Voyageur Asset Management Inc.) ceased to be investment advisor and Hennessy Advisors, Inc. became investment advisor. The return of the Tamarack Large Cap Growth Fund, Class S shares during the period October 1, 2008 through March 20, 2009 was (33.30)%. The return of the Hennessy Cornerstone Large Growth Fund, Original Class shares during the period March 20, 2009 through September 30, 2009 was 42.64%. |
| (3) | Amount is less than $0.01 or ($0.01) per share. |
| (4) | Per share net investment income (loss) has been calculated using the average daily shares method. |
| (5) | Not annualized. |
| (6) | Annualized. |
| (7) | Portfolio turnover is calculated on the basis of the Fund as a whole. |
The accompanying notes are an integral part of these financial statements.
| | | | | | | One Month Ended | | | | | | | | | | |
| Year Ended October 31, | | | October 31, | | | Year Ended September 30, | |
| 2011 | | | 2010 | | | 2009(1) | | | 2009(2) | | | 2008(2) | | | 2007(2) | |
| | | | | | | | | | | | | | | | | |
| $ | 11.70 | | | $ | 9.49 | | | $ | 9.60 | | | $ | 10.09 | | | $ | 12.61 | | | $ | 10.98 | |
| | | | | | | | | | | | | | | | | | | | | | | |
| | 0.09 | | | | 0.09 | | | | — | (3) | | | 0.05 | | | | — | (3)(4) | | | — | (3) |
| | 0.69 | | | | 2.17 | | | | (0.11 | ) | | | (0.54 | ) | | | (2.52 | ) | | | 1.63 | |
| | 0.78 | | | | 2.26 | | | | (0.11 | ) | | | (0.49 | ) | | | (2.52 | ) | | | 1.63 | |
| | | | | | | | | | | | | | | | | | | | | | | |
| | (0.09 | ) | | | (0.05 | ) | | | — | | | | — | | | | — | | | | — | |
| | (0.02 | ) | | | — | | | | — | | | | — | | | | — | | | | — | |
| | (0.11 | ) | | | (0.05 | ) | | | — | | | | — | | | | — | | | | — | |
| $ | 12.37 | | | $ | 11.70 | | | $ | 9.49 | | | $ | 9.60 | | | $ | 10.09 | | | $ | 12.61 | |
| | 6.70 | % | | | 23.88 | % | | | (1.15 | )%(5) | | | (4.86 | )% | | | (19.98 | )% | | | 14.85 | % |
| | | | | | | | | | | | | | | | | | | | | | | |
| $ | 77.88 | | | $ | 78.83 | | | $ | 69.41 | | | $ | 70.61 | | | $ | 80.91 | | | $ | 113.15 | |
| | | | | | | | | | | | | | | | | | | | | | | |
| | 1.26 | % | | | 1.30 | % | | | 1.26 | %(6) | | | 1.40 | % | | | 1.16 | % | | | 1.18 | % |
| | 1.30 | % | | | 1.30 | % | | | 1.30 | %(6) | | | 1.17 | % | | | 0.98 | % | | | 1.00 | % |
| | | | | | | | | | | | | | | | | | | | | | | |
| | 0.72 | % | | | 0.84 | % | | | (0.01 | )%(6) | | | 0.36 | % | | | (0.19 | )% | | | (0.19 | )% |
| | 0.68 | % | | | 0.84 | % | | | (0.05 | )%(6) | | | 0.59 | % | | | (0.01 | )% | | | (0.01 | )% |
| | 70 | % | | | 83 | % | | | 0 | %(5) | | | 116 | % | | | 38 | % | | | 25 | % |
HENNESSY FUNDS 1-800-966-4354
Financial Highlights
| Hennessy Cornerstone Large Growth Fund |
For an Institutional Class share outstanding throughout each period
| | | Six Months Ended | |
| | | April 30, 2012 | |
| | | (Unaudited) | |
| PER SHARE DATA: | | | |
| Net asset value, beginning of period | | $ | 12.44 | |
| | | | | |
| Income from investment operations: | | | | |
| Net investment income | | | 0.09 | |
| Net realized and unrealized gains (losses) on securities | | | 1.02 | |
| Total from investment operations | | | 1.11 | |
| | | | | |
| Less Distributions: | | | | |
| Dividends from net investment income | | | (0.10 | ) |
| Dividends from net realized gains | | | (2.46 | ) |
| Total distributions | | | (2.56 | ) |
| Net asset value, end of period | | $ | 10.99 | |
| | | | | |
| TOTAL RETURN | | | 10.85 | %(4) |
| | | | | |
| SUPPLEMENTAL DATA AND RATIOS: | | | | |
| Net assets, end of period (millions) | | $ | 0.16 | |
| Ratio of expenses to average net assets: | | | | |
| Before expense reimbursement | | | 1.13 | %(5) |
| After expense reimbursement | | | 0.98 | %(5) |
| Ratio of net investment income to average net assets | | | | |
| Before expense reimbursement | | | 1.68 | %(5) |
| After expense reimbursement | | | 1.83 | %(5) |
Portfolio turnover rate(6) | | | 0 | %(4) |
| (1) | For the one month period ended October 31, 2009. Effective October 31, 2009, the Fund changed its fiscal year end to October 31st from September 30th. |
| (2) | Institutional Class shares commenced operations on March 20, 2009. |
| (3) | Amount is less than $0.01 or ($0.01) per share. |
| (4) | Not annualized. |
| (5) | Annualized. |
| (6) | Portfolio turnover is calculated on the basis of the Fund as a whole. |
The accompanying notes are an integral part of these financial statements.
| | | | | | | One Month Ended | | | Period Ended | |
| Year Ended October 31, | | | October 31, | | | September 30, | |
| 2011 | | | 2010 | | | 2009(1) | | | 2009(2) | |
| | | | | | | | | | | |
| $ | 11.76 | | | $ | 9.51 | | | $ | 9.61 | | | $ | 6.73 | |
| | | | | | | | | | | | | | | |
| | | | | | | | | | | | | | | |
| | 0.08 | | | | 0.10 | | | | — | (3) | | | 0.03 | |
| | 0.74 | | | | 2.20 | | | | (0.10 | ) | | | 2.85 | |
| | 0.82 | | | | 2.30 | | | | (0.10 | ) | | | 2.88 | |
| | | | | | | | | | | | | | | |
| | | | | | | | | | | | | | | |
| | (0.12 | ) | | | (0.05 | ) | | | — | | | | — | |
| | (0.02 | ) | | | — | | | | — | | | | — | |
| | (0.14 | ) | | | (0.05 | ) | | | — | | | | — | |
| $ | 12.44 | | | $ | 11.76 | | | $ | 9.51 | | | $ | 9.61 | |
| | | | | | | | | | | | | | | |
| | 6.99 | % | | | 24.26 | % | | | (1.04 | )%(4) | | | 42.79 | %(4) |
| | | | | | | | | | | | | | | |
| | | | | | | | | | | | | | | |
| $ | 0.14 | | | $ | 0.07 | | | $ | 0.04 | | | $ | 0.04 | |
| | | | | | | | | | | | | | | |
| | 1.14 | % | | | 1.16 | % | | | 1.14 | %(5) | | | 16.51 | %(5) |
| | 0.98 | % | | | 0.98 | % | | | 0.98 | %(5) | | | 0.98 | %(5) |
| | | | | | | | | | | | | | | |
| | 0.81 | % | | | 0.90 | % | | | 0.12 | %(5) | | | (14.54 | )%(5) |
| | 0.97 | % | | | 1.08 | % | | | 0.28 | %(5) | | | 0.99 | %(5) |
| | 70 | % | | | 83 | % | | | 0 | %(4) | | | 116 | %(4) |
HENNESSY FUNDS 1-800-966-4354
Financial Highlights
| Hennessy Cornerstone Value Fund |
For an Original Class share outstanding throughout each period
| | | Six Months Ended | |
| | | April 30, 2012 | |
| | | (Unaudited) | |
| PER SHARE DATA: | | | |
| Net asset value, beginning of period | | $ | 12.84 | |
| | | | | |
| Income from investment operations: | | | | |
| Net investment income (loss) | | | 0.18 | |
| Net realized and unrealized gains (losses) on investments | | | 0.93 | |
| Total from investment operations | | | 1.11 | |
| | | | | |
| Less Distributions: | | | | |
| Dividends from net investment income | | | (0.42 | ) |
| Dividends from net realized gains | | | — | |
| Total distributions | | | (0.42 | ) |
| Net asset value, end of period | | $ | 13.53 | |
| | | | | |
| TOTAL RETURN | | | 8.84 | %(1) |
| | | | | |
| SUPPLEMENTAL DATA AND RATIOS: | | | | |
| Net assets, end of period (millions) | | $ | 122.59 | |
| Ratio of expenses to average net assets | | | 1.27 | %(2) |
| Ratio of net investment income to average net assets | | | 2.64 | %(2) |
Portfolio turnover rate(3) | | | 43 | %(1) |
| (1) | Not Annualized. |
| (2) | Annualized. |
| (3) | Portfolio turnover is calculated on the basis of the Fund as a whole. |
The accompanying notes are an integral part of these financial statements.
| Year Ended October 31, | |
| 2011 | | | 2010 | | | 2009 | | | 2008 | | | 2007 | |
| | | | | | | | | | | | | | |
| $ | 12.53 | | | $ | 10.63 | | | $ | 9.05 | | | $ | 17.06 | | | $ | 15.27 | |
| | | | | | | | | | | | | | | | | | | |
| | 0.45 | | | | 0.29 | | | | 0.24 | | | | 0.55 | | | | 0.46 | |
| | 0.23 | | | | 1.81 | | | | 1.87 | | | | (8.15 | ) | | | 1.68 | |
| | 0.68 | | | | 2.10 | | | | 2.11 | | | | (7.60 | ) | | | 2.14 | |
| | | | | | | | | | | | | | | | | | | |
| | (0.37 | ) | | | (0.20 | ) | | | (0.53 | ) | | | (0.41 | ) | | | (0.35 | ) |
| | — | | | | — | | | | — | | | | — | | | | — | |
| | (0.37 | ) | | | (0.20 | ) | | | (0.53 | ) | | | (0.41 | ) | | | (0.35 | ) |
| $ | 12.84 | | | $ | 12.53 | | | $ | 10.63 | | | $ | 9.05 | | | $ | 17.06 | |
| | | | | | | | | | | | | | | | | | | |
| | 5.58 | % | | | 19.98 | % | | | 25.51 | % | | | (45.50 | )% | | | 14.26 | % |
| | | | | | | | | | | | | | | | | | | |
| | | | | | | | | | | | | | | | | | | |
| $ | 116.41 | | | $ | 155.87 | | | $ | 145.91 | | | $ | 97.10 | | | $ | 204.50 | |
| | 1.31 | % | | | 1.29 | % | | | 1.27 | % | | | 1.20 | % | | | 1.17 | % |
| | 2.94 | % | | | 2.33 | % | | | 3.19 | % | | | 3.92 | % | | | 2.64 | % |
| | 40 | % | | | 91 | % | | | 59 | % | | | 53 | % | | | 40 | % |
HENNESSY FUNDS 1-800-966-4354
Financial Highlights
| Hennessy Cornerstone Value Fund |
For an Institutional Class share outstanding throughout each period
| | | Six Months Ended | |
| | | April 30, 2012 | |
| | | (Unaudited) | |
| PER SHARE DATA: | | | |
| Net asset value, beginning of period | | $ | 12.86 | |
| | | | | |
| Income from investment operations: | | | | |
| Net investment income (loss) | | | 0.25 | |
| Net realized and unrealized gains (losses) on investments | | | 0.88 | |
| Total from investment operations | | | 1.13 | |
| | | | | |
| Less Distributions: | | | | |
| Dividends from net investment income | | | (0.46 | ) |
| Dividends from net realized gains | | | — | |
| Total distributions | | | (0.46 | ) |
| Net asset value, end of period | | | 13.53 | |
| | | | | |
| TOTAL RETURN | | | 9.02 | %(2) |
| | | | | |
| SUPPLEMENTAL DATA AND RATIOS: | | | | |
| Net assets, end of period (millions) | | $ | 2.40 | |
| Ratio of expenses to average net assets | | | | |
| Before expense reimbursement | | | 1.11 | %(3) |
| After expense reimbursement | | | 0.98 | %(3) |
| Ratio of net investment income to average net assets | | | | |
| Before expense reimbursement | | | 2.77 | %(3) |
| After expense reimbursement | | | 2.90 | %(3) |
Portfolio turnover rate(4) | | | 43 | %(2) |
| (1) | Institutional Class shares commenced operations on March 3, 2008. |
| (2) | Not Annualized. |
| (3) | Annualized. |
| (4) | Portfolio turnover is calculated on the basis of the Fund as a whole. |
The accompanying notes are an integral part of these financial statements.
| | | | | | | | | | Period Ended | |
| Year Ended October 31, | | | October 31, | |
| 2011 | | | 2010 | | | 2009 | | | 2008(1) | |
| | | | | | | | | | | |
| $ | 12.54 | | | $ | 10.63 | | | $ | 9.06 | | | $ | 13.79 | |
| | | | | | | | | | | | | | | |
| | | | | | | | | | | | | | | |
| | 0.36 | | | | 0.30 | | | | 0.30 | | | | 0.34 | |
| | 0.37 | | | | 1.83 | | | | 1.83 | | | | (5.07 | ) |
| | 0.73 | | | | 2.13 | | | | 2.13 | | | | (4.73 | ) |
| | | | | | | | | | | | | | | |
| | | | | | | | | | | | | | | |
| | (0.41 | ) | | | (0.22 | ) | | | (0.56 | ) | | | — | |
| | — | | | | — | | | | — | | | | — | |
| | (0.41 | ) | | | (0.22 | ) | | | (0.56 | ) | | | — | |
| $ | 12.86 | | | $ | 12.54 | | | $ | 10.63 | | | $ | 9.06 | |
| | | | | | | | | | | | | | | |
| | 6.00 | % | | | 20.31 | % | | | 25.87 | % | | | (34.30 | )%(2) |
| | | | | | | | | | | | | | | |
| | | | | | | | | | | | | | | |
| $ | 1.17 | | | $ | 1.35 | | | $ | 1.11 | | | $ | 0.87 | |
| | | | | | | | | | | | | | | |
| | 1.14 | % | | | 1.10 | % | | | 1.13 | % | | | 1.14 | %(3) |
| | 0.98 | % | | | 0.98 | % | | | 0.98 | % | | | 0.98 | %(3) |
| | | | | | | | | | | | | | | |
| | 3.04 | % | | | 2.52 | % | | | 3.33 | % | | | 4.94 | %(3) |
| | 3.20 | % | | | 2.64 | % | | | 3.48 | % | | | 5.10 | %(3) |
| | 40 | % | | | 91 | % | | | 59 | % | | | 53 | %(2) |
HENNESSY FUNDS 1-800-966-4354
Financial Highlights
| Hennessy Total Return Fund |
For an Original Class share outstanding throughout each period
| | | Six Months Ended | |
| | | April 30, 2012 | |
| | | (Unaudited) | |
| PER SHARE DATA: | | | |
| Net asset value, beginning of period | | $ | 11.47 | |
| | | | | |
| Income from investment operations: | | | | |
| Net investment income | | | 0.09 | |
| Net realized and unrealized gains (losses) on securities | | | 0.90 | |
| Total from investment operations | | | 0.99 | |
| | | | | |
| Less Distributions: | | | | |
| Dividends from net investment income | | | (0.09 | ) |
| Dividends from realized capital gains | | | — | |
| Total distributions | | | (0.09 | ) |
| Net asset value, end of period | | $ | 12.37 | |
| | | | | |
| TOTAL RETURN | | | 8.67 | %(1) |
| | | | | |
| SUPPLEMENTAL DATA AND RATIOS: | | | | |
| Net assets, end of period (millions) | | $ | 69.70 | |
| Gross ratio of expenses, including interest expense, to average net assets | | | 1.32 | %(2) |
| Ratio of interest expense to average net assets | | | 0.08 | %(2) |
| Net ratio of expenses, excluding interest expense, to average net assets | | | 1.24 | %(2) |
| Ratio of net investment income to average net assets | | | 1.56 | %(2) |
| Portfolio turnover rate | | | 8 | %(1) |
| (1) | Not Annualized. |
| (2) | Annualized. |
The accompanying notes are an integral part of these financial statements.
| Year Ended October 31, | |
| 2011 | | | 2010 | | | 2009 | | | 2008 | | | 2007 | |
| | | | | | | | | | | | | | |
| $ | 10.57 | | | $ | 9.10 | | | $ | 9.22 | | | $ | 13.73 | | | $ | 12.61 | |
| | | | | | | | | | | | | | | | | | | |
| | 0.18 | | | | 0.16 | | | | 0.18 | | | | 0.28 | | | | 0.33 | |
| | 0.89 | | | | 1.48 | | | | (0.14 | ) | | | (4.49 | ) | | | 1.13 | |
| | 1.07 | | | | 1.64 | | | | 0.04 | | | | (4.21 | ) | | | 1.46 | |
| | | | | | | | | | | | | | | | | | | |
| | (0.17 | ) | | | (0.17 | ) | | | (0.16 | ) | | | (0.30 | ) | | | (0.34 | ) |
| | — | | | | — | | | | — | | | | — | | | | — | |
| | (0.17 | ) | | | (0.17 | ) | | | (0.16 | ) | | | (0.30 | ) | | | (0.34 | ) |
| $ | 11.47 | | | $ | 10.57 | | | $ | 9.10 | | | $ | 9.22 | | | $ | 13.73 | |
| | 10.22 | % | | | 18.09 | % | | | 0.69 | % | | | (30.97 | )% | | | 11.70 | % |
| | | | | | | | | | | | | | | | | | | |
| | | | | | | | | | | | | | | | | | | |
| $ | 64.13 | | | $ | 69.08 | | | $ | 52.38 | | | $ | 58.22 | | | $ | 96.31 | |
| | 1.34 | % | | | 1.33 | % | | | 1.56 | % | | | 2.36 | % | | | 3.04 | % |
| | 0.10 | % | | | 0.08 | % | | | 0.29 | % | | | 1.16 | % | | | 1.88 | % |
| | 1.24 | % | | | 1.25 | % | | | 1.27 | % | | | 1.20 | % | | | 1.16 | % |
| | 1.56 | % | | | 1.62 | % | | | 2.12 | % | | | 2.43 | % | | | 2.48 | % |
| | 21 | % | | | 41 | % | | | 41 | % | | | 16 | % | | | 12 | % |
HENNESSY FUNDS 1-800-966-4354
Financial Highlights
For an Original Class share outstanding throughout each period
| | | Six Months Ended | |
| | | April 30, 2012 | |
| | | (Unaudited) | |
| PER SHARE DATA: | | | |
| Net asset value, beginning of period | | $ | 11.13 | |
| | | | | |
| Income from investment operations: | | | | |
| Net investment income | | | 0.02 | |
| Net realized and unrealized gains (losses) on securities | | | 0.57 | |
| Total from investment operations | | | 0.59 | |
| | | | | |
| Less Distributions: | | | | |
| Dividends from net investment income | | | (0.02 | ) |
| Dividends from realized capital gains | | | — | |
| Total distributions | | | (0.02 | ) |
| Net asset value, end of period | | $ | 11.70 | |
| | | | | |
| TOTAL RETURN | | | 5.35 | %(1) |
| | | | | |
| SUPPLEMENTAL DATA AND RATIOS: | | | | |
| Net assets, end of period (millions) | | $ | 23.72 | |
| Ratio of net expenses to average net assets | | | 1.44 | %(2) |
| Ratio of net investment income to average net assets | | | 0.47 | %(2) |
| Portfolio turnover rate | | | 16 | %(1) |
| (1) | Not Annualized. |
| (2) | Annualized. |
The accompanying notes are an integral part of these financial statements.
| Year Ended October 31, | |
| 2011 | | | 2010 | | | 2009 | | | 2008 | | | 2007 | |
| | | | | | | | | | | | | | |
| $ | 10.43 | | | $ | 9.48 | | | $ | 9.11 | | | $ | 12.51 | | | $ | 11.83 | |
| | | | | | | | | | | | | | | | | | | |
| | 0.05 | | | | 0.05 | | | | 0.10 | | | | 0.25 | | | | 0.38 | |
| | 0.70 | | | | 0.95 | | | | 0.38 | | | | (2.80 | ) | | | 0.69 | |
| | 0.75 | | | | 1.00 | | | | 0.48 | | | | (2.55 | ) | | | 1.07 | |
| | | | | | | | | | | | | | | | | | | |
| | (0.05 | ) | | | (0.05 | ) | | | (0.11 | ) | | | (0.26 | ) | | | (0.39 | ) |
| | — | | | | — | | | | — | | | | (0.59 | ) | | | — | |
| | (0.05 | ) | | | (0.05 | ) | | | (0.11 | ) | | | (0.85 | ) | | | (0.39 | ) |
| $ | 11.13 | | | $ | 10.43 | | | $ | 9.48 | | | $ | 9.11 | | | $ | 12.51 | |
| | 7.16 | % | | | 10.53 | % | | | 5.46 | % | | | (21.55 | )% | | | 9.16 | % |
| | | | | | | | | | | | | | | | | | | |
| | | | | | | | | | | | | | | | | | | |
| $ | 18.02 | | | $ | 12.50 | | | $ | 11.47 | | | $ | 11.46 | | | $ | 16.82 | |
| | 1.61 | % | | | 1.65 | % | | | 1.73 | % | | | 1.56 | % | | | 1.36 | % |
| | 0.42 | % | | | 0.45 | % | | | 1.17 | % | | | 2.31 | % | | | 2.86 | % |
| | 39 | % | | | 57 | % | | | 46 | % | | | 13 | % | | | 35 | % |
HENNESSY FUNDS 1-800-966-4354
Notes to the Financial Statements
April 30, 2012 (Unaudited)
1). ORGANIZATION
The Hennessy Mutual Funds, Inc. was organized as a Maryland corporation on May 20, 1996 and consists of three separate series: Hennessy Cornerstone Growth Fund (the “Growth Fund”), Hennessy Cornerstone Value Fund (the “Value Fund”) and the Hennessy Focus 30 Fund (the “Focus 30 Fund”). These Funds are open-end, diversified management investment companies registered under the Investment Company Act of 1940, as amended (the “1940 Act”). The investment objective of the Growth and Focus 30 Funds is long-term growth of capital. The investment objective of the Value Fund is total return, consisting of capital appreciation and current income.
The Hennessy Funds, Inc. was organized as a Maryland corporation on January 11, 1996 and consists of two separate series: Hennessy Balanced Fund (the “Balanced Fund”) and Hennessy Total Return Fund (the “Total Return Fund”). The Balanced and Total Return Funds are open-end, non-diversified management investment companies registered under the 1940 Act. The investment objective of the Balanced Fund is a combination of capital appreciation and current income. The investment objective of the Total Return Fund is total return, consisting of capital appreciation and current income.
The Hennessy Funds Trust (the “Trust”) was organized as a Delaware Statutory Trust on September 17, 1992 and consists of two series: Hennessy Select Large Value Fund and Hennessy Cornerstone Large Growth Fund (the “Large Growth Fund”). The financial results of the Hennessy Select Large Value Fund are not contained in this report. The Large Growth Fund is an open-end, diversified management investment company registered under the 1940 Act. The investment objective of the Large Growth Fund is long-term growth of capital.
The Growth, Focus 30, Large Growth, Value, Total Return and Balanced Funds collectively represent the Hennessy Cornerstone Series Funds (the “Funds”).
The Growth, Focus 30, Large Growth and Value Funds offer Original and Institutional Class shares. Each class of shares differs principally in its respective administration, shareholder servicing and transfer agent expenses and sales charges, if any. Each class has identical rights to earnings, assets and voting privileges, except for class-specific expenses and exclusive rights to vote on matters affecting only individual classes. The Balanced and Total Return Funds offer only Original Class shares.
2). SIGNIFICANT ACCOUNTING POLICIES
The following is a summary of significant accounting policies consistently followed by the Funds in the preparation of the financial statements. These policies are in conformity with U.S. generally accepted accounting principles (“GAAP”).
| a). | Investment Valuation – All investments in securities are recorded at their estimated fair value, as described in Note 3. |
| | |
| b). | Federal Income Taxes – Provision for Federal income taxes or excise taxes has not been made since the Funds have elected to be taxed as “regulated investment companies” and intend to distribute substantially all taxable income to shareholders and otherwise comply with the provisions of the Internal Revenue Code applicable to regulated investment companies. Net investment income or loss and realized gains and losses for federal income tax purposes may differ from that reported on the financial statements because of temporary book and tax basis differences. Temporary differences are primarily the result of the treatment of wash sales for tax reporting purposes. Distributions from net realized gains for book purposes may include short-term capital gains, which are included as ordinary income to shareholders for tax purposes. |
| | |
| c). | Income and Expenses – Dividend income is recognized on the ex-dividend date or as soon as information is available to the Funds and interest income is recognized on an accrual basis. Income, expenses (other than expenses attributable to a specific class), and realized and unrealized gains or losses on investments are allocated to each class of shares based on its respective net assets. |
| | |
| d). | Distributions to Shareholders – Dividends from net investment income for the Growth, Focus 30, Large Growth and Value Funds, if any, are declared and paid out annually, usually in November or December of each year. Dividends from net investment income for the Total Return and Balanced Funds are declared and paid on a calendar quarter basis. Distributions of net realized capital gains, if any, are declared and paid annually, usually in November or December of each year, for all of the Funds. |
| | |
| e). | Security Transactions – Investment and shareholder transactions are recorded on the trade date. The Funds determine the gain or loss realized from the investment transactions by comparing the original cost of the security lot sold with the net sale proceeds. Discounts and premiums on securities purchased are accreted/amortized over the life of the respective security. |
| | |
| f). | Use of Estimates – The preparation of financial statements in conformity with GAAP requires management to make estimates and assumptions that affect the reported amounts of assets and liabilities and disclosure of contingent assets and liabilities at the date of the financial statements and the reported change in net assets during the reporting period. Actual results could differ from those estimates. |
| | |
| g). | Share Valuation – The net asset value (“NAV”) per share of each Fund is calculated by dividing the sum of the value of the securities held by each Fund, plus cash or other assets, minus all liabilities (including estimated accrued expenses) by the total number of shares outstanding for each Fund, rounded to the nearest cent. The Funds’ shares will not be priced on the days on which the New York Stock Exchange is closed for trading. The offering and redemption price per share for each Fund is equal to each Fund’s net asset value per share. |
HENNESSY FUNDS 1-800-966-4354
| h). | Repurchase Agreements – Each Fund may enter into repurchase agreements with member banks or security dealers of the Federal Reserve whom the investment advisor deems creditworthy. The repurchase price generally equals the price paid by the Fund plus interest negotiated on the basis of current short-term rates. |
| | |
| | Securities pledged as collateral for repurchase agreements are held by the custodian bank until the respective agreements mature. Provisions of the repurchase agreements ensure that the market value of the collateral, including accrued interest thereon, is sufficient, in the event of default of the counterparty. If the counterparty defaults and the value of the collateral declines or if the counterparty enters an insolvency proceeding, realization of the collateral by the Fund may be delayed or limited. |
| | |
| i). | Accounting for Uncertainty in Income Taxes – The Funds have adopted accounting policies regarding recognition and measurement of tax positions taken or expected to be taken on a tax return. The Funds have reviewed all open tax years and major jurisdictions and concluded that there is no impact on the Funds’ net assets and no tax liability resulting from unrecognized tax benefits relating to uncertain income tax positions taken or expected to be taken on a tax return. As of April 30, 2012, open Federal and state tax years for the Large Growth Fund include the tax year ended September 30, 2009, tax period ended October 31, 2009 and tax years ended October 31, 2010 and October 31, 2011. As of April 30, 2012, open Federal and state tax years for the Growth, Focus, Value, Total Return and Balanced Fund include the tax years ended October 31, 2009 through 2011. |
| | |
| j). | Derivatives – The Funds may invest in, or enter into, derivatives, such as options, futures contracts, options on futures contracts and swaps, for a variety of reasons, including to hedge certain risks, to provide a substitute for purchasing or selling particular securities or to increase potential income gain. Derivatives may provide a cheaper, quicker or more specifically focused way for a Fund to invest than “traditional” securities would. The main purpose of utilizing these derivative instruments is for hedging purposes. |
| | |
| | The Funds have adopted the financial accounting reporting rules as required by the Derivatives and Hedging Topic of the FASB Accounting Standards Codification (“FASB ASC”). The Funds are required to include enhanced disclosure that enables investors to understand how and why an entity uses derivatives, how derivatives are accounted for, and how derivatives instruments affect an entity’s results of operations and financial position. During the six months ended April 30, 2012, the Funds did not hold any derivative instruments. |
| | |
| k). | Events Subsequent to the Fiscal Period End – The Funds have adopted financial reporting rules regarding subsequent events which requires an entity to recognize in the financial statements the effects of all subsequent events that provide additional evidence about conditions that existed at the date of the balance sheet. Management has evaluated the Funds’ related events and transactions that occurred subsequent to April 30, 2012, through the date of issuance of the Funds’ financial statements. There were no events or transactions that occurred during this period that materially impacted the amounts or disclosures in the Fund’s financial statements. |
| l). | New Accounting Pronouncements – In April 2011, FASB issued ASU No. 2011-03 “Reconsideration of Effective Control for Repurchase Agreements”. ASU 2011-03 amends FASB ASC Topic 860, Transfers and Servicing, specifically the criteria required to determine whether a repurchase agreement (repo) and similar agreements should be accounted for as sales of financial assets or secured borrowings with commitments. ASU No. 2011-03 changes the assessment of effective control by focusing on the transferor’s contractual rights and obligations and removing the criterion to assess its ability to exercise those rights or honor those obligations. This could result in changes to the way entities account for certain transactions including repurchase agreements, mortgage dollar rolls and reverse repurchase agreements. The ASU will become effective on a prospective basis for new transfers and modifications to existing transactions as of the beginning of the first interim or annual period beginning on or after December 15, 2011. Management continues to evaluate the application of this pronouncement to the Funds, and is not in a position at this time to evaluate the significance of its impact, if any, on the Funds’ financial statements. |
| | |
| | In May 2011, the Financial Accounting Standards Board (“FASB”) issued ASU No. 2011-04 “Amendments to Achieve Common Fair Value Measurement and Disclosure Requirements” in GAAP and the International Financial Reporting Standards (“IFRSs”). ASU No. 2011-04 amends FASB ASC Topic 820, Fair Value Measurements and Disclosures, to establish common requirements for measuring fair value and for disclosing information about fair value measurements in accordance with GAAP and IFRSs. ASU No. 2011-04 is effective for fiscal years beginning after December 15, 2011 and for interim periods within those fiscal years. Management is currently evaluating the impact of these amendments and does not believe they will have a material impact on the Funds’ financial statements. |
| | |
| | In December 2011, FASB issued ASU No. 2011-11 related to disclosures about offsetting assets and liabilities. The amendments in this ASU require an entity to disclose information about offsetting and related arrangements to enable users of its financial statements to understand the effect of those arrangements on its financial position. The ASU is effective for annual reporting periods beginning on or after January 1, 2013, and interim periods within those annual periods. The guidance requires retrospective applications for all comparative periods presented. The Fund is currently evaluating the impact ASU 2011-11 will have on the financial statements disclosures. |
3). SECURITIES VALUATION
The Funds have adopted authoritative fair valuation accounting standards which establish an authoritative definition of fair value and set out a hierarchy for measuring fair value. These standards require additional disclosures about the various inputs and valuation techniques used to develop the measurements of fair value and a discussion in changes in valuation techniques and related inputs during the period. These inputs are summarized in the three broad levels listed below:
HENNESSY FUNDS 1-800-966-4354
| Level 1 – | Quoted unadjusted prices for identical instruments in active markets to which the Fund has access at the date of measurement. |
| | |
| Level 2 – | Quoted prices for similar instruments in active markets; quoted prices for identical or similar instruments in markets that are not active; and model-derived valuations in which all significant inputs and significant value drivers are observable in active markets. Level 2 inputs are those in markets for which there are few transactions, the prices are not current, little public information exists or instances where prices vary substantially over time or among brokered market makers. |
| | |
| Level 3 – | Model-derived valuations in which one or more significant inputs or significant value drivers are unobservable. Unobservable inputs are those inputs that reflect the Funds’ own assumptions that market participant’s would use to price the asset or liability based on the best available information. |
Following is a description of the valuation techniques applied to the Funds’ major categories of assets and liabilities measured at fair value on a recurring basis.
Equity Securities – Equity securities, including common stocks, preferred stocks, foreign issued common stocks, exchange traded funds, closed-end mutual funds and real estate investment trust, which are traded on a securities exchange for which a last-quoted sales price is readily available will be valued at the last sales price as reported by the primary exchange on which the securities are listed. Securities listed on the Nasdaq National Market System (“Nasdaq”) will be valued at the Nasdaq Official Closing Price, which may differ from the last sales price reported. Securities traded on a securities exchange for which a last-quoted sales price is not readily available will be valued at the mean between the bid and ask prices. To the extent these securities are actively traded and valuation adjustments are not applied, they are categorized in Level 1 of the fair value hierarchy.
The Board of Directors/Trustees of the Funds has adopted fair value pricing procedures that are followed when a price for a security is not readily available or if a significant event has occurred that indicates the closing price of a security no longer represents the true value of that security. Fair value pricing determinations are made in good faith in accordance with these procedures. There are numerous criteria that will be given consideration in determining a fair value of a security. Some of these criteria are: trading volume of security and markets, value of other like securities and news events with direct bearing to security or market. Fair value pricing results in an estimated price that reasonably reflects the current market conditions in order to rate the portfolio holdings such that shareholder transactions receive a fair net asset value. Depending on the relative significance of the valuation inputs, these securities may be classified in either Level 2 or Level 3 of the fair value hierarchy.
Mutual Funds – Investments in mutual funds are generally priced at the ending net asset value (NAV) provided by the service agent of the Funds and will be classified as Level 1 securities.
U.S. Government Securities – U.S. government securities are normally valued using a model that incorporates market observable data such as reported sales of similar securities, broker quotes, yields, bids, offers, and reference data. Certain securities are valued principally using prices furnished by a pricing service. U.S. government securities are generally categorized in Level 1 or Level 2 of the fair value hierarchy depending on the inputs used and market activity levels for specific securities.
Short-Term Securities – Short-term equity investments, including money market funds, are valued in the manner specified above. Short-term debt investments are valued at amortized cost, if their original maturity was 60 days or less, or by amortizing the values as of the 61st day prior to maturity, if their original term to maturity exceeded 60 days. Short-term securities are generally in Level 1 or Level 2 of the fair market hierarchy depending on the inputs used and market activity levels for specific securities.
The Funds have performed an analysis of all existing investments to determine the significance and character of all inputs to their fair value determination. Various inputs are used in determining the value of each Fund’s investments. The inputs or methodology used for valuing securities are not necessarily an indication of the risk associated with investing in those securities. Details related to the fair valuation hierarchy of the Funds’ securities as of April 30, 2012 are included with each Fund’s Schedule of Investments.
4). REVERSE REPURCHASE AGREEMENTS
The Total Return Fund may enter into reverse repurchase agreements with the same parties with whom it may enter into repurchase agreements. Under a reverse repurchase agreement, the Fund sells securities and agrees to repurchase them at a mutually agreed upon date and price. Under the 1940 Act, reverse repurchase agreements will be regarded as a form of borrowing by the Fund unless, at the time it enters into a reverse repurchase agreement, it establishes and maintains a segregated account with its custodian containing securities from its portfolio having a value not less than the repurchase price (including accrued interest). The Total Return Fund has established and maintained such an account for its reverse repurchase agreements. Reverse repurchase agreements involve the risk that the market value of the securities retained in lieu of sale by the Fund may decline below the price of the securities the Fund has sold but is obligated to repurchase. In the event the buyer or its trustee or receiver may receive an extension of time to determine whether to enforce the Fund’s obligation to repurchase the securities, and the Fund’s use of the proceeds of the reverse repurchase agreement may effectively be restricted pending such decision. Also, the Fund would bear the risk of loss to the extent that the proceeds of the reverse repurchase agreements are less than the value of the securities subject to such agreements.
For the six months ended April 30, 2012, the average daily balance and average interest rate in effect for reverse repurchase agreements were $20,264,687 and 0.26%, respectively. At April 30, 2012, the interest rate in effect for the outstanding reverse repurchase agreements, scheduled to mature on May 17, 2012 ($7,200,000), June 21, 2012 (4,500,000) and July 19, 2012 ($9,000,000) were
HENNESSY FUNDS 1-800-966-4354
0.22%, 0.24% and 0.22%, respectively. Outstanding reverse repurchase agreements at April 30, 2012 were equal to 29.70% of the Total Return Fund’s total net assets.
5). INVESTMENT TRANSACTIONS
Purchases and sales of investment securities (excluding government and short-term investments) during the six months ended April 30, 2012 were as follows:
| | | Growth | | | Focus 30 | | | Large Growth | | | Value | | | Total Return | | | Balanced | |
| | | Fund | | | Fund | | | Fund | | | Fund | | | Fund | | | Fund | |
| Purchases | | $ | 177,678,055 | | | $ | — | | | $ | — | | | $ | 50,806,103 | | | $ | 4,563,156 | | | $ | 2,692,508 | |
| Sales | | $ | 187,789,994 | | | $ | 37,907,688 | | | $ | 6,356,278 | | | $ | 50,460,238 | | | $ | 4,009,237 | | | $ | 1,494,659 | |
Purchases and sales/maturities of long-term U.S. Government Securities for the Balanced Fund were $0 and $700,000, respectively, for the six month period ended April 30, 2012. There were no purchases or sales/maturities of long-term U.S. Government Securities for the Growth, Focus 30, Large Growth, Value, or Total Return Funds for the six month period ended April 30, 2012.
6). INVESTMENT MANAGEMENT FEE AND OTHER TRANSACTIONS WITH AFFILIATES
Hennessy Advisors, Inc. (the “Advisor”) is the Advisor of the Funds. The Advisor provides the Funds with investment management services under a Management Agreement. The Advisor furnishes all investment advice, office space, facilities, and provides most of the personnel needed by the Funds. As compensation for its services, the Advisor is entitled to a monthly fee from each Fund. The fee is based upon the average daily net assets of the Funds at the annual rate of:
| Growth Fund | 0.74% |
| Focus 30 Fund | 0.74% |
| Large Growth Fund | 0.74% |
| Value Fund | 0.74% |
| Total Return Fund | 0.60% |
| Balanced Fund | 0.60% |
Advisor fees payable for the Growth, Focus 30, Large Growth, Value, Total Return, and Balanced Funds as of April 30, 2012 were $127,361, $86,973, $48,308, $74,795, $33,705, and $11,409, respectively.
The Advisor has agreed to waive its fees and absorb expenses to the extent that the total annual operating expenses (excluding all Federal, state and local taxes, interest, brokerage commissions, acquired fund fees and expenses and other costs incurred in connection with the purchase and sale of securities and extraordinary items) do not exceed 0.98% of the Funds’ net assets for the Institutional Class shares in the Growth, Focus 30, Large Growth and Value Funds. The expense limitation agreement for the Institutional Class shares can only be terminated by the Board of Directors/Trustees. For a period of three years after the year in which the Advisor waives or reimburses expenses, the Advisor may seek reimbursement from the Funds to the extent that total annual Fund operating expenses are less than the expense limitation in effect at the time of the reimbursement.
The Advisor previously contractually agreed to limit the expenses of certain Funds. These agreements have since either expired or have been terminated by the Board of Directors/Trustees. However, for a period of three years after the
year in which the Advisor waives or reimburses expenses, the Advisor may seek reimbursement from the Fund to the extent that total annual fund operating expenses are less than the expense limitation in effect at the time of the waiver or reimbursement.
As of April 30, 2012, cumulative expenses subject to potential recovery to the aforementioned conditions and year of expiration are as follows:
| | | Oct. 31, 2012 | | | Oct. 31, 2013 | | | Oct. 31, 2014 | | | Apr. 30, 2015 | | | Total | |
| Growth Fund – Institutional Class | | $ | 6,062 | | | $ | — | | | $ | — | | | $ | — | | | $ | 6,062 | |
| Focus 30 Fund – Institutional Class | | $ | 43,673 | | | $ | — | | | $ | — | | | $ | — | | | $ | 43,673 | |
| Large Growth Fund – Institutional Class | | $ | 5 | | | $ | — | | | $ | — | | | $ | — | | | $ | 5 | |
| Value Fund – Institutional Class | | $ | 1,298 | | | $ | — | | | $ | — | | | $ | — | | | $ | 1,298 | |
The Board of Directors/Trustees has approved a Shareholder Servicing Plan for the Original Class shares of each of the Funds which was instituted to compensate the Advisor for the non-investment management services it provides to the Funds. The Plan provides for a monthly fee paid to the Advisor at an annual rate of 0.10% of the average daily net assets of the Funds.
Service fees payable for the Growth, Focus 30, Large Growth, Value, Total Return, and Balanced Funds as of April 30, 2012 were $16,993, $9,880, $6,515, $9,969, $5,618, and $1,902, respectively.
The Growth, Focus 30, Large Growth and Value Funds have entered into agreements with various brokers, dealers and financial intermediaries in connection with the sale of shares of the Funds. The agreements provide for periodic payments by the Funds to the brokers, dealers and financial intermediaries for providing certain shareholder maintenance services (sub-transfer agent expenses). These shareholder services include: the pre-processing and quality control of new accounts, shareholder correspondence, answering customer inquiries regarding account status and facilitating shareholder telephone transactions. Fees paid by the Growth, Focus 30, Large Growth and Value Fund to various brokers, dealers and financial intermediaries for the six months ended April 30, 2012, were $147,945, $125,801, $12,043 and $37,957, respectively.
The Total Return and Balanced Funds have adopted a plan pursuant to Rule 12b-1 which authorizes payments in connection with the distribution of the Total Return and Balanced Fund shares at an annual rate not to exceed 0.15% of each Fund’s average daily net assets. Amounts paid under the Plan may be spent on any activities or expenses primarily intended to result in the sale of shares, including but not limited to, advertising, compensation for sales and marketing activities or financial institutions and others such as dealers and distributors, shareholder account servicing, the printing and mailing of prospectuses to other than current shareowners and the printing and mailing of sales literature.
U.S. Bancorp Fund Services, LLC (the “Administrator”) acts as the Funds’ Administrator under an Administration Agreement. Administrative services under this agreement include custody, distribution, fund accounting, fund administration and transfer agent services. In addition, the Administrator prepares various federal and state regulatory filings, reports and returns for the Funds; prepares reports and materials to be supplied to the directors; monitors the activities of the Funds’ custodian, transfer agent and accountants; coordinates the preparation and payment of the Funds’ expenses and reviews the Funds’ expense accruals. Fees
HENNESSY FUNDS 1-800-966-4354
paid to U.S. Bancorp Fund Services, LLC for the six months ended April 30, 2012, were $243,229, $190,595, $99,296, $153,222, $86,154 and $25,862 for Growth, Focus 30, Large Growth, Value, Total Return and Balanced Funds, respectively. The Administrator has voluntarily waived all or a portion of its administration fees allocated to the Institutional Class shares of the Growth Fund, Focus 30 Fund, Large Growth and Value Fund. The administration fees voluntarily waived by the Administrator during the six months ended April 30, 2012 were $1,575, $19,675, $110 and $918, respectively.
Quasar Distributors, LLC (the “Distributor”) acts as the Funds’ principal underwriter in a continuous public offering of the Funds’ shares. The Distributor is an affiliated company of U.S. Bank, N.A.
7). LINE OF CREDIT
The Growth, Focus 30, and Value Funds have $40,000,000, $25,000,000 and $10,000,000 lines of credit, respectively, intended to provide short-term financing, if necessary, subject to certain restrictions, in connection with shareholder redemptions. The credit facility is with its custodian bank, U.S. Bank, N.A. Borrowings under this arrangement bear interest at the bank’s prime rate. During the six months ended April 30, 2012, the Growth and Value Funds had no line of credit activity. During the six months ended April 30, 2012, the Focus 30 Fund had an outstanding average daily balance and a weighted average interest rate of $177,170 and 3.25%, respectively. The maximum amount outstanding for the Focus 30 Fund during the period was $5,498,000.
8). FEDERAL TAX INFORMATION
As of October 31, 2011, the Funds most recent fiscal year end, the components of accumulated earnings (losses) for income tax purposes were as follows:
| | | | | | | | | Large | |
| | | Growth | | | Focus 30 | | | Growth | |
| | | Fund | | | Fund | | | Fund | |
| Cost of investments for tax purposes | | $ | 203,767,572 | | | $ | 167,113,847 | | | $ | 79,516,812 | |
| Gross tax unrealized appreciation | | | 19,602,977 | | | | 4,725,071 | | | | 6,865,675 | |
| Gross tax unrealized depreciation | | | (35,823,319 | ) | | | (1,641,452 | ) | | | (8,246,007 | ) |
| Net tax unrealized | | | | | | | | | | | | |
| appreciation (depreciation) | | $ | (16,220,342 | ) | | $ | 3,083,619 | | | $ | (1,380,332 | ) |
| Undistributed ordinary income | | $ | — | | | $ | — | | | $ | 559,148 | |
| Undistributed long-term capital gains | | | — | | | | — | | | | 15,375,933 | |
| Total distributable earnings | | $ | — | | | $ | — | | | $ | 15,935,081 | |
| Other accumulated gains/(loss) | | $ | (245,266,479 | ) | | $ | (43,585,773 | ) | | $ | — | |
| Total accumulated earnings/(loss) | | $ | (261,486,821 | ) | | $ | (40,502,154 | ) | | $ | 14,554,749 | |
| | | | | | Total | | | | |
| | | Value | | | Return | | | Balanced | |
| | | Fund | | | Fund | | | Fund | |
| Cost of investments for tax purposes | | $ | 107,366,724 | | | $ | 77,141,489 | | | $ | 17,362,733 | |
| Gross tax unrealized appreciation | | | 15,529,521 | | | | 6,362,263 | | | | 986,813 | |
| Gross tax unrealized depreciation | | | (5,513,002 | ) | | | (1,486,990 | ) | | | (289,426 | ) |
| Net tax unrealized | | | | | | | | | | | | |
| appreciation (depreciation) | | $ | 10,016,519 | | | $ | 4,875,273 | | | $ | 697,387 | |
| Undistributed ordinary income | | $ | 3,329,870 | | | $ | 74,649 | | | $ | 6,275 | |
| Undistributed long-term capital gains | | | — | | | | — | | | | — | |
| Total distributable earnings | | $ | 3,329,870 | | | $ | 74,649 | | | $ | 6,275 | |
| Other accumulated gains/(loss) | | $ | (46,714,841 | ) | | $ | (10,329,856 | ) | | $ | (1,736,101 | ) |
| Total accumulated earnings/(loss) | | $ | (33,368,452 | ) | | $ | (5,379,934 | ) | | $ | (1,032,439 | ) |
The difference between book-basis and tax-basis unrealized appreciation is attributable primarily to wash sales and partnership adjustments.
At October 31, 2011, the Growth Fund had tax basis capital losses of $245,266,479, to offset future capital gains. Of such losses, $1,008,985 expire October 31, 2012, $1,008,985 expire October 31, 2013, $1,008,985 expire October 31, 2014, $1,008,985 expire October 31, 2015, $63,120,201 expire October 31, 2016 and $178,110,338 expire October 31, 2017.
At October 31, 2011, the Focus 30 Fund had tax basis capital losses of $43,585,773, to offset future capital gains. Of such losses, $2,450,635 expire October 31, 2016 and $41,135,138 expire October 31, 2017.
At October 31, 2011, the Large Growth Fund had no tax basis capital losses to offset future capital gains.
At October 31, 2011, the Value Fund had tax basis capital losses of $46,714,841, to offset future capital gains. The losses expire on October 31, 2017.
At October 31, 2011, the Total Return Fund had tax basis capital losses of $10,329,856, to offset future capital gains. The losses expire on October 31, 2017.
At October 31, 2011, the Balanced Fund had tax basis capital losses of $1,736,101, to offset future capital gains. The losses expire on October 31, 2017.
The tax character of distributions paid during 2012 and 2011 for the Funds were as follows:
| | | Six Months Ended | | | | |
| | | April 30, 2012 | | | Year Ended | |
| Growth Fund | | (Unaudited) | | | October 31, 2011 | |
| Ordinary Income | | $ | — | | | $ | — | |
| Long-term capital gain | | | — | | | | — | |
| | | $ | — | | | $ | — | |
HENNESSY FUNDS 1-800-966-4354
| | | Six Months Ended | | | | |
| | | April 30, 2012 | | | Year Ended | |
| Focus 30 Fund | | (Unaudited) | | | October 31, 2011 | |
| Ordinary Income | | $ | — | | | $ | — | |
| Long-term capital gain | | | — | | | | — | |
| | | $ | — | | | $ | — | |
| | | | | | | | |
| | | Six Months Ended | | | | | |
| | | April 30, 2012 | | | Year Ended | |
| Large Growth Fund | | (Unaudited) | | | October 31, 2011 | |
| Ordinary Income | | $ | 559,138 | | | $ | 627,807 | |
| Long-term capital gain | | | 15,375,965 | | | | 109,248 | |
| | | $ | 15,935,113 | | | $ | 737,055 | |
| | | | | | | �� | |
| | | Six Months Ended | | | | | |
| | | April 30, 2012 | | | Year Ended | |
| Value Fund | | (Unaudited) | | | October 31, 2011 | |
| Ordinary Income | | $ | 3,834,285 | | | $ | 4,283,374 | |
| Long-term capital gain | | | — | | | | — | |
| | | $ | 3,834,285 | | | $ | 4,283,374 | |
| | | | | | | | |
| | | Six Months Ended | | | | | |
| | | April 30, 2012 | | | Year Ended | |
| Total Return Fund | | (Unaudited) | | | October 31, 2011 | |
| Ordinary Income | | $ | 523,930 | | | $ | 1,003,505 | |
| Long-term capital gain | | | — | | | | — | |
| | | $ | 523,930 | | | $ | 1,003,505 | |
| | | | | | | | |
| | | Six Months Ended | | | | | |
| | | April 30, 2012 | | | Year Ended | |
| Balanced Fund | | (Unaudited) | | | October 31, 2011 | |
| Ordinary Income | | $ | 44,552 | | | $ | 55,526 | |
| Long-term capital gain | | | — | | | | — | |
| | | $ | 44,552 | | | $ | 55,526 | |
9). FUND ACQUISITION
On August 31, 2011, the Board of Directors/Trustees of the Corporation and the Trust approved and declared advisable the acquisition of the Hennessy Cornerstone Growth Fund, Series II (“Growth II Fund”) by the Hennessy Cornerstone Growth Fund (“Growth Fund”). The purpose of the acquisition was to combine two funds managed by Hennessy Advisors, Inc. with comparable investment objectives and strategies. The acquisition provided for the transfer of assets of the Growth II Fund to the Growth Fund and the assumption of the liabilities of the Growth II Fund by the Growth Fund. Following the acquisition, the Growth Fund held the assets of the Growth Fund II that it acquired until the Growth Fund rebalanced its portfolio in the winter, pursuant to its customary procedures. For financial reporting purposes, assets received and shares issued by the Growth Fund were recorded at fair value; however, the cost basis of the investments received from the Growth II Fund was carried forward to align ongoing reporting of the Growth Fund’s realized and unrealized gains and losses with amounts distributable to shareholders for tax purposes.
The acquisition was effective as of the close of business on October 28, 2011. The following table illustrates the specifics of the acquisition:
| | | Shares issued to | | | | |
| | Growth II Fund | Shareholders of | Growth Fund | Combined | Tax Status | |
| | Net Assets | Growth II Fund | Net Assets | Net Assets | of Transfer | |
| | $26,164,811(1) | 2,557,259 | $166,323,192 | $192,488,003 | Non-taxable | |
| (1) | Includes accumulated realized losses and unrealized depreciation in the amounts of ($47,367,221) and ($1,807,380) respectively. |
Assuming the acquisition had been completed on November 1, 2010, the beginning of the annual reporting period of the Growth Fund, the Growth Fund’s pro forma of operations (unaudited) for the year ended October 31, 2011, are as follows:
| Net investment loss | | $ | (1,610,798 | ) |
| Net realized gain on investments | | $ | 46,803,124 | |
| Change in unrealized depreciation on investments | | $ | (45,923,349 | ) |
| Net decrease in net assets resulting from operations | | $ | (731,023 | ) |
Because the combined investment portfolios have been managed as a single integrated portfolio since the acquisition was completed, it is not practicable to separate the amounts of revenue and earnings of the Growth II Fund that have been included in the Growth Fund’s statement of operations since October 28, 2011.
HENNESSY FUNDS 1-800-966-4354
April 30, 2012 (Unaudited)
As a shareholder of the Funds, you incur two types of costs: (1) transaction costs, including sales charges (loads) on purchase payments, reinvested dividends, or other distributions; redemption fees; and exchange fees; and (2) ongoing costs, including management fees; service fees; and other Fund expenses. This Example is intended to help you understand your ongoing costs (in dollars) of investing in each of the Funds and to compare these costs with the ongoing costs of investing in other mutual funds. The Example is based on an investment of $1,000 invested at the beginning of the period and held for the entire period from November 1, 2011 through April 30, 2012.
Actual Expenses
The first set of lines of the table below provide information about actual account values and actual expenses. Although the Funds charge no sales loads or transaction fees, you will be assessed fees for outgoing wire transfers, returned checks and stop payment orders at prevailing rates charged by U.S. Bancorp Fund Services, LLC, the Funds’ transfer agent. If you request that a redemption be made by wire transfer, currently a $15.00 fee is charged by the Funds’ transfer agent. IRA accounts will be charged a $15.00 annual maintenance fee. The example below includes, but is not limited to, management fees, shareholder servicing fees, fund accounting, custody and transfer agent fees. However, the example below does not include portfolio trading commissions and related expenses, and other extraordinary expenses as determined under generally accepted accounting principles. You may use the information within these lines, together with the amount you invested, to estimate the expenses that you paid over the six-month period. Simply divide your account value by $1,000 (for example, an $8,600 account value divided by $1,000 = 8.6), then multiply the result by the number in the first line under the heading entitled “Expenses Paid During Period” to estimate the expenses you paid on your account during this period.
Hypothetical Example for Comparison Purposes
The second set of lines within the table below provide information about hypothetical account values and hypothetical expenses based on the Funds’ actual expense ratios and an assumed rate of return of 5% per year before expenses, which is not the Funds’ actual return. The hypothetical account values and expenses may not be used to estimate the actual ending account balance or expenses you paid for the period. You may use this information to compare the ongoing costs of investing in the Funds and other funds. To do so, compare this 5% hypothetical example with the 5% hypothetical examples that appear in the shareholder reports of the other funds. Please note that the expenses shown in the table are meant to highlight your ongoing costs only and do not reflect any transactional costs, such as sales charges (loads), or exchange fees. Therefore, the second line of the table is useful in comparing ongoing costs only, and will not help you determine the relative total costs of owning different funds. In addition, if these transactional costs were included, your costs would have been higher.
| | | Beginning | | | Ending | | | Expenses Paid | |
| | | Account Value | | | Account Value | | | During Period(1) | |
| Original Class | | 11/1/11 | | | 4/30/12 | | | 11/1/11 – 4/30/12 | |
| | | | | | | | | | |
| Actual | | | | | | | | | |
| Growth Fund – Original Class | | $ | 1,000.00 | | | $ | 1,185.60 | | | $ | 7.28 | |
| Focus 30 Fund – Original Class | | $ | 1,000.00 | | | $ | 1,125.10 | | | $ | 7.29 | |
| Large Growth Fund – Original Class | | $ | 1,000.00 | | | $ | 1,106.60 | | | $ | 6.60 | |
| Value Fund – Original Class | | $ | 1,000.00 | | | $ | 1,088.40 | | | $ | 6.59 | |
| Total Return Fund – Original Class | | $ | 1,000.00 | | | $ | 1,086.70 | | | $ | 6.85 | |
| Balanced Fund – Original Class | | $ | 1,000.00 | | | $ | 1,053.50 | | | $ | 7.35 | |
| | | | | | | | | | | | | |
| Hypothetical (5% return | | | | | | | | | | | | |
| before expenses) | | | | | | | | | | | | |
| Growth Fund – Original Class | | $ | 1,000.00 | | | $ | 1,018.20 | | | $ | 6.72 | |
| Focus 30 Fund – Original Class | | $ | 1,000.00 | | | $ | 1,018.00 | | | $ | 6.92 | |
| Large Growth Fund – Original Class | | $ | 1,000.00 | | | $ | 1,018.60 | | | $ | 6.32 | |
| Value Fund – Original Class | | $ | 1,000.00 | | | $ | 1,018.55 | | | $ | 6.37 | |
| Total Return Fund – Original Class | | $ | 1,000.00 | | | $ | 1,018.30 | | | $ | 6.62 | |
| Balanced Fund – Original Class | | $ | 1,000.00 | | | $ | 1,017.70 | | | $ | 7.22 | |
| (1) | Expenses are equal to the Growth Fund’s expense ratio of 1.34%, the Focus 30 Fund’s expense ratio of 1.38%, the Large Growth Fund’s expense ratio of 1.26%, the Value Fund’s expense ratio of 1.27%, the Total Return Fund’s expense ratio of 1.32%, and the Balanced Fund’s expense ratio of 1.44%, multiplied by the average account value over the period, multiplied by 182/366 days (to reflect one-half year period). |
| | | Beginning | | | Ending | | | Expenses Paid | |
| | | Account Value | | | Account Value | | | During Period(2) | |
| Institutional Class | | 11/1/11 | | | 4/30/12 | | | 11/1/11 – 4/30/12 | |
| | | | | | | | | | |
| Actual | | | | | | | | | |
| Growth Fund – Institutional Class | | $ | 1,000.00 | | | $ | 1,188.30 | | | $ | 5.33 | |
| Focus 30 Fund – Institutional Class | | $ | 1,000.00 | | | $ | 1,127.40 | | | $ | 5.18 | |
| Large Growth Fund – Institutional Class | | $ | 1,000.00 | | | $ | 1,108.50 | | | $ | 5.14 | |
| Value Fund – Institutional Class | | $ | 1,000.00 | | | $ | 1,090.20 | | | $ | 5.09 | |
| | | | | | | | | | | | | |
| Hypothetical (5% return | | | | | | | | | | | | |
| before expenses) | | | | | | | | | | | | |
| Growth Fund – Institutional Class | | $ | 1,000.00 | | | $ | 1,019.99 | | | $ | 4.92 | |
| Focus 30 Fund – Institutional Class | | $ | 1,000.00 | | | $ | 1,019.99 | | | $ | 4.92 | |
| Large Growth Fund – Institutional Class | | $ | 1,000.00 | | | $ | 1,019.99 | | | $ | 4.92 | |
| Value Fund – Institutional Class | | $ | 1,000.00 | | | $ | 1,019.99 | | | $ | 4.92 | |
| (2) | Expenses are equal to the Growth, Focus 30, Large Growth and Value Fund’s expense ratio of 0.98%, multiplied by the average account value over the period, multiplied by 182/366 days (to reflect one-half year period). |
HENNESSY FUNDS 1-800-966-4354
How to Obtain a Copy of the Funds’ Proxy Voting Policy and Proxy Voting Records
A description of the policies and procedures that the Funds use to determine how to vote proxies relating to portfolio securities is available without charge: (1) by calling 1-800-966-4354; (2) on the Hennessy Funds website at www.hennessyfunds.com; or (3) on the U.S. Securities and Exchange Commission’s website at www.sec.gov. Hennessy Funds’ proxy voting record is available on the SEC’s website at www.sec.gov no later than August 31 for the prior 12 months ending June 30.
Quarterly Filings on Form N-Q
The Funds file their complete schedule of portfolio holdings with the SEC for the first and third quarters of each fiscal year on Form N-Q. The Funds’ Form N-Q will be available on the SEC’s website at www.sec.gov. The Funds’ Form N-Q may be reviewed and copied at the SEC’s Public Reference Room in Washington, DC and information on the operation of the Public Reference Room may be obtained by calling 1-800-SEC-0330. Information included in the Funds’ N-Q will also be available upon request by calling 1-800-966-4354.
Directors and Officers
The Funds’ Statement of Additional Information includes additional information about the Funds’ Directors and Officers and is available, without charge, upon request by calling 1-800-966-4354 or by visiting the Hennessy Funds website at www.hennessyfunds.com.
Federal Tax Distribution Information (Unaudited)
The Large Growth, Value, Total Return and Balanced Fund designated 100%, 100%, 100% and 100%, respectively, of the dividend declared from net investment income during the year ended October 31, 2011, as qualified dividend income under the Jobs Growth and Tax Reconciliation Act of 2003.
For the year ended October 31, 2011, 100%, 98.20%, 100% and 100% of the ordinary income distributions paid by the Large Growth, Value, Total Return and Balanced Funds, respectively, qualify for the dividends received deduction available to corporate shareholders. A portion of the dividend income received by the Value Fund was from American Depositary Receipts which does not qualify for the dividend received deduction available to corporate shareholders.
Householding
To help keep the Funds’ costs as low as possible, we generally deliver a single copy of most financial reports and prospectuses to shareholders who share an address, even if the accounts are registered under different names. This process, known as “householding,” does not apply to account statements. You may, of course, request an individual copy of a prospectus or financial report at any time. If you would like to receive separate mailings, please call the Transfer Agent at 1-800-261-6950 or 1-414-765-4124 and we will begin individual delivery within 30 days of your request. If your account is held through a financial institution or other intermediary, please contact them directly to request individual delivery.
HENNESSY FUNDS 1-800-966-4354
Board Approval of Continuation of Investment Advisory Agreement
At its meeting on March 7, 2012, the Board of Directors (the “Board”) of the Hennessy Funds, Inc. (the “Company”) and its two series, the Hennessy Balanced Fund (the “Balanced Fund”) and the Hennessy Total Return Fund (the “Total Return Fund”) (each a “Fund” or collectively the “Funds”), the Hennessy Mutual Funds, Inc. (the “Company”) and its three series, the Hennessy Cornerstone Growth Fund (the “Growth Fund”), the Hennessy Cornerstone Value Fund (the “Value Fund”), and the Hennessy Focus 30 Fund (the “Focus 30 Fund”), the Hennessy Funds Trust (the “Company”) which includes the Hennessy Cornerstone Large Growth Fund (the “Large Growth Fund”), and the Hennessy Select Large Value Fund (the “Large Value Fund”), and the Hennessy SPARX Funds Trust (the “Company”) and its two series, the Hennessy Select SPARX Japan Fund (the “Japan Fund”) and the Hennessy Select SPARX Japan Smaller Companies Fund (the “Japan Smaller Companies Fund”) or collectively with the Growth, Value, Focus 30, Total Return, Balanced, Large Value and Large Growth funds (the “Funds”), or collectively with the Hennessy Funds, Inc., and the Hennessy Mutual Funds, Inc., and the Hennessy Funds Trust (the “Companies”), including the Directors who are not “interested persons” (as defined in the Investment Company Act of 1940) of the Funds’ voted to re-approve the current investment advisory agreement for the Funds. The Board reviewed and discussed the specific services provided by the Advisor. The Advisor:
• Provide formula driven investment management for the Hennessy Total Return and Balanced Funds; and the Hennessy Cornerstone Growth, Focus 30, Value and Large Growth Funds. Hennessy Advisors, Inc. holds the patent rights to the formulas used for the Cornerstone Growth and Value Funds. In providing investment management, Hennessy Advisors, Inc. will direct and oversee the trading of securities within and the rebalancing of the portfolios of the Funds.
• Provide oversight of the sub-advisors for the Hennessy Select Large Value, Hennessy Select SPARX Japan, and Hennessy Select SPARX Japan Smaller Companies Funds.
• Pay the incentive compensation of the Funds’ Chief Compliance Officer.
• Provide responsive customer and shareholder servicing which consists of providing a call center to respond to shareholder inquiries, including specific mutual fund account information. Shareholders can contact Hennessy Advisors, Inc. directly during office hours. The firm endeavors to answer all calls in person within two rings of the telephone.
• Oversee distribution of the Funds through third-party broker/dealers and independent financial institutions such as Charles Schwab, Inc., Fidelity, TD Waterhouse and Pershing. Hennessy Advisors participates in “no transaction fee” (“NTF”) programs with these companies, which allows customers to purchase the Hennessy Funds through third party distribution channels without paying a transaction fee. Hennessy Advisors compensates these third party distributors under a pre-determined contractual agreement.
• Oversee those third party service providers that support the Funds in providing fund accounting, fund administration, fund distribution, transfer agency and custodial services.
Hennessy Advisors, Inc. provides its services to the Hennessy Funds, Inc.; the Hennessy Mutual Funds, Inc.; the Hennessy Funds Trust, and the Hennessy SPARX Funds Trust. The firm also operates a small Limited Liability Company designed for highly qualified investors. Services are provided to no other clients. The firm does not offer investment advice to individual persons or entities other than the mutual funds it manages.
The Board also: (i) compared the performance of each Fund to benchmark indices over various periods of time and concluded that the performance of each Fund warranted the continuation of the Advisory Agreement; (ii) compared the expense ratios of funds similar in asset size and investment objective to each of the Funds and concluded the actual or projected expenses of each Fund were reasonable and warranted continuation of the Advisory Agreement; (iii) considered the fees charged by Hennessy Advisors, Inc. to those of funds similar in asset size and investment objective to each of the Funds and concluded the advisory fees of each Fund were reasonable and warranted continuation of the Advisory Agreement; (iv) considered the profitability of Hennessy Advisors, Inc. with respect to each Fund and the profitability of the Sub-Advisors with respect to the Select Series Funds and concluded the profits were reasonable and not excessive when compared to profitability guidelines set forth in relevant court cases; and (v) considered the high level of professionalism and knowledge, along with an extremely low level of turnover, of the employees of the Advisor.
The Board then discussed economies of scale and breakpoints and determined that the Funds managed by Hennessy Advisors, Inc. have not yet grown in size, nor has their marketplace demonstrated significantly rapid potential growth to any extent that would warrant the use of breakpoints. The Board took into consideration the profitability of Hennessy Advisors, Inc. and the advisory fees of comparable mutual funds.
The Board reviewed the Funds’ expense ratios and comparable expense ratios for funds like the nine funds being considered for contract renewal by Hennessy Advisors, Inc. The Board used data from Lipper as presented in the charts in the Board Materials showing funds similar in nature to the Hennessy Funds (Mid-Cap Blend, Small Cap Blend, etc.). The Board determined that the expense ratios of the Funds fall within the range of the ratios of other funds in their classification. The Board also referenced the Advisor’s Form ADV and copies of the current Investment Advisory Agreements. All of the factors above were considered separately by the non-interested Directors in an executive session during which management of the Advisor was not present. The factors were viewed in their totality by the Board, with no single factor being the principal or determinative factor in the Board’s determination of whether to approve the continuation of the Advisory Agreements. The Board was also assisted in its review, consideration and discussion of the Advisory Agreements by a memorandum prepared by legal counsel that summarized the Board’s obligations. Based on the factors discussed above, the Board, including all Independent Directors, recommended continuation of the Advisory Agreements.
HENNESSY FUNDS 1-800-966-4354
(This Page Intentionally Left Blank.)
For information, questions
or assistance, please call
The Hennessy Funds
1-800-966-4354 or 1-415-899-1555
INVESTMENT ADVISOR
Hennessy Advisors, Inc.
7250 Redwood Blvd., Suite 200
Novato, California 94945
ADMINISTRATOR, TRANSFER
AGENT, DIVIDEND PAYING
AGENT & SHAREHOLDER
SERVICING AGENT
U.S. Bancorp Fund Services, LLC
P.O. Box 701
Milwaukee, Wisconsin 53201-0701
CUSTODIAN
U.S. Bank N.A.
Custody Operations
1555 North River Center Dr., Suite 302
Milwaukee, Wisconsin 53212
DIRECTORS/TRUSTEES
Neil J. Hennessy
Robert T. Doyle
J. Dennis DeSousa
Gerald P. Richardson
COUNSEL
Foley & Lardner LLP
777 East Wisconsin Avenue
Milwaukee, Wisconsin 53202-5306
INDEPENDENT REGISTERED
PUBLIC ACCOUNTING FIRM
KPMG LLP
777 East Wisconsin Avenue
Milwaukee, Wisconsin 53202-5306
DISTRIBUTOR
Quasar Distributors, LLC
615 East Michigan Street
Milwaukee, Wisconsin 53202
WWW.HENNESSYFUNDS.COM
This report has been prepared for shareholders and may be distributed
to others only if preceded or accompanied by a current prospectus.
HENNESSY FUNDS
SEMI-ANNUAL REPORT
APRIL 30, 2012
Hennessy Select Large Value Fund
Hennessy Select SPARX Japan Fund
Hennessy Select SPARX Japan Smaller Companies Fund
Contents
| Letter to shareholders | 1 |
| Performance overview (unaudited) | |
| Hennessy Select Large Value Fund | 4 |
| Hennessy Select SPARX Japan Fund | 6 |
| Hennessy Select SPARX Japan Smaller Companies Fund | 8 |
| Financial statements | |
| Schedules of investments | |
| Hennessy Select Large Value Fund | 10 |
| Hennessy Select SPARX Japan Fund | 15 |
| Hennessy Select SPARX Japan Smaller Companies Fund | 19 |
| Statements of assets and liabilities | 24 |
| Statements of operations | 26 |
| Statements of changes in net assets | 28 |
| Financial highlights | |
| Hennessy Select Large Value Fund | 30 |
| Hennessy Select SPARX Japan Fund | 34 |
| Hennessy Select SPARX Japan Smaller Companies Fund | 38 |
| Notes to the financial statements | 40 |
| Expense example | 49 |
| Proxy voting policy | 51 |
| Quarterly Filings on Form N-Q | 51 |
| Directors and Officers | 51 |
| Federal Tax Distribution Information | 51 |
| Householding | 52 |
| Board approval of continuation | |
| of investment advisory agreement | 53 |
LETTER TO SHAREHOLDERS
June, 2012
Dear Hennessy Funds Shareholder:
The more things change, the more they stay the same. When I last wrote to you, I described two themes that were dominating the investing atmosphere: low consumer confidence with a perception that the financial markets were in a free fall and a crisis of clarity from Washington on issues such as taxes, healthcare, and regulation. Those themes are still in play. Although consumer confidence is on the rise, we still have no real clarity on many of the major issues facing our economy. Add those dynamics to a Presidential Election year and that can equal emotional turmoil for the markets. I have stated for the record that I believe the markets will experience moderate growth this year, in the range of 8-12%, and even with the hurdles of investor perception, lack of clarity, and all the noise generated by an election year, I stand by that prediction.
In February, I wrote a commentary suggesting that the U.S. economy was in the midst of a recovery, and I still believe that is true. Americans continue to be adaptable and resilient. We listen to the financial news and worry about our home values, pension cuts, and employment figures, but we keep pulling ourselves up by our bootstraps and persevering. And, U.S. corporations are persevering, too. Even with global turmoil and no clear direction on whether our government supports “business” or not, U.S. corporations are doing well. They’ve trimmed costs, closed unprofitable business lines, saved bundles of cash and now many are even bringing their manufacturing back to the U.S. By doing all of these things, I believe we have avoided a depression, and are instead experiencing a slow, but steady, recovery.
Don’t just take my word for it. Many CEOs across the country are optimistic as well. In its April issue, the headline of The Conference Board’s* newsletter read, “CEO Confidence Increases.” The Conference Board Measure of CEO Confidence™, which had improved in the fourth quarter of last year, increased further in the first quarter of 2012. The Measure now reads 63, up from 49 last quarter. Corporations have been hoarding cash, and once these executives, who are optimistic about growth prospects and our economy, receive clear guidelines on tax rates, healthcare, and regulation, I strongly believe that they will put their cash to work and begin to hire in the later part of 2012. That is exactly what we need to get this economy moving.
*The Conference Board is a global, independent business membership and research association working in the public interest.
HENNESSY FUNDS 1-800-966-4354
For the six months ended April 30, 2012 the Dow Jones Industrial Average returned 12.04% while the S&P 500 Index earned 12.77%. Those are strong six months numbers. We saw solid performance across a wide range of asset classes and sectors, which signals to me that is strength throughout the market, not just in pockets. Strong U.S. economic numbers along with the Bank of Japan’s easing of monetary policy, which resulted in a weakening of the Yen, helped drive positive performance in the Japanese market during the period, with the TOPIX returning 3.13% and the Nikkei 225 returning 3.68%. We just need investor perception to catch up with the reality of strong market fundamentals. Once investors embrace the idea of consistent but moderate performance and return to utilizing basic fundamentals, I do believe they will return to investing in equities.
I want cooler heads to prevail. I want Washington to provide us with straightforward leadership and to give us all clear direction on the issues I have outlined. But even just giving us clarity on the fate of the Bush Tax Cuts would show every investor that there are level heads and that we have leaders among our government officials. As long-term, conservative and disciplined investors, we need to know what treatment our capital gains and dividends will receive. We need leadership that will make the tough decisions to move our nation and our economy forward.
What can we look forward to in the last six months of our fiscal year? I predict there will be a lot of debate, rhetoric, and posturing from Washington. I also believe that corporate leaders in America will continue to work hard to provide value and moderate returns to their shareholders, while waiting out the results of the election and hoping for clarity from Washington. And global business leaders will likewise continue to forge ahead with an eye to events as they unfold in the U.S. as well as in Europe.
We will also continue to work hard to provide value and returns to each of our shareholders. At Hennessy Funds, we serve our shareholders directly, so that we can provide answers to shareholder questions and concerns, so please don’t hesitate to contact us at (800) 966-4354.
Best regards,
Neil J. Hennessy
Portfolio Manager & Chief Investment Officer
Past performance does not guarantee future results.
Mutual fund investing involves risk. Principal loss is possible.
Opinions expressed are those of Neil Hennessy and are subject to change, are not guaranteed and should not be considered investment advice.
The Dow Jones Industrial Average and the S&P 500 are unmanaged indices of common stocks comprised of major industrial companies and assume reinvestment of dividends. The Tokyo Stock Price Index (TOPIX) is a market capitalization-weighted index of all companies listed on the First Section of the Tokyo Stock Exchange. The Nikkei 225 is a stock market index for the Tokyo Stock Exchange (TSE). The Nikkei 225 and TOPIX indices are presented in U.S. Dollar terms and take into account reinvestment of dividends.
You cannot invest directly in an index.
HENNESSY FUNDS 1-800-966-4354
Hennessy Select Large Value Fund
Original Class Shares (HSVFX)
AVERAGE ANNUAL TOTAL RETURN PERIODS ENDED APRIL 30, 2012
| | Six | One | Five | Ten | Since Inception |
| | Months | Year | Years | Years | (9/30/84) |
| Hennessy Select Large Value | | | | | |
| Fund – Original Class | 13.07% | 2.86% | -1.31% | 2.65% | 9.58% |
| Russell 1000 Value Index | 11.62% | 1.03% | -1.73% | 4.83% | 10.90% |
| S&P 500 Index | 12.77% | 4.76% | 1.01% | 4.71% | 10.67% |
Gross expense ratio: 1.38%.
Performance data quoted represents past performance; past performance does not guarantee future results. The performance for periods prior to March 20, 2009 reflects the performance of the Tamarack Value Fund, the predecessor to the Hennessy Select Large Value Fund. The investment return and principal value of an investment will fluctuate so that an investor’s shares, when redeemed, may be worth more or less than their original cost. Current performance of the Fund may be lower or higher than the performance quoted. Performance data current to the most recent month end may be obtained by visiting www.hennessyfunds.com. The gross expense ratio presented is that from the most recent prospectus.
PERFORMANCE NARRATIVE FROM RBC GLOBAL
ASSET MANAGEMENT (U.S.) INC., SUB-ADVISOR
The Hennessy Select Large Value Fund returned 13.07% for the six-month period ending April 30, 2012, outperforming its benchmark, the Russell 1000 Value Index, which returned 11.62%, and the S&P 500 Index, which returned 12.77% for the same period. The Fund’s outperformance was the result of stock selection across a number of sectors, led by the Consumer Discretionary, Consumer Staples and Materials sectors. Conversely, stock selection in the Healthcare and Energy Sectors detracted from performance. The top contributing stock in the portfolio, Solutia, Inc., which gained 69%, was the beneficiary of a takeout by Eastman Chemical. Other top performing stocks for the period include Consumer Discretionary holdings Wyndham Worldwide Corp., which returned 51%, and Home Depot, which returned 46%. The two weakest performing stocks in the portfolio come from our two weakest performing sectors, Energy and Healthcare. Baker Hughes, Inc. was the biggest detractor for the time period, losing -16% due to challenges in their pressure pumping business caused by lower utilization, higher costs, and the inability to improve pricing. Watson Pharmaceuticals also detracted from performance, returning -10% as expectations for benefits from generic Lipitor proved to be too high. The Fund has since sold both the Baker Hughes and Watson Pharmaceutical positions.
Hennessy Select Large Value Fund
Institutional Class Shares (HSVIX)
AVERAGE ANNUAL TOTAL RETURN PERIODS ENDED APRIL 30, 2012
| | Six | One | Three | Since Inception |
| | Months | Year | Years | (3/20/09) |
| Hennessy Select Large Value | | | | |
| Fund – Institutional Class | 13.34% | 3.28% | 15.87% | 19.94% |
| Russell 1000 Value Index | 11.62% | 1.03% | 18.32% | 23.12% |
| S&P 500 Index | 12.77% | 4.76% | 19.46% | 23.74% |
Gross expense ratio: 1.21%. Net expense ratio: 0.98%. The expense ratio is contractually capped at 0.98% indefinitely.
Performance data quoted represents past performance; past performance does not guarantee future results. The investment return and principal value of an investment will fluctuate so that an investor’s shares, when redeemed, may be worth more or less than their original cost. Current performance of the Fund may be lower or higher than the performance quoted. Performance data current to the most recent month end may be obtained by visiting www.hennessyfunds.com. Investment performance reflects fee waivers in effect. In the absence of such waivers, total return would be reduced. The gross and net expense ratios presented are those from the most recent prospectus.
The S&P 500 and Russell 1000 Value are unmanaged indices commonly used to measure the performance of U.S. stocks. The Russell 1000 Value measures large-cap, value-oriented stocks. One cannot invest directly in an index.
HENNESSY FUNDS 1-800-966-4354
Hennessy Select SPARX Japan Fund
Original Class Shares (SPXJX)
AVERAGE ANNUAL TOTAL RETURN PERIODS ENDED APRIL 30, 2012
| | Six | One | Five | Since Inception |
| | Months | Year | Years | (10/31/03) |
| Hennessy Select SPARX Japan Fund | | | | |
| – Original Class | 7.43% | 1.28% | -1.34% | 6.12% |
| MSCI Japan Index | 3.90% | -3.14% | -5.31% | 2.57% |
| Russell/Nomura Total Market Index | 3.79% | -2.38% | -4.91% | 2.42% |
| TOPIX | 3.13% | -2.29% | -5.05% | 2.12% |
Gross expense ratio: 1.87%.
Performance data quoted represents past performance; past performance does not guarantee future results. The investment return and principal value of an investment will fluctuate so that an investor’s shares, when redeemed, may be worth more or less than their original cost. Current performance of the Fund may be lower or higher than the performance quoted. Performance data current to the most recent month end may be obtained by visiting www.hennessyfunds.com. The gross expense ratio presented is that from the most recent prospectus.
PERFORMANCE NARRATIVE FROM SPARX ASSET
MANAGEMENT CO, LTD., SUB-ADVISOR
The Hennessy Select SPARX Japan Fund returned 7.43% for the six-month period ending April 30, 2012, significantly outperforming both the Russell / Nomura Total Market Index, which returned 3.79%, and the TOPIX, which returned 3.13% for the same period. The biggest contributors to the Fund’s performance among the TOPIX 33 sub-industries included shares of wholesalers, automakers and chemical manufacturers. Conversely, miscellaneous manufacturing, precision instrument makers and machinery manufacturers were among the worst performers.
Among the strongest positive contributors to the Fund’s performance during the period were Shimano, Inc., a bicycle parts manufacturer with strong global market share, and general trading firms such as Sumitomo Corp., Itochu Corp. and Marubeni Corp. Shares of Shimano advanced following the release of its first quarter earnings results for the year ending December, 2012, reporting significant year over year increases in total revenue and operating profit, which exceeded expectations. On a further positive note, China, a burgeoning sports bike market, has begun to see robust growth in sales in recent quarters, contributing to Shimano’s overall earnings.
On the other hand, the worst performance for the period came from Asics Corporation, the high-performance sports shoes maker, Daikin Industries, Ltd., Japan’s largest manufacturer of commercial-use air-conditioners, and Terumo Corp., a medical equipment manufacturer. Shares of Asics tumbled in November 2011 after the company revised its forecast of profits by -18%, blaming a stronger Yen against the Euro and U.S. Dollar and a delay in the launch of its new “Lightweight” shoe category in the U.S. During our recent post earnings release interview with the company, management admitted that while they were slow to react to this new industry trend of recreational long-distance running, Asics has now launched their version of “Lightweight” shoes. We believe that Asics will remain a leader in their category as they continue to be one of the most preferred brands in the world for marathons, and they have strong pricing power coupled with stable demand thanks to an increasing number joggers and marathoners around the world.
Hennessy Select SPARX Japan Fund
Institutional Class Shares (SPARX)
AVERAGE ANNUAL TOTAL RETURN PERIODS ENDED APRIL 30, 2012
| | Six | One | Five | Since Inception |
| | Months | Year | Years | (10/31/03) |
| Hennessy Select SPARX | | | | |
| Japan Fund – Institutional Class | 7.57% | 1.54% | -1.22% | 6.28% |
| MSCI Japan Index | 3.90% | -3.14% | -5.31% | 2.57% |
| Russell/Nomura Total Market Index | 3.79% | -2.38% | -4.91% | 2.42% |
| TOPIX | 3.13% | -2.29% | -5.05% | 2.12% |
Gross expense ratio: 1.65%.
Performance data quoted represents past performance; past performance does not guarantee future results. The investment return and principal value of an investment will fluctuate so that an investor’s shares, when redeemed, may be worth more or less than their original cost. Current performance of the Fund may be lower or higher than the performance quoted. Performance data current to the most recent month end may be obtained by visiting www.hennessyfunds.com. The gross expense ratio presented is that from the most recent prospectus.
The TOPIX is an unmanaged, capitalization weighted index of all the companies listed on the First Section of the Tokyo Stock Exchange. The Russell/Nomura Total Market Index contains the top 98% of all stocks listed on Japan’s stock exchange and registered on Japan’s OTC market, in terms of market capitalization. The Russell/Nomura Total Market Index is replacing the MSCI Japan Index because the Fund believes that the composition of the Russell/Nomura Total Market Index better reflects the Fund’s holdings for comparison purposes. The MSCI Japan Index is a market capitalization weighted index of Japanese equities.
Returns are presented in U.S. Dollar terms and take into account reinvestment of dividends.
HENNESSY FUNDS 1-800-966-4354
Hennessy Select SPARX Japan Smaller Companies
Fund (SPJSX)
AVERAGE ANNUAL TOTAL RETURN PERIODS ENDED APRIL 30, 2012
| | Six | One | Three | Since Inception |
| | Months | Year | Years | (8/31/07) |
| Hennessy Select SPARX Japan Smaller | | | | |
| Companies Fund – Original Class | 12.18% | 7.18% | 19.27% | 3.87% |
| MSCI Japan Small Cap Index | 5.31% | 3.70% | 13.10% | -1.09% |
| Russell/Nomura Small Cap Index | 5.86% | 5.28% | 13.00% | 0.35% |
| TOPIX | 3.13% | -2.29% | 7.70% | -4.93% |
Gross expense ratio: 2.11%.
Performance data quoted represents past performance; past performance does not guarantee future results. The investment return and principal value of an investment will fluctuate so that an investor’s shares, when redeemed, may be worth more or less than their original cost. Current performance of the Fund may be lower or higher than the performance quoted. Performance data current to the most recent month end may be obtained by visiting www.hennessyfunds.com. The gross expense ratio presented is that from the most recent prospectus.
PERFORMANCE NARRATIVE FROM SPARX ASSET
MANAGEMENT CO, LTD., SUB-ADVISOR
The Hennessy Select SPARX Japan Smaller Companies Fund returned 12.18% for the six-month period ending April 30, 2012, more than doubling the returns for both the Russell / Nomura Small Cap Index, which returned 5.86%, and the TOPIX, which returned 3.13% for the same period. The biggest contributors to the Fund’s performance among the TOPIX 33 sub-industries included shares of the service industry firms, construction firms and wholesalers. On the other hand, negative contributors included insurers, oil & coal producers and food producers.
Among the strongest positive contributors to the Fund’s performance during the period were West Holdings Corporation, which specializes in remodeling and home improvement as well as photovoltaic systems, SMS Co., Ltd., which operates a recruiting website for the nursing and medical industry, and ASKUL Corporation, a provider of total office support systems and the pioneer in taking orders though fax machines and the internet. Shares of West Holdings rose due to expectations of greater investment by energy companies, as the government set the purchase price for renewable energy at JPY 42 per kW. Shares of SMS surged due to a newspaper article which featured the company as a high-growth company that is expected to record historic high profits in the current fiscal year. Shares of ASKUL Corporation rose as the market reacted positively to several developments - the company’s progress toward achieving its earnings projections for the third quarter of its fiscal year ending September 30, 2012, healthy monthly revenues, and the sense that earnings have bottomed out.
On the other hand, the worst performance for the period came from Anicom Holdings, Inc., the pioneer of pet insurance in Japan with about 70% of domestic market share, Micronics Japan Co., Ltd., the leading manufacturer of semiconductor measuring devices, and Juki Corporation, the world’s largest producer of industrial sewing machines and Japan’s third largest maker of home-use machines. Shares of Anicom experienced a downward turn after the company announced negative third quarter earnings results for the fiscal year ending in March 2012 due to a temporary increase in costs. Also, the shares of the company fell on low liquidity fears rather than their long-term strong fundamentals. Shares of Micronics declined due to its announcement of a downward revision in its earnings projections and its involvement in the bankruptcy of Elpida Memory, Inc..
However, we believe that the firm will generate stronger earnings with a rise in orders from overseas clients. Finally, shares of Juki declined as the market reacted negatively to the growing finance risk faced by the company. Also, investors are concerned about a sales decline in Asia. However, in our view, the firm’s earnings will grow with a pickup in demand from emerging countries.
The TOPIX is an unmanaged, capitalization-weighted index of all the companies listed on the First Section of the Tokyo Stock Exchange. The Russell/Nomura Small Cap Index contains the bottom 15% of the Russell/Nomura Total Market Index, which contains the top 98% of all stocks listed on Japan's stock exchange and registered on Japan’s OTC market, in terms of market capitalization. The Russell/Nomura Small Cap Index is replacing the MSCI Japan Small Cap Index because the Fund believes that the composition of the Russell/Nomura Small Cap Index better reflects the Fund’s holdings for comparison purposes. The MSCI Japan Small Cap Index represents the universe of small capitalization companies in the Japanese equity market.
Returns are presented in U.S. Dollar terms and take into account reinvestment of dividends.
HENNESSY FUNDS 1-800-966-4354
Schedules of Investments
HENNESSY SELECT
LARGE VALUE FUND
As of April 30, 2012 (Unaudited)
(% of Net Assets)
| TOP TEN EQUITY HOLDINGS | % of net assets |
| J.P. Morgan Chase & Co. | 3.17% |
| General Electric Co. | 3.16% |
| Wells Fargo & Co. | 3.07% |
| Chevron Corp. | 3.00% |
| Pfizer, Inc. | 2.64% |
| Cisco Systems, Inc. | 2.46% |
| Intel Corp. | 2.45% |
| Kraft Foods, Inc. | 2.42% |
| Exxon Mobil Corp. | 2.37% |
| Verizon Communications, Inc. | 2.32% |
| | COMMON STOCKS – 97.90% | | Number of | | | | | | % of | |
| | | | Shares | | | Value | | | Net Assets | |
| | Consumer Discretionary – 10.30% | | | | | | | | | |
| | CBS Corp. | | | 54,120 | | | $ | 1,804,902 | | | | 1.40 | % |
| | Comcast Corp. | | | 88,370 | | | | 2,680,262 | | | | 2.08 | % |
| | Ford Motor Co. | | | 79,335 | | | | 894,899 | | | | 0.70 | % |
| | Macy’s, Inc. | | | 26,605 | | | | 1,091,337 | | | | 0.85 | % |
| | Pulte Homes, Inc. (a) | | | 93,920 | | | | 924,173 | | | | 0.72 | % |
| | Target Corp. | | | 31,100 | | | | 1,801,934 | | | | 1.40 | % |
| | The Home Depot, Inc. | | | 47,370 | | | | 2,453,292 | | | | 1.91 | % |
| | Wyndham Worldwide Corp. | | | 31,595 | | | | 1,590,493 | | | | 1.24 | % |
| | | | | | | | | 13,241,292 | | | | 10.30 | % |
| | | | | | | | | | | | | | |
| | Consumer Staples – 6.50% | | | | | | | | | | | | |
| | CVS Caremark Corp. | | | 60,405 | | | | 2,695,271 | | | | 2.10 | % |
| | Kraft Foods, Inc. | | | 78,100 | | | | 3,113,847 | | | | 2.42 | % |
| | Philip Morris International, Inc. | | | 23,340 | | | | 2,089,163 | | | | 1.62 | % |
| | Smithfield Foods, Inc. (a) | | | 21,910 | | | | 459,234 | | | | 0.36 | % |
| | | | | | | | | 8,357,515 | | | | 6.50 | % |
| | | | | | | | | | | | | | |
| | Energy – 11.02% | | | | | | | | | | | | |
| | Anadarko Petroleum Corp. | | | 17,160 | | | | 1,256,284 | | | | 0.98 | % |
| | Chevron Corp. | | | 36,245 | | | | 3,862,267 | | | | 3.00 | % |
| | Devon Energy Corp. | | | 14,325 | | | | 1,000,601 | | | | 0.78 | % |
| | Exxon Mobil Corp. | | | 35,250 | | | | 3,043,485 | | | | 2.37 | % |
| | Marathon Oil Corp. | | | 32,940 | | | | 966,460 | | | | 0.75 | % |
| | Occidental Petroleum Corp. | | | 26,165 | | | | 2,386,771 | | | | 1.85 | % |
| | Oil States International, Inc. (a) | | | 20,880 | | | | 1,661,630 | | | | 1.29 | % |
| | | | | | | | | 14,177,498 | | | | 11.02 | % |
| | | | | | | | | | | | | | |
| | Financials – 23.46% | | | | | | | | | | | | |
| | Ace Ltd. (b) | | | 34,890 | | | | 2,650,593 | | | | 2.06 | % |
| | Affiliated Managers Group, Inc. (a) | | | 12,825 | | | | 1,457,177 | | | | 1.13 | % |
| | American International Group, Inc. (a) | | | 20,580 | | | | 700,337 | | | | 0.55 | % |
| | Ameriprise Financial, Inc. | | | 20,560 | | | | 1,114,558 | | | | 0.87 | % |
| | Bank of America Corp. | | | 143,340 | | | | 1,162,487 | | | | 0.90 | % |
| | Capital One Financial Corp. | | | 21,255 | | | | 1,179,227 | | | | 0.92 | % |
| | Citigroup, Inc. | | | 49,975 | | | | 1,651,174 | | | | 1.28 | % |
| | Digital Realty Trust, Inc. | | | 8,700 | | | | 653,283 | | | | 0.51 | % |
The accompanying notes are an integral part of these financial statements.
HENNESSY FUNDS 1-800-966-4354
| | COMMON STOCKS | | Number of | | | | | | % of | |
| | | | Shares | | | Value | | | Net Assets | |
| | Financials (Continued) | | | | | | | | | |
| | Invesco Ltd. (b) | | | 41,680 | | | $ | 1,035,331 | | | | 0.81 | % |
| | J.P. Morgan Chase & Co. | | | 94,985 | | | | 4,082,455 | | | | 3.17 | % |
| | Marsh & McLennan Companies, Inc. | | | 48,475 | | | | 1,621,489 | | | | 1.26 | % |
| | Metlife, Inc. | | | 26,250 | | | | 945,788 | | | | 0.74 | % |
| | PNC Financial Services Group, Inc. | | | 34,720 | | | | 2,302,631 | | | | 1.79 | % |
| | Prudential Financial, Inc. | | | 12,380 | | | | 749,485 | | | | 0.58 | % |
| | Simon Property Group, Inc. | | | 10,618 | | | | 1,652,161 | | | | 1.28 | % |
| | State Street Corp. | | | 13,805 | | | | 638,067 | | | | 0.50 | % |
| | The Goldman Sachs Group, Inc. | | | 9,790 | | | | 1,127,319 | | | | 0.88 | % |
| | Torchmark Corp. | | | 30,735 | | | | 1,497,102 | | | | 1.16 | % |
| | Wells Fargo & Co. | | | 118,245 | | | | 3,952,930 | | | | 3.07 | % |
| | | | | | | | | 30,173,594 | | | | 23.46 | % |
| | | | | | | | | | | | | | |
| | Health Care – 12.05% | | | | | | | | | | | | |
| | Abbott Labs | | | 29,115 | | | | 1,806,877 | | | | 1.41 | % |
| | Baxter International, Inc. | | | 8,195 | | | | 454,085 | | | | 0.35 | % |
| | Bristol-Myers Squibb Co. | | | 74,340 | | | | 2,480,726 | | | | 1.93 | % |
| | CIGNA Corp. | | | 14,240 | | | | 658,315 | | | | 0.51 | % |
| | Gilead Sciences, Inc. (a) | | | 21,845 | | | | 1,136,158 | | | | 0.88 | % |
| | Humana, Inc. | | | 15,805 | | | | 1,275,147 | | | | 0.99 | % |
| | McKesson Corp. | | | 20,175 | | | | 1,844,197 | | | | 1.44 | % |
| | Medtronic, Inc. | | | 15,490 | | | | 591,718 | | | | 0.46 | % |
| | Merck & Co., Inc. | | | 47,047 | | | | 1,846,124 | | | | 1.44 | % |
| | Pfizer, Inc. | | | 148,235 | | | | 3,399,029 | | | | 2.64 | % |
| | | | | | | | | 15,492,376 | | | | 12.05 | % |
| | | | | | | | | | | | | | |
| | Industrials – 9.83% | | | | | | | | | | | | |
| | Caterpillar, Inc. | | | 8,770 | | | | 901,293 | | | | 0.70 | % |
| | CSX Corp. | | | 32,020 | | | | 714,366 | | | | 0.56 | % |
| | General Electric Co. | | | 207,450 | | | | 4,061,871 | | | | 3.16 | % |
| | Honeywell International, Inc. | | | 31,500 | | | | 1,910,790 | | | | 1.49 | % |
| | KBR, Inc. | | | 28,975 | | | | 981,093 | | | | 0.76 | % |
| | Owens Corning (a) | | | 26,200 | | | | 899,970 | | | | 0.70 | % |
| | The Boeing Co. | | | 14,315 | | | | 1,099,392 | | | | 0.85 | % |
| | The Timken Co. | | | 13,460 | | | | 760,625 | | | | 0.59 | % |
The accompanying notes are an integral part of these financial statements.
| | COMMON STOCKS | | Number of | | | | | | % of | |
| | | | Shares | | | Value | | | Net Assets | |
| | Industrials (Continued) | | | | | | | | | |
| | Union Pacific Corp. | | | 11,630 | | | $ | 1,307,677 | | | | 1.02 | % |
| | | | | | | | | 12,637,077 | | | | 9.83 | % |
| | | | | | | | | | | | | | |
| | Information Technology – 9.91% | | | | | | | | | | | | |
| | Akamai Technologies, Inc. (a) | | | 15,925 | | | | 519,155 | | | | 0.41 | % |
| | Cisco Systems, Inc. | | | 157,215 | | | | 3,167,882 | | | | 2.46 | % |
| | e-Bay, Inc. (a) | | | 23,215 | | | | 952,976 | | | | 0.74 | % |
| | Hewlett-Packard Co. | | | 64,980 | | | | 1,608,905 | | | | 1.25 | % |
| | Intel Corp. | | | 110,740 | | | | 3,145,016 | | | | 2.45 | % |
| | Jabil Circuit, Inc. | | | 22,160 | | | | 519,652 | | | | 0.40 | % |
| | Mastercard, Inc. | | | 2,755 | | | | 1,246,004 | | | | 0.97 | % |
| | Texas Instruments, Inc. | | | 20,175 | | | | 644,389 | | | | 0.50 | % |
| | Yahoo!, Inc. (a) | | | 60,340 | | | | 937,684 | | | | 0.73 | % |
| | | | | | | | | 12,741,663 | | | | 9.91 | % |
| | | | | | | | | | | | | | |
| | Materials – 3.46% | | | | | | | | | | | | |
| | CF Industries Holdings, Inc. | | | 4,185 | | | | 807,956 | | | | 0.63 | % |
| | LyondellBasell Industries NV (b) | | | 21,280 | | | | 889,078 | | | | 0.69 | % |
| | Nucor Corp. | | | 22,455 | | | | 880,461 | | | | 0.68 | % |
| | The Dow Chemical Co. | | | 22,240 | | | | 753,491 | | | | 0.59 | % |
| | Weyerhaeuser Co. | | | 54,900 | | | | 1,117,764 | | | | 0.87 | % |
| | | | | | | | | 4,448,750 | | | | 3.46 | % |
| | | | | | | | | | | | | | |
| | Telecommunication Services – 4.68% | | | | | | | | | | | | |
| | AT&T, Inc. | | | 54,070 | | | | 1,779,444 | | | | 1.38 | % |
| | CenturyLink, Inc. | | | 32,587 | | | | 1,256,555 | | | | 0.98 | % |
| | Verizon Communications, Inc. | | | 73,980 | | | | 2,987,312 | | | | 2.32 | % |
| | | | | | | | | 6,023,311 | | | | 4.68 | % |
| | | | | | | | | | | | | | |
| | Utilities – 6.69% | | | | | | | | | | | | |
| | Centerpoint Energy, Inc. | | | 75,195 | | | | 1,519,691 | | | | 1.18 | % |
| | CMS Energy Corp. | | | 58,135 | | | | 1,336,524 | | | | 1.04 | % |
| | Edison International | | | 41,450 | | | | 1,824,214 | | | | 1.42 | % |
| | FirstEnergy Corp. | | | 17,455 | | | | 817,243 | | | | 0.63 | % |
| | Nextera Energy, Inc. | | | 33,220 | | | | 2,137,707 | | | | 1.66 | % |
| | Northeast Utilities | | | 26,410 | | | | 971,096 | | | | 0.76 | % |
| | | | | | | | | 8,606,475 | | | | 6.69 | % |
| | | | | | | | | | | | | | |
| | Total Common Stocks (Cost $104,257,514) | | | | | | | 125,899,551 | | | | 97.90 | % |
The accompanying notes are an integral part of these financial statements.
HENNESSY FUNDS 1-800-966-4354
| | SHORT-TERM INVESTMENTS – 1.19% | | Number of | | | | | | % of | |
| | | | Shares | | | Value | | | Net Assets | |
| | Money Market Fund – 1.19% | | | | | | | | | |
| | Fidelity Government Portfolio – | | | | | | | | | |
| | Institutional Class, 0.010% (c) | | | 1,536,246 | | | $ | 1,536,246 | | | | 1.19 | % |
| | | | | | | | | | | | | | |
| | Total Money Market Fund | | | | | | | | | | | | |
| | (Cost $1,536,246) | | | | | | | 1,536,246 | | | | 1.19 | % |
| | | | | | | | | | | | | | |
| | Total Short-Term Investments | | | | | | | | | | | | |
| | (Cost $1,536,246) | | | | | | | 1,536,246 | | | | 1.19 | % |
| | | | | | | | | | | | | | |
| | Total Investments – 99.09% | | | | | | | | | | | | |
| | (Cost $105,793,760) | | | | | | | 127,435,797 | | | | 99.09 | % |
| | | | | | | | | | | | | | |
| | Other Assets in Excess of Liabilities – 0.91% | | | | | | | 1,170,359 | | | | 0.91 | % |
| | TOTAL NET ASSETS – 100.00% | | | | | | $ | 128,606,156 | | | | 100.00 | % |
Percentages are stated as a percent of net assets.
| (a) | Non-income producing security. |
| (b) | U.S. traded security of a foreign issuer. |
| (c) | The rate listed is the fund’s 7-day yield as of April 30, 2012. |
Summary of Fair Value Exposure at April 30, 2012
The following is a summary of the inputs used to value the Fund’s net assets as of April 30, 2012 (See Note 3 in the accompanying notes to the financial statements):
| Common Stock | | Level 1 | | | Level 2 | | | Level 3 | | | Total | |
| Consumer Discretionary | | $ | 13,241,292 | | | $ | — | | | $ | — | | | $ | 13,241,292 | |
| Consumer Staples | | | 8,357,515 | | | | — | | | | — | | | | 8,357,515 | |
| Energy | | | 14,177,498 | | | | — | | | | — | | | | 14,177,498 | |
| Financials | | | 30,173,594 | | | | — | | | | — | | | | 30,173,594 | |
| Health Care | | | 15,492,376 | | | | — | | | | — | | | | 15,492,376 | |
| Industrials | | | 12,637,077 | | | | — | | | | — | | | | 12,637,077 | |
| Information Technology | | | 12,741,663 | | | | — | | | | — | | | | 12,741,663 | |
| Materials | | | 4,448,750 | | | | — | | | | — | | | | 4,448,750 | |
| Telecommunication Services | | | 6,023,311 | | | | — | | | | — | | | | 6,023,311 | |
| Utilities | | | 8,606,475 | | | | — | | | | — | | | | 8,606,475 | |
| Total Common Stock | | $ | 125,899,551 | | | $ | — | | | $ | — | | | $ | 125,899,551 | |
| Short-Term Investments | | | | | | | | | | | | | | | | |
| Money Market Funds | | $ | 1,536,246 | | | $ | — | | | $ | — | | | $ | 1,536,246 | |
| Total Short-Term Investments | | $ | 1,536,246 | | | $ | — | | | $ | — | | | $ | 1,536,246 | |
| Total Investments in Securities | | $ | 127,435,797 | | | $ | — | | | $ | — | | | $ | 127,435,797 | |
Transfers between levels are recognized at the end of the reporting period. During the period ended April 30, 2012, the Fund recognized no transfers between levels.
The accompanying notes are an integral part of these financial statements.
HENNESSY SELECT SPARX
JAPAN FUND
As of April 30, 2012 (Unaudited)
(% of Net Assets)
| TOP TEN EQUITY HOLDINGS | % of net assets |
| Shimano, Inc. | 7.35% |
| Misumi Group, Inc. | 6.55% |
| Ryohin Keikaku Co., Ltd. | 6.49% |
| Keyence Corp. | 6.34% |
| Sumitomo Corp. | 6.13% |
| Rohto Pharmaceutical Co., Ltd. | 5.69% |
| Mitsubishi Corp. | 5.60% |
| Kao Corp. | 5.23% |
| Itochu Corp. | 4.19% |
| Daikin Industries | 4.18% |
HENNESSY FUNDS 1-800-966-4354
| | COMMON STOCKS – 95.61% | | Number of | | | | | | % of | |
| | | | Shares | | | Value | | | Net Assets | |
| | Consumer Discretionary – 20.76% | | | | | | | | | |
| | Asics Corp. | | | 75,500 | | | $ | 812,835 | | | | 3.97 | % |
| | Isuzu Motors, Ltd. | | | 65,000 | | | | 371,111 | | | | 1.81 | % |
| | Ryohin Keikaku Co., Ltd. | | | 24,500 | | | | 1,330,124 | | | | 6.49 | % |
| | Shimano, Inc. | | | 22,900 | | | | 1,505,758 | | | | 7.35 | % |
| | Toyota Motor Corp. | | | 5,700 | | | | 233,573 | | | | 1.14 | % |
| | | | | | | | | 4,253,401 | | | | 20.76 | % |
| | | | | | | | | | | | | | |
| | Consumer Staples – 11.02% | | | | | | | | | | | | |
| | Kao Corp. | | | 40,000 | | | | 1,071,814 | | | | 5.23 | % |
| | Pigeon Corp. | | | 8,800 | | | | 351,107 | | | | 1.72 | % |
| | Unicharm Corp. | | | 14,900 | | | | 833,528 | | | | 4.07 | % |
| | | | | | | | | 2,256,449 | | | | 11.02 | % |
| | | | | | | | | | | | | | |
| | Financials – 6.55% | | | | | | | | | | | | |
| | Mizuho Financial Group | | | 396,500 | | | | 625,085 | | | | 3.05 | % |
| | Sumitomo Mitsui Financial Group, Inc. | | | 22,400 | | | | 716,773 | | | | 3.50 | % |
| | | | | | | | | 1,341,858 | | | | 6.55 | % |
| | | | | | | | | | | | | | |
| | Health Care – 13.57% | | | | | | | | | | | | |
| | Mani, Inc. | | | 22,800 | | | | 816,460 | | | | 3.99 | % |
| | Rohto Pharmaceutical Co., Ltd. | | | 91,000 | | | | 1,165,602 | | | | 5.69 | % |
| | Terumo Corp. | | | 17,400 | | | | 797,267 | | | | 3.89 | % |
| | | | | | | | | 2,779,329 | | | | 13.57 | % |
| | | | | | | | | | | | | | |
| | Industrials – 31.48% | | | | | | | | | | | | |
| | Daikin Industries | | | 32,400 | | | | 856,033 | | | | 4.18 | % |
| | Itochu Corp. | | | 75,900 | | | | 858,749 | | | | 4.19 | % |
| | Komatsu, Ltd. | | | 12,200 | | | | 351,116 | | | | 1.71 | % |
| | Marubeni Corp. | | | 92,000 | | | | 638,821 | | | | 3.12 | % |
| | Misumi Group, Inc. | | | 57,400 | | | | 1,342,781 | | | | 6.55 | % |
| | Mitsubishi Corp. | | | 52,900 | | | | 1,146,447 | | | | 5.60 | % |
| | Sumitomo Corp. | | | 88,300 | | | | 1,254,848 | | | | 6.13 | % |
| | | | | | | | | 6,448,795 | | | | 31.48 | % |
| | | | | | | | | | | | | | |
| | Information Technology – 6.34% | | | | | | | | | | | | |
| | Keyence Corp. | | | 5,500 | | | | 1,298,137 | | | | 6.34 | % |
| | | | | | | | | | | | | | |
| | Materials – 5.89% | | | | | | | | | | | | |
| | Fuji Seal International, Inc. | | | 43,100 | | | | 826,498 | | | | 4.03 | % |
The accompanying notes are an integral part of these financial statements.
| | COMMON STOCKS | | Number of | | | | | | % of | |
| | | | Shares | | | Value | | | Net Assets | |
| | Materials (Continued) | | | | | | | | | |
| | Sumitomo Metal Mining Co., Ltd. | | | 29,000 | | | $ | 380,403 | | | | 1.86 | % |
| | | | | | | | | 1,206,901 | | | | 5.89 | % |
| | | | | | | | | | | | | | |
| | Total Common Stocks (Cost $16,723,824) | | | | | | | 19,584,870 | | | | 95.61 | % |
| | | | | | | | | | | | | | |
| | SHORT-TERM INVESTMENTS – 3.52% | | | | | | | | | | | | |
| | Money Market Fund – 3.52% | | | | | | | | | | | | |
| | Fidelity Government Portfolio – | | | | | | | | �� | | | | |
| | Institutional Class, 0.010% (a) | | | 720,259 | | | | 720,259 | | | | 3.52 | % |
| | | | | | | | | | | | | | |
| | Total Money Market Fund | | | | | | | | | | | | |
| | (Cost $720,259) | | | | | | | 720,259 | | | | 3.52 | % |
| | | | | | | | | | | | | | |
| | Total Short-Term Investments | | | | | | | | | | | | |
| | (Cost $720,259) | | | | | | | 720,259 | | | | 3.52 | % |
| | | | | | | | | | | | | | |
| | Total Investments – 99.13% | | | | | | | | | | | | |
| | (Cost $17,444,083) | | | | | | | 20,305,129 | | | | 99.13 | % |
| | | | | | | | | | | | | | |
| | Other Assets in Excess of Liabilities – 0.87% | | | | | | | 178,098 | | | | 0.87 | % |
| | TOTAL NET ASSETS – 100.00% | | | | | | $ | 20,483,227 | | | | 100.00 | % |
Percentages are stated as a percent of net assets.
| (a) | The rate listed is the fund’s 7-day yield as of April 30, 2012. |
Summary of Fair Value Exposure at April 30, 2012
The following is a summary of the inputs used to value the Fund’s net assets as of April 30, 2012 (See Note 3 in the accompanying notes to the financial statements):
| Common Stock | | Level 1 | | | Level 2 | | | Level 3 | | | Total | |
| Consumer Discretionary | | $ | — | | | $ | 4,253,401 | | | $ | — | | | $ | 4,253,401 | |
| Consumer Staples | | | — | | | | 2,256,449 | | | | — | | | | 2,256,449 | |
| Financials | | | — | | | | 1,341,858 | | | | — | | | | 1,341,858 | |
| Health Care | | | — | | | | 2,779,329 | | | | — | | | | 2,779,329 | |
| Industrials | | | — | | | | 6,448,795 | | | | — | | | | 6,448,795 | |
| Information Technology | | | — | | | | 1,298,137 | | | | — | | | | 1,298,137 | |
| Materials | | | — | | | | 1,206,901 | | | | — | | | | 1,206,901 | |
| Total Common Stock | | $ | — | | | $ | 19,584,870 | | | $ | — | | | $ | 19,584,870 | |
| Short-Term Investments | | | | | | | | | | | | | | | | |
| Money Market Funds | | $ | 720,259 | | | | — | | | $ | — | | | $ | 720,259 | |
| Total Short-Term Investments | | $ | 720,259 | | | $ | — | | | $ | — | | | $ | 720,259 | |
| Total Investments in Securities | | $ | 720,259 | | | $ | 19,584,870 | | | $ | — | | | $ | 20,305,129 | |
Transfers between levels are recognized at the end of the reporting period. During the period ended April 30, 2012, the Fund recognized transfers between Levels 1 and 2.
The accompanying notes are an integral part of these financial statements.
HENNESSY FUNDS �� 1-800-966-4354
Level 2 Reconciliation Disclosure
Following is a reconciliation of Level 2 assets for which unobservable inputs were used to determine fair value:
| | | Common Stocks | |
| Transfers into Level 2 | | $ | 19,584,870 | |
| Transfers out of Level 2 | | | — | |
| Net transfers in and/or out of Level 2 | | $ | 19,584,870 | |
Transfers between Level 1 and Level 2 relate to the use of a fair valuation pricing service. On days when the fair valuation pricing service used, non-U.S. dollar denominated securities move from a Level 1 to a Level 2 classification.
The accompanying notes are an integral part of these financial statements.
HENNESSY SELECT SPARX
JAPAN SMALLER COMPANIES FUND
As of April 30, 2012 (Unaudited)
(% of Net Assets)
| TOP TEN EQUITY HOLDINGS | % of net assets |
| West Holdings Corp. | 2.90% |
| Seiko Holdings | 2.75% |
| Shin Nippon Air Technologies Co., Ltd. | 2.60% |
| ASKUL Corp. | 2.59% |
| Hagihara Industries, Inc. | 2.47% |
| NOF Corp. | 2.45% |
| UT Holdings Co., Ltd. | 2.37% |
| Kyosan Electric Manufacturing Co., Ltd. | 2.34% |
| Fujikura Kasei Co., Ltd. | 2.33% |
| Iwatani Corp. | 2.29% |
HENNESSY FUNDS 1-800-966-4354
| | COMMON STOCKS – 94.21% | | Number of | | | | | | % of | |
| | | | Shares | | | Value | | | Net Assets | |
| | Consumer Discretionary – 18.23% | | | | | | | | | |
| | ASKUL Corp. | | | 17,900 | | | $ | 357,585 | | | | 2.59 | % |
| | Doshisha Co., Ltd. | | | 7,400 | | | | 216,393 | | | | 1.57 | % |
| | Gulliver International Co., Ltd. | | | 2,620 | | | | 93,575 | | | | 0.68 | % |
| | Hagihara Industries, Inc. | | | 19,300 | | | | 340,079 | | | | 2.47 | % |
| | Nippon Seiki Co., Ltd. | | | 18,000 | | | | 227,057 | | | | 1.65 | % |
| | Seiko Holdings | | | 150,000 | | | | 379,347 | | | | 2.75 | % |
| | Tohokushinsha Film Corp. | | | 28,800 | | | | 252,048 | | | | 1.83 | % |
| | Village Vanguard Co., Ltd. | | | 149 | | | | 247,247 | | | | 1.79 | % |
| | West Holdings Corp. | | | 22,900 | | | | 399,585 | | | | 2.90 | % |
| | | | | | | | | 2,512,916 | | | | 18.23 | % |
| | | | | | | | | | | | | | |
| | Consumer Staples – 3.87% | | | | | | | | | | | | |
| | Cawachi Ltd. | | | 6,800 | | | | 163,703 | | | | 1.19 | % |
| | Megmilk Snow Brand | | | 13,200 | | | | 239,218 | | | | 1.73 | % |
| | Mitsui Sugar Co. | | | 40,000 | | | | 130,631 | | | | 0.95 | % |
| | | | | | | | | 533,552 | | | | 3.87 | % |
| | | | | | | | | | | | | | |
| | Financials – 3.88% | | | | | | | | | | | | |
| | Anicom Holdings, Inc. | | | 50,000 | | | | 309,995 | | | | 2.25 | % |
| | Kenedix, Inc. (a) | | | 1,252 | | | | 225,246 | | | | 1.63 | % |
| | | | | | | | | 535,241 | | | | 3.88 | % |
| | | | | | | | | | | | | | |
| | Health Care – 2.14% | | | | | | | | | | | | |
| | Message Co., Ltd. | | | 83 | | | | 294,727 | | | | 2.14 | % |
| | | | | | | | | | | | | | |
| | Industrials – 30.80% | | | | | | | | | | | | |
| | Aichi Corp. | | | 61,200 | | | | 269,966 | | | | 1.96 | % |
| | Anest Iwata Corp. | | | 64,000 | | | | 308,635 | | | | 2.24 | % |
| | Asunaro Aoki Construction, Ltd. | | | 44,000 | | | | 258,656 | | | | 1.88 | % |
| | Iwatani Corp. | | | 90,000 | | | | 316,370 | | | | 2.29 | % |
| | Juki Corp. | | | 68,000 | | | | 133,474 | | | | 0.97 | % |
| | Kyosan Electric Manufacturing Co., Ltd. | | | 74,000 | | | | 322,390 | | | | 2.34 | % |
| | Mirait Holdings Corp. | | | 33,100 | | | | 238,206 | | | | 1.73 | % |
| | Morita Holdings Corp. | | | 46,000 | | | | 306,757 | | | | 2.23 | % |
| | Nichias Corp. | | | 24,000 | | | | 124,562 | | | | 0.90 | % |
| | Nippon Yusoki Co., Ltd. | | | 81,000 | | | | 253,710 | | | | 1.84 | % |
| | Nisshinbo Holdings | | | 34,000 | | | | 298,927 | | | | 2.17 | % |
The accompanying notes are an integral part of these financial statements.
| | COMMON STOCKS | | Number of | | | | | | % of | |
| | | | Shares | | | Value | | | Net Assets | |
| | Industrials (Continued) | | | | | | | | | |
| | Nitto Kogyo Corp. | | | 14,300 | | | $ | 207,723 | | | | 1.51 | % |
| | Prestige International, Inc. | | | 22,300 | | | | 225,933 | | | | 1.64 | % |
| | Sankyu, Inc. | | | 56,000 | | | | 222,196 | | | | 1.61 | % |
| | SBS Holdings, Inc. | | | 20,200 | | | | 189,865 | | | | 1.38 | % |
| | Shin Nippon Air Technologies Co., Ltd. | | | 59,200 | | | | 358,945 | | | | 2.60 | % |
| | Toshin Group Co., Ltd. | | | 8,400 | | | | 208,843 | | | | 1.51 | % |
| | | | | | | | | 4,245,158 | | | | 30.80 | % |
| | | | | | | | | | | | | | |
| | Information Technology – 23.16% | | | | | | | | | | | | |
| | D.A. Consortium, Inc. | | | 206 | | | | 68,861 | | | | 0.50 | % |
| | Iriso Electronics | | | 15,000 | | | | 305,957 | | | | 2.22 | % |
| | Macnica, Inc. | | | 12,600 | | | | 293,878 | | | | 2.13 | % |
| | Micronics Japan Co., Ltd. | | | 36,400 | | | | 170,669 | | | | 1.24 | % |
| | Nifty Corp. | | | 8 | | | | 10,890 | | | | 0.08 | % |
| | Nippon Chemi-con Corp. | | | 72,000 | | | | 271,447 | | | | 1.97 | % |
| | Roland DG Corp. | | | 21,100 | | | | 247,879 | | | | 1.80 | % |
| | SIIX Corp. | | | 15,700 | | | | 241,565 | | | | 1.75 | % |
| | SMS Co., Ltd. | | | 124 | | | | 172,390 | | | | 1.25 | % |
| | SRA Holdings, Inc. | | | 25,700 | | | | 293,180 | | | | 2.13 | % |
| | Tamura Corp. | | | 93,000 | | | | 255,174 | | | | 1.85 | % |
| | Towa Corp. | | | 39,200 | | | | 219,456 | | | | 1.59 | % |
| | UKC Holdings Corp. | | | 10,200 | | | | 140,511 | | | | 1.02 | % |
| | UT Holdings Co., Ltd . | | | 412 | | | | 326,753 | | | | 2.37 | % |
| | Yamaichi Electronics Co., Ltd. (a) | | | 77,000 | | | | 173,984 | | | | 1.26 | % |
| | | | | | | | | 3,192,594 | | | | 23.16 | % |
| | | | | | | | | | | | | | |
| | Materials – 11.13% | | | | | | | | | | | | |
| | Fujikura Kasei Co., Ltd. | | | 55,100 | | | | 320,793 | | | | 2.33 | % |
| | Kanto Denka Kogyo | | | 36,000 | | | | 116,633 | | | | 0.85 | % |
| | Konishi Co., Ltd. | | | 16,500 | | | | 227,793 | | | | 1.65 | % |
| | NOF Corp. | | | 67,000 | | | | 337,219 | | | | 2.45 | % |
| | Okabe Co., Ltd. | | | 23,700 | | | | 149,536 | | | | 1.08 | % |
| | Wood One Co., Ltd. | | | 37,000 | | | | 152,371 | | | | 1.10 | % |
| | Yushiro Chemical | | | 21,800 | | | | 229,731 | | | | 1.67 | % |
| | | | | | | | | 1,534,076 | | | | 11.13 | % |
The accompanying notes are an integral part of these financial statements.
HENNESSY FUNDS 1-800-966-4354
| | COMMON STOCKS | | Number of | | | | | | % of | |
| | | | Shares | | | Value | | | Net Assets | |
| | Utilities – 1.00% | | | | | | | | | |
| | Shizuokagas Co. | | | 19,000 | | | $ | 137,372 | | | | 1.00 | % |
| | | | | | | | | | | | | | |
| | Total Common Stocks (Cost $11,057,189) | | | | | | | 12,985,636 | | | | 94.21 | % |
| | | | | | | | | | | | | | |
| | SHORT-TERM INVESTMENTS – 4.31% | | | | | | | | | | | | |
| | Money Market Fund – 4.31% | | | | | | | | | | | | |
| | Fidelity Government Portfolio – | | | | | | | | | | | | |
| | Institutional Class, 0.010% (b) | | | 593,380 | | | | 593,380 | | | | 4.31 | % |
| | | | | | | | | | | | | | |
| | Total Money Market Fund | | | | | | | | | | | | |
| | (Cost $593,380) | | | | | | | 593,380 | | | | 4.31 | % |
| | | | | | | | | | | | | | |
| | Total Short-Term Investments | | | | | | | | | | | | |
| | (Cost $593,380) | | | | | | | 593,380 | | | | 4.31 | % |
| | | | | | | | | | | | | | |
| | Total Investments – 98.52% | | | | | | | | | | | | |
| | (Cost $11,650,569) | | | | | | | 13,579,016 | | | | 98.52 | % |
| | | | | | | | | | | | | | |
| | Other Assets in Excess of Liabilities – 1.48% | | | | | | | 203,527 | | | | 1.48 | % |
| | TOTAL NET ASSETS – 100.00% | | | | | | $ | 13,782,543 | | | | 100.00 | % |
Percentages are stated as a percent of net assets.
| (a) | Non-income producing security. |
| (b) | The rate listed is the fund’s 7-day yield as of April 30, 2012. |
The accompanying notes are an integral part of these financial statements.
Summary of Fair Value Exposure at April 30, 2012
The following is a summary of the inputs used to value the Fund’s net assets as of April 30, 2012 (See Note 3 in the accompanying notes to the financial statements):
| Common Stock | | Level 1 | | | Level 2 | | | Level 3 | | | Total | |
| Consumer Discretionary | | $ | — | | | $ | 2,512,916 | | | $ | — | | | $ | 2,512,916 | |
| Consumer Staples | | | — | | | | 533,552 | | | | — | | | | 533,552 | |
| Financials | | | — | | | | 535,241 | | | | — | | | | 535,241 | |
| Health Care | | | — | | | | 294,727 | | | | — | | | | 294,727 | |
| Industrials | | | — | | | | 4,245,158 | | | | — | | | | 4,245,158 | |
| Information Technology | | | — | | | | 3,192,594 | | | | — | | | | 3,192,594 | |
| Materials | | | — | | | | 1,534,076 | | | | — | | | | 1,534,076 | |
| Utilities | | | — | | | | 137,372 | | | | — | | | | 137,372 | |
| Total Common Stock | | $ | — | | | $ | 12,985,636 | | | $ | — | | | $ | 12,985,636 | |
| Short-Term Investments | | | | | | | | | | | | | | | | |
| Money Market Funds | | $ | 593,380 | | | $ | — | | | $ | — | | | $ | 593,380 | |
| Total Short-Term Investments | | $ | 593,380 | | | $ | — | | | $ | — | | | $ | 593,380 | |
| Total Investments in Securities | | $ | 593,380 | | | $ | 12,985,636 | | | $ | — | | | $ | 13,579,016 | |
Transfers between levels are recognized at the end of the reporting period. During the period ended April 30, 2012, the Fund recognized transfers between Levels 1 and 2.
Level 2 Reconciliation Disclosure
Following is a reconciliation of Level 2 assets for which unobservable inputs were used to determine fair value:
| | | Common Stocks | |
| Transfers into Level 2 | | $ | 12,985,636 | |
| Transfers out of Level 2 | | | — | |
| Net transfers in and/or out of Level 2 | | $ | 12,985,636 | |
Transfers between Level 1 and Level 2 relate to the use of a fair valuation pricing service. On days when the fair valuation pricing service used, non-U.S. dollar denominated securities move from a Level 1 to a Level 2 classification.
The accompanying notes are an integral part of these financial statements.
HENNESSY FUNDS 1-800-966-4354
Financial Statements
Statements of Assets and Liabilities as of April 30, 2012 (Unaudited) |
ASSETS:
Investments in securities, at value (cost $105,793,760, $17,444,083, and $11,650,569 respectively)
Dividends and interest receivable
Receivable for fund shares sold
Receivable for securities sold
Prepaid expenses and other assets
Total Assets
LIABILITIES:
Payable for securities purchased
Payable for fund shares redeemed
Payable to advisor
Payable to administrator
Payable to auditor
Accrued interest payable
Accrued service fees
Accrued expenses and other payables
Total Liabilities
NET ASSETS
NET ASSETS CONSIST OF:
Capital stock
Accumulated net investment income (loss)
Accumulated net realized gain (loss) on investments
Unrealized net appreciation (depreciation) on investments and foreign currency related transactions
Total Net Assets
NET ASSETS
Original Class:
Shares authorized (no par value, $0.001 and $0.001 par value, respectively)
Net assets applicable to outstanding Original Class shares
Shares issued and outstanding
Net asset value, offering price and redemption price per share
Institutional Class:
Shares authorized (no par value and $0.001 par value, respectively)
Net assets applicable to outstanding Institutional Class shares
Shares issued and outstanding
Net asset value, offering price and redemption price per share
The accompanying notes are an integral part of these financial statements.
| | | | | | | HENNESSY | |
| HENNESSY | | | HENNESSY | | | SELECT SPARX | |
| SELECT LARGE | | | SELECT SPARX | | | JAPAN SMALLER | |
| VALUE FUND | | | JAPAN FUND | | | COMPANIES FUND | |
| | | | | | | | |
| $ | 127,435,797 | | | $ | 20,305,129 | | | $ | 13,579,016 | |
| | 130,102 | | | | 212,319 | | | | 163,639 | |
| | 1,396 | | | | 20,715 | | | | 3,000 | |
| | 2,728,321 | | | | — | | | | 100,652 | |
| | 26,062 | | | | 18,017 | | | | 10,220 | |
| | 130,321,678 | | | | 20,556,180 | | | | 13,856,527 | |
| | | | | | | | | | | |
| | | | | | | | | | | |
| | 1,380,515 | | | | — | | | | — | |
| | 126,003 | | | | 23,153 | | | | 34,140 | |
| | 89,303 | | | | 16,918 | | | | 13,230 | |
| | 81,947 | | | | 12,823 | | | | 11,500 | |
| | 9,667 | | | | 9,900 | | | | 8,735 | |
| | — | | | | 19 | | | �� | — | |
| | 10,502 | | | | 846 | | | | 1,103 | |
| | 17,585 | | | | 9,294 | | | | 5,276 | |
| | 1,715,522 | | | | 72,953 | | | | 73,984 | |
| | | | | | | | | | | |
| $ | 128,606,156 | | | $ | 20,483,227 | | | $ | 13,782,543 | |
| | | | | | | | | | | |
| | | | | | | | | | | |
| $ | 141,741,261 | | | $ | 50,799,526 | | | $ | 11,745,137 | |
| | 357,784 | | | | 7,949 | | | | (319,240 | ) |
| | (35,134,926 | ) | | | (33,192,925 | ) | | | 420,432 | |
| | 21,642,037 | | | | 2,868,677 | | | | 1,936,214 | |
| $ | 128,606,156 | | | $ | 20,483,227 | | | $ | 13,782,543 | |
| | | | | | | | | | | |
| | | | | | | | | | | |
| | | | | | | | | | | |
| Unlimited | | | Unlimited | | | Unlimited | |
| | 128,554,874 | | | | 10,025,889 | | | | 13,782,543 | |
| | 5,338,150 | | | | 666,987 | | | | 1,223,013 | |
| $ | 24.08 | | | $ | 15.03 | | | $ | 11.27 | |
| | | | | | | | | | | |
| | | | | | | | | | | |
| Unlimited | | | Unlimited | | | | N/A | |
| | 51,282 | | | | 10,457,338 | | | | N/A | |
| | 2,124 | | | | 687,614 | | | | N/A | |
| $ | 24.14 | | | $ | 15.21 | | | | N/A | |
HENNESSY FUNDS 1-800-966-4354
Financial Statements
Statements of Operations Six Months Ended April 30, 2012 (Unaudited) |
INVESTMENT INCOME:
Dividend income(1)
Interest income
Total investment income
EXPENSES:
Investment advisory fees
Administration, fund accounting, custody and transfer agent fees
Service fees – Original Class (See Note 5)
Federal and state registration fees
Audit fees
Legal fees
Compliance expense
Reports to shareholders
Trustees’ fees and expenses
Sub-transfer agent expenses – Original Class (See Note 5)
Sub-transfer agent expenses – Institutional Class (See Note 5)
Interest expense (See Note 5)
Other
Total expenses before reimbursement/waiver
Administration expense waiver – Institutional Class (See Note 5)
Net expenses
NET INVESTMENT INCOME (LOSS)
REALIZED AND UNREALIZED GAINS (LOSSES):
Net realized gain (loss) on investments
Change in unrealized appreciation (depreciation) on investments
NET REALIZED GAIN (LOSS) AND UNREALIZED GAIN (LOSS) ON INVESTMENTS
NET INCREASE (DECREASE) IN NET ASSETS RESULTING FROM OPERATIONS
| (1) | Net of foreign taxes withheld of $828, $16,535 and $14,337, respectively. |
The accompanying notes are an integral part of these financial statements.
| | | | | | | HENNESSY | |
| HENNESSY | | | HENNESSY | | | SELECT SPARX | |
| SELECT LARGE | | | SELECT SPARX | | | JAPAN SMALLER | |
| VALUE FUND | | | JAPAN FUND | | | COMPANIES FUND | |
| | | | | | | | |
| $ | 1,604,446 | | | $ | 219,639 | | | $ | 195,249 | |
| | 62 | | | | 75 | | | | 35 | |
| | 1,604,508 | | | | 219,714 | | | | 195,284 | |
| | | | | | | | | | | |
| | | | | | | | | | | |
| | 534,454 | | | | 110,648 | | | | 124,262 | |
| | 160,336 | | | | 28,216 | | | | 26,406 | |
| | 62,855 | | | | 6,113 | | | | 10,355 | |
| | 15,544 | | | | 20,019 | | | | 10,336 | |
| | 10,465 | | | | 10,352 | | | | 9,439 | |
| | 3,491 | | | | 3,491 | | | | 3,491 | |
| | 5,433 | | | | 5,433 | | | | 5,433 | |
| | 18,948 | | | | 5,984 | | | | 3,241 | |
| | 4,985 | | | | 4,987 | | | | 4,987 | |
| | 49,327 | | | | 6,316 | | | | 17,675 | |
| | — | | | | 1,984 | | | | N/A | |
| | — | | | | 2,204 | | | | 3,152 | |
| | 7,280 | | | | 6,018 | | | | 6,166 | |
| | 873,118 | | | | 211,765 | | | | 224,943 | |
| | (51 | ) | | | — | | | | N/A | |
| | 873,067 | | | | 211,765 | | | | 224,943 | |
| $ | 731,441 | | | $ | 7,949 | | | $ | (29,659 | ) |
| | | | | | | | | | | |
| | | | | | | | | | | |
| $ | 4,585,738 | | | $ | (568,038 | ) | | $ | 1,117,995 | |
| | 10,340,677 | | | | 2,063,475 | | | | 1,417,479 | |
| | 14,926,415 | | | | 1,495,437 | | | | 2,535,474 | |
| | | | | | | | | | | |
| $ | 15,657,856 | | | $ | 1,503,386 | | | $ | 2,505,815 | |
HENNESSY FUNDS 1-800-966-4354
Financial Statements
| Statements of Changes in Net Assets |
OPERATIONS:
Net investment income (loss)
Net realized gain (loss)
Change in unrealized appreciation (depreciation)
Net increase (decrease) in net assets resulting from operations
DISTRIBUTIONS TO SHAREHOLDERS FROM:
Net investment income – Original Class
Net investment income – Institutional Class
Total distributions
CAPITAL SHARE TRANSACTIONS:
Proceeds from shares subscribed – Original Class
Proceeds from shares subscribed – Institutional Class
Dividends reinvested – Original Class
Dividends reinvested – Institutional Class
Cost of shares redeemed – Original Class
Cost of shares redeemed – Institutional Class
Redemption fees retained – Original Class
Redemption fees retained – Institutional Class
Net increase (decrease) in net assets derived from capital share transactions
TOTAL INCREASE (DECREASE) IN NET ASSETS
NET ASSETS:
Beginning of period
End of period
Accumulated net investment income (loss), end of period
CHANGES IN SHARES OUTSTANDING:
Shares sold – Original Class
Shares sold – Institutional Class
Shares issued to holders as reinvestment of dividends – Original Class
Shares issued to holders as reinvestment of dividends – Institutional Class
Shares redeemed – Original Class
Shares redeemed – Institutional Class
Net increase (decrease) in shares outstanding
The accompanying notes are an integral part of these financial statements.
| | | | | | | | | | | | | Hennessy Select SPARX | |
| Hennessy Select Large | | | Hennessy Select SPARX | | | Japan Smaller | |
| Value Fund | | | Japan Fund | | | Companies Fund | |
| | | | | | | | | | | | | | | | | |
| Six Months | | | | | | Six Months | | | | | | Six Months | | | | |
| Ended | | | | | | Ended | | | | | | Ended | | | | |
| April 30, 2012 | | | Year Ended | | | April 30, 2012 | | | Year Ended | | | April 30, 2012 | | | Year Ended | |
| (Unaudited) | | | October 31, 2011 | | | (Unaudited) | | | October 31, 2011 | | | (Unaudited) | | | October 31, 2011 | |
| | | | | | | | | | | | | | | | | |
| $ | 731,441 | | | $ | 1,283,875 | | | $ | 7,949 | | | $ | (82,227 | ) | | $ | (29,659 | ) | | $ | 41,453 | |
| | 4,585,738 | | | | 11,600,606 | | | | (568,038 | ) | | | 1,052,378 | | | | 1,117,995 | | | | 1,413,091 | |
| | 10,340,677 | | | | (5,464,551 | ) | | | 2,063,475 | | | | (4,618,650 | ) | | | 1,417,479 | | | | (331,017 | ) |
| | 15,657,856 | | | | 7,419,930 | | | | 1,503,386 | | | | (3,648,499 | ) | | | 2,505,815 | | | | 1,123,527 | |
| | | | | | | | | | | | | | | | | | | | | | | |
| | | | | | | | | | | | | | | | | | | | | | | |
| | (1,007,288 | ) | | | (1,291,601 | ) | | | — | | | | — | | | | (99,101 | ) | | | — | |
| | (471 | ) | | | (582 | ) | | | — | | | | — | | | | N/A | | | | N/A | |
| | (1,007,759 | ) | | | (1,292,183 | ) | | | — | | | | — | | | | (99,101 | ) | | | — | |
| | | | | | | | | | | | | | | | | | | | | | | |
| | | | | | | | | | | | | | | | | | | | | | | |
| | 663,555 | | | | 1,847,792 | | | | 3,409,633 | | | | 68,660,478 | | | | 1,549,827 | | | | 18,301,075 | |
| | 9,393 | | | | 10,610 | | | | 112,755 | | | | 1,179,768 | | | | N/A | | | | N/A | |
| | 961,882 | | | | 1,235,299 | | | | — | | | | — | | | | 95,320 | | | | — | |
| | 471 | | | | 528 | | | | — | | | | — | | | | N/A | | | | N/A | |
| | (11,684,930 | ) | | | (16,781,736 | ) | | | (8,963,371 | ) | | | (68,498,891 | ) | | | (14,352,377 | ) | | $ | (10,506,632 | ) |
| | (289 | ) | | | (12,669 | ) | | | (90,653 | ) | | | (16,765,426 | ) | | | N/A | | | | N/A | |
| | — | | | | — | | | | — | | | | 222 | | | | — | | | | 32 | |
| | — | | | | — | | | | — | | | | — | | | | N/A | | | | N/A | |
| | (10,049,918 | ) | | | (13,700,176 | ) | | | (5,531,636 | ) | | | (15,423,849 | ) | | $ | (12,707,230 | ) | | | 7,794,475 | |
| | 4,600,179 | | | | (7,572,429 | ) | | | (4,028,250 | ) | | | (19,072,348 | ) | | | (10,300,516 | ) | | | 8,918,002 | |
| | | | | | | | | | | | | | | | | | | | | | | |
| | | | | | | | | | | | | | | | | | | | | | | |
| | 124,005,977 | | | | 131,578,406 | | | | 24,511,477 | | | | 43,583,825 | | | | 24,083,059 | | | | 15,165,057 | |
| $ | 128,606,156 | | | $ | 124,005,977 | | | $ | 20,483,227 | | | $ | 24,511,477 | | | $ | 13,782,543 | | | $ | 24,083,059 | |
| | | | | | | | | | | | | | | | | | | | | | | |
| $ | 357,784 | | | $ | 634,102 | | | $ | 7,949 | | | $ | — | | | $ | (319,240 | ) | | $ | (190,480 | ) |
| | | | | | | | | | | | | | | | | | | | | | | |
| | | | | | | | | | | | | | | | | | | | | | | |
| | 29,069 | | | | 84,224 | | | | 237,841 | | | | 4,803,522 | | | | 144,957 | | | | 1,751,882 | |
| | 424 | | | | 497 | | | | 7,536 | | | | 80,655 | | | | N/A | | | | N/A | |
| | 43,941 | | | | 56,743 | | | | — | | | | — | | | | 9,571 | | | | — | |
| | 21 | | | | 24 | | | | — | | | | — | | | | N/A | | | | N/A | |
| | (510,208 | ) | | | (759,938 | ) | | | (629,548 | ) | | | (5,335,288 | ) | | | (1,319,221 | ) | | | (1,007,763 | ) |
| | (13 | ) | | | (615 | ) | | | (6,235 | ) | | | (1,256,328 | ) | | | N/A | | | | N/A | |
| | (436,766 | ) | | | (619,065 | ) | | | (390,406 | ) | | | (1,707,439 | ) | | | (1,164,693 | ) | | | 744,119 | |
HENNESSY FUNDS 1-800-966-4354
Financial Highlights
| Hennessy Select Large Value Fund |
For an Original Class share outstanding throughout each period
| | | Six Months Ended | |
| | | April 30, 2012 | |
| | | (Unaudited) | |
| PER SHARE DATA: | | | |
| Net asset value, beginning of period | | $ | 21.47 | |
| | | | | |
| Income from investment operations: | | | | |
| Net investment income (loss) | | | 0.14 | |
| Net realized and unrealized gains (losses) on securities | | | 2.65 | |
| Total from investment operations | | | 2.79 | |
| | | | | |
| Less Distributions: | | | | |
| Dividends from net investment income | | | (0.18 | ) |
| Dividends from net realized gains | | | — | |
| Total distributions | | | (0.18 | ) |
| Net asset value, end of period | | $ | 24.08 | |
| | | | | |
| TOTAL RETURN | | | 13.07 | %(4) |
| | | | | |
| SUPPLEMENTAL DATA AND RATIOS: | | | | |
| Net assets, end of period (millions) | | $ | 128.55 | |
| Ratio of expenses to average net assets: | | | | |
| Before expense reimbursement | | | 1.39 | %(5) |
| After expense reimbursement | | | 1.39 | %(5) |
| Ratio of net investment income to average net assets | | | | |
| Before expense reimbursement | | | 1.16 | %(5) |
| After expense reimbursement | | | 1.16 | %(5) |
Portfolio turnover rate(6) | | | 52 | %(4) |
| (1) | For the one month ended October 31, 2009. Effective October 31, 2009, the Fund changed its fiscal year end to October 31st from September 30th. |
| (2) | The financial highlights set forth for periods prior to March 20, 2009 represent the historical financial highlights of the Tamarack Value Fund, Class S shares. The assets of the Tamarack Value Fund were acquired by the Hennessy Select Large Value Fund on March 20, 2009. Prior to the reorganization, Tamarack Value Fund also offered Class A, Class C and R shares. At that time RBC Global Asset Management (U.S.), Inc., (formerly known as Voyageur Asset Management Inc.) ceased to be investment advisor and Hennessy Advisors, Inc. became investment advisor. The return of the Tamarack Value Fund, Class S shares during the period October 1, 2008 through March 20, 2009 was (33.09)%. The return of the Hennessy Select Large Value Fund, Original Class shares during the period March 20, 2009 through September 30, 2009 was 36.84%. |
| (3) | Per share net investment income (loss) has been calculated using the average daily shares method. |
| (4) | Not Annualized. |
| (5) | Annualized. |
| (6) | Portfolio turnover is calculated on the basis of the Fund as a whole. |
The accompanying notes are an integral part of these financial statements.
| | | | | | | One Month | | | | | | | | | | |
| | | | | | | Ended | | | | | | | | | | |
| Year Ended October 31, | | | October 31, | | | Year Ended September 30, | |
| 2011 | | | 2010 | | | 2009(1) | | | 2009(2) | | | 2008(2) | | | 2007(2) | |
| | | | | | | | | | | | | | | | | |
| $ | 20.57 | | | $ | 18.88 | | | $ | 19.49 | | | $ | 21.80 | | | $ | 43.12 | | | $ | 41.74 | |
| | | | | | | | | | | | | | | | | | | | | | | |
| | 0.22 | | | | 0.14 | | | | 0.01 | | | | 0.31 | | | | 0.42 | (3) | | | 0.58 | (3) |
| | 0.89 | | | | 1.78 | | | | (0.62 | ) | | | (2.21 | ) | | | (7.43 | ) | | | 5.04 | |
| | 1.11 | | | | 1.92 | | | | (0.61 | ) | | | (1.90 | ) | | | (7.01 | ) | | | 5.62 | |
| | | | | | | | | | | | | | | | | | | | | | | |
| | (0.21 | ) | | | (0.23 | ) | | | — | | | | (0.41 | ) | | | (0.78 | ) | | | (0.63 | ) |
| | — | | | | — | | | | — | | | | — | | | | (13.53 | ) | | | (3.61 | ) |
| | (0.21 | ) | | | (0.23 | ) | | | — | | | | (0.41 | ) | | | (14.31 | ) | | | (4.24 | ) |
| $ | 21.47 | | | $ | 20.57 | | | $ | 18.88 | | | $ | 19.49 | | | $ | 21.80 | | | $ | 43.12 | |
| | 5.36 | % | | | 10.22 | % | | | (3.13 | )%(4) | | | (8.43 | )% | | | (22.42 | )% | | | 14.19 | % |
| | | | | | | | | | | | | | | | | | | | | | | |
| | | | | | | | | | | | | | | | | | | | | | | |
| $ | 123.97 | | | $ | 131.54 | | | $ | 132.77 | | | $ | 138.34 | | | $ | 174.23 | | | $ | 269.37 | |
| | | | | | | | | | | | | | | | | | | | | | | |
| | 1.38 | % | | | 1.41 | % | | | 1.37 | %(5) | | | 1.42 | % | | | 1.22 | % | | | 1.26 | % |
| | 1.38 | % | | | 1.38 | % | | | 1.30 | %(5) | | | 1.17 | % | | | 1.02 | % | | | 1.03 | % |
| | | | | | | | | | | | | | | | | | | | | | | |
| | 0.97 | % | | | 0.64 | % | | | 0.28 | %(5) | | | 1.46 | % | | | 1.32 | % | | | 1.13 | % |
| | 0.97 | % | | | 0.67 | % | | | 0.35 | %(5) | | | 1.71 | % | | | 1.52 | % | | | 1.36 | % |
| | 149 | % | | | 146 | % | | | 10 | %(4) | | | 142 | % | | | 162 | % | | | 136 | % |
HENNESSY FUNDS 1-800-966-4354
Financial Highlights
| Hennessy Select Large Value Fund |
For an Institutional Class share outstanding throughout each period
| | | Six Months Ended | |
| | | April 30, 2012 | |
| | | (Unaudited) | |
| PER SHARE DATA: | | | |
| Net asset value, beginning of period | | $ | 21.56 | |
| | | | | |
| Income from investment operations: | | | | |
| Net investment income (loss) | | | 0.21 | |
| Net realized and unrealized gains (losses) on securities | | | 2.64 | |
| Total from investment operations | | | 2.85 | |
| | | | | |
| Less Distributions: | | | | |
| Dividends from net investment income | | | (0.27 | ) |
| Dividends from net realized gains | | | — | |
| Total distributions | | | (0.27 | ) |
| Net asset value, end of period | | $ | 24.14 | |
| | | | | |
| TOTAL RETURN | | | 13.34 | %(4) |
| | | | | |
| SUPPLEMENTAL DATA AND RATIOS: | | | | |
| Net assets, end of period (millions) | | $ | 0.05 | |
| Ratio of expenses to average net assets: | | | | |
| Before expense reimbursement | | | 1.21 | %(5) |
| After expense reimbursement | | | 0.98 | %(5) |
| Ratio of net investment income to average net assets | | | | |
| Before expense reimbursement | | | 1.28 | %(5) |
| After expense reimbursement | | | 1.51 | %(5) |
Portfolio turnover rate(6) | | | 52 | %(4) |
| (1) | For the one month ended October 31, 2009. Effective October 31, 2009, the Fund changed its fiscal year end to October 31st from September 30th. |
| (2) | Institutional Class shares commenced operations on March 20, 2009. |
| (3) | Amount is less than $0.01 or $(0.01). |
| (4) | Not annualized. |
| (5) | Annualized. |
| (6) | Portfolio turnover is calculated on the basis of the Fund as a whole. |
The accompanying notes are an integral part of these financial statements.
| | | | | | | One Month | | | | |
| | | | | | | Ended | | | Period Ended | |
| Year Ended October 31, | | | October 31, | | | September 30, | |
| 2011 | | | 2010 | | | 2009(1) | | | 2009(2) | |
| | | | | | | | | | | |
| $ | 20.65 | | | $ | 18.92 | | | $ | 19.53 | | | $ | 14.25 | |
| | | | | | | | | | | | | | | |
| | | | | | | | | | | | | | | |
| | 0.27 | | | | 0.21 | | | | — | (3) | | | 0.08 | |
| | 0.92 | | | | 1.80 | | | | (0.61 | ) | | | 5.20 | |
| | 1.19 | | | | 2.01 | | | | (0.61 | ) | | | 5.28 | |
| | | | | | | | | | | | | | | |
| | | | | | | | | | | | | | | |
| | (0.28 | ) | | | (0.28 | ) | | | — | | | | — | |
| | — | | | | — | | | | — | | | | — | |
| | (0.28 | ) | | | (0.28 | ) | | | — | | | | — | |
| $ | 21.56 | | | $ | 20.65 | | | $ | 18.92 | | | $ | 19.53 | |
| | | | | | | | | | | | | | | |
| | 5.76 | % | | | 10.65 | % | | | (3.12 | )%(4) | | | 37.05 | %(4) |
| | | | | | | | | | | | | | | |
| | | | | | | | | | | | | | | |
| $ | 0.04 | | | $ | 0.04 | | | $ | 0.03 | | | $ | 0.03 | |
| | | | | | | | | | | | | | | |
| | 1.21 | % | | | 1.22 | % | | | 1.20 | %(5) | | | 26.18 | %(5) |
| | 0.98 | % | | | 0.98 | % | | | 0.98 | %(5) | | | 0.98 | %(5) |
| | | | | | | | | | | | | | | |
| | 1.13 | % | | | 0.80 | % | | | 0.44 | %(5) | | | (24.06 | )%(5) |
| | 1.36 | % | | | 1.04 | % | | | 0.66 | %(5) | | | 1.14 | %(5) |
| | 149 | % | | | 146 | % | | | 10 | %(4) | | | 142 | %(4) |
HENNESSY FUNDS 1-800-966-4354
Financial Highlights
| Hennessy Select SPARX Japan Fund |
For an Original Class share outstanding throughout each period
| | | Six Months Ended | |
| | | April 30, 2012 | |
| | | (Unaudited) | |
| PER SHARE DATA: | | | |
| Net asset value, beginning of period | | $ | 13.99 | |
| | | | | |
| Income from investment operations: | | | | |
| Net investment income (loss) | | | (0.01 | ) |
| Net realized and unrealized gains (losses) on securities | | | 1.05 | |
| Total from investment operations | | | 1.04 | |
| | | | | |
| Less Distributions: | | | | |
| Dividends from net investment income | | | — | |
| Dividends from net realized gains | | | — | |
| Return of capital | | | — | |
| Total distributions | | | — | |
| Redemption fees retained | | | — | |
| Net asset value, end of period | | $ | 15.03 | |
| | | | | |
| TOTAL RETURN | | | 7.43 | %(3) |
| | | | | |
| SUPPLEMENTAL DATA AND RATIOS: | | | | |
| Net assets, end of period (millions) | | $ | 10.03 | |
| Ratio of expenses to average net assets: | | | | |
| Before expense reimbursement | | | 1.98 | %(4) |
| After expense reimbursement | | | 1.98 | %(4) |
| Ratio of net investment income (loss) to average net assets | | | | |
| Before expense reimbursement | | | (0.12 | )%(4) |
| After expense reimbursement | | | (0.12 | )%(4) |
Portfolio turnover rate(5) | | | 2 | %(3) |
| (1) | The financial highlights set forth for periods prior to September 17, 2009 represent the historical financial highlights of the SPARX Japan Fund. On September 17, 2009 Hennessy Advisors, Inc., became the investment advisor to the Fund and the Fund changed its name to Hennessy Select SPARX Japan Fund. In addition, the Investor Class shares were redesignated Original Class shares. |
| (2) | Amount is less than $0.01. |
| (3) | Not annualized. |
| (4) | Annualized. |
| (5) | Portfolio turnover is calculated on the basis of the Fund as a whole. |
The accompanying notes are an integral part of these financial statements.
| Year Ended October 31, | |
| 2011 | | | 2010 | | | 2009(1) | | | 2008(1) | | | 2007(1) | |
| | | | | | | | | | | | | | |
| $ | 12.58 | | | $ | 11.38 | | | $ | 9.73 | | | $ | 16.24 | | | $ | 17.20 | |
| | | | | | | | | | | | | | | | | | | |
| | (0.10 | ) | | | (0.04 | ) | | | 0.02 | | | | 0.05 | | | | (0.03 | ) |
| | 1.51 | | | | 1.25 | | | | 1.66 | | | | (6.56 | ) | | | (0.93 | ) |
| | 1.41 | | | | 1.21 | | | | 1.68 | | | | (6.51 | ) | | | (0.96 | ) |
| | | | | | | | | | | | | | | | | | | |
| | — | | | | (0.01 | ) | | | (0.03 | ) | | | — | | | | — | |
| | — | | | | — | | | | — | | | | — | | | | — | |
| | — | | | | (0.01 | ) | | | — | | | | — | | | | — | |
| | — | | | | (0.02 | ) | | | (0.03 | ) | | | — | | | | — | |
| | — | | | | 0.01 | | | | — | (2) | | | — | (2) | | | — | |
| $ | 13.99 | | | $ | 12.58 | | | $ | 11.38 | | | $ | 9.73 | | | $ | 16.24 | |
| | 11.21 | % | | | 11.04 | % | | | 17.36 | % | | | (40.09 | )% | | | (5.58 | )% |
| | | | | | | | | | | | | | | | | | | |
| | | | | | | | | | | | | | | | | | | |
| $ | 14.81 | | | $ | 20.01 | | | $ | 28.29 | | | $ | 15.86 | | | $ | 19.54 | |
| | | | | | | | | | | | | | | | | | | |
| | 1.86 | % | | | 1.71 | % | | | 1.75 | % | | | 1.72 | % | | | 1.87 | % |
| | 1.86 | % | | | 1.59 | % | | | 1.24 | % | | | 1.25 | % | | | 1.45 | % |
| | | | | | | | | | | | | | | | | | | |
| | (0.54 | )% | | | (0.27 | )% | | | (0.34 | )% | | | (0.10 | )% | | | (0.62 | )% |
| | (0.54 | )% | | | (0.15 | )% | | | 0.17 | % | | | 0.37 | % | | | (0.20 | )% |
| | 166 | % | | | 8 | % | | | 17 | % | | | 35 | % | | | 111 | % |
HENNESSY FUNDS 1-800-966-4354
Financial Highlights
| Hennessy Select SPARX Japan Fund |
For an Institutional Class share outstanding throughout each period
| | | Six Months Ended | |
| | | April 30, 2012 | |
| | | (Unaudited) | |
| PER SHARE DATA: | | | |
| Net asset value, beginning of period | | $ | 14.14 | |
| | | | | |
| Income from investment operations: | | | | |
| Net investment income (loss) | | | 0.02 | |
| Net realized and unrealized gains (losses) on securities | | | 1.05 | |
| Total from investment operations | | | 1.07 | |
| | | | | |
| Less Distributions: | | | | |
| Dividends from net investment income | | | — | |
| Dividends from net realized gains | | | — | |
| Return of capital | | | — | |
| Total distributions | | | — | |
| Redemption fees retained | | | — | |
| Net asset value, end of period | | $ | 15.21 | |
| | | | | |
| TOTAL RETURN | | | 7.57 | %(3) |
| | | | | |
| SUPPLEMENTAL DATA AND RATIOS: | | | | |
| Net assets, end of period (millions) | | $ | 10.46 | |
| Ratio of expenses to average net assets: | | | | |
| Before expense reimbursement | | | 1.84 | %(4) |
| After expense reimbursement | | | 1.84 | %(4) |
| Ratio of net investment income (loss) to average net assets | | | | |
| Before expense reimbursement | | | 0.30 | %(4) |
| After expense reimbursement | | | 0.30 | %(4) |
Portfolio turnover rate(5) | | | 2 | %(3) |
| (1) | The financial highlights set forth for periods prior to September 17, 2009 represent the historical financial highlights of the SPARX Japan Fund. On September 17, 2009 Hennessy Advisors, Inc., became the investment advisor to the Fund and the Fund changed its name to Hennessy Select SPARX Japan Fund. |
| (2) | Amount is less than $0.01 or $(0.01). |
| (3) | Not annualized. |
| (4) | Annualized. |
| (5) | Portfolio turnover is calculated on the basis of the Fund as a whole. |
The accompanying notes are an integral part of these financial statements.
| Year Ended October 31, | |
| 2011 | | | 2010 | | | 2009(1) | | | 2008(1) | | | 2007(1) | |
| | | | | | | | | | | | | | |
| $ | 12.66 | | | $ | 11.44 | | | $ | 9.78 | | | $ | 16.33 | | | $ | 17.27 | |
| | | | | | | | | | | | | | | | | | | |
| | 0.03 | | | | 0.01 | | | | 0.03 | | | | 0.05 | | | | — | (2) |
| | 1.45 | | | | 1.23 | | | | 1.66 | | | | (6.60 | ) | | | (0.94 | ) |
| | 1.48 | | | | 1.24 | | | | 1.69 | | | | (6.55 | ) | | | (0.94 | ) |
| | | | | | | | | | | | | | | | | | | |
| | — | | | | (0.01 | ) | | | (0.03 | ) | | | — | | | | — | |
| | — | | | | — | | | | — | | | | — | | | | — | |
| | — | | | | (0.01 | ) | | | — | | | | — | | | | — | |
| | — | | | | (0.02 | ) | | | (0.03 | ) | | | — | | | | — | |
| | — | | | | — | | | | — | (2) | | | — | (2) | | | — | |
| $ | 14.14 | | | $ | 12.66 | | | $ | 11.44 | | | $ | 9.78 | | | $ | 16.33 | |
| | 11.69 | % | | | 11.07 | % | | | 17.37 | % | | | (40.11 | )% | | | (5.44 | )% |
| | | | | | | | | | | | | | | | | | | |
| | | | | | | | | | | | | | | | | | | |
| $ | 9.70 | | | $ | 23.57 | | | $ | 25.55 | | | $ | 37.03 | | | $ | 82.94 | |
| | | | | | | | | | | | | | | | | | | |
| | 1.64 | % | | | 1.45 | % | | | 1.75 | % | | | 1.72 | % | | | 1.67 | % |
| | 1.64 | % | | | 1.40 | % | | | 1.24 | % | | | 1.25 | % | | | 1.25 | % |
| | | | | | | | | | | | | | | | | | | |
| | 0.19 | % | | | 0.02 | % | | | (0.34 | )% | | | (0.10 | )% | | | (0.42 | )% |
| | 0.19 | % | | | 0.07 | % | | | 0.17 | % | | | 0.37 | % | | | 0.00 | % |
| | 166 | % | | | 8 | % | | | 17 | % | | | 35 | % | | | 111 | % |
HENNESSY FUNDS 1-800-966-4354
Financial Highlights
| Hennessy Select SPARX Japan Smaller Companies Fund |
For an Original Class share outstanding throughout each period
| | | Six Months Ended | |
| | | April 30, 2012 | |
| | | (Unaudited) | |
| PER SHARE DATA: | | | |
| Net asset value, beginning of period | | $ | 10.09 | |
| | | | | |
| Income from investment operations: | | | | |
| Net investment income (loss) | | | (0.14 | ) |
| Net realized and unrealized gains (losses) on securities | | | 1.36 | |
| Total from investment operations | | | 1.22 | |
| | | | | |
| Less Distributions: | | | | |
| Dividends from net investment income | | | (0.04 | ) |
| Dividends from net realized gains | | | — | |
| Total distributions | | | (0.04 | ) |
| Redemption fees retained | | | — | |
| Net asset value, end of period | | $ | 11.27 | |
| | | | | |
| TOTAL RETURN | | | 12.18 | %(5) |
| | | | | |
| SUPPLEMENTAL DATA AND RATIOS: | | | | |
| Net assets, end of period (millions) | | $ | 13.78 | |
| Ratio of expenses to average net assets: | | | | |
| Before expense reimbursement | | | 2.17 | %(6) |
| After expense reimbursement | | | 2.17 | %(6) |
| Ratio of net investment income (loss) to average net assets | | | | |
| Before expense reimbursement | | | (0.29 | )%(6) |
| After expense reimbursement | | | (0.29 | )%(6) |
Portfolio turnover rate(7) | | | 24 | %(5) |
| (1) | The financial highlights set forth for periods prior to September 17, 2009 represent the historical financial highlights of the SPARX Japan Smaller Companies Fund. On September 17, 2009 Hennessy Advisors, Inc., became the investment advisor to the Fund and the Fund changed its name to Hennessy Select SPARX Japan Smaller Companies Fund. In addition, the Investor Class shares were redesignated Original Class shares. |
| (2) | The Fund commenced operations on August 31, 2007 |
| (3) | Amount is less than $0.01 or $(0.01). |
| (4) | Calculated based on average shares outstanding. |
| (5) | Not annualized. |
| (6) | Annualized. |
| (7) | Portfolio turnover is calculated on the basis of the Fund as a whole. |
The accompanying notes are an integral part of these financial statements.
| | | | | | | | | | | | | Period Ended | |
| Year Ended October 31, | | | October 31, | |
| 2011 | | | 2010 | | | 2009(1) | | | 2008(1) | | | 2007(1)(2) | |
| | | | | | | | | | | | | | |
| $ | 9.23 | | | $ | 9.74 | | | $ | 6.87 | | | $ | 10.98 | | | $ | 10.00 | |
| | | | | | | | | | | | | | | | | | | |
| | 0.06 | | | | — | (3) | | | 0.07 | | | | 0.02 | (4) | | | — | (3) |
| | 0.80 | | | | (0.10 | ) | | | 2.80 | | | | (4.08 | ) | | | 0.98 | |
| | 0.86 | | | | (0.10 | ) | | | 2.87 | | | | (4.06 | ) | | | 0.98 | |
| | | | | | | | | | | | | | | | | | | |
| | — | | | | (0.42 | ) | | | — | | | | (0.07 | ) | | | — | |
| | — | | | | — | | | | — | | | | — | | | | — | |
| | — | | | | (0.42 | ) | | | — | | | | (0.07 | ) | | | — | |
| | — | | | | 0.01 | | | | — | (3) | | | 0.02 | | | | — | |
| $ | 10.09 | | | $ | 9.23 | | | $ | 9.74 | | | $ | 6.87 | | | $ | 10.98 | |
| | 9.32 | % | | | (0.72 | )% | | | 41.78 | % | | | (37.00 | )% | | | 9.80 | %(5) |
| | | | | | | | | | | | | | | | | | | |
| | | | | | | | | | | | | | | | | | | |
| $ | 24.08 | | | $ | 15.17 | | | $ | 16.20 | | | $ | 11.74 | | | $ | 5.58 | |
| | | | | | | | | | | | | | | | | | | |
| | 2.10 | % | | | 2.14 | % | | | 3.10 | % | | | 4.47 | % | | | 9.73 | %(6) |
| | 2.10 | % | | | 2.01 | % | | | 1.60 | % | | | 1.60 | % | | | 1.60 | %(6) |
| | | | | | | | | | | | | | | | | | | |
| | 0.17 | % | | | (0.14 | )% | | | (0.86 | )% | | | (2.60 | )% | | | (8.15 | )%(6) |
| | 0.17 | % | | | (0.01 | )% | | | 0.64 | % | | | 0.26 | % | | | (0.02 | )%(6) |
| | 61 | % | | | 100 | % | | | 138 | % | | | 55 | % | | | 13 | %(5) |
HENNESSY FUNDS 1-800-966-4354
Notes to the Financial Statements
April 30, 2012 (Unaudited)
1). ORGANIZATION
The Hennessy Select Large Value Fund (the “Large Value Fund”) is organized as a separate investment portfolio or series of Hennessy Funds Trust, a Delaware statutory trust that was organized on September 17, 1992. The Large Value Fund is an open-end, diversified management investment company registered under the Investment Company Act of 1940, as amended (the “1940 Act”). The investment objective of the Large Value Fund is long-term growth of capital and current income.
The Hennessy Select SPARX Japan Fund (the “Japan Fund”) and the Hennessy Select SPARX Japan Smaller Companies Fund (the “Japan Smaller Companies Fund”) are organized as separate investment portfolios or series of Hennessy SPARX Funds Trust, a Massachusetts business trust that was organized on July 24, 1995. The Japan Fund and the Japan Smaller Companies Fund are open-end, diversified management investment companies registered under the 1940 Act. Although these Funds will each be considered a “diversified” mutual fund, the Funds may employ a relatively focused investment strategy and may hold securities of fewer issuers than other diversified funds. The investment objective of the Japan Fund and the Japan Smaller Companies Fund is long-term capital appreciation.
The Large Value Fund, Japan Fund and Japan Smaller Companies Fund collectively represent the Hennessy Select Series Funds (the “Funds”).
The Large Value Fund and Japan Fund offer Original and Institutional Class shares. Each class of shares differs principally in its respective administration, shareholder servicing and transfer agent expenses and sales charges, if any. Each class has identical rights to earnings, assets and voting privileges, except for class-specific expenses and exclusive rights to vote on matters affecting only individual classes. The Japan Smaller Companies Fund offers only Original Class shares.
2). SIGNIFICANT ACCOUNTING POLICIES
The following is a summary of significant accounting policies consistently followed by the Funds in the preparation of the financial statements. These policies are in conformity with U.S. generally accepted accounting principles (“GAAP”).
| a). | Investment Valuation – All investments in securities are recorded at their estimated fair value, as described in Note 3. |
| | |
| b). | Federal Income Taxes – Provision for federal income taxes or excise taxes has not been made since the Funds have elected to be taxed as a “regulated investment company” and intend to distribute substantially all taxable income to shareholders and otherwise comply with the provisions of the Internal Revenue Code applicable to regulated investment companies. Net investment income and realized gains and losses for federal income tax |
| | purposes may differ from that reported on the financial statements because of temporary book and tax basis differences. Temporary differences are primarily the result of the treatment of wash sales for tax reporting purposes. Distributions from net realized gains for book purposes may include short-term capital gains, which are included as ordinary income to shareholders for tax purposes. |
| | |
| c). | Income and Expenses – Dividend income is recognized on the ex-dividend date or as soon as information is available to the Funds and interest income is recognized on an accrual basis. Income, expenses (other than expenses attributable to a specific class), and realized and unrealized gains or losses on investments are allocated to each class of shares based on its respective net assets. |
| | |
| d). | Distributions to Shareholders – Dividends from net investment income and distributions of net realized capital gains for the Funds, if any, are declared and paid out annually, usually in November or December of each year. |
| | |
| e). | Security Transactions – Investment and shareholder transactions are recorded on the trade date. The Funds determine the gain or loss realized from the investment transactions by comparing the original cost of the security lot sold with the net sale proceeds. Discounts and premiums on securities purchased are accreted/amortized over the life of the respective security. |
| | |
| | Foreign securities are recorded in the financial statements after translation to U.S. dollars based on the applicable exchange rate at the end of the period. The Funds do not isolate that portion of the results of operations resulting from changes in the currency exchange rate from the fluctuations resulting from changes in the market prices of investments. |
| | |
| f). | Use of Estimates – The preparation of financial statements in conformity with GAAP requires management to make estimates and assumptions that affect the reported amounts of assets and liabilities and disclosure of contingent assets and liabilities at the date of the financial statements and the reported change in net assets during the reporting period. Actual results could differ from those estimates. |
| | |
| g). | Share Valuation – The net asset value (“NAV”) per share of each Fund is calculated by dividing the sum of the value of the securities held, plus cash or other assets, minus all liabilities (including estimated accrued expenses) by the total number of shares outstanding, rounded to the nearest cent. The Funds’ shares will not be priced on the days on which the New York Stock Exchange is closed for trading. The offering and redemption price per share for each Fund is equal to each Fund’s net asset value per share. The Japan Fund and Japan Smaller Companies Funds charged a 2.00% redemption fee on shares held less than 60 days through January 29, 2010. These fees were retained by each Fund and treated as additional paid-in-capital and allocated to each respective class of shares (if applicable). |
| | |
| h). | Foreign Currency – Values of investments denominated in foreign currencies are converted into U.S. dollars using the spot market rate of exchange at the time of valuation. Purchases and sales of investments and income are translated into U.S. dollars using the spot market rate of |
HENNESSY FUNDS 1-800-966-4354
| | exchange prevailing on the respective dates of such transactions. The effect of changes in foreign exchange rates on realized and unrealized security gains and losses is reflected as a component of such gains or losses. Foreign investments present additional risks due to currency fluctuations, economic and political factors, lower liquidity, government regulations, differences in accounting standards and other factors. |
| | |
| i). | Forward Contracts – The Funds may enter into forward currency contracts to reduce their exposure to changes in foreign currency exchange rates on their foreign holdings and to lock in the U.S. dollar cost of firm purchase and sale commitments for securities denominated in foreign currencies. A forward currency contract is a commitment to purchase or sell a foreign currency at a future date at a negotiated forward rate. The gain or loss arising from the difference between the U.S. dollar cost of the original contract and the value of the foreign currency in U.S. dollars upon closing of such contract is included in net realized gain or loss from foreign currency transactions. During the six months ended April 30, 2012, the Funds did not enter into any forward contracts. |
| | |
| j). | Repurchase Agreements – The Funds may enter into repurchase agreements with member banks or security dealers of the Federal Reserve whom the investment advisor deems creditworthy. The repurchase price generally equals the price paid by the Fund plus interest negotiated on the basis of current short-term rates. |
| | |
| | Securities pledged as collateral for repurchase agreements are held by the custodian bank until the respective agreements mature. Provisions of the repurchase agreements ensure that the market value of the collateral, including accrued interest thereon, is sufficient, in the event of default of the counterparty. If the counterparty defaults and the value of the collateral declines or if the counterparty enters an insolvency proceeding, realization of the collateral by the Fund may be delayed or limited. |
| | |
| k). | Accounting for Uncertainty in Income Taxes – The Funds have adopted financial reporting rules regarding recognition and measurement of tax positions taken or expected to be taken on a tax return. The Funds have reviewed all open tax years and major jurisdictions and concluded that there is no impact on the Funds’ net assets and no tax liability resulting from unrecognized tax benefits relating to uncertain income tax positions taken or expected to be taken on a tax return. As of April 30, 2012, open Federal and state tax years for the Large Value Fund include the tax year ended September 30, 2009, the tax period ended October 31, 2009 and the tax years ended October 31, 2010 and October 31, 2011. As of April 30, 2012, open Federal and state tax years for the Japan Fund and Japan Smaller Companies Fund include the tax years ended October 31, 2009 through 2011. |
| | |
| l). | Derivatives – The Funds may invest in, or enter into, derivatives, such as options, futures contracts, options on futures contracts and swaps, for a variety of reasons, including to hedge certain risks, to provide a substitute for purchasing or selling particular securities or to increase potential income gain. Derivatives may provide a cheaper, quicker or more specifically focused |
| | way for a Fund to invest than “traditional” securities would. The main purpose of utilizing these derivative instruments is for hedging purposes. |
| | |
| | The Funds have adopted the financial accounting reporting rules as required by the Derivatives and Hedging Topic of the FASB Accounting Standards Codification (“FASB ASC”). The Funds are required to include enhanced disclosure that enables investors to understand how and why an entity uses derivatives, how derivatives are accounted for, and how derivatives instruments affect any entity’s results of operations and financial position. During the six months ended April 30, 2012, the Funds did not hold any derivative instruments. |
| | |
| m). | Events Subsequent to the Fiscal Period End – The Funds have adopted financial reporting rules regarding subsequent events which requires an entity to recognize in the financial statements the effects of all subsequent events that provide additional evidence about conditions that existed at the date of the balance sheet. Management has evaluated the Funds’ related events and transactions that occurred subsequent to April 30, 2012, through the date of issuance of the Funds’ financial statements. There were no events or transactions that occurred during this period that materially impacted the amounts or disclosures in the Funds’ financial statements. |
| | |
| n). | New Accounting Pronouncements – In May 2011, the Financial Accounting Standards Board (“FASB”) issued ASU No. 2011-04 “Amendments to Achieve Common Fair Value Measurement and Disclosure Requirements” in GAAP and the International Financial Reporting Standards (“IFRSs”). ASU No. 2011-04 amends FASB ASC Topic 820, Fair Value Measurements and Disclosures, to establish common requirements for measuring fair value and for disclosing information about fair value measurements in accordance with GAAP and IFRSs. ASU No. 2011-04 is effective for fiscal years beginning after December 15, 2011 and for interim periods within those fiscal years. Management is currently evaluating the impact of these amendments and does not believe they will have a material impact on the Funds’ financial statements. |
| | |
| | In December 2011, FASB issued ASU No. 2011-11 related to disclosures about offsetting assets and liabilities. The amendments in this ASU require an entity to disclose information about offsetting and related arrangements to enable users of its financial statements to understand the effect of those arrangements on its financial position. The ASU is effective for annual reporting periods beginning on or after January 1, 2013, and interim periods within those annual periods. The guidance requires retrospective applications for all comparative periods presented. Management is currently evaluating the impact ASU 2011-11 will have on the financial statements disclosures. |
3). SECURITIES VALUATION
The Funds have adopted authoritative fair valuation accounting standards which establish an authoritative definition of fair value and set out a hierarchy for measuring fair value. These standards require additional disclosures about the various inputs and valuation techniques used to develop the measurements of fair value and a discussion in changes in valuation techniques and related inputs
HENNESSY FUNDS 1-800-966-4354
during the period. These inputs are summarized in the three broad levels listed below:
| Level 1 – | Quoted unadjusted prices for identical instruments in active markets to which the Fund has access at the date of measurement. |
| | |
| Level 2 – | Quoted prices for similar instruments in active markets; quoted prices for identical or similar instruments in markets that are not active; and model-derived valuations in which all significant inputs and significant value drivers are observable in active markets. Level 2 inputs are those in markets for which there are few transactions, the prices are not current, the prices are fair value adjusted due to post market close subsequent events (foreign markets), little public information exists or instances where prices vary substantially over time or among brokered market makers. |
| | |
| Level 3 – | Model-derived valuations in which one or more significant inputs or significant value drivers are unobservable. Unobservable inputs are those inputs that reflect the Funds’ own assumptions that market participant’s would use to price the asset or liability based on the best available information. |
Following is a description of the valuation techniques applied to the Funds’ major categories of assets and liabilities measured at fair value on a recurring basis.
Equity Securities – Equity securities, including common stocks, preferred stocks, foreign issued common stocks, exchange traded funds, closed-end mutual funds and real estate investment trusts, which are traded on a securities exchange for which a last-quoted sales price is readily available will be valued at the last sales price as reported by the primary exchange on which the securities are listed. Securities listed on the Nasdaq National Market System (“Nasdaq”) will be valued at the Nasdaq Official Closing Price, which may differ from the last sales price reported. Securities traded on a securities exchange for which a last-quoted sales price is not readily available will be valued at the mean between the bid and ask prices. To the extent these securities are actively traded and valuation adjustments are not applied, they are categorized in Level 1 of the fair value hierarchy.
Mutual Funds – Investments in mutual funds are generally priced at the ending net asset value (NAV) provided by the service agent of the Funds and will be classified as Level 1 securities.
The Board of Trustees of the Funds has adopted fair value pricing procedures that are followed when a price for a security is not readily available or if a significant event has occurred that indicates the closing price of a security no longer represents the true value of that security. Fair value pricing determinations are made in good faith in accordance with these procedures. There are numerous criteria that will be given consideration in determining a fair value of a security. Some of these criteria are: trading volume of security and markets, value of other like securities and news events with direct bearing to security or market. Fair value pricing results in an estimated price that reasonably reflects the current market conditions in order to rate the portfolio holdings such that shareholder transactions receive a fair net asset value.
Fair valuing of foreign securities may be determined with the assistance of a pricing service using correlations between the movement of prices of such securities and indices of domestic securities and other appropriate indicators, such as closing market prices of relevant American Depositary Receipts or futures contracts. The effect of using fair value pricing is that the Funds’ NAV will reflect the affected portfolio securities’ value as determined in the judgment of the Board of Trustees or its designee instead of being determined by the market. Using a fair value pricing methodology to price securities may result in a value that is different from a security’s most recent closing price and from the prices used by other investment companies to calculate their net asset values and are considered Level 2 prices in the fair valuation hierarchy. Because the Funds invest in foreign securities, the value of the Funds’ portfolio securities may change on days when investors will not be able to purchase or redeem your shares. Depending on the relative significance of the valuation inputs, these securities may be classified in either Level 2 or Level 3 of the fair value hierarchy.
Short-Term Securities – Short-term equity investments, including money market funds are valued in the manner specified above. Short-term debt investments are valued at amortized cost, if their original maturity was 60 days or less, or by amortizing the values as of the 61st day prior to maturity, if their original term to maturity exceeded 60 days. Short-term securities are generally in Level 1 or Level 2 of the fair valued hierarchy depending on the inputs used and market activity levels for specific securities.
The Funds have performed an analysis of all existing investments to determine the significance and character of all inputs to their fair value determination. Various inputs are used in determining the value of each Fund’s investments. The inputs or methodology used for valuing securities are not necessarily an indication of the risk associated with investing in those securities. Details related to the fair valuation hierarchy of the Funds’ securities as of April 30, 2012 are included with each Fund’s Schedule of Investments.
4). INVESTMENT TRANSACTIONS
Purchases and sales of investment securities (excluding government and short-term investments) during the following fiscal periods were as follows:
| | | Purchases | | | Sales | |
| Large Value Fund | | $ | 64,515,567 | | | $ | 75,897,361 | |
| Japan Fund | | $ | 315,658 | | | $ | 3,562,488 | |
| Japan Smaller Companies Fund | | $ | 4,942,589 | | | $ | 18,241,841 | |
There were no purchases or sales of long term U.S. Government securities in the Funds during the six months ended April 30, 2012.
5). INVESTMENT MANAGEMENT FEE AND OTHER TRANSACTIONS WITH AFFILIATES
Hennessy Advisors, Inc. (the “Advisor”) is the Advisor of the Funds. The Advisor provides the Funds with investment management services under an Investment Advisory Agreement. The Advisor furnishes all investment advice, office space, facilities, and provides most of the personnel needed by the Funds. As compensation for its services, the Advisor is entitled to a monthly fee from each Fund. The fee is based upon the average daily net assets of the Funds at the annual rate of:
HENNESSY FUNDS 1-800-966-4354
| Large Value Fund | 0.85% |
| Japan Fund | 1.00% |
| Japan Smaller Companies Fund | 1.20% |
Advisor fees payable for the Large Value, Japan, and Japan Smaller Companies Funds as of April 30, 2012 were $89,303, $16,918 and $13,230, respectively.
The Advisor has delegated the day to day management of the Large Value Fund to a Sub-Advisor, RBC Global Asset Management (U.S.), Inc. (“RBC”). The Advisor has delegated the day to day management of the Japan and Japan Smaller Companies Funds to a Sub-Advisor, SPARX Asset Management Co. Ltd. (“SPARX”). The Advisor pays the Sub-Advisor fees for each of the Funds from its own assets and these fees are not an additional expense of the Funds.
The Advisor has agreed to absorb expenses to the extent that the total annual operating expenses (excluding all Federal, state and local taxes, interest, brokerage commissions, acquired fund fees and expenses and other costs incurred in connection with the purchase and sale of securities and extraordinary items) do not exceed 0.98% of the Large Value Fund’s net assets for the Institutional Class shares. The expense limitation agreement for the Institutional Class shares of the Large Value Fund can only be terminated by the Board of Trustees. For a period of three years after the year in which the Advisor waives or reimburses expenses, the Advisor may seek reimbursement from the Fund to the extent that total annual fund operating expenses are less than the expense limitation in effect at the time of the waiver or reimbursement. The Advisor did not reimburse any expenses during the six months ended April 30, 2012.
The Advisor previously contractually agreed to limit the expenses of certain Funds. These agreements have since either expired or have been terminated by the Board of Trustees. However, for a period of three years after the year in which the Advisor waives or reimburses expenses, the Advisor may seek reimbursement from the Fund to the extent that total annual fund operating expenses are less than the expense limitation in effect at the time of the waiver or reimbursement. As of April 30, 2012, cumulative expenses subject to potential recovery to the aforementioned conditions and their year of expiration are as follows:
| | | Oct. 31, 2012 | | | Oct. 31, 2013 | | | Oct. 31, 2014 | | | Oct. 31, 2015 | | | Total | |
| Select Large Value Fund – | | | | | | | | | | | | | | | |
| Original Class | | $ | 7,641 | | | $ | 38,444 | | | $ | — | | | $ | — | | | $ | 46,085 | |
| Select Large Value Fund – | | | | | | | | | | | | | | | | | | | | |
| Institutional Class | | $ | 6 | | | $ | — | | | $ | — | | | $ | — | | | $ | 6 | |
| Japan Fund – Original Class | | $ | — | | | $ | 37,425 | | | $ | — | | | $ | — | | | $ | 37,425 | |
| Japan Fund – Institutional Class | | $ | — | | | $ | 12,915 | | | $ | — | | | $ | — | | | $ | 12,915 | |
| Japan Smaller Companies Fund – | | | | | | | | | | | | | | | | | | | | |
| Original Class | | $ | — | | | $ | 19,527 | | | $ | — | | | $ | — | | | $ | 19,527 | |
The Board of Trustees has approved a Shareholder Servicing Plan for the Original Class shares of the Funds which was instituted to compensate the Advisor for the non-investment management services it provides to the Fund. The Plan provides for a monthly fee paid to the Advisor at an annual rate of 0.10% of the average daily net assets of the Original Class shares of the Funds.
Service fees payable for the Large Value, Japan, and Japan Smaller Companies Funds as of April 30, 2012 were $10,502, $846 and $1,103, respectively.
The Funds have entered into agreements with various brokers, dealers and financial intermediaries in connection with the sale of shares of the Funds. The agreements provide for periodic payments by the Funds to the brokers, dealers and financial intermediaries for providing certain shareholder maintenance services (sub-transfer agent expenses). These shareholder services include: the pre-processing and quality control of new accounts, shareholder correspondence, answering customer inquiries regarding account status and facilitating shareholder telephone transactions. Fees paid by the Large Value, Japan and Japan Smaller Companies Funds to various brokers, dealers and financial intermediaries for the six months ended April 30, 2012, were $49,327, $8,300, and $17,675, respectively.
U.S. Bancorp Fund Services, LLC (the “Administrator”) acts as the Funds’ Administrator under an Administration Agreement. Administrative services under this agreement include custody, distribution, fund accounting, fund administration and transfer agent services. In addition, the Administrator prepares various federal and state regulatory filings, reports and returns for the Fund; prepares reports and materials to be supplied to the directors; monitors the activities of the Funds’ custodian, transfer agent and accountants; coordinates the preparation and payment of the Funds’ expenses and reviews the Funds’ expense accruals. Fees paid to U.S. Bancorp Fund Services, LLC for the six months ended April 30, 2012, were $160,336, $28,216 and $26,406, for the Large Value, Japan and Japan Smaller Companies Funds, respectively. The Administrator has voluntarily waived all or a portion of its administration fees allocated to the Institutional Class shares of the Large Value Fund. The administration fees voluntarily waived by the Administrator during the six months ended April 30, 2012 were $51.
Quasar Distributors, LLC (“Quasar”) acts as the Funds’ principal underwriter in a continuous public offering of the Funds’ shares. Quasar is an affiliated company of U.S. Bank, N.A.
6). LINE OF CREDIT
The SPARX Japan and SPARX Japan Smaller Companies Funds have $22,000,000 and $3,000,000 lines of credit, respectively, intended to provide short-term financing, if necessary, subject to certain restrictions, in connection with shareholder redemptions. The credit facility is with its custodian bank, U.S. Bank, N.A. Borrowings under this arrangement bear interest at the bank’s prime rate. During the six months ended April 30, 2012, the SPARX Japan Fund had an outstanding average daily balance and a weighted average interest rate of $242 and 3.25%, respectively. The maximum amount outstanding for the SPARX Japan Fund during the period was $44,000. During the six months ended April 30, 2012, the SPARX Japan Smaller Companies Fund had an outstanding average daily balance and a weighted average interest rate of $102,198 and 3.25%, respectively. The maximum amount outstanding for the SPARX Japan Smaller Companies Fund during the period was $3,000,000.
HENNESSY FUNDS 1-800-966-4354
7). FEDERAL TAX INFORMATION
The following balances for the Funds are as of October 31, 2011 (the Funds’ most recent fiscal year end):
| | | | | | | | | Japan Smaller | |
| | | Select Large | | | Japan | | | Companies | |
| | | Value Fund | | | Fund | | | Fund | |
| Cost of investments for tax purposes | | $ | 112,973,309 | | | $ | 23,377,605 | | | $ | 23,659,233 | |
| Gross tax unrealized appreciation | | | 14,651,304 | | | | 2,404,887 | | | | 2,120,467 | |
| Gross tax unrealized depreciation | | | (3,855,248 | ) | | | (1,630,590 | ) | | | (1,891,048 | ) |
| Net tax unrealized | | | | | | | | | | | | |
| appreciation (depreciation) | | $ | 10,796,056 | | | $ | 774,297 | | | $ | 229,419 | |
| Undistributed ordinary income | | $ | 634,102 | | | $ | — | | | $ | 99,101 | |
| Undistributed long-term capital gains | | | — | | | | — | | | | — | |
| Total distributable earnings | | $ | 634,102 | | | $ | — | | | $ | 99,101 | |
| Other accumulated gains/(loss) | | $ | (39,215,361 | ) | | $ | (32,593,981 | ) | | $ | (697,828 | ) |
| Total accumulated earnings/(loss) | | $ | (27,785,203 | ) | | $ | (31,819,684 | ) | | $ | (369,308 | ) |
At October 31, 2011, the Large Value Fund had tax basis capital losses of $39,195,490, to offset future capital gains. Of such losses, $8,250,940 expire October 31, 2016 and $30,944,550 expire on October 31, 2017.
At October 31, 2011, the Japan Fund had tax basis capital losses of $32,589,964, to offset future capital gains. Of such losses, $4,786,618 expire October 31, 2015, $6,231,544 expire on October 31, 2016, $15,450,664 expire October 31, 2017 and $6,121,138 expire October 31, 2018.
At October 31, 2011, the Japan Smaller Companies Fund had tax basis capital losses of $694,391, to offset future capital gains. The losses expire on October 31, 2017. The tax character of distributions paid during 2012 and 2011 for the Funds were as follows:
| | | Six Months Ended | | | | |
| | | April 30, 2012 | | | Year Ended | |
| Large Value Fund | | (Unaudited) | | | October 31, 2011 | |
| Ordinary Income | | $ | 1,007,759 | | | $ | 1,292,183 | |
| Long-term capital gain | | | — | | | | — | |
| | | $ | 1,007,759 | | | $ | 1,292,183 | |
| | | | | | | | |
| | | Six Months Ended | | | | | |
| | | April 30, 2012 | | | Year Ended | |
| Japan Fund | | (Unaudited) | | | October 31, 2011 | |
| Ordinary Income | | $ | — | | | $ | — | |
| Long-term capital gain | | | — | | | | — | |
| | | $ | — | | | $ | — | |
| | | | | | | | |
| | | Six Months Ended | | | | | |
| | | April 30, 2012 | | | Year Ended | |
| Japan Smaller Companies Fund | | (Unaudited) | | | October 31, 2011 | |
| Ordinary Income | | $ | 99,101 | | | $ | — | |
| Long-term capital gain | | | — | | | | — | |
| | | $ | 99,101 | | | $ | — | |
Expense Example (Unaudited)
April 30, 2012 (Unaudited)
As a shareholder of the Funds, you incur two types of costs: (1) transaction costs, including sales charges (loads) on purchase payments, reinvested dividends, or other distributions; redemption fees; and exchange fees; and (2) ongoing costs, including management fees; service fees; and other Fund expenses. This Example is intended to help you understand your ongoing costs (in dollars) of investing in each of the Funds and to compare these costs with the ongoing costs of investing in other mutual funds. The Example is based on an investment of $1,000 invested at the beginning of the period and held for the entire period from November 1, 2012 through April 30, 2012.
Actual Expenses
The first set of lines of the table below provide information about actual account values and actual expenses. Although the Funds charge no sales loads or transaction fees, you will be assessed fees for outgoing wire transfers, returned checks and stop payment orders at prevailing rates charged by U.S. Bancorp Fund Services, LLC, the Funds’ transfer agent. If you request that a redemption be made by wire transfer, currently a $15.00 fee is charged by the Funds’ transfer agent. IRA accounts will be charged a $15.00 annual maintenance fee (not to exceed $30 per social security number). The example below includes, but is not limited to, management fees, shareholder servicing fees, fund accounting, custody and transfer agent fees. However, the example below does not include portfolio trading commissions and related expenses, interest expense or dividends on short positions taken by the Fund and other extraordinary expenses as determined under generally accepted accounting principles. You may use the information within these lines, together with the amount you invested, to estimate the expenses that you paid over the six-month period. Simply divide your account value by $1,000 (for example, an $8,600 account value divided by $1,000 = 8.6), then multiply the result by the number in the first line under the heading entitled “Expenses Paid During Period” to estimate the expenses you paid on your account during this period.
Hypothetical Example for Comparison Purposes
The second set of lines within the table below provide information about hypothetical account values and hypothetical expenses based on the Funds’ actual expense ratios and an assumed rate of return of 5% per year before expenses, which is not the Funds’ actual return. The hypothetical account values and expenses may not be used to estimate the actual ending account balance or expenses you paid for the period. You may use this information to compare the ongoing costs of investing in the Funds and other funds. To do so, compare this 5% hypothetical example with the 5% hypothetical examples that appear in the shareholder reports of the other funds. Please note that the expenses shown in the table are meant to highlight your ongoing costs only and do not reflect any transactional costs, such as sales charges (loads), or exchange fees. Therefore, the second line of the table is useful in comparing ongoing costs only, and will not help you determine the relative total costs of owning different funds. In addition, if these transactional costs were included, your costs would have been higher.
HENNESSY FUNDS 1-800-966-4354
| | | Beginning | | | Ending | | | Expenses Paid | |
| | | Account Value | | | Account Value | | | During Period(1) | |
| Original Class | | 11/1/11 | | | 4/30/12 | | | 11/1/11-4/30/12 | |
| | | | | | | | | | |
| Actual | | | | | | | | | |
| Large Value Fund – Original Class | | $ | 1,000.00 | | | $ | 1,130.70 | | | $ | 7.36 | |
| Japan Fund – Original Class | | $ | 1,000.00 | | | $ | 1,074.30 | | | $ | 10.21 | |
| Japan Smaller Companies | | | | | | | | | | | | |
| Fund – Original Class | | $ | 1,000.00 | | | $ | 1,121.80 | | | $ | 11.45 | |
| | | | | | | | | | | | | |
| Hypothetical (5% return | | | | | | | | | | | | |
| before expenses) | | | | | | | | | | | | |
| Large Value Fund – Original Class | | $ | 1,000.00 | | | $ | 1,017.95 | | | $ | 6.97 | |
| Japan Fund – Original Class | | $ | 1,000.00 | | | $ | 1,015.02 | | | $ | 9.92 | |
| Japan Smaller Companies | | | | | | | | | | | | |
| Fund – Original Class | | $ | 1,000.00 | | | $ | 1,014.07 | | | $ | 10.87 | |
| (1) | Expenses are equal to the Large Value Fund’s expense ratio of 1.39%, the Japan Fund’s expense ratio of 1.98%, and the Smaller Companies Fund’s expense ratio of 2.17%, multiplied by the average account value over the period, multiplied by 182/366 days (to reflect one-half year period.) |
| | | Beginning | | | Ending | | | Expenses Paid | |
| | | Account Value | | | Account Value | | | During Period(2) | |
| Institutional Class | | 11/1/11 | | | 4/30/12 | | | 11/1/11-4/30/12 | |
| | | | | | | | | | |
| Actual | | | | | | | | | |
| Large Value Fund – Institutional Class | | $ | 1,000.00 | | | $ | 1,133.40 | | | $ | 5.20 | |
| Japan Fund – Institutional Class | | $ | 1,000.00 | | | $ | 1,075.70 | | | $ | 9.50 | |
| | | | | | | | | | | | | |
| Hypothetical (5% return | | | | | | | | | | | | |
| before expenses) | | | | | | | | | | | | |
| Large Value Fund – Institutional Class | | $ | 1,000.00 | | | $ | 1,019.99 | | | $ | 4.92 | |
| Japan Fund – Institutional Class | | $ | 1,000.00 | | | $ | 1,015.71 | | | $ | 9.22 | |
| (2) | Expenses are equal to the Large Value Fund’s expense ratio of 0.98%, and the Japan Fund’s expense ratio of 1.84%, multiplied by the average account value over the period, multiplied by 182/366 days (to reflect one-half year period.) |
How to Obtain a Copy of the Funds’ Proxy Voting Policy and Proxy Voting Records
A description of the policies and procedures that the Funds use to determine how to vote proxies relating to portfolio securities is available without charge: (1) by calling 1-800-966-4354; (2) on the Hennessy Funds website at www.hennessyfunds.com; or (3) on the U.S. Securities and Exchange Commission’s website at www.sec.gov. Hennessy Funds’ proxy voting record is available on the SEC’s website at www.sec.gov no later than August 31 for the prior 12 months ending June 30.
Quarterly Filings on Form N-Q
The Funds file their complete schedule of portfolio holdings with the SEC for the first and third quarters of each fiscal year on Form N-Q. The Funds’ Form N-Q will be available on the SEC’s website at www.sec.gov. The Funds’ Form N-Q may be reviewed and copied at the SEC’s Public Reference Room in Washington, DC and information on the operation of the Public Reference Room may be obtained by calling 1-800-SEC-0330. Information included in the Funds’ N-Q will also be available upon request by calling 1-800-966-4354.
Trustees and Officers
The Funds’ Statement of Additional Information includes additional information about the Funds’ Trustees and Officers and is available, without charge, upon request by calling 1-800-966-4354 or by visiting the Hennessy Funds website at www.hennessyfunds.com.
Federal Tax Distribution Information (Unaudited)
The Large Value, Japan and Japan Smaller Companies Funds designate 100%, 0% and 0%, respectively, of the dividends declared from net investment income during the year ended October 31, 2011, as qualified dividend income under the Jobs Growth and Tax Reconciliation Act of 2003.
For the year ended October 31, 2011, 100%, 0% and 0%, of the ordinary distributions paid by the Large Value, Japan and Japan Smaller Companies Funds qualify for the dividend received deduction available to corporate shareholders. All of the dividend income received by the Japan and Japan Smaller Companies Funds was from foreign investments which does not qualify for the dividend received deduction available to corporate shareholders.
HENNESSY FUNDS 1-800-966-4354
For the year ended October 31, 2011, the Hennessy Select SPARX Japan Smaller Companies Fund earned foreign source income and paid foreign taxes which they intend to pass through to their shareholders pursuant to Section 853 of the Internal Revenue Code as follows:
| | Foreign Source Income | Foreign Taxes |
| | Earned (per share) | Paid (per share) |
| Japan | 0.246 | 0.017 |
Householding
To help keep each Fund’s costs as low as possible, we generally deliver a single copy of most financial reports and prospectuses to shareholders who share an address, even if the accounts are registered under different names. This process, known as “householding,” does not apply to account statements. You may, of course, request an individual copy of a prospectus or financial report at any time. If you would like to receive separate mailings, please call the Transfer Agent at 1-800-261-6950 or 1-414-765-4124 and we will begin individual delivery within 30 days of your request. If your account is held through a financial institution or other intermediary, please contact them directly to request individual delivery.
Board Approval of Continuation of Investment Advisory Agreement
At its meeting on March 7, 2012, the Board of Directors (the “Board”) of the Hennessy Funds, Inc. (the “Company”) and its two series, the Hennessy Balanced Fund (the “Balanced Fund”) and the Hennessy Total Return Fund (the “Total Return Fund”) (each a “Fund” or collectively the “Funds”), the Hennessy Mutual Funds, Inc. (the “Company”) and its three series, the Hennessy Cornerstone Growth Fund (the “Growth Fund”), the Hennessy Cornerstone Value Fund (the “Value Fund”), and the Hennessy Focus 30 Fund (the “Focus 30 Fund”), the Hennessy Funds Trust (the “Company”) which includes the Hennessy Cornerstone Large Growth Fund (the “Large Growth Fund”), and the Hennessy Select Large Value Fund (the “Large Value Fund”), and the Hennessy SPARX Funds Trust (the “Company”) and its two series, the Hennessy Select SPARX Japan Fund (the “Japan Fund”) and the Hennessy Select SPARX Japan Smaller Companies Fund (the “Japan Smaller Companies Fund”) or collectively with the Growth, Value, Focus 30, Total Return, Balanced, Large Value and Large Growth funds (the “Funds”), or collectively with the Hennessy Funds, Inc., and the Hennessy Mutual Funds, Inc., and the Hennessy Funds Trust (the “Companies”), including the Directors who are not “interested persons” (as defined in the Investment Company Act of 1940) of the Funds’ voted to re-approve the current investment advisory agreement for the Funds. The Board reviewed and discussed the specific services provided by the Advisor. The Advisor:
| | • | Provide formula driven investment management for the Hennessy Total Return and Balanced Funds; and the Hennessy Cornerstone Growth, Focus 30, Value and Large Growth Funds. Hennessy Advisors, Inc. holds the patent rights to the formulas used for the Cornerstone Growth and Value Funds. In providing investment management, Hennessy Advisors, Inc. will direct and oversee the trading of securities within and the rebalancing of the portfolios of the Funds. |
| | | |
| | • | Provide oversight of the sub-advisors for the Hennessy Select Large Value, Hennessy Select SPARX Japan, and Hennessy Select SPARX Japan Smaller Companies Funds. |
| | | |
| | • | Pay the incentive compensation of the Funds’ Chief Compliance Officer. |
| | | |
| | • | Provide responsive customer and shareholder servicing which consists of providing a call center to respond to shareholder inquiries, including specific mutual fund account information. Shareholders can contact Hennessy Advisors, Inc. directly during office hours. The firm endeavors to answer all calls in person within two rings of the telephone. |
| | | |
| | • | Oversee distribution of the Funds through third-party broker/dealers and independent financial institutions such as Charles Schwab, Inc., Fidelity, TD Waterhouse and Pershing. Hennessy Advisors participates in “no transaction fee” (“NTF”) programs with these companies, which allows customers to purchase the Hennessy Funds through third party distribution channels without paying a transaction fee. Hennessy Advisors compensates these third party distributors under a pre-determined contractual agreement. |
HENNESSY FUNDS 1-800-966-4354
| | • | Oversee those third party service providers that support the Funds in providing fund accounting, fund administration, fund distribution, transfer agency and custodial services. |
Hennessy Advisors, Inc. provides its services to the Hennessy Funds, Inc.; the Hennessy Mutual Funds, Inc.; the Hennessy Funds Trust, and the Hennessy SPARX Funds Trust. The firm also operates a small Limited Liability Company designed for highly qualified investors. Services are provided to no other clients. The firm does not offer investment advice to individual persons or entities other than the mutual funds it manages.
The Board also: (i) compared the performance of each Fund to benchmark indices over various periods of time and concluded that the performance of each Fund warranted the continuation of the Advisory Agreement; (ii) compared the expense ratios of funds similar in asset size and investment objective to each of the Funds and concluded the actual or projected expenses of each Fund were reasonable and warranted continuation of the Advisory Agreement; (iii) considered the fees charged by Hennessy Advisors, Inc. to those of funds similar in asset size and investment objective to each of the Funds and concluded the advisory fees of each Fund were reasonable and warranted continuation of the Advisory Agreement; (iv) considered the profitability of Hennessy Advisors, Inc. with respect to each Fund and the profitability of the Sub-Advisors with respect to the Select Series Funds and concluded the profits were reasonable and not excessive when compared to profitability guidelines set forth in relevant court cases; and (v) considered the high level of professionalism and knowledge, along with an extremely low level of turnover, of the employees of the Advisor.
The Board then discussed economies of scale and breakpoints and determined that the Funds managed by Hennessy Advisors, Inc. have not yet grown in size, nor has their marketplace demonstrated significantly rapid potential growth to any extent that would warrant the use of breakpoints. The Board took into consideration the profitability of Hennessy Advisors, Inc. and the advisory fees of comparable mutual funds.
The Board reviewed the Funds’ expense ratios and comparable expense ratios for funds like the nine funds being considered for contract renewal by Hennessy Advisors, Inc. The Board used data from Lipper as presented in the charts in the Board Materials showing funds similar in nature to the Hennessy Funds (Mid-Cap Blend, Small Cap Blend, etc.). The Board determined that the expense ratios of the Funds fall within the range of the ratios of other funds in their classification. The Board also referenced the Advisor’s Form ADV and copies of the current Investment Advisory Agreements. All of the factors above were considered separately by the non-interested Directors in an executive session during which management of the Advisor was not present. The factors were viewed in their totality by the Board, with no single factor being the principal or determinative factor in the Board’s determination of whether to approve the continuation of the Advisory Agreements. The Board was also assisted in its review, consideration and discussion of the Advisory Agreements by a memorandum prepared by legal counsel that summarized the Board’s obligations. Based on the factors discussed above, the Board, including all Independent Directors, recommended continuation of the Advisory Agreements.
(This Page Intentionally Left Blank.)
HENNESSY FUNDS 1-800-966-4354
For information, questions
or assistance, please call
The Hennessy Funds
1-800-966-4354 or 1-415-899-1555
INVESTMENT ADVISOR
Hennessy Advisors, Inc.
7250 Redwood Blvd., Suite 200
Novato, California 94945
ADMINISTRATOR, TRANSFER
AGENT, DIVIDEND PAYING
AGENT & SHAREHOLDER
SERVICING AGENT
U.S. Bancorp Fund Services, LLC
P.O. Box 701
Milwaukee, Wisconsin 53201-0701
CUSTODIAN
U.S. Bank N.A.
Custody Operations
1555 North River Center Dr., Suite 302
Milwaukee, Wisconsin 53212
TRUSTEES
Neil J. Hennessy
Robert T. Doyle
J. Dennis DeSousa
Gerald P. Richardson
COUNSEL
Foley & Lardner LLP
777 East Wisconsin Avenue
Milwaukee, Wisconsin 53202-5306
INDEPENDENT REGISTERED
PUBLIC ACCOUNTING FIRM
KPMG LLP
777 East Wisconsin Avenue, 15th Floor
Milwaukee, Wisconsin 53202
DISTRIBUTOR
Quasar Distributors, LLC
615 East Michigan Street
Milwaukee, Wisconsin 53202
WWW.HENNESSYFUNDS.COM
This report has been prepared for shareholders and may be distributed
to others only if preceded or accompanied by a current prospectus.
Item 2. Code of Ethics.
Not applicable for semi-annual reports.
Item 3. Audit Committee Financial Expert.
Not applicable for semi-annual reports.
Item 4. Principal Accountant Fees and Services.
Not applicable for semi-annual reports.
Item 5. Audit Committee of Listed Registrants.
Not applicable to registrants who are not listed issuers (as defined in Rule 10A-3 under the Securities Exchange Act of 1934).
Item 6. Investments.
Schedule of Investments is included as part of the report to shareholders filed under Item 1 of this Form
Item 7. Disclosure of Proxy Voting Policies and Procedures for Closed-End Management Investment Companies.
Not applicable to open-end investment companies.
Item 8. Portfolio Managers of Closed-End Management Investment Companies.
Not applicable to open-end investment companies.
Item 9. Purchases of Equity Securities by Closed-End Management Investment Company and Affiliated Purchasers.
Not applicable to open-end investment companies.
Item 10. Submission of Matters to a Vote of Security Holders.
Not Applicable
Item 11. Controls and Procedures.
| (a) | The Registrant’s President and Treasurer have reviewed the Registrant's disclosure controls and procedures (as defined in Rule 30a-3(c) under the Investment Company Act of 1940 (the “Act”)) as of a date within 90 days of the filing of this report, as required by Rule 30a-3(b) under the Act and Rules 13a-15(b) or 15d-15(b) under the Securities Exchange Act of 1934. Based on their review, such officers have concluded that the disclosure controls and procedures are effective in ensuring that information required to be disclosed in this report is appropriately recorded, processed, summarized and reported and made known to them by others within the Registrant and by the Registrant’s service provider. |
| (b) | There were no changes in the Registrant's internal control over financial reporting (as defined in Rule 30a-3(d) under the Act) that occurred during the second fiscal quarter of the period covered by this report that has materially affected, or is reasonably likely to materially affect, the Registrant's internal control over financial reporting. |
Item 12. Exhibits.
| (a) | (1) Any code of ethics or amendment thereto, that is the subject of the disclosure required by Item 2, to the extent that the registrant intends to satisfy Item 2 requirements through filing an exhibit. Not Applicable |
(2) A separate certification for each principal executive and principal financial officer pursuant to Section 302 of the Sarbanes-Oxley Act of 2002. Filed herewith.
(3) Any written solicitation to purchase securities under Rule 23c-1 under the Act sent or given during the period covered by the report by or on behalf of the registrant to 10 or more persons. Not applicable to open-end investment companies.
| (b) | Certifications pursuant to Section 906 of the Sarbanes-Oxley Act of 2002. Furnished herewith. |
SIGNATURES
Pursuant to the requirements of the Securities Exchange Act of 1934 and the Investment Company Act of 1940, the registrant has duly caused this report to be signed on its behalf by the undersigned, thereunto duly authorized.
(Registrant) Hennessy Funds Trust
By (Signature and Title)* /s/Neil J. Hennessy
Neil J. Hennessy, President
Date July 9, 2012
Pursuant to the requirements of the Securities Exchange Act of 1934 and the Investment Company Act of 1940, this report has been signed below by the following persons on behalf of the registrant and in the capacities and on the dates indicated.
By (Signature and Title)* /s/Neil J. Hennessy
Neil J. Hennessy, President
Date July 9, 2012
By (Signature and Title)* /s/Teresa M. Nilsen
Teresa M. Nilsen, Treasurer
Date July 9, 2012