UNITED STATES
SECURITIES AND EXCHANGE COMMISSION
Washington, D.C. 20549
FORM N-CSR
CERTIFIED SHAREHOLDER REPORT OF REGISTERED
MANAGEMENT INVESTMENT COMPANIES
Investment Company Act file number (811-07168)
Hennessy Funds Trust
(Exact name of registrant as specified in charter)
7250 Redwood Blvd., Suite 200
Novato, CA 94945
(Address of principal executive offices) (Zip code)
Neil J. Hennessy
7250 Redwood Blvd., Suite 200
Novato, CA 94945
(Name and address of agent for service)
800-966-4354
Registrant’s telephone number, including area code
Date of fiscal year end: October 31, 2014
Date of reporting period: April 30, 2014
Item 1. Reports to Stockholders.
SEMI-ANNUAL REPORT
APRIL 30, 2014
HENNESSY CORNERSTONE
GROWTH FUND
Investor Class HFCGX
Institutional Class HICGX
hennessyfunds.com | 1-800-966-4354
(This Page Intentionally Left Blank.)
Contents
| Letter to Shareholders | 2 |
| Performance Overview | 4 |
| Financial Statements | |
| Schedule of Investments | 7 |
| Statement of Assets and Liabilities | 12 |
| Statement of Operations | 13 |
| Statements of Changes in Net Assets | 15 |
| Financial Highlights | 16 |
| Notes to the Financial Statements | 20 |
| Expense Example | 28 |
| Proxy Voting | 30 |
| Quarterly Filings on Form N-Q | 30 |
| Householding | 30 |
| Board Approval of Investment Advisory Agreement | 31 |
HENNESSY FUNDS 1-800-966-4354
Dear Shareholder:
The financial markets have provided strong returns over the past six-months ended April 30, 2014, with the Dow Jones Industrial Average (DJIA) and S&P 500 both returning approximately 8% during the period. The current valuation metrics of the major indices are solid; for example, the DJIA currently has a price-to-earnings ratio of 15x and a price-to-sales ratio of 1.75x. The DJIA also has a dividend yield of 2.2%, which is nearly as high as that of a 10-Year U.S. Treasury, which is currently yielding 2.6%. Investing in high-yielding, high-quality DJIA stocks have the potential to not only provide an income stream but also for stock price appreciation as well. Fixed income investing has run its course, in my opinion, and many individuals are currently benefiting from the return to investing in equities that possess strong fundamentals.
U.S. corporations continue to drive shareholder value by making acquisitions, initiating and raising dividends, investing in internal infrastructure, and buying back stock. However, lately I have begun to see a shift in those business strategies. The easier-to-execute acquisitions seem to be a thing of the past, and firms now have to be even more creative to execute accretive deals. I also believe that while firms may continue to initiate dividends, fewer firms will raise their dividends and fewer firms will participate in stock buyback programs going forward. So what will these cash-rich companies do with their capital if they are not raising dividends or buying back stock? I believe we will see companies begin to initiate capital expenditure programs.
Due to the continuing uncertainty from a lack of clear policies on taxes, healthcare, and regulations, I have observed that corporations would rather wait for clarity from our government leaders and defer any significant changes to their current business models. Up until this point, there has been no real cost for firms to defer spending their capital as they wait for anticipated guidance on policies that directly affect their businesses. But, this economic handcuffing from all of this uncertainty has gone on long enough. I believe there will now be firms who want to improve their margins and will begin spending money to expand their sales, and may even begin to hire. Once a competitor begins to move in this way, then the cost to defer becomes real for companies. This movement to expansion may well be a catalyst to propel the financial markets. I do believe this will be a slow shift, but one that will keep the economy improving, and should, in my opinion, help to generate reasonable market returns over the next few years.
With almost $3 trillion in cash sitting on the sidelines, this strategic shift by companies to begin spending their idle capital should help the economic recovery in the U.S. But that is only one part of the equation. Washington politics still play a role in how strong that recovery will be. The national political landscape will change in the next few years, and the future generation of elected officials will be faced with what I believe are fictitious unemployment figures (6.3% reported, when over 20 million Americans are looking for more work or a better job), a sluggish economy, and global competition in business. The next regime needs to provide real clarity on the issues that face all Americans and American corporations: taxation, regulation, and how to pay for our new healthcare system. I also believe that our government needs to regard business as a noble profession and to implement common sense and logic in their policy making instead of politics as usual. As Confucius is quoted as saying, “Life is really simple, but we insist on making it complicated.”
I am confident that even with all the hurdles facing corporate America, companies continue to provide good value for their shareholders, and I believe that means the financial markets are in good shape and should remain strong moving forward, I also believe that the next few months may be volatile. Fads come and go, and the current buzz on the Street is around investing in social media stocks. I believe that chasing hot products has contributed and will continue to contribute to the volatility of the markets this year. After over 35 years in the business, I still firmly believe the best way to position your portfolio is by investing in good companies over the long term, rather than trying to buy the next hot idea at exactly the right time. At Hennessy Funds, hunches and fads have no place in our investment process, and we understand that successful investing comes from time in the market, not timing the market.
We remain focused on investing based on proven fundamentals, and we are committed to managing money for the sole benefit of our shareholders. If you have any questions or want to speak with us directly, please don’t hesitate to call us at (800) 966-4354.
Best regards,
Neil J. Hennessy
President and Chief Investment Officer
Past performance does not guarantee future results.
Mutual fund investing involves risk. Principal loss is possible.
Opinions expressed are those of Neil Hennessy and are subject to change, are not guaranteed and should not be considered investment advice.
The Dow Jones Industrial Average and S&P 500 are unmanaged indices commonly used to measure the performance of U.S. stocks. One cannot invest directly in an index.
Price-to-sales ratio and price-to-earnings ratio are tools for calculating relative valuation. Price-to-sales ratio is calculated by dividing the market price by revenue per share. Price-to-earnings ratio is the market price per share divided by earnings per share.
HENNESSY FUNDS 1-800-966-4354
Performance Overview (Unaudited)
The opinions expressed in the following commentary reflect those of the Portfolio Managers as of the date written. Any such opinions are subject to change based on market or other conditions and are not guaranteed. These opinions may not be relied upon as investment advice. Investment decisions for the Fund are based on several factors, and may not be relied upon as an indication of trading intent on behalf of the Fund. Security positions can and do change.
AVERAGE ANNUAL TOTAL RETURN PERIODS ENDED APRIL 30, 2014*
| | Six | One | Five | Ten |
| | Months(1) | Year | Years | Years |
| Hennessy Cornerstone Growth Fund – | | | | |
| Investor Class (HFCGX) | 9.65% | 23.99% | 16.43% | 5.34% |
| Hennessy Cornerstone Growth Fund – | | | | |
Institutional Class (HICGX)(2) | 9.85% | 24.36% | 16.81% | 5.55% |
Russell 2000® Index | 3.08% | 20.50% | 19.84% | 8.67% |
| S&P 500 Index | 8.36% | 20.44% | 19.14% | 7.67% |
Expense ratios: 1.29% (Investor Class); Gross 1.11%, Net 0.98%(3) (Institutional Class)
Performance data quoted represents past performance; past performance does not guarantee future results. The investment return and principal value of an investment will fluctuate so that an investor’s shares, when redeemed, may be worth more or less than their original cost. Current performance of the Fund may be lower or higher than the performance quoted. Performance data current to the most recent month end may be obtained by visiting hennessyfunds.com.
The expense ratios presented are from the most recent prospectus.
| (1) | Periods less than one year are not annualized. |
| (2) | The inception date of the Institutional Class shares is March 3, 2008. Performance shown prior to the inception of the Institutional Class shares reflects the performance of the Investor Class shares and includes expenses that are not applicable to and are higher than those of the Institutional Class shares. |
| (3) | With regard to Institutional Class shares, the Fund’s investment advisor has contractually agreed to waive a portion of its expenses indefinitely. |
PERFORMANCE NARRATIVE
Portfolio Manager, Neil Hennessy, and Co-Portfolio Manager, Brian Peery
Over the previous six months, how did the Fund perform and what factors contributed to this performance?
For the six-month period ended April 30, 2014, the Investor Class of the Hennessy Cornerstone Growth Fund returned 9.65%, outperforming the Russell 2000® Index, the S&P 500 Index, and the Morningstar Small Blend Category Average, which returned 3.08%, 8.36%, and 4.48% for the same period, respectively.
We are pleased with the overall performance of the Fund during the previous six months versus its benchmarks. The Fund’s relative outperformance was driven partly by allocation and performance in seven of the ten sectors in which the Fund was invested, but the primary driver of the Fund’s performance was underlying stock selection. The biggest contribution to the Fund’s outperformance versus its benchmarks was in the Industrial sector, where the Fund’s overweighting and stock selection amounted to roughly half of the
outperformance relative to the Russell 2000® Index. The largest detractor to the Fund’s performance was its cash holdings, which are targeted at less than 5% of the Fund’s total net assets and which averaged just under 2.5% for the six-month period.
Additional Portfolio Manager commentary and related investment outlook:
If you have watched the financial news or opened the investing section of a newspaper lately, you have probably heard or read about two things: the Russell 2000® Index has dropped below its 200-day moving average (bad) and high multiple stocks have dropped fairly precipitously (really bad if you own them). By adhering to our strict investment methodology, we have been largely able to sidestep the recent downturn in sectors like social media and biotechnology. By employing a strict price-to-sales ratio limit of 1.5, we invest in what we deem to be reasonably valued companies rather than those stocks whose price is predicated on expected future growth. This growth at a reasonable price approach has served us well, and we believe wholeheartedly in utilizing this methodology when investing. We anticipate investors will continue to migrate out of high risk, high multiple stocks and into stocks that will potentially do well as the economy expands.
During the six-month period ended April 30, 2014 the performance of the Fund was quite strong, yet the overall markets have generally been filled with uncertainty and mild upheaval, much like in previous months. We believe, however, that the economy has been progressing nicely and that there is even better news on the horizon.
Consumer spending, which is a large driver of Gross Domestic Product (approximately 70% of GDP) was and continues to be muted. The Christmas season proved to be a difficult time for a number of retailers as consumers opted to constrain spending. Not long after the holidays, the East Coast experienced particularly bad weather, and the consumer chose to defer purchases rather than battle the weather. The end result of the weather related issues, at least as far as the stock market was concerned, was a temporary lowering in the expectations for company earnings.
Today, although there are still lingering weather related issues, including the West Coast and Midwest droughts, the forecast for spending looks much more promising. Although we expect to see some moderation going forward, consumer spending ended the quarter on a high note, and we firmly believe it will increase as the year progresses. We also expect that not only will company earnings improve, but more importantly, revenues should start to improve with the overall strength of the economy.
In fact, we are seeing positive signs in both revenue growth and the all-important corporate capital expenditures levels. Over the last six months, we have seen a slight disconnect between earnings and revenues, with earnings showing healthy gains, largely due to cost containment, while revenue growth lagged. With few cost cuts seemingly left to be made, companies appear to be starting to utilize their healthy balance sheets to focus on organic growth, which we expect will drive corporate spending higher. In fact, we anticipate the U.S. economy should expand nicely over the next 12 to 18 months and that the markets should benefit from this flow of capital. While excess cash has largely been directed toward acquisitions, increasing dividends, and/or stock buybacks recently, we believe this shift in corporate spending has the potential to reward shareholders over the longer term.
We are confident that there are opportunities in the Small-Cap and Mid-Cap space, especially in some of the more cyclical sectors. We believe the cyclical companies, which are those companies most sensitive to economic growth, should do well as the economy continues to improve. The Fund is currently overweight cyclical stocks versus its benchmarks and will remain so until its portfolio is rebalanced later this year.
HENNESSY FUNDS 1-800-966-4354
The Russell 2000® Index is an unmanaged index commonly used to measure the performance of U.S. small-cap stocks. The S&P 500 is an index commonly used to measure the performance of U.S. stocks. You cannot invest directly in an index. Performance data for an index does not reflect any deductions for fees, expenses or taxes. The Fund invests in small- and medium-capitalization companies, which may have limited liquidity and greater price volatility than large-capitalization companies. Investments in foreign securities involve greater volatility and political, economic and currency risk and differences in accounting methods. Fund holdings and sector allocations are subject to change. Please refer to the Schedule of Investments included in this report for additional portfolio information.
Price-to-sales ratio is a tool for calculating a stock’s valuation relative to other companies. It is calculated by dividing a stock’s current price by its revenue per share.
Each Morningstar category average represents a universe of funds with similar investment objectives. ©Morningstar, Inc. All Rights Reserved. The information contained herein: 1) is proprietary to Morningstar; 2) may not be copied or distributed and 3) is not warranted to be accurate, complete or timely. Neither Morningstar nor its content providers are responsible for any damages or losses arising from any use of this information. Past performance does not guarantee future results.
Schedule of Investments
HENNESSY CORNERSTONE GROWTH FUND
As of April 30, 2014 (Unaudited)
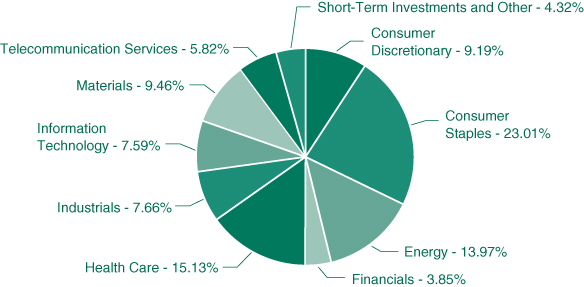
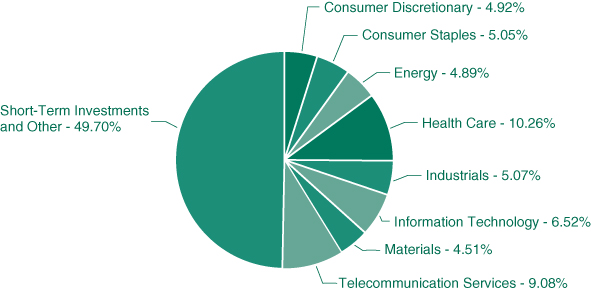
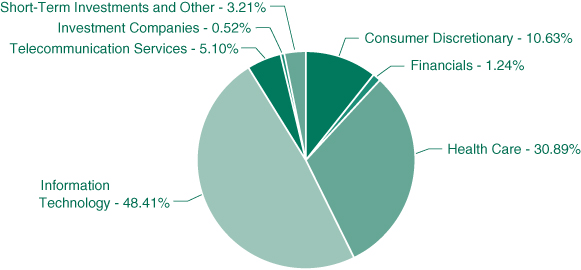
(% of Net Assets)
| | TOP TEN HOLDINGS (EXCLUDING CASH/CASH EQUIVALENTS) | % NET ASSETS |
| | Universal Insurance Holdings, Inc. | 2.36% |
| | Green Plains Renewable Energy, Inc. | 2.33% |
| | Exterran Holdings, Inc. | 2.31% |
| | Alaska Air Group, Inc. | 2.28% |
| | Delta Air Lines, Inc. | 2.26% |
| | Aceto Corp. | 2.23% |
| | Southwest Airlines Co. | 2.19% |
| | United Rentals, Inc. | 2.18% |
| | Targa Resources Corp. | 2.16% |
| | Tyson Foods, Inc., Class A | 2.16% |
Note: For presentation purposes, the Fund has grouped some of the industry categories. For purposes of categorizing securities for compliance with Section 8(b)(1) of the Investment Company Act of 1940, the Fund uses more specific industry classifications.
HENNESSY FUNDS 1-800-966-4354
| | COMMON STOCKS – 95.59% | | Number | | | | | | % of | |
| | | | of Shares | | | Value | | | Net Assets | |
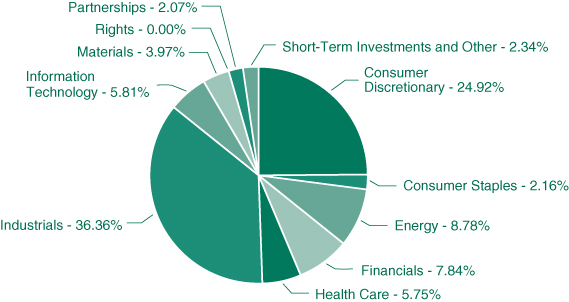
| | Consumer Discretionary – 24.92% | | | | | | | | | |
| | Advance Auto Parts, Inc. | | | 37,200 | | | $ | 4,511,988 | | | | 1.85 | % |
| | Carmike Cinemas, Inc. (a) | | | 164,227 | | | | 4,870,973 | | | | 2.00 | % |
| | Core-Mark Holding Co., Inc. | | | 60,972 | | | | 4,910,685 | | | | 2.01 | % |
| | G-III Apparel Group, Ltd. (a) | | | 69,900 | | | | 5,016,723 | | | | 2.05 | % |
| | Jack in the Box, Inc. (a) | | | 89,400 | | | | 4,786,476 | | | | 1.96 | % |
| | Jarden Corp. (a) | | | 78,700 | | | | 4,497,705 | | | | 1.84 | % |
| | La-Z-Boy, Inc. | | | 171,800 | | | | 4,162,714 | | | | 1.71 | % |
| | MDC Partners, Inc. (b) | | | 187,197 | | | | 4,571,350 | | | | 1.87 | % |
| | New York Times Co. | | | 326,300 | | | | 5,246,904 | | | | 2.15 | % |
| | Papa Johns International, Inc. | | | 97,200 | | | | 4,263,192 | | | | 1.75 | % |
| | The Goodyear Tire & Rubber Co. | | | 174,400 | | | | 4,394,880 | | | | 1.80 | % |
| | Tuesday Morning Corp. (a) | | | 333,911 | | | | 4,668,076 | | | | 1.91 | % |
| | Visteon Corp. (a) | | | 56,700 | | | | 4,922,127 | | | | 2.02 | % |
| | | | | | | | | 60,823,793 | | | | 24.92 | % |
| | | | | | | | | | | | | | |
| | Consumer Staples – 2.16% | | | | | | | | | | | | |
| | Tyson Foods, Inc., Class A | | | 125,400 | | | | 5,263,038 | | | | 2.16 | % |
| | | | | | | | | | | | | | |
| | Energy – 8.78% | | | | | | | | | | | | |
| | Exterran Holdings, Inc. | | | 131,100 | | | | 5,639,922 | | | | 2.31 | % |
| | Green Plains Renewable Energy, Inc. | | | 190,200 | | | | 5,686,980 | | | | 2.33 | % |
| | Matrix Service Co. (a) | | | 156,327 | | | | 4,841,447 | | | | 1.98 | % |
| | Targa Resources Corp. | | | 48,800 | | | | 5,269,912 | | | | 2.16 | % |
| | | | | | | | | 21,438,261 | | | | 8.78 | % |
| | | | | | | | | | | | | | |
| | Financials – 7.84% | | | | | | | | | | | | |
| | BGC Partners, Inc. | | | 671,273 | | | | 4,813,028 | | | | 1.97 | % |
| | CNO Financial Group, Inc. | | | 257,600 | | | | 4,443,600 | | | | 1.82 | % |
| | LPL Financial Holdings, Inc. | | | 87,100 | | | | 4,124,185 | | | | 1.69 | % |
| | Universal Insurance Holdings, Inc. | | | 393,500 | | | | 5,756,905 | | | | 2.36 | % |
| | | | | | | | | 19,137,718 | | | | 7.84 | % |
| | | | | | | | | | | | | | |
| | Health Care – 5.75% | | | | | | | | | | | | |
| | Alere, Inc. (a) | | | 133,000 | | | | 4,442,200 | | | | 1.82 | % |
| | CIGNA Corp. | | | 61,700 | | | | 4,938,468 | | | | 2.02 | % |
| | MWI Veterinary Supply, Inc. (a) | | | 29,700 | | | | 4,652,208 | | | | 1.91 | % |
| | | | | | | | | 14,032,876 | | | | 5.75 | % |
The accompanying notes are an integral part of these financial statements.
| | COMMON STOCKS | | Number | | | | | | % of | |
| | | | of Shares | | | Value | | | Net Assets | |
| | Industrials – 36.36% | | | | | | | | | |
| | Aceto Corp. | | | 248,784 | | | $ | 5,443,394 | | | | 2.23 | % |
| | Alaska Air Group, Inc. | | | 59,100 | | | | 5,560,128 | | | | 2.28 | % |
| | Curtiss Wright Corp. | | | 73,800 | | | | 4,718,772 | | | | 1.93 | % |
| | Delta Air Lines, Inc. | | | 149,900 | | | | 5,520,817 | | | | 2.26 | % |
| | Engility Holdings, Inc. (a) | | | 115,346 | | | | 5,033,700 | | | | 2.06 | % |
| | Huntington Ingalls Industries, Inc. | | | 49,300 | | | | 5,077,900 | | | | 2.08 | % |
| | John Bean Technologies Corp. | | | 159,786 | | | | 4,632,196 | | | | 1.90 | % |
| | L-3 Communications Holdings, Inc. | | | 41,600 | | | | 4,799,392 | | | | 1.97 | % |
| | Lennox International, Inc. | | | 53,200 | | | | 4,459,756 | | | | 1.83 | % |
| | Lockheed Martin Corp. | | | 29,400 | | | | 4,825,716 | | | | 1.98 | % |
| | Northrop Grumman Corp. | | | 39,500 | | | | 4,799,645 | | | | 1.97 | % |
| | Orbital Sciences Corp. (a) | | | 171,896 | | | | 5,053,742 | | | | 2.07 | % |
| | Primoris Services Corp. | | | 143,000 | | | | 4,001,140 | | | | 1.64 | % |
| | Raytheon Co. | | | 49,300 | | | | 4,707,164 | | | | 1.93 | % |
| | Southwest Airlines Co. | | | 221,600 | | | | 5,356,072 | | | | 2.19 | % |
| | The Manitowoc Co., Inc. | | | 163,300 | | | | 5,189,674 | | | | 2.12 | % |
| | United Continental Holdings, Inc. (a) | | | 104,200 | | | | 4,258,654 | | | | 1.74 | % |
| | United Rentals, Inc. (a) | | | 56,800 | | | | 5,329,544 | | | | 2.18 | % |
| | | | | | | | | 88,767,406 | | | | 36.36 | % |
| | | | | | | | | | | | | | |
| | Information Technology – 5.81% | | | | | | | | | | | | |
| | CSG Systems International, Inc. | | | 175,000 | | | | 4,613,000 | | | | 1.89 | % |
| | Hewlett-Packard Co. | | | 157,500 | | | | 5,206,950 | | | | 2.13 | % |
| | Super Micro Computer, Inc. (a) | | | 214,900 | | | | 4,375,364 | | | | 1.79 | % |
| | | | | | | | | 14,195,314 | | | | 5.81 | % |
| | | | | | | | | | | | | | |
| | Materials – 3.97% | | | | | | | | | | | | |
| | AK Steel Holding Corp. (a) | | | 686,000 | | | | 4,802,000 | | | | 1.97 | % |
| | PolyOne Corp. | | | 130,600 | | | | 4,893,582 | | | | 2.00 | % |
| | | | | | | | | 9,695,582 | | | | 3.97 | % |
| | Total Common Stocks | | | | | | | | | | | | |
| | (Cost $207,900,555) | | | | | | | 233,353,988 | | | | 95.59 | % |
| | | | | | | | | | | | | | |
| | RIGHTS – 0.00% | | | | | | | | | | | | |
| | Forest Laboratories, Inc. (a)(c) | | | 5,500 | | | | 5,225 | | | | 0.00 | % |
| | | | | | | | | | | | | | |
| | Total Rights | | | | | | | | | | | | |
| | (Cost $0) | | | | | | | 5,225 | | | | 0.00 | % |
The accompanying notes are an integral part of these financial statements.
HENNESSY FUNDS 1-800-966-4354
| | PARTNERSHIPS – 2.07% | | Number | | | | | | % of | |
| | | | of Shares | | | Value | | | Net Assets | |
| | Energy – 2.07% | | | | | | | | | |
| | NGL Energy Partners LP | | | 130,579 | | | $ | 5,049,490 | | | | 2.07 | % |
| | | | | | | | | | | | | | |
| | Total Partnerships | | | | | | | | | | | | |
| | (Cost $4,581,811) | | | | | | | 5,049,490 | | | | 2.07 | % |
| | | | | | | | | | | | | | |
| | SHORT-TERM INVESTMENTS – 1.69% | | | | | | | | | | | | |
| | | | | | | | | | | | | | |
| | Money Market Funds – 1.69% | | | | | | | | | | | | |
| | Fidelity Government Portfolio – | | | | | | | | | | | | |
| | Institutional Class, 0.01% (d) | | | 4,116,133 | | | | 4,116,133 | | | | 1.69 | % |
| | | | | | | | | | | | | | |
| | Total Money Market Funds | | | | | | | | | | | | |
| | (Cost $4,116,133) | | | | | | | 4,116,133 | | | | 1.69 | % |
| | | | | | | | | | | | | | |
| | Total Short-Term Investments | | | | | | | | | | | | |
| | (Cost $4,116,133) | | | | | | | 4,116,133 | | | | 1.69 | % |
| | | | | | | | | | | | | | |
| | Total Investments | | | | | | | | | | | | |
| | (Cost $216,598,499) – 99.35% | | | | | | | 242,524,836 | | | | 99.35 | % |
| | | | | | | | | | | | | | |
| | Other Assets in | | | | | | | | | | | | |
| | Excess of Liabilities – 0.65% | | | | | | | 1,593,578 | | | | 0.65 | % |
| | TOTAL NET ASSETS – 100.00% | | | | | | $ | 244,118,414 | | | | 100.00 | % |
Percentages are stated as a percent of net assets.
| (a) | Non-income producing security. |
| (b) | U.S. traded security of a foreign corporation. |
| (c) | Security is fair valued in good faith. |
| (d) | The rate listed is the fund’s 7-day yield as of April 30, 2014. |
The accompanying notes are an integral part of these financial statements.
Summary of Fair Value Exposure at April 30, 2014
The following is a summary of the inputs used to value the Fund’s net assets as of April 30, 2014 (See Note 3 in the accompanying notes to the financial statements):
| Common Stock | | Level 1 | | | Level 2 | | | Level 3 | | | Total | |
| Consumer Discretionary | | $ | 60,823,793 | | | $ | — | | | $ | — | | | $ | 60,823,793 | |
| Consumer Staples | | | 5,263,038 | | | | — | | | | — | | | | 5,263,038 | |
| Energy | | | 21,438,261 | | | | — | | | | — | | | | 21,438,261 | |
| Financials | | | 19,137,718 | | | | — | | | | — | | | | 19,137,718 | |
| Health Care | | | 14,032,876 | | | | — | | | | — | | | | 14,032,876 | |
| Industrials | | | 88,767,406 | | | | — | | | | — | | | | 88,767,406 | |
| Information Technology | | | 14,195,314 | | | | — | | | | — | | | | 14,195,314 | |
| Materials | | | 9,695,582 | | | | — | | | | — | | | | 9,695,582 | |
| Total Common Stock | | $ | 233,353,988 | | | $ | — | | | $ | — | | | $ | 233,353,988 | |
| Rights | | $ | — | | | $ | — | | | $ | 5,225 | * | | $ | 5,225 | |
| Partnerships | | | | | | | | | | | | | | | | |
| Energy | | $ | 5,049,490 | | | $ | — | | | $ | — | | | $ | 5,049,490 | |
| Total Partnerships | | $ | 5,049,490 | | | $ | — | | | $ | — | | | $ | 5,049,490 | |
| Short-Term Investments | | | | | | | | | | | | | | | | |
| Money Market Funds | | $ | 4,116,133 | | | $ | — | | | $ | — | | | $ | 4,116,133 | |
| Total Short-Term Investments | | $ | 4,116,133 | | | $ | — | | | $ | — | | | $ | 4,116,133 | |
| Total Investments | | $ | 242,519,611 | | | $ | — | | | $ | 5,225 | | | $ | 242,524,836 | |
Transfers between levels are recognized at the end of the reporting period. During the six-month period ended April 30, 2014, the Fund recognized no transfers between levels.
* Acquired in merger.
Level 3 Reconciliation Disclosure
Following is a reconciliation of Level 3 assets for which significant unobservable inputs were used to determine fair value.
| | | Rights | |
| Balance as of October 31, 2013 | | $ | 5,225 | |
| Accrued discounts/premiums | | | — | |
| Realized gain (loss) | | | — | |
| Change in unrealized appreciation (depreciation) | | | — | |
| Purchases | | | — | |
| (Sales) | | | — | |
| Transfer in and/or out of Level 3 | | | — | |
| Balance as of April 30, 2014 | | $ | 5,225 | |
| | | | | |
| Net in unrealized appreciation/depreciation during | | | | |
| the year for Level 3 investments held at April 30, 2014 | | $ | 5,225 | |
The Level 3 investments as of April 30, 2014 represented 0.00% of net assets and did not warrant a disclosure of significant unobservable valuation inputs.
The accompanying notes are an integral part of these financial statements.
HENNESSY FUNDS 1-800-966-4354
Financial Statements
Statement of Assets and Liabilities as of April 30, 2014 (Unaudited) |
| ASSETS: | | | |
| Investments in securities, at value (cost $216,598,499) | | $ | 242,524,836 | |
| Dividends and interest receivable | | | 69,324 | |
| Receivable for fund shares sold | | | 32,450 | |
| Receivable for securities sold | | | 5,068,745 | |
| Prepaid expenses and other assets | | | 25,591 | |
| Total Assets | | | 247,720,946 | |
| | | | | |
| LIABILITIES: | | | | |
| Payable for securities purchased | | | 3,074,984 | |
| Payable for fund shares redeemed | | | 179,482 | |
| Payable to advisor | | | 148,829 | |
| Payable to administrator | | | 73,009 | |
| Payable to auditor | | | 16,816 | |
| Accrued service fees | | | 17,979 | |
| Accrued interest payable | | | 157 | |
| Accrued trustees fees | | | 4,992 | |
| Accrued expenses and other payables | | | 86,284 | |
| Total Liabilities | | | 3,602,532 | |
| NET ASSETS | | $ | 244,118,414 | |
| | | | | |
| NET ASSETS CONSIST OF: | | | | |
| Capital stock | | $ | 369,887,091 | |
| Accumulated net investment loss | | | (805,254 | ) |
| Accumulated net realized loss on investments | | | (150,889,760 | ) |
| Unrealized net appreciation on investments | | | 25,926,337 | |
| Total Net Assets | | $ | 244,118,414 | |
| | | | | |
| NET ASSETS | | | | |
| Investor Class: | | | | |
| Shares authorized (no par value) | | Unlimited | |
| Net assets applicable to outstanding Investor Class shares | | | 218,161,707 | |
| Shares issued and outstanding | | | 12,713,439 | |
| Net asset value, offering price and redemption price per share | | $ | 17.16 | |
| | | | | |
| Institutional Class: | | | | |
| Shares authorized (no par value) | | Unlimited | |
| Net assets applicable to outstanding Institutional Class shares | | | 25,956,707 | |
| Shares issued and outstanding | | | 1,482,282 | |
| Net asset value, offering price and redemption price per share | | $ | 17.51 | |
The accompanying notes are an integral part of these financial statements.
Financial Statements
Statement of Operations Six Months Ended April 30, 2014 (Unaudited) |
| INVESTMENT INCOME: | | | |
Dividend income(1) | | $ | 1,372,887 | |
| Interest income | | | 270 | |
| Total investment income | | | 1,373,157 | |
| | | | | |
| EXPENSES: | | | | |
| Investment advisory fees | | | 921,011 | |
| Administration, fund accounting, custody and transfer agent fees | | | 248,922 | |
| Sub-transfer agent expenses – Investor Class (See Note 5) | | | 162,743 | |
| Sub-transfer agent expenses – Institutional Class (See Note 5) | | | 14,430 | |
| Service fees – Investor Class (See Note 5) | | | 111,343 | |
| Reports to shareholders | | | 22,399 | |
| Federal and state registration fees | | | 18,893 | |
| Audit fees | | | 12,793 | |
| Compliance expense | | | 10,655 | |
| Trustees’ fees and expenses | | | 8,380 | |
| Legal fees | | | 2,480 | |
| Other expenses | | | 12,623 | |
| Total expenses before waiver | | | 1,546,672 | |
| Administration expense waiver (See Note 5) | | | (18,467 | ) |
| Net expenses | | | 1,528,205 | |
| NET INVESTMENT LOSS | | $ | (155,048 | ) |
| | | | | |
| REALIZED AND UNREALIZED GAINS (LOSSES): | | | | |
| Net realized gain on investments | | $ | 42,943,746 | |
| Change in unrealized appreciation on investments | | | (19,552,664 | ) |
| Net gain on investments | | | 23,391,082 | |
| NET INCREASE IN NET ASSETS RESULTING FROM OPERATIONS | | $ | 23,236,034 | |
(1) Net of foreign taxes withheld of $5,114.
The accompanying notes are an integral part of these financial statements.
HENNESSY FUNDS 1-800-966-4354
(This Page Intentionally Left Blank.)
Financial Statements
| Statements of Changes in Net Assets |
| | | Six Months Ended | | | | |
| | | April 30, 2014 | | | Year Ended | |
| | | (Unaudited) | | | October 31, 2013 | |
| OPERATIONS: | | | | | | |
| Net investment loss | | $ | (155,048 | ) | | $ | (632,613 | ) |
| Net realized gain on securities | | | 42,943,746 | | | | 51,423,472 | |
| Change in unrealized appreciation (depreciation) | | | | | | | | |
| on securities | | | (19,552,664 | ) | | | 16,444,675 | |
| Net increase in net assets resulting from operations | | | 23,236,034 | | | | 67,235,534 | |
| | | | | | | | | |
| CAPITAL SHARE TRANSACTIONS: | | | | | | | | |
| Proceeds from shares subscribed – Investor Class | | | 4,670,245 | | | | 41,940,983 | |
| Proceeds from shares subscribed – Institutional Class | | | 593,350 | | | | 3,016,344 | |
| Cost of shares redeemed – Investor Class | | | (28,092,327 | )(1) | | | (147,291,804 | ) |
| Cost of shares redeemed – Institutional Class | | | (3,345,198 | )(1) | | | (20,555,666 | ) |
| Net decrease in net assets derived | | | | | | | | |
| from capital share transactions | | | (26,173,930 | ) | | | (122,890,143 | ) |
| TOTAL DECREASE IN NET ASSETS | | | (2,937,896 | ) | | | (55,654,609 | ) |
| | | | | | | | | |
| NET ASSETS: | | | | | | | | |
| Beginning of period | | | 247,056,310 | | | | 302,710,919 | |
| End of period | | $ | 244,118,414 | | | $ | 247,056,310 | |
| Undistributed net investment loss, end of period | | $ | (805,254 | ) | | $ | (650,206 | ) |
| | | | | | | | | |
| CHANGES IN SHARES OUTSTANDING: | | | | | | | | |
| Shares sold – Investor Class | | | 279,052 | | | | 3,204,921 | |
| Shares sold – Institutional Class | | | 34,811 | | | | 216,262 | |
| Shares redeemed – Investor Class | | | (1,678,889 | ) | | | (10,550,825 | ) |
| Shares redeemed – Institutional Class | | | (197,699 | ) | | | (1,522,417 | ) |
| Net decrease in shares outstanding | | | (1,562,725 | ) | | | (8,652,059 | ) |
| (1) | Net of redemption fees of $34 and $46 for the Investor Class and Institutional Class shares, respectively, related to redemption fees imposed by the FBR Small Cap Fund (which was reorganized into the Fund) during a prior year but not received until the six-month period ended April 30, 2014. |
The accompanying notes are an integral part of these financial statements.
HENNESSY FUNDS 1-800-966-4354
Financial Highlights
| Hennessy Cornerstone Growth Fund |
For an Investor Class share outstanding throughout each period
| | | Six Months Ended | |
| | | April 30, 2014 | |
| | | (Unaudited) | |
| PER SHARE DATA: | | | |
| Net asset value, beginning of period | | $ | 15.65 | |
| | | | | |
| Income from investment operations: | | | | |
| Net investment loss | | | (0.02 | ) |
| Net realized and unrealized gains (losses) on securities | | | 1.53 | |
| Total from investment operations | | | 1.51 | |
| Net asset value, end of period | | $ | 17.16 | |
| | | | | |
| TOTAL RETURN | | | 9.65 | %(1) |
| | | | | |
| SUPPLEMENTAL DATA AND RATIOS: | | | | |
| Net assets, end of period (millions) | | $ | 218.16 | |
| Ratio of expenses to average net assets | | | 1.26 | %(2) |
| Ratio of net investment loss to average net assets | | | (0.08 | )%(2) |
Portfolio turnover rate(3) | | | 82 | %(1) |
| (1) | Not annualized. |
| (2) | Annualized. |
| (3) | Portfolio turnover is calculated on the basis of the Fund as a whole. |
The accompanying notes are an integral part of these financial statements.
| Year Ended October 31, | |
| 2013 | | | 2012 | | | 2011 | | | 2010 | | | 2009 | |
| | | | | | | | | | | | | | |
| $ | 12.38 | | | $ | 9.97 | | | $ | 10.28 | | | $ | 8.81 | | | $ | 8.80 | |
| | | | | | | | | | | | | | | | | | | |
| | | | | | | | | | | | | | | | | | | |
| | (0.11 | ) | | | (0.07 | ) | | | (0.08 | ) | | | (0.10 | ) | | | (0.04 | ) |
| | 3.38 | | | | 2.48 | | | | (0.23 | ) | | | 1.57 | | | | 0.05 | |
| | 3.27 | | | | 2.41 | | | | (0.31 | ) | | | 1.47 | | | | 0.01 | |
| $ | 15.65 | | | $ | 12.38 | | | $ | 9.97 | | | $ | 10.28 | | | $ | 8.81 | |
| | | | | | | | | | | | | | | | | | | |
| | 26.41 | % | | | 24.17 | % | | | (3.02 | )% | | | 16.69 | % | | | 0.11 | % |
| | | | | | | | | | | | | | | | | | | |
| | | | | | | | | | | | | | | | | | | |
| $ | 220.83 | | | $ | 265.60 | | | $ | 184.40 | | | $ | 207.11 | | | $ | 228.96 | |
| | 1.29 | % | | | 1.34 | % | | | 1.33 | % | | | 1.34 | % | | | 1.36 | % |
| | (0.26 | )% | | | (0.66 | )% | | | (0.78 | )% | | | (0.89 | )% | | | (0.42 | )% |
| | 105 | % | | | 90 | % | | | 106 | % | | | 103 | % | | | 108 | % |
The accompanying notes are an integral part of these financial statements.
HENNESSY FUNDS 1-800-966-4354
Financial Highlights
| Hennessy Cornerstone Growth Fund |
For an Institutional Class share outstanding throughout each period
| | | Six Months Ended | |
| | | April 30, 2014 | |
| | | (Unaudited) | |
| PER SHARE DATA: | | | |
| Net asset value, beginning of period | | $ | 15.94 | |
| | | | | |
| Income from investment operations: | | | | |
| Net investment income (loss) | | | 0.03 | |
| Net realized and unrealized gains (losses) on securities | | | 1.54 | |
| Total from investment operations | | | 1.57 | |
| Net asset value, end of period | | $ | 17.51 | |
| | | | | |
| TOTAL RETURN | | | 9.85 | %(1) |
| | | | | |
| SUPPLEMENTAL DATA AND RATIOS: | | | | |
| Net assets, end of period (millions) | | $ | 25.96 | |
| Ratio of expenses to average net assets: | | | | |
| Before expense reimbursement | | | 1.12 | %(2) |
| After expense reimbursement | | | 0.98 | %(2) |
| Ratio of net investment income (loss) to average net assets: | | | | |
| Before expense reimbursement | | | (0.02 | )%(2) |
| After expense reimbursement | | | 0.12 | %(2) |
Portfolio turnover rate(3) | | | 82 | %(1) |
| (1) | Not annualized. |
| (2) | Annualized. |
| (3) | Portfolio turnover is calculated on the basis of the Fund as a whole. |
The accompanying notes are an integral part of these financial statements.
| Year Ended October 31, | |
| 2013 | | | 2012 | | | 2011 | | | 2010 | | | 2009 | |
| | | | | | | | | | | | | | |
| $ | 12.57 | | | $ | 10.09 | | | $ | 10.37 | | | $ | 8.86 | | | $ | 8.82 | |
| | | | | | | | | | | | | | | | | | | |
| | | | | | | | | | | | | | | | | | | |
| | 0.01 | | | | (0.04 | ) | | | (0.05 | ) | | | (0.07 | ) | | | — | |
| | 3.36 | | | | 2.52 | | | | (0.23 | ) | | | 1.58 | | | | 0.04 | |
| | 3.37 | | | | 2.48 | | | | (0.28 | ) | | | 1.51 | | | | 0.04 | |
| $ | 15.94 | | | $ | 12.57 | | | $ | 10.09 | | | $ | 10.37 | | | $ | 8.86 | |
| | | | | | | | | | | | | | | | | | | |
| | 26.81 | % | | | 24.58 | % | | | (2.70 | )% | | | 17.04 | % | | | 0.45 | % |
| | | | | | | | | | | | | | | | | | | |
| | | | | | | | | | | | | | | | | | | |
| $ | 26.23 | | | $ | 37.11 | | | $ | 2.53 | | | $ | 3.12 | | | $ | 4.68 | |
| | | | | | | | | | | | | | | | | | | |
| | 1.11 | % | | | 1.11 | % | | | 1.09 | % | | | 1.09 | % | | | 1.11 | % |
| | 0.98 | % | | | 0.98 | % | | | 0.98 | % | | | 0.98 | % | | | 0.98 | % |
| | | | | | | | | | | | | | | | | | | |
| | (0.01 | )% | | | (0.51 | )% | | | (0.55 | )% | | | (0.64 | )% | | | (0.17 | )% |
| | 0.12 | % | | | (0.38 | )% | | | (0.44 | )% | | | (0.53 | )% | | | (0.04 | )% |
| | 105 | % | | | 90 | % | | | 106 | % | | | 103 | % | | | 108 | % |
The accompanying notes are an integral part of these financial statements.
HENNESSY FUNDS 1-800-966-4354
Notes to the Financial Statements
April 30, 2014 (Unaudited)
1). ORGANIZATION
The Hennessy Cornerstone Growth Fund (the “Fund”) is a series of Hennessy Funds Trust (the “Trust”), which was organized as a Delaware statutory trust on September 17, 1992. The Fund is an open-end management investment company registered under the Investment Company Act of 1940, as amended. The Fund is a successor to a fund with the same name (the “Predecessor Fund”) that was a series of Hennessy Mutual Funds, Inc., a Maryland corporation, pursuant to a reorganization that took place after the close of business on February 28, 2014. Prior to February 28, 2014, the Fund had no investment operations. As a result of the reorganization, holders of the Investor Class shares of the Predecessor Fund received Investor Class shares of the Fund (the Investor Class shares of the Fund are the successor to the accounting and performance information of the Predecessor Fund), and holders of the Institutional Class shares of the Predecessor Fund received Institutional Class shares of the Fund (the Institutional Class shares of the Fund are the successor to the accounting and performance information of the Predecessor Fund). The investment objective of the Fund is long-term growth of capital. The Fund is a diversified fund.
The Fund offers Investor Class and Institutional Class shares. Prior to October 26, 2012, the Investor Class shares were known as Original Class shares. Each class of shares differs principally in its respective administration, 12b-1 distribution and service fees, shareholder servicing, and transfer agent expenses and sales charges, if any. Each class has identical rights to earnings, assets, and voting privileges, except for class-specific expenses and exclusive rights to vote on matters affecting only individual classes.
2). SIGNIFICANT ACCOUNTING POLICIES
The following is a summary of significant accounting policies consistently followed by the Fund in the preparation of the financial statements. These policies are in conformity with U.S. generally accepted accounting principles (“GAAP”).
| a). | Investment Valuation – All investments in securities are recorded at their estimated fair value, as described in Note 3. |
| b). | Federal Income Taxes – Provision for Federal income taxes or excise taxes has not been made since the Fund has elected to be taxed as a “regulated investment company” and intends to distribute substantially all of its taxable income to its shareholders and otherwise comply with the provisions of the Internal Revenue Code of 1986, as amended, applicable to regulated investment companies. Net investment income or loss and realized gains and losses for federal income tax purposes may differ from that reported on the financial statements because of temporary book and tax basis differences. Temporary differences are primarily the result of the treatment of wash sales for tax reporting purposes. Distributions from net realized gains for book purposes may include short-term capital gains, which are included as ordinary income to shareholders for tax purposes. |
| c). | Income and Expenses – Dividend income is recognized on the ex-dividend date or as soon as information is available to the Fund. Interest income, which includes the amortization of premium and accretion of discount, is recognized on an accrual basis. The Fund is charged for those expenses that are directly attributable to the portfolio, |
| | such as advisory, administration, and certain shareholder service fees. Income, expenses (other than expenses attributable to a specific class), and realized and unrealized gains or losses on investments are allocated to each class of shares based on its respective net assets. |
| d). | Distributions to Shareholders – Dividends from net investment income for the Fund, if any, are declared and paid out annually, usually in November or December. Distributions of net realized capital gains, if any, are declared and paid annually, usually in November or December. |
| e). | Security Transactions – Investment and shareholder transactions are recorded on the trade date. The Fund determines the gain or loss realized from the investment transactions by comparing the original cost of the security lot sold with the net sale proceeds. Discounts and premiums on securities purchased are accreted/amortized over the life of the respective security. |
| f). | Use of Estimates – The preparation of financial statements in conformity with GAAP requires management to make estimates and assumptions that affect the reported amounts of assets and liabilities and disclosure of contingent assets and liabilities at the date of the financial statements and the reported change in net assets during the reporting period. Actual results could differ from those estimates. |
| g). | Share Valuation – The net asset value (“NAV”) per share of the Fund is calculated by dividing the sum of the value of the securities held by the Fund, plus cash or other assets, minus all liabilities (including estimated accrued expenses) by the total number of shares outstanding for the Fund, rounded to the nearest cent. The Fund’s shares will not be priced on days the New York Stock Exchange is closed for trading. The offering and redemption price per share for the Fund is equal to the Fund’s net asset value per share. |
| h). | Foreign Currency – Values of investments denominated in foreign currencies, if any, are converted into U.S. dollars using the spot market rate of exchange at the time of valuation. Purchases and sales of investments and income are translated into U.S. dollars using the spot market rate of exchange prevailing on the respective dates of such transactions. The Fund does not isolate the portion of the results of operations resulting from fluctuations in foreign exchange rates on investments from fluctuations resulting from changes in the market prices of securities held. Such fluctuations are included with the net realized and unrealized gain or loss on investments. Foreign investments present additional risks due to currency fluctuations, economic and political factors, lower liquidity, government regulations, differences in accounting standards, and other factors. |
| i). | Forward Contracts – The Fund may enter into forward currency contracts to reduce its exposure to changes in foreign currency exchange rates on its foreign holdings and to lock in the U.S. dollar cost of firm purchase and sale commitments for securities denominated in foreign currencies. A forward currency contract is a commitment to purchase or sell a foreign currency at a future date at a negotiated forward rate. The gain or loss arising from the difference between the U.S. dollar cost of the original contract and the value of the foreign currency in U.S. dollars upon closing of such contract is included in net realized gain or loss from foreign currency transactions. During the six months ended April 30, 2014, the Fund did not enter into any forward contracts. |
| j). | Repurchase Agreements – The Fund may enter into repurchase agreements with member banks or security dealers of the Federal Reserve Board whom the investment advisor deems creditworthy. The repurchase price generally equals the price paid by the Fund plus interest negotiated on the basis of current short-term rates. |
HENNESSY FUNDS 1-800-966-4354
| | Securities pledged as collateral for repurchase agreements are held by the custodian bank until the respective agreements mature. Provisions of the repurchase agreements ensure that the market value of the collateral, including accrued interest thereon, is sufficient in the event of default of the counterparty. If the counterparty defaults and the value of the collateral declines or if the counterparty enters an insolvency proceeding, realization of the collateral by the Fund may be delayed or limited. |
| k). | Accounting for Uncertainty in Income Taxes – The Fund has adopted accounting policies regarding recognition and measurement of tax positions taken or expected to be taken on a tax return. The Fund has reviewed all open tax years in major jurisdictions and concluded that there is no impact on the Fund’s net assets and no tax liability resulting from unrecognized tax benefits relating to uncertain income tax positions taken or expected to be taken on a tax return. The Fund’s major tax jurisdictions are U.S. Federal and Delaware. As of April 30, 2014, open Federal and state tax years for the Fund include the tax years ended October 31, 2011 through 2013. |
| l). | Derivatives – The Fund may invest in, or enter into, derivatives, such as options, futures contracts, options on futures contracts, and swaps, for a variety of reasons, including to hedge certain risks, to provide a substitute for purchasing or selling particular securities, or to increase potential income gain. Derivatives may provide a cheaper, quicker, or more specifically focused way for a Fund to invest than “traditional” securities would. The main purpose of utilizing these derivative instruments is for hedging purposes. |
| | The Fund has adopted the financial accounting reporting rules as required by the Derivatives and Hedging Topic of the Financial Accounting Standards Board Accounting Standards Codification. Under such rules, the Fund is required to include enhanced disclosure that enables investors to understand how and why an entity uses derivatives, how derivatives are accounted for, and how derivatives instruments affect an entity’s results of operations and financial position. During the six months ended April 30, 2014, the Fund did not hold any derivative instruments. |
| m). | Events Subsequent to the Fiscal Period End – The Fund has adopted financial reporting rules regarding subsequent events that require an entity to recognize in the financial statements the effects of all subsequent events that provide additional evidence about conditions that existed at the date of the balance sheet. Management has evaluated the Fund’s related events and transactions that occurred subsequent to April 30, 2014 through the date of issuance of the Fund’s financial statements. There were no events or transactions that occurred during this period that materially impacted the amounts or disclosures in the Fund’s financial statements. |
3). SECURITIES VALUATION
The Fund has adopted authoritative fair valuation accounting standards that establish an authoritative definition of fair value and set out a hierarchy for measuring fair value. These standards require additional disclosures about the various inputs and valuation techniques used to develop the measurements of fair value and a discussion in changes in valuation techniques and related inputs during the period. These inputs are summarized in the three broad levels listed below:
| | Level 1 – | Quoted unadjusted prices for identical instruments in active markets to which the Fund has access at the date of measurement. |
| | Level 2 – | Quoted prices for similar instruments in active markets; quoted prices for identical or similar instruments in markets that are not active; and model-derived valuations in which all significant inputs and significant value drivers are observable in active markets. Level 2 inputs are those in markets for which there are few transactions, the prices are not current, the prices are fair value adjusted due to post-market close subsequent events (foreign markets), little public information exists, or instances where prices vary substantially over time or among brokered market makers. These inputs may also include interest rates, prepayment speeds, credit risk curves, default rates, and similar data. |
| | Level 3 – | Model-derived valuations in which one or more significant inputs or significant value drivers are unobservable. Unobservable inputs are those inputs that reflect the Fund’s own assumptions about what market participants would use to price the asset or liability based on the best available information. |
Following is a description of the valuation techniques applied to the Fund’s major categories of assets and liabilities measured at fair value on a recurring basis.
Equity Securities – Equity securities, including common stocks, preferred stocks, foreign issued common stocks, exchange traded funds, closed-end mutual funds, and real estate investment trusts, that are traded on a securities exchange for which a last-quoted sales price is readily available will be valued at the last sales price as reported by the primary exchange on which the securities are listed. Securities listed on The NASDAQ Stock Market (“NASDAQ”) will be valued at the NASDAQ Official Closing Price, which may differ from the last sales price reported. Securities traded on a securities exchange for which a last-quoted sales price is not readily available will be valued at the mean between the bid and ask prices. To the extent these securities are actively traded and valuation adjustments are not applied, they are classified in Level 1 of the fair value hierarchy.
Investment Companies – Investments in investment companies (e.g., mutual funds and exchange traded funds) are generally priced at the ending NAV provided by the Fund’s service agent and will be classified in Level 1 of the fair value hierarchy.
Debt Securities – Debt securities, including corporate bonds, asset-backed securities, mortgage-backed securities, municipal bonds, U.S. Treasuries, and U.S. government agency issues, are valued at market on the basis of valuations furnished by an independent pricing service that utilizes both dealer-supplied valuations and formula-based techniques. The pricing service may consider recently executed transactions in securities of the issuer or comparable issuers, market price quotations (where observable), bond spreads, and fundamental data relating to the issuer. In addition, the model may incorporate market observable data such as reported sales of similar securities, broker quotes, yields, bids, offers, and reference data. Certain securities are valued principally using dealer quotations. These securities are generally classified in Level 2 of the fair value hierarchy.
Short-Term Securities – Short-term equity investments, including money market funds, are valued in the manner specified above. Short-term debt investments are valued at amortized cost, if their original maturity was 60 days or less, or by amortizing the values as of the 61st day prior to maturity, if their original term to maturity exceeded 60 days. Short-term securities are generally classified in Level 1 or Level 2 of the fair market hierarchy depending on the inputs used and market activity levels for specific securities.
The Board of Trustees of the Fund (the “Board”) has adopted fair value pricing procedures that are followed when a price for a security is not readily available or if a
HENNESSY FUNDS 1-800-966-4354
significant event has occurred that indicates the closing price of a security no longer represents the true value of that security. Fair value pricing determinations are made in good faith in accordance with these procedures. There are numerous criteria that will be given consideration in determining a fair value of a security. Some of these criteria are trading volume of security and markets, the value of other like securities, and news events with direct bearing to security or market. Fair value pricing results in an estimated price that reasonably reflects the current market conditions in order to rate the portfolio holdings such that shareholder transactions receive a fair net asset value. Depending on the relative significance of the valuation inputs, these securities may be classified in either Level 2 or Level 3 of the fair value hierarchy.
Fair valuing of foreign securities may be determined with the assistance of a pricing service using correlations between the movement of prices of such securities and indices of domestic securities and other appropriate indicators, such as closing market prices of relevant American Depositary Receipts or futures contracts. The effect of using fair value pricing is that the Fund’s NAV will reflect the affected portfolio securities’ value as determined in the judgment of the Board or its designee instead of being determined by the market. Using a fair value pricing methodology to price foreign securities may result in a value that is different from a foreign security’s most recent closing price and from the prices used by other investment companies to calculate their net asset values and are generally considered Level 2 prices in the fair valuation hierarchy. Because the Fund may invest in foreign securities, the value of the Fund’s portfolio securities may change on days when you will not be able to purchase or redeem your shares.
The Board has delegated day-to-day valuation matters to a Valuation Committee comprised of one or more representatives from Hennessy Advisors, Inc., the Fund’s investment advisor. The function of the Valuation Committee is to value securities where current and reliable market quotations are not readily available. All actions taken by the Valuation Committee are reviewed by the Board.
The Fund has performed an analysis of all existing investments to determine the significance and character of all inputs to their fair value determination. Various inputs are used in determining the value of the Fund’s investments. The inputs or methodology used for valuing securities are not necessarily an indication of the risk associated with investing in those securities. Details related to the fair valuation hierarchy of the Fund’s securities as of April 30, 2014 are included in the Fund’s Schedule of Investments.
4). INVESTMENT TRANSACTIONS
Purchases and sales of investment securities (excluding government and short-term investments) for the Fund during the six months ended April 30, 2014 were $201,983,346 and $231,661,329, respectively.
There were no purchases or sales/maturities of long-term U.S. Government Securities for the Fund during the six months ended April 30, 2014.
5). INVESTMENT MANAGEMENT FEE AND OTHER TRANSACTIONS WITH AFFILIATES
Hennessy Advisors, Inc. (the “Advisor”) is the investment advisor of the Fund. The Advisor provides the Fund with investment management services under an Investment Advisory Agreement. The Advisor furnishes all investment advice, office space, facilities, and provides most of the personnel needed by the Fund. As compensation for its services, the Advisor is entitled to a monthly fee from the Fund. The fee is based upon the average daily net assets of the Fund at the annual rate of 0.74%. The net investment advisory fees payable for the Fund as of April 30, 2014 were $148,829.
The Advisor has agreed to waive its fees and absorb expenses to the extent that the total annual operating expenses (excluding all Federal, state and local taxes, interest, brokerage commissions, acquired fund fees and expenses and other costs incurred in connection with the purchase and sale of securities and extraordinary items) exceed 0.98% of the Fund’s net assets for the Institutional Class shares of the Fund. The expense limitation agreement for the Institutional Class shares can only be terminated by the Board.
For a period of three years after the year in which the Advisor waives or reimburses expenses, the Advisor may seek reimbursement from the Fund to the extent that total annual fund operating expenses are less than the expense limitation in effect at the time of the reimbursement. During the three years ended October 31, 2013, no Advisor fees were waived and therefore no expenses are subject to potential recovery.
The Board has approved a Shareholder Servicing Agreement for the Investor Class shares of the Fund, which was instituted to compensate the Advisor for the non-investment management services it provides to the Fund. The Shareholder Servicing Agreement provides for a monthly fee paid to the Advisor at an annual rate of 0.10% of the average daily net assets of the Fund attributable to Investor Class shares. Shareholder servicing fees payable for the Fund as of April 30, 2014 were $17,979.
The Fund has entered into agreements with various brokers, dealers, and financial intermediaries in connection with the sale of shares of the Fund. The agreements provide for periodic payments by the Fund to the brokers, dealers, and financial intermediaries for providing certain shareholder maintenance services (sub-transfer agent expenses). These shareholder services include the pre-processing and quality control of new accounts, shareholder correspondence, answering customer inquiries regarding account status, and facilitating shareholder telephone transactions. Fees paid by the Fund to various brokers, dealers, and financial intermediaries for the six months ended April 30, 2014 were $177,173.
U.S. Bancorp Fund Services, LLC (“USBFS”) provides the Fund with administrative, fund accounting, and transfer agent services, including all regulatory reporting, and necessary office equipment and personnel. As administrator, USBFS prepares various federal and state regulatory filings, reports, and returns for the Fund; prepares reports and materials to be supplied to the Board; monitors the activities of the Fund’s custodian, transfer agent, and accountants; and coordinates the preparation and payment of the Fund’s expenses and reviews the Fund’s expense accruals. Fees paid to USBFS for the six months ended April 30, 2014 were $230,455.
USBFS has voluntarily waived all or a portion of its fees allocated to the Institutional Class shares of the Fund. The administration fees voluntarily waived by USBFS during the six months ended April 30, 2014 were $18,467.
U.S. Bank, N.A., an affiliate of USBFS, serves as the Fund’s custodian. Quasar Distributors, LLC acts as the Fund’s principal underwriter in a continuous public offering of the Fund’s shares. Quasar Distributors, LLC is an affiliate of USBFS and U.S. Bank, N.A.
6). LINE OF CREDIT
The Fund has a line of credit with the other funds in the Hennessy Funds family of funds (the “Hennessy Funds”) in the amount of the lesser of (i) $100,000,000 or (ii) 33.33% of each Hennessy Fund’s net assets, or 30% for the Hennessy Gas Utility Index Fund and 10% for the Hennessy Balanced Fund, intended to provide short-term financing, if necessary, subject to certain restrictions, in connection with shareholder redemptions. The
HENNESSY FUNDS 1-800-966-4354
7). FEDERAL TAX INFORMATION
As of October 31, 2013, the Fund’s most recent fiscal year end, the components of accumulated earnings (losses) for income tax purposes for the Fund were as follows:
| | Cost of investments for tax purposes | | $ | 201,929,450 | |
| | Gross tax unrealized appreciation | | $ | 49,734,271 | |
| | Gross tax unrealized depreciation | | | (4,414,906 | ) |
| | Net tax unrealized appreciation/depreciation | | $ | 45,319,365 | |
| | Undistributed ordinary income | | $ | — | |
| | Undistributed long-term capital gains | | | — | |
| | Total distributable earnings | | $ | — | |
| | Other accumulated gain (loss) | | $ | (194,324,076 | ) |
| | Total accumulated gain (loss) | | $ | (149,004,711 | ) |
The difference between book-basis and tax-basis unrealized appreciation is attributable primarily to capital loss carry overs, wash sales, and partnership adjustments.
At October 31, 2013, the Fund’s most recent fiscal year end, the Fund had capital loss carryforwards that expire as follows:
| | $ 10,518,607 | 10/31/16 |
| | $183,155,263 | 10/31/17 |
During the year ended October 31, 2013, the Fund’s most recent fiscal year end, the capital loss carry forwards utilized for the Fund were $50,322,514.
Capital losses sustained in the year ended October 31, 2012 and in future taxable years will not expire and may be carried over by the Fund without limitation; however, they will retain the character of the original loss. Furthermore, any losses incurred during those taxable years will be required to be utilized prior to the losses incurred in the pre-enactment taxable years. As a result of this ordering rule, pre-enactment capital loss carryforwards may be more likely to expire unused. Under pre-enactment law, capital losses could be carried forward for eight years, and carried forward as short-term capital losses, irrespective of the character of the original loss.
At October 31, 2013, the Fund deferred, on a tax basis, a post-December late year ordinary loss deferral of $(650,206) and the Fund did not defer, on a tax basis, any post-December loss deferrals.
The Fund did not pay any distributions during fiscal year 2014 (year-to-date) or fiscal year 2013.
8.) AGREEMENT AND PLAN OF REORGANIZATION
On December 11, 2013, the Board approved an Agreement and Plan of Reorganization (the “Agreement”), of the Hennessy Cornerstone Growth Fund (the “New Fund”), pursuant to which the New Fund would be a successor to the corresponding series of the same name of Hennessy Mutual Funds, Inc., a Maryland corporation (the “Predecessor Fund”). The Agreement provided for the transfer of assets of the Predecessor Fund to the New Fund and the assumption of the liabilities of the Predecessor Fund by the New
Fund. The New Fund had the same investment objective and substantially similar principal investment strategies as the Predecessor Fund. The reorganization was effective as of the close of business on February 28, 2014. The following table illustrates the specifics of the reorganization:
| | | Shares of the New Fund | | | |
| | Predecessor Fund | Issued to Shareholders of | New Fund | Combined | Tax Status |
| | Net Assets | the Predecessor Fund | Net Assets | Net Assets | of Transfer |
| | $252,177,309(1) | 14,754,804 | $252,177,309 | $252,177,309 | Non-taxable |
| | (1) | Included accumulated realized losses and unrealized appreciation in the amounts of $(152,482,828) and $24,938,411, respectively. |
HENNESSY FUNDS 1-800-966-4354
Expense Example (Unaudited)
April 30, 2014
As a shareholder of the Fund, you incur two types of costs: (1) transaction costs, including sales charges (loads) on purchase payments, reinvested dividends, or other distributions; redemption fees; and exchange fees; and (2) ongoing costs, including management fees; service fees; and other Fund expenses. This Example is intended to help you understand your ongoing costs (in dollars) of investing in the Fund and to compare these costs with the ongoing costs of investing in other mutual funds. The Example is based on an investment of $1,000 invested at the beginning of the period and held for the entire period from November 1, 2013 through April 30, 2014.
Actual Expenses
The first line of the table below under the “Investor Class” and “Institutional Class” headings provides information about actual account values and actual expenses. Although the Fund charges no sales loads or transaction fees, you will be assessed fees for outgoing wire transfers, returned checks and stop payment orders at prevailing rates charged by U.S. Bancorp Fund Services, LLC, the Fund’s transfer agent. If you request that a redemption be made by wire transfer, currently a $15.00 fee is charged by the Fund’s transfer agent. IRA accounts will be charged a $15.00 annual maintenance fee. The example below includes, but is not limited to, management fees, shareholder servicing fees, fund accounting, custody, and transfer agent fees. However, the example below does not include portfolio trading commissions and related expenses, and other extraordinary expenses as determined under generally accepted accounting principles. You may use the information in this line, together with the amount you invested, to estimate the expenses that you paid over the period. Simply divide your account value by $1,000 (for example, an $8,600 account value divided by $1,000 = 8.6), then multiply the result by the number in the first line of the table under the “Investor Class” and “Institutional Class” headings in the column entitled “Expenses Paid During Period” to estimate the expenses you paid on your account during this period.
Hypothetical Example for Comparison Purposes
The second line of the table below under the “Investor Class” and “Institutional Class” headings provides information about hypothetical account values and hypothetical expenses based on the Fund’s actual expense ratios and an assumed rate of return of 5% per year before expenses, which is not the Fund’s actual return. The hypothetical account values and expenses may not be used to estimate the actual ending account balance or expenses you paid for the period. You may use this information to compare the ongoing costs of investing in the Fund and other funds. To do so, compare this 5% hypothetical example with the 5% hypothetical examples that appear in the shareholder reports of the other funds. Please note that the expenses shown in the table are meant to highlight your ongoing costs only and do not reflect any transactional costs, such as sales charges (loads), or exchange fees. Therefore, the second line of the table under the “Investor Class” and “Institutional Class” headings is useful in comparing ongoing costs only, and will not help you determine the relative total costs of owning different funds. In addition, if these transactional costs were included, your costs would have been higher.
| | | | Expenses Paid |
| | Beginning | Ending | During Period(1) |
| | Account Value | Account Value | November 1, 2013 – |
| | November 1, 2013 | April 30, 2014 | April 30, 2014 |
| Investor Class | | | |
| | | | |
| Actual | $1,000.00 | $1,096.50 | $6.55 |
| | | | |
| Hypothetical (5% return | | | |
| before expenses) | $1,000.00 | $1,018.55 | $6.31 |
| | | | |
| Institutional Class | | | |
| | | | |
| Actual | $1,000.00 | $1,098.50 | $5.10 |
| | | | |
| Hypothetical (5% return | | | |
| before expenses) | $1,000.00 | $1,019.93 | $4.91 |
| (1) | Expenses are equal to the Fund’s annualized expense ratio of 1.26% for Investor Class shares or 0.98% for Institutional Class shares, as applicable, multiplied by the average account value over the period, multiplied by 181/365 days (to reflect one-half year period). |
HENNESSY FUNDS 1-800-966-4354
Proxy Voting
A description of the policies and procedures the Fund uses to determine how to vote proxies relating to portfolio securities is available without charge: (1) by calling 1-800-966-4354; (2) on the Hennessy Funds’ website at hennessyfunds.com; or (3) on the U.S. Securities and Exchange Commission’s (the “SEC”) website at www.sec.gov. The Fund’s proxy voting record is available on both the Hennessy Funds’ website at hennessyfunds.com and the SEC’s website at www.sec.gov no later than August 31 for the prior 12 months ending June 30.
Quarterly Filings on Form N-Q
The Fund files its complete schedule of portfolio holdings with the SEC for the first and third quarters of each fiscal year on Form N-Q. The Fund’s Forms N-Q are available on the SEC’s website at www.sec.gov. The Fund’s Forms N-Q may be reviewed and copied at the SEC’s Public Reference Room in Washington, DC and information on the operation of the Public Reference Room may be obtained by calling 1-800-SEC-0330. Information included in the Fund’s Forms N-Q will also be available upon request by calling 1-800-966-4354.
Householding
To help keep the Fund’s costs as low as possible, we generally deliver a single copy of most financial reports and prospectuses to shareholders who share an address, even if the accounts are registered under different names. This process, known as “householding,” does not apply to account statements. You may, of course, request an individual copy of a prospectus or financial report at any time. If you would like to receive separate mailings, please call the Administrator at 1-800-261-6950 or 1-414-765-4124 and we will begin individual delivery within 30 days of your request. If your account is held through a financial institution or other intermediary, please contact them directly to request individual delivery.
Board Approval of Investment Advisory
Agreement
At its meeting on December 4, 2013, the Board of Trustees of the Fund (the “Board”) unanimously approved the investment advisory agreement of the Fund for an initial period of two years.
The Board reviewed a number of documents, including a memorandum provided by outside legal counsel that described the fiduciary duties of the Board with respect to approving the investment advisory agreement and the relevant factors for consideration, the Advisor’s most recent Form 10-K, a copy of the advisory agreement, a fund fact sheet, and peer expense and performance comparisons. The Board considered and discussed numerous factors, including the following:
| | • | The Board considered the services identified below that are provided by the Advisor: |
| | | • | The Advisor acts as portfolio manager for the Fund. In this capacity, the Advisor manages the composition of the portfolio of the Fund, including the purchase, retention, and disposition of portfolio securities in accordance with the Fund’s investment objectives, policies, and restrictions. The Advisor holds a perpetual, royalty-free, exclusive license to the formula used for the Fund. |
| | | • | The Advisor oversees distribution of the Fund through third-party broker/dealers and independent financial institutions such as Charles Schwab, Inc., Fidelity, TD Waterhouse, and Pershing. The Advisor participates in “no transaction fee” (“NTF”) programs with these companies on behalf of the Fund, which allows customers to purchase the Fund through third-party distribution channels without paying a transaction fee. The Advisor compensates a number of these third-party providers of NTF programs out of its own revenues and not those of the Fund. |
| | | • | The Advisor oversees service providers that support the Fund in providing fund accounting, fund administration, fund distribution, transfer agency, and custodial services. |
| | • | The Board considered that the advisory services to be provided by the Advisor are services required for the operation of the Fund. |
| | • | The Board considered the nature and quality of the advisory services offered by the Advisor to the Fund. |
| | • | The Board considered that the terms of the advisory agreement are fair and reasonable. |
| | • | The Board compared the performance of the Fund to benchmark indices over various periods of time and concluded that the positive performance of the Fund warranted the approval of the advisory agreement. |
| | • | The Board reviewed the Fund’s expense ratio and comparable expense ratios for funds comparable to the Fund. The Board used data from Morningstar showing funds similar in asset size and investment objective to the Fund and determined that the expense ratio of the Fund falls within the range of the ratios of other comparable funds and concluded that the expenses of the Fund were reasonable. |
| | • | The Board considered the fees charged by the Advisor to those of funds similar in asset size and investment objective to the Fund and concluded the advisory fee of the Fund was reasonable and warranted approval of the advisory agreement. |
HENNESSY FUNDS 1-800-966-4354
| | • | The Board considered the profitability of the Advisor with respect to the Fund and concluded the profits were reasonable and not excessive when compared to profitability guidelines set forth in relevant court cases. |
| | • | The Board considered the high level of professionalism and knowledge of the Advisor’s employees, along with an extremely low level of turnover of the employees of the Advisor, and concluded that this was beneficial to the Fund and its shareholders, as it ensures that the Fund is operated efficiently. |
All of the factors above were considered separately by the Board, including the Trustees who are not “interested persons” (as defined in the Investment Company Act of 1940, as amended) of the Fund (the “Independent Trustees”) meeting in an executive session. The factors were viewed in their totality by the Board, with no single factor being the principal or determinative factor in the Board’s determination of whether to approve the advisory agreement. Based on the factors discussed above, the Board, including all of the Independent Trustees, recommended approval of the advisory agreement.
(This Page Intentionally Left Blank.)
For information, questions or assistance, please call
The Hennessy Funds
1-800-966-4354 or 1-415-899-1555
INVESTMENT ADVISOR
Hennessy Advisors, Inc.
7250 Redwood Blvd., Suite 200
Novato, California 94945
ADMINISTRATOR,
TRANSFER AGENT,
DIVIDEND PAYING AGENT &
SHAREHOLDER SERVICING AGENT
U.S. Bancorp Fund Services, LLC
P.O. Box 701
Milwaukee, Wisconsin 53201-0701
CUSTODIAN
U.S. Bank N.A.
Custody Operations
1555 North River Center Dr., Suite 302
Milwaukee, Wisconsin 53212
TRUSTEES
Neil J. Hennessy
Robert T. Doyle
J. Dennis DeSousa
Gerald P. Richardson
COUNSEL
Foley & Lardner LLP
777 East Wisconsin Avenue
Milwaukee, Wisconsin 53202-5306
INDEPENDENT REGISTERED
PUBLIC ACCOUNTING FIRM
KPMG LLP
777 East Wisconsin Avenue
Milwaukee, Wisconsin 53202-5306
DISTRIBUTOR
Quasar Distributors, LLC
615 East Michigan Street
Milwaukee, Wisconsin 53202

hennessyfunds.com | 1-800-966-4354
This report has been prepared for shareholders and may be distributed to
others only if preceded or accompanied by a current prospectus.
SEMI-ANNUAL REPORT
APRIL 30, 2014
HENNESSY FOCUS FUND
Investor Class HFCSX
Institutional Class HFCIX
hennessyfunds.com | 1-800-966-4354
(This Page Intentionally Left Blank.)
Contents
| Letter to Shareholders | 2 |
| Performance Overview | 4 |
| Financial Statements | |
| Schedule of Investments | 7 |
| Statement of Assets and Liabilities | 11 |
| Statement of Operations | 12 |
| Statements of Changes in Net Assets | 13 |
| Financial Highlights | 14 |
| Notes to the Financial Statements | 18 |
| Expense Example | 25 |
| Proxy Voting | 27 |
| Quarterly Filings on Form N-Q | 27 |
| Householding | 27 |
| Board Approval of Investment Advisory Agreements | 28 |
HENNESSY FUNDS 1-800-966-4354
Dear Shareholder:
The financial markets have provided strong returns over the past six-months ended April 30, 2014, with the Dow Jones Industrial Average (DJIA) and S&P 500 both returning approximately 8% during the period. The current valuation metrics of the major indices are solid; for example, the DJIA currently has a price-to-earnings ratio of 15x and a price-to-sales ratio of 1.75x. The DJIA also has a dividend yield of 2.2%, which is nearly as high as that of a 10-Year U.S. Treasury, which is currently yielding 2.6%. Investing in high-yielding, high-quality DJIA stocks have the potential to not only provide an income stream but also for stock price appreciation as well. Fixed income investing has run its course, in my opinion, and many individuals are currently benefiting from the return to investing in equities that possess strong fundamentals.
U.S. corporations continue to drive shareholder value by making acquisitions, initiating and raising dividends, investing in internal infrastructure, and buying back stock. However, lately I have begun to see a shift in those business strategies. The easier-to-execute acquisitions seem to be a thing of the past, and firms now have to be even more creative to execute accretive deals. I also believe that while firms may continue to initiate dividends, fewer firms will raise their dividends and fewer firms will participate in stock buyback programs going forward. So what will these cash-rich companies do with their capital if they are not raising dividends or buying back stock? I believe we will see companies begin to initiate capital expenditure programs.
Due to the continuing uncertainty from a lack of clear policies on taxes, healthcare, and regulations, I have observed that corporations would rather wait for clarity from our government leaders and defer any significant changes to their current business models. Up until this point, there has been no real cost for firms to defer spending their capital as they wait for anticipated guidance on policies that directly affect their businesses. But, this economic handcuffing from all of this uncertainty has gone on long enough. I believe there will now be firms who want to improve their margins and will begin spending money to expand their sales, and may even begin to hire. Once a competitor begins to move in this way, then the cost to defer becomes real for companies. This movement to expansion may well be a catalyst to propel the financial markets. I do believe this will be a slow shift, but one that will keep the economy improving, and should, in my opinion, help to generate reasonable market returns over the next few years.
With almost $3 trillion in cash sitting on the sidelines, this strategic shift by companies to begin spending their idle capital should help the economic recovery in the U.S. But that is only one part of the equation. Washington politics still play a role in how strong that recovery will be. The national political landscape will change in the next few years, and the future generation of elected officials will be faced with what I believe are fictitious unemployment figures (6.3% reported, when over 20 million Americans are looking for more work or a better job), a sluggish economy, and global competition in business. The next regime needs to provide real clarity on the issues that face all Americans and American corporations: taxation, regulation, and how to pay for our new healthcare system. I also believe that our government needs to regard business as a noble profession and to implement common sense and logic in their policy making instead of politics as usual. As Confucius is quoted as saying, “Life is really simple, but we insist on making it complicated.”
I am confident that even with all the hurdles facing corporate America, companies continue to provide good value for their shareholders, and I believe that means the financial markets are in good shape and should remain strong moving forward, I also believe that the next few months may be volatile. Fads come and go, and the current buzz on the Street is around investing in social media stocks. I believe that chasing hot products has contributed and will continue to contribute to the volatility of the markets this year. After over 35 years in the business, I still firmly believe the best way to position your portfolio is by investing in good companies over the long term, rather than trying to buy the next hot idea at exactly the right time. At Hennessy Funds, hunches and fads have no place in our investment process, and we understand that successful investing comes from time in the market, not timing the market.
We remain focused on investing based on proven fundamentals, and we are committed to managing money for the sole benefit of our shareholders. If you have any questions or want to speak with us directly, please don’t hesitate to call us at (800) 966-4354.
Best regards,
Neil J. Hennessy
President and Chief Investment Officer
Past performance does not guarantee future results.
Mutual fund investing involves risk. Principal loss is possible.
Opinions expressed are those of Neil Hennessy and are subject to change, are not guaranteed and should not be considered investment advice.
The Dow Jones Industrial Average and S&P 500 are unmanaged indices commonly used to measure the performance of U.S. stocks. One cannot invest directly in an index.
Price-to-sales ratio and price-to-earnings ratio are tools for calculating relative valuation. Price-to-sales ratio is calculated by dividing the market price by revenue per share. Price-to-earnings ratio is the market price per share divided by earnings per share.
HENNESSY FUNDS 1-800-966-4354
Performance Overview (Unaudited)
The opinions expressed in the following commentary reflect those of the Portfolio Managers as of the date written. Any such opinions are subject to change based on market or other conditions and are not guaranteed. These opinions may not be relied upon as investment advice. Investment decisions for the Fund are based on several factors, and may not be relied upon as an indication of trading intent on behalf of the Fund. Security positions can and do change.
AVERAGE ANNUAL TOTAL RETURN PERIODS ENDED APRIL 30, 2014
| | Six | One | Five | Ten |
| | Months(1) | Year | Years | Years |
| Hennessy Focus Fund – | | | | |
| Investor Class (HFCSX) | 2.17% | 15.07% | 18.69% | 11.28% |
| Hennessy Focus Fund – | | | | |
Institutional Class (HFCIX)(2) | 2.31% | 15.43% | 19.02% | 11.49% |
Russell 3000® Index | 7.83% | 20.78% | 19.54% | 8.10% |
Russell MidCap® Growth Index | 6.04% | 20.62% | 21.10% | 9.63% |
Expense ratios: 1.44% (Investor Class); 1.14% (Institutional Class)
Performance data quoted represents past performance; past performance does not guarantee future results. The investment return and principal value of an investment will fluctuate so that an investor’s shares, when redeemed, may be worth more or less than their original cost. Current performance of the Fund may be lower or higher than the performance quoted. Performance data current to the most recent month end may be obtained by visiting hennessyfunds.com. Performance for periods prior to October 26, 2012 is that of the FBR Focus Fund.
The expense ratios presented are from the most recent prospectus.
| (1) | Periods less than one year are not annualized. |
| (2) | The inception date of the Institutional Class shares is May 30, 2008. Performance shown prior to the inception of the Institutional Class shares reflects the performance of the Investor Class shares and includes expenses that are not applicable to and are higher than those of the Institutional Class shares. |
PERFORMANCE NARRATIVE
BROAD RUN INVESTMENT MANAGEMENT, LLC, SUB-ADVISOR
Portfolio Managers Brian Macauley, CFA, David Rainey, CFA, and Ira Rothberg, CFA, Broad Run Investment Management, LLC (sub-advisor).
Over the previous six months, how did the Fund perform and what factors contributed to this performance?
For the six-month period ended April 30, 2014, the Investor Class of the Hennessy Focus Fund returned 2.17%, underperforming the Russell 3000® Index, the Russell Midcap® Growth Index, and the Morningstar Mid-Cap Growth Category Average, which returned 7.83%, 6.04%, and 3.60% for the same period, respectively.
Leading contributors to the Fund’s performance were O’Reilly Automotive, Inc., Markel Corporation, and The Charles Schwab Corporation, all of which the Fund continues to hold. Leading detractors from the Fund’s performance were Bally Technologies, Inc., Encore Capital Group, Inc., and CarMax, Inc. While the stock prices of these three companies declined during the period, the sales and earnings of their underlying businesses increased at what we view as attractive rates. We continue to have a favorable long-term view of their future business and investment prospects, so the Fund
continues to hold these investments. We invest with a long-term time horizon and encourage shareholders to do the same. Despite the discussion of six-month results referenced above, we encourage fellow shareholders to evaluate the Fund’s performance over three-, five-, and ten-year periods since shorter time periods can be influenced by many transitory issues unrelated to the growth in intrinsic value of the Fund’s holdings.
Additional Portfolio Manager commentary and related investment outlook:
Selectivity is a hallmark of the Fund. We focus on holding about two dozen of the best investments we can find from a universe of approximately 2,500 U.S. public companies. At the same time, in choosing these investments we are very mindful to seek to avoid situations that expose the Fund to large permanent capital losses. Our view is that long-term performance is determined just as much by what we choose to avoid as by what we choose to own in the Fund. For example, healthy skepticism and a disciplined valuation overlay enabled the Fund to largely avoid the destruction wrought upon the technology sector during the internet bubble collapse, and also to largely avoid direct exposure to the mortgage debacle that precipitated the Great Recession.
This approach leads us to heavy investment exposure in some sectors and little or no exposure in other sectors. For example, today the Fund has exposure to just seven of Morningstar’s twelve market sectors, and even then with very different weightings than the overall market. Since the Fund’s portfolio and sector exposure looks so different than the market indices, we inevitably get performance results that deviate from the market.
We accept that our approach will sometimes lead to short-term periods of under-performance relative to the market indices, but we believe this has allowed the Fund to substantially outperform over the ten-year period ended April 30, 2014.
We continue to find select opportunities in an attempt to enhance the Fund’s portfolio. During the six-month period, the Fund established positions in Brookfield Asset Management, Inc. and Mistras Group, Inc., while eliminating positions in News Corporation and UTi Worldwide, Inc. We believe that these new portfolio companies were bought at relatively low valuations and are potentially capable of high-teens annual earnings growth over the next five years.
We continue to have a positive long-term outlook for the Fund. The Fund’s holdings are predominately a collection of what we believe to be secular growth businesses trading at reasonable valuations. Our expectation is that the Fund will own these businesses for five- or even ten-year periods. Over this long-term time horizon, we expect that the Fund’s returns will likely be determined primarily by the growth in earnings power of these businesses.
The Russell 3000® Index is an unmanaged index commonly used to measure the performance of U.S. stocks. The Russell Midcap® Growth Index is an unmanaged index commonly used to measure the performance of U.S. medium-capitalization growth stocks. You cannot invest directly in an index. Performance data for an index does not reflect any deductions for fees, expenses or taxes. The Fund is non-diversified, meaning it concentrates its assets in fewer holdings than a diversified fund and is therefore more exposed to individual stock volatility than a diversified fund. The Fund may invest in small- and medium-capitalization companies, which may have limited liquidity and greater price volatility than large-capitalization companies. References to specific securities should not be considered a recommendation to buy or sell any security. Fund holdings and sector allocations are subject to change. Please refer to the Schedule of Investments included in this report for additional portfolio information.
Earnings growth is not a measure of the Fund’s future performance.
HENNESSY FUNDS 1-800-966-4354
Each Morningstar category average represents a universe of funds with similar investment objectives. © Morningstar, Inc. All Rights Reserved. The information contained herein: 1) is proprietary to Morningstar; 2) may not be copied or distributed and 3) is not warranted to be accurate, complete or timely. Neither Morningstar nor its content providers are responsible for any damages or losses arising from any use of this information. Past performance does not guarantee future results.
Schedule of Investments
HENNESSY FOCUS FUND
As of April 30, 2014 (Unaudited)
(% of Net Assets)
| | TOP TEN HOLDINGS (EXCLUDING CASH/CASH EQUIVALENTS) | % NET ASSETS |
| | O’Reilly Automotive, Inc. | 9.15% |
| | Markel Corp. | 8.52% |
| | American Tower Corp., Class A | 8.49% |
| | CarMax, Inc. | 6.29% |
| | Bally Technologies, Inc. | 5.22% |
| | Gaming & Leisure Properties, Inc. | 5.14% |
| | Aon PLC | 4.95% |
| | Twenty First Century Fox, Inc. | 4.51% |
| | The Charles Schwab Corp. | 4.27% |
| | Encore Capital Group, Inc. | 3.85% |
Note: For presentation purposes, the Fund has grouped some of the industry categories. For purposes of categorizing securities for compliance with Section 8(b)(1) of the Investment Company Act of 1940, the Fund uses more specific industry classifications.
HENNESSY FUNDS 1-800-966-4354
| | COMMON STOCKS – 73.73% | | Number | | | | | | % of | |
| | | | of Shares | | | Value | | | Net Assets | |
| | Consumer Discretionary – 29.03% | | | | | | | | | |
| | Bally Technologies, Inc. (a) | | | 1,169,000 | | | $ | 76,113,590 | | | | 5.22 | % |
| | CarMax, Inc. (a) | | | 2,097,740 | | | | 91,839,057 | | | | 6.29 | % |
| | Dick’s Sporting Goods, Inc. | | | 815,767 | | | | 42,958,290 | | | | 2.94 | % |
| | O’Reilly Automotive, Inc. (a) | | | 897,900 | | | | 133,598,541 | | | | 9.15 | % |
| | Penn National Gaming, Inc. (a) | | | 1,197,772 | | | | 13,367,136 | | | | 0.92 | % |
| | Twenty First Century Fox, Inc. | | | 2,057,204 | | | | 65,871,672 | | | | 4.51 | % |
| | | | | | | | | 423,748,286 | | | | 29.03 | % |
| | | | | | | | | | | | | | |
| | Energy – 3.64% | | | | | | | | | | | | |
| | World Fuel Services Corp. | | | 1,168,204 | | | | 53,200,010 | | | | 3.64 | % |
| | | | | | | | | | | | | | |
| | Financials – 26.11% | | | | | | | | | | | | |
| | Aon PLC (b) | | | 851,000 | | | | 72,232,880 | | | | 4.95 | % |
| | Brookfield Asset Management, Inc.(b) | | | 119,423 | | | | 5,022,931 | | | | 0.35 | % |
| | Diamond Hill Investment Group, Inc. | | | 83,945 | | | | 9,965,950 | | | | 0.68 | % |
| | Encore Capital Group, Inc. (a) | | | 1,300,849 | | | | 56,222,694 | | | | 3.85 | % |
| | Markel Corp. (a) | | | 198,637 | | | | 124,330,871 | | | | 8.52 | % |
| | Marlin Business Services Corp. | | | 493,638 | | | | 8,475,765 | | | | 0.58 | % |
| | T. Rowe Price Group, Inc. | | | 517,900 | | | | 42,535,127 | | | | 2.91 | % |
| | The Charles Schwab Corp. | | | 2,346,699 | | | | 62,304,859 | | | | 4.27 | % |
| | | | | | | | | 381,091,077 | | | | 26.11 | % |
| | | | | | | | | | | | | | |
| | Health Care – 1.41% | | | | | | | | | | | | |
| | Henry Schein, Inc. (a) | | | 180,000 | | | | 20,561,400 | | | | 1.41 | % |
| | | | | | | | | | | | | | |
| | Industrials – 5.10% | | | | | | | | | | | | |
| | American Woodmark Corp. (a) | | | 798,561 | | | | 23,964,816 | | | | 1.64 | % |
| | Mistras Group, Inc. (a) | | | 11,642 | | | | 264,390 | | | | 0.02 | % |
| | Roadrunner Transportation Systems, Inc. (a) | | | 904,200 | | | | 22,270,446 | | | | 1.53 | % |
| | Simpson Manufacturing Company, Inc. | | | 850,000 | | | | 27,871,500 | | | | 1.91 | % |
| | | | | | | | | 74,371,152 | | | | 5.10 | % |
| | | | | | | | | | | | | | |
| | Information Technology – 8.44% | | | | | | | | | | | | |
| | Google, Inc. (a) | | | 68,984 | | | | 36,331,113 | | | | 2.49 | % |
| | Google, Inc., Class A (a) | | | 68,984 | | | | 36,898,162 | | | | 2.53 | % |
| | MICROS Systems, Inc. (a) | | | 971,148 | | | | 50,014,122 | | | | 3.42 | % |
| | | | | | | | | 123,243,397 | | | | 8.44 | % |
| | Total Common Stocks | | | | | | | | | | | | |
| | (Cost $581,147,127) | | | | | | | 1,076,215,322 | | | | 73.73 | % |
The accompanying notes are an integral part of these financial statements.
| | REITS – 13.63% | | Number | | | | | | % of | |
| | | | of Shares | | | Value | | | Net Assets | |
| | | | | | | | | | | | | | |
| | American Tower Corp., Class A | | | 1,483,679 | | | $ | 123,916,870 | | | | 8.49 | % |
| | Gaming & Leisure Properties, Inc. | | | 2,043,407 | | | | 75,095,207 | | | | 5.14 | % |
| | | | | | | | | | | | | | |
| | Total REITS | | | | | | | | | | | | |
| | (Cost $81,851,999) | | | | | | | 199,012,077 | | | | 13.63 | % |
| | | | | | | | | | | | | | |
| | SHORT-TERM INVESTMENTS – 12.64% | | | | | | | | | | | | |
| | | | | | | | | | | | | | |
| | Money Market Funds – 12.64% | | | | | | | | | | | | |
| | Federated Government Obligations Fund – Class I, 0.01% (c) | | | 72,500,000 | | | | 72,500,000 | | | | 4.97 | % |
| | Federated Treasury Obligations Fund, 0.01% (c) | | | 39,448,162 | | | | 39,448,162 | | | | 2.70 | % |
| | Fidelity Government Portfolio – Institutional Class, 0.01% (c) | | | 72,500,000 | | | | 72,500,000 | | | | 4.97 | % |
| | | | | | | | | | | | | | |
| | Total Money Market Funds | | | | | | | | | | | | |
| | (Cost $184,448,162) | | | | | | | 184,448,162 | | | | 12.64 | % |
| | | | | | | | | | | | | | |
| | Total Short-Term Investments | | | | | | | | | | | | |
| | (Cost $184,448,162) | | | | | | | 184,448,162 | | | | 12.64 | % |
| | | | | | | | | | | | | | |
| | Total Investments | | | | | | | | | | | | |
| | (Cost $847,447,288) – 100.00% | | | | | | | 1,459,675,561 | | | | 100.00 | % |
| | Liabilities in Excess | | | | | | | | | | | | |
| | of Other Assets – 0.00% | | | | | | | (20,981 | ) | | | 0.00 | % |
| | TOTAL NET ASSETS – 100.00% | | | | | | $ | 1,459,654,580 | | | | 100.00 | % |
Percentages are stated as a percent of net assets.
| (a) | Non-income producing security. |
| (b) | U.S. traded security of a foreign corporation. |
| (c) | The rate listed is the fund’s 7-day yield as of April 30, 2014. |
The accompanying notes are an integral part of these financial statements.
HENNESSY FUNDS 1-800-966-4354
Summary of Fair Value Exposure at April 30, 2014
The following is a summary of the inputs used to value the Fund’s net assets as of April 30, 2014 (See Note 3 in the accompanying notes to the financial statements):
| Common Stock | | Level 1 | | | Level 2 | | | Level 3 | | | Total | |
| Consumer Discretionary | | $ | 423,748,286 | | | $ | — | | | $ | — | | | $ | 423,748,286 | |
| Energy | | | 53,200,010 | | | | — | | | | — | | | | 53,200,010 | |
| Financials | | | 381,091,077 | | | | — | | | | — | | | | 381,091,077 | |
| Health Care | | | 20,561,400 | | | | — | | | | — | | | | 20,561,400 | |
| Industrials | | | 74,371,152 | | | | — | | | | — | | | | 74,371,152 | |
| Information Technology | | | 123,243,397 | | | | — | | | | — | | | | 123,243,397 | |
| Total Common Stock | | $ | 1,076,215,322 | | | $ | — | | | $ | — | | | $ | 1,076,215,322 | |
| REITS | | | | | | | | | | | | | | | | |
| Financials | | $ | 199,012,077 | | | $ | — | | | $ | — | | | $ | 199,012,077 | |
| Short-Term Investments | | | | | | | | | | | | | | | | |
| Money Market Funds | | $ | 184,448,162 | | | $ | — | | | $ | — | | | $ | 184,448,162 | |
| Total Short-Term Investments | | $ | 184,448,162 | | | $ | — | | | $ | — | | | $ | 184,448,162 | |
| Total Investments | | $ | 1,459,675,561 | | | $ | — | | | $ | — | | | $ | 1,459,675,561 | |
Transfers between levels are recognized at the end of the reporting period. During the six-month period ended April 30, 2014, the Fund recognized no transfers between levels.
The accompanying notes are an integral part of these financial statements.
Financial Statements
Statement of Assets and Liabilities as of April 30, 2014 (Unaudited) |
| ASSETS: | | | |
| Investments in securities, at value (cost $847,447,288) | | $ | 1,459,675,561 | |
| Dividends and interest receivable | | | 214,323 | |
| Receivable for fund shares sold | | | 2,682,569 | |
| Prepaid expenses and other assets | | | 55,302 | |
| Total Assets | | | 1,462,627,755 | |
| | | | | |
| LIABILITIES: | | | | |
| Payable for fund shares redeemed | | | 1,063,509 | |
| Payable to advisor | | | 1,083,310 | |
| Payable to administrator | | | 295,624 | |
| Payable to auditor | | | 9,476 | |
| Accrued distribution fees | | | 296,620 | |
| Accrued trustees fees | | | 4,034 | |
| Accrued expenses and other payables | | | 220,602 | |
| Total Liabilities | | | 2,973,175 | |
| NET ASSETS | | $ | 1,459,654,580 | |
| | | | | |
| NET ASSETS CONSIST OF: | | | | |
| Capital stock | | $ | 839,109,443 | |
| Accumulated net investment income | | | 3,284,876 | |
| Accumulated net realized gain on investments | | | 5,031,988 | |
| Unrealized net appreciation on investments | | | 612,228,273 | |
| Total Net Assets | | $ | 1,459,654,580 | |
| | | | | |
| NET ASSETS | | | | |
| Investor Class: | | | | |
| Shares authorized (no par value) | | Unlimited | |
| Net assets applicable to outstanding Investor Class shares | | | 1,199,944,137 | |
| Shares issued and outstanding | | | 18,778,206 | |
| Net asset value, offering price and redemption price per share | | $ | 63.90 | |
| | | | | |
| Institutional Class: | | | | |
| Shares authorized (no par value) | | Unlimited | |
| Net assets applicable to outstanding Institutional Class shares | | | 259,710,443 | |
| Shares issued and outstanding | | | 4,010,783 | |
| Net asset value, offering price and redemption price per share | | $ | 64.75 | |
The accompanying notes are an integral part of these financial statements.
HENNESSY FUNDS 1-800-966-4354
Financial Statements
Statement of Operations Six Months Ended April 30, 2014 (Unaudited) |
| INVESTMENT INCOME: | | | |
| Dividend income | | $ | 20,618,833 | |
| Interest income | | | 8,042 | |
| Total investment income | | | 20,626,875 | |
| | | | | |
| EXPENSES: | | | | |
| Investment advisory fees | | | 6,377,920 | |
| Distribution fees – Investor Class (See Note 5) | | | 1,489,317 | |
| Administration, fund accounting, custody and transfer agent fees | | | 850,389 | |
| Sub-transfer agent expenses – Investor Class (See Note 5) | | | 729,798 | |
| Sub-transfer agent expenses – Institutional Class (See Note 5) | | | 75,957 | |
| Reports to shareholders | | | 72,473 | |
| Federal and state registration fees | | | 28,991 | |
| Trustees’ fees and expenses | | | 12,556 | |
| Compliance expense | | | 10,655 | |
| Audit fees | | | 9,471 | |
| Legal fees | | | 3,720 | |
| Other expenses | | | 37,044 | |
| Total expenses | | | 9,698,291 | |
| NET INVESTMENT INCOME | | $ | 10,928,584 | |
| | | | | |
| REALIZED AND UNREALIZED GAINS: | | | | |
| Net realized gain on investments | | $ | 5,030,834 | |
| Change in unrealized appreciation on investments | | | 11,022,433 | |
| Net gain on investments | | | 16,053,267 | |
| NET INCREASE IN NET ASSETS RESULTING FROM OPERATIONS | | $ | 26,981,851 | |
The accompanying notes are an integral part of these financial statements.
Financial Statements
| Statements of Changes in Net Assets |
| | | Six Months Ended | | | | |
| | | April 30, 2014 | | | Year Ended | |
| | | (Unaudited) | | | October 31, 2013 | |
| OPERATIONS: | | | | | | |
| Net investment income (loss) | | $ | 10,928,584 | | | $ | (7,900,190 | ) |
| Net realized gain on securities | | | 5,030,834 | | | | 22,730,911 | |
| Change in unrealized appreciation on securities | | | 11,022,433 | | | | 258,060,122 | |
| Net increase in net assets resulting from operations | | | 26,981,851 | | | | 272,890,843 | |
| | | | | | | | | |
| DISTRIBUTIONS TO SHAREHOLDERS FROM: | | | | | | | | |
| Net realized gains | | | | | | | | |
| Investor Class | | | (19,269,073 | ) | | | (58,291,075 | ) |
| Institutional Class | | | (3,177,442 | ) | | | (5,349,797 | ) |
| Total distributions | | | (22,446,515 | ) | | | (63,640,872 | ) |
| | | | | | | | | |
| CAPITAL SHARE TRANSACTIONS: | | | | | | | | |
| Proceeds from shares subscribed – Investor Class | | | 197,909,569 | | | | 375,206,953 | |
| Proceeds from shares subscribed – Institutional Class | | | 118,466,306 | | | | 127,598,554 | |
| Dividends reinvested – Investor Class | | | 18,773,429 | | | | 56,748,943 | |
| Dividends reinvested – Institutional Class | | | 2,406,086 | | | | 4,791,826 | |
| Cost of shares redeemed – Investor Class | | | (160,797,597 | )(1) | | | (188,842,828 | )(2) |
| Cost of shares redeemed – Institutional Class | | | (41,376,276 | ) | | | (49,900,885 | ) |
| Net increase in net assets derived | | | | | | | | |
| from capital share transactions | | | 135,381,517 | | | | 325,602,563 | |
| TOTAL INCREASE IN NET ASSETS | | | 139,916,853 | | | | 534,852,534 | |
| | | | | | | | | |
| NET ASSETS: | | | | | | | | |
| Beginning of period | | | 1,319,737,727 | | | | 784,885,193 | |
| End of period | | $ | 1,459,654,580 | | | $ | 1,319,737,727 | |
| Undistributed net investment | | | | | | | | |
| income (loss), end of period | | $ | 3,284,876 | | | $ | (7,643,708 | ) |
| | | | | | | | | |
| CHANGES IN SHARES OUTSTANDING: | | | | | | | | |
| Shares sold – Investor Class | | | 3,057,033 | | | | 6,493,694 | |
| Shares sold – Institutional Class | | | 1,807,339 | | | | 2,140,491 | |
| Shares issued to holders as | | | | | | | | |
| reinvestment of dividends – Investor Class | | | 291,422 | | | | 1,149,695 | |
| Shares issued to holders as | | | | | | | | |
| reinvestment of dividends – Institutional Class | | | 36,903 | | | | 96,221 | |
| Shares redeemed – Investor Class | | | (2,498,958 | ) | | | (3,380,133 | ) |
| Shares redeemed – Institutional Class | | | (630,480 | ) | | | (920,448 | ) |
| Net increase in shares outstanding | | | 2,063,259 | | | | 5,579,520 | |
| (1) | Net of redemption fees of $949 related to redemption fees imposed by the FBR Focus Fund during a prior year but not received until the six-month period ended April 30, 2014. |
| (2) | Net of redemption fees of $1,716 related to redemption fees imposed by the FBR Focus Fund during a prior year but not received until fiscal year 2013. |
The accompanying notes are an integral part of these financial statements.
HENNESSY FUNDS 1-800-966-4354
Financial Highlights
For an Investor Class share outstanding throughout each period
| | | Six Months Ended | |
| | | April 30, 2014 | |
| | | (Unaudited) | |
| PER SHARE DATA: | | | |
| Net asset value, beginning of period | | $ | 63.58 | |
| | | | | |
| Income from investment operations: | | | | |
| Net investment income (loss) | | | 0.49 | |
| Net realized and unrealized gains (losses) on securities | | | 0.89 | |
| Total from investment operations | | | 1.38 | |
| | | | | |
| Less distributions: | | | | |
| Dividends from net investment income | | | — | |
| Dividends from net realized gains | | | (1.06 | ) |
| Total distributions | | | (1.06 | ) |
| Paid-in capital from redemption fees | | | — | |
| Net asset value, end of period | | $ | 63.90 | |
| | | | | |
| TOTAL RETURN | | | 2.17 | %(5) |
| | | | | |
| SUPPLEMENTAL DATA AND RATIOS: | | | | |
| Net assets, end of period (millions) | | $ | 1,199.94 | |
| Ratio of expenses to average net assets | | | 1.42 | %(4) |
| Ratio of net investment loss to average net assets | | | 1.50 | %(4) |
Portfolio turnover rate(3) | | | 2 | %(5) |
| (1) | Calculated based on average shares outstanding method. |
| (2) | Amount is less than $0.01. |
| (3) | Portfolio turnover is calculated on the basis of the Fund as a whole. |
| (4) | Annualized. |
| (5) | Not annualized. |
The accompanying notes are an integral part of these financial statements.
| Year Ended October 31, | |
| 2013 | | | 2012 | | | 2011 | | | 2010 | | | 2009 | |
| | | | | | | | | | | | | | |
| $ | 51.78 | | | $ | 49.80 | | | $ | 47.57 | | | $ | 37.56 | | | $ | 37.40 | |
| | | | | | | | | | | | | | | | | | | |
| | | | | | | | | | | | | | | | | | | |
| | (0.32 | ) | | | (0.39 | ) | | | (0.50 | )(1) | | | (0.64 | ) | | | (0.42 | ) |
| | 16.44 | | | | 7.61 | | | | 4.44 | | | | 10.65 | | | | 5.76 | |
| | 16.12 | | | | 7.22 | | | | 3.94 | | | | 10.01 | | | | 5.34 | |
| | | | | | | | | | | | | | | | | | | |
| | | | | | | | | | | | | | | | | | | |
| | — | | | | — | | | | — | | | | — | | | | — | |
| | (4.32 | ) | | | (5.24 | ) | | | (1.72 | ) | | | — | | | | (5.19 | ) |
| | (4.32 | ) | | | (5.24 | ) | | | (1.72 | ) | | | — | | | | (5.19 | ) |
| | 0.00 | (2) | | | 0.00 | (2) | | | 0.01 | | | | 0.00 | (2) | | | 0.01 | |
| $ | 63.58 | | | $ | 51.78 | | | $ | 49.80 | | | $ | 47.57 | | | $ | 37.56 | |
| | | | | | | | | | | | | | | | | | | |
| | 33.54 | % | | | 16.17 | % | | | 8.35 | % | | | 26.65 | % | | | 17.74 | % |
| | | | | | | | | | | | | | | | | | | |
| | | | | | | | | | | | | | | | | | | |
| $ | 1,139.85 | | | $ | 707.61 | | | $ | 611.34 | | | $ | 670.84 | | | $ | 759.77 | |
| | 1.43 | % | | | 1.41 | % | | | 1.44 | % | | | 1.51 | % | | | 1.43 | % |
| | (0.85 | )% | | | (0.79 | )% | | | (1.01 | )% | | | (1.31 | )% | | | (1.16 | )% |
| | 4 | % | | | 13 | % | | | 13 | % | | | 5 | % | | | 5 | % |
The accompanying notes are an integral part of these financial statements.
HENNESSY FUNDS 1-800-966-4354
Financial Highlights
For an Institutional Class share outstanding throughout each period*
| | | Six Months Ended | |
| | | April 30, 2014 | |
| | | (Unaudited) | |
| PER SHARE DATA: | | | |
| Net asset value, beginning of period | | $ | 64.32 | |
| | | | | |
| Income from investment operations: | | | | |
| Net investment income | | | 0.46 | |
| Net realized and unrealized gains on securities | | | 1.03 | |
| Total from investment operations | | | 1.49 | |
| | | | | |
| Less distributions: | | | | |
| Dividends from net investment income | | | — | |
| Dividends from net realized gains | | | (1.06 | ) |
| Total distributions | | | (1.06 | ) |
| Paid-in capital from redemption fees | | | — | |
| Net asset value, end of period | | $ | 64.75 | |
| | | | | |
| TOTAL RETURN | | | 2.31 | %(5) |
| | | | | |
| SUPPLEMENTAL DATA AND RATIOS: | | | | |
| Net assets, end of period (millions) | | $ | 259.71 | |
| Ratio of expenses to average net assets | | | 1.11 | %(4) |
| Ratio of net investment income (loss) to average net assets | | | 1.75 | %(4) |
Portfolio turnover rate(3) | | | 2 | %(5) |
| * | Per share amounts have been restated on a retroactive basis to reflect a 1:18 reverse stock split effective December 10, 2010. |
| (1) | Calculated based on average shares outstanding method. |
| (2) | Amount is less than $0.01. |
| (3) | Portfolio turnover is calculated on the basis of the Fund as a whole. |
| (4) | Annualized. |
| (5) | Not annualized. |
The accompanying notes are an integral part of these financial statements.
| Year Ended October 31, | |
| 2013 | | | 2012 | | | 2011 | | | 2010 | | | 2009 | |
| | | | | | | | | | | | | | |
| $ | 52.19 | | | $ | 50.02 | | | $ | 47.64 | | | $ | 37.84 | | | $ | 130.93 | |
| | | | | | | | | | | | | | | | | | | |
| | | | | | | | | | | | | | | | | | | |
| | (0.13 | ) | | | (0.22 | ) | | | (0.37 | )(1) | | | (0.41 | ) | | | (0.25 | ) |
| | 16.58 | | | | 7.63 | | | | 4.47 | | | | 10.58 | | | | 0.59 | |
| | 16.45 | | | | 7.41 | | | | 4.10 | | | | 10.17 | | | | 0.34 | |
| | | | | | | | | | | | | | | | | | | |
| | | | | | | | | | | | | | | | | | | |
| | — | | | | — | | | | — | | | | (0.37 | ) | | | — | |
| | (4.32 | ) | | | (5.24 | ) | | | (1.72 | ) | | | — | | | | (93.45 | ) |
| | (4.32 | ) | | | (5.24 | ) | | | (1.72 | ) | | | (0.37 | ) | | | (93.45 | ) |
| | — | | | | 0.00 | (2) | | | 0.00 | (2) | | | 0.00 | (2) | | | 0.02 | |
| $ | 64.32 | | | $ | 52.19 | | | $ | 50.02 | | | $ | 47.64 | | | $ | 37.84 | |
| | | | | | | | | | | | | | | | | | | |
| | 33.94 | % | | | 16.51 | % | | | 8.53 | % | | | 27.32 | % | | | 18.15 | % |
| | | | | | | | | | | | | | | | | | | |
| | | | | | | | | | | | | | | | | | | |
| $ | 179.89 | | | $ | 77.28 | | | $ | 49.01 | | | $ | 36.81 | | | $ | 34.23 | |
| | 1.13 | % | | | 1.12 | % | | | 1.15 | % | | | 1.26 | % | | | 1.15 | % |
| | (0.52 | )% | | | (0.52 | )% | | | (0.76 | )% | | | (1.06 | )% | | | (0.88 | )% |
| | 4 | % | | | 13 | % | | | 13 | % | | | 5 | % | | | 5 | % |
The accompanying notes are an integral part of these financial statements.
HENNESSY FUNDS 1-800-966-4354
Notes to the Financial Statements
April 30, 2014 (Unaudited)
1). ORGANIZATION
The Hennessy Focus Fund (the “Fund”) is a series of Hennessy Funds Trust (the “Trust”), which was organized as a Delaware statutory trust on September 17, 1992. The Fund is an open-end management investment company registered under the Investment Company Act of 1940, as amended. The Fund is a successor to the FBR Focus Fund (the “Predecessor FBR Fund”), a series of The FBR Funds, a Delaware statutory trust, pursuant to a reorganization that took place after the close of business on October 26, 2012. Prior to October 26, 2012, the Fund had no investment operations. As a result of the reorganization, holders of the Investor Class shares of the Predecessor FBR Fund received Investor Class shares of the Fund (the Investor Class shares of the Fund are the successor to the accounting and performance information of the Predecessor FBR Fund), and holders of the Institutional Class shares of the Predecessor FBR Fund received Institutional Class shares of the Fund (the Institutional Class shares of the Fund are the successor to the accounting and performance information of the Predecessor FBR Fund). The investment objective of the Fund is capital appreciation. The Fund is a non-diversified fund.
The Fund offers Investor Class and Institutional Class shares. Each class of shares differs principally in its respective administration, 12b-1 distribution and service fees, shareholder servicing, and transfer agent expenses and sales charges, if any. Each class has identical rights to earnings, assets, and voting privileges, except for class-specific expenses and exclusive rights to vote on matters affecting only individual classes.
2). SIGNIFICANT ACCOUNTING POLICIES
The following is a summary of significant accounting policies consistently followed by the Fund in the preparation of the financial statements. These policies are in conformity with U.S. generally accepted accounting principles (“GAAP”)..
| a). | Investment Valuation – All investments in securities are recorded at their estimated fair value, as described in Note 3. |
| b). | Federal Income Taxes – Provision for Federal income taxes or excise taxes has not been made since the Fund has elected to be taxed as a “regulated investment company” and intends to distribute substantially all of its taxable income to its shareholders and otherwise comply with the provisions of the Internal Revenue Code of 1986, as amended, applicable to regulated investment companies. Net investment income or loss and realized gains and losses for federal income tax purposes may differ from that reported on the financial statements because of temporary book and tax basis differences. Temporary differences are primarily the result of the treatment of wash sales for tax reporting purposes. Distributions from net realized gains for book purposes may include short-term capital gains, which are included as ordinary income to shareholders for tax purposes. |
| c). | Income and Expenses – Dividend income is recognized on the ex-dividend date or as soon as information is available to the Fund. Interest income, which includes the amortization of premium and accretion of discount, is recognized on an accrual basis. The Fund is charged for those expenses that are directly attributable to the portfolio, such as advisory, administration, and certain shareholder service fees. Income, |
| | expenses (other than expenses attributable to a specific class), and realized and unrealized gains or losses on investments are allocated to each class of shares based on its respective net assets. |
| d). | Distributions to Shareholders – Dividends from net investment income for the Fund, if any, are declared and paid out annually, usually in November or December. Distributions of net realized capital gains, if any, are declared and paid annually, usually in November or December. |
| e). | Security Transactions – Investment and shareholder transactions are recorded on the trade date. The Fund determines the gain or loss realized from the investment transactions by comparing the original cost of the security lot sold with the net sale proceeds. Discounts and premiums on securities purchased are accreted/amortized over the life of the respective security. |
| f). | Use of Estimates – The preparation of financial statements in conformity with GAAP requires management to make estimates and assumptions that affect the reported amounts of assets and liabilities and disclosure of contingent assets and liabilities at the date of the financial statements and the reported change in net assets during the reporting period. Actual results could differ from those estimates. |
| g). | Share Valuation – The net asset value (“NAV”) per share of the Fund is calculated by dividing the sum of the value of the securities held by the Fund, plus cash or other assets, minus all liabilities (including estimated accrued expenses) by the total number of shares outstanding for the Fund, rounded to the nearest cent. The Fund’s shares will not be priced on days the New York Stock Exchange is closed for trading. The offering and redemption price per share for the Fund is equal to the Fund’s net asset value per share. |
| h). | Foreign Currency – Values of investments denominated in foreign currencies, if any, are converted into U.S. dollars using the spot market rate of exchange at the time of valuation. Purchases and sales of investments and income are translated into U.S. dollars using the spot market rate of exchange prevailing on the respective dates of such transactions. The Fund does not isolate the portion of the results of operations resulting from fluctuations in foreign exchange rates on investments from fluctuations resulting from changes in the market prices of securities held. Such fluctuations are included with the net realized and unrealized gain or loss on investments. Foreign investments present additional risks due to currency fluctuations, economic and political factors, lower liquidity, government regulations, differences in accounting standards, and other factors. |
| i). | Forward Contracts – The Fund may enter into forward currency contracts to reduce its exposure to changes in foreign currency exchange rates on its foreign holdings and to lock in the U.S. dollar cost of firm purchase and sale commitments for securities denominated in foreign currencies. A forward currency contract is a commitment to purchase or sell a foreign currency at a future date at a negotiated forward rate. The gain or loss arising from the difference between the U.S. dollar cost of the original contract and the value of the foreign currency in U.S. dollars upon closing of such contract is included in net realized gain or loss from foreign currency transactions. During the six months ended April 30, 2014, the Fund did not enter into any forward contracts. |
| j). | Repurchase Agreements – The Fund may enter into repurchase agreements with member banks or security dealers of the Federal Reserve Board whom the investment advisor deems creditworthy. The repurchase price generally equals the price paid by the Fund plus interest negotiated on the basis of current short-term rates. |
HENNESSY FUNDS 1-800-966-4354
| | Securities pledged as collateral for repurchase agreements are held by the custodian bank until the respective agreements mature. Provisions of the repurchase agreements ensure that the market value of the collateral, including accrued interest thereon, is sufficient in the event of default of the counterparty. If the counterparty defaults and the value of the collateral declines or if the counterparty enters an insolvency proceeding, realization of the collateral by the Fund may be delayed or limited. |
| k). | Accounting for Uncertainty in Income Taxes – The Fund has adopted accounting policies regarding recognition and measurement of tax positions taken or expected to be taken on a tax return. The Fund has reviewed all open tax years in major jurisdictions and concluded that there is no impact on the Fund’s net assets and no tax liability resulting from unrecognized tax benefits relating to uncertain income tax positions taken or expected to be taken on a tax return. The Fund’s major tax jurisdictions are U.S. Federal and Delaware. As of April 30, 2014, open Federal and state tax years for the Fund include the tax years ended October 31, 2011 through 2013. |
| l). | Derivatives – The Fund may invest in, or enter into, derivatives, such as options, futures contracts, options on futures contracts, and swaps, for a variety of reasons, including to hedge certain risks, to provide a substitute for purchasing or selling particular securities, or to increase potential income gain. Derivatives may provide a cheaper, quicker, or more specifically focused way for a Fund to invest than “traditional” securities would. The main purpose of utilizing these derivative instruments is for hedging purposes. |
| | The Fund has adopted the financial accounting reporting rules as required by the Derivatives and Hedging Topic of the Financial Accounting Standards Board Accounting Standards Codification. Under such rules, the Fund is required to include enhanced disclosure that enables investors to understand how and why an entity uses derivatives, how derivatives are accounted for, and how derivatives instruments affect an entity’s results of operations and financial position. During the six months ended April 30, 2014, the Fund did not hold any derivative instruments. |
| m). | Events Subsequent to the Fiscal Period End – The Fund has adopted financial reporting rules regarding subsequent events that require an entity to recognize in the financial statements the effects of all subsequent events that provide additional evidence about conditions that existed at the date of the balance sheet. Management has evaluated the Fund’s related events and transactions that occurred subsequent to April 30, 2014 through the date of issuance of the Fund’s financial statements. There were no events or transactions that occurred during this period that materially impacted the amounts or disclosures in the Fund’s financial statements. |
3). SECURITIES VALUATION
The Fund has adopted authoritative fair valuation accounting standards that establish an authoritative definition of fair value and set out a hierarchy for measuring fair value. These standards require additional disclosures about the various inputs and valuation techniques used to develop the measurements of fair value and a discussion in changes in valuation techniques and related inputs during the period. These inputs are summarized in the three broad levels listed below:
| | Level 1 – | Quoted unadjusted prices for identical instruments in active markets to which the Fund has access at the date of measurement. |
| | Level 2 – | Quoted prices for similar instruments in active markets; quoted prices for identical or similar instruments in markets that are not active; and model-derived valuations in which all significant inputs and significant value drivers are observable in active markets. Level 2 inputs are those in markets for which there are few transactions, the prices are not current, the prices are fair value adjusted due to post-market close subsequent events (foreign markets), little public information exists, or instances where prices vary substantially over time or among brokered market makers. These inputs may also include interest rates, prepayment speeds, credit risk curves, default rates, and similar data. |
| | Level 3 – | Model-derived valuations in which one or more significant inputs or significant value drivers are unobservable. Unobservable inputs are those inputs that reflect the Fund’s own assumptions about what market participants would use to price the asset or liability based on the best available information. |
Following is a description of the valuation techniques applied to the Fund’s major categories of assets and liabilities measured at fair value on a recurring basis.
Equity Securities – Equity securities, including common stocks, preferred stocks, foreign issued common stocks, exchange traded funds, closed-end mutual funds, and real estate investment trusts, that are traded on a securities exchange for which a last-quoted sales price is readily available will be valued at the last sales price as reported by the primary exchange on which the securities are listed. Securities listed on The NASDAQ Stock Market (“NASDAQ”) will be valued at the NASDAQ Official Closing Price, which may differ from the last sales price reported. Securities traded on a securities exchange for which a last-quoted sales price is not readily available will be valued at the mean between the bid and ask prices. To the extent these securities are actively traded and valuation adjustments are not applied, they are classified in Level 1 of the fair value hierarchy.
Investment Companies – Investments in investment companies (e.g., mutual funds and exchange traded funds) are generally priced at the ending NAV provided by the Fund’s service agent and will be classified in Level 1 of the fair value hierarchy.
Debt Securities – Debt securities, including corporate bonds, asset-backed securities, mortgage-backed securities, municipal bonds, U.S. Treasuries, and U.S. government agency issues, are valued at market on the basis of valuations furnished by an independent pricing service that utilizes both dealer-supplied valuations and formula-based techniques. The pricing service may consider recently executed transactions in securities of the issuer or comparable issuers, market price quotations (where observable), bond spreads, and fundamental data relating to the issuer. In addition, the model may incorporate market observable data such as reported sales of similar securities, broker quotes, yields, bids, offers, and reference data. Certain securities are valued principally using dealer quotations. These securities are generally classified in Level 2 of the fair value hierarchy.
Short-Term Securities – Short-term equity investments, including money market funds, are valued in the manner specified above. Short-term debt investments are valued at amortized cost, if their original maturity was 60 days or less, or by amortizing the values as of the 61st day prior to maturity, if their original term to maturity exceeded 60 days. Short-term securities are generally classified in Level 1 or Level 2 of the fair market hierarchy depending on the inputs used and market activity levels for specific securities.
The Board of Trustees of the Fund (the “Board”) has adopted fair value pricing procedures that are followed when a price for a security is not readily available or if a
HENNESSY FUNDS 1-800-966-4354
significant event has occurred that indicates the closing price of a security no longer represents the true value of that security. Fair value pricing determinations are made in good faith in accordance with these procedures. There are numerous criteria that will be given consideration in determining a fair value of a security. Some of these criteria are trading volume of security and markets, the value of other like securities, and news events with direct bearing to security or market. Fair value pricing results in an estimated price that reasonably reflects the current market conditions in order to rate the portfolio holdings such that shareholder transactions receive a fair net asset value. Depending on the relative significance of the valuation inputs, these securities may be classified in either Level 2 or Level 3 of the fair value hierarchy.
Fair valuing of foreign securities may be determined with the assistance of a pricing service using correlations between the movement of prices of such securities and indices of domestic securities and other appropriate indicators, such as closing market prices of relevant American Depositary Receipts or futures contracts. The effect of using fair value pricing is that the Fund’s NAV will reflect the affected portfolio securities’ value as determined in the judgment of the Board or its designee instead of being determined by the market. Using a fair value pricing methodology to price foreign securities may result in a value that is different from a foreign security’s most recent closing price and from the prices used by other investment companies to calculate their net asset values and are generally considered Level 2 prices in the fair valuation hierarchy. Because the Fund may invest in foreign securities, the value of the Fund’s portfolio securities may change on days when you will not be able to purchase or redeem your shares.
The Board has delegated day-to-day valuation matters to a Valuation Committee comprised of one or more representatives from Hennessy Advisors, Inc., the Fund’s investment advisor. The function of the Valuation Committee is to value securities where current and reliable market quotations are not readily available. All actions taken by the Valuation Committee are reviewed by the Board.
The Fund has performed an analysis of all existing investments to determine the significance and character of all inputs to their fair value determination. Various inputs are used in determining the value of the Fund’s investments. The inputs or methodology used for valuing securities are not necessarily an indication of the risk associated with investing in those securities. Details related to the fair valuation hierarchy of the Fund’s securities as of April 30, 2014 are included in the Fund’s Schedule of Investments.
4). INVESTMENT TRANSACTIONS
Purchases and sales of investment securities (excluding government and short-term investments) for the Fund during the six months ended April 30, 2014 were $111,281,242 and $21,687,201, respectively.
There were no purchases or sales/maturities of long-term U.S. Government Securities for the Fund during the six months ended April 30, 2014.
5). INVESTMENT MANAGEMENT FEE AND OTHER TRANSACTIONS WITH AFFILIATES
Hennessy Advisors, Inc. (the “Advisor”) is the investment advisor of the Fund. The Advisor provides the Fund with investment management services under an Investment Advisory Agreement. The Advisor furnishes all investment advice, office space, facilities, and provides most of the personnel needed by the Fund. As compensation for its services, the Advisor is entitled to a monthly fee from the Fund. The fee is based upon the average daily net assets of the Fund at the annual rate of 0.90%. The net investment advisory fees payable for the Fund as of April 30, 2014 were $1,083,310.
The Advisor has delegated the day-to-day management of the Fund to a sub-advisor, Broad Run Investment Management, LLC. The Advisor pays the sub-advisor fees for the Fund from its own assets and these fees are not an additional expense of the Fund.
The Advisor has contractually agreed to limit the total annual operating expenses of the Fund (excluding interest, taxes, brokerage commissions, dividend expenses, acquired fund fees and expenses, extraordinary legal expenses, or any other extraordinary expenses and, from and after November 1, 2014, 12b-1 fees) to 1.95% and 1.70% of the Fund’s net assets for the Investor Class shares and Institutional Class shares of the Fund, respectively, through February 28, 2015.
For a period of three years after the year in which the Advisor waives or reimburses expenses, the Advisor may seek reimbursement from the Fund to the extent that total annual fund operating expenses are less than the expense limitation in effect at the time of the reimbursement. During the three years ended October 31, 2013, no Advisor fees were waived and therefore no expenses are subject to potential recovery.
The Fund has adopted a plan pursuant to Rule 12b-1 under the Investment Company Act of 1940, as amended, that authorizes payments in connection with the distribution of the Fund’s shares at an annual rate of up to 0.25% of the Fund’s average daily net assets attributable to Investor Class shares. Amounts paid under the plan may be spent on any activities or expenses primarily intended to result in the sale of shares, including but not limited to, advertising, compensation for sales and marketing activities or financial institutions and others such as dealers and distributors, shareholder account servicing, the printing and mailing of prospectuses to other than current shareowners, and the printing and mailing of sales literature.
The Fund has entered into agreements with various brokers, dealers, and financial intermediaries in connection with the sale of shares of the Fund. The agreements provide for periodic payments by the Fund to the brokers, dealers, and financial intermediaries for providing certain shareholder maintenance services (sub-transfer agent expenses). These shareholder services include the pre-processing and quality control of new accounts, shareholder correspondence, answering customer inquiries regarding account status, and facilitating shareholder telephone transactions. Fees paid by the Fund to various brokers, dealers, and financial intermediaries for the six months ended April 30, 2014 were $805,755.
U.S. Bancorp Fund Services, LLC (“USBFS”) provides the Fund with administrative, fund accounting, and transfer agent services, including all regulatory reporting, and necessary office equipment and personnel. As administrator, USBFS prepares various federal and state regulatory filings, reports, and returns for the Fund; prepares reports and materials to be supplied to the Board; monitors the activities of the Fund’s custodian, transfer agent, and accountants; and coordinates the preparation and payment of the Fund’s expenses and reviews the Fund’s expense accruals. Fees paid to USBFS for the six months ended April 30, 2014 were $850,389.
U.S. Bank, N.A., an affiliate of USBFS, serves as the Fund’s custodian. Quasar Distributors, LLC acts as the Fund’s principal underwriter in a continuous public offering of the Fund’s shares. Quasar Distributors, LLC is an affiliate of USBFS and U.S. Bank, N.A.
6). LINE OF CREDIT
The Fund has a line of credit with the other funds in the Hennessy Funds family of funds (the “Hennessy Funds”) in the amount of the lesser of (i) $100,000,000 or (ii) 33.33% of each Hennessy Fund’s net assets, or 30% for the Hennessy Gas Utility Index Fund and 10% for the Hennessy Balanced Fund, intended to provide short-term financing, if
HENNESSY FUNDS 1-800-966-4354
necessary, subject to certain restrictions, in connection with shareholder redemptions. The credit facility is with the Hennessy Funds’ custodian bank, U.S. Bank, N.A. Borrowings under this arrangement bear interest at the bank’s prime rate. During the six months ended April 30, 2014, the Fund did not have any borrowings outstanding under the line of credit.
7). FEDERAL TAX INFORMATION
As of October 31, 2013, the Fund’s most recent fiscal year end, the components of accumulated earnings (losses) for income tax purposes for the Fund were as follows:
| | Cost of investments for tax purposes | | $ | 716,452,529 | |
| | Gross tax unrealized appreciation | | $ | 605,898,829 | |
| | Gross tax unrealized depreciation | | | (4,692,989 | ) |
| | Net tax unrealized appreciation/depreciation | | $ | 601,205,840 | |
| | Undistributed ordinary income | | $ | — | |
| | Undistributed long-term capital gains | | | 22,447,669 | |
| | Total distributable earnings | | $ | 22,447,669 | |
| | Other accumulated gain (loss) | | $ | (7,643,708 | ) |
| | Total accumulated gain (loss) | | $ | 616,009,801 | |
The difference between book-basis and tax-basis unrealized appreciation is attributable primarily to capital loss carry overs, wash sales, and partnership adjustments.
At October 31, 2013, the Fund’s most recent fiscal year end, the Fund had no tax basis capital losses to offset future capital gains.
Capital losses sustained in the year ended October 31, 2012 and in future taxable years will not expire and may be carried over by the Fund without limitation; however, they will retain the character of the original loss. Furthermore, any losses incurred during those taxable years will be required to be utilized prior to the losses incurred in the pre-enactment taxable years. As a result of this ordering rule, pre-enactment capital loss carryforwards may be more likely to expire unused. Under pre-enactment law, capital losses could be carried forward for eight years, and carried forward as short-term capital losses, irrespective of the character of the original loss.
At October 31, 2013, the Fund deferred, on a tax basis, a post-December late year ordinary loss deferral of $(7,643,708) and the Fund did not defer, on a tax basis, any post-December loss deferrals.
The tax character of distributions paid during fiscal year 2014 (year-to-date) and fiscal year 2013 for the Fund were as follows:
| | | | Six Months Ended | | | Year Ended | |
| | | | April 30, 2014 | | | October 31, 2013 | |
| | Ordinary income | | $ | — | | | $ | — | |
| | Long-term capital gain | | | 22,446,515 | | | | 63,640,872 | |
| | | | $ | 22,446,515 | | | $ | 63,640,872 | |
Expense Example (Unaudited)
April 30, 2014
As a shareholder of the Fund, you incur two types of costs: (1) transaction costs, including sales charges (loads) on purchase payments, reinvested dividends, or other distributions; redemption fees; and exchange fees; and (2) ongoing costs, including management fees; service fees; and other Fund expenses. This Example is intended to help you understand your ongoing costs (in dollars) of investing in the Fund and to compare these costs with the ongoing costs of investing in other mutual funds. The Example is based on an investment of $1,000 invested at the beginning of the period and held for the entire period from November 1, 2013 through April 30, 2014.
Actual Expenses
The first line of the table below under the “Investor Class” and “Institutional Class” headings provides information about actual account values and actual expenses. Although the Fund charges no sales loads or transaction fees, you will be assessed fees for outgoing wire transfers, returned checks and stop payment orders at prevailing rates charged by U.S. Bancorp Fund Services, LLC, the Fund’s transfer agent. If you request that a redemption be made by wire transfer, currently a $15.00 fee is charged by the Fund’s transfer agent. IRA accounts will be charged a $15.00 annual maintenance fee. The example below includes, but is not limited to, management fees, shareholder servicing fees, fund accounting, custody, and transfer agent fees. However, the example below does not include portfolio trading commissions and related expenses, and other extraordinary expenses as determined under generally accepted accounting principles. You may use the information in this line, together with the amount you invested, to estimate the expenses that you paid over the period. Simply divide your account value by $1,000 (for example, an $8,600 account value divided by $1,000 = 8.6), then multiply the result by the number in the first line of the table under the “Investor Class” and “Institutional Class” headings in the column entitled “Expenses Paid During Period” to estimate the expenses you paid on your account during this period.
Hypothetical Example for Comparison Purposes
The second line of the table below under the “Investor Class” and “Institutional Class” headings provides information about hypothetical account values and hypothetical expenses based on the Fund’s actual expense ratios and an assumed rate of return of 5% per year before expenses, which is not the Fund’s actual return. The hypothetical account values and expenses may not be used to estimate the actual ending account balance or expenses you paid for the period. You may use this information to compare the ongoing costs of investing in the Fund and other funds. To do so, compare this 5% hypothetical example with the 5% hypothetical examples that appear in the shareholder reports of the other funds. Please note that the expenses shown in the table are meant to highlight your ongoing costs only and do not reflect any transactional costs, such as sales charges (loads), or exchange fees. Therefore, the second line of the table under the “Investor Class” and “Institutional Class” headings is useful in comparing ongoing costs only, and will not help you determine the relative total costs of owning different funds. In addition, if these transactional costs were included, your costs would have been higher.
HENNESSY FUNDS 1-800-966-4354
| | | | Expenses Paid |
| | Beginning | Ending | During Period(1) |
| | Account Value | Account Value | November 1, 2013 – |
| | November 1, 2013 | April 30, 2014 | April 30, 2014 |
| Investor Class | | | |
| | | | |
| Actual | $1,000.00 | $1,021.70 | $7.12 |
| | | | |
| Hypothetical (5% return | | | |
| before expenses) | $1,000.00 | $1,017.75 | $7.10 |
| | | | |
| Institutional Class | | | |
| | | | |
| Actual | $1,000.00 | $1,023.10 | $5.57 |
| | | | |
| Hypothetical (5% return | | | |
| before expenses) | $1,000.00 | $1,019.29 | $5.56 |
| (1) | Expenses are equal to the Fund’s annualized expense ratio of 1.42% for Investor Class shares or 1.11% for Institutional Class shares, as applicable, multiplied by the average account value over the period, multiplied by 181/365 days (to reflect one-half year period). |
Proxy Voting
A description of the policies and procedures the Fund uses to determine how to vote proxies relating to portfolio securities is available without charge: (1) by calling 1-800-966-4354; (2) on the Hennessy Funds’ website at hennessyfunds.com; or (3) on the U.S. Securities and Exchange Commission’s (the “SEC”) website at www.sec.gov. The Fund’s proxy voting record is available on both the Hennessy Funds’ website at hennessyfunds.com and the SEC’s website at www.sec.gov no later than August 31 for the prior 12 months ending June 30.
Quarterly Filings on Form N-Q
The Fund files its complete schedule of portfolio holdings with the SEC for the first and third quarters of each fiscal year on Form N-Q. The Fund’s Forms N-Q are available on the SEC’s website at www.sec.gov. The Fund’s Forms N-Q may be reviewed and copied at the SEC’s Public Reference Room in Washington, DC and information on the operation of the Public Reference Room may be obtained by calling 1-800-SEC-0330. Information included in the Fund’s Forms N-Q will also be available upon request by calling 1-800-966-4354.
Householding
To help keep the Fund’s costs as low as possible, we generally deliver a single copy of most financial reports and prospectuses to shareholders who share an address, even if the accounts are registered under different names. This process, known as “householding,” does not apply to account statements. You may, of course, request an individual copy of a prospectus or financial report at any time. If you would like to receive separate mailings, please call the Administrator at 1-800-261-6950 or 1-414-765-4124 and we will begin individual delivery within 30 days of your request. If your account is held through a financial institution or other intermediary, please contact them directly to request individual delivery.
HENNESSY FUNDS 1-800-966-4354
Board Approval of Investment Advisory
Agreements
At its meeting on March 3, 2014, the Board of Trustees of the Fund (the “Board”) unanimously approved the continuation of the investment advisory agreement and sub-advisory agreement of the Fund.
The Board reviewed a number of documents, including a memorandum provided by outside legal counsel that described the fiduciary duties of the Board with respect to approving the continuance of the investment advisory and sub-advisory agreements and the relevant factors for consideration, a memorandum from the Advisor that listed each of the relevant factors and the documents provided to help the Board assess each such factor, the Advisor’s most recent Form 10-K and 10-Q, the Advisor’s Form ADV Part I, a document that listed the range of services provided by the Advisor for the Fund, a written discussion of economies of scale, a completed questionnaire from the sub-advisor, the sub-advisor’s Form ADV Parts I and II, copies of the advisory and sub-advisory agreements, a fund fact sheet, and peer expense and performance comparisons. The Board considered and discussed numerous factors, including the following:
| | • | The Board considered the services identified below that are provided by the Advisor and the sub-advisor: |
| | | • | The Advisor oversees the sub-advisor for the Fund. The sub-advisor acts as the portfolio manager to the Fund, managing the composition of the portfolio of the Fund, including the purchase, retention, and disposition of portfolio securities in accordance with the Fund’s investment objectives, policies, and restrictions. |
| | | • | The Advisor performs daily reconciliations of portfolio positions and cash for the Fund. |
| | | • | The Advisor oversees the use of soft dollars for the Fund. |
| | | • | The Advisor monitors compliance by the Fund with its investment objectives and restrictions. |
| | | • | The Advisor monitors compliance with federal securities laws and performs activities such as maintaining a compliance program, conducting ongoing reviews of the compliance programs of the sub-advisor and the Fund’s other service providers, conducting on-site visits to the sub-advisor and the Fund’s other service providers, monitoring incidents of abusive trading practices, reviewing Fund expense accruals, payments, and fixed expense ratios, evaluating insurance providers for fidelity bond coverage and D&O/E&O insurance coverage, conducting employee compliance training, reviewing reports provided by service providers, maintaining books and records, and preparing an annual compliance report to the Board. |
| | | • | The Advisor oversees service providers that support the Fund in providing fund accounting, fund administration, fund distribution, transfer agency, custodial, sales and marketing, audit, information technology, and legal services. |
| | | • | The Advisor maintains an in-house public relations and marketing department on behalf of the Fund. |
| | | • | The Advisor is actively involved with preparing regulatory filings for the Fund. |
| | | • | The Advisor oversees proxy voting for the Fund. |
| | | • | The Advisor oversees distribution of the Fund through third-party broker/dealers and independent financial institutions such as Charles Schwab, |
| | | | Inc., Fidelity, TD Waterhouse, and Pershing. The Advisor participates in “no transaction fee” (“NTF”) programs with these companies on behalf of the Fund, which allows customers to purchase the Fund through third-party distribution channels without paying a transaction fee. The Advisor compensates a number of these third-party providers of NTF programs out of its own revenues and not those of the Fund. |
| | | • | The Advisor pays the incentive compensation of all of the Fund’s compliance officers and employs other staff such as management executives, legal personnel, marketing personnel, national accounts and distribution personnel, sales personnel, and trading oversight personnel. |
| | | • | The Advisor prepares or reviews Board materials, frequently presents to the Board or leads Board discussions, prepares or reviews meeting minutes, and arranges for Board training and education. |
| | • | The Board compared the performance of the Fund to benchmark indices over various periods of time and concluded that the positive performance of the Fund warranted the continuation of the advisory and sub-advisory agreements. |
| | • | The Board reviewed the Fund’s expense ratio and comparable expense ratios for funds comparable to the Fund. The Board used data from Morningstar showing funds similar in asset size and investment objective to the Fund and determined that the expense ratio of the Fund falls within the range of the ratios of other comparable funds and concluded that the expenses of the Fund were reasonable. |
| | • | The Board considered the fees charged by the Advisor and the sub-advisor of the Fund to those of funds similar in asset size and investment objective to the Fund and concluded the advisory and sub-advisory fees of the Fund were reasonable and warranted continuation of the advisory and sub-advisory agreements. The Trustees noted that the investment advisory and sub-advisory fees are not adjusted if economies of scale are realized as the Fund grows because many of the expenses incurred to manage the Fund are asset-based fees and thus do not result in material economies of scale being realized as the net assets of the Fund increase. |
| | • | The Board considered the profitability of the Advisor and the sub-advisor with respect to the Fund and concluded the profits were reasonable and not excessive when compared to profitability guidelines set forth in relevant court cases. |
| | • | The Board considered the high level of professionalism and knowledge of the Advisor’s employees, along with an extremely low level of turnover of the employees of the Advisor, and concluded that this was beneficial to the Fund and its shareholders, as it ensures that the Fund is operated efficiently. |
All of the factors above were considered separately by the Board, including the Trustees who are not “interested persons” (as defined in the Investment Company Act of 1940, as amended) of the Fund (the “Independent Trustees”) meeting in an executive session. The factors were viewed in their totality by the Board, with no single factor being the principal or determinative factor in the Board’s determination of whether to approve the continuation of the advisory and sub-advisory agreements. Based on the factors discussed above, the Board, including all of the Independent Trustees, recommended continuation of the advisory and sub-advisory agreements.
HENNESSY FUNDS 1-800-966-4354
For information, questions or assistance, please call
The Hennessy Funds
1-800-966-4354 or 1-415-899-1555
INVESTMENT ADVISOR
Hennessy Advisors, Inc.
7250 Redwood Blvd., Suite 200
Novato, California 94945
ADMINISTRATOR,
TRANSFER AGENT,
DIVIDEND PAYING AGENT &
SHAREHOLDER SERVICING AGENT
U.S. Bancorp Fund Services, LLC
P.O. Box 701
Milwaukee, Wisconsin 53201-0701
CUSTODIAN
U.S. Bank N.A.
Custody Operations
1555 North River Center Dr., Suite 302
Milwaukee, Wisconsin 53212
TRUSTEES
Neil J. Hennessy
Robert T. Doyle
J. Dennis DeSousa
Gerald P. Richardson
COUNSEL
Foley & Lardner LLP
777 East Wisconsin Avenue
Milwaukee, Wisconsin 53202-5306
INDEPENDENT REGISTERED
PUBLIC ACCOUNTING FIRM
Tait, Weller & Baker LLP
1818 Market Street, Suite 2400
Philadelphia, Pennsylvania 19103
DISTRIBUTOR
Quasar Distributors, LLC
615 East Michigan Street
Milwaukee, Wisconsin 53202
hennessyfunds.com | 1-800-966-4354
This report has been prepared for shareholders and may be distributed to
others only if preceded or accompanied by a current prospectus.
SEMI-ANNUAL REPORT
APRIL 30, 2014
HENNESSY CORNERSTONE
MID CAP 30 FUND
Investor Class HFMDX
Institutional Class HIMDX
hennessyfunds.com | 1-800-966-4354
(This Page Intentionally Left Blank.)
Contents
| Letter to Shareholders | 2 |
| Performance Overview | 4 |
| Financial Statements | |
| Schedule of Investments | 7 |
| Statement of Assets and Liabilities | 11 |
| Statement of Operations | 12 |
| Statements of Changes in Net Assets | 14 |
| Financial Highlights | 16 |
| Notes to the Financial Statements | 20 |
| Expense Example | 28 |
| Proxy Voting | 30 |
| Quarterly Filings on Form N-Q | 30 |
| Federal Tax Distribution Information | 30 |
| Householding | 30 |
| Board Approval of Investment Advisory Agreement | 31 |
HENNESSY FUNDS 1-800-966-4354
June 2014
Dear Shareholder:
The financial markets have provided strong returns over the past six-months ended April 30, 2014, with the Dow Jones Industrial Average (DJIA) and S&P 500 both returning approximately 8% during the period. The current valuation metrics of the major indices are solid; for example, the DJIA currently has a price-to-earnings ratio of 15x and a price-to-sales ratio of 1.75x. The DJIA also has a dividend yield of 2.2%, which is nearly as high as that of a 10-Year U.S. Treasury, which is currently yielding 2.6%. Investing in high-yielding, high-quality DJIA stocks have the potential to not only provide an income stream but also for stock price appreciation as well. Fixed income investing has run its course, in my opinion, and many individuals are currently benefiting from the return to investing in equities that possess strong fundamentals.
U.S. corporations continue to drive shareholder value by making acquisitions, initiating and raising dividends, investing in internal infrastructure, and buying back stock. However, lately I have begun to see a shift in those business strategies. The easier-to-execute acquisitions seem to be a thing of the past, and firms now have to be even more creative to execute accretive deals. I also believe that while firms may continue to initiate dividends, fewer firms will raise their dividends and fewer firms will participate in stock buyback programs going forward. So what will these cash-rich companies do with their capital if they are not raising dividends or buying back stock? I believe we will see companies begin to initiate capital expenditure programs.
Due to the continuing uncertainty from a lack of clear policies on taxes, healthcare, and regulations, I have observed that corporations would rather wait for clarity from our government leaders and defer any significant changes to their current business models. Up until this point, there has been no real cost for firms to defer spending their capital as they wait for anticipated guidance on policies that directly affect their businesses. But, this economic handcuffing from all of this uncertainty has gone on long enough. I believe there will now be firms who want to improve their margins and will begin spending money to expand their sales, and may even begin to hire. Once a competitor begins to move in this way, then the cost to defer becomes real for companies. This movement to expansion may well be a catalyst to propel the financial markets. I do believe this will be a slow shift, but one that will keep the economy improving, and should, in my opinion, help to generate reasonable market returns over the next few years.
With almost $3 trillion in cash sitting on the sidelines, this strategic shift by companies to begin spending their idle capital should help the economic recovery in the U.S. But that is only one part of the equation. Washington politics still play a role in how strong that recovery will be. The national political landscape will change in the next few years, and the future generation of elected officials will be faced with what I believe are fictitious unemployment figures (6.3% reported, when over 20 million Americans are looking for more work or a better job), a sluggish economy, and global competition in business. The next regime needs to provide real clarity on the issues that face all Americans and American corporations: taxation, regulation, and how to pay for our new healthcare system. I also believe that our government needs to regard business as a noble profession and to implement common sense and logic in their policy making instead of politics as usual. As Confucius is quoted as saying, “Life is really simple, but we insist on making it complicated.”
I am confident that even with all the hurdles facing corporate America, companies continue to provide good value for their shareholders, and I believe that means the financial markets are in good shape and should remain strong moving forward, I also believe that the next few months may be volatile. Fads come and go, and the current buzz on the Street is around investing in social media stocks. I believe that chasing hot products has contributed and will continue to contribute to the volatility of the markets this year. After over 35 years in the business, I still firmly believe the best way to position your portfolio is by investing in good companies over the long term, rather than trying to buy the next hot idea at exactly the right time. At Hennessy Funds, hunches and fads have no place in our investment process, and we understand that successful investing comes from time in the market, not timing the market.
We remain focused on investing based on proven fundamentals, and we are committed to managing money for the sole benefit of our shareholders. If you have any questions or want to speak with us directly, please don’t hesitate to call us at (800) 966-4354.
Best regards,
Neil J. Hennessy
President and Chief Investment Officer
Past performance does not guarantee future results.
Mutual fund investing involves risk. Principal loss is possible.
Opinions expressed are those of Neil Hennessy and are subject to change, are not guaranteed and should not be considered investment advice.
The Dow Jones Industrial Average and S&P 500 are unmanaged indices commonly used to measure the performance of U.S. stocks. One cannot invest directly in an index.
Price-to-sales ratio and price-to-earnings ratio are tools for calculating relative valuation. Price-to-sales ratio is calculated by dividing the market price by revenue per share. Price-to-earnings ratio is the market price per share divided by earnings per share.
HENNESSY FUNDS 1-800-966-4354
Performance Overview (Unaudited)
The opinions expressed in the following commentary reflect those of the Portfolio Managers as of the date written. Any such opinions are subject to change based on market or other conditions and are not guaranteed. These opinions may not be relied upon as investment advice. Investment decisions for the Fund are based on several factors, and may not be relied upon as an indication of trading intent on behalf of the Fund. Security positions can and do change.
AVERAGE ANNUAL TOTAL RETURN PERIODS ENDED APRIL 30, 2014
| | Six | One | Five | Ten |
| | Months(1) | Year | Years | Years |
| Hennessy Cornerstone | | | | |
| Mid Cap 30 Fund – | | | | |
| Investor Class (HFMDX) | 12.71% | 19.76% | 21.27% | 12.17% |
| Hennessy Cornerstone | | | | |
| Mid Cap 30 Fund – | | | | |
Institutional Class (HIMDX)(2) | 12.88% | 20.18% | 21.71% | 12.42% |
Russell Midcap® Index | 7.76% | 21.25% | 21.87% | 10.40% |
| S&P 500 Index | 8.36% | 20.44% | 19.14% | 7.67% |
Expense ratios: 1.31% (Investor Class); Gross 1.11%, Net 0.98%(3) (Institutional Class)
Performance data quoted represents past performance; past performance does not guarantee future results. The investment return and principal value of an investment will fluctuate so that an investor’s shares, when redeemed, may be worth more or less than their original cost. Current performance of the Fund may be lower or higher than the performance quoted. Performance data current to the most recent month end may be obtained by visiting hennessyfunds.com.
The expense ratios presented are from the most recent prospectus.
| (1) | Periods less than one year are not annualized. |
| (2) | The inception date of the Institutional Class shares is March 3, 2008. Performance shown prior to the inception of the Institutional Class shares reflects the performance of the Investor Class shares and includes expenses that are not applicable to and are higher than those of the Institutional Class shares. |
| (3) | With regard to Institutional Class shares, the Fund’s investment advisor has contractually agreed to waive a portion of its expenses indefinitely. |
PERFORMANCE NARRATIVE
Portfolio Manager, Neil Hennessy, and Co-Portfolio Manager, Brian Peery
Over the previous six months, how did the Fund perform and what factors contributed to this performance?
For the six-month period ended April 30, 2014, the Investor Class of the Hennessy Cornerstone Mid Cap 30 Fund returned 12.71%, significantly outperforming the Russell Midcap® Index, the S&P 500 Index, and the Morningstar Mid-Cap Blend Category Average, which returned 7.76%, 8.36%, and 6.73% for the same period, respectively.
We are very pleased with the overall performance of the Fund during the previous six months versus its benchmarks. The Fund’s relative outperformance was driven partly by allocation and performance in seven of the ten sectors in which the Fund was invested, but the primary driver of the Fund’s performance was underlying stock selection. The biggest contribution to the Fund’s outperformance versus its benchmarks was in the
Industrial sector, where the Fund’s overweighting and stock selection amounted to roughly half of the outperformance relative to the Russell Midcap® Index. The largest detractor to the Fund’s performance was its under-allocation to the Utilities sector, which dragged down performance by 20 basis points, or 0.2% of overall performance.
Additional Portfolio Manager commentary and related investment outlook:
The goal of the Fund is to perform better than its benchmarks over time with a lower risk profile. By having a concentrated portfolio of just 30 stocks, the outperformance of even just a few stocks can have a meaningful impact on the overall performance of the Fund. We believe that having 30 positions in the portfolio provides ample diversification across the Mid-Cap domestic equity market. Modern portfolio theory suggests that a level of approximately 94% diversification can be achieved with exposure to only 30 issuers, and that achieving 100% diversification requires exposure to approximately another 240 issuers.
If you have watched the financial news or opened the investing section of a newspaper lately, you have probably heard or read that high multiple stocks have dropped fairly precipitously. By adhering to our strict investment methodology, we have been largely able to sidestep the recent downturn in sectors like social media and biotechnology. By employing a strict price-to-sales ratio limit of 1.5, we invest in what we deem to be reasonably valued companies rather than those stocks whose price is predicated on expected future growth. This growth at a reasonable price approach has served us well, and we believe wholeheartedly in utilizing this methodology when investing. We anticipate investors will continue to migrate out of high risk, high multiple stocks and into stocks that will potentially do well as the economy expands.
Although we expect to see some moderation going forward, consumer spending ended the quarter on a high note, and we firmly believe it will increase as the year progresses. We also expect that not only will company earnings improve, but more importantly, revenues should start to improve with the overall strength of the economy.
In fact, we are seeing positive signs in both revenue growth and the all-important corporate capital expenditures levels. Over the last six months, we have seen a slight disconnect between earnings and revenues, with earnings showing healthy gains, largely due to cost containment, while revenue growth lagged. With few cost cuts seemingly left to be made, companies appear to be starting to utilize their healthy balance sheets to focus on organic growth, which we expect will drive corporate spending higher. In fact, we anticipate that the U.S. economy should expand nicely over the next 12 to 18 months and that the markets should benefit from this flow of capital. While excess cash has largely been directed toward acquisitions, increasing dividends, and/or stock buybacks recently, we believe this shift in corporate spending has the potential to reward shareholders over the longer term.
We are confident that there are opportunities in the Mid-Cap space (companies with a market capitalization of $1 billion to $10 billion, in which the Fund invests), especially in some of the more cyclical sectors. We believe the cyclical companies, which are those companies most sensitive to economic growth, should do well as the economy continues to improve. The Fund is currently overweight cyclical stocks versus its benchmarks and will remain so until its portfolio is rebalanced later this year.
The Russell Midcap® Index is an unmanaged index commonly used to measure the performance of U.S. medium-capitalization stocks. The S&P 500 Index is an unmanaged index commonly used to measure the performance of U.S. stocks. You cannot invest directly in an index. Performance data for an index does not reflect any deductions for fees, expenses or taxes. The Fund invests in medium-
HENNESSY FUNDS 1-800-966-4354
capitalization companies, which may have limited liquidity and greater price volatility than large-capitalization companies. The Fund’s portfolio is rebalanced annually in accordance with its strategy, which may result in the elimination of better performing assets from the Fund’s investments and increases in investments with relatively lower total return. Fund holdings and sector allocations are subject to change. Please refer to the Schedule of Investments included in this report for additional portfolio information.
Diversification does not assure a profit, nor does it protect against a loss in a declining market. Basis point is a unit equal to 1/100th of 1%. Price-to-sales is a tool for calculating relative valuation and is the market price per share divided by revenue per share.
Each Morningstar category average represents a universe of funds with similar investment objectives. © Morningstar, Inc. All Rights Reserved. The information contained herein: 1) is proprietary to Morningstar; 2) may not be copied or distributed and 3) is not warranted to be accurate, complete or timely. Neither Morningstar nor its content providers are responsible for any damages or losses arising from any use of this information. Past performance does not guarantee future results.
Schedule of Investments
HENNESSY CORNERSTONE MID CAP 30 FUND
As of April 30, 2014 (Unaudited)
(% of Net Assets)
| | TOP TEN HOLDINGS (EXCLUDING CASH/CASH EQUIVALENTS) | % NET ASSETS |
| | Avis Budget Group, Inc. | 5.18% |
| | Huntington Ingalls Industries, Inc. | 4.52% |
| | Alaska Air Group, Inc. | 4.37% |
| | Genworth Financial, Inc. | 4.09% |
| | Skechers USA, Inc. | 3.98% |
| | Hanesbrands, Inc. | 3.88% |
| | Sunpower Corp. | 3.78% |
| | Pilgrim’s Pride Corp. | 3.74% |
| | ITT Corp. | 3.55% |
| | Swift Transportation Co. | 3.53% |
Note: For presentation purposes, the Fund has grouped some of the industry categories. For purposes of categorizing securities for compliance with Section 8(b)(1) of the Investment Company Act of 1940, the Fund uses more specific industry classifications.
HENNESSY FUNDS 1-800-966-4354
| | COMMON STOCKS – 95.57% | | Number | | | | | | % of | |
| | | | of Shares | | | Value | | | Net Assets | |
| | Consumer Discretionary – 35.74% | | | | | | | | | |
| | American Axle & Manufacturing Holdings, Inc. (a) | | | 344,700 | | | $ | 6,083,955 | | | | 2.64 | % |
| | Brunswick Corp. | | | 170,800 | | | | 6,864,452 | | | | 2.98 | % |
| | Cracker Barrel Old Country Store, Inc. | | | 66,200 | | | | 6,271,788 | | | | 2.72 | % |
| | Hanesbrands, Inc. | | | 108,900 | | | | 8,939,601 | | | | 3.88 | % |
| | Lear Corp. | | | 94,900 | | | | 7,882,394 | | | | 3.42 | % |
| | Lithia Motors, Inc. | | | 93,600 | | | | 6,952,608 | | | | 3.01 | % |
| | Skechers USA, Inc. (a) | | | 223,900 | | | | 9,177,661 | | | | 3.98 | % |
| | Tenneco, Inc. (a) | | | 135,100 | | | | 8,088,437 | | | | 3.51 | % |
| | The Goodyear Tire & Rubber Co. | | | 303,600 | | | | 7,650,720 | | | | 3.32 | % |
| | Visteon Corp. (a) | | | 90,600 | | | | 7,864,986 | | | | 3.41 | % |
| | Wendy’s Co. | | | 797,500 | | | | 6,627,225 | | | | 2.87 | % |
| | | | | | | | | 82,403,827 | | | | 35.74 | % |
| | | | | | | | | | | | | | |
| | Consumer Staples – 6.53% | | | | | | | | | | | | |
| | Flowers Foods, Inc. | | | 313,800 | | | | 6,439,176 | | | | 2.79 | % |
| | Pilgrim’s Pride Corp. (a) | | | 394,100 | | | | 8,615,026 | | | | 3.74 | % |
| | | | | | | | | 15,054,202 | | | | 6.53 | % |
| | | | | | | | | | | | | | |
| | Financials – 10.27% | | | | | | | | | | | | |
| | American Equity Investment Life Holding Co. | | | 322,500 | | | | 7,520,700 | | | | 3.26 | % |
| | AmTrust Financial Services, Inc. | | | 174,600 | | | | 6,751,782 | | | | 2.93 | % |
| | Genworth Financial, Inc. (a) | | | 527,300 | | | | 9,412,305 | | | | 4.08 | % |
| | | | | | | | | 23,684,787 | | | | 10.27 | % |
| | | | | | | | | | | | | | |
| | Health Care – 6.43% | | | | | | | | | | | | |
| | Omnicare, Inc. | | | 123,400 | | | | 7,313,918 | | | | 3.17 | % |
| | Universal Health Services, Inc. | | | 91,800 | | | | 7,508,322 | | | | 3.26 | % |
| | | | | | | | | 14,822,240 | | | | 6.43 | % |
| | | | | | | | | | | | | | |
| | Industrials – 27.11% | | | | | | | | | | | | |
| | Alaska Air Group, Inc. | | | 107,200 | | | | 10,085,376 | | | | 4.37 | % |
| | Avis Budget Group, Inc. (a) | | | 227,000 | | | | 11,937,930 | | | | 5.18 | % |
| | Huntington Ingalls Industries, Inc. | | | 101,100 | | | | 10,413,300 | | | | 4.52 | % |
| | ITT Corp. | | | 190,000 | | | | 8,196,600 | | | | 3.55 | % |
| | Oshkosh Corp. | | | 140,000 | | | | 7,771,400 | | | | 3.37 | % |
| | Swift Transportation Co. (a) | | | 338,700 | | | | 8,145,735 | | | | 3.53 | % |
| | URS Corp. | | | 126,500 | | | | 5,960,680 | | | | 2.59 | % |
| | | | | | | | | 62,511,021 | | | | 27.11 | % |
The accompanying notes are an integral part of these financial statements.
| | COMMON STOCKS | | Number | | | | | | % of | |
| | | | of Shares | | | Value | | | Net Assets | |
| | Information Technology – 9.49% | | | | | | | | | |
| | Ciena Corp. (a) | | | 274,000 | | | $ | 5,416,980 | | | | 2.35 | % |
| | Computer Sciences Corp. | | | 131,100 | | | | 7,758,498 | | | | 3.36 | % |
| | Sunpower Corp. (a) | | | 260,600 | | | | 8,709,252 | | | | 3.78 | % |
| | | | | | | | | | | | | | |
| | | | | | | | | 21,884,730 | | | | 9.49 | % |
| | | | | | | | | | | | | | |
| | Total Common Stocks | | | | | | | | | | | | |
| | (Cost $191,702,456) | | | | | | | 220,360,807 | | | | 95.57 | % |
| | | | | | | | | | | | | | |
| | SHORT-TERM INVESTMENTS – 4.51% | | | | | | | | | | | | |
| | | | | | | | | | | | | | |
| | Money Market Funds – 4.51% | | | | | | | | | | | | |
| | Fidelity Government Portfolio – | | | | | | | | | | | | |
| | Institutional Class, 0.01% (b) | | | 10,386,187 | | | | 10,386,187 | | | | 4.51 | % |
| | | | | | | | | | | | | | |
| | Total Money Market Funds | | | | | | | | | | | | |
| | (Cost $10,386,187) | | | | | | | 10,386,187 | | | | 4.51 | % |
| | | | | | | | | | | | | | |
| | Total Short-Term Investments | | | | | | | | | | | | |
| | (Cost $10,386,187) | | | | | | | 10,386,187 | | | | 4.51 | % |
| | | | | | | | | | | | | | |
| | Total Investments | | | | | | | | | | | | |
| | (Cost $202,088,643) – 100.08% | | | | | | | 230,746,994 | | | | 100.08 | % |
| | Liabilities in Excess of | | | | | | | | | | | | |
| | Other Assets – (0.08)% | | | | | | | (181,897 | ) | | | (0.08 | )% |
| | TOTAL NET ASSETS – 100.00% | | | | | | $ | 230,565,097 | | | | 100.00 | % |
Percentages are stated as a percent of net assets.
| (a) | Non-income producing security. |
| (b) | The rate listed is the fund’s 7-day yield as of April 30, 2014. |
The accompanying notes are an integral part of these financial statements.
HENNESSY FUNDS 1-800-966-4354
Summary of Fair Value Exposure at April 30, 2014
The following is a summary of the inputs used to value the Fund’s net assets as of April 30, 2014 (See Note 3 in the accompanying notes to the financial statements):
| Common Stock | | Level 1 | | | Level 2 | | | Level 3 | | | Total | |
| Consumer Discretionary | | $ | 82,403,827 | | | $ | — | | | $ | — | | | $ | 82,403,827 | |
| Consumer Staples | | | 15,054,202 | | | | — | | | | — | | | | 15,054,202 | |
| Financials | | | 23,684,787 | | | | — | | | | — | | | | 23,684,787 | |
| Health Care | | | 14,822,240 | | | | — | | | | — | | | | 14,822,240 | |
| Industrials | | | 62,511,021 | | | | — | | | | — | | | | 62,511,021 | |
| Information Technology | | | 21,884,730 | | | | — | | | | — | | | | 21,884,730 | |
| Total Common Stock | | $ | 220,360,807 | | | $ | — | | | $ | — | | | $ | 220,360,807 | |
| Short-Term Investments | | | | | | | | | | | | | | | | |
| Money Market Funds | | $ | 10,386,187 | | | $ | — | | | $ | — | | | $ | 10,386,187 | |
| Total Short-Term Investments | | $ | 10,386,187 | | | $ | — | | | $ | — | | | $ | 10,386,187 | |
| Total Investments | | $ | 230,746,994 | | | $ | — | | | $ | — | | | $ | 230,746,994 | |
Transfers between levels are recognized at the end of the reporting period. During the six-month period ended April 30, 2014, the Fund recognized no transfers between levels.
The accompanying notes are an integral part of these financial statements.
Financial Statements
Statement of Assets and Liabilities as of April 30, 2014 (Unaudited) |
| ASSETS: | | | |
| Investments in securities, at value (cost $202,088,643) | | $ | 230,746,994 | |
| Dividends and interest receivable | | | 61,599 | |
| Receivable for fund shares sold | | | 1,001,725 | |
| Receivable for securities sold | | | 9,598,571 | |
| Prepaid expenses and other assets | | | 31,187 | |
| Total Assets | | | 241,440,076 | |
| | | | | |
| LIABILITIES: | | | | |
| Payable for securities purchased | | | 10,394,748 | |
| Payable for fund shares redeemed | | | 190,156 | |
| Payable to advisor | | | 137,298 | |
| Payable to administrator | | | 60,329 | |
| Payable to auditor | | | 13,891 | |
| Accrued service fees | | | 14,040 | |
| Accrued interest payable | | | 551 | |
| Accrued trustees fees | | | 4,755 | |
| Accrued expenses and other payables | | | 59,211 | |
| Total Liabilities | | | 10,874,979 | |
| NET ASSETS | | $ | 230,565,097 | |
| | | | | |
| NET ASSETS CONSIST OF: | | | | |
| Capital stock | | $ | 198,486,007 | |
| Accumulated net investment loss | | | (37,733 | ) |
| Accumulated net realized gain on investments | | | 3,458,472 | |
| Unrealized net appreciation on investments | | | 28,658,351 | |
| Total Net Assets | | $ | 230,565,097 | |
| | | | | |
| NET ASSETS | | | | |
| Investor Class: | | | | |
| Shares authorized (no par value) | | Unlimited | |
| Net assets applicable to outstanding Investor Class shares | | | 174,637,921 | |
| Shares issued and outstanding | | | 9,643,958 | |
| Net asset value, offering price and redemption price per share | | $ | 18.11 | |
| | | | | |
| Institutional Class: | | | | |
| Shares authorized (no par value) | | Unlimited | |
| Net assets applicable to outstanding Institutional Class shares | | | 55,927,176 | |
| Shares issued and outstanding | | | 3,033,962 | |
| Net asset value, offering price and redemption price per share | | $ | 18.43 | |
The accompanying notes are an integral part of these financial statements.
HENNESSY FUNDS 1-800-966-4354
Financial Statements
Statement of Operations Six Months Ended April 30, 2014 (Unaudited) |
| INVESTMENT INCOME: | | | |
| Dividend income | | $ | 912,557 | |
| Interest income | | | 334 | |
| Total investment income | | | 912,891 | |
| | | | | |
| EXPENSES: | | | | |
| Investment advisory fees | | | 803,688 | |
| Administration, fund accounting, custody and transfer agent fees | | | 217,213 | |
| Sub-transfer agent expenses – Investor Class (See Note 5) | | | 145,096 | |
| Sub-transfer agent expenses – Institutional Class (See Note 5) | | | 23,558 | |
| Service fees – Investor Class (See Note 5) | | | 82,431 | |
| Federal and state registration fees | | | 23,555 | |
| Reports to shareholders | | | 17,257 | |
| Compliance expense | | | 10,655 | |
| Audit fees | | | 9,868 | |
| Trustees’ fees and expenses | | | 7,878 | |
| Legal fees | | | 2,480 | |
| Other expenses | | | 10,428 | |
| Total expenses before waiver | | | 1,354,107 | |
| Administration expense waiver (See Note 5) | | | (32,882 | ) |
| Net expenses | | | 1,321,225 | |
| NET INVESTMENT LOSS | | $ | (408,334 | ) |
| | | | | |
| REALIZED AND UNREALIZED GAINS: | | | | |
| Net realized gain on investments | | $ | 5,310,089 | |
| Change in unrealized appreciation on investments | | | 21,216,002 | |
| Net gain on investments | | | 26,526,091 | |
| NET INCREASE IN NET ASSETS RESULTING FROM OPERATIONS | | $ | 26,117,757 | |
The accompanying notes are an integral part of these financial statements.
(This Page Intentionally Left Blank.)
HENNESSY FUNDS 1-800-966-4354
Financial Statements
| Statements of Changes in Net Assets |
| | | Six Months Ended | | | | |
| | | April 30, 2014 | | | Year Ended | |
| | | (Unaudited) | | | October 31, 2013 | |
| OPERATIONS: | | | | | | |
| Net investment income (loss) | | $ | (408,334 | ) | | $ | 1,152,317 | |
| Net realized gain on securities | | | 5,310,089 | | | | 59,762,626 | |
| Change in unrealized appreciation (depreciation) | | | | | | | | |
| on securities | | | 21,216,002 | | | | (20,009,895 | ) |
| Net increase in net assets resulting from operations | | | 26,117,757 | | | | 40,905,048 | |
| | | | | | | | | |
| DISTRIBUTIONS TO SHAREHOLDERS FROM: | | | | | | | | |
| Net investment income | | | | | | | | |
| Investor Class | | | (171,607 | ) | | | (1,650,619 | ) |
| Institutional Class | | | (182,037 | ) | | | (675,237 | ) |
| Net realized gains | | | | | | | | |
| Investor Class | | | (11,906,252 | ) | | | — | |
| Institutional Class | | | (3,717,057 | ) | | | — | |
| Total distributions | | | (15,976,953 | ) | | | (2,325,856 | ) |
| | | | | | | | | |
| CAPITAL SHARE TRANSACTIONS: | | | | | | | | |
| Proceeds from shares subscribed – Investor Class | | | 15,579,565 | | | | 57,117,732 | |
| Proceeds from shares subscribed – Institutional Class | | | 5,447,548 | | | | 22,736,273 | |
| Dividends reinvested – Investor Class | | | 11,873,074 | | | | 1,616,989 | |
| Dividends reinvested – Institutional Class | | | 3,660,618 | | | | 657,114 | |
| Cost of shares redeemed – Investor Class | | | (19,908,377 | ) | | | (74,701,969 | ) |
| Cost of shares redeemed – Institutional Class | | | (6,863,182 | ) | | | (22,841,934 | ) |
| Net increase (decrease) in net assets derived | | | | | | | | |
| from capital share transactions | | | 9,789,246 | | | | (15,415,795 | ) |
| TOTAL INCREASE IN NET ASSETS | | | 19,930,050 | | | | 23,163,397 | |
| | | | | | | | | |
| NET ASSETS: | | | | | | | | |
| Beginning of period | | | 210,635,047 | | | | 187,471,650 | |
| End of period | | $ | 230,565,097 | | | $ | 210,635,047 | |
| Undistributed net investment income (loss), | | | | | | | | |
| end of period | | $ | (37,733 | ) | | $ | 724,245 | |
The accompanying notes are an integral part of these financial statements.
| Statements of Changes in Net Assets - Continued |
| | | Six Months Ended | | | | |
| | | April 30, 2014 | | | Year Ended | |
| | | (Unaudited) | | | October 31, 2013 | |
| CHANGES IN SHARES OUTSTANDING: | | | | | | |
| Shares sold – Investor Class | | | 885,283 | | | | 3,548,784 | |
| Shares sold – Institutional Class | | | 308,449 | | | | 1,394,219 | |
| Shares issued to holders as | | | | | | | | |
| reinvestment of dividends – Investor Class | | | 706,175 | | | | 114,114 | |
| Shares issued to holders as | | | | | | | | |
| reinvestment of dividends – Institutional Class | | | 213,582 | | | | 45,696 | |
| Shares redeemed – Investor Class | | | (1,154,089 | ) | | | (4,826,744 | ) |
| Shares redeemed – Institutional Class | | | (392,822 | ) | | | (1,443,416 | ) |
| Net increase (decrease) in shares outstanding | | | 566,578 | | | | (1,167,347 | ) |
The accompanying notes are an integral part of these financial statements.
HENNESSY FUNDS 1-800-966-4354
Financial Highlights
| Hennessy Cornerstone Mid Cap 30 Fund |
For an Investor Class share outstanding throughout each period
| | | Six Months Ended | |
| | | April 30, 2014 | |
| | | (Unaudited) | |
| PER SHARE DATA: | | | |
| Net asset value, beginning of period | | $ | 17.32 | |
| | | | | |
| Income from investment operations: | | | | |
| Net investment income (loss) | | | (0.04 | ) |
| Net realized and unrealized gains on investments | | | 2.14 | |
| Total from investment operations | | | 2.10 | |
| | | | | |
| Less distributions: | | | | |
| Dividends from net investment income | | | (0.02 | ) |
| Dividends from net realized gains | | | (1.29 | ) |
| Total distributions | | | (1.31 | ) |
| Net asset value, end of period | | $ | 18.11 | |
| | | | | |
| TOTAL RETURN | | | 12.71 | %(1) |
| | | | | |
| SUPPLEMENTAL DATA AND RATIOS: | | | | |
| Net assets, end of period (millions) | | $ | 174.64 | |
| Ratio of expenses to average net assets | | | 1.29 | %(2) |
| Ratio of net investment income (loss) to average net assets | | | (0.45 | )%(2) |
Portfolio turnover rate(3) | | | 8 | %(1) |
| (1) | Not annualized. |
| (2) | Annualized. |
| (3) | Portfolio turnover is calculated on the basis of the Fund as a whole. |
The accompanying notes are an integral part of these financial statements.
| Year Ended October 31, | |
| 2013 | | | 2012 | | | 2011 | | | 2010 | | | 2009 | |
| | | | | | | | | | | | | | |
| $ | 14.06 | | | $ | 12.15 | | | $ | 11.18 | | | $ | 8.73 | | | $ | 8.02 | |
| | | | | | | | | | | | | | | | | | | |
| | | | | | | | | | | | | | | | | | | |
| | 0.09 | | | | 0.08 | | | | (0.09 | ) | | | (0.03 | ) | | | (0.02 | ) |
| | 3.35 | | | | 1.83 | | | | 1.06 | | | | 2.48 | | | | 0.73 | |
| | 3.44 | | | | 1.91 | | | | 0.97 | | | | 2.45 | | | | 0.71 | |
| | | | | | | | | | | | | | | | | | | |
| | | | | | | | | | | | | | | | | | | |
| | (0.18 | ) | | | — | | | | — | | | | — | | | | — | |
| | — | | | | — | | | | — | | | | — | | | | — | |
| | (0.18 | ) | | | — | | | | — | | | | — | | | | — | |
| $ | 17.32 | | | $ | 14.06 | | | $ | 12.15 | | | $ | 11.18 | | | $ | 8.73 | |
| | | | | | | | | | | | | | | | | | | |
| | 24.78 | % | | | 15.72 | % | | | 8.68 | % | | | 28.06 | % | | | 8.85 | % |
| | | | | | | | | | | | | | | | | | | |
| | | | | | | | | | | | | | | | | | | |
| $ | 159.45 | | | $ | 145.85 | | | $ | 146.23 | | | $ | 123.20 | | | $ | 128.36 | |
| | 1.31 | % | | | 1.37 | % | | | 1.36 | % | | | 1.39 | % | | | 1.39 | % |
| | 0.51 | % | | | 0.59 | % | | | (0.79 | )% | | | (0.26 | )% | | | (0.20 | )% |
| | 212 | % | | | 25 | % | | | 107 | % | | | 87 | % | | | 90 | % |
The accompanying notes are an integral part of these financial statements.
HENNESSY FUNDS 1-800-966-4354
Financial Highlights
| Hennessy Cornerstone Mid Cap 30 Fund |
For an Institutional Class share outstanding throughout each period
| | | Six Months Ended | |
| | | April 30, 2014 | |
| | | (Unaudited) | |
| PER SHARE DATA: | | | |
| Net asset value, beginning of period | | $ | 17.62 | |
| | | | | |
| Income from investment operations: | | | | |
| Net investment income (loss) | | | (0.02 | ) |
| Net realized and unrealized gains on investments | | | 2.18 | |
| Total from investment operations | | | 2.16 | |
| | | | | |
| Less distributions: | | | | |
| Dividends from net investment income | | | (0.06 | ) |
| Dividends from net realized gains | | | (1.29 | ) |
| Total distributions | | | (1.35 | ) |
| Net asset value, end of period | | $ | 18.43 | |
| | | | | |
| TOTAL RETURN | | | 12.88 | %(1) |
| | | | | |
| SUPPLEMENTAL DATA AND RATIOS: | | | | |
| Net assets, end of period (millions) | | $ | 55.93 | |
| Ratio of expenses to average net assets: | | | | |
| Before expense reimbursement | | | 1.11 | %(2) |
| After expense reimbursement | | | 0.98 | %(2) |
| Ratio of net investment income (loss) to average net assets: | | | | |
| Before expense reimbursement | | | (0.27 | )%(2) |
| After expense reimbursement | | | (0.14 | )%(2) |
Portfolio turnover rate(3) | | | 8 | %(1) |
| (1) | Not annualized. |
| (2) | Annualized. |
| (3) | Portfolio turnover is calculated on the basis of the Fund as a whole. |
The accompanying notes are an integral part of these financial statements.
| Year Ended October 31, | |
| 2013 | | | 2012 | | | 2011 | | | 2010 | | | 2009 | |
| | | | | | | | | | | | | | |
| $ | 14.31 | | | $ | 12.32 | | | $ | 11.29 | | | $ | 8.78 | | | $ | 8.04 | |
| | | | | | | | | | | | | | | | | | | |
| | | | | | | | | | | | | | | | | | | |
| | 0.14 | | | | 0.09 | | | | (0.05 | ) | | | 0.02 | | | | 0.02 | |
| | 3.41 | | | | 1.90 | | | | 1.08 | | | | 2.49 | | | | 0.72 | |
| | 3.55 | | | | 1.99 | | | | 1.03 | | | | 2.51 | | | | 0.74 | |
| | | | | | | | | | | | | | | | | | | |
| | | | | | | | | | | | | | | | | | | |
| | (0.24 | ) | | | — | | | | — | | | | — | | | | — | |
| | — | | | | — | | | | — | | | | — | | | | — | |
| | (0.24 | ) | | | — | | | | — | | | | — | | | | — | |
| $ | 17.62 | | | $ | 14.31 | | | $ | 12.32 | | | $ | 11.29 | | | $ | 8.78 | |
| | | | | | | | | | | | | | | | | | | |
| | 25.15 | % | | | 16.15 | % | | | 9.12 | % | | | 28.59 | % | | | 9.20 | % |
| | | | | | | | | | | | | | | | | | | |
| | | | | | | | | | | | | | | | | | | |
| $ | 51.19 | | | $ | 41.62 | | | $ | 24.06 | | | $ | 21.38 | | | $ | 27.44 | |
| | | | | | | | | | | | | | | | | | | |
| | 1.11 | % | | | 1.16 | % | | | 1.14 | % | | | 1.16 | % | | | 1.15 | % |
| | 0.98 | % | | | 0.98 | % | | | 0.98 | % | | | 0.98 | % | | | 0.98 | % |
| | | | | | | | | | | | | | | | | | | |
| | 0.71 | % | | | 0.90 | % | | | (0.41 | )% | | | (0.03 | )% | | | 0.04 | % |
| | 0.84 | % | | | 1.08 | % | | | (0.57 | )% | | | 0.15 | % | | | 0.21 | % |
| | 212 | % | | | 25 | % | | | 107 | % | | | 87 | % | | | 90 | % |
The accompanying notes are an integral part of these financial statements.
HENNESSY FUNDS 1-800-966-4354
Notes to the Financial Statements
April 30, 2014 (Unaudited)
1). ORGANIZATION
The Hennessy Cornerstone Mid Cap 30 Fund (the “Fund”) is a series of Hennessy Funds Trust (the “Trust”), which was organized as a Delaware statutory trust on September 17, 1992. The Fund is an open-end management investment company registered under the Investment Company Act of 1940, as amended. The Fund is a successor to a fund with the same name (the “Predecessor Fund”) that was a series of Hennessy Mutual Funds, Inc., a Maryland corporation, pursuant to a reorganization that took place after the close of business on February 28, 2014. Prior to February 28, 2014, the Fund had no investment operations. As a result of the reorganization, holders of the Investor Class shares of the Predecessor Fund received Investor Class shares of the Fund (the Investor Class shares of the Fund are the successor to the accounting and performance information of the Predecessor Fund), and holders of the Institutional Class shares of the Predecessor Fund received Institutional Class shares of the Fund (the Institutional Class shares of the Fund are the successor to the accounting and performance information of the Predecessor Fund). The investment objective of the Fund is long-term growth of capital. The Fund is a diversified fund.
The Fund offers Investor Class and Institutional Class shares. Prior to October 26, 2012, the Investor Class shares were known as Original Class shares. Each class of shares differs principally in its respective administration, 12b-1 distribution and service fees, shareholder servicing, and transfer agent expenses and sales charges, if any. Each class has identical rights to earnings, assets, and voting privileges, except for class-specific expenses and exclusive rights to vote on matters affecting only individual classes.
2). SIGNIFICANT ACCOUNTING POLICIES
The following is a summary of significant accounting policies consistently followed by the Fund in the preparation of the financial statements. These policies are in conformity with U.S. generally accepted accounting principles (“GAAP”).
| a). | Investment Valuation – All investments in securities are recorded at their estimated fair value, as described in Note 3. |
| b). | Federal Income Taxes – Provision for Federal income taxes or excise taxes has not been made since the Fund has elected to be taxed as a “regulated investment company” and intends to distribute substantially all of its taxable income to its shareholders and otherwise comply with the provisions of the Internal Revenue Code of 1986, as amended, applicable to regulated investment companies. Net investment income or loss and realized gains and losses for federal income tax purposes may differ from that reported on the financial statements because of temporary book and tax basis differences. Temporary differences are primarily the result of the treatment of wash sales for tax reporting purposes. Distributions from net realized gains for book purposes may include short-term capital gains, which are included as ordinary income to shareholders for tax purposes. |
| c). | Income and Expenses – Dividend income is recognized on the ex-dividend date or as soon as information is available to the Fund. Interest income, which includes the amortization of premium and accretion of discount, is recognized on an accrual basis. The Fund is charged for those expenses that are directly attributable to the portfolio, |
| | such as advisory, administration, and certain shareholder service fees. Income, expenses (other than expenses attributable to a specific class), and realized and unrealized gains or losses on investments are allocated to each class of shares based on its respective net assets. |
| d). | Distributions to Shareholders – Dividends from net investment income for the Fund, if any, are declared and paid out annually, usually in November or December. Distributions of net realized capital gains, if any, are declared and paid annually, usually in November or December. |
| e). | Security Transactions – Investment and shareholder transactions are recorded on the trade date. The Fund determines the gain or loss realized from the investment transactions by comparing the original cost of the security lot sold with the net sale proceeds. Discounts and premiums on securities purchased are accreted/amortized over the life of the respective security. |
| f). | Use of Estimates – The preparation of financial statements in conformity with GAAP requires management to make estimates and assumptions that affect the reported amounts of assets and liabilities and disclosure of contingent assets and liabilities at the date of the financial statements and the reported change in net assets during the reporting period. Actual results could differ from those estimates. |
| g). | Share Valuation – The net asset value (“NAV”) per share of the Fund is calculated by dividing the sum of the value of the securities held by the Fund, plus cash or other assets, minus all liabilities (including estimated accrued expenses) by the total number of shares outstanding for the Fund, rounded to the nearest cent. The Fund’s shares will not be priced on days the New York Stock Exchange is closed for trading. The offering and redemption price per share for the Fund is equal to the Fund’s net asset value per share. |
| h). | Foreign Currency – Values of investments denominated in foreign currencies, if any, are converted into U.S. dollars using the spot market rate of exchange at the time of valuation. Purchases and sales of investments and income are translated into U.S. dollars using the spot market rate of exchange prevailing on the respective dates of such transactions. The Fund does not isolate the portion of the results of operations resulting from fluctuations in foreign exchange rates on investments from fluctuations resulting from changes in the market prices of securities held. Such fluctuations are included with the net realized and unrealized gain or loss on investments. Foreign investments present additional risks due to currency fluctuations, economic and political factors, lower liquidity, government regulations, differences in accounting standards, and other factors. |
| i). | Forward Contracts – The Fund may enter into forward currency contracts to reduce its exposure to changes in foreign currency exchange rates on its foreign holdings and to lock in the U.S. dollar cost of firm purchase and sale commitments for securities denominated in foreign currencies. A forward currency contract is a commitment to purchase or sell a foreign currency at a future date at a negotiated forward rate. The gain or loss arising from the difference between the U.S. dollar cost of the original contract and the value of the foreign currency in U.S. dollars upon closing of such contract is included in net realized gain or loss from foreign currency transactions. During the six months ended April 30, 2014, the Fund did not enter into any forward contracts. |
| j). | Repurchase Agreements – The Fund may enter into repurchase agreements with member banks or security dealers of the Federal Reserve Board whom the investment advisor deems creditworthy. The repurchase price generally equals the price paid by the Fund plus interest negotiated on the basis of current short-term rates. |
HENNESSY FUNDS 1-800-966-4354
| | Securities pledged as collateral for repurchase agreements are held by the custodian bank until the respective agreements mature. Provisions of the repurchase agreements ensure that the market value of the collateral, including accrued interest thereon, is sufficient in the event of default of the counterparty. If the counterparty defaults and the value of the collateral declines or if the counterparty enters an insolvency proceeding, realization of the collateral by the Fund may be delayed or limited. |
| k). | Accounting for Uncertainty in Income Taxes – The Fund has adopted accounting policies regarding recognition and measurement of tax positions taken or expected to be taken on a tax return. The Fund has reviewed all open tax years in major jurisdictions and concluded that there is no impact on the Fund’s net assets and no tax liability resulting from unrecognized tax benefits relating to uncertain income tax positions taken or expected to be taken on a tax return. The Fund’s major tax jurisdictions are U.S. Federal and Delaware. As of April 30, 2014, open Federal and state tax years for the Fund include the tax years ended October 31, 2011 through 2013. |
| l). | Derivatives – The Fund may invest in, or enter into, derivatives, such as options, futures contracts, options on futures contracts, and swaps, for a variety of reasons, including to hedge certain risks, to provide a substitute for purchasing or selling particular securities, or to increase potential income gain. Derivatives may provide a cheaper, quicker, or more specifically focused way for a Fund to invest than “traditional” securities would. The main purpose of utilizing these derivative instruments is for hedging purposes. |
| | The Fund has adopted the financial accounting reporting rules as required by the Derivatives and Hedging Topic of the Financial Accounting Standards Board Accounting Standards Codification. Under such rules, the Fund is required to include enhanced disclosure that enables investors to understand how and why an entity uses derivatives, how derivatives are accounted for, and how derivatives instruments affect an entity’s results of operations and financial position. During the six months ended April 30, 2014, the Fund did not hold any derivative instruments. |
| m). | Events Subsequent to the Fiscal Period End – The Fund has adopted financial reporting rules regarding subsequent events that require an entity to recognize in the financial statements the effects of all subsequent events that provide additional evidence about conditions that existed at the date of the balance sheet. Management has evaluated the Fund’s related events and transactions that occurred subsequent to April 30, 2014 through the date of issuance of the Fund’s financial statements. There were no events or transactions that occurred during this period that materially impacted the amounts or disclosures in the Fund’s financial statements. |
3). SECURITIES VALUATION
The Fund has adopted authoritative fair valuation accounting standards that establish an authoritative definition of fair value and set out a hierarchy for measuring fair value. These standards require additional disclosures about the various inputs and valuation techniques used to develop the measurements of fair value and a discussion in changes in valuation techniques and related inputs during the period. These inputs are summarized in the three broad levels listed below:
| | Level 1 – | Quoted unadjusted prices for identical instruments in active markets to which the Fund has access at the date of measurement. |
| | Level 2 – | Quoted prices for similar instruments in active markets; quoted prices for identical or similar instruments in markets that are not active; and model-derived valuations in which all significant inputs and significant value |
| | | drivers are observable in active markets. Level 2 inputs are those in markets for which there are few transactions, the prices are not current, the prices are fair value adjusted due to post-market close subsequent events (foreign markets), little public information exists, or instances where prices vary substantially over time or among brokered market makers. These inputs may also include interest rates, prepayment speeds, credit risk curves, default rates, and similar data. |
| | Level 3 – | Model-derived valuations in which one or more significant inputs or significant value drivers are unobservable. Unobservable inputs are those inputs that reflect the Fund’s own assumptions about what market participants would use to price the asset or liability based on the best available information. |
Following is a description of the valuation techniques applied to the Fund’s major categories of assets and liabilities measured at fair value on a recurring basis.
Equity Securities – Equity securities, including common stocks, preferred stocks, foreign issued common stocks, exchange traded funds, closed-end mutual funds, and real estate investment trusts, that are traded on a securities exchange for which a last-quoted sales price is readily available will be valued at the last sales price as reported by the primary exchange on which the securities are listed. Securities listed on The NASDAQ Stock Market (“NASDAQ”) will be valued at the NASDAQ Official Closing Price, which may differ from the last sales price reported. Securities traded on a securities exchange for which a last-quoted sales price is not readily available will be valued at the mean between the bid and ask prices. To the extent these securities are actively traded and valuation adjustments are not applied, they are classified in Level 1 of the fair value hierarchy.
Investment Companies – Investments in investment companies (e.g., mutual funds and exchange traded funds) are generally priced at the ending NAV provided by the Fund’s service agent and will be classified in Level 1 of the fair value hierarchy.
Debt Securities – Debt securities, including corporate bonds, asset-backed securities, mortgage-backed securities, municipal bonds, U.S. Treasuries, and U.S. government agency issues, are valued at market on the basis of valuations furnished by an independent pricing service that utilizes both dealer-supplied valuations and formula-based techniques. The pricing service may consider recently executed transactions in securities of the issuer or comparable issuers, market price quotations (where observable), bond spreads, and fundamental data relating to the issuer. In addition, the model may incorporate market observable data such as reported sales of similar securities, broker quotes, yields, bids, offers, and reference data. Certain securities are valued principally using dealer quotations. These securities are generally classified in Level 2 of the fair value hierarchy.
Short-Term Securities – Short-term equity investments, including money market funds, are valued in the manner specified above. Short-term debt investments are valued at amortized cost, if their original maturity was 60 days or less, or by amortizing the values as of the 61st day prior to maturity, if their original term to maturity exceeded 60 days. Short-term securities are generally classified in Level 1 or Level 2 of the fair market hierarchy depending on the inputs used and market activity levels for specific securities.
The Board of Trustees of the Fund (the “Board”) has adopted fair value pricing procedures that are followed when a price for a security is not readily available or if a significant event has occurred that indicates the closing price of a security no longer represents the true value of that security. Fair value pricing determinations are made in good faith in accordance with these procedures. There are numerous criteria that will be
HENNESSY FUNDS 1-800-966-4354
given consideration in determining a fair value of a security. Some of these criteria are trading volume of security and markets, the value of other like securities, and news events with direct bearing to security or market. Fair value pricing results in an estimated price that reasonably reflects the current market conditions in order to rate the portfolio holdings such that shareholder transactions receive a fair net asset value. Depending on the relative significance of the valuation inputs, these securities may be classified in either Level 2 or Level 3 of the fair value hierarchy.
Fair valuing of foreign securities may be determined with the assistance of a pricing service using correlations between the movement of prices of such securities and indices of domestic securities and other appropriate indicators, such as closing market prices of relevant American Depositary Receipts or futures contracts. The effect of using fair value pricing is that the Fund’s NAV will reflect the affected portfolio securities’ value as determined in the judgment of the Board or its designee instead of being determined by the market. Using a fair value pricing methodology to price foreign securities may result in a value that is different from a foreign security’s most recent closing price and from the prices used by other investment companies to calculate their net asset values and are generally considered Level 2 prices in the fair valuation hierarchy. Because the Fund may invest in foreign securities, the value of the Fund’s portfolio securities may change on days when you will not be able to purchase or redeem your shares.
The Board has delegated day-to-day valuation matters to a Valuation Committee comprised of one or more representatives from Hennessy Advisors, Inc., the Fund’s investment advisor. The function of the Valuation Committee is to value securities where current and reliable market quotations are not readily available. All actions taken by the Valuation Committee are reviewed by the Board.
The Fund has performed an analysis of all existing investments to determine the significance and character of all inputs to their fair value determination. Various inputs are used in determining the value of the Fund’s investments. The inputs or methodology used for valuing securities are not necessarily an indication of the risk associated with investing in those securities. Details related to the fair valuation hierarchy of the Fund’s securities as of April 30, 2014 are included in the Fund’s Schedule of Investments.
4). INVESTMENT TRANSACTIONS
Purchases and sales of investment securities (excluding government and short-term investments) for the Fund during the six months ended April 30, 2014 were $17,933,724 and $27,934,744, respectively.
There were no purchases or sales/maturities of long-term U.S. Government Securities for the Fund during the six months ended April 30, 2014.
5). INVESTMENT MANAGEMENT FEE AND OTHER TRANSACTIONS WITH AFFILIATES
Hennessy Advisors, Inc. (the “Advisor”) is the investment advisor of the Fund. The Advisor provides the Fund with investment management services under an Investment Advisory Agreement. The Advisor furnishes all investment advice, office space, facilities, and provides most of the personnel needed by the Fund. As compensation for its services, the Advisor is entitled to a monthly fee from the Fund. The fee is based upon the average daily net assets of the Fund at the annual rate of 0.74%. The net investment advisory fees payable for the Fund as of April 30, 2014 were $137,298.
The Advisor has agreed to waive its fees and absorb expenses to the extent that the total annual operating expenses (excluding all Federal, state and local taxes, interest, brokerage commissions, acquired fund fees and expenses and other costs incurred in connection with the purchase and sale of securities and extraordinary items) exceed 0.98%
of the Fund’s net assets for the Institutional Class shares of the Fund. The expense limitation agreement for the Institutional Class shares can only be terminated by the Board.
For a period of three years after the year in which the Advisor waives or reimburses expenses, the Advisor may seek reimbursement from the Fund to the extent that total annual fund operating expenses are less than the expense limitation in effect at the time of the reimbursement. During the three years ended October 31, 2013, no Advisor fees were waived and therefore no expenses are subject to potential recovery.
The Board has approved a Shareholder Servicing Agreement for the Investor Class shares of the Fund, which was instituted to compensate the Advisor for the non-investment management services it provides to the Fund. The Shareholder Servicing Agreement provides for a monthly fee paid to the Advisor at an annual rate of 0.10% of the average daily net assets of the Fund attributable to Investor Class shares. Shareholder servicing fees payable for the Fund as of April 30, 2014 were $14,040.
The Fund has entered into agreements with various brokers, dealers, and financial intermediaries in connection with the sale of shares of the Fund. The agreements provide for periodic payments by the Fund to the brokers, dealers, and financial intermediaries for providing certain shareholder maintenance services (sub-transfer agent expenses). These shareholder services include the pre-processing and quality control of new accounts, shareholder correspondence, answering customer inquiries regarding account status, and facilitating shareholder telephone transactions. Fees paid by the Fund to various brokers, dealers, and financial intermediaries for the six months ended April 30, 2014 were $168,654.
U.S. Bancorp Fund Services, LLC (“USBFS”) provides the Fund with administrative, fund accounting, and transfer agent services, including all regulatory reporting, and necessary office equipment and personnel. As administrator, USBFS prepares various federal and state regulatory filings, reports, and returns for the Fund; prepares reports and materials to be supplied to the Board; monitors the activities of the Fund’s custodian, transfer agent, and accountants; and coordinates the preparation and payment of the Fund’s expenses and reviews the Fund’s expense accruals. Fees paid to USBFS for the six months ended April 30, 2014 were $184,331.
USBFS has voluntarily waived all or a portion of its fees allocated to the Institutional Class shares of the Fund. The administration fees voluntarily waived by USBFS during the six months ended April 30, 2014 were $32,882.
U.S. Bank, N.A., an affiliate of USBFS, serves as the Fund’s custodian. Quasar Distributors, LLC acts as the Fund’s principal underwriter in a continuous public offering of the Fund’s shares. Quasar Distributors, LLC is an affiliate of USBFS and U.S. Bank, N.A.
6). LINE OF CREDIT
The Fund has a line of credit with the other funds in the Hennessy Funds family of funds (the “Hennessy Funds”) in the amount of the lesser of (i) $100,000,000 or (ii) 33.33% of each Hennessy Fund’s net assets, or 30% for the Hennessy Gas Utility Index Fund and 10% for the Hennessy Balanced Fund, intended to provide short-term financing, if necessary, subject to certain restrictions, in connection with shareholder redemptions. The credit facility is with the Hennessy Funds’ custodian bank, U.S. Bank, N.A. Borrowings under this arrangement bear interest at the bank’s prime rate. During the six months ended April 30, 2014, the Fund did not have any borrowings outstanding under the line of credit.
HENNESSY FUNDS 1-800-966-4354
7). FEDERAL TAX INFORMATION
As of October 31, 2013, the Fund’s most recent fiscal year end, the components of accumulated earnings (losses) for income tax purposes for the Fund were as follows:
| | Cost of investments for tax purposes | | $ | 203,302,306 | |
| | Gross tax unrealized appreciation | | $ | 11,718,602 | |
| | Gross tax unrealized depreciation | | | (4,276,253 | ) |
| | Net tax unrealized appreciation/depreciation | | $ | 7,442,349 | |
| | Undistributed ordinary income | | $ | 724,245 | |
| | Undistributed long-term capital gains | | | 15,252,709 | |
| | Total distributable earnings | | $ | 15,976,954 | |
| | Other accumulated gain (loss) | | $ | (1,481,017 | ) |
| | Total accumulated gain (loss) | | $ | 21,938,286 | |
The difference between book-basis and tax-basis unrealized appreciation is attributable primarily to capital loss carry overs, wash sales, and partnership adjustments.
At October 31, 2013, the Fund’s most recent fiscal year end, the Fund had capital loss carryforwards that expire as follows:
During the year ended October 31, 2013, the Fund’s most recent fiscal year end, the capital loss carry forwards utilized for the Fund were $43,512,280.
Capital losses sustained in the year ended October 31, 2012 and in future taxable years will not expire and may be carried over by the Fund without limitation; however, they will retain the character of the original loss. Furthermore, any losses incurred during those taxable years will be required to be utilized prior to the losses incurred in the pre-enactment taxable years. As a result of this ordering rule, pre-enactment capital loss carryforwards may be more likely to expire unused. Under pre-enactment law, capital losses could be carried forward for eight years, and carried forward as short-term capital losses, irrespective of the character of the original loss.
At October 31, 2013, the Fund did not defer, on a tax basis, any post-December late year ordinary loss deferrals or post-December loss deferrals.
The tax character of distributions paid during fiscal year 2014 (year-to-date) and fiscal year 2013 for the Fund were as follows:
| | | | Six Months Ended | | | Year Ended | |
| | | | April 30, 2014 | | | October 31, 2013 | |
| | Ordinary income | | $ | 353,644 | | | $ | 2,325,856 | |
| | Long-term capital gain | | | 15,623,309 | | | | — | |
| | | | $ | 15,976,953 | | | $ | 2,325,856 | |
8). AGREEMENT AND PLAN OF REORGANIZATION
On December 11, 2013, the Board approved an Agreement and Plan of Reorganization (the “Agreement”), of the Hennessy Cornerstone Mid Cap 30 Fund (the “New Fund”), pursuant to which the New Fund would be a successor to the corresponding series of the same name of Hennessy Mutual Funds, Inc., a Maryland corporation (the “Predecessor Fund”). The Agreement provided for the transfer of assets of the Predecessor Fund to the New Fund and the assumption of the liabilities of the Predecessor Fund by the New Fund. The New Fund had the same investment objective and substantially similar principal investment strategies as the Predecessor Fund. The reorganization was effective as of the close of business on February 28, 2014. The following table illustrates the specifics of the reorganization:
| | | Shares of the New Fund | | | |
| | Predecessor Fund | Issued to Shareholders of | New Fund | Combined | Tax Status |
| | Net Assets | the Predecessor Fund | Net Assets | Net Assets | of Transfer |
| | $223,166,917(1) | 12,549,357 | $223,166,917 | $223,166,917 | Non-taxable |
| | (1) | Included accumulated realized gains and unrealized appreciation in the amounts of $15,487,981 and $27,823,920, respectively. |
HENNESSY FUNDS 1-800-966-4354
Expense Example (Unaudited)
April 30, 2014
As a shareholder of the Fund, you incur two types of costs: (1) transaction costs, including sales charges (loads) on purchase payments, reinvested dividends, or other distributions; redemption fees; and exchange fees; and (2) ongoing costs, including management fees; service fees; and other Fund expenses. This Example is intended to help you understand your ongoing costs (in dollars) of investing in the Fund and to compare these costs with the ongoing costs of investing in other mutual funds. The Example is based on an investment of $1,000 invested at the beginning of the period and held for the entire period from November 1, 2013 through April 30, 2014.
Actual Expenses
The first line of the table below under the “Investor Class” and “Institutional Class” headings provides information about actual account values and actual expenses. Although the Fund charges no sales loads or transaction fees, you will be assessed fees for outgoing wire transfers, returned checks and stop payment orders at prevailing rates charged by U.S. Bancorp Fund Services, LLC, the Fund’s transfer agent. If you request that a redemption be made by wire transfer, currently a $15.00 fee is charged by the Fund’s transfer agent. IRA accounts will be charged a $15.00 annual maintenance fee. The example below includes, but is not limited to, management fees, shareholder servicing fees, fund accounting, custody, and transfer agent fees. However, the example below does not include portfolio trading commissions and related expenses, and other extraordinary expenses as determined under generally accepted accounting principles. You may use the information in this line, together with the amount you invested, to estimate the expenses that you paid over the period. Simply divide your account value by $1,000 (for example, an $8,600 account value divided by $1,000 = 8.6), then multiply the result by the number in the first line of the table under the “Investor Class” and “Institutional Class” headings in the column entitled “Expenses Paid During Period” to estimate the expenses you paid on your account during this period.
Hypothetical Example for Comparison Purposes
The second line of the table below under the “Investor Class” and “Institutional Class” headings provides information about hypothetical account values and hypothetical expenses based on the Fund’s actual expense ratios and an assumed rate of return of 5% per year before expenses, which is not the Fund’s actual return. The hypothetical account values and expenses may not be used to estimate the actual ending account balance or expenses you paid for the period. You may use this information to compare the ongoing costs of investing in the Fund and other funds. To do so, compare this 5% hypothetical example with the 5% hypothetical examples that appear in the shareholder reports of the other funds. Please note that the expenses shown in the table are meant to highlight your ongoing costs only and do not reflect any transactional costs, such as sales charges (loads), or exchange fees. Therefore, the second line of the table under the “Investor Class” and “Institutional Class” headings is useful in comparing ongoing costs only, and will not help you determine the relative total costs of owning different funds. In addition, if these transactional costs were included, your costs would have been higher.
| | | | Expenses Paid |
| | Beginning | Ending | During Period(1) |
| | Account Value | Account Value | November 1, 2013 – |
| | November 1, 2013 | April 30, 2014 | April 30, 2014 |
| Investor Class | | | |
| | | | |
| Actual | $1,000.00 | $1,127.10 | $6.80 |
| | | | |
| Hypothetical (5% return | | | |
| before expenses) | $1,000.00 | $1,018.40 | $6.46 |
| | | | |
| Institutional Class | | | |
| | | | |
| Actual | $1,000.00 | $1,128.80 | $5.17 |
| | | | |
| Hypothetical (5% return | | | |
| before expenses) | $1,000.00 | $1,019.93 | $4.91 |
| (1) | Expenses are equal to the Fund’s annualized expense ratio of 1.29% for Investor Class shares or 0.98% for Institutional Class shares, as applicable, multiplied by the average account value over the period, multiplied by 181/365 days (to reflect one-half year period). |
HENNESSY FUNDS 1-800-966-4354
Proxy Voting
A description of the policies and procedures the Fund uses to determine how to vote proxies relating to portfolio securities is available without charge: (1) by calling 1-800-966-4354; (2) on the Hennessy Funds’ website at hennessyfunds.com; or (3) on the U.S. Securities and Exchange Commission’s (the “SEC”) website at www.sec.gov. The Fund’s proxy voting record is available on both the Hennessy Funds’ website at hennessyfunds.com and the SEC’s website at www.sec.gov no later than August 31 for the prior 12 months ending June 30.
Quarterly Filings on Form N-Q
The Fund files its complete schedule of portfolio holdings with the SEC for the first and third quarters of each fiscal year on Form N-Q. The Fund’s Forms N-Q are available on the SEC’s website at www.sec.gov. The Fund’s Forms N-Q may be reviewed and copied at the SEC’s Public Reference Room in Washington, DC and information on the operation of the Public Reference Room may be obtained by calling 1-800-SEC-0330. Information included in the Fund’s Forms N-Q will also be available upon request by calling 1-800-966-4354.
Federal Tax Distribution Information
(Unaudited)
For the fiscal year ended October 31, 2013, certain dividends paid by the Fund may be subject to a maximum tax rate of 15%, as provided for by the Jobs and Growth Tax Relief Reconciliation Act of 2003. The percentage of dividends declared from ordinary income designated as qualified dividend income was 100.00%.
For corporate shareholders, the percent of ordinary income distributions qualifying for the corporate dividends received deduction for the fiscal year ended October 31, 2013 was 100.00%.
The percentage of taxable ordinary income distributions that are designated as short-term capital gain distributions under Section 871(k)(2)(C) of the Internal Revenue Code of 1986, as amended, for the Fund was 0.00%.
Householding
To help keep the Fund’s costs as low as possible, we generally deliver a single copy of most financial reports and prospectuses to shareholders who share an address, even if the accounts are registered under different names. This process, known as “householding,” does not apply to account statements. You may, of course, request an individual copy of a prospectus or financial report at any time. If you would like to receive separate mailings, please call the Administrator at 1-800-261-6950 or 1-414-765-4124 and we will begin individual delivery within 30 days of your request. If your account is held through a financial institution or other intermediary, please contact them directly to request individual delivery.
Board Approval of Investment Advisory
Agreement
At its meeting on December 4, 2013, the Board of Trustees of the Fund (the “Board”) unanimously approved the investment advisory agreement of the Fund for an initial period of two years.
The Board reviewed a number of documents, including a memorandum provided by outside legal counsel that described the fiduciary duties of the Board with respect to approving the investment advisory agreement and the relevant factors for consideration, the Advisor’s most recent Form 10-K, a copy of the advisory agreement, a fund fact sheet, and peer expense and performance comparisons. The Board considered and discussed numerous factors, including the following:
| | • | The Board considered the services identified below that are provided by the Advisor: |
| | | • | The Advisor acts as portfolio manager for the Fund. In this capacity, the Advisor manages the composition of the portfolio of the Fund, including the purchase, retention, and disposition of portfolio securities in accordance with the Fund’s investment objectives, policies, and restrictions. |
| | | • | The Advisor oversees distribution of the Fund through third-party broker/dealers and independent financial institutions such as Charles Schwab, Inc., Fidelity, TD Waterhouse, and Pershing. The Advisor participates in “no transaction fee” (“NTF”) programs with these companies on behalf of the Fund, which allows customers to purchase the Fund through third-party distribution channels without paying a transaction fee. The Advisor compensates a number of these third-party providers of NTF programs out of its own revenues and not those of the Fund. |
| | | • | The Advisor oversees service providers that support the Fund in providing fund accounting, fund administration, fund distribution, transfer agency, and custodial services. |
| | • | The Board considered that the advisory services to be provided by the Advisor are services required for the operation of the Fund. |
| | • | The Board considered the nature and quality of the advisory services offered by the Advisor to the Fund. |
| | • | The Board considered that the terms of the advisory agreement are fair and reasonable. |
| | • | The Board compared the performance of the Fund to benchmark indices over various periods of time and concluded that the positive performance of the Fund warranted the approval of the advisory agreement. |
| | • | The Board reviewed the Fund’s expense ratio and comparable expense ratios for funds comparable to the Fund. The Board used data from Morningstar showing funds similar in asset size and investment objective to the Fund and determined that the expense ratio of the Fund falls within the range of the ratios of other comparable funds and concluded that the expenses of the Fund were reasonable. |
| | • | The Board considered the fees charged by the Advisor to those of funds similar in asset size and investment objective to the Fund and concluded the advisory fee of the Fund was reasonable and warranted approval of the advisory agreement. |
HENNESSY FUNDS 1-800-966-4354
| | • | The Board considered the profitability of the Advisor with respect to the Fund and concluded the profits were reasonable and not excessive when compared to profitability guidelines set forth in relevant court cases. |
| | • | The Board considered the high level of professionalism and knowledge of the Advisor’s employees, along with an extremely low level of turnover of the employees of the Advisor, and concluded that this was beneficial to the Fund and its shareholders, as it ensures that the Fund is operated efficiently. |
All of the factors above were considered separately by the Board, including the Trustees who are not “interested persons” (as defined in the Investment Company Act of 1940, as amended) of the Fund (the “Independent Trustees”) meeting in an executive session. The factors were viewed in their totality by the Board, with no single factor being the principal or determinative factor in the Board’s determination of whether to approve the advisory agreement. Based on the factors discussed above, the Board, including all of the Independent Trustees, recommended approval of the advisory agreement.
(This Page Intentionally Left Blank.)
For information, questions or assistance, please call
The Hennessy Funds
1-800-966-4354 or 1-415-899-1555
INVESTMENT ADVISOR
Hennessy Advisors, Inc.
7250 Redwood Blvd., Suite 200
Novato, California 94945
ADMINISTRATOR,
TRANSFER AGENT,
DIVIDEND PAYING AGENT &
SHAREHOLDER SERVICING AGENT
U.S. Bancorp Fund Services, LLC
P.O. Box 701
Milwaukee, Wisconsin 53201-0701
CUSTODIAN
U.S. Bank N.A.
Custody Operations
1555 North River Center Dr., Suite 302
Milwaukee, Wisconsin 53212
TRUSTEES
Neil J. Hennessy
Robert T. Doyle
J. Dennis DeSousa
Gerald P. Richardson
COUNSEL
Foley & Lardner LLP
777 East Wisconsin Avenue
Milwaukee, Wisconsin 53202-5306
INDEPENDENT REGISTERED
PUBLIC ACCOUNTING FIRM
KPMG LLP
777 East Wisconsin Avenue
Milwaukee, Wisconsin 53202-5306
DISTRIBUTOR
Quasar Distributors, LLC
615 East Michigan Street
Milwaukee, Wisconsin 53202
hennessyfunds.com | 1-800-966-4354
This report has been prepared for shareholders and may be distributed to
others only if preceded or accompanied by a current prospectus.

SEMI-ANNUAL REPORT
APRIL 30, 2014
HENNESSY CORNERSTONE
LARGE GROWTH FUND
Investor Class HFLGX
Institutional Class HILGX
hennessyfunds.com | 1-800-966-4354
(This Page Intentionally Left Blank.)
Contents
| Letter to Shareholders | 2 |
| Performance Overview | 4 |
| Financial Statements | |
| Schedule of Investments | 6 |
| Statement of Assets and Liabilities | 10 |
| Statement of Operations | 11 |
| Statements of Changes in Net Assets | 13 |
| Financial Highlights | 14 |
| Notes to the Financial Statements | 18 |
| Expense Example | 25 |
| Proxy Voting | 27 |
| Quarterly Filings on Form N-Q | 27 |
| Federal Tax Distribution Information | 27 |
| Householding | 27 |
| Board Approval of Investment Advisory Agreement | 28 |
HENNESSY FUNDS 1-800-966-4354
June 2014
Dear Shareholder:
The financial markets have provided strong returns over the past six-months ended April 30, 2014, with the Dow Jones Industrial Average (DJIA) and S&P 500 both returning approximately 8% during the period. The current valuation metrics of the major indices are solid; for example, the DJIA currently has a price-to-earnings ratio of 15x and a price-to-sales ratio of 1.75x. The DJIA also has a dividend yield of 2.2%, which is nearly as high as that of a 10-Year U.S. Treasury, which is currently yielding 2.6%. Investing in high-yielding, high-quality DJIA stocks have the potential to not only provide an income stream but also for stock price appreciation as well. Fixed income investing has run its course, in my opinion, and many individuals are currently benefiting from the return to investing in equities that possess strong fundamentals.
U.S. corporations continue to drive shareholder value by making acquisitions, initiating and raising dividends, investing in internal infrastructure, and buying back stock. However, lately I have begun to see a shift in those business strategies. The easier-to-execute acquisitions seem to be a thing of the past, and firms now have to be even more creative to execute accretive deals. I also believe that while firms may continue to initiate dividends, fewer firms will raise their dividends and fewer firms will participate in stock buyback programs going forward. So what will these cash-rich companies do with their capital if they are not raising dividends or buying back stock? I believe we will see companies begin to initiate capital expenditure programs.
Due to the continuing uncertainty from a lack of clear policies on taxes, healthcare, and regulations, I have observed that corporations would rather wait for clarity from our government leaders and defer any significant changes to their current business models. Up until this point, there has been no real cost for firms to defer spending their capital as they wait for anticipated guidance on policies that directly affect their businesses. But, this economic handcuffing from all of this uncertainty has gone on long enough. I believe there will now be firms who want to improve their margins and will begin spending money to expand their sales, and may even begin to hire. Once a competitor begins to move in this way, then the cost to defer becomes real for companies. This movement to expansion may well be a catalyst to propel the financial markets. I do believe this will be a slow shift, but one that will keep the economy improving, and should, in my opinion, help to generate reasonable market returns over the next few years.
With almost $3 trillion in cash sitting on the sidelines, this strategic shift by companies to begin spending their idle capital should help the economic recovery in the U.S. But that is only one part of the equation. Washington politics still play a role in how strong that recovery will be. The national political landscape will change in the next few years, and the future generation of elected officials will be faced with what I believe are fictitious unemployment figures (6.3% reported, when over 20 million Americans are looking for more work or a better job), a sluggish economy, and global competition in business. The next regime needs to provide real clarity on the issues that face all Americans and American corporations: taxation, regulation, and how to pay for our new healthcare system. I also believe that our government needs to regard business as a noble profession and to implement common sense and logic in their policy making instead of politics as usual. As Confucius is quoted as saying, “Life is really simple, but we insist on making it complicated.”
I am confident that even with all the hurdles facing corporate America, companies continue to provide good value for their shareholders, and I believe that means the financial markets are in good shape and should remain strong moving forward, I also believe that the next few months may be volatile. Fads come and go, and the current buzz on the Street is around investing in social media stocks. I believe that chasing hot products has contributed and will continue to contribute to the volatility of the markets this year. After over 35 years in the business, I still firmly believe the best way to position your portfolio is by investing in good companies over the long term, rather than trying to buy the next hot idea at exactly the right time. At Hennessy Funds, hunches and fads have no place in our investment process, and we understand that successful investing comes from time in the market, not timing the market.
We remain focused on investing based on proven fundamentals, and we are committed to managing money for the sole benefit of our shareholders. If you have any questions or want to speak with us directly, please don’t hesitate to call us at (800) 966-4354.
Best regards,
Neil J. Hennessy
President and Chief Investment Officer
Past performance does not guarantee future results.
Mutual fund investing involves risk. Principal loss is possible.
Opinions expressed are those of Neil Hennessy and are subject to change, are not guaranteed and should not be considered investment advice.
The Dow Jones Industrial Average and S&P 500 are unmanaged indices commonly used to measure the performance of U.S. stocks. One cannot invest directly in an index.
Price-to-sales ratio and price-to-earnings ratio are tools for calculating relative valuation. Price-to-sales ratio is calculated by dividing the market price by revenue per share. Price-to-earnings ratio is the market price per share divided by earnings per share.
HENNESSY FUNDS 1-800-966-4354
Performance Overview (Unaudited)
The opinions expressed in the following commentary reflect those of the Portfolio Managers as of the date written. Any such opinions are subject to change based on market or other conditions and are not guaranteed. These opinions may not be relied upon as investment advice. Investment decisions for the Fund are based on several factors, and may not be relied upon as an indication of trading intent on behalf of the Fund. Security positions can and do change.
AVERAGE ANNUAL TOTAL RETURN PERIODS ENDED APRIL 30, 2014
| | | | Since | |
| | Six | One | Five | Inception |
| | Months(1) | Year | Years | (3/20/09) |
| Hennessy Large Growth Fund – | | | | |
| Investor Class (HFLGX) | 12.70% | 28.53% | 20.41% | 23.31% |
| Hennessy Large Growth Fund – | | | | |
| Institutional Class (HILGX) | 12.81% | 28.82% | 20.75% | 23.65% |
Russell 1000® Index | 8.25% | 20.81% | 19.52% | 22.23% |
| S&P 500 Index | 8.36% | 20.44% | 19.14% | 21.72% |
Expense ratios: 1.19% (Investor Class); Gross 1.10%, Net 0.98%(2) (Institutional Class)
Performance data quoted represents past performance; past performance does not guarantee future results. The investment return and principal value of an investment will fluctuate so that an investor’s shares, when redeemed, may be worth more or less than their original cost. Current performance of the Fund may be lower or higher than the performance quoted. Performance data current to the most recent month end may be obtained by visiting hennessyfunds.com.
The expense ratios presented are from the most recent prospectus.
| (1) | Periods less than one year are not annualized. |
| (2) | With regard to Institutional Class shares, the Fund’s investment advisor has contractually agreed to waive a portion of its expenses indefinitely. |
PERFORMANCE NARRATIVE
Portfolio Manager, Neil Hennessy, and Co-Portfolio Manager, Brian Peery
Over the previous six months, how did the Fund perform and what factors contributed to this performance?
For the six-month period ended April 30, 2014, the Investor Class of the Hennessy Cornerstone Large Growth Fund returned 12.70%, significantly outperforming the Russell 1000® Index, the S&P 500 Index, and the Morningstar Large Blend Category Average, which returned 8.25%, 8.36%, and 7.41% for the same period, respectively.
We are very pleased with the overall performance of the Fund during the previous six months versus its benchmarks. The Fund’s relative outperformance was driven entirely by stock selection, as asset allocation had a very slight negative effect on the portfolio. The biggest contribution to the Fund’s outperformance versus its benchmarks was stock selection in the Industrial and Information Technology sectors, which accounted for over half of the outperformance relative to the Russell 1000® Index. The largest detractor to the Fund’s performance was its cash holdings, which are targeted at less than 5% of the Fund’s total net assets and which averaged approximately 3.5% for the six-month period.
Additional Portfolio Manager commentary and related investment outlook:
During the last six months, we saw a continued trend of companies beating earnings expectations, but not quite meeting revenue targets. We believe this trend is abating and that we should see better earnings and revenue numbers in the coming year. While top line revenue growth was muted due to a slow growth environment and weather-related issues, companies are still doing well. Corporate profits continue to reach new highs due to deferred capital expenditure plans, combined with tempered cost cutting.
We feel, however, that we are in the midst of a change, and an important one for the future of the bull market. We are seeing positive signs in both revenue growth and the all-important corporate capital expenditures levels. Over the last six months, we have seen a slight disconnect between earnings and revenues, with earnings showing healthy gains, largely due to cost containment, while revenue growth lagged. With few cost cuts seemingly left to be made, companies appear to be starting to utilize their healthy balance sheets to focus on organic growth, and we expect that will drive corporate spending higher. In fact, we anticipate the U.S. economy should expand nicely over the next 12 to 18 months and that the markets should benefit from this flow of capital. While excess cash has largely been directed toward acquisitions, increasing dividends, and/or stock buybacks recently, we believe this shift in corporate spending has the potential to reward shareholders over the longer term. One of the key criteria we use in the stock selection process for the Fund is return on total capital, which is essentially a profitability ratio that measures a return on investment. What it really indicates is how successfully a company turns capital into profits. We believe companies are now shifting towards organic growth via capital expenditure plans and that they are very well positioned to do so. We are pleased that the companies selected for inclusion in the Fund’s portfolio through our stock selection methodology appear to be leading their respective industries in creating value for their shareholders.
We believe the attractiveness of equity prices coupled with an extremely low interest rate environment have many investors seeking high quality, dividend-paying growth companies (note that 46 out of the 50 stocks within the portfolio pay a dividend). In our view, investing in growth companies that pay a dividend can provide an exciting potential to generate current income, coupled with the potential price appreciation of the stock.
The Russell 1000® Index and the S&P 500 Index are unmanaged indices commonly used to measure the performance of U.S. stocks. You cannot invest directly in an index. Performance data for an index does not reflect any deductions for fees, expenses or taxes. The Fund may invest in medium-capitalization companies, which may have more limited liquidity and greater price volatility than large-capitalization companies. Fund holdings and sector allocations are subject to change. Please refer to the Schedule of Investments included in this report for additional portfolio information.
Each Morningstar category average represents a universe of funds with similar investment objectives. © Morningstar, Inc. All Rights Reserved. The information contained herein: 1) is proprietary to Morningstar; 2) may not be copied or distributed and 3) is not warranted to be accurate, complete or timely. Neither Morningstar nor its content providers are responsible for any damages or losses arising from any use of this information. Past performance does not guarantee future results.
HENNESSY FUNDS 1-800-966-4354
Schedule of Investments
HENNESSY CORNERSTONE LARGE GROWTH FUND
As of April 30, 2014 (Unaudited)
(% of Net Assets)
| | TOP TEN HOLDINGS (EXCLUDING CASH/CASH EQUIVALENTS) | % NET ASSETS |
| | Delta Air Lines, Inc. | 2.24% |
| | Halliburton Co. | 2.23% |
| | SanDisk Corp. | 2.19% |
| | Lorillard, Inc. | 2.12% |
| | Kroger Co. | 2.09% |
| | Caterpillar, Inc. | 2.09% |
| | Hewlett-Packard Co. | 2.07% |
| | Eli Lilly & Co. | 2.05% |
| | Union Pacific Corp. | 2.02% |
| | AutoZone, Inc. | 2.01% |
Note: For presentation purposes, the Fund has grouped some of the industry categories. For purposes of categorizing securities for compliance with Section 8(b)(1) of the Investment Company Act of 1940, the Fund uses more specific industry classifications.
| | COMMON STOCKS – 94.41% | | Number | | | | | | % of | |
| | | | of Shares | | | Value | | | Net Assets | |
| | Consumer Discretionary – 17.48% | | | | | | | | | |
| | AutoZone, Inc. (a) | | | 4,400 | | | $ | 2,349,116 | | | | 2.01 | % |
| | Bed Bath & Beyond, Inc. (a) | | | 25,800 | | | | 1,602,954 | | | | 1.37 | % |
| | Coach, Inc. | | | 36,900 | | | | 1,647,585 | | | | 1.41 | % |
| | DIRECTV (a) | | | 30,100 | | | | 2,335,760 | | | | 2.00 | % |
| | Dollar General Corp. (a) | | | 34,000 | | | | 1,918,960 | | | | 1.64 | % |
| | Ford Motor Co. | | | 133,800 | | | | 2,160,870 | | | | 1.85 | % |
| | Lowes Companies, Inc. | | | 42,400 | | | | 1,946,584 | | | | 1.67 | % |
| | Macy’s, Inc. | | | 38,800 | | | | 2,228,284 | | | | 1.91 | % |
| | McDonald’s Corp. | | | 21,500 | | | | 2,179,670 | | | | 1.86 | % |
| | The Gap, Inc. | | | 52,500 | | | | 2,063,250 | | | | 1.76 | % |
| | | | | | | | | 20,433,033 | | | | 17.48 | % |
| | | | | | | | | | | | | | |
| | Consumer Staples – 19.03% | | | | | | | | | | | | |
| | Altria Group, Inc. | | | 55,000 | | | | 2,206,050 | | | | 1.89 | % |
| | General Mills, Inc. | | | 42,100 | | | | 2,232,142 | | | | 1.91 | % |
| | Kimberly Clark Corp. | | | 19,900 | | | | 2,233,775 | | | | 1.91 | % |
| | Kraft Foods Group, Inc. | | | 38,800 | | | | 2,206,168 | | | | 1.89 | % |
| | Kroger Co. | | | 53,100 | | | | 2,444,724 | | | | 2.09 | % |
| | Lorillard, Inc. | | | 41,700 | | | | 2,477,814 | | | | 2.12 | % |
| | Pepsico, Inc. | | | 25,200 | | | | 2,164,428 | | | | 1.85 | % |
| | Philip Morris International, Inc. | | | 24,300 | | | | 2,075,949 | | | | 1.78 | % |
| | Sysco Corp. | | | 57,600 | | | | 2,098,368 | | | | 1.79 | % |
| | Wal-Mart Stores, Inc. | | | 26,400 | | | | 2,104,344 | | | | 1.80 | % |
| | | | | | | | | 22,243,762 | | | | 19.03 | % |
| | | | | | | | | | | | | | |
| | Energy – 13.37% | | | | | | | | | | | | |
| | Chevron Corp. | | | 16,700 | | | | 2,096,184 | | | | 1.79 | % |
| | ConocoPhillips | | | 29,700 | | | | 2,207,007 | | | | 1.89 | % |
| | Exxon Mobil Corp. | | | 20,900 | | | | 2,140,369 | | | | 1.83 | % |
| | Halliburton Co. | | | 41,400 | | | | 2,611,098 | | | | 2.23 | % |
| | HollyFrontier Corp. | | | 42,100 | | | | 2,214,039 | | | | 1.90 | % |
| | Marathon Oil Corp. | | | 60,100 | | | | 2,172,615 | | | | 1.86 | % |
| | Marathon Petroleum Corp. | | | 23,500 | | | | 2,184,325 | | | | 1.87 | % |
| | | | | | | | | 15,625,637 | | | | 13.37 | % |
| | | | | | | | | | | | | | |
| | Health Care – 5.69% | | | | | | | | | | | | |
| | Baxter International, Inc. | | | 29,975 | | | | 2,181,880 | | | | 1.87 | % |
The accompanying notes are an integral part of these financial statements.
HENNESSY FUNDS 1-800-966-4354
| | COMMON STOCKS | | Number | | | | | | % of | |
| | | | of Shares | | | Value | | | Net Assets | |
| | Health Care (Continued) | | | | | | | | | |
| | Eli Lilly & Co. | | | 40,600 | | | $ | 2,399,460 | | | | 2.05 | % |
| | UnitedHealth Group, Inc. | | | 27,600 | | | | 2,071,104 | | | | 1.77 | % |
| | | | | | | | | 6,652,444 | | | | 5.69 | % |
| | | | | | | | | | | | | | |
| | Industrials – 21.32% | | | | | | | | | | | | |
| | Caterpillar, Inc. | | | 23,100 | | | | 2,434,740 | | | | 2.09 | % |
| | CSX Corp. | | | 73,000 | | | | 2,060,060 | | | | 1.76 | % |
| | Cummins, Inc. | | | 14,900 | | | | 2,247,665 | | | | 1.92 | % |
| | Deere & Co. | | | 22,900 | | | | 2,137,486 | | | | 1.83 | % |
| | Delta Air Lines, Inc. | | | 71,000 | | | | 2,614,930 | | | | 2.24 | % |
| | Illinois Tool Works, Inc. | | | 24,800 | | | | 2,113,704 | | | | 1.81 | % |
| | Lockheed Martin Corp. | | | 14,100 | | | | 2,314,374 | | | | 1.98 | % |
| | Northrop Grumman Corp. | | | 18,300 | | | | 2,223,633 | | | | 1.90 | % |
| | Raytheon Co. | | | 23,400 | | | | 2,234,232 | | | | 1.91 | % |
| | Union Pacific Corp. | | | 12,400 | | | | 2,361,332 | | | | 2.02 | % |
| | United Technologies Corp. | | | 18,400 | | | | 2,177,272 | | | | 1.86 | % |
| | | | | | | | | 24,919,428 | | | | 21.32 | % |
| | | | | | | | | | | | | | |
| | Information Technology – 15.65% | | | | | | | | | | | | |
| | Apple, Inc. | | | 3,850 | | | | 2,271,847 | | | | 1.94 | % |
| | Hewlett-Packard Co. | | | 73,200 | | | | 2,419,992 | | | | 2.07 | % |
| | Intel Corp. | | | 80,500 | | | | 2,148,545 | | | | 1.84 | % |
| | International Business Machines Corp. | | | 11,100 | | | | 2,180,817 | | | | 1.86 | % |
| | Microsoft Corp. | | | 56,200 | | | | 2,270,480 | | | | 1.94 | % |
| | Oracle Corp. | | | 55,200 | | | | 2,256,576 | | | | 1.93 | % |
| | SanDisk Corp. | | | 30,100 | | | | 2,557,597 | | | | 2.19 | % |
| | Western Digital Corp. | | | 24,900 | | | | 2,194,437 | | | | 1.88 | % |
| | | | | | | | | 18,300,291 | | | | 15.65 | % |
| | | | | | | | | | | | | | |
| | Materials – 1.87% | | | | | | | | | | | | |
| | CF Industries Holdings, Inc. | | | 8,900 | | | | 2,182,013 | | | | 1.87 | % |
| | | | | | | | | | | | | | |
| | Total Common Stocks | | | | | | | | | | | | |
| | (Cost $88,298,786) | | | | | | | 110,356,608 | | | | 94.41 | % |
The accompanying notes are an integral part of these financial statements.
| | SHORT-TERM INVESTMENTS – 3.48% | | Number | | | | | | % of | |
| | | | of Shares | | | Value | | | Net Assets | |
| | Money Market Funds – 3.48% | | | | | | | | | |
| | Fidelity Government Portfolio – | | | | | | | | | |
| | Institutional Class, 0.01% (b) | | | 4,067,705 | | | $ | 4,067,705 | | | | 3.48 | % |
| | | | | | | | | | | | | | |
| | Total Money Market Funds | | | | | | | | | | | | |
| | (Cost $4,067,705) | | | | | | | 4,067,705 | | | | 3.48 | % |
| | | | | | | | | | | | | | |
| | Total Short-Term Investments | | | | | | | | | | | | |
| | (Cost $4,067,705) | | | | | | | 4,067,705 | | | | 3.48 | % |
| | | | | | | | | | | | | | |
| | Total Investments | | | | | | | | | | | | |
| | (Cost $92,366,491) – 97.89% | | | | | | | 114,424,313 | | | | 97.89 | % |
| | Other Assets in Excess | | | | | | | | | | | | |
| | of Liabilities – 2.11% | | | | | | | 2,465,060 | | | | 2.11 | % |
| | TOTAL NET ASSETS – 100.00% | | | | | | $ | 116,889,373 | | | | 100.00 | % |
Percentages are stated as a percent of net assets.
| (a) | Non-income producing security. |
| (b) | The rate listed is the fund’s 7-day yield as of April 30, 2014. |
Summary of Fair Value Exposure at April 30, 2014
The following is a summary of the inputs used to value the Fund’s net assets as of April 30, 2014 (See Note 3 in the accompanying notes to the financial statements):
| Common Stock | | Level 1 | | | Level 2 | | | Level 3 | | | Total | |
| Consumer Discretionary | | $ | 20,433,033 | | | $ | — | | | $ | — | | | $ | 20,433,033 | |
| Consumer Staples | | | 22,243,762 | | | | — | | | | — | | | | 22,243,762 | |
| Energy | | | 15,625,637 | | | | — | | | | — | | | | 15,625,637 | |
| Health Care | | | 6,652,444 | | | | — | | | | — | | | | 6,652,444 | |
| Industrials | | | 24,919,428 | | | | — | | | | — | | | | 24,919,428 | |
| Information Technology | | | 18,300,291 | | | | — | | | | — | | | | 18,300,291 | |
| Materials | | | 2,182,013 | | | | — | | | | — | | | | 2,182,013 | |
| Total Common Stock | | $ | 110,356,608 | | | $ | — | | | $ | — | | | $ | 110,356,608 | |
| Short-Term Investments | | | | | | | | | | | | | | | | |
| Money Market Funds | | $ | 4,067,705 | | | $ | — | | | $ | — | | | $ | 4,067,705 | |
| Total Short-Term Investments | | $ | 4,067,705 | | | $ | — | | | $ | — | | | $ | 4,067,705 | |
| Total Investments | | $ | 114,424,313 | | | $ | — | | | $ | — | | | $ | 114,424,313 | |
Transfers between levels are recognized at the end of the reporting period. During the six-month period ended April 30, 2014, the Fund recognized no transfers between levels.
The accompanying notes are an integral part of these financial statements.
HENNESSY FUNDS 1-800-966-4354
Financial Statements
Statement of Assets and Liabilities as of April 30, 2014 (Unaudited) |
| ASSETS: | | | |
| Investments in securities, at value (cost $92,366,491) | | $ | 114,424,313 | |
| Dividends and interest receivable | | | 81,349 | |
| Receivable for fund shares sold | | | 2,528,381 | |
| Prepaid expenses and other assets | | | 17,616 | |
| Total Assets | | | 117,051,659 | |
| | | | | |
| LIABILITIES: | | | | |
| Payable for fund shares redeemed | | | 15,200 | |
| Payable to advisor | | | 68,568 | |
| Payable to administrator | | | 35,997 | |
| Payable to auditor | | | 13,698 | |
| Accrued service fees | | | 7,871 | |
| Accrued interest payable | | | 70 | |
| Accrued trustees fees | | | 4,705 | |
| Accrued expenses and other payables | | | 16,177 | |
| Total Liabilities | | | 162,286 | |
| NET ASSETS | | $ | 116,889,373 | |
| | | | | |
| NET ASSETS CONSIST OF: | | | | |
| Capital stock | | $ | 81,062,020 | |
| Accumulated net investment income | | | 545,331 | |
| Accumulated net realized gain on investments | | | 13,224,200 | |
| Unrealized net appreciation on investments | | | 22,057,822 | |
| Total Net Assets | | $ | 116,889,373 | |
| | | | | |
| NET ASSETS | | | | |
| Investor Class: | | | | |
| Shares authorized (no par value) | | Unlimited | |
| Net assets applicable to outstanding Investor Class shares | | | 97,926,420 | |
| Shares issued and outstanding | | | 6,807,249 | |
| Net asset value, offering price and redemption price per share | | $ | 14.39 | |
| | | | | |
| Institutional Class: | | | | |
| Shares authorized (no par value) | | Unlimited | |
| Net assets applicable to outstanding Institutional Class shares | | | 18,962,953 | |
| Shares issued and outstanding | | | 1,307,178 | |
| Net asset value, offering price and redemption price per share | | $ | 14.51 | |
The accompanying notes are an integral part of these financial statements.
Financial Statements
Statement of Operations Six Months Ended April 30, 2014 (Unaudited) |
| INVESTMENT INCOME: | | | |
| Dividend income | | $ | 1,166,055 | |
| Interest income | | | 189 | |
| Total investment income | | | 1,166,244 | |
| | | | | |
| EXPENSES: | | | | |
| Investment advisory fees | | | 399,157 | |
| Administration, fund accounting, custody and transfer agent fees | | | 107,880 | |
| Service fees – Investor Class (See Note 5) | | | 45,745 | |
| Federal and state registration fees | | | 17,901 | |
| Sub-transfer agent expenses – Investor Class (See Note 5) | | | 14,411 | |
| Sub-transfer agent expenses – Institutional Class (See Note 5) | | | 4,924 | |
| Compliance expense | | | 10,655 | |
| Audit fees | | | 8,855 | |
| Trustees’ fees and expenses | | | 7,289 | |
| Reports to shareholders | | | 5,852 | |
| Legal fees | | | 2,480 | |
| Other expenses | | | 6,489 | |
| Total expenses before waiver | | | 631,638 | |
| Administration expense waiver (See Note 5) | | | (10,725 | ) |
| Net expenses | | | 620,913 | |
| NET INVESTMENT INCOME | | $ | 545,331 | |
| | | | | |
| REALIZED AND UNREALIZED GAINS (LOSSES): | | | | |
| Net realized gain on investments | | $ | 16,269,997 | |
| Change in unrealized appreciation on investments | | | (3,817,772 | ) |
| Net gain on investments | | | 12,452,225 | |
| NET INCREASE IN NET ASSETS RESULTING FROM OPERATIONS | | $ | 12,997,556 | |
The accompanying notes are an integral part of these financial statements.
HENNESSY FUNDS 1-800-966-4354
(This Page Intentionally Left Blank.)
Financial Statements
| Statements of Changes in Net Assets |
| | | Six Months Ended | | | | |
| | | April 30, 2014 | | | Year Ended | |
| | | (Unaudited) | | | October 31, 2013 | |
| OPERATIONS: | | | | | | |
| Net investment income | | $ | 545,331 | | | $ | 1,194,449 | |
| Net realized gain on securities | | | 16,269,997 | | | | 6,201,807 | |
| Change in unrealized appreciation (depreciation) on securities | | | (3,817,772 | ) | | | 17,304,019 | |
| Net increase in net assets resulting from operations | | | 12,997,556 | | | | 24,700,275 | |
| | | | | | | | | |
| DISTRIBUTIONS TO SHAREHOLDERS FROM: | | | | | | | | |
| Net investment income | | | | | | | | |
| Investor Class | | | (985,143 | ) | | | (719,396 | ) |
| Institutional Class | | | (209,291 | ) | | | (361,073 | ) |
| Net realized gains | | | | | | | | |
| Investor Class | | | (4,397,057 | ) | | | (117,309 | ) |
| Institutional Class | | | (781,018 | ) | | | (52,078 | ) |
| Total distributions | | | (6,372,509 | ) | | | (1,249,856 | ) |
| | | | | | | | | |
| CAPITAL SHARE TRANSACTIONS: | | | | | | | | |
| Proceeds from shares subscribed – Investor Class | | | 2,125,396 | | | | 1,740,370 | |
| Proceeds from shares subscribed – Institutional Class | | | 2,651,544 | | | | 815,827 | |
| Dividends reinvested – Investor Class | | | 5,021,319 | | | | 780,066 | |
| Dividends reinvested – Institutional Class | | | 949,886 | | | | 406,311 | |
| Cost of shares redeemed – Investor Class | | | (3,615,427 | ) | | | (8,522,055 | ) |
| Cost of shares redeemed – Institutional Class | | | (1,828,759 | )(1) | | | (23,485,757 | ) |
| Net increase (decrease) in net assets derived | | | | | | | | |
| from capital share transactions | | | 5,303,959 | | | | (28,265,238 | ) |
| TOTAL INCREASE (DECREASE) IN NET ASSETS | | | 11,929,006 | | | | (4,814,819 | ) |
| | | | | | | | | |
| NET ASSETS: | | | | | | | | |
| Beginning of period | | | 104,960,367 | | | | 109,775,186 | |
| End of period | | $ | 116,889,373 | | | $ | 104,960,367 | |
| Undistributed net investment income, end of period | | $ | 545,331 | | | $ | 1,194,434 | |
| | | | | | | | | |
| CHANGES IN SHARES OUTSTANDING: | | | | | | | | |
| Shares sold – Investor Class | | | 151,883 | | | | 149,494 | |
| Shares sold – Institutional Class | | | 187,576 | | | | 68,395 | |
| Shares issued to holders as reinvestment | | | | | | | | |
| of dividends – Investor Class | | | 375,434 | | | | 72,353 | |
| Shares issued to holders as reinvestment | | | | | | | | |
| of dividends – Institutional Class | | | 70,320 | | | | 37,405 | |
| Shares redeemed – Investor Class | | | (264,468 | ) | | | (720,532 | ) |
| Shares redeemed – Institutional Class | | | (133,936 | ) | | | (2,050,571 | ) |
| Net increase (decrease) in shares outstanding | | | 386,809 | | | | (2,443,456 | ) |
| (1) | Net of redemption fees of $3 related to redemption fees imposed by the FBR Large Cap Fund (which was reorganized into the Fund) during a prior year but not received until the six-month period ended April 30, 2014. |
The accompanying notes are an integral part of these financial statements.
HENNESSY FUNDS 1-800-966-4354
Financial Highlights
| Hennessy Cornerstone Large Growth Fund |
For an Investor Class share outstanding throughout each period
| | | Six Months Ended | |
| | | April 30, 2014 | |
| | | (Unaudited) | |
| PER SHARE DATA: | | | |
| Net asset value, beginning of period | | $ | 13.56 | |
| | | | | |
| Income from investment operations: | | | | |
| Net investment income | | | 0.06 | |
| Net realized and unrealized gains (losses) on securities | | | 1.59 | |
| Total from investment operations | | | 1.65 | |
| | | | | |
| Less distributions: | | | | |
| Dividends from net investment income | | | (0.14 | ) |
| Dividends from net realized gains | | | (0.68 | ) |
| Total distributions | | | (0.82 | ) |
| Net asset value, end of period | | $ | 14.39 | |
| | | | | |
| TOTAL RETURN | | | 12.70 | %(4) |
| | | | | |
| SUPPLEMENTAL DATA AND RATIOS: | | | | |
| Net assets, end of period (millions) | | $ | 97.93 | |
| Ratio of expenses to average net assets: | | | | |
| Before expense reimbursement/recoupment | | | 1.18 | %(5) |
| After expense reimbursement/recoupment | | | 1.18 | %(5) |
| Ratio of net investment income to average net assets: | | | | |
| Before expense reimbursement/recoupment | | | 0.98 | %(5) |
| After expense reimbursement/recoupment | | | 0.98 | %(5) |
Portfolio turnover rate(6) | | | 49 | %(4) |
| (1) | For the one month ended October 31, 2009. Effective October 31, 2009, the Fund changed its fiscal year end to October 31 from September 30. |
| (2) | The financial highlights set forth for periods prior to March 20, 2009 represent the historical financial highlights of the Tamarack Large Cap Growth Fund, Class S shares. The assets of the Tamarack Large Cap Growth Fund were acquired by the Hennessy Cornerstone Large Growth Fund on March 20, 2009. At the time, RBC Global Asset Management (U.S.), Inc. (formerly known as Voyageur Asset Management, Inc.) ceased to be investment advisor and Hennessy Advisors, Inc. became investment advisor. The return of the Tamarack Large Cap Growth Fund, Class S shares during the period October 1, 2008 through March 20, 2009 was (33.30)%. The return of the Hennessy Cornerstone Large Growth Fund, Original Class shares during the period March 20, 2009 through September 30, 2009 was 42.64%. |
| (3) | Amount is less than $0.01 or ($0.01). |
| (4) | Not annualized. |
| (5) | Annualized. |
| (6) | Portfolio turnover is calculated on the basis of the Fund as a whole. |
The accompanying notes are an integral part of these financial statements.
| | | | | | | | | | | | | One Month Ended | | | Year Ended | |
| Year Ended October 31, | | | October 31, | | | September 30, | |
| 2013 | | | 2012 | | | 2011 | | | 2010 | | | 2009(1) | | | 2009(2) | |
| | | | | | | | | | | | | | | | | |
| $ | 10.77 | | | $ | 12.37 | | | $ | 11.70 | | | $ | 9.49 | | | $ | 9.60 | | | $ | 10.09 | |
| | | | | | | | | | | | | | | | | | | | | | | |
| | | | | | | | | | | | | | | | | | | | | | | |
| | 0.14 | | | | 0.13 | | | | 0.09 | | | | 0.09 | | | | 0.00 | (3) | | | 0.05 | |
| | 2.77 | | | | 0.80 | | | | 0.69 | | | | 2.17 | | | | (0.11 | ) | | | (0.54 | ) |
| | 2.91 | | | | 0.93 | | | | 0.78 | | | | 2.26 | | | | (0.11 | ) | | | (0.49 | ) |
| | | | | | | | | | | | | | | | | | | | | | | |
| | | | | | | | | | | | | | | | | | | | | | | |
| | (0.10 | ) | | | (0.07 | ) | | | (0.09 | ) | | | (0.05 | ) | | | — | | | | — | |
| | (0.02 | ) | | | (2.46 | ) | | | (0.02 | ) | | | — | | | | — | | | | — | |
| | (0.12 | ) | | | (2.53 | ) | | | (0.11 | ) | | | (0.05 | ) | | | — | | | | — | |
| $ | 13.56 | | | $ | 10.77 | | | $ | 12.37 | | | $ | 11.70 | | | $ | 9.49 | | | $ | 9.60 | |
| | | | | | | | | | | | | | | | | | | | | | | |
| | 27.32 | % | | | 9.14 | % | | | 6.70 | % | | | 23.88 | % | | | (1.15 | )%(4) | | | (4.86 | )% |
| | | | | | | | | | | | | | | | | | | | | | | |
| | | | | | | | | | | | | | | | | | | | | | | |
| $ | 88.77 | | | $ | 75.83 | | | $ | 77.88 | | | $ | 78.83 | | | $ | 69.41 | | | $ | 70.61 | |
| | | | | | | | | | | | | | | | | | | | | | | |
| | 1.19 | % | | | 1.27 | % | | | 1.26 | % | | | 1.30 | % | | | 1.26 | %(5) | | | 1.40 | % |
| | 1.19 | % | | | 1.27 | % | | | 1.30 | % | | | 1.30 | % | | | 1.30 | %(5) | | | 1.17 | % |
| | | | | | | | | | | | | | | | | | | | | | | |
| | 1.10 | % | | | 1.35 | % | | | 0.72 | % | | | 0.84 | % | | | (0.01 | )%(5) | | | 0.36 | % |
| | 1.10 | % | | | 1.35 | % | | | 0.68 | % | | | 0.84 | % | | | (0.05 | )%(5) | | | 0.59 | % |
| | 73 | % | | | 0 | % | | | 70 | % | | | 83 | % | | | 0 | %(4) | | | 116 | % |
The accompanying notes are an integral part of these financial statements.
HENNESSY FUNDS 1-800-966-4354
Financial Highlights
| Hennessy Cornerstone Large Growth Fund |
For an Institutional Class share outstanding throughout each period
| | | Six Months Ended | |
| | | April 30, 2014 | |
| | | (Unaudited) | |
| PER SHARE DATA: | | | |
| Net asset value, beginning of period | | $ | 13.68 | |
| | | | | |
| Income from investment operations: | | | | |
| Net investment income | | | 0.09 | |
| Net realized and unrealized gains (losses) on securities | | | 1.59 | |
| Total from investment operations | | | 1.68 | |
| | | | | |
| Less distributions: | | | | |
| Dividends from net investment income | | | (0.17 | ) |
| Dividends from net realized gains | | | (0.68 | ) |
| Total distributions | | | (0.85 | ) |
| Net asset value, end of period | | $ | 14.51 | |
| | | | | |
| TOTAL RETURN | | | 12.81 | %(4) |
| | | | | |
| SUPPLEMENTAL DATA AND RATIOS: | | | | |
| Net assets, end of period (millions) | | $ | 18.96 | |
| Ratio of expenses to average net assets: | | | | |
| Before expense reimbursement | | | 1.11 | %(5) |
| After expense reimbursement | | | 0.98 | %(5) |
| Ratio of net investment income to average net assets: | | | | |
| Before expense reimbursement | | | 1.06 | %(5) |
| After expense reimbursement | | | 1.19 | %(5) |
Portfolio turnover rate(6) | | | 49 | %(4) |
| (1) | For the one month ended October 31, 2009. Effective October 31, 2009, the Fund changed its fiscal year end to October 31 from September 30. |
| (2) | Institutional Class shares commenced operations on March 20, 2009. |
| (3) | Amount is less than $0.01 or ($0.01). |
| (4) | Not annualized. |
| (5) | Annualized. |
| (6) | Portfolio turnover is calculated on the basis of the Fund as a whole. |
The accompanying notes are an integral part of these financial statements.
| | | | | | | | | | | | | One Month Ended | | | Period Ended | |
| Year Ended October 31, | | | October 31, | | | September 30, | |
| 2013 | | | 2012 | | | 2011 | | | 2010 | | | 2009(1) | | | 2009(2) | |
| | | | | | | | | | | | | | | | | |
| $ | 10.85 | | | $ | 12.44 | | | $ | 11.76 | | | $ | 9.51 | | | $ | 9.61 | | | $ | 6.73 | |
| | | | | | | | | | | | | | | | | | | | | | | |
| | | | | | | | | | | | | | | | | | | | | | | |
| | 0.09 | | | | 0.07 | | | | 0.08 | | | | 0.10 | | | | 0.00 | (3) | | | 0.03 | |
| | 2.88 | | | | 0.89 | | | | 0.74 | | | | 2.20 | | | | (0.10 | ) | | | 2.85 | |
| | 2.97 | | | | 0.96 | | | | 0.82 | | | | 2.30 | | | | (0.10 | ) | | | 2.88 | |
| | | | | | | | | | | | | | | | | | | | | | | |
| | | | | | | | | | | | | | | | | | | | | | | |
| | (0.12 | ) | | | (0.09 | ) | | | (0.12 | ) | | | (0.05 | ) | | | — | | | | — | |
| | (0.02 | ) | | | (2.46 | ) | | | (0.02 | ) | | | — | | | | — | | | | — | |
| | (0.14 | ) | | | (2.55 | ) | | | (0.14 | ) | | | (0.05 | ) | | | — | | | | — | |
| $ | 13.68 | | | $ | 10.85 | | | $ | 12.44 | | | $ | 11.76 | | | $ | 9.51 | | | $ | 9.61 | |
| | | | | | | | | | | | | | | | | | | | | | | |
| | 27.63 | % | | | 9.43 | % | | | 6.99 | % | | | 24.26 | % | | | (1.04 | )%(4) | | | 42.79 | %(4) |
| | | | | | | | | | | | | | | | | | | | | | | |
| | | | | | | | | | | | | | | | | | | | | | | |
| $ | 16.19 | | | $ | 33.94 | | | $ | 0.14 | | | $ | 0.07 | | | $ | 0.04 | | | $ | 0.04 | |
| | | | | | | | | | | | | | | | | | | | | | | |
| | 1.10 | % | | | 1.41 | % | | | 1.14 | % | | | 1.16 | % | | | 1.14 | %(5) | | | 16.51 | %(5) |
| | 0.98 | % | | | 0.98 | % | | | 0.98 | % | | | 0.98 | % | | | 0.98 | %(5) | | | 0.98 | %(5) |
| | | | | | | | | | | | | | | | | | | | | | | |
| | 1.38 | % | | | 6.44 | % | | | 0.81 | % | | | 0.90 | % | | | 0.12 | %(5) | | | (14.54 | )%(5) |
| | 1.50 | % | | | 6.87 | % | | | 0.97 | % | | | 1.08 | % | | | 0.28 | %(5) | | | 0.99 | %(5) |
| | 73 | % | | | 0 | % | | | 70 | % | | | 83 | % | | | 0 | %(4) | | | 116 | %(4) |
The accompanying notes are an integral part of these financial statements.
HENNESSY FUNDS 1-800-966-4354
Notes to the Financial Statements
April 30, 2014 (Unaudited)
1). ORGANIZATION
The Hennessy Cornerstone Large Growth Fund (the “Fund”) is a series of Hennessy Funds Trust (the “Trust”), which was organized as a Delaware statutory trust on September 17, 1992. The Fund is an open-end management investment company registered under the Investment Company Act of 1940, as amended. The investment objective of the Fund is long-term growth of capital. The Fund is a diversified fund.
The Fund offers Investor Class and Institutional Class shares. Prior to October 26, 2012, the Investor Class shares were known as Original Class shares. Each class of shares differs principally in its respective administration, 12b-1 distribution and service fees, shareholder servicing, and transfer agent expenses and sales charges, if any. Each class has identical rights to earnings, assets, and voting privileges, except for class-specific expenses and exclusive rights to vote on matters affecting only individual classes.
2). SIGNIFICANT ACCOUNTING POLICIES
The following is a summary of significant accounting policies consistently followed by the Fund in the preparation of the financial statements. These policies are in conformity with U.S. generally accepted accounting principles (“GAAP”).
| a). | Investment Valuation – All investments in securities are recorded at their estimated fair value, as described in Note 3. |
| b). | Federal Income Taxes – Provision for Federal income taxes or excise taxes has not been made since the Fund has elected to be taxed as a “regulated investment company” and intends to distribute substantially all of its taxable income to its shareholders and otherwise comply with the provisions of the Internal Revenue Code of 1986, as amended, applicable to regulated investment companies. Net investment income or loss and realized gains and losses for federal income tax purposes may differ from that reported on the financial statements because of temporary book and tax basis differences. Temporary differences are primarily the result of the treatment of wash sales for tax reporting purposes. Distributions from net realized gains for book purposes may include short-term capital gains, which are included as ordinary income to shareholders for tax purposes. |
| c). | Income and Expenses – Dividend income is recognized on the ex-dividend date or as soon as information is available to the Fund. Interest income, which includes the amortization of premium and accretion of discount, is recognized on an accrual basis. The Fund is charged for those expenses that are directly attributable to the portfolio, such as advisory, administration, and certain shareholder service fees. Income, expenses (other than expenses attributable to a specific class), and realized and unrealized gains or losses on investments are allocated to each class of shares based on its respective net assets. |
| d). | Distributions to Shareholders – Dividends from net investment income for the Fund, if any, are declared and paid out annually, usually in November or December. Distributions of net realized capital gains, if any, are declared and paid annually, usually in November or December. |
| e). | Security Transactions – Investment and shareholder transactions are recorded on the trade date. The Fund determines the gain or loss realized from the investment |
| | transactions by comparing the original cost of the security lot sold with the net sale proceeds. Discounts and premiums on securities purchased are accreted/amortized over the life of the respective security. |
| f). | Use of Estimates – The preparation of financial statements in conformity with GAAP requires management to make estimates and assumptions that affect the reported amounts of assets and liabilities and disclosure of contingent assets and liabilities at the date of the financial statements and the reported change in net assets during the reporting period. Actual results could differ from those estimates. |
| g). | Share Valuation – The net asset value (“NAV”) per share of the Fund is calculated by dividing the sum of the value of the securities held by the Fund, plus cash or other assets, minus all liabilities (including estimated accrued expenses) by the total number of shares outstanding for the Fund, rounded to the nearest cent. The Fund’s shares will not be priced on days the New York Stock Exchange is closed for trading. The offering and redemption price per share for the Fund is equal to the Fund’s net asset value per share. |
| h). | Foreign Currency – Values of investments denominated in foreign currencies, if any, are converted into U.S. dollars using the spot market rate of exchange at the time of valuation. Purchases and sales of investments and income are translated into U.S. dollars using the spot market rate of exchange prevailing on the respective dates of such transactions. The Fund does not isolate the portion of the results of operations resulting from fluctuations in foreign exchange rates on investments from fluctuations resulting from changes in the market prices of securities held. Such fluctuations are included with the net realized and unrealized gain or loss on investments. Foreign investments present additional risks due to currency fluctuations, economic and political factors, lower liquidity, government regulations, differences in accounting standards, and other factors. |
| i). | Forward Contracts – The Fund may enter into forward currency contracts to reduce its exposure to changes in foreign currency exchange rates on its foreign holdings and to lock in the U.S. dollar cost of firm purchase and sale commitments for securities denominated in foreign currencies. A forward currency contract is a commitment to purchase or sell a foreign currency at a future date at a negotiated forward rate. The gain or loss arising from the difference between the U.S. dollar cost of the original contract and the value of the foreign currency in U.S. dollars upon closing of such contract is included in net realized gain or loss from foreign currency transactions. During the six months ended April 30, 2014, the Fund did not enter into any forward contracts. |
| j). | Repurchase Agreements – The Fund may enter into repurchase agreements with member banks or security dealers of the Federal Reserve Board whom the investment advisor deems creditworthy. The repurchase price generally equals the price paid by the Fund plus interest negotiated on the basis of current short-term rates. |
| | Securities pledged as collateral for repurchase agreements are held by the custodian bank until the respective agreements mature. Provisions of the repurchase agreements ensure that the market value of the collateral, including accrued interest thereon, is sufficient in the event of default of the counterparty. If the counterparty defaults and the value of the collateral declines or if the counterparty enters an insolvency proceeding, realization of the collateral by the Fund may be delayed or limited. |
| k). | Accounting for Uncertainty in Income Taxes – The Fund has adopted accounting policies regarding recognition and measurement of tax positions taken or expected to be taken on a tax return. The Fund has reviewed all open tax years in major jurisdictions and concluded that there is no impact on the Fund’s net assets and no |
HENNESSY FUNDS 1-800-966-4354
| | tax liability resulting from unrecognized tax benefits relating to uncertain income tax positions taken or expected to be taken on a tax return. The Fund��s major tax jurisdictions are U.S. Federal and Delaware. As of April 30, 2014, open Federal and state tax years for the Fund include the tax years ended October 31, 2011 through 2013. |
| l). | Derivatives – The Fund may invest in, or enter into, derivatives, such as options, futures contracts, options on futures contracts, and swaps, for a variety of reasons, including to hedge certain risks, to provide a substitute for purchasing or selling particular securities, or to increase potential income gain. Derivatives may provide a cheaper, quicker, or more specifically focused way for a Fund to invest than “traditional” securities would. The main purpose of utilizing these derivative instruments is for hedging purposes. |
| | The Fund has adopted the financial accounting reporting rules as required by the Derivatives and Hedging Topic of the Financial Accounting Standards Board Accounting Standards Codification. Under such rules, the Fund is required to include enhanced disclosure that enables investors to understand how and why an entity uses derivatives, how derivatives are accounted for, and how derivatives instruments affect an entity’s results of operations and financial position. During the six months ended April 30, 2014, the Fund did not hold any derivative instruments. |
| m). | Events Subsequent to the Fiscal Period End – The Fund has adopted financial reporting rules regarding subsequent events that require an entity to recognize in the financial statements the effects of all subsequent events that provide additional evidence about conditions that existed at the date of the balance sheet. Management has evaluated the Fund’s related events and transactions that occurred subsequent to April 30, 2014 through the date of issuance of the Fund’s financial statements. There were no events or transactions that occurred during this period that materially impacted the amounts or disclosures in the Fund’s financial statements. |
3). SECURITIES VALUATION
The Fund has adopted authoritative fair valuation accounting standards that establish an authoritative definition of fair value and set out a hierarchy for measuring fair value. These standards require additional disclosures about the various inputs and valuation techniques used to develop the measurements of fair value and a discussion in changes in valuation techniques and related inputs during the period. These inputs are summarized in the three broad levels listed below:
| | Level 1 – | Quoted unadjusted prices for identical instruments in active markets to which the Fund has access at the date of measurement. |
| | Level 2 – | Quoted prices for similar instruments in active markets; quoted prices for identical or similar instruments in markets that are not active; and model-derived valuations in which all significant inputs and significant value drivers are observable in active markets. Level 2 inputs are those in markets for which there are few transactions, the prices are not current, the prices are fair value adjusted due to post-market close subsequent events (foreign markets), little public information exists, or instances where prices vary substantially over time or among brokered market makers. These inputs may also include interest rates, prepayment speeds, credit risk curves, default rates, and similar data. |
| | Level 3 – | Model-derived valuations in which one or more significant inputs or significant value drivers are unobservable. Unobservable inputs are those |
| | | inputs that reflect the Fund’s own assumptions about what market participants would use to price the asset or liability based on the best available information. |
Following is a description of the valuation techniques applied to the Fund’s major categories of assets and liabilities measured at fair value on a recurring basis.
Equity Securities – Equity securities, including common stocks, preferred stocks, foreign issued common stocks, exchange traded funds, closed-end mutual funds, and real estate investment trusts, that are traded on a securities exchange for which a last-quoted sales price is readily available will be valued at the last sales price as reported by the primary exchange on which the securities are listed. Securities listed on The NASDAQ Stock Market (“NASDAQ”) will be valued at the NASDAQ Official Closing Price, which may differ from the last sales price reported. Securities traded on a securities exchange for which a last-quoted sales price is not readily available will be valued at the mean between the bid and ask prices. To the extent these securities are actively traded and valuation adjustments are not applied, they are classified in Level 1 of the fair value hierarchy.
Investment Companies – Investments in investment companies (e.g., mutual funds and exchange traded funds) are generally priced at the ending NAV provided by the Fund’s service agent and will be classified in Level 1 of the fair value hierarchy.
Debt Securities – Debt securities, including corporate bonds, asset-backed securities, mortgage-backed securities, municipal bonds, U.S. Treasuries, and U.S. government agency issues, are valued at market on the basis of valuations furnished by an independent pricing service that utilizes both dealer-supplied valuations and formula-based techniques. The pricing service may consider recently executed transactions in securities of the issuer or comparable issuers, market price quotations (where observable), bond spreads, and fundamental data relating to the issuer. In addition, the model may incorporate market observable data such as reported sales of similar securities, broker quotes, yields, bids, offers, and reference data. Certain securities are valued principally using dealer quotations. These securities are generally classified in Level 2 of the fair value hierarchy.
Short-Term Securities – Short-term equity investments, including money market funds, are valued in the manner specified above. Short-term debt investments are valued at amortized cost, if their original maturity was 60 days or less, or by amortizing the values as of the 61st day prior to maturity, if their original term to maturity exceeded 60 days. Short-term securities are generally classified in Level 1 or Level 2 of the fair market hierarchy depending on the inputs used and market activity levels for specific securities.
The Board of Trustees of the Fund (the “Board”) has adopted fair value pricing procedures that are followed when a price for a security is not readily available or if a significant event has occurred that indicates the closing price of a security no longer represents the true value of that security. Fair value pricing determinations are made in good faith in accordance with these procedures. There are numerous criteria that will be given consideration in determining a fair value of a security. Some of these criteria are trading volume of security and markets, the value of other like securities, and news events with direct bearing to security or market. Fair value pricing results in an estimated price that reasonably reflects the current market conditions in order to rate the portfolio holdings such that shareholder transactions receive a fair net asset value. Depending on the relative significance of the valuation inputs, these securities may be classified in either Level 2 or Level 3 of the fair value hierarchy.
Fair valuing of foreign securities may be determined with the assistance of a pricing service using correlations between the movement of prices of such securities and indices of domestic securities and other appropriate indicators, such as closing market prices of
HENNESSY FUNDS 1-800-966-4354
relevant American Depositary Receipts or futures contracts. The effect of using fair value pricing is that the Fund’s NAV will reflect the affected portfolio securities’ value as determined in the judgment of the Board or its designee instead of being determined by the market. Using a fair value pricing methodology to price foreign securities may result in a value that is different from a foreign security’s most recent closing price and from the prices used by other investment companies to calculate their net asset values and are generally considered Level 2 prices in the fair valuation hierarchy. Because the Fund may invest in foreign securities, the value of the Fund’s portfolio securities may change on days when you will not be able to purchase or redeem your shares.
The Board has delegated day-to-day valuation matters to a Valuation Committee comprised of one or more representatives from Hennessy Advisors, Inc., the Fund’s investment advisor. The function of the Valuation Committee is to value securities where current and reliable market quotations are not readily available. All actions taken by the Valuation Committee are reviewed by the Board.
The Fund has performed an analysis of all existing investments to determine the significance and character of all inputs to their fair value determination. Various inputs are used in determining the value of the Fund’s investments. The inputs or methodology used for valuing securities are not necessarily an indication of the risk associated with investing in those securities. Details related to the fair valuation hierarchy of the Fund’s securities as of April 30, 2014 are included in the Fund’s Schedule of Investments.
4). INVESTMENT TRANSACTIONS
Purchases and sales of investment securities (excluding government and short-term investments) for the Fund during the six months ended April 30, 2014 were $52,053,924 and $57,750,003, respectively.
There were no purchases or sales/maturities of long-term U.S. Government Securities for the Fund during the six months ended April 30, 2014.
5). INVESTMENT MANAGEMENT FEE AND OTHER TRANSACTIONS WITH AFFILIATES
Hennessy Advisors, Inc. (the “Advisor”) is the investment advisor of the Fund. The Advisor provides the Fund with investment management services under an Investment Advisory Agreement. The Advisor furnishes all investment advice, office space, facilities, and provides most of the personnel needed by the Fund. As compensation for its services, the Advisor is entitled to a monthly fee from the Fund. The fee is based upon the average daily net assets of the Fund at the annual rate of 0.74%. The net investment advisory fees payable for the Fund as of April 30, 2014 were $68,568.
The Advisor has agreed to waive its fees and absorb expenses to the extent that the total annual operating expenses (excluding all Federal, state and local taxes, interest, brokerage commissions, acquired fund fees and expenses and other costs incurred in connection with the purchase and sale of securities and extraordinary items) exceed 0.98% of the Fund’s net assets for the Institutional Class shares of the Fund. The expense limitation agreement for the Institutional Class shares can only be terminated by the Board.
For a period of three years after the year in which the Advisor waives or reimburses expenses, the Advisor may seek reimbursement from the Fund to the extent that total annual fund operating expenses are less than the expense limitation in effect at the time of the reimbursement. During the three years ended October 31, 2013, no Advisor fees were waived and therefore no expenses are subject to potential recovery.
The Board has approved a Shareholder Servicing Agreement for the Investor Class shares of the Fund, which was instituted to compensate the Advisor for the non-
investment management services it provides to the Fund. The Shareholder Servicing Agreement provides for a monthly fee paid to the Advisor at an annual rate of 0.10% of the average daily net assets of the Fund attributable to Investor Class shares. Shareholder servicing fees payable for the Fund as of April 30, 2014 were $7,871.
The Fund has entered into agreements with various brokers, dealers, and financial intermediaries in connection with the sale of shares of the Fund. The agreements provide for periodic payments by the Fund to the brokers, dealers, and financial intermediaries for providing certain shareholder maintenance services (sub-transfer agent expenses). These shareholder services include the pre-processing and quality control of new accounts, shareholder correspondence, answering customer inquiries regarding account status, and facilitating shareholder telephone transactions. Fees paid by the Fund to various brokers, dealers, and financial intermediaries for the six months ended April 30, 2014 were $19,335.
U.S. Bancorp Fund Services, LLC (“USBFS”) provides the Fund with administrative, fund accounting, and transfer agent services, including all regulatory reporting, and necessary office equipment and personnel. As administrator, USBFS prepares various federal and state regulatory filings, reports, and returns for the Fund; prepares reports and materials to be supplied to the Board; monitors the activities of the Fund’s custodian, transfer agent, and accountants; and coordinates the preparation and payment of the Fund’s expenses and reviews the Fund’s expense accruals. Fees paid to USBFS for the six months ended April 30, 2014 were $97,155.
USBFS has voluntarily waived all or a portion of its fees allocated to the Institutional Class shares of the Fund. The administration fees voluntarily waived by USBFS during the six months ended April 30, 2014 were $10,725.
U.S. Bank, N.A., an affiliate of USBFS, serves as the Fund’s custodian. Quasar Distributors, LLC acts as the Fund’s principal underwriter in a continuous public offering of the Fund’s shares. Quasar Distributors, LLC is an affiliate of USBFS and U.S. Bank, N.A.
6). LINE OF CREDIT
The Fund has a line of credit with the other funds in the Hennessy Funds family of funds (the “Hennessy Funds”) in the amount of the lesser of (i) $100,000,000 or (ii) 33.33% of each Hennessy Fund’s net assets, or 30% for the Hennessy Gas Utility Index Fund and 10% for the Hennessy Balanced Fund, intended to provide short-term financing, if necessary, subject to certain restrictions, in connection with shareholder redemptions. The credit facility is with the Hennessy Funds’ custodian bank, U.S. Bank, N.A. Borrowings under this arrangement bear interest at the bank’s prime rate. During the six months ended April 30, 2014, the Fund did not have any borrowings outstanding under the line of credit.
7). FEDERAL TAX INFORMATION
As of October 31, 2013, the Fund’s most recent fiscal year end, the components of accumulated earnings (losses) for income tax purposes for the Fund were as follows:
| | Cost of investments for tax purposes | | $ | 79,154,555 | |
| | Gross tax unrealized appreciation | | $ | 26,254,879 | |
| | Gross tax unrealized depreciation | | | (379,285 | ) |
| | Net tax unrealized appreciation/depreciation | | $ | 25,875,594 | |
| | Undistributed ordinary income | | $ | 1,205,676 | |
| | Undistributed long-term capital gains | | | 5,166,795 | |
| | Total distributable earnings | | $ | 6,372,471 | |
| | Other accumulated gain (loss) | | $ | (3,045,759 | ) |
| | Total accumulated gain (loss) | | $ | 29,202,306 | |
HENNESSY FUNDS 1-800-966-4354
The difference between book-basis and tax-basis unrealized appreciation is attributable primarily to capital loss carry overs, wash sales, and partnership adjustments.
At October 31, 2013, the Fund’s most recent fiscal year end, the Fund had capital loss carryforwards that expire as follows:
During the year ended October 31, 2013, the Fund’s most recent fiscal year end, the capital loss carry forwards utilized for the Fund were $1,015,253.
Capital losses sustained in the year ended October 31, 2012 and in future taxable years will not expire and may be carried over by the Fund without limitation; however, they will retain the character of the original loss. Furthermore, any losses incurred during those taxable years will be required to be utilized prior to the losses incurred in the pre-enactment taxable years. As a result of this ordering rule, pre-enactment capital loss carryforwards may be more likely to expire unused. Under pre-enactment law, capital losses could be carried forward for eight years, and carried forward as short-term capital losses, irrespective of the character of the original loss.
At October 31, 2013, the Fund did not defer, on a tax basis, any post-December late year ordinary loss deferrals or post-December loss deferrals.
The tax character of distributions paid during fiscal year 2014 (year-to-date) and fiscal year 2013 for the Fund were as follows:
| | | | Six Months Ended | | | Year Ended | |
| | | | April 30, 2014 | | | October 31, 2013 | |
| | Ordinary income | | $ | 1,205,687 | | | $ | 1,080,469 | |
| | Long-term capital gain | | | 5,166,822 | | | | 169,387 | |
| | | | $ | 6,372,509 | | | $ | 1,249,856 | |
Expense Example (Unaudited)
April 30, 2014
As a shareholder of the Fund, you incur two types of costs: (1) transaction costs, including sales charges (loads) on purchase payments, reinvested dividends, or other distributions; redemption fees; and exchange fees; and (2) ongoing costs, including management fees; service fees; and other Fund expenses. This Example is intended to help you understand your ongoing costs (in dollars) of investing in the Fund and to compare these costs with the ongoing costs of investing in other mutual funds. The Example is based on an investment of $1,000 invested at the beginning of the period and held for the entire period from November 1, 2013 through April 30, 2014.
Actual Expenses
The first line of the table below under the “Investor Class” and “Institutional Class” headings provides information about actual account values and actual expenses. Although the Fund charges no sales loads or transaction fees, you will be assessed fees for outgoing wire transfers, returned checks and stop payment orders at prevailing rates charged by U.S. Bancorp Fund Services, LLC, the Fund’s transfer agent. If you request that a redemption be made by wire transfer, currently a $15.00 fee is charged by the Fund’s transfer agent. IRA accounts will be charged a $15.00 annual maintenance fee. The example below includes, but is not limited to, management fees, shareholder servicing fees, fund accounting, custody, and transfer agent fees. However, the example below does not include portfolio trading commissions and related expenses, and other extraordinary expenses as determined under generally accepted accounting principles. You may use the information in this line, together with the amount you invested, to estimate the expenses that you paid over the period. Simply divide your account value by $1,000 (for example, an $8,600 account value divided by $1,000 = 8.6), then multiply the result by the number in the first line of the table under the “Investor Class” and “Institutional Class” headings in the column entitled “Expenses Paid During Period” to estimate the expenses you paid on your account during this period.
Hypothetical Example for Comparison Purposes
The second line of the table below under the “Investor Class” and “Institutional Class” headings provides information about hypothetical account values and hypothetical expenses based on the Fund’s actual expense ratios and an assumed rate of return of 5% per year before expenses, which is not the Fund’s actual return. The hypothetical account values and expenses may not be used to estimate the actual ending account balance or expenses you paid for the period. You may use this information to compare the ongoing costs of investing in the Fund and other funds. To do so, compare this 5% hypothetical example with the 5% hypothetical examples that appear in the shareholder reports of the other funds. Please note that the expenses shown in the table are meant to highlight your ongoing costs only and do not reflect any transactional costs, such as sales charges (loads), or exchange fees. Therefore, the second line of the table under the “Investor Class” and “Institutional Class” headings is useful in comparing ongoing costs only, and will not help you determine the relative total costs of owning different funds. In addition, if these transactional costs were included, your costs would have been higher.
HENNESSY FUNDS 1-800-966-4354
| | | | Expenses Paid |
| | Beginning | Ending | During Period(1) |
| | Account Value | Account Value | November 1, 2013 – |
| | November 1, 2013 | April 30, 2014 | April 30, 2014 |
| Investor Class | | | |
| | | | |
| Actual | $1,000.00 | $1,127.00 | $6.22 |
| | | | |
| Hypothetical (5% return | | | |
| before expenses) | $1,000.00 | $1,018.94 | $5.91 |
| | | | |
| Institutional Class | | | |
| | | | |
| Actual | $1,000.00 | $1,128.10 | $5.17 |
| | | | |
| Hypothetical (5% return | | | |
| before expenses) | $1,000.00 | $1,019.93 | $4.91 |
| (1) | Expenses are equal to the Fund’s annualized expense ratio of 1.18% for Investor Class shares or 0.98% for Institutional Class shares, as applicable, multiplied by the average account value over the period, multiplied by 181/365 days (to reflect one-half year period). |
Proxy Voting
A description of the policies and procedures the Fund uses to determine how to vote proxies relating to portfolio securities is available without charge: (1) by calling 1-800-966-4354; (2) on the Hennessy Funds’ website at hennessyfunds.com; or (3) on the U.S. Securities and Exchange Commission’s (the “SEC”) website at www.sec.gov. The Fund’s proxy voting record is available on both the Hennessy Funds’ website at hennessyfunds.com and the SEC’s website at www.sec.gov no later than August 31 for the prior 12 months ending June 30.
Quarterly Filings on Form N-Q
The Fund files its complete schedule of portfolio holdings with the SEC for the first and third quarters of each fiscal year on Form N-Q. The Fund’s Forms N-Q are available on the SEC’s website at www.sec.gov. The Fund’s Forms N-Q may be reviewed and copied at the SEC’s Public Reference Room in Washington, DC and information on the operation of the Public Reference Room may be obtained by calling 1-800-SEC-0330. Information included in the Fund’s Forms N-Q will also be available upon request by calling 1-800-966-4354.
Federal Tax Distribution Information
(Unaudited)
For the fiscal year ended October 31, 2013, certain dividends paid by the Fund may be subject to a maximum tax rate of 15%, as provided for by the Jobs and Growth Tax Relief Reconciliation Act of 2003. The percentage of dividends declared from ordinary income designated as qualified dividend income was 100.00%.
For corporate shareholders, the percent of ordinary income distributions qualifying for the corporate dividends received deduction for the fiscal year ended October 31, 2013 was 100.00%.
The percentage of taxable ordinary income distributions that are designated as short-term capital gain distributions under Section 871(k)(2)(C) of the Internal Revenue Code of 1986, as amended, for the Fund was 0.00%.
Householding
To help keep the Fund’s costs as low as possible, we generally deliver a single copy of most financial reports and prospectuses to shareholders who share an address, even if the accounts are registered under different names. This process, known as “householding,” does not apply to account statements. You may, of course, request an individual copy of a prospectus or financial report at any time. If you would like to receive separate mailings, please call the Administrator at 1-800-261-6950 or 1-414-765-4124 and we will begin individual delivery within 30 days of your request. If your account is held through a financial institution or other intermediary, please contact them directly to request individual delivery.
HENNESSY FUNDS 1-800-966-4354
Board Approval of Investment Advisory
Agreement
At its meeting on March 3, 2014, the Board of Trustees of the Fund (the “Board”) unanimously approved the continuation of the investment advisory agreement of the Fund.
The Board reviewed a number of documents, including a memorandum provided by outside legal counsel that described the fiduciary duties of the Board with respect to approving the continuance of the investment advisory agreement and the relevant factors for consideration, a memorandum from the Advisor that listed each of the relevant factors and the documents provided to help the Board assess each such factor, the Advisor’s most recent Form 10-K and 10-Q, the Advisor’s Form ADV Part I, a document that listed the range of services provided by the Advisor for the Fund, a written discussion of economies of scale, a copy of the advisory agreement, a fund fact sheet, and peer expense and performance comparisons. The Board considered and discussed numerous factors, including the following:
| | • | The Board considered the services identified below that are provided by the Advisor: |
| | | • | The Advisor acts as portfolio manager for the Fund. In this capacity, the Advisor manages the composition of the portfolio of the Fund, including the purchase, retention, and disposition of portfolio securities in accordance with the Fund’s investment objectives, policies, and restrictions. |
| | | • | The Advisor performs daily reconciliations of portfolio positions and cash for the Fund. |
| | | • | The Advisor manages the use of soft dollars for the Fund. |
| | | • | The Advisor monitors compliance by the Fund with its investment objectives and restrictions. |
| | | • | The Advisor monitors compliance with federal securities laws and performs activities such as maintaining a compliance program, conducting ongoing reviews of the compliance programs of the Fund’s service providers, conducting on-site visits to the Fund’s service providers, monitoring incidents of abusive trading practices, reviewing Fund expense accruals, payments, and fixed expense ratios, evaluating insurance providers for fidelity bond coverage and D&O/E&O insurance coverage, conducting employee compliance training, reviewing reports provided by service providers, maintaining books and records, and preparing an annual compliance report to the Board. |
| | | • | The Advisor oversees service providers that support the Fund in providing fund accounting, fund administration, fund distribution, transfer agency, custodial, sales and marketing, audit, information technology, and legal services. |
| | | • | The Advisor maintains an in-house public relations and marketing department on behalf of the Fund. |
| | | • | The Advisor is actively involved with preparing regulatory filings for the Fund. |
| | | • | The Advisor manages proxy voting for the Fund. |
| | | • | The Advisor oversees distribution of the Fund through third-party broker/dealers and independent financial institutions such as Charles Schwab, Inc., Fidelity, TD Waterhouse, and Pershing. The Advisor participates in “no transaction fee” (“NTF”) programs with these companies on behalf of the Fund, |
| | | | which allows customers to purchase the Fund through third-party distribution channels without paying a transaction fee. The Advisor compensates a number of these third-party providers of NTF programs out of its own revenues and not those of the Fund. |
| | | • | The Advisor pays the incentive compensation of all of the Fund’s compliance officers and employs other staff such as management executives, legal personnel, marketing personnel, national accounts and distribution personnel, sales personnel, and trading oversight personnel. |
| | | • | The Advisor prepares or reviews Board materials, frequently presents to the Board or leads Board discussions, prepares or reviews meeting minutes, and arranges for Board training and education. |
| | • | The Board compared the performance of the Fund to benchmark indices over various periods of time and concluded that the positive performance of the Fund warranted the continuation of the advisory agreement. |
| | • | The Board reviewed the Fund’s expense ratio and comparable expense ratios for funds comparable to the Fund. The Board used data from Morningstar showing funds similar in asset size and investment objective to the Fund and determined that the expense ratio of the Fund falls within the range of the ratios of other comparable funds and concluded that the expenses of the Fund were reasonable. |
| | • | The Board considered the fees charged by the Advisor to those of funds similar in asset size and investment objective to the Fund and concluded the advisory fee of the Fund was reasonable and warranted continuation of the advisory agreement. The Trustees noted that the investment advisory fees are not adjusted if economies of scale are realized as the Fund grows because many of the expenses incurred by the Advisor to manage the Fund are asset-based fees and thus do not result in material economies of scale being realized as the net assets of the Fund increase. |
| | • | The Board considered the profitability of the Advisor with respect to the Fund and concluded the profits were reasonable and not excessive when compared to profitability guidelines set forth in relevant court cases. |
| | • | The Board considered the high level of professionalism and knowledge of the Advisor’s employees, along with an extremely low level of turnover of the employees of the Advisor, and concluded that this was beneficial to the Fund and its shareholders, as it ensures that the Fund is operated efficiently. |
All of the factors above were considered separately by the Board, including the Trustees who are not “interested persons” (as defined in the Investment Company Act of 1940, as amended) of the Fund (the “Independent Trustees”) meeting in an executive session. The factors were viewed in their totality by the Board, with no single factor being the principal or determinative factor in the Board’s determination of whether to approve the continuation of the advisory agreement. Based on the factors discussed above, the Board, including all of the Independent Trustees, recommended continuation of the advisory agreement.
HENNESSY FUNDS 1-800-966-4354
For information, questions or assistance, please call
The Hennessy Funds
1-800-966-4354 or 1-415-899-1555
INVESTMENT ADVISOR
Hennessy Advisors, Inc.
7250 Redwood Blvd., Suite 200
Novato, California 94945
ADMINISTRATOR,
TRANSFER AGENT,
DIVIDEND PAYING AGENT &
SHAREHOLDER SERVICING AGENT
U.S. Bancorp Fund Services, LLC
P.O. Box 701
Milwaukee, Wisconsin 53201-0701
CUSTODIAN
U.S. Bank N.A.
Custody Operations
1555 North River Center Dr., Suite 302
Milwaukee, Wisconsin 53212
TRUSTEES
Neil J. Hennessy
Robert T. Doyle
J. Dennis DeSousa
Gerald P. Richardson
COUNSEL
Foley & Lardner LLP
777 East Wisconsin Avenue
Milwaukee, Wisconsin 53202-5306
INDEPENDENT REGISTERED
PUBLIC ACCOUNTING FIRM
KPMG LLP
777 East Wisconsin Avenue
Milwaukee, Wisconsin 53202-5306
DISTRIBUTOR
Quasar Distributors, LLC
615 East Michigan Street
Milwaukee, Wisconsin 53202
hennessyfunds.com | 1-800-966-4354
This report has been prepared for shareholders and may be distributed to
others only if preceded or accompanied by a current prospectus.
SEMI-ANNUAL REPORT
APRIL 30, 2014
HENNESSY CORNERSTONE
VALUE FUND
Investor Class HFCVX
Institutional Class HICVX
hennessyfunds.com | 1-800-966-4354
(This Page Intentionally Left Blank.)
Contents
| Letter to Shareholders | 2 |
| Performance Overview | 4 |
| Financial Statements | |
| Schedule of Investments | 6 |
| Statement of Assets and Liabilities | 10 |
| Statement of Operations | 11 |
| Statements of Changes in Net Assets | 13 |
| Financial Highlights | 14 |
| Notes to the Financial Statements | 18 |
| Expense Example | 26 |
| Proxy Voting | 28 |
| Quarterly Filings on Form N-Q | 28 |
| Federal Tax Distribution Information | 28 |
| Householding | 28 |
| Board Approval of Investment Advisory Agreement | 29 |
HENNESSY FUNDS 1-800-966-4354
June 2014
Dear Shareholder:
The financial markets have provided strong returns over the past six-months ended April 30, 2014, with the Dow Jones Industrial Average (DJIA) and S&P 500 both returning approximately 8% during the period. The current valuation metrics of the major indices are solid; for example, the DJIA currently has a price-to-earnings ratio of 15x and a price-to-sales ratio of 1.75x. The DJIA also has a dividend yield of 2.2%, which is nearly as high as that of a 10-Year U.S. Treasury, which is currently yielding 2.6%. Investing in high-yielding, high-quality DJIA stocks have the potential to not only provide an income stream but also for stock price appreciation as well. Fixed income investing has run its course, in my opinion, and many individuals are currently benefiting from the return to investing in equities that possess strong fundamentals.
U.S. corporations continue to drive shareholder value by making acquisitions, initiating and raising dividends, investing in internal infrastructure, and buying back stock. However, lately I have begun to see a shift in those business strategies. The easier-to-execute acquisitions seem to be a thing of the past, and firms now have to be even more creative to execute accretive deals. I also believe that while firms may continue to initiate dividends, fewer firms will raise their dividends and fewer firms will participate in stock buyback programs going forward. So what will these cash-rich companies do with their capital if they are not raising dividends or buying back stock? I believe we will see companies begin to initiate capital expenditure programs.
Due to the continuing uncertainty from a lack of clear policies on taxes, healthcare, and regulations, I have observed that corporations would rather wait for clarity from our government leaders and defer any significant changes to their current business models. Up until this point, there has been no real cost for firms to defer spending their capital as they wait for anticipated guidance on policies that directly affect their businesses. But, this economic handcuffing from all of this uncertainty has gone on long enough. I believe there will now be firms who want to improve their margins and will begin spending money to expand their sales, and may even begin to hire. Once a competitor begins to move in this way, then the cost to defer becomes real for companies. This movement to expansion may well be a catalyst to propel the financial markets. I do believe this will be a slow shift, but one that will keep the economy improving, and should, in my opinion, help to generate reasonable market returns over the next few years.
With almost $3 trillion in cash sitting on the sidelines, this strategic shift by companies to begin spending their idle capital should help the economic recovery in the U.S. But that is only one part of the equation. Washington politics still play a role in how strong that recovery will be. The national political landscape will change in the next few years, and the future generation of elected officials will be faced with what I believe are fictitious unemployment figures (6.3% reported, when over 20 million Americans are looking for more work or a better job), a sluggish economy, and global competition in business. The next regime needs to provide real clarity on the issues that face all Americans and American corporations: taxation, regulation, and how to pay for our new healthcare system. I also believe that our government needs to regard business as a noble profession and to implement common sense and logic in their policy making instead of politics as usual. As Confucius is quoted as saying, “Life is really simple, but we insist on making it complicated.”
I am confident that even with all the hurdles facing corporate America, companies continue to provide good value for their shareholders, and I believe that means the financial markets are in good shape and should remain strong moving forward, I also believe that the next few months may be volatile. Fads come and go, and the current buzz on the Street is around investing in social media stocks. I believe that chasing hot products has contributed and will continue to contribute to the volatility of the markets this year. After over 35 years in the business, I still firmly believe the best way to position your portfolio is by investing in good companies over the long term, rather than trying to buy the next hot idea at exactly the right time. At Hennessy Funds, hunches and fads have no place in our investment process, and we understand that successful investing comes from time in the market, not timing the market.
We remain focused on investing based on proven fundamentals, and we are committed to managing money for the sole benefit of our shareholders. If you have any questions or want to speak with us directly, please don’t hesitate to call us at (800) 966-4354.
Best regards,
Neil J. Hennessy
President and Chief Investment Officer
Past performance does not guarantee future results.
Mutual fund investing involves risk. Principal loss is possible.
Opinions expressed are those of Neil Hennessy and are subject to change, are not guaranteed and should not be considered investment advice.
The Dow Jones Industrial Average and S&P 500 are unmanaged indices commonly used to measure the performance of U.S. stocks. One cannot invest directly in an index.
Price-to-sales ratio and price-to-earnings ratio are tools for calculating relative valuation. Price-to-sales ratio is calculated by dividing the market price by revenue per share. Price-to-earnings ratio is the market price per share divided by earnings per share.
HENNESSY FUNDS 1-800-966-4354
Performance Overview (Unaudited)
The opinions expressed in the following commentary reflect those of the Portfolio Managers as of the date written. Any such opinions are subject to change based on market or other conditions and are not guaranteed. These opinions may not be relied upon as investment advice. Investment decisions for the Fund are based on several factors, and may not be relied upon as an indication of trading intent on behalf of the Fund. Security positions can and do change.
AVERAGE ANNUAL TOTAL RETURN PERIODS ENDED APRIL 30, 2014
| | Six | One | Five | Ten |
| | Months(1) | Year | Years | Years |
| Hennessy Cornerstone Value Fund – | | | | |
| Investor Class (HFCVX) | 8.41% | 17.52% | 20.13% | 7.17% |
| Hennessy Cornerstone Value Fund – | | | | |
Institutional Class (HICVX)(2) | 8.48% | 17.74% | 20.50% | 7.35% |
Russell 1000® Value Index | 9.61% | 20.90% | 19.52% | 7.95% |
| S&P 500 Index | 8.36% | 20.44% | 19.14% | 7.67% |
Expense ratios: 1.22% (Investor Class); Gross 1.10%, Net 0.98%(3) (Institutional Class)
Performance data quoted represents past performance; past performance does not guarantee future results. The investment return and principal value of an investment will fluctuate so that an investor’s shares, when redeemed, may be worth more or less than their original cost. Current performance of the Fund may be lower or higher than the performance quoted. Performance data current to the most recent month end may be obtained by visiting hennessyfunds.com.
The expense ratios presented are from the most recent prospectus.
| (1) | Periods less than one year are not annualized. |
| (2) | The inception date of the Institutional Class shares is March 3, 2008. Performance shown prior to the inception of the Institutional Class shares reflects the performance of the Investor Class shares and includes expenses that are not applicable to and are higher than those of the Institutional Class shares. |
| (3) | With regard to Institutional Class shares, the Funds’ investment advisor has contractually agreed to waive a portion of its expenses indefinitely. |
PERFORMANCE NARRATIVE
Portfolio Manager, Neil Hennessy, and Co-Portfolio Manager, Brian Peery
Over the previous six months, how did the Fund perform and what factors contributed to this performance?
For the six-month period ended April 30, 2014, the Investor Class of the Hennessy Cornerstone Value Fund returned 8.41%, underperforming the Russell 1000® Value Index, which returned 9.61% for the same period, but outperforming the S&P 500 Index and the Morningstar Large Value Category Average, which returned 8.36%, and 8.14% for the same period, respectively.
While the Fund had strong absolute performance for the six-month period, its performance versus the Russell 1000® Value Index was hampered slightly by both asset allocation and stock selection. Relative overweighting in the Consumer Staples sector, combined with stock selection within the sector, attributed to all of the Fund’s relative underperformance versus the Russell 1000® Value Index. Specifically, a significant contributor to the relative underperformance was CVS Caremark Corporation, which is no longer held by the Fund.
Additional Portfolio Manager commentary and related investment outlook:
The financial markets continue to appear to favor companies that place a high emphasis on shareholder value, specifically those companies that reward shareholders with higher dividends, and we expect this trend to continue. There are many companies whose dividend yield is currently higher than that of a 10-Year U.S. Treasury. As of the end of April, the Fund’s 30-Day SEC Yield was 2.10% (as a reference point, the U.S. Treasury 10-Year and 5-Year yields at the end of April were 2.65% and 1.68%, respectively). As investors continue to seek out opportunities to generate income while having exposure to the upside potential of the equity markets, we believe that large capitalization, dividend-paying companies should continue to do well.
A recent focus in the financial news is how poorly high multiple stocks have performed recently. We have managed to avoid owning any of these stocks in the Fund by virtue of being a value fund that utilizes a high dividend approach to its investing. And, while we do not own any stocks within the sectors and areas currently under selling pressure, we do anticipate that investors will continue to migrate out of high risk, high multiple stocks and into stocks that should do well as the economy expands. With interest rates expected to remain low for quite some time, we would expect investors will continue to migrate towards high-quality, dividend-paying companies as a means of potential income generation, especially after taking into consideration the favorable tax rates of income from dividends versus ordinary income. While the equation for high-dividend stocks might not be as obvious today as it was just a few years ago, when dividend yields were even higher, we still believe they offer an excellent means of potentially generating income while maintaining exposure to potential appreciation of the underlying asset in the form of a higher stock price.
The Russell 1000® Value Index is an unmanaged index commonly used to measure the performance of U.S. large-capitalization value stocks. The S&P 500 Index is an unmanaged index commonly used to measure the performance of U.S. stocks. You cannot invest directly in an index. Performance data for an index does not reflect any deductions for fees, expenses or taxes. The Fund may invest in medium-capitalization companies, which may have more limited liquidity and greater price volatility than large-capitalization companies. Investments in foreign securities involve greater volatility and political, economic and currency risk and differences in accounting methods. The Fund’s portfolio is rebalanced annually in accordance with its strategy, which may result in the elimination of better performing assets from the Fund’s investments and increases in investments with relatively lower total return. References to specific securities should not be considered a recommendation to buy or sell any security. Fund holdings and sector allocations are subject to change. Please refer to the Schedule of Investments included in this report for additional portfolio information. Any tax or legal information provided is not exhaustive. Investors must consult their tax advisor or legal counsel for advice and information concerning their particular situation. Neither the Fund nor any of its representatives may give legal or tax advice.
30-Day SEC Yield is a standardized yield computed by dividing the net investment income per share earned during the past 30-day period by the share price at the end of the period, expressed as an annual percentage rate.
Each Morningstar category average represents a universe of funds with similar investment objectives. © Morningstar, Inc. All Rights Reserved. The information contained herein: 1) is proprietary to Morningstar; 2) may not be copied or distributed and 3) is not warranted to be accurate, complete or timely. Neither Morningstar nor its content providers are responsible for any damages or losses arising from any use of this information. Past performance does not guarantee future results.
HENNESSY FUNDS 1-800-966-4354
Schedule of Investments
HENNESSY CORNERSTONE VALUE FUND
As of April 30, 2014 (Unaudited)
(% of Net Assets)
| | TOP TEN HOLDINGS (EXCLUDING CASH/CASH EQUIVALENTS) | % NET ASSETS |
| | Total SA – ADR | 2.19% |
| | CenturyLink, Inc. | 2.15% |
| | Banco Santander SA – ADR | 2.06% |
| | Royal Dutch Shell PLC – ADR | 2.05% |
| | Unilever PLC – ADR | 2.04% |
| | Altria Group, Inc. | 2.03% |
| | Kellogg Co. | 2.03% |
| | Johnson & Johnson | 2.02% |
| | ConocoPhillips | 2.01% |
| | Exxon Mobil Corp. | 1.97% |
Note: For presentation purposes, the Fund has grouped some of the industry categories. For purposes of categorizing securities for compliance with Section 8(b)(1) of the Investment Company Act of 1940, the Fund uses more specific industry classifications.
| | COMMON STOCKS – 95.68% | | Number | | | | | | % of | |
| | | | of Shares | | | Value | | | Net Assets | |
| | Consumer Discretionary – 9.19% | | | | | | | | | |
| | Ford Motor Co. | | | 190,600 | | | $ | 3,078,190 | | | | 1.92 | % |
| | General Motors Co. | | | 78,700 | | | | 2,713,576 | | | | 1.69 | % |
| | McDonald’s Corp . | | | 29,800 | | | | 3,021,124 | | | | 1.89 | % |
| | Target Corp. | | | 50,000 | | | | 3,087,500 | | | | 1.93 | % |
| | Thomson Reuters Corp. (b) | | | 78,100 | | | | 2,825,658 | | | | 1.76 | % |
| | | | | | | | | 14,726,048 | | | | 9.19 | % |
| | | | | | | | | | | | | | |
| | Consumer Staples – 23.01% | | | | | | | | | | | | |
| | Altria Group, Inc. | | | 81,300 | | | | 3,260,943 | | | | 2.03 | % |
| | ConAgra Foods, Inc. | | | 90,300 | | | | 2,755,053 | | | | 1.72 | % |
| | General Mills, Inc. | | | 59,200 | | | | 3,138,784 | | | | 1.96 | % |
| | Kellogg Co. | | | 48,700 | | | | 3,254,621 | | | | 2.03 | % |
| | Kimberly Clark Corp. | | | 26,300 | | | | 2,952,175 | | | | 1.84 | % |
| | Kraft Foods Group, Inc. | | | 54,200 | | | | 3,081,812 | | | | 1.92 | % |
| | Pepsico, Inc. | | | 35,300 | | | | 3,031,917 | | | | 1.89 | % |
| | Philip Morris International, Inc. | | | 36,800 | | | | 3,143,824 | | | | 1.96 | % |
| | Procter & Gamble Co. | | | 36,600 | | | | 3,021,330 | | | | 1.89 | % |
| | Sysco Corp. | | | 80,300 | | | | 2,925,329 | | | | 1.83 | % |
| | The Coca-Cola Co. | | | 74,500 | | | | 3,038,855 | | | | 1.90 | % |
| | Unilever PLC – ADR | | | 72,900 | | | | 3,261,546 | | | | 2.04 | % |
| | | | | | | | | 36,866,189 | | | | 23.01 | % |
| | | | | | | | | | | | | | |
| | Energy – 13.97% | | | | | | | | | | | | |
| | BP PLC – ADR | | | 60,100 | | | | 3,042,262 | | | | 1.90 | % |
| | Chevron Corp. | | | 24,900 | | | | 3,125,448 | | | | 1.95 | % |
| | ConocoPhillips | | | 43,400 | | | | 3,225,054 | | | | 2.01 | % |
| | Exxon Mobil Corp. | | | 30,800 | | | | 3,154,228 | | | | 1.97 | % |
| | Occidental Petroleum Corp. | | | 31,800 | | | | 3,044,850 | | | | 1.90 | % |
| | Royal Dutch Shell PLC – ADR | | | 38,800 | | | | 3,284,420 | | | | 2.05 | % |
| | Total SA – ADR | | | 49,300 | | | | 3,512,132 | | | | 2.19 | % |
| | | | | | | | | 22,388,394 | | | | 13.97 | % |
| | | | | | | | | | | | | | |
| | Financials – 3.85% | | | | | | | | | | | | |
| | Banco Santander SA – ADR | | | 331,600 | | | | 3,302,736 | | | | 2.06 | % |
| | J.P. Morgan Chase & Co. | | | 51,100 | | | | 2,860,578 | | | | 1.79 | % |
| | | | | | | | | 6,163,314 | | | | 3.85 | % |
The accompanying notes are an integral part of these financial statements.
HENNESSY FUNDS 1-800-966-4354
| | COMMON STOCKS | | Number | | | | | | % of | |
| | | | of Shares | | | Value | | | Net Assets | |
| | Health Care – 15.13% | | | | | | | | | |
| | AbbVie, Inc. | | | 58,600 | | | $ | 3,051,888 | | | | 1.91 | % |
| | Baxter International, Inc. | | | 41,700 | | | | 3,035,343 | | | | 1.89 | % |
| | Bristol-Myers Squibb Co. | | | 57,000 | | | | 2,855,130 | | | | 1.78 | % |
| | Eli Lilly & Co. | | | 52,700 | | | | 3,114,570 | | | | 1.94 | % |
| | GlaxoSmithKline PLC – ADR | | | 54,400 | | | | 3,012,128 | | | | 1.88 | % |
| | Johnson & Johnson | | | 31,900 | | | | 3,231,151 | | | | 2.02 | % |
| | Merck & Co., Inc. | | | 53,200 | | | | 3,115,392 | | | | 1.94 | % |
| | Pfizer, Inc. | | | 90,600 | | | | 2,833,968 | | | | 1.77 | % |
| | | | | | | | | 24,249,570 | | | | 15.13 | % |
| | | | | | | | | | | | | | |
| | Industrials – 7.66% | | | | | | | | | | | | |
| | 3M Co. | | | 22,400 | | | | 3,115,616 | | | | 1.94 | % |
| | General Electric Co. | | | 113,900 | | | | 3,062,771 | | | | 1.91 | % |
| | Lockheed Martin Corp. | | | 18,800 | | | | 3,085,832 | | | | 1.93 | % |
| | Waste Management, Inc. | | | 67,600 | | | | 3,004,820 | | | | 1.88 | % |
| | | | | | | | | 12,269,039 | | | | 7.66 | % |
| | | | | | | | | | | | | | |
| | Information Technology – 7.59% | | | | | | | | | | | | |
| | Cisco Systems, Inc. | | | 128,700 | | | | 2,974,257 | | | | 1.86 | % |
| | Intel Corp. | | | 115,800 | | | | 3,090,702 | | | | 1.93 | % |
| | Microsoft Corp. | | | 76,000 | | | | 3,070,400 | | | | 1.91 | % |
| | Texas Instruments, Inc. | | | 66,800 | | | | 3,036,060 | | | | 1.89 | % |
| | | | | | | | | 12,171,419 | | | | 7.59 | % |
| | | | | | | | | | | | | | |
| | Materials – 9.46% | | | | | | | | | | | | |
| | EI Du Pont de Nemours & Co. | | | 46,200 | | | | 3,110,184 | | | | 1.94 | % |
| | Freeport-McMoRan Copper & Gold, Inc. | | | 89,200 | | | | 3,065,804 | | | | 1.92 | % |
| | International Paper Co. | | | 60,200 | | | | 2,808,330 | | | | 1.75 | % |
| | Nucor Corp. | | | 59,500 | | | | 3,079,125 | | | | 1.92 | % |
| | The Dow Chemical Co. | | | 62,000 | | | | 3,093,800 | | | | 1.93 | % |
| | | | | | | | | 15,157,243 | | | | 9.46 | % |
| | | | | | | | | | | | | | |
| | Telecommunication Services – 5.82% | | | | | | | | | | | | |
| | AT&T, Inc. | | | 86,800 | | | | 3,098,760 | | | | 1.93 | % |
| | CenturyLink, Inc. | | | 98,600 | | | | 3,442,126 | | | | 2.15 | % |
| | Verizon Communications, Inc. | | | 59,700 | | | | 2,789,781 | | | | 1.74 | % |
| | | | | | | | | 9,330,667 | | | | 5.82 | % |
| | Total Common Stocks | | | | | | | | | | | | |
| | (Cost $119,319,287) | | | | | | | 153,321,883 | | | | 95.68 | % |
The accompanying notes are an integral part of these financial statements.
| | SHORT-TERM INVESTMENTS – 5.69% | | Number | | | | | | % of | |
| | | | of Shares | | | Value | | | Net Assets | |
| | Money Market Funds – 5.69% | | | | | | | | | |
| | Federated Government Obligations Fund – Class I, 0.01% (a) | | | 1,195,062 | | | $ | 1,195,062 | | | | 0.75 | % |
| | Fidelity Government Portfolio – Institutional Class, 0.01% (a) | | | 7,920,000 | | | | 7,920,000 | | | | 4.94 | % |
| | | | | | | | | | | | | | |
| | Total Money Market Funds | �� | | | | | | | | | | | |
| | (Cost $9,115,062) | | | | | | | 9,115,062 | | | | 5.69 | % |
| | | | | | | | | | | | | | |
| | Total Short-Term Investments | | | | | | | | | | | | |
| | (Cost $9,115,062) | | | | | | | 9,115,062 | | | | 5.69 | % |
| | | | | | | | | | | | | | |
| | Total Investments | | | | | | | | | | | | |
| | (Cost $128,434,349) – 101.37% | | | | | | | 162,436,945 | | | | 101.37 | % |
| | Liabilities in Excess | | | | | | | | | | | | |
| | of Other Assets – (1.37)% | | | | | | | (2,189,143 | ) | | | (1.37 | )% |
| | TOTAL NET ASSETS – 100.00% | | | | | | $ | 160,247,802 | | | | 100.00 | % |
Percentages are stated as a percent of net assets.
ADR – American Depositary Receipt
| (a) | The rate listed is the fund’s 7-day yield as of April 30, 2014. |
| (b) | U.S. traded security of a foreign corporation. |
Summary of Fair Value Exposure at April 30, 2014
The following is a summary of the inputs used to value the Fund’s net assets as of April 30, 2014 (See Note 3 in the accompanying notes to the financial statements):
| Common Stock | | Level 1 | | | Level 2 | | | Level 3 | | | Total | |
| Consumer Discretionary | | $ | 14,726,048 | | | $ | — | | | $ | — | | | $ | 14,726,048 | |
| Consumer Staples | | | 36,866,189 | | | | — | | | | — | | | | 36,866,189 | |
| Energy | | | 22,388,394 | | | | — | | | | — | | | | 22,388,394 | |
| Financials | | | 6,163,314 | | | | — | | | | — | | | | 6,163,314 | |
| Health Care | | | 24,249,570 | | | | — | | | | — | | | | 24,249,570 | |
| Industrials | | | 12,269,039 | | | | — | | | | — | | | | 12,269,039 | |
| Information Technology | | | 12,171,419 | | | | — | | | | — | | | | 12,171,419 | |
| Materials | | | 15,157,243 | | | | — | | | | — | | | | 15,157,243 | |
| Telecommunication Services | | | 9,330,667 | | | | — | | | | — | | | | 9,330,667 | |
| Total Common Stock | | $ | 153,321,883 | | | $ | — | | | $ | — | | | $ | 153,321,883 | |
| Short-Term Investments | | | | | | | | | | | | | | | | |
| Money Market Funds | | $ | 9,115,062 | | | $ | — | | | $ | — | | | $ | 9,115,062 | |
| Total Short-Term Investments | | $ | 9,115,062 | | | $ | — | | | $ | — | | | $ | 9,115,062 | |
| Total Investments | | $ | 162,436,945 | | | $ | — | | | $ | — | | | $ | 162,436,945 | |
Transfers between levels are recognized at the end of the reporting period. During the six-month period ended April 30, 2014, the Fund recognized no transfers between levels.
The accompanying notes are an integral part of these financial statements.
HENNESSY FUNDS 1-800-966-4354
Financial Statements
Statement of Assets and Liabilities as of April 30, 2014 (Unaudited) |
| ASSETS: | | | |
| Investments in securities, at value (cost $128,434,349) | | $ | 162,436,945 | |
| Dividends and interest receivable | | | 338,068 | |
| Receivable for fund shares sold | | | 13,843 | |
| Prepaid expenses and other assets | | | 21,126 | |
| Total Assets | | | 162,809,982 | |
| | | | | |
| LIABILITIES: | | | | |
| Payable for securities purchased | | | 2,355,786 | |
| Payable for fund shares redeemed | | | 11,027 | |
| Payable to advisor | | | 90,579 | |
| Payable to administrator | | | 47,109 | |
| Payable to auditor | | | 12,948 | |
| Accrued service fees | | | 11,704 | |
| Accrued trustees fees | | | 5,073 | |
| Accrued expenses and other payables | | | 27,954 | |
| Total Liabilities | | | 2,562,180 | |
| NET ASSETS | | $ | 160,247,802 | |
| | | | | |
| NET ASSETS CONSIST OF: | | | | |
| Capital stock | | $ | 149,086,385 | |
| Accumulated net investment income | | | 957,137 | |
| Accumulated net realized loss on investments | | | (23,798,316 | ) |
| Unrealized net appreciation on investments | | | 34,002,596 | |
| Total Net Assets | | $ | 160,247,802 | |
| | | | | |
| NET ASSETS | | | | |
| Investor Class: | | | | |
| Shares authorized (no par value) | | Unlimited | |
| Net assets applicable to outstanding Investor Class shares | | | 144,848,668 | |
| Shares issued and outstanding | | | 8,103,767 | |
| Net asset value, offering price and redemption price per share | | $ | 17.87 | |
| | | | | |
| Institutional Class: | | | | |
| Shares authorized (no par value) | | Unlimited | |
| Net assets applicable to outstanding Institutional Class shares | | | 15,399,134 | |
| Shares issued and outstanding | | | 862,021 | |
| Net asset value, offering price and redemption price per share | | $ | 17.86 | |
The accompanying notes are an integral part of these financial statements.Financial Statements
Statement of Operations Six Months Ended April 30, 2014 (Unaudited) |
| INVESTMENT INCOME: | | | |
Dividend income(1) | | $ | 2,359,550 | |
| Interest income | | | 267 | |
| Total investment income | | | 2,359,817 | |
| | | | | |
| EXPENSES: | | | | |
| Investment advisory fees | | | 527,827 | |
| Administration, fund accounting, custody and transfer agent fees | | | 142,656 | |
| Service fees – Investor Class (See Note 5) | | | 69,338 | |
| Sub-transfer agent expenses – Investor Class (See Note 5) | | | 47,496 | |
| Sub-transfer agent expenses – Institutional Class (See Note 5) | | | 1,592 | |
| Federal and state registration fees | | | 15,368 | |
| Audit fees | | | 11,425 | |
| Compliance expense | | | 10,655 | |
| Reports to shareholders | | | 9,025 | |
| Trustees’ fees and expenses | | | 7,488 | |
| Legal fees | | | 2,480 | |
| Other expenses | | | 8,743 | |
| Total expenses before waiver | | | 854,093 | |
| Administration expense waiver (See Note 5) | | | (3,201 | ) |
| Net expenses | | | 850,892 | |
| NET INVESTMENT INCOME | | $ | 1,508,925 | |
| | | | | |
| REALIZED AND UNREALIZED GAINS: | | | | |
| Net realized gain on investments | | $ | 8,681,478 | |
| Change in unrealized appreciation on investments | | | 1,647,176 | |
| Net gain on investments | | | 10,328,654 | |
| NET INCREASE IN NET ASSETS RESULTING FROM OPERATIONS | | $ | 11,837,579 | |
| (1) | Net of foreign taxes withheld of $38,625. |
The accompanying notes are an integral part of these financial statements.
HENNESSY FUNDS 1-800-966-4354
(This Page Intentionally Left Blank.)
Financial Statements
| Statements of Changes in Net Assets |
| | | Six Months Ended | | | | |
| | | April 30, 2014 | | | Year Ended | |
| | | (Unaudited) | | | October 31, 2013 | |
| OPERATIONS: | | | | | | |
| Net investment income | | $ | 1,508,925 | | | $ | 3,507,085 | |
| Net realized gain on securities | | | 8,681,478 | | | | 12,225,964 | |
| Change in unrealized appreciation on securities | | | 1,647,176 | | | | 13,004,866 | |
| Net increase in net assets resulting from operations | | | 11,837,579 | | | | 28,737,915 | |
| | | | | | | | | |
| DISTRIBUTIONS TO SHAREHOLDERS FROM: | | | | | | | | |
| Net investment income | | | | | | | | |
| Investor Class | | | (3,513,687 | ) | | | (3,262,318 | ) |
| Institutional Class | | | (87,011 | ) | | | (77,674 | ) |
| Total distributions | | | (3,600,698 | ) | | | (3,339,992 | ) |
| | | | | | | | | |
| CAPITAL SHARE TRANSACTIONS: | | | | | | | | |
| Proceeds from shares subscribed – Investor Class | | | 1,929,519 | | | | 5,921,525 | |
| Proceeds from shares subscribed – Institutional Class | | | 12,638,477 | | | | 2,126,066 | |
| Dividends reinvested – Investor Class | | | 3,144,018 | | | | 2,900,074 | |
| Dividends reinvested – Institutional Class | | | 73,379 | | | | 66,521 | |
| Cost of shares redeemed – Investor Class | | | (7,024,297 | )(1) | | | (19,568,045 | ) |
| Cost of shares redeemed – Institutional Class | | | (1,783,229 | ) | | | (1,332,315 | ) |
| Net increase (decrease) in net assets | | | | | | | | |
| derived from capital share transactions | | | 8,977,867 | | | | (9,886,174 | ) |
| TOTAL INCREASE IN NET ASSETS | | | 17,214,748 | | | | 15,511,749 | |
| | | | | | | | | |
| NET ASSETS: | | | | | | | | |
| Beginning of period | | | 143,033,054 | | | | 127,521,305 | |
| End of period | | $ | 160,247,802 | | | $ | 143,033,054 | |
| Undistributed net investment income, end of period | | $ | 957,137 | | | $ | 3,048,910 | |
| | | | | | | | | |
| CHANGES IN SHARES OUTSTANDING: | | | | | | | | |
| Shares sold – Investor Class | | | 112,571 | | | | 395,919 | |
| Shares sold – Institutional Class | | | 718,950 | | | | 140,683 | |
| Shares issued to holders as reinvestment | | | | | | | | |
| of dividends – Investor Class | | | 183,861 | | | | 209,090 | |
| Shares issued to holders as reinvestment | | | | | | | | |
| of dividends – Institutional Class | | | 4,296 | | | | 4,803 | |
| Shares redeemed – Investor Class | | | (412,387 | ) | | | (1,299,056 | ) |
| Shares redeemed – Institutional Class | | | (102,882 | ) | | | (84,166 | ) |
| Net increase (decrease) in shares outstanding | | | 504,409 | | | | (632,727 | ) |
| (1) | Net of redemption fees of $2,165 related to redemption fees imposed by the Fund during a prior year but not received until the six-month period ended April 30, 2014. |
The accompanying notes are an integral part of these financial statements.
HENNESSY FUNDS 1-800-966-4354
Financial Highlights
| Hennessy Cornerstone Value Fund |
For an Investor Class share outstanding throughout each period
| | | Six Months Ended | |
| | | April 30, 2014 | |
| | | (Unaudited) | |
| PER SHARE DATA: | | | |
| Net asset value, beginning of period | | $ | 16.90 | |
| | | | | |
| Income from investment operations: | | | | |
| Net investment income | | | 0.18 | |
| Net realized and unrealized gains on investments | | | 1.22 | |
| Total from investment operations | | | 1.40 | |
| | | | | |
| Less distributions: | | | | |
| Dividends from net investment income | | | (0.43 | ) |
| Total distributions | | | (0.43 | ) |
| Net asset value, end of period | | $ | 17.87 | |
| | | | | |
| TOTAL RETURN | | | 8.41 | %(1) |
| | | | | |
| SUPPLEMENTAL DATA AND RATIOS: | | | | |
| Net assets, end of period (millions) | | $ | 144.85 | |
| Ratio of expenses to average net assets | | | 1.20 | %(2) |
| Ratio of net investment income to average net assets | | | 2.11 | %(2) |
Portfolio turnover rate(3) | | | 32 | %(1) |
| (1) | Not annualized. |
| (2) | Annualized. |
| (3) | Portfolio turnover is calculated on the basis of the Fund as a whole. |
The accompanying notes are an integral part of these financial statements.
| Year Ended October 31, | |
| 2013 | | | 2012 | | | 2011 | | | 2010 | | | 2009 | |
| | | | | | | | | | | | | | |
| $ | 14.02 | | | $ | 12.84 | | | $ | 12.53 | | | $ | 10.63 | | | $ | 9.05 | |
| | | | | | | | | | | | | | | | | | | |
| | | | | | | | | | | | | | | | | | | |
| | 0.42 | | | | 0.37 | | | | 0.45 | | | | 0.29 | | | | 0.24 | |
| | 2.84 | | | | 1.23 | | | | 0.23 | | | | 1.81 | | | | 1.87 | |
| | 3.26 | | | | 1.60 | | | | 0.68 | | | | 2.10 | | | | 2.11 | |
| | | | | | | | | | | | | | | | | | | |
| | | | | | | | | | | | | | | | | | | |
| | (0.38 | ) | | | (0.42 | ) | | | (0.37 | ) | | | (0.20 | ) | | | (0.53 | ) |
| | (0.38 | ) | | | (0.42 | ) | | | (0.37 | ) | | | (0.20 | ) | | | (0.53 | ) |
| $ | 16.90 | | | $ | 14.02 | | | $ | 12.84 | | | $ | 12.53 | | | $ | 10.63 | |
| | | | | | | | | | | | | | | | | | | |
| | 23.84 | % | | | 12.79 | % | | | 5.58 | % | | | 19.98 | % | | | 25.51 | % |
| | | | | | | | | | | | | | | | | | | |
| | | | | | | | | | | | | | | | | | | |
| $ | 138.94 | | | $ | 124.99 | | | $ | 116.41 | | | $ | 155.87 | | | $ | 145.91 | |
| | 1.22 | % | | | 1.26 | % | | | 1.31 | % | | | 1.29 | % | | | 1.27 | % |
| | 2.60 | % | | | 2.67 | % | | | 2.94 | % | | | 2.33 | % | | | 3.19 | % |
| | 41 | % | | | 47 | % | | | 40 | % | | | 91 | % | | | 59 | % |
The accompanying notes are an integral part of these financial statements.
HENNESSY FUNDS 1-800-966-4354
Financial Highlights
| Hennessy Cornerstone Value Fund |
For an Institutional Class share outstanding throughout each period
| | | Six Months Ended | |
| | | April 30, 2014 | |
| | | (Unaudited) | |
| PER SHARE DATA: | | | |
| Net asset value, beginning of period | | $ | 16.92 | |
| | | | | |
| Income from investment operations: | | | | |
| Net investment income | | | 0.31 | |
| Net realized and unrealized gains on investments | | | 1.10 | |
| Total from investment operations | | | 1.41 | |
| | | | | |
| Less distributions: | | | | |
| Dividends from net investment income | | | (0.47 | ) |
| Total distributions | | | (0.47 | ) |
| Net asset value, end of period | | $ | 17.86 | |
| | | | | |
| TOTAL RETURN | | | 8.48 | %(1) |
| | | | | |
| SUPPLEMENTAL DATA AND RATIOS: | | | | |
| Net assets, end of period (millions) | | $ | 15.40 | |
| Ratio of expenses to average net assets: | | | | |
| Before expense reimbursement | | | 1.14 | %(2) |
| After expense reimbursement | | | 0.98 | %(2) |
| Ratio of net investment income to average net assets: | | | | |
| Before expense reimbursement | | | 2.01 | %(2) |
| After expense reimbursement | | | 2.17 | %(2) |
Portfolio turnover rate(3) | | | 32 | %(1) |
| (1) | Not annualized. |
| (2) | Annualized. |
| (3) | Portfolio turnover is calculated on the basis of the Fund as a whole. |
The accompanying notes are an integral part of these financial statements.
| Year Ended October 31, | |
| 2013 | | | 2012 | | | 2011 | | | 2010 | | | 2009 | |
| | | | | | | | | | | | | | |
| $ | 14.04 | | | $ | 12.86 | | | $ | 12.54 | | | $ | 10.63 | | | $ | 9.06 | |
| | | | | | | | | | | | | | | | | | | |
| | | | | | | | | | | | | | | | | | | |
| | 0.50 | | | | 0.45 | | | | 0.36 | | | | 0.30 | | | | 0.30 | |
| | 2.80 | | | | 1.19 | | | | 0.37 | | | | 1.83 | | | | 1.83 | |
| | 3.30 | | | | 1.64 | | | | 0.73 | | | | 2.13 | | | | 2.13 | |
| | | | | | | | | | | | | | | | | | | |
| | | | | | | | | | | | | | | | | | | |
| | (0.42 | ) | | | (0.46 | ) | | | (0.41 | ) | | | (0.22 | ) | | | (0.56 | ) |
| | (0.42 | ) | | | (0.46 | ) | | | (0.41 | ) | | | (0.22 | ) | | | (0.56 | ) |
| $ | 16.92 | | | $ | 14.04 | | | $ | 12.86 | | | $ | 12.54 | | | $ | 10.63 | |
| | | | | | | | | | | | | | | | | | | |
| | 24.13 | % | | | 13.13 | % | | | 6.00 | % | | | 20.31 | % | | | 25.87 | % |
| | | | | | | | | | | | | | | | | | | |
| | | | | | | | | | | | | | | | | | | |
| $ | 4.09 | | | $ | 2.53 | | | $ | 1.17 | | | $ | 1.35 | | | $ | 1.11 | |
| | | | | | | | | | | | | | | | | | | |
| | 1.10 | % | | | 1.20 | % | | | 1.14 | % | | | 1.10 | % | | | 1.13 | % |
| | 0.98 | % | | | 0.98 | % | | | 0.98 | % | | | 0.98 | % | | | 0.98 | % |
| | | | | | | | | | | | | | | | | | | |
| | 2.64 | % | | | 2.72 | % | | | 3.04 | % | | | 2.52 | % | | | 3.33 | % |
| | 2.76 | % | | | 2.94 | % | | | 3.20 | % | | | 2.64 | % | | | 3.48 | % |
| | 41 | % | | | 47 | % | | | 40 | % | | | 91 | % | | | 59 | % |
The accompanying notes are an integral part of these financial statements.
HENNESSY FUNDS 1-800-966-4354
Notes to the Financial Statements
April 30, 2014 (Unaudited)
1). ORGANIZATION
The Hennessy Cornerstone Value Fund (the “Fund”) is a series of Hennessy Funds Trust (the “Trust”), which was organized as a Delaware statutory trust on September 17, 1992. The Fund is an open-end management investment company registered under the Investment Company Act of 1940, as amended. The Fund is a successor to a fund with the same name (the “Predecessor Fund”) that was a series of Hennessy Mutual Funds, Inc., a Maryland corporation, pursuant to a reorganization that took place after the close of business on February 28, 2014. Prior to February 28, 2014, the Fund had no investment operations. As a result of the reorganization, holders of the Investor Class shares of the Predecessor Fund received Investor Class shares of the Fund (the Investor Class shares of the Fund are the successor to the accounting and performance information of the Predecessor Fund), and holders of the Institutional Class shares of the Predecessor Fund received Institutional Class shares of the Fund (the Institutional Class shares of the Fund are the successor to the accounting and performance information of the Predecessor Fund). The investment objective of the Fund is total return, consisting of capital appreciation and current income. The Fund is a diversified fund.
The Fund offers Investor Class and Institutional Class shares. Prior to October 26, 2012, the Investor Class shares were known as Original Class shares. Each class of shares differs principally in its respective administration, 12b-1 distribution and service fees, shareholder servicing, and transfer agent expenses and sales charges, if any. Each class has identical rights to earnings, assets, and voting privileges, except for class-specific expenses and exclusive rights to vote on matters affecting only individual classes.
2). SIGNIFICANT ACCOUNTING POLICIES
The following is a summary of significant accounting policies consistently followed by the Fund in the preparation of the financial statements. These policies are in conformity with U.S. generally accepted accounting principles (“GAAP”)..
| a). | Investment Valuation – All investments in securities are recorded at their estimated fair value, as described in Note 3. |
| b). | Federal Income Taxes – Provision for Federal income taxes or excise taxes has not been made since the Fund has elected to be taxed as a “regulated investment company” and intends to distribute substantially all of its taxable income to its shareholders and otherwise comply with the provisions of the Internal Revenue Code of 1986, as amended, applicable to regulated investment companies. Net investment income or loss and realized gains and losses for federal income tax purposes may differ from that reported on the financial statements because of temporary book and tax basis differences. Temporary differences are primarily the result of the treatment of wash sales for tax reporting purposes. Distributions from net realized gains for book purposes may include short-term capital gains, which are included as ordinary income to shareholders for tax purposes. |
| c). | Income and Expenses – Dividend income is recognized on the ex-dividend date or as soon as information is available to the Fund. Interest income, which includes the amortization of premium and accretion of discount, is recognized on an accrual basis. The Fund is charged for those expenses that are directly attributable to the portfolio, |
| | such as advisory, administration, and certain shareholder service fees. Income, expenses (other than expenses attributable to a specific class), and realized and unrealized gains or losses on investments are allocated to each class of shares based on its respective net assets. |
| d). | Distributions to Shareholders – Dividends from net investment income for the Fund, if any, are declared and paid out annually, usually in November or December. Distributions of net realized capital gains, if any, are declared and paid annually, usually in November or December. |
| e). | Security Transactions – Investment and shareholder transactions are recorded on the trade date. The Fund determines the gain or loss realized from the investment transactions by comparing the original cost of the security lot sold with the net sale proceeds. Discounts and premiums on securities purchased are accreted/amortized over the life of the respective security. |
| f). | Use of Estimates – The preparation of financial statements in conformity with GAAP requires management to make estimates and assumptions that affect the reported amounts of assets and liabilities and disclosure of contingent assets and liabilities at the date of the financial statements and the reported change in net assets during the reporting period. Actual results could differ from those estimates. |
| g). | Share Valuation – The net asset value (“NAV”) per share of the Fund is calculated by dividing the sum of the value of the securities held by the Fund, plus cash or other assets, minus all liabilities (including estimated accrued expenses) by the total number of shares outstanding for the Fund, rounded to the nearest cent. The Fund’s shares will not be priced on days the New York Stock Exchange is closed for trading. The offering and redemption price per share for the Fund is equal to the Fund’s net asset value per share. |
| h). | Foreign Currency – Values of investments denominated in foreign currencies, if any, are converted into U.S. dollars using the spot market rate of exchange at the time of valuation. Purchases and sales of investments and income are translated into U.S. dollars using the spot market rate of exchange prevailing on the respective dates of such transactions. The Fund does not isolate the portion of the results of operations resulting from fluctuations in foreign exchange rates on investments from fluctuations resulting from changes in the market prices of securities held. Such fluctuations are included with the net realized and unrealized gain or loss on investments. Foreign investments present additional risks due to currency fluctuations, economic and political factors, lower liquidity, government regulations, differences in accounting standards, and other factors. |
| i). | Forward Contracts – The Fund may enter into forward currency contracts to reduce its exposure to changes in foreign currency exchange rates on its foreign holdings and to lock in the U.S. dollar cost of firm purchase and sale commitments for securities denominated in foreign currencies. A forward currency contract is a commitment to purchase or sell a foreign currency at a future date at a negotiated forward rate. The gain or loss arising from the difference between the U.S. dollar cost of the original contract and the value of the foreign currency in U.S. dollars upon closing of such contract is included in net realized gain or loss from foreign currency transactions. During the six months ended April 30, 2014, the Fund did not enter into any forward contracts. |
| j). | Repurchase Agreements – The Fund may enter into repurchase agreements with member banks or security dealers of the Federal Reserve Board whom the investment advisor deems creditworthy. The repurchase price generally equals the price paid by the Fund plus interest negotiated on the basis of current short-term rates. |
HENNESSY FUNDS 1-800-966-4354
| | Securities pledged as collateral for repurchase agreements are held by the custodian bank until the respective agreements mature. Provisions of the repurchase agreements ensure that the market value of the collateral, including accrued interest thereon, is sufficient in the event of default of the counterparty. If the counterparty defaults and the value of the collateral declines or if the counterparty enters an insolvency proceeding, realization of the collateral by the Fund may be delayed or limited. |
| k). | Accounting for Uncertainty in Income Taxes – The Fund has adopted accounting policies regarding recognition and measurement of tax positions taken or expected to be taken on a tax return. The Fund has reviewed all open tax years in major jurisdictions and concluded that there is no impact on the Fund’s net assets and no tax liability resulting from unrecognized tax benefits relating to uncertain income tax positions taken or expected to be taken on a tax return. The Fund’s major tax jurisdictions are U.S. Federal and Delaware. As of April 30, 2014, open Federal and state tax years for the Fund include the tax years ended October 31, 2011 through 2013. |
| l). | Derivatives – The Fund may invest in, or enter into, derivatives, such as options, futures contracts, options on futures contracts, and swaps, for a variety of reasons, including to hedge certain risks, to provide a substitute for purchasing or selling particular securities, or to increase potential income gain. Derivatives may provide a cheaper, quicker, or more specifically focused way for a Fund to invest than “traditional” securities would. The main purpose of utilizing these derivative instruments is for hedging purposes. |
| | The Fund has adopted the financial accounting reporting rules as required by the Derivatives and Hedging Topic of the Financial Accounting Standards Board Accounting Standards Codification. Under such rules, the Fund is required to include enhanced disclosure that enables investors to understand how and why an entity uses derivatives, how derivatives are accounted for, and how derivatives instruments affect an entity’s results of operations and financial position. During the six months ended April 30, 2014, the Fund did not hold any derivative instruments. |
| m). | Events Subsequent to the Fiscal Period End – The Fund has adopted financial reporting rules regarding subsequent events that require an entity to recognize in the financial statements the effects of all subsequent events that provide additional evidence about conditions that existed at the date of the balance sheet. Management has evaluated the Fund’s related events and transactions that occurred subsequent to April 30, 2014 through the date of issuance of the Fund’s financial statements. There were no events or transactions that occurred during this period that materially impacted the amounts or disclosures in the Fund’s financial statements. |
3). SECURITIES VALUATION
The Fund has adopted authoritative fair valuation accounting standards that establish an authoritative definition of fair value and set out a hierarchy for measuring fair value. These standards require additional disclosures about the various inputs and valuation techniques used to develop the measurements of fair value and a discussion in changes in valuation techniques and related inputs during the period. These inputs are summarized in the three broad levels listed below:
| | Level 1 – | Quoted unadjusted prices for identical instruments in active markets to which the Fund has access at the date of measurement. |
| | Level 2 – | Quoted prices for similar instruments in active markets; quoted prices for identical or similar instruments in markets that are not active; and model-derived valuations in which all significant inputs and significant value drivers are observable in active markets. Level 2 inputs are those in markets for which there are few transactions, the prices are not current, the prices are fair value adjusted due to post-market close subsequent events (foreign markets), little public information exists, or instances where prices vary substantially over time or among brokered market makers. These inputs may also include interest rates, prepayment speeds, credit risk curves, default rates, and similar data. |
| | Level 3 – | Model-derived valuations in which one or more significant inputs or significant value drivers are unobservable. Unobservable inputs are those inputs that reflect the Fund’s own assumptions about what market participants would use to price the asset or liability based on the best available information. |
Following is a description of the valuation techniques applied to the Fund’s major categories of assets and liabilities measured at fair value on a recurring basis.
Equity Securities – Equity securities, including common stocks, preferred stocks, foreign issued common stocks, exchange traded funds, closed-end mutual funds, and real estate investment trusts, that are traded on a securities exchange for which a last-quoted sales price is readily available will be valued at the last sales price as reported by the primary exchange on which the securities are listed. Securities listed on The NASDAQ Stock Market (“NASDAQ”) will be valued at the NASDAQ Official Closing Price, which may differ from the last sales price reported. Securities traded on a securities exchange for which a last-quoted sales price is not readily available will be valued at the mean between the bid and ask prices. To the extent these securities are actively traded and valuation adjustments are not applied, they are classified in Level 1 of the fair value hierarchy.
Investment Companies – Investments in investment companies (e.g., mutual funds and exchange traded funds) are generally priced at the ending NAV provided by the Fund’s service agent and will be classified in Level 1 of the fair value hierarchy.
Debt Securities – Debt securities, including corporate bonds, asset-backed securities, mortgage-backed securities, municipal bonds, U.S. Treasuries, and U.S. government agency issues, are valued at market on the basis of valuations furnished by an independent pricing service that utilizes both dealer-supplied valuations and formula-based techniques. The pricing service may consider recently executed transactions in securities of the issuer or comparable issuers, market price quotations (where observable), bond spreads, and fundamental data relating to the issuer. In addition, the model may incorporate market observable data such as reported sales of similar securities, broker quotes, yields, bids, offers, and reference data. Certain securities are valued principally using dealer quotations. These securities are generally classified in Level 2 of the fair value hierarchy.
Short-Term Securities – Short-term equity investments, including money market funds, are valued in the manner specified above. Short-term debt investments are valued at amortized cost, if their original maturity was 60 days or less, or by amortizing the values as of the 61st day prior to maturity, if their original term to maturity exceeded 60 days. Short-term securities are generally classified in Level 1 or Level 2 of the fair market hierarchy depending on the inputs used and market activity levels for specific securities.
The Board of Trustees of the Fund (the “Board”) has adopted fair value pricing procedures that are followed when a price for a security is not readily available or if a
HENNESSY FUNDS 1-800-966-4354
significant event has occurred that indicates the closing price of a security no longer represents the true value of that security. Fair value pricing determinations are made in good faith in accordance with these procedures. There are numerous criteria that will be given consideration in determining a fair value of a security. Some of these criteria are trading volume of security and markets, the value of other like securities, and news events with direct bearing to security or market. Fair value pricing results in an estimated price that reasonably reflects the current market conditions in order to rate the portfolio holdings such that shareholder transactions receive a fair net asset value. Depending on the relative significance of the valuation inputs, these securities may be classified in either Level 2 or Level 3 of the fair value hierarchy.
Fair valuing of foreign securities may be determined with the assistance of a pricing service using correlations between the movement of prices of such securities and indices of domestic securities and other appropriate indicators, such as closing market prices of relevant American Depositary Receipts or futures contracts. The effect of using fair value pricing is that the Fund’s NAV will reflect the affected portfolio securities’ value as determined in the judgment of the Board or its designee instead of being determined by the market. Using a fair value pricing methodology to price foreign securities may result in a value that is different from a foreign security’s most recent closing price and from the prices used by other investment companies to calculate their net asset values and are generally considered Level 2 prices in the fair valuation hierarchy. Because the Fund may invest in foreign securities, the value of the Fund’s portfolio securities may change on days when you will not be able to purchase or redeem your shares.
The Board has delegated day-to-day valuation matters to a Valuation Committee comprised of one or more representatives from Hennessy Advisors, Inc., the Fund’s investment advisor. The function of the Valuation Committee is to value securities where current and reliable market quotations are not readily available. All actions taken by the Valuation Committee are reviewed by the Board.
The Fund has performed an analysis of all existing investments to determine the significance and character of all inputs to their fair value determination. Various inputs are used in determining the value of the Fund’s investments. The inputs or methodology used for valuing securities are not necessarily an indication of the risk associated with investing in those securities. Details related to the fair valuation hierarchy of the Fund’s securities as of April 30, 2014 are included in the Fund’s Schedule of Investments.
4). INVESTMENT TRANSACTIONS
Purchases and sales of investment securities (excluding government and short-term investments) for the Fund during the six months ended April 30, 2014 were $46,434,443 and $44,878,918, respectively.
There were no purchases or sales/maturities of long-term U.S. Government Securities for the Fund during the six months ended April 30, 2014.
5). INVESTMENT MANAGEMENT FEE AND OTHER TRANSACTIONS WITH AFFILIATES
Hennessy Advisors, Inc. (the “Advisor”) is the investment advisor of the Fund. The Advisor provides the Fund with investment management services under an Investment Advisory Agreement. The Advisor furnishes all investment advice, office space, facilities, and provides most of the personnel needed by the Fund. As compensation for its services, the Advisor is entitled to a monthly fee from the Fund. The fee is based upon the average daily net assets of the Fund at the annual rate of 0.74%. The net investment advisory fees payable for the Fund as of April 30, 2014 were $90,579.
The Advisor has agreed to waive its fees and absorb expenses to the extent that the total annual operating expenses (excluding all Federal, state and local taxes, interest, brokerage commissions, acquired fund fees and expenses and other costs incurred in connection with the purchase and sale of securities and extraordinary items) exceed 0.98% of the Fund’s net assets for the Institutional Class shares of the Fund. The expense limitation agreement for the Institutional Class shares can only be terminated by the Board.
For a period of three years after the year in which the Advisor waives or reimburses expenses, the Advisor may seek reimbursement from the Fund to the extent that total annual fund operating expenses are less than the expense limitation in effect at the time of the reimbursement. During the three years ended October 31, 2013, no Advisor fees were waived and therefore no expenses are subject to potential recovery.
The Board has approved a Shareholder Servicing Agreement for the Investor Class shares of the Fund, which was instituted to compensate the Advisor for the non-investment management services it provides to the Fund. The Shareholder Servicing Agreement provides for a monthly fee paid to the Advisor at an annual rate of 0.10% of the average daily net assets of the Fund attributable to Investor Class shares. Shareholder servicing fees payable for the Fund as of April 30, 2014 were $11,704.
The Fund has entered into agreements with various brokers, dealers, and financial intermediaries in connection with the sale of shares of the Fund. The agreements provide for periodic payments by the Fund to the brokers, dealers, and financial intermediaries for providing certain shareholder maintenance services (sub-transfer agent expenses). These shareholder services include the pre-processing and quality control of new accounts, shareholder correspondence, answering customer inquiries regarding account status, and facilitating shareholder telephone transactions. Fees paid by the Fund to various brokers, dealers, and financial intermediaries for the six months ended April 30, 2014 were $49,088.
U.S. Bancorp Fund Services, LLC (“USBFS”) provides the Fund with administrative, fund accounting, and transfer agent services, including all regulatory reporting, and necessary office equipment and personnel. As administrator, USBFS prepares various federal and state regulatory filings, reports, and returns for the Fund; prepares reports and materials to be supplied to the Board; monitors the activities of the Fund’s custodian, transfer agent, and accountants; and coordinates the preparation and payment of the Fund’s expenses and reviews the Fund’s expense accruals. Fees paid to USBFS for the six months ended April 30, 2014 were $139,455.
USBFS has voluntarily waived all or a portion of its fees allocated to the Institutional Class shares of the Fund. The administration fees voluntarily waived by USBFS during the six months ended April 30, 2014 were $3,201.
U.S. Bank, N.A., an affiliate of USBFS, serves as the Fund’s custodian. Quasar Distributors, LLC acts as the Fund’s principal underwriter in a continuous public offering of the Fund’s shares. Quasar Distributors, LLC is an affiliate of USBFS and U.S. Bank, N.A.
6). LINE OF CREDIT
The Fund has a line of credit with the other funds in the Hennessy Funds family of funds (the “Hennessy Funds”) in the amount of the lesser of (i) $100,000,000 or (ii) 33.33% of each Hennessy Fund’s net assets, or 30% for the Hennessy Gas Utility Index Fund and 10% for the Hennessy Balanced Fund, intended to provide short-term financing, if necessary, subject to certain restrictions, in connection with shareholder redemptions. The credit facility is with the Hennessy Funds’ custodian bank, U.S. Bank, N.A. Borrowings
HENNESSY FUNDS 1-800-966-4354
under this arrangement bear interest at the bank’s prime rate. During the six months ended April 30, 2014, the Fund did not have any borrowings outstanding under the line of credit.
7). FEDERAL TAX INFORMATION
As of October 31, 2013, the Fund’s most recent fiscal year end, the components of accumulated earnings (losses) for income tax purposes for the Fund were as follows:
| | Cost of investments for tax purposes | | $ | 110,932,811 | |
| | Gross tax unrealized appreciation | | $ | 34,383,174 | |
| | Gross tax unrealized depreciation | | | (2,440,803 | ) |
| | Net tax unrealized appreciation/depreciation | | $ | 31,942,371 | |
| | Undistributed ordinary income | | $ | 3,048,910 | |
| | Undistributed long-term capital gains | | | — | |
| | Total distributable earnings | | $ | 3,048,910 | |
| | Other accumulated gain (loss) | | $ | (32,066,745 | ) |
| | Total accumulated gain (loss) | | $ | 2,924,536 | |
The difference between book-basis and tax-basis unrealized appreciation is attributable primarily to capital loss carry overs, wash sales, and partnership adjustments.
At October 31, 2013, the Fund’s most recent fiscal year end, the Fund had capital loss carryforwards that expire as follows:
During the year ended October 31, 2013, the Fund’s most recent fiscal year end, the capital loss carry forwards utilized for the Fund were $11,775,111.
Capital losses sustained in the year ended October 31, 2012 and in future taxable years will not expire and may be carried over by the Fund without limitation; however, they will retain the character of the original loss. Furthermore, any losses incurred during those taxable years will be required to be utilized prior to the losses incurred in the pre-enactment taxable years. As a result of this ordering rule, pre-enactment capital loss carryforwards may be more likely to expire unused. Under pre-enactment law, capital losses could be carried forward for eight years, and carried forward as short-term capital losses, irrespective of the character of the original loss.
At October 31, 2013, the Fund did not defer, on a tax basis, any post-December late year ordinary loss deferrals or post-December loss deferrals.
The tax character of distributions paid during fiscal year 2014 (year-to-date) and fiscal year 2013 for the Fund were as follows:
| | | | Six Months Ended | | | Year Ended | |
| | | | April 30, 2014 | | | October 31, 2013 | |
| | Ordinary income | | $ | 3,600,698 | | | $ | 3,339,992 | |
| | Long-term capital gain | | | — | | | | — | |
| | | | $ | 3,600,698 | | | $ | 3,339,992 | |
8). AGREEMENT AND PLAN OF REORGANIZATION
On December 11, 2013, the Board approved an Agreement and Plan of Reorganization (the “Agreement”), of the Hennessy Cornerstone Value Fund (the “New Fund”), pursuant to which the New Fund would be a successor to the corresponding series of the same name of Hennessy Mutual Funds, Inc., a Maryland corporation (the “Predecessor Fund”). The Agreement provided for the transfer of assets of the Predecessor Fund to the New Fund and the assumption of the liabilities of the Predecessor Fund by the New Fund. The
New Fund had the same investment objective and substantially similar principal investment strategies as the Predecessor Fund. The reorganization was effective as of the close of business on February 28, 2014. The following table illustrates the specifics of the reorganization:
| | | Shares of the New Fund | | | |
| | Predecessor Fund | Issued to Shareholders of | New Fund | Combined | Tax Status |
| | Net Assets | the Predecessor Fund | Net Assets | Net Assets | of Transfer |
| | $143,051,399(1) | 8,349,070 | $143,051,399 | $143,051,399 | Non-taxable |
| | (1) | Included accumulated realized losses and unrealized appreciation in the amounts of $(23,524,673) and $28,156,692, respectively. |
HENNESSY FUNDS 1-800-966-4354
Expense Example (Unaudited)
April 30, 2014
As a shareholder of the Fund, you incur two types of costs: (1) transaction costs, including sales charges (loads) on purchase payments, reinvested dividends, or other distributions; redemption fees; and exchange fees; and (2) ongoing costs, including management fees; service fees; and other Fund expenses. This Example is intended to help you understand your ongoing costs (in dollars) of investing in the Fund and to compare these costs with the ongoing costs of investing in other mutual funds. The Example is based on an investment of $1,000 invested at the beginning of the period and held for the entire period from November 1, 2013 through April 30, 2014.
Actual Expenses
The first line of the table below under the “Investor Class” and “Institutional Class” headings provides information about actual account values and actual expenses. Although the Fund charges no sales loads or transaction fees, you will be assessed fees for outgoing wire transfers, returned checks and stop payment orders at prevailing rates charged by U.S. Bancorp Fund Services, LLC, the Fund’s transfer agent. If you request that a redemption be made by wire transfer, currently a $15.00 fee is charged by the Fund’s transfer agent. IRA accounts will be charged a $15.00 annual maintenance fee. The example below includes, but is not limited to, management fees, shareholder servicing fees, fund accounting, custody, and transfer agent fees. However, the example below does not include portfolio trading commissions and related expenses, and other extraordinary expenses as determined under generally accepted accounting principles. You may use the information in this line, together with the amount you invested, to estimate the expenses that you paid over the period. Simply divide your account value by $1,000 (for example, an $8,600 account value divided by $1,000 = 8.6), then multiply the result by the number in the first line of the table under the “Investor Class” and “Institutional Class” headings in the column entitled “Expenses Paid During Period” to estimate the expenses you paid on your account during this period.
Hypothetical Example for Comparison Purposes
The second line of the table below under the “Investor Class” and “Institutional Class” headings provides information about hypothetical account values and hypothetical expenses based on the Fund’s actual expense ratios and an assumed rate of return of 5% per year before expenses, which is not the Fund’s actual return. The hypothetical account values and expenses may not be used to estimate the actual ending account balance or expenses you paid for the period. You may use this information to compare the ongoing costs of investing in the Fund and other funds. To do so, compare this 5% hypothetical example with the 5% hypothetical examples that appear in the shareholder reports of the other funds. Please note that the expenses shown in the table are meant to highlight your ongoing costs only and do not reflect any transactional costs, such as sales charges (loads), or exchange fees. Therefore, the second line of the table under the “Investor Class” and “Institutional Class” headings is useful in comparing ongoing costs only, and will not help you determine the relative total costs of owning different funds. In addition, if these transactional costs were included, your costs would have been higher.
| | | | Expenses Paid |
| | Beginning | Ending | During Period(1) |
| | Account Value | Account Value | November 1, 2013 – |
| | November 1, 2013 | April 30, 2014 | April 30, 2014 |
| Investor Class | | | |
| | | | |
| Actual | $1,000.00 | $1,084.10 | $6.20 |
| | | | |
| Hypothetical (5% return | | | |
| before expenses) | $1,000.00 | $1,018.84 | $6.01 |
| | | | |
| Institutional Class | | | |
| | | | |
| Actual | $1,000.00 | $1,084.80 | $5.07 |
| | | | |
| Hypothetical (5% return | | | |
| before expenses) | $1,000.00 | $1,019.93 | $4.91 |
| (1) | Expenses are equal to the Fund’s annualized expense ratio of 1.20% for Investor Class shares or 0.98% for Institutional Class shares, as applicable, multiplied by the average account value over the period, multiplied by 181/365 days (to reflect one-half year period). |
HENNESSY FUNDS 1-800-966-4354
Proxy Voting
A description of the policies and procedures the Fund uses to determine how to vote proxies relating to portfolio securities is available without charge: (1) by calling 1-800-966-4354; (2) on the Hennessy Funds’ website at hennessyfunds.com; or (3) on the U.S. Securities and Exchange Commission’s (the “SEC”) website at www.sec.gov. The Fund’s proxy voting record is available on both the Hennessy Funds’ website at hennessyfunds.com and the SEC’s website at www.sec.gov no later than August 31 for the prior 12 months ending June 30.
Quarterly Filings on Form N-Q
The Fund files its complete schedule of portfolio holdings with the SEC for the first and third quarters of each fiscal year on Form N-Q. The Fund’s Forms N-Q will be available on the SEC’s website at www.sec.gov. The Fund’s Forms N-Q may be reviewed and copied at the SEC’s Public Reference Room in Washington, DC and information on the operation of the Public Reference Room may be obtained by calling 1-800-SEC-0330. Information included in the Fund’s Forms N-Q will also be available upon request by calling 1-800-966-4354.
Federal Tax Distribution Information
(Unaudited)
For the fiscal year ended October 31, 2013, certain dividends paid by the Fund may be subject to a maximum tax rate of 15%, as provided for by the Jobs and Growth Tax Relief Reconciliation Act of 2003. The percentage of dividends declared from ordinary income designated as qualified dividend income was 100.00%.
For corporate shareholders, the percent of ordinary income distributions qualifying for the corporate dividends received deduction for the fiscal year ended October 31, 2013 was 100.00%.
The percentage of taxable ordinary income distributions that are designated as short-term capital gain distributions under Section 871(k)(2)(C) of the Internal Revenue Code of 1986, as amended, for the Fund was 0.00%.
Householding
To help keep the Fund’s costs as low as possible, we generally deliver a single copy of most financial reports and prospectuses to shareholders who share an address, even if the accounts are registered under different names. This process, known as “householding,” does not apply to account statements. You may, of course, request an individual copy of a prospectus or financial report at any time. If you would like to receive separate mailings, please call the Administrator at 1-800-261-6950 or 1-414-765-4124 and we will begin individual delivery within 30 days of your request. If your account is held through a financial institution or other intermediary, please contact them directly to request individual delivery.
Board Approval of Investment Advisory
Agreement
At its meeting on December 4, 2013, the Board of Trustees of the Fund (the “Board”) unanimously approved the investment advisory agreement of the Fund for an initial period of two years.
The Board reviewed a number of documents, including a memorandum provided by outside legal counsel that described the fiduciary duties of the Board with respect to approving the investment advisory agreement and the relevant factors for consideration, the Advisor’s most recent Form 10-K, a copy of the advisory agreement, a fund fact sheet, and peer expense and performance comparisons. The Board considered and discussed numerous factors, including the following:
| | • | The Board considered the services identified below that are provided by the Advisor: |
| | | • | The Advisor acts as portfolio manager for the Fund. In this capacity, the Advisor manages the composition of the portfolio of the Fund, including the purchase, retention, and disposition of portfolio securities in accordance with the Fund’s investment objectives, policies, and restrictions. The Advisor holds a perpetual, royalty-free, exclusive license to the formula used for the Fund. |
| | | • | The Advisor oversees distribution of the Fund through third-party broker/dealers and independent financial institutions such as Charles Schwab, Inc., Fidelity, TD Waterhouse, and Pershing. The Advisor participates in “no transaction fee” (“NTF”) programs with these companies on behalf of the Fund, which allows customers to purchase the Fund through third-party distribution channels without paying a transaction fee. The Advisor compensates a number of these third-party providers of NTF programs out of its own revenues and not those of the Fund. |
| | | • | The Advisor oversees service providers that support the Fund in providing fund accounting, fund administration, fund distribution, transfer agency, and custodial services. |
| | • | The Board considered that the advisory services to be provided by the Advisor are services required for the operation of the Fund. |
| | • | The Board considered the nature and quality of the advisory services offered by the Advisor to the Fund. |
| | • | The Board considered that the terms of the advisory agreement are fair and reasonable. |
| | • | The Board compared the performance of the Fund to benchmark indices over various periods of time and concluded that the positive performance of the Fund warranted the approval of the advisory agreement. |
| | • | The Board reviewed the Fund’s expense ratio and comparable expense ratios for funds comparable to the Fund. The Board used data from Morningstar showing funds similar in asset size and investment objective to the Fund and determined that the expense ratio of the Fund falls within the range of the ratios of other comparable funds and concluded that the expenses of the Fund were reasonable. |
| | • | The Board considered the fees charged by the Advisor to those of funds similar in asset size and investment objective to the Fund and concluded the advisory fee of the Fund was reasonable and warranted approval of the advisory agreement. |
HENNESSY FUNDS 1-800-966-4354
| | • | The Board considered the profitability of the Advisor with respect to the Fund and concluded the profits were reasonable and not excessive when compared to profitability guidelines set forth in relevant court cases. |
| | • | The Board considered the high level of professionalism and knowledge of the Advisor’s employees, along with an extremely low level of turnover of the employees of the Advisor, and concluded that this was beneficial to the Fund and its shareholders, as it ensures that the Fund is operated efficiently. |
All of the factors above were considered separately by the Board, including the Trustees who are not “interested persons” (as defined in the Investment Company Act of 1940, as amended) of the Fund (the “Independent Trustees”) meeting in an executive session. The factors were viewed in their totality by the Board, with no single factor being the principal or determinative factor in the Board’s determination of whether to approve the advisory agreement. Based on the factors discussed above, the Board, including all of the Independent Trustees, recommended approval of the advisory agreement.
(This Page Intentionally Left Blank.)
For information, questions or assistance, please call
The Hennessy Funds
1-800-966-4354 or 1-415-899-1555
INVESTMENT ADVISOR
Hennessy Advisors, Inc.
7250 Redwood Blvd., Suite 200
Novato, California 94945
ADMINISTRATOR,
TRANSFER AGENT,
DIVIDEND PAYING AGENT &
SHAREHOLDER SERVICING AGENT
U.S. Bancorp Fund Services, LLC
P.O. Box 701
Milwaukee, Wisconsin 53201-0701
CUSTODIAN
U.S. Bank N.A.
Custody Operations
1555 North River Center Dr., Suite 302
Milwaukee, Wisconsin 53212
TRUSTEES
Neil J. Hennessy
Robert T. Doyle
J. Dennis DeSousa
Gerald P. Richardson
COUNSEL
Foley & Lardner LLP
777 East Wisconsin Avenue
Milwaukee, Wisconsin 53202-5306
INDEPENDENT REGISTERED
PUBLIC ACCOUNTING FIRM
KPMG LLP
777 East Wisconsin Avenue
Milwaukee, Wisconsin 53202-5306
DISTRIBUTOR
Quasar Distributors, LLC
615 East Michigan Street
Milwaukee, Wisconsin 53202
hennessyfunds.com | 1-800-966-4354
This report has been prepared for shareholders and may be distributed to
others only if preceded or accompanied by a current prospectus.
SEMI-ANNUAL REPORT
APRIL 30, 2014
HENNESSY LARGE VALUE FUND
Investor Class HLVFX
Institutional Class HLVIX
hennessyfunds.com | 1-800-966-4354
(This Page Intentionally Left Blank.)
Contents
| Letter to Shareholders | 2 |
| Performance Overview | 4 |
| Financial Statements | |
| Schedule of Investments | 7 |
| Statement of Assets and Liabilities | 13 |
| Statement of Operations | 14 |
| Statements of Changes in Net Assets | 16 |
| Financial Highlights | 18 |
| Notes to the Financial Statements | 22 |
| Expense Example | 29 |
| Proxy Voting | 31 |
| Quarterly Filings on Form N-Q | 31 |
| Federal Tax Distribution Information | 31 |
| Householding | 31 |
| Board Approval of Investment Advisory Agreements | 32 |
HENNESSY FUNDS 1-800-966-4354
June 2014
Dear Shareholder:
The financial markets have provided strong returns over the past six-months ended April 30, 2014, with the Dow Jones Industrial Average (DJIA) and S&P 500 both returning approximately 8% during the period. The current valuation metrics of the major indices are solid; for example, the DJIA currently has a price-to-earnings ratio of 15x and a price-to-sales ratio of 1.75x. The DJIA also has a dividend yield of 2.2%, which is nearly as high as that of a 10-Year U.S. Treasury, which is currently yielding 2.6%. Investing in high-yielding, high-quality DJIA stocks have the potential to not only provide an income stream but also for stock price appreciation as well. Fixed income investing has run its course, in my opinion, and many individuals are currently benefiting from the return to investing in equities that possess strong fundamentals.
U.S. corporations continue to drive shareholder value by making acquisitions, initiating and raising dividends, investing in internal infrastructure, and buying back stock. However, lately I have begun to see a shift in those business strategies. The easier-to-execute acquisitions seem to be a thing of the past, and firms now have to be even more creative to execute accretive deals. I also believe that while firms may continue to initiate dividends, fewer firms will raise their dividends and fewer firms will participate in stock buyback programs going forward. So what will these cash-rich companies do with their capital if they are not raising dividends or buying back stock? I believe we will see companies begin to initiate capital expenditure programs.
Due to the continuing uncertainty from a lack of clear policies on taxes, healthcare, and regulations, I have observed that corporations would rather wait for clarity from our government leaders and defer any significant changes to their current business models. Up until this point, there has been no real cost for firms to defer spending their capital as they wait for anticipated guidance on policies that directly affect their businesses. But, this economic handcuffing from all of this uncertainty has gone on long enough. I believe there will now be firms who want to improve their margins and will begin spending money to expand their sales, and may even begin to hire. Once a competitor begins to move in this way, then the cost to defer becomes real for companies. This movement to expansion may well be a catalyst to propel the financial markets. I do believe this will be a slow shift, but one that will keep the economy improving, and should, in my opinion, help to generate reasonable market returns over the next few years.
With almost $3 trillion in cash sitting on the sidelines, this strategic shift by companies to begin spending their idle capital should help the economic recovery in the U.S. But that is only one part of the equation. Washington politics still play a role in how strong that recovery will be. The national political landscape will change in the next few years, and the future generation of elected officials will be faced with what I believe are fictitious unemployment figures (6.3% reported, when over 20 million Americans are looking for more work or a better job), a sluggish economy, and global competition in business. The next regime needs to provide real clarity on the issues that face all Americans and American corporations: taxation, regulation, and how to pay for our new healthcare system. I also believe that our government needs to regard business as a noble profession and to implement common sense and logic in their policy making instead of politics as usual. As Confucius is quoted as saying, “Life is really simple, but we insist on making it complicated.”
I am confident that even with all the hurdles facing corporate America, companies continue to provide good value for their shareholders, and I believe that means the financial markets are in good shape and should remain strong moving forward, I also believe that the next few months may be volatile. Fads come and go, and the current buzz on the Street is around investing in social media stocks. I believe that chasing hot products has contributed and will continue to contribute to the volatility of the markets this year. After over 35 years in the business, I still firmly believe the best way to position your portfolio is by investing in good companies over the long term, rather than trying to buy the next hot idea at exactly the right time. At Hennessy Funds, hunches and fads have no place in our investment process, and we understand that successful investing comes from time in the market, not timing the market.
We remain focused on investing based on proven fundamentals, and we are committed to managing money for the sole benefit of our shareholders. If you have any questions or want to speak with us directly, please don’t hesitate to call us at (800) 966-4354.
Best regards,
Neil J. Hennessy
President and Chief Investment Officer
Past performance does not guarantee future results.
Mutual fund investing involves risk. Principal loss is possible.
Opinions expressed are those of Neil Hennessy and are subject to change, are not guaranteed and should not be considered investment advice.
The Dow Jones Industrial Average and S&P 500 are unmanaged indices commonly used to measure the performance of U.S. stocks. One cannot invest directly in an index.
Price-to-sales ratio and price-to-earnings ratio are tools for calculating relative valuation. Price-to-sales ratio is calculated by dividing the market price by revenue per share. Price-to-earnings ratio is the market price per share divided by earnings per share.
HENNESSY FUNDS 1-800-966-4354
Performance Overview (Unaudited)
The opinions expressed in the following commentary reflect those of the Portfolio Managers as of the date written. Any such opinions are subject to change based on market or other conditions and are not guaranteed. These opinions may not be relied upon as investment advice. Investment decisions for the Fund are based on several factors, and may not be relied upon as an indication of trading intent on behalf of the Fund. Security positions can and do change.
AVERAGE ANNUAL TOTAL RETURN PERIODS ENDED APRIL 30, 2014
| | Six | One | Five | Ten |
| | Months(1) | Year | Years | Years |
| Hennessy Large Value Fund – | | | | |
| Investor Class (HLVFX) | 7.57% | 17.24% | 16.37% | 6.15% |
| Hennessy Large Value Fund – | | | | |
Institutional Class (HLVIX)(2) | 7.77% | 17.65% | 16.81% | 6.36% |
Russell 1000® Value Index | 9.61% | 20.90% | 19.52% | 7.95% |
| S&P 500 Index | 8.36% | 20.44% | 19.14% | 7.67% |
Expense ratios: 1.33% (Investor Class); Gross 1.14%, Net 0.98%(3) (Institutional Class)
Performance data quoted represents past performance; past performance does not guarantee future results. The investment return and principal value of an investment will fluctuate so that an investor’s shares, when redeemed, may be worth more or less than their original cost. Current performance of the Fund may be lower or higher than the performance quoted. Performance for periods prior to March 20, 2009 reflects the performance of the Tamarack Value Fund, the predecessor to the Hennessy Large Value Fund. Performance data current to the most recent month end may be obtained by visiting hennessyfunds.com.
The expense ratios presented are from the most recent prospectus.
| (1) | Periods less than one year are not annualized. |
| (2) | The inception date of the Institutional Class shares is March 20, 2009. Performance shown prior to the inception of the Institutional Class shares reflects the performance of the Tamarack Value Fund’s Class S shares and includes expenses that are not applicable to and are different than those of the Investor Class and Institutional Class shares. |
| (3) | With regard to Institutional Class shares, the Fund’s investment advisor has contractually agreed to waive a portion of its expenses indefinitely. |
PERFORMANCE NARRATIVE
RBC GLOBAL ASSET MANAGEMENT (U.S.) INC., SUB-ADVISOR
Portfolio Managers Stuart Lippe, Barbara Browning, CFA, and Adam Scheiner, CFA, RBC Global Asset Management (U.S.) Inc. (sub-advisor)
Over the previous six months, how did the Fund perform and what factors contributed to this performance?
For the six-month period ended April 30, 2014, the Investor Class of the Hennessy Large Value Fund returned 7.57%, underperforming the Russell 1000® Value Index, the S&P 500 Index, and the Morningstar Large Value Category Average, which returned 9.61%, 8.36%, and 8.14% for the same period, respectively.
While the Fund had strong absolute performance for the six-month period, its relative underperformance was driven by stock selection across a number of sectors including Health Care, Materials, Consumer Discretionary, Financials, Utilities, Consumer Staples and Telecommunications. Conversely, stock selection in the Energy, Industrials,
and Information Technology sectors benefited performance. Sector allocation detracted modestly from performance as the Fund’s sector neutral mandate, by design, limits the impact of sector weighting decisions. We instead make investment decisions at the industry level.
Within the Health Care sector, not owning Merck & Co., Inc. (up 32% during the six-month period) hurt relative performance. Merck & Co., Inc. reported strong earnings and experienced higher than expected sales throughout much of its product line. The Fund’s overweight position in Pfizer, Inc. partially offset this, as some excitement over the company’s oncology pipeline and a solid beating of earnings created significant interest in the stock. Also, the Fund’s slight overweight position in Johnson & Johnson benefited performance as the stock was up nearly 11% during the six-month period. A solid quarter on the back of the fact that Johnson & Johnson has one of the youngest and strongest drug portfolios in the industry propelled the stock. The company has strong entries in atrial fibrillation (Eliquis), diabetes (Invokana) and prostate cancer (Zytiga), which continue to push the stock higher. The Fund continues to hold positions in Pfizer Inc. and Johnson & Johnson.
Stock selection in the Materials sector was also a significant detractor from relative performance over the six-month period. The Fund’s overweight position in Freeport-McMoRan Copper & Gold, Inc. hurt performance as the stock was down 16% during the Fund’s holding period. The stock was impacted by the announcement of an export tax from Indonesia, which is where the company’s largest and lowest cost mine is located, a slowing in Chinese economic data (China is the company’s largest user of copper), and a corporate bond default in China that scared the market as copper is often used as collateral in financing in the region. The Fund’s overweight position in Huntsman Corporation and CF Industries Holdings, Inc., partially offset the negative performance of Freeport-McMoRan Copper & Gold, Inc. The Fund no longer holds Freeport-McMoRan Copper & Gold Inc. or CF Industries Holdings, Inc.
On the positive side of the ledger, stock selection within the Energy sector added to the relative performance of the Fund. Helmerich & Payne, Inc. and Exxon Mobil Corporation were both strong performers. Helmerich & Payne, Inc. has been the single best performing energy stock in the Russell 1000® Value Index benchmark over the last six months, returning close to 42% over the period. The stock has benefited from a variety of factors, including having the most technologically advanced fleet of rigs of any of the land drillers. Demand and pricing for land rigs have been excellent as both majors and independent exploration and production companies have started to intensify their spending in the Permian, Eagle Ford, Marcellus, and other promising U.S. oil fields. The Fund’s allocation to Exxon Mobil Corporation benefited performance as the stock reported better than expected earnings, and for the first time in many quarters output numbers did not disappoint. Net income rose nicely, and the stock was up nearly 16% over the six–month period. The Fund continues to hold both of these positions.
Additional Portfolio Manager commentary and related investment outlook:
We remain confident in our stock selection-driven process and our ability to find special situation stocks that we believe can outperform regardless of the market environment. While investment decisions are the result of bottom-up stock selection, and our sector-neutral mandate requires investment in all ten major sectors, there are a number of industry-based themes that we believe could lead to outperformance as we head further into 2014. With respect to consumer spending, consumers are spending more of their dollars on housing related, durable goods related, and hard-line retail related (home and auto) items, and less on soft-line and multi-line retail-related items (apparel and shoes).
HENNESSY FUNDS 1-800-966-4354
This trend has been apparent in company results and stock performance through 2013 and the beginning of 2014, and while we think it will continue, we are looking for opportunities in stocks that have over-discounted this theme.
In regard to technology, trends in the industry continue to favor companies exposed to the secular growth areas of mobile, cloud, and IT as a service. We continue to look for attractively valued opportunities in these areas rather than the legacy enterprise IT names. We are overweight semiconductors as we look for exposure to the Internet of Things (IoT). Essentially, IoT is the idea of everyday things becoming “connected” or “smart.” This transition is occurring in autos through infotainment offerings, safety features, and fuel efficiency mechanisms that all require integrated circuits and sensors to communicate, measure, and process data. The theme is also accelerating in industrial automation, appliances, and fitness wearables to name a few areas. While IoT is still in its infancy, we are seeing strong penetration in autos and other industrial end markets.
We also expect a continued rebound in capital market activity to positively impact the Fund’s holdings in asset managers and money center banks and an increased utilization in the health care industry prompted by health care reform (specifically with regard to managed care) to support our overweight position in health care providers and services.
_______________
The Russell 1000® Value Index is an unmanaged index commonly used to measure the performance of U.S. large-capitalization value stocks. The S&P 500 Index is an unmanaged index commonly used to measure the performance of U.S. stocks. You cannot invest directly in an index. Performance data for an index does not reflect any deductions for fees, expenses or taxes. The Fund may invest in medium-capitalization companies, which may have more limited liquidity and greater price volatility than large-capitalization companies. References to specific securities should not be considered a recommendation to buy or sell any security. Fund holdings and sector allocations are subject to change. Please refer to the Schedule of Investments included in this report for additional portfolio information.
Each Morningstar category average represents a universe of funds with similar investment objectives. © Morningstar, Inc. All Rights Reserved. The information contained herein: 1) is proprietary to Morningstar; 2) may not be copied or distributed and 3) is not warranted to be accurate, complete or timely. Neither Morningstar nor its content providers are responsible for any damages or losses arising from any use of this information. Past performance does not guarantee future results.
Schedule of Investments
HENNESSY LARGE VALUE FUND
As of April 30, 2014 (Unaudited)
(% of Net Assets)
| | TOP TEN HOLDINGS (EXCLUDING CASH/CASH EQUIVALENTS) | % NET ASSETS |
| | Wells Fargo & Co. | 4.58% |
| | Pfizer, Inc. | 3.76% |
| | J.P. Morgan Chase & Co. | 3.47% |
| | Chevron Corp. | 3.44% |
| | Johnson & Johnson | 3.14% |
| | Exxon Mobil Corp. | 3.05% |
| | Helmerich & Payne, Inc. | 2.77% |
| | Apple, Inc. | 2.21% |
| | The Walt Disney Co. | 2.09% |
| | Medtronic, Inc. | 1.99% |
Note: For presentation purposes, the Fund has grouped some of the industry categories. For purposes of categorizing securities for compliance with Section 8(b)(1) of the Investment Company Act of 1940, the Fund uses more specific industry classifications.
HENNESSY FUNDS 1-800-966-4354
| | COMMON STOCKS – 96.13% | | Number | | | | | | % of | |
| | | | of Shares | | | Value | | | Net Assets | |
| | Consumer Discretionary – 6.38% | | | | | | | | | |
| | Ford Motor Co. | | | 120,665 | | | $ | 1,948,740 | | | | 1.31 | % |
| | Lowes Companies, Inc. | | | 19,060 | | | | 875,044 | | | | 0.58 | % |
| | Macy’s, Inc. | | | 26,135 | | | | 1,500,933 | | | | 1.01 | % |
| | The Walt Disney Co. | | | 39,195 | | | | 3,109,731 | | | | 2.09 | % |
| | Time Warner, Inc. | | | 31,195 | | | | 2,073,220 | | | | 1.39 | % |
| | | | | | | | | 9,507,668 | | | | 6.38 | % |
| | | | | | | | | | | | | | |
| | Consumer Staples – 4.21% | | | | | | | | | | | | |
| | CVS Caremark Corp. | | | 33,480 | | | | 2,434,666 | | | | 1.63 | % |
| | Kraft Foods Group, Inc. | | | 37,880 | | | | 2,153,857 | | | | 1.45 | % |
| | Procter & Gamble Co. | | | 20,410 | | | | 1,684,845 | | | | 1.13 | % |
| | | | | | | | | 6,273,368 | | | | 4.21 | % |
| | | | | | | | | | | | | | |
| | Energy – 15.28% | | | | | | | | | | | | |
| | Anadarko Petroleum Corp. | | | 22,395 | | | | 2,217,553 | | | | 1.49 | % |
| | Chevron Corp. | | | 40,825 | | | | 5,124,354 | | | | 3.44 | % |
| | Exxon Mobil Corp. | | | 44,385 | | | | 4,545,468 | | | | 3.05 | % |
| | Helmerich & Payne, Inc. | | | 37,995 | | | | 4,128,157 | | | | 2.77 | % |
| | Marathon Oil Corp. | | | 63,050 | | | | 2,279,258 | | | | 1.53 | % |
| | Pioneer Natural Resources Co. | | | 11,560 | | | | 2,234,201 | | | | 1.50 | % |
| | Valero Energy Corp. | | | 39,020 | | | | 2,230,773 | | | | 1.50 | % |
| | | | | | | | | 22,759,764 | | | | 15.28 | % |
| | | | | | | | | | | | | | |
| | Financials – 24.25% | | | | | | | | | | | | |
| | Affiliated Managers Group, Inc. (a) | | | 5,950 | | | | 1,179,290 | | | | 0.79 | % |
| | Allstate Corp. | | | 40,810 | | | | 2,324,129 | | | | 1.56 | % |
| | American International Group, Inc. | | | 28,200 | | | | 1,498,266 | | | | 1.01 | % |
| | BlackRock, Inc. | | | 6,990 | | | | 2,103,990 | | | | 1.41 | % |
| | Citigroup, Inc. | | | 50,455 | | | | 2,417,299 | | | | 1.62 | % |
| | Genworth Financial, Inc. (a) | | | 86,150 | | | | 1,537,777 | | | | 1.03 | % |
| | Hartford Financial Services Group, Inc. | | | 48,945 | | | | 1,755,657 | | | | 1.18 | % |
| | J.P. Morgan Chase & Co. | | | 92,365 | | | | 5,170,593 | | | | 3.47 | % |
| | Marsh & McLennan Companies, Inc. | | | 39,595 | | | | 1,952,429 | | | | 1.31 | % |
| | MetLife, Inc. | | | 32,965 | | | | 1,725,718 | | | | 1.16 | % |
| | Morgan Stanley | | | 66,875 | | | | 2,068,444 | | | | 1.39 | % |
| | Regions Financial Corp. | | | 132,540 | | | | 1,343,956 | | | | 0.90 | % |
| | State Street Corp. | | | 18,895 | | | | 1,219,861 | | | | 0.82 | % |
The accompanying notes are an integral part of these financial statements.
| | COMMON STOCKS | | Number | | | | | | % of | |
| | | | of Shares | | | Value | | | Net Assets | |
| | Financials (Continued) | | | | | | | | | |
| | SunTrust Banks, Inc. | | | 32,875 | | | $ | 1,257,797 | | | | 0.85 | % |
| | The PNC Financial Services Group, Inc. | | | 20,780 | | | | 1,746,351 | | | | 1.17 | % |
| | Wells Fargo & Co. | | | 137,340 | | | | 6,817,558 | | | | 4.58 | % |
| | | | | | | | | 36,119,115 | | | | 24.25 | % |
| | | | | | | | | | | | | | |
| | Health Care – 13.20% | | | | | | | | | | | | |
| | C.R. Bard, Inc. | | | 7,775 | | | | 1,067,741 | | | | 0.72 | % |
| | CIGNA Corp. | | | 29,525 | | | | 2,363,181 | | | | 1.59 | % |
| | Covidien PLC (b) | | | 30,340 | | | | 2,161,725 | | | | 1.45 | % |
| | Johnson & Johnson | | | 46,150 | | | | 4,674,533 | | | | 3.14 | % |
| | McKesson Corp. | | | 4,805 | | | | 812,958 | | | | 0.55 | % |
| | Medtronic, Inc. | | | 50,400 | | | | 2,964,528 | | | | 1.99 | % |
| | Pfizer, Inc. | | | 179,210 | | | | 5,605,689 | | | | 3.76 | % |
| | | | | | | | | 19,650,355 | | | | 13.20 | % |
| | | | | | | | | | | | | | |
| | Industrials – 10.89% | | | | | | | | | | | | |
| | Caterpillar, Inc. | | | 20,140 | | | | 2,122,756 | | | | 1.42 | % |
| | Danaher Corp. | | | 19,490 | | | | 1,430,176 | | | | 0.96 | % |
| | Delta Air Lines, Inc. | | | 37,065 | | | | 1,365,104 | | | | 0.92 | % |
| | General Dynamics Corp. | | | 20,230 | | | | 2,214,174 | | | | 1.49 | % |
| | General Electric Co. | | | 69,230 | | | | 1,861,595 | | | | 1.25 | % |
| | Honeywell International, Inc. | | | 22,115 | | | | 2,054,483 | | | | 1.38 | % |
| | Ingersoll-Rand PLC (b) | | | 23,575 | | | | 1,409,785 | | | | 0.95 | % |
| | Lockheed Martin Corp. | | | 7,435 | | | | 1,220,381 | | | | 0.82 | % |
| | Parker Hannifin Corp. | | | 8,645 | | | | 1,096,878 | | | | 0.73 | % |
| | Ryder System, Inc. | | | 17,585 | | | | 1,445,135 | | | | 0.97 | % |
| | | | | | | | | 16,220,467 | | | | 10.89 | % |
| | | | | | | | | | | | | | |
| | Information Technology – 10.50% | | | | | | | | | | | | |
| | Adobe Systems, Inc. (a) | | | 20,540 | | | | 1,267,113 | | | | 0.85 | % |
| | Apple, Inc. | | | 5,560 | | | | 3,280,900 | | | | 2.21 | % |
| | Autodesk, Inc. (a) | | | 22,705 | | | | 1,090,294 | | | | 0.73 | % |
| | Cisco Systems, Inc. | | | 80,525 | | | | 1,860,933 | | | | 1.25 | % |
| | Hewlett-Packard Co. | | | 46,925 | | | | 1,551,340 | | | | 1.04 | % |
| | LAM Research Corp. (a) | | | 16,295 | | | | 938,755 | | | | 0.63 | % |
| | Microchip Technology, Inc. | | | 19,180 | | | | 911,817 | | | | 0.61 | % |
| | NXP Semiconductors NV (a)(b) | | | 24,210 | | | | 1,443,400 | | | | 0.97 | % |
The accompanying notes are an integral part of these financial statements.
HENNESSY FUNDS 1-800-966-4354
| | COMMON STOCKS | | Number | | | | | | % of | |
| | | | of Shares | | | Value | | | Net Assets | |
| | Information Technology (Continued) | | | | | | | | | |
| | Skyworks Solutions, Inc. (a) | | | 33,670 | | | $ | 1,382,154 | | | | 0.93 | % |
| | TE Connectivity, Ltd. (b) | | | 14,830 | | | | 874,673 | | | | 0.59 | % |
| | Western Digital Corp. | | | 11,660 | | | | 1,027,596 | | | | 0.69 | % |
| | | | | | | | | 15,628,975 | | | | 10.50 | % |
| | | | | | | | | | | | | | |
| | Materials – 3.91% | | | | | | | | | | | | |
| | CF Industries Holdings, Inc. | | | 3,975 | | | | 974,551 | | | | 0.65 | % |
| | Eastman Chemical Co. | | | 8,505 | | | | 741,381 | | | | 0.50 | % |
| | Huntsman Corp. | | | 56,165 | | | | 1,406,933 | | | | 0.94 | % |
| | International Paper Co. | | | 22,295 | | | | 1,040,062 | | | | 0.70 | % |
| | Newmont Mining Corp. | | | 36,440 | | | | 904,805 | | | | 0.61 | % |
| | Steel Dynamics, Inc. | | | 41,405 | | | | 756,469 | | | | 0.51 | % |
| | | | | | | | | 5,824,201 | | | | 3.91 | % |
| | | | | | | | | | | | | | |
| | Telecommunication Services – 1.57% | | | | | | | | | | | | |
| | AT&T, Inc. | | | 65,580 | | | | 2,341,206 | | | | 1.57 | % |
| | | | | | | | | | | | | | |
| | Utilities – 5.94% | | | | | | | | | | | | |
| | American Electric Power, Inc. | | | 46,075 | | | | 2,479,296 | | | | 1.66 | % |
| | DTE Energy Co. | | | 33,160 | | | | 2,591,122 | | | | 1.74 | % |
| | Northeast Utilities | | | 33,340 | | | | 1,575,649 | | | | 1.06 | % |
| | Sempra Energy | | | 22,305 | | | | 2,199,496 | | | | 1.48 | % |
| | | | | | | | | 8,845,563 | | | | 5.94 | % |
| | Total Common Stocks | | | | | | | | | | | | |
| | (Cost $109,589,901) | | | | | | | 143,170,682 | | | | 96.13 | % |
| | | | | | | | | | | | | | |
| | REITS – 2.80% | | | | | | | | | | | | |
| | Prologis, Inc. | | | 46,655 | | | | 1,895,593 | | | | 1.27 | % |
| | Simon Property Group, Inc. | | | 13,103 | | | | 2,269,440 | | | | 1.53 | % |
| | | | | | | | | | | | | | |
| | Total REITS | | | | | | | | | | | | |
| | (Cost $2,908,963) | | | | | | | 4,165,033 | | | | 2.80 | % |
The accompanying notes are an integral part of these financial statements.
| | SHORT-TERM INVESTMENTS – 1.05% | | Number | | | | | | % of | |
| | | | of Shares | | | Value | | | Net Assets | |
| | Money Market Funds – 1.05% | | | | | | | | | |
| | Fidelity Government Portfolio – | | | | | | | | | |
| | Institutional Class, 0.01% (c) | | | 1,566,474 | | | $ | 1,566,474 | | | | 1.05 | % |
| | | | | | | | | | | | | | |
| | Total Money Market Funds | | | | | | | | | | | | |
| | (Cost $1,566,474) | | | | | | | 1,566,474 | | | | 1.05 | % |
| | | | | | | | | | | | | | |
| | Total Short-Term Investments | | | | | | | | | | | | |
| | (Cost $1,566,474) | | | | | | | 1,566,474 | | | | 1.05 | % |
| | | | | | | | | | | | | | |
| | Total Investments | | | | | | | | | | | | |
| | (Cost $114,065,338) – 99.98% | | | | | | | 148,902,189 | | | | 99.98 | % |
| | Other Assets in Excess | | | | | | | | | | | | |
| | of Liabilities – 0.02% | | | | | | | 26,617 | | | | 0.02 | % |
| | TOTAL NET ASSETS – 100.00% | | | | | | $ | 148,928,806 | | | | 100.00 | % |
| | | | | | | | | | | | | | |
Percentages are stated as a percent of net assets.| (a) | Non-income producing security. |
| (b) | U.S. traded security of a foreign corporation. |
| (c) | The rate listed is the fund’s 7-day yield as of April 30, 2014. |
The accompanying notes are an integral part of these financial statements.
HENNESSY FUNDS 1-800-966-4354
Summary of Fair Value Exposure at April 30, 2014
The following is a summary of the inputs used to value the Fund’s net assets as of April 30, 2014 (See Note 3 in the accompanying notes to the financial statements):
| Common Stock | | Level 1 | | | Level 2 | | | Level 3 | | | Total | |
| Consumer Discretionary | | $ | 9,507,668 | | | $ | — | | | $ | — | | | $ | 9,507,668 | |
| Consumer Staples | | | 6,273,368 | | | | — | | | | — | | | | 6,273,368 | |
| Energy | | | 22,759,764 | | | | — | | | | — | | | | 22,759,764 | |
| Financials | | | 36,119,115 | | | | — | | | | — | | | | 36,119,115 | |
| Health Care | | | 19,650,355 | | | | — | | | | — | | | | 19,650,355 | |
| Industrials | | | 16,220,467 | | | | — | | | | — | | | | 16,220,467 | |
| Information Technology | | | 15,628,975 | | | | — | | | | — | | | | 15,628,975 | |
| Materials | | | 5,824,201 | | | | — | | | | — | | | | 5,824,201 | |
| Telecommunication Services | | | 2,341,206 | | | | — | | | | — | | | | 2,341,206 | |
| Utilities | | | 8,845,563 | | | | — | | | | — | | | | 8,845,563 | |
| Total Common Stock | | $ | 143,170,682 | | | $ | — | | | $ | — | | | $ | 143,170,682 | |
| REITS | | | | | | | | | | | | | | | | |
| Financials | | $ | 4,165,033 | | | $ | — | | | $ | — | | | $ | 4,165,033 | |
| Total REITS | | $ | 4,165,033 | | | $ | — | | | $ | — | | | $ | 4,165,033 | |
| Short-Term Investments | | | | | | | | | | | | | | | | |
| Money Market Funds | | $ | 1,566,474 | | | $ | — | | | $ | — | | | $ | 1,566,474 | |
| Total Short-Term Investments | | $ | 1,566,474 | | | $ | — | | | $ | — | | | $ | 1,566,474 | |
| Total Investments | | $ | 148,902,189 | | | $ | — | | | $ | — | | | $ | 148,902,189 | |
Transfers between levels are recognized at the end of the reporting period. During the six-month period ended April 30, 2014, the Fund recognized no transfers between levels.
The accompanying notes are an integral part of these financial statements.
Financial Statements
Statement of Assets and Liabilities as of April 30, 2014 (Unaudited) |
| ASSETS: | | | |
| Investments in securities, at value (cost $114,065,338) | | $ | 148,902,189 | |
| Dividends and interest receivable | | | 129,708 | |
| Receivable for fund shares sold | | | 14,292 | |
| Receivable for securities sold | | | 1,330,046 | |
| Prepaid expenses and other assets | | | 21,264 | |
| Total Assets | | | 150,397,499 | |
| | | | | |
| LIABILITIES: | | | | |
| Payable for securities purchased | | | 1,197,634 | |
| Payable for fund shares redeemed | | | 60,856 | |
| Payable to advisor | | | 102,790 | |
| Payable to administrator | | | 49,682 | |
| Payable to auditor | | | 12,333 | |
| Accrued service fees | | | 12,064 | |
| Accrued trustees fees | | | 4,735 | |
| Accrued expenses and other payables | | | 28,599 | |
| Total Liabilities | | | 1,468,693 | |
| NET ASSETS | | $ | 148,928,806 | |
| | | | | |
| NET ASSETS CONSIST OF: | | | | |
| Capital stock | | $ | 120,119,400 | |
| Accumulated net investment income | | | 309,599 | |
| Accumulated net realized loss on investments | | | (6,337,044 | ) |
| Unrealized net appreciation on investments | | | 34,836,851 | |
| Total Net Assets | | $ | 148,928,806 | |
| | | | | |
| NET ASSETS | | | | |
| Investor Class: | | | | |
| Shares authorized (no par value) | | Unlimited | |
| Net assets applicable to outstanding Investor Class shares | | | 148,573,208 | |
| Shares issued and outstanding | | | 4,534,296 | |
| Net asset value, offering price and redemption price per share | | $ | 32.77 | |
| | | | | |
| Institutional Class: | | | | |
| Shares authorized (no par value) | | Unlimited | |
| Net assets applicable to outstanding Institutional Class shares | | | 355,598 | |
| Shares issued and outstanding | | | 10,819 | |
| Net asset value, offering price and redemption price per share | | $ | 32.87 | |
The accompanying notes are an integral part of these financial statements.
HENNESSY FUNDS 1-800-966-4354
Financial Statements
Statement of Operations Six Months Ended April 30, 2014 (Unaudited) |
| INVESTMENT INCOME: | | | |
| Dividend income | | $ | 1,497,577 | |
| Interest income | | | 59 | |
| Total investment income | | | 1,497,636 | |
| | | | | |
| EXPENSES: | | | | |
| Investment advisory fees | | | 614,245 | |
| Administration, fund accounting, custody and transfer agent fees | | | 144,528 | |
| Service fees – Investor Class (See Note 5) | | | 72,092 | |
| Sub-transfer agent expenses – Investor Class (See Note 5) | | | 50,465 | |
| Sub-transfer agent expenses – Institutional Class (See Note 5) | | | 143 | |
| Federal and state registration fees | | | 17,388 | |
| Audit fees | | | 10,811 | |
| Compliance expense | | | 10,655 | |
| Reports to shareholders | | | 9,521 | |
| Trustees’ fees and expenses | | | 7,536 | |
| Legal fees | | | 2,480 | |
| Other expenses | | | 8,239 | |
| Total expenses before waiver | | | 948,103 | |
| Administration expense waiver (See Note 5) | | | (422 | ) |
| Net expenses | | | 947,681 | |
| NET INVESTMENT INCOME | | $ | 549,955 | |
| | | | | |
| REALIZED AND UNREALIZED GAINS: | | | | |
| Net realized gain on investments | | $ | 6,023,881 | |
| Change in unrealized appreciation on investments | | | 4,097,154 | |
| Net gain on investments | | | 10,121,035 | |
| NET INCREASE IN NET ASSETS RESULTING FROM OPERATIONS | | $ | 10,670,990 | |
The accompanying notes are an integral part of these financial statements.
(This Page Intentionally Left Blank.)
HENNESSY FUNDS 1-800-966-4354
Financial Statements
| Statements of Changes in Net Assets |
| | | Six Months Ended | | | | |
| | | April 30, 2014 | | | Year Ended | |
| | | (Unaudited) | | | October 31, 2013 | |
| OPERATIONS: | | | | | | |
| Net investment income | | $ | 549,955 | | | $ | 1,323,440 | |
| Net realized gain on securities | | | 6,023,881 | | | | 17,493,521 | |
| Change in unrealized appreciation | | | | | | | | |
| on securities | | | 4,097,154 | | | | 11,896,355 | |
| Net increase in net assets resulting | | | | | | | | |
| from operations | | | 10,670,990 | | | | 30,713,316 | |
| | | | | | | | | |
| DISTRIBUTIONS TO SHAREHOLDERS FROM: | | | | | | | | |
| Net investment income | | | | | | | | |
| Investor Class | | | (1,140,763 | ) | | | (1,437,942 | ) |
| Institutional Class | | | (3,752 | ) | | | (921 | ) |
| Total distributions | | | (1,144,515 | ) | | | (1,438,863 | ) |
| | | | | | | | | |
| CAPITAL SHARE TRANSACTIONS: | | | | | | | | |
| Proceeds from shares subscribed – | | | | | | | | |
| Investor Class | | | 770,878 | | | | 2,715,396 | |
| Proceeds from shares subscribed – | | | | | | | | |
| Institutional Class | | | 9,484 | | | | 440,166 | |
| Dividends reinvested – Investor Class | | | 1,092,130 | | | | 1,378,307 | |
| Dividends reinvested – Institutional Class | | | 3,353 | | | | 921 | |
| Cost of shares redeemed – Investor Class | | | (6,278,694 | ) | | | (14,868,801 | ) |
| Cost of shares redeemed – Institutional Class | | | (16,114 | ) | | | (209,593 | ) |
| Net decrease in net assets derived from | | | | | | | | |
| capital share transactions | | | (4,418,963 | ) | | | (10,543,604 | ) |
| TOTAL INCREASE IN NET ASSETS | | | 5,107,512 | | | | 18,730,849 | |
| | | | | | | | | |
| NET ASSETS: | | | | | | | | |
| Beginning of period | | | 143,821,294 | | | | 125,090,445 | |
| End of period | | $ | 148,928,806 | | | $ | 143,821,294 | |
| Undistributed net investment | | | | | | | | |
| income, end of period | | $ | 309,599 | | | $ | 904,159 | |
The accompanying notes are an integral part of these financial statements.
| Statements of Changes in Net Assets – Continued |
| | | Six Months Ended | | | | |
| | | April 30, 2014 | | | Year Ended | |
| | | (Unaudited) | | | October 31, 2013 | |
| CHANGES IN SHARES OUTSTANDING: | | | | | | |
| Shares sold – Investor Class | | | 24,546 | | | | 99,185 | |
| Shares sold – Institutional Class | | | 295 | | | | 15,876 | |
| Shares issued to holders as reinvestment of dividends – | | | | | | | | |
| Investor Class | | | 34,322 | | | | 55,132 | |
| Shares issued to holders as reinvestment of dividends – | | | | | | | | |
| Institutional Class | | | 105 | | | | 37 | |
| Shares redeemed – Investor Class | | | (199,051 | ) | | | (538,927 | ) |
| Shares redeemed – Institutional Class | | | (506 | ) | | | (7,267 | ) |
| Net decrease in shares outstanding | | | (140,289 | ) | | | (375,964 | ) |
The accompanying notes are an integral part of these financial statements.
HENNESSY FUNDS 1-800-966-4354
Financial Highlights
| Hennessy Large Value Fund |
For an Investor Class share outstanding throughout each period
| | | Six Months Ended | |
| | | April 30, 2014 | |
| | | (Unaudited) | |
| PER SHARE DATA: | | | |
| Net asset value, beginning of period | | $ | 30.70 | |
| | | | | |
| Income from investment operations: | | | | |
| Net investment income | | | 0.12 | |
| Net realized and unrealized gains (losses) on securities | | | 2.20 | |
| Total from investment operations | | | 2.32 | |
| | | | | |
| Less distributions: | | | | |
| Dividends from net investment income | | | (0.25 | ) |
| Total distributions | | | (0.25 | ) |
| Net asset value, end of period | | $ | 32.77 | |
| | | | | |
| TOTAL RETURN | | | 7.57 | %(3) |
| | | | | |
| SUPPLEMENTAL DATA AND RATIOS: | | | | |
| Net assets, end of period (millions) | | $ | 148.57 | |
| Ratio of expenses to average net assets: | | | | |
| Before expense reimbursement | | | 1.31 | %(4) |
| After expense reimbursement | | | 1.31 | %(4) |
| Ratio of net investment income to average net assets: | | | | |
| Before expense reimbursement | | | 0.76 | %(4) |
| After expense reimbursement | | | 0.76 | %(4) |
Portfolio turnover rate(5) | | | 41 | %(3) |
| (1) | For the one month ended October 31, 2009. Effective October 31, 2009, the Fund changed its fiscal year end to October 31 from September 30. |
| (2) | The financial highlights set forth for periods prior to March 20, 2009 represent the historical financial highlights of the Tamarack Value Fund, Class S shares. The assets of the Tamarack Value Fund were acquired by the Hennessy Large Value (formerly known as Hennessy Select Large Value Fund) Fund on March 20, 2009. Prior to the reorganization, Tamarack Value Fund also offered Class A, Class C and R shares. At that time, RBC Global Asset Management (U.S.) Inc., (formerly known as Voyageur Asset Management Inc.) ceased to be investment advisor and Hennessy Advisors, Inc. became investment advisor. The return of the Tamarack Value Fund, Class S shares during the period October 1, 2008 through March 20, 2009 was (33.09)%. The return of the Hennessy Select Large Value Fund, Original Class shares during the period March 20, 2009 through September 30, 2009 was 36.84%. |
| (3) | Not annualized. |
| (4) | Annualized. |
| (5) | Portfolio turnover is calculated on the basis of the Fund as a whole. |
The accompanying notes are an integral part of these financial statements.
| | | | | | | | | | | | | | | | | One Month Ended | | | | Year Ended | |
| | Year Ended October 31, | | | October 31, | | | | September 30, | |
| | 2013 | | | | 2012 | | | | 2011 | | | | 2010 | | | 2009(1) | | | | 2009(2) | |
| | | | | | | | | | | | | | | | | | | | | | | |
| $ | 24.71 | | | $ | 21.47 | | | $ | 20.57 | | | $ | 18.88 | | | $ | 19.49 | | | $ | 21.80 | |
| | | | | | | | | | | | | | | | | | | | | | | |
| | | | | | | | | | | | | | | | | | | | | | | |
| | 0.28 | | | | 0.28 | | | | 0.22 | | | | 0.14 | | | | 0.01 | | | | 0.31 | |
| | 6.00 | | | | 3.14 | | | | 0.89 | | | | 1.78 | | | | (0.62 | ) | | | (2.21 | ) |
| | 6.28 | | | | 3.42 | | | | 1.11 | | | | 1.92 | | | | (0.61 | ) | | | (1.90 | ) |
| | | | | | | | | | | | | | | | | | | | | | | |
| | | | | | | | | | | | | | | | | | | | | | | |
| | (0.29 | ) | | | (0.18 | ) | | | (0.21 | ) | | | (0.23 | ) | | | — | | | | (0.41 | ) |
| | (0.29 | ) | | | (0.18 | ) | | | (0.21 | ) | | | (0.23 | ) | | | — | | | | (0.41 | ) |
| $ | 30.70 | | | $ | 24.71 | | | $ | 21.47 | | | $ | 20.57 | | | $ | 18.88 | | �� | $ | 19.49 | |
| | | | | | | | | | | | | | | | | | | | | | | |
| | 25.64 | % | | | 16.07 | % | | | 5.36 | % | | | 10.22 | % | | | (3.13 | )%(3) | | | (8.43 | )% |
| | | | | | | | | | | | | | | | | | | | | | | |
| | | | | | | | | | | | | | | | | | | | | | | |
| $ | 143.48 | | | $ | 125.00 | | | $ | 123.97 | | | $ | 131.54 | | | $ | 132.77 | | | $ | 138.34 | |
| | | | | | | | | | | | | | | | | | | | | | | |
| | 1.33 | % | | | 1.40 | % | | | 1.38 | % | | | 1.41 | % | | | 1.37 | %(4) | | | 1.42 | % |
| | 1.33 | % | | | 1.40 | % | | | 1.38 | % | | | 1.38 | % | | | 1.30 | %(4) | | | 1.17 | % |
| | | | | | | | | | | | | | | | | | | | | | | |
| | 0.98 | % | | | 1.16 | % | | | 0.97 | % | | | 0.64 | % | | | 0.28 | %(4) | | | 1.46 | % |
| | 0.98 | % | | | 1.16 | % | | | 0.97 | % | | | 0.67 | % | | | 0.35 | %(4) | | | 1.71 | % |
| | 91 | % | | | 111 | % | | | 149 | % | | | 146 | % | | | 10 | %(3) | | | 142 | % |
The accompanying notes are an integral part of these financial statements.
HENNESSY FUNDS 1-800-966-4354
Financial Highlights
| Hennessy Large Value Fund |
For an Institutional Class share outstanding throughout each period
| | | Six Months Ended | |
| | | April 30, 2014 | |
| | | (Unaudited) | |
| PER SHARE DATA: | | | |
| Net asset value, beginning of period | | $ | 30.83 | |
| | | | | |
| Income from investment operations: | | | | |
| Net investment income | | | 0.17 | |
| Net realized and unrealized gains (losses) on securities | | | 2.21 | |
| Total from investment operations | | | 2.38 | |
| | | | | |
| Less distributions: | | | | |
| Dividends from net investment income | | | (0.34 | ) |
| Total distributions | | | (0.34 | ) |
| Net asset value, end of period | | $ | 32.87 | |
| | | | | |
| TOTAL RETURN | | | 7.77 | %(4) |
| | | | | |
| SUPPLEMENTAL DATA AND RATIOS: | | | | |
| Net assets, end of period (millions) | | $ | 0.36 | |
| Ratio of expenses to average net assets: | | | | |
| Before expense reimbursement | | | 1.23 | %(5) |
| After expense reimbursement | | | 0.98 | %(5) |
| Ratio of net investment income to average net assets: | | | | |
| Before expense reimbursement | | | 0.85 | %(5) |
| After expense reimbursement | | | 1.10 | %(5) |
Portfolio turnover rate(6) | | | 41 | %(4) |
| (1) | For the one month ended October 31, 2009. Effective October 31, 2009, the Fund changed its fiscal year end to October 31 from September 30. |
| (2) | Institutional Class shares commenced operations on March 20, 2009. |
| (3) | Amount is less than $0.01 or $(0.01). |
| (4) | Not annualized. |
| (5) | Annualized. |
| (6) | Portfolio turnover is calculated on the basis of the Fund as a whole. |
The accompanying notes are an integral part of these financial statements.
| | | | | | | | | | | | | | | | | | One Month Ended | | | | Period Ended | |
| | Year Ended October 31, | | | | October 31, | | | | September 30, | |
| | 2013 | | | | 2012 | | | | 2011 | | | | 2010 | | | | 2009(1) | | | | 2009(2) | |
| | | | | | | | | | | | | | | | | | | | | | | |
| $ | 24.83 | | | $ | 21.56 | | | $ | 20.65 | | | $ | 18.92 | | | $ | 19.53 | | | $ | 14.25 | |
| | | | | | | | | | | | | | | | | | | | | | | |
| | | | | | | | | | | | | | | | | | | | | | | |
| | 0.49 | | | | 0.39 | | | | 0.27 | | | | 0.21 | | | | 0.00 | (3) | | | 0.08 | |
| | 5.90 | | | | 3.15 | | | | 0.92 | | | | 1.80 | | | | (0.61 | ) | | | 5.20 | |
| | 6.39 | | | | 3.54 | | | | 1.19 | | | | 2.01 | | | | (0.61 | ) | | | 5.28 | |
| | | | | | | | | | | | | | | | | | | | | | | |
| | | | | | | | | | | | | | | | | | | | | | | |
| | (0.39 | ) | | | (0.27 | ) | | | (0.28 | ) | | | (0.28 | ) | | | — | | | | — | |
| | (0.39 | ) | | | (0.27 | ) | | | (0.28 | ) | | | (0.28 | ) | | | — | | | | — | |
| $ | 30.83 | | | $ | 24.83 | | | $ | 21.56 | | | $ | 20.65 | | | $ | 18.92 | | | $ | 19.53 | |
| | | | | | | | | | | | | | | | | | | | | | | |
| | 26.08 | % | | | 16.58 | % | | | 5.76 | % | | | 10.65 | % | | | (3.12 | )%(4) | | | 37.05 | %(4) |
| | | | | | | | | | | | | | | | | | | | | | | |
| | | | | | | | | | | | | | | | | | | | | | | |
| $ | 0.34 | | | $ | 0.06 | | | $ | 0.04 | | | $ | 0.04 | | | $ | 0.03 | | | $ | 0.03 | |
| | | | | | | | | | | | | | | | | | | | | | | |
| | 1.14 | % | | | 1.22 | % | | | 1.21 | % | | | 1.22 | % | | | 1.20 | %(5) | | | 26.18 | %(5) |
| | 0.98 | % | | | 0.98 | % | | | 0.98 | % | | | 0.98 | % | | | 0.98 | %(5) | | | 0.98 | %(5) |
| | | | | | | | | | | | | | | | | | | | | | | |
| | 1.07 | % | | | 1.29 | % | | | 1.13 | % | | | 0.80 | % | | | 0.44 | %(5) | | | (24.06 | )%(5) |
| | 1.23 | % | | | 1.53 | % | | | 1.36 | % | | | 1.04 | % | | | 0.66 | %(5) | | | 1.14 | %(5) |
| | 91 | % | | | 111 | % | | | 149 | % | | | 146 | % | | | 10 | %(4) | | | 142 | %(4) |
The accompanying notes are an integral part of these financial statements.
HENNESSY FUNDS 1-800-966-4354
Notes to the Financial Statements
April 30, 2014 (Unaudited)
1). ORGANIZATION
The Hennessy Large Value Fund (the “Fund”) is a series of Hennessy Funds Trust (the “Trust”), which was organized as a Delaware statutory trust on September 17, 1992. The Fund is an open-end management investment company registered under the Investment Company Act of 1940, as amended. The investment objective of the Fund is long-term growth of capital and current income. The Fund is a diversified fund.
The Fund offers Investor Class and Institutional Class shares. Prior to October 26, 2012, the Investor Class shares were known as Original Class shares. Each class of shares differs principally in its respective administration, 12b-1 distribution and service fees, shareholder servicing, and transfer agent expenses and sales charges, if any. Each class has identical rights to earnings, assets, and voting privileges, except for class-specific expenses and exclusive rights to vote on matters affecting only individual classes.
2). SIGNIFICANT ACCOUNTING POLICIES
The following is a summary of significant accounting policies consistently followed by the Fund in the preparation of the financial statements. These policies are in conformity with U.S. generally accepted accounting principles (“GAAP”).
| a). | Investment Valuation – All investments in securities are recorded at their estimated fair value, as described in Note 3. |
| b). | Federal Income Taxes – Provision for Federal income taxes or excise taxes has not been made since the Fund has elected to be taxed as a “regulated investment company” and intends to distribute substantially all of its taxable income to its shareholders and otherwise comply with the provisions of the Internal Revenue Code of 1986, as amended, applicable to regulated investment companies. Net investment income or loss and realized gains and losses for federal income tax purposes may differ from that reported on the financial statements because of temporary book and tax basis differences. Temporary differences are primarily the result of the treatment of wash sales for tax reporting purposes. Distributions from net realized gains for book purposes may include short-term capital gains, which are included as ordinary income to shareholders for tax purposes. |
| c). | Income and Expenses – Dividend income is recognized on the ex-dividend date or as soon as information is available to the Fund. Interest income, which includes the amortization of premium and accretion of discount, is recognized on an accrual basis. The Fund is charged for those expenses that are directly attributable to the portfolio, such as advisory, administration, and certain shareholder service fees. Income, expenses (other than expenses attributable to a specific class), and realized and unrealized gains or losses on investments are allocated to each class of shares based on its respective net assets. |
| d). | Distributions to Shareholders – Dividends from net investment income for the Fund, if any, are declared and paid out annually, usually in November or December. Distributions of net realized capital gains, if any, are declared and paid annually, usually in November or December. |
| e). | Security Transactions – Investment and shareholder transactions are recorded on the trade date. The Fund determines the gain or loss realized from the investment |
| | transactions by comparing the original cost of the security lot sold with the net sale proceeds. Discounts and premiums on securities purchased are accreted/amortized over the life of the respective security. |
| f). | Use of Estimates – The preparation of financial statements in conformity with GAAP requires management to make estimates and assumptions that affect the reported amounts of assets and liabilities and disclosure of contingent assets and liabilities at the date of the financial statements and the reported change in net assets during the reporting period. Actual results could differ from those estimates. |
| g). | Share Valuation – The net asset value (“NAV”) per share of the Fund is calculated by dividing the sum of the value of the securities held by the Fund, plus cash or other assets, minus all liabilities (including estimated accrued expenses) by the total number of shares outstanding for the Fund, rounded to the nearest cent. The Fund’s shares will not be priced on days the New York Stock Exchange is closed for trading. The offering and redemption price per share for the Fund is equal to the Fund’s net asset value per share. |
| h). | Foreign Currency – Values of investments denominated in foreign currencies, if any, are converted into U.S. dollars using the spot market rate of exchange at the time of valuation. Purchases and sales of investments and income are translated into U.S. dollars using the spot market rate of exchange prevailing on the respective dates of such transactions. The Fund does not isolate the portion of the results of operations resulting from fluctuations in foreign exchange rates on investments from fluctuations resulting from changes in the market prices of securities held. Such fluctuations are included with the net realized and unrealized gain or loss on investments. Foreign investments present additional risks due to currency fluctuations, economic and political factors, lower liquidity, government regulations, differences in accounting standards, and other factors. |
| i). | Forward Contracts – The Fund may enter into forward currency contracts to reduce its exposure to changes in foreign currency exchange rates on its foreign holdings and to lock in the U.S. dollar cost of firm purchase and sale commitments for securities denominated in foreign currencies. A forward currency contract is a commitment to purchase or sell a foreign currency at a future date at a negotiated forward rate. The gain or loss arising from the difference between the U.S. dollar cost of the original contract and the value of the foreign currency in U.S. dollars upon closing of such contract is included in net realized gain or loss from foreign currency transactions. During the six months ended April 30, 2014, the Fund did not enter into any forward contracts. |
| j). | Repurchase Agreements – The Fund may enter into repurchase agreements with member banks or security dealers of the Federal Reserve Board whom the investment advisor deems creditworthy. The repurchase price generally equals the price paid by the Fund plus interest negotiated on the basis of current short-term rates. |
| | Securities pledged as collateral for repurchase agreements are held by the custodian bank until the respective agreements mature. Provisions of the repurchase agreements ensure that the market value of the collateral, including accrued interest thereon, is sufficient in the event of default of the counterparty. If the counterparty defaults and the value of the collateral declines or if the counterparty enters an insolvency proceeding, realization of the collateral by the Fund may be delayed or limited. |
| k). | Accounting for Uncertainty in Income Taxes – The Fund has adopted accounting policies regarding recognition and measurement of tax positions taken or expected to be taken on a tax return. The Fund has reviewed all open tax years in major jurisdictions and concluded that there is no impact on the Fund’s net assets and no tax liability |
HENNESSY FUNDS 1-800-966-4354
| | resulting from unrecognized tax benefits relating to uncertain income tax positions taken or expected to be taken on a tax return. The Fund’s major tax jurisdictions are U.S. Federal and Delaware. As of April 30, 2014, open Federal and state tax years for the Fund include the tax years ended October 31, 2011 through 2013. |
| l). | Derivatives – The Fund may invest in, or enter into, derivatives, such as options, futures contracts, options on futures contracts, and swaps, for a variety of reasons, including to hedge certain risks, to provide a substitute for purchasing or selling particular securities, or to increase potential income gain. Derivatives may provide a cheaper, quicker, or more specifically focused way for a Fund to invest than “traditional” securities would. The main purpose of utilizing these derivative instruments is for hedging purposes. |
| | The Fund has adopted the financial accounting reporting rules as required by the Derivatives and Hedging Topic of the Financial Accounting Standards Board Accounting Standards Codification. Under such rules, the Fund is required to include enhanced disclosure that enables investors to understand how and why an entity uses derivatives, how derivatives are accounted for, and how derivatives instruments affect an entity’s results of operations and financial position. During the six months ended April 30, 2014, the Fund did not hold any derivative instruments. |
| m). | Events Subsequent to the Fiscal Period End – The Fund has adopted financial reporting rules regarding subsequent events that require an entity to recognize in the financial statements the effects of all subsequent events that provide additional evidence about conditions that existed at the date of the balance sheet. Management has evaluated the Fund’s related events and transactions that occurred subsequent to April 30, 2014 through the date of issuance of the Fund’s financial statements. There were no events or transactions that occurred during this period that materially impacted the amounts or disclosures in the Fund’s financial statements. |
3). SECURITIES VALUATION
The Fund has adopted authoritative fair valuation accounting standards that establish an authoritative definition of fair value and set out a hierarchy for measuring fair value. These standards require additional disclosures about the various inputs and valuation techniques used to develop the measurements of fair value and a discussion in changes in valuation techniques and related inputs during the period. These inputs are summarized in the three broad levels listed below:
| | Level 1 – | Quoted unadjusted prices for identical instruments in active markets to which the Fund has access at the date of measurement. |
| | Level 2 – | Quoted prices for similar instruments in active markets; quoted prices for identical or similar instruments in markets that are not active; and model-derived valuations in which all significant inputs and significant value drivers are observable in active markets. Level 2 inputs are those in markets for which there are few transactions, the prices are not current, the prices are fair value adjusted due to post-market close subsequent events (foreign markets), little public information exists, or instances where prices vary substantially over time or among brokered market makers. These inputs may also include interest rates, prepayment speeds, credit risk curves, default rates, and similar data. |
| | Level 3 – | Model-derived valuations in which one or more significant inputs or significant value drivers are unobservable. Unobservable inputs are those inputs that reflect the Fund’s own assumptions about what market participants would use to price the asset or liability based on the best available information. |
Following is a description of the valuation techniques applied to the Fund’s major categories of assets and liabilities measured at fair value on a recurring basis.
Equity Securities – Equity securities, including common stocks, preferred stocks, foreign issued common stocks, exchange traded funds, closed-end mutual funds, and real estate investment trusts, that are traded on a securities exchange for which a last-quoted sales price is readily available will be valued at the last sales price as reported by the primary exchange on which the securities are listed. Securities listed on The NASDAQ Stock Market (“NASDAQ”) will be valued at the NASDAQ Official Closing Price, which may differ from the last sales price reported. Securities traded on a securities exchange for which a last-quoted sales price is not readily available will be valued at the mean between the bid and ask prices. To the extent these securities are actively traded and valuation adjustments are not applied, they are classified in Level 1 of the fair value hierarchy.
Investment Companies – Investments in investment companies (e.g., mutual funds and exchange traded funds) are generally priced at the ending NAV provided by the Fund’s service agent and will be classified in Level 1 of the fair value hierarchy.
Debt Securities – Debt securities, including corporate bonds, asset-backed securities, mortgage-backed securities, municipal bonds, U.S. Treasuries, and U.S. government agency issues, are valued at market on the basis of valuations furnished by an independent pricing service that utilizes both dealer-supplied valuations and formula-based techniques. The pricing service may consider recently executed transactions in securities of the issuer or comparable issuers, market price quotations (where observable), bond spreads, and fundamental data relating to the issuer. In addition, the model may incorporate market observable data such as reported sales of similar securities, broker quotes, yields, bids, offers, and reference data. Certain securities are valued principally using dealer quotations. These securities are generally classified in Level 2 of the fair value hierarchy.
Short-Term Securities – Short-term equity investments, including money market funds, are valued in the manner specified above. Short-term debt investments are valued at amortized cost, if their original maturity was 60 days or less, or by amortizing the values as of the 61st day prior to maturity, if their original term to maturity exceeded 60 days. Short-term securities are generally classified in Level 1 or Level 2 of the fair market hierarchy depending on the inputs used and market activity levels for specific securities.
The Board of Trustees of the Fund (the “Board”) has adopted fair value pricing procedures that are followed when a price for a security is not readily available or if a significant event has occurred that indicates the closing price of a security no longer represents the true value of that security. Fair value pricing determinations are made in good faith in accordance with these procedures. There are numerous criteria that will be given consideration in determining a fair value of a security. Some of these criteria are trading volume of security and markets, the value of other like securities, and news events with direct bearing to security or market. Fair value pricing results in an estimated price that reasonably reflects the current market conditions in order to rate the portfolio holdings such that shareholder transactions receive a fair net asset value. Depending on the relative significance of the valuation inputs, these securities may be classified in either Level 2 or Level 3 of the fair value hierarchy.
Fair valuing of foreign securities may be determined with the assistance of a pricing service using correlations between the movement of prices of such securities and indices of domestic securities and other appropriate indicators, such as closing market prices of relevant American Depositary Receipts or futures contracts. The effect of using fair value pricing is that the Fund’s NAV will reflect the affected portfolio securities’ value as
HENNESSY FUNDS 1-800-966-4354
determined in the judgment of the Board or its designee instead of being determined by the market. Using a fair value pricing methodology to price foreign securities may result in a value that is different from a foreign security’s most recent closing price and from the prices used by other investment companies to calculate their net asset values and are generally considered Level 2 prices in the fair valuation hierarchy. Because the Fund may invest in foreign securities, the value of the Fund’s portfolio securities may change on days when you will not be able to purchase or redeem your shares.
The Board has delegated day-to-day valuation matters to a Valuation Committee comprised of one or more representatives from Hennessy Advisors, Inc., the Fund’s investment advisor. The function of the Valuation Committee is to value securities where current and reliable market quotations are not readily available. All actions taken by the Valuation Committee are reviewed by the Board.
The Fund has performed an analysis of all existing investments to determine the significance and character of all inputs to their fair value determination. Various inputs are used in determining the value of the Fund’s investments. The inputs or methodology used for valuing securities are not necessarily an indication of the risk associated with investing in those securities. Details related to the fair valuation hierarchy of the Fund’s securities as of April 30, 2014 are included in the Fund’s Schedule of Investments.
4). INVESTMENT TRANSACTIONS
Purchases and sales of investment securities (excluding government and short-term investments) for the Fund during the six months ended April 30, 2014 were $59,934,480 and $65,361,497, respectively.
There were no purchases or sales/maturities of long-term U.S. Government Securities for the Fund during the six months ended April 30, 2014.
5). INVESTMENT MANAGEMENT FEE AND OTHER TRANSACTIONS WITH AFFILIATES
Hennessy Advisors, Inc. (the “Advisor”) is the investment advisor of the Fund. The Advisor provides the Fund with investment management services under an Investment Advisory Agreement. The Advisor furnishes all investment advice, office space, facilities, and provides most of the personnel needed by the Fund. As compensation for its services, the Advisor is entitled to a monthly fee from the Fund. The fee is based upon the average daily net assets of the Fund at the annual rate of 0.85%. The net investment advisory fees payable for the Fund as of April 30, 2014 were $102,790.
The Advisor has delegated the day-to-day management of the Fund to a sub-advisor, RBC Global Asset Management (U.S.) Inc. The Advisor pays the sub-advisor fees for the Fund from its own assets and these fees are not an additional expense of the Fund.
The Advisor has agreed to waive its fees and absorb expenses to the extent that the total annual operating expenses (excluding all Federal, state and local taxes, interest, brokerage commissions, acquired fund fees and expenses and other costs incurred in connection with the purchase and sale of securities and extraordinary items) exceed 0.98% of the Fund’s net assets for the Institutional Class shares of the Fund. The expense limitation agreement for the Institutional Class shares can only be terminated by the Board.
For a period of three years after the year in which the Advisor waives or reimburses expenses, the Advisor may seek reimbursement from the Fund to the extent that total annual fund operating expenses are less than the expense limitation in effect at the time of the reimbursement. During the three years ended October 31, 2013, no Advisor fees were waived and therefore no expenses are subject to potential recovery.
The Board has approved a Shareholder Servicing Agreement for Investor Class shares of the Fund, which was instituted to compensate the Advisor for the non-investment management services it provides to the Fund. The Shareholder Servicing Agreement provides for a monthly fee paid to the Advisor at an annual rate of 0.10% of the average daily net assets of the Fund attributable to Investor Class shares. Shareholder servicing fees payable for the Fund as of April 30, 2014 were $12,064.
The Fund has entered into agreements with various brokers, dealers, and financial intermediaries in connection with the sale of shares of the Fund. The agreements provide for periodic payments by the Fund to the brokers, dealers, and financial intermediaries for providing certain shareholder maintenance services (sub-transfer agent expenses). These shareholder services include the pre-processing and quality control of new accounts, shareholder correspondence, answering customer inquiries regarding account status, and facilitating shareholder telephone transactions. Fees paid by the Fund to various brokers, dealers, and financial intermediaries for the six months ended April 30, 2014 were $50,608.
U.S. Bancorp Fund Services, LLC (“USBFS”) provides the Fund with administrative, fund accounting, and transfer agent services, including all regulatory reporting, and necessary office equipment and personnel. As administrator, USBFS prepares various federal and state regulatory filings, reports, and returns for the Fund; prepares reports and materials to be supplied to the Board; monitors the activities of the Fund’s custodian, transfer agent, and accountants; and coordinates the preparation and payment of the Fund’s expenses and reviews the Fund’s expense accruals. Fees paid to USBFS for the six months ended April 30, 2014 were $144,106.
USBFS has voluntarily waived all or a portion of its fees allocated to the Institutional Class shares of the Fund. The administration fees voluntarily waived by USBFS during the six months ended April 30, 2014 were $422.
U.S. Bank, N.A., an affiliate of USBFS, serves as the Fund’s custodian. Quasar Distributors, LLC acts as the Fund’s principal underwriter in a continuous public offering of the Fund’s shares. Quasar Distributors, LLC is an affiliate of USBFS and U.S. Bank, N.A.
6). LINE OF CREDIT
The Fund has a line of credit with the other funds in the Hennessy Funds family of funds (the “Hennessy Funds”) in the amount of the lesser of (i) $100,000,000 or (ii) 33.33% of each Hennessy Fund’s net assets, or 30% for the Hennessy Gas Utility Index Fund and 10% for the Hennessy Balanced Fund, intended to provide short-term financing, if necessary, subject to certain restrictions, in connection with shareholder redemptions. The credit facility is with the Hennessy Funds’ custodian bank, U.S. Bank, N.A. Borrowings under this arrangement bear interest at the bank’s prime rate. During the six months ended April 30, 2014, the Fund did not have any borrowings outstanding under the line of credit.
HENNESSY FUNDS 1-800-966-4354
7). FEDERAL TAX INFORMATION
As of October 31, 2013, the Fund’s most recent fiscal year end, the components of accumulated earnings (losses) for income tax purposes for the Fund were as follows:
| | Cost of investments for tax purposes | | $ | 114,439,789 | |
| | Gross tax unrealized appreciation | | $ | 31,694,757 | |
| | Gross tax unrealized depreciation | | | (1,266,680 | ) |
| | Net tax unrealized appreciation/depreciation | | $ | 30,428,077 | |
| | Undistributed ordinary income | | $ | 904,159 | |
| | Undistributed long-term capital gains | | | — | |
| | Total distributable earnings | | $ | 904,159 | |
| | Other accumulated gain (loss) | | $ | (12,049,305 | ) |
| | Total accumulated gain (loss) | | $ | 19,282,931 | |
The difference between book-basis and tax-basis unrealized appreciation is attributable primarily to capital loss carry overs, wash sales, and partnership adjustments.
At October 31, 2013, the Fund’s most recent fiscal year end, the Fund had capital loss carryforwards that expire as follows:
During the year ended October 31, 2013, the Fund’s most recent fiscal year end, the capital loss carry forwards utilized for the Fund were $17,419,429.
Capital losses sustained in the year ended October 31, 2012 and in future taxable years will not expire and may be carried over by the Fund without limitation; however, they will retain the character of the original loss. Furthermore, any losses incurred during those taxable years will be required to be utilized prior to the losses incurred in the pre-enactment taxable years. As a result of this ordering rule, pre-enactment capital loss carryforwards may be more likely to expire unused. Under pre-enactment law, capital losses could be carried forward for eight years, and carried forward as short-term capital losses, irrespective of the character of the original loss.
At October 31, 2013, the Fund did not defer, on a tax basis, any post-December late year ordinary loss deferrals or post-December loss deferrals.
The tax character of distributions paid during fiscal year 2014 (year-to-date) and fiscal year 2013 for the Fund were as follows:
| | | | Six Months Ended | | | Year Ended | |
| | | | April 30, 2014 | | | October 31, 2013 | |
| | Ordinary income | | $ | 1,144,515 | | | $ | 1,438,863 | |
| | Long-term capital gain | | | — | | | | — | |
| | | | $ | 1,144,515 | | | $ | 1,438,863 | |
Expense Example (Unaudited)
April 30, 2014
As a shareholder of the Fund, you incur two types of costs: (1) transaction costs, including sales charges (loads) on purchase payments, reinvested dividends, or other distributions; redemption fees; and exchange fees; and (2) ongoing costs, including management fees; service fees; and other Fund expenses. This Example is intended to help you understand your ongoing costs (in dollars) of investing in the Fund and to compare these costs with the ongoing costs of investing in other mutual funds. The Example is based on an investment of $1,000 invested at the beginning of the period and held for the entire period from November 1, 2013 through April 30, 2014.
Actual Expenses
The first line of the table below under the “Investor Class” and “Institutional Class” headings provides information about actual account values and actual expenses. Although the Fund charges no sales loads or transaction fees, you will be assessed fees for outgoing wire transfers, returned checks and stop payment orders at prevailing rates charged by U.S. Bancorp Fund Services, LLC, the Fund’s transfer agent. If you request that a redemption be made by wire transfer, currently a $15.00 fee is charged by the Fund’s transfer agent. IRA accounts will be charged a $15.00 annual maintenance fee. The example below includes, but is not limited to, management fees, shareholder servicing fees, fund accounting, custody, and transfer agent fees. However, the example below does not include portfolio trading commissions and related expenses, and other extraordinary expenses as determined under generally accepted accounting principles. You may use the information in this line, together with the amount you invested, to estimate the expenses that you paid over the period. Simply divide your account value by $1,000 (for example, an $8,600 account value divided by $1,000 = 8.6), then multiply the result by the number in the first line of the table under the “Investor Class” and “Institutional Class” headings in the column entitled “Expenses Paid During Period” to estimate the expenses you paid on your account during this period.
Hypothetical Example for Comparison Purposes
The second line of the table below under the “Investor Class” and “Institutional Class” headings provides information about hypothetical account values and hypothetical expenses based on the Fund’s actual expense ratios and an assumed rate of return of 5% per year before expenses, which is not the Fund’s actual return. The hypothetical account values and expenses may not be used to estimate the actual ending account balance or expenses you paid for the period. You may use this information to compare the ongoing costs of investing in the Fund and other funds. To do so, compare this 5% hypothetical example with the 5% hypothetical examples that appear in the shareholder reports of the other funds. Please note that the expenses shown in the table are meant to highlight your ongoing costs only and do not reflect any transactional costs, such as sales charges (loads), or exchange fees. Therefore, the second line of the table under the “Investor Class” and “Institutional Class” headings is useful in comparing ongoing costs only, and will not help you determine the relative total costs of owning different funds. In addition, if these transactional costs were included, your costs would have been higher.
HENNESSY FUNDS 1-800-966-4354
| | | | Expenses Paid |
| | Beginning | Ending | During Period(1) |
| | Account Value | Account Value | November 1, 2013 – |
| | November 1, 2013 | April 30, 2014 | April 30, 2014 |
| Investor Class | | | |
| | | | |
| Actual | $1,000.00 | $1,075.70 | $6.74 |
| | | | |
| Hypothetical (5% return | | | |
| before expenses) | $1,000.00 | $1,018.30 | $6.56 |
| | | | |
| Institutional Class | | | |
| | | | |
| Actual | $1,000.00 | $1,077.70 | $5.05 |
| | | | |
| Hypothetical (5% return | | | |
| before expenses) | $1,000.00 | $1,019.93 | $4.91 |
| (1) | Expenses are equal to the Fund’s annualized expense ratio of 1.31% for Investor Class shares or 0.98% for Institutional Class shares, as applicable, multiplied by the average account value over the period, multiplied by 181/365 days (to reflect one-half year period). |
Proxy Voting
A description of the policies and procedures the Fund uses to determine how to vote proxies relating to portfolio securities is available without charge: (1) by calling 1-800-966-4354; (2) on the Hennessy Funds’ website at hennessyfunds.com; or (3) on the U.S. Securities and Exchange Commission’s (the “SEC”) website at www.sec.gov. The Fund’s proxy voting record is available on both the Hennessy Funds’ website at hennessyfunds.com and the SEC’s website at www.sec.gov no later than August 31 for the prior 12 months ending June 30.
Quarterly Filings on Form N-Q
The Fund files its complete schedule of portfolio holdings with the SEC for the first and third quarters of each fiscal year on Form N-Q. The Fund’s Forms N-Q are available on the SEC’s website at www.sec.gov. The Fund’s Forms N-Q may be reviewed and copied at the SEC’s Public Reference Room in Washington, DC and information on the operation of the Public Reference Room may be obtained by calling 1-800-SEC-0330. Information included in the Fund’s Forms N-Q will also be available upon request by calling 1-800-966-4354.
Federal Tax Distribution Information
(Unaudited)
For the fiscal year ended October 31, 2013, certain dividends paid by the Fund may be subject to a maximum tax rate of 15%, as provided for by the Jobs and Growth Tax Relief Reconciliation Act of 2003. The percentage of dividends declared from ordinary income designated as qualified dividend income was 100.00%.
For corporate shareholders, the percent of ordinary income distributions qualifying for the corporate dividends received deduction for the fiscal year ended October 31, 2013 was 100.00%.
The percentage of taxable ordinary income distributions that are designated as short-term capital gain distributions under Section 871(k)(2)(C) of the Internal Revenue Code of 1986, as amended, for the Fund was 0.00%.
Householding
To help keep the Fund’s costs as low as possible, we generally deliver a single copy of most financial reports and prospectuses to shareholders who share an address, even if the accounts are registered under different names. This process, known as “householding,” does not apply to account statements. You may, of course, request an individual copy of a prospectus or financial report at any time. If you would like to receive separate mailings, please call the Administrator at 1-800-261-6950 or 1-414-765-4124 and we will begin individual delivery within 30 days of your request. If your account is held through a financial institution or other intermediary, please contact them directly to request individual delivery.
HENNESSY FUNDS 1-800-966-4354
Board Approval of Investment Advisory
Agreements
At its meeting on March 3, 2014, the Board of Trustees of the Fund (the “Board”) unanimously approved the continuation of the investment advisory agreement and sub-advisory agreement of the Fund.
The Board reviewed a number of documents, including a memorandum provided by outside legal counsel that described the fiduciary duties of the Board with respect to approving the continuance of the investment advisory and sub-advisory agreements and the relevant factors for consideration, a memorandum from the Advisor that listed each of the relevant factors and the documents provided to help the Board assess each such factor, the Advisor’s most recent Form 10-K and 10-Q, the Advisor’s Form ADV Part I, a document that listed the range of services provided by the Advisor for the Fund, a written discussion of economies of scale, a completed questionnaire from the sub-advisor, the sub-advisor’s Form ADV Parts I and II, copies of the advisory and sub-advisory agreements, a fund fact sheet, and peer expense and performance comparisons. The Board considered and discussed numerous factors, including the following:
| | • | The Board considered the services identified below that are provided by the Advisor and the sub-advisor: |
| | | • | The Advisor oversees the sub-advisor for the Fund. The sub-advisor acts as the portfolio manager to the Fund, managing the composition of the portfolio of the Fund, including the purchase, retention, and disposition of portfolio securities in accordance with the Fund’s investment objectives, policies, and restrictions. |
| | | • | The Advisor performs daily reconciliations of portfolio positions and cash for the Fund. |
| | | • | The Advisor oversees the use of soft dollars for the Fund. |
| | | • | The Advisor monitors compliance by the Fund with its investment objectives and restrictions. |
| | | • | The Advisor monitors compliance with federal securities laws and performs activities such as maintaining a compliance program, conducting ongoing reviews of the compliance programs of the sub-advisor and the Fund’s other service providers, conducting on-site visits to the sub-advisor and the Fund’s other service providers, monitoring incidents of abusive trading practices, reviewing Fund expense accruals, payments, and fixed expense ratios, evaluating insurance providers for fidelity bond coverage and D&O/E&O insurance coverage, conducting employee compliance training, reviewing reports provided by service providers, maintaining books and records, and preparing an annual compliance report to the Board. |
| | | • | The Advisor oversees service providers that support the Fund in providing fund accounting, fund administration, fund distribution, transfer agency, custodial, sales and marketing, audit, information technology, and legal services. |
| | | • | The Advisor maintains an in-house public relations and marketing department on behalf of the Fund. |
| | | • | The Advisor is actively involved with preparing regulatory filings for the Fund. |
| | | • | The Advisor oversees proxy voting for the Fund. |
| | | • | The Advisor oversees distribution of the Fund through third-party broker/dealers and independent financial institutions such as Charles Schwab, |
| | | | Inc., Fidelity, TD Waterhouse, and Pershing. The Advisor participates in “no transaction fee” (“NTF”) programs with these companies on behalf of the Fund, which allows customers to purchase the Fund through third-party distribution channels without paying a transaction fee. The Advisor compensates a number of these third-party providers of NTF programs out of its own revenues and not those of the Fund. |
| | | • | The Advisor pays the incentive compensation of all of the Fund’s compliance officers and employs other staff such as management executives, legal personnel, marketing personnel, national accounts and distribution personnel, sales personnel, and trading oversight personnel. |
| | | • | The Advisor prepares or reviews Board materials, frequently presents to the Board or leads Board discussions, prepares or reviews meeting minutes, and arranges for Board training and education. |
| | • | The Board compared the performance of the Fund to benchmark indices over various periods of time and concluded that the positive performance of the Fund warranted the continuation of the advisory and sub-advisory agreements. |
| | • | The Board reviewed the Fund’s expense ratio and comparable expense ratios for funds comparable to the Fund. The Board used data from Morningstar showing funds similar in asset size and investment objective to the Fund and determined that the expense ratio of the Fund falls within the range of the ratios of other comparable funds and concluded that the expenses of the Fund were reasonable. |
| | • | The Board considered the fees charged by the Advisor and the sub-advisor of the Fund to those of funds similar in asset size and investment objective to the Fund and concluded the advisory and sub-advisory fees of the Fund were reasonable and warranted continuation of the advisory and sub-advisory agreements. The Trustees noted that the investment advisory and sub-advisory fees are not adjusted if economies of scale are realized as the Fund grows because many of the expenses incurred to manage the Fund are asset-based fees and thus do not result in material economies of scale being realized as the net assets of the Fund increase. |
| | • | The Board considered the profitability of the Advisor and the sub-advisor with respect to the Fund and concluded the profits were reasonable and not excessive when compared to profitability guidelines set forth in relevant court cases. |
| | • | The Board considered the high level of professionalism and knowledge of the Advisor’s employees, along with an extremely low level of turnover of the employees of the Advisor, and concluded that this was beneficial to the Fund and its shareholders, as it ensures that the Fund is operated efficiently. |
All of the factors above were considered separately by the Board, including the Trustees who are not “interested persons” (as defined in the Investment Company Act of 1940, as amended) of the Fund (the “Independent Trustees”) meeting in an executive session. The factors were viewed in their totality by the Board, with no single factor being the principal or determinative factor in the Board’s determination of whether to approve the continuation of the advisory and sub-advisory agreements. Based on the factors discussed above, the Board, including all of the Independent Trustees, recommended continuation of the advisory and sub-advisory agreements.
HENNESSY FUNDS 1-800-966-4354
For information, questions or assistance, please call
The Hennessy Funds
1-800-966-4354 or 1-415-899-1555
INVESTMENT ADVISOR
Hennessy Advisors, Inc.
7250 Redwood Blvd., Suite 200
Novato, California 94945
ADMINISTRATOR,
TRANSFER AGENT,
DIVIDEND PAYING AGENT &
SHAREHOLDER SERVICING AGENT
U.S. Bancorp Fund Services, LLC
P.O. Box 701
Milwaukee, Wisconsin 53201-0701
CUSTODIAN
U.S. Bank N.A.
Custody Operations
1555 North River Center Dr., Suite 302
Milwaukee, Wisconsin 53212
TRUSTEES
Neil J. Hennessy
Robert T. Doyle
J. Dennis DeSousa
Gerald P. Richardson
COUNSEL
Foley & Lardner LLP
777 East Wisconsin Avenue
Milwaukee, Wisconsin 53202-5306
INDEPENDENT REGISTERED
PUBLIC ACCOUNTING FIRM
KPMG LLP
777 East Wisconsin Avenue
Milwaukee, Wisconsin 53202-5306
DISTRIBUTOR
Quasar Distributors, LLC
615 East Michigan Street
Milwaukee, Wisconsin 53202
hennessyfunds.com | 1-800-966-4354
This report has been prepared for shareholders and may be distributed to
others only if preceded or accompanied by a current prospectus.
SEMI-ANNUAL REPORT
APRIL 30, 2014
HENNESSY TOTAL RETURN FUND
Investor Class HDOGX
hennessyfunds.com | 1-800-966-4354
(This Page Intentionally Left Blank.)
Contents
| Letter to Shareholders | 2 |
| Performance Overview | 4 |
| Financial Statements | |
| Schedule of Investments | 6 |
| Statement of Assets and Liabilities | 10 |
| Statement of Operations | 11 |
| Statements of Changes in Net Assets | 12 |
| Statement of Cash Flows | 13 |
| Financial Highlights | 14 |
| Notes to the Financial Statements | 16 |
| Expense Example | 24 |
| Proxy Voting | 26 |
| Quarterly Filings on Form N-Q | 26 |
| Federal Tax Distribution Information | 26 |
| Householding | 26 |
| Board Approval of Investment Advisory Agreement | 27 |
HENNESSY FUNDS 1-800-966-4354
June 2014
Dear Shareholder:
The financial markets have provided strong returns over the past six-months ended April 30, 2014, with the Dow Jones Industrial Average (DJIA) and S&P 500 both returning approximately 8% during the period. The current valuation metrics of the major indices are solid; for example, the DJIA currently has a price-to-earnings ratio of 15x and a price-to-sales ratio of 1.75x. The DJIA also has a dividend yield of 2.2%, which is nearly as high as that of a 10-Year U.S. Treasury, which is currently yielding 2.6%. Investing in high-yielding, high-quality DJIA stocks have the potential to not only provide an income stream but also for stock price appreciation as well. Fixed income investing has run its course, in my opinion, and many individuals are currently benefiting from the return to investing in equities that possess strong fundamentals.
U.S. corporations continue to drive shareholder value by making acquisitions, initiating and raising dividends, investing in internal infrastructure, and buying back stock. However, lately I have begun to see a shift in those business strategies. The easier-to-execute acquisitions seem to be a thing of the past, and firms now have to be even more creative to execute accretive deals. I also believe that while firms may continue to initiate dividends, fewer firms will raise their dividends and fewer firms will participate in stock buyback programs going forward. So what will these cash-rich companies do with their capital if they are not raising dividends or buying back stock? I believe we will see companies begin to initiate capital expenditure programs.
Due to the continuing uncertainty from a lack of clear policies on taxes, healthcare, and regulations, I have observed that corporations would rather wait for clarity from our government leaders and defer any significant changes to their current business models. Up until this point, there has been no real cost for firms to defer spending their capital as they wait for anticipated guidance on policies that directly affect their businesses. But, this economic handcuffing from all of this uncertainty has gone on long enough. I believe there will now be firms who want to improve their margins and will begin spending money to expand their sales, and may even begin to hire. Once a competitor begins to move in this way, then the cost to defer becomes real for companies. This movement to expansion may well be a catalyst to propel the financial markets. I do believe this will be a slow shift, but one that will keep the economy improving, and should, in my opinion, help to generate reasonable market returns over the next few years.
With almost $3 trillion in cash sitting on the sidelines, this strategic shift by companies to begin spending their idle capital should help the economic recovery in the U.S. But that is only one part of the equation. Washington politics still play a role in how strong that recovery will be. The national political landscape will change in the next few years, and the future generation of elected officials will be faced with what I believe are fictitious unemployment figures (6.3% reported, when over 20 million Americans are looking for more work or a better job), a sluggish economy, and global competition in business. The next regime needs to provide real clarity on the issues that face all Americans and American corporations: taxation, regulation, and how to pay for our new healthcare system. I also believe that our government needs to regard business as a noble profession and to implement common sense and logic in their policy making instead of politics as usual. As Confucius is quoted as saying, “Life is really simple, but we insist on making it complicated.”
I am confident that even with all the hurdles facing corporate America, companies continue to provide good value for their shareholders, and I believe that means the financial markets are in good shape and should remain strong moving forward, I also believe that the next few months may be volatile. Fads come and go, and the current buzz on the Street is around investing in social media stocks. I believe that chasing hot products has contributed and will continue to contribute to the volatility of the markets this year. After over 35 years in the business, I still firmly believe the best way to position your portfolio is by investing in good companies over the long term, rather than trying to buy the next hot idea at exactly the right time. At Hennessy Funds, hunches and fads have no place in our investment process, and we understand that successful investing comes from time in the market, not timing the market.
We remain focused on investing based on proven fundamentals, and we are committed to managing money for the sole benefit of our shareholders. If you have any questions or want to speak with us directly, please don’t hesitate to call us at (800) 966-4354.
Best regards,
Neil J. Hennessy
President and Chief Investment Officer
Past performance does not guarantee future results.
Mutual fund investing involves risk. Principal loss is possible.
Opinions expressed are those of Neil Hennessy and are subject to change, are not guaranteed and should not be considered investment advice.
The Dow Jones Industrial Average and S&P 500 are unmanaged indices commonly used to measure the performance of U.S. stocks. One cannot invest directly in an index.
Price-to-sales ratio and price-to-earnings ratio are tools for calculating relative valuation. Price-to-sales ratio is calculated by dividing the market price by revenue per share. Price-to-earnings ratio is the market price per share divided by earnings per share.
HENNESSY FUNDS 1-800-966-4354
Performance Overview (Unaudited)
The opinions expressed in the following commentary reflect those of the Portfolio Managers as of the date written. Any such opinions are subject to change based on market or other conditions and are not guaranteed. These opinions may not be relied upon as investment advice. Investment decisions for the Fund are based on several factors, and may not be relied upon as an indication of trading intent on behalf of the Fund. Security positions can and do change.
AVERAGE ANNUAL TOTAL RETURN PERIODS ENDED APRIL 30, 2014
| | Six | One | Five | Ten |
| | Months(1) | Year | Years | Years |
| Hennessy Total | | | | |
| Return Fund (HDOGX) | 5.34% | 8.34% | 15.40% | 5.42% |
75/25 Blended DJIA/Treasury Index(2) | 5.95% | 10.79% | 13.67% | 6.33% |
| Dow Jones Industrial Average | 7.90% | 14.44% | 18.32% | 7.68% |
Expense ratio: 1.37%
Performance data quoted represents past performance; past performance does not guarantee future results. The investment return and principal value of an investment will fluctuate so that an investor’s shares, when redeemed, may be worth more or less than their original cost. Current performance of the Fund may be lower or higher than the performance quoted. Performance data current to the most recent month end may be obtained by visiting hennessyfunds.com.
The expense ratio presented is from the most recent prospectus.
| (1) | Periods less than one year are not annualized. |
| (2) | The 75/25 Blended DJIA/Treasury Index consists of 75% common stocks represented by the Dow Jones Industrial Average and 25% short-duration Treasury securities represented by the BofA Merrill Lynch 90-day Treasury Bill Index. |
PERFORMANCE NARRATIVE
Portfolio Manager, Neil Hennessy, and Co-Portfolio Manager, Brian Peery
Over the previous six months, how did the Fund perform and what factors contributed to this performance?
For the six-month period ended April 30, 2014, the Hennessy Total Return Fund returned 5.34%, underperforming the 75/25 Blended DJIA/Treasury Index, the Dow Jones Industrial Average, and the Morningstar Large Value Category Average, which returned 5.95%, 7.90%, and 8.14% for the same period, respectively.
While the Fund’s roughly 25% weighting in U.S. Treasuries was a detriment to overall performance compared to its equity benchmarks, the Fund’s relative underperformance compared to the 75/25 Blended DJIA/Treasury Index was due to stock selection.
During the six-month period ended April 30, 2014, 15 of the Fund’s 18 equity positions had positive returns, with only Verizon Communication, Inc., Hewlett-Packard Company, and Kraft Foods Group, Inc. posting negative returns. Although Hewlett-Packard Company and Kraft Foods Group, Inc. are no longer members of the Dow Jones Industrial Average, both stocks remained in the Fund’s portfolio until the Fund was rebalanced. When the portfolio was rebalanced, the newest “Dogs of the Dow” stocks replaced those stocks no longer in the index.
While the Fund’s portfolio may underperform its benchmarks in periods where equities rise sharply, the strategy aims to capture near market returns with a lower risk
profile, since only approximately 75% of the Fund’s assets are invested in equities. Conversely, if equity markets were to fall sharply, we would expect the Fund to perform better than its equity benchmarks due to its approximately 25% exposure to short-term U.S. Treasuries that are held to maturity. Ultimately, the overall goal of this portfolio is to capture near-market upside performance while mitigating some of the potential market downside risk.
Additional Portfolio Manager commentary and related investment outlook:
We continue to believe that the Dow Jones Industrial Average stocks, and in particular the stocks comprising the high dividend- yielding “Dogs of the Dow” (the methodology employed within the Fund), provide an excellent way to gain equity exposure to the markets. With U.S. Treasury yields still trading near historic lows, many investors are seeking high quality, dividend-paying companies as a means of potentially generating current income. We believe that the rotation out of bonds and into equities, where investors have historically received higher yields as well as the potential for capital appreciation, should continue.
As the market reaches new highs and investors become more wary of a potential pullback, we believe that a trend of moving some money away from more risky asset classes and into the perceived “safety” of very large dividend-paying companies will prevail. We believe the Fund is well positioned for the more moderately conservative investor as the equity portion of the portfolio holds what we would deem to be high quality, high dividend-paying companies, while the short duration of the Treasury component (all less than three months) will allow us the ability to roll into higher yielding treasuries in the event yields continue to rise.
The 75/25 Blended DJIA/Treasury Index consists of 75% common stocks represented by the Dow Jones Industrial Average and 25% short-duration Treasury securities represented by the BofA Merrill Lynch 90-day U.S. Treasury Bill Index. The Dow Jones Industrial Average is an unmanaged index commonly used to measure the performance of U.S. stocks. The BofA Merrill Lynch 90-day U.S. Treasury Bill Index is an unmanaged index of Treasury securities maturing in 90 days. You cannot invest directly in an index. Performance data for an index does not reflect any deductions for fees, expenses or taxes. The Fund is non-diversified, meaning it concentrates its assets in fewer individual holdings than a diversified fund and is therefore more exposed to individual stock volatility than a diversified fund. The Fund’s portfolio is rebalanced annually in accordance with its strategy, which may result in the elimination of better performing assets from the Fund’s investments and increases in investments with relatively lower total return. References to specific securities should not be considered a recommendation to buy or sell any security. Fund holdings and sector allocations are subject to change. Please refer to the Schedule of Investments included in this report for additional portfolio information.
Each Morningstar category average represents a universe of funds with similar investment objectives. © Morningstar, Inc. All Rights Reserved. The information contained herein: 1) is proprietary to Morningstar; 2) may not be copied or distributed and 3) is not warranted to be accurate, complete or timely. Neither Morningstar nor its content providers are responsible for any damages or losses arising from any use of this information. Past performance does not guarantee future results.
HENNESSY FUNDS 1-800-966-4354
Schedule of Investments
HENNESSY TOTAL RETURN FUND
As of April 30, 2014 (Unaudited)
(% of Net Assets)
| | TOP TEN HOLDINGS | % NET ASSETS |
| | U.S. Treasury Bill, 0.030%, 07/24/2014 | 26.83% |
| | U.S. Treasury Bill, 0.050%, 06/26/2014 | 21.00% |
| | U.S. Treasury Bill, 0.015%, 05/22/2014 | 15.17% |
| | Merck & Co., Inc. | 8.28% |
| | Intel Corp. | 7.43% |
| | AT&T, Inc. | 7.22% |
| | Chevron Corp. | 7.22% |
| | Pfizer, Inc. | 7.18% |
| | McDonald’s Corp. | 7.06% |
| | Verizon Communications, Inc. | 6.81% |
Note: For presentation purposes, the Fund has grouped some of the industry categories. For purposes of categorizing securities for compliance with Section 8(b)(1) of the Investment Company Act of 1940, the Fund uses more specific industry classifications.
| | COMMON STOCKS – 74.40% | | Number | | | | | | % of | |
| | | | of Shares | | | Value | | | Net Assets | |
| | Consumer Discretionary – 7.06% | | | | | | | | | |
| | McDonald’s Corp. | | | 59,700 | | | $ | 6,052,386 | | | | 7.06 | % |
| | | | | | | | | | | | | | |
| | Consumer Staples – 6.39% | | | | | | | | | | | | |
| | Procter & Gamble Co. | | | 54,000 | | | | 4,457,700 | | | | 5.20 | % |
| | The Coca-Cola Co. | | | 25,100 | | | | 1,023,829 | | | | 1.19 | % |
| | | | | | | | | 5,481,529 | | | | 6.39 | % |
| | | | | | | | | | | | | | |
| | Energy – 7.22% | | | | | | | | | | | | |
| | Chevron Corp. | | | 49,300 | | | | 6,188,136 | | | | 7.22 | % |
| | | | | | | | | | | | | | |
| | Financials – 0.35% | | | | | | | | | | | | |
| | J.P. Morgan Chase & Co. | | | 5,300 | | | | 296,694 | | | | 0.35 | % |
| | | | | | | | | | | | | | |
| | Health Care – 16.09% | | | | | | | | | | | | |
| | Johnson & Johnson | | | 5,300 | | | | 536,837 | | | | 0.63 | % |
| | Merck & Co., Inc. | | | 121,200 | | | | 7,097,472 | | | | 8.28 | % |
| | Pfizer, Inc. | | | 196,800 | | | | 6,155,904 | | | | 7.18 | % |
| | | | | | | | | 13,790,213 | | | | 16.09 | % |
| | | | | | | | | | | | | | |
| | Industrials – 6.42% | | | | | | | | | | | | |
| | General Electric Co. | | | 204,700 | | | | 5,504,383 | | | | 6.42 | % |
| | | | | | | | | | | | | | |
| | Information Technology – 12.91% | | | | | | | | | | | | |
| | Cisco Systems, Inc. | | | 66,200 | | | | 1,529,882 | | | | 1.79 | % |
| | Intel Corp. | | | 238,700 | | | | 6,370,903 | | | | 7.43 | % |
| | Microsoft Corp. | | | 78,300 | | | | 3,163,320 | | | | 3.69 | % |
| | | | | | | | | 11,064,105 | | | | 12.91 | % |
| | | | | | | | | | | | | | |
| | Materials – 3.93% | | | | | | | | | | | | |
| | EI Du Pont de Nemours & Co. | | | 50,100 | | | | 3,372,732 | | | | 3.93 | % |
| | | | | | | | | | | | | | |
| | Telecommunication Services – 14.03% | | | | | | | | | | | | |
| | AT&T, Inc. | | | 173,400 | | | | 6,190,380 | | | | 7.22 | % |
| | Verizon Communications, Inc. | | | 124,900 | | | | 5,836,577 | | | | 6.81 | % |
| | | | | | | | | 12,026,957 | | | | 14.03 | % |
| | Total Common Stocks | | | | | | | | | | | | |
| | (Cost $50,187,041) | | | | | | | 63,777,135 | | | | 74.40 | % |
The accompanying notes are an integral part of these financial statements.
HENNESSY FUNDS 1-800-966-4354
| | SHORT-TERM INVESTMENTS – 65.55% | | Number of Shares/ | | | | | | % of | |
| | | | Par Amount | | | Value | | | Net Assets | |
| | Money Market Funds – 2.55% | | | | | | | | | |
| | Fidelity Government Portfolio – | | | | | | | | | |
| | Institutional Class, 0.01% (a) | | | 2,184,782 | | | $ | 2,184,782 | | | | 2.55 | % |
| | | | | | | | | | | | | | |
| | Total Money Market Funds | | | | | | | | | | | | |
| | (Cost $2,184,782) | | | | | | | 2,184,782 | | | | 2.55 | % |
| | | | | | | | | | | | | | |
| | U.S. Treasury Bills – 63.00% | | | | | | | | | | | | |
| | 0.015%, 05/22/2014 (b)(c) | | | 13,000,000 | | | | 12,999,697 | | | | 15.17 | % |
| | 0.050%, 06/26/2014 (b)(c) | | | 18,000,000 | | | | 17,998,880 | | | | 21.00 | % |
| | 0.030%, 07/24/2014 (b)(c) | | | 23,000,000 | | | | 22,999,402 | | | | 26.83 | % |
| | | | | | | | | | | | | | |
| | Total U.S. Treasury Bills | | | | | | | | | | | | |
| | (Cost $53,997,773) | | | | | | | 53,997,979 | | | | 63.00 | % |
| | | | | | | | | | | | | | |
| | Total Short-Term Investments | | | | | | | | | | | | |
| | (Cost $56,182,555) | | | | | | | 56,182,761 | | | | 65.55 | % |
| | | | | | | | | | | | | | |
| | Total Investments | | | | | | | | | | | | |
| | (Cost $106,369,596) – 139.95% | | | | | | | 119,959,896 | | | | 139.95 | % |
| | Liabilities in Excess | | | | | | | | | | | | |
| | of Other Assets – (39.95)% | | | | | | | (34,242,078 | ) | | | (39.95 | )% |
| | TOTAL NET ASSETS – 100.00% | | | | | | $ | 85,717,818 | | | | 100.00 | % |
Percentages are stated as a percent of net assets.
| (a) | The rate listed is the fund’s 7-day yield as of April 30, 2014. |
| (b) | The rate listed is discount rate at issue. |
| (c) | Held as collateral for reverse repurchase agreements. |
The accompanying notes are an integral part of these financial statements.
Summary of Fair Value Exposure at April 30, 2014
The following is a summary of the inputs used to value the Fund’s net assets as of April 30, 2014 (See Note 3 in the accompanying notes to the financial statements):
| Common Stock | | Level 1 | | | Level 2 | | | Level 3 | | | Total | |
| Consumer Discretionary | | $ | 6,052,386 | | | $ | — | | | $ | — | | | $ | 6,052,386 | |
| Consumer Staples | | | 5,481,529 | | | | — | | | | — | | | | 5,481,529 | |
| Energy | | | 6,188,136 | | | | — | | | | — | | | | 6,188,136 | |
| Financials | | | 296,694 | | | | — | | | | — | | | | 296,694 | |
| Health Care | | | 13,790,213 | | | | — | | | | — | | | | 13,790,213 | |
| Industrials | | | 5,504,383 | | | | — | | | | — | | | | 5,504,383 | |
| Information Technology | | | 11,064,105 | | | | — | | | | — | | | | 11,064,105 | |
| Materials | | | 3,372,732 | | | | — | | | | — | | | | 3,372,732 | |
| Telecommunication Services | | | 12,026,957 | | | | — | | | | — | | | | 12,026,957 | |
| Total Common Stock | | $ | 63,777,135 | | | $ | — | | | $ | — | | | $ | 63,777,135 | |
| Short-Term Investments | | | | | | | | | | | | | | | | |
| Money Market Funds | | $ | 2,184,782 | | | $ | — | | | $ | — | | | $ | 2,184,782 | |
| U.S. Treasury Bills | | | — | | | | 53,997,979 | | | | — | | | | 53,997,979 | |
| Total Short-Term Investments | | $ | 2,184,782 | | | $ | 53,997,979 | | | $ | — | | | $ | 56,182,761 | |
| Total Investments | | $ | 65,961,917 | | | $ | 53,997,979 | | | $ | — | | | $ | 119,959,896 | |
Transfers between levels are recognized at the end of the reporting period. During the six-month period ended April 30, 2014, the Fund recognized no transfers between levels.
Reverse repurchase agreements are carried at face value; hence, they are not included in the fair valuation hierarchy. The face value of the reverse repurchase agreements at April 30, 2014 was $34,181,000. Due to the short-term nature of the reverse repurchase agreements, face value approximates fair value. The face value plus interest due at maturity is equal to $34,202,363.
Schedule of Reverse Repurchase Agreements
| | | | | | | Principal | Maturity | | Maturity | |
| Face Value | | Counterparty | | Rate | Trade Date | Date | | Amount | |
| $ | 8,995,000 | | Jefferies, LLC | | 0.25% | 2/20/14 | 5/22/14 | | $ | 9,000,622 | |
| | 10,794,000 | | Jefferies, LLC | | 0.25% | 3/27/14 | 6/26/14 | | | 10,800,746 | |
| | 14,392,000 | | Jefferies, LLC | | 0.25% | 4/24/14 | 7/24/14 | | | 14,400,995 | |
| $ | 34,181,000 | | | | | | | | | $ | 34,202,363 | |
As of April 30, 2014, the fair value of securities held as collateral for reverse repurchase agreements was $53,997,979 as noted on the Schedule of Investments.
The accompanying notes are an integral part of these financial statements.
HENNESSY FUNDS 1-800-966-4354
Financial Statements
Statement of Assets and Liabilities as of April 30, 2014 (Unaudited) |
| ASSETS: | | | |
| Investments in securities, at value (cost $106,369,596) | | $ | 119,959,896 | |
| Dividends and interest receivable | | | 182,150 | |
| Receivable for fund shares sold | | | 18,381 | |
| Prepaid expenses and other assets | | | 12,662 | |
| Total Assets | | | 120,173,089 | |
| | | | | |
| LIABILITIES: | | | | |
| Payable for fund shares redeemed | | | 97,378 | |
| Payable to advisor | | | 42,046 | |
| Payable to administrator | | | 28,079 | |
| Payable to auditor | | | 12,337 | |
| Accrued distribution fees | | | 42,302 | |
| Accrued service fees | | | 7,008 | |
| Reverse repurchase agreement | | | 34,181,000 | |
| Accrued interest payable | | | 5,465 | |
| Accrued trustees fees | | | 3,295 | |
| Accrued expenses and other payables | | | 36,361 | |
| Total Liabilities | | | 34,455,271 | |
| NET ASSETS | | $ | 85,717,818 | |
| | | | | |
| NET ASSETS CONSIST OF: | | | | |
| Capital stock | | $ | 70,680,595 | |
| Accumulated net investment income | | | 97,646 | |
| Accumulated net realized gain on investments | | | 1,349,277 | |
| Unrealized net appreciation on investments | | | 13,590,300 | |
| Total Net Assets | | $ | 85,717,818 | |
| | | | | |
| NET ASSETS | | | | |
| Investor Class: | | | | |
| Shares authorized (no par value) | | Unlimited | |
| Net assets applicable to outstanding Investor Class shares | | | 85,717,818 | |
| Shares issued and outstanding | | | 5,726,933 | |
| Net asset value, offering price and redemption price per share | | $ | 14.97 | |
The accompanying notes are an integral part of these financial statements.
Financial Statements
Statement of Operations Six Months Ended April 30, 2014 (Unaudited) |
| INVESTMENT INCOME: | | | |
| Dividend income | | $ | 1,154,783 | |
| Interest income | | | 10,102 | |
| Total investment income | | | 1,164,885 | |
| | | | | |
| EXPENSES: | | | | |
| Investment advisory fees | | | 261,882 | |
| Administration, fund accounting, custody and transfer agent fees | | | 87,294 | |
| Distribution fees – Investor Class (See Note 5) | | | 65,470 | |
| Service fees – Investor Class (See Note 5) | | | 43,647 | |
| Sub-transfer agent expenses – Investor Class (See Note 5) | | | 40,423 | |
| Interest expense (See Notes 6 and 8) | | | 39,891 | |
| Federal and state registration fees | | | 14,303 | |
| Compliance expense | | | 10,655 | |
| Audit fees | | | 10,315 | |
| Reports to shareholders | | | 6,248 | |
| Trustees’ fees and expenses | | | 4,959 | |
| Legal fees | | | 2,481 | |
| Other expenses | | | 6,283 | |
| Total expenses | | | 593,851 | |
| NET INVESTMENT INCOME | | $ | 571,034 | |
| | | | | |
| REALIZED AND UNREALIZED GAINS: | | | | |
| Net realized gain on investments | | $ | 3,598,799 | |
| Change in unrealized appreciation on investments | | | 274,796 | |
| Net gain on investments | | | 3,873,595 | |
| NET INCREASE IN NET ASSETS RESULTING FROM OPERATIONS | | $ | 4,444,629 | |
The accompanying notes are an integral part of these financial statements.
HENNESSY FUNDS 1-800-966-4354
Financial Statements
| Statements of Changes in Net Assets |
| | | Six Months Ended | | | | |
| | | April 30, 2014 | | | Year Ended | |
| | | (Unaudited) | | | October 31, 2013 | |
| OPERATIONS: | | | | | | |
| Net investment income | | $ | 571,034 | | | $ | 945,157 | |
| Net realized gain on securities | | | 3,598,799 | | | | 4,930,184 | |
| Change in unrealized appreciation on securities | | | 274,796 | | | | 4,920,747 | |
| Net increase in net assets resulting from operations | | | 4,444,629 | | | | 10,796,088 | |
| | | | | | | | | |
| DISTRIBUTIONS TO SHAREHOLDERS FROM: | | | | | | | | |
| Net investment income | | | | | | | | |
| Investor Class | | | (539,805 | ) | | | (957,145 | ) |
| Total distributions | | | (539,805 | ) | | | (957,145 | ) |
| | | | | | | | | |
| CAPITAL SHARE TRANSACTIONS: | | | | | | | | |
| Proceeds from shares subscribed – Investor Class | | | 3,312,735 | | | | 21,431,210 | |
| Dividends reinvested – Investor Class | | | 502,323 | | | | 873,732 | |
| Cost of shares redeemed – Investor Class | | | (12,243,186 | ) | | | (19,573,550 | ) |
| Net increase (decrease) in net assets | | | | | | | | |
| derived from capital share transactions | | | (8,428,128 | ) | | | 2,731,392 | |
| TOTAL INCREASE (DECREASE) IN NET ASSETS | | | (4,523,304 | ) | | | 12,570,335 | |
| | | | | | | | | |
| NET ASSETS: | | | | | | | | |
| Beginning of period | | | 90,241,122 | | | | 77,670,787 | |
| End of period | | $ | 85,717,818 | | | $ | 90,241,122 | |
| Undistributed net investment income, end of period | | $ | 97,646 | | | $ | 66,417 | |
| | | | | | | | | |
| CHANGES IN SHARES OUTSTANDING: | | | | | | | | |
| Shares sold – Investor Class | | | 228,487 | | | | 1,551,829 | |
| Shares issued to holders as | | | | | | | | |
| reinvestment of dividends – Investor Class | | | 34,119 | | | | 64,334 | |
| Shares redeemed – Investor Class | | | (844,478 | ) | | | (1,451,726 | ) |
| Net increase (decrease) in shares outstanding | | | (581,872 | ) | | | 164,437 | |
The accompanying notes are an integral part of these financial statements.
Financial Statements
Statement of Cash Flows For the Six Months Ended April 30,2014 (Unaudited) |
| Cash Flows From Operating Activities: | | | |
| Net increase in net assets from operations | | $ | 4,444,629 | |
| Adjustments to reconcile net increase in net assets from | | | | |
| operations to net cash provided by operating activities: | | | | |
| Purchase of investment securities | | | (61,729,784 | ) |
| Proceeds on sale of securities | | | 70,210,794 | |
| Increase in other receivables, net | | | (14,415 | ) |
| Decrease in other assets | | | 4,895 | |
| Decrease in accrued expenses and other payables | | | (64,604 | ) |
| Net accretion of discount on securities | | | (9,987 | ) |
| Net realized gain on investments | | | (3,598,799 | ) |
| Unrealized appreciation on securities | | | (274,796 | ) |
| Net cash provided by operating activities | | $ | 8,967,933 | |
| | | | | |
| Cash Flows From Financing Activities: | | | | |
| Increase in reverse repurchase agreements | | $ | — | |
| Proceeds on shares sold | | | 3,312,735 | |
| Payment on shares repurchased | | | (12,243,186 | ) |
| Cash dividends paid, net of dividends reinvested | | | (37,482 | ) |
| Net cash used in financing activities | | $ | (8,967,933 | ) |
| | | | | |
| Cash at beginning of period | | | — | |
| Cash at end of period | | | — | |
| Net increase (decrease) in cash | | $ | — | |
| | | | | |
| Cash paid for interest | | $ | 44,553 | |
The accompanying notes are an integral part of these financial statements.
HENNESSY FUNDS 1-800-966-4354
Financial Highlights
| Hennessy Total Return Fund |
For an Investor Class share outstanding throughout each period
| | | Six Months Ended | |
| | | April 30, 2014 | |
| | | (Unaudited) | |
| PER SHARE DATA: | | | |
| Net asset value, beginning of period | | $ | 14.30 | |
| | | | | |
| Income from investment operations: | | | | |
| Net investment income | | | 0.10 | |
| Net realized and unrealized gains (losses) on securities | | | 0.66 | |
| Total from investment operations | | | 0.76 | |
| | | | | |
| Less distributions: | | | | |
| Dividends from net investment income | | | (0.09 | ) |
| Total distributions | | | (0.09 | ) |
| Net asset value, end of period | | $ | 14.97 | |
| | | | | |
| TOTAL RETURN | | | 5.34 | %(1) |
| | | | | |
| SUPPLEMENTAL DATA AND RATIOS: | | | | |
| Net assets, end of period (millions) | | $ | 85.72 | |
| Gross ratio of expenses, including interest expense, to average net assets | | | 1.36 | %(2) |
| Ratio of interest expense to average net assets | | | 0.09 | %(2) |
| Net ratio of expenses, excluding interest expense, to average net assets | | | 1.27 | %(2) |
| Ratio of net investment income to average net assets | | | 1.31 | %(2) |
| Portfolio turnover rate | | | 10 | %(1) |
| (1) | Not annualized. |
| (2) | Annualized. |
The accompanying notes are an integral part of these financial statements.
| Year Ended October 31, | |
| 2013 | | | 2012 | | | 2011 | | | 2010 | | | 2009 | |
| | | | | | | | | | | | | | |
| $ | 12.64 | | | $ | 11.47 | | | $ | 10.57 | | | $ | 9.10 | | | $ | 9.22 | |
| | | | | | | | | | | | | | | | | | | |
| | | | | | | | | | | | | | | | | | | |
| | 0.16 | | | | 0.18 | | | | 0.18 | | | | 0.16 | | | | 0.18 | |
| | 1.66 | | | | 1.17 | | | | 0.89 | | | | 1.48 | | | | (0.14 | ) |
| | 1.82 | | | | 1.35 | | | | 1.07 | | | | 1.64 | | | | 0.04 | |
| | | | | | | | | | | | | | | | | | | |
| | | | | | | | | | | | | | | | | | | |
| | (0.16 | ) | | | (0.18 | ) | | | (0.17 | ) | | | (0.17 | ) | | | (0.16 | ) |
| | (0.16 | ) | | | (0.18 | ) | | | (0.17 | ) | | | (0.17 | ) | | | (0.16 | ) |
| $ | 14.30 | | | $ | 12.64 | | | $ | 11.47 | | | $ | 10.57 | | | $ | 9.10 | |
| | | | | | | | | | | | | | | | | | | |
| | 14.49 | % | | | 11.78 | % | | | 10.22 | % | | | 18.09 | % | | | 0.69 | % |
| | | | | | | | | | | | | | | | | | | |
| | | | | | | | | | | | | | | | | | | |
| $ | 90.24 | | | $ | 77.67 | | | $ | 64.13 | | | $ | 69.08 | | | $ | 52.38 | |
| | 1.37 | % | | | 1.37 | % | | | 1.34 | % | | | 1.33 | % | | | 1.56 | % |
| | 0.10 | % | | | 0.08 | % | | | 0.10 | % | | | 0.08 | % | | | 0.29 | % |
| | 1.27 | % | | | 1.29 | % | | | 1.24 | % | | | 1.25 | % | | | 1.27 | % |
| | 1.16 | % | | | 1.44 | % | | | 1.56 | % | | | 1.62 | % | | | 2.12 | % |
| | 31 | % | | | 22 | % | | | 21 | % | | | 41 | % | | | 41 | % |
The accompanying notes are an integral part of these financial statements.
HENNESSY FUNDS 1-800-966-4354
Notes to the Financial Statements
April 30, 2014 (Unaudited)
1). ORGANIZATION
The Hennessy Total Return Fund (the “Fund”) is a series of Hennessy Funds Trust (the “Trust”), which was organized as a Delaware statutory trust on September 17, 1992. The Fund is an open-end management investment company registered under the Investment Company Act of 1940, as amended. The Fund is a successor to a fund with the same name (the “Predecessor Fund”) that was a series of The Hennessy Funds, Inc., a Maryland corporation, pursuant to a reorganization that took place after the close of business on February 28, 2014. Prior to February 28, 2014, the Fund had no investment operations. As a result of the reorganization, holders of the Investor Class shares of the Predecessor Fund received Investor Class shares of the Fund (the Investor Class shares of the Fund are the successor to the accounting and performance information of the Predecessor Fund). The investment objective of the Fund is total return, consisting of capital appreciation and current income. The Fund is a non-diversified fund.
The Fund offers Investor Class shares. Prior to October 26, 2012, the Investor Class shares were known as Original Class shares.
2). SIGNIFICANT ACCOUNTING POLICIES
The following is a summary of significant accounting policies consistently followed by the Fund in the preparation of the financial statements. These policies are in conformity with U.S. generally accepted accounting principles (“GAAP”).
| a). | Investment Valuation – All investments in securities are recorded at their estimated fair value, as described in Note 3. |
| b). | Federal Income Taxes – Provision for Federal income taxes or excise taxes has not been made since the Fund has elected to be taxed as a “regulated investment company” and intends to distribute substantially all of its taxable income to its shareholders and otherwise comply with the provisions of the Internal Revenue Code of 1986, as amended, applicable to regulated investment companies. Net investment income or loss and realized gains and losses for federal income tax purposes may differ from that reported on the financial statements because of temporary book and tax basis differences. Temporary differences are primarily the result of the treatment of wash sales for tax reporting purposes. Distributions from net realized gains for book purposes may include short-term capital gains, which are included as ordinary income to shareholders for tax purposes. |
| c). | Income and Expenses – Dividend income is recognized on the ex-dividend date or as soon as information is available to the Fund. Interest income, which includes the amortization of premium and accretion of discount, is recognized on an accrual basis. The Fund is charged for those expenses that are directly attributable to the portfolio, such as advisory, administration, and certain shareholder service fees. |
| d). | Distributions to Shareholders – Dividends from net investment income for the Fund, if any, are declared and paid out on a calendar quarter basis. Distributions of net realized capital gains, if any, are declared and paid annually, usually in November or December. |
| e). | Security Transactions – Investment and shareholder transactions are recorded on the trade date. The Fund determines the gain or loss realized from the investment |
| | transactions by comparing the original cost of the security lot sold with the net sale proceeds. Discounts and premiums on securities purchased are accreted/amortized over the life of the respective security. |
| f). | Use of Estimates – The preparation of financial statements in conformity with GAAP requires management to make estimates and assumptions that affect the reported amounts of assets and liabilities and disclosure of contingent assets and liabilities at the date of the financial statements and the reported change in net assets during the reporting period. Actual results could differ from those estimates. |
| g). | Share Valuation – The net asset value (“NAV”) per share of the Fund is calculated by dividing the sum of the value of the securities held by the Fund, plus cash or other assets, minus all liabilities (including estimated accrued expenses) by the total number of shares outstanding for the Fund, rounded to the nearest cent. The Fund’s shares will not be priced on days the New York Stock Exchange is closed for trading. The offering and redemption price per share for the Fund is equal to the Fund’s net asset value per share. |
| h). | Foreign Currency – Values of investments denominated in foreign currencies, if any, are converted into U.S. dollars using the spot market rate of exchange at the time of valuation. Purchases and sales of investments and income are translated into U.S. dollars using the spot market rate of exchange prevailing on the respective dates of such transactions. The Fund does not isolate the portion of the results of operations resulting from fluctuations in foreign exchange rates on investments from fluctuations resulting from changes in the market prices of securities held. Such fluctuations are included with the net realized and unrealized gain or loss on investments. Foreign investments present additional risks due to currency fluctuations, economic and political factors, lower liquidity, government regulations, differences in accounting standards, and other factors. |
| i). | Forward Contracts – The Fund may enter into forward currency contracts to reduce its exposure to changes in foreign currency exchange rates on its foreign holdings and to lock in the U.S. dollar cost of firm purchase and sale commitments for securities denominated in foreign currencies. A forward currency contract is a commitment to purchase or sell a foreign currency at a future date at a negotiated forward rate. The gain or loss arising from the difference between the U.S. dollar cost of the original contract and the value of the foreign currency in U.S. dollars upon closing of such contract is included in net realized gain or loss from foreign currency transactions. During the six months ended April 30, 2014, the Fund did not enter into any forward contracts. |
| j). | Repurchase Agreements – The Fund may enter into repurchase agreements with member banks or security dealers of the Federal Reserve Board whom the investment advisor deems creditworthy. The repurchase price generally equals the price paid by the Fund plus interest negotiated on the basis of current short-term rates. |
| | Securities pledged as collateral for repurchase agreements are held by the custodian bank until the respective agreements mature. Provisions of the repurchase agreements ensure that the market value of the collateral, including accrued interest thereon, is sufficient in the event of default of the counterparty. If the counterparty defaults and the value of the collateral declines or if the counterparty enters an insolvency proceeding, realization of the collateral by the Fund may be delayed or limited. |
| k). | Accounting for Uncertainty in Income Taxes – The Fund has adopted accounting policies regarding recognition and measurement of tax positions taken or expected to be taken on a tax return. The Fund has reviewed all open tax years in major jurisdictions and concluded that there is no impact on the Fund’s net assets and no tax liability |
HENNESSY FUNDS 1-800-966-4354
| | resulting from unrecognized tax benefits relating to uncertain income tax positions taken or expected to be taken on a tax return. The Fund’s major tax jurisdictions are U.S. Federal and Delaware. As of April 30, 2014, open Federal and state tax years for the Fund include the tax years ended October 31, 2011 through 2013. |
| l). | Derivatives – The Fund may invest in, or enter into, derivatives, such as options, futures contracts, options on futures contracts, and swaps, for a variety of reasons, including to hedge certain risks, to provide a substitute for purchasing or selling particular securities, or to increase potential income gain. Derivatives may provide a cheaper, quicker, or more specifically focused way for a Fund to invest than “traditional” securities would. The main purpose of utilizing these derivative instruments is for hedging purposes. |
| | The Fund has adopted the financial accounting reporting rules as required by the Derivatives and Hedging Topic of the Financial Accounting Standards Board Accounting Standards Codification. Under such rules, the Fund is required to include enhanced disclosure that enables investors to understand how and why an entity uses derivatives, how derivatives are accounted for, and how derivatives instruments affect an entity’s results of operations and financial position. During the six months ended April 30, 2014, the Fund did not hold any derivative instruments. |
| m). | Offsetting Assets and Liabilities – The Fund has adopted financial reporting rules regarding offsetting assets and liabilities and related netting arrangements to enable users of its financial statements to understand the effect of those arrangements on its financial position. Reverse repurchase transactions are entered into by the Fund under Master Repurchase Agreements (“MRA”) that permit the Fund, under certain circumstances, including an event of default (such as bankruptcy or insolvency), to offset payables under the MRA with collateral held with the counterparty and create one single net payment from the Fund. Upon a bankruptcy or insolvency of the MRA counterparty, the Fund is considered an unsecured creditor with respect to excess collateral and, as such, the return of excess collateral may be delayed. In the event the buyer of securities under an MRA files for bankruptcy or becomes insolvent, the Fund’s use of the proceeds of the agreement may be restricted while the other party, or its trustee or receiver, determines whether or not to enforce the Fund’s obligation to repurchase the securities. For additional information regarding the offsetting of assets and liabilities at April 30, 2014, please reference the table in Note 8. |
| n). | Events Subsequent to the Fiscal Period End – The Fund has adopted financial reporting rules regarding subsequent events that require an entity to recognize in the financial statements the effects of all subsequent events that provide additional evidence about conditions that existed at the date of the balance sheet. Management has evaluated the Fund’s related events and transactions that occurred subsequent to April 30, 2014 through the date of issuance of the Fund’s financial statements. There were no events or transactions that occurred during this period that materially impacted the amounts or disclosures in the Fund’s financial statements. |
3). SECURITIES VALUATION
The Fund has adopted authoritative fair valuation accounting standards that establish an authoritative definition of fair value and set out a hierarchy for measuring fair value. These standards require additional disclosures about the various inputs and valuation techniques used to develop the measurements of fair value and a discussion in changes in valuation techniques and related inputs during the period. These inputs are summarized in the three broad levels listed below:
| | Level 1 – | Quoted unadjusted prices for identical instruments in active markets to which the Fund has access at the date of measurement. |
| | Level 2 – | Quoted prices for similar instruments in active markets; quoted prices for identical or similar instruments in markets that are not active; and model-derived valuations in which all significant inputs and significant value drivers are observable in active markets. Level 2 inputs are those in markets for which there are few transactions, the prices are not current, the prices are fair value adjusted due to post-market close subsequent events (foreign markets), little public information exists, or instances where prices vary substantially over time or among brokered market makers. These inputs may also include interest rates, prepayment speeds, credit risk curves, default rates, and similar data. |
| | Level 3 – | Model-derived valuations in which one or more significant inputs or significant value drivers are unobservable. Unobservable inputs are those inputs that reflect the Fund’s own assumptions about what market participants would use to price the asset or liability based on the best available information. |
Following is a description of the valuation techniques applied to the Fund’s major categories of assets and liabilities measured at fair value on a recurring basis.
Equity Securities – Equity securities, including common stocks, preferred stocks, foreign issued common stocks, exchange traded funds, closed-end mutual funds, and real estate investment trusts, that are traded on a securities exchange for which a last-quoted sales price is readily available will be valued at the last sales price as reported by the primary exchange on which the securities are listed. Securities listed on The NASDAQ Stock Market (“NASDAQ”) will be valued at the NASDAQ Official Closing Price, which may differ from the last sales price reported. Securities traded on a securities exchange for which a last-quoted sales price is not readily available will be valued at the mean between the bid and ask prices. To the extent these securities are actively traded and valuation adjustments are not applied, they are classified in Level 1 of the fair value hierarchy.
Investment Companies – Investments in investment companies (e.g., mutual funds and exchange traded funds) are generally priced at the ending NAV provided by the Fund’s service agent and will be classified in Level 1 of the fair value hierarchy.
Debt Securities – Debt securities, including corporate bonds, asset-backed securities, mortgage-backed securities, municipal bonds, U.S. Treasuries, and U.S. government agency issues, are valued at market on the basis of valuations furnished by an independent pricing service that utilizes both dealer-supplied valuations and formula-based techniques. The pricing service may consider recently executed transactions in securities of the issuer or comparable issuers, market price quotations (where observable), bond spreads, and fundamental data relating to the issuer. In addition, the model may incorporate market observable data such as reported sales of similar securities, broker quotes, yields, bids, offers, and reference data. Certain securities are valued principally using dealer quotations. These securities are generally classified in Level 2 of the fair value hierarchy.
Short-Term Securities – Short-term equity investments, including money market funds, are valued in the manner specified above. Short-term debt investments are valued at amortized cost, if their original maturity was 60 days or less, or by amortizing the values as of the 61st day prior to maturity, if their original term to maturity exceeded 60 days. Short-term securities are generally classified in Level 1 or Level 2 of the fair market hierarchy depending on the inputs used and market activity levels for specific securities.
HENNESSY FUNDS 1-800-966-4354
The Board of Trustees of the Fund (the “Board”) has adopted fair value pricing procedures that are followed when a price for a security is not readily available or if a significant event has occurred that indicates the closing price of a security no longer represents the true value of that security. Fair value pricing determinations are made in good faith in accordance with these procedures. There are numerous criteria that will be given consideration in determining a fair value of a security. Some of these criteria are trading volume of security and markets, the value of other like securities, and news events with direct bearing to security or market. Fair value pricing results in an estimated price that reasonably reflects the current market conditions in order to rate the portfolio holdings such that shareholder transactions receive a fair net asset value. Depending on the relative significance of the valuation inputs, these securities may be classified in either Level 2 or Level 3 of the fair value hierarchy.
Fair valuing of foreign securities may be determined with the assistance of a pricing service using correlations between the movement of prices of such securities and indices of domestic securities and other appropriate indicators, such as closing market prices of relevant American Depositary Receipts or futures contracts. The effect of using fair value pricing is that the Fund’s NAV will reflect the affected portfolio securities’ value as determined in the judgment of the Board or its designee instead of being determined by the market. Using a fair value pricing methodology to price foreign securities may result in a value that is different from a foreign security’s most recent closing price and from the prices used by other investment companies to calculate their net asset values and are generally considered Level 2 prices in the fair valuation hierarchy. Because the Fund may invest in foreign securities, the value of the Fund’s portfolio securities may change on days when you will not be able to purchase or redeem your shares.
The Board has delegated day-to-day valuation matters to a Valuation Committee comprised of one or more representatives from Hennessy Advisors, Inc., the Fund’s investment advisor. The function of the Valuation Committee is to value securities where current and reliable market quotations are not readily available. All actions taken by the Valuation Committee are reviewed by the Board.
The Fund has performed an analysis of all existing investments to determine the significance and character of all inputs to their fair value determination. Various inputs are used in determining the value of the Fund’s investments. The inputs or methodology used for valuing securities are not necessarily an indication of the risk associated with investing in those securities. Details related to the fair valuation hierarchy of the Fund’s securities as of April 30, 2014 are included in the Fund’s Schedule of Investments.
4). INVESTMENT TRANSACTIONS
Purchases and sales of investment securities (excluding government and short-term investments) for the Fund during the six months ended April 30, 2014 were $6,099,978 and $10,383,908, respectively.
There were no purchases or sales/maturities of long-term U.S. Government Securities for the Fund during the six months ended April 30, 2014.
5). INVESTMENT MANAGEMENT FEE AND OTHER TRANSACTIONS WITH AFFILIATES
Hennessy Advisors, Inc. (the “Advisor”) is the investment advisor of the Fund. The Advisor provides the Fund with investment management services under an Investment Advisory Agreement. The Advisor furnishes all investment advice, office space, facilities, and provides most of the personnel needed by the Fund. As compensation for its services, the Advisor is entitled to a monthly fee from the Fund. The fee is based upon the average
daily net assets of the Fund at the annual rate of 0.60%. The net investment advisory fees payable for the Fund as of April 30, 2014 were $42,046.
The Board has approved a Shareholder Servicing Agreement for the Fund, which was instituted to compensate the Advisor for the non-investment management services it provides to the Fund. The Shareholder Servicing Agreement provides for a monthly fee paid to the Advisor at an annual rate of 0.10% of the average daily net assets of the Fund. Shareholder servicing fees payable for the Fund as of April 30, 2014 were $7,008.
The Fund has adopted a plan pursuant to Rule 12b-1 under the Investment Company Act of 1940, as amended, that authorizes payments in connection with the distribution of the Fund’s shares at an annual rate of up to 0.15% of the Fund’s average daily net assets. Amounts paid under the plan may be spent on any activities or expenses primarily intended to result in the sale of shares, including but not limited to, advertising, compensation for sales and marketing activities or financial institutions and others such as dealers and distributors, shareholder account servicing, the printing and mailing of prospectuses to other than current shareowners, and the printing and mailing of sales literature.
The Fund has entered into agreements with various brokers, dealers, and financial intermediaries in connection with the sale of shares of the Fund. The agreements provide for periodic payments by the Fund to the brokers, dealers, and financial intermediaries for providing certain shareholder maintenance services (sub-transfer agent expenses). These shareholder services include the pre-processing and quality control of new accounts, shareholder correspondence, answering customer inquiries regarding account status, and facilitating shareholder telephone transactions. Fees paid by the Fund to various brokers, dealers, and financial intermediaries for the six months ended April 30, 2014 were $40,423.
U.S. Bancorp Fund Services, LLC (“USBFS”) provides the Fund with administrative, fund accounting, and transfer agent services, including all regulatory reporting, and necessary office equipment and personnel. As administrator, USBFS prepares various federal and state regulatory filings, reports, and returns for the Fund; prepares reports and materials to be supplied to the Board; monitors the activities of the Fund’s custodian, transfer agent, and accountants; and coordinates the preparation and payment of the Fund’s expenses and reviews the Fund’s expense accruals. Fees paid to USBFS for the six months ended April 30, 2014 were $87,294.
U.S. Bank, N.A., an affiliate of USBFS, serves as the Fund’s custodian. Quasar Distributors, LLC acts as the Fund’s principal underwriter in a continuous public offering of the Fund’s shares. Quasar Distributors, LLC is an affiliate of USBFS and U.S. Bank, N.A.
6). LINE OF CREDIT
The Fund has a line of credit with the other funds in the Hennessy Funds family of funds (the “Hennessy Funds”) in the amount of the lesser of (i) $100,000,000 or (ii) 33.33% of each Hennessy Fund’s net assets, or 30% for the Hennessy Gas Utility Index Fund and 10% for the Hennessy Balanced Fund, intended to provide short-term financing, if necessary, subject to certain restrictions, in connection with shareholder redemptions. The credit facility is with the Hennessy Funds’ custodian bank, U.S. Bank, N.A. Borrowings under this arrangement bear interest at the bank’s prime rate. During the six months ended April 30, 2014, the Fund had an outstanding average daily balance and a weighted average interest rate of $735 and 3.25%, respectively. The maximum amount outstanding for the Fund during the period was $133,000.
HENNESSY FUNDS �� 1-800-966-4354
7). FEDERAL TAX INFORMATION
As of October 31, 2013, the Fund’s most recent fiscal year end, the components of accumulated earnings (losses) for income tax purposes for the Fund were as follows:
| | Cost of investments for tax purposes | | $ | 111,406,807 | |
| | Gross tax unrealized appreciation | | $ | 13,388,054 | |
| | Gross tax unrealized depreciation | | | (237,537 | ) |
| | Net tax unrealized appreciation/depreciation | | $ | 13,150,517 | |
| | Undistributed ordinary income | | $ | 66,417 | |
| | Undistributed long-term capital gains | | | — | |
| | Total distributable earnings | | $ | 66,417 | |
| | Other accumulated gain (loss) | | $ | (2,084,535 | ) |
| | Total accumulated gain (loss) | | $ | 11,132,399 | |
The difference between book-basis and tax-basis unrealized appreciation is attributable primarily to capital loss carry overs, wash sales, and partnership adjustments.
At October 31, 2013, the Fund’s most recent fiscal year end, the Fund had capital loss carryforwards that expire as follows:
During the year ended October 31, 2013, the Fund’s most recent fiscal year end, the capital loss carry forwards utilized for the Fund were $4,924,652.
Capital losses sustained in the year ended October 31, 2012 and in future taxable years will not expire and may be carried over by the Fund without limitation; however, they will retain the character of the original loss. Furthermore, any losses incurred during those taxable years will be required to be utilized prior to the losses incurred in the pre-enactment taxable years. As a result of this ordering rule, pre-enactment capital loss carryforwards may be more likely to expire unused. Under pre-enactment law, capital losses could be carried forward for eight years, and carried forward as short-term capital losses, irrespective of the character of the original loss.
At October 31, 2013, the Fund did not defer, on a tax basis, any post-December late year ordinary loss deferrals or post-December loss deferrals.
The tax character of distributions paid during fiscal year 2014 (year-to-date) and fiscal year 2013 for the Fund were as follows:
| | | | Six Months Ended | | | Year Ended | |
| | | | April 30, 2014 | | | October 31, 2013 | |
| | Ordinary income | | $ | 539,805 | | | $ | 957,145 | |
| | Long-term capital gain | | | — | | | | — | |
| | | | $ | 539,805 | | | $ | 957,145 | |
8). REVERSE REPURCHASE AGREEMENTS
The Fund may enter into reverse repurchase agreements with the same parties with whom it may enter into repurchase agreements. Under a reverse repurchase agreement, the Fund sells securities and agrees to repurchase them at a mutually agreed upon date and price. Reverse repurchase agreements are regarded as a form of secured borrowing by the Fund. Securities sold under reverse repurchase agreements are reflected as a liability on the Statement of Assets and Liabilities. Interest payments made are recorded as a component of interest expense on the Statement of Operations.
For the six months ended April 30, 2014, the average daily balance and average interest rate in effect for reverse repurchase agreements were $34,449,359 and 0.241%,
respectively. At April 30, 2014, the interest rate in effect for the outstanding reverse repurchase agreements scheduled to mature on May 22, 2014 ($8,995,000), June 26, 2014 ($10,794,000), and July 24, 2014 ($14,392,000) was 0.25%, 0.25%, and 0.25%, respectively. Outstanding reverse repurchase agreements at April 30, 2014 were equal to 39.88% of the Fund’s net assets.
Below is the gross and net information about instruments and transactions eligible for offset in the Statement of Assets and Liabilities as well as instruments and transactions subject to an agreement similar to a master netting arrangement:
| | | Gross | Net | | | |
| | | Amounts | Amounts | | | |
| | | Offset | Presented | Gross Amounts Not | |
| | | in the | in the | Offset in the Statement | |
| | Gross | Statement | Statement | of Assets and Liabilities | |
| | Amounts of | of | of | | Collateral | |
| | Recognized | Assets and | Assets and | Financial | Pledged | Net |
| Description | Liabilities | Liabilities | Liabilities | Instruments | (Received) | Amount |
| Reverse | | | | | | |
| Repurchase | | | | | | |
| Agreements | $34,181,000 | $ — | $34,181,000 | $34,181,000 | $ — | $ — |
| | $34,181,000 | $ — | $34,181,000 | $34,181,000 | $ — | $ — |
For additional information, please reference the “Offsetting Assets and Liabilities” section in Note 2.
9). AGREEMENT AND PLAN OF REORGANIZATION
On December 11, 2013, the Board approved an Agreement and Plan of Reorganization (the “Agreement”), of the Hennessy Total Return Fund (the “New Fund”), pursuant to which the New Fund would be a successor to the corresponding series of the same name of The Hennessy Funds, Inc., a Maryland corporation (the “Predecessor Fund”). The Agreement provided for the transfer of assets of the Predecessor Fund to the New Fund and the assumption of the liabilities of the Predecessor Fund by the New Fund. The New Fund had the same investment objective and substantially similar principal investment strategies as the Predecessor Fund. The reorganization was effective as of the close of business on February 28, 2014. The following table illustrates the specifics of the reorganization:
| | | Shares of the New Fund | | | |
| | Predecessor Fund | Issued to Shareholders of | New Fund | Combined | Tax Status |
| | Net Assets | the Predecessor Fund | Net Assets | Net Assets | of Transfer |
| | $85,203,249(1) | 5,860,970 | $85,203,249 | $85,203,249 | Non-taxable |
| | (1) | Included accumulated realized gains and unrealized appreciation in the amounts of $221,200 and $11,758,211, respectively. |
HENNESSY FUNDS 1-800-966-4354
Expense Example (Unaudited)
April 30, 2014
As a shareholder of the Fund, you incur two types of costs: (1) transaction costs, including sales charges (loads) on purchase payments, reinvested dividends, or other distributions; redemption fees; and exchange fees; and (2) ongoing costs, including management fees; service fees; and other Fund expenses. This Example is intended to help you understand your ongoing costs (in dollars) of investing in the Fund and to compare these costs with the ongoing costs of investing in other mutual funds. The Example is based on an investment of $1,000 invested at the beginning of the period and held for the entire period from November 1, 2013 through April 30, 2014.
Actual Expenses
The first line of the table below provides information about actual account values and actual expenses. Although the Fund charges no sales loads or transaction fees, you will be assessed fees for outgoing wire transfers, returned checks and stop payment orders at prevailing rates charged by U.S. Bancorp Fund Services, LLC, the Fund’s transfer agent. If you request that a redemption be made by wire transfer, currently a $15.00 fee is charged by the Fund’s transfer agent. IRA accounts will be charged a $15.00 annual maintenance fee. The example below includes, but is not limited to, management fees, shareholder servicing fees, fund accounting, custody, and transfer agent fees. However, the example below does not include portfolio trading commissions and related expenses, and other extraordinary expenses as determined under generally accepted accounting principles. You may use the information in this line, together with the amount you invested, to estimate the expenses that you paid over the period. Simply divide your account value by $1,000 (for example, an $8,600 account value divided by $1,000 = 8.6), then multiply the result by the number in the first line of the table under the heading entitled “Expenses Paid During Period” to estimate the expenses you paid on your account during this period.
Hypothetical Example for Comparison Purposes
The second line of the table below provides information about hypothetical account values and hypothetical expenses based on the Fund’s actual expense ratios and an assumed rate of return of 5% per year before expenses, which is not the Fund’s actual return. The hypothetical account values and expenses may not be used to estimate the actual ending account balance or expenses you paid for the period. You may use this information to compare the ongoing costs of investing in the Fund and other funds. To do so, compare this 5% hypothetical example with the 5% hypothetical examples that appear in the shareholder reports of the other funds. Please note that the expenses shown in the table are meant to highlight your ongoing costs only and do not reflect any transactional costs, such as sales charges (loads), or exchange fees. Therefore, the second line of the table is useful in comparing ongoing costs only, and will not help you determine the relative total costs of owning different funds. In addition, if these transactional costs were included, your costs would have been higher.
| | | | Expenses Paid |
| | Beginning | Ending | During Period(1) |
| | Account Value | Account Value | November 1, 2013 – |
| | November 1, 2013 | April 30, 2014 | April 30, 2014 |
| Investor Class | | | |
| | | | |
| Actual | $1,000.00 | $1,053.40 | $6.92 |
| | | | |
| Hypothetical (5% return | | | |
| before expenses) | $1,000.00 | $1,018.05 | $6.80 |
| (1) | Expenses are equal to the Fund’s annualized expense ratio of 1.36%, multiplied by the average account value over the period, multiplied by 181/365 days (to reflect one-half year period). |
HENNESSY FUNDS 1-800-966-4354
Proxy Voting
A description of the policies and procedures the Fund uses to determine how to vote proxies relating to portfolio securities is available without charge: (1) by calling 1-800-966-4354; (2) on the Hennessy Funds’ website at hennessyfunds.com; or (3) on the U.S. Securities and Exchange Commission’s (the “SEC”) website at www.sec.gov. The Fund’s proxy voting record is available on both the Hennessy Funds’ website at hennessyfunds.com and the SEC’s website at www.sec.gov no later than August 31 for the prior 12 months ending June 30.
Quarterly Filings on Form N-Q
The Fund files its complete schedule of portfolio holdings with the SEC for the first and third quarters of each fiscal year on Form N-Q. The Fund’s Forms N-Q are available on the SEC’s website at www.sec.gov. The Fund’s Forms N-Q may be reviewed and copied at the SEC’s Public Reference Room in Washington, DC and information on the operation of the Public Reference Room may be obtained by calling 1-800-SEC-0330. Information included in the Fund’s Forms N-Q will also be available upon request by calling 1-800-966-4354.
Federal Tax Distribution Information
(Unaudited)
For the fiscal year ended October 31, 2013, certain dividends paid by the Fund may be subject to a maximum tax rate of 15%, as provided for by the Jobs and Growth Tax Relief Reconciliation Act of 2003. The percentage of dividends declared from ordinary income designated as qualified dividend income was 100.00%.
For corporate shareholders, the percent of ordinary income distributions qualifying for the corporate dividends received deduction for the fiscal year ended October 31, 2013 was 100.00%.
The percentage of taxable ordinary income distributions that are designated as short-term capital gain distributions under Section 871(k)(2)(C) of the Internal Revenue Code of 1986, as amended, for the Fund was 0.00%.
Householding
To help keep the Fund’s costs as low as possible, we generally deliver a single copy of most financial reports and prospectuses to shareholders who share an address, even if the accounts are registered under different names. This process, known as “householding,” does not apply to account statements. You may, of course, request an individual copy of a prospectus or financial report at any time. If you would like to receive separate mailings, please call the Administrator at 1-800-261-6950 or 1-414-765-4124 and we will begin individual delivery within 30 days of your request. If your account is held through a financial institution or other intermediary, please contact them directly to request individual delivery.
Board Approval of Investment Advisory
Agreement
At its meeting on December 4, 2013, the Board of Trustees of the Fund (the “Board”) unanimously approved the investment advisory agreement of the Fund for an initial period of two years.
The Board reviewed a number of documents, including a memorandum provided by outside legal counsel that described the fiduciary duties of the Board with respect to approving the investment advisory agreement and the relevant factors for consideration, the Advisor’s most recent Form 10-K, a copy of the advisory agreement, a fund fact sheet, and peer expense and performance comparisons. The Board considered and discussed numerous factors, including the following:
| | • | The Board considered the services identified below that are provided by the Advisor: |
| | | • | The Advisor acts as portfolio manager for the Fund. In this capacity, the Advisor manages the composition of the portfolio of the Fund, including the purchase, retention, and disposition of portfolio securities in accordance with the Fund’s investment objectives, policies, and restrictions. |
| | | • | The Advisor oversees distribution of the Fund through third-party broker/dealers and independent financial institutions such as Charles Schwab, Inc., Fidelity, TD Waterhouse, and Pershing. The Advisor participates in “no transaction fee” (“NTF”) programs with these companies on behalf of the Fund, which allows customers to purchase the Fund through third-party distribution channels without paying a transaction fee. The Advisor compensates a number of these third-party providers of NTF programs out of its own revenues and not those of the Fund. |
| | | • | The Advisor oversees service providers that support the Fund in providing fund accounting, fund administration, fund distribution, transfer agency, and custodial services. |
| | • | The Board considered that the advisory services to be provided by the Advisor are services required for the operation of the Fund. |
| | • | The Board considered the nature and quality of the advisory services offered by the Advisor to the Fund. |
| | • | The Board considered that the terms of the advisory agreement are fair and reasonable. |
| | • | The Board compared the performance of the Fund to benchmark indices over various periods of time and concluded that the positive performance of the Fund warranted the approval of the advisory agreement. |
| | • | The Board reviewed the Fund’s expense ratio and comparable expense ratios for funds comparable to the Fund. The Board used data from Morningstar showing funds similar in asset size and investment objective to the Fund and determined that the expense ratio of the Fund falls within the range of the ratios of other comparable funds and concluded that the expenses of the Fund were reasonable. |
| | • | The Board considered the fees charged by the Advisor to those of funds similar in asset size and investment objective to the Fund and concluded the advisory fee of the Fund was reasonable and warranted approval of the advisory agreement. |
HENNESSY FUNDS 1-800-966-4354
| | • | The Board considered the profitability of the Advisor with respect to the Fund and concluded the profits were reasonable and not excessive when compared to profitability guidelines set forth in relevant court cases. |
| | • | The Board considered the high level of professionalism and knowledge of the Advisor’s employees, along with an extremely low level of turnover of the employees of the Advisor, and concluded that this was beneficial to the Fund and its shareholders, as it ensures that the Fund is operated efficiently. |
All of the factors above were considered separately by the Board, including the Trustees who are not “interested persons” (as defined in the Investment Company Act of 1940, as amended) of the Fund (the “Independent Trustees”) meeting in an executive session. The factors were viewed in their totality by the Board, with no single factor being the principal or determinative factor in the Board’s determination of whether to approve the advisory agreement. Based on the factors discussed above, the Board, including all of the Independent Trustees, recommended approval of the advisory agreement.
(This Page Intentionally Left Blank.)
For information, questions or assistance, please call
The Hennessy Funds
1-800-966-4354 or 1-415-899-1555
INVESTMENT ADVISOR
Hennessy Advisors, Inc.
7250 Redwood Blvd., Suite 200
Novato, California 94945
ADMINISTRATOR,
TRANSFER AGENT,
DIVIDEND PAYING AGENT &
SHAREHOLDER SERVICING AGENT
U.S. Bancorp Fund Services, LLC
P.O. Box 701
Milwaukee, Wisconsin 53201-0701
CUSTODIAN
U.S. Bank N.A.
Custody Operations
1555 North River Center Dr., Suite 302
Milwaukee, Wisconsin 53212
TRUSTEES
Neil J. Hennessy
Robert T. Doyle
J. Dennis DeSousa
Gerald P. Richardson
COUNSEL
Foley & Lardner LLP
777 East Wisconsin Avenue
Milwaukee, Wisconsin 53202-5306
INDEPENDENT REGISTERED
PUBLIC ACCOUNTING FIRM
KPMG LLP
777 East Wisconsin Avenue
Milwaukee, Wisconsin 53202-5306
DISTRIBUTOR
Quasar Distributors, LLC
615 East Michigan Street
Milwaukee, Wisconsin 53202
hennessyfunds.com | 1-800-966-4354
This report has been prepared for shareholders and may be distributed to
others only if preceded or accompanied by a current prospectus.
SEMI-ANNUAL REPORT
APRIL 30, 2014
HENNESSY EQUITY AND
INCOME FUND
Investor Class HEIFX
Institutional Class HEIIX
hennessyfunds.com | 1-800-966-4354
(This Page Intentionally Left Blank.)
Contents
| Letter to Shareholders | 2 |
| Performance Overview | 4 |
| Financial Statements | |
| Schedule of Investments | 7 |
| Statement of Assets and Liabilities | 18 |
| Statement of Operations | 19 |
| Statements of Changes in Net Assets | 21 |
| Financial Highlights | 22 |
| Notes to the Financial Statements | 26 |
| Expense Example | 33 |
| Proxy Voting | 35 |
| Quarterly Filings on Form N-Q | 35 |
| Federal Tax Distribution Information | 35 |
| Householding | 35 |
| Board Approval of Investment Advisory Agreements | 36 |
HENNESSY FUNDS 1-800-966-4354
June 2014
Dear Shareholder:
The financial markets have provided strong returns over the past six-months ended April 30, 2014, with the Dow Jones Industrial Average (DJIA) and S&P 500 both returning approximately 8% during the period. The current valuation metrics of the major indices are solid; for example, the DJIA currently has a price-to-earnings ratio of 15x and a price-to-sales ratio of 1.75x. The DJIA also has a dividend yield of 2.2%, which is nearly as high as that of a 10-Year U.S. Treasury, which is currently yielding 2.6%. Investing in high-yielding, high-quality DJIA stocks have the potential to not only provide an income stream but also for stock price appreciation as well. Fixed income investing has run its course, in my opinion, and many individuals are currently benefiting from the return to investing in equities that possess strong fundamentals.
U.S. corporations continue to drive shareholder value by making acquisitions, initiating and raising dividends, investing in internal infrastructure, and buying back stock. However, lately I have begun to see a shift in those business strategies. The easier-to-execute acquisitions seem to be a thing of the past, and firms now have to be even more creative to execute accretive deals. I also believe that while firms may continue to initiate dividends, fewer firms will raise their dividends and fewer firms will participate in stock buyback programs going forward. So what will these cash-rich companies do with their capital if they are not raising dividends or buying back stock? I believe we will see companies begin to initiate capital expenditure programs.
Due to the continuing uncertainty from a lack of clear policies on taxes, healthcare, and regulations, I have observed that corporations would rather wait for clarity from our government leaders and defer any significant changes to their current business models. Up until this point, there has been no real cost for firms to defer spending their capital as they wait for anticipated guidance on policies that directly affect their businesses. But, this economic handcuffing from all of this uncertainty has gone on long enough. I believe there will now be firms who want to improve their margins and will begin spending money to expand their sales, and may even begin to hire. Once a competitor begins to move in this way, then the cost to defer becomes real for companies. This movement to expansion may well be a catalyst to propel the financial markets. I do believe this will be a slow shift, but one that will keep the economy improving, and should, in my opinion, help to generate reasonable market returns over the next few years.
With almost $3 trillion in cash sitting on the sidelines, this strategic shift by companies to begin spending their idle capital should help the economic recovery in the U.S. But that is only one part of the equation. Washington politics still play a role in how strong that recovery will be. The national political landscape will change in the next few years, and the future generation of elected officials will be faced with what I believe are fictitious unemployment figures (6.3% reported, when over 20 million Americans are looking for more work or a better job), a sluggish economy, and global competition in business. The next regime needs to provide real clarity on the issues that face all Americans and American corporations: taxation, regulation, and how to pay for our new healthcare system. I also believe that our government needs to regard business as a noble profession and to implement common sense and logic in their policy making instead of politics as usual. As Confucius is quoted as saying, “Life is really simple, but we insist on making it complicated.”
I am confident that even with all the hurdles facing corporate America, companies continue to provide good value for their shareholders, and I believe that means the financial markets are in good shape and should remain strong moving forward, I also believe that the next few months may be volatile. Fads come and go, and the current buzz on the Street is around investing in social media stocks. I believe that chasing hot products has contributed and will continue to contribute to the volatility of the markets this year. After over 35 years in the business, I still firmly believe the best way to position your portfolio is by investing in good companies over the long term, rather than trying to buy the next hot idea at exactly the right time. At Hennessy Funds, hunches and fads have no place in our investment process, and we understand that successful investing comes from time in the market, not timing the market.
We remain focused on investing based on proven fundamentals, and we are committed to managing money for the sole benefit of our shareholders. If you have any questions or want to speak with us directly, please don’t hesitate to call us at (800) 966-4354.
Best regards,
Neil J. Hennessy
President and Chief Investment Officer
Past performance does not guarantee future results.
Mutual fund investing involves risk. Principal loss is possible.
Opinions expressed are those of Neil Hennessy and are subject to change, are not guaranteed and should not be considered investment advice.
The Dow Jones Industrial Average and S&P 500 are unmanaged indices commonly used to measure the performance of U.S. stocks. One cannot invest directly in an index.
Price-to-sales ratio and price-to-earnings ratio are tools for calculating relative valuation. Price-to-sales ratio is calculated by dividing the market price by revenue per share. Price-to-earnings ratio is the market price per share divided by earnings per share.
HENNESSY FUNDS 1-800-966-4354
Performance Overview (Unaudited)
The opinions expressed in the following commentaries reflect those of the Portfolio Managers as of the date written. Any such opinions are subject to change based on market or other conditions and are not guaranteed. These opinions may not be relied upon as investment advice. Investment decisions for the Fund are based on several factors, and may not be relied upon as an indication of trading intent on behalf of the Fund. Security positions can and do change.
AVERAGE ANNUAL TOTAL RETURN PERIODS ENDED APRIL 30, 2014
| | Six | One | Five | Ten |
| | Months(1) | Year | Years | Years |
| Hennessy Equity and Income Fund – | | | | |
| Investor Class (HEIFX) | 4.49% | 9.16% | 14.11% | 8.02% |
| Hennessy Equity and Income Fund – | | | | |
| Institutional Class (HEIIX) | 4.61% | 9.37% | 14.37% | 8.28% |
Blended Balanced Index(2) | 5.37% | 11.85% | 13.20% | 6.57% |
| S&P 500 Index | 8.36% | 20.44% | 19.14% | 7.67% |
| Expense ratios: | Gross 1.39%, Net 1.36%(3) (Investor Class); |
| | Gross 1.09% (Institutional Class) |
Performance data quoted represents past performance; past performance does not guarantee future results. The investment return and principal value of an investment will fluctuate so that an investor’s shares, when redeemed, may be worth more or less than their original cost. Current performance of the fund may be lower or higher than the performance quoted. Performance data current to the most recent month end may be obtained by visiting hennessyfunds.com. Performance for the period from March 12, 2010 to October 26, 2012 is that of the FBR Balanced Fund and for the periods prior to March 12, 2010 is that of the AFBA 5 Star Balanced Fund.
The expense ratios presented are from the most recent prospectus.
| (1) | Periods less than one year are not annualized. |
| (2) | The Blended Balanced Index consists of 60% common stocks represented by the S&P 500 Index and 40% bonds represented by the Barclays Capital Intermediate U.S. Government/Credit Index. |
| (3) | With regard to Investor Class shares, the Fund’s investment advisor has contractually agreed to waive a portion of its expenses through February 28, 2015. |
PERFORMANCE NARRATIVE
THE LONDON COMPANY OF VIRGINIA, LLC,
SUB-ADVISOR (EQUITY PORTION)
FINANCIAL COUNSELORS, INC., SUB-ADVISOR (FIXED INCOME PORTION)
For the six-month period ended April 30, 2014, the Investor Class of the Hennessy Equity and Income Fund returned 4.49%, underperforming the Blended Balanced Index, the S&P 500 Index, and the Morningstar Moderate Allocation Category Average, which returned 5.37%, 8.36%, and 4.65% for the same period, respectively.
Portfolio Managers: Stephen M. Goddard, CFA (Lead Portfolio Manager), Jonathan T. Moody, CFA, J. Brian Campbell, CFA, Mark DeVaul, CFA, CPA, The London Company of Virginia, LLC (sub-advisor of the equity portion of the Fund)
Over the previous six months, how did the equity portion of the Fund perform and what factors contributed to this performance?
Domestic equity returns for the six-month period ended April 30, 2014 were strong, driven heavily by gains coming from the last two months of 2013. Year-to-date returns have been less consistent in their strength. The year started with a preference for growth over value, as well as low quality over high quality. However, this changed late in March after Fed Chairman Yellen introduced the possibility of higher interest rates sooner than many expected. This led to a change in market leadership and value-oriented, lower beta, large-cap stocks took over, which was a favorable development for the Fund’s portfolio. Although the period ended with the Fund behind its primary benchmark, the relative returns were positive during the last few months of the six-month period and are reflective of a trend that has since continued. The Fund’s overweight position in the Consumer Staples sector and underweight position in the Health Care sector hurt performance this period. The Fund’s holdings in the Energy and Health Care sectors underperformed, but were offset by positive returns from holdings in the Industrials and Consumer Staples sectors.
Additional Portfolio Manager commentary on the equity portion of the Fund and the related investment outlook:
With the markets appearing to move ever-higher, we often are asked where the market is headed next, whether or not stocks are becoming over-valued, and if we are encountering difficulty in uncovering fresh investment opportunities. We are neither prognosticators nor seers, and have no informed opinion as to the market’s next move or direction. For us, one critical determinant is the equity risk premium, which measures the spread between the cost of debt and the cost of equity. The amount of that spread defines the degree of opportunity that corporate managements have to optimize capital structure for the benefit of shareholders. From our vantage point, the backdrop remains advantageous and we are finding no dearth of fresh ideas across sectors and the market cap spectrum.
Our approach is to strive to own companies with strong returns on capital and flexibility to enhance shareholder value using the balance sheet. Low interest rates and relatively high equity risk premiums can enable companies to potentially increase shareholder value by adjusting the capital structure of the company. Separately, with elevated cash levels on corporate balance sheets and dividend payout ratios near historic lows, we expect investors to reward companies that wisely deploy capital, including through higher dividends, share repurchases, and merger and acquisition transactions. We believe the Fund’s more conservative portfolio is well positioned for a slow-growth environment that has the potential to reward strong capital allocation.
Portfolio Managers: Gary B. Cloud, CFA and Peter G. Greig, CFA, Financial Counselors, Inc. (sub-advisor of the fixed income portion of the Fund)
Over the previous six months, how did the fixed income portion of the Fund perform and what factors contributed to this performance?
A pro-cyclical asset allocation in the Fund helped performance due to an overweight position in Corporate bonds and an underweight position in U.S. Treasury securities. Higher yielding fixed income securities in the portfolio boosted the interest income component of total return, adding to performance. The biggest boost to the Fund’s performance came from Fixed Income sector asset allocation and individual issue selection, while the amortization and roll effect had the largest negative impact on Fund performance.
Additional Portfolio Manager commentary on the fixed income portion of the Fund and the related investment outlook:
Long-term government bond yields confounded the pessimists and dropped sharply during the six-month period. The yield curve flattened noticeably as short-term rates brought forward the first interest rate hike and longer maturities priced in a more benign
HENNESSY FUNDS 1-800-966-4354
inflation environment. The net result was almost an entire retracement of last years’ negative return for the major investment grade bond indices over the last 180 days.
We believe that potential GDP continues to be in the 2.00% to 2.50% range and the U.S. economy will have a hard time overheating. We believe China and Japan are both looking weaker this year, and Europe seems to be relegated to 1.00% trend growth. We expect that emerging market economies will likely weigh on global growth due to the need to rebalance their economies through lower current account deficits and higher short-term interest rates.
We believe geopolitical tensions, subpar U.S. economic growth, and weak personal income growth will likely weigh on inflation pressures for the rest of this year. We expect interest rates to remain stubbornly low over the near term and perhaps end the year about where they started 2014. We believe short-term interest rates will move higher sometime in the next few years, but we do not expect that to happen over the next two quarters.
The Blended Balanced Index consists of 60% common stocks represented by the S&P 500 Index and 40% bonds represented by the Barclays Capital Intermediate U.S. Government/Credit Index. The S&P 500 Index is an unmanaged index commonly used to measure the performance of U.S. stocks. The Barclays Capital Intermediate U.S. Government/Credit Index is an unmanaged index commonly used to measure the performance of U.S. bonds. You cannot invest directly in an index. Performance data for an index does not reflect any deductions for fees, expenses or taxes. The Fund may invest in debt securities, which typically decrease in value when interest rates rise. The risk is greater for longer term debt securities. Investments by the Fund in lower-rated and non-rated securities presents a greater risk of loss to principal and interest than higher-rated securities. Investments in Asset-Backed and Mortgage-Backed securities include additional risks that investors should be aware of, including credit risk, prepayment risk, possible illiquidity and default, as well as increased susceptibility to adverse economic developments. Investments in foreign securities may involve greater volatility and political, economic and currency risk and differences in accounting methods. The Fund may invest in IPOs, which may fluctuate considerably due to the absence of a prior public market and may have a magnified impact on the Fund. Fund holdings and sector allocations are subject to change. Please refer to the Schedule of Investments included in this report for additional portfolio information.
Beta measures the volatility of a fund as compared to that of the market or a benchmark.
Each Morningstar category average represents a universe of funds with similar investment objectives. © Morningstar, Inc. All Rights Reserved. The information contained herein: 1) is proprietary to Morningstar; 2) may not be copied or distributed and 3) is not warranted to be accurate, complete or timely. Neither Morningstar nor its content providers are responsible for any damages or losses arising from any use of this information. Past performance does not guarantee future results.
Schedule of Investments
HENNESSY EQUITY AND INCOME FUND
As of April 30, 2014 (Unaudited)
(% of Net Assets)
| | TOP TEN HOLDINGS (EXCLUDING CASH/CASH EQUIVALENTS) | % NET ASSETS |
| | NewMarket Corp. | 3.43% |
| | Wells Fargo & Co. | 2.80% |
| | General Dynamics Corp. | 2.59% |
| | CarMax, Inc. | 2.43% |
| | Berkshire Hathaway, Inc., Class B | 2.43% |
| | Bristol-Myers Squibb Co. | 2.39% |
| | U.S. Treasury Note, 4.125%, 05/15/2015 | 2.38% |
| | BlackRock, Inc. | 2.29% |
| | Albemarle Corp. | 2.24% |
| | Corning, Inc. | 2.21% |
Note: For presentation purposes, the Fund has grouped some of the industry categories. For purposes of categorizing securities for compliance with Section 8(b)(1) of the Investment Company Act of 1940, the Fund uses more specific industry classifications.
HENNESSY FUNDS 1-800-966-4354
| | COMMON STOCKS – 62.60% | | Number | | | | | | % of | |
| | | | of Shares | | | Value | | | Net Assets | |
| | Consumer Discretionary – 6.16% | | | | | | | | | |
| | CarMax, Inc. (a) | | | 184,589 | | | $ | 8,081,306 | | | | 2.43 | % |
| | Carnival Corp. | | | 162,290 | | | | 6,379,620 | | | | 1.92 | % |
| | Lowes Companies, Inc. | | | 131,126 | | | | 6,019,995 | | | | 1.81 | % |
| | | | | | | | | 20,480,921 | | | | 6.16 | % |
| | | | | | | | | | | | | | |
| | Consumer Staples – 10.57% | | | | | | | | | | | | |
| | Altria Group, Inc. | | | 155,439 | | | | 6,234,658 | | | | 1.88 | % |
| | Brown-Forman Corp., Class B | | | 29,476 | | | | 2,644,587 | | | | 0.80 | % |
| | Energizer Holdings, Inc. | | | 61,062 | | | | 6,820,015 | | | | 2.05 | % |
| | Lorillard, Inc. | | | 67,926 | | | | 4,036,163 | | | | 1.22 | % |
| | Reynolds American, Inc. | | | 89,131 | | | | 5,029,662 | | | | 1.51 | % |
| | The Coca-Cola Co. | | | 124,081 | | | | 5,061,264 | | | | 1.52 | % |
| | Wal-Mart Stores, Inc. | | | 66,242 | | | | 5,280,150 | | | | 1.59 | % |
| | | | | | | | | 35,106,499 | | | | 10.57 | % |
| | | | | | | | | | | | | | |
| | Energy – 5.62% | | | | | | | | | | | | |
| | Apache Corp. | | | 58,780 | | | | 5,102,104 | | | | 1.53 | % |
| | Chevron Corp. | | | 58,411 | | | | 7,331,749 | | | | 2.21 | % |
| | ConocoPhillips | | | 83,878 | | | | 6,232,974 | | | | 1.88 | % |
| | | | | | | | | 18,666,827 | | | | 5.62 | % |
| | | | | | | | | | | | | | |
| | Financials – 10.14% | | | | | | | | | | | | |
| | Bank of America Corp. | | | 390,000 | | | | 5,904,600 | | | | 1.78 | % |
| | Berkshire Hathaway, Inc., Class B (a) | | | 62,689 | | | | 8,077,478 | | | | 2.43 | % |
| | BlackRock, Inc. | | | 25,318 | | | | 7,620,718 | | | | 2.29 | % |
| | Wells Fargo & Co. | | | 187,693 | | | | 9,317,080 | | | | 2.80 | % |
| | White Mountains Insurance Group Ltd. (c) | | | 4,651 | | | | 2,773,205 | | | | 0.84 | % |
| | | | | | | | | 33,693,081 | | | | 10.14 | % |
| | | | | | | | | | | | | | |
| | Health Care – 5.81% | | | | | | | | | | | | |
| | Bristol-Myers Squibb Co. | | | 158,768 | | | | 7,952,689 | | | | 2.39 | % |
| | Eli Lilly & Co. | | | 120,590 | | | | 7,126,869 | | | | 2.15 | % |
| | Pfizer, Inc. | | | 135,085 | | | | 4,225,459 | | | | 1.27 | % |
| | | | | | | | | 19,305,017 | | | | 5.81 | % |
| | | | | | | | | | | | | | |
| | Industrials – 4.00% | | | | | | | | | | | | |
| | FedEx Corp. | | | 34,348 | | | | 4,679,915 | | | | 1.41 | % |
| | General Dynamics Corp. | | | 78,810 | | | | 8,625,755 | | | | 2.59 | % |
| | | | | | | | | 13,305,670 | | | | 4.00 | % |
The accompanying notes are an integral part of these financial statements.
| | COMMON STOCKS | | Number | | | | | | % of | |
| | | | of Shares | | | Value | | | Net Assets | |
| | Information Technology – 11.11% | | | | | | | | | |
| | Cisco Systems, Inc. | | | 212,446 | | | $ | 4,909,627 | | | | 1.48 | % |
| | Corning, Inc. | | | 350,797 | | | | 7,335,165 | | | | 2.21 | % |
| | EMC Corp. | | | 229,463 | | | | 5,920,145 | | | | 1.78 | % |
| | Intel Corp. | | | 208,299 | | | | 5,559,500 | | | | 1.67 | % |
| | International Business Machines Corp. | | | 18,525 | | | | 3,639,607 | | | | 1.10 | % |
| | Microsoft Corp. | | | 90,513 | | | | 3,656,725 | | | | 1.10 | % |
| | Visa, Inc., Class A | | | 29,009 | | | | 5,877,514 | | | | 1.77 | % |
| | | | | | | | | 36,898,283 | | | | 11.11 | % |
| | | | | | | | | | | | | | |
| | Materials – 7.67% | | | | | | | | | | | | |
| | Albemarle Corp. | | | 111,275 | | | | 7,459,876 | | | | 2.24 | % |
| | NewMarket Corp. | | | 30,590 | | | | 11,389,269 | | | | 3.43 | % |
| | The Mosaic Co. | | | 132,560 | | | | 6,633,302 | | | | 2.00 | % |
| | | | | | | | | 25,482,447 | | | | 7.67 | % |
| | | | | | | | | | | | | | |
| | Telecommunication Services – 1.52% | | | | | | | | | | | | |
| | Verizon Communications, Inc. | | | 108,148 | | | | 5,053,756 | | | | 1.52 | % |
| | | | | | | | | | | | | | |
| | Total Common Stocks | | | | | | | | | | | | |
| | (Cost $159,113,303) | | | | | | | 207,992,501 | | | | 62.60 | % |
| | | | | | | | | | | | | | |
| | PREFERRED STOCKS – 0.03% | | | | | | | | | | | | |
| | | | | | | | | | | | | | |
| | Financial – 0.03% | | | | | | | | | | | | |
| | Fannie Mae Preferred (a) | | | 10,600 | | | | 109,180 | | | | 0.03 | % |
| | | | | | | | | | | | | | |
| | Total Preferred Stocks | | | | | | | | | | | | |
| | (Cost $265,000) | | | | | | | 109,180 | | | | 0.03 | % |
| | | | | | | | | | | | | | |
| | REITS – 0.10% | | | | | | | | | | | | |
| | Apollo Commercial Real Estate Finance, Inc. | | | 19,000 | | | | 323,190 | | | | 0.10 | % |
| | | | | | | | | | | | | | |
| | Total REITS | | | | | | | | | | | | |
| | (Cost $321,773) | | | | | | | 323,190 | | | | 0.10 | % |
| | | | | | | | | | | | | | |
| | CORPORATE BONDS – 23.26% | | Par | | | | | | | % of | |
| | | | Amount | | | Value | | | Net Assets | |
| | Consumer Discretionary – 1.32% | | | | | | | | | | | | |
| | Amazon.com, Inc. | | | | | | | | | | | | |
| | 0.650%, 11/27/2015 | | | 800,000 | | | | 802,072 | | | | 0.24 | % |
| | Comcast Corp. | | | | | | | | | | | | |
| | 4.950%, 06/15/2016 | | | 600,000 | | | | 652,238 | | | | 0.20 | % |
The accompanying notes are an integral part of these financial statements.
HENNESSY FUNDS 1-800-966-4354
| | CORPORATE BONDS | | Par | | | | | | % of | |
| | | | Amount | | | Value | | | Net Assets | |
| | Consumer Discretionary (Continued) | | | | | | | | | |
| | Ford Motor Credit Co. LLC | | | | | | | | | |
| | 3.000%, 06/12/2017 | | | 1,750,000 | | | $ | 1,826,645 | | | | 0.55 | % |
| | Starbucks Corp. | | | | | | | | | | | | |
| | 6.250%, 08/15/2017 | | | 300,000 | | | | 346,567 | | | | 0.10 | % |
| | The Home Depot, Inc. | | | | | | | | | | | | |
| | 5.400%, 03/01/2016 | | | 700,000 | | | | 761,021 | | | | 0.23 | % |
| | | | | | | | | 4,388,543 | | | | 1.32 | % |
| | | | | | | | | | | | | | |
| | Consumer Staples – 0.49% | | | | | | | | | | | | |
| | Anheuser-Busch InBev Worldwide, Inc. | | | | | | | | | | | | |
| | 7.750%, 01/15/2019 | | | 150,000 | | | | 186,358 | | | | 0.05 | % |
| | CVS Caremark Corp. | | | | | | | | | | | | |
| | 4.750%, 05/18/2020 | | | 400,000 | | | | 444,078 | | | | 0.13 | % |
| | 5.750%, 06/01/2017 | | | 600,000 | | | | 679,596 | | | | 0.21 | % |
| | Wal-Mart Stores, Inc. | | | | | | | | | | | | |
| | 5.000%, 10/25/2040 | | | 300,000 | | | | 334,234 | | | | 0.10 | % |
| | | | | | | | | 1,644,266 | | | | 0.49 | % |
| | | | | | | | | | | | | | |
| | Energy – 0.27% | | | | | | | | | | | | |
| | Encana Corp. – ADR (c) | | | | | | | | | | | | |
| | 3.900%, 11/15/2021 | | | 850,000 | | | | 883,012 | | | | 0.27 | % |
| | | | | | | | | | | | | | |
| | Financials – 13.59% | | | | | | | | | | | | |
| | Aflac, Inc. | | | | | | | | | | | | |
| | 8.500%, 05/15/2019 | | | 650,000 | | | | 841,536 | | | | 0.25 | % |
| | American Express Co. | | | | | | | | | | | | |
| | 6.150%, 08/28/2017 | | | 1,550,000 | | | | 1,784,374 | | | | 0.54 | % |
| | American Express Credit Corp. | | | | | | | | | | | | |
| | 2.750%, 09/15/2015 | | | 1,150,000 | | | | 1,184,840 | | | | 0.36 | % |
| | American International Group, Inc. | | | | | | | | | | | | |
| | 4.875%, 06/01/2022 | | | 600,000 | | | | 668,602 | | | | 0.20 | % |
| | 5.850%, 01/16/2018 | | | 1,075,000 | | | | 1,228,129 | | | | 0.37 | % |
| | Associated Banc-Corp | | | | | | | | | | | | |
| | 5.125%, 03/28/2016 | | | 700,000 | | | | 746,497 | | | | 0.23 | % |
| | Associates Corporation of North America | | | | | | | | | | | | |
| | 6.950%, 11/01/2018 | | | 300,000 | | | | 356,414 | | | | 0.11 | % |
| | Bank New York Mellon Corp. | | | | | | | | | | | | |
| | 1.969%, 06/20/2017 | | | 500,000 | | | | 511,159 | | | | 0.15 | % |
| | Bank of Montreal – ADR (c) | | | | | | | | | | | | |
| | 2.500%, 01/11/2017 | | | 400,000 | | | | 414,996 | | | | 0.13 | % |
| | Bank of Nova Scotia – ADR (c) | | | | | | | | | | | | |
| | 2.550%, 01/12/2017 | | | 1,000,000 | | | | 1,040,200 | | | | 0.31 | % |
The accompanying notes are an integral part of these financial statements.
| | CORPORATE BONDS | | Par | | | | | | % of | |
| | | | Amount | | | Value | | | Net Assets | |
| | Financials (Continued) | | | | | | | | | |
| | BlackRock, Inc. | | | | | | | | | |
| | 3.500%, 03/18/2024 | | | 1,000,000 | | | $ | 998,917 | | | | 0.30 | % |
| | Capital One Financial Corp. | | | | | | | | | | | | |
| | 4.750%, 07/15/2021 | | | 1,500,000 | | | | 1,658,168 | | | | 0.50 | % |
| | Citigroup, Inc. | | | | | | | | | | | | |
| | 6.125%, 11/21/2017 | | | 1,455,000 | | | | 1,664,278 | | | | 0.50 | % |
| | Credit Suisse USA, Inc. | | | | | | | | | | | | |
| | 5.125%, 08/15/2015 | | | 975,000 | | | | 1,031,669 | | | | 0.31 | % |
| | Discover Financial Services | | | | | | | | | | | | |
| | 5.200%, 04/27/2022 | | | 900,000 | | | | 980,015 | | | | 0.30 | % |
| | Fifth Third Bancorp | | | | | | | | | | | | |
| | 3.625%, 01/25/2016 | | | 700,000 | | | | 733,340 | | | | 0.22 | % |
| | First Niagara Financial Group, Inc. | | | | | | | | | | | | |
| | 6.750%, 03/19/2020 | | | 590,000 | | | | 678,270 | | | | 0.20 | % |
| | Franklin Resources, Inc. | | | | | | | | | | | | |
| | 1.375%, 09/15/2017 | | | 1,080,000 | | | | 1,075,286 | | | | 0.32 | % |
| | General Electric Capital Corp. | | | | | | | | | | | | |
| | 5.625%, 05/01/2018 | | | 1,050,000 | | | | 1,204,544 | | | | 0.36 | % |
| | General Electric Capital Corp. 1.625% 040218 | | | | | | | | | | | | |
| | 1.625%, 04/02/2018 | | | 500,000 | | | | 499,797 | | | | 0.15 | % |
| | General Electric Capital Corp. 5% 010816 | | | | | | | | | | | | |
| | 5.000%, 01/08/2016 | | | 500,000 | | | | 536,230 | | | | 0.16 | % |
| | Genworth Financial, Inc. | | | | | | | | | | | | |
| | 6.515%, 05/22/2018 | | | 500,000 | | | | 578,570 | | | | 0.17 | % |
| | Goldman Sachs Group, Inc. | | | | | | | | | | | | |
| | 5.350%, 01/15/2016 | | | 500,000 | | | | 536,681 | | | | 0.16 | % |
| | HSBC Finance Corp. | | | | | | | | | | | | |
| | 2.375%, 02/13/2015 | | | 1,000,000 | | | | 1,016,079 | | | | 0.30 | % |
| | 5.000%, 06/30/2015 | | | 1,200,000 | | | | 1,257,090 | | | | 0.38 | % |
| | J. P. Morgan Chase & Co. | | | | | | | | | | | | |
| | 6.000%, 01/15/2018 | | | 1,000,000 | | | | 1,147,288 | | | | 0.35 | % |
| | KeyCorp | | | | | | | | | | | | |
| | 3.750%, 08/13/2015 | | | 900,000 | | | | 934,896 | | | | 0.28 | % |
| | 5.100%, 03/24/2021 | | | 950,000 | | | | 1,075,609 | | | | 0.33 | % |
| | Lazard Group | | | | | | | | | | | | |
| | 6.850%, 06/15/2017 | | | 320,000 | | | | 363,685 | | | | 0.11 | % |
| | Lincoln National Corp. | | | | | | | | | | | | |
| | 6.250%, 02/15/2020 | | | 780,000 | | | | 917,786 | | | | 0.28 | % |
| | Manulife Financial Corp. – ADR (c) | | | | | | | | | | | | |
| | 3.400%, 09/17/2015 | | | 300,000 | | | | 311,233 | | | | 0.09 | % |
The accompanying notes are an integral part of these financial statements.
HENNESSY FUNDS 1-800-966-4354
| | CORPORATE BONDS | | Par | | | | | | % of | |
| | | | Amount | | | Value | | | Net Assets | |
| | Financials (Continued) | | | | | | | | | |
| | Merrill Lynch & Company, Inc. | | | | | | | | | |
| | 6.875%, 04/25/2018 | | | 955,000 | | | $ | 1,126,087 | | | | 0.34 | % |
| | Merrill Lynch & Company, Inc., Series MTNC | | | | | | | | | | | | |
| | 0.704%, 01/15/2015 | | | 250,000 | | | | 250,398 | | | | 0.08 | % |
| | MetLife, Inc., Series A | | | | | | | | | | | | |
| | 6.817%, 08/15/2018 | | | 100,000 | | | | 119,580 | | | | 0.04 | % |
| | Morgan Stanley | | | | | | | | | | | | |
| | 5.375%, 10/15/2015 | | | 500,000 | | | | 532,760 | | | | 0.16 | % |
| | 5.750%, 01/25/2021 | | | 850,000 | | | | 976,644 | | | | 0.29 | % |
| | 6.625%, 04/01/2018 | | | 250,000 | | | | 291,937 | | | | 0.09 | % |
| | Prudential Financial, Inc. | | | | | | | | | | | | |
| | 5.500%, 03/15/2016 | | | 310,000 | | | | 336,357 | | | | 0.10 | % |
| | Prudential Financial, Inc., Series MTNB | | | | | | | | | | | | |
| | 5.100%, 09/20/2014 | | | 285,000 | | | | 290,111 | | | | 0.09 | % |
| | Qwest Capital Funding, Inc. | | | | | | | | | | | | |
| | 6.500%, 11/15/2018 | | | 700,000 | | | | 784,000 | | | | 0.24 | % |
| | Raymond James Financial, Inc. | | | | | | | | | | | | |
| | 5.625%, 04/01/2024 | | | 700,000 | | | | 775,769 | | | | 0.23 | % |
| | Royal Bank of Canada – ADR (c) | | | | | | | | | | | | |
| | 2.200%, 07/27/2018 | | | 1,000,000 | | | | 1,014,744 | | | | 0.31 | % |
| | Simon Property Group, Inc. | | | | | | | | | | | | |
| | 6.100%, 05/01/2016 | | | 1,010,000 | | | | 1,102,946 | | | | 0.33 | % |
| | St. Paul Travelers, Inc. | | | | | | | | | | | | |
| | 5.500%, 12/01/2015 | | | 275,000 | | | | 296,039 | | | | 0.09 | % |
| | SunTrust Banks, Inc. | | | | | | | | | | | | |
| | 3.600%, 04/15/2016 | | | 250,000 | | | | 262,766 | | | | 0.08 | % |
| | 6.000%, 09/11/2017 | | | 250,000 | | | | 284,343 | | | | 0.08 | % |
| | The Bear Stearns Companies, Inc. | | | | | | | | | | | | |
| | 6.400%, 10/02/2017 | | | 1,350,000 | | | | 1,562,698 | | | | 0.47 | % |
| | The Charles Schwab Corp. | | | | | | | | | | | | |
| | 0.850%, 12/04/2015 | | | 1,000,000 | | | | 1,004,016 | | | | 0.30 | % |
| | The Goldman Sachs Group, Inc. | | | | | | | | | | | | |
| | 5.375%, 03/15/2020 | | | 1,100,000 | | | | 1,235,918 | | | | 0.37 | % |
| | The Hartford Financial Services Group, Inc. | | | | | | | | | | | | |
| | 5.375%, 03/15/2017 | | | 300,000 | | | | 332,000 | | | | 0.10 | % |
| | The Royal Bank of Scotland PLC – ADR (c) | | | | | | | | | | | | |
| | 4.375%, 03/16/2016 | | | 400,000 | | | | 425,760 | | | | 0.13 | % |
| | Toronto Dominion Bank – ADR (c) | | | | | | | | | | | | |
| | 2.375%, 10/19/2016 | | | 1,000,000 | | | | 1,037,643 | | | | 0.31 | % |
| | Wachovia Corp. | | | | | | | | | | | | |
| | 5.750%, 06/15/2017 | | | 850,000 | | | | 966,388 | | | | 0.29 | % |
The accompanying notes are an integral part of these financial statements.
| | CORPORATE BONDS | | Par | | | | | | % of | |
| | | | Amount | | | Value | | | Net Assets | |
| | Financials (Continued) | | | | | | | | | |
| | Wells Fargo & Co. | | | | | | | | | |
| | 5.625%, 12/11/2017 | | | 1,000,000 | | | $ | 1,142,563 | | | | 0.34 | % |
| | Westpac Banking Corp. – ADR (c) | | | | | | | | | | | | |
| | 4.200%, 02/27/2015 | | | 500,000 | | | | 515,456 | | | | 0.16 | % |
| | 4.875%, 11/19/2019 | | | 450,000 | | | | 504,817 | | | | 0.15 | % |
| | | | | | | | | 45,147,918 | | | | 13.59 | % |
| | | | | | | | | | | | | | |
| | Health Care – 1.65% | | | | | | | | | | | | |
| | Agilent Technologies, Inc. | | | | | | | | | | | | |
| | 5.000%, 07/15/2020 | | | 650,000 | | | | 713,112 | | | | 0.22 | % |
| | Amgen, Inc. | | | | | | | | | | | | |
| | 2.500%, 11/15/2016 | | | 1,000,000 | | | | 1,038,539 | | | | 0.31 | % |
| | Celgene Corp. | | | | | | | | | | | | |
| | 2.300%, 08/15/2018 | | | 1,000,000 | | | | 1,008,305 | | | | 0.30 | % |
| | GlaxoSmithKline Capital, Inc. – ADR (c) | | | | | | | | | | | | |
| | 1.500%, 05/08/2017 | | | 500,000 | | | | 505,478 | | | | 0.15 | % |
| | Merck and Co., Inc. | | | | | | | | | | | | |
| | 6.000%, 09/15/2017 | | | 850,000 | | | | 978,571 | | | | 0.29 | % |
| | UnitedHealth Group, Inc. | | | | | | | | | | | | |
| | 5.375%, 03/15/2016 | | | 250,000 | | | | 271,263 | | | | 0.08 | % |
| | Wellpoint, Inc. | | | | | | | | | | | | |
| | 2.375%, 02/15/2017 | | | 960,000 | | | | 982,007 | | | | 0.30 | % |
| | | | | | | | | 5,497,275 | | | | 1.65 | % |
| | | | | | | | | | | | | | |
| | Industrials – 0.31% | | | | | | | | | | | | |
| | John Deere Capital Corp. | | | | | | | | | | | | |
| | 1.850%, 09/15/2016 | | | 1,000,000 | | | | 1,026,565 | | | | 0.31 | % |
| | | | | | | | | | | | | | |
| | Information Technology – 1.98% | | | | | | | | | | | | |
| | Altera Corp. | | | | | | | | | | | | |
| | 1.750%, 05/15/2017 | | | 1,000,000 | | | | 1,009,491 | | | | 0.30 | % |
| | Applied Materials, Inc. | | | | | | | | | | | | |
| | 4.300%, 06/15/2021 | | | 300,000 | | | | 326,349 | | | | 0.10 | % |
| | Corning, Inc. | | | | | | | | | | | | |
| | 6.850%, 03/01/2029 | | | 275,000 | | | | 335,176 | | | | 0.10 | % |
| | eBay, Inc. | | | | | | | | | | | | |
| | 3.250%, 10/15/2020 | | | 1,000,000 | | | | 1,027,413 | | | | 0.31 | % |
| | EMC Corp. | | | | | | | | | | | | |
| | 1.875%, 06/01/2018 | | | 1,000,000 | | | | 1,005,451 | | | | 0.30 | % |
| | Hewlett Packard Co. | | | | | | | | | | | | |
| | 3.000%, 09/15/2016 | | | 1,000,000 | | | | 1,045,033 | | | | 0.32 | % |
| | Juniper Networks, Inc. | | | | | | | | | | | | |
| | 4.600%, 03/15/2021 | | | 1,000,000 | | | | 1,061,981 | | | | 0.32 | % |
The accompanying notes are an integral part of these financial statements.
HENNESSY FUNDS 1-800-966-4354
| | CORPORATE BONDS | | Par | | | | | | % of | |
| | | | Amount | | | Value | | | Net Assets | |
| | Information Technology (Continued) | | | | | | | | | |
| | KLA-Tencor Corp. | | | | | | | | | |
| | 6.900%, 05/01/2018 | | | 650,000 | | | $ | 763,183 | | | | 0.23 | % |
| | | | | | | | | 6,574,077 | | | | 1.98 | % |
| | | | | | | | | | | | | | |
| | Materials – 1.90% | | | | | | | | | | | | |
| | Alcoa, Inc. | | | | | | | | | | | | |
| | 6.150%, 08/15/2020 | | | 625,000 | | | | 690,303 | | | | 0.21 | % |
| | AngloGold Ashanti Holdings PLC – ADR (c) | | | | | | | | | | | | |
| | 5.125%, 08/01/2022 | | | 1,000,000 | | | | 970,653 | | | | 0.29 | % |
| | El du Pont de Nemours & Co. | | | | | | | | | | | | |
| | 4.750%, 03/15/2015 | | | 315,000 | | | | 326,645 | | | | 0.10 | % |
| | Goldcorp, Inc. – ADR (c) | | | | | | | | | | | | |
| | 2.125%, 03/15/2018 | | | 1,250,000 | | | | 1,245,815 | | | | 0.38 | % |
| | International Paper Co. | | | | | | | | | | | | |
| | 9.375%, 05/15/2019 | | | 250,000 | | | | 329,817 | | | | 0.10 | % |
| | Rio Tinto Finance USA PLC – ADR (c) | | | | | | | | | | | | |
| | 1.375%, 06/17/2016 | | | 1,000,000 | | | | 1,011,341 | | | | 0.30 | % |
| | 2.000%, 03/22/2017 | | | 640,000 | | | | 653,746 | | | | 0.20 | % |
| | The Dow Chemical Co. | | | | | | | | | | | | |
| | 4.250%, 11/15/2020 | | | 1,000,000 | | | | 1,072,332 | | | | 0.32 | % |
| | | | | | | | | 6,300,652 | | | | 1.90 | % |
| | | | | | | | | | | | | | |
| | Telecommunication Services – 1.66% | | | | | | | | | | | | |
| | AT&T, Inc. | | | | | | | | | | | | |
| | 2.950%, 05/15/2016 | | | 775,000 | | | | 808,236 | | | | 0.24 | % |
| | 3.000%, 02/15/2022 | | | 250,000 | | | | 246,528 | | | | 0.08 | % |
| | 5.350%, 09/01/2040 | | | 200,000 | | | | 209,397 | | | | 0.06 | % |
| | 5.800%, 02/15/2019 | | | 800,000 | | | | 929,290 | | | | 0.28 | % |
| | CenturyLink, Inc. | | | | | | | | | | | | |
| | 5.150%, 06/15/2017 | | | 400,000 | | | | 434,500 | | | | 0.13 | % |
| | Verizon Communications, Inc. | | | | | | | | | | | | |
| | 0.700%, 11/02/2015 | | | 800,000 | | | | 801,622 | | | | 0.24 | % |
| | 6.350%, 04/01/2019 | | | 600,000 | | | | 710,399 | | | | 0.22 | % |
| | 8.750%, 11/01/2018 | | | 292,000 | | | | 373,388 | | | | 0.11 | % |
| | Vodafone Group PLC – ADR (c) | | | | | | | | | | | | |
| | 1.500%, 02/19/2018 | | | 1,000,000 | | | | 992,842 | | | | 0.30 | % |
| | | | | | | | | 5,506,202 | | | | 1.66 | % |
| | | | | | | | | | | | | | |
| | Utilities – 0.09% | | | | | | | | | | | | |
| | Sempra Energy | | | | | | | | | | | | |
| | 6.500%, 06/01/2016 | | | 275,000 | | | | 305,079 | | | | 0.09 | % |
| | | | | | | | | | | | | | |
| | Total Corporate Bonds | | | | | | | | | | | | |
| | (Cost $75,061,690) | | | | | | | 77,273,589 | | | | 23.26 | % |
The accompanying notes are an integral part of these financial statements.
| | MORTGAGE BACKED SECURITIES – 3.70% | | Par | | | | | | % of | |
| | | | Amount | | | Value | | | Net Assets | |
| | Federal Home Loan Mortgage Corp. | | | | | | | | | |
| | 3.000%, 05/01/2042 | | | 4,336,790 | | | $ | 4,235,529 | | | | 1.27 | % |
| | 3.000%, 09/01/2042 | | | 2,791,760 | | | | 2,726,575 | | | | 0.82 | % |
| | 5.000%, 05/01/2020 | | | 125,417 | | | | 135,392 | | | | 0.04 | % |
| | 5.500%, 04/01/2037 | | | 232,320 | | | | 259,573 | | | | 0.08 | % |
| | Federal National Mortgage Association | | | | | | | | | | | | |
| | 2.400%, 11/07/2024 | | | 1,000,000 | | | | 936,022 | | | | 0.28 | % |
| | 3.500%, 01/01/2042 | | | 928,608 | | | | 945,085 | | | | 0.28 | % |
| | 4.000%, 12/01/2041 | | | 1,215,398 | | | | 1,276,403 | | | | 0.38 | % |
| | 4.000%, 10/01/2041 | | | 1,312,615 | | | | 1,378,377 | | | | 0.42 | % |
| | 4.500%, 08/01/2020 | | | 142,490 | | | | 151,746 | | | | 0.05 | % |
| | 6.000%, 10/01/2037 | | | 222,158 | | | | 247,767 | | | | 0.08 | % |
| | | | | | | | | | | | | | |
| | Total Mortgage Backed Securities | | | | | | | | | | | | |
| | (Cost $12,636,133) | | | | | | | 12,292,469 | | | | 3.70 | % |
| | | | | | | | | | | | | | |
| | U.S. GOVERNMENT AGENCY ISSUES – 1.46% | | | | | | | | | | | | |
| | Federal Home Loan Banks | | | | | | | | | | | | |
| | 1.000%, 04/23/2024 | | | 1,700,000 | | | | 1,702,157 | | | | 0.51 | % |
| | 1.000%, 06/27/2023 | | | 1,500,000 | | | | 1,500,349 | | | | 0.45 | % |
| | 1.000%, 11/20/2028 | | | 1,000,000 | | | | 999,134 | | | | 0.30 | % |
| | 5.750%, 06/15/2037 | | | 600,000 | | | | 665,119 | | | | 0.20 | % |
| | | | | | | | | | | | | | |
| | Total U.S. Government Agency Issues | | | | | | | | | | | | |
| | (Cost $4,895,494) | | | | | | | 4,866,759 | | | | 1.46 | % |
| | | | | | | | | | | | | | |
| | U.S. TREASURY OBLIGATIONS – 4.50% | | | | | | | | | | | | |
| | | | | | | | | | | | | | |
| | U.S. Treasury Bonds – 0.48% | | | | | | | | | | | | |
| | U.S. Treasury Bonds | | | | | | | | | | | | |
| | 3.625%, 02/15/2044 | | | 1,500,000 | | | | 1,546,641 | | | | 0.47 | % |
| | U.S. Treasury Inflation Index Bond | | | | | | | | | | | | |
| | 0.125%, 07/15/2022 | | | 25,524 | | | | 25,255 | | | | 0.01 | % |
| | | | | | | | | | | | | | |
| | Total U.S. Treasury Bonds | | | | | | | | | | | | |
| | (Cost $1,547,172) | | | | | | | 1,571,896 | | | | 0.48 | % |
| | | | | | | | | | | | | | |
| | U.S. Treasury Notes – 4.02% | | | | | | | | | | | | |
| | 2.375%, 03/31/2016 | | | 2,005,000 | | | | 2,081,910 | | | | 0.63 | % |
| | 3.250%, 03/31/2017 | | | 1,000,000 | | | | 1,069,883 | | | | 0.32 | % |
| | 4.125%, 05/15/2015 | | | 7,600,000 | | | | 7,916,616 | | | | 2.38 | % |
| | 2.750%, 02/15/2024 | | | 1,000,000 | | | | 1,008,828 | | | | 0.30 | % |
| | 2.500%, 08/15/2023 | | | 1,300,000 | | | | 1,289,996 | | | | 0.39 | % |
| | | | | | | | | | | | | | |
| | Total U.S. Treasury Notes | | | | | | | | | | | | |
| | (Cost $13,344,716) | | | | | | | 13,367,233 | | | | 4.02 | % |
| | | | | | | | | | | | | | |
| | Total U.S. Treasury Obligations | | | | | | | | | | | | |
| | (Cost $14,891,888) | | | | | | | 14,939,129 | | | | 4.50 | % |
The accompanying notes are an integral part of these financial statements.
HENNESSY FUNDS 1-800-966-4354
| | INVESTMENT COMPANIES (EXCLUDING | | Number | | | | | | % of | |
| | MONEY MARKET FUNDS) – 2.39% | | of Shares | | | Value | | | Net Assets | |
| | iShares iBoxx $High Yield Corporation Bond Fund | | | 12,000 | | | $ | 1,132,080 | | | | 0.34 | % |
| | PowerShares Senior Loan Portfolio | | | 120,000 | | | | 2,968,800 | | | | 0.90 | % |
| | SPDR Barclays Capital High Yield Bond | | | 14,500 | | | | 599,575 | | | | 0.18 | % |
| | SPDR Barclays Short Term High Yield | | | 62,500 | | | | 1,935,000 | | | | 0.58 | % |
| | Wisdomtree Emerging Markets Local Debt Fund | | | 11,000 | | | | 506,110 | | | | 0.15 | % |
| | Apollo Investment Corporation | | | 40,000 | | | | 319,600 | | | | 0.09 | % |
| | Calamos Convertible Opportunity And Income Fund | | | 16,000 | | | | 220,000 | | | | 0.07 | % |
| | NGP Capital Resources Co. | | | 8,000 | | | | 54,480 | | | | 0.02 | % |
| | PennantPark Investment Corp. | | | 19,000 | | | | 203,300 | | | | 0.06 | % |
| | | | | | | | | | | | | | |
| | Total Investment Companies (Excluding | | | | | | | | | | | | |
| | Money Market Funds) (Cost $7,965,340) | | | | | | | 7,938,945 | | | | 2.39 | % |
| | | | | | | | | | | | | | |
| | SHORT-TERM INVESTMENTS – 1.02% | | | | | | | | | | | | |
| | | | | | | | | | | | | | |
| | Money Market Funds – 1.02% | | | | | | | | | | | | |
| | Fidelity Government Portfolio – | | | �� | | | | | | | | | |
| | Institutional Class, 0.01% (b) | | | 3,400,459 | | | | 3,400,459 | | | | 1.02 | % |
| | | | | | | | | | | | | | |
| | Total Money Market Funds | | | | | | | | | | | | |
| | (Cost $3,400,459) | | | | | | | 3,400,459 | | | | 1.02 | % |
| | | | | | | | | | | | | | |
| | Total Short-Term Investments | | | | | | | | | | | | |
| | (Cost $3,400,459) | | | | | | | 3,400,459 | | | | 1.02 | % |
| | | | | | | | | | | | | | |
| | Total Investments | | | | | | | | | | | | |
| | (Cost $278,551,080) – 99.06% | | | | | | | 329,136,221 | | | | 99.06 | % |
| | Other Assets in Excess | | | | | | | | | | | | |
| | of Liabilities – 0.94% | | | | | | | 3,123,958 | | | | 0.94 | % |
| | TOTAL NET ASSETS – 100.00% | | | | | | $ | 332,260,179 | | | | 100.00 | % |
Percentages are stated as a percent of net assets.
ADR – American Depositary Receipt
| (a) | Non-income producing security. |
| (b) | The rate listed is the fund’s 7-day yield as of April 30, 2014. |
| (c) | U.S. traded security of a foreign corporation. |
The accompanying notes are an integral part of these financial statements.
Summary of Fair Value Exposure at April 30, 2014
The following is a summary of the inputs used to value the Fund’s net assets as of April 30, 2014 (See Note 3 in the accompanying notes to the financial statements):
| Common Stock | | Level 1 | | | Level 2 | | | Level 3 | | | Total | |
| Consumer Discretionary | | $ | 20,480,921 | | | $ | — | | | $ | — | | | $ | 20,480,921 | |
| Consumer Staples | | | 35,106,499 | | | | — | | | | — | | | | 35,106,499 | |
| Energy | | | 18,666,827 | | | | — | | | | — | | | | 18,666,827 | |
| Financials | | | 33,693,081 | | | | — | | | | — | | | | 33,693,081 | |
| Health Care | | | 19,305,017 | | | | — | | | | — | | | | 19,305,017 | |
| Industrials | | | 13,305,670 | | | | — | | | | — | | | | 13,305,670 | |
| Information Technology | | | 36,898,283 | | | | — | | | | — | | | | 36,898,283 | |
| Materials | | | 25,482,447 | | | | — | | | | — | | | | 25,482,447 | |
| Telecommunication Services | | | 5,053,756 | | | | — | | | | — | | | | 5,053,756 | |
| Total Common Stock | | $ | 207,992,501 | | | $ | — | | | $ | — | | | $ | 207,992,501 | |
| Preferred Stock | | $ | 109,180 | | | $ | — | | | $ | — | | | $ | 109,180 | |
| REITS | | | | | | | | | | | | | | | | |
| Financials | | $ | 323,190 | | | $ | — | | | $ | — | | | $ | 323,190 | |
| Corporate Bonds | | | | | | | | | | | | | | | | |
| Consumer Discretionary | | $ | — | | | $ | 4,388,543 | | | $ | — | | | $ | 4,388,543 | |
| Consumer Staples | | | — | | | | 1,644,266 | | | | — | | | | 1,644,266 | |
| Energy | | | — | | | | 883,012 | | | | — | | | | 883,012 | |
| Financials | | | — | | | | 45,147,918 | | | | — | | | | 45,147,918 | |
| Health Care | | | — | | | | 5,497,275 | | | | — | | | | 5,497,275 | |
| Industrials | | | — | | | | 1,026,565 | | | | — | | | | 1,026,565 | |
| Information Technology | | | — | | | | 6,574,077 | | | | — | | | | 6,574,077 | |
| Materials | | | — | | | | 6,300,652 | | | | — | | | | 6,300,652 | |
| Telecommunication Services | | | — | | | | 5,506,202 | | | | — | | | | 5,506,202 | |
| Utilities | | | — | | | | 305,079 | | | | — | | | | 305,079 | |
| Total Corporate Bonds | | $ | — | | | $ | 77,273,589 | | | $ | — | | | $ | 77,273,589 | |
| Mortgage Backed Securities | | $ | — | | | $ | 12,292,469 | | | $ | — | | | $ | 12,292,469 | |
| U.S. Government Agency Issues | | $ | — | | | $ | 4,866,759 | | | $ | — | | | $ | 4,866,759 | |
| U.S. Treasury Obligations | | | | | | | | | | | | | | | | |
| U.S. Treasury Bonds | | $ | — | | | $ | 1,571,896 | | | $ | — | | | $ | 1,571,896 | |
| U.S. Treasury Notes | | | — | | | | 13,367,233 | | | | — | | | | 13,367,233 | |
| Total U.S. Treasury Obligations | | $ | — | | | $ | 14,939,129 | | | $ | — | | | $ | 14,939,129 | |
| Investment Companies (Excluding | | | | | | | | | | | | | | | | |
| Money Market Funds) | | $ | 7,938,945 | | | $ | — | | | $ | — | | | $ | 7,938,945 | |
| Short-Term Investments | | | | | | | | | | | | | | | | |
| Money Market Funds | | $ | 3,400,459 | | | $ | — | | | $ | — | | | $ | 3,400,459 | |
| Total Short-Term Investments | | $ | 3,400,459 | | | $ | — | | | $ | — | | | $ | 3,400,459 | |
| Total Investments | | $ | 219,764,275 | | | $ | 109,371,946 | | | $ | — | �� | | $ | 329,136,221 | |
Transfers between levels are recognized at the end of the reporting period. During the six-month period ended April 30, 2014, the Fund recognized no transfers between levels.
The accompanying notes are an integral part of these financial statements.
HENNESSY FUNDS 1-800-966-4354
Financial Statements
Statement of Assets and Liabilities as of April 30, 2014 (Unaudited) |
| ASSETS: | | | |
| Investments in securities, at value (cost $278,551,080) | | $ | 329,136,221 | |
| Dividends and interest receivable | | | 1,259,047 | |
| Receivable for fund shares sold | | | 1,659,960 | |
| Receivable for securities sold | | | 2,165,442 | |
| Prepaid expenses and other assets | | | 31,702 | |
| Total Assets | | | 334,252,372 | |
| | | | | |
| LIABILITIES: | | | | |
| Payable for securities purchased | | | 1,010,151 | |
| Payable for fund shares redeemed | | | 579,516 | |
| Payable to advisor | | | 212,589 | |
| Payable to administrator | | | 63,748 | |
| Payable to auditor | | | 9,477 | |
| Accrued distribution fees | | | 62,429 | |
| Accrued trustees fees | | | 5,067 | |
| Accrued expenses and other payables | | | 49,216 | |
| Total Liabilities | | | 1,992,193 | |
| NET ASSETS | | $ | 332,260,179 | |
| | | | | |
| NET ASSETS CONSIST OF: | | | | |
| Capital stock | | $ | 274,663,181 | |
| Accumulated net investment income | | | 132,591 | |
| Accumulated net realized gain on investments | | | 6,879,266 | |
| Unrealized net appreciation on investments | | | 50,585,141 | |
| Total Net Assets | | $ | 332,260,179 | |
| | | | | |
| NET ASSETS | | | | |
| Investor Class: | | | | |
| Shares authorized (no par value) | | Unlimited | |
| Net assets applicable to outstanding Investor Class shares | | | 246,788,191 | |
| Shares issued and outstanding | | | 15,543,779 | |
| Net asset value, offering price and redemption price per share | | $ | 15.88 | |
| | | | | |
| Institutional Class: | | | | |
| Shares authorized (no par value) | | Unlimited | |
| Net assets applicable to outstanding Institutional Class shares | | | 85,471,988 | |
| Shares issued and outstanding | | | 5,682,915 | |
| Net asset value, offering price and redemption price per share | | $ | 15.04 | |
The accompanying notes are an integral part of these financial statements.
Financial Statements
Statement of Operations Six Months Ended April 30, 2014 (Unaudited) |
| INVESTMENT INCOME: | | | |
| Dividend income | | $ | 2,424,526 | |
| Interest income | | | 1,317,951 | |
| Total investment income | | | 3,742,477 | |
| | | | | |
| EXPENSES: | | | | |
| Investment advisory fees | | | 1,277,374 | |
| Distribution fees – Investor Class (See Note 5) | | | 290,425 | |
| Administration, fund accounting, custody and transfer agent fees | | | 191,606 | |
| Sub-transfer agent expenses – Investor Class (See Note 5) | | | 131,298 | |
| Sub-transfer agent expenses – Institutional Class (See Note 5) | | | 37,152 | |
| Reports to shareholders | | | 23,407 | |
| Federal and state registration fees | | | 22,868 | |
| Compliance expense | | | 10,655 | |
| Audit fees | | | 9,472 | |
| Trustees’ fees and expenses | | | 8,679 | |
| Legal fees | | | 2,480 | |
| Other expenses | | | 13,298 | |
| Total expenses before reimbursement from advisor | | | 2,018,714 | |
| Expense reimbursement by advisor – Investor Class | | | (11,567 | ) |
| Net expenses | | | 2,007,147 | |
| NET INVESTMENT INCOME | | $ | 1,735,330 | |
| | | | | |
| REALIZED AND UNREALIZED GAINS: | | | | |
| Net realized gain on investments | | $ | 6,955,810 | |
| Change in unrealized appreciation on investments | | | 5,463,868 | |
| Net gain on investments | | | 12,419,678 | |
| NET INCREASE IN NET ASSETS RESULTING FROM OPERATIONS | | $ | 14,155,008 | |
The accompanying notes are an integral part of these financial statements.
HENNESSY FUNDS 1-800-966-4354
(This Page Intentionally Left Blank.)
Financial Statements
| Statements of Changes in Net Assets |
| | | Six Months Ended | | | | |
| | | April 30, 2014 | | | Year Ended | |
| | | (Unaudited) | | | October 31, 2013 | |
| OPERATIONS: | | | | | | |
| Net investment income | | $ | 1,735,330 | | | $ | 4,864,880 | |
| Net realized gain on securities | | | 6,955,810 | | | | 13,272,491 | |
| Change in unrealized appreciation on securities | | | 5,463,868 | | | | 21,344,922 | |
| Net increase in net assets resulting from operations | | | 14,155,008 | | | | 39,482,293 | |
| | | | | | | | | |
| DISTRIBUTIONS TO SHAREHOLDERS FROM: | | | | | | | | |
| Net investment income – Investor Class | | | (1,231,250 | ) | | | (3,063,016 | ) |
| Net investment income – Institutional Class | | | (618,636 | ) | | | (1,937,482 | ) |
| Net realized gains – Investor Class | | | (10,301,249 | ) | | | — | |
| Net realized gains – Institutional Class | | | — | | | | — | |
| Total distributions | | | (12,151,135 | ) | | | (5,000,498 | ) |
| | | | | | | | | |
| CAPITAL SHARE TRANSACTIONS: | | | | | | | | |
| Proceeds from shares subscribed – Investor Class | | | 41,952,308 | | | | 99,856,871 | |
| Proceeds from shares subscribed – Institutional Class | | | 14,819,182 | | | | 29,868,131 | |
| Dividends reinvested – Investor Class | | | 8,419,389 | | | | 2,933,613 | |
| Dividends reinvested – Institutional Class | | | 2,521,205 | | | | 1,518,097 | |
| Cost of shares redeemed – Investor Class | | | (38,441,052 | )(1) | | | (90,377,638 | )(2) |
| Cost of shares redeemed – Institutional Class | | | (17,380,980 | ) | | | (65,319,830 | )(2) |
| Net increase (decrease) in net assets derived | | | | | | | | |
| from capital share transactions | | | 11,890,052 | | | | (21,520,756 | ) |
| TOTAL INCREASE IN NET ASSETS | | | 13,893,925 | | | | 12,961,039 | |
| | | | | | | | | |
| NET ASSETS: | | | | | | | | |
| Beginning of period | | | 318,366,254 | | | | 305,405,215 | |
| End of period | | $ | 332,260,179 | | | $ | 318,366,254 | |
| Undistributed net investment income, end of period | | $ | 132,591 | | | $ | 247,147 | |
| | | | | | | | | |
| CHANGES IN SHARES OUTSTANDING: | | | | | | | | |
| Shares sold – Investor Class | | | 2,676,370 | | | | 6,666,051 | |
| Shares sold – Institutional Class | | | 998,914 | | | | 2,087,219 | |
| Shares issued to holders as reinvestment | | | | | | | | |
| of dividends – Investor Class | | | 544,993 | | | | 200,342 | |
| Shares issued to holders as reinvestment | | | | | | | | |
| of dividends – Institutional Class | | | 172,060 | | | | 110,506 | |
| Shares redeemed – Investor Class | | | (2,471,443 | ) | | | (6,175,811 | ) |
| Shares redeemed – Institutional Class | | | (1,175,130 | ) | | | (4,674,153 | ) |
| Net increase (decrease) in shares outstanding | | | 745,764 | | | | (1,785,846 | ) |
| (1) | Net of redemption fees of $105 related to redemption fees imposed by the FBR Balanced Fund during a prior year but not received until the six-month period ended April 30, 2014. |
| (2) | Net of redemption fees of $1,077 and $482 for the Investor Class and Institutional Class shares, respectively, related to redemption fees imposed by the FBR Balanced Fund during a prior year but not received until fiscal year 2013. |
The accompanying notes are an integral part of these financial statements.
HENNESSY FUNDS 1-800-966-4354
Financial Highlights
| Hennessy Equity and Income Fund |
For an Investor Class share outstanding throughout each period
| | | Six Months Ended | |
| | | April 30, 2014 | |
| | | (Unaudited) | |
| PER SHARE DATA: | | | |
| Net asset value, beginning of period | | $ | 15.77 | |
| | | | | |
| Income from investment operations: | | | | |
| Net investment income | | | 0.08 | |
| Net realized and unrealized gains (losses) on securities | | | 0.61 | |
| Total from investment operations | | | 0.69 | |
| | | | | |
| Less distributions: | | | | |
| Dividends from net investment income | | | (0.08 | ) |
| Dividends from realized capital gains | | | (0.50 | ) |
| Return of capital | | | — | |
| Total distributions | | | (0.58 | ) |
| Paid-in capital from redemption fees | | | — | |
| Net asset value, end of period | | $ | 15.88 | |
| | | | | |
| TOTAL RETURN | | | 4.49 | %(4) |
| | | | | |
| SUPPLEMENTAL DATA AND RATIOS: | | | | |
| Net assets, end of period (millions) | | $ | 246.79 | |
| Ratio of expenses to average net assets: | | | | |
| Before expense reimbursement | | | 1.34 | %(5) |
| After expense reimbursement | | | 1.33 | %(5) |
| Ratio of net investment income to average net assets: | | | | |
| Before expense reimbursement | | | 1.00 | %(5) |
| After expense reimbursement | | | 1.01 | %(5) |
Portfolio turnover rate(6) | | | 15 | %(4) |
| (1) | For the seven-month period ended October 31, 2010. Effective October 31, 2010, the Fund changed its fiscal year end from March 31 to October 31. |
| (2) | Calculated based on average shares outstanding method. |
| (3) | Amount is less than $0.01. |
| (4) | Not annualized. |
| (5) | Annualized. |
| (6) | Portfolio turnover is calculated on the basis of the Fund as a whole. |
The accompanying notes are an integral part of these financial statements.
| | | | | | | | | | For the Period | | | | | | | |
| | | | | | | | | | April 1, 2010 | | | | | | | |
| For the Year Ended October 31, | | | to October 31, | | | Year Ended March 31, | |
| 2013 | | | 2012 | | | 2011 | | | 2010(1) | | | 2010 | | | 2009 | |
| | | | | | | | | | | | | | | | | |
| $ | 13.96 | | | $ | 12.99 | | | $ | 11.93 | | | $ | 11.52 | | | $ | 8.92 | | | $ | 12.27 | |
| | | | | | | | | | | | | | | | | | | | | | | |
| | | | | | | | | | | | | | | | | | | | | | | |
| | 0.23 | | | | 0.18 | | | | 0.29 | (2) | | | 0.17 | (2) | | | 0.29 | (2) | | | 0.32 | (2) |
| | 1.81 | | | | 0.99 | | | | 1.04 | | | | 0.40 | | | | 2.61 | | | | (3.23 | ) |
| | 2.04 | | | | 1.17 | | | | 1.33 | | | | 0.57 | | | | 2.90 | | | | (2.91 | ) |
| | | | | | | | | | | | | | | | | | | | | | | |
| | | | | | | | | | | | | | | | | | | | | | | |
| | (0.23 | ) | | | (0.20 | ) | | | (0.27 | ) | | | (0.16 | ) | | | (0.30 | ) | | | (0.25 | ) |
| | — | | | | — | | | | — | | | | — | | | | — | | | | (0.17 | ) |
| | — | | | | — | | | | — | | | | — | | | | — | | | | (0.03 | ) |
| | (0.23 | ) | | | (0.20 | ) | | | (0.27 | ) | | | (0.16 | ) | | | (0.30 | ) | | | (0.45 | ) |
| | 0.00 | (3) | | | 0.00 | (3) | | | 0.00 | (3) | | | 0.00 | (3) | | | 0.00 | (3) | | | 0.01 | |
| $ | 15.77 | | | $ | 13.96 | | | $ | 12.99 | | | $ | 11.93 | | | $ | 11.52 | | | $ | 8.92 | |
| | | | | | | | | | | | | | | | | | | | | | | |
| | 14.72 | % | | | 9.01 | % | | | 11.30 | % | | | 5.04 | %(4) | | | 32.76 | % | | | (24.28 | )% |
| | | | | | | | | | | | | | | | | | | | | | | |
| | | | | | | | | | | | | | | | | | | | | | | |
| $ | 233.25 | | | $ | 196.92 | | | $ | 56.75 | | | $ | 41.50 | | | $ | 46.81 | | | $ | 18.86 | |
| | | | | | | | | | | | | | | | | | | | | | | |
| | 1.36 | % | | | 1.33 | % | | | 1.54 | % | | | 1.60 | %(5) | | | 1.69 | % | | | 1.84 | % |
| | 1.33 | % | | | 1.24 | % | | | 1.24 | % | | | 1.24 | %(5) | | | 1.25 | % | | | 1.32 | % |
| | | | | | | | | | | | | | | | | | | | | | | |
| | 1.51 | % | | | 1.37 | % | | | 2.03 | % | | | 2.21 | %(5) | | | 2.26 | % | | | 2.50 | % |
| | 1.54 | % | | | 1.46 | % | | | 2.33 | % | | | 2.56 | %(5) | | | 2.70 | % | | | 3.03 | % |
| | 52 | % | | | 34 | % | | | 35 | % | | | 27 | %(4) | | | 26 | % | | | 32 | % |
The accompanying notes are an integral part of these financial statements.
HENNESSY FUNDS 1-800-966-4354
Financial Highlights
| Hennessy Equity and Income Fund |
For an Institutional Class share outstanding throughout each period
| | | Six Months Ended | |
| | | April 30, 2014 | |
| | | (Unaudited) | |
| PER SHARE DATA: | | | |
| Net asset value, beginning of period | | $ | 14.97 | |
| | | | | |
| Income from investment operations: | | | | |
| Net investment income | | | 0.09 | |
| Net realized and unrealized gains (losses) on investments | | | 0.58 | |
| Total from investment operations | | | 0.67 | |
| | | | | |
| Less distributions: | | | | |
| Dividends from net investment income | | | (0.10 | ) |
| Dividends from net realized gains | | | (0.50 | ) |
| Return of Capital | | | — | |
| Total distributions | | | (0.60 | ) |
| Paid-in capital from redemption fees | | | — | |
| Net asset value, end of period | | $ | 15.04 | |
| | | | | |
| TOTAL RETURN | | | 4.61 | %(4) |
| | | | | |
| SUPPLEMENTAL DATA AND RATIOS: | | | | |
| Net assets, end of period (millions) | | $ | 85.47 | |
| Ratio of expenses to average net assets: | | | | |
| Before expense reimbursement | | | 1.06 | %(5) |
| After expense reimbursement | | | 1.06 | %(5) |
| Ratio of net investment income to average net assets: | | | | |
| Before expense reimbursement | | | 1.29 | %(5) |
| After expense reimbursement | | | 1.29 | %(5) |
Portfolio turnover rate(6) | | | 15 | %(4) |
| (1) | For the seven-month period ended October 31, 2010. Effective October 31, 2010, the Fund changed its fiscal year end from March 31 to October 31. |
| (2) | Calculated based on average shares outstanding method. |
| (3) | Amount is less than $0.01. |
| (4) | Not annualized. |
| (5) | Annualized. |
| (6) | Portfolio turnover is calculated on the basis of the Fund as a whole. |
The accompanying notes are an integral part of these financial statements.
| | | | | | | | | | For the Period | | | | | | | |
| | | | | | | | | | April 1, 2010 | | | | | | | |
| For the Year Ended October 31, | | | to October 31, | | | Year Ended March 31, | |
| 2013 | | | 2012 | | | 2011 | | | 2010(1) | | | 2010 | | | 2009 | |
| | | | | | | | | | | | | | | | | |
| $ | 13.29 | | | $ | 12.38 | | | $ | 11.38 | | | $ | 10.99 | | | $ | 8.52 | | | $ | 11.75 | |
| | | | | | | | | | | | | | | | | | | | | | | |
| | | | | | | | | | | | | | | | | | | | | | | |
| | 0.25 | | | | 0.22 | | | | 0.32 | (2) | | | 0.18 | (2) | | | 0.30 | (2) | | | 0.33 | (2) |
| | 1.72 | | | | 0.92 | | | | 0.99 | | | | 0.38 | | | | 2.50 | | | | (3.10 | ) |
| | 1.97 | | | | 1.14 | | | | 1.31 | | | | 0.56 | | | | 2.80 | | | | (2.77 | ) |
| | | | | | | | | | | | | | | | | | | | | | | |
| | | | | | | | | | | | | | | | | | | | | | | |
| | (0.29 | ) | | | (0.23 | ) | | | (0.31 | ) | | | (0.17 | ) | | | (0.33 | ) | | | (0.26 | ) |
| | — | | | | — | | | | — | | | | — | | | | — | | | | (0.17 | ) |
| | — | | | | — | | | | — | | | | — | | | | — | | | | (0.04 | ) |
| | (0.29 | ) | | | (0.23 | ) | | | (0.31 | ) | | | (0.17 | ) | | | (0.33 | ) | | | (0.47 | ) |
| | 0.00 | (3) | | | 0.00 | (3) | | | 0.00 | (3) | | | 0.00 | (3) | | | 0.00 | (3) | | | 0.01 | |
| $ | 14.97 | | | $ | 13.29 | | | $ | 12.38 | | | $ | 11.38 | | | $ | 10.99 | | | $ | 8.52 | |
| | | | | | | | | | | | | | | | | | | | | | | |
| | 14.99 | % | | | 9.23 | % | | | 11.62 | % | | | 5.19 | %(4) | | | 33.10 | % | | | (24.13 | )% |
| | | | | | | | | | | | | | | | | | | | | | | |
| | | | | | | | | | | | | | | | | | | | | | | |
| $ | 85.12 | | | $ | 108.49 | | | $ | 55.28 | | | $ | 42.17 | | | $ | 39.40 | | | $ | 31.13 | |
| | | | | | | | | | | | | | | | | | | | | | | |
| | 1.06 | % | | | 1.06 | % | | | 1.12 | % | | | 1.20 | %(5) | | | 1.43 | % | | | 1.58 | % |
| | 1.06 | % | | | 0.99 | % | | | 0.99 | % | | | 0.99 | %(5) | | | 0.99 | % | | | 1.07 | % |
| | | | | | | | | | | | | | | | | | | | | | | |
| | 1.95 | % | | | 1.68 | % | | | 2.56 | % | | | 2.60 | %(5) | | | 2.57 | % | | | 2.73 | % |
| | 1.95 | % | | | 1.75 | % | | | 2.69 | % | | | 2.82 | %(5) | | | 3.01 | % | | | 3.24 | % |
| | 52 | % | | | 34 | % | | | 35 | % | | | 27 | %(4) | | | 26 | % | | | 32 | % |
The accompanying notes are an integral part of these financial statements.
HENNESSY FUNDS 1-800-966-4354
April 30, 2014 (Unaudited)
1). ORGANIZATION
The Hennessy Equity and Income Fund (the “Fund”) is a series of Hennessy Funds Trust (the “Trust”), which was organized as a Delaware statutory trust on September 17, 1992. The Fund is an open-end management investment company registered under the Investment Company Act of 1940, as amended. The Fund is a successor to the FBR Balanced Fund (the “Predecessor FBR Fund”), a series of The FBR Funds, a Delaware statutory trust, pursuant to a reorganization that took place after the close of business on October 26, 2012. Prior to October 26, 2012, the Fund had no investment operations. As a result of the reorganization, holders of the Investor Class shares of the Predecessor FBR Fund received Investor Class shares of the Fund (the Investor Class shares of the Fund are the successor to the accounting and performance information of the Predecessor FBR Fund), and holders of the Institutional Class shares of the Predecessor FBR Fund received Institutional Class shares of the Fund (the Institutional Class shares of the Fund are the successor to the accounting and performance information of the Predecessor FBR Fund). The investment objective of the Fund is long-term capital growth and current income. The Fund is a diversified fund.
The Fund offers Investor Class and Institutional Class shares. Each class of shares differs principally in its respective administration, 12b-1 distribution and service fees, shareholder servicing, and transfer agent expenses and sales charges, if any. Each class has identical rights to earnings, assets, and voting privileges, except for class-specific expenses and exclusive rights to vote on matters affecting only individual classes.
2). SIGNIFICANT ACCOUNTING POLICIES
The following is a summary of significant accounting policies consistently followed by the Fund in the preparation of the financial statements. These policies are in conformity with U.S. generally accepted accounting principles (“GAAP”).
| a). | Investment Valuation – All investments in securities are recorded at their estimated fair value, as described in Note 3. |
| b). | Federal Income Taxes – Provision for Federal income taxes or excise taxes has not been made since the Fund has elected to be taxed as a “regulated investment company” and intends to distribute substantially all of its taxable income to its shareholders and otherwise comply with the provisions of the Internal Revenue Code of 1986, as amended, applicable to regulated investment companies. Net investment income or loss and realized gains and losses for federal income tax purposes may differ from that reported on the financial statements because of temporary book and tax basis differences. Temporary differences are primarily the result of the treatment of wash sales for tax reporting purposes. Distributions from net realized gains for book purposes may include short-term capital gains, which are included as ordinary income to shareholders for tax purposes. |
| c). | Income and Expenses – Dividend income is recognized on the ex-dividend date or as soon as information is available to the Fund. Interest income, which includes the amortization of premium and accretion of discount, is recognized on an accrual basis. The Fund is charged for those expenses that are directly attributable to the portfolio, such as advisory, administration, and certain shareholder service fees. Income, |
| | expenses (other than expenses attributable to a specific class), and realized and unrealized gains or losses on investments are allocated to each class of shares based on its respective net assets. |
| d). | Distributions to Shareholders – Dividends from net investment income for the Fund, if any, are declared and paid out on a calendar quarter basis. Distributions of net realized capital gains, if any, are declared and paid annually, usually in November or December. |
| e). | Security Transactions – Investment and shareholder transactions are recorded on the trade date. The Fund determines the gain or loss realized from the investment transactions by comparing the original cost of the security lot sold with the net sale proceeds. Discounts and premiums on securities purchased are accreted/amortized over the life of the respective security. |
| f). | Use of Estimates – The preparation of financial statements in conformity with GAAP requires management to make estimates and assumptions that affect the reported amounts of assets and liabilities and disclosure of contingent assets and liabilities at the date of the financial statements and the reported change in net assets during the reporting period. Actual results could differ from those estimates. |
| g). | Share Valuation – The net asset value (“NAV”) per share of the Fund is calculated by dividing the sum of the value of the securities held by the Fund, plus cash or other assets, minus all liabilities (including estimated accrued expenses) by the total number of shares outstanding for the Fund, rounded to the nearest cent. The Fund’s shares will not be priced on days the New York Stock Exchange is closed for trading. The offering and redemption price per share for the Fund is equal to the Fund’s net asset value per share. |
| h). | Foreign Currency – Values of investments denominated in foreign currencies are converted into U.S. dollars using the spot market rate of exchange at the time of valuation. Purchases and sales of investments and income are translated into U.S. dollars using the spot market rate of exchange prevailing on the respective dates of such transactions. The Fund does not isolate the portion of the results of operations resulting from fluctuations in foreign exchange rates on investments from fluctuations resulting from changes in the market prices of securities held. Such fluctuations are included with the net realized and unrealized gain or loss on investments. Foreign investments present additional risks due to currency fluctuations, economic and political factors, lower liquidity, government regulations, differences in accounting standards, and other factors. |
| i). | Forward Contracts – The Fund may enter into forward currency contracts to reduce its exposure to changes in foreign currency exchange rates on its foreign holdings and to lock in the U.S. dollar cost of firm purchase and sale commitments for securities denominated in foreign currencies. A forward currency contract is a commitment to purchase or sell a foreign currency at a future date at a negotiated forward rate. The gain or loss arising from the difference between the U.S. dollar cost of the original contract and the value of the foreign currency in U.S. dollars upon closing of such contract is included in net realized gain or loss from foreign currency transactions. During the six months ended April 30, 2014, the Fund did not enter into any forward contracts. |
| j). | Repurchase Agreements – The Fund may enter into repurchase agreements with member banks or security dealers of the Federal Reserve Board whom the investment advisor deems creditworthy. The repurchase price generally equals the price paid by the Fund plus interest negotiated on the basis of current short-term rates. |
HENNESSY FUNDS 1-800-966-4354
| | Securities pledged as collateral for repurchase agreements are held by the custodian bank until the respective agreements mature. Provisions of the repurchase agreements ensure that the market value of the collateral, including accrued interest thereon, is sufficient in the event of default of the counterparty. If the counterparty defaults and the value of the collateral declines or if the counterparty enters an insolvency proceeding, realization of the collateral by the Fund may be delayed or limited. |
| k). | Accounting for Uncertainty in Income Taxes – The Fund has adopted accounting policies regarding recognition and measurement of tax positions taken or expected to be taken on a tax return. The Fund has reviewed all open tax years in major jurisdictions and concluded that there is no impact on the Fund’s net assets and no tax liability resulting from unrecognized tax benefits relating to uncertain income tax positions taken or expected to be taken on a tax return. The Fund’s major tax jurisdictions are U.S. Federal and Delaware. As of April 30, 2014, open Federal and state tax years for the Fund include the tax years ended October 31, 2011 through 2013. |
| l). | Derivatives – The Fund may invest in, or enter into, derivatives, such as options, futures contracts, options on futures contracts, and swaps, for a variety of reasons, including to hedge certain risks, to provide a substitute for purchasing or selling particular securities, or to increase potential income gain. Derivatives may provide a cheaper, quicker, or more specifically focused way for a Fund to invest than “traditional” securities would. The main purpose of utilizing these derivative instruments is for hedging purposes. |
| | The Fund has adopted the financial accounting reporting rules as required by the Derivatives and Hedging Topic of the Financial Accounting Standards Board Accounting Standards Codification. Under such rules, the Fund is required to include enhanced disclosure that enables investors to understand how and why an entity uses derivatives, how derivatives are accounted for, and how derivatives instruments affect an entity’s results of operations and financial position. During the six months ended April 30, 2014, the Fund did not hold any derivative instruments. |
| m). | Events Subsequent to the Fiscal Period End – The Fund has adopted financial reporting rules regarding subsequent events that require an entity to recognize in the financial statements the effects of all subsequent events that provide additional evidence about conditions that existed at the date of the balance sheet. Management has evaluated the Fund’s related events and transactions that occurred subsequent to April 30, 2014 through the date of issuance of the Fund’s financial statements. There were no events or transactions that occurred during this period that materially impacted the amounts or disclosures in the Fund’s financial statements. |
3). SECURITIES VALUATION
The Fund has adopted authoritative fair valuation accounting standards that establish an authoritative definition of fair value and set out a hierarchy for measuring fair value. These standards require additional disclosures about the various inputs and valuation techniques used to develop the measurements of fair value and a discussion in changes in valuation techniques and related inputs during the period. These inputs are summarized in the three broad levels listed below:
| | Level 1 – | Quoted unadjusted prices for identical instruments in active markets to which the Fund has access at the date of measurement. |
| | Level 2 – | Quoted prices for similar instruments in active markets; quoted prices for identical or similar instruments in markets that are not active; and model-derived valuations in which all significant inputs and significant value drivers are observable in active markets. Level 2 inputs are those in markets for which there are few transactions, the prices are not current, the prices are fair value adjusted due to post-market close subsequent events (foreign markets), little public information exists, or instances where prices vary substantially over time or among brokered market makers. These inputs may also include interest rates, prepayment speeds, credit risk curves, default rates, and similar data. |
| | Level 3 – | Model-derived valuations in which one or more significant inputs or significant value drivers are unobservable. Unobservable inputs are those inputs that reflect the Fund’s own assumptions about what market participants would use to price the asset or liability based on the best available information. |
Following is a description of the valuation techniques applied to the Fund’s major categories of assets and liabilities measured at fair value on a recurring basis.
Equity Securities – Equity securities, including common stocks, preferred stocks, foreign issued common stocks, exchange traded funds, closed-end mutual funds, and real estate investment trusts, that are traded on a securities exchange for which a last-quoted sales price is readily available will be valued at the last sales price as reported by the primary exchange on which the securities are listed. Securities listed on The NASDAQ Stock Market (“NASDAQ”) will be valued at the NASDAQ Official Closing Price, which may differ from the last sales price reported. Securities traded on a securities exchange for which a last-quoted sales price is not readily available will be valued at the mean between the bid and ask prices. To the extent these securities are actively traded and valuation adjustments are not applied, they are classified in Level 1 of the fair value hierarchy.
Investment Companies – Investments in investment companies (e.g., mutual funds and exchange traded funds) are generally priced at the ending NAV provided by the Fund’s service agent and will be classified in Level 1 of the fair value hierarchy.
Debt Securities – Debt securities, including corporate bonds, asset-backed securities, mortgage-backed securities, municipal bonds, U.S. Treasuries, and U.S. government agency issues, are valued at market on the basis of valuations furnished by an independent pricing service that utilizes both dealer-supplied valuations and formula-based techniques. The pricing service may consider recently executed transactions in securities of the issuer or comparable issuers, market price quotations (where observable), bond spreads, and fundamental data relating to the issuer. In addition, the model may incorporate market observable data such as reported sales of similar securities, broker quotes, yields, bids, offers, and reference data. Certain securities are valued principally using dealer quotations. These securities are generally classified in Level 2 of the fair value hierarchy.
Short-Term Securities – Short-term equity investments, including money market funds, are valued in the manner specified above. Short-term debt investments are valued at amortized cost, if their original maturity was 60 days or less, or by amortizing the values as of the 61st day prior to maturity, if their original term to maturity exceeded 60 days. Short-term securities are generally classified in Level 1 or Level 2 of the fair market hierarchy depending on the inputs used and market activity levels for specific securities.
The Board of Trustees of the Fund (the “Board”) has adopted fair value pricing procedures that are followed when a price for a security is not readily available or if a
HENNESSY FUNDS 1-800-966-4354
significant event has occurred that indicates the closing price of a security no longer represents the true value of that security. Fair value pricing determinations are made in good faith in accordance with these procedures. There are numerous criteria that will be given consideration in determining a fair value of a security. Some of these criteria are trading volume of security and markets, the value of other like securities, and news events with direct bearing to security or market. Fair value pricing results in an estimated price that reasonably reflects the current market conditions in order to rate the portfolio holdings such that shareholder transactions receive a fair net asset value. Depending on the relative significance of the valuation inputs, these securities may be classified in either Level 2 or Level 3 of the fair value hierarchy.
Fair valuing of foreign securities may be determined with the assistance of a pricing service using correlations between the movement of prices of such securities and indices of domestic securities and other appropriate indicators, such as closing market prices of relevant American Depositary Receipts or futures contracts. The effect of using fair value pricing is that the Fund’s NAV will reflect the affected portfolio securities’ value as determined in the judgment of the Board or its designee instead of being determined by the market. Using a fair value pricing methodology to price foreign securities may result in a value that is different from a foreign security’s most recent closing price and from the prices used by other investment companies to calculate their net asset values and are generally considered Level 2 prices in the fair valuation hierarchy. Because the Fund may invest in foreign securities, the value of the Fund’s portfolio securities may change on days when you will not be able to purchase or redeem your shares.
The Board has delegated day-to-day valuation matters to a Valuation Committee comprised of one or more representatives from Hennessy Advisors, Inc., the Fund’s investment advisor. The function of the Valuation Committee is to value securities where current and reliable market quotations are not readily available. All actions taken by the Valuation Committee are reviewed by the Board.
The Fund has performed an analysis of all existing investments to determine the significance and character of all inputs to their fair value determination. Various inputs are used in determining the value of the Fund’s investments. The inputs or methodology used for valuing securities are not necessarily an indication of the risk associated with investing in those securities. Details related to the fair valuation hierarchy of the Fund’s securities as of April 30, 2014 are included in the Fund’s Schedule of Investments.
4). INVESTMENT TRANSACTIONS
Purchases and sales of investment securities (excluding government and short-term investments) for the Fund during the six months ended April 30, 2014 were $31,799,064 and $32,186,170, respectively.
Purchases and sales/maturities of long-term U.S. Government Securities for the Fund were $14,996,968 and $14,878,086, respectively, for the six months ended April 30, 2014.
5). INVESTMENT MANAGEMENT FEE AND OTHER TRANSACTIONS WITH AFFILIATES
Hennessy Advisors, Inc. (the “Advisor”) is the investment advisor of the Fund. The Advisor provides the Fund with investment management services under an Investment Advisory Agreement. The Advisor furnishes all investment advice, office space, facilities, and provides most of the personnel needed by the Fund. As compensation for its services, the Advisor is entitled to a monthly fee from the Fund. The fee is based upon the average daily net assets of the Fund at the annual rate of 0.80%. The net investment advisory fees payable for the Fund as of April 30, 2014 were $212,589.
The Advisor has delegated the day-to-day management of the equity sleeve of the Fund to The London Company of Virginia, LLC and has delegated the day-to-day management of the fixed income sleeve of the Fund to Financial Counselors, Inc. The Advisor pays the sub-advisor fees for the Fund from its own assets and these fees are not an additional expense of the Fund.
The Advisor has contractually agreed to limit the total annual operating expenses of the Fund (excluding interest, taxes, brokerage commissions, dividend expenses, 12b-1 fees, acquired fund fees and expenses, extraordinary legal expenses, or any other extraordinary expenses) to 1.08% of the Fund’s net assets for both the Investor Class shares and Institutional Class shares of the Fund through February 28, 2015.
For a period of three years after the year in which the Advisor waives or reimburses expenses, the Advisor may seek reimbursement from the Fund to the extent that total annual fund operating expenses are less than the expense limitation in effect at the time of the reimbursement. The Advisor waived or reimbursed expenses of $11,567 for the Fund during the six-month period ended April 30, 2014. As of April 30, 2014, cumulative expenses subject to potential recovery to the aforementioned conditions and year of expiration are as follows:
| | | | October 31, 2015 | | | October 31, 2016 | | | October 31, 2017 | | | Total | |
| | Investor Class | | $ | 0 | | | $ | 67,819 | | | $ | 11,567 | | | $ | 79,386 | |
| | Institutional Class | | $ | 0 | | | $ | 0 | | | $ | 0 | | | $ | 0 | |
The Fund has adopted a plan pursuant to Rule 12b-1 under the Investment Company Act of 1940, as amended, that authorizes payments in connection with the distribution of the Fund’s shares at an annual rate of up to 0.25% of the average daily net assets of the Fund attributable to Investor Class shares. Amounts paid under the plan may be spent on any activities or expenses primarily intended to result in the sale of shares, including but not limited to, advertising, compensation for sales and marketing activities or financial institutions and others such as dealers and distributors, shareholder account servicing, the printing and mailing of prospectuses to other than current shareowners, and the printing and mailing of sales literature.
The Fund has entered into agreements with various brokers, dealers, and financial intermediaries in connection with the sale of shares of the Fund. The agreements provide for periodic payments by the Fund to the brokers, dealers, and financial intermediaries for providing certain shareholder maintenance services (sub-transfer agent expenses). These shareholder services include the pre-processing and quality control of new accounts, shareholder correspondence, answering customer inquiries regarding account status, and facilitating shareholder telephone transactions. Fees paid by the Fund to various brokers, dealers, and financial intermediaries for the six months ended April 30, 2014 were $168,450.
U.S. Bancorp Fund Services, LLC (“USBFS”) provides the Fund with administrative, fund accounting, and transfer agent services, including all regulatory reporting, and necessary office equipment and personnel. As administrator, USBFS prepares various federal and state regulatory filings, reports, and returns for the Fund; prepares reports and materials to be supplied to the Board; monitors the activities of the Fund’s custodian, transfer agent, and accountants; and coordinates the preparation and payment of the Fund’s expenses and reviews the Fund’s expense accruals. Fees paid to USBFS for the six months ended April 30, 2014 were $191,606.
U.S. Bank, N.A., an affiliate of USBFS, serves as the Fund’s custodian. Quasar Distributors, LLC acts as the Fund’s principal underwriter in a continuous public offering of the Fund’s shares. Quasar Distributors, LLC is an affiliate of USBFS and U.S. Bank, N.A.
HENNESSY FUNDS 1-800-966-4354
6). LINE OF CREDIT
The Fund has a line of credit with the other funds in the Hennessy Funds family of funds (the “Hennessy Funds”) in the amount of the lesser of (i) $100,000,000 or (ii) 33.33% of each Hennessy Fund’s net assets, or 30% for the Hennessy Gas Utility Index Fund and 10% for the Hennessy Balanced Fund, intended to provide short-term financing, if necessary, subject to certain restrictions, in connection with shareholder redemptions. The credit facility is with the Hennessy Funds’ custodian bank, U.S. Bank, N.A. Borrowings under this arrangement bear interest at the bank’s prime rate. During the six months ended April 30, 2014, the Fund did not have any borrowings outstanding under the line of credit.
7). FEDERAL TAX INFORMATION
As of October 31, 2013, the Fund’s most recent fiscal year end, the components of accumulated earnings (losses) for income tax purposes for the Fund were as follows:
| | Cost of investments for tax purposes | | $ | 272,312,225 | |
| | Gross tax unrealized appreciation | | $ | 47,145,367 | |
| | Gross tax unrealized depreciation | | | (2,100,558 | ) |
| | Net tax unrealized appreciation/depreciation | | $ | 45,044,809 | |
| | Undistributed ordinary income | | $ | 247,147 | |
| | Undistributed long-term capital gains | | | 10,301,169 | |
| | Total distributable earnings | | $ | 10,548,316 | |
| | Other accumulated gain (loss) | | $ | — | |
| | Total accumulated gain (loss) | | $ | 55,593,125 | |
The difference between book-basis and tax-basis unrealized appreciation is attributable primarily to capital loss carry overs, wash sales, and partnership adjustments.
At October 31, 2013, the Fund’s most recent fiscal year end, the Fund had no tax basis capital losses to offset future capital gains.
During the year ended October 31, 2013, the Fund’s most recent fiscal year end, the capital loss carry forwards utilized for the Fund were $2,832,320.
Capital losses sustained in the year ended October 31, 2012 and in future taxable years will not expire and may be carried over by the Fund without limitation; however, they will retain the character of the original loss. Furthermore, any losses incurred during those taxable years will be required to be utilized prior to the losses incurred in the pre-enactment taxable years. As a result of this ordering rule, pre-enactment capital loss carryforwards may be more likely to expire unused. Under pre-enactment law, capital losses could be carried forward for eight years, and carried forward as short-term capital losses, irrespective of the character of the original loss.
At October 31, 2013, the Fund did not defer, on a tax basis, any post-December late year ordinary loss deferrals or post-December loss deferrals.
The tax character of distributions paid during fiscal year 2014 (year-to-date) and fiscal year 2013 for the Fund were as follows:
| | | | Six Months Ended | | | Year Ended | |
| | | | April 30, 2014 | | | October 31, 2013 | |
| | Ordinary income | | $ | 1,849,886 | | | $ | 5,000,498 | |
| | Long-term capital gain | | | 10,301,249 | | | | — | |
| | | | $ | 12,151,135 | | | $ | 5,000,498 | |
Expense Example (Unaudited)
April 30, 2014
As a shareholder of the Fund, you incur two types of costs: (1) transaction costs, including sales charges (loads) on purchase payments, reinvested dividends, or other distributions; redemption fees; and exchange fees; and (2) ongoing costs, including management fees; service fees; and other Fund expenses. This Example is intended to help you understand your ongoing costs (in dollars) of investing in the Fund and to compare these costs with the ongoing costs of investing in other mutual funds. The Example is based on an investment of $1,000 invested at the beginning of the period and held for the entire period from November 1, 2013 through April 30, 2014.
Actual Expenses
The first line of the table below under the “Investor Class” and “Institutional Class” headings provides information about actual account values and actual expenses. Although the Fund charges no sales loads or transaction fees, you will be assessed fees for outgoing wire transfers, returned checks and stop payment orders at prevailing rates charged by U.S. Bancorp Fund Services, LLC, the Fund’s transfer agent. If you request that a redemption be made by wire transfer, currently a $15.00 fee is charged by the Fund’s transfer agent. IRA accounts will be charged a $15.00 annual maintenance fee. The example below includes, but is not limited to, management fees, shareholder servicing fees, fund accounting, custody, and transfer agent fees. However, the example below does not include portfolio trading commissions and related expenses, and other extraordinary expenses as determined under generally accepted accounting principles. You may use the information in this line, together with the amount you invested, to estimate the expenses that you paid over the period. Simply divide your account value by $1,000 (for example, an $8,600 account value divided by $1,000 = 8.6), then multiply the result by the number in the first line of the table under the “Investor Class” and “Institutional Class” headings in the column entitled “Expenses Paid During Period” to estimate the expenses you paid on your account during this period.
Hypothetical Example for Comparison Purposes
The second line of the table below under the “Investor Class” and “Institutional Class” headings provides information about hypothetical account values and hypothetical expenses based on the Fund’s actual expense ratios and an assumed rate of return of 5% per year before expenses, which is not the Fund’s actual return. The hypothetical account values and expenses may not be used to estimate the actual ending account balance or expenses you paid for the period. You may use this information to compare the ongoing costs of investing in the Fund and other funds. To do so, compare this 5% hypothetical example with the 5% hypothetical examples that appear in the shareholder reports of the other funds. Please note that the expenses shown in the table are meant to highlight your ongoing costs only and do not reflect any transactional costs, such as sales charges (loads), or exchange fees. Therefore, the second line of the table under the “Investor Class” and “Institutional Class” headings is useful in comparing ongoing costs only, and will not help you determine the relative total costs of owning different funds. In addition, if these transactional costs were included, your costs would have been higher.
HENNESSY FUNDS 1-800-966-4354
| | | | Expenses Paid |
| | Beginning | Ending | During Period(1) |
| | Account Value | Account Value | November 1, 2013 – |
| | November 1, 2013 | April 30, 2014 | April 30, 2014 |
| Investor Class | | | |
| | | | |
| Actual | $1,000.00 | $1,044.90 | $6.74 |
| | | | |
| Hypothetical (5% return | | | |
| before expenses) | $1,000.00 | $1,018.20 | $6.66 |
| | | | |
| Institutional Class | | | |
| | | | |
| Actual | $1,000.00 | $1,046.10 | $5.38 |
| | | | |
| Hypothetical (5% return | | | |
| before expenses) | $1,000.00 | $1,019.54 | $5.31 |
| (1) | Expenses are equal to the Fund’s annualized expense ratio of 1.33% for Investor Class shares or 1.06% for Institutional Class shares, as applicable, multiplied by the average account value over the period, multiplied by 181/365 days (to reflect one-half year period). |
Proxy Voting
A description of the policies and procedures the Fund uses to determine how to vote proxies relating to portfolio securities is available without charge: (1) by calling 1-800-966-4354; (2) on the Hennessy Funds’ website at hennessyfunds.com; or (3) on the U.S. Securities and Exchange Commission’s (the “SEC”) website at www.sec.gov. The Fund’s proxy voting record is available on both the Hennessy Funds’ website at hennessyfunds.com and the SEC’s website at www.sec.gov no later than August 31 for the prior 12 months ending June 30.
Quarterly Filings on Form N-Q
The Fund files its complete schedule of portfolio holdings with the SEC for the first and third quarters of each fiscal year on Form N-Q. The Fund’s Forms N-Q are available on the SEC’s website at www.sec.gov. The Fund’s Forms N-Q may be reviewed and copied at the SEC’s Public Reference Room in Washington, DC and information on the operation of the Public Reference Room may be obtained by calling 1-800-SEC-0330. Information included in the Fund’s Forms N-Q will also be available upon request by calling 1-800-966-4354.
Federal Tax Distribution Information
(Unaudited)
For the fiscal year ended October 31, 2013, certain dividends paid by the Fund may be subject to a maximum tax rate of 15%, as provided for by the Jobs and Growth Tax Relief Reconciliation Act of 2003. The percentage of dividends declared from ordinary income designated as qualified dividend income was 99.15%.
For corporate shareholders, the percent of ordinary income distributions qualifying for the corporate dividends received deduction for the fiscal year ended October 31, 2013 was 99.15%.
The percentage of taxable ordinary income distributions that are designated as short-term capital gain distributions under Section 871(k)(2)(C) of the Internal Revenue Code of 1986, as amended, for the Fund was 0.00%.
Householding
To help keep the Fund’s costs as low as possible, we generally deliver a single copy of most financial reports and prospectuses to shareholders who share an address, even if the accounts are registered under different names. This process, known as “householding,” does not apply to account statements. You may, of course, request an individual copy of a prospectus or financial report at any time. If you would like to receive separate mailings, please call the Administrator at 1-800-261-6950 or 1-414-765-4124 and we will begin individual delivery within 30 days of your request. If your account is held through a financial institution or other intermediary, please contact them directly to request individual delivery.
HENNESSY FUNDS 1-800-966-4354
Board Approval of Investment Advisory
Agreements
At its meeting on March 3, 2014, the Board of Trustees of the Fund (the “Board”) unanimously approved the continuation of the investment advisory agreement and sub-advisory agreements of the Fund.
The Board reviewed a number of documents, including a memorandum provided by outside legal counsel that described the fiduciary duties of the Board with respect to approving the continuance of the investment advisory and sub-advisory agreements and the relevant factors for consideration, a memorandum from the Advisor that listed each of the relevant factors and the documents provided to help the Board assess each such factor, the Advisor’s most recent Form 10-K and 10-Q, the Advisor’s Form ADV Part I, a document that listed the range of services provided by the Advisor for the Fund, a written discussion of economies of scale, a completed questionnaire from each sub-advisor, each sub-advisor’s Form ADV Parts I and II, copies of the advisory and sub-advisory agreements, a fund fact sheet, and peer expense and performance comparisons. The Board considered and discussed numerous factors, including the following:
| | • | The Board considered the services identified below that are provided by the Advisor and the sub-advisors: |
| | | • | The Advisor oversees the sub-advisors for the Fund. The sub-advisors act as the portfolio manager to the Fund, managing the composition of the portfolio of the Fund, including the purchase, retention, and disposition of portfolio securities in accordance with the Fund’s investment objectives, policies, and restrictions. |
| | | • | The Advisor performs daily reconciliations of portfolio positions and cash for the Fund. |
| | | • | The Advisor oversees the use of soft dollars for the Fund. |
| | | • | The Advisor monitors compliance by the Fund with its investment objectives and restrictions. |
| | | • | The Advisor monitors compliance with federal securities laws and performs activities such as maintaining a compliance program, conducting ongoing reviews of the compliance programs of the sub-advisors and the Fund’s other service providers, conducting on-site visits to the sub-advisors and the Fund’s other service providers, monitoring incidents of abusive trading practices, reviewing Fund expense accruals, payments, and fixed expense ratios, evaluating insurance providers for fidelity bond coverage and D&O/E&O insurance coverage, conducting employee compliance training, reviewing reports provided by service providers, maintaining books and records, and preparing an annual compliance report to the Board. |
| | | • | The Advisor oversees service providers that support the Fund in providing fund accounting, fund administration, fund distribution, transfer agency, custodial, sales and marketing, audit, information technology, and legal services. |
| | | • | The Advisor maintains an in-house public relations and marketing department on behalf of the Fund. |
| | | • | The Advisor is actively involved with preparing regulatory filings for the Fund. |
| | | • | The Advisor oversees proxy voting for the Fund. |
| | | • | The Advisor oversees distribution of the Fund through third-party broker/dealers and independent financial institutions such as Charles Schwab, |
| | | | Inc., Fidelity, TD Waterhouse, and Pershing. The Advisor participates in “no transaction fee” (“NTF”) programs with these companies on behalf of the Fund, which allows customers to purchase the Fund through third-party distribution channels without paying a transaction fee. The Advisor compensates a number of these third-party providers of NTF programs out of its own revenues and not those of the Fund. |
| | | • | The Advisor pays the incentive compensation of all of the Fund’s compliance officers and employs other staff such as management executives, legal personnel, marketing personnel, national accounts and distribution personnel, sales personnel, and trading oversight personnel. |
| | | • | The Advisor prepares or reviews Board materials, frequently presents to the Board or leads Board discussions, prepares or reviews meeting minutes, and arranges for Board training and education. |
| | • | The Board compared the performance of the Fund to benchmark indices over various periods of time and concluded that the positive performance of the Fund warranted the continuation of the advisory and sub-advisory agreements. |
| | • | The Board reviewed the Fund’s expense ratio and comparable expense ratios for funds comparable to the Fund. The Board used data from Morningstar showing funds similar in asset size and investment objective to the Fund and determined that the expense ratio of the Fund falls within the range of the ratios of other comparable funds and concluded that the expenses of the Fund were reasonable. |
| | • | The Board considered the fees charged by the Advisor and the sub-advisors of the Fund to those of funds similar in asset size and investment objective to the Fund and concluded the advisory and sub-advisory fees of the Fund were reasonable and warranted continuation of the advisory and sub-advisory agreements. The Trustees noted that the investment advisory and sub-advisory fees are not adjusted if economies of scale are realized as the Fund grows because many of the expenses incurred to manage the Fund are asset-based fees and thus do not result in material economies of scale being realized as the net assets of the Fund increase. |
| | • | The Board considered the profitability of the Advisor and the sub-advisors with respect to the Fund and concluded the profits were reasonable and not excessive when compared to profitability guidelines set forth in relevant court cases. |
| | • | The Board considered the high level of professionalism and knowledge of the Advisor’s employees, along with an extremely low level of turnover of the employees of the Advisor, and concluded that this was beneficial to the Fund and its shareholders, as it ensures that the Fund is operated efficiently. |
All of the factors above were considered separately by the Board, including the Trustees who are not “interested persons” (as defined in the Investment Company Act of 1940, as amended) of the Fund (the “Independent Trustees”) meeting in an executive session. The factors were viewed in their totality by the Board, with no single factor being the principal or determinative factor in the Board’s determination of whether to approve the continuation of the advisory and sub-advisory agreements. Based on the factors discussed above, the Board, including all of the Independent Trustees, recommended continuation of the advisory and sub-advisory agreements.
HENNESSY FUNDS 1-800-966-4354
For information, questions or assistance, please call
The Hennessy Funds
1-800-966-4354 or 1-415-899-1555
INVESTMENT ADVISOR
Hennessy Advisors, Inc.
7250 Redwood Blvd., Suite 200
Novato, California 94945
ADMINISTRATOR,
TRANSFER AGENT,
DIVIDEND PAYING AGENT &
SHAREHOLDER SERVICING AGENT
U.S. Bancorp Fund Services, LLC
P.O. Box 701
Milwaukee, Wisconsin 53201-0701
CUSTODIAN
U.S. Bank N.A.
Custody Operations
1555 North River Center Dr., Suite 302
Milwaukee, Wisconsin 53212
TRUSTEES
Neil J. Hennessy
Robert T. Doyle
J. Dennis DeSousa
Gerald P. Richardson
COUNSEL
Foley & Lardner LLP
777 East Wisconsin Avenue
Milwaukee, Wisconsin 53202-5306
INDEPENDENT REGISTERED
PUBLIC ACCOUNTING FIRM
Tait, Weller & Baker LLP
1818 Market Street, Suite 2400
Philadelphia, Pennsylvania 19103
DISTRIBUTOR
Quasar Distributors, LLC
615 East Michigan Street
Milwaukee, Wisconsin 53202
hennessyfunds.com | 1-800-966-4354
This report has been prepared for shareholders and may be distributed to
others only if preceded or accompanied by a current prospectus.
SEMI-ANNUAL REPORT
APRIL 30, 2014
HENNESSY BALANCED
FUND
Investor Class HBFBX
hennessyfunds.com | 1-800-966-4354
(This Page Intentionally Left Blank.)
Contents
| Letter to Shareholders | | 2 |
| Performance Overview | | 4 |
| Financial Statements | | |
| Schedule of Investments | | 6 |
| Statement of Assets and Liabilities | | 10 |
| Statement of Operations | | 11 |
| Statements of Changes in Net Assets | | 13 |
| Financial Highlights | | 14 |
| Notes to the Financial Statements | | 16 |
| Expense Example | | 23 |
| Proxy Voting | | 25 |
| Quarterly Filings on Form N-Q | | 25 |
| Federal Tax Distribution Information | | 25 |
| Householding | | 25 |
| Board Approval of Investment Advisory Agreement | | 26 |
HENNESSY FUNDS 1-800-966-4354
June 2014
Dear Shareholder:
The financial markets have provided strong returns over the past six-months ended April 30, 2014, with the Dow Jones Industrial Average (DJIA) and S&P 500 both returning approximately 8% during the period. The current valuation metrics of the major indices are solid; for example, the DJIA currently has a price-to-earnings ratio of 15x and a price-to-sales ratio of 1.75x. The DJIA also has a dividend yield of 2.2%, which is nearly as high as that of a 10-Year U.S. Treasury, which is currently yielding 2.6%. Investing in high-yielding, high-quality DJIA stocks have the potential to not only provide an income stream but also for stock price appreciation as well. Fixed income investing has run its course, in my opinion, and many individuals are currently benefiting from the return to investing in equities that possess strong fundamentals.
U.S. corporations continue to drive shareholder value by making acquisitions, initiating and raising dividends, investing in internal infrastructure, and buying back stock. However, lately I have begun to see a shift in those business strategies. The easier-to-execute acquisitions seem to be a thing of the past, and firms now have to be even more creative to execute accretive deals. I also believe that while firms may continue to initiate dividends, fewer firms will raise their dividends and fewer firms will participate in stock buyback programs going forward. So what will these cash-rich companies do with their capital if they are not raising dividends or buying back stock? I believe we will see companies begin to initiate capital expenditure programs.
Due to the continuing uncertainty from a lack of clear policies on taxes, healthcare, and regulations, I have observed that corporations would rather wait for clarity from our government leaders and defer any significant changes to their current business models. Up until this point, there has been no real cost for firms to defer spending their capital as they wait for anticipated guidance on policies that directly affect their businesses. But, this economic handcuffing from all of this uncertainty has gone on long enough. I believe there will now be firms who want to improve their margins and will begin spending money to expand their sales, and may even begin to hire. Once a competitor begins to move in this way, then the cost to defer becomes real for companies. This movement to expansion may well be a catalyst to propel the financial markets. I do believe this will be a slow shift, but one that will keep the economy improving, and should, in my opinion, help to generate reasonable market returns over the next few years.
With almost $3 trillion in cash sitting on the sidelines, this strategic shift by companies to begin spending their idle capital should help the economic recovery in the U.S. But that is only one part of the equation. Washington politics still play a role in how strong that recovery will be. The national political landscape will change in the next few years, and the future generation of elected officials will be faced with what I believe are fictitious unemployment figures (6.3% reported, when over 20 million Americans are looking for more work or a better job), a sluggish economy, and global competition in business. The next regime needs to provide real clarity on the issues that face all Americans and American corporations: taxation, regulation, and how to pay for our new healthcare system. I also believe that our government needs to regard business as a noble profession and to implement common sense and logic in their policy making instead of politics as usual. As Confucius is quoted as saying, “Life is really simple, but we insist on making it complicated.”
I am confident that even with all the hurdles facing corporate America, companies continue to provide good value for their shareholders, and I believe that means the financial markets are in good shape and should remain strong moving forward, I also believe that the next few months may be volatile. Fads come and go, and the current buzz on the Street is around investing in social media stocks. I believe that chasing hot products has contributed and will continue to contribute to the volatility of the markets this year. After over 35 years in the business, I still firmly believe the best way to position your portfolio is by investing in good companies over the long term, rather than trying to buy the next hot idea at exactly the right time. At Hennessy Funds, hunches and fads have no place in our investment process, and we understand that successful investing comes from time in the market, not timing the market.
We remain focused on investing based on proven fundamentals, and we are committed to managing money for the sole benefit of our shareholders. If you have any questions or want to speak with us directly, please don’t hesitate to call us at (800) 966-4354.
Best regards,
Neil J. Hennessy
President and Chief Investment Officer
Past performance does not guarantee future results.
Mutual fund investing involves risk. Principal loss is possible.
Opinions expressed are those of Neil Hennessy and are subject to change, are not guaranteed and should not be considered investment advice.
The Dow Jones Industrial Average and S&P 500 are unmanaged indices commonly used to measure the performance of U.S. stocks. One cannot invest directly in an index.
Price-to-sales ratio and price-to-earnings ratio are tools for calculating relative valuation. Price-to-sales ratio is calculated by dividing the market price by revenue per share. Price-to-earnings ratio is the market price per share divided by earnings per share.
HENNESSY FUNDS 1-800-966-4354
Performance Overview (Unaudited)
The opinions expressed in the following commentary reflect those of the Portfolio Managers as of the date written. Any such opinions are subject to change based on market or other conditions and are not guaranteed. These opinions may not be relied upon as investment advice. Investment decisions for the Fund are based on several factors, and may not be relied upon as an indication of trading intent on behalf of the Fund. Security positions can and do change.
AVERAGE ANNUAL TOTAL RETURN PERIODS ENDED APRIL 30, 2014
| | Six | One | Five | Ten |
| | Months(1) | Year | Years | Years |
| Hennessy Balanced Fund (HBFBX) | 3.22% | 4.93% | 10.22% | 3.89% |
50/50 Blended DJIA/Treasury Index(2) | 4.04% | 7.28% | 9.30% | 5.09% |
| Dow Jones Industrial Average | 7.90% | 14.44% | 18.32% | 7.68% |
Expense ratio: 1.75%
Performance data quoted represents past performance; past performance does not guarantee future results. The investment return and principal value of an investment will fluctuate so that an investor’s shares, when redeemed, may be worth more or less than their original cost. Current performance of the Fund may be lower or higher than the performance quoted. Performance data current to the most recent month end may be obtained by visiting hennessyfunds.com.
The expense ratio presented is from the most recent prospectus.
| (1) | Periods less than one year are not annualized. |
| (2) | The 50/50 Blended DJIA/Treasury Index consists of 50% common stocks represented by the Dow Jones Industrial Average and 50% short-duration Treasury securities represented by the BofA Merrill Lynch 1-Year Treasury Note Index. |
PERFORMANCE NARRATIVE
Portfolio Manager, Neil Hennessy, and Co-Portfolio Manager, Brian Peery
Over the previous six months, how did the Fund perform and what factors contributed to this performance?
For the six-month period ended April 30, 2014, the Hennessy Balanced Fund returned 3.22%, underperforming the 50/50 Blended DJIA/Treasury Index, the Dow Jones Industrial Average, and the Morningstar Moderate Allocation Category Average, which returned 4.04%, 7.90%, and 4.65% for the same period, respectively.
The Fund’s relative underperformance to its benchmarks is due primarily to the relative underperformance of some of the higher dividend-paying companies within the Dow Jones Industrial Average. Because the Fund maintains a position of approximately 50% in U.S. Treasuries, it did not fully capture the performance of the equity markets over the six-month period. While the Fund’s portfolio may underperform its benchmarks in periods where equities rise sharply, the strategy aims to capture near-market returns with a lower risk profile, since only approximately 50% of the assets of the Fund are invested in equities. Conversely, if equity markets were to fall sharply, we would expect the Fund to perform better than its equity benchmarks due to its approximately 50% exposure to short-term U.S. Treasuries that are held to maturity. Ultimately, the overall goal of this portfolio is to capture upside performance while mitigating downside risk.
During the six-month period ended April 30, 2014, all but one of the Fund’s 13 equity positions had positive returns, with only Verizon Communications, Inc. posting a negative return. Merck & Co., Inc. and Microsoft Corporation had the best performance during the period, posting gains of 31% and 15%, respectively. Despite Merck & Co., Inc. being the largest holding within the Fund, the Fund’s relative underweight position in Microsoft Corporation and overweight position in both Verizon Communications, Inc. and AT&T, Inc. hurt relative overall performance versus its benchmarks. The Fund continues to hold all of these positions.
Additional Portfolio Manager commentary and related investment outlook:
We continue to believe that the Dow Jones Industrial Average stocks, and in particular the stocks comprising the high dividend- yielding “Dogs of the Dow” (the methodology employed within the Hennessy Balanced Fund), provide an excellent way to gain equity exposure to the markets. With U.S. Treasury yields still trading near historic lows, many investors are seeking high quality, dividend- paying companies as a means of potentially generating current income. We believe that the rotation out of bonds and into equities, where investors have historically received higher yields as well as the potential for capital appreciation, should continue.
As the overall markets reach new highs and investors become more wary of a potential pullback, we believe that a trend of moving some money away from more risky asset classes and into the perceived “safety” of very large dividend-paying companies will prevail. We believe the Fund is well positioned for the more conservative investor as the equity portion of the portfolio holds what we would deem to be high quality, high-dividend-paying companies, while the relatively short duration of the U.S. Treasury component (all less than one year) will allow us the ability to roll into higher yielding treasuries in the event yields continue to rise.
_______________
The 50/50 Blended DJIA/Treasury Index consists of 50% common stocks represented by the Dow Jones Industrial Average and 50% short duration Treasury securities represented by the BofA Merrill Lynch 1-Year U.S. Treasury Note Index. The Dow Jones Industrial Average is an unmanaged index commonly used to measure the performance of U.S. stocks. The BofA Merrill Lynch 1-Year U.S. Treasury Note Index is an unmanaged index comprised of Treasury securities maturing in approximately one year. You cannot invest directly in an index. Performance data for an index does not reflect any deductions for fees, expenses or taxes. The Fund is non-diversified, meaning it concentrates its assets in fewer individual holdings than a diversified fund and is therefore more exposed to individual stock volatility than a diversified fund. The Fund’s portfolio is rebalanced annually in accordance with its strategy, which may result in the elimination of better performing assets from the Fund’s investments and increases in investments with relatively lower total return. References to specific securities should not be considered a recommendation to buy or sell any security. Fund holdings and sector allocations are subject to change. Please refer to the Schedule of Investments included in this report for additional portfolio information.
Each Morningstar category average represents a universe of funds with similar investment objectives. © Morningstar, Inc. All Rights Reserved. The information contained herein: 1) is proprietary to Morningstar; 2) may not be copied or distributed and 3) is not warranted to be accurate, complete or timely. Neither Morningstar nor its content providers are responsible for any damages or losses arising from any use of this information. Past performance does not guarantee future results.
HENNESSY FUNDS 1-800-966-4354
Schedule of Investments
HENNESSY BALANCED FUND
As of April 30, 2014 (Unaudited)
(% of Net Assets)
| | TOP TEN HOLDINGS | % NET ASSETS |
| | U.S. Treasury Bill, 0.115%, 02/05/2015 | 12.56% |
| | U.S. Treasury Bill, 0.075%, 08/21/2014 | 8.37% |
| | U.S. Treasury Bill, 0.080%, 09/18/2014 | 6.70% |
| | U.S. Treasury Bill, 0.050%, 06/26/2014 | 6.70% |
| | Merck & Co., Inc. | 5.74% |
| | Intel Corp. | 5.26% |
| | General Electric Co. | 5.07% |
| | Procter & Gamble Co. | 5.05% |
| | U.S. Treasury Bill, 0.010%, 05/29/2014 | 5.02% |
| | McDonald’s Corp. | 4.92% |
| | | |
Note: For presentation purposes, the Fund has grouped some of the industry categories. For purposes of categorizing securities for compliance with Section 8(b)(1) of the Investment Company Act of 1940, the Fund uses more specific industry classifications.
| | COMMON STOCKS – 50.30% | | Number | | | | | | % of | |
| | | | of Shares | | | Value | | | Net Assets | |
| | Consumer Discretionary – 4.92% | | | | | | | | | |
| | McDonald’s Corp. | | | 5,800 | | | $ | 588,004 | | | | 4.92 | % |
| | | | | | | | | | | | | | |
| | Consumer Staples – 5.05% | | | | | | | | | | | | |
| | Procter & Gamble Co. | | | 7,300 | | | | 602,615 | | | | 5.05 | % |
| | | | | | | | | | | | | | |
| | Energy – 4.89% | | | | | | | | | | | | |
| | Chevron Corp. | | | 4,650 | | | | 583,668 | | | | 4.89 | % |
| | | | | | | | | | | | | | |
| | Health Care – 10.26% | | | | | | | | | | | | |
| | Merck & Co., Inc. | | | 11,700 | | | | 685,152 | | | | 5.74 | % |
| | Pfizer, Inc. | | | 17,250 | | | | 539,580 | | | | 4.52 | % |
| | | | | | | | | 1,224,732 | | | | 10.26 | % |
| | | | | | | | | | | | | | |
| | Industrials – 5.07% | | | | | | | | | | | | |
| | General Electric Co. | | | 22,500 | | | | 605,025 | | | | 5.07 | % |
| | | | | | | | | | | | | | |
| | Information Technology – 6.52% | | | | | | | | | | | | |
| | Cisco Systems, Inc. | | | 4,850 | | | | 112,084 | | | | 0.94 | % |
| | Intel Corp. | | | 23,550 | | | | 628,549 | | | | 5.26 | % |
| | Microsoft Corp. | | | 950 | | | | 38,380 | | | | 0.32 | % |
| | | | | | | | | 779,013 | | | | 6.52 | % |
| | | | | | | | | | | | | | |
| | Materials – 4.51% | | | | | | | | | | | | |
| | EI Du Pont de Nemours & Co. | | | 8,000 | | | | 538,560 | | | | 4.51 | % |
| | | | | | | | | | | | | | |
| | Telecommunication Services – 9.08% | | | | | | | | | | | | |
| | AT&T, Inc. | | | 16,450 | | | | 587,265 | | | | 4.92 | % |
| | Verizon Communications, Inc. | | | 10,650 | | | | 497,675 | | | | 4.16 | % |
| | | | | | | | | 1,084,940 | | | | 9.08 | % |
| | Total Common Stocks | | | | | | | | | | | | |
| | (Cost $4,880,427) | | | | | | | 6,006,557 | | | | 50.30 | % |
The accompanying notes are an integral part of these financial statements.
HENNESSY FUNDS 1-800-966-4354
| | SHORT-TERM INVESTMENTS – 49.85% | | Number of Shares/ | | | | | | % of | |
| | | | Par Amount | | | Value | | | Net Assets | |
| | Money Market Funds – 1.30% | | | | | | | | | |
| | Fidelity Government Portfolio – | | | | | | | | | |
| | Institutional Class, 0.01% (a) | | | 154,803 | | | $ | 154,803 | | | | 1.30 | % |
| | | | | | | | | | | | | | |
| | Total Money Market Funds | | | | | | | | | | | | |
| | (Cost $154,803) | | | | | | | 154,803 | | | | 1.30 | % |
| | | | | | | | | | | | | | |
| | U.S. Treasury Bills – 48.55% | | | | | | | | | | | | |
| | 0.020%, 05/01/2014 (b) | | | 300,000 | | | | 300,000 | | | | 2.51 | % |
| | 0.010%, 05/29/2014 (b) | | | 600,000 | | | | 599,951 | | | | 5.02 | % |
| | 0.050%, 06/26/2014 (b) | | | 800,000 | | | | 799,832 | | | | 6.70 | % |
| | 0.075%, 08/21/2014 (b) | | | 1,000,000 | | | | 999,918 | | | | 8.37 | % |
| | 0.080%, 09/18/2014 (b) | | | 800,000 | | | | 799,914 | | | | 6.70 | % |
| | 0.115%, 02/05/2015 (b) | | | 1,500,000 | | | | 1,499,212 | | | | 12.56 | % |
| | 0.120%, 03/05/2015 (b) | | | 300,000 | | | | 299,795 | | | | 2.51 | % |
| | 0.125%, 04/02/2015 (b) | | | 500,000 | | | | 499,627 | | | | 4.18 | % |
| | | | | | | | | | | | | | |
| | Total U.S. Treasury Bills | | | | | | | | | | | | |
| | (Cost $5,797,262) | | | | | | | 5,798,249 | | | | 48.55 | % |
| | | | | | | | | | | | | | |
| | Total Short-Term Investments | | | | | | | | | | | | |
| | (Cost $5,952,065) | | | | | | | 5,953,052 | | | | 49.85 | % |
| | | | | | | | | | | | | | |
| | Total Investments | | | | | | | | | | | | |
| | (Cost $10,832,492) – 100.15% | | | | | | | 11,959,609 | | | | 100.15 | % |
| | Liabilities in Excess of | | | | | | | | | | | | |
| | Other Assets – (0.15)% | | | | | | | (18,304 | ) | | | (0.15 | )% |
| | TOTAL NET ASSETS – 100.00% | | | | | | $ | 11,941,305 | | | | 100.00 | % |
Percentages are stated as a percent of net assets.
| (a) | The rate listed is the fund’s 7-day yield as of April 30, 2014. |
| (b) | The rate listed is discount rate at issue. |
The accompanying notes are an integral part of these financial statements.
Summary of Fair Value Exposure at April 30, 2014
The following is a summary of the inputs used to value the Fund’s net assets as of April 30, 2014 (See Note 3 in the accompanying notes to the financial statements):
| Common Stock | | Level 1 | | | Level 2 | | | Level 3 | | | Total | |
| Consumer Discretionary | | $ | 588,004 | | | $ | — | | | $ | — | | | $ | 588,004 | |
| Consumer Staples | | | 602,615 | | | | — | | | | — | | | | 602,615 | |
| Energy | | | 583,668 | | | | — | | | | — | | | | 583,668 | |
| Health Care | | | 1,224,732 | | | | — | | | | — | | | | 1,224,732 | |
| Industrials | | | 605,025 | | | | — | | | | — | | | | 605,025 | |
| Information Technology | | | 779,013 | | | | — | | | | — | | | | 779,013 | |
| Materials | | | 538,560 | | | | — | | | | — | | | | 538,560 | |
| Telecommunication Services | | | 1,084,940 | | | | — | | | | — | | | | 1,084,940 | |
| Total Common Stock | | $ | 6,006,557 | | | $ | — | | | $ | — | | | $ | 6,006,557 | |
| Short-Term Investments | | | | | | | | | | | | | | | | |
| Money Market Funds | | $ | 154,803 | | | $ | — | | | $ | — | | | $ | 154,803 | |
| U.S. Treasury Bills | | | — | | | | 5,798,249 | | | | — | | | | 5,798,249 | |
| Total Short-Term Investments | | $ | 154,803 | | | $ | 5,798,249 | | | $ | — | | | $ | 5,953,052 | |
| Total Investments | | $ | 6,161,360 | | | $ | 5,798,249 | | | $ | — | | | $ | 11,959,609 | |
Transfers between levels are recognized at the end of the reporting period. During the six-month period ended April 30, 2014, the Fund recognized no transfers between levels.
The accompanying notes are an integral part of these financial statements.
HENNESSY FUNDS 1-800-966-4354
Statement of Assets and Liabilities as of April 30, 2014 (Unaudited) |
| ASSETS: | | | |
| Investments in securities, at value (cost $10,832,492) | | $ | 11,959,609 | |
| Dividends and interest receivable | | | 18,819 | |
| Receivable for fund shares sold | | | 123 | |
| Prepaid expenses and other assets | | | 13,804 | |
| Total Assets | | | 11,992,355 | |
| | | | | |
| LIABILITIES: | | | | |
| Payable to advisor | | | 5,859 | |
| Payable to administrator | | | 4,442 | |
| Payable to auditor | | | 11,444 | |
| Accrued distribution fees | | | 15,130 | |
| Accrued service fees | | | 978 | |
| Accrued trustees fees | | | 3,186 | |
| Accrued expenses and other payables | | | 10,011 | |
| Total Liabilities | | | 51,050 | |
| NET ASSETS | | $ | 11,941,305 | |
| | | | | |
| NET ASSETS CONSIST OF: | | | | |
| Capital stock | | $ | 10,622,229 | |
| Accumulated net investment income | | | 1,734 | |
| Accumulated net realized gain on investments | | | 190,225 | |
| Unrealized net appreciation on investments | | | 1,127,117 | |
| Total Net Assets | | $ | 11,941,305 | |
| | | | | |
| NET ASSETS | | | | |
| Investor Class: | | | | |
| Shares authorized (no par value) | | Unlimited | |
| Net assets applicable to outstanding Investor Class shares | | | 11,941,305 | |
| Shares issued and outstanding | | | 928,839 | |
| Net asset value, offering price and redemption price per share | | $ | 12.86 | |
The accompanying notes are an integral part of these financial statements.
Financial Statements
Statement of Operations Six Months Ended April 30, 2014 (Unaudited) |
| INVESTMENT INCOME: | | | |
| Dividend income | | $ | 113,050 | |
| Interest income | | | 2,769 | |
| Total investment income | | | 115,819 | |
| | | | | |
| EXPENSES: | | | | |
| Investment advisory fees | | | 35,733 | |
| Administration, fund accounting, custody and transfer agent fees | | | 11,911 | |
| Federal and state registration fees | | | 11,808 | |
| Compliance expense | | | 10,655 | |
| Audit fees | | | 9,421 | |
| Distribution fees – Investor Class (See Note 5) | | | 8,933 | |
| Service fees – Investor Class (See Note 5) | | | 5,955 | |
| Trustees’ fees and expenses | | | 4,563 | |
| Sub-transfer agent expenses – Investor Class (See Note 5) | | | 4,475 | |
| Legal fees | | | 2,480 | |
| Reports to shareholders | | | 1,761 | |
| Other expenses | | | 3,181 | |
| Total expenses | | | 110,876 | |
| NET INVESTMENT INCOME | | $ | 4,943 | |
| | | | | |
| REALIZED AND UNREALIZED GAINS: | | | | |
| Net realized gain on investments | | $ | 199,797 | |
| Change in unrealized appreciation on investments | | | 168,580 | |
| Net gain on investments | | | 368,377 | |
| NET INCREASE IN NET ASSETS RESULTING FROM OPERATIONS | | $ | 373,320 | |
The accompanying notes are an integral part of these financial statements.
HENNESSY FUNDS 1-800-966-4354
(This Page Intentionally Left Blank.)
Financial Statements
| Statements of Changes in Net Assets |
| | | Six Months Ended | | | | |
| | | April 30, 2014 | | | Year Ended | |
| | | (Unaudited) | | | October 31, 2013 | |
| OPERATIONS: | | | | | | |
| Net investment income | | $ | 4,943 | | | $ | 19,673 | |
| Net realized gain on securities | | | 199,797 | | | | 1,673,842 | |
| Change in unrealized appreciation on securities | | | 168,580 | | | | (684,183 | ) |
| Net increase in net assets resulting from operations | | | 373,320 | | | | 1,009,332 | |
| | | | | | | | | |
| DISTRIBUTIONS TO SHAREHOLDERS FROM: | | | | | | | | |
| Net investment income | | | | | | | | |
| Investor Class | | | (3,209 | ) | | | (23,090 | ) |
| Net realized gains | | | | | | | | |
| Investor Class | | | (413,659 | ) | | | — | |
| Total distributions | | | (416,868 | ) | | | (23,090 | ) |
| | | | | | | | | |
| CAPITAL SHARE TRANSACTIONS: | | | | | | | | |
| Proceeds from shares subscribed – Investor Class | | | 263,261 | | | | 1,014,696 | |
| Dividends reinvested – Investor Class | | | 404,904 | | | | 21,766 | |
| Cost of shares redeemed – Investor Class | | | (893,886 | ) | | | (14,981,906 | ) |
| Net decrease in net assets derived | | | | | | | | |
| from capital share transactions | | | (225,721 | ) | | | (13,945,444 | ) |
| TOTAL DECREASE IN NET ASSETS | | | (269,269 | ) | | | (12,959,202 | ) |
| | | | | | | | | |
| NET ASSETS: | | | | | | | | |
| Beginning of period | | | 12,210,574 | | | | 25,169,776 | |
| End of period | | $ | 11,941,305 | | | $ | 12,210,574 | |
| Undistributed net investment income, end of period | | $ | 1,734 | | | $ | — | |
| | | | | | | | | |
| CHANGES IN SHARES OUTSTANDING: | | | | | | | | |
| Shares sold – Investor Class | | | 20,904 | | | | 82,345 | |
| Shares issued to holders as reinvestment of dividends – | | | | | | | | |
| Investor Class | | | 32,209 | | | | 1,841 | |
| Shares redeemed – Investor Class | | | (70,561 | ) | | | (1,256,293 | ) |
| Net decrease in shares outstanding | | | (17,448 | ) | | | (1,172,107 | ) |
The accompanying notes are an integral part of these financial statements.
HENNESSY FUNDS 1-800-966-4354
Financial Highlights
For an Investor Class share outstanding throughout each period
| | | Six Months Ended | |
| | | April 30, 2014 | |
| | | (Unaudited) | |
| PER SHARE DATA: | | | |
| Net asset value, beginning of period | | $ | 12.90 | |
| | | | | |
| Income from investment operations: | | | | |
| Net investment income | | | 0.00 | (3) |
| Net realized and unrealized gains on securities | | | 0.40 | |
| Total from investment operations | | | 0.40 | |
| | | | | |
| Less distributions: | | | | |
| Dividends from net investment income | | | 0.00 | (3) |
| Dividends from realized capital gains | | | (0.44 | ) |
| Total distributions | | | (0.44 | ) |
| Net asset value, end of period | | $ | 12.86 | |
| | | | | |
| TOTAL RETURN | | | 3.22 | %(1) |
| | | | | |
| SUPPLEMENTAL DATA AND RATIOS: | | | | |
| Net assets, end of period (millions) | | $ | 11.94 | |
| Ratio of net expenses to average net assets | | | 1.86 | %(2) |
| Ratio of net investment income to average net assets | | | 0.08 | %(2) |
| Portfolio turnover rate | | | 2 | %(1) |
| (3) | Amount is less than $0.01 or $(0.01). |
The accompanying notes are an integral part of these financial statements.
| Year Ended October 31, | |
| 2013 | | | 2012 | | | 2011 | | | 2010 | | | 2009 | |
| | | | | | | | | | | | | | |
| $ | 11.88 | | | $ | 11.13 | | | $ | 10.43 | | | $ | 9.48 | | | $ | 9.11 | |
| | | | | | | | | | | | | | | | | | | |
| | | | | | | | | | | | | | | | | | | |
| | 0.02 | | | | 0.04 | | | | 0.05 | | | | 0.05 | | | | 0.10 | |
| | 1.02 | | | | 0.75 | | | | 0.70 | | | | 0.95 | | | | 0.38 | |
| | 1.04 | | | | 0.79 | | | | 0.75 | | | | 1.00 | | | | 0.48 | |
| | | | | | | | | | | | | | | | | | | |
| | (0.02 | ) | | | (0.04 | ) | | | (0.05 | ) | | | (0.05 | ) | | | (0.11 | ) |
| | — | | | | — | | | | — | | | | — | | | | — | |
| | (0.02 | ) | | | (0.04 | ) | | | (0.05 | ) | | | (0.05 | ) | | | (0.11 | ) |
| $ | 12.90 | | | $ | 11.88 | | | $ | 11.13 | | | $ | 10.43 | | | $ | 9.48 | |
| | | | | | | | | | | | | | | | | | | |
| | 8.77 | % | | | 7.13 | % | | | 7.16 | % | | | 10.53 | % | | | 5.46 | % |
| | | | | | | | | | | | | | | | | | | |
| | | | | | | | | | | | | | | | | | | |
| $ | 12.21 | | | $ | 25.17 | | | $ | 18.02 | | | $ | 12.50 | | | $ | 11.47 | |
| | 1.75 | % | | | 1.54 | % | | | 1.61 | % | | | 1.65 | % | | | 1.73 | % |
| | 0.14 | % | | | 0.34 | % | | | 0.42 | % | | | 0.45 | % | | | 1.17 | % |
| | 22 | % | | | 17 | % | | | 39 | % | | | 57 | % | | | 46 | % |
The accompanying notes are an integral part of these financial statements.
HENNESSY FUNDS 1-800-966-4354
Notes to the Financial Statements
April 30, 2014 (Unaudited)
1). ORGANIZATION
The Hennessy Balanced Fund (the “Fund”) is a series of Hennessy Funds Trust (the “Trust”), which was organized as a Delaware statutory trust on September 17, 1992. The Fund is an open-end management investment company registered under the Investment Company Act of 1940, as amended. The Fund is a successor to a fund with the same name (the “Predecessor Fund”) that was a series of The Hennessy Funds, Inc., a Maryland corporation, pursuant to a reorganization that took place after the close of business on February 28, 2014. Prior to February 28, 2014, the Fund had no investment operations. As a result of the reorganization, holders of the Investor Class shares of the Predecessor Fund received Investor Class shares of the Fund (the Investor Class shares of the Fund are the successor to the accounting and performance information of the Predecessor Fund). The investment objective of the Fund is a combination of capital appreciation and current income. The Fund is a non-diversified fund.
| | The Fund offers Investor Class shares. Prior to October 26, 2012, the Investor Class shares were known as Original Class shares. |
2). SIGNIFICANT ACCOUNTING POLICIES
The following is a summary of significant accounting policies consistently followed by the Fund in the preparation of the financial statements. These policies are in conformity with U.S. generally accepted accounting principles (“GAAP”).
| a). | Investment Valuation – All investments in securities are recorded at their estimated fair value, as described in Note 3. |
| b). | Federal Income Taxes – Provision for Federal income taxes or excise taxes has not been made since the Fund has elected to be taxed as a “regulated investment company” and intends to distribute substantially all of its taxable income to its shareholders and otherwise comply with the provisions of the Internal Revenue Code of 1986, as amended, applicable to regulated investment companies. Net investment income or loss and realized gains and losses for federal income tax purposes may differ from that reported on the financial statements because of temporary book and tax basis differences. Temporary differences are primarily the result of the treatment of wash sales for tax reporting purposes. Distributions from net realized gains for book purposes may include short-term capital gains, which are included as ordinary income to shareholders for tax purposes. |
| c). | Income and Expenses – Dividend income is recognized on the ex-dividend date or as soon as information is available to the Fund. Interest income, which includes the amortization of premium and accretion of discount, is recognized on an accrual basis. The Fund is charged for those expenses that are directly attributable to the portfolio, such as advisory, administration, and certain shareholder service fees. |
| d). | Distributions to Shareholders – Dividends from net investment income for the Fund, if any, are declared and paid out on a calendar quarter basis. Distributions of net realized capital gains, if any, are declared and paid annually, usually in November or December. |
| e). | Security Transactions – Investment and shareholder transactions are recorded on the trade date. The Fund determines the gain or loss realized from the investment |
| | transactions by comparing the original cost of the security lot sold with the net sale proceeds. Discounts and premiums on securities purchased are accreted/amortized over the life of the respective security. |
| f). | Use of Estimates – The preparation of financial statements in conformity with GAAP requires management to make estimates and assumptions that affect the reported amounts of assets and liabilities and disclosure of contingent assets and liabilities at the date of the financial statements and the reported change in net assets during the reporting period. Actual results could differ from those estimates. |
| g). | Share Valuation – The net asset value (“NAV”) per share of the Fund is calculated by dividing the sum of the value of the securities held by the Fund, plus cash or other assets, minus all liabilities (including estimated accrued expenses) by the total number of shares outstanding for the Fund, rounded to the nearest cent. The Fund’s shares will not be priced on days the New York Stock Exchange is closed for trading. The offering and redemption price per share for the Fund is equal to the Fund’s net asset value per share. |
| h). | Foreign Currency – Values of investments denominated in foreign currencies, if any, are converted into U.S. dollars using the spot market rate of exchange at the time of valuation. Purchases and sales of investments and income are translated into U.S. dollars using the spot market rate of exchange prevailing on the respective dates of such transactions. The Fund does not isolate the portion of the results of operations resulting from fluctuations in foreign exchange rates on investments from fluctuations resulting from changes in the market prices of securities held. Such fluctuations are included with the net realized and unrealized gain or loss on investments. Foreign investments present additional risks due to currency fluctuations, economic and political factors, lower liquidity, government regulations, differences in accounting standards, and other factors. |
| i). | Forward Contracts – The Fund may enter into forward currency contracts to reduce its exposure to changes in foreign currency exchange rates on its foreign holdings and to lock in the U.S. dollar cost of firm purchase and sale commitments for securities denominated in foreign currencies. A forward currency contract is a commitment to purchase or sell a foreign currency at a future date at a negotiated forward rate. The gain or loss arising from the difference between the U.S. dollar cost of the original contract and the value of the foreign currency in U.S. dollars upon closing of such contract is included in net realized gain or loss from foreign currency transactions. During the six months ended April 30, 2014, the Fund did not enter into any forward contracts. |
| j). | Repurchase Agreements – The Fund may enter into repurchase agreements with member banks or security dealers of the Federal Reserve Board whom the investment advisor deems creditworthy. The repurchase price generally equals the price paid by the Fund plus interest negotiated on the basis of current short-term rates. |
| | Securities pledged as collateral for repurchase agreements are held by the custodian bank until the respective agreements mature. Provisions of the repurchase agreements ensure that the market value of the collateral, including accrued interest thereon, is sufficient in the event of default of the counterparty. If the counterparty defaults and the value of the collateral declines or if the counterparty enters an insolvency proceeding, realization of the collateral by the Fund may be delayed or limited. |
| k). | Accounting for Uncertainty in Income Taxes – The Fund has adopted accounting policies regarding recognition and measurement of tax positions taken or expected to be taken on a tax return. The Fund has reviewed all open tax years in major jurisdictions and concluded that there is no impact on the Fund’s net assets and no tax liability |
HENNESSY FUNDS 1-800-966-4354
| | resulting from unrecognized tax benefits relating to uncertain income tax positions taken or expected to be taken on a tax return. The Fund’s major tax jurisdictions are U.S. Federal and Delaware. As of April 30, 2014, open Federal and state tax years for the Fund include the tax years ended October 31, 2011 through 2013. |
| l). | Derivatives – The Fund may invest in, or enter into, derivatives, such as options, futures contracts, options on futures contracts, and swaps, for a variety of reasons, including to hedge certain risks, to provide a substitute for purchasing or selling particular securities, or to increase potential income gain. Derivatives may provide a cheaper, quicker, or more specifically focused way for a Fund to invest than “traditional” securities would. The main purpose of utilizing these derivative instruments is for hedging purposes. |
| | The Fund has adopted the financial accounting reporting rules as required by the Derivatives and Hedging Topic of the Financial Accounting Standards Board Accounting Standards Codification. Under such rules, the Fund is required to include enhanced disclosure that enables investors to understand how and why an entity uses derivatives, how derivatives are accounted for, and how derivatives instruments affect an entity’s results of operations and financial position. During the six months ended April 30, 2014, the Fund did not hold any derivative instruments. |
| m). | Events Subsequent to the Fiscal Period End – The Fund has adopted financial reporting rules regarding subsequent events that require an entity to recognize in the financial statements the effects of all subsequent events that provide additional evidence about conditions that existed at the date of the balance sheet. Management has evaluated the Fund’s related events and transactions that occurred subsequent to April 30, 2014 through the date of issuance of the Fund’s financial statements. There were no events or transactions that occurred during this period that materially impacted the amounts or disclosures in the Fund’s financial statements. |
3). SECURITIES VALUATION |
| The Fund has adopted authoritative fair valuation accounting standards that establish an authoritative definition of fair value and set out a hierarchy for measuring fair value. These standards require additional disclosures about the various inputs and valuation techniques used to develop the measurements of fair value and a discussion in changes in valuation techniques and related inputs during the period. These inputs are summarized in the three broad levels listed below: |
| | Level 1 – | Quoted unadjusted prices for identical instruments in active markets to which the Fund has access at the date of measurement. |
| | Level 2 – | Quoted prices for similar instruments in active markets; quoted prices for identical or similar instruments in markets that are not active; and model-derived valuations in which all significant inputs and significant value drivers are observable in active markets. Level 2 inputs are those in markets for which there are few transactions, the prices are not current, the prices are fair value adjusted due to post-market close subsequent events (foreign markets), little public information exists, or instances where prices vary substantially over time or among brokered market makers. These inputs may also include interest rates, prepayment speeds, credit risk curves, default rates, and similar data. |
| | Level 3 – | Model-derived valuations in which one or more significant inputs or significant value drivers are unobservable. Unobservable inputs are those inputs that reflect the Fund’s own assumptions about what market participants would use to price the asset or liability based on the best available information. |
Following is a description of the valuation techniques applied to the Fund’s major categories of assets and liabilities measured at fair value on a recurring basis.
Equity Securities – Equity securities, including common stocks, preferred stocks, foreign issued common stocks, exchange traded funds, closed-end mutual funds, and real estate investment trusts, that are traded on a securities exchange for which a last-quoted sales price is readily available will be valued at the last sales price as reported by the primary exchange on which the securities are listed. Securities listed on The NASDAQ Stock Market (“NASDAQ”) will be valued at the NASDAQ Official Closing Price, which may differ from the last sales price reported. Securities traded on a securities exchange for which a last-quoted sales price is not readily available will be valued at the mean between the bid and ask prices. To the extent these securities are actively traded and valuation adjustments are not applied, they are classified in Level 1 of the fair value hierarchy.
Investment Companies – Investments in investment companies (e.g., mutual funds and exchange traded funds) are generally priced at the ending NAV provided by the Fund’s service agent and will be classified in Level 1 of the fair value hierarchy.
Debt Securities – Debt securities, including corporate bonds, asset-backed securities, mortgage-backed securities, municipal bonds, U.S. Treasuries, and U.S. government agency issues, are valued at market on the basis of valuations furnished by an independent pricing service that utilizes both dealer-supplied valuations and formula-based techniques. The pricing service may consider recently executed transactions in securities of the issuer or comparable issuers, market price quotations (where observable), bond spreads, and fundamental data relating to the issuer. In addition, the model may incorporate market observable data such as reported sales of similar securities, broker quotes, yields, bids, offers, and reference data. Certain securities are valued principally using dealer quotations. These securities are generally classified in Level 2 of the fair value hierarchy.
Short-Term Securities – Short-term equity investments, including money market funds, are valued in the manner specified above. Short-term debt investments are valued at amortized cost, if their original maturity was 60 days or less, or by amortizing the values as of the 61st day prior to maturity, if their original term to maturity exceeded 60 days. Short-term securities are generally classified in Level 1 or Level 2 of the fair market hierarchy depending on the inputs used and market activity levels for specific securities.
The Board of Trustees of the Fund (the “Board”) has adopted fair value pricing procedures that are followed when a price for a security is not readily available or if a significant event has occurred that indicates the closing price of a security no longer represents the true value of that security. Fair value pricing determinations are made in good faith in accordance with these procedures. There are numerous criteria that will be given consideration in determining a fair value of a security. Some of these criteria are trading volume of security and markets, the value of other like securities, and news events with direct bearing to security or market. Fair value pricing results in an estimated price that reasonably reflects the current market conditions in order to rate the portfolio holdings such that shareholder transactions receive a fair net asset value. Depending on the relative significance of the valuation inputs, these securities may be classified in either Level 2 or Level 3 of the fair value hierarchy.
Fair valuing of foreign securities may be determined with the assistance of a pricing service using correlations between the movement of prices of such securities and indices of domestic securities and other appropriate indicators, such as closing market prices of relevant American Depositary Receipts or futures contracts. The effect of using fair value pricing is that the Fund’s NAV will reflect the affected portfolio securities’ value as
HENNESSY FUNDS 1-800-966-4354
determined in the judgment of the Board or its designee instead of being determined by the market. Using a fair value pricing methodology to price foreign securities may result in a value that is different from a foreign security’s most recent closing price and from the prices used by other investment companies to calculate their net asset values and are generally considered Level 2 prices in the fair valuation hierarchy. Because the Fund may invest in foreign securities, the value of the Fund’s portfolio securities may change on days when you will not be able to purchase or redeem your shares.
The Board has delegated day-to-day valuation matters to a Valuation Committee comprised of one or more representatives from Hennessy Advisors, Inc., the Fund’s investment advisor. The function of the Valuation Committee is to value securities where current and reliable market quotations are not readily available. All actions taken by the Valuation Committee are reviewed by the Board.
The Fund has performed an analysis of all existing investments to determine the significance and character of all inputs to their fair value determination. Various inputs are used in determining the value of the Fund’s investments. The inputs or methodology used for valuing securities are not necessarily an indication of the risk associated with investing in those securities. Details related to the fair valuation hierarchy of the Fund’s securities as of April 30, 2014 are included in the Fund’s Schedule of Investments.
4). INVESTMENT TRANSACTIONS
Purchases and sales of investment securities (excluding government and short-term investments) for the Fund during the six months ended April 30, 2014 were $152,132 and $805,900, respectively.
Purchases and sales/maturities of long-term U.S. Government Securities for the Fund were $0 and $2,000,000, respectively, during the six months ended April 30, 2014.
5). INVESTMENT MANAGEMENT FEE AND OTHER TRANSACTIONS WITH AFFILIATES
Hennessy Advisors, Inc. (the “Advisor”) is the investment advisor of the Fund. The Advisor provides the Fund with investment management services under an Investment Advisory Agreement. The Advisor furnishes all investment advice, office space, facilities, and provides most of the personnel needed by the Fund. As compensation for its services, the Advisor is entitled to a monthly fee from the Fund. The fee is based upon the average daily net assets of the Fund at the annual rate of 0.60%. The net investment advisory fees payable for the Fund as of April 30, 2014 were $5,859.
The Board has approved a Shareholder Servicing Agreement for the Fund, which was instituted to compensate the Advisor for the non-investment management services it provides to the Fund. The Shareholder Servicing Agreement provides for a monthly fee paid to the Advisor at an annual rate of 0.10% of the average daily net assets of the Fund. Shareholder servicing fees payable for the Fund as of April 30, 2014 were $978.
The Fund has adopted a plan pursuant to Rule 12b-1 under the Investment Company Act of 1940, as amended, that authorizes payments in connection with the distribution of the Fund’s shares at an annual rate of up to 0.15% of the Fund’s average daily net assets. Amounts paid under the plan may be spent on any activities or expenses primarily intended to result in the sale of shares, including but not limited to, advertising, compensation for sales and marketing activities or financial institutions and others such as dealers and distributors, shareholder account servicing, the printing and mailing of prospectuses to other than current shareowners, and the printing and mailing of sales literature.
The Fund has entered into agreements with various brokers, dealers, and financial intermediaries in connection with the sale of shares of the Fund. The agreements provide
for periodic payments by the Fund to the brokers, dealers, and financial intermediaries for providing certain shareholder maintenance services (sub-transfer agent expenses). These shareholder services include the pre-processing and quality control of new accounts, shareholder correspondence, answering customer inquiries regarding account status, and facilitating shareholder telephone transactions. Fees paid by the Fund to various brokers, dealers, and financial intermediaries for the six months ended April 30, 2014 were $4,475.
U.S. Bancorp Fund Services, LLC (“USBFS”) provides the Fund with administrative, fund accounting, and transfer agent services, including all regulatory reporting, and necessary office equipment and personnel. As administrator, USBFS prepares various federal and state regulatory filings, reports, and returns for the Fund; prepares reports and materials to be supplied to the Board; monitors the activities of the Fund’s custodian, transfer agent, and accountants; and coordinates the preparation and payment of the Fund’s expenses and reviews the Fund’s expense accruals. Fees paid to USBFS for the six months ended April 30, 2014 were $11,911.
U.S. Bank, N.A., an affiliate of USBFS, serves as the Fund’s custodian. Quasar Distributors, LLC acts as the Fund’s principal underwriter in a continuous public offering of the Fund’s shares. Quasar Distributors, LLC is an affiliate of USBFS and U.S. Bank, N.A.
6). LINE OF CREDIT
The Fund has a line of credit with the other funds in the Hennessy Funds family of funds (the “Hennessy Funds”) in the amount of the lesser of (i) $100,000,000 or (ii) 33.33% of each Hennessy Fund’s net assets, or 30% for the Hennessy Gas Utility Index Fund and 10% for the Hennessy Balanced Fund, intended to provide short-term financing, if necessary, subject to certain restrictions, in connection with shareholder redemptions. The credit facility is with the Hennessy Funds’ custodian bank, U.S. Bank, N.A. Borrowings under this arrangement bear interest at the bank’s prime rate. During the six months ended April 30, 2014, the Fund did not have any borrowings outstanding under the line of credit.
7). FEDERAL TAX INFORMATION
As of October 31, 2013, the Fund’s most recent fiscal year end, the components of accumulated earnings (losses) for income tax purposes for the Fund were as follows:
| | Cost of investments for tax purposes | | $ | 11,290,839 | |
| | Gross tax unrealized appreciation | | $ | 970,611 | |
| | Gross tax unrealized depreciation | | | (21,637 | ) |
| | Net tax unrealized appreciation/depreciation | | $ | 948,974 | |
| | Undistributed ordinary income | | $ | — | |
| | Undistributed long-term capital gains | | | 413,650 | |
| | Total distributable earnings | | $ | 413,650 | |
| | Other accumulated gain (loss) | | $ | — | |
| | Total accumulated gain (loss) | | $ | 1,362,624 | |
The difference between book-basis and tax-basis unrealized appreciation is attributable primarily to capital loss carry overs, wash sales, and partnership adjustments.
At October 31, 2013, the Fund’s most recent fiscal year end, the Fund had no tax basis capital losses to offset future capital gains.
During the year ended October 31, 2013, the Fund’s most recent fiscal year end, the capital loss carry forwards utilized for the Fund were $1,233,401.
HENNESSY FUNDS 1-800-966-4354
Capital losses sustained in the year ended October 31, 2012 and in future taxable years will not expire and may be carried over by the Fund without limitation; however, they will retain the character of the original loss. Furthermore, any losses incurred during those taxable years will be required to be utilized prior to the losses incurred in the pre-enactment taxable years. As a result of this ordering rule, pre-enactment capital loss carryforwards may be more likely to expire unused. Under pre-enactment law, capital losses could be carried forward for eight years, and carried forward as short-term capital losses, irrespective of the character of the original loss.
At October 31, 2013, the Fund did not defer, on a tax basis, any post-December late year ordinary loss deferrals or post-December loss deferrals.
The tax character of distributions paid during fiscal year 2014 (year-to-date) and fiscal year 2013 for the Fund were as follows:
| | | | Six Months Ended | | | Year Ended | |
| | | | April 30, 2014 | | | October 31, 2013 | |
| | Ordinary income | | $ | 3,209 | | | $ | 22,605 | |
| | Long-term capital gain | | | 413,659 | | | | 485 | |
| | | | $ | 416,868 | | | $ | 23,090 | |
8). AGREEMENT AND PLAN OF REORGANIZATION
On December 11, 2013, the Board approved an Agreement and Plan of Reorganization (the “Agreement”), of the Hennessy Balanced Fund (the “New Fund”), pursuant to which the New Fund would be a successor to the corresponding series of the same name of The Hennessy Funds, Inc., a Maryland corporation (the “Predecessor Fund”). The Agreement provided for the transfer of assets of the Predecessor Fund to the New Fund and the assumption of the liabilities of the Predecessor Fund by the New Fund. The New Fund had the same investment objective and substantially similar principal investment strategies as the Predecessor Fund. The reorganization was effective as of the close of business on February 28, 2014. The following table illustrates the specifics of the reorganization:
| | | Shares of the New Fund | | | |
| | Predecessor Fund | Issued to Shareholders of | New Fund | Combined | Tax Status |
| | Net Assets | the Predecessor Fund | Net Assets | Net Assets | of Transfer |
| | $11,886,699(1) | 945,038 | $11,886,699 | $11,886,699 | Non-taxable |
| | (1) | Included accumulated realized gains and unrealized appreciation in the amounts of $426,205 and $1,031,787, respectively. |
Expense Example (Unaudited)
April 30, 2014
As a shareholder of the Fund, you incur two types of costs: (1) transaction costs, including sales charges (loads) on purchase payments, reinvested dividends, or other distributions; redemption fees; and exchange fees; and (2) ongoing costs, including management fees; service fees; and other Fund expenses. This Example is intended to help you understand your ongoing costs (in dollars) of investing in the Fund and to compare these costs with the ongoing costs of investing in other mutual funds. The Example is based on an investment of $1,000 invested at the beginning of the period and held for the entire period from November 1, 2013 through April 30, 2014.
Actual Expenses
The first line of the table below provides information about actual account values and actual expenses. Although the Fund charges no sales loads or transaction fees, you will be assessed fees for outgoing wire transfers, returned checks and stop payment orders at prevailing rates charged by U.S. Bancorp Fund Services, LLC, the Fund’s transfer agent. If you request that a redemption be made by wire transfer, currently a $15.00 fee is charged by the Fund’s transfer agent. IRA accounts will be charged a $15.00 annual maintenance fee. The example below includes, but is not limited to, management fees, shareholder servicing fees, fund accounting, custody, and transfer agent fees. However, the example below does not include portfolio trading commissions and related expenses, and other extraordinary expenses as determined under generally accepted accounting principles. You may use the information in this line, together with the amount you invested, to estimate the expenses that you paid over the period. Simply divide your account value by $1,000 (for example, an $8,600 account value divided by $1,000 = 8.6), then multiply the result by the number in the first line of the table under the heading entitled “Expenses Paid During Period” to estimate the expenses you paid on your account during this period.
Hypothetical Example for Comparison Purposes
The second line of the table below provides information about hypothetical account values and hypothetical expenses based on the Fund’s actual expense ratios and an assumed rate of return of 5% per year before expenses, which is not the Fund’s actual return. The hypothetical account values and expenses may not be used to estimate the actual ending account balance or expenses you paid for the period. You may use this information to compare the ongoing costs of investing in the Fund and other funds. To do so, compare this 5% hypothetical example with the 5% hypothetical examples that appear in the shareholder reports of the other funds. Please note that the expenses shown in the table are meant to highlight your ongoing costs only and do not reflect any transactional costs, such as sales charges (loads), or exchange fees. Therefore, the second line of the table is useful in comparing ongoing costs only, and will not help you determine the relative total costs of owning different funds. In addition, if these transactional costs were included, your costs would have been higher.
HENNESSY FUNDS 1-800-966-4354
| | | | Expenses Paid |
| | Beginning | Ending | During Period(1) |
| | Account Value | Account Value | November 1, 2013 – |
| | November 1, 2013 | April 30, 2014 | April 30, 2014 |
| Investor Class | | | |
| | | | |
| Actual | $1,000.00 | $1,032.20 | $9.37 |
| | | | |
| Hypothetical (5% return | | | |
| before expenses) | $1,000.00 | $1,015.57 | $9.30 |
| (1) | Expenses are equal to the Fund’s annualized expense ratio of 1.86%, multiplied by the average account value over the period, multiplied by 181/365 days (to reflect one-half year period). |
Proxy Voting
A description of the policies and procedures the Fund uses to determine how to vote proxies relating to portfolio securities is available without charge: (1) by calling 1-800-966-4354; (2) on the Hennessy Funds’ website at hennessyfunds.com; or (3) on the U.S. Securities and Exchange Commission’s (the “SEC”) website at www.sec.gov. The Fund’s proxy voting record is available on both the Hennessy Funds’ website at hennessyfunds.com and the SEC’s website at www.sec.gov no later than August 31 for the prior 12 months ending June 30.
Quarterly Filings on Form N-Q
The Fund files its complete schedule of portfolio holdings with the SEC for the first and third quarters of each fiscal year on Form N-Q. The Fund’s Forms N-Q are available on the SEC’s website at www.sec.gov. The Fund’s Forms N-Q may be reviewed and copied at the SEC’s Public Reference Room in Washington, DC and information on the operation of the Public Reference Room may be obtained by calling 1-800-SEC-0330. Information included in the Fund’s Forms N-Q will also be available upon request by calling 1-800-966-4354.
Federal Tax Distribution Information
(Unaudited)
For the fiscal year ended October 31, 2013, certain dividends paid by the Fund may be subject to a maximum tax rate of 15%, as provided for by the Jobs and Growth Tax Relief Reconciliation Act of 2003. The percentage of dividends declared from ordinary income designated as qualified dividend income was 100.00%.
For corporate shareholders, the percent of ordinary income distributions qualifying for the corporate dividends received deduction for the fiscal year ended October 31, 2013 was 100.00%.
The percentage of taxable ordinary income distributions that are designated as short-term capital gain distributions under Section 871(k)(2)(C) of the Internal Revenue Code of 1986, as amended, for the Fund was 0.00%.
Householding
To help keep the Fund’s costs as low as possible, we generally deliver a single copy of most financial reports and prospectuses to shareholders who share an address, even if the accounts are registered under different names. This process, known as “householding,” does not apply to account statements. You may, of course, request an individual copy of a prospectus or financial report at any time. If you would like to receive separate mailings, please call the Administrator at 1-800-261-6950 or 1-414-765-4124 and we will begin individual delivery within 30 days of your request. If your account is held through a financial institution or other intermediary, please contact them directly to request individual delivery.
HENNESSY FUNDS 1-800-966-4354
Board Approval of Investment Advisory
Agreement
At its meeting on December 4, 2013, the Board of Trustees of the Fund (the “Board”) unanimously approved the investment advisory agreement of the Fund for an initial period of two years.
The Board reviewed a number of documents, including a memorandum provided by outside legal counsel that described the fiduciary duties of the Board with respect to approving the investment advisory agreement and the relevant factors for consideration, the Advisor’s most recent Form 10-K, a copy of the advisory agreement, a fund fact sheet, and peer expense and performance comparisons. The Board considered and discussed numerous factors, including the following:
| | • | The Board considered the services identified below that are provided by the Advisor: |
| | | • | The Advisor acts as portfolio manager for the Fund. In this capacity, the Advisor manages the composition of the portfolio of the Fund, including the purchase, retention, and disposition of portfolio securities in accordance with the Fund’s investment objectives, policies, and restrictions. |
| | | • | The Advisor oversees distribution of the Fund through third-party broker/dealers and independent financial institutions such as Charles Schwab, Inc., Fidelity, TD Waterhouse, and Pershing. The Advisor participates in “no transaction fee” (“NTF”) programs with these companies on behalf of the Fund, which allows customers to purchase the Fund through third-party distribution channels without paying a transaction fee. The Advisor compensates a number of these third-party providers of NTF programs out of its own revenues and not those of the Fund. |
| | | • | The Advisor oversees service providers that support the Fund in providing fund accounting, fund administration, fund distribution, transfer agency, and custodial services. |
| | • | The Board considered that the advisory services to be provided by the Advisor are services required for the operation of the Fund. |
| | • | The Board considered the nature and quality of the advisory services offered by the Advisor to the Fund. |
| | • | The Board considered that the terms of the advisory agreement are fair and reasonable. |
| | • | The Board compared the performance of the Fund to benchmark indices over various periods of time and concluded that the positive performance of the Fund warranted the approval of the advisory agreement. |
| | • | The Board reviewed the Fund’s expense ratio and comparable expense ratios for funds comparable to the Fund. The Board used data from Morningstar showing funds similar in asset size and investment objective to the Fund and determined that the expense ratio of the Fund falls within the range of the ratios of other comparable funds and concluded that the expenses of the Fund were reasonable. |
| | • | The Board considered the fees charged by the Advisor to those of funds similar in asset size and investment objective to the Fund and concluded the advisory fee of the Fund was reasonable and warranted approval of the advisory agreement. |
| | • | The Board considered the profitability of the Advisor with respect to the Fund and concluded the profits were reasonable and not excessive when compared to profitability guidelines set forth in relevant court cases. |
| | • | The Board considered the high level of professionalism and knowledge of the Advisor’s employees, along with an extremely low level of turnover of the employees of the Advisor, and concluded that this was beneficial to the Fund and its shareholders, as it ensures that the Fund is operated efficiently. |
All of the factors above were considered separately by the Board, including the Trustees who are not “interested persons” (as defined in the Investment Company Act of 1940, as amended) of the Fund (the “Independent Trustees”) meeting in an executive session. The factors were viewed in their totality by the Board, with no single factor being the principal or determinative factor in the Board’s determination of whether to approve the advisory agreement. Based on the factors discussed above, the Board, including all of the Independent Trustees, recommended approval of the advisory agreement.
HENNESSY FUNDS 1-800-966-4354
(This Page Intentionally Left Blank.)
For information, questions or assistance, please call
The Hennessy Funds
1-800-966-4354 or 1-415-899-1555
INVESTMENT ADVISOR
Hennessy Advisors, Inc.
7250 Redwood Blvd., Suite 200
Novato, California 94945
ADMINISTRATOR,
TRANSFER AGENT,
DIVIDEND PAYING AGENT &
SHAREHOLDER SERVICING AGENT
U.S. Bancorp Fund Services, LLC
P.O. Box 701
Milwaukee, Wisconsin 53201-0701
CUSTODIAN
U.S. Bank N.A.
Custody Operations
1555 North River Center Dr., Suite 302
Milwaukee, Wisconsin 53212
TRUSTEES
Neil J. Hennessy
Robert T. Doyle
J. Dennis DeSousa
Gerald P. Richardson
COUNSEL
Foley & Lardner LLP
777 East Wisconsin Avenue
Milwaukee, Wisconsin 53202-5306
INDEPENDENT REGISTERED
PUBLIC ACCOUNTING FIRM
KPMG LLP
777 East Wisconsin Avenue
Milwaukee, Wisconsin 53202-5306
DISTRIBUTOR
Quasar Distributors, LLC
615 East Michigan Street
Milwaukee, Wisconsin 53202
hennessyfunds.com | 1-800-966-4354
This report has been prepared for shareholders and may be distributed to
others only if preceded or accompanied by a current prospectus.
SEMI-ANNUAL REPORT
APRIL 30, 2014
HENNESSY CORE BOND FUND
Investor Class HCBFX
Institutional Class HCBIX
hennessyfunds.com | 1-800-966-4354
(This Page Intentionally Left Blank.)
Contents
| Letter to Shareholders | 2 |
| Performance Overview | 4 |
| Financial Statements | |
| Schedule of Investments | 6 |
| Statement of Assets and Liabilities | 11 |
| Statement of Operations | 12 |
| Statements of Changes in Net Assets | 14 |
| Financial Highlights | 16 |
| Notes to the Financial Statements | 20 |
| Expense Example | 27 |
| Proxy Voting | 29 |
| Quarterly Filings on Form N-Q | 29 |
| Federal Tax Distribution Information | 29 |
| Householding | 29 |
| Board Approval of Investment Advisory Agreements | 30 |
HENNESSY FUNDS 1-800-966-4354
Dear Shareholder:
The financial markets have provided strong returns over the past six-months ended April 30, 2014, with the Dow Jones Industrial Average (DJIA) and S&P 500 both returning approximately 8% during the period. The current valuation metrics of the major indices are solid; for example, the DJIA currently has a price-to-earnings ratio of 15x and a price-to-sales ratio of 1.75x. The DJIA also has a dividend yield of 2.2%, which is nearly as high as that of a 10-Year U.S. Treasury, which is currently yielding 2.6%. Investing in high-yielding, high-quality DJIA stocks have the potential to not only provide an income stream but also for stock price appreciation as well. Fixed income investing has run its course, in my opinion, and many individuals are currently benefiting from the return to investing in equities that possess strong fundamentals.
U.S. corporations continue to drive shareholder value by making acquisitions, initiating and raising dividends, investing in internal infrastructure, and buying back stock. However, lately I have begun to see a shift in those business strategies. The easier-to-execute acquisitions seem to be a thing of the past, and firms now have to be even more creative to execute accretive deals. I also believe that while firms may continue to initiate dividends, fewer firms will raise their dividends and fewer firms will participate in stock buyback programs going forward. So what will these cash-rich companies do with their capital if they are not raising dividends or buying back stock? I believe we will see companies begin to initiate capital expenditure programs.
Due to the continuing uncertainty from a lack of clear policies on taxes, healthcare, and regulations, I have observed that corporations would rather wait for clarity from our government leaders and defer any significant changes to their current business models. Up until this point, there has been no real cost for firms to defer spending their capital as they wait for anticipated guidance on policies that directly affect their businesses. But, this economic handcuffing from all of this uncertainty has gone on long enough. I believe there will now be firms who want to improve their margins and will begin spending money to expand their sales, and may even begin to hire. Once a competitor begins to move in this way, then the cost to defer becomes real for companies. This movement to expansion may well be a catalyst to propel the financial markets. I do believe this will be a slow shift, but one that will keep the economy improving, and should, in my opinion, help to generate reasonable market returns over the next few years.
With almost $3 trillion in cash sitting on the sidelines, this strategic shift by companies to begin spending their idle capital should help the economic recovery in the U.S. But that is only one part of the equation. Washington politics still play a role in how strong that recovery will be. The national political landscape will change in the next few years, and the future generation of elected officials will be faced with what I believe are fictitious unemployment figures (6.3% reported, when over 20 million Americans are looking for more work or a better job), a sluggish economy, and global competition in business. The next regime needs to provide real clarity on the issues that face all Americans and American corporations: taxation, regulation, and how to pay for our new healthcare system. I also believe that our government needs to regard business as a noble profession and to implement common sense and logic in their policy making instead of politics as usual. As Confucius is quoted as saying, “Life is really simple, but we insist on making it complicated.”
I am confident that even with all the hurdles facing corporate America, companies continue to provide good value for their shareholders, and I believe that means the financial markets are in good shape and should remain strong moving forward, I also believe that the next few months may be volatile. Fads come and go, and the current buzz on the Street is around investing in social media stocks. I believe that chasing hot products has contributed and will continue to contribute to the volatility of the markets this year. After over 35 years in the business, I still firmly believe the best way to position your portfolio is by investing in good companies over the long term, rather than trying to buy the next hot idea at exactly the right time. At Hennessy Funds, hunches and fads have no place in our investment process, and we understand that successful investing comes from time in the market, not timing the market.
We remain focused on investing based on proven fundamentals, and we are committed to managing money for the sole benefit of our shareholders. If you have any questions or want to speak with us directly, please don’t hesitate to call us at (800) 966-4354.
Best regards,
Neil J. Hennessy
President and Chief Investment Officer
Past performance does not guarantee future results.
Mutual fund investing involves risk. Principal loss is possible.
Opinions expressed are those of Neil Hennessy and are subject to change, are not guaranteed and should not be considered investment advice.
The Dow Jones Industrial Average and S&P 500 are unmanaged indices commonly used to measure the performance of U.S. stocks. One cannot invest directly in an index.
Price-to-sales ratio and price-to-earnings ratio are tools for calculating relative valuation. Price-to-sales ratio is calculated by dividing the market price by revenue per share. Price-to-earnings ratio is the market price per share divided by earnings per share.
HENNESSY FUNDS 1-800-966-4354
Performance Overview (Unaudited)
The opinions expressed in the following commentary reflect those of the Portfolio Managers as of the date written. Any such opinions are subject to change based on market or other conditions and are not guaranteed. These opinions may not be relied upon as investment advice. Investment decisions for the Fund are based on several factors, and may not be relied upon as an indication of trading intent on behalf of the Fund. Security positions can and do change.
AVERAGE ANNUAL TOTAL RETURN PERIODS ENDED APRIL 30, 2014
| | Six | One | Five | Ten |
| | Months(1) | Year | Years | Years |
| Hennessy Core Bond Fund – | | | | |
| Investor Class (HCBFX) | 1.33% | 0.36% | 5.76% | 4.83% |
| Hennessy Core Bond Fund – | | | | |
| Institutional Class (HCBIX) | 1.39% | 0.61% | 6.02% | 5.09% |
| Barclays Capital Intermediate | | | | |
| U.S. Government/Credit Index | 0.88% | -0.24% | 4.19% | 4.24% |
| Expense ratios: | Gross 2.37%, Net 1.41%(2) (Investor Class); |
| | Gross 1.78%, Net 1.16%(2) (Institutional Class) |
Performance data quoted represents past performance; past performance does not guarantee future results. The investment return and principal value of an investment will fluctuate so that an investor’s shares, when redeemed, may be worth more or less than their original cost. Current performance of the fund may be lower or higher than the performance quoted. Performance data current to the most recent month end may be obtained by visiting hennessyfunds.com. Performance for the period from March 12, 2010 to October 26, 2012 is that of the FBR Core Bond Fund and for the periods prior to March 12, 2010 is that of the AFBA 5 Star Total Return Bond Fund.
The expense ratios presented are from the most recent prospectus.
| (1) | Periods less than one year are not annualized. |
| (2) | The Fund’s investment advisor has contractually agreed to waive a portion of its expenses through February 28, 2015. |
PERFORMANCE NARRATIVE
FINANCIAL COUNSELORS, INC., SUB-ADVISOR
Portfolio Managers Gary B. Cloud, CFA, and Peter G. Greig, CFA, Financial Counselors, Inc. (sub-advisor)
Over the previous six months, how did the Fund perform and what factors contributed to this performance?
For the six-month period ended April 30, 2014, the Investor Class of the Hennessy Core Bond Fund returned 1.33%, outperforming the Barclays Capital Intermediate U.S. Government/Credit Index, which returned 0.88% for the same period, and underperforming the Morningstar Intermediate Term Bond Category Average, which returned 2.05% for the same period.
A pro-cyclical asset allocation in the Fund helped performance relative to its primary benchmark due to an overweight position in Corporate bonds and an underweight position in U.S. Treasury securities. Higher yielding fixed income securities in the portfolio boosted the interest income component of total return, adding to performance. The biggest boost to the Fund’s relative performance came from Fixed Income sector asset
allocation and individual issue selection, while the amortization and roll effect had the largest negative impact on Fund performance.
Additional Portfolio Manager commentary and related investment outlook:
Long-term government bond yields confounded the pessimists and dropped sharply during the six-month period. The yield curve flattened noticeably as short term rates brought forward the first interest rate hike and longer maturities priced in a more benign inflation environment. The net result was almost an entire retracement of last years’ negative return for the major investment grade bond indices over the last 180 days.
We believe that potential GDP continues to be in the 2.00% to 2.50% range and the U.S. economy will have a hard time overheating. We believe China and Japan are both looking weaker this year, and Europe seems to be relegated to 1.00% trend growth. We expect that emerging market economies will likely weigh on global growth due to the need to rebalance their economies through lower current account deficits and higher short-term interest rates.
We believe geopolitical tensions, subpar U.S. economic growth, and weak personal income growth will likely weigh on inflation pressures for the rest of this year. We expect interest rates to remain stubbornly low over the near term and perhaps end the year about where they started 2014. We believe short-term interest rates will move higher sometime in the next few years, but we do not expect that to happen over the next two quarters.
The Barclays Capital Intermediate U.S. Government/Credit Index is an unmanaged index commonly used to measure the performance of U.S. bonds. You cannot invest directly in an index. Performance data for an index does not reflect any deductions for fees, expenses or taxes. The Fund may invest in debt securities, which typically decrease in value when interest rates rise. The risk is greater for longer term debt securities. Investments by the Fund in lower-rated and non-rated securities presents a greater risk of loss to principal and interest than higher-rated securities. Investments in Asset-Backed and Mortgage-Backed securities include additional risks that investors should be aware of including credit risk, prepayment risk, possible illiquidity and default, as well as increased susceptibility to adverse economic developments. Investments in foreign securities may involve greater volatility and political, economic and currency risk and differences in accounting methods. The Fund may invest in IPOs, which may fluctuate considerably due to the absence of a prior public market and may have a magnified impact on the Fund. Fund holdings and sector allocations are subject to change. Please refer to the Schedule of Investments included in this report for additional portfolio information.
Each Morningstar category average represents a universe of funds with similar investment objectives. © Morningstar, Inc. All Rights Reserved. The information contained herein: 1) is proprietary to Morningstar; 2) may not be copied or distributed and 3) is not warranted to be accurate, complete or timely. Neither Morningstar nor its content providers are responsible for any damages or losses arising from any use of this information. Past performance does not guarantee future results.
HENNESSY FUNDS 1-800-966-4354
Schedule of Investments
HENNESSY CORE BOND FUND
As of April 30, 2014 (Unaudited)
(% of Net Assets)
| | TOP TEN HOLDINGS (EXCLUDING CASH/CASH EQUIVALENTS) | % NET ASSETS |
| | Federal National Mortgage Association 3.000%, 08/01/2042 | 8.14% |
| | U.S. Treasury Note, 3.250%, 03/31/2017 | 7.80% |
| | U.S. Treasury Note, 2.500%, 08/15/2023 | 6.76% |
| | Ford Motor Credit Co. LLC 3.000%, 06/12/2017 | 5.73% |
| | The Royal Bank of Scotland PLC – ADR 4.375%, 03/16/2016 | 5.00% |
| | Manulife Financial Corp. – ADR 3.400%, 09/17/2015 | 4.88% |
| | Associates Corporation of North America 6.950%, 11/01/2018 | 4.65% |
| | Sempra Energy 6.500%, 06/01/2016 | 4.35% |
| | Agilent Technologies, Inc. 5.000%, 07/15/2020 | 4.30% |
| | Associated Banc-Corp 5.125%, 03/28/2016 | 4.18% |
Note: For presentation purposes, the Fund has grouped some of the industry categories. For purposes of categorizing securities for compliance with Section 8(b)(1) of the Investment Company Act of 1940, the Fund uses more specific industry classifications.
| | PREFERRED STOCKS – 1.28% | | Number | | | | | | % of | |
| | | | of Shares | | | Value | | | Net Assets | |
| | Financials – 1.28% | | | | | | | | | |
| | Fannie Mae Preferred (a) | | | 7,900 | | | $ | 81,370 | | | | 1.28 | % |
| | | | | | | | | | | | | | |
| | Total Preferred Stocks | | | | | | | | | | | | |
| | (Cost $197,500) | | | | | | | 81,370 | | | | 1.28 | % |
| | | | | | | | | | | | | | |
| | REITS – 1.60% | | | | | | | | | | | | |
| | Apollo Commercial Real Estate Finance, Inc. | | | 6,000 | | | | 102,060 | | | | 1.60 | % |
| | | | | | | | | | | | | | |
| | Total REITS | | | | | | | | | | | | |
| | (Cost $99,679) | | | | | | | 102,060 | | | | 1.60 | % |
| | | | | | | | | | | | | | |
| | CORPORATE BONDS – 56.73% | | Par | | | | | | | % of | |
| | | | Amount | | | Value | | | Net Assets | |
| | Consumer Discretionary – 10.10% | | | | | | | | | | | | |
| | Ford Motor Credit Co. LLC | | | | | | | | | | | | |
| | 3.000%, 06/12/2017 | | | 350,000 | | | | 365,329 | | | | 5.73 | % |
| | Royal Caribbean Cruises Ltd. – ADR (c) | | | | | | | | | | | | |
| | 7.500%, 10/15/2027 | | | 75,000 | | | | 84,750 | | | | 1.33 | % |
| | YUM! Brands, Inc. | | | | | | | | | | | | |
| | 5.300%, 09/15/2019 | | | 175,000 | | | | 194,280 | | | | 3.04 | % |
| | | | | | | | | 644,359 | | | | 10.10 | % |
| | | | | | | | | | | | | | |
| | Financials – 33.97% | | | | | | | | | | | | |
| | American International Group, Inc. | | | | | | | | | | | | |
| | 5.850%, 01/16/2018 | | | 50,000 | | | | 57,122 | | | | 0.89 | % |
| | Associated Banc-Corp | | | | | | | | | | | | |
| | 5.125%, 03/28/2016 | | | 250,000 | | | | 266,606 | | | | 4.18 | % |
| | Associates Corporation of North America | | | | | | | | | | | | |
| | 6.950%, 11/01/2018 | | | 250,000 | | | | 297,012 | | | | 4.65 | % |
| | Citigroup, Inc. | | | | | | | | | | | | |
| | 6.125%, 11/21/2017 | | | 40,000 | | | | 45,753 | | | | 0.72 | % |
| | Discover Financial Services | | | | | | | | | | | | |
| | 5.200%, 04/27/2022 | | | 175,000 | | | | 190,559 | | | | 2.98 | % |
| | Lazard Group | | | | | | | | | | | | |
| | 6.850%, 06/15/2017 | | | 215,000 | | | | 244,351 | | | | 3.83 | % |
| | Manulife Financial Corp. – ADR (c) | | | | | | | | | | | | |
| | 3.400%, 09/17/2015 | | | 300,000 | | | | 311,234 | | | | 4.88 | % |
| | Prudential Financial, Inc. | | | | | | | | | | | | |
| | 5.500%, 03/15/2016 | | | 198,000 | | | | 214,834 | | | | 3.37 | % |
| | The Hartford Financial Services Group, Inc. | | | | | | | | | | | | |
| | 5.375%, 03/15/2017 | | | 200,000 | | | | 221,333 | | | | 3.47 | % |
The accompanying notes are an integral part of these financial statements.
HENNESSY FUNDS 1-800-966-4354
| | CORPORATE BONDS | | Par | | | | | | % of | |
| | | | Amount | | | Value | | | Net Assets | |
| | Financials (Continued) | | | | | | | | | |
| | The Royal Bank of Scotland PLC – ADR (c) | | | | | | | | | |
| | 4.375%, 03/16/2016 | | | 300,000 | | | $ | 319,320 | | | | 5.00 | % |
| | | | | | | | | 2,168,124 | | | | 33.97 | % |
| | | | | | | | | | | | | | |
| | Health Care – 4.30% | | | | | | | | | | | | |
| | Agilent Technologies, Inc. | | | | | | | | | | | | |
| | 5.000%, 07/15/2020 | | | 250,000 | | | | 274,274 | | | | 4.30 | % |
| | | | | | | | | | | | | | |
| | Information Technology – 2.39% | | | | | | | | | | | | |
| | KLA-Tencor Corp. | | | | | | | | | | | | |
| | 6.900%, 05/01/2018 | | | 130,000 | | | | 152,636 | | | | 2.39 | % |
| | | | | | | | | | | | | | |
| | Materials – 1.62% | | | | | | | | | | | | |
| | El du Pont de Nemours & Co. | | | | | | | | | | | | |
| | 4.750%, 03/15/2015 | | | 100,000 | | | | 103,697 | | | | 1.62 | % |
| | | | | | | | | | | | | | |
| | Utilities – 4.35% | | | | | | | | | | | | |
| | Sempra Energy | | | | | | | | | | | | |
| | 6.500%, 06/01/2016 | | | 250,000 | | | | 277,345 | | | | 4.35 | % |
| | | | | | | | | | | | | | |
| | Total Corporate Bonds | | | | | | | | | | | | |
| | (Cost $3,394,058) | | | | | | | 3,620,435 | | | | 56.73 | % |
| | | | | | | | | | | | | | |
| | MORTGAGE BACKED SECURITIES – 8.14% | | | | | | | | | | | | |
| | Federal National Mortgage Association | | | | | | | | | | | | |
| | 3.000%, 08/01/2042 | | | 531,296 | | | | 519,216 | | | | 8.14 | % |
| | | | | | | | | | | | | | |
| | Total Mortgage Backed Securities | | | | | | | | | | | | |
| | (Cost $547,092) | | | | | | | 519,216 | | | | 8.14 | % |
| | | | | | | | | | | | | | |
| | U.S. GOVERNMENT AGENCY ISSUES – 3.92% | | | | | | | | | | | | |
| | Federal Home Loan Banks | | | | | | | | | | | | |
| | 1.000%, 04/23/2024 | | | 250,000 | | | | 250,317 | | | | 3.92 | % |
| | | | | | | | | | | | | | |
| | Total U.S. Government Agency Issues | | | | | | | | | | | | |
| | (Cost $249,812) | | | | | | | 250,317 | | | | 3.92 | % |
| | | | | | | | | | | | | | |
| | U.S. TREASURY OBLIGATIONS – 16.20% | | | | | | | | | | | | |
| | | | | | | | | | | | | | |
| | U.S. Treasury Bonds – 1.64% | | | | | | | | | | | | |
| | 6.250%, 08/15/2023 | | | 80,000 | | | | 104,850 | | | | 1.64 | % |
| | | | | | | | | | | | | | |
| | Total U.S. Treasury Bonds | | | | | | | | | | | | |
| | (Cost $105,338) | | | | | | | 104,850 | | | | 1.64 | % |
The accompanying notes are an integral part of these financial statements.
| | U.S. TREASURY OBLIGATIONS – 16.20% | | Par | | | | | | % of | |
| | | | Amount | | | Value | | | Net Assets | |
| | U.S. Treasury Notes – 14.56% | | | | | | | | | |
| | 3.250%, 03/31/2017 | | | 465,000 | | | $ | 497,495 | | | | 7.80 | % |
| | 2.500%, 08/15/2023 | | | 435,000 | | | | 431,653 | | | | 6.76 | % |
| | | | | | | | | | | | | | |
| | Total U.S. Treasury Notes | | | | | | | | | | | | |
| | (Cost $930,722) | | | | | | | 929,148 | | | | 14.56 | % |
| | | | | | | | | | | | | | |
| | Total U.S. Treasury Obligations | | | | | | | | | | | | |
| | (Cost $1,036,060) | | | | | | | 1,033,998 | | | | 16.20 | % |
| | | | | | | | | | | | | | |
| | INVESTMENT COMPANIES (EXCLUDING | | Number | | | | | | | % of | |
| | MONEY MARKET FUNDS) – 9.17% | | of Shares | | | Value | | | Net Assets | |
| | | | | | | | | | | | | | |
| | iShares iBoxx $High Yield Corporation Bond Fund | | | 1,600 | | | | 150,944 | | | | 2.36 | % |
| | PowerShares Senior Loan Portfolio | | | 10,000 | | | | 247,400 | | | | 3.88 | % |
| | SPDR Barclays Short Term High Yield | | | 5,000 | | | | 154,800 | | | | 2.43 | % |
| | Wisdomtree Emerging Markets Local Debt Fund | | | 700 | | | | 32,207 | | | | 0.50 | % |
| | | | | | | | | | | | | | |
| | Total Investment Companies (Excluding | | | | | | | | | | | | |
| | Money Market Funds) | | | | | | | | | | | | |
| | (Cost $585,513) | | | | | | | 585,351 | | | | 9.17 | % |
| | | | | | | | | | | | | | |
| | SHORT-TERM INVESTMENTS – 0.65% | | | | | | | | | | | | |
| | | | | | | | | | | | | | |
| | Money Market Funds – 0.65% | | | | | | | | | | | | |
| | Fidelity Government Portfolio – | | | | | | | | | | | | |
| | Institutional Class, 0.01% (b) | | | 41,685 | | | | 41,685 | | | | 0.65 | % |
| | | | | | | | | | | | | | |
| | Total Money Market Funds | | | | | | | | | | | | |
| | (Cost $41,685) | | | | | | | 41,685 | | | | 0.65 | % |
| | | | | | | | | | | | | | |
| | Total Short-Term Investments | | | | | | | | | | | | |
| | (Cost $41,685) | | | | | | | 41,685 | | | | 0.65 | % |
| | | | | | | | | | | | | | |
| | Total Investments | | | | | | | | | | | | |
| | (Cost $6,151,399) – 97.69% | | | | | | | 6,234,432 | | | | 97.69 | % |
| | Other Assets in | | | | | | | | | | | | |
| | Excess of Liabilities – 2.31% | | | | | | | 147,563 | | | | 2.31 | % |
| | TOTAL NET ASSETS – 100.00% | | | | | | $ | 6,381,995 | | | | 100.00 | % |
Percentages are stated as a percent of net assets.
ADR – American Depositary Receipt
| (a) | Non-income producing security. |
| (b) | The rate listed is the fund’s 7-day yield as of April 30, 2014. |
| (c) | U.S. traded security of a foreign corporation. |
The accompanying notes are an integral part of these financial statements.
HENNESSY FUNDS 1-800-966-4354
Summary of Fair Value Exposure at April 30, 2014
The following is a summary of the inputs used to value the Fund’s net assets as of April 30, 2014 (See Note 3 in the accompanying notes to the financial statements):
| | | Level 1 | | | Level 2 | | | Level 3 | | | Total | |
| Preferred Stock | | $ | 81,370 | | | $ | — | | | $ | — | | | $ | 81,370 | |
| REITS | | | | | | | | | | | | | | | | |
| Financials | | $ | 102,060 | | | $ | — | | | $ | — | | | $ | 102,060 | |
| Corporate Bonds | | | | | | | | | | | | | | | | |
| Consumer Discretionary | | $ | — | | | $ | 644,359 | | | $ | — | | | $ | 644,359 | |
| Financials | | | — | | | | 2,168,124 | | | | — | | | | 2,168,124 | |
| Health Care | | | — | | | | 274,274 | | | | — | | | | 274,274 | |
| Information Technology | | | — | | | | 152,636 | | | | — | | | | 152,636 | |
| Materials | | | — | | | | 103,697 | | | | — | | | | 103,697 | |
| Utilities | | | — | | | | 277,345 | | | | — | | | | 277,345 | |
| Total Corporate Bonds | | $ | — | | | $ | 3,620,435 | | | $ | — | | | $ | 3,620,435 | |
| Mortgage Backed Securities | | $ | — | | | $ | 519,216 | | | $ | — | | | $ | 519,216 | |
| U.S. Government Agency Issues | | $ | — | | | $ | 250,317 | | | $ | — | | | $ | 250,317 | |
| U.S. Treasury Obligations | | | | | | | | | | | | | | | | |
| U.S. Treasury Bonds | | $ | — | | | $ | 104,850 | | | $ | — | | | $ | 104,850 | |
| U.S. Treasury Notes | | | — | | | | 929,148 | | | | — | | | | 929,148 | |
| Total U.S. Treasury Obligations | | $ | — | | | $ | 1,033,998 | | | $ | — | | | $ | 1,033,998 | |
| Investment Companies (Excluding | | | | | | | | | | | | | | | | |
| Money Market Funds) | | $ | 585,351 | | | $ | — | | | $ | — | | | $ | 585,351 | |
| Short-Term Investments | | | | | | | | | | | | | | | | |
| Money Market Funds | | $ | 41,685 | | | $ | — | | | $ | — | | | $ | 41,685 | |
| Total Short-Term Investments | | $ | 41,685 | | | $ | — | | | $ | — | | | $ | 41,685 | |
| Total Investments | | $ | 810,466 | | | $ | 5,423,966 | | | $ | — | | | $ | 6,234,432 | |
Transfers between levels are recognized at the end of the reporting period. During the six-month period ended April 30, 2014, the Fund recognized no transfers between levels.
The accompanying notes are an integral part of these financial statements.
Financial Statements
Statement of Assets and Liabilities as of April 30, 2014 (Unaudited) |
| ASSETS: | | | |
| Investments in securities, at value (cost $6,151,399) | | $ | 6,234,432 | |
| Dividends and interest receivable | | | 50,092 | |
| Receivable for fund shares sold | | | 1,768 | |
| Receivable for securities sold | | | 99,367 | |
| Prepaid expenses and other assets | | | 23,124 | |
| Due from advisor | | | 3,949 | |
| Total Assets | | | 6,412,732 | |
| | | | | |
| LIABILITIES: | | | | |
| Payable for fund shares redeemed | | | 155 | |
| Payable to administrator | | | 2,884 | |
| Payable to auditor | | | 9,475 | |
| Distribution payable | | | 755 | |
| Accrued distribution fees | | | 2,516 | |
| Accrued trustees fees | | | 5,364 | |
| Accrued expenses and other payables | | | 9,588 | |
| Total Liabilities | | | 30,737 | |
| NET ASSETS | | $ | 6,381,995 | |
| | | | | |
| NET ASSETS CONSIST OF: | | | | |
| Capital stock | | $ | 6,266,866 | |
| Accumulated net investment income | | | 166 | |
| Accumulated net realized gain on investments | | | 31,930 | |
| Unrealized net appreciation on investments | | | 83,033 | |
| Total Net Assets | | $ | 6,381,995 | |
| | | | | |
| NET ASSETS | | | | |
| Investor Class: | | | | |
| Shares authorized (no par value) | | Unlimited | |
| Net assets applicable to outstanding Investor Class shares | | | 2,992,546 | |
| Shares issued and outstanding | | | 388,940 | |
| Net asset value, offering price and redemption price per share | | $ | 7.69 | |
| | | | | |
| Institutional Class: | | | | |
| Shares authorized (no par value) | | Unlimited | |
| Net assets applicable to outstanding Institutional Class shares | | | 3,389,449 | |
| Shares issued and outstanding | | | 500,295 | |
| Net asset value, offering price and redemption price per share | | $ | 6.77 | |
The accompanying notes are an integral part of these financial statements.
HENNESSY FUNDS 1-800-966-4354
Financial Statements
Statement of Operations Six Months Ended April 30, 2014 (Unaudited) |
| INVESTMENT INCOME: | | | |
| Dividend income | | $ | 18,126 | |
| Interest income | | | 98,687 | |
| Total investment income | | | 116,813 | |
| | | | | |
| EXPENSES: | | | | |
| Investment advisory fees | | | 25,622 | |
| Federal and state registration fees | | | 16,863 | |
| Compliance expense | | | 10,655 | |
| Audit fees | | | 9,472 | |
| Trustees’ fees and expenses | | | 6,943 | |
| Administration, fund accounting, custody and transfer agent fees | | | 3,843 | |
| Distribution fees – Investor Class (See Note 5) | | | 3,842 | |
| Legal fees | | | 2,480 | |
| Reports to shareholders | | | 1,635 | |
| Sub-transfer agent expenses – Investor Class (See Note 5) | | | 1,284 | |
| Sub-transfer agent expenses – Institutional Class (See Note 5) | | | 108 | |
| Other expenses | | | 3,532 | |
| Total expenses before reimbursement from advisor | | | 86,279 | |
| Expense reimbursement by advisor – Investor Class | | | (24,076 | ) |
| Expense reimbursement by advisor – Institutional Class | | | (24,748 | ) |
| Net expenses | | | 37,455 | |
| NET INVESTMENT INCOME | | $ | 79,358 | |
| | | | | |
| REALIZED AND UNREALIZED GAINS: | | | | |
| Net realized gain on investments | | $ | 32,596 | |
| Change in unrealized depreciation on investments | | | (24,952 | ) |
| Net gain on investments | | | 7,644 | |
| NET INCREASE IN NET ASSETS RESULTING FROM OPERATIONS | | $ | 87,002 | |
The accompanying notes are an integral part of these financial statements.
(This Page Intentionally Left Blank.)
HENNESSY FUNDS 1-800-966-4354
Financial Statements
| Statements of Changes in Net Assets |
| | | Six Months Ended | | | | |
| | | April 30, 2014 | | | Year Ended | |
| | | (Unaudited) | | | October 31, 2013 | |
| OPERATIONS: | | | | | | |
| Net investment income | | $ | 79,358 | | | $ | 451,243 | |
| Net realized gain on securities | | | 32,596 | | | | 1,390,074 | |
| Change in unrealized depreciation on securities | | | (24,952 | ) | | | (1,718,510 | ) |
| Net increase in net assets resulting from operations | | | 87,002 | | | | 122,807 | |
| | | | | | | | | |
| DISTRIBUTIONS TO SHAREHOLDERS FROM: | | | | | | | | |
| Net investment income | | | | | | | | |
| Investor Class | | | (34,814 | ) | | | (103,816 | ) |
| Institutional Class | | | (44,378 | ) | | | (365,266 | ) |
| Net realized gains | | | | | | | | |
| Investor Class | | | (1,349,963 | ) | | | (74,517 | ) |
| Institutional Class | | | (14,284 | ) | | | (670,866 | ) |
| Total distributions | | | (1,443,439 | ) | | | (1,214,465 | ) |
| | | | | | | | | |
| CAPITAL SHARE TRANSACTIONS: | | | | | | | | |
| Proceeds from shares subscribed – Investor Class | | | 1,218,921 | | | | 2,098,731 | |
| Proceeds from shares subscribed – Institutional Class | | | 116,371 | | | | 1,200,715 | |
| Dividends reinvested – Investor Class | | | 587,343 | | | | 157,601 | |
| Dividends reinvested – Institutional Class | | | 765,130 | | | | 1,033,843 | |
| Cost of shares redeemed – Investor Class | | | (1,210,454 | ) | | | (2,623,814 | ) |
| Cost of shares redeemed – Institutional Class | | | (143,550 | ) | | | (31,279,649 | )(1) |
| Net increase (decrease) in net assets derived | | | | | | | | |
| from capital share transactions | | | 1,333,761 | | | | (29,412,573 | ) |
| TOTAL DECREASE IN NET ASSETS | | | (22,676 | ) | | | (30,504,231 | ) |
| | | | | | | | | |
| NET ASSETS: | | | | | | | | |
| Beginning of period | | | 6,404,671 | | | | 36,908,902 | |
| End of period | | $ | 6,381,995 | | | $ | 6,404,671 | |
| Undistributed net investment income, end of period | | $ | 166 | | | $ | — | |
| (1) | Net of redemption fees of $26 related to redemption fees imposed by the FBR Core Bond Fund during a prior year but not received until fiscal year 2013. |
The accompanying notes are an integral part of these financial statements.
| Statements of Changes in Net Assets – Continued |
| | | Six Months Ended | | | | |
| | | April 30, 2014 | | | Year Ended | |
| | | (Unaudited) | | | October 31, 2013 | |
| CHANGES IN SHARES OUTSTANDING: | | | | | | |
| Shares sold – Investor Class | | | 152,187 | | | | 213,393 | |
| Shares sold – Institutional Class | | | 15,934 | | | | 135,965 | |
| Shares issued to holders as | | | | | | | | |
| reinvestment of dividends – Investor Class | | | 76,539 | | | | 16,225 | |
| Shares issued to holders as | | | | | | | | |
| reinvestment of dividends – Institutional Class | | | 113,111 | | | | 116,531 | |
| Shares redeemed – Investor Class | | | (155,987 | ) | | | (271,391 | ) |
| Shares redeemed – Institutional Class | | | (19,732 | ) | | | (3,540,601 | ) |
| Net increase (decrease) in shares outstanding | | | 182,052 | | | | (3,329,878 | ) |
The accompanying notes are an integral part of these financial statements.
HENNESSY FUNDS 1-800-966-4354
Financial Highlights
For an Investor Class share outstanding throughout each period
| | | Six Months Ended | |
| | | April 30, 2014 | |
| | | (Unaudited) | |
| PER SHARE DATA: | | | |
| Net asset value, beginning of period | | $ | 9.56 | |
| | | | | |
| Income from investment operations: | | | | |
| Net investment income | | | 0.09 | |
| Net realized and unrealized gains (losses) on investments | | | 0.01 | |
| Total from investment operations | | | 0.10 | |
| | | | | |
| Less distributions: | | | | |
| Dividends from net investment income | | | (0.09 | ) |
| Dividends from net realized gains | | | (1.88 | ) |
| Total distributions | | | (1.97 | ) |
| Paid-in capital from redemption fees | | | — | |
| Net asset value, end of period | | $ | 7.69 | |
| | | | | |
| TOTAL RETURN | | | 1.33 | %(4) |
| | | | | |
| SUPPLEMENTAL DATA AND RATIOS: | | | | |
| Net assets, end of period (millions) | | $ | 2.99 | |
| Ratio of expenses to average net assets: | | | | |
| Before expense reimbursement | | | 2.87 | %(5) |
| After expense reimbursement | | | 1.30 | %(5) |
| Ratio of net investment income to average net assets: | | | | |
| Before expense reimbursement | | | 0.78 | %(5) |
| After expense reimbursement | | | 2.35 | %(5) |
Portfolio turnover rate(6) | | | 33 | %(4) |
| (1) | For the seven-month period ended October 31, 2010. Effective October 31, 2010, the Fund changed its fiscal year end from March 31 to October 31. |
| (2) | Calculated based on average shares outstanding method. |
| (3) | Amount is less than $0.01. |
| (4) | Not annualized. |
| (5) | Annualized. |
| (6) | Portfolio turnover is calculated on the basis of the Fund as a whole. |
The accompanying notes are an integral part of these financial statements.
| | | | | | | | | | For the Period | | | | | | | |
| | | | | | | | | | April 1, 2010 | | | | | | | |
| For the Year Ended October 31, | | | to October 31, | | | Year Ended March 31, | |
| 2013 | | | 2012 | | | 2011 | | | 2010(1) | | | 2010 | | | 2009 | |
| | | | | | | | | | | | | | | | | |
| $ | 9.97 | | | $ | 9.56 | | | $ | 9.82 | | | $ | 9.39 | | | $ | 8.75 | | | $ | 9.16 | |
| | | | | | | | | | | | | | | | | | | | | | | |
| | | | | | | | | | | | | | | | | | | | | | | |
| | 0.27 | | | | 0.28 | | | | 0.35 | (2) | | | 0.23 | (2) | | | 0.38 | (2) | | | 0.35 | (2) |
| | (0.23 | ) | | | 0.41 | | | | (0.14 | ) | | | 0.42 | | | | 0.69 | | | | (0.44 | ) |
| | 0.04 | | | | 0.69 | | | | 0.21 | | | | 0.65 | | | | 1.07 | | | | (0.09 | ) |
| | | | | | | | | | | | | | | | | | | | | | | |
| | | | | | | | | | | | | | | | | | | | | | | |
| | (0.27 | ) | | | (0.20 | ) | | | (0.32 | ) | | | (0.22 | ) | | | (0.38 | ) | | | (0.32 | ) |
| | (0.18 | ) | | | (0.08 | ) | | | (0.15 | ) | | | — | | | | (0.05 | ) | | | — | |
| | (0.45 | ) | | | (0.28 | ) | | | (0.47 | ) | | | (0.22 | ) | | | (0.43 | ) | | | (0.32 | ) |
| | — | | | | 0.00 | (3) | | | 0.00 | (3) | | | 0.00 | (3) | | | 0.00 | (3) | | | 0.00 | (3) |
| $ | 9.56 | | | $ | 9.97 | | | $ | 9.56 | | | $ | 9.82 | | | $ | 9.39 | | | $ | 8.75 | |
| | | | | | | | | | | | | | | | | | | | | | | |
| | 0.41 | % | | | 7.38 | % | | | 2.35 | % | | | 6.98 | %(4) | | | 12.33 | % | | | (0.93 | )% |
| | | | | | | | | | | | | | | | | | | | | | | |
| | | | | | | | | | | | | | | | | | | | | | | |
| $ | 3.02 | | | $ | 3.57 | | | $ | 4.05 | | | $ | 4.45 | | | $ | 4.62 | | | $ | 2.06 | |
| | | | | | | | | | | | | | | | | | | | | | | |
| | 2.26 | % | | | 2.12 | % | | | 2.38 | % | | | 2.10 | %(5) | | | 1.93 | % | | | 2.14 | % |
| | 1.30 | % | | | 1.30 | % | | | 1.30 | % | | | 1.30 | %(5) | | | 1.31 | % | | | 1.33 | % |
| | | | | | | | | | | | | | | | | | | | | | | |
| | 1.70 | % | | | 2.01 | % | | | 2.58 | % | | | 3.37 | %(5) | | | 3.49 | % | | | 3.21 | % |
| | 2.66 | % | | | 2.83 | % | | | 3.66 | % | | | 4.17 | %(5) | | | 4.11 | % | | | 4.02 | % |
| | 74 | % | | | 75 | % | | | 57 | % | | | 46 | %(4) | | | 28 | % | | | 39 | % |
The accompanying notes are an integral part of these financial statements.
HENNESSY FUNDS 1-800-966-4354
Financial Highlights
For an Institutional Class share outstanding throughout each period
| | | Six Months Ended | |
| | | April 30, 2014 | |
| | | (Unaudited) | |
| PER SHARE DATA: | | | |
| Net asset value, beginning of period | | $ | 8.65 | |
| | | | | |
| Income from investment operations: | | | | |
| Net investment income | | | 0.09 | |
| Net realized and unrealized gains (losses) on investments | | | 0.00 | (3) |
| Total from investment operations | | | 0.09 | |
| | | | | |
| Less distributions: | | | | |
| Dividends from net investment income | | | (0.09 | ) |
| Dividends from net realized gains | | | (1.88 | ) |
| Total distributions | | | (1.97 | ) |
| Paid-in capital from redemption fees | | | — | |
| Net asset value, end of period | | $ | 6.77 | |
| | | | | |
| TOTAL RETURN | | | 1.39 | %(4) |
| | | | | |
| SUPPLEMENTAL DATA AND RATIOS: | | | | |
| Net assets, end of period (millions) | | $ | 3.39 | |
| Ratio of expenses to average net assets: | | | | |
| Before expense reimbursement | | | 2.54 | %(5) |
| After expense reimbursement | | | 1.05 | %(5) |
| Ratio of net investment income to average net assets: | | | | |
| Before expense reimbursement | | | 1.11 | %(5) |
| After expense reimbursement | | | 2.60 | %(5) |
Portfolio turnover rate(6) | | | 33 | %(4) |
| (1) | For the seven-month period ended October 31, 2010. Effective October 31, 2010, the Fund changed its fiscal year end from March 31 to October 31. |
| (2) | Calculated based on average shares outstanding method. |
| (3) | Amount is less than $0.01. |
| (4) | Not annualized. |
| (5) | Annualized. |
| (6) | Portfolio turnover is calculated on the basis of the Fund as a whole. |
The accompanying notes are an integral part of these financial statements.
| | | | | | | | | | For the Period | | | | | | | |
| | | | | | | | | | April 1, 2010 | | | | | | | |
| For the Year Ended October 31, | | | to October 31, | | | Year Ended March 31, | |
| 2013 | | | 2012 | | | 2011 | | | 2010(1) | | | 2010 | | | 2009 | |
| | | | | | | | | | | | | | | | | |
| $ | 9.06 | | | $ | 8.77 | | | $ | 9.05 | | | $ | 8.67 | | | $ | 8.11 | | | $ | 8.52 | |
| | | | | | | | | | | | | | | | | | | | | | | |
| | | | | | | | | | | | | | | | | | | | | | | |
| | 0.19 | | | | 0.27 | | | | 0.34 | (2) | | | 0.23 | (2) | | | 0.37 | (2) | | | 0.35 | (2) |
| | (0.13 | ) | | | 0.38 | | | | (0.12 | ) | | | 0.38 | | | | 0.64 | | | | (0.42 | ) |
| | 0.06 | | | | 0.65 | | | | 0.22 | | | | 0.61 | | | | 1.01 | | | | (0.07 | ) |
| | | | | | | | | | | | | | | | | | | | | | | |
| | | | | | | | | | | | | | | | | | | | | | | |
| | (0.29 | ) | | | (0.28 | ) | | | (0.35 | ) | | | (0.23 | ) | | | (0.40 | ) | | | (0.34 | ) |
| | (0.18 | ) | | | (0.08 | ) | | | (0.15 | ) | | | — | | | | (0.05 | ) | | | — | |
| | (0.47 | ) | | | (0.36 | ) | | | (0.50 | ) | | | (0.23 | ) | | | (0.45 | ) | | | (0.34 | ) |
| | 0.00 | (3) | | | 0.00 | (3) | | | 0.00 | (3) | | | 0.00 | (3) | | | 0.00 | (3) | | | 0.00 | (3) |
| $ | 8.65 | | | $ | 9.06 | | | $ | 8.77 | | | $ | 9.05 | | | $ | 8.67 | | | $ | 8.11 | |
| | | | | | | | | | | | | | | | | | | | | | | |
| | 0.69 | % | | | 7.63 | % | | | 2.62 | % | | | 7.15 | %(4) | | | 12.62 | % | | | (0.74 | )% |
| | | | | | | | | | | | | | | | | | | | | | | |
| | | | | | | | | | | | | | | | | | | | | | | |
| $ | 3.38 | | | $ | 33.34 | | | $ | 23.25 | | | $ | 24.25 | | | $ | 23.89 | | | $ | 22.05 | |
| | | | | | | | | | | | | | | | | | | | | | | |
| | 1.67 | % | | | 1.31 | % | | | 1.43 | % | | | 1.47 | %(5) | | | 1.69 | % | | | 1.89 | % |
| | 1.05 | % | | | 1.05 | % | | | 1.05 | % | | | 1.05 | %(5) | | | 1.06 | % | | | 1.08 | % |
| | | | | | | | | | | | | | | | | | | | | | | |
| | 2.28 | % | | | 2.74 | % | | | 3.54 | % | | | 4.00 | %(5) | | | 3.74 | % | | | 3.46 | % |
| | 2.90 | % | | | 3.00 | % | | | 3.92 | % | | | 4.41 | %(5) | | | 4.37 | % | | | 4.27 | % |
| | 74 | % | | | 75 | % | | | 57 | % | | | 46 | %(4) | | | 28 | % | | | 39 | % |
The accompanying notes are an integral part of these financial statements.
HENNESSY FUNDS 1-800-966-4354
Notes to the Financial Statements
April 30, 2014 (Unaudited)
1). ORGANIZATION
The Hennessy Core Bond Fund (the “Fund”) is a series of Hennessy Funds Trust (the “Trust”), which was organized as a Delaware statutory trust on September 17, 1992. The Fund is an open-end management investment company registered under the Investment Company Act of 1940, as amended. The Fund is a successor to the FBR Core Bond Fund (the “Predecessor FBR Fund”), a series of The FBR Funds, a Delaware statutory trust, pursuant to a reorganization that took place after the close of business on October 26, 2012. Prior to October 26, 2012, the Fund had no investment operations. As a result of the reorganization, holders of the Investor Class shares of the Predecessor FBR Fund received Investor Class shares of the Fund (the Investor Class shares of the Fund are the successor to the accounting and performance information of the Predecessor FBR Fund), and holders of the Institutional Class shares of the Predecessor FBR Fund received Institutional Class shares of the Fund (the Institutional Class shares of the Fund are the successor to the accounting and performance information of the Predecessor FBR Fund). The investment objective of the Fund is current income with capital growth as a secondary objective. The Fund is a diversified fund.
The Fund offers Investor Class and Institutional Class shares. Each class of shares differs principally in its respective administration, 12b-1 distribution and service fees, shareholder servicing, and transfer agent expenses and sales charges, if any. Each class has identical rights to earnings, assets, and voting privileges, except for class-specific expenses and exclusive rights to vote on matters affecting only individual classes.
2). SIGNIFICANT ACCOUNTING POLICIES
The following is a summary of significant accounting policies consistently followed by the Fund in the preparation of the financial statements. These policies are in conformity with U.S. generally accepted accounting principles (“GAAP”).
| a). | Investment Valuation – All investments in securities are recorded at their estimated fair value, as described in Note 3. |
| b). | Federal Income Taxes – Provision for Federal income taxes or excise taxes has not been made since the Fund has elected to be taxed as a “regulated investment company” and intends to distribute substantially all of its taxable income to its shareholders and otherwise comply with the provisions of the Internal Revenue Code of 1986, as amended, applicable to regulated investment companies. Net investment income or loss and realized gains and losses for federal income tax purposes may differ from that reported on the financial statements because of temporary book and tax basis differences. Temporary differences are primarily the result of the treatment of wash sales for tax reporting purposes. Distributions from net realized gains for book purposes may include short-term capital gains, which are included as ordinary income to shareholders for tax purposes. |
| c). | Income and Expenses – Dividend income is recognized on the ex-dividend date or as soon as information is available to the Fund. Interest income, which includes the amortization of premium and accretion of discount, is recognized on an accrual basis. The Fund is charged for those expenses that are directly attributable to the portfolio, such as advisory, administration, and certain shareholder service fees. Income, |
| | expenses (other than expenses attributable to a specific class), and realized and unrealized gains or losses on investments are allocated to each class of shares based on its respective net assets. |
| d). | Distributions to Shareholders – Dividends from net investment income for the Fund, if any, are declared and paid out monthly. Distributions of net realized capital gains, if any, are declared and paid annually, usually in November or December. |
| e). | Security Transactions – Investment and shareholder transactions are recorded on the trade date. The Fund determines the gain or loss realized from the investment transactions by comparing the original cost of the security lot sold with the net sale proceeds. Discounts and premiums on securities purchased are accreted/amortized over the life of the respective security. |
| f). | Use of Estimates – The preparation of financial statements in conformity with GAAP requires management to make estimates and assumptions that affect the reported amounts of assets and liabilities and disclosure of contingent assets and liabilities at the date of the financial statements and the reported change in net assets during the reporting period. Actual results could differ from those estimates. |
| g). | Share Valuation – The net asset value (“NAV”) per share of the Fund is calculated by dividing the sum of the value of the securities held by the Fund, plus cash or other assets, minus all liabilities (including estimated accrued expenses) by the total number of shares outstanding for the Fund, rounded to the nearest cent. The Fund’s shares will not be priced on days the New York Stock Exchange is closed for trading. The offering and redemption price per share for the Fund is equal to the Fund’s net asset value per share. |
| h). | Foreign Currency – Values of investments denominated in foreign currencies are converted into U.S. dollars using the spot market rate of exchange at the time of valuation. Purchases and sales of investments and income are translated into U.S. dollars using the spot market rate of exchange prevailing on the respective dates of such transactions. The Fund does not isolate the portion of the results of operations resulting from fluctuations in foreign exchange rates on investments from fluctuations resulting from changes in the market prices of securities held. Such fluctuations are included with the net realized and unrealized gain or loss on investments. Foreign investments present additional risks due to currency fluctuations, economic and political factors, lower liquidity, government regulations, differences in accounting standards, and other factors. |
| i). | Forward Contracts – The Fund may enter into forward currency contracts to reduce its exposure to changes in foreign currency exchange rates on its foreign holdings and to lock in the U.S. dollar cost of firm purchase and sale commitments for securities denominated in foreign currencies. A forward currency contract is a commitment to purchase or sell a foreign currency at a future date at a negotiated forward rate. The gain or loss arising from the difference between the U.S. dollar cost of the original contract and the value of the foreign currency in U.S. dollars upon closing of such contract is included in net realized gain or loss from foreign currency transactions. During the six months ended April 30, 2014, the Fund did not enter into any forward contracts. |
| j). | Repurchase Agreements – The Fund may enter into repurchase agreements with member banks or security dealers of the Federal Reserve Board whom the investment advisor deems creditworthy. The repurchase price generally equals the price paid by the Fund plus interest negotiated on the basis of current short-term rates. |
HENNESSY FUNDS 1-800-966-4354
| | Securities pledged as collateral for repurchase agreements are held by the custodian bank until the respective agreements mature. Provisions of the repurchase agreements ensure that the market value of the collateral, including accrued interest thereon, is sufficient in the event of default of the counterparty. If the counterparty defaults and the value of the collateral declines or if the counterparty enters an insolvency proceeding, realization of the collateral by the Fund may be delayed or limited. |
| k). | Accounting for Uncertainty in Income Taxes – The Fund has adopted accounting policies regarding recognition and measurement of tax positions taken or expected to be taken on a tax return. The Fund has reviewed all open tax years in major jurisdictions and concluded that there is no impact on the Fund’s net assets and no tax liability resulting from unrecognized tax benefits relating to uncertain income tax positions taken or expected to be taken on a tax return. The Fund’s major tax jurisdictions are U.S. Federal and Delaware. As of April 30, 2014, open Federal and state tax years for the Fund include the tax years ended October 31, 2011 through 2013. |
| l). | Derivatives – The Fund may invest in, or enter into, derivatives, such as options, futures contracts, options on futures contracts, and swaps, for a variety of reasons, including to hedge certain risks, to provide a substitute for purchasing or selling particular securities, or to increase potential income gain. Derivatives may provide a cheaper, quicker, or more specifically focused way for a Fund to invest than “traditional” securities would. The main purpose of utilizing these derivative instruments is for hedging purposes. |
| | The Fund has adopted the financial accounting reporting rules as required by the Derivatives and Hedging Topic of the Financial Accounting Standards Board Accounting Standards Codification. Under such rules, the Fund is required to include enhanced disclosure that enables investors to understand how and why an entity uses derivatives, how derivatives are accounted for, and how derivatives instruments affect an entity’s results of operations and financial position. During the six months ended April 30, 2014, the Fund did not hold any derivative instruments. |
| m). | Events Subsequent to the Fiscal Period End – The Fund has adopted financial reporting rules regarding subsequent events that require an entity to recognize in the financial statements the effects of all subsequent events that provide additional evidence about conditions that existed at the date of the balance sheet. Management has evaluated the Fund’s related events and transactions that occurred subsequent to April 30, 2014 through the date of issuance of the Fund’s financial statements. There were no events or transactions that occurred during this period that materially impacted the amounts or disclosures in the Fund’s financial statements. |
3). SECURITIES VALUATION
The Fund has adopted authoritative fair valuation accounting standards that establish an authoritative definition of fair value and set out a hierarchy for measuring fair value. These standards require additional disclosures about the various inputs and valuation techniques used to develop the measurements of fair value and a discussion in changes in valuation techniques and related inputs during the period. These inputs are summarized in the three broad levels listed below:
| | Level 1 – | Quoted unadjusted prices for identical instruments in active markets to which the Fund has access at the date of measurement. |
| | Level 2 – | Quoted prices for similar instruments in active markets; quoted prices for identical or similar instruments in markets that are not active; and model-derived valuations in which all significant inputs and significant value drivers are observable in active markets. Level 2 inputs are those in markets for which there are few transactions, the prices are not current, the prices are fair value adjusted due to post-market close subsequent events (foreign markets), little public information exists, or instances where prices vary substantially over time or among brokered market makers. These inputs may also include interest rates, prepayment speeds, credit risk curves, default rates, and similar data. |
| | Level 3 – | Model-derived valuations in which one or more significant inputs or significant value drivers are unobservable. Unobservable inputs are those inputs that reflect the Fund’s own assumptions about what market participants would use to price the asset or liability based on the best available information. |
Following is a description of the valuation techniques applied to the Fund’s major categories of assets and liabilities measured at fair value on a recurring basis.
Equity Securities – Equity securities, including common stocks, preferred stocks, foreign issued common stocks, exchange traded funds, closed-end mutual funds, and real estate investment trusts, that are traded on a securities exchange for which a last-quoted sales price is readily available will be valued at the last sales price as reported by the primary exchange on which the securities are listed. Securities listed on The NASDAQ Stock Market (“NASDAQ”) will be valued at the NASDAQ Official Closing Price, which may differ from the last sales price reported. Securities traded on a securities exchange for which a last-quoted sales price is not readily available will be valued at the mean between the bid and ask prices. To the extent these securities are actively traded and valuation adjustments are not applied, they are classified in Level 1 of the fair value hierarchy.
Investment Companies – Investments in investment companies (e.g., mutual funds and exchange traded funds) are generally priced at the ending NAV provided by the Fund’s service agent and will be classified in Level 1 of the fair value hierarchy.
Debt Securities – Debt securities, including corporate bonds, asset-backed securities, mortgage-backed securities, municipal bonds, U.S. Treasuries, and U.S. government agency issues, are valued at market on the basis of valuations furnished by an independent pricing service that utilizes both dealer-supplied valuations and formula-based techniques. The pricing service may consider recently executed transactions in securities of the issuer or comparable issuers, market price quotations (where observable), bond spreads, and fundamental data relating to the issuer. In addition, the model may incorporate market observable data such as reported sales of similar securities, broker quotes, yields, bids, offers, and reference data. Certain securities are valued principally using dealer quotations. These securities are generally classified in Level 2 of the fair value hierarchy.
Short-Term Securities – Short-term equity investments, including money market funds, are valued in the manner specified above. Short-term debt investments are valued at amortized cost, if their original maturity was 60 days or less, or by amortizing the values as of the 61st day prior to maturity, if their original term to maturity exceeded 60 days. Short-term securities are generally classified in Level 1 or Level 2 of the fair market hierarchy depending on the inputs used and market activity levels for specific securities.
The Board of Trustees of the Fund (the “Board”) has adopted fair value pricing procedures that are followed when a price for a security is not readily available or if a
HENNESSY FUNDS 1-800-966-4354
significant event has occurred that indicates the closing price of a security no longer represents the true value of that security. Fair value pricing determinations are made in good faith in accordance with these procedures. There are numerous criteria that will be given consideration in determining a fair value of a security. Some of these criteria are trading volume of security and markets, the value of other like securities, and news events with direct bearing to security or market. Fair value pricing results in an estimated price that reasonably reflects the current market conditions in order to rate the portfolio holdings such that shareholder transactions receive a fair net asset value. Depending on the relative significance of the valuation inputs, these securities may be classified in either Level 2 or Level 3 of the fair value hierarchy.
Fair valuing of foreign securities may be determined with the assistance of a pricing service using correlations between the movement of prices of such securities and indices of domestic securities and other appropriate indicators, such as closing market prices of relevant American Depositary Receipts or futures contracts. The effect of using fair value pricing is that the Fund’s NAV will reflect the affected portfolio securities’ value as determined in the judgment of the Board or its designee instead of being determined by the market. Using a fair value pricing methodology to price foreign securities may result in a value that is different from a foreign security’s most recent closing price and from the prices used by other investment companies to calculate their net asset values and are generally considered Level 2 prices in the fair valuation hierarchy. Because the Fund may invest in foreign securities, the value of the Fund’s portfolio securities may change on days when you will not be able to purchase or redeem your shares.
The Board has delegated day-to-day valuation matters to a Valuation Committee comprised of one or more representatives from Hennessy Advisors, Inc., the Fund’s investment advisor. The function of the Valuation Committee is to value securities where current and reliable market quotations are not readily available. All actions taken by the Valuation Committee are reviewed by the Board.
The Fund has performed an analysis of all existing investments to determine the significance and character of all inputs to their fair value determination. Various inputs are used in determining the value of the Fund’s investments. The inputs or methodology used for valuing securities are not necessarily an indication of the risk associated with investing in those securities. Details related to the fair valuation hierarchy of the Fund’s securities as of April 30, 2014 are included in the Fund’s Schedule of Investments.
4). INVESTMENT TRANSACTIONS
Purchases and sales of investment securities (excluding government and short-term investments) for the Fund during the six months ended April 30, 2014 were $186,798 and $1,169,039, respectively.
Purchases and sales/maturities of long-term U.S. Government Securities for the Fund were $1,867,178 and $911,114, respectively, for the six months ended April 30, 2014.
5). INVESTMENT MANAGEMENT FEE AND OTHER TRANSACTIONS WITH AFFILIATES
Hennessy Advisors, Inc. (the “Advisor”) is the investment advisor of the Fund. The Advisor provides the Fund with investment management services under an Investment Advisory Agreement. The Advisor furnishes all investment advice, office space, facilities, and provides most of the personnel needed by the Fund. As compensation for its services, the Advisor is entitled to a monthly fee from the Fund. The fee is based upon the average daily net assets of the Fund at the annual rate of 0.80%.
The Advisor has delegated the day-to-day management of the Fund to a sub-advisor, Financial Counselors, Inc. The Advisor pays the sub-advisor fees for the Fund from its own assets and these fees are not an additional expense of the Fund.
The Advisor has contractually agreed to limit the total annual operating expenses of the Fund (excluding interest, taxes, brokerage commissions, dividend expenses, 12b-1 fees, acquired fund fees and expenses, extraordinary legal expenses, or any other extraordinary expenses) to 1.05% of the Fund’s net assets for both the Investor Class shares and Institutional Class shares of the Fund through February 28, 2015. The net expense reimbursement receivable for the Fund as of April 30, 2014 was $3,949.
For a period of three years after the year in which the Advisor waives or reimburses expenses, the Advisor may seek reimbursement from the Fund to the extent that total annual fund operating expenses are less than the expense limitation in effect at the time of the reimbursement. The Advisor waived or reimbursed expenses of $48,824 for the Fund during the six-month period ended April 30, 2014. As of April 30, 2014, cumulative expenses subject to potential recovery to the aforementioned conditions and year of expiration are as follows:
| | | | October 31, 2015 | | | October 31, 2016 | | | October 31, 2017 | | | Total | |
| | Investor Class | | $ | 755 | | | $ | 36,603 | | | $ | 24,076 | | | $ | 61,434 | |
| | Institutional Class | | $ | 4 | | | $ | 74,877 | | | $ | 24,748 | | | $ | 99,629 | |
The Fund has adopted a plan pursuant to Rule 12b-1 under the Investment Company Act of 1940, as amended, that authorizes payments in connection with the distribution of the Fund’s shares at an annual rate of up to 0.25% of the Fund’s average daily net assets attributable to Investor Class shares. Amounts paid under the plan may be spent on any activities or expenses primarily intended to result in the sale of shares, including but not limited to, advertising, compensation for sales and marketing activities or financial institutions and others such as dealers and distributors, shareholder account servicing, the printing and mailing of prospectuses to other than current shareowners, and the printing and mailing of sales literature.
The Fund has entered into agreements with various brokers, dealers, and financial intermediaries in connection with the sale of shares of the Fund. The agreements provide for periodic payments by the Fund to the brokers, dealers, and financial intermediaries for providing certain shareholder maintenance services (sub-transfer agent expenses). These shareholder services include the pre-processing and quality control of new accounts, shareholder correspondence, answering customer inquiries regarding account status, and facilitating shareholder telephone transactions. Fees paid by the Fund to various brokers, dealers, and financial intermediaries for the six months ended April 30, 2014 were $1,392.
U.S. Bancorp Fund Services, LLC (“USBFS”) provides the Fund with administrative, fund accounting, and transfer agent services, including all regulatory reporting, and necessary office equipment and personnel. As administrator, USBFS prepares various federal and state regulatory filings, reports, and returns for the Fund; prepares reports and materials to be supplied to the Board; monitors the activities of the Fund’s custodian, transfer agent, and accountants; and coordinates the preparation and payment of the Fund’s expenses and reviews the Fund’s expense accruals. Fees paid to USBFS for the six months ended April 30, 2014 were $3,843.
U.S. Bank, N.A., an affiliate of USBFS, serves as the Fund’s custodian. Quasar Distributors, LLC acts as the Fund’s principal underwriter in a continuous public offering of the Fund’s shares. Quasar Distributors, LLC is an affiliate of USBFS and U.S. Bank, N.A.
HENNESSY FUNDS 1-800-966-4354
6). LINE OF CREDIT
The Fund has a line of credit with the other funds in the Hennessy Funds family of funds (the “Hennessy Funds”) in the amount of the lesser of (i) $100,000,000 or (ii) 33.33% of each Hennessy Fund’s net assets, or 30% for the Hennessy Gas Utility Index Fund and 10% for the Hennessy Balanced Fund, intended to provide short-term financing, if necessary, subject to certain restrictions, in connection with shareholder redemptions. The credit facility is with the Hennessy Funds’ custodian bank, U.S. Bank, N.A. Borrowings under this arrangement bear interest at the bank’s prime rate. During the six months ended April 30, 2014, the Fund did not have any borrowings outstanding under the line of credit.
7). FEDERAL TAX INFORMATION
As of October 31, 2013, the Fund’s most recent fiscal year end, the components of accumulated earnings (losses) for income tax purposes for the Fund were as follows:
| | Cost of investments for tax purposes | | $ | 6,227,313 | |
| | Gross tax unrealized appreciation | | $ | 283,915 | |
| | Gross tax unrealized depreciation | | | (176,590 | ) |
| | Net tax unrealized appreciation/depreciation | | $ | 107,325 | |
| | Undistributed ordinary income | | $ | 14,283 | |
| | Undistributed long-term capital gains | | | 1,349,958 | |
| | Total distributable earnings | | $ | 1,364,241 | |
| | Other accumulated gain (loss) | | $ | — | |
| | Total accumulated gain (loss) | | $ | 1,471,566 | |
The difference between book-basis and tax-basis unrealized appreciation is attributable primarily to capital loss carry overs, wash sales, and partnership adjustments.
At October 31, 2013, the Fund’s most recent fiscal year end, the Fund had no tax basis capital losses to offset future capital gains.
Capital losses sustained in the year ended October 31, 2012 and in future taxable years will not expire and may be carried over by the Fund without limitation; however, they will retain the character of the original loss. Furthermore, any losses incurred during those taxable years will be required to be utilized prior to the losses incurred in the pre-enactment taxable years. As a result of this ordering rule, pre-enactment capital loss carryforwards may be more likely to expire unused. Under pre-enactment law, capital losses could be carried forward for eight years, and carried forward as short-term capital losses, irrespective of the character of the original loss.
At October 31, 2013, the Fund did not defer, on a tax basis, any post-December late year ordinary loss deferrals or post-December loss deferrals.
The tax character of distributions paid during fiscal year 2014 (year-to-date) and fiscal year 2013 for the Fund were as follows:
| | | | Six Months Ended | | | Year Ended | |
| | | | April 30, 2014 | | | October 31, 2013 | |
| | Ordinary income | | $ | 93,476 | | | $ | 846,010 | |
| | Long-term capital gain | | | 1,349,963 | | | | 368,455 | |
| | | | $ | 1,443,439 | | | $ | 1,214,465 | |
Expense Example (Unaudited)
April 30, 2014
As a shareholder of the Fund, you incur two types of costs: (1) transaction costs, including sales charges (loads) on purchase payments, reinvested dividends, or other distributions; redemption fees; and exchange fees; and (2) ongoing costs, including management fees; service fees; and other Fund expenses. This Example is intended to help you understand your ongoing costs (in dollars) of investing in the Fund and to compare these costs with the ongoing costs of investing in other mutual funds. The Example is based on an investment of $1,000 invested at the beginning of the period and held for the entire period from November 1, 2013 through April 30, 2014.
Actual Expenses
The first line of the table below under the “Investor Class” and “Institutional Class” headings provides information about actual account values and actual expenses. Although the Fund charges no sales loads or transaction fees, you will be assessed fees for outgoing wire transfers, returned checks and stop payment orders at prevailing rates charged by U.S. Bancorp Fund Services, LLC, the Fund’s transfer agent. If you request that a redemption be made by wire transfer, currently a $15.00 fee is charged by the Fund’s transfer agent. IRA accounts will be charged a $15.00 annual maintenance fee. The example below includes, but is not limited to, management fees, shareholder servicing fees, fund accounting, custody, and transfer agent fees. However, the example below does not include portfolio trading commissions and related expenses, and other extraordinary expenses as determined under generally accepted accounting principles. You may use the information in this line, together with the amount you invested, to estimate the expenses that you paid over the period. Simply divide your account value by $1,000 (for example, an $8,600 account value divided by $1,000 = 8.6), then multiply the result by the number in the first line of the table under the “Investor Class” and “Institutional Class” headings in the column entitled “Expenses Paid During Period” to estimate the expenses you paid on your account during this period.
Hypothetical Example for Comparison Purposes
The second line of the table below under the “Investor Class” and “Institutional Class” headings provides information about hypothetical account values and hypothetical expenses based on the Fund’s actual expense ratios and an assumed rate of return of 5% per year before expenses, which is not the Fund’s actual return. The hypothetical account values and expenses may not be used to estimate the actual ending account balance or expenses you paid for the period. You may use this information to compare the ongoing costs of investing in the Fund and other funds. To do so, compare this 5% hypothetical example with the 5% hypothetical examples that appear in the shareholder reports of the other funds. Please note that the expenses shown in the table are meant to highlight your ongoing costs only and do not reflect any transactional costs, such as sales charges (loads), or exchange fees. Therefore, the second line of the table under the “Investor Class” and “Institutional Class” headings is useful in comparing ongoing costs only, and will not help you determine the relative total costs of owning different funds. In addition, if these transactional costs were included, your costs would have been higher.
HENNESSY FUNDS 1-800-966-4354
| | | | Expenses Paid |
| | Beginning | Ending | During Period(1) |
| | Account Value | Account Value | November 1, 2013 – |
| | November 1, 2013 | April 30, 2014 | April 30, 2014 |
| Investor Class | | | |
| | | | |
| Actual | $1,000.00 | $1,013.30 | $6.49 |
| | | | |
| Hypothetical (5% return | | | |
| before expenses) | $1,000.00 | $1,018.35 | $6.51 |
| | | | |
| Institutional Class | | | |
| | | | |
| Actual | $1,000.00 | $1,013.90 | $5.24 |
| | | | |
| Hypothetical (5% return | | | |
| before expenses) | $1,000.00 | $1,019.59 | $5.26 |
| (1) | Expenses are equal to the Fund’s annualized expense ratio of 1.30% for Investor Class shares or 1.05% for Institutional Class shares, as applicable, multiplied by the average account value over the period, multiplied by 181/365 days (to reflect one-half year period). |
Proxy Voting
A description of the policies and procedures the Fund uses to determine how to vote proxies relating to portfolio securities is available without charge: (1) by calling 1-800-966-4354; (2) on the Hennessy Funds’ website at hennessyfunds.com; or (3) on the U.S. Securities and Exchange Commission’s (the “SEC”) website at www.sec.gov. The Fund’s proxy voting record is available on both the Hennessy Funds’ website at hennessyfunds.com and the SEC’s website at www.sec.gov no later than August 31 for the prior 12 months ending June 30.
Quarterly Filings on Form N-Q
The Fund files its complete schedule of portfolio holdings with the SEC for the first and third quarters of each fiscal year on Form N-Q. The Fund’s Forms N-Q are available on the SEC’s website at www.sec.gov. The Fund’s Forms N-Q may be reviewed and copied at the SEC’s Public Reference Room in Washington, DC and information on the operation of the Public Reference Room may be obtained by calling 1-800-SEC-0330. Information included in the Fund’s Forms N-Q will also be available upon request by calling 1-800-966-4354.
Federal Tax Distribution Information
(Unaudited)
For the fiscal year ended October 31, 2013, certain dividends paid by the Fund may be subject to a maximum tax rate of 15%, as provided for by the Jobs and Growth Tax Relief Reconciliation Act of 2003. The percentage of dividends declared from ordinary income designated as qualified dividend income was 11.09%.
For corporate shareholders, the percent of ordinary income distributions qualifying for the corporate dividends received deduction for the fiscal year ended October 31, 2013 was 10.99%.
The percentage of taxable ordinary income distributions that are designated as short-term capital gain distributions under Section 871(k)(2)(C) of the Internal Revenue Code of 1986, as amended, for the Fund was 45.46%.
Householding
To help keep the Fund’s costs as low as possible, we generally deliver a single copy of most financial reports and prospectuses to shareholders who share an address, even if the accounts are registered under different names. This process, known as “householding,” does not apply to account statements. You may, of course, request an individual copy of a prospectus or financial report at any time. If you would like to receive separate mailings, please call the Administrator at 1-800-261-6950 or 1-414-765-4124 and we will begin individual delivery within 30 days of your request. If your account is held through a financial institution or other intermediary, please contact them directly to request individual delivery.
HENNESSY FUNDS 1-800-966-4354
Board Approval of Investment Advisory
Agreements
At its meeting on March 3, 2014, the Board of Trustees of the Fund (the “Board”) unanimously approved the continuation of the investment advisory agreement and sub-advisory agreement of the Fund.
The Board reviewed a number of documents, including a memorandum provided by outside legal counsel that described the fiduciary duties of the Board with respect to approving the continuance of the investment advisory and sub-advisory agreements and the relevant factors for consideration, a memorandum from the Advisor that listed each of the relevant factors and the documents provided to help the Board assess each such factor, the Advisor’s most recent Form 10-K and 10-Q, the Advisor’s Form ADV Part I, a document that listed the range of services provided by the Advisor for the Fund, a written discussion of economies of scale, a completed questionnaire from the sub-advisor, the sub-advisor’s Form ADV Parts I and II, copies of the advisory and sub-advisory agreements, a fund fact sheet, and peer expense and performance comparisons. The Board considered and discussed numerous factors, including the following:
| | • | The Board considered the services identified below that are provided by the Advisor and the sub-advisor: |
| | | • | The Advisor oversees the sub-advisor for the Fund. The sub-advisor acts as the portfolio manager to the Fund, managing the composition of the portfolio of the Fund, including the purchase, retention, and disposition of portfolio securities in accordance with the Fund’s investment objectives, policies, and restrictions. |
| | | • | The Advisor performs daily reconciliations of portfolio positions and cash for the Fund. |
| | | • | The Advisor oversees the use of soft dollars for the Fund. |
| | | • | The Advisor monitors compliance by the Fund with its investment objectives and restrictions. |
| | | • | The Advisor monitors compliance with federal securities laws and performs activities such as maintaining a compliance program, conducting ongoing reviews of the compliance programs of the sub-advisor and the Fund’s other service providers, conducting on-site visits to the sub-advisor and the Fund’s other service providers, monitoring incidents of abusive trading practices, reviewing Fund expense accruals, payments, and fixed expense ratios, evaluating insurance providers for fidelity bond coverage and D&O/E&O insurance coverage, conducting employee compliance training, reviewing reports provided by service providers, maintaining books and records, and preparing an annual compliance report to the Board. |
| | | • | The Advisor oversees service providers that support the Fund in providing fund accounting, fund administration, fund distribution, transfer agency, custodial, sales and marketing, audit, information technology, and legal services. |
| | | • | The Advisor maintains an in-house public relations and marketing department on behalf of the Fund. |
| | | • | The Advisor is actively involved with preparing regulatory filings for the Fund. |
| | | • | The Advisor oversees proxy voting for the Fund. |
| | | • | The Advisor oversees distribution of the Fund through third-party broker/dealers and independent financial institutions such as Charles Schwab, |
| | | | Inc., Fidelity, TD Waterhouse, and Pershing. The Advisor participates in “no transaction fee” (“NTF”) programs with these companies on behalf of the Fund, which allows customers to purchase the Fund through third-party distribution channels without paying a transaction fee. The Advisor compensates a number of these third-party providers of NTF programs out of its own revenues and not those of the Fund. |
| | | • | The Advisor pays the incentive compensation of all of the Fund’s compliance officers and employs other staff such as management executives, legal personnel, marketing personnel, national accounts and distribution personnel, sales personnel, and trading oversight personnel. |
| | | • | The Advisor prepares or reviews Board materials, frequently presents to the Board or leads Board discussions, prepares or reviews meeting minutes, and arranges for Board training and education. |
| | • | The Board compared the performance of the Fund to benchmark indices over various periods of time and concluded that the positive performance of the Fund warranted the continuation of the advisory and sub-advisory agreements. |
| | • | The Board reviewed the Fund’s expense ratio and comparable expense ratios for funds comparable to the Fund. The Board used data from Morningstar showing funds similar in asset size and investment objective to the Fund and determined that the expense ratio of the Fund falls within the range of the ratios of other comparable funds and concluded that the expenses of the Fund were reasonable. |
| | • | The Board considered the fees charged by the Advisor and the sub-advisor of the Fund to those of funds similar in asset size and investment objective to the Fund and concluded the advisory and sub-advisory fees of the Fund were reasonable and warranted continuation of the advisory and sub-advisory agreements. The Trustees noted that the investment advisory and sub-advisory fees are not adjusted if economies of scale are realized as the Fund grows because many of the expenses incurred to manage the Fund are asset-based fees and thus do not result in material economies of scale being realized as the net assets of the Fund increase. |
| | • | The Board considered the profitability of the Advisor and the sub-advisor with respect to the Fund and concluded the profits were reasonable and not excessive when compared to profitability guidelines set forth in relevant court cases. |
| | • | The Board considered the high level of professionalism and knowledge of the Advisor’s employees, along with an extremely low level of turnover of the employees of the Advisor, and concluded that this was beneficial to the Fund and its shareholders, as it ensures that the Fund is operated efficiently. |
All of the factors above were considered separately by the Board, including the Trustees who are not “interested persons” (as defined in the Investment Company Act of 1940, as amended) of the Fund (the “Independent Trustees”) meeting in an executive session. The factors were viewed in their totality by the Board, with no single factor being the principal or determinative factor in the Board’s determination of whether to approve the continuation of the advisory and sub-advisory agreements. Based on the factors discussed above, the Board, including all of the Independent Trustees, recommended continuation of the advisory and sub-advisory agreements.
HENNESSY FUNDS 1-800-966-4354
(This Page Intentionally Left Blank.)
For information, questions or assistance, please call
The Hennessy Funds
1-800-966-4354 or 1-415-899-1555
INVESTMENT ADVISOR
Hennessy Advisors, Inc.
7250 Redwood Blvd., Suite 200
Novato, California 94945
ADMINISTRATOR,
TRANSFER AGENT,
DIVIDEND PAYING AGENT &
SHAREHOLDER SERVICING AGENT
U.S. Bancorp Fund Services, LLC
P.O. Box 701
Milwaukee, Wisconsin 53201-0701
CUSTODIAN
U.S. Bank N.A.
Custody Operations
1555 North River Center Dr., Suite 302
Milwaukee, Wisconsin 53212
TRUSTEES
Neil J. Hennessy
Robert T. Doyle
J. Dennis DeSousa
Gerald P. Richardson
COUNSEL
Foley & Lardner LLP
777 East Wisconsin Avenue
Milwaukee, Wisconsin 53202-5306
INDEPENDENT REGISTERED
PUBLIC ACCOUNTING FIRM
Tait, Weller & Baker LLP
1818 Market Street, Suite 2400
Philadelphia, Pennsylvania 19103
DISTRIBUTOR
Quasar Distributors, LLC
615 East Michigan Street
Milwaukee, Wisconsin 53202
hennessyfunds.com | 1-800-966-4354
This report has been prepared for shareholders and may be distributed to
others only if preceded or accompanied by a current prospectus.
SEMI-ANNUAL REPORT
APRIL 30, 2014
HENNESSY GAS UTILITY
INDEX FUND
Investor Class GASFX
hennessyfunds.com | 1-800-966-4354
(This Page Intentionally Left Blank.)
Contents
| Letter to Shareholders | 2 |
| Performance Overview | 4 |
| Financial Statements | |
| Schedule of Investments | 7 |
| Statement of Assets and Liabilities | 12 |
| Statement of Operations | 13 |
| Statements of Changes in Net Assets | 15 |
| Financial Highlights | 16 |
| Notes to the Financial Statements | 18 |
| Expense Example | 25 |
| Proxy Voting | 27 |
| Quarterly Filings on Form N-Q | 27 |
| Federal Tax Distribution Information | 27 |
| Householding | 27 |
| Board Approval of Investment Advisory Agreement | 28 |
HENNESSY FUNDS 1-800-966-4354
June 2014
Dear Shareholder:
The financial markets have provided strong returns over the past six-months ended April 30, 2014, with the Dow Jones Industrial Average (DJIA) and S&P 500 both returning approximately 8% during the period. The current valuation metrics of the major indices are solid; for example, the DJIA currently has a price-to-earnings ratio of 15x and a price-to-sales ratio of 1.75x. The DJIA also has a dividend yield of 2.2%, which is nearly as high as that of a 10-Year U.S. Treasury, which is currently yielding 2.6%. Investing in high-yielding, high-quality DJIA stocks have the potential to not only provide an income stream but also for stock price appreciation as well. Fixed income investing has run its course, in my opinion, and many individuals are currently benefiting from the return to investing in equities that possess strong fundamentals.
U.S. corporations continue to drive shareholder value by making acquisitions, initiating and raising dividends, investing in internal infrastructure, and buying back stock. However, lately I have begun to see a shift in those business strategies. The easier-to-execute acquisitions seem to be a thing of the past, and firms now have to be even more creative to execute accretive deals. I also believe that while firms may continue to initiate dividends, fewer firms will raise their dividends and fewer firms will participate in stock buyback programs going forward. So what will these cash-rich companies do with their capital if they are not raising dividends or buying back stock? I believe we will see companies begin to initiate capital expenditure programs.
Due to the continuing uncertainty from a lack of clear policies on taxes, healthcare, and regulations, I have observed that corporations would rather wait for clarity from our government leaders and defer any significant changes to their current business models. Up until this point, there has been no real cost for firms to defer spending their capital as they wait for anticipated guidance on policies that directly affect their businesses. But, this economic handcuffing from all of this uncertainty has gone on long enough. I believe there will now be firms who want to improve their margins and will begin spending money to expand their sales, and may even begin to hire. Once a competitor begins to move in this way, then the cost to defer becomes real for companies. This movement to expansion may well be a catalyst to propel the financial markets. I do believe this will be a slow shift, but one that will keep the economy improving, and should, in my opinion, help to generate reasonable market returns over the next few years.
With almost $3 trillion in cash sitting on the sidelines, this strategic shift by companies to begin spending their idle capital should help the economic recovery in the U.S. But that is only one part of the equation. Washington politics still play a role in how strong that recovery will be. The national political landscape will change in the next few years, and the future generation of elected officials will be faced with what I believe are fictitious unemployment figures (6.3% reported, when over 20 million Americans are looking for more work or a better job), a sluggish economy, and global competition in business. The next regime needs to provide real clarity on the issues that face all Americans and American corporations: taxation, regulation, and how to pay for our new healthcare system. I also believe that our government needs to regard business as a noble profession and to implement common sense and logic in their policy making instead of politics as usual. As Confucius is quoted as saying, “Life is really simple, but we insist on making it complicated.”
I am confident that even with all the hurdles facing corporate America, companies continue to provide good value for their shareholders, and I believe that means the financial markets are in good shape and should remain strong moving forward, I also believe that the next few months may be volatile. Fads come and go, and the current buzz on the Street is around investing in social media stocks. I believe that chasing hot products has contributed and will continue to contribute to the volatility of the markets this year. After over 35 years in the business, I still firmly believe the best way to position your portfolio is by investing in good companies over the long term, rather than trying to buy the next hot idea at exactly the right time. At Hennessy Funds, hunches and fads have no place in our investment process, and we understand that successful investing comes from time in the market, not timing the market.
We remain focused on investing based on proven fundamentals, and we are committed to managing money for the sole benefit of our shareholders. If you have any questions or want to speak with us directly, please don’t hesitate to call us at (800) 966-4354.
Best regards,
Neil J. Hennessy
President and Chief Investment Officer
Past performance does not guarantee future results.
Mutual fund investing involves risk. Principal loss is possible.
Opinions expressed are those of Neil Hennessy and are subject to change, are not guaranteed and should not be considered investment advice.
The Dow Jones Industrial Average and S&P 500 are unmanaged indices commonly used to measure the performance of U.S. stocks. One cannot invest directly in an index.
Price-to-sales ratio and price-to-earnings ratio are tools for calculating relative valuation. Price-to-sales ratio is calculated by dividing the market price by revenue per share. Price-to-earnings ratio is the market price per share divided by earnings per share.
HENNESSY FUNDS 1-800-966-4354
Performance Overview (Unaudited)
The opinions expressed in the following commentary reflect those of the Portfolio Managers as of the date written. Any such opinions are subject to change based on market or other conditions and are not guaranteed. These opinions may not be relied upon as investment advice. Investment decisions for the Fund are based on several factors, and may not be relied upon as an indication of trading intent on behalf of the Fund. Security positions can and do change.
AVERAGE ANNUAL TOTAL RETURN PERIODS ENDED APRIL 30, 2014
| | Six | One | Five | Ten |
| | Months(1) | Year | Years | Years |
| Hennessy Gas Utility | | | | |
| Index Fund (GASFX) | 13.49% | 17.14% | 22.92% | 13.68% |
AGA Stock Index(2) | 13.35% | 17.19% | 21.86% | 12.57% |
| S&P 500 Index | 8.36% | 20.44% | 19.14% | 7.67% |
Expense ratio: 0.80%
Performance data quoted represents past performance; past performance does not guarantee future results. The investment return and principal value of an investment will fluctuate so that an investor’s shares, when redeemed, may be worth more or less than their original cost. Current performance of the Fund may be lower or higher than the performance quoted. Performance data current to the most recent month end may be obtained by visiting hennessyfunds.com. Performance for periods prior to October 26, 2012 is that of the FBR Gas Utility Index Fund.
The expense ratio presented is from the most recent prospectus.
| (1) | Periods less than one year are not annualized. |
| (2) | Source: American Gas Association. As calculated by the American Gas Association, the total return of the AGA Stock Index reflects the appreciation or depreciation of the stocks in the AGA Stock Index plus all dividends paid on such stocks, but does not assume that the dividends are reinvested and compounded. |
PERFORMANCE NARRATIVE
Portfolio Manager, Winsor H. Aylesworth, and Co-Portfolio Manager, Ryan Kelley
Over the previous six months, how did the Fund perform and what factors contributed to this performance?
For the six-month period ended April 30, 2014, the Hennessy Gas Utility Index Fund returned 13.49%, outperforming the American Gas Association (AGA) Stock Index, the S&P 500 Index, and the Morningstar Utilities Category Average, which returned 13.35%, 8.36%, and 10.71% for the same period, respectively.
Two of the Fund’s best performers for the period were Cheniere Energy, Inc. and Energy Transfer Equity, L.P., which returned 42% and 39%, respectively. These two companies were also last year’s top performers. Cheniere Energy, Inc. focuses on Liquid Natural Gas (LNG) and owns ports along the Gulf Coast that can receive and process imports and is currently constructing LNG export facilities. It is the first company to be granted a license to export LNG. Actual shipments are expected to begin in early 2016. Energy Transfer Equity, L.P. is a Master Limited Partnership (MLP) that specializes in the storage and transportation of natural gas. It too has been granted a license to export LNG and has benefited from the interest in this new demand driver for the industry. As an MLP, the company pays the bulk of its cash flow out in distributions to avoid paying taxes
at the corporate level, which makes it particularly attractive to income-oriented investors. Both Cheniere Energy, Inc. and Energy Transfer Equity, L.P. continued to be two of the Fund’s largest holdings for the six-month period and thus their individual success added greatly to the success of the Fund.
Two holdings that detracted from the Fund’s performance were WGL Holdings Corp. and Kinder Morgan, Inc., which returned -10% and -5%, respectively. WGL Holdings Corp. is a Washington, D.C.-based utility that offers diversified energy solutions throughout the mid-Atlantic region. The stock was impacted by disappointing fourth quarter earnings as the firm continues to diversify from a local distribution company to a provider of more diversified energy sources, including solar, wind, pipelines and storage. As its new business initiatives develop, we anticipate that the stock price should recover. The combined entities of Kinder Morgan form one of the largest pipeline owners in the country. The entity owned by the Fund acts as the general partner to Kinder Morgan’s many MLPs. The stock’s performance has been hindered as growth has been below the industry average. However, as a major player in the industry, we would expect Kinder Morgan, Inc. to grow with the industry in the future.
There were two additions and one deletion to the AGA Stock Index, and thus the Fund’s portfolio, during the six-month period. Additions included One Gas, Inc., an Oklahoma-based natural gas distribution company that was spun off from ONEOK Inc., and Plains GP Holdings, L.P., the general partner to various MLPs that are engaged in the transportation, storage, and terminal line of natural gas liquids and natural gas in both Canada and the United States. The one stock deleted was a result of an acquisition of an AGA member company, NV Energy, by a Canadian utility, Fortis, Inc. NV Energy was a Nevada-based utility while Fortis, Inc. is a large electric and natural gas distribution utility based in British Columbia. Although an AGA member company, Fortis, Inc. does not trade on an American exchange and hence is not a part of the AGA Stock Index. To be included in the AGA Stock Index, a company must be publicly traded on an American stock exchange and be a dues-paying member of the AGA.
Additional Portfolio Manager commentary and related investment outlook:
Investors’ expectations for the Fund should be for the Fund to match the returns of the AGA Stock Index minus the expenses of the Fund. For this six-month period, the Fund exceeded that general expectation. The Fund also continued to outperform its peer group of Utility funds as measured by Morningstar, as well as the overall market as measured by the S&P 500 Index. Thus, by most measures it was a very strong period. The Fund continues to benefit from its focus on the distribution part of the natural gas industry. In addition, the Fund’s performance for the period was helped by a colder than normal winter season, which resulted in record consumption of natural gas used for heating purposes. Finally, the Fund’s portfolio continues to be the beneficiary of the expanded role that natural gas plays in our nation’s energy needs.
The overall outlook for the natural gas distribution industry, which is the basis of the Fund, continues to be strong. With renewed concern about global warming, there is the need to replace coal as the fuel for electricity generation. Natural gas offers a solution that is environmentally friendly, with a supply that is readily available, with stable pricing. This bodes well for the companies in the Fund’s portfolio. Again, we thank you for your investor support.
HENNESSY FUNDS 1-800-966-4354
Performance for the AGA Stock Index is provided by the American Gas Association. As calculated by the American Gas Association, the total return of the AGA Stock Index reflects the appreciation or depreciation of the stocks in the AGA Stock Index plus all dividends paid on such stocks, but does not assume that the dividends are reinvested and compounded.
The AGA Stock Index is a market capitalization-weighted index, adjusted monthly, consisting of member companies of the AGA. The S&P 500 Index is an unmanaged index commonly used to measure the performance of U.S. stocks. You cannot invest directly in an index. Performance data for an index does not reflect any deductions for fees, expenses or taxes. The Fund is non-diversified, meaning it concentrates its assets in fewer holdings than a diversified fund and is therefore more exposed to individual stock volatility than a diversified fund. Investments are focused in the natural gas distribution and transmission industry, which may be adversely affected by rising interest rates, weather, and the wholesale pricing of alternative fuels. Investments in foreign securities may involve greater volatility and political, economic and currency risk and differences in accounting methods. While the Fund seeks to track the performance of the AGA Stock Index as closely as possible, the Fund’s return may not always be able to match or achieve a high correlation with the return of the AGA Stock Index. References to specific securities should not be considered a recommendation to buy or sell any security. Fund holdings and sector allocations are subject to change. Please refer to the Schedule of Investments included in this report for additional portfolio information.
Each Morningstar category average represents a universe of funds with similar investment objectives. © Morningstar, Inc. All Rights Reserved. The information contained herein: 1) is proprietary to Morningstar; 2) may not be copied or distributed and 3) is not warranted to be accurate, complete or timely. Neither Morningstar nor its content providers are responsible for any damages or losses arising from any use of this information. Past performance does not guarantee future results.
Schedule of Investments
HENNESSY GAS UTILITY INDEX FUND
As of April 30, 2014 (Unaudited)
(% of Net Assets)
| | TOP TEN HOLDINGS (EXCLUDING CASH/CASH EQUIVALENTS) | % NET ASSETS |
| | Cheniere Energy, Inc. | 5.01% |
| | Spectra Energy Corp. | 4.94% |
| | Sempra Energy | 4.93% |
| | Dominion Resources, Inc. | 4.92% |
| | Kinder Morgan, Inc. | 4.87% |
| | Energy Transfer Equity, LP | 4.87% |
| | National Grid PLC | 4.87% |
| | Enbridge, Inc. | 4.81% |
| | TransCanada Corp. | 4.76% |
| | NiSource, Inc. | 3.96% |
Note: For presentation purposes, the Fund has grouped some of the industry categories. For purposes of categorizing securities for compliance with Section 8(b)(1) of the Investment Company Act of 1940, the Fund uses more specific industry classifications.
HENNESSY FUNDS 1-800-966-4354
| | COMMON STOCKS – 93.23% | | Number | | | | | | % of | |
| | | | of Shares | | | Value | | | Net Assets | |
| | Energy – 25.73% | | | | | | | | | |
| | Cheniere Energy, Inc. (a) | | | 1,512,117 | | | $ | 85,359,005 | | | | 5.01 | % |
| | Enbridge, Inc. (c) | | | 1,695,348 | | | | 81,868,355 | | | | 4.81 | % |
| | Energen Corp. | | | 149,992 | | | | 11,685,877 | | | | 0.68 | % |
| | EQT Corp. | | | 103,460 | | | | 11,276,105 | | | | 0.66 | % |
| | Kinder Morgan, Inc. | | | 2,539,725 | | | | 82,947,418 | | | | 4.87 | % |
| | Spectra Energy Corp. | | | 2,117,615 | | | | 84,090,492 | | | | 4.94 | % |
| | TransCanada Corp. (c) | | | 1,738,827 | | | | 81,081,503 | | | | 4.76 | % |
| | | | | | | | | 438,308,755 | | | | 25.73 | % |
| | | | | | | | | | | | | | |
| | Financials – 0.66% | | | | | | | | | | | | |
| | Berkshire Hathaway, Inc., Class A (a) | | | 58 | | | | 11,209,950 | | | | 0.66 | % |
| | | | | | | | | | | | | | |
| | Utilities – 66.84% | | | | | | | | | | | | |
| | AGL Resources, Inc. | | | 955,416 | | | | 51,592,464 | | | | 3.03 | % |
| | ALLETE, Inc. | | | 3,050 | | | | 157,868 | | | | 0.01 | % |
| | Alliant Energy Corp. | | | 84,654 | | | | 4,950,566 | | | | 0.29 | % |
| | Ameren Corp. | | | 189,390 | | | | 7,823,701 | | | | 0.46 | % |
| | Atmos Energy Corp. | | | 991,762 | | | | 50,619,532 | | | | 2.97 | % |
| | Avista Corp. | | | 115,972 | | | | 3,728,500 | | | | 0.22 | % |
| | Black Hills Corp. | | | 97,459 | | | | 5,628,257 | | | | 0.33 | % |
| | Centerpoint Energy, Inc. | | | 1,530,226 | | | | 37,888,396 | | | | 2.22 | % |
| | Chesapeake Utilities Corp. | | | 80,161 | | | | 5,070,985 | | | | 0.30 | % |
| | CMS Energy Corp. | | | 784,648 | | | | 23,782,681 | | | | 1.40 | % |
| | Consolidated Edison, Inc. | | | 475,886 | | | | 27,615,665 | | | | 1.62 | % |
| | Corning Natural Gas Holding Corp. | | | 22,663 | | | | 412,467 | | | | 0.02 | % |
| | Delta Natural Gas Company, Inc. | | | 77,547 | | | | 1,478,821 | | | | 0.09 | % |
| | Dominion Resources, Inc. | | | 1,156,096 | | | | 83,863,204 | | | | 4.92 | % |
| | DTE Energy Co. | | | 269,954 | | | | 21,094,206 | | | | 1.24 | % |
| | Duke Energy Corp. | | | 146,337 | | | | 10,900,643 | | | | 0.64 | % |
| | Entergy Corp. | | | 16,050 | | | | 1,163,625 | | | | 0.07 | % |
| | Exelon Corp. | | | 472,881 | | | | 16,565,021 | | | | 0.97 | % |
| | Gas Natural, Inc. | | | 73,944 | | | | 805,990 | | | | 0.05 | % |
| | Iberdrola SA – ADR (c) | | | 468,823 | | | | 13,080,162 | | | | 0.77 | % |
| | Integrys Energy Group, Inc. | | | 402,488 | | | | 24,664,465 | | | | 1.45 | % |
| | MDU Resources Group, Inc. | | | 668,607 | | | | 23,682,060 | | | | 1.39 | % |
| | MGE Energy, Inc. | | | 55,496 | | | | 2,121,057 | | | | 0.12 | % |
The accompanying notes are an integral part of these financial statements.
| | COMMON STOCKS | | Number | | | | | | % of | |
| | | | of Shares | | | Value | | | Net Assets | |
| | Utilities (Continued) | | | | | | | | | |
| | National Fuel Gas Co. | | | 478,324 | | | $ | 35,223,779 | | | | 2.07 | % |
| | National Grid PLC – ADR (c) | | | 1,166,198 | | | | 82,870,030 | | | | 4.87 | % |
| | New Jersey Resources Corp. | | | 308,642 | | | | 15,348,767 | | | | 0.90 | % |
| | NiSource, Inc. | | | 1,856,131 | | | | 67,414,678 | | | | 3.96 | % |
| | Northeast Utilities | | | 192,475 | | | | 9,096,368 | | | | 0.53 | % |
| | Northwest Natural Gas Co. | | | 251,594 | | | | 11,138,066 | | | | 0.65 | % |
| | Northwestern Corp. | | | 119,198 | | | | 5,766,799 | | | | 0.34 | % |
| | One Gas, Inc. (a) | | | 546,078 | | | | 19,975,533 | | | | 1.17 | % |
| | ONEOK, Inc. | | | 959,315 | | | | 60,647,894 | | | | 3.56 | % |
| | Pepco Holdings, Inc. | | | 85,904 | | | | 2,298,791 | | | | 0.14 | % |
| | PG&E Corp. | | | 1,076,799 | | | | 49,080,498 | | | | 2.88 | % |
| | Piedmont Natural Gas Company, Inc. | | | 771,172 | | | | 27,600,246 | | | | 1.62 | % |
| | PPL Corp. | | | 607,035 | | | | 20,238,547 | | | | 1.19 | % |
| | Public Service Enterprise Group, Inc. | | | 955,790 | | | | 39,158,716 | | | | 2.30 | % |
| | Questar Corp. | | | 1,348,115 | | | | 32,732,232 | | | | 1.92 | % |
| | RGC Resources, Inc. | | | 48,967 | | | | 935,270 | | | | 0.06 | % |
| | SCANA Corp. | | | 251,466 | | | | 13,498,695 | | | | 0.79 | % |
| | Sempra Energy | | | 851,940 | | | | 84,009,803 | | | | 4.93 | % |
| | South Jersey Industries, Inc. | | | 228,177 | | | | 13,108,769 | | | | 0.77 | % |
| | Southwest Gas Corp. | | | 448,178 | | | | 24,654,272 | | | | 1.45 | % |
| | TECO Energy, Inc. | | | 294,736 | | | | 5,293,458 | | | | 0.31 | % |
| | The Empire District Electric Co. | | | 29,600 | | | | 719,872 | | | | 0.04 | % |
| | The Laclede Group, Inc. | | | 313,633 | | | | 14,869,340 | | | | 0.87 | % |
| | UGI Corp. | | | 244,935 | | | | 11,436,015 | | | | 0.67 | % |
| | UIL Holdings Corp. | | | 232,133 | | | | 8,526,245 | | | | 0.50 | % |
| | Unitil Corp. | | | 74,654 | | | | 2,478,513 | | | | 0.15 | % |
| | UNS Energy Corp. | | | 23,480 | | | | 1,410,209 | | | | 0.08 | % |
| | Vectren Corp. | | | 314,416 | | | | 12,755,857 | | | | 0.75 | % |
| | WGL Holdings, Inc. | | | 451,087 | | | | 17,948,752 | | | | 1.05 | % |
| | Wisconsin Energy Corp. | | | 248,460 | | | | 12,045,341 | | | | 0.71 | % |
| | Xcel Energy, Inc. | | | 548,399 | | | | 17,477,476 | | | | 1.03 | % |
| | | | | | | | | 1,138,449,167 | | | | 66.84 | % |
| | | | | | | | | | | | | | |
| | Total Common Stocks | | | | | | | | | | | | |
| | (Cost $1,151,366,256) | | | | | | | 1,587,967,872 | | | | 93.23 | % |
The accompanying notes are an integral part of these financial statements.
HENNESSY FUNDS 1-800-966-4354
| | PARTNERSHIPS – 5.57% | | Number | | | | | | % of | |
| | | | of Shares | | | Value | | | Net Assets | |
| | Energy – 5.57% | | | | | | | | | |
| | Energy Transfer Equity, LP | | | 1,779,408 | | | $ | 82,902,619 | | | | 4.87 | % |
| | Plains GP Holdings, LP | | | 435,000 | | | | 11,992,950 | | | | 0.70 | % |
| | | | | | | | | | | | | | |
| | Total Partnerships | | | | | | | | | | | | |
| | (Cost $43,352,818) | | | | | | | 94,895,569 | | | | 5.57 | % |
| | | | | | | | | | | | | | |
| | SHORT-TERM INVESTMENTS – 1.44% | | | | | | | | | | | | |
| | | | | | | | | | | | | | |
| | Money Market Funds – 1.44% | | | | | | | | | | | | |
| | Fidelity Government Portfolio – | | | | | | | | | | | | |
| | Institutional Class, 0.01% (b) | | | 24,448,813 | | | | 24,448,813 | | | | 1.44 | % |
| | | | | | | | | | | | | | |
| | Total Money Market Funds | | | | | | | | | | | | |
| | (Cost $24,448,813) | | | | | | | 24,448,813 | | | | 1.44 | % |
| | | | | | | | | | | | | | |
| | Total Short-Term Investments | | | | | | | | | | | | |
| | (Cost $24,448,813) | | | | | | | 24,448,813 | | | | 1.44 | % |
| | | | | | | | | | | | | | |
| | Total Investments | | | | | | | | | | | | |
| | (Cost $1,219,167,887) – 100.24% | | | | | | | 1,707,312,254 | | | | 100.24 | % |
| | Liabilities in Excess | | | | | | | | | | | | |
| | of Other Assets – (0.24)% | | | | | | | (4,051,380 | ) | | | (0.24 | )% |
| | TOTAL NET ASSETS – 100.00% | | | | | | $ | 1,703,260,874 | | | | 100.00 | % |
Percentages are stated as a percent of net assets.
ADR – American Depositary Receipt
| (a) | Non-income producing security. |
| (b) | The rate listed is the fund’s 7-day yield as of April 30, 2014. |
| (c) | U.S. traded security of a foreign corporation. |
The accompanying notes are an integral part of these financial statements.
Summary of Fair Value Exposure at April 30, 2014
The following is a summary of the inputs used to value the Fund’s net assets as of April 30, 2014 (See Note 3 in the accompanying notes to the financial statements):
| Common Stock | | Level 1 | | | Level 2 | | | Level 3 | | | Total | |
| Energy | | $ | 438,308,755 | | | $ | — | | | $ | — | | | $ | 438,308,755 | |
| Financials | | | 11,209,950 | | | | — | | | | — | | | | 11,209,950 | |
| Utilities | | | 1,138,449,167 | | | | — | | | | — | | | | 1,138,449,167 | |
| Total Common Stock | | $ | 1,587,967,872 | | | $ | — | | | $ | — | | | $ | 1,587,967,872 | |
| Partnerships | | | | | | | | | | | | | | | | |
| Energy | | $ | 94,895,569 | | | $ | — | | | $ | — | | | $ | 94,895,569 | |
| Total Partnerships | | $ | 94,895,569 | | | $ | — | | | $ | — | | | $ | 94,895,569 | |
| Short-Term Investments | | | | | | | | | | | | | | | | |
| Money Market Funds | | $ | 24,448,813 | | | $ | — | | | $ | — | | | $ | 24,448,813 | |
| Total Short-Term Investments | | $ | 24,448,813 | | | $ | — | | | $ | — | | | $ | 24,448,813 | |
| Total Investments | | $ | 1,707,312,254 | | | $ | — | | | $ | — | | | $ | 1,707,312,254 | |
Transfers between levels are recognized at the end of the reporting period. During the six-month period ended April 30, 2014, the Fund recognized transfers between Levels 1 and 2.
Below is a reconciliation that details the transfer of securities between Level 1 and Level 2 during the reporting period.
| | | Common Stock | |
| Transfers into Level 1 | | $ | 412,467 | |
| Transfers out of Level 1 | | | — | |
| Net transfers into/(out of) Level 1 | | | 412,467 | |
| Transfers into Level 2 | | | — | |
| Transfers out of Level 2 | | | (412,467 | ) |
| Net transfers into/(out of) Level 2 | | $ | (412,467 | ) |
The Fund transferred $412,467 from Level 2 to Level 1 at April 30, 2014. The security was transferred due to lack of an active market on October 31, 2013, but actively traded on April 30, 2014.
The accompanying notes are an integral part of these financial statements.
HENNESSY FUNDS 1-800-966-4354
Financial Statements
Statement of Assets and Liabilities as of April 30, 2014 (Unaudited) |
| ASSETS: | | | |
| Investments in securities, at value (cost $1,219,167,887) | | $ | 1,707,312,254 | |
| Cash | | | 613,028 | |
| Dividends and interest receivable | | | 2,740,238 | |
| Receivable for fund shares sold | | | 16,582,951 | |
| Return of capital receivable | | | 74,189 | |
| Prepaid expenses and other assets | | | 34,771 | |
| Total Assets | | | 1,727,357,431 | |
| | | | | |
| LIABILITIES: | | | | |
| Payable for securities purchased | | | 22,032,098 | |
| Payable for fund shares redeemed | | | 890,212 | |
| Payable to advisor | | | 527,936 | |
| Payable to administrator | | | 296,392 | |
| Payable to auditor | | | 9,472 | |
| Accrued trustees fees | | | 4,979 | |
| Accrued expenses and other payables | | | 335,468 | |
| Total Liabilities | | | 24,096,557 | |
| NET ASSETS | | $ | 1,703,260,874 | |
| | | | | |
| NET ASSETS CONSIST OF: | | | | |
| Capital stock | | $ | 1,220,106,304 | |
| Accumulated net investment income | | | 1,628,108 | |
| Accumulated net realized loss on investments | | | (6,613,953 | ) |
| Unrealized net appreciation on investments | | | 488,140,415 | |
| Total Net Assets | | $ | 1,703,260,874 | |
| | | | | |
| NET ASSETS | | | | |
| Investor Class: | | | | |
| Shares authorized (no par value) | | Unlimited | |
| Net assets applicable to outstanding Investor Class shares | | | 1,703,260,874 | |
| Shares issued and outstanding | | | 58,111,660 | |
| Net asset value, offering price and redemption price per share | | $ | 29.31 | |
The accompanying notes are an integral part of these financial statements.
Financial Statements
Statement of Operations Six Months Ended April 30, 2014 (Unaudited) |
| INVESTMENT INCOME: | | | |
Dividend income(1) | | $ | 20,563,005 | |
| Interest income | | | 1,007 | |
| Total investment income | | | 20,564,012 | |
| | | | | |
| EXPENSES: | | | | |
| Investment advisory fees | | | 2,693,187 | |
| Sub-transfer agent expenses – Investor Class (See Note 5) | | | 1,279,264 | |
| Administration, fund accounting, custody and transfer agent fees | | | 807,956 | |
| Reports to shareholders | | | 85,937 | |
| Federal and state registration fees | | | 19,776 | |
| Trustees’ fees and expenses | | | 12,645 | |
| Compliance expense | | | 10,655 | |
| Audit fees | | | 9,471 | |
| Legal fees | | | 2,976 | |
| Other expenses | | | 313,119 | |
| Total expenses | | | 5,234,986 | |
| NET INVESTMENT INCOME | | $ | 15,329,026 | |
| | | | | |
| REALIZED AND UNREALIZED GAINS: | | | | |
| Net realized gain on investments | | $ | 9,770,574 | |
| Change in unrealized appreciation on investments | | | 158,335,296 | |
| Net gain on investments | | | 168,105,870 | |
| NET INCREASE IN NET ASSETS RESULTING FROM OPERATIONS | | $ | 183,434,896 | |
| (1) | Net of foreign taxes withheld of $325,603. |
The accompanying notes are an integral part of these financial statements.
HENNESSY FUNDS 1-800-966-4354
(This Page Intentionally Left Blank.)
Financial Statements
| Statements of Changes in Net Assets |
| | | Six Months Ended | | | | |
| | | April 30, 2014 | | | Year Ended | |
| | | (Unaudited) | | | October 31, 2013 | |
| OPERATIONS: | | | | | | |
| Net investment income | | $ | 15,329,026 | | | $ | 23,732,673 | |
| Net realized gain on securities | | | 9,770,574 | | | | 20,377,887 | |
| Change in unrealized appreciation on securities | | | 158,335,296 | | | | 131,840,690 | |
| Net increase in net assets resulting from operations | | | 183,434,896 | | | | 175,951,250 | |
| | | | | | | | | |
| DISTRIBUTIONS TO SHAREHOLDERS FROM: | | | | | | | | |
| Net investment income | | | | | | | | |
| Investor Class | | | (13,700,918 | ) | | | (23,162,526 | ) |
| Net realized gains | | | | | | | | |
| Investor Class | | | (27,515,133 | ) | | | (17,562,108 | ) |
| Total distributions | | | (41,216,051 | ) | | | (40,724,634 | ) |
| | | | | | | | | |
| CAPITAL SHARE TRANSACTIONS: | | | | | | | | |
| Proceeds from shares subscribed – Investor Class | | | 481,404,758 | | | | 575,374,779 | |
| Dividends reinvested – Investor Class | | | 38,960,692 | | | | 38,473,417 | |
| Cost of shares redeemed – Investor Class | | | (142,114,269 | )(1) | | | (313,104,396 | )(2) |
| Net increase in net assets derived | | | | | | | | |
| from capital share transactions | | | 378,251,181 | | | | 300,743,800 | |
| TOTAL INCREASE IN NET ASSETS | | | 520,470,026 | | | | 435,970,416 | |
| | | | | | | | | |
| NET ASSETS: | | | | | | | | |
| Beginning of period | | | 1,182,790,848 | | | | 746,820,432 | |
| End of period | | $ | 1,703,260,874 | | | $ | 1,182,790,848 | |
| Undistributed net investment income, end of period | | $ | 1,628,108 | | | $ | — | |
| | | | | | | | | |
| CHANGES IN SHARES OUTSTANDING: | | | | | | | | |
| Shares sold – Investor Class | | | 17,545,097 | | | | 23,099,378 | |
| Shares issued to holders as reinvestment | | | | | | | | |
| of dividends – Investor Class | | | 1,482,604 | | | | 1,647,989 | |
| Shares redeemed – Investor Class | | | (5,233,658 | ) | | | (12,830,834 | ) |
| Net increase in shares outstanding | | | 13,794,043 | | | | 11,916,533 | |
| (1) | Net of redemption fees of $6,816 related to redemption fees imposed by the FBR Gas Utility Index Fund during a prior year but not received until the six-month period ended April 30, 2014. |
| (2) | Net of redemption fees of $4,408 related to redemption fees imposed by the FBR Gas Utility Index Fund during a prior year but not received until fiscal year 2013. |
The accompanying notes are an integral part of these financial statements.
HENNESSY FUNDS 1-800-966-4354
Financial Highlights
| Hennessy Gas Utility Index Fund |
For an Investor Class share outstanding throughout each period
| | | Six Months Ended | |
| | | April 30, 2014 | |
| | | (Unaudited) | |
| PER SHARE DATA: | | | |
| Net asset value, beginning of period | | $ | 26.69 | |
| | | | | |
| Income from investment operations: | | | | |
| Net investment income | | | 0.30 | |
| Net realized and unrealized gains on securities | | | 3.19 | |
| Total from investment operations | | | 3.49 | |
| | | | | |
| Less distributions: | | | | |
| Dividends from net investment income | | | (0.27 | ) |
| Dividends from realized capital gains | | | (0.60 | ) |
| Total distributions | | | (0.87 | ) |
| Paid-in capital from redemption fees | | | — | |
| Net asset value, end of period | | $ | 29.31 | |
| | | | | |
| TOTAL RETURN | | | 13.49 | %(4) |
| | | | | |
| SUPPLEMENTAL DATA AND RATIOS: | | | | |
| Net assets, end of period (millions) | | $ | 1,703.26 | |
| Ratio of expenses to average net assets: | | | | |
| Before expense reimbursement | | | 0.78 | %(3) |
| After expense reimbursement | | | 0.78 | %(3) |
| Ratio of net investment income to average net assets: | | | | |
| Before expense reimbursement | | | 2.28 | %(3) |
| After expense reimbursement | | | 2.28 | %(3) |
| Portfolio turnover rate | | | 5 | %(4) |
| (1) | Calculated based on average shares outstanding method. |
| (2) | Amount is less than $0.01. |
| (3) | Annualized. |
| (4) | Not annualized. |
The accompanying notes are an integral part of these financial statements.
| Year Ended October 31, | |
| 2013 | | | 2012 | | | 2011 | | | 2010 | | | 2009 | |
| | | | | | | | | | | | | | |
| $ | 23.05 | | | $ | 21.21 | | | $ | 17.83 | | | $ | 15.13 | | | $ | 15.26 | |
| | | | | | | | | | | | | | | | | | | |
| | | | | | | | | | | | | | | | | | | |
| | 0.62 | | | | 0.58 | | | | 0.51 | (1) | | | 0.58 | | | | 0.49 | |
| | 4.18 | | | | 1.99 | | | | 3.59 | | | | 2.72 | | | | 0.60 | |
| | 4.80 | | | | 2.57 | | | | 4.10 | | | | 3.30 | | | | 1.09 | |
| | | | | | | | | | | | | | | | | | | |
| | | | | | | | | | | | | | | | | | | |
| | (0.61 | ) | | | (0.58 | ) | | | (0.51 | ) | | | (0.58 | ) | | | (0.49 | ) |
| | (0.55 | ) | | | (0.16 | ) | | | (0.21 | ) | | | (0.02 | ) | | | (0.74 | ) |
| | (1.16 | ) | | | (0.74 | ) | | | (0.72 | ) | | | (0.60 | ) | | | (1.23 | ) |
| | 0.00 | (2) | | | 0.01 | | | | 0.00 | (2) | | | 0.00 | (2) | | | 0.01 | |
| $ | 26.69 | | | $ | 23.05 | | | $ | 21.21 | | | $ | 17.83 | | | $ | 15.13 | |
| | | | | | | | | | | | | | | | | | | |
| | 21.70 | % | | | 12.41 | % | | | 23.54 | % | | | 22.25 | % | | | 8.18 | % |
| | | | | | | | | | | | | | | | | | | |
| | | | | | | | | | | | | | | | | | | |
| $ | 1,182.79 | | | $ | 746.82 | | | $ | 433.78 | | | $ | 244.04 | | | $ | 193.68 | |
| | | | | | | | | | | | | | | | | | | |
| | 0.80 | % | | | 0.69 | % | | | 0.71 | % | | | 0.77 | % | | | 0.76 | % |
| | 0.80 | % | | | 0.69 | % | | | 0.71 | % | | | 0.76 | % | | | 0.76 | % |
| | | | | | | | | | | | | | | | | | | |
| | 2.56 | % | | | 2.72 | % | | | 2.68 | % | | | 3.50 | % | | | 3.51 | % |
| | 2.56 | % | | | 2.72 | % | | | 2.68 | % | | | 3.51 | % | | | 3.51 | % |
| | 18 | % | | | 16 | % | | | 17 | % | | | 16 | % | | | 26 | % |
The accompanying notes are an integral part of these financial statements.
HENNESSY FUNDS 1-800-966-4354
Notes to the Financial Statements
April 30, 2014 (Unaudited)
1). ORGANIZATION
The Hennessy Gas Utility Index Fund (the “Fund”) is a series of Hennessy Funds Trust (the “Trust”), which was organized as a Delaware statutory trust on September 17, 1992. The Fund is an open-end management investment company registered under the Investment Company Act of 1940, as amended. The Fund is a successor to the FBR Gas Utility Index Fund (the “Predecessor FBR Fund”), a series of The FBR Funds, a Delaware statutory trust, pursuant to a reorganization that took place after the close of business on October 26, 2012. Prior to October 26, 2012, the Fund had no investment operations. As a result of the reorganization, holders of the Investor Class shares of the Predecessor FBR Fund received Investor Class shares of the Fund (the Investor Class shares of the Fund are the successor to the accounting and performance information of the Predecessor FBR Fund). The investment objective of the Fund is income and capital appreciation. The Fund is a non-diversified fund.
The Fund offers Investor Class shares.
2). SIGNIFICANT ACCOUNTING POLICIES
The following is a summary of significant accounting policies consistently followed by the Fund in the preparation of the financial statements. These policies are in conformity with U.S. generally accepted accounting principles (“GAAP”).
| a). | Investment Valuation – All investments in securities are recorded at their estimated fair value, as described in Note 3. |
| b). | Federal Income Taxes – Provision for Federal income taxes or excise taxes has not been made since the Fund has elected to be taxed as a “regulated investment company” and intends to distribute substantially all of its taxable income to its shareholders and otherwise comply with the provisions of the Internal Revenue Code of 1986, as amended, applicable to regulated investment companies. Net investment income or loss and realized gains and losses for federal income tax purposes may differ from that reported on the financial statements because of temporary book and tax basis differences. Temporary differences are primarily the result of the treatment of wash sales for tax reporting purposes. Distributions from net realized gains for book purposes may include short-term capital gains, which are included as ordinary income to shareholders for tax purposes. |
| c). | Income and Expenses – Dividend income is recognized on the ex-dividend date or as soon as information is available to the Fund. Interest income, which includes the amortization of premium and accretion of discount, is recognized on an accrual basis. The Fund is charged for those expenses that are directly attributable to the portfolio, such as advisory, administration, and certain shareholder service fees. |
| d). | Distributions to Shareholders – Dividends from net investment income for the Fund, if any, are declared and paid out on a calendar quarter basis. Distributions of net realized capital gains, if any, are declared and paid annually, usually in November or December. |
| e). | Security Transactions – Investment and shareholder transactions are recorded on the trade date. The Fund determines the gain or loss realized from the investment transactions by comparing the original cost of the security lot sold with the net sale |
| | proceeds. Discounts and premiums on securities purchased are accreted/amortized over the life of the respective security. |
| f). | Use of Estimates – The preparation of financial statements in conformity with GAAP requires management to make estimates and assumptions that affect the reported amounts of assets and liabilities and disclosure of contingent assets and liabilities at the date of the financial statements and the reported change in net assets during the reporting period. Actual results could differ from those estimates. |
| g). | Share Valuation – The net asset value (“NAV”) per share of the Fund is calculated by dividing the sum of the value of the securities held by the Fund, plus cash or other assets, minus all liabilities (including estimated accrued expenses) by the total number of shares outstanding for the Fund, rounded to the nearest cent. The Fund’s shares will not be priced on days the New York Stock Exchange is closed for trading. The offering and redemption price per share for the Fund is equal to the Fund’s net asset value per share. |
| h). | Foreign Currency – Values of investments denominated in foreign currencies are converted into U.S. dollars using the spot market rate of exchange at the time of valuation. Purchases and sales of investments and income are translated into U.S. dollars using the spot market rate of exchange prevailing on the respective dates of such transactions. The Fund does not isolate the portion of the results of operations resulting from fluctuations in foreign exchange rates on investments from fluctuations resulting from changes in the market prices of securities held. Such fluctuations are included with the net realized and unrealized gain or loss on investments. Foreign investments present additional risks due to currency fluctuations, economic and political factors, lower liquidity, government regulations, differences in accounting standards, and other factors. |
| i). | Forward Contracts – The Fund may enter into forward currency contracts to reduce its exposure to changes in foreign currency exchange rates on its foreign holdings and to lock in the U.S. dollar cost of firm purchase and sale commitments for securities denominated in foreign currencies. A forward currency contract is a commitment to purchase or sell a foreign currency at a future date at a negotiated forward rate. The gain or loss arising from the difference between the U.S. dollar cost of the original contract and the value of the foreign currency in U.S. dollars upon closing of such contract is included in net realized gain or loss from foreign currency transactions. During the six months ended April 30, 2014, the Fund did not enter into any forward contracts. |
| j). | Repurchase Agreements – The Fund may enter into repurchase agreements with member banks or security dealers of the Federal Reserve Board whom the investment advisor deems creditworthy. The repurchase price generally equals the price paid by the Fund plus interest negotiated on the basis of current short-term rates. |
| | Securities pledged as collateral for repurchase agreements are held by the custodian bank until the respective agreements mature. Provisions of the repurchase agreements ensure that the market value of the collateral, including accrued interest thereon, is sufficient in the event of default of the counterparty. If the counterparty defaults and the value of the collateral declines or if the counterparty enters an insolvency proceeding, realization of the collateral by the Fund may be delayed or limited. |
| k). | Accounting for Uncertainty in Income Taxes – The Fund has adopted accounting policies regarding recognition and measurement of tax positions taken or expected to be taken on a tax return. The Fund has reviewed all open tax years in major jurisdictions |
HENNESSY FUNDS 1-800-966-4354
| | and concluded that there is no impact on the Fund’s net assets and no tax liability resulting from unrecognized tax benefits relating to uncertain income tax positions taken or expected to be taken on a tax return. The Fund’s major tax jurisdictions are U.S. Federal and Delaware. As of April 30, 2014, open Federal and state tax years for the Fund include the tax years ended October 31, 2011 through 2013. |
| l). | Derivatives – The Fund may invest in, or enter into, derivatives, such as options, futures contracts, options on futures contracts, and swaps, for a variety of reasons, including to hedge certain risks, to provide a substitute for purchasing or selling particular securities, or to increase potential income gain. Derivatives may provide a cheaper, quicker, or more specifically focused way for a Fund to invest than “traditional” securities would. The main purpose of utilizing these derivative instruments is for hedging purposes. |
| | The Fund has adopted the financial accounting reporting rules as required by the Derivatives and Hedging Topic of the Financial Accounting Standards Board Accounting Standards Codification. Under such rules, the Fund is required to include enhanced disclosure that enables investors to understand how and why an entity uses derivatives, how derivatives are accounted for, and how derivatives instruments affect an entity’s results of operations and financial position. During the six months ended April 30, 2014, the Fund did not hold any derivative instruments. |
| m). | Events Subsequent to the Fiscal Period End – The Fund has adopted financial reporting rules regarding subsequent events that require an entity to recognize in the financial statements the effects of all subsequent events that provide additional evidence about conditions that existed at the date of the balance sheet. Management has evaluated the Fund’s related events and transactions that occurred subsequent to April 30, 2014 through the date of issuance of the Fund’s financial statements. There were no events or transactions that occurred during this period that materially impacted the amounts or disclosures in the Fund’s financial statements. |
3). SECURITIES VALUATION
The Fund has adopted authoritative fair valuation accounting standards that establish an authoritative definition of fair value and set out a hierarchy for measuring fair value. These standards require additional disclosures about the various inputs and valuation techniques used to develop the measurements of fair value and a discussion in changes in valuation techniques and related inputs during the period. These inputs are summarized in the three broad levels listed below:
| | Level 1 – | Quoted unadjusted prices for identical instruments in active markets to which the Fund has access at the date of measurement. |
| | Level 2 – | Quoted prices for similar instruments in active markets; quoted prices for identical or similar instruments in markets that are not active; and model-derived valuations in which all significant inputs and significant value drivers are observable in active markets. Level 2 inputs are those in markets for which there are few transactions, the prices are not current, the prices are fair value adjusted due to post-market close subsequent events (foreign markets), little public information exists, or instances where prices vary substantially over time or among brokered market makers. These inputs may also include interest rates, prepayment speeds, credit risk curves, default rates, and similar data. |
| | Level 3 – | Model-derived valuations in which one or more significant inputs or significant value drivers are unobservable. Unobservable inputs are those |
| | inputs that reflect the Fund’s own assumptions about what market participants would use to price the asset or liability based on the best available information. |
Following is a description of the valuation techniques applied to the Fund’s major categories of assets and liabilities measured at fair value on a recurring basis.
Equity Securities – Equity securities, including common stocks, preferred stocks, foreign issued common stocks, exchange traded funds, closed-end mutual funds, and real estate investment trusts, that are traded on a securities exchange for which a last-quoted sales price is readily available will be valued at the last sales price as reported by the primary exchange on which the securities are listed. Securities listed on The NASDAQ Stock Market (“NASDAQ”) will be valued at the NASDAQ Official Closing Price, which may differ from the last sales price reported. Securities traded on a securities exchange for which a last-quoted sales price is not readily available will be valued at the mean between the bid and ask prices. To the extent these securities are actively traded and valuation adjustments are not applied, they are classified in Level 1 of the fair value hierarchy.
Investment Companies – Investments in investment companies (e.g., mutual funds and exchange traded funds) are generally priced at the ending NAV provided by the Fund’s service agent and will be classified in Level 1 of the fair value hierarchy.
Debt Securities – Debt securities, including corporate bonds, asset-backed securities, mortgage-backed securities, municipal bonds, U.S. Treasuries, and U.S. government agency issues, are valued at market on the basis of valuations furnished by an independent pricing service that utilizes both dealer-supplied valuations and formula-based techniques. The pricing service may consider recently executed transactions in securities of the issuer or comparable issuers, market price quotations (where observable), bond spreads, and fundamental data relating to the issuer. In addition, the model may incorporate market observable data such as reported sales of similar securities, broker quotes, yields, bids, offers, and reference data. Certain securities are valued principally using dealer quotations. These securities are generally classified in Level 2 of the fair value hierarchy.
Short-Term Securities – Short-term equity investments, including money market funds, are valued in the manner specified above. Short-term debt investments are valued at amortized cost, if their original maturity was 60 days or less, or by amortizing the values as of the 61st day prior to maturity, if their original term to maturity exceeded 60 days. Short-term securities are generally classified in Level 1 or Level 2 of the fair market hierarchy depending on the inputs used and market activity levels for specific securities.
The Board of Trustees of the Fund (the “Board”) has adopted fair value pricing procedures that are followed when a price for a security is not readily available or if a significant event has occurred that indicates the closing price of a security no longer represents the true value of that security. Fair value pricing determinations are made in good faith in accordance with these procedures. There are numerous criteria that will be given consideration in determining a fair value of a security. Some of these criteria are trading volume of security and markets, the value of other like securities, and news events with direct bearing to security or market. Fair value pricing results in an estimated price that reasonably reflects the current market conditions in order to rate the portfolio holdings such that shareholder transactions receive a fair net asset value. Depending on the relative significance of the valuation inputs, these securities may be classified in either Level 2 or Level 3 of the fair value hierarchy.
Fair valuing of foreign securities may be determined with the assistance of a pricing service using correlations between the movement of prices of such securities and indices
HENNESSY FUNDS 1-800-966-4354
of domestic securities and other appropriate indicators, such as closing market prices of relevant American Depositary Receipts or futures contracts. The effect of using fair value pricing is that the Fund’s NAV will reflect the affected portfolio securities’ value as determined in the judgment of the Board or its designee instead of being determined by the market. Using a fair value pricing methodology to price foreign securities may result in a value that is different from a foreign security’s most recent closing price and from the prices used by other investment companies to calculate their net asset values and are generally considered Level 2 prices in the fair valuation hierarchy. Because the Fund may invest in foreign securities, the value of the Fund’s portfolio securities may change on days when you will not be able to purchase or redeem your shares.
The Board has delegated day-to-day valuation matters to a Valuation Committee comprised of one or more representatives from Hennessy Advisors, Inc., the Fund’s investment advisor. The function of the Valuation Committee is to value securities where current and reliable market quotations are not readily available. All actions taken by the Valuation Committee are reviewed by the Board.
The Fund has performed an analysis of all existing investments to determine the significance and character of all inputs to their fair value determination. Various inputs are used in determining the value of the Fund’s investments. The inputs or methodology used for valuing securities are not necessarily an indication of the risk associated with investing in those securities. Details related to the fair valuation hierarchy of the Fund’s securities as of April 30, 2014 are included in the Fund’s Schedule of Investments.
4). INVESTMENT TRANSACTIONS
Purchases and sales of investment securities (excluding government and short-term investments) for the Fund during the six months ended April 30, 2014 were $428,786,470 and $74,562,337, respectively.
There were no purchases or sales/maturities of long-term U.S. Government Securities for the Fund for the six months ended April 30, 2014.
5). INVESTMENT MANAGEMENT FEE AND OTHER TRANSACTIONS WITH AFFILIATES
Hennessy Advisors, Inc. (the “Advisor”) is the investment advisor of the Fund. The Advisor provides the Fund with investment management services under an Investment Advisory Agreement. The Advisor furnishes all investment advice, office space, facilities, and provides most of the personnel needed by the Fund. As compensation for its services, the Advisor is entitled to a monthly fee from the Fund. The fee is based upon the average daily net assets of the Fund at the annual rate of 0.40%. The net investment advisory fees payable for the Fund as of April 30, 2014 were $527,936.
The Advisor has contractually agreed to limit the total annual operating expenses of the Fund (excluding interest, taxes, brokerage commissions, dividend expenses, acquired fund fees and expenses, extraordinary legal expenses, or any other extraordinary expenses and, from and after November 1, 2014, 12b-1 fees) to 0.85% of the Fund’s net assets through February 28, 2015.
For a period of three years after the year in which the Advisor waives or reimburses expenses, the Advisor may seek reimbursement from the Fund to the extent that total annual fund operating expenses are less than the expense limitation in effect at the time of the reimbursement. During the three years ended October 31, 2013, no Advisor fees were waived and therefore no expenses are subject to potential recovery.
The Fund has adopted a plan pursuant to Rule 12b-1 under the Investment Company Act of 1940, as amended, that authorizes payments in connection with the
distribution of the Fund’s shares at an annual rate of up to 0.25% of the Fund’s average daily net assets, but the plan will not be implemented prior to October 26, 2014. Amounts paid under the plan may be spent on any activities or expenses primarily intended to result in the sale of shares, including but not limited to, advertising, compensation for sales and marketing activities or financial institutions and others such as dealers and distributors, shareholder account servicing, the printing and mailing of prospectuses to other than current shareowners, and the printing and mailing of sales literature.
The Fund has entered into agreements with various brokers, dealers, and financial intermediaries in connection with the sale of shares of the Fund. The agreements provide for periodic payments by the Fund to the brokers, dealers, and financial intermediaries for providing certain shareholder maintenance services (sub-transfer agent expenses). These shareholder services include the pre-processing and quality control of new accounts, shareholder correspondence, answering customer inquiries regarding account status, and facilitating shareholder telephone transactions. Fees paid by the Fund to various brokers, dealers, and financial intermediaries for the six months ended April 30, 2014 were $1,279,264.
U.S. Bancorp Fund Services, LLC (“USBFS”) provides the Fund with administrative, fund accounting, and transfer agent services, including all regulatory reporting, and necessary office equipment and personnel. As administrator, USBFS prepares various federal and state regulatory filings, reports, and returns for the Fund; prepares reports and materials to be supplied to the Board; monitors the activities of the Fund’s custodian, transfer agent, and accountants; and coordinates the preparation and payment of the Fund’s expenses and reviews the Fund’s expense accruals. Fees paid to USBFS for the six months ended April 30, 2014 were $807,956.
U.S. Bank, N.A., an affiliate of USBFS, serves as the Fund’s custodian. Quasar Distributors, LLC acts as the Fund’s principal underwriter in a continuous public offering of the Fund’s shares. Quasar Distributors, LLC is an affiliate of USBFS and U.S. Bank, N.A.
6). LINE OF CREDIT
The Fund has a line of credit with the other funds in the Hennessy Funds family of funds (the “Hennessy Funds”) in the amount of the lesser of (i) $100,000,000 or (ii) 33.33% of each Hennessy Fund’s net assets, or 30% for the Hennessy Gas Utility Index Fund and 10% for the Hennessy Balanced Fund, intended to provide short-term financing, if necessary, subject to certain restrictions, in connection with shareholder redemptions. The credit facility is with the Hennessy Funds’ custodian bank, U.S. Bank, N.A. Borrowings under this arrangement bear interest at the bank’s prime rate. During the six months ended April 30, 2014, the Fund did not have any borrowings outstanding under the line of credit.
HENNESSY FUNDS 1-800-966-4354
7). FEDERAL TAX INFORMATION
As of October 31, 2013, the Fund’s most recent fiscal year end, the components of accumulated earnings (losses) for income tax purposes for the Fund were as follows:
| | Cost of investments for tax purposes | | $ | 869,739,852 | |
| | Gross tax unrealized appreciation | | $ | 338,296,903 | |
| | Gross tax unrealized depreciation | | | (24,875,224 | ) |
| | Net tax unrealized appreciation/depreciation | | $ | 313,421,679 | |
| | Undistributed ordinary income | | $ | 9,951,374 | |
| | Undistributed long-term capital gains | | | 17,563,261 | |
| | Total distributable earnings | | $ | 27,514,635 | |
| | Other accumulated gain (loss) | | $ | (589 | ) |
| | Total accumulated gain (loss) | | $ | 340,935,725 | |
The difference between book-basis and tax-basis unrealized appreciation is attributable primarily to capital loss carry overs, wash sales, and partnership adjustments.
At October 31, 2013, the Fund’s most recent fiscal year end, the Fund had no tax basis capital losses to offset future capital gains.
Capital losses sustained in the year ended October 31, 2012 and in future taxable years will not expire and may be carried over by the Fund without limitation; however, they will retain the character of the original loss. Furthermore, any losses incurred during those taxable years will be required to be utilized prior to the losses incurred in the pre-enactment taxable years. As a result of this ordering rule, pre-enactment capital loss carryforwards may be more likely to expire unused. Under pre-enactment law, capital losses could be carried forward for eight years, and carried forward as short-term capital losses, irrespective of the character of the original loss.
At October 31, 2013, the Fund did not defer, on a tax basis, any post-December late year ordinary loss deferrals or post-December loss deferrals.
The tax character of distributions paid during fiscal year 2014 (year-to-date) and fiscal year 2013 for the Fund were as follows:
| | | | Six Months Ended | | | Year Ended | |
| | | | April 30, 2014 | | | October 31, 2013 | |
| | Ordinary income | | $ | 23,652,336 | | | $ | 25,896,541 | |
| | Long-term capital gain | | | 17,563,715 | | | | 14,828,093 | |
| | | | $ | 41,216,051 | | | $ | 40,724,634 | |
Expense Example (Unaudited)
April 30, 2014
As a shareholder of the Fund, you incur two types of costs: (1) transaction costs, including sales charges (loads) on purchase payments, reinvested dividends, or other distributions; redemption fees; and exchange fees; and (2) ongoing costs, including management fees; service fees; and other Fund expenses. This Example is intended to help you understand your ongoing costs (in dollars) of investing in the Fund and to compare these costs with the ongoing costs of investing in other mutual funds. The Example is based on an investment of $1,000 invested at the beginning of the period and held for the entire period from November 1, 2013 through April 30, 2014.
Actual Expenses
The first line of the table below provides information about actual account values and actual expenses. Although the Fund charges no sales loads or transaction fees, you will be assessed fees for outgoing wire transfers, returned checks and stop payment orders at prevailing rates charged by U.S. Bancorp Fund Services, LLC, the Fund’s transfer agent. If you request that a redemption be made by wire transfer, currently a $15.00 fee is charged by the Fund’s transfer agent. IRA accounts will be charged a $15.00 annual maintenance fee. The example below includes, but is not limited to, management fees, shareholder servicing fees, fund accounting, custody, and transfer agent fees. However, the example below does not include portfolio trading commissions and related expenses, and other extraordinary expenses as determined under generally accepted accounting principles. You may use the information in this line, together with the amount you invested, to estimate the expenses that you paid over the period. Simply divide your account value by $1,000 (for example, an $8,600 account value divided by $1,000 = 8.6), then multiply the result by the number in the first line of the table under the heading entitled “Expenses Paid During Period” to estimate the expenses you paid on your account during this period.
Hypothetical Example for Comparison Purposes
The second line of the table below provides information about hypothetical account values and hypothetical expenses based on the Fund’s actual expense ratios and an assumed rate of return of 5% per year before expenses, which is not the Fund’s actual return. The hypothetical account values and expenses may not be used to estimate the actual ending account balance or expenses you paid for the period. You may use this information to compare the ongoing costs of investing in the Fund and other funds. To do so, compare this 5% hypothetical example with the 5% hypothetical examples that appear in the shareholder reports of the other funds. Please note that the expenses shown in the table are meant to highlight your ongoing costs only and do not reflect any transactional costs, such as sales charges (loads), or exchange fees. Therefore, the second line of the table is useful in comparing ongoing costs only, and will not help you determine the relative total costs of owning different funds. In addition, if these transactional costs were included, your costs would have been higher.
HENNESSY FUNDS 1-800-966-4354
| | | | Expenses Paid |
| | Beginning | Ending | During Period(1) |
| | Account Value | Account Value | November 1, 2013 – |
| | November 1, 2013 | April 30, 2014 | April 30, 2014 |
| Investor Class | | | |
| | | | |
| Actual | $1,000.00 | $1,134.90 | $4.13 |
| | | | |
| Hypothetical (5% return | | | |
| before expenses) | $1,000.00 | $1,020.93 | $3.91 |
| (1) | Expenses are equal to the Fund’s annualized expense ratio of 0.78%, multiplied by the average account value over the period, multiplied by 181/365 days (to reflect one-half year period). |
Proxy Voting
A description of the policies and procedures the Fund uses to determine how to vote proxies relating to portfolio securities is available without charge: (1) by calling 1-800-966-4354; (2) on the Hennessy Funds’ website at hennessyfunds.com; or (3) on the U.S. Securities and Exchange Commission’s (the “SEC”) website at www.sec.gov. The Fund’s proxy voting record is available on both the Hennessy Funds’ website at hennessyfunds.com and the SEC’s website at www.sec.gov no later than August 31 for the prior 12 months ending June 30.
Quarterly Filings on Form N-Q
The Fund files its complete schedule of portfolio holdings with the SEC for the first and third quarters of each fiscal year on Form N-Q. The Fund’s Forms N-Q are available on the SEC’s website at www.sec.gov. The Fund’s Forms N-Q may be reviewed and copied at the SEC’s Public Reference Room in Washington, DC and information on the operation of the Public Reference Room may be obtained by calling 1-800-SEC-0330. Information included in the Fund’s Forms N-Q will also be available upon request by calling 1-800-966-4354.
Federal Tax Distribution Information
(Unaudited)
For the fiscal year ended October 31, 2013, certain dividends paid by the Fund may be subject to a maximum tax rate of 15%, as provided for by the Jobs and Growth Tax Relief Reconciliation Act of 2003. The percentage of dividends declared from ordinary income designated as qualified dividend income was 96.62%.
For corporate shareholders, the percent of ordinary income distributions qualifying for the corporate dividends received deduction for the fiscal year ended October 31, 2013 was 81.42%.
The percentage of taxable ordinary income distributions that are designated as short-term capital gain distributions under Section 871(k)(2)(C) of the Internal Revenue Code of 1986, as amended, for the Fund was 12.43%.
Householding
To help keep the Fund’s costs as low as possible, we generally deliver a single copy of most financial reports and prospectuses to shareholders who share an address, even if the accounts are registered under different names. This process, known as “householding,” does not apply to account statements. You may, of course, request an individual copy of a prospectus or financial report at any time. If you would like to receive separate mailings, please call the Administrator at 1-800-261-6950 or 1-414-765-4124 and we will begin individual delivery within 30 days of your request. If your account is held through a financial institution or other intermediary, please contact them directly to request individual delivery.
HENNESSY FUNDS 1-800-966-4354
Board Approval of Investment Advisory
Agreement
At its meeting on March 3, 2014, the Board of Trustees of the Fund (the “Board”) unanimously approved the continuation of the investment advisory agreement of the Fund.
The Board reviewed a number of documents, including a memorandum provided by outside legal counsel that described the fiduciary duties of the Board with respect to approving the continuance of the investment advisory agreement and the relevant factors for consideration, a memorandum from the Advisor that listed each of the relevant factors and the documents provided to help the Board assess each such factor, the Advisor’s most recent Form 10-K and 10-Q, the Advisor’s Form ADV Part I, a document that listed the range of services provided by the Advisor for the Fund, a written discussion of economies of scale, a copy of the advisory agreement, a fund fact sheet, and peer expense and performance comparisons. The Board considered and discussed numerous factors, including the following:
| | • | The Board considered the services identified below that are provided by the Advisor: |
| | | • | The Advisor acts as portfolio manager for the Fund. In this capacity, the Advisor manages the composition of the portfolio of the Fund, including the purchase, retention, and disposition of portfolio securities in accordance with the Fund’s investment objectives, policies, and restrictions. |
| | | • | The Advisor performs daily reconciliations of portfolio positions and cash for the Fund. |
| | | • | The Advisor manages the use of soft dollars for the Fund. |
| | | • | The Advisor monitors compliance by the Fund with its investment objectives and restrictions. |
| | | • | The Advisor monitors compliance with federal securities laws and performs activities such as maintaining a compliance program, conducting ongoing reviews of the compliance programs of the Fund’s service providers, conducting on-site visits to the Fund’s service providers, monitoring incidents of abusive trading practices, reviewing Fund expense accruals, payments, and fixed expense ratios, evaluating insurance providers for fidelity bond coverage and D&O/E&O insurance coverage, conducting employee compliance training, reviewing reports provided by service providers, maintaining books and records, and preparing an annual compliance report to the Board. |
| | | • | The Advisor oversees service providers that support the Fund in providing fund accounting, fund administration, fund distribution, transfer agency, custodial, sales and marketing, audit, information technology, and legal services. |
| | | • | The Advisor maintains an in-house public relations and marketing department on behalf of the Fund. |
| | | • | The Advisor is actively involved with preparing regulatory filings for the Fund. |
| | | • | The Advisor manages proxy voting for the Fund. |
| | | • | The Advisor oversees distribution of the Fund through third-party broker/dealers and independent financial institutions such as Charles Schwab, Inc., Fidelity, TD Waterhouse, and Pershing. The Advisor participates in “no transaction fee” (“NTF”) programs with these companies on behalf of the Fund, |
| | | | which allows customers to purchase the Fund through third-party distribution channels without paying a transaction fee. The Advisor compensates a number of these third-party providers of NTF programs out of its own revenues and not those of the Fund. |
| | | • | The Advisor pays the incentive compensation of all of the Fund’s compliance officers and employs other staff such as management executives, legal personnel, marketing personnel, national accounts and distribution personnel, sales personnel, and trading oversight personnel. |
| | | • | The Advisor prepares or reviews Board materials, frequently presents to the Board or leads Board discussions, prepares or reviews meeting minutes, and arranges for Board training and education. |
| | • | The Board compared the performance of the Fund to benchmark indices over various periods of time and concluded that the positive performance of the Fund warranted the continuation of the advisory agreement. |
| | • | The Board reviewed the Fund’s expense ratio and comparable expense ratios for funds comparable to the Fund. The Board used data from Morningstar showing funds similar in asset size and investment objective to the Fund and determined that the expense ratio of the Fund falls within the range of the ratios of other comparable funds and concluded that the expenses of the Fund were reasonable. |
| | • | The Board considered the fees charged by the Advisor to those of funds similar in asset size and investment objective to the Fund and concluded the advisory fee of the Fund was reasonable and warranted continuation of the advisory agreement. The Trustees noted that the investment advisory fees are not adjusted if economies of scale are realized as the Fund grows because many of the expenses incurred by the Advisor to manage the Fund are asset-based fees and thus do not result in material economies of scale being realized as the net assets of the Fund increase. |
| | • | The Board considered the profitability of the Advisor with respect to the Fund and concluded the profits were reasonable and not excessive when compared to profitability guidelines set forth in relevant court cases. |
| | • | The Board considered the high level of professionalism and knowledge of the Advisor’s employees, along with an extremely low level of turnover of the employees of the Advisor, and concluded that this was beneficial to the Fund and its shareholders, as it ensures that the Fund is operated efficiently. |
All of the factors above were considered separately by the Board, including the Trustees who are not “interested persons” (as defined in the Investment Company Act of 1940, as amended) of the Fund (the “Independent Trustees”) meeting in an executive session. The factors were viewed in their totality by the Board, with no single factor being the principal or determinative factor in the Board’s determination of whether to approve the continuation of the advisory agreement. Based on the factors discussed above, the Board, including all of the Independent Trustees, recommended continuation of the advisory agreement.
HENNESSY FUNDS 1-800-966-4354
For information, questions or assistance, please call
The Hennessy Funds
1-800-966-4354 or 1-415-899-1555
INVESTMENT ADVISOR
Hennessy Advisors, Inc.
7250 Redwood Blvd., Suite 200
Novato, California 94945
ADMINISTRATOR,
TRANSFER AGENT,
DIVIDEND PAYING AGENT &
SHAREHOLDER SERVICING AGENT
U.S. Bancorp Fund Services, LLC
P.O. Box 701
Milwaukee, Wisconsin 53201-0701
CUSTODIAN
U.S. Bank N.A.
Custody Operations
1555 North River Center Dr., Suite 302
Milwaukee, Wisconsin 53212
TRUSTEES
Neil J. Hennessy
Robert T. Doyle
J. Dennis DeSousa
Gerald P. Richardson
COUNSEL
Foley & Lardner LLP
777 East Wisconsin Avenue
Milwaukee, Wisconsin 53202-5306
INDEPENDENT REGISTERED
PUBLIC ACCOUNTING FIRM
Tait, Weller & Baker LLP
1818 Market Street, Suite 2400
Philadelphia, Pennsylvania 19103
DISTRIBUTOR
Quasar Distributors, LLC
615 East Michigan Street
Milwaukee, Wisconsin 53202
hennessyfunds.com | 1-800-966-4354
This report has been prepared for shareholders and may be distributed to
others only if preceded or accompanied by a current prospectus.
SEMI-ANNUAL REPORT
APRIL 30, 2014
HENNESSY SMALL CAP
FINANCIAL FUND
Investor Class HSFNX
Institutional Class HISFX
hennessyfunds.com | 1-800-966-4354
(This Page Intentionally Left Blank.)
Contents
| Letter to Shareholders | 2 |
| Performance Overview | 4 |
| Financial Statements | |
| Schedule of Investments | 6 |
| Statement of Assets and Liabilities | 10 |
| Statement of Operations | 11 |
| Statements of Changes in Net Assets | 12 |
| Financial Highlights | 14 |
| Notes to the Financial Statements | 18 |
| Expense Example | 25 |
| Proxy Voting | 27 |
| Quarterly Filings on Form N-Q | 27 |
| Federal Tax Distribution Information | 27 |
| Householding | 27 |
| Board Approval of Investment Advisory Agreement | 28 |
HENNESSY FUNDS 1-800-966-4354
June 2014
Dear Shareholder:
The financial markets have provided strong returns over the past six-months ended April 30, 2014, with the Dow Jones Industrial Average (DJIA) and S&P 500 both returning approximately 8% during the period. The current valuation metrics of the major indices are solid; for example, the DJIA currently has a price-to-earnings ratio of 15x and a price-to-sales ratio of 1.75x. The DJIA also has a dividend yield of 2.2%, which is nearly as high as that of a 10-Year U.S. Treasury, which is currently yielding 2.6%. Investing in high-yielding, high-quality DJIA stocks have the potential to not only provide an income stream but also for stock price appreciation as well. Fixed income investing has run its course, in my opinion, and many individuals are currently benefiting from the return to investing in equities that possess strong fundamentals.
U.S. corporations continue to drive shareholder value by making acquisitions, initiating and raising dividends, investing in internal infrastructure, and buying back stock. However, lately I have begun to see a shift in those business strategies. The easier-to-execute acquisitions seem to be a thing of the past, and firms now have to be even more creative to execute accretive deals. I also believe that while firms may continue to initiate dividends, fewer firms will raise their dividends and fewer firms will participate in stock buyback programs going forward. So what will these cash-rich companies do with their capital if they are not raising dividends or buying back stock? I believe we will see companies begin to initiate capital expenditure programs.
Due to the continuing uncertainty from a lack of clear policies on taxes, healthcare, and regulations, I have observed that corporations would rather wait for clarity from our government leaders and defer any significant changes to their current business models. Up until this point, there has been no real cost for firms to defer spending their capital as they wait for anticipated guidance on policies that directly affect their businesses. But, this economic handcuffing from all of this uncertainty has gone on long enough. I believe there will now be firms who want to improve their margins and will begin spending money to expand their sales, and may even begin to hire. Once a competitor begins to move in this way, then the cost to defer becomes real for companies. This movement to expansion may well be a catalyst to propel the financial markets. I do believe this will be a slow shift, but one that will keep the economy improving, and should, in my opinion, help to generate reasonable market returns over the next few years.
With almost $3 trillion in cash sitting on the sidelines, this strategic shift by companies to begin spending their idle capital should help the economic recovery in the U.S. But that is only one part of the equation. Washington politics still play a role in how strong that recovery will be. The national political landscape will change in the next few years, and the future generation of elected officials will be faced with what I believe are fictitious unemployment figures (6.3% reported, when over 20 million Americans are looking for more work or a better job), a sluggish economy, and global competition in business. The next regime needs to provide real clarity on the issues that face all Americans and American corporations: taxation, regulation, and how to pay for our new healthcare system. I also believe that our government needs to regard business as a noble profession and to implement common sense and logic in their policy making instead of politics as usual. As Confucius is quoted as saying, “Life is really simple, but we insist on making it complicated.”
I am confident that even with all the hurdles facing corporate America, companies continue to provide good value for their shareholders, and I believe that means the financial markets are in good shape and should remain strong moving forward, I also believe that the next few months may be volatile. Fads come and go, and the current buzz on the Street is around investing in social media stocks. I believe that chasing hot products has contributed and will continue to contribute to the volatility of the markets this year. After over 35 years in the business, I still firmly believe the best way to position your portfolio is by investing in good companies over the long term, rather than trying to buy the next hot idea at exactly the right time. At Hennessy Funds, hunches and fads have no place in our investment process, and we understand that successful investing comes from time in the market, not timing the market.
We remain focused on investing based on proven fundamentals, and we are committed to managing money for the sole benefit of our shareholders. If you have any questions or want to speak with us directly, please don’t hesitate to call us at (800) 966-4354.
Best regards,
Neil J. Hennessy
President and Chief Investment Officer
Past performance does not guarantee future results.
Mutual fund investing involves risk. Principal loss is possible.
Opinions expressed are those of Neil Hennessy and are subject to change, are not guaranteed and should not be considered investment advice.
The Dow Jones Industrial Average and S&P 500 are unmanaged indices commonly used to measure the performance of U.S. stocks. One cannot invest directly in an index.
Price-to-sales ratio and price-to-earnings ratio are tools for calculating relative valuation. Price-to-sales ratio is calculated by dividing the market price by revenue per share. Price-to-earnings ratio is the market price per share divided by earnings per share.
HENNESSY FUNDS 1-800-966-4354
Performance Overview (Unaudited)
The opinions expressed in the following commentary reflect those of the Portfolio Managers as of the date written. Any such opinions are subject to change based on market or other conditions and are not guaranteed. These opinions may not be relied upon as investment advice. Investment decisions for the Fund are based on several factors, and may not be relied upon as an indication of trading intent on behalf of the Fund. Security positions can and do change.
AVERAGE ANNUAL TOTAL RETURN PERIODS ENDED APRIL 30, 2014
| | Six | One | Five | Ten |
| | Months(1) | Year | Years | Years |
| Hennessy Small Cap Financial Fund – | | | | |
| Investor Class (HSFNX) | 0.47% | 15.79% | 13.68% | 5.52% |
| Hennessy Small Cap Financial Fund – | | | | |
Institutional Class (HISFX)(2) | 0.58% | 16.16% | 13.87% | 5.67% |
Russell 2000® Financial | | | | |
| Services Index | 2.91% | 13.36% | 16.51% | 5.58% |
Russell 2000® Index | 3.08% | 20.50% | 19.84% | 8.67% |
Expense ratios: 1.50% (Investor Class); 1.19% (Institutional Class)
Performance data quoted represents past performance; past performance does not guarantee future results. The investment return and principal value of an investment will fluctuate so that an investor’s shares, when redeemed, may be worth more or less than their original cost. Current performance of the Fund may be lower or higher than the performance quoted. Performance data current to the most recent month end may be obtained by visiting hennessyfunds.com. Performance for periods prior to October 26, 2012 is that of the FBR Small Cap Financial Fund.
The expense ratios presented are from the most recent prospectus.
| (1) | Periods less than one year are not annualized. |
| (2) | The inception date of the Institutional Class shares is May 30, 2008. Performance shown prior to the inception of the Institutional Class shares reflects the performance of the Investor Class shares and includes expenses that are not applicable to and are higher than those of the Institutional Class shares. |
PERFORMANCE NARRATIVE
Portfolio Manager, David H. Ellison, and Co-Portfolio Manager, Ryan Kelley
Over the previous six months, how did the Fund perform and what factors contributed to this performance?
For the six-month period ended April 30, 2014, the Investor Class of the Hennessy Small Cap Financial Fund returned 0.47%, underperforming the Russell 2000® Financial Services Index, the Russell 2000® Index, and the Morningstar Financial Category Average, which returned 2.91%, 3.08%, and 5.20% for the same period, respectively.
Companies with the strongest performance contributions to the Fund during the period include mortgage insurance companies, commercial real estate finance companies, and traditional banks. Specific positions that contributed most strongly to the Fund’s performance include Genworth Financial, Inc., NorthStar Realty Finance Corp., and Popular, Inc. The Fund continues to hold all of these positions.
Companies detracting from the Fund’s performance during the period include mortgage banking companies. Specific positions that detracted from the Fund’s performance include Nationstar Mortgage Holdings, Inc., Ocwen Financial Corp., and
Stonegate Mortgage Corporation. The Fund no longer holds Nationstar Mortgage Holdings, Inc. or Ocwen Financial Corp.
Additional Portfolio Manager commentary and related investment outlook:
We are now in the fifth year of recovery from the depths of the most recent recession and housing crash. The banking industry just completed another year of recovery as credit, capital, liquidity, and liability structures improved. During the last twelve months, housing has shown real signs of recovery as prices and purchase activity increased noticeably. Headwinds do remain, however, as new compliance costs have increased, demand for loans remains muted by historical standards, and concerns about the overall strength of the economy have tempered enthusiasm for financial companies.
We have positioned the Fund in companies that we believe are prepared to take advantage of further economic recovery. Small capitalization financial companies are focused on housing as it relates to demand, credit, and lending spreads. Our research shows that small banks obtain approximately 80% of their revenues from the lending margin on residential housing. Any improvement in loan volumes and lending spreads should be meaningful to earnings growth going forward. Finally, industry consolidation activity has increased over the last twelve months. We expect this to become a factor in the Fund’s performance in the periods ahead.
We believe there is still much work to be done that could positively impact earnings for small financial companies going forward. Along with loan growth and improved spreads, there are cost containment objectives, fee income growth, reduced credit costs, and valuation benefits from increased consolidation. We strive to position the Fund to give shareholders national exposure to the best opportunities in the small capitalization financial space with attention to earnings growth, earnings quality, and valuation discipline.
The Russell 2000® Financial Services Index is an unmanaged index commonly used to measure the performance of U.S. small-capitalization financial sector stocks. The Russell 2000® Index is an unmanaged index commonly used to measure the performance of U.S. small-capitalization stocks. You cannot invest directly in an index. Performance data for an index does not reflect any deductions for fees, expenses or taxes. The Fund is non-diversified, meaning it concentrates its assets in fewer holdings than a diversified fund and is therefore more exposed to individual stock volatility than a diversified fund. The Fund invests in smaller-capitalization companies, which involves additional risks such as more limited liquidity and greater volatility than large-capitalization companies. Investments are focused in the financial services industry, which may be adversely affected by regulatory or other market conditions such as rising interest rates. References to specific securities should not be considered a recommendation to buy or sell any security. Fund holdings and sector allocations are subject to change. Please refer to the Schedule of Investments included in this report for additional portfolio information.
Earnings growth is not a measure of the Fund’s future performance.
Each Morningstar category average represents a universe of funds with similar investment objectives. © Morningstar, Inc. All Rights Reserved. The information contained herein: 1) is proprietary to Morningstar; 2) may not be copied or distributed and 3) is not warranted to be accurate, complete or timely. Neither Morningstar nor its content providers are responsible for any damages or losses arising from any use of this information. Past performance does not guarantee future results.
HENNESSY FUNDS 1-800-966-4354
Schedule of Investments
HENNESSY SMALL CAP FINANCIAL FUND
As of April 30, 2014 (Unaudited)
(% of Net Assets)
| | TOP TEN HOLDINGS (EXCLUDING CASH/CASH EQUIVALENTS) | % NET ASSETS |
| | Genworth Financial, Inc. | 4.09% |
| | Astoria Financial Corp. | 3.76% |
| | Washington Federal, Inc. | 3.63% |
| | Encore Capital Group, Inc. | 3.60% |
| | Synovus Financial Corp. | 3.58% |
| | Wintrust Financial Corp. | 3.56% |
| | BankUnited, Inc. | 3.56% |
| | Flushing Financial Corp. | 3.53% |
| | Radian Group, Inc. | 3.52% |
| | Zions Bancorporation | 3.50% |
Note: For presentation purposes, the Fund has grouped some of the industry categories. For purposes of categorizing securities for compliance with Section 8(b)(1) of the Investment Company Act of 1940, the Fund uses more specific industry classifications.
| | COMMON STOCKS – 97.38% | | Number | | | | | | % of | |
| | | | of Shares | | | Value | | | Net Assets | |
| | Consumer Discretionary – 1.28% | | | | | | | | | |
| | KB Home | | | 205,000 | | | $ | 3,384,550 | | | | 1.28 | % |
| | | | | | | | | | | | | | |
| | Financials – 95.15% | | | | | | | | | | | | |
| | Associated Banc-Corp. | | | 410,000 | | | | 7,195,500 | | | | 2.72 | % |
| | Astoria Financial Corp. | | | 750,000 | | | | 9,945,000 | | | | 3.76 | % |
| | Bancorp, Inc. Del (a) | | | 490,000 | | | | 7,751,800 | | | | 2.93 | % |
| | Bank Mutual Corp. | | | 30,000 | | | | 180,600 | | | | 0.07 | % |
| | BankUnited, Inc. | | | 285,000 | | | | 9,402,150 | | | | 3.56 | % |
| | Banner Corp. | | | 155,000 | | | | 6,128,700 | | | | 2.32 | % |
| | Capital Bank Financial Corp. (a) | | | 186,308 | | | | 4,443,446 | | | | 1.68 | % |
| | Center Bancorp, Inc. | | | 20,000 | | | | 370,200 | | | | 0.14 | % |
| | Centerstate Banks, Inc. | | | 105,000 | | | | 1,151,850 | | | | 0.43 | % |
| | Customers Bancorp, Inc. (a) | | | 240,000 | | | | 5,287,200 | | | | 2.00 | % |
| | Encore Capital Group, Inc. (a) | | | 220,000 | | | | 9,508,400 | | | | 3.60 | % |
| | Everbank Financial Corp. | | | 20,000 | | | | 374,400 | | | | 0.14 | % |
| | First Bancorp (a)(c) | | | 980,000 | | | | 5,037,200 | | | | 1.91 | % |
| | First Connecticut Bancorp, Inc. | | | 110,000 | | | | 1,743,500 | | | | 0.66 | % |
| | First Internet Bancorp | | | 188,480 | | | | 4,114,518 | | | | 1.56 | % |
| | Flagstar Bancorp, Inc. (a) | | | 375,000 | | | | 6,600,000 | | | | 2.50 | % |
| | Flushing Financial Corp. | | | 485,000 | | | | 9,321,700 | | | | 3.53 | % |
| | Fulton Financial Corp. | | | 365,000 | | | | 4,449,350 | | | | 1.68 | % |
| | Genworth Financial, Inc. (a) | | | 605,000 | | | | 10,799,250 | | | | 4.09 | % |
| | Green Dot Corp., Class A (a) | | | 25,000 | | | | 434,250 | | | | 0.16 | % |
| | Hingham Institution for Savings | | | 94,000 | | | | 6,533,940 | | | | 2.47 | % |
| | HomeStreet, Inc. | | | 376,000 | | | | 6,828,160 | | | | 2.58 | % |
| | Independent Bank Corp. – Mich (a) | | | 290,000 | | | | 3,775,800 | | | | 1.43 | % |
| | Independent Bank Corp. | | | 35,000 | | | | 1,299,200 | | | | 0.49 | % |
| | Investors Bancorp, Inc. | | | 235,000 | | | | 6,281,550 | | | | 2.38 | % |
| | KKR Financial Holdings LLC | | | 460,000 | | | | 5,308,400 | | | | 2.01 | % |
| | MBIA, Inc. (a) | | | 565,000 | | | | 6,847,800 | | | | 2.59 | % |
| | MGIC Investment Corp. (a) | | | 815,000 | | | | 7,009,000 | | | | 2.65 | % |
| | National Bank Holdings Corp. | | | 50,000 | | | | 958,000 | | | | 0.36 | % |
| | NorthStar Realty Finance Corp. | | | 180,000 | | | | 2,883,600 | | | | 1.09 | % |
| | OceanFirst Financial Corp. | | | 220,400 | | | | 3,574,888 | | | | 1.35 | % |
| | Pacwest Bancorp | | | 55,000 | | | | 2,165,350 | | | | 0.82 | % |
The accompanying notes are an integral part of these financial statements.
HENNESSY FUNDS 1-800-966-4354
| | COMMON STOCKS | | Number | | | | | | % of | |
| | | | of Shares | | | Value | | | Net Assets | |
| | Financials (Continued) | | | | | | | | | |
| | Popular, Inc. (a)(c) | | | 290,000 | | | $ | 8,961,000 | | | | 3.39 | % |
| | Portfolio Recovery Associates, Inc. (a) | | | 12,000 | | | | 685,800 | | | | 0.26 | % |
| | Provident Financial Services, Inc. | | | 490,000 | | | | 8,516,200 | | | | 3.22 | % |
| | Radian Group, Inc. | | | 665,000 | | | | 9,296,700 | | | | 3.52 | % |
| | RAIT Financial Trust | | | 435,000 | | | | 3,558,300 | | | | 1.35 | % |
| | Rockville Financial, Inc. | | | 160,000 | | | | 2,105,600 | | | | 0.80 | % |
| | Square 1 Financial, Inc. (a) | | | 95,000 | | | | 1,790,750 | | | | 0.68 | % |
| | Stonegate Mortgage Corp. (a) | | | 440,000 | | | | 5,566,000 | | | | 2.11 | % |
| | Susquehanna Bancshares, Inc. | | | 415,000 | | | | 4,299,400 | | | | 1.63 | % |
| | Synovus Financial Corp. | | | 2,950,000 | | | | 9,469,500 | | | | 3.58 | % |
| | Territorial Bancorp, Inc. | | | 90,000 | | | | 1,841,400 | | | | 0.70 | % |
| | UMPQUA Holdings Corp. | | | 292,425 | | | | 4,863,028 | | | | 1.84 | % |
| | United Financial Bancorp, Inc. | | | 85,000 | | | | 1,499,400 | | | | 0.57 | % |
| | Washington Federal, Inc. | | | 445,000 | | | | 9,603,100 | | | | 3.63 | % |
| | Webster Financial Corp. | | | 30,000 | | | | 904,200 | | | | 0.34 | % |
| | Wintrust Financial Corp. | | | 210,000 | | | | 9,412,200 | | | | 3.56 | % |
| | WSFS Financial Corp. | | | 31,700 | | | | 2,143,554 | | | | 0.81 | % |
| | Zions Bancorporation | | | 320,000 | | | | 9,254,400 | | | | 3.50 | % |
| | | | | | | | | 251,475,234 | | | | 95.15 | % |
| | | | | | | | | | | | | | |
| | Information Technology – 0.95% | | | | | | | | | | | | |
| | Move, Inc. (a) | | | 145,000 | | | | 1,550,050 | | | | 0.59 | % |
| | Total System Services, Inc. | | | 30,000 | | | | 953,100 | | | | 0.36 | % |
| | | | | | | | | 2,503,150 | | | | 0.95 | % |
| | | | | | | | | | | | | | |
| | Total Common Stocks | | | | | | | | | | | | |
| | (Cost $214,590,653) | | | | | | | 257,362,934 | | | | 97.38 | % |
The accompanying notes are an integral part of these financial statements.
| | SHORT-TERM INVESTMENTS – 2.29% | | Number | | | | | | % of | |
| | | | of Shares | | | Value | | | Net Assets | |
| | Money Market Funds – 2.29% | | | | | | | | | |
| | Fidelity Government Portfolio – | | | | | | | | | |
| | Institutional Class, 0.01% (b) | | | 6,046,707 | | | $ | 6,046,707 | | | | 2.29 | % |
| | | | | | | | | | | | | | |
| | Total Money Market Funds | | | | | | | | | | | | |
| | (Cost $6,046,707) | | | | | | | 6,046,707 | | | | 2.29 | % |
| | | | | | | | | | | | | | |
| | Total Short-Term Investments | | | | | | | | | | | | |
| | (Cost $6,046,707) | | | | | | | 6,046,707 | | | | 2.29 | % |
| | | | | | | | | | | | | | |
| | Total Investments | | | | | | | | | | | | |
| | (Cost $220,637,360) – 99.67% | | | | | | | 263,409,641 | | | | 99.67 | % |
| | Other Assets in | | | | | | | | | | | | |
| | Excess of Liabilities – 0.33% | | | | | | | 872,881 | | | | 0.33 | % |
| | TOTAL NET ASSETS – 100.00% | | | | | | $ | 264,282,522 | | | | 100.00 | % |
Percentages are stated as a percent of net assets.
| (a) | Non-income producing security. |
| (b) | The rate listed is the fund’s 7-day yield as of April 30, 2014. |
| (c) | U.S. traded security of a foreign corporation. |
Summary of Fair Value Exposure at April 30, 2014
The following is a summary of the inputs used to value the Fund’s net assets as of April 30, 2014 (See Note 3 in the accompanying notes to the financial statements):
| Common Stock | | Level 1 | | | Level 2 | | | Level 3 | | | Total | |
| Consumer Discretionary | | $ | 3,384,550 | | | $ | — | | | $ | — | | | $ | 3,384,550 | |
| Financials | | | 251,475,234 | | | | — | | | | — | | | | 251,475,234 | |
| Information Technology | | | 2,503,150 | | | | — | | | | — | | | | 2,503,150 | |
| Total Common Stock | | $ | 257,362,934 | | | $ | — | | | $ | — | | | $ | 257,362,934 | |
| Short-Term Investments | | | | | | | | | | | | | | | | |
| Money Market Funds | | $ | 6,046,707 | | | $ | — | | | $ | — | | | $ | 6,046,707 | |
| Total Short-Term Investments | | $ | 6,046,707 | | | $ | — | | | $ | — | | | $ | 6,046,707 | |
| Total Investments | | $ | 263,409,641 | | | $ | — | | | $ | — | | | $ | 263,409,641 | |
Transfers between levels are recognized at the end of the reporting period. During the six-month period ended April 30, 2014, the Fund recognized no transfers between levels.
The accompanying notes are an integral part of these financial statements.
HENNESSY FUNDS 1-800-966-4354
Financial Statements
Statement of Assets and Liabilities as of April 30, 2014 (Unaudited) |
| ASSETS: | | | |
| Investments in securities, at value (cost $220,637,360) | | $ | 263,409,641 | |
| Dividends and interest receivable | | | 67,944 | |
| Receivable for fund shares sold | | | 171,768 | |
| Receivable for securities sold | | | 2,365,644 | |
| Prepaid expenses and other assets | | | 23,555 | |
| Total Assets | | | 266,038,552 | |
| | | | | |
| LIABILITIES: | | | | |
| Payable for fund shares redeemed | | | 1,361,226 | |
| Payable to advisor | | | 207,553 | |
| Payable to administrator | | | 59,883 | |
| Payable to auditor | | | 9,473 | |
| Accrued distribution fees | | | 51,946 | |
| Accrued trustees fees | | | 4,940 | |
| Accrued expenses and other payables | | | 61,009 | |
| Total Liabilities | | | 1,756,030 | |
| NET ASSETS | | $ | 264,282,522 | |
| | | | | |
| NET ASSETS CONSIST OF: | | | | |
| Capital stock | | $ | 200,309,572 | |
| Accumulated net investment loss | | | (409,035 | ) |
| Accumulated net realized gain on investments | | | 21,609,704 | |
| Unrealized net appreciation on investments | | | 42,772,281 | |
| Total Net Assets | | $ | 264,282,522 | |
| | | | | |
| NET ASSETS | | | | |
| Investor Class: | | | | |
| Shares authorized (no par value) | | Unlimited | |
| Net assets applicable to outstanding Investor Class shares | | | 209,895,027 | |
| Shares issued and outstanding | | | 8,779,193 | |
| Net asset value, offering price and redemption price per share | | $ | 23.91 | |
| | | | | |
| Institutional Class: | | | | |
| Shares authorized (no par value) | | Unlimited | |
| Net assets applicable to outstanding Institutional Class shares | | | 54,387,495 | |
| Shares issued and outstanding | | | 3,783,594 | |
| Net asset value, offering price and redemption price per share | | $ | 14.37 | |
The accompanying notes are an integral part of these financial statements.
Financial Statements
Statement of Operations Six Months Ended April 30, 2014 (Unaudited) |
| INVESTMENT INCOME: | | | |
| Dividend income | | $ | 2,310,356 | |
| Interest income | | | 326 | |
| Total investment income | | | 2,310,682 | |
| | | | | |
| EXPENSES: | | | | |
| Investment advisory fees | | | 1,379,717 | |
| Distribution fees – Investor Class (See Note 5) | | | 300,209 | |
| Administration, fund accounting, custody and transfer agent fees | | | 183,963 | |
| Sub-transfer agent expenses – Investor Class (See Note 5) | | | 146,618 | |
| Sub-transfer agent expenses – Institutional Class (See Note 5) | | | 17,606 | |
| Reports to shareholders | | | 32,860 | |
| Federal and state registration fees | | | 18,562 | |
| Compliance expense | | | 10,655 | |
| Audit fees | | | 9,472 | |
| Trustees’ fees and expenses | | | 8,529 | |
| Legal fees | | | 2,480 | |
| Interest expense (See Note 6) | | | 582 | |
| Other expenses | | | 12,050 | |
| Total expenses | | | 2,123,303 | |
| NET INVESTMENT INCOME | | $ | 187,379 | |
| REALIZED AND UNREALIZED GAINS (LOSSES): | | | | |
| Net realized gain on investments | | $ | 24,571,730 | |
| Change in unrealized appreciation on investments | | | (21,473,411 | ) |
| Net gain on investments | | | 3,098,319 | |
| NET INCREASE IN NET ASSETS RESULTING FROM OPERATIONS | | $ | 3,285,698 | |
The accompanying notes are an integral part of these financial statements.
HENNESSY FUNDS 1-800-966-4354
Financial Statements
| Statements of Changes in Net Assets |
| | | Six Months Ended | | | | |
| | | April 30, 2014 | | | Year Ended | |
| | | (Unaudited) | | | October 31, 2013 | |
| OPERATIONS: | | | | | | |
| Net investment income | | $ | 187,379 | | | $ | 1,386,645 | |
| Net realized gain on securities | | | 24,571,730 | | | | 27,485,214 | |
| Change in unrealized appreciation (depreciation) | | | | | | | | |
| on securities | | | (21,473,411 | ) | | | 40,111,802 | |
| Net increase in net assets resulting from operations | | | 3,285,698 | | | | 68,983,661 | |
| | | | | | | | | |
| DISTRIBUTIONS TO SHAREHOLDERS FROM: | | | | | | | | |
| Net investment income | | | | | | | | |
| Investor Class | | | (583,882 | ) | | | (1,118,880 | ) |
| Institutional Class | | | (611,323 | ) | | | (520,872 | ) |
| Net realized gains | | | | | | | | |
| Investor Class | | | (15,192,378 | ) | | | — | |
| Institutional Class | | | (6,931,392 | ) | | | — | |
| Total distributions | | | (23,318,975 | ) | | | (1,639,752 | ) |
| | | | | | | | | |
| CAPITAL SHARE TRANSACTIONS: | | | | | | | | |
| Proceeds from shares subscribed – Investor Class | | | 15,857,413 | | | | 91,423,499 | |
| Proceeds from shares subscribed – Institutional Class | | | 3,929,622 | | | | 25,715,806 | |
| Dividends reinvested – Investor Class | | | 15,450,637 | | | | 1,096,037 | |
| Dividends reinvested – Institutional Class | | | 3,238,127 | | | | 123,116 | |
| Cost of shares redeemed – Investor Class | | | (51,142,355 | )(1) | | | (71,541,810 | )(2) |
| Cost of shares redeemed – Institutional Class | | | (15,240,174 | ) | | | (12,933,095 | ) |
| Net increase (decrease) in net assets derived | | | | | | | | |
| from capital share transactions | | | (27,906,730 | ) | | | 33,883,553 | |
| TOTAL INCREASE (DECREASE) IN NET ASSETS | | | (47,940,007 | ) | | | 101,227,462 | |
| | | | | | | | | |
| NET ASSETS: | | | | | | | | |
| Beginning of period | | | 312,222,529 | | | | 210,995,067 | |
| End of period | | $ | 264,282,522 | | | $ | 312,222,529 | |
| Undistributed net investment income (loss), end of period | | $ | (409,035 | ) | | $ | 598,791 | |
| (1) | Net of redemption fees of $12,269 related to redemption fees imposed by the FBR Small Cap Financial Fund during a prior year but not received until the six-month period ended April 30, 2014. |
| (2) | Net of redemption fees of $2,257 related to redemption fees imposed by the FBR Small Cap Financial Fund during a prior year but not received until fiscal year 2013. |
The accompanying notes are an integral part of these financial statements.
| Statements of Changes in Net Assets – Continued |
| | | Six Months Ended | | | | |
| | | April 30, 2014 | | | Year Ended | |
| | | (Unaudited) | | | October 31, 2013 | |
| CHANGES IN SHARES OUTSTANDING: | | | | | | |
| Shares sold – Investor Class | | | 628,937 | | | | 4,155,799 | |
| Shares sold – Institutional Class | | | 258,120 | | | | 1,761,812 | |
| Shares issued to holders as reinvestment | | | | | | | | |
| of dividends – Investor Class | | | 624,580 | | | | 55,049 | |
| Shares issued to holders as reinvestment | | | | | | | | |
| of dividends – Institutional Class | | | 216,312 | | | | 9,865 | |
| Shares redeemed – Investor Class | | | (2,056,136 | ) | | | (3,185,460 | ) |
| Shares redeemed – Institutional Class | | | (1,001,402 | ) | | | (1,010,378 | ) |
| Net increase (decrease) in shares outstanding | | | (1,329,589 | ) | | | 1,786,687 | |
The accompanying notes are an integral part of these financial statements.
HENNESSY FUNDS 1-800-966-4354
Financial Highlights
| Hennessy Small Cap Financial Fund |
For an Investor Class share outstanding throughout each period
| | | Six Months Ended | |
| | | April 30, 2014 | |
| | | (Unaudited) | |
| PER SHARE DATA: | | | |
| Net asset value, beginning of period | | $ | 25.40 | |
| | | | | |
| Income from investment operations: | | | | |
| Net investment income | | | 0.01 | |
| Net realized and unrealized gains (losses) on securities | | | 0.16 | |
| Total from investment operations | | | 0.17 | |
| | | | | |
| Less distributions: | | | | |
| Dividends from net investment income | | | (0.06 | ) |
| Dividends from net realized gains | | | (1.60 | ) |
| Total distributions | | | (1.66 | ) |
| Paid-in capital from redemption fees | | | — | |
| Net asset value, end of period | | $ | 23.91 | |
| | | | | |
| TOTAL RETURN | | | 0.47 | %(4) |
| | | | | |
| SUPPLEMENTAL DATA AND RATIOS: | | | | |
| Net assets, end of period (millions) | | $ | 209.90 | |
| Ratio of expenses to average net assets | | | 1.45 | %(5) |
| Ratio of net investment income to average net assets | | | 0.52 | %(5) |
Portfolio turnover rate(3) | | | 25 | %(4) |
| | | | | |
| (1) | Calculated based on average shares outstanding method. |
| (2) | Amount is less than $0.01. |
| (3) | Portfolio turnover is calculated on the basis of the Fund as a whole. |
| (4) | Not annualized. |
| (5) | Annualized |
The accompanying notes are an integral part of these financial statements.
| Year Ended October 31, | |
| 2013 | | | 2012 | | | 2011 | | | 2010 | | | 2009 | |
| | | | | | | | | | | | | | |
| $ | 19.54 | | | $ | 16.48 | | | $ | 18.11 | | | $ | 15.91 | | | $ | 15.22 | |
| | | | | | | | | | | | | | | | | | | |
| | | | | | | | | | | | | | | | | | | |
| | 0.10 | | | | 0.11 | | | | 0.21 | (1) | | | 0.08 | | | | 0.06 | |
| | 5.88 | | | | 3.24 | | | | (1.66 | ) | | | 2.17 | | | | 0.81 | |
| | 5.98 | | | | 3.35 | | | | (1.45 | ) | | | 2.25 | | | | 0.87 | |
| | | | | | | | | | | | | | | | | | | |
| | | | | | | | | | | | | | | | | | | |
| | (0.12 | ) | | | (0.29 | ) | | | (0.06 | ) | | | (0.07 | ) | | | (0.19 | ) |
| | — | | | | — | | | | (0.13 | ) | | | — | | | | — | |
| | (0.12 | ) | | | (0.29 | ) | | | (0.19 | ) | | | (0.07 | ) | | | (0.19 | ) |
| | 0.00 | (2) | | | 0.00 | (2) | | | 0.01 | | | | 0.02 | | | | 0.01 | |
| $ | 25.40 | | | $ | 19.54 | | | $ | 16.48 | | | $ | 18.11 | | | $ | 15.91 | |
| | | | | | | | | | | | | | | | | | | |
| | 30.80 | % | | | 20.65 | % | | | (8.12 | )% | | | 14.27 | % | | | 5.89 | % |
| | | | | | | | | | | | | | | | | | | |
| | | | | | | | | | | | | | | | | | | |
| $ | 243.42 | | | $ | 167.20 | | | $ | 154.21 | | | $ | 216.75 | | | $ | 187.56 | |
| | 1.46 | % | | | 1.45 | % | | | 1.52 | % | | | 1.51 | % | | | 1.51 | % |
| | 0.48 | % | | | 0.56 | % | | | 0.81 | % | | | 0.35 | % | | | 0.50 | % |
| | 57 | % | | | 43 | % | | | 70 | % | | | 89 | % | | | 118 | % |
The accompanying notes are an integral part of these financial statements.
HENNESSY FUNDS 1-800-966-4354
Financial Highlights
| Hennessy Small Cap Financial Fund |
For an Institutional Class share outstanding throughout each period
| | | Six Months Ended | |
| | | April 30, 2014 | |
| | | (Unaudited) | |
| PER SHARE DATA: | | | |
| Net asset value, beginning of period | | $ | 15.96 | |
| | | | | |
| Income from investment operations: | | | | |
| Net investment income | | | 0.00 | (2) |
| Net realized and unrealized gains (losses) on securities | | | 0.15 | |
| Total from investment operations | | | 0.15 | |
| | | | | |
| Less distributions: | | | | |
| Dividends from net investment income | | | (0.14 | ) |
| Dividends from net realized gains | | | (1.60 | ) |
| Total distributions | | | (1.74 | ) |
| Paid-in capital from redemption fees | | | — | |
| Net asset value, end of period | | $ | 14.37 | |
| | | | | |
| TOTAL RETURN | | | 0.58 | %(4) |
| | | | | |
| SUPPLEMENTAL DATA AND RATIOS: | | | | |
| Net assets, end of period (millions) | | $ | 54.39 | |
| Ratio of expenses to average net assets | | | 1.14 | %(5) |
| Ratio of net investment income to average net assets | | | 0.37 | %(5) |
Portfolio turnover rate(3) | | | 25 | %(4) |
| (1) | Calculated based on average shares outstanding method. |
| (2) | Amount is less than $0.01. |
| (3) | Portfolio turnover is calculated on the basis of the Fund as a whole. |
| (4) | Not annualized. |
| (5) | Annualized. |
The accompanying notes are an integral part of these financial statements.
| Year Ended October 31, | |
| 2013 | | | 2012 | | | 2011 | | | 2010 | | | 2009 | |
| | | | | | | | | | | | | | |
| $ | 12.34 | | | $ | 10.55 | | | $ | 11.70 | | | $ | 10.34 | | | $ | 9.96 | |
| | | | | | | | | | | | | | | | | | | |
| | | | | | | | | | | | | | | | | | | |
| | 0.14 | | | | 0.16 | | | | 0.19 | (1) | | | 0.09 | | | | 0.19 | |
| | 3.66 | | | | 1.98 | | | | (1.09 | ) | | | 1.40 | | | | 0.40 | |
| | 3.80 | | | | 2.14 | | | | (0.90 | ) | | | 1.49 | | | | 0.59 | |
| | | | | | | | | | | | | | | | | | | |
| | | | | | | | | | | | | | | | | | | |
| | (0.18 | ) | | | (0.35 | ) | | | (0.12 | ) | | | (0.13 | ) | | | (0.21 | ) |
| | — | | | | — | | | | (0.13 | ) | | | — | | | | — | |
| | (0.18 | ) | | | (0.35 | ) | | | (0.25 | ) | | | (0.13 | ) | | | (0.21 | ) |
| | — | | | | 0.00 | (2) | | | — | | | | 0.00 | (2) | | | — | |
| $ | 15.96 | | | $ | 12.34 | | | $ | 10.55 | | | $ | 11.70 | | | $ | 10.34 | |
| | | | | | | | | | | | | | | | | | | |
| | 31.18 | % | | | 20.95 | % | | | (8.00 | )% | | | 14.52 | % | | | 6.14 | % |
| | | | | | | | | | | | | | | | | | | |
| | | | | | | | | | | | | | | | | | | |
| $ | 68.80 | | | $ | 43.79 | | | $ | 19.89 | | | $ | 25.01 | | | $ | 10.64 | |
| | 1.15 | % | | | 1.25 | % | | | 1.34 | % | | | 1.23 | % | | | 1.56 | % |
| | 0.74 | % | | | 0.72 | % | | | 1.00 | % | | | 0.61 | % | | | 0.04 | % |
| | 57 | % | | | 43 | % | | | 70 | % | | | 89 | % | | | 118 | % |
The accompanying notes are an integral part of these financial statements.
HENNESSY FUNDS 1-800-966-4354
Notes to the Financial Statements
April 30, 2014 (Unaudited)
1). ORGANIZATION
The Hennessy Small Cap Financial (the “Fund”) is a series of Hennessy Funds Trust (the “Trust”), which was organized as a Delaware statutory trust on September 17, 1992. The Fund is an open-end management investment company registered under the Investment Company Act of 1940, as amended. The Fund is a successor to the FBR Small Cap Financial Fund (the “Predecessor FBR Fund”), a series of The FBR Funds, a Delaware statutory trust, pursuant to a reorganization that took place after the close of business on October 26, 2012. Prior to October 26, 2012, the Fund had no investment operations. As a result of the reorganization, holders of the Investor Class shares of the Predecessor FBR Fund received Investor Class shares of the Fund (the Investor Class shares of the Fund are the successor to the accounting and performance information of the Predecessor FBR Fund), and holders of the Institutional Class shares of the Predecessor FBR Fund received Institutional Class shares of the Fund (the Institutional Class shares of the Fund are the successor to the accounting and performance information of the Predecessor FBR Fund). The investment objective of the Fund is capital appreciation. The Fund is a non-diversified fund.
The Fund offers Investor Class and Institutional Class shares. Each class of shares differs principally in its respective administration, 12b-1 distribution and service fees, shareholder servicing, and transfer agent expenses and sales charges, if any. Each class has identical rights to earnings, assets, and voting privileges, except for class-specific expenses and exclusive rights to vote on matters affecting only individual classes.
2). SIGNIFICANT ACCOUNTING POLICIES
The following is a summary of significant accounting policies consistently followed by the Fund in the preparation of the financial statements. These policies are in conformity with U.S. generally accepted accounting principles (“GAAP”).
| a). | Investment Valuation – All investments in securities are recorded at their estimated fair value, as described in Note 3. |
| b). | Federal Income Taxes – Provision for Federal income taxes or excise taxes has not been made since the Fund has elected to be taxed as a “regulated investment company” and intends to distribute substantially all of its taxable income to its shareholders and otherwise comply with the provisions of the Internal Revenue Code of 1986, as amended, applicable to regulated investment companies. Net investment income or loss and realized gains and losses for federal income tax purposes may differ from that reported on the financial statements because of temporary book and tax basis differences. Temporary differences are primarily the result of the treatment of wash sales for tax reporting purposes. Distributions from net realized gains for book purposes may include short-term capital gains, which are included as ordinary income to shareholders for tax purposes. |
| c). | Income and Expenses – Dividend income is recognized on the ex-dividend date or as soon as information is available to the Fund. Interest income, which includes the amortization of premium and accretion of discount, is recognized on an accrual basis. The Fund is charged for those expenses that are directly attributable to the portfolio, such as advisory, administration, and certain shareholder service fees. Income, |
| | expenses (other than expenses attributable to a specific class), and realized and unrealized gains or losses on investments are allocated to each class of shares based on its respective net assets. |
| d). | Distributions to Shareholders – Dividends from net investment income for the Fund, if any, are declared and paid out annually, usually in November or December. Distributions of net realized capital gains, if any, are declared and paid annually, usually in November or December. |
| e). | Security Transactions – Investment and shareholder transactions are recorded on the trade date. The Fund determines the gain or loss realized from the investment transactions by comparing the original cost of the security lot sold with the net sale proceeds. Discounts and premiums on securities purchased are accreted/amortized over the life of the respective security. |
| f). | Use of Estimates – The preparation of financial statements in conformity with GAAP requires management to make estimates and assumptions that affect the reported amounts of assets and liabilities and disclosure of contingent assets and liabilities at the date of the financial statements and the reported change in net assets during the reporting period. Actual results could differ from those estimates. |
| g). | Share Valuation – The net asset value (“NAV”) per share of the Fund is calculated by dividing the sum of the value of the securities held by the Fund, plus cash or other assets, minus all liabilities (including estimated accrued expenses) by the total number of shares outstanding for the Fund, rounded to the nearest cent. The Fund’s shares will not be priced on days the New York Stock Exchange is closed for trading. The offering and redemption price per share for the Fund is equal to the Fund’s net asset value per share. |
| h). | Foreign Currency – Values of investments denominated in foreign currencies are converted into U.S. dollars using the spot market rate of exchange at the time of valuation. Purchases and sales of investments and income are translated into U.S. dollars using the spot market rate of exchange prevailing on the respective dates of such transactions. The Fund does not isolate the portion of the results of operations resulting from fluctuations in foreign exchange rates on investments from fluctuations resulting from changes in the market prices of securities held. Such fluctuations are included with the net realized and unrealized gain or loss on investments. Foreign investments present additional risks due to currency fluctuations, economic and political factors, lower liquidity, government regulations, differences in accounting standards, and other factors. |
| i). | Forward Contracts – The Fund may enter into forward currency contracts to reduce its exposure to changes in foreign currency exchange rates on its foreign holdings and to lock in the U.S. dollar cost of firm purchase and sale commitments for securities denominated in foreign currencies. A forward currency contract is a commitment to purchase or sell a foreign currency at a future date at a negotiated forward rate. The gain or loss arising from the difference between the U.S. dollar cost of the original contract and the value of the foreign currency in U.S. dollars upon closing of such contract is included in net realized gain or loss from foreign currency transactions. During the six months ended April 30, 2014, the Fund did not enter into any forward contracts. |
| j). | Repurchase Agreements – The Fund may enter into repurchase agreements with member banks or security dealers of the Federal Reserve Board whom the investment advisor deems creditworthy. The repurchase price generally equals the price paid by the Fund plus interest negotiated on the basis of current short-term rates. |
HENNESSY FUNDS 1-800-966-4354
| | Securities pledged as collateral for repurchase agreements are held by the custodian bank until the respective agreements mature. Provisions of the repurchase agreements ensure that the market value of the collateral, including accrued interest thereon, is sufficient in the event of default of the counterparty. If the counterparty defaults and the value of the collateral declines or if the counterparty enters an insolvency proceeding, realization of the collateral by the Fund may be delayed or limited. |
| k). | Accounting for Uncertainty in Income Taxes – The Fund has adopted accounting policies regarding recognition and measurement of tax positions taken or expected to be taken on a tax return. The Fund has reviewed all open tax years in major jurisdictions and concluded that there is no impact on the Fund’s net assets and no tax liability resulting from unrecognized tax benefits relating to uncertain income tax positions taken or expected to be taken on a tax return. The Fund’s major tax jurisdictions are U.S. Federal and Delaware. As of April 30, 2014, open Federal and state tax years for the Fund include the tax years ended October 31, 2011 through 2013. |
| l). | Derivatives – The Fund may invest in, or enter into, derivatives, such as options, futures contracts, options on futures contracts, and swaps, for a variety of reasons, including to hedge certain risks, to provide a substitute for purchasing or selling particular securities, or to increase potential income gain. Derivatives may provide a cheaper, quicker, or more specifically focused way for a Fund to invest than “traditional” securities would. The main purpose of utilizing these derivative instruments is for hedging purposes. |
| | The Fund has adopted the financial accounting reporting rules as required by the Derivatives and Hedging Topic of the Financial Accounting Standards Board Accounting Standards Codification. Under such rules, the Fund is required to include enhanced disclosure that enables investors to understand how and why an entity uses derivatives, how derivatives are accounted for, and how derivatives instruments affect an entity’s results of operations and financial position. During the six months ended April 30, 2014, the Fund did not hold any derivative instruments. |
| m). | Events Subsequent to the Fiscal Period End – The Fund has adopted financial reporting rules regarding subsequent events that require an entity to recognize in the financial statements the effects of all subsequent events that provide additional evidence about conditions that existed at the date of the balance sheet. Management has evaluated the Fund’s related events and transactions that occurred subsequent to April 30, 2014 through the date of issuance of the Fund’s financial statements. There were no events or transactions that occurred during this period that materially impacted the amounts or disclosures in the Fund’s financial statements. |
3). SECURITIES VALUATION
The Fund has adopted authoritative fair valuation accounting standards that establish an authoritative definition of fair value and set out a hierarchy for measuring fair value. These standards require additional disclosures about the various inputs and valuation techniques used to develop the measurements of fair value and a discussion in changes in valuation techniques and related inputs during the period. These inputs are summarized in the three broad levels listed below:
| | Level 1 – | Quoted unadjusted prices for identical instruments in active markets to which the Fund has access at the date of measurement. |
| | Level 2 – | Quoted prices for similar instruments in active markets; quoted prices for identical or similar instruments in markets that are not active; and model-derived valuations in which all significant inputs and significant value drivers are observable in active markets. Level 2 inputs are those in markets for which there are few transactions, the prices are not current, the prices are fair value adjusted due to post-market close subsequent events (foreign markets), little public information exists, or instances where prices vary substantially over time or among brokered market makers. These inputs may also include interest rates, prepayment speeds, credit risk curves, default rates, and similar data. |
| | Level 3 – | Model-derived valuations in which one or more significant inputs or significant value drivers are unobservable. Unobservable inputs are those inputs that reflect the Fund’s own assumptions about what market participants would use to price the asset or liability based on the best available information. |
Following is a description of the valuation techniques applied to the Fund’s major categories of assets and liabilities measured at fair value on a recurring basis.
Equity Securities – Equity securities, including common stocks, preferred stocks, foreign issued common stocks, exchange traded funds, closed-end mutual funds, and real estate investment trusts, that are traded on a securities exchange for which a last-quoted sales price is readily available will be valued at the last sales price as reported by the primary exchange on which the securities are listed. Securities listed on The NASDAQ Stock Market (“NASDAQ”) will be valued at the NASDAQ Official Closing Price, which may differ from the last sales price reported. Securities traded on a securities exchange for which a last-quoted sales price is not readily available will be valued at the mean between the bid and ask prices. To the extent these securities are actively traded and valuation adjustments are not applied, they are classified in Level 1 of the fair value hierarchy.
Investment Companies – Investments in investment companies (e.g., mutual funds and exchange traded funds) are generally priced at the ending NAV provided by the Fund’s service agent and will be classified in Level 1 of the fair value hierarchy.
Debt Securities – Debt securities, including corporate bonds, asset-backed securities, mortgage-backed securities, municipal bonds, U.S. Treasuries, and U.S. government agency issues, are valued at market on the basis of valuations furnished by an independent pricing service that utilizes both dealer-supplied valuations and formula-based techniques. The pricing service may consider recently executed transactions in securities of the issuer or comparable issuers, market price quotations (where observable), bond spreads, and fundamental data relating to the issuer. In addition, the model may incorporate market observable data such as reported sales of similar securities, broker quotes, yields, bids, offers, and reference data. Certain securities are valued principally using dealer quotations. These securities are generally classified in Level 2 of the fair value hierarchy.
Short-Term Securities – Short-term equity investments, including money market funds, are valued in the manner specified above. Short-term debt investments are valued at amortized cost, if their original maturity was 60 days or less, or by amortizing the values as of the 61st day prior to maturity, if their original term to maturity exceeded 60 days. Short-term securities are generally classified in Level 1 or Level 2 of the fair market hierarchy depending on the inputs used and market activity levels for specific securities.
The Board of Trustees of the Fund (the “Board”) has adopted fair value pricing procedures that are followed when a price for a security is not readily available or if a
HENNESSY FUNDS 1-800-966-4354
significant event has occurred that indicates the closing price of a security no longer represents the true value of that security. Fair value pricing determinations are made in good faith in accordance with these procedures. There are numerous criteria that will be given consideration in determining a fair value of a security. Some of these criteria are trading volume of security and markets, the value of other like securities, and news events with direct bearing to security or market. Fair value pricing results in an estimated price that reasonably reflects the current market conditions in order to rate the portfolio holdings such that shareholder transactions receive a fair net asset value. Depending on the relative significance of the valuation inputs, these securities may be classified in either Level 2 or Level 3 of the fair value hierarchy.
Fair valuing of foreign securities may be determined with the assistance of a pricing service using correlations between the movement of prices of such securities and indices of domestic securities and other appropriate indicators, such as closing market prices of relevant American Depositary Receipts or futures contracts. The effect of using fair value pricing is that the Fund’s NAV will reflect the affected portfolio securities’ value as determined in the judgment of the Board or its designee instead of being determined by the market. Using a fair value pricing methodology to price foreign securities may result in a value that is different from a foreign security’s most recent closing price and from the prices used by other investment companies to calculate their net asset values and are generally considered Level 2 prices in the fair valuation hierarchy. Because the Fund may invest in foreign securities, the value of the Fund’s portfolio securities may change on days when you will not be able to purchase or redeem your shares.
The Board has delegated day-to-day valuation matters to a Valuation Committee comprised of one or more representatives from Hennessy Advisors, Inc., the Fund’s investment advisor. The function of the Valuation Committee is to value securities where current and reliable market quotations are not readily available. All actions taken by the Valuation Committee are reviewed by the Board.
The Fund has performed an analysis of all existing investments to determine the significance and character of all inputs to their fair value determination. Various inputs are used in determining the value of the Fund’s investments. The inputs or methodology used for valuing securities are not necessarily an indication of the risk associated with investing in those securities. Details related to the fair valuation hierarchy of the Fund’s securities as of April 30, 2014 are included in the Fund’s Schedule of Investments.
4). INVESTMENT TRANSACTIONS
Purchases and sales of investment securities (excluding government and short-term investments) for the Fund during the six months ended April 30, 2014 were $74,289,048 and $124,494,309, respectively.
There were no purchases or sales/maturities of long-term U.S. Government Securities for the Fund for the six months ended April 30, 2014.
5). INVESTMENT MANAGEMENT FEE AND OTHER TRANSACTIONS WITH AFFILIATES
Hennessy Advisors, Inc. (the “Advisor”) is the investment advisor of the Fund. The Advisor provides the Fund with investment management services under an Investment Advisory Agreement. The Advisor furnishes all investment advice, office space, facilities, and provides most of the personnel needed by the Fund. As compensation for its services, the Advisor is entitled to a monthly fee from the Fund. The fee is based upon the average daily net assets of the Fund at the annual rate of 0.90%. The net investment advisory fees payable for the Fund as of April 30, 2014 were $207,553.
The Advisor has contractually agreed to limit the total annual operating expenses of the Fund (excluding interest, taxes, brokerage commissions, dividend expenses, acquired fund fees and expenses, extraordinary legal expenses, or any other extraordinary expenses and, from and after November 1, 2014, 12b-1 fees) to 1.95% and 1.70% of the Fund’s net assets for the Investor Class shares and Institutional Class shares of the Fund, respectively, through February 28, 2015.
For a period of three years after the year in which the Advisor waives or reimburses expenses, the Advisor may seek reimbursement from the Fund to the extent that total annual fund operating expenses are less than the expense limitation in effect at the time of the reimbursement. During the three years ended October 31, 2013, no Advisor fees were waived and therefore no expenses are subject to potential recovery.
The Fund has adopted a plan pursuant to Rule 12b-1 under the Investment Company Act of 1940, as amended, that authorizes payments in connection with the distribution of the Fund’s shares at an annual rate of up to 0.25% of the Fund’s average daily net assets. Amounts paid under the plan may be spent on any activities or expenses primarily intended to result in the sale of shares, including but not limited to, advertising, compensation for sales and marketing activities or financial institutions and others such as dealers and distributors, shareholder account servicing, the printing and mailing of prospectuses to other than current shareowners, and the printing and mailing of sales literature.
The Fund has entered into agreements with various brokers, dealers, and financial intermediaries in connection with the sale of shares of the Fund. The agreements provide for periodic payments by the Fund to the brokers, dealers, and financial intermediaries for providing certain shareholder maintenance services (sub-transfer agent expenses). These shareholder services include the pre-processing and quality control of new accounts, shareholder correspondence, answering customer inquiries regarding account status, and facilitating shareholder telephone transactions. Fees paid by the Fund to various brokers, dealers, and financial intermediaries for the six months ended April 30, 2014 were $164,224.
U.S. Bancorp Fund Services, LLC (“USBFS”) provides the Fund with administrative, fund accounting, and transfer agent services, including all regulatory reporting, and necessary office equipment and personnel. As administrator, USBFS prepares various federal and state regulatory filings, reports, and returns for the Fund; prepares reports and materials to be supplied to the Board; monitors the activities of the Fund’s custodian, transfer agent, and accountants; and coordinates the preparation and payment of the Fund’s expenses and reviews the Fund’s expense accruals. Fees paid to USBFS for the six months ended April 30, 2014 were $183,963.
U.S. Bank, N.A., an affiliate of USBFS, serves as the Fund’s custodian. Quasar Distributors, LLC acts as the Fund’s principal underwriter in a continuous public offering of the Fund’s shares. Quasar Distributors, LLC is an affiliate of USBFS and U.S. Bank, N.A.
6). LINE OF CREDIT
The Fund has a line of credit with the other funds in the Hennessy Funds family of funds (the “Hennessy Funds”) in the amount of the lesser of (i) $100,000,000 or (ii) 33.33% of each Hennessy Fund’s net assets, or 30% for the Hennessy Gas Utility Index Fund and 10% for the Hennessy Balanced Fund, intended to provide short-term financing, if necessary, subject to certain restrictions, in connection with shareholder redemptions. The credit facility is with the Hennessy Funds’ custodian bank, U.S. Bank, N.A. Borrowings under this arrangement bear interest at the bank’s prime rate. During the six months
HENNESSY FUNDS 1-800-966-4354
ended April 30, 2014, the Fund had an outstanding average daily balance and a weighted average interest rate of $36,635 and 3.25%, respectively. The maximum amount outstanding for the Fund during the period was $3,328,000.
7). FEDERAL TAX INFORMATION
As of October 31, 2013, the Fund’s most recent fiscal year end, the components of accumulated earnings (losses) for income tax purposes for the Fund were as follows:
| Cost of investments for tax purposes | | $ | 252,322,381 | |
| Gross tax unrealized appreciation | | $ | 68,513,862 | |
| Gross tax unrealized depreciation | | | (7,656,886 | ) |
| Net tax unrealized appreciation/depreciation | | $ | 60,856,976 | |
| Undistributed ordinary income | | $ | 3,301,727 | |
| Undistributed long-term capital gains | | | 19,847,524 | |
| Total distributable earnings | | $ | 23,149,251 | |
| Other accumulated gain (loss) | | $ | — | |
| Total accumulated gain (loss) | | $ | 84,006,227 | |
The difference between book-basis and tax-basis unrealized appreciation is attributable primarily to capital loss carry overs, wash sales, and partnership adjustments.
At October 31, 2013, the Fund’s most recent fiscal year end, the Fund had no tax basis capital losses to offset future capital gains.
During the year ended October 31, 2013, the Fund’s most recent fiscal year end, the capital loss carry forwards utilized for the Fund were $3,656,683.
Capital losses sustained in the year ended October 31, 2012 and in future taxable years will not expire and may be carried over by the Fund without limitation; however, they will retain the character of the original loss. Furthermore, any losses incurred during those taxable years will be required to be utilized prior to the losses incurred in the pre-enactment taxable years. As a result of this ordering rule, pre-enactment capital loss carryforwards may be more likely to expire unused. Under pre-enactment law, capital losses could be carried forward for eight years, and carried forward as short-term capital losses, irrespective of the character of the original loss.
At October 31, 2013, the Fund did not defer, on a tax basis, any post-December late year ordinary loss deferrals or post-December loss deferrals.
The tax character of distributions paid during fiscal year 2014 (year-to-date) and fiscal year 2013 for the Fund were as follows:
| | | | Six Months Ended | | | Year Ended | |
| | | | April 30, 2014 | | | October 31, 2013 | |
| | Ordinary income | | $ | 3,471,345 | | | $ | 1,639,752 | |
| | Long-term capital gain | | | 19,847,630 | | | | — | |
| | | | $ | 23,318,975 | | | $ | 1,639,752 | |
Expense Example (Unaudited)
April 30, 2014
As a shareholder of the Fund, you incur two types of costs: (1) transaction costs, including sales charges (loads) on purchase payments, reinvested dividends, or other distributions; redemption fees; and exchange fees; and (2) ongoing costs, including management fees; service fees; and other Fund expenses. This Example is intended to help you understand your ongoing costs (in dollars) of investing in the Fund and to compare these costs with the ongoing costs of investing in other mutual funds. The Example is based on an investment of $1,000 invested at the beginning of the period and held for the entire period from November 1, 2013 through April 30, 2014.
Actual Expenses
The first line of the table below under the “Investor Class” and “Institutional Class” headings provides information about actual account values and actual expenses. Although the Fund charges no sales loads or transaction fees, you will be assessed fees for outgoing wire transfers, returned checks and stop payment orders at prevailing rates charged by U.S. Bancorp Fund Services, LLC, the Fund’s transfer agent. If you request that a redemption be made by wire transfer, currently a $15.00 fee is charged by the Fund’s transfer agent. IRA accounts will be charged a $15.00 annual maintenance fee. The example below includes, but is not limited to, management fees, shareholder servicing fees, fund accounting, custody, and transfer agent fees. However, the example below does not include portfolio trading commissions and related expenses, and other extraordinary expenses as determined under generally accepted accounting principles. You may use the information in this line, together with the amount you invested, to estimate the expenses that you paid over the period. Simply divide your account value by $1,000 (for example, an $8,600 account value divided by $1,000 = 8.6), then multiply the result by the number in the first line of the table under the “Investor Class” and “Institutional Class” headings in the column entitled “Expenses Paid During Period” to estimate the expenses you paid on your account during this period.
Hypothetical Example for Comparison Purposes
The second line of the table below under the “Investor Class” and “Institutional Class” headings provides information about hypothetical account values and hypothetical expenses based on the Fund’s actual expense ratios and an assumed rate of return of 5% per year before expenses, which is not the Fund’s actual return. The hypothetical account values and expenses may not be used to estimate the actual ending account balance or expenses you paid for the period. You may use this information to compare the ongoing costs of investing in the Fund and other funds. To do so, compare this 5% hypothetical example with the 5% hypothetical examples that appear in the shareholder reports of the other funds. Please note that the expenses shown in the table are meant to highlight your ongoing costs only and do not reflect any transactional costs, such as sales charges (loads), or exchange fees. Therefore, the second line of the table under the “Investor Class” and “Institutional Class” headings is useful in comparing ongoing costs only, and will not help you determine the relative total costs of owning different funds. In addition, if these transactional costs were included, your costs would have been higher.
HENNESSY FUNDS 1-800-966-4354
| | | | Expenses Paid |
| | Beginning | Ending | During Period(1) |
| | Account Value | Account Value | November 1, 2013 – |
| | November 1, 2013 | April 30, 2014 | April 30, 2014 |
| Investor Class | | | |
| | | | |
| Actual | $1,000.00 | $1,004.70 | $7.21 |
| | | | |
| Hypothetical (5% return | | | |
| before expenses) | $1,000.00 | $1,017.60 | $7.25 |
| | | | |
| Institutional Class | | | |
| | | | |
| Actual | $1,000.00 | $1,005.80 | $5.67 |
| | | | |
| Hypothetical (5% return | | | |
| before expenses) | $1,000.00 | $1,019.14 | $5.71 |
| (1) | Expenses are equal to the Fund’s annualized expense ratio of 1.45% for Investor Class shares or 1.14% for Institutional Class shares, as applicable, multiplied by the average account value over the period, multiplied by 181/365 days (to reflect one-half year period). |
Proxy Voting
A description of the policies and procedures the Fund uses to determine how to vote proxies relating to portfolio securities is available without charge: (1) by calling 1-800-966-4354; (2) on the Hennessy Funds’ website at hennessyfunds.com; or (3) on the U.S. Securities and Exchange Commission’s (the “SEC”) website at www.sec.gov. The Fund’s proxy voting record is available on both the Hennessy Funds’ website at hennessyfunds.com and the SEC’s website at www.sec.gov no later than August 31 for the prior 12 months ending June 30.
Quarterly Filings on Form N-Q
The Fund files its complete schedule of portfolio holdings with the SEC for the first and third quarters of each fiscal year on Form N-Q. The Fund’s Forms N-Q are available on the SEC’s website at www.sec.gov. The Fund’s Forms N-Q may be reviewed and copied at the SEC’s Public Reference Room in Washington, DC and information on the operation of the Public Reference Room may be obtained by calling 1-800-SEC-0330. Information included in the Fund’s Forms N-Q will also be available upon request by calling 1-800-966-4354.
Federal Tax Distribution Information
(Unaudited)
For the fiscal year ended October 31, 2013, certain dividends paid by the Fund may be subject to a maximum tax rate of 15%, as provided for by the Jobs and Growth Tax Relief Reconciliation Act of 2003. The percentage of dividends declared from ordinary income designated as qualified dividend income was 95.82%.
For corporate shareholders, the percent of ordinary income distributions qualifying for the corporate dividends received deduction for the fiscal year ended October 31, 2013 was 91.25%.
The percentage of taxable ordinary income distributions that are designated as short-term capital gain distributions under Section 871(k)(2)(C) of the Internal Revenue Code of 1986, as amended, for the Fund was 0.00%.
Householding
To help keep the Fund’s costs as low as possible, we generally deliver a single copy of most financial reports and prospectuses to shareholders who share an address, even if the accounts are registered under different names. This process, known as “householding,” does not apply to account statements. You may, of course, request an individual copy of a prospectus or financial report at any time. If you would like to receive separate mailings, please call the Administrator at 1-800-261-6950 or 1-414-765-4124 and we will begin individual delivery within 30 days of your request. If your account is held through a financial institution or other intermediary, please contact them directly to request individual delivery.
HENNESSY FUNDS 1-800-966-4354
Agreement
At its meeting on March 3, 2014, the Board of Trustees of the Fund (the “Board”) unanimously approved the continuation of the investment advisory agreement of the Fund.
The Board reviewed a number of documents, including a memorandum provided by outside legal counsel that described the fiduciary duties of the Board with respect to approving the continuance of the investment advisory agreement and the relevant factors for consideration, a memorandum from the Advisor that listed each of the relevant factors and the documents provided to help the Board assess each such factor, the Advisor’s most recent Form 10-K and 10-Q, the Advisor’s Form ADV Part I, a document that listed the range of services provided by the Advisor for the Fund, a written discussion of economies of scale, a copy of the advisory agreement, a fund fact sheet, and peer expense and performance comparisons. The Board considered and discussed numerous factors, including the following:
| | • | The Board considered the services identified below that are provided by the Advisor: |
| | | • | The Advisor acts as portfolio manager for the Fund. In this capacity, the Advisor manages the composition of the portfolio of the Fund, including the purchase, retention, and disposition of portfolio securities in accordance with the Fund’s investment objectives, policies, and restrictions. |
| | | • | The Advisor performs daily reconciliations of portfolio positions and cash for the Fund. |
| | | • | The Advisor manages the use of soft dollars for the Fund. |
| | | • | The Advisor monitors compliance by the Fund with its investment objectives and restrictions. |
| | | • | The Advisor monitors compliance with federal securities laws and performs activities such as maintaining a compliance program, conducting ongoing reviews of the compliance programs of the Fund’s service providers, conducting on-site visits to the Fund’s service providers, monitoring incidents of abusive trading practices, reviewing Fund expense accruals, payments, and fixed expense ratios, evaluating insurance providers for fidelity bond coverage and D&O/E&O insurance coverage, conducting employee compliance training, reviewing reports provided by service providers, maintaining books and records, and preparing an annual compliance report to the Board. |
| | | • | The Advisor oversees service providers that support the Fund in providing fund accounting, fund administration, fund distribution, transfer agency, custodial, sales and marketing, audit, information technology, and legal services. |
| | | • | The Advisor maintains an in-house public relations and marketing department on behalf of the Fund. |
| | | • | The Advisor is actively involved with preparing regulatory filings for the Fund. |
| | | • | The Advisor manages proxy voting for the Fund. |
| | | • | The Advisor oversees distribution of the Fund through third-party broker/dealers and independent financial institutions such as Charles Schwab, Inc., Fidelity, TD Waterhouse, and Pershing. The Advisor participates in “no transaction fee” (“NTF”) programs with these companies on behalf of the Fund, |
| | | | which allows customers to purchase the Fund through third-party distribution channels without paying a transaction fee. The Advisor compensates a number of these third-party providers of NTF programs out of its own revenues and not those of the Fund. |
| | | • | The Advisor pays the incentive compensation of all of the Fund’s compliance officers and employs other staff such as management executives, legal personnel, marketing personnel, national accounts and distribution personnel, sales personnel, and trading oversight personnel. |
| | | • | The Advisor prepares or reviews Board materials, frequently presents to the Board or leads Board discussions, prepares or reviews meeting minutes, and arranges for Board training and education. |
| | • | The Board compared the performance of the Fund to benchmark indices over various periods of time and concluded that the positive performance of the Fund warranted the continuation of the advisory agreement. |
| | • | The Board reviewed the Fund’s expense ratio and comparable expense ratios for funds comparable to the Fund. The Board used data from Morningstar showing funds similar in asset size and investment objective to the Fund and determined that the expense ratio of the Fund falls within the range of the ratios of other comparable funds and concluded that the expenses of the Fund were reasonable. |
| | • | The Board considered the fees charged by the Advisor to those of funds similar in asset size and investment objective to the Fund and concluded the advisory fee of the Fund was reasonable and warranted continuation of the advisory agreement. The Trustees noted that the investment advisory fees are not adjusted if economies of scale are realized as the Fund grows because many of the expenses incurred by the Advisor to manage the Fund are asset-based fees and thus do not result in material economies of scale being realized as the net assets of the Fund increase. |
| | • | The Board considered the profitability of the Advisor with respect to the Fund and concluded the profits were reasonable and not excessive when compared to profitability guidelines set forth in relevant court cases. |
| | • | The Board considered the high level of professionalism and knowledge of the Advisor’s employees, along with an extremely low level of turnover of the employees of the Advisor, and concluded that this was beneficial to the Fund and its shareholders, as it ensures that the Fund is operated efficiently. |
All of the factors above were considered separately by the Board, including the Trustees who are not “interested persons” (as defined in the Investment Company Act of 1940, as amended) of the Fund (the “Independent Trustees”) meeting in an executive session. The factors were viewed in their totality by the Board, with no single factor being the principal or determinative factor in the Board’s determination of whether to approve the continuation of the advisory agreement. Based on the factors discussed above, the Board, including all of the Independent Trustees, recommended continuation of the advisory agreement.
HENNESSY FUNDS 1-800-966-4354
For information, questions or assistance, please call
The Hennessy Funds
1-800-966-4354 or 1-415-899-1555
INVESTMENT ADVISOR
Hennessy Advisors, Inc.
7250 Redwood Blvd., Suite 200
Novato, California 94945
ADMINISTRATOR,
TRANSFER AGENT,
DIVIDEND PAYING AGENT &
SHAREHOLDER SERVICING AGENT
U.S. Bancorp Fund Services, LLC
P.O. Box 701
Milwaukee, Wisconsin 53201-0701
CUSTODIAN
U.S. Bank N.A.
Custody Operations
1555 North River Center Dr., Suite 302
Milwaukee, Wisconsin 53212
TRUSTEES
Neil J. Hennessy
Robert T. Doyle
J. Dennis DeSousa
Gerald P. Richardson
COUNSEL
Foley & Lardner LLP
777 East Wisconsin Avenue
Milwaukee, Wisconsin 53202-5306
INDEPENDENT REGISTERED
PUBLIC ACCOUNTING FIRM
Tait, Weller & Baker LLP
1818 Market Street, Suite 2400
Philadelphia, Pennsylvania 19103
DISTRIBUTOR
Quasar Distributors, LLC
615 East Michigan Street
Milwaukee, Wisconsin 53202
hennessyfunds.com | 1-800-966-4354
This report has been prepared for shareholders and may be distributed to
others only if preceded or accompanied by a current prospectus.
SEMI-ANNUAL REPORT
APRIL 30, 2014
HENNESSY LARGE CAP
FINANCIAL FUND
Investor Class HLFNX
hennessyfunds.com | 1-800-966-4354
(This Page Intentionally Left Blank.)
Contents
| Letter to Shareholders | | 2 |
| Performance Overview | | 4 |
| Financial Statements | | |
| Schedule of Investments | | 6 |
| Statement of Assets and Liabilities | | 10 |
| Statement of Operations | | 11 |
| Statements of Changes in Net Assets | | 13 |
| Financial Highlights | | 14 |
| Notes to the Financial Statements | | 16 |
| Expense Example | | 23 |
| Proxy Voting | | 25 |
| Quarterly Filings on Form N-Q | | 25 |
| Federal Tax Distribution Information | | 25 |
| Householding | | 25 |
| Board Approval of Investment Advisory Agreement | | 26 |
HENNESSY FUNDS 1-800-966-4354
June 2014
Dear Shareholder:
The financial markets have provided strong returns over the past six-months ended April 30, 2014, with the Dow Jones Industrial Average (DJIA) and S&P 500 both returning approximately 8% during the period. The current valuation metrics of the major indices are solid; for example, the DJIA currently has a price-to-earnings ratio of 15x and a price-to-sales ratio of 1.75x. The DJIA also has a dividend yield of 2.2%, which is nearly as high as that of a 10-Year U.S. Treasury, which is currently yielding 2.6%. Investing in high-yielding, high-quality DJIA stocks have the potential to not only provide an income stream but also for stock price appreciation as well. Fixed income investing has run its course, in my opinion, and many individuals are currently benefiting from the return to investing in equities that possess strong fundamentals.
U.S. corporations continue to drive shareholder value by making acquisitions, initiating and raising dividends, investing in internal infrastructure, and buying back stock. However, lately I have begun to see a shift in those business strategies. The easier-to-execute acquisitions seem to be a thing of the past, and firms now have to be even more creative to execute accretive deals. I also believe that while firms may continue to initiate dividends, fewer firms will raise their dividends and fewer firms will participate in stock buyback programs going forward. So what will these cash-rich companies do with their capital if they are not raising dividends or buying back stock? I believe we will see companies begin to initiate capital expenditure programs.
Due to the continuing uncertainty from a lack of clear policies on taxes, healthcare, and regulations, I have observed that corporations would rather wait for clarity from our government leaders and defer any significant changes to their current business models. Up until this point, there has been no real cost for firms to defer spending their capital as they wait for anticipated guidance on policies that directly affect their businesses. But, this economic handcuffing from all of this uncertainty has gone on long enough. I believe there will now be firms who want to improve their margins and will begin spending money to expand their sales, and may even begin to hire. Once a competitor begins to move in this way, then the cost to defer becomes real for companies. This movement to expansion may well be a catalyst to propel the financial markets. I do believe this will be a slow shift, but one that will keep the economy improving, and should, in my opinion, help to generate reasonable market returns over the next few years.
With almost $3 trillion in cash sitting on the sidelines, this strategic shift by companies to begin spending their idle capital should help the economic recovery in the U.S. But that is only one part of the equation. Washington politics still play a role in how strong that recovery will be. The national political landscape will change in the next few years, and the future generation of elected officials will be faced with what I believe are fictitious unemployment figures (6.3% reported, when over 20 million Americans are looking for more work or a better job), a sluggish economy, and global competition in business. The next regime needs to provide real clarity on the issues that face all Americans and American corporations: taxation, regulation, and how to pay for our new healthcare system. I also believe that our government needs to regard business as a noble profession and to implement common sense and logic in their policy making instead of politics as usual. As Confucius is quoted as saying, “Life is really simple, but we insist on making it complicated.”
I am confident that even with all the hurdles facing corporate America, companies continue to provide good value for their shareholders, and I believe that means the financial markets are in good shape and should remain strong moving forward, I also believe that the next few months may be volatile. Fads come and go, and the current buzz on the Street is around investing in social media stocks. I believe that chasing hot products has contributed and will continue to contribute to the volatility of the markets this year. After over 35 years in the business, I still firmly believe the best way to position your portfolio is by investing in good companies over the long term, rather than trying to buy the next hot idea at exactly the right time. At Hennessy Funds, hunches and fads have no place in our investment process, and we understand that successful investing comes from time in the market, not timing the market.
We remain focused on investing based on proven fundamentals, and we are committed to managing money for the sole benefit of our shareholders. If you have any questions or want to speak with us directly, please don’t hesitate to call us at (800) 966-4354.
Best regards,
Neil J. Hennessy
President and Chief Investment Officer
Past performance does not guarantee future results.
Mutual fund investing involves risk. Principal loss is possible.
Opinions expressed are those of Neil Hennessy and are subject to change, are not guaranteed and should not be considered investment advice.
The Dow Jones Industrial Average and S&P 500 are unmanaged indices commonly used to measure the performance of U.S. stocks. One cannot invest directly in an index.
Price-to-sales ratio and price-to-earnings ratio are tools for calculating relative valuation. Price-to-sales ratio is calculated by dividing the market price by revenue per share. Price-to-earnings ratio is the market price per share divided by earnings per share.
HENNESSY FUNDS 1-800-966-4354
Performance Overview (Unaudited)
The opinions expressed in the following commentary reflect those of the Portfolio Managers as of the date written. Any such opinions are subject to change based on market or other conditions and are not guaranteed. These opinions may not be relied upon as investment advice. Investment decisions for the Fund are based on several factors, and may not be relied upon as an indication of trading intent on behalf of the Fund. Security positions can and do change.
AVERAGE ANNUAL TOTAL RETURN PERIODS ENDED APRIL 30, 2014
| | Six | One | Five | Ten |
| | Months(1) | Year | Years | Years |
| Hennessy Large Cap | | | | |
| Financial Fund (HLFNX) | 6.06% | 21.82% | 15.21% | 5.33% |
Russell 1000® Financial | | | | |
| Services Index | 7.11% | 18.21% | 17.45% | 1.76% |
Russell 1000® Index | 8.25% | 20.81% | 19.52% | 8.05% |
Expense ratio: 1.57%
Performance data quoted represents past performance; past performance does not guarantee future results. The investment return and principal value of an investment will fluctuate so that an investor’s shares, when redeemed, may be worth more or less than their original cost. Current performance of the Fund may be lower or higher than the performance quoted. Performance data current to the most recent month end may be obtained by visiting hennessyfunds.com. Performance for periods prior to October 26, 2012 is that of the FBR Large Cap Financial Fund.
The expense ratio presented is that from the most recent prospectus.
(1) Periods less than one year are not annualized.
PERFORMANCE NARRATIVE
Portfolio Manager: David H. Ellison, and Co-Portfolio Manager, Ryan Kelley
Over the previous six months, how did the Fund perform and what factors contributed to this performance?
For the six-month period ended April 30, 2014, the Hennessy Large Cap Financial Fund returned 6.06%, underperforming the Russell 1000® Financial Services Index and the Russell 1000® Index, which returned 7.11% and 8.25% for the same period, respectively, but outperforming the Morningstar Financial Category Average, which returned 5.20% for the same period.
The Fund remains concentrated in the largest U.S. based financial companies. These companies continue to see fundamental improvements as they work internally to grow earnings and earnings quality.
Companies with the strongest performance contributions to the Fund during the period were in the asset management and traditional bank businesses. Specific positions that contributed most strongly to performance included The Blackstone Group L.P., PNC Financial Services Group, Inc., SunTrust Banks, Inc., and Wells Fargo & Company. The Fund continues to hold all of these positions.
Companies detracting from the Fund’s performance during the period include consumer finance, brokerage, and trading platforms. Specific positions that detracted
from the Fund’s performance include CIT Group, Inc., The Goldman Sachs Group, Inc., and IntercontinentalExchange Group, Inc. The Fund no longer holds IntercontinentalExchange Group, Inc.
Additional Portfolio Manager commentary and related investment outlook:
Overall industry conditions improved during the six-month period. Residential and commercial real estate activity, investment banking, securities trading, loan demand, commercial services and credit conditions all improved. Balance sheets also improved as companies continue to de-lever, de-complicate and de-risk.
We expect the ongoing improvements to continue as big balance sheets, cost structures, and revenue streams are rationalized. We believe the changes in the “big bank” model will likely be significant over the next three to five years. We believe these changes are being driven by regulatory structures designed to reduce risk in the biggest institutions, which we expect to impact the entire industry and eventually could make it more stable. We believe this will be good for the overall economy as a strong, well-structured banking system is necessary for sustained economic growth. Ultimately, we expect that book values and earnings streams may become more stable over time. This should allow for higher dividends and stock buybacks going forward, which has historically been good for financial stock prices.
Valuations of the large capitalization financials, as measured by price-to-book and price-to-earnings, remain below historical averages. We believe these valuations may recover as companies work to get better internally across all business lines while the external economy heals and improves.
The Russell 1000® Financial Services Index is an unmanaged index commonly used to measure the performance of large-capitalization financial sector stocks. The Russell 1000® Index is an unmanaged index commonly used to measure the performance of U.S. stocks. You cannot invest directly in an index. Performance data for an index does not reflect any deductions for fees, expenses or taxes. The Fund is non-diversified, meaning it concentrates its assets in fewer holdings that a diversified fund and is therefore more exposed to individual stock volatility than a diversified fund. Investments are focused in the financial services industry, which may be adversely affected by regulatory or other market conditions such as rising interest rates. The Fund invests in small- and medium-capitalization companies, which involves additional risks such as more limited liquidity and greater volatility than large-capitalization companies. References to specific securities should not be considered a recommendation to buy or sell any security. Fund holdings and sector allocations are subject to change. Please refer to the Schedule of Investments included in this report for additional portfolio information.
Book value is the value at which a company carries an asset on its balance sheet. Price-to-book is a ratio used to compare a stock’s market value to its book value and is calculated by dividing the current closing price of such stock by the most recent quarter’s book value per share. Price-to-earnings is a tool for calculating relative valuation and is the market price per share divided by earnings per share.
Each Morningstar category average represents a universe of funds with similar investment objectives. © Morningstar, Inc. All Rights Reserved. The information contained herein: 1) is proprietary to Morningstar; 2) may not be copied or distributed and 3) is not warranted to be accurate, complete or timely. Neither Morningstar nor its content providers are responsible for any damages or losses arising from any use of this information. Past performance does not guarantee future results.
HENNESSY FUNDS 1-800-966-4354
Schedule of Investments
HENNESSY LARGE CAP FINANCIAL FUND
As of April 30, 2014 (Unaudited)
(% of Net Assets)
| | TOP TEN HOLDINGS (EXCLUDING CASH/CASH EQUIVALENTS) | % NET ASSETS |
| | American International Group, Inc. | 4.88% |
| | Citigroup, Inc. | 4.76% |
| | The Travelers Companies, Inc. | 4.76% |
| | MetLife, Inc. | 4.66% |
| | SunTrust Banks, Inc. | 4.57% |
| | J.P. Morgan Chase & Co. | 4.55% |
| | The PNC Financial Services Group, Inc. | 4.50% |
| | Regions Financial Corp. | 4.50% |
| | Morgan Stanley | 4.35% |
| | Fifth Third Bancorp | 4.34% |
Note: For presentation purposes, the Fund has grouped some of the industry categories. For purposes of categorizing securities for compliance with Section 8(b)(1) of the Investment Company Act of 1940, the Fund uses more specific industry classifications.
| | COMMON STOCKS – 89.86% | | Number | | | | | | % of | |
| | | | of Shares | | | Value | | | Net Assets | |
| | Financials – 82.26% | | | | | | | | | |
| | American International Group, Inc. | | | 96,000 | | | $ | 5,100,480 | | | | 4.88 | % |
| | Bank of America Corp. | | | 285,000 | | | | 4,314,900 | | | | 4.13 | % |
| | Capital One Financial Corp. | | | 53,000 | | | | 3,916,700 | | | | 3.75 | % |
| | CIT Group, Inc. | | | 91,000 | | | | 3,917,550 | | | | 3.75 | % |
| | Citigroup, Inc. | | | 104,000 | | | | 4,982,640 | | | | 4.76 | % |
| | Comerica, Inc. | | | 50,000 | | | | 2,412,000 | | | | 2.31 | % |
| | Discover Financial Services | | | 52,000 | | | | 2,906,800 | | | | 2.78 | % |
| | E Trade Financial Corp. (a) | | | 30,000 | | | | 673,500 | | | | 0.64 | % |
| | Fifth Third Bancorp | | | 220,000 | | | | 4,534,200 | | | | 4.34 | % |
| | Huntington Bancshares, Inc. | | | 355,000 | | | | 3,251,800 | | | | 3.11 | % |
| | J.P. Morgan Chase & Co. | | | 85,000 | | | | 4,758,300 | | | | 4.55 | % |
| | KeyCorp | | | 116,000 | | | | 1,582,240 | | | | 1.51 | % |
| | MetLife, Inc. | | | 93,000 | | | | 4,868,550 | | | | 4.66 | % |
| | Morgan Stanley | | | 147,000 | | | | 4,546,710 | | | | 4.35 | % |
| | Prudential Financial, Inc. | | | 43,000 | | | | 3,469,240 | | | | 3.32 | % |
| | Regions Financial Corp. | | | 464,000 | | | | 4,704,960 | | | | 4.50 | % |
| | SunTrust Banks, Inc. | | | 125,000 | | | | 4,782,500 | | | | 4.57 | % |
| | The Charles Schwab Corp. | | | 20,000 | | | | 531,000 | | | | 0.51 | % |
| | The Goldman Sachs Group, Inc. | | | 25,000 | | | | 3,995,500 | | | | 3.82 | % |
| | The PNC Financial Services Group, Inc. | | | 56,000 | | | | 4,706,240 | | | | 4.50 | % |
| | The Travelers Companies, Inc. | | | 55,000 | | | | 4,981,900 | | | | 4.76 | % |
| | U.S. Bancorp (c) | | | 98,000 | | | | 3,996,440 | | | | 3.82 | % |
| | Wells Fargo & Co. | | | 62,000 | | | | 3,077,680 | | | | 2.94 | % |
| | | | | | | | | 86,011,830 | | | | 82.26 | % |
| | | | �� | | | | | | | | | | |
| | Information Technology – 7.60% | | | | | | | | | | | | |
| | MasterCard, Inc., Class A | | | 53,000 | | | | 3,898,150 | | | | 3.73 | % |
| | Visa, Inc., Class A | | | 20,000 | | | | 4,052,200 | | | | 3.87 | % |
| | | | | | | | | | | | | | |
| | | | | | | | | 7,950,350 | | | | 7.60 | % |
| | | | | | | | | | | | | | |
| | Total Common Stocks | | | | | | | | | | | | |
| | (Cost $76,663,739) | | | | | | | 93,962,180 | | | | 89.86 | % |
The accompanying notes are an integral part of these financial statements.
HENNESSY FUNDS 1-800-966-4354
| | PARTNERSHIPS – 3.45% | | Number | | | | | | % of | |
| | | | of Shares | | | Value | | | Net Assets | |
| | Financials – 3.45% | | | | | | | | | |
| | Blackstone Group L.P. | | | 122,000 | | | | 3,602,660 | | | | 3.45 | % |
| | | | | | | | | | | | | | |
| | Total Partnerships | | | | | | | | | | | | |
| | (Cost $1,984,926) | | | | | | | 3,602,660 | | | | 3.45 | % |
| | | | | | | | | | | | | | |
| | SHORT-TERM INVESTMENTS – 6.77% | | | | | | | | | | | | |
| | | | | | | | | | | | | | |
| | Money Market Funds – 6.77% | | | | | | | | | | | | |
| | Federated Government Obligations Fund – | | | | | | | | | | | | |
| | Class I, 0.01% (b) | | | 1,892,186 | | | $ | 1,892,186 | | | | 1.81 | % |
| | Fidelity Government Portfolio – | | | | | | | | | | | | |
| | Institutional Class, 0.01% (b) | | | 5,190,000 | | | | 5,190,000 | | | | 4.96 | % |
| | | | | | | | | | | | | | |
| | Total Money Market Funds | | | | | | | | | | | | |
| | (Cost $7,082,186) | | | | | | | 7,082,186 | | | | 6.77 | % |
| | | | | | | | | | | | | | |
| | Total Short-Term Investments | | | | | | | | | | | | |
| | (Cost $7,082,186) | | | | | | | 7,082,186 | | | | 6.77 | % |
| | | | | | | | | | | | | | |
| | Total Investments | | | | | | | | | | | | |
| | (Cost $85,730,851) – 100.08% | | | | | | | 104,647,026 | | | | 100.08 | % |
| | Liabilities in Excess of | | | | | | | | | | | | |
| | Other Assets – (0.08)% | | | | | | | (84,463 | ) | | | (0.08 | )% |
| | TOTAL NET ASSETS – 100.00% | | | | | | $ | 104,562,563 | | | | 100.00 | % |
Percentages are stated as a percent of net assets.
| (a) | Non-income producing security. |
| (b) | The rate listed is the fund’s 7-day yield as of April 30, 2014. |
| (c) | Investment in affiliated security. Quasar Distributors, LLC, which serves as the Fund’s distributor, is a subsidiary of U.S. Bancorp. Details of transactions with this affiliated company for the period ended April 30, 2014, are as follows: |
| | Issuer | | U.S. Bancorp | |
| | Beginning Cost | | $ | 1,739,350 | |
| | Purchase Cost | | $ | 2,199,937 | |
| | Sales Cost | | $ | 213,432 | |
| | Ending Cost | | $ | 3,725,855 | |
| | Dividend Income | | $ | 35,880 | |
| | Shares | | | 98,000 | |
| | Market Value | | $ | 3,996,440 | |
The accompanying notes are an integral part of these financial statements.
Summary of Fair Value Exposure at April 30, 2014
The following is a summary of the inputs used to value the Fund’s net assets as of April 30, 2014 (See Note 3 in the accompanying notes to the financial statements):
| Common Stock | | Level 1 | | | Level 2 | | | Level 3 | | | Total | |
| Financials | | $ | 86,011,830 | | | $ | — | | | $ | — | | | $ | 86,011,830 | |
| Information Technology | | | 7,950,350 | | | | — | | | | — | | | | 7,950,350 | |
| Total Common Stock | | $ | 93,962,180 | | | $ | — | | | $ | — | | | $ | 93,962,180 | |
| Partnerships | | | | | | | | | | | | | | | | |
| Financials | | $ | 3,602,660 | | | $ | — | | | $ | — | | | $ | 3,602,660 | |
| Total Partnerships | | $ | 3,602,660 | | | $ | — | | | $ | — | | | $ | 3,602,660 | |
| Short-Term Investments | | | | | | | | | | | | | | | | |
| Money Market Funds | | $ | 7,082,186 | | | $ | — | | | $ | — | | | $ | 7,082,186 | |
| Total Short-Term Investments | | $ | 7,082,186 | | | $ | — | | | $ | — | | | $ | 7,082,186 | |
| Total Investments | | $ | 104,647,026 | | | $ | — | | | $ | — | | | $ | 104,647,026 | |
Transfers between levels are recognized at the end of the reporting period. During the six-month period ended April 30, 2014, the Fund recognized no transfers between levels.
The accompanying notes are an integral part of these financial statements.
HENNESSY FUNDS 1-800-966-4354
Financial Statements
Statement of Assets and Liabilities as of April 30, 2014 (Unaudited) |
| ASSETS: | | | |
| Investments in securities, at value (cost $82,004,996) | | $ | 100,650,586 | |
| Investments in affiliated securities, at value (cost $3,725,855) | | | 3,996,440 | |
| Dividends and interest receivable | | | 49,002 | |
| Receivable for fund shares sold | | | 55,381 | |
| Return of capital receivable | | | 42,700 | |
| Prepaid expenses and other assets | | | 13,041 | |
| Total Assets | | | 104,807,150 | |
| | | | | |
| LIABILITIES: | | | | |
| Payable for fund shares redeemed | | | 87,002 | |
| Payable to advisor | | | 78,322 | |
| Payable to administrator | | | 21,791 | |
| Payable to auditor | | | 9,472 | |
| Distribution payable | | | 23,919 | |
| Accrued trustees fees | | | 4,947 | |
| Accrued expenses and other payables | | | 19,134 | |
| Total Liabilities | | | 244,587 | |
| NET ASSETS | | $ | 104,562,563 | |
| | | | | |
| NET ASSETS CONSIST OF: | | | | |
| Capital stock | | $ | 83,397,645 | |
| Accumulated net investment loss | | | (210,140 | ) |
| Accumulated net realized gain on investments | | | 2,458,883 | |
| Unrealized net appreciation on investments | | | 18,916,175 | |
| Total Net Assets | | $ | 104,562,563 | |
| | | | | |
| NET ASSETS | | | | |
| Investor Class: | | | | |
| Shares authorized (no par value) | | Unlimited | |
| Net assets applicable to outstanding Investor Class shares | | | 104,562,563 | |
| Shares issued and outstanding | | | 5,341,318 | |
| Net asset value, offering price and redemption price per share | | $ | 19.58 | |
The accompanying notes are an integral part of these financial statements.
Financial Statements
Statement of Operations Six Months Ended April 30, 2014 (Unaudited) |
| INVESTMENT INCOME: | | | |
| Dividend income | | $ | 675,700 | |
| Dividend income from affiliated securities | | | 35,880 | |
| Interest income | | | 136 | |
| Total investment income | | | 711,716 | |
| | | | | |
| EXPENSES: | | | | |
| Investment advisory fees | | | 455,749 | |
| Administration, fund accounting, custody and transfer agent fees | | | 60,767 | |
| Distribution fees – Investor Class (See Note 5) | | | 126,597 | |
| Federal and state registration fees | | | 10,672 | |
| Audit fees | | | 9,472 | |
| Legal fees | | | 2,480 | |
| Compliance expense | | | 10,655 | |
| Reports to shareholders | | | 4,735 | |
| Trustees’ fees and expenses | | | 7,439 | |
| Sub-transfer agent expenses – Investor Class (See Note 5) | | | 65,831 | |
| Interest expense (See Note 6) | | | 217 | |
| Other expenses | | | 5,511 | |
| Total expenses | | | 760,125 | |
| NET INVESTMENT LOSS | | $ | (48,409 | ) |
| | | | | |
| REALIZED AND UNREALIZED GAINS: | | | | |
| Net realized gain on investments | | $ | 4,570,354 | |
| Affiliated investments | | | 75,753 | |
| Change in unrealized appreciation on investments | | | 578,139 | |
| Net gain on investments | | | 5,224,246 | |
| NET INCREASE IN NET ASSETS RESULTING FROM OPERATIONS | | $ | 5,175,837 | |
The accompanying notes are an integral part of these financial statements.
HENNESSY FUNDS 1-800-966-4354
(This Page Intentionally Left Blank.)
Financial Statements
| Statements of Changes in Net Assets |
| | | Six Months Ended | | | | |
| | | April 30, 2014 | | | Year Ended | |
| | | (Unaudited) | | | October 31, 2013 | |
| OPERATIONS: | | | | | | |
| Net investment loss | | $ | (48,409 | ) | | $ | (155,053 | ) |
| Net realized gain on securities | | | 4,646,107 | | | | 8,243,533 | |
| Long-term capital gain distributions | | | | | | | | |
| from regulated investment companies | | | — | | | | 17,820 | |
| Change in unrealized appreciation on securities | | | 578,139 | | | | 10,739,120 | |
| Net increase in net assets | | | | | | | | |
| resulting from operations | | | 5,175,837 | | | | 18,845,420 | |
| | | | | | | | | |
| DISTRIBUTIONS TO SHAREHOLDERS FROM: | | | | | | | | |
| Net investment income | | | | | | | | |
| Investor Class | | | — | | | | (50,837 | ) |
| Net realized gains | | | | | | | | |
| Investor Class | | | (2,696,057 | ) | | | — | |
| Total distributions | | | (2,696,057 | ) | | | (50,837 | ) |
| | | | | | | | | |
| CAPITAL SHARE TRANSACTIONS: | | | | | | | | |
| Proceeds from shares subscribed – Investor Class | | | 29,329,381 | | | | 43,711,247 | |
| Dividends reinvested – Investor Class | | | 2,639,350 | | | | 49,255 | |
| Cost of shares redeemed – Investor Class | | | (18,186,917 | )(1) | | | (38,910,007 | )(2) |
| Net increase in net assets derived | | | | | | | | |
| from capital share transactions | | | 13,781,814 | | | | 4,850,495 | |
| TOTAL INCREASE IN NET ASSETS | | | 16,261,594 | | | | 23,645,078 | |
| | | | | | | | | |
| NET ASSETS: | | | | | | | | |
| Beginning of period | | | 88,300,969 | | | | 64,655,891 | |
| End of period | | $ | 104,562,563 | | | $ | 88,300,969 | |
| Undistributed net investment loss, end of period | | $ | (210,140 | ) | | $ | (161,731 | ) |
| | | | | | | | | |
| CHANGES IN SHARES OUTSTANDING: | | | | | | | | |
| Shares sold – Investor Class | | | 1,472,369 | | | | 2,488,338 | |
| Shares issued to holders as reinvestment | | | | | | | | |
| of dividends – Investor Class | | | 135,909 | | | | 3,367 | |
| Shares redeemed – Investor Class | | | (912,578 | ) | | | (2,412,632 | ) |
| Net increase in shares outstanding | | | 695,700 | | | | 79,073 | |
| (1) | Net of redemption fees of $287 related to redemption fees imposed by the FBR Large Cap Financial Fund during a prior year but not received until the six-month period ended April 30, 2014.. |
| (2) | Net of redemption fees of $15 related to redemption fees imposed by the FBR Large Cap Financial Fund during a prior year but not received until fiscal year 2013. |
The accompanying notes are an integral part of these financial statements.
HENNESSY FUNDS 1-800-966-4354
Financial Highlights
| Hennessy Large Cap Financial Fund |
For an Investor Class share outstanding throughout each period
| | | Six Months Ended | |
| | | April 30, 2014 | |
| | | (Unaudited) | |
| PER SHARE DATA: | | | |
| Net asset value, beginning of period | | $ | 19.01 | |
| | | | | |
| Income from investment operations: | | | | |
| Net investment income (loss) | | | 0.01 | |
| Net realized and unrealized gains (losses) on investments | | | 1.15 | |
| Total from investment operations | | | 1.16 | |
| | | | | |
| Less distributions: | | | | |
| Dividends from net investment income | | | (0.01 | ) |
| Distribution in excess of net investment income | | | — | |
| Dividends from net realized gains | | | (0.58 | ) |
| Total distributions | | | (0.59 | ) |
| Paid-in capital from redemption fees | | | — | |
| Net asset value, end of period | | $ | 19.58 | |
| | | | | |
| TOTAL RETURN | | | 6.06 | %(3) |
| Net assets, end of period (millions) | | $ | 104.56 | |
| Ratio of expenses to average net assets: | | | | |
| Before expense reimbursement | | | 1.50 | %(4) |
| After expense reimbursement | | | 1.50 | %(4) |
| Ratio of net investment income (loss) to average net assets: | | | | |
| Before expense reimbursement | | | (0.10 | )%(4) |
| After expense reimbursement | | | (0.10 | )%(4) |
| Portfolio turnover rate | | | 22 | %(3) |
| (1) | Calculated based on average shares outstanding method. |
| (2) | Amount is less than $0.01. |
| (3) | Not annualized. |
| (4) | Annualized. |
The accompanying notes are an integral part of these financial statements.
| Year Ended October 31, | |
| 2013 | | | 2012 | | | 2011 | | | 2010 | | | 2009 | |
| | | | | | | | | | | | | | |
| $ | 14.16 | | | $ | 11.91 | | | $ | 12.88 | | | $ | 12.61 | | | $ | 11.14 | |
| | | | | | | | | | | | | | | | | | | |
| | | | | | | | | | | | | | | | | | | |
| | (0.03 | ) | | | 0.01 | | | | (0.04 | )(1) | | | (0.08 | ) | | | 0.00 | (2) |
| | 4.89 | | | | 2.24 | | | | (0.93 | ) | | | 0.35 | | | | 1.58 | |
| | 4.86 | | | | 2.25 | | | | (0.97 | ) | | | 0.27 | | | | 1.58 | |
| | | | | | | | | | | | | | | | | | | |
| | | | | | | | | | | | | | | | | | | |
| | (0.01 | ) | | | — | | | | — | | | | — | | | | (0.10 | ) |
| | — | | | | — | | | | — | | | | — | | | | (0.02 | ) |
| | — | | | | — | | | | — | | | | — | | | | — | |
| | (0.01 | ) | | | — | | | | — | | | | — | | | | (0.12 | ) |
| | 0.00 | (2) | | | 0.00 | (2) | | | 0.00 | (2) | | | 0.00 | (2) | | | 0.01 | |
| $ | 19.01 | | | $ | 14.16 | | | $ | 11.91 | | | $ | 12.88 | | | $ | 12.61 | |
| | | | | | | | | | | | | | | | | | | |
| | 34.37 | % | | | 18.89 | % | | | (7.53 | )% | | | 2.14 | % | | | 14.52 | % |
| $ | 88.30 | | | $ | 64.66 | | | $ | 55.68 | | | $ | 48.72 | | | $ | 37.20 | |
| | | | | | | | | | | | | | | | | | | |
| | 1.57 | % | | | 1.57 | % | | | 1.61 | % | | | 1.78 | % | | | 1.81 | % |
| | 1.57 | % | | | 1.57 | % | | | 1.61 | % | | | 1.78 | % | | | 1.81 | % |
| | | | | | | | | | | | | | | | | | | |
| | (0.22 | )% | | | 0.09 | % | | | (0.34 | )% | | | (0.73 | )% | | | (0.08 | )% |
| | (0.22 | )% | | | 0.09 | % | | | (0.34 | )% | | | (0.73 | )% | | | (0.08 | )% |
| | 75 | % | | | 93 | % | | | 97 | % | | | 150 | % | | | 220 | % |
The accompanying notes are an integral part of these financial statements.
HENNESSY FUNDS 1-800-966-4354
Notes to the Financial Statements
April 30, 2014 (Unaudited)
1). ORGANIZATION
The Hennessy Large Cap Financial Fund (the “Fund”) is a series of Hennessy Funds Trust (the “Trust”), which was organized as a Delaware statutory trust on September 17, 1992. The Fund is an open-end management investment company registered under the Investment Company Act of 1940, as amended. The Fund is a successor to the FBR Large Cap Financial Fund (the “Predecessor FBR Fund”), a series of The FBR Funds, a Delaware statutory trust, pursuant to a reorganization that took place after the close of business on October 26, 2012. Prior to October 26, 2012, the Fund had no investment operations. As a result of the reorganization, holders of the Investor Class shares of the Predecessor FBR Fund received Investor Class shares of the Fund (the Investor Class shares of the Fund are the successor to the accounting and performance information of the Predecessor FBR Fund). The investment objective of the Fund is capital appreciation. The Fund is a non-diversified fund.
The Fund offers Investor Class shares.
2). SIGNIFICANT ACCOUNTING POLICIES
The following is a summary of significant accounting policies consistently followed by the Fund in the preparation of the financial statements. These policies are in conformity with U.S. generally accepted accounting principles (“GAAP”).
| a). | Investment Valuation – All investments in securities are recorded at their estimated fair value, as described in Note 3. |
| b). | Federal Income Taxes – Provision for Federal income taxes or excise taxes has not been made since the Fund has elected to be taxed as a “regulated investment company” and intends to distribute substantially all of its taxable income to its shareholders and otherwise comply with the provisions of the Internal Revenue Code of 1986, as amended, applicable to regulated investment companies. Net investment income or loss and realized gains and losses for federal income tax purposes may differ from that reported on the financial statements because of temporary book and tax basis differences. Temporary differences are primarily the result of the treatment of wash sales for tax reporting purposes. Distributions from net realized gains for book purposes may include short-term capital gains, which are included as ordinary income to shareholders for tax purposes. |
| c). | Income and Expenses – Dividend income is recognized on the ex-dividend date or as soon as information is available to the Fund. Interest income, which includes the amortization of premium and accretion of discount, is recognized on an accrual basis. The Fund is charged for those expenses that are directly attributable to the portfolio, such as advisory, administration, and certain shareholder service fees. |
| d). | Distributions to Shareholders – Dividends from net investment income for the Fund, if any, are declared and paid out annually, usually in November or December. Distributions of net realized capital gains, if any, are declared and paid annually, usually in November or December |
| e). | Security Transactions – Investment and shareholder transactions are recorded on the trade date. The Fund determines the gain or loss realized from the investment transactions by comparing the original cost of the security lot sold with the net sale |
| | proceeds. Discounts and premiums on securities purchased are accreted/amortized over the life of the respective security. |
| f). | Use of Estimates – The preparation of financial statements in conformity with GAAP requires management to make estimates and assumptions that affect the reported amounts of assets and liabilities and disclosure of contingent assets and liabilities at the date of the financial statements and the reported change in net assets during the reporting period. Actual results could differ from those estimates. |
| g). | Share Valuation – The net asset value (“NAV”) per share of the Fund is calculated by dividing the sum of the value of the securities held by the Fund, plus cash or other assets, minus all liabilities (including estimated accrued expenses) by the total number of shares outstanding for the Fund, rounded to the nearest cent. The Fund’s shares will not be priced on days the New York Stock Exchange is closed for trading. The offering and redemption price per share for the Fund is equal to the Fund’s net asset value per share. |
| h). | Foreign Currency – Values of investments denominated in foreign currencies are converted into U.S. dollars using the spot market rate of exchange at the time of valuation. Purchases and sales of investments and income are translated into U.S. dollars using the spot market rate of exchange prevailing on the respective dates of such transactions. The Fund does not isolate the portion of the results of operations resulting from fluctuations in foreign exchange rates on investments from fluctuations resulting from changes in the market prices of securities held. Such fluctuations are included with the net realized and unrealized gain or loss on investments. Foreign investments present additional risks due to currency fluctuations, economic and political factors, lower liquidity, government regulations, differences in accounting standards, and other factors. |
| i). | Forward Contracts – The Fund may enter into forward currency contracts to reduce its exposure to changes in foreign currency exchange rates on its foreign holdings and to lock in the U.S. dollar cost of firm purchase and sale commitments for securities denominated in foreign currencies. A forward currency contract is a commitment to purchase or sell a foreign currency at a future date at a negotiated forward rate. The gain or loss arising from the difference between the U.S. dollar cost of the original contract and the value of the foreign currency in U.S. dollars upon closing of such contract is included in net realized gain or loss from foreign currency transactions. During the six months ended April 30, 2014, the Fund did not enter into any forward contracts. |
| j). | Repurchase Agreements – The Fund may enter into repurchase agreements with member banks or security dealers of the Federal Reserve Board whom the investment advisor deems creditworthy. The repurchase price generally equals the price paid by the Fund plus interest negotiated on the basis of current short-term rates. |
| | Securities pledged as collateral for repurchase agreements are held by the custodian bank until the respective agreements mature. Provisions of the repurchase agreements ensure that the market value of the collateral, including accrued interest thereon, is sufficient in the event of default of the counterparty. If the counterparty defaults and the value of the collateral declines or if the counterparty enters an insolvency proceeding, realization of the collateral by the Fund may be delayed or limited. |
| k). | Accounting for Uncertainty in Income Taxes – The Fund has adopted accounting policies regarding recognition and measurement of tax positions taken or expected to be taken on a tax return. The Fund has reviewed all open tax years in major jurisdictions and concluded that there is no impact on the Fund’s net assets and no tax liability |
HENNESSY FUNDS 1-800-966-4354
| | resulting from unrecognized tax benefits relating to uncertain income tax positions taken or expected to be taken on a tax return. The Fund’s major tax jurisdictions are U.S. Federal and Delaware. As of April 30, 2014, open Federal and state tax years for the Fund include the tax years ended October 31, 2011 through 2013. |
| l). | Derivatives – The Fund may invest in, or enter into, derivatives, such as options, futures contracts, options on futures contracts, and swaps, for a variety of reasons, including to hedge certain risks, to provide a substitute for purchasing or selling particular securities, or to increase potential income gain. Derivatives may provide a cheaper, quicker, or more specifically focused way for a Fund to invest than “traditional” securities would. The main purpose of utilizing these derivative instruments is for hedging purposes. |
| | The Fund has adopted the financial accounting reporting rules as required by the Derivatives and Hedging Topic of the Financial Accounting Standards Board Accounting Standards Codification. Under such rules, the Fund is required to include enhanced disclosure that enables investors to understand how and why an entity uses derivatives, how derivatives are accounted for, and how derivatives instruments affect an entity’s results of operations and financial position. During the six months ended April 30, 2014, the Fund did not hold any derivative instruments. |
| m). | Events Subsequent to the Fiscal Period End – The Fund has adopted financial reporting rules regarding subsequent events that require an entity to recognize in the financial statements the effects of all subsequent events that provide additional evidence about conditions that existed at the date of the balance sheet. Management has evaluated the Fund’s related events and transactions that occurred subsequent to April 30, 2014 through the date of issuance of the Fund’s financial statements. There were no events or transactions that occurred during this period that materially impacted the amounts or disclosures in the Fund’s financial statements. |
3). SECURITIES VALUATION
The Fund has adopted authoritative fair valuation accounting standards that establish an authoritative definition of fair value and set out a hierarchy for measuring fair value. These standards require additional disclosures about the various inputs and valuation techniques used to develop the measurements of fair value and a discussion in changes in valuation techniques and related inputs during the period. These inputs are summarized in the three broad levels listed below:
| | Level 1 – | Quoted unadjusted prices for identical instruments in active markets to which the Fund has access at the date of measurement. |
| | Level 2 – | Quoted prices for similar instruments in active markets; quoted prices for identical or similar instruments in markets that are not active; and model-derived valuations in which all significant inputs and significant value drivers are observable in active markets. Level 2 inputs are those in markets for which there are few transactions, the prices are not current, the prices are fair value adjusted due to post-market close subsequent events (foreign markets), little public information exists, or instances where prices vary substantially over time or among brokered market makers. These inputs may also include interest rates, prepayment speeds, credit risk curves, default rates, and similar data. |
| | Level 3 – | Model-derived valuations in which one or more significant inputs or significant value drivers are unobservable. Unobservable inputs are those inputs that reflect the Fund’s own assumptions about what market participants would use to price the asset or liability based on the best available information. |
Following is a description of the valuation techniques applied to the Fund’s major categories of assets and liabilities measured at fair value on a recurring basis.
Equity Securities – Equity securities, including common stocks, preferred stocks, foreign issued common stocks, exchange traded funds, closed-end mutual funds, and real estate investment trusts, that are traded on a securities exchange for which a last-quoted sales price is readily available will be valued at the last sales price as reported by the primary exchange on which the securities are listed. Securities listed on The NASDAQ Stock Market (“NASDAQ”) will be valued at the NASDAQ Official Closing Price, which may differ from the last sales price reported. Securities traded on a securities exchange for which a last-quoted sales price is not readily available will be valued at the mean between the bid and ask prices. To the extent these securities are actively traded and valuation adjustments are not applied, they are classified in Level 1 of the fair value hierarchy.
Investment Companies – Investments in investment companies (e.g., mutual funds and exchange traded funds) are generally priced at the ending NAV provided by the Fund’s service agent and will be classified in Level 1 of the fair value hierarchy.
Debt Securities – Debt securities, including corporate bonds, asset-backed securities, mortgage-backed securities, municipal bonds, U.S. Treasuries, and U.S. government agency issues, are valued at market on the basis of valuations furnished by an independent pricing service that utilizes both dealer-supplied valuations and formula-based techniques. The pricing service may consider recently executed transactions in securities of the issuer or comparable issuers, market price quotations (where observable), bond spreads, and fundamental data relating to the issuer. In addition, the model may incorporate market observable data such as reported sales of similar securities, broker quotes, yields, bids, offers, and reference data. Certain securities are valued principally using dealer quotations. These securities are generally classified in Level 2 of the fair value hierarchy.
Short-Term Securities – Short-term equity investments, including money market funds, are valued in the manner specified above. Short-term debt investments are valued at amortized cost, if their original maturity was 60 days or less, or by amortizing the values as of the 61st day prior to maturity, if their original term to maturity exceeded 60 days. Short-term securities are generally classified in Level 1 or Level 2 of the fair market hierarchy depending on the inputs used and market activity levels for specific securities.
The Board of Trustees of the Fund (the “Board”) has adopted fair value pricing procedures that are followed when a price for a security is not readily available or if a significant event has occurred that indicates the closing price of a security no longer represents the true value of that security. Fair value pricing determinations are made in good faith in accordance with these procedures. There are numerous criteria that will be given consideration in determining a fair value of a security. Some of these criteria are trading volume of security and markets, the value of other like securities, and news events with direct bearing to security or market. Fair value pricing results in an estimated price that reasonably reflects the current market conditions in order to rate the portfolio holdings such that shareholder transactions receive a fair net asset value. Depending on the relative significance of the valuation inputs, these securities may be classified in either Level 2 or Level 3 of the fair value hierarchy.
Fair valuing of foreign securities may be determined with the assistance of a pricing service using correlations between the movement of prices of such securities and indices of domestic securities and other appropriate indicators, such as closing market prices of relevant American Depositary Receipts or futures contracts. The effect of using fair value pricing is that the Fund’s NAV will reflect the affected portfolio securities’ value as determined in the judgment of the Board or its designee instead of being determined by
HENNESSY FUNDS 1-800-966-4354
the market. Using a fair value pricing methodology to price foreign securities may result in a value that is different from a foreign security’s most recent closing price and from the prices used by other investment companies to calculate their net asset values and are generally considered Level 2 prices in the fair valuation hierarchy. Because the Fund may invest in foreign securities, the value of the Fund’s portfolio securities may change on days when you will not be able to purchase or redeem your shares.
The Board has delegated day-to-day valuation matters to a Valuation Committee comprised of one or more representatives from Hennessy Advisors, Inc., the Fund’s investment advisor. The function of the Valuation Committee is to value securities where current and reliable market quotations are not readily available. All actions taken by the Valuation Committee are reviewed by the Board.
The Fund has performed an analysis of all existing investments to determine the significance and character of all inputs to their fair value determination. Various inputs are used in determining the value of the Fund’s investments. The inputs or methodology used for valuing securities are not necessarily an indication of the risk associated with investing in those securities. Details related to the fair valuation hierarchy of the Fund’s securities as of April 30, 2014 are included in the Fund’s Schedule of Investments.
4). INVESTMENT TRANSACTIONS
Purchases and sales of investment securities (excluding government and short-term investments) for the Fund during the six months ended April 30, 2014 were $27,470,186 and $22,133,432, respectively.
There were no purchases or sales/maturities of long-term U.S. Government Securities for the Fund for the six months ended April 30, 2014.
5). INVESTMENT MANAGEMENT FEE AND OTHER TRANSACTIONS WITH AFFILIATES
Hennessy Advisors, Inc. (the “Advisor”) is the investment advisor of the Fund. The Advisor provides the Fund with investment management services under an Investment Advisory Agreement. The Advisor furnishes all investment advice, office space, facilities, and provides most of the personnel needed by the Fund. As compensation for its services, the Advisor is entitled to a monthly fee from the Fund. The fee is based upon the average daily net assets of the Fund at the annual rate of 0.90%. The net investment advisory fees payable for the Fund as of April 30, 2014 were $78,322.
The Advisor has contractually agreed to limit the total annual operating expenses of the Fund (excluding interest, taxes, brokerage commissions, dividend expenses, acquired fund fees and expenses, extraordinary legal expenses, or any other extraordinary expenses and, from and after November 1, 2014, 12b-1 fees) to 1.95% of the Fund’s net assets through February 28, 2015.
For a period of three years after the year in which the Advisor waives or reimburses expenses, the Advisor may seek reimbursement from the Fund to the extent that total annual fund operating expenses are less than the expense limitation in effect at the time of the reimbursement. During the three years ended October 31, 2013, no Advisor fees were waived and therefore no expenses are subject to potential recovery.
The Fund has adopted a plan pursuant to Rule 12b-1 under the Investment Company Act of 1940, as amended, that authorizes payments in connection with the distribution of the Fund’s shares at an annual rate of up to 0.25% of the Fund’s average daily net assets. Amounts paid under the plan may be spent on any activities or expenses primarily intended to result in the sale of shares, including but not limited to, advertising, compensation for sales and marketing activities or financial institutions and others such as dealers and
distributors, shareholder account servicing, the printing and mailing of prospectuses to other than current shareowners, and the printing and mailing of sales literature.
The Fund has entered into agreements with various brokers, dealers, and financial intermediaries in connection with the sale of shares of the Fund. The agreements provide for periodic payments by the Fund to the brokers, dealers, and financial intermediaries for providing certain shareholder maintenance services (sub-transfer agent expenses). These shareholder services include the pre-processing and quality control of new accounts, shareholder correspondence, answering customer inquiries regarding account status, and facilitating shareholder telephone transactions. Fees paid by the Fund to various brokers, dealers, and financial intermediaries for the six months ended April 30, 2014 were $65,831.
U.S. Bancorp Fund Services, LLC (“USBFS”) provides the Fund with administrative, fund accounting, and transfer agent services, including all regulatory reporting, and necessary office equipment and personnel. As administrator, USBFS prepares various federal and state regulatory filings, reports, and returns for the Fund; prepares reports and materials to be supplied to the Board; monitors the activities of the Fund’s custodian, transfer agent, and accountants; and coordinates the preparation and payment of the Fund’s expenses and reviews the Fund’s expense accruals. Fees paid to USBFS for the six months ended April 30, 2014 were $60,767.
U.S. Bank, N.A., an affiliate of USBFS, serves as the Fund’s custodian. Quasar Distributors, LLC acts as the Fund’s principal underwriter in a continuous public offering of the Fund’s shares. Quasar Distributors, LLC is an affiliate of USBFS and U.S. Bank, N.A.
6). LINE OF CREDIT
The Fund has a line of credit with the other funds in the Hennessy Funds family of funds (the “Hennessy Funds”) in the amount of the lesser of (i) $100,000,000 or (ii) 33.33% of each Hennessy Fund’s net assets, or 30% for the Hennessy Gas Utility Index Fund and 10% for the Hennessy Balanced Fund, intended to provide short-term financing, if necessary, subject to certain restrictions, in connection with shareholder redemptions. The credit facility is with the Hennessy Funds’ custodian bank, U.S. Bank, N.A. Borrowings under this arrangement bear interest at the bank’s prime rate. During the six months ended April 30, 2014, the Fund had an outstanding average daily balance and a weighted average interest rate of $19,972 and 3.25%, respectively. The maximum amount outstanding for the Fund during the period was $973,000.
7). FEDERAL TAX INFORMATION
As of October 31, 2013, the Fund’s most recent fiscal year end, the components of accumulated earnings (losses) for income tax purposes for the Fund were as follows:
| | Cost of investments for tax purposes | | $ | 72,142,471 | |
| | Gross tax unrealized appreciation | | $ | 18,631,889 | |
| | Gross tax unrealized depreciation | | | (2,481,037 | ) |
| | Net tax unrealized appreciation/depreciation | | $ | 16,150,852 | |
| | Undistributed ordinary income | | $ | — | |
| | Undistributed long-term capital gains | | | 2,696,017 | |
| | Total distributable earnings | | $ | 2,696,017 | |
| | Other accumulated gain (loss) | | $ | (161,731 | ) |
| | Total accumulated gain (loss) | | $ | 18,685,138 | |
The difference between book-basis and tax-basis unrealized appreciation is attributable primarily to capital loss carry overs, wash sales, and partnership adjustments.
At October 31, 2013, the Fund’s most recent fiscal year end, the Fund had no tax basis capital losses to offset future capital gains.
HENNESSY FUNDS 1-800-966-4354
During the year ended October 31, 2013, the Fund’s most recent fiscal year end, the capital loss carry forwards utilized for the Fund were $3,634,977.
Capital losses sustained in the year ended October 31, 2012 and in future taxable years will not expire and may be carried over by the Fund without limitation; however, they will retain the character of the original loss. Furthermore, any losses incurred during those taxable years will be required to be utilized prior to the losses incurred in the pre-enactment taxable years. As a result of this ordering rule, pre-enactment capital loss carryforwards may be more likely to expire unused. Under pre-enactment law, capital losses could be carried forward for eight years, and carried forward as short-term capital losses, irrespective of the character of the original loss.
At October 31, 2013, the Fund deferred, on a tax basis, a post-December late year ordinary loss deferral of $(161,731) and the Fund did not defer, on a tax basis, any post-December loss deferrals
The tax character of distributions paid during fiscal year 2014 (year-to-date) and fiscal year 2013 for the Fund were as follows:
| | | | Six Months Ended | | | Year Ended | |
| | | | April 30, 2014 | | | October 31, 2013 | |
| | Ordinary income | | $ | — | | | $ | 50,837 | |
| | Long-term capital gain | | | 2,696,057 | | | | — | |
| | | | $ | 2,696,057 | | | $ | 50,837 | |
Expense Example (Unaudited)
April 30, 2014
As a shareholder of the Fund, you incur two types of costs: (1) transaction costs, including sales charges (loads) on purchase payments, reinvested dividends, or other distributions; redemption fees; and exchange fees; and (2) ongoing costs, including management fees; service fees; and other Fund expenses. This Example is intended to help you understand your ongoing costs (in dollars) of investing in the Fund and to compare these costs with the ongoing costs of investing in other mutual funds. The Example is based on an investment of $1,000 invested at the beginning of the period and held for the entire period from November 1, 2013 through April 30, 2014.
Actual Expenses
The first line of the table below provides information about actual account values and actual expenses. Although the Fund charges no sales loads or transaction fees, you will be assessed fees for outgoing wire transfers, returned checks and stop payment orders at prevailing rates charged by U.S. Bancorp Fund Services, LLC, the Fund’s transfer agent. If you request that a redemption be made by wire transfer, currently a $15.00 fee is charged by the Fund’s transfer agent. IRA accounts will be charged a $15.00 annual maintenance fee. The example below includes, but is not limited to, management fees, shareholder servicing fees, fund accounting, custody, and transfer agent fees. However, the example below does not include portfolio trading commissions and related expenses, and other extraordinary expenses as determined under generally accepted accounting principles. You may use the information in this line, together with the amount you invested, to estimate the expenses that you paid over the period. Simply divide your account value by $1,000 (for example, an $8,600 account value divided by $1,000 = 8.6), then multiply the result by the number in the first line of the table under the heading entitled “Expenses Paid During Period” to estimate the expenses you paid on your account during this period.
Hypothetical Example for Comparison Purposes
The second line of the table below provides information about hypothetical account values and hypothetical expenses based on the Fund’s actual expense ratios and an assumed rate of return of 5% per year before expenses, which is not the Fund’s actual return. The hypothetical account values and expenses may not be used to estimate the actual ending account balance or expenses you paid for the period. You may use this information to compare the ongoing costs of investing in the Fund and other funds. To do so, compare this 5% hypothetical example with the 5% hypothetical examples that appear in the shareholder reports of the other funds. Please note that the expenses shown in the table are meant to highlight your ongoing costs only and do not reflect any transactional costs, such as sales charges (loads), or exchange fees. Therefore, the second line of the table is useful in comparing ongoing costs only, and will not help you determine the relative total costs of owning different funds. In addition, if these transactional costs were included, your costs would have been higher.
HENNESSY FUNDS 1-800-966-4354
| | | | Expenses Paid |
| | Beginning | Ending | During Period(1) |
| | Account Value | Account Value | November 1, 2013 – |
| | November 1, 2013 | April 30, 2014 | April 30, 2014 |
| Investor Class | | | |
| | | | |
| Actual | $1,000.00 | $1,060.60 | $7.66 |
| | | | |
| Hypothetical (5% return | | | |
| before expenses) | $1,000.00 | $1,017.36 | $7.50 |
| (1) | Expenses are equal to the Fund’s annualized expense ratio of 1.50%, multiplied by the average account value over the period, multiplied by 181/365 days (to reflect one-half year period). |
Proxy Voting
A description of the policies and procedures the Fund uses to determine how to vote proxies relating to portfolio securities is available without charge: (1) by calling 1-800-966-4354; (2) on the Hennessy Funds’ website at hennessyfunds.com; or (3) on the U.S. Securities and Exchange Commission’s (the “SEC”) website at www.sec.gov. The Fund’s proxy voting record is available on both the Hennessy Funds’ website at hennessyfunds.com and the SEC’s website at www.sec.gov no later than August 31 for the prior 12 months ending June 30.
Quarterly Filings on Form N-Q
The Fund files its complete schedule of portfolio holdings with the SEC for the first and third quarters of each fiscal year on Form N-Q. The Fund’s Forms N-Q are available on the SEC’s website at www.sec.gov. The Fund’s Forms N-Q may be reviewed and copied at the SEC’s Public Reference Room in Washington, DC and information on the operation of the Public Reference Room may be obtained by calling 1-800-SEC-0330. Information included in the Fund’s Forms N-Q will also be available upon request by calling 1-800-966-4354.
Federal Tax Distribution Information
(Unaudited)
For the fiscal year ended October 31, 2013, certain dividends paid by the Fund may be subject to a maximum tax rate of 15%, as provided for by the Jobs and Growth Tax Relief Reconciliation Act of 2003. The percentage of dividends declared from ordinary income designated as qualified dividend income was 100.00%.
For corporate shareholders, the percent of ordinary income distributions qualifying for the corporate dividends received deduction for the fiscal year ended October 31, 2013 was 100.00%.
The percentage of taxable ordinary income distributions that are designated as short-term capital gain distributions under Section 871(k)(2)(C) of the Internal Revenue Code of 1986, as amended, for the Fund was 0.00%.
Householding
To help keep the Fund’s costs as low as possible, we generally deliver a single copy of most financial reports and prospectuses to shareholders who share an address, even if the accounts are registered under different names. This process, known as “householding,” does not apply to account statements. You may, of course, request an individual copy of a prospectus or financial report at any time. If you would like to receive separate mailings, please call the Administrator at 1-800-261-6950 or 1-414-765-4124 and we will begin individual delivery within 30 days of your request. If your account is held through a financial institution or other intermediary, please contact them directly to request individual delivery.
HENNESSY FUNDS 1-800-966-4354
Board Approval of Investment Advisory
Agreement
At its meeting on March 3, 2014, the Board of Trustees of the Fund (the “Board”) unanimously approved the continuation of the investment advisory agreement of the Fund.
The Board reviewed a number of documents, including a memorandum provided by outside legal counsel that described the fiduciary duties of the Board with respect to approving the continuance of the investment advisory agreement and the relevant factors for consideration, a memorandum from the Advisor that listed each of the relevant factors and the documents provided to help the Board assess each such factor, the Advisor’s most recent Form 10-K and 10-Q, the Advisor’s Form ADV Part I, a document that listed the range of services provided by the Advisor for the Fund, a written discussion of economies of scale, a copy of the advisory agreement, a fund fact sheet, and peer expense and performance comparisons. The Board considered and discussed numerous factors, including the following:
| | • | The Board considered the services identified below that are provided by the Advisor: |
| | | • | The Advisor acts as portfolio manager for the Fund. In this capacity, the Advisor manages the composition of the portfolio of the Fund, including the purchase, retention, and disposition of portfolio securities in accordance with the Fund’s investment objectives, policies, and restrictions. |
| | | • | The Advisor performs daily reconciliations of portfolio positions and cash for the Fund. |
| | | • | The Advisor manages the use of soft dollars for the Fund. |
| | | • | The Advisor monitors compliance by the Fund with its investment objectives and restrictions. |
| | | • | The Advisor monitors compliance with federal securities laws and performs activities such as maintaining a compliance program, conducting ongoing reviews of the compliance programs of the Fund’s service providers, conducting on-site visits to the Fund’s service providers, monitoring incidents of abusive trading practices, reviewing Fund expense accruals, payments, and fixed expense ratios, evaluating insurance providers for fidelity bond coverage and D&O/E&O insurance coverage, conducting employee compliance training, reviewing reports provided by service providers, maintaining books and records, and preparing an annual compliance report to the Board. |
| | | • | The Advisor oversees service providers that support the Fund in providing fund accounting, fund administration, fund distribution, transfer agency, custodial, sales and marketing, audit, information technology, and legal services. |
| | | • | The Advisor maintains an in-house public relations and marketing department on behalf of the Fund. |
| | | • | The Advisor is actively involved with preparing regulatory filings for the Fund. |
| | | • | The Advisor manages proxy voting for the Fund. |
| | | • | The Advisor oversees distribution of the Fund through third-party broker/dealers and independent financial institutions such as Charles Schwab, Inc., Fidelity, TD Waterhouse, and Pershing. The Advisor participates in “no transaction fee” (“NTF”) programs with these companies on behalf of the Fund, |
| | | | which allows customers to purchase the Fund through third-party distribution channels without paying a transaction fee. The Advisor compensates a number of these third-party providers of NTF programs out of its own revenues and not those of the Fund. |
| | | • | The Advisor pays the incentive compensation of all of the Fund’s compliance officers and employs other staff such as management executives, legal personnel, marketing personnel, national accounts and distribution personnel, sales personnel, and trading oversight personnel. |
| | | • | The Advisor prepares or reviews Board materials, frequently presents to the Board or leads Board discussions, prepares or reviews meeting minutes, and arranges for Board training and education. |
| | • | The Board compared the performance of the Fund to benchmark indices over various periods of time and concluded that the positive performance of the Fund warranted the continuation of the advisory agreement. |
| | • | The Board reviewed the Fund’s expense ratio and comparable expense ratios for funds comparable to the Fund. The Board used data from Morningstar showing funds similar in asset size and investment objective to the Fund and determined that the expense ratio of the Fund falls within the range of the ratios of other comparable funds and concluded that the expenses of the Fund were reasonable. |
| | • | The Board considered the fees charged by the Advisor to those of funds similar in asset size and investment objective to the Fund and concluded the advisory fee of the Fund was reasonable and warranted continuation of the advisory agreement. The Trustees noted that the investment advisory fees are not adjusted if economies of scale are realized as the Fund grows because many of the expenses incurred by the Advisor to manage the Fund are asset-based fees and thus do not result in material economies of scale being realized as the net assets of the Fund increase. |
| | • | The Board considered the profitability of the Advisor with respect to the Fund and concluded the profits were reasonable and not excessive when compared to profitability guidelines set forth in relevant court cases. |
| | • | The Board considered the high level of professionalism and knowledge of the Advisor’s employees, along with an extremely low level of turnover of the employees of the Advisor, and concluded that this was beneficial to the Fund and its shareholders, as it ensures that the Fund is operated efficiently. |
All of the factors above were considered separately by the Board, including the Trustees who are not “interested persons” (as defined in the Investment Company Act of 1940, as amended) of the Fund (the “Independent Trustees”) meeting in an executive session. The factors were viewed in their totality by the Board, with no single factor being the principal or determinative factor in the Board’s determination of whether to approve the continuation of the advisory agreement. Based on the factors discussed above, the Board, including all of the Independent Trustees, recommended continuation of the advisory agreement.
HENNESSY FUNDS 1-800-966-4354
(This Page Intentionally Left Blank.)
For information, questions or assistance, please call
The Hennessy Funds
1-800-966-4354 or 1-415-899-1555
INVESTMENT ADVISOR
Hennessy Advisors, Inc.
7250 Redwood Blvd., Suite 200
Novato, California 94945
ADMINISTRATOR,
TRANSFER AGENT,
DIVIDEND PAYING AGENT &
SHAREHOLDER SERVICING AGENT
U.S. Bancorp Fund Services, LLC
P.O. Box 701
Milwaukee, Wisconsin 53201-0701
CUSTODIAN
U.S. Bank N.A.
Custody Operations
1555 North River Center Dr., Suite 302
Milwaukee, Wisconsin 53212
TRUSTEES
Neil J. Hennessy
Robert T. Doyle
J. Dennis DeSousa
Gerald P. Richardson
COUNSEL
Foley & Lardner LLP
777 East Wisconsin Avenue
Milwaukee, Wisconsin 53202-5306
INDEPENDENT REGISTERED
PUBLIC ACCOUNTING FIRM
Tait, Weller & Baker LLP
1818 Market Street, Suite 2400
Philadelphia, Pennsylvania 19103
DISTRIBUTOR
Quasar Distributors, LLC
615 East Michigan Street
Milwaukee, Wisconsin 53202
hennessyfunds.com | 1-800-966-4354
This report has been prepared for shareholders and may be distributed to
others only if preceded or accompanied by a current prospectus.
SEMI-ANNUAL REPORT
APRIL 30, 2014
HENNESSY TECHNOLOGY FUND
Investor Class HTECX
Institutional Class HTCIX
hennessyfunds.com | 1-800-966-4354
(This Page Intentionally Left Blank.)
Contents
| Letter to Shareholders | | 2 |
| Performance Overview | | 4 |
| Financial Statements | | |
| Schedule of Investments | | 7 |
| Statement of Assets and Liabilities | | 11 |
| Statement of Operations | | 12 |
| Statements of Changes in Net Assets | | 13 |
| Financial Highlights | | 14 |
| Notes to the Financial Statements | | 18 |
| Expense Example | | 25 |
| Proxy Voting | | 27 |
| Quarterly Filings on Form N-Q | | 27 |
| Householding | | 27 |
| Board Approval of Investment Advisory Agreement | | 28 |
HENNESSY FUNDS 1-800-966-4354
June 2014
Dear Shareholder:
The financial markets have provided strong returns over the past six-months ended April 30, 2014, with the Dow Jones Industrial Average (DJIA) and S&P 500 both returning approximately 8% during the period. The current valuation metrics of the major indices are solid; for example, the DJIA currently has a price-to-earnings ratio of 15x and a price-to-sales ratio of 1.75x. The DJIA also has a dividend yield of 2.2%, which is nearly as high as that of a 10-Year U.S. Treasury, which is currently yielding 2.6%. Investing in high-yielding, high-quality DJIA stocks have the potential to not only provide an income stream but also for stock price appreciation as well. Fixed income investing has run its course, in my opinion, and many individuals are currently benefiting from the return to investing in equities that possess strong fundamentals.
U.S. corporations continue to drive shareholder value by making acquisitions, initiating and raising dividends, investing in internal infrastructure, and buying back stock. However, lately I have begun to see a shift in those business strategies. The easier-to-execute acquisitions seem to be a thing of the past, and firms now have to be even more creative to execute accretive deals. I also believe that while firms may continue to initiate dividends, fewer firms will raise their dividends and fewer firms will participate in stock buyback programs going forward. So what will these cash-rich companies do with their capital if they are not raising dividends or buying back stock? I believe we will see companies begin to initiate capital expenditure programs.
Due to the continuing uncertainty from a lack of clear policies on taxes, healthcare, and regulations, I have observed that corporations would rather wait for clarity from our government leaders and defer any significant changes to their current business models. Up until this point, there has been no real cost for firms to defer spending their capital as they wait for anticipated guidance on policies that directly affect their businesses. But, this economic handcuffing from all of this uncertainty has gone on long enough. I believe there will now be firms who want to improve their margins and will begin spending money to expand their sales, and may even begin to hire. Once a competitor begins to move in this way, then the cost to defer becomes real for companies. This movement to expansion may well be a catalyst to propel the financial markets. I do believe this will be a slow shift, but one that will keep the economy improving, and should, in my opinion, help to generate reasonable market returns over the next few years.
With almost $3 trillion in cash sitting on the sidelines, this strategic shift by companies to begin spending their idle capital should help the economic recovery in the U.S. But that is only one part of the equation. Washington politics still play a role in how strong that recovery will be. The national political landscape will change in the next few years, and the future generation of elected officials will be faced with what I believe are fictitious unemployment figures (6.3% reported, when over 20 million Americans are looking for more work or a better job), a sluggish economy, and global competition in business. The next regime needs to provide real clarity on the issues that face all Americans and American corporations: taxation, regulation, and how to pay for our new healthcare system. I also believe that our government needs to regard business as a noble profession and to implement common sense and logic in their policy making instead of politics as usual. As Confucius is quoted as saying, “Life is really simple, but we insist on making it complicated.”
I am confident that even with all the hurdles facing corporate America, companies continue to provide good value for their shareholders, and I believe that means the financial markets are in good shape and should remain strong moving forward, I also believe that the next few months may be volatile. Fads come and go, and the current buzz on the Street is around investing in social media stocks. I believe that chasing hot products has contributed and will continue to contribute to the volatility of the markets this year. After over 35 years in the business, I still firmly believe the best way to position your portfolio is by investing in good companies over the long term, rather than trying to buy the next hot idea at exactly the right time. At Hennessy Funds, hunches and fads have no place in our investment process, and we understand that successful investing comes from time in the market, not timing the market.
We remain focused on investing based on proven fundamentals, and we are committed to managing money for the sole benefit of our shareholders. If you have any questions or want to speak with us directly, please don’t hesitate to call us at (800) 966-4354.
Best regards,
Neil J. Hennessy
President and Chief Investment Officer
Past performance does not guarantee future results.
Mutual fund investing involves risk. Principal loss is possible.
Opinions expressed are those of Neil Hennessy and are subject to change, are not guaranteed and should not be considered investment advice.
The Dow Jones Industrial Average and S&P 500 are unmanaged indices commonly used to measure the performance of U.S. stocks. One cannot invest directly in an index.
Price-to-sales ratio and price-to-earnings ratio are tools for calculating relative valuation. Price-to-sales ratio is calculated by dividing the market price by revenue per share. Price-to-earnings ratio is the market price per share divided by earnings per share.
HENNESSY FUNDS 1-800-966-4354
Performance Overview (Unaudited)
The opinions expressed in the following commentary reflect those of the Portfolio Managers as of the date written. Any such opinions are subject to change based on market or other conditions and are not guaranteed. These opinions may not be relied upon as investment advice. Investment decisions for the Fund are based on several factors, and may not be relied upon as an indication of trading intent on behalf of the Fund. Security positions can and do change.
AVERAGE ANNUAL TOTAL RETURN PERIODS ENDED APRIL 30, 2014
| | Six | One | Five | Ten |
| | Months(1) | Year | Years | Years |
| Hennessy Technology Fund – | | | | |
| Investor Class (HTECX) | -0.81% | 15.93% | 12.44% | 5.45% |
| Hennessy Technology Fund – | | | | |
Institutional Class (HTCIX)(2) | -0.66% | 16.25% | 12.65% | 5.55% |
| NASDAQ Composite Index | 5.04% | 24.87% | 20.36% | 8.90% |
| S&P 500 Index | 8.36% | 20.44% | 19.14% | 7.67% |
| Expense ratios: | Gross 3.08%, Net 1.99%(3) (Investor Class); |
| | Gross 2.80%, Net 1.74%(3) (Institutional Class) |
Performance data quoted represents past performance; past performance does not guarantee future results. The investment return and principal value of an investment will fluctuate so that an investor’s shares, when redeemed, may be worth more or less than their original cost. Current performance of the Fund may be lower or higher than the performance quoted. Performance data current to the most recent month end may be obtained by visiting hennessyfunds.com. Performance for periods prior to October 26, 2012 is that of the FBR Technology Fund.
The expense ratios presented are from the most recent prospectus.
| (1) | Periods less than one year are not annualized. |
| (2) | The inception date of the Institutional Class shares is March 12, 2010. Performance shown prior to the inception of the Institutional Class shares reflects the performance of the Investor Class shares and includes expenses that are not applicable to and are higher than those of the Institutional Class shares. |
| (3) | The Fund’s investment advisor has contractually agreed to waive a portion of its expenses through February 28, 2015. |
PERFORMANCE NARRATIVE
Portfolio Managers Winsor H. Aylesworth and David H. Ellison
Over the previous six months, how did the Fund perform and what factors contributed to this performance?
For the six-month period ended April 30, 2014, the Investor Class of the Hennessy Technology Fund returned -0.81%, underperforming the NASDAQ Composite Index, the S&P 500 Index, and the Morningstar Technology Category Average, which returned 5.04%, 8.36%, and 6.46% for the same period, respectively.
After a relatively good period of performance, the Fund underperformed its benchmarks. During the period, investors for various reasons started taking profits in the names that had appreciated the most. This correction hit stocks in both the Healthcare and Technology sectors. The Healthcare and Technology correction hit the Fund particularly hard because they were a major category of investment. In summary, investor sentiment shifted from a growth bent to a value orientation. Our emphasis on stocks with
growing tangible book, growing revenues and growing profits, as desirable as that is, just did not reward this period.
Two stocks that did reward us were Illumina, Inc. and athenahealth, Inc., which returned 45% and 29%, respectively. Illumina, Inc. manufactures and markets life science tools and integrated systems for the analytics of data to the biotech industry, while athenahealth, Inc. provides cloud-based services and health record software to the Healthcare industry. With the aging population and the emphasis on managing health care costs, these stocks have been, and are expected to possibly be, in the sweet spot for growth for the foreseeable future. Both of these holdings comprised 3 - 4% of the Fund’s total assets during the period. We feel any market downturn would provide buying opportunity in these holdings, and the Fund continues to hold both of these positions.
Every portfolio has some holdings that underperform and do not meet investment expectations. We are always evaluating information to determine if we deem the underperformance to be just a “blip” or whether the stock should be eliminated from the Fund’s portfolio. Two stocks still owned by the Fund that had what we believe was a “blip” with respect to their recent performance are Amazon.com, Inc. and NetSuite, Inc., with six-month returns of -24% and -23%, respectively. Well known and widely held Amazon.com, Inc. is one of the largest online retailers and has an impressive record of revenue growth. Unfortunately, this is an example of where investors took profits during the period. We continue to believe Amazon.com, Inc. is a leader in combining technology with the retail experience and should continue to grow and has the potential to reward investors again. NetSuite, Inc. is a cloud-based software provider. The stock was not immune to correction as its price had perhaps been overvalued in relation to its impressive record of growth. Each of these holdings comprised 2 ½ - 3% of the Fund’s total assets during the period. The Fund continues to hold both of these positions.
Additional Portfolio Manager commentary and related investment outlook:
Investors have much to be nervous about with geopolitics, job growth, housing starts, and interest rates issues dominating headlines. It is not unexpected that at times investors, both large and small, review their portfolios and rebalance by selling the winners and buying alternatives. It is our belief we are in such a period. The good news is that we believe the Technology industry should continue to entice investors, as it offers potential solutions to the problems of mankind and innovative products for the consumer. As investor fears ease and the economy improves, revenues and profits for successful companies should grow along with their tangible book value. As a result, stock prices should improve. We will continue to offer the Fund’s shareholders exposure to this segment following a consistent approach that emphasizes these metrics.
The NASDAQ Composite Index is a broad-based capitalization-weighted index of all the NASDAQ National Market and Small Cap stocks. The S&P 500 Index is an unmanaged index commonly used to measure the performance of U.S. stocks. You cannot invest directly in an index. Performance data for an index does not reflect any deductions for fees, expenses or taxes. The Fund is non-diversified, meaning it concentrates its assets in fewer holdings than a diversified fund and is therefore more exposed to individual stock volatility than a diversified fund. Investments are focused in the technology industry, which may be adversely affected by rapidly changing technology, availability of capital, R&D, government regulation and the relatively high risks of obsolescence caused by scientific and technological advances. Investments in foreign securities may involve greater volatility and political, economic and currency risk and differences in accounting methods. The Fund may invest in IPOs, which may fluctuate considerably due to the absence of a prior public market and may have a magnified impact on the Fund. The Fund invests in small- and medium-capitalization companies, which involves additional risks such as more limited liquidity and
HENNESSY FUNDS 1-800-966-4354
greater volatility than large-capitalization companies. References to specific securities should not be considered a recommendation to buy or sell any security. Fund holdings and sector allocations are subject to change. Please refer to the Schedule of Investments included in this report for additional portfolio information.
Tangible Book Value is a method of valuing a company by measuring its equity after removing any intangible assets.
Each Morningstar category average represents a universe of funds with similar investment objectives. © Morningstar, Inc. All Rights Reserved. The information contained herein: 1) is proprietary to Morningstar; 2) may not be copied or distributed and 3) is not warranted to be accurate, complete or timely. Neither Morningstar nor its content providers are responsible for any damages or losses arising from any use of this information. Past performance does not guarantee future results.
Schedule of Investments
HENNESSY TECHNOLOGY FUND
As of April 30, 2014 (Unaudited)
(% of Net Assets)
| | TOP TEN HOLDINGS (EXCLUDING CASH/CASH EQUIVALENTS) | % NET ASSETS |
| | Gilead Sciences, Inc. | 5.19% |
| | Micron Technology, Inc. | 4.59% |
| | SanDisk Corp. | 4.56% |
| | Amazon.com, Inc. | 4.55% |
| | IMS Health Holdings, Inc. | 4.53% |
| | T- Mobile US, Inc. | 4.52% |
| | Illumina, Inc. | 4.42% |
| | Biogen Idec, Inc. | 4.36% |
| | Thermo Fisher Scientific, Inc. | 4.35% |
| | Alexion Pharmaceuticals, Inc. | 4.35% |
Note: For presentation purposes, the Fund has grouped some of the industry categories. For purposes of categorizing securities for compliance with Section 8(b)(1) of the Investment Company Act of 1940, the Fund uses more specific industry classifications.
HENNESSY FUNDS 1-800-966-4354
| | COMMON STOCKS – 96.27% | | Number | | | | | | % of | |
| | | | of Shares | | | Value | | | Net Assets | |
| | Consumer Discretionary – 10.63% | | | | | | | | | |
| | Amazon.com, Inc. (a) | | | 920 | | | $ | 279,800 | | | | 4.55 | % |
| | Harman International Industries, Inc. | | | 1,050 | | | | 115,090 | | | | 1.87 | % |
| | NetFlix, Inc. (a) | | | 805 | | | | 259,242 | | | | 4.21 | % |
| | | | | | | | | 654,132 | | | | 10.63 | % |
| | | | | | | | | | | | | | |
| | Financials – 1.24% | | | | | | | | | | | | |
| | Zillow, Inc. (a) | | | 705 | | | | 76,634 | | | | 1.24 | % |
| | | | | | | | | | | | | | |
| | Health Care – 30.89% | | | | | | | | | | | | |
| | Alexion Pharmaceuticals, Inc. (a) | | | 1,690 | | | | 267,358 | | | | 4.35 | % |
| | Align Technology, Inc. (a) | | | 1,440 | | | | 72,562 | | | | 1.18 | % |
| | athenahealth, Inc. (a) | | | 930 | | | | 114,985 | | | | 1.87 | % |
| | Biogen Idec, Inc. (a) | | | 935 | | | | 268,457 | | | | 4.36 | % |
| | Gilead Sciences, Inc. (a) | | | 4,065 | | | | 319,062 | | | | 5.19 | % |
| | Illumina, Inc. (a) | | | 2,003 | | | | 272,107 | | | | 4.42 | % |
| | IMS Health Holdings, Inc. (a) | | | 11,750 | | | | 278,945 | | | | 4.53 | % |
| | Medidata Solutions, Inc. (a) | | | 1,077 | | | | 39,106 | | | | 0.64 | % |
| | Thermo Fisher Scientific, Inc. | | | 2,350 | | | | 267,900 | | | | 4.35 | % |
| | | | | | | | | 1,900,482 | | | | 30.89 | % |
| | | | | | | | | | | | | | |
| | Information Technology – 48.41% | | | | | | | | | | | | |
| | 3D Systems Corp. (a) | | | 2,002 | | | | 94,775 | | | | 1.54 | % |
| | Alliance Fiber Optic Products, Inc. | | | 1,865 | | | | 35,845 | | | | 0.58 | % |
| | Applied Materials, Inc. | | | 13,950 | | | | 265,887 | | | | 4.32 | % |
| | Arris Group, Inc. (a) | | | 2,182 | | | | 56,928 | | | | 0.93 | % |
| | Bottomline Technologies, Inc. (a) | | | 1,000 | | | | 31,640 | | | | 0.51 | % |
| | Finisar Corp. (a) | | | 1,495 | | | | 39,094 | | | | 0.64 | % |
| | First Solar, Inc. (a) | | | 1,545 | | | | 104,272 | | | | 1.69 | % |
| | Fleetmatics Group PLC (a)(c) | | | 2,195 | | | | 65,916 | | | | 1.07 | % |
| | iGATE Corp. (a) | | | 975 | | | | 35,685 | | | | 0.58 | % |
| | Imperva, Inc. (a) | | | 2,200 | | | | 50,336 | | | | 0.82 | % |
| | Interactive Intelligence Group, Inc (a) | | | 625 | | | | 39,106 | | | | 0.64 | % |
| | LAM Research Corp. (a) | | | 2,830 | | | | 163,036 | | | | 2.65 | % |
| | Lattice Semiconductor Corp. (a) | | | 5,125 | | | | 43,153 | | | | 0.70 | % |
| | Methode Electronics, Inc. | | | 1,505 | | | | 41,749 | | | | 0.68 | % |
| | Micron Technology, Inc. (a) | | | 10,815 | | | | 282,488 | | | | 4.59 | % |
| | NetSuite, Inc. (a) | | | 1,265 | | | | 97,797 | | | | 1.59 | % |
The accompanying notes are an integral part of these financial statements.
| | COMMON STOCKS | | Number | | | | | | % of | |
| | | | of Shares | | | Value | | | Net Assets | |
| | Information Technology (Continued) | | | | | | | | | |
| | Pandora Media, Inc. (a) | | | 5,100 | | | $ | 119,442 | | | | 1.94 | % |
| | Proofpoint, Inc. (a) | | | 2,100 | | | | 53,424 | | | | 0.87 | % |
| | salesforce.com, Inc. (a) | | | 5,120 | | | | 264,448 | | | | 4.30 | % |
| | SanDisk Corp. | | | 3,300 | | | | 280,401 | | | | 4.56 | % |
| | Servicenow, Inc. (a) | | | 2,750 | | | | 136,730 | | | | 2.22 | % |
| | Splunk, Inc. (a) | | | 2,500 | | | | 136,425 | | | | 2.22 | % |
| | SS&C Technologies Holdings, Inc. (a) | | | 1,275 | | | | 49,623 | | | | 0.81 | % |
| | Stratasys Ltd. (a)(c) | | | 860 | | | | 83,308 | | | | 1.35 | % |
| | The Ultimate Software Group, Inc. (a) | | | 495 | | | | 59,217 | | | | 0.96 | % |
| | Workday, Inc. (a) | | | 3,615 | | | | 264,148 | | | | 4.29 | % |
| | Yelp, Inc. (a) | | | 1,440 | | | | 83,981 | | | | 1.36 | % |
| | | | | | | | | 2,978,854 | | | | 48.41 | % |
| | | | | | | | | | | | | | |
| | Telecommunication Services – 5.10% | | | | | | | | | | | | |
| | 8x8 Inc. (a) | | | 3,665 | | | | 35,551 | | | | 0.58 | % |
| | T- Mobile US, Inc. (a) | | | 9,500 | | | | 278,255 | | | | 4.52 | % |
| | | | | | | | | 313,806 | | | | 5.10 | % |
| | | | | | | | | | | | | | |
| | Total Common Stocks | | | | | | | | | | | | |
| | (Cost $5,861,422) | | | | | | | 5,923,908 | | | | 96.27 | % |
| | | | | | | | | | | | | | |
| | INVESTMENT COMPANIES (EXCLUDING | | | | | | | | | | | | |
| | MONEY MARKET FUNDS) – 0.52% | | | | | | | | | | | | |
| | Hercules Technology Growth Capital, Inc. | | | 2,320 | | | | 31,737 | | | | 0.52 | % |
| | | | | | | | | | | | | | |
| | Total Investment Companies (Excluding | | | | | | | | | | | | |
| | Money Market Funds) | | | | | | | | | | | | |
| | (Cost $30,636) | | | | | | | 31,737 | | | | 0.52 | % |
The accompanying notes are an integral part of these financial statements.
HENNESSY FUNDS 1-800-966-4354
| | SHORT-TERM INVESTMENTS – 4.00% | | Number | | | | | | % of | |
| | | | of Shares | | | Value | | | Net Assets | |
| | Money Market Funds – 4.00% | | | | | | | | | |
| | Fidelity Government Portfolio – | | | | | | | | | |
| | Institutional Class, 0.01% (b) | | | 245,868 | | | $ | 245,868 | | | | 4.00 | % |
| | | | | | | | | | | | | | |
| | Total Money Market Funds | | | | | | | | | | | | |
| | (Cost $245,868) | | | | | | | 245,868 | | | | 4.00 | % |
| | | | | | | | | | | | | | |
| | Total Short-Term Investments | | | | | | | | | | | | |
| | (Cost $245,868) | | | | | | | 245,868 | | | | 4.00 | % |
| | | | | | | | | | | | | | |
| | Total Investments | | | | | | | | | | | | |
| | (Cost $6,137,926) – 100.79% | | | | | | | 6,201,513 | | | | 100.79 | % |
| | Liabilities in Excess | | | | | | | | | | | | |
| | of Other Assets – (0.79)% | | | | | | | (48,398 | ) | | | (0.79 | )% |
| | TOTAL NET ASSETS – 100.00% | | | | | | $ | 6,153,115 | | | | 100.00 | % |
Percentages are stated as a percent of net assets.
| (a) | Non-income producing security. |
| (b) | The rate listed is the fund’s 7-day yield as of April 30, 2014. |
| (c) | U.S. traded security of a foreign corporation. |
Summary of Fair Value Exposure at April 30, 2014
The following is a summary of the inputs used to value the Fund’s net assets as of April 30, 2014 (See Note 3 in the accompanying notes to the financial statements):
| Common Stock | | Level 1 | | | Level 2 | | | Level 3 | | | Total | |
| Consumer Discretionary | | $ | 654,132 | | | $ | — | | | $ | — | | | $ | 654,132 | |
| Financials | | | 76,634 | | | | — | | | | — | | | | 76,634 | |
| Health Care | | | 1,900,482 | | | | — | | | | — | | | | 1,900,482 | |
| Information Technology | | | 2,978,854 | | | | — | | | | — | | | | 2,978,854 | |
| Telecommunication Services | | | 313,806 | | | | — | | | | — | | | | 313,806 | |
| Total Common Stock | | $ | 5,923,908 | | | $ | — | | | $ | — | | | $ | 5,923,908 | |
| Investment Companies (Excluding | | | | | | | | | | | | | | | | |
| Money Market Funds) | | $ | 31,737 | | | $ | — | | | $ | — | | | $ | 31,737 | |
| Short-Term Investments | | | | | | | | | | | | | | | | |
| Money Market Funds | | $ | 245,868 | | | $ | — | | | $ | — | | | $ | 245,868 | |
| Total Short-Term Investments | | $ | 245,868 | | | $ | — | | | $ | — | | | $ | 245,868 | |
| Total Investments | | $ | 6,201,513 | | | $ | — | | | $ | — | | | $ | 6,201,513 | |
Transfers between levels are recognized at the end of the reporting period. During the six-month period ended April 30, 2014, the Fund recognized no transfers between levels.
The accompanying notes are an integral part of these financial statements.
Financial Statements
Statement of Assets and Liabilities as of April 30, 2014 (Unaudited) |
| ASSETS: | | | |
| Investments in securities, at value (cost $6,137,926) | | $ | 6,201,513 | |
| Dividends and interest receivable | | | 137 | |
| Receivable for fund shares sold | | | 176 | |
| Receivable for securities sold | | | 106,058 | |
| Prepaid expenses and other assets | | | 23,881 | |
| Due from advisor | | | 485 | |
| Total Assets | | | 6,332,250 | |
| | | | | |
| LIABILITIES: | | | | |
| Payable for securities purchased | | | 114,641 | |
| Payable for fund shares redeemed | | | 35,246 | |
| Payable to administrator | | | 2,897 | |
| Payable to auditor | | | 9,474 | |
| Distribution payable | | | 4,873 | |
| Accrued trustees fees | | | 5,376 | |
| Accrued expenses and other payables | | | 6,628 | |
| Total Liabilities | | | 179,135 | |
| NET ASSETS | | $ | 6,153,115 | |
| | | | | |
| NET ASSETS CONSIST OF: | | | | |
| Capital stock | | $ | 7,207,201 | |
| Accumulated net investment loss | | | (117,340 | ) |
| Accumulated net realized loss on investments | | | (1,000,333 | ) |
| Unrealized net appreciation on investments | | | 63,587 | |
| Total Net Assets | | $ | 6,153,115 | |
| | | | | |
| NET ASSETS | | | | |
| Investor Class: | | | | |
| Shares authorized (no par value) | | Unlimited | |
| Net assets applicable to outstanding Investor Class shares | | | 4,929,734 | |
| Shares issued and outstanding | | | 366,256 | |
| Net asset value, offering price and redemption price per share | | $ | 13.46 | |
| | | | | |
| Institutional Class: | | | | |
| Shares authorized (no par value) | | Unlimited | |
| Net assets applicable to outstanding Institutional Class shares | | | 1,223,381 | |
| Shares issued and outstanding | | | 90,047 | |
| Net asset value, offering price and redemption price per share | | $ | 13.59 | |
The accompanying notes are an integral part of these financial statements.
HENNESSY FUNDS 1-800-966-4354
Financial Statements
Statement of Operations Six Months Ended April 30, 2014 (Unaudited) |
| INVESTMENT INCOME: | | | |
| Dividend income | | $ | 7,681 | |
| Interest income | | | 11 | |
| Total investment income | | | 7,692 | |
| | | | | |
| EXPENSES: | | | | |
| Investment advisory fees | | | 28,040 | |
| Federal and state registration fees | | | 16,557 | |
| Compliance expense | | | 10,655 | |
| Audit fees | | | 9,472 | |
| Trustees’ fees and expenses | | | 6,943 | |
| Distribution fees – Investor Class (See Note 5) | | | 6,179 | |
| Administration, fund accounting, custody and transfer agent fees | | | 3,664 | |
| Legal fees | | | 2,480 | |
| Sub-transfer agent expenses – Investor Class (See Note 5) | | | 2,460 | |
| Sub-transfer agent expenses – Institutional Class (See Note 5) | | | 161 | |
| Reports to shareholders | | | 1,106 | |
| Other expenses | | | 3,565 | |
| Total expenses before reimbursement from advisor | | | 91,282 | |
| Expense reimbursement by advisor – Investor Class | | | (25,872 | ) |
| Expense reimbursement from advisor – Institutional Class | | | (6,267 | ) |
| Net expenses | | | 59,143 | |
| NET INVESTMENT LOSS | | $ | (51,451 | ) |
| | | | | |
| REALIZED AND UNREALIZED GAINS (LOSSES): | | | | |
| Net realized gain on investments | | $ | 767,400 | |
| Change in unrealized appreciation on investments | | | (828,267 | ) |
| Net gain (loss) on investments | | | (60,867 | ) |
| NET DECREASE IN NET ASSETS RESULTING FROM OPERATIONS | | $ | (112,318 | ) |
The accompanying notes are an integral part of these financial statements.
Financial Statements
| Statements of Changes in Net Assets |
| | | Six Months Ended | | | | |
| | | April 30, 2014 | | | Year Ended | |
| | | (Unaudited) | | | October 31, 2013 | |
| OPERATIONS: | | | | | | |
| Net investment loss | | $ | (51,451 | ) | | $ | (66,991 | ) |
| Net realized gain on securities | | | 767,400 | | | | 577,798 | |
| Change in unrealized appreciation (depreciation) | | | | | | | | |
| on securities | | | (828,267 | ) | | | 802,157 | |
| Net increase (decrease) in net assets | | | | | | | | |
| resulting from operations | | | (112,318 | ) | | | 1,312,964 | |
| | | | | | | | | |
| CAPITAL SHARE TRANSACTIONS: | | | | | | | | |
| Proceeds from shares subscribed – Investor Class | | | 828,795 | | | | 633,313 | |
| Proceeds from shares subscribed – Institutional Class | | | 84,537 | | | | 199,069 | |
| Cost of shares redeemed – Investor Class | | | (285,707 | ) | | | (1,642,150 | ) |
| Cost of shares redeemed – Institutional Class | | | (42,641 | ) | | | (196,791 | ) |
| Net increase (decrease) in net assets | | | | | | | | |
| derived from capital share transactions | | | 584,984 | | | | (1,006,559 | ) |
| TOTAL INCREASE IN NET ASSETS | | | 472,666 | | | | 306,405 | |
| | | | | | | | | |
| NET ASSETS: | | | | | | | | |
| Beginning of period | | | 5,680,449 | | | | 5,374,044 | |
| End of period | | $ | 6,153,115 | | | $ | 5,680,449 | |
| Undistributed net investment loss, end of period | | $ | (117,340 | ) | | $ | (65,889 | ) |
| | | | | | | | | |
| CHANGES IN SHARES OUTSTANDING: | | | | | | | | |
| Shares sold – Investor Class | | | 55,585 | | | | 54,289 | |
| Shares sold – Institutional Class | | | 5,809 | | | | 16,644 | |
| Shares redeemed – Investor Class | | | (20,262 | ) | | | (139,783 | ) |
| Shares redeemed – Institutional Class | | | (2,781 | ) | | | (16,569 | ) |
| Net increase (decrease) in shares outstanding | | | 38,351 | | | | (85,419 | ) |
The accompanying notes are an integral part of these financial statements.
HENNESSY FUNDS 1-800-966-4354
Financial Highlights
For an Investor Class share outstanding throughout each period
| | | Six Months Ended | |
| | | April 30, 2014 | |
| | | (Unaudited) | |
| PER SHARE DATA: | | | |
| Net asset value, beginning of period | | $ | 13.57 | |
| | | | | |
| Income from investment operations: | | | | |
| Net investment loss | | | (0.10 | ) |
| Net realized and unrealized gains (losses) on investments | | | (0.01 | ) |
| Total from investment operations | | | (0.11 | ) |
| Paid-in capital from redemption fees | | | — | |
| Net asset value, end of period | | $ | 13.46 | |
| | | | | |
| TOTAL RETURN | | | (0.81 | )%(4) |
| | | | | |
| SUPPLEMENTAL DATA AND RATIOS: | | | | |
| Net assets, end of period (millions) | | $ | 4.93 | |
| Ratio of expenses to average net assets: | | | | |
| Before expense reimbursement | | | 3.00 | %(5) |
| After expense reimbursement | | | 1.95 | %(5) |
| Ratio of net investment income (loss) to average net assets: | | | | |
| Before expense reimbursement | | | (2.75 | )%(5) |
| After expense reimbursement | | | (1.70 | )%(5) |
Portfolio turnover rate(3) | | | 99 | %(4) |
| (1) | Calculated based on average shares outstanding method. |
| (2) | Amount is less than $0.01. |
| (3) | Portfolio turnover is calculated on the basis of the Fund as a whole. |
| (4) | Not annualized. |
| (5) | Annualized. |
The accompanying notes are an integral part of these financial statements.
| Year Ended October 31, | |
| 2013 | | | 2012 | | | 2011 | | | 2010 | | | 2009 | |
| | | | | | | | | | | | | | |
| $ | 10.67 | | | $ | 10.86 | | | $ | 11.00 | | | $ | 9.05 | | | $ | 6.96 | |
| | | | | | | | | | | | | | | | | | | |
| | | | | | | | | | | | | | | | | | | |
| | (0.20 | ) | | | (0.15 | ) | | | (0.17 | )(1) | | | (0.14 | ) | | | (0.08 | ) |
| | 3.10 | | | | (0.04 | ) | | | 0.03 | | | | 2.08 | | | | 2.16 | |
| | 2.90 | | | | (0.19 | ) | | | (0.14 | ) | | | 1.94 | | | | 2.08 | |
| | — | | | | 0.00 | (2) | | | 0.00 | (2) | | | 0.01 | | | | 0.01 | |
| $ | 13.57 | | | $ | 10.67 | | | $ | 10.86 | | | $ | 11.00 | | | $ | 9.05 | |
| | | | | | | | | | | | | | | | | | | |
| | 27.18 | % | | | (1.75 | )% | | | (1.27 | )% | | | 21.55 | % | | | 30.03 | % |
| | | | | | | | | | | | | | | | | | | |
| | | | | | | | | | | | | | | | | | | |
| $ | 4.49 | | | $ | 4.44 | | | $ | 5.70 | | | $ | 8.21 | | | $ | 8.39 | |
| | | | | | | | | | | | | | | | | | | |
| | 3.04 | % | | | 3.20 | % | | | 2.79 | % | | | 2.50 | % | | | 3.00 | % |
| | 1.95 | % | | | 1.95 | % | | | 1.95 | % | | | 1.95 | % | | | 1.95 | % |
| | | | | | | | | | | | | | | | | | | |
| | (2.36 | )% | | | (2.39 | )% | | | (2.38 | )% | | | (1.64 | )% | | | (2.10 | )% |
| | (1.27 | )% | | | (1.14 | )% | | | (1.54 | )% | | | (1.10 | )% | | | (1.05 | )% |
| | 164 | % | | | 138 | % | | | 141 | % | | | 353 | % | | | 211 | % |
The accompanying notes are an integral part of these financial statements.
HENNESSY FUNDS 1-800-966-4354
Financial Highlights
For an Institutional Class share outstanding throughout each period
| | | Six Months Ended | |
| | | April 30, 2014 | |
| | | (Unaudited) | |
| PER SHARE DATA: | | | |
| Net asset value, beginning of period | | $ | 13.68 | |
| | | | | |
| Income from investment operations: | | | | |
| Net investment loss | | | (0.10 | ) |
| Net realized and unrealized gains (losses) on investments | | | 0.01 | |
| Total from investment operations | | | (0.09 | ) |
| Paid-in capital from redemption fees | | | — | |
| Net asset value, end of period | | $ | 13.59 | |
| | | | | |
| TOTAL RETURN | | | (0.66 | )%(4) |
| | | | | |
| SUPPLEMENTAL DATA AND RATIOS: | | | | |
| Net assets, end of period (millions) | | $ | 1.22 | |
| Ratio of expenses to average net assets: | | | | |
| Before expense reimbursement | | | 2.67 | %(5) |
| After expense reimbursement | | | 1.70 | %(5) |
| Ratio of net investment income (loss) to average net assets: | | | | |
| Before expense reimbursement | | | (2.42 | )%(5) |
| After expense reimbursement | | | (1.45 | )%(5) |
Portfolio turnover rate(6) | | | 99 | %(4) |
| (1) | Institutional Class shares commenced operations on March 12, 2010. |
| (2) | Calculated based on average shares outstanding method. |
| (3) | Amount is less than $0.01. |
| (4) | Not annualized. |
| (5) | Annualized. |
| (6) | Portfolio turnover is calculated on the basis of the Fund as a whole. |
The accompanying notes are an integral part of these financial statements.
| | | | | | | | | | Period Ended | |
| For the Year Ended October 31, | | | October 31, | |
| 2013 | | | 2012 | | | 2011 | | | 2010(1) | |
| | | | | | | | | | | |
| $ | 10.73 | | | $ | 10.89 | | | $ | 11.00 | | | $ | 10.46 | |
| | | | | | | | | | | | | | | |
| | | | | | | | | | | | | | | |
| | (0.12 | ) | | | (0.11 | ) | | | (0.14 | )(2) | | | (0.07 | ) |
| | 3.07 | | | | (0.05 | ) | | | 0.03 | | | | 0.61 | |
| | 2.95 | | | | (0.16 | ) | | | (0.11 | ) | | | 0.54 | |
| | — | | | | 0.00 | (3) | | | 0.00 | (3) | | | 0.00 | (3) |
| $ | 13.68 | | | $ | 10.73 | | | $ | 10.89 | | | $ | 11.00 | |
| | | | | | | | | | | | | | | |
| | 27.49 | % | | | (1.47 | )% | | | (1.00 | )% | | | 5.16 | %(4) |
| | | | | | | | | | | | | | | |
| | | | | | | | | | | | | | | |
| $ | 1.19 | | | $ | 0.93 | | | $ | 1.16 | | | $ | 4.61 | |
| | | | | | | | | | | | | | | |
| | 2.76 | % | | | 4.11 | % | | | 3.45 | % | | | 2.34 | %(5) |
| | 1.70 | % | | | 1.70 | % | | | 1.70 | % | | | 1.70 | %(5) |
| | | | | | | | | | | | | | | |
| | (2.10 | )% | | | (3.31 | )% | | | (2.99 | )% | | | (1.41 | )%(5) |
| | (1.04 | )% | | | (0.90 | )% | | | (1.24 | )% | | | (0.77 | )%(5) |
| | 164 | % | | | 138 | % | | | 141 | % | | | 353 | %(4) |
The accompanying notes are an integral part of these financial statements.
HENNESSY FUNDS 1-800-966-4354
Notes to the Financial Statements
April 30, 2014 (Unaudited)
1). ORGANIZATION
The Hennessy Technology Fund (the “Fund”) is a series of Hennessy Funds Trust (the “Trust”), which was organized as a Delaware statutory trust on September 17, 1992. The Fund is an open-end management investment company registered under the Investment Company Act of 1940, as amended. The Fund is a successor to the FBR Technology Fund (the “Predecessor FBR Fund”), a series of The FBR Funds, a Delaware statutory trust, pursuant to a reorganization that took place after the close of business on October 26, 2012. Prior to October 26, 2012, the Fund had no investment operations. As a result of the reorganization, holders of the Investor Class shares of the Predecessor FBR Fund received Investor Class shares of the Fund (the Investor Class shares of the Fund are the successor to the accounting and performance information of the Predecessor FBR Fund), and holders of the Institutional Class shares of the Predecessor FBR Fund received Institutional Class shares of the Fund (the Institutional Class shares of the Fund are the successor to the accounting and performance information of the Predecessor FBR Fund). The investment objective of the Fund is capital appreciation. The Fund is a non-diversified fund.
The Fund offers Investor Class and Institutional Class shares. Each class of shares differs principally in its respective administration, 12b-1 distribution and service fees, shareholder servicing, and transfer agent expenses and sales charges, if any. Each class has identical rights to earnings, assets, and voting privileges, except for class-specific expenses and exclusive rights to vote on matters affecting only individual classes.
2). SIGNIFICANT ACCOUNTING POLICIES
The following is a summary of significant accounting policies consistently followed by the Fund in the preparation of the financial statements. These policies are in conformity with U.S. generally accepted accounting principles (“GAAP”).
| a). | Investment Valuation – All investments in securities are recorded at their estimated fair value, as described in Note 3. |
| b). | Federal Income Taxes – Provision for Federal income taxes or excise taxes has not been made since the Fund has elected to be taxed as a “regulated investment company” and intends to distribute substantially all of its taxable income to its shareholders and otherwise comply with the provisions of the Internal Revenue Code of 1986, as amended, applicable to regulated investment companies. Net investment income or loss and realized gains and losses for federal income tax purposes may differ from that reported on the financial statements because of temporary book and tax basis differences. Temporary differences are primarily the result of the treatment of wash sales for tax reporting purposes. Distributions from net realized gains for book purposes may include short-term capital gains, which are included as ordinary income to shareholders for tax purposes. |
| c). | Income and Expenses – Dividend income is recognized on the ex-dividend date or as soon as information is available to the Fund. Interest income, which includes the amortization of premium and accretion of discount, is recognized on an accrual basis. The Fund is charged for those expenses that are directly attributable to the portfolio, such as advisory, administration, and certain shareholder service fees. Income, |
| | expenses (other than expenses attributable to a specific class), and realized and unrealized gains or losses on investments are allocated to each class of shares based on its respective net assets. |
| d). | Distributions to Shareholders – Dividends from net investment income for the Fund, if any, are declared and paid out annually, usually in November or December. Distributions of net realized capital gains, if any, are declared and paid annually, usually in November or December. |
| e). | Security Transactions – Investment and shareholder transactions are recorded on the trade date. The Fund determines the gain or loss realized from the investment transactions by comparing the original cost of the security lot sold with the net sale proceeds. Discounts and premiums on securities purchased are accreted/amortized over the life of the respective security. |
| f). | Use of Estimates – The preparation of financial statements in conformity with GAAP requires management to make estimates and assumptions that affect the reported amounts of assets and liabilities and disclosure of contingent assets and liabilities at the date of the financial statements and the reported change in net assets during the reporting period. Actual results could differ from those estimates. |
| g). | Share Valuation – The net asset value (“NAV”) per share of the Fund is calculated by dividing the sum of the value of the securities held by the Fund, plus cash or other assets, minus all liabilities (including estimated accrued expenses) by the total number of shares outstanding for the Fund, rounded to the nearest cent. The Fund’s shares will not be priced on days the New York Stock Exchange is closed for trading. The offering and redemption price per share for the Fund is equal to the Fund’s net asset value per share. |
| h). | Foreign Currency – Values of investments denominated in foreign currencies are converted into U.S. dollars using the spot market rate of exchange at the time of valuation. Purchases and sales of investments and income are translated into U.S. dollars using the spot market rate of exchange prevailing on the respective dates of such transactions. The Fund does not isolate the portion of the results of operations resulting from fluctuations in foreign exchange rates on investments from fluctuations resulting from changes in the market prices of securities held. Such fluctuations are included with the net realized and unrealized gain or loss on investments. Foreign investments present additional risks due to currency fluctuations, economic and political factors, lower liquidity, government regulations, differences in accounting standards, and other factors. |
| i). | Forward Contracts – The Fund may enter into forward currency contracts to reduce its exposure to changes in foreign currency exchange rates on its foreign holdings and to lock in the U.S. dollar cost of firm purchase and sale commitments for securities denominated in foreign currencies. A forward currency contract is a commitment to purchase or sell a foreign currency at a future date at a negotiated forward rate. The gain or loss arising from the difference between the U.S. dollar cost of the original contract and the value of the foreign currency in U.S. dollars upon closing of such contract is included in net realized gain or loss from foreign currency transactions. During the six months ended April 30, 2014, the Fund did not enter into any forward contracts. |
| j). | Repurchase Agreements – The Fund may enter into repurchase agreements with member banks or security dealers of the Federal Reserve Board whom the investment advisor deems creditworthy. The repurchase price generally equals the price paid by the Fund plus interest negotiated on the basis of current short-term rates. |
HENNESSY FUNDS 1-800-966-4354
| | Securities pledged as collateral for repurchase agreements are held by the custodian bank until the respective agreements mature. Provisions of the repurchase agreements ensure that the market value of the collateral, including accrued interest thereon, is sufficient in the event of default of the counterparty. If the counterparty defaults and the value of the collateral declines or if the counterparty enters an insolvency proceeding, realization of the collateral by the Fund may be delayed or limited. |
| k). | Accounting for Uncertainty in Income Taxes – The Fund has adopted accounting policies regarding recognition and measurement of tax positions taken or expected to be taken on a tax return. The Fund has reviewed all open tax years in major jurisdictions and concluded that there is no impact on the Fund’s net assets and no tax liability resulting from unrecognized tax benefits relating to uncertain income tax positions taken or expected to be taken on a tax return. The Fund’s major tax jurisdictions are U.S. Federal and Delaware. As of April 30, 2014, open Federal and state tax years for the Fund include the tax years ended October 31, 2011 through 2013. |
| l). | Derivatives – The Fund may invest in, or enter into, derivatives, such as options, futures contracts, options on futures contracts, and swaps, for a variety of reasons, including to hedge certain risks, to provide a substitute for purchasing or selling particular securities, or to increase potential income gain. Derivatives may provide a cheaper, quicker, or more specifically focused way for a Fund to invest than “traditional” securities would. The main purpose of utilizing these derivative instruments is for hedging purposes. |
| | The Fund has adopted the financial accounting reporting rules as required by the Derivatives and Hedging Topic of the Financial Accounting Standards Board Accounting Standards Codification. Under such rules, the Fund is required to include enhanced disclosure that enables investors to understand how and why an entity uses derivatives, how derivatives are accounted for, and how derivatives instruments affect an entity’s results of operations and financial position. During the six months ended April 30, 2014, the Fund did not hold any derivative instruments. |
| m). | Events Subsequent to the Fiscal Period End – The Fund has adopted financial reporting rules regarding subsequent events that require an entity to recognize in the financial statements the effects of all subsequent events that provide additional evidence about conditions that existed at the date of the balance sheet. Management has evaluated the Fund’s related events and transactions that occurred subsequent to April 30, 2014 through the date of issuance of the Fund’s financial statements. There were no events or transactions that occurred during this period that materially impacted the amounts or disclosures in the Fund’s financial statements. |
3). SECURITIES VALUATION
The Fund has adopted authoritative fair valuation accounting standards that establish an authoritative definition of fair value and set out a hierarchy for measuring fair value. These standards require additional disclosures about the various inputs and valuation techniques used to develop the measurements of fair value and a discussion in changes in valuation techniques and related inputs during the period. These inputs are summarized in the three broad levels listed below:
| | Level 1 – | Quoted unadjusted prices for identical instruments in active markets to which the Fund has access at the date of measurement. |
| | Level 2 – | Quoted prices for similar instruments in active markets; quoted prices for identical or similar instruments in markets that are not active; and model-derived valuations in which all significant inputs and significant value drivers are observable in active markets. Level 2 inputs are those in markets for which there are few transactions, the prices are not current, the prices are fair value adjusted due to post-market close subsequent events (foreign markets), little public information exists, or instances where prices vary substantially over time or among brokered market makers. These inputs may also include interest rates, prepayment speeds, credit risk curves, default rates, and similar data. |
| | Level 3 – | Model-derived valuations in which one or more significant inputs or significant value drivers are unobservable. Unobservable inputs are those inputs that reflect the Fund’s own assumptions about what market participants would use to price the asset or liability based on the best available information. |
Following is a description of the valuation techniques applied to the Fund’s major categories of assets and liabilities measured at fair value on a recurring basis.
Equity Securities – Equity securities, including common stocks, preferred stocks, foreign issued common stocks, exchange traded funds, closed-end mutual funds, and real estate investment trusts, that are traded on a securities exchange for which a last-quoted sales price is readily available will be valued at the last sales price as reported by the primary exchange on which the securities are listed. Securities listed on The NASDAQ Stock Market (“NASDAQ”) will be valued at the NASDAQ Official Closing Price, which may differ from the last sales price reported. Securities traded on a securities exchange for which a last-quoted sales price is not readily available will be valued at the mean between the bid and ask prices. To the extent these securities are actively traded and valuation adjustments are not applied, they are classified in Level 1 of the fair value hierarchy.
Investment Companies – Investments in investment companies (e.g., mutual funds and exchange traded funds) are generally priced at the ending NAV provided by the Fund’s service agent and will be classified in Level 1 of the fair value hierarchy.
Debt Securities – Debt securities, including corporate bonds, asset-backed securities, mortgage-backed securities, municipal bonds, U.S. Treasuries, and U.S. government agency issues, are valued at market on the basis of valuations furnished by an independent pricing service that utilizes both dealer-supplied valuations and formula-based techniques. The pricing service may consider recently executed transactions in securities of the issuer or comparable issuers, market price quotations (where observable), bond spreads, and fundamental data relating to the issuer. In addition, the model may incorporate market observable data such as reported sales of similar securities, broker quotes, yields, bids, offers, and reference data. Certain securities are valued principally using dealer quotations. These securities are generally classified in Level 2 of the fair value hierarchy.
Short-Term Securities – Short-term equity investments, including money market funds, are valued in the manner specified above. Short-term debt investments are valued at amortized cost, if their original maturity was 60 days or less, or by amortizing the values as of the 61st day prior to maturity, if their original term to maturity exceeded 60 days. Short-term securities are generally classified in Level 1 or Level 2 of the fair market hierarchy depending on the inputs used and market activity levels for specific securities.
The Board of Trustees of the Fund (the “Board”) has adopted fair value pricing procedures that are followed when a price for a security is not readily available or if a
HENNESSY FUNDS 1-800-966-4354
significant event has occurred that indicates the closing price of a security no longer represents the true value of that security. Fair value pricing determinations are made in good faith in accordance with these procedures. There are numerous criteria that will be given consideration in determining a fair value of a security. Some of these criteria are trading volume of security and markets, the value of other like securities, and news events with direct bearing to security or market. Fair value pricing results in an estimated price that reasonably reflects the current market conditions in order to rate the portfolio holdings such that shareholder transactions receive a fair net asset value. Depending on the relative significance of the valuation inputs, these securities may be classified in either Level 2 or Level 3 of the fair value hierarchy.
Fair valuing of foreign securities may be determined with the assistance of a pricing service using correlations between the movement of prices of such securities and indices of domestic securities and other appropriate indicators, such as closing market prices of relevant American Depositary Receipts or futures contracts. The effect of using fair value pricing is that the Fund’s NAV will reflect the affected portfolio securities’ value as determined in the judgment of the Board or its designee instead of being determined by the market. Using a fair value pricing methodology to price foreign securities may result in a value that is different from a foreign security’s most recent closing price and from the prices used by other investment companies to calculate their net asset values and are generally considered Level 2 prices in the fair valuation hierarchy. Because the Fund may invest in foreign securities, the value of the Fund’s portfolio securities may change on days when you will not be able to purchase or redeem your shares.
The Board has delegated day-to-day valuation matters to a Valuation Committee comprised of one or more representatives from Hennessy Advisors, Inc., the Fund’s investment advisor. The function of the Valuation Committee is to value securities where current and reliable market quotations are not readily available. All actions taken by the Valuation Committee are reviewed by the Board.
The Fund has performed an analysis of all existing investments to determine the significance and character of all inputs to their fair value determination. Various inputs are used in determining the value of the Fund’s investments. The inputs or methodology used for valuing securities are not necessarily an indication of the risk associated with investing in those securities. Details related to the fair valuation hierarchy of the Fund’s securities as of April 30, 2014 are included in the Fund’s Schedule of Investments.
4). INVESTMENT TRANSACTIONS
Purchases and sales of investment securities (excluding government and short-term investments) for the Fund during the six months ended April 30, 2014 were $6,602,649 and $6,031,541, respectively.
There were no purchases or sales/maturities of long-term U.S. Government Securities for the Fund for the six months ended April 30, 2014.
5). INVESTMENT MANAGEMENT FEE AND OTHER TRANSACTIONS WITH AFFILIATES
Hennessy Advisors, Inc. (the “Advisor”) is the investment advisor of the Fund. The Advisor provides the Fund with investment management services under an Investment Advisory Agreement. The Advisor furnishes all investment advice, office space, facilities, and provides most of the personnel needed by the Fund. As compensation for its services, the Advisor is entitled to a monthly fee from the Fund. The fee is based upon the average daily net assets of the Fund at the annual rate of 0.90%.
The Advisor has contractually agreed to limit the total annual operating expenses of the Fund (excluding interest, taxes, brokerage commissions, dividend expenses, acquired fund fees and expenses, extraordinary legal expenses, or any other extraordinary expenses and, from and after November 1, 2014, 12b-1 fees) to 1.95% and 1.70% of the Fund’s net assets for the Investor Class shares and Institutional Class shares of the Fund, respectively, through February 28, 2015. The net expense reimbursement for the Fund as of April 30, 2014 was $485.
For a period of three years after the year in which the Advisor waives or reimburses expenses, the Advisor may seek reimbursement from the Fund to the extent that total annual fund operating expenses are less than the expense limitation in effect at the time of the reimbursement. The Advisor waived or reimbursed expenses of $32,139 for the Fund during the six-month period ended April 30, 2014. As of April 30, 2014, cumulative expenses subject to potential recovery to the aforementioned conditions and year of expiration are as follows:
| | | | October 31, 2015 | | | October 31, 2016 | | | October 31, 2017 | | | Total | |
| | Investor Class | | $ | 619 | | | $ | 48,568 | | | $ | 25,872 | | | $ | 75,059 | |
| | Institutional Class | | $ | 151 | | | $ | 10,931 | | | $ | 6,267 | | | $ | 17,349 | |
The Fund has adopted a plan pursuant to Rule 12b-1 under the Investment Company Act of 1940, as amended, that authorizes payments in connection with the distribution of the Fund’s shares at an annual rate of up to 0.25% of the Fund’s average daily net assets attributable to Investor Class shares. Amounts paid under the plan may be spent on any activities or expenses primarily intended to result in the sale of shares, including but not limited to, advertising, compensation for sales and marketing activities or financial institutions and others such as dealers and distributors, shareholder account servicing, the printing and mailing of prospectuses to other than current shareowners, and the printing and mailing of sales literature.
The Fund has entered into agreements with various brokers, dealers, and financial intermediaries in connection with the sale of shares of the Fund. The agreements provide for periodic payments by the Fund to the brokers, dealers, and financial intermediaries for providing certain shareholder maintenance services (sub-transfer agent expenses). These shareholder services include the pre-processing and quality control of new accounts, shareholder correspondence, answering customer inquiries regarding account status, and facilitating shareholder telephone transactions. Fees paid by the Fund to various brokers, dealers, and financial intermediaries for the six months ended April 30, 2014 were $2,621.
U.S. Bancorp Fund Services, LLC (“USBFS”) provides the Fund with administrative, fund accounting, and transfer agent services, including all regulatory reporting, and necessary office equipment and personnel. As administrator, USBFS prepares various federal and state regulatory filings, reports, and returns for the Fund; prepares reports and materials to be supplied to the Board; monitors the activities of the Fund’s custodian, transfer agent, and accountants; and coordinates the preparation and payment of the Fund’s expenses and reviews the Fund’s expense accruals. Fees paid to USBFS for the six months ended April 30, 2014 were $3,664.
U.S. Bank, N.A., an affiliate of USBFS, serves as the Fund’s custodian. Quasar Distributors, LLC acts as the Fund’s principal underwriter in a continuous public offering of the Fund’s shares. Quasar Distributors, LLC is an affiliate of USBFS and U.S. Bank, N.A.
6). LINE OF CREDIT
The Fund has a line of credit with the other funds in the Hennessy Funds family of funds (the “Hennessy Funds”) in the amount of the lesser of (i) $100,000,000 or (ii) 33.33% of
HENNESSY FUNDS 1-800-966-4354
each Hennessy Fund’s net assets, or 30% for the Hennessy Gas Utility Index Fund and 10% for the Hennessy Balanced Fund, intended to provide short-term financing, if necessary, subject to certain restrictions, in connection with shareholder redemptions. The credit facility is with the Hennessy Funds’ custodian bank, U.S. Bank, N.A. Borrowings under this arrangement bear interest at the bank’s prime rate. During the six months ended April 30, 2014, the Fund did not have any borrowings outstanding under the line of credit.
7). FEDERAL TAX INFORMATION
As of October 31, 2013, the Fund’s most recent fiscal year end, the components of accumulated earnings (losses) for income tax purposes for the Fund were as follows:
| | Cost of investments for tax purposes | | $ | 4,760,318 | |
| | Gross tax unrealized appreciation | | $ | 964,717 | |
| | Gross tax unrealized depreciation | | | (83,425 | ) |
| | Net tax unrealized appreciation/depreciation | | $ | 881,292 | |
| | Undistributed ordinary income | | $ | — | |
| | Undistributed long-term capital gains | | | — | |
| | Total distributable earnings | | $ | — | |
| | Other accumulated gain (loss) | | $ | (1,823,060 | ) |
| | Total accumulated gain (loss) | | $ | (941,768 | ) |
The difference between book-basis and tax-basis unrealized appreciation is attributable primarily to capital loss carry overs, wash sales, and partnership adjustments.
At October 31, 2013, the Fund’s most recent fiscal year end, the Fund had capital loss carryforwards that expire as follows:
During the year ended October 31, 2013, the Fund’s most recent fiscal year end, the capital loss carry forwards utilized for the Fund were $448,592.
Capital losses sustained in the year ended October 31, 2012 and in future taxable years will not expire and may be carried over by the Fund without limitation; however, they will retain the character of the original loss. Furthermore, any losses incurred during those taxable years will be required to be utilized prior to the losses incurred in the pre-enactment taxable years. As a result of this ordering rule, pre-enactment capital loss carryforwards may be more likely to expire unused. Under pre-enactment law, capital losses could be carried forward for eight years, and carried forward as short-term capital losses, irrespective of the character of the original loss.
At October 31, 2013, the Fund deferred, on a tax basis, a post-December late year ordinary loss deferral of $(65,889) and did not defer, on a tax basis, any post-December loss deferrals.
The Fund did not pay any distributions during fiscal year 2014 (year-to-date) or fiscal year 2013.
Expense Example (Unaudited)
April 30, 2014
As a shareholder of the Fund, you incur two types of costs: (1) transaction costs, including sales charges (loads) on purchase payments, reinvested dividends, or other distributions; redemption fees; and exchange fees; and (2) ongoing costs, including management fees; service fees; and other Fund expenses. This Example is intended to help you understand your ongoing costs (in dollars) of investing in the Fund and to compare these costs with the ongoing costs of investing in other mutual funds. The Example is based on an investment of $1,000 invested at the beginning of the period and held for the entire period from November 1, 2013 through April 30, 2014.
Actual Expenses
The first line of the table below under the “Investor Class” and “Institutional Class” headings provides information about actual account values and actual expenses. Although the Fund charges no sales loads or transaction fees, you will be assessed fees for outgoing wire transfers, returned checks and stop payment orders at prevailing rates charged by U.S. Bancorp Fund Services, LLC, the Fund’s transfer agent. If you request that a redemption be made by wire transfer, currently a $15.00 fee is charged by the Fund’s transfer agent. IRA accounts will be charged a $15.00 annual maintenance fee. The example below includes, but is not limited to, management fees, shareholder servicing fees, fund accounting, custody, and transfer agent fees. However, the example below does not include portfolio trading commissions and related expenses, and other extraordinary expenses as determined under generally accepted accounting principles. You may use the information in this line, together with the amount you invested, to estimate the expenses that you paid over the period. Simply divide your account value by $1,000 (for example, an $8,600 account value divided by $1,000 = 8.6), then multiply the result by the number in the first line of the table under the “Investor Class” and “Institutional Class” headings in the column entitled “Expenses Paid During Period” to estimate the expenses you paid on your account during this period.
Hypothetical Example for Comparison Purposes
The second line of the table below under the “Investor Class” and “Institutional Class” headings provides information about hypothetical account values and hypothetical expenses based on the Fund’s actual expense ratios and an assumed rate of return of 5% per year before expenses, which is not the Fund’s actual return. The hypothetical account values and expenses may not be used to estimate the actual ending account balance or expenses you paid for the period. You may use this information to compare the ongoing costs of investing in the Fund and other funds. To do so, compare this 5% hypothetical example with the 5% hypothetical examples that appear in the shareholder reports of the other funds. Please note that the expenses shown in the table are meant to highlight your ongoing costs only and do not reflect any transactional costs, such as sales charges (loads), or exchange fees. Therefore, the second line of the table under the “Investor Class” and “Institutional Class” headings is useful in comparing ongoing costs only, and will not help you determine the relative total costs of owning different funds. In addition, if these transactional costs were included, your costs would have been higher.
HENNESSY FUNDS 1-800-966-4354
| | | | Expenses Paid |
| | Beginning | Ending | During Period(1) |
| | Account Value | Account Value | November 1, 2013 – |
| | November 1, 2013 | April 30, 2014 | April 30, 2014 |
| Investor Class | | | |
| | | | |
| Actual | $1,000.00 | $ 991.90 | $9.63 |
| | | | |
| Hypothetical (5% return | | | |
| before expenses) | $1,000.00 | $1,015.12 | $9.74 |
| | | | |
| Institutional Class | | | |
| | | | |
| Actual | $1,000.00 | $ 993.40 | $8.40 |
| | | | |
| Hypothetical (5% return | | | |
| before expenses) | $1,000.00 | $1,016.36 | $8.50 |
| (1) | Expenses are equal to the Fund’s annualized expense ratio of 1.95% for Investor Class shares or 1.70% for Institutional Class shares, as applicable, multiplied by the average account value over the period, multiplied by 181/365 days (to reflect one-half year period). |
Proxy Voting
A description of the policies and procedures the Fund uses to determine how to vote proxies relating to portfolio securities is available without charge: (1) by calling 1-800-966-4354; (2) on the Hennessy Funds’ website at hennessyfunds.com; or (3) on the U.S. Securities and Exchange Commission’s (the “SEC”) website at www.sec.gov. The Fund’s proxy voting record is available on both the Hennessy Funds’ website at hennessyfunds.com and the SEC’s website at www.sec.gov no later than August 31 for the prior 12 months ending June 30.
Quarterly Filings on Form N-Q
The Fund files its complete schedule of portfolio holdings with the SEC for the first and third quarters of each fiscal year on Form N-Q. The Fund’s Forms N-Q are available on the SEC’s website at www.sec.gov. The Fund’s Forms N-Q may be reviewed and copied at the SEC’s Public Reference Room in Washington, DC and information on the operation of the Public Reference Room may be obtained by calling 1-800-SEC-0330. Information included in the Fund’s Forms N-Q will also be available upon request by calling 1-800-966-4354.
Householding
To help keep the Fund’s costs as low as possible, we generally deliver a single copy of most financial reports and prospectuses to shareholders who share an address, even if the accounts are registered under different names. This process, known as “householding,” does not apply to account statements. You may, of course, request an individual copy of a prospectus or financial report at any time. If you would like to receive separate mailings, please call the Administrator at 1-800-261-6950 or 1-414-765-4124 and we will begin individual delivery within 30 days of your request. If your account is held through a financial institution or other intermediary, please contact them directly to request individual delivery.
HENNESSY FUNDS 1-800-966-4354
Board Approval of Investment Advisory
Agreement
At its meeting on March 3, 2014, the Board of Trustees of the Fund (the “Board”) unanimously approved the continuation of the investment advisory agreement of the Fund.
The Board reviewed a number of documents, including a memorandum provided by outside legal counsel that described the fiduciary duties of the Board with respect to approving the continuance of the investment advisory agreement and the relevant factors for consideration, a memorandum from the Advisor that listed each of the relevant factors and the documents provided to help the Board assess each such factor, the Advisor’s most recent Form 10-K and 10-Q, the Advisor’s Form ADV Part I, a document that listed the range of services provided by the Advisor for the Fund, a written discussion of economies of scale, a copy of the advisory agreement, a fund fact sheet, and peer expense and performance comparisons. The Board considered and discussed numerous factors, including the following:
| | • | The Board considered the services identified below that are provided by the Advisor: |
| | | • | The Advisor acts as portfolio manager for the Fund. In this capacity, the Advisor manages the composition of the portfolio of the Fund, including the purchase, retention, and disposition of portfolio securities in accordance with the Fund’s investment objectives, policies, and restrictions. |
| | | • | The Advisor performs daily reconciliations of portfolio positions and cash for the Fund. |
| | | • | The Advisor manages the use of soft dollars for the Fund. |
| | | • | The Advisor monitors compliance by the Fund with its investment objectives and restrictions. |
| | | • | The Advisor monitors compliance with federal securities laws and performs activities such as maintaining a compliance program, conducting ongoing reviews of the compliance programs of the Fund’s service providers, conducting on-site visits to the Fund’s service providers, monitoring incidents of abusive trading practices, reviewing Fund expense accruals, payments, and fixed expense ratios, evaluating insurance providers for fidelity bond coverage and D&O/E&O insurance coverage, conducting employee compliance training, reviewing reports provided by service providers, maintaining books and records, and preparing an annual compliance report to the Board. |
| | | • | The Advisor oversees service providers that support the Fund in providing fund accounting, fund administration, fund distribution, transfer agency, custodial, sales and marketing, audit, information technology, and legal services. |
| | | • | The Advisor maintains an in-house public relations and marketing department on behalf of the Fund. |
| | | • | The Advisor is actively involved with preparing regulatory filings for the Fund. |
| | | • | The Advisor manages proxy voting for the Fund. |
| | | • | The Advisor oversees distribution of the Fund through third-party broker/dealers and independent financial institutions such as Charles Schwab, Inc., Fidelity, TD Waterhouse, and Pershing. The Advisor participates in “no transaction fee” (“NTF”) programs with these companies on behalf of the Fund, |
| | | | which allows customers to purchase the Fund through third-party distribution channels without paying a transaction fee. The Advisor compensates a number of these third-party providers of NTF programs out of its own revenues and not those of the Fund. |
| | | • | The Advisor pays the incentive compensation of all of the Fund’s compliance officers and employs other staff such as management executives, legal personnel, marketing personnel, national accounts and distribution personnel, sales personnel, and trading oversight personnel. |
| | | • | The Advisor prepares or reviews Board materials, frequently presents to the Board or leads Board discussions, prepares or reviews meeting minutes, and arranges for Board training and education. |
| | • | The Board compared the performance of the Fund to benchmark indices over various periods of time and concluded that the positive performance of the Fund warranted the continuation of the advisory agreement. |
| | • | The Board reviewed the Fund’s expense ratio and comparable expense ratios for funds comparable to the Fund. The Board used data from Morningstar showing funds similar in asset size and investment objective to the Fund and determined that the expense ratio of the Fund falls within the range of the ratios of other comparable funds and concluded that the expenses of the Fund were reasonable. |
| | • | The Board considered the fees charged by the Advisor to those of funds similar in asset size and investment objective to the Fund and concluded the advisory fee of the Fund was reasonable and warranted continuation of the advisory agreement. The Trustees noted that the investment advisory fees are not adjusted if economies of scale are realized as the Fund grows because many of the expenses incurred by the Advisor to manage the Fund are asset-based fees and thus do not result in material economies of scale being realized as the net assets of the Fund increase. |
| | • | The Board considered the profitability of the Advisor with respect to the Fund and concluded the profits were reasonable and not excessive when compared to profitability guidelines set forth in relevant court cases. |
| | • | The Board considered the high level of professionalism and knowledge of the Advisor’s employees, along with an extremely low level of turnover of the employees of the Advisor, and concluded that this was beneficial to the Fund and its shareholders, as it ensures that the Fund is operated efficiently. |
All of the factors above were considered separately by the Board, including the Trustees who are not “interested persons” (as defined in the Investment Company Act of 1940, as amended) of the Fund (the “Independent Trustees”) meeting in an executive session. The factors were viewed in their totality by the Board, with no single factor being the principal or determinative factor in the Board’s determination of whether to approve the continuation of the advisory agreement. Based on the factors discussed above, the Board, including all of the Independent Trustees, recommended continuation of the advisory agreement.
HENNESSY FUNDS 1-800-966-4354
For information, questions or assistance, please call
The Hennessy Funds
1-800-966-4354 or 1-415-899-1555
INVESTMENT ADVISOR
Hennessy Advisors, Inc.
7250 Redwood Blvd., Suite 200
Novato, California 94945
ADMINISTRATOR,
TRANSFER AGENT,
DIVIDEND PAYING AGENT &
SHAREHOLDER SERVICING AGENT
U.S. Bancorp Fund Services, LLC
P.O. Box 701
Milwaukee, Wisconsin 53201-0701
CUSTODIAN
U.S. Bank N.A.
Custody Operations
1555 North River Center Dr., Suite 302
Milwaukee, Wisconsin 53212
TRUSTEES
Neil J. Hennessy
Robert T. Doyle
J. Dennis DeSousa
Gerald P. Richardson
COUNSEL
Foley & Lardner LLP
777 East Wisconsin Avenue
Milwaukee, Wisconsin 53202-5306
INDEPENDENT REGISTERED
PUBLIC ACCOUNTING FIRM
Tait, Weller & Baker LLP
1818 Market Street, Suite 2400
Philadelphia, Pennsylvania 19103
DISTRIBUTOR
Quasar Distributors, LLC
615 East Michigan Street
Milwaukee, Wisconsin 53202
hennessyfunds.com | 1-800-966-4354
This report has been prepared for shareholders and may be distributed to
others only if preceded or accompanied by a current prospectus.
SEMI-ANNUAL REPORT
APRIL 30, 2014
HENNESSY JAPAN FUND
Investor Class HJPNX
Institutional Class HJPIX
hennessyfunds.com | 1-800-966-4354
(This Page Intentionally Left Blank.)
Contents
| Letter to Shareholders | 2 |
| Performance Overview | 4 |
| Financial Statements | |
| Schedule of Investments | 6 |
| Statement of Assets and Liabilities | 10 |
| Statement of Operations | 11 |
| Statements of Changes in Net Assets | 13 |
| Financial Highlights | 14 |
| Notes to the Financial Statements | 18 |
| Expense Example | 25 |
| Proxy Voting | 27 |
| Quarterly Filings on Form N-Q | 27 |
| Householding | 27 |
| Board Approval of Investment Advisory Agreements | 28 |
HENNESSY FUNDS 1-800-966-4354
June 2014
Dear Shareholder:
As we review the first half of the year, we continue to see the same trends as in the recent past, with corporations in both Japan and the U.S. driving shareholder value by making acquisitions, initiating and raising dividends, investing in internal infrastructure, and buying back stock. In fact, the total amount of dividends paid by Japanese companies reached a historic high over the twelve months ended March 31, 2013. I believe we will likely see continued dividend increases from cash-rich companies, and we may also begin to see these firms initiate capital expenditure programs.
Up until this point, there has been no real cost for firms to defer spending, but I do believe there will now be companies that want to improve their margins and will begin spending money to expand their revenue, and may even begin to hire. Once a competitor begins to move in this way, then the cost to defer becomes real for companies. This movement to expansion may well be a catalyst to propel the financial markets. With almost $3 trillion in cash sitting on the sidelines in the U.S. alone, it should help the economic recovery here in the U.S. for companies to begin spending their idle capital, which will likely have ripple effects to the Japan market and beyond.
The Japan financial markets were volatile over the past six months ended April 30, 2014, with the Tokyo Price Index, or TOPIX, falling -5.41% (in U.S. Dollar terms) during the period. While the Japanese market started the period on a positive note as a result of constructive economic developments in Japan and overseas, the market recorded negative returns for the overall six-month period ended April 30, 2014. This was due in large part to profit taking by investors following the surging Japanese market in 2013, and also due to concerns over the economies of developing countries and the instability of their currencies, the appreciation of the yen, growing tensions in Ukraine, and the volatile global economy.
On April 1, Japan’s long-anticipated consumption tax increase took effect, raising the tax by three percent to eight percent. Initial reports suggest that the impact from the rise in taxes has been muted, which has put investors’ minds at ease. Longer term economic indicators suggest that the benefits of Prime Minister Abe’s aggressive monetary and fiscal policies, referred to as “Abenomics,” are spreading and gaining traction. While many investors may now have concerns about the third arrow of Abenomics, which is the growth strategy, I believe that cyclical recovery will continue in Japan for the next few years with or without the growth strategy. Corporate balance sheets were strengthened significantly over recent years, which allowed Japanese companies to stay competitive at much higher currency rates, and I believe Japanese corporations will likely maintain their growth momentum irrespective of any future movement of the yen. With favorable top line and bottom line results, I expect many companies to further grow their cash flow, which can stimulate future capital expenditures and which is sorely needed following two decades of underinvestment. The trickle-down effect should benefit many domestic Japanese industries and has the potential to create a positive economic cycle for years to come.
I believe that Japanese investors, including pensions and individuals, will finally start investing in the domestic equity market, which should support the normalization of the valuation of the Japanese equity market and undervalued names. The Japanese private sector is holding historically high financial assets, with cash and cash deposits held by corporations and individuals at $2.1 trillion and $8.7 trillion, respectively. This money on
the sidelines represents approximately two times the size of Japan’s total equity market cap. This liquidity has never been invested, which was a smart decision made by investors in the deflationary environment of the past.
The Japanese government is creating a private pension plan modeled on the Individual Retirement Account, or IRA, in the U.S. IRAs were introduced in the U.S. in 1974 to encourage individuals to invest by introducing tax breaks. Assets in U.S. IRA accounts grew 80-fold over 20 years, from $6.8 billion in 1980 to $5.4 trillion in 2010. In 1980, bank deposits accounted for 82% of U.S. IRA assets, and today they account for just 10%. In 1980, mutual funds accounted for just 3% of U.S. IRA assets, and today they account for 46%. With this new government program, I strongly believe that a large structural shift from bank deposits into equities is likely to occur in Japan, much like it did in the U.S. This in turn should help to drive the growth of the Japanese equity markets.
I am confident that even with all the hurdles facing corporations both in the U.S. and Japan, companies will continue to provide value for their shareholders. To me, that means the financial markets are in good shape and should remain strong moving forward. I also believe that the next few months may be volatile for the worldwide economy and the financial markets. After over 35 years in the business, I still firmly believe the best way to position your portfolio is by investing in good companies over the long term, rather than trying to buy the next hot idea at exactly the right time. At Hennessy Funds, hunches and fads have no place in our investment process, and we understand that successful investing comes from time in the market, not timing the market.
We remain focused on investing based on proven fundamentals, and we are committed to managing money for the sole benefit of our shareholders. If you have any questions or want to speak with us directly, please don’t hesitate to call us at (800) 966-4354.
Best regards,
Neil J. Hennessy
President and Chief Investment Officer
Past performance does not guarantee future results.
Mutual fund investing involves risk. Principal loss is possible.
Opinions expressed are those of Neil Hennessy and are subject to change, are not guaranteed and should not be considered investment advice.
The Tokyo Price Index (TOPIX) is a market capitalization-weighted index of all companies listed on the First Section of the Tokyo Stock Exchange. One cannot invest directly in an index.
Cash flow can be used as an indication of a company’s financial strength and represents earnings before depreciation, amortization, and non-cash charges.
HENNESSY FUNDS 1-800-966-4354
Performance Overview (Unaudited)
The opinions expressed in the following commentary reflect those of the Portfolio Managers as of the date written. Any such opinions are subject to change based on market or other conditions and are not guaranteed. These opinions may not be relied upon as investment advice. Investment decisions for the Fund are based on several factors, and may not be relied upon as an indication of trading intent on behalf of the Fund. Security positions can and do change.
AVERAGE ANNUAL TOTAL RETURN PERIODS ENDED APRIL 30, 2014
| | Six | One | Five | Ten |
| | Months(1) | Year | Years | Years |
| Hennessy Japan Fund – | | | | |
| Investor Class (HJPNX) | -1.47% | 5.21% | 15.57% | 4.18% |
| Hennessy Japan Fund – | | | | |
| Institutional Class (HJPIX) | -1.35% | 5.51% | 15.83% | 4.36% |
Russell/Nomura Total MarketTM Index | -5.27% | -2.70% | 8.15% | 2.52% |
| Tokyo Price Index (TOPIX) | -5.41% | -3.08% | 8.27% | 2.35% |
Expense ratios: 1.91% (Investor Class); 1.67% (Institutional Class)
Performance data quoted represents past performance; past performance does not guarantee future results. The investment return and principal value of an investment will fluctuate so that an investor’s shares, when redeemed, may be worth more or less than their original cost. Current performance of the Fund may be lower or higher than the performance quoted. Performance data current to the most recent month end may be obtained by visiting hennessyfunds.com.
The expense ratios presented are from the most recent prospectus.
| (1) | Periods less than one year are not annualized. |
PERFORMANCE NARRATIVE
SPARX ASSET MANAGEMENT CO., LTD, SUB-ADVISOR
Portfolio Managers: Masakazu Takeda, CMA, and Yu Shimizu, CMA, SPARX Asset Management Co., Ltd. (sub-advisor)
Over the previous six months, how did the Fund perform and what factors contributed to this performance?
For the six-month period ended April 30, 2014, the Investor Class of the Hennessy Japan Fund returned -1.47%, significantly outperforming the Russell/Nomura Total Market™ Index, the Tokyo Price Index (TOPIX), and the Morningstar Japan Category Average, which returned -5.27%, -5.41%, and -4.31% for the same period, respectively.
The largest positive contributors to the Fund’s performance among the 33 TOPIX sub-industries were shares of chemical manufacturers, miscellaneous manufacturing firms, and retailers. Conversely, shares of wholesalers, banks, and precision instrument makers performed negatively during the six-month period.
Among the strongest performing stocks in the Fund during the period were Rohto Pharmaceutical Co., Ltd., the leading over-the-counter ophthalmic medicines and skincare cosmetics producer, Nidec Corporation, the world’s major electric motor manufacturer, and Ryohin Keikaku Co., Ltd., the operator of the MUJI brand retail chain store. Shares of both Rohto Pharmaceutical Co., Ltd. and Nidec Corporation jumped over 28% and 24%, respectively, following strong earnings results for the fourth quarter of
calendar year 2013. The market also welcomed Nidec Corporation’s upward revision of its full-year earnings guidance for its fiscal year ended March 31, 2014. Finally, shares of Ryohin Keikaku Co., Ltd. surged 18% due to the solid earnings announcement for its fiscal year ended February 28, 2014, and the upbeat guidance for the new fiscal year. The Fund continues to hold all of these positions.
Conversely, Terumo Medical Corporation, Japan’s largest medical device manufacturer, MISUMI Group, Inc., the maker and distributor of metal mold components and precision machinery parts, and Unicharm Corporation, the baby and feminine care products maker, were among the major detractors from the Fund’s performance. Shares of Terumo Medical Corporation fell 13% following its third quarter earnings announcement for its fiscal year ended March 31, 2014, as investors were disappointed with the decline in sales. Shares of MISUMI Group, Inc. declined 11% on what we believe was the market’s growing concern over its outlook for fiscal year 2014. Lastly, shares of Unicharm Corporation fell 8% as the perception of an intensifying competitive landscape became widely recognized by investors.
Additional Portfolio Manager commentary and related investment outlook:
Going forward, we will continue to increase our exposure to companies with a distinct manufacturing edge, high-quality craftsmanship, energy-efficient technologies, or a superior brand image that may benefit from the growing demand from the economies of developed and emerging countries. We will also continue to favor general trading firms that span those technologies to the emerging nations.
The Russell/Nomura Total Market™ Index contains the top 98% of all stocks listed on Japan’s stock exchange and registered on Japan’s OTC market in terms of market capitalization. The Tokyo Price Index (TOPIX) is a market capitalization-weighted index of all companies listed on the First Section of the Tokyo Stock Exchange. The Russell/Nomura Total Market™ and TOPIX indices are presented in U.S. dollar terms and take into account reinvestment of dividends. You cannot invest directly in an index. Performance data for an index does not reflect any deductions for fees, expenses or taxes. The Fund may invest in small- and medium capitalization companies, which may have limited liquidity and greater price volatility than large-capitalization companies. Investments in foreign securities involve greater volatility and political, economic and currency risk and differences in accounting methods. The Fund may invest in IPOs, which may fluctuate considerably due to the absence of a prior public market and may have a magnified impact on the Fund. References to specific securities should not be considered a recommendation to buy or sell any security. Fund holdings and sector allocations are subject to change. Please refer to the Schedule of Investments included in this report for additional portfolio information.
Each Morningstar category average represents a universe of funds with similar investment objectives. © Morningstar, Inc. All Rights Reserved. The information contained herein: 1) is proprietary to Morningstar; 2) may not be copied or distributed and 3) is not warranted to be accurate, complete or timely. Neither Morningstar nor its content providers are responsible for any damages or losses arising from any use of this information. Past performance does not guarantee future results.
HENNESSY FUNDS 1-800-966-4354
Schedule of Investments
HENNESSY JAPAN FUND
As of April 30, 2014 (Unaudited)
(% of Net Assets)
| | TOP TEN HOLDINGS (EXCLUDING CASH/CASH EQUIVALENTS) | % NET ASSETS |
| | Ryohin Keikaku Co., Ltd. | 6.57% |
| | Kao Corp. | 6.39% |
| | Asics Corp. | 5.93% |
| | Nidec Corp. | 5.79% |
| | Rohto Pharmaceutical Co., Ltd. | 5.77% |
| | Fuji Seal International, Inc. | 5.46% |
| | Unicharm Corp. | 5.44% |
| | Shimano, Inc. | 5.42% |
| | Isuzu Motors, Ltd. | 5.17% |
| | Keyence Corp. | 5.10% |
Note: For presentation purposes, the Fund has grouped some of the industry categories. For purposes of categorizing securities for compliance with Section 8(b)(1) of the Investment Company Act of 1940, the Fund uses more specific industry classifications.
| | COMMON STOCKS – 98.62% | | Number | | | | | | % of | |
| | | | of Shares | | | Value | | | Net Assets | |
| | Consumer Discretionary – 27.95% | | | | | | | | | |
| | Asics Corp. | | | 115,200 | | | $ | 2,242,177 | | | | 5.93 | % |
| | Isuzu Motors, Ltd. | | | 337,000 | | | | 1,957,145 | | | | 5.17 | % |
| | Ryohin Keikaku Co., Ltd. | | | 22,100 | | | | 2,483,674 | | | | 6.57 | % |
| | Shimano, Inc. | | | 20,500 | | | | 2,049,217 | | | | 5.42 | % |
| | Toyota Motor Corp. | | | 34,000 | | | | 1,836,958 | | | | 4.86 | % |
| | | | | | | | | 10,569,171 | | | | 27.95 | % |
| | | | | | | | | | | | | | |
| | Consumer Staples – 15.16% | | | | | | | | | | | | |
| | Kao Corp. | | | 64,200 | | | | 2,416,964 | | | | 6.39 | % |
| | Pigeon Corp. | | | 28,100 | | | | 1,258,067 | | | | 3.33 | % |
| | Unicharm Corp. | | | 37,900 | | | | 2,055,243 | | | | 5.44 | % |
| | | | | | | | | 5,730,274 | | | | 15.16 | % |
| | | | | | | | | | | | | | |
| | Financials – 6.90% | | | | | | | | | | | | |
| | Mizuho Financial Group | | | 503,200 | | | | 985,571 | | | | 2.60 | % |
| | Sumitomo Mitsui Financial Group, Inc. | | | 41,100 | | | | 1,624,696 | | | | 4.30 | % |
| | | | | | | | | 2,610,267 | | | | 6.90 | % |
| | | | | | | | | | | | | | |
| | Health Care – 11.18% | | | | | | | | | | | | |
| | Mani, Inc. | | | 6,900 | | | | 308,664 | | | | 0.81 | % |
| | Rohto Pharmaceutical Co., Ltd. | | | 123,600 | | | | 2,180,492 | | | | 5.77 | % |
| | Terumo Corp. | | | 87,600 | | | | 1,738,477 | | | | 4.60 | % |
| | | | | | | | | 4,227,633 | | | | 11.18 | % |
| | | | | | | | | | | | | | |
| | Industrials – 26.87% | | | | | | | | | | | | |
| | Daikin Industries | | | 17,100 | | | | 989,135 | | | | 2.61 | % |
| | Itochu Corp. | | | 40,500 | | | | 453,997 | | | | 1.20 | % |
| | Komatsu, Ltd. | | | 7,500 | | | | 165,122 | | | | 0.44 | % |
| | Kubota Corp. | | | 36,000 | | | | 463,987 | | | | 1.23 | % |
| | Marubeni Corp. | | | 63,000 | | | | 420,992 | | | | 1.11 | % |
| | Misumi Group, Inc. | | | 72,400 | | | | 1,761,798 | | | | 4.66 | % |
| | Mitsubishi Corp. | | | 105,800 | | | | 1,894,593 | | | | 5.01 | % |
| | Nidec Corp. | | | 38,700 | | | | 2,187,924 | | | | 5.79 | % |
| | Sumitomo Corp. | | | 140,500 | | | | 1,823,758 | | | | 4.82 | % |
| | | | | | | | | 10,161,306 | | | | 26.87 | % |
| | | | | | | | | | | | | | |
| | Information Technology – 5.10% | | | | | | | | | | | | |
| | Keyence Corp. | | | 5,000 | | | | 1,928,808 | | | | 5.10 | % |
The accompanying notes are an integral part of these financial statements.
HENNESSY FUNDS 1-800-966-4354
| | COMMON STOCKS | | Number | | | | | | % of | |
| | | | of Shares | | | Value | | | Net Assets | |
| | Materials – 5.46% | | | | | | | | | |
| | Fuji Seal International, Inc. | | | 63,400 | | | $ | 2,062,784 | | | | 5.46 | % |
| | | | | | | | | | | | | | |
| | Total Common Stocks | | | | | | | | | | | | |
| | (Cost $28,238,389) | | | | | | | 37,290,243 | | | | 98.62 | % |
| | | | | | | | | | | | | | |
| | SHORT-TERM INVESTMENTS – 0.79% | | | | | | | | | | | | |
| | | | | | | | | | | | | | |
| | Money Market Funds – 0.79% | | | | | | | | | | | | |
| | Fidelity Government Portfolio – | | | | | | | | | | | | |
| | Institutional Class, 0.01% (a) | | | 299,418 | | | | 299,418 | | | | 0.79 | % |
| | | | | | | | | | | | | | |
| | Total Money Market Funds | | | | | | | | | | | | |
| | (Cost $299,418) | | | | | | | 299,418 | | | | 0.79 | % |
| | | | | | | | | | | | | | |
| | Total Short-Term Investments | | | | | | | | | | | | |
| | (Cost $299,418) | | | | | | | 299,418 | | | | 0.79 | % |
| | | | | | | | | | | | | | |
| | Total Investments | | | | | | | | | | | | |
| | (Cost $28,537,807) – 99.41% | | | | | | | 37,589,661 | | | | 99.41 | % |
| | Other Assets in Excess | | | | | | | | | | | | |
| | of Liabilities – 0.59% | | | | | | | 222,717 | | | | 0.59 | % |
| | TOTAL NET ASSETS – 100.00% | | | | | | $ | 37,812,378 | | | | 100.00 | % |
Percentages are stated as a percent of net assets.
| (a) | The rate listed is the fund’s 7-day yield as of April 30, 2014. |
The accompanying notes are an integral part of these financial statements.
Summary of Fair Value Exposure at April 30, 2014
The following is a summary of the inputs used to value the Fund’s net assets as of April 30, 2014 (See Note 3 in the accompanying notes to the financial statements):
| Common Stock | | Level 1 | | | Level 2 | | | Level 3 | | | Total | |
| Consumer Discretionary | | $ | — | | | $ | 10,569,171 | | | $ | — | | | $ | 10,569,171 | |
| Consumer Staples | | | — | | | | 5,730,274 | | | | — | | | | 5,730,274 | |
| Financials | | | — | | | | 2,610,267 | | | | — | | | | 2,610,267 | |
| Health Care | | | — | | | | 4,227,633 | | | | — | | | | 4,227,633 | |
| Industrials | | | — | | | | 10,161,306 | | | | — | | | | 10,161,306 | |
| Information Technology | | | — | | | | 1,928,808 | | | | — | | | | 1,928,808 | |
| Materials | | | — | | | | 2,062,784 | | | | — | | | | 2,062,784 | |
| Total Common Stock | | $ | — | | | $ | 37,290,243 | | | $ | — | | | $ | 37,290,243 | |
| Short-Term Investments | | | | | | | | | | | | | | | | |
| Money Market Funds | | $ | 299,418 | | | $ | — | | | $ | — | | | $ | 299,418 | |
| Total Short-Term Investments | | $ | 299,418 | | | $ | — | | | $ | — | | | $ | 299,418 | |
| Total Investments | | $ | 299,418 | | | $ | — | | | $ | — | | | $ | 37,589,661 | |
Transfers between levels are recognized at the end of the reporting period. During the six-month period ended April 30, 2014, the Fund recognized significant transfers between Levels 1 and 2.
Transfers between Level 1 and Level 2 relate to the use of a fair valuation pricing service. On days when the fair valuation pricing service is used, non-U.S. dollar denominated securities move from a Level 1 to a Level 2 classification.
The accompanying notes are an integral part of these financial statements.
HENNESSY FUNDS �� 1-800-966-4354
Financial Statements
Statement of Assets and Liabilities as of April 30, 2014 (Unaudited) |
| ASSETS: | | | |
| Investments in securities, at value (cost $28,537,807) | | $ | 37,589,661 | |
| Dividends and interest receivable | | | 312,342 | |
| Receivable for fund shares sold | | | 14,879 | |
| Prepaid expenses and other assets | | | 21,743 | |
| Total Assets | | | 37,938,625 | |
| | | | | |
| LIABILITIES: | | | | |
| Payable for fund shares redeemed | | | 37,028 | |
| Payable to advisor | | | 37,237 | |
| Payable to administrator | | | 15,875 | |
| Payable to auditor | | | 12,461 | |
| Accrued service fees | | | 2,707 | |
| Accrued interest payable | | | 2,241 | |
| Accrued trustees fees | | | 5,011 | |
| Accrued expenses and other payables | | | 13,687 | |
| Total Liabilities | | | 126,247 | |
| NET ASSETS | | $ | 37,812,378 | |
| | | | | |
| NET ASSETS CONSIST OF: | | | | |
| Capital stock | | $ | 62,237,205 | |
| Accumulated net investment loss | | | (147,266 | ) |
| Accumulated net realized loss on investments | | | (33,328,595 | ) |
| Unrealized net appreciation on investments | | | 9,051,034 | |
| Total Net Assets | | $ | 37,812,378 | |
| | | | | |
| NET ASSETS | | | | |
| Investor Class: | | | | |
| Shares authorized (no par value) | | Unlimited | |
| Net assets applicable to outstanding Investor Class shares | | | 25,539,038 | |
| Shares issued and outstanding | | | 1,316,963 | |
| Net asset value, offering price and redemption price per share | | $ | 19.39 | |
| | | | | |
| Institutional Class: | | | | |
| Shares authorized (no par value) | | Unlimited | |
| Net assets applicable to outstanding Institutional Class shares | | | 12,273,340 | |
| Shares issued and outstanding | | | 622,737 | |
| Net asset value, offering price and redemption price per share | | $ | 19.71 | |
The accompanying notes are an integral part of these financial statements.
Financial Statements
Statement of Operations Six Months Ended April 30, 2014 (Unaudited) |
| INVESTMENT INCOME: | | | |
Dividend income(1) | | $ | 355,463 | |
| Interest income | | | 123 | |
| Total investment income | | | 355,586 | |
| | | | | |
| EXPENSES: | | | | |
| Investment advisory fees | | | 224,059 | |
| Administration, fund accounting, custody and transfer agent fees | | | 44,812 | |
| Sub-transfer agent expenses – Investor Class (See Note 5) | | | 32,102 | |
| Sub-transfer agent expenses – Institutional Class (See Note 5) | | | 3,025 | |
| Federal and state registration fees | | | 17,566 | |
| Service fees – Investor Class (See Note 5) | | | 16,905 | |
| Compliance expense | | | 10,655 | |
| Audit fees | | | 10,563 | |
| Trustees’ fees and expenses | | | 6,943 | |
| Reports to shareholders | | | 5,997 | |
| Legal fees | | | 2,480 | |
| Interest expense (See Note 6) | | | 2,222 | |
| Other expenses | | | 5,073 | |
| Total expenses | | | 382,402 | |
| NET INVESTMENT LOSS | | $ | (26,816 | ) |
| | | | | |
| REALIZED AND UNREALIZED GAINS (LOSSES): | | | | |
| Net realized gain on investments | | $ | 13,191 | |
| Change in unrealized appreciation on investments | | | (826,729 | ) |
| Net loss on investments | | | (813,538 | ) |
| NET DECREASE IN NET ASSETS RESULTING FROM OPERATIONS | | $ | (840,354 | ) |
| (1) | Net of foreign taxes withheld of $64,067. |
The accompanying notes are an integral part of these financial statements.
HENNESSY FUNDS 1-800-966-4354
(This Page Intentionally Left Blank.)
Financial Statements
| Statements of Changes in Net Assets |
| | | Six Months Ended | | | | |
| | | April 30, 2014 | | | Year Ended | |
| | | (Unaudited) | | | October 31, 2013 | |
| OPERATIONS: | | | | | | |
| Net investment loss | | $ | (26,816 | ) | | $ | (84,313 | ) |
| Net realized gain on securities | | | 13,191 | | | | 16,814 | |
| Change in unrealized appreciation (depreciation) | | | | | | | | |
| on securities | | | (826,729 | ) | | | 6,419,308 | |
| Net increase (decrease) in net assets | | | | | | | | |
| resulting from operations | | | (840,354 | ) | | | 6,351,809 | |
| | | | | | | | | |
| DISTRIBUTIONS TO SHAREHOLDERS FROM: | | | | | | | | |
| Return of capital | | | | | | | | |
| Investor Class | | | — | | | | (7,343 | ) |
| Institutional Class | | | — | | | | (5,524 | ) |
| Total distributions | | | — | | | | (12,867 | ) |
| | | | | | | | | |
| CAPITAL SHARE TRANSACTIONS: | | | | | | | | |
| Proceeds from shares subscribed – Investor Class | | | 17,775,299 | | | | 34,783,512 | |
| Proceeds from shares subscribed – Institutional Class | | | 4,342,557 | | | | 2,373,930 | |
| Dividends reinvested – Investor Class | | | — | | | | 7,134 | |
| Dividends reinvested – Institutional Class | | | — | | | | 5,425 | |
| Cost of shares redeemed – Investor Class | | | (22,908,201 | ) | | | (18,430,840 | ) |
| Cost of shares redeemed – Institutional Class | | | (949,957 | ) | | | (4,003,290 | ) |
| Net increase (decrease) in net assets | | | | | | | | |
| derived from capital share transactions | | | (1,740,302 | ) | | | 14,735,871 | |
| TOTAL INCREASE (DECREASE) IN NET ASSETS | | | (2,580,656 | ) | | | 21,074,813 | |
| | | | | | | | | |
| NET ASSETS: | | | | | | | | |
| Beginning of period | | | 40,393,034 | | | | 19,318,221 | |
| End of period | | $ | 37,812,378 | | | $ | 40,393,034 | |
| Undistributed net investment loss, end of period | | $ | (147,266 | ) | | $ | (120,450 | ) |
| | | | | | | | | |
| CHANGES IN SHARES OUTSTANDING: | | | | | | | | |
| Shares sold – Investor Class | | | 910,717 | | | | 1,961,023 | |
| Shares sold – Institutional Class | | | 217,260 | | | | 126,165 | |
| Shares issued to holders as reinvestment | | | | | | | | |
| of dividends – Investor Class | | | — | | | | 459 | |
| Shares issued to holders as reinvestment | | | | | | | | |
| of dividends – Institutional Class | | | — | | | | 344 | |
| Shares redeemed – Investor Class | | | (1,185,350 | ) | | | (1,043,924 | ) |
| Shares redeemed – Institutional Class | | | (48,640 | ) | | | (245,080 | ) |
| Net increase (decrease) in shares outstanding | | | (106,013 | ) | | | 798,987 | |
The accompanying notes are an integral part of these financial statements.
HENNESSY FUNDS 1-800-966-4354
Financial Highlights
For an Investor Class share outstanding throughout each period
| | | Six Months Ended | |
| | | April 30, 2014 | |
| | | (Unaudited) | |
| PER SHARE DATA: | | | |
| Net asset value, beginning of period | | $ | 19.68 | |
| | | | | |
| Income from investment operations: | | | | |
| Net investment income (loss) | | | (0.04 | ) |
| Net realized and unrealized gains (losses) on securities | | | (0.25 | ) |
| Total from investment operations | | | (0.29 | ) |
| | | | | |
| Less distributions: | | | | |
| Dividends from net investment income | | | — | |
| Return of capital | | | — | |
| Total distributions | | | — | |
| Paid-in capital from redemption fees | | | — | |
| Net asset value, end of period | | $ | 19.39 | |
| | | | | |
| TOTAL RETURN | | | (1.47 | )%(3) |
| | | | | |
| SUPPLEMENTAL DATA AND RATIOS: | | | | |
| Net assets, end of period (millions) | | $ | 25.54 | |
| Ratio of expenses to average net assets: | | | | |
| Before expense reimbursement | | | 1.76 | %(4) |
| After expense reimbursement | | | 1.76 | %(4) |
| Ratio of net investment income (loss) to average net assets: | | | | |
| Before expense reimbursement | | | (0.19 | )%(4) |
| After expense reimbursement | | | (0.19 | )%(4) |
Portfolio turnover rate(5) | | | 21 | %(3) |
| (1) | The financial highlights set forth for periods prior to September 17, 2009 represent the historical financial highlights of the SPARX Japan Fund. On September 17, 2009, Hennessy Advisors, Inc. became the investment advisor to the Fund and the Fund changed its name to Hennessy Select SPARX Japan Fund. In October 2012, the Fund changed its name to Hennessy Japan Fund. |
| (2) | Amount is less than $0.01. |
| (3) | Not annualized. |
| (4) | Annualized. |
| (5) | Portfolio turnover is calculated on the basis of the Fund as a whole. |
The accompanying notes are an integral part of these financial statements.
| Year Ended October 31, | |
| 2013 | | | 2012 | | | 2011 | | | 2010 | | | 2009(1) | |
| | | | | | | | | | | | | | |
| $ | 15.40 | | | $ | 13.99 | | | $ | 12.58 | | | $ | 11.38 | | | $ | 9.73 | |
| | | | | | | | | | | | | | | | | | | |
| | | | | | | | | | | | | | | | | | | |
| | (0.04 | ) | | | (0.02 | ) | | | (0.10 | ) | | | (0.04 | ) | | | 0.02 | |
| | 4.33 | | | | 1.43 | | | | 1.51 | | | | 1.25 | | | | 1.66 | |
| | 4.29 | | | | 1.41 | | | | 1.41 | | | | 1.21 | | | | 1.68 | |
| | | | | | | | | | | | | | | | | | | |
| | | | | | | | | | | | | | | | | | | |
| | — | | | | — | | | | — | | | | (0.01 | ) | | | (0.03 | ) |
| | (0.01 | ) | | | — | | | | — | | | | (0.01 | ) | | | — | |
| | (0.01 | ) | | | — | | | | — | | | | (0.02 | ) | | | (0.03 | ) |
| | — | | | | — | | | | — | | | | 0.01 | | | | 0.00 | (2) |
| $ | 19.68 | | | $ | 15.40 | | | $ | 13.99 | | | $ | 12.58 | | | $ | 11.38 | |
| | | | | | | | | | | | | | | | | | | |
| | 27.87 | % | | | 10.08 | % | | | 11.21 | % | | | 11.04 | % | | | 17.36 | % |
| | | | | | | | | | | | | | | | | | | |
| | | | | | | | | | | | | | | | | | | |
| $ | 31.32 | | | $ | 10.38 | | | $ | 14.81 | | | $ | 20.01 | | | $ | 28.29 | |
| | | | | | | | | | | | | | | | | | | |
| | 1.90 | % | | | 2.03 | % | | | 1.86 | % | | | 1.71 | % | | | 1.75 | % |
| | 1.90 | % | | | 2.03 | % | | | 1.86 | % | | | 1.59 | % | | | 1.24 | % |
| | | | | | | | | | | | | | | | | | | |
| | (0.35 | )% | | | (0.09 | )% | | | (0.54 | )% | | | (0.27 | )% | | | (0.34 | )% |
| | (0.35 | )% | | | (0.09 | )% | | | (0.54 | )% | | | (0.15 | )% | | | 0.17 | % |
| | 6 | % | | | 2 | % | | | 166 | % | | | 8 | % | | | 17 | % |
The accompanying notes are an integral part of these financial statements.
HENNESSY FUNDS 1-800-966-4354
Financial Highlights
For an Institutional Class share outstanding throughout each period
| | | Six Months Ended | |
| | | April 30, 2014 | |
| | | (Unaudited) | |
| PER SHARE DATA: | | | |
| Net asset value, beginning of period | | $ | 19.98 | |
| | | | | |
| Income from investment operations: | | | | |
| Net investment income (loss) | | | 0.02 | |
| Net realized and unrealized gains (losses) on securities | | | (0.29 | ) |
| Total from investment operations | | | (0.27 | ) |
| | | | | |
| Less distributions: | | | | |
| Dividends from net investment income | | | — | |
| Return of capital | | | — | |
| Total distributions | | | — | |
| Paid-in capital from redemption fees | | | — | |
| Net asset value, end of period | | $ | 19.71 | |
| | | | | |
| TOTAL RETURN | | | (1.35 | )%(3) |
| | | | | |
| SUPPLEMENTAL DATA AND RATIOS: | | | | |
| Net assets, end of period (millions) | | $ | 12.27 | |
| Ratio of expenses to average net assets: | | | | |
| Before expense reimbursement | | | 1.54 | %(4) |
| After expense reimbursement | | | 1.54 | %(4) |
| Ratio of net investment income (loss) to average net assets: | | | | |
| Before expense reimbursement | | | 0.08 | %(4) |
| After expense reimbursement | | | 0.08 | %(4) |
Portfolio turnover rate(5) | | | 21 | %(3) |
| (1) | The financial highlights set forth for periods prior to September 17, 2009 represent the historical financial highlights of the SPARX Japan Fund. On September 17, 2009, Hennessy Advisors, Inc. became the investment advisor to the Fund and the Fund changed its name to Hennessy Select SPARX Japan Fund. In October 2012, the Fund changed its name to Hennessy Japan Fund. |
| (2) | Amount is less than $0.01. |
| (3) | Not annualized. |
| (4) | Annualized. |
| (5) | Portfolio turnover is calculated on the basis of the Fund as a whole. |
The accompanying notes are an integral part of these financial statements.
| Year Ended October 31, | |
| 2013 | | | 2012 | | | 2011 | | | 2010 | | | 2009(1) | |
| | | | | | | | | | | | | | |
| $ | 15.60 | | | $ | 14.14 | | | $ | 12.66 | | | $ | 11.44 | | | $ | 9.78 | |
| | | | | | | | | | | | | | | | | | | |
| | | | | | | | | | | | | | | | | | | |
| | (0.03 | ) | | | 0.02 | | | | 0.03 | | | | 0.01 | | | | 0.03 | |
| | 4.42 | | | | 1.44 | | | | 1.45 | | | | 1.23 | | | | 1.66 | |
| | 4.39 | | | | 1.46 | | | | 1.48 | | | | 1.24 | | | | 1.69 | |
| | | | | | | | | | | | | | | | | | | |
| | | | | | | | | | | | | | | | | | | |
| | — | | | | — | | | | — | | | | (0.01 | ) | | | (0.03 | ) |
| | (0.01 | ) | | | — | | | | — | | | | (0.01 | ) | | | — | |
| | (0.01 | ) | | | — | | | | — | | | | (0.02 | ) | | | (0.03 | ) |
| | — | | | | — | | | | — | | | | — | | | | 0.00 | (2) |
| $ | 19.98 | | | $ | 15.60 | | | $ | 14.14 | | | $ | 12.66 | | | $ | 11.44 | |
| | | | | | | | | | | | | | | | | | | |
| | 28.19 | % | | | 10.33 | % | | | 11.69 | % | | | 11.07 | % | | | 17.37 | % |
| | | | | | | | | | | | | | | | | | | |
| | | | | | | | | | | | | | | | | | | |
| $ | 9.07 | | | $ | 8.94 | | | $ | 9.70 | | | $ | 23.57 | | | $ | 25.55 | |
| | | | | | | | | | | | | | | | | | | |
| | 1.66 | % | | | 1.85 | % | | | 1.64 | % | | | 1.45 | % | | | 1.75 | % |
| | 1.66 | % | | | 1.85 | % | | | 1.64 | % | | | 1.40 | % | | | 1.24 | % |
| | | | | | | | | | | | | | | | | | | |
| | (0.20 | )% | | | 0.13 | % | | | 0.19 | % | | | 0.02 | % | | | (0.34 | )% |
| | (0.20 | )% | | | 0.13 | % | | | 0.19 | % | | | 0.07 | % | | | 0.17 | % |
| | 6 | % | | | 2 | % | | | 166 | % | | | 8 | % | | | 17 | % |
The accompanying notes are an integral part of these financial statements.
HENNESSY FUNDS 1-800-966-4354
Notes to the Financial Statements
April 30, 2014 (Unaudited)
1). ORGANIZATION
The Hennessy Japan Fund (the “Fund”) is a series of Hennessy Funds Trust (the “Trust”), which was organized as a Delaware statutory trust on September 17, 1992. The Fund is an open-end management investment company registered under the Investment Company Act of 1940, as amended. The Fund is a successor to a fund with the same name (the “Predecessor Fund”) that was a series of Hennessy SPARX Funds Trust, a Massachusetts business trust, pursuant to a reorganization that took place after the close of business on February 28, 2014. Prior to February 28, 2014, the Fund had no investment operations. As a result of the reorganization, holders of the Investor Class shares of the Predecessor Fund received Investor Class shares of the Fund (the Investor Class shares of the Fund are the successor to the accounting and performance information of the Predecessor Fund), and holders of the Institutional Class shares of the Predecessor Fund received Institutional Class shares of the Fund (the Institutional Class shares of the Fund are the successor to the accounting and performance information of the Predecessor Fund). The investment objective of the Fund is long-term capital appreciation. The Fund is a diversified fund, but may employ a relatively focused investment strategy and may hold securities of fewer issuers than other diversified funds.
The Fund offers Investor Class and Institutional Class shares. Prior to October 26, 2012, the Investor Class shares were known as Original Class shares. Each class of shares differs principally in its respective administration, 12b-1 distribution and service fees, shareholder servicing, and transfer agent expenses and sales charges, if any. Each class has identical rights to earnings, assets, and voting privileges, except for class-specific expenses and exclusive rights to vote on matters affecting only individual classes.
2). SIGNIFICANT ACCOUNTING POLICIES
The following is a summary of significant accounting policies consistently followed by the Fund in the preparation of the financial statements. These policies are in conformity with U.S. generally accepted accounting principles (“GAAP”).
| a). | Investment Valuation – All investments in securities are recorded at their estimated fair value, as described in Note 3. |
| b). | Federal Income Taxes – Provision for Federal income taxes or excise taxes has not been made since the Fund has elected to be taxed as a “regulated investment company” and intends to distribute substantially all of its taxable income to its shareholders and otherwise comply with the provisions of the Internal Revenue Code of 1986, as amended, applicable to regulated investment companies. Net investment income or loss and realized gains and losses for federal income tax purposes may differ from that reported on the financial statements because of temporary book and tax basis differences. Temporary differences are primarily the result of the treatment of wash sales for tax reporting purposes. Distributions from net realized gains for book purposes may include short-term capital gains, which are included as ordinary income to shareholders for tax purposes. |
| c). | Income and Expenses – Dividend income is recognized on the ex-dividend date or as soon as information is available to the Fund. Interest income, which includes the amortization of premium and accretion of discount, is recognized on an accrual basis. |
| | The Fund is charged for those expenses that are directly attributable to the portfolio, such as advisory, administration, and certain shareholder service fees. Income, expenses (other than expenses attributable to a specific class), and realized and unrealized gains or losses on investments are allocated to each class of shares based on its respective net assets. |
| d). | Distributions to Shareholders – Dividends from net investment income for the Fund, if any, are declared and paid out annually, usually in November or December. Distributions of net realized capital gains, if any, are declared and paid annually, usually in November or December. |
| e). | Security Transactions – Investment and shareholder transactions are recorded on the trade date. The Fund determines the gain or loss realized from the investment transactions by comparing the original cost of the security lot sold with the net sale proceeds. Discounts and premiums on securities purchased are accreted/amortized over the life of the respective security. |
| f). | Use of Estimates – The preparation of financial statements in conformity with GAAP requires management to make estimates and assumptions that affect the reported amounts of assets and liabilities and disclosure of contingent assets and liabilities at the date of the financial statements and the reported change in net assets during the reporting period. Actual results could differ from those estimates. |
| g). | Share Valuation – The net asset value (“NAV”) per share of the Fund is calculated by dividing the sum of the value of the securities held by the Fund, plus cash or other assets, minus all liabilities (including estimated accrued expenses) by the total number of shares outstanding for the Fund, rounded to the nearest cent. The Fund’s shares will not be priced on days the New York Stock Exchange is closed for trading. The offering and redemption price per share for the Fund is equal to the Fund’s net asset value per share. |
| h). | Foreign Currency – Values of investments denominated in foreign currencies, if any, are converted into U.S. dollars using the spot market rate of exchange at the time of valuation. Purchases and sales of investments and income are translated into U.S. dollars using the spot market rate of exchange prevailing on the respective dates of such transactions. The Fund does not isolate the portion of the results of operations resulting from fluctuations in foreign exchange rates on investments from fluctuations resulting from changes in the market prices of securities held. Such fluctuations are included with the net realized and unrealized gain or loss on investments. Foreign investments present additional risks due to currency fluctuations, economic and political factors, lower liquidity, government regulations, differences in accounting standards, and other factors. |
| i). | Forward Contracts – The Fund may enter into forward currency contracts to reduce its exposure to changes in foreign currency exchange rates on its foreign holdings and to lock in the U.S. dollar cost of firm purchase and sale commitments for securities denominated in foreign currencies. A forward currency contract is a commitment to purchase or sell a foreign currency at a future date at a negotiated forward rate. The gain or loss arising from the difference between the U.S. dollar cost of the original contract and the value of the foreign currency in U.S. dollars upon closing of such contract is included in net realized gain or loss from foreign currency transactions. During the six months ended April 30, 2014, the Fund did not enter into any forward contracts. |
| j). | Repurchase Agreements – The Fund may enter into repurchase agreements with member banks or security dealers of the Federal Reserve Board whom the investment advisor deems creditworthy. The repurchase price generally equals the price paid by the Fund plus interest negotiated on the basis of current short-term rates. |
HENNESSY FUNDS 1-800-966-4354
| | Securities pledged as collateral for repurchase agreements are held by the custodian bank until the respective agreements mature. Provisions of the repurchase agreements ensure that the market value of the collateral, including accrued interest thereon, is sufficient in the event of default of the counterparty. If the counterparty defaults and the value of the collateral declines or if the counterparty enters an insolvency proceeding, realization of the collateral by the Fund may be delayed or limited. |
| k). | Accounting for Uncertainty in Income Taxes – The Fund has adopted accounting policies regarding recognition and measurement of tax positions taken or expected to be taken on a tax return. The Fund has reviewed all open tax years in major jurisdictions and concluded that there is no impact on the Fund’s net assets and no tax liability resulting from unrecognized tax benefits relating to uncertain income tax positions taken or expected to be taken on a tax return. The Fund’s major tax jurisdictions are U.S. Federal and Delaware. As of April 30, 2014, open Federal and state tax years for the Fund include the tax years ended October 31, 2011 through 2013. |
| l). | Derivatives – The Fund may invest in, or enter into, derivatives, such as options, futures contracts, options on futures contracts, and swaps, for a variety of reasons, including to hedge certain risks, to provide a substitute for purchasing or selling particular securities, or to increase potential income gain. Derivatives may provide a cheaper, quicker, or more specifically focused way for a Fund to invest than “traditional” securities would. The main purpose of utilizing these derivative instruments is for hedging purposes. |
| | The Fund has adopted the financial accounting reporting rules as required by the Derivatives and Hedging Topic of the Financial Accounting Standards Board Accounting Standards Codification. Under such rules, the Fund is required to include enhanced disclosure that enables investors to understand how and why an entity uses derivatives, how derivatives are accounted for, and how derivatives instruments affect an entity’s results of operations and financial position. During the six months ended April 30, 2014, the Fund did not hold any derivative instruments. |
| m). | Events Subsequent to the Fiscal Period End – The Fund has adopted financial reporting rules regarding subsequent events that require an entity to recognize in the financial statements the effects of all subsequent events that provide additional evidence about conditions that existed at the date of the balance sheet. Management has evaluated the Fund’s related events and transactions that occurred subsequent to April 30, 2014 through the date of issuance of the Fund’s financial statements. There were no events or transactions that occurred during this period that materially impacted the amounts or disclosures in the Fund’s financial statements. |
3). SECURITIES VALUATION
The Fund has adopted authoritative fair valuation accounting standards that establish an authoritative definition of fair value and set out a hierarchy for measuring fair value. These standards require additional disclosures about the various inputs and valuation techniques used to develop the measurements of fair value and a discussion in changes in valuation techniques and related inputs during the period. These inputs are summarized in the three broad levels listed below:
| | Level 1 – | Quoted unadjusted prices for identical instruments in active markets to which the Fund has access at the date of measurement. |
| | | |
| | Level 2 – | Quoted prices for similar instruments in active markets; quoted prices for identical or similar instruments in markets that are not active; and model-derived valuations in which all significant inputs and significant value drivers are observable in active markets. Level 2 inputs are those in |
| | | markets for which there are few transactions, the prices are not current, the prices are fair value adjusted due to post-market close subsequent events (foreign markets), little public information exists, or instances where prices vary substantially over time or among brokered market makers. These inputs may also include interest rates, prepayment speeds, credit risk curves, default rates, and similar data. |
| | | |
| | Level 3 – | Model-derived valuations in which one or more significant inputs or significant value drivers are unobservable. Unobservable inputs are those inputs that reflect the Fund’s own assumptions about what market participants would use to price the asset or liability based on the best available information. |
Following is a description of the valuation techniques applied to the Fund’s major categories of assets and liabilities measured at fair value on a recurring basis.
Equity Securities – Equity securities, including common stocks, preferred stocks, foreign issued common stocks, exchange traded funds, closed-end mutual funds, and real estate investment trusts, that are traded on a securities exchange for which a last-quoted sales price is readily available will be valued at the last sales price as reported by the primary exchange on which the securities are listed. Securities listed on The NASDAQ Stock Market (“NASDAQ”) will be valued at the NASDAQ Official Closing Price, which may differ from the last sales price reported. Securities traded on a securities exchange for which a last-quoted sales price is not readily available will be valued at the mean between the bid and ask prices. To the extent these securities are actively traded and valuation adjustments are not applied, they are classified in Level 1 of the fair value hierarchy.
Investment Companies – Investments in investment companies (e.g., mutual funds and exchange traded funds) are generally priced at the ending NAV provided by the Fund’s service agent and will be classified in Level 1 of the fair value hierarchy.
Debt Securities – Debt securities, including corporate bonds, asset-backed securities, mortgage-backed securities, municipal bonds, U.S. Treasuries, and U.S. government agency issues, are valued at market on the basis of valuations furnished by an independent pricing service that utilizes both dealer-supplied valuations and formula-based techniques. The pricing service may consider recently executed transactions in securities of the issuer or comparable issuers, market price quotations (where observable), bond spreads, and fundamental data relating to the issuer. In addition, the model may incorporate market observable data such as reported sales of similar securities, broker quotes, yields, bids, offers, and reference data. Certain securities are valued principally using dealer quotations. These securities are generally classified in Level 2 of the fair value hierarchy.
Short-Term Securities – Short-term equity investments, including money market funds, are valued in the manner specified above. Short-term debt investments are valued at amortized cost, if their original maturity was 60 days or less, or by amortizing the values as of the 61st day prior to maturity, if their original term to maturity exceeded 60 days. Short-term securities are generally classified in Level 1 or Level 2 of the fair market hierarchy depending on the inputs used and market activity levels for specific securities.
The Board of Trustees of the Fund (the “Board”) has adopted fair value pricing procedures that are followed when a price for a security is not readily available or if a significant event has occurred that indicates the closing price of a security no longer represents the true value of that security. Fair value pricing determinations are made in good faith in accordance with these procedures. There are numerous criteria that will be given consideration in determining a fair value of a security. Some of these criteria are trading volume of security and markets, the value of other like securities, and news events
HENNESSY FUNDS 1-800-966-4354
with direct bearing to security or market. Fair value pricing results in an estimated price that reasonably reflects the current market conditions in order to rate the portfolio holdings such that shareholder transactions receive a fair net asset value. Depending on the relative significance of the valuation inputs, these securities may be classified in either Level 2 or Level 3 of the fair value hierarchy.
Fair valuing of foreign securities may be determined with the assistance of a pricing service using correlations between the movement of prices of such securities and indices of domestic securities and other appropriate indicators, such as closing market prices of relevant American Depositary Receipts or futures contracts. The effect of using fair value pricing is that the Fund’s NAV will reflect the affected portfolio securities’ value as determined in the judgment of the Board or its designee instead of being determined by the market. Using a fair value pricing methodology to price foreign securities may result in a value that is different from a foreign security’s most recent closing price and from the prices used by other investment companies to calculate their net asset values and are generally considered Level 2 prices in the fair valuation hierarchy. Because the Fund may invest in foreign securities, the value of the Fund’s portfolio securities may change on days when you will not be able to purchase or redeem your shares.
The Board has delegated day-to-day valuation matters to a Valuation Committee comprised of one or more representatives from Hennessy Advisors, Inc., the Fund’s investment advisor. The function of the Valuation Committee is to value securities where current and reliable market quotations are not readily available. All actions taken by the Valuation Committee are reviewed by the Board.
The Fund has performed an analysis of all existing investments to determine the significance and character of all inputs to their fair value determination. Various inputs are used in determining the value of the Fund’s investments. The inputs or methodology used for valuing securities are not necessarily an indication of the risk associated with investing in those securities. Details related to the fair valuation hierarchy of the Fund’s securities as of April 30, 2014 are included in the Fund’s Schedule of Investments.
4). INVESTMENT TRANSACTIONS
Purchases and sales of investment securities (excluding government and short-term investments) for the Fund during the six months ended April 30, 2014 were $8,608,506 and $9,037,801, respectively.
There were no purchases or sales/maturities of long-term U.S. Government Securities for the Fund during the six months ended April 30, 2014.
5). INVESTMENT MANAGEMENT FEE AND OTHER TRANSACTIONS WITH AFFILIATES
Hennessy Advisors, Inc. (the “Advisor”) is the investment advisor of the Fund. The Advisor provides the Fund with investment management services under an Investment Advisory Agreement. The Advisor furnishes all investment advice, office space, facilities, and provides most of the personnel needed by the Fund. As compensation for its services, the Advisor is entitled to a monthly fee from the Fund. The fee is based upon the average daily net assets of the Fund at the annual rate of 1.00%. The net investment advisory fees payable for the Fund as of April 30, 2014 were $37,237.
The Advisor has delegated the day-to-day management of the Fund to a sub-advisor, SPARX Asset Management Co., Ltd. The Advisor pays the sub-advisor fees for the Fund from its own assets and these fees are not an additional expense of the Fund.
The Board has approved a Shareholder Servicing Agreement for the Investor Class shares of the Fund, which was instituted to compensate the Advisor for the non-
investment management services it provides to the Fund. The Shareholder Servicing Agreement provides for a monthly fee paid to the Advisor at an annual rate of 0.10% of the average daily net assets of the Fund attributable to Investor Class shares. Shareholder servicing fees payable for the Fund as of April 30, 2014 were $2,707.
The Fund has entered into agreements with various brokers, dealers, and financial intermediaries in connection with the sale of shares of the Fund. The agreements provide for periodic payments by the Fund to the brokers, dealers, and financial intermediaries for providing certain shareholder maintenance services (sub-transfer agent expenses). These shareholder services include the pre-processing and quality control of new accounts, shareholder correspondence, answering customer inquiries regarding account status, and facilitating shareholder telephone transactions. Fees paid by the Fund to various brokers, dealers, and financial intermediaries for the six months ended April 30, 2014 were $35,127.
U.S. Bancorp Fund Services, LLC (“USBFS”) provides the Fund with administrative, fund accounting, and transfer agent services, including all regulatory reporting, and necessary office equipment and personnel. As administrator, USBFS prepares various federal and state regulatory filings, reports, and returns for the Fund; prepares reports and materials to be supplied to the Board; monitors the activities of the Fund’s custodian, transfer agent, and accountants; and coordinates the preparation and payment of the Fund’s expenses and reviews the Fund’s expense accruals. Fees paid to USBFS for the six months ended April 30, 2014 were $44,812.
U.S. Bank, N.A., an affiliate of USBFS, serves as the Fund’s custodian. Quasar Distributors, LLC acts as the Fund’s principal underwriter in a continuous public offering of the Fund’s shares. Quasar Distributors, LLC is an affiliate of USBFS and U.S. Bank, N.A.
6). LINE OF CREDIT
The Fund has a line of credit with the other funds in the Hennessy Funds family of funds (the “Hennessy Funds”) in the amount of the lesser of (i) $100,000,000 or (ii) 33.33% of each Hennessy Fund’s net assets, or 30% for the Hennessy Gas Utility Index Fund and 10% for the Hennessy Balanced Fund, intended to provide short-term financing, if necessary, subject to certain restrictions, in connection with shareholder redemptions. The credit facility is with the Hennessy Funds’ custodian bank, U.S. Bank, N.A. Borrowings under this arrangement bear interest at the bank’s prime rate. During the six months ended April 30, 2014, the Fund had an outstanding average daily balance and a weighted average interest rate of $314,934 and 3.25%, respectively. The maximum amount outstanding for the Fund during the period was $8,288,000.
7). FEDERAL TAX INFORMATION
As of October 31, 2013, the Fund’s most recent fiscal year end, the components of accumulated earnings (losses) for income tax purposes for the Fund were as follows:
| | Cost of investments for tax purposes | | $ | 30,288,033 | |
| | Gross tax unrealized appreciation | | $ | 10,246,685 | |
| | Gross tax unrealized depreciation | | | (418,275 | ) |
| | Net tax unrealized appreciation/depreciation | | $ | 9,828,410 | |
| | Undistributed ordinary income | | $ | — | |
| | Undistributed long-term capital gains | | | — | |
| | Total distributable earnings | | $ | — | |
| | Other accumulated gain (loss) | | $ | (33,412,883 | ) |
| | Total accumulated gain (loss) | | $ | (23,584,473 | ) |
| | | | | | |
HENNESSY FUNDS 1-800-966-4354
The difference between book-basis and tax-basis unrealized appreciation is attributable primarily to capital loss carry overs, wash sales, and partnership adjustments.
At October 31, 2013, the Fund’s most recent fiscal year end, the Fund had capital loss carryforwards that expire as follows:
| | $ | 4,786,618 | | 10/31/15 |
| | $ | 6,231,544 | | 10/31/16 |
| | $ | 15,450,664 | | 10/31/17 |
| | $ | 6,121,138 | | 10/31/18 |
| | $ | 362,390 | | Indefinite ST |
| | $ | 340,146 | | Indefinite LT |
During the year ended October 31, 2013, the Fund’s most recent fiscal year end, the capital loss carry forwards utilized for the Fund were $812,229.
Capital losses sustained in the year ended October 31, 2012 and in future taxable years will not expire and may be carried over by the Fund without limitation; however, they will retain the character of the original loss. Furthermore, any losses incurred during those taxable years will be required to be utilized prior to the losses incurred in the pre-enactment taxable years. As a result of this ordering rule, pre-enactment capital loss carryforwards may be more likely to expire unused. Under pre-enactment law, capital losses could be carried forward for eight years, and carried forward as short-term capital losses, irrespective of the character of the original loss.
At October 31, 2013, the Fund deferred, on a tax basis, a post-December late year ordinary loss deferral and a post-December loss deferral of $(120,450) and did not defer, on a tax basis, any post-December loss deferrals.
The tax character of distributions paid during fiscal year 2014 (year-to-date) and fiscal year 2013 for the Fund were as follows:
| | | | Six Months Ended | | | Year Ended | |
| | | | April 30, 2014 | | | October 31, 2013 | |
| | Ordinary income | | $ | — | | | $ | — | |
| | Long-term capital gain | | | — | | | | — | |
| | Return of capital | | | — | | | | 12,867 | |
| | | | $ | — | | | $ | 12,867 | |
8). AGREEMENT AND PLAN OF REORGANIZATION
On December 11, 2013, the Board approved an Agreement and Plan of Reorganization (the “Agreement”), of the Hennessy Japan Fund (the “New Fund”), pursuant to which the New Fund would be a successor to the corresponding series of the same name Hennessy SPARX Funds Trust, a Massachusetts business trust (the “Predecessor Fund”). The Agreement provided for the transfer of assets of the Predecessor Fund to the New Fund and the assumption of the liabilities of the Predecessor Fund by the New Fund. The New Fund had the same investment objective and substantially similar principal investment strategies as the Predecessor Fund. The reorganization was effective as of the close of business on February 28, 2014. The following table illustrates the specifics of the reorganization:
| | | Shares of the New Fund | | | |
| | Predecessor Fund | Issued to Shareholders of | New Fund | Combined | Tax Status |
| | Net Assets | the Predecessor Fund | Net Assets | Net Assets | of Transfer |
| | $48,645,944(1) | 2,463,074 | $48,645,944 | $48,645,944 | Non-taxable |
| | (1) | Included accumulated realized loss and unrealized appreciation in the amounts of $(33,440,043) and $9,954,834, respectively. |
Expense Example (Unaudited)
April 30, 2014
As a shareholder of the Fund, you incur two types of costs: (1) transaction costs, including sales charges (loads) on purchase payments, reinvested dividends, or other distributions; redemption fees; and exchange fees; and (2) ongoing costs, including management fees; service fees; and other Fund expenses. This Example is intended to help you understand your ongoing costs (in dollars) of investing in the Fund and to compare these costs with the ongoing costs of investing in other mutual funds. The Example is based on an investment of $1,000 invested at the beginning of the period and held for the entire period from November 1, 2013 through April 30, 2014.
Actual Expenses
The first line of the table below under the “Investor Class” and “Institutional Class” headings provides information about actual account values and actual expenses. Although the Fund charges no sales loads or transaction fees, you will be assessed fees for outgoing wire transfers, returned checks and stop payment orders at prevailing rates charged by U.S. Bancorp Fund Services, LLC, the Fund’s transfer agent. If you request that a redemption be made by wire transfer, currently a $15.00 fee is charged by the Fund’s transfer agent. IRA accounts will be charged a $15.00 annual maintenance fee. The example below includes, but is not limited to, management fees, shareholder servicing fees, fund accounting, custody, and transfer agent fees. However, the example below does not include portfolio trading commissions and related expenses, and other extraordinary expenses as determined under generally accepted accounting principles. You may use the information in this line, together with the amount you invested, to estimate the expenses that you paid over the period. Simply divide your account value by $1,000 (for example, an $8,600 account value divided by $1,000 = 8.6), then multiply the result by the number in the first line of the table under the “Investor Class” and “Institutional Class” headings in the column entitled “Expenses Paid During Period” to estimate the expenses you paid on your account during this period.
Hypothetical Example for Comparison Purposes
The second line of the table below under the “Investor Class” and “Institutional Class” headings provides information about hypothetical account values and hypothetical expenses based on the Fund’s actual expense ratios and an assumed rate of return of 5% per year before expenses, which is not the Fund’s actual return. The hypothetical account values and expenses may not be used to estimate the actual ending account balance or expenses you paid for the period. You may use this information to compare the ongoing costs of investing in the Fund and other funds. To do so, compare this 5% hypothetical example with the 5% hypothetical examples that appear in the shareholder reports of the other funds. Please note that the expenses shown in the table are meant to highlight your ongoing costs only and do not reflect any transactional costs, such as sales charges (loads), or exchange fees. Therefore, the second line of the table under the “Investor Class” and “Institutional Class” headings is useful in comparing ongoing costs only, and will not help you determine the relative total costs of owning different funds. In addition, if these transactional costs were included, your costs would have been higher.
HENNESSY FUNDS 1-800-966-4354
| | | | Expenses Paid |
| | Beginning | Ending | During Period(1) |
| | Account Value | Account Value | November 1, 2013 – |
| | November 1, 2013 | April 30, 2014 | April 30, 2014 |
| Investor Class | | | |
| | | | |
| Actual | $1,000.00 | $ 985.30 | $8.66 |
| | | | |
| Hypothetical (5% return | | | |
| before expenses) | $1,000.00 | $1,016.07 | $8.80 |
| | | | |
| Institutional Class | | | |
| | | | |
| Actual | $1,000.00 | $ 986.50 | $7.59 |
| | | | |
| Hypothetical (5% return | | | |
| before expenses) | $1,000.00 | $1,017.16 | $7.70 |
| (1) | Expenses are equal to the Fund’s annualized expense ratio of 1.76% for Investor Class shares or 1.54% for Institutional Class shares, as applicable, multiplied by the average account value over the period, multiplied by 181/365 days (to reflect one-half year period). |
Proxy Voting
A description of the policies and procedures the Fund uses to determine how to vote proxies relating to portfolio securities is available without charge: (1) by calling 1-800-966-4354; (2) on the Hennessy Funds’ website at hennessyfunds.com; or (3) on the U.S. Securities and Exchange Commission’s (the “SEC”) website at www.sec.gov. The Fund’s proxy voting record is available on both the Hennessy Funds’ website at hennessyfunds.com and the SEC’s website at www.sec.gov no later than August 31 for the prior 12 months ending June 30.
Quarterly Filings on Form N-Q
The Fund files its complete schedule of portfolio holdings with the SEC for the first and third quarters of each fiscal year on Form N-Q. The Fund’s Forms N-Q are available on the SEC’s website at www.sec.gov. The Fund’s Forms N-Q may be reviewed and copied at the SEC’s Public Reference Room in Washington, DC and information on the operation of the Public Reference Room may be obtained by calling 1-800-SEC-0330. Information included in the Fund’s Forms N-Q will also be available upon request by calling 1-800-966-4354.
Householding
To help keep the Fund’s costs as low as possible, we generally deliver a single copy of most financial reports and prospectuses to shareholders who share an address, even if the accounts are registered under different names. This process, known as “householding,” does not apply to account statements. You may, of course, request an individual copy of a prospectus or financial report at any time. If you would like to receive separate mailings, please call the Administrator at 1-800-261-6950 or 1-414-765-4124 and we will begin individual delivery within 30 days of your request. If your account is held through a financial institution or other intermediary, please contact them directly to request individual delivery.
HENNESSY FUNDS 1-800-966-4354
Board Approval of Investment Advisory
Agreements
At its meeting on December 4, 2013, the Board of Trustees of the Fund (the “Board”) unanimously approved the investment advisory agreement and sub-advisory agreement of the Fund for an initial period of two years.
The Board reviewed a number of documents, including a memorandum provided by outside legal counsel that described the fiduciary duties of the Board with respect to approving the investment advisory agreement and the relevant factors for consideration, the Advisor’s most recent Form 10-K, a completed questionnaire from the sub-advisor, copies of the advisory and sub-advisory agreements, a fund fact sheet, and peer expense and performance comparisons. The Board considered and discussed numerous factors, including the following:
| | • | The Board considered the services identified below that are provided by the Advisor and the sub-advisor: |
| | | • | The sub-advisor acts as the portfolio manager to the Fund, managing the composition of the portfolio of the Fund, including the purchase, retention, and disposition of portfolio securities in accordance with the Fund’s investment objectives, policies, and restrictions. |
| | | • | The Advisor oversees distribution of the Fund through third-party broker/dealers and independent financial institutions such as Charles Schwab, Inc., Fidelity, TD Waterhouse, and Pershing. The Advisor participates in “no transaction fee” (“NTF”) programs with these companies on behalf of the Fund, which allows customers to purchase the Fund through third-party distribution channels without paying a transaction fee. The Advisor compensates a number of these third-party providers of NTF programs out of its own revenues and not those of the Fund. |
| | | • | The Advisor oversees service providers that support the Fund in providing fund accounting, fund administration, fund distribution, transfer agency, and custodial services. |
| | • | The Board considered that the advisory services to be provided by the Advisor and the sub-advisor are services required for the operation of the Fund. |
| | • | The Board considered the nature and quality of the advisory services offered by the Advisor and the sub-advisor to the Fund. |
| | • | The Board considered that the terms of the advisory and sub-advisory agreements are fair and reasonable. |
| | • | The Board compared the performance of the Fund to benchmark indices over various periods of time and concluded that the positive performance of the Fund warranted the approval of the advisory and sub-advisory agreements. |
| | • | The Board reviewed the Fund’s expense ratio and comparable expense ratios for funds comparable to the Fund. The Board used data from Morningstar showing funds similar in asset size and investment objective to the Fund and determined that the expense ratio of the Fund falls within the range of the ratios of other comparable funds and concluded that the expenses of the Fund were reasonable. |
| | • | The Board considered the fees charged by the Advisor to those of funds similar in asset size and investment objective to the Fund and concluded the advisory fee of the Fund was reasonable and warranted approval of the advisory and sub-advisory agreements. |
| | • | The Board considered the profitability of the Advisor and the sub-advisor with respect to the Fund and concluded the profits were reasonable and not excessive when compared to profitability guidelines set forth in relevant court cases. |
| | • | The Board considered the high level of professionalism and knowledge of the Advisor’s and sub-advisor’s employees, along with an extremely low level of turnover of the employees of the Advisor, and concluded that this was beneficial to the Fund and its shareholders, as it ensures that the Fund is operated efficiently. |
All of the factors above were considered separately by the Board, including the Trustees who are not “interested persons” (as defined in the Investment Company Act of 1940, as amended) of the Fund (the “Independent Trustees”) meeting in an executive session. The factors were viewed in their totality by the Board, with no single factor being the principal or determinative factor in the Board’s determination of whether to approve the advisory and sub-advisory agreements. Based on the factors discussed above, the Board, including all of the Independent Trustees, recommended approval of the advisory and sub-advisory agreements.
HENNESSY FUNDS 1-800-966-4354
For information, questions or assistance, please call
The Hennessy Funds
1-800-966-4354 or 1-415-899-1555
INVESTMENT ADVISOR
Hennessy Advisors, Inc.
7250 Redwood Blvd., Suite 200
Novato, California 94945
ADMINISTRATOR,
TRANSFER AGENT,
DIVIDEND PAYING AGENT &
SHAREHOLDER SERVICING AGENT
U.S. Bancorp Fund Services, LLC
P.O. Box 701
Milwaukee, Wisconsin 53201-0701
CUSTODIAN
U.S. Bank N.A.
Custody Operations
1555 North River Center Dr., Suite 302
Milwaukee, Wisconsin 53212
TRUSTEES
Neil J. Hennessy
Robert T. Doyle
J. Dennis DeSousa
Gerald P. Richardson
COUNSEL
Foley & Lardner LLP
777 East Wisconsin Avenue
Milwaukee, Wisconsin 53202-5306
INDEPENDENT REGISTERED
PUBLIC ACCOUNTING FIRM
KPMG LLP
777 East Wisconsin Avenue
Milwaukee, Wisconsin 53202-5306
DISTRIBUTOR
Quasar Distributors, LLC
615 East Michigan Street
Milwaukee, Wisconsin 53202
hennessyfunds.com | 1-800-966-4354
This report has been prepared for shareholders and may be distributed to
others only if preceded or accompanied by a current prospectus.
SEMI-ANNUAL REPORT
APRIL 30, 2014
HENNESSY JAPAN SMALL CAP FUND
Investor Class HJPSX
hennessyfunds.com | 1-800-966-4354
(This Page Intentionally Left Blank.)
Contents
| Letter to Shareholders | 2 |
| Performance Overview | 4 |
| Financial Statements | |
| Schedule of Investments | 6 |
| Statement of Assets and Liabilities | 11 |
| Statement of Operations | 12 |
| Statements of Changes in Net Assets | 13 |
| Financial Highlights | 14 |
| Notes to the Financial Statements | 16 |
| Expense Example | 23 |
| Proxy Voting | 25 |
| Quarterly Filings on Form N-Q | 25 |
| Householding | 25 |
| Board Approval of Investment Advisory Agreements | 26 |
HENNESSY FUNDS 1-800-966-4354
June 2014
Dear Shareholder:
As we review the first half of the year, we continue to see the same trends as in the recent past, with corporations in both Japan and the U.S. driving shareholder value by making acquisitions, initiating and raising dividends, investing in internal infrastructure, and buying back stock. In fact, the total amount of dividends paid by Japanese companies reached a historic high over the twelve months ended March 31, 2013. I believe we will likely see continued dividend increases from cash-rich companies, and we may also begin to see these firms initiate capital expenditure programs.
Up until this point, there has been no real cost for firms to defer spending, but I do believe there will now be companies that want to improve their margins and will begin spending money to expand their revenue, and may even begin to hire. Once a competitor begins to move in this way, then the cost to defer becomes real for companies. This movement to expansion may well be a catalyst to propel the financial markets. With almost $3 trillion in cash sitting on the sidelines in the U.S. alone, it should help the economic recovery here in the U.S. for companies to begin spending their idle capital, which will likely have ripple effects to the Japan market and beyond.
The Japan financial markets were volatile over the past six months ended April 30, 2014, with the Tokyo Price Index, or TOPIX, falling -5.41% (in U.S. Dollar terms) during the period. While the Japanese market started the period on a positive note as a result of constructive economic developments in Japan and overseas, the market recorded negative returns for the overall six-month period ended April 30, 2014. This was due in large part to profit taking by investors following the surging Japanese market in 2013, and also due to concerns over the economies of developing countries and the instability of their currencies, the appreciation of the yen, growing tensions in Ukraine, and the volatile global economy.
On April 1, Japan’s long-anticipated consumption tax increase took effect, raising the tax by three percent to eight percent. Initial reports suggest that the impact from the rise in taxes has been muted, which has put investors’ minds at ease. Longer term economic indicators suggest that the benefits of Prime Minister Abe’s aggressive monetary and fiscal policies, referred to as “Abenomics,” are spreading and gaining traction. While many investors may now have concerns about the third arrow of Abenomics, which is the growth strategy, I believe that cyclical recovery will continue in Japan for the next few years with or without the growth strategy. Corporate balance sheets were strengthened significantly over recent years, which allowed Japanese companies to stay competitive at much higher currency rates, and I believe Japanese corporations will likely maintain their growth momentum irrespective of any future movement of the yen. With favorable top line and bottom line results, I expect many companies to further grow their cash flow, which can stimulate future capital expenditures and which is sorely needed following two decades of underinvestment. The trickle-down effect should benefit many domestic Japanese industries and has the potential to create a positive economic cycle for years to come.
I believe that Japanese investors, including pensions and individuals, will finally start investing in the domestic equity market, which should support the normalization of the valuation of the Japanese equity market and undervalued names. The Japanese private sector is holding historically high financial assets, with cash and cash deposits held by corporations and individuals at $2.1 trillion and $8.7 trillion, respectively. This money on
the sidelines represents approximately two times the size of Japan’s total equity market cap. This liquidity has never been invested, which was a smart decision made by investors in the deflationary environment of the past.
The Japanese government is creating a private pension plan modeled on the Individual Retirement Account, or IRA, in the U.S. IRAs were introduced in the U.S. in 1974 to encourage individuals to invest by introducing tax breaks. Assets in U.S. IRA accounts grew 80-fold over 20 years, from $6.8 billion in 1980 to $5.4 trillion in 2010. In 1980, bank deposits accounted for 82% of U.S. IRA assets, and today they account for just 10%. In 1980, mutual funds accounted for just 3% of U.S. IRA assets, and today they account for 46%. With this new government program, I strongly believe that a large structural shift from bank deposits into equities is likely to occur in Japan, much like it did in the U.S. This in turn should help to drive the growth of the Japanese equity markets.
I am confident that even with all the hurdles facing corporations both in the U.S. and Japan, companies will continue to provide value for their shareholders. To me, that means the financial markets are in good shape and should remain strong moving forward. I also believe that the next few months may be volatile for the worldwide economy and the financial markets. After over 35 years in the business, I still firmly believe the best way to position your portfolio is by investing in good companies over the long term, rather than trying to buy the next hot idea at exactly the right time. At Hennessy Funds, hunches and fads have no place in our investment process, and we understand that successful investing comes from time in the market, not timing the market.
We remain focused on investing based on proven fundamentals, and we are committed to managing money for the sole benefit of our shareholders. If you have any questions or want to speak with us directly, please don’t hesitate to call us at (800) 966-4354.
Best regards,
Neil J. Hennessy
President and Chief Investment Officer
Past performance does not guarantee future results.
Mutual fund investing involves risk. Principal loss is possible.
Opinions expressed are those of Neil Hennessy and are subject to change, are not guaranteed and should not be considered investment advice.
The Tokyo Price Index (TOPIX) is a market capitalization-weighted index of all companies listed on the First Section of the Tokyo Stock Exchange. One cannot invest directly in an index.
Cash flow can be used as an indication of a company’s financial strength and represents earnings before depreciation, amortization, and non-cash charges.
HENNESSY FUNDS 1-800-966-4354
Performance Overview (Unaudited)
The opinions expressed in the following commentary reflect those of the Portfolio Managers as of the date written. Any such opinions are subject to change based on market or other conditions and are not guaranteed. These opinions may not be relied upon as investment advice. Investment decisions for the Fund are based on several factors, and may not be relied upon as an indication of trading intent on behalf of the Fund. Security positions can and do change.
AVERAGE ANNUAL TOTAL RETURN PERIODS ENDED APRIL 30, 2014*
| | | | | Since |
| | Six | One | Five | Inception |
| | Months(1) | Year | Years | (8/31/07) |
| Hennessy Japan Small Cap Fund – | | | | |
| Investor Class (HJPSX) | 5.20% | 8.73% | 18.60% | 7.82% |
| Russell/Nomura Small Cap Index | -3.56% | -1.74% | 11.64% | 3.05% |
| Tokyo Price Index (TOPIX) | -5.41% | -3.08% | 8.27% | -0.89% |
Expense ratio: 2.40%
Performance data quoted represents past performance; past performance does not guarantee future results. The investment return and principal value of an investment will fluctuate so that an investor’s shares, when redeemed, may be worth more or less than their original cost. Current performance of the Fund may be lower or higher than the performance quoted. Performance data current to the most recent month end may be obtained by visiting hennessyfunds.com.
The expense ratio presented is from the most recent prospectus.
(1) Periods less than one year are not annualized.
PERFORMANCE NARRATIVE
SPARX ASSET MANAGEMENT CO., LTD, SUB-ADVISOR
Portfolio Managers Tadahiro Fujimura, CFA and CMA, and Hidehiro Moriya, SPARX Asset Management Co., Ltd. (sub-advisor)
Over the previous six months, how did the Fund perform and what factors contributed to this performance?
For the six-month period ended April 30, 2014, the Hennessy Japan Small Cap Fund returned 5.20%, significantly outperforming the Russell/Nomura Small Cap™ Index, the Tokyo Price Index (TOPIX), and the Morningstar Japan Category Average, which returned -3.56%, -5.41%, and -4.31% for the same period, respectively.
The largest positive contributors to the Fund’s performance among the 33 TOPIX sub-industries were shares of electronic appliance makers, machinery manufacturers, and retailers. Conversely, shares of securities and commodities dealers, auto-related firms, and information and communication-related firms performed negatively.
Among the strongest performing stocks in the Fund were shares of Yamaichi Electronics Co., Ltd., a leading manufacturer of integrated circuit sockets, Bic Camera, Inc., the second largest consumer electronics retailer, and S Foods, Inc., a manufacturer and retailer of meat products. Yamaichi Electronics Co., Ltd. developed an ultra slim, multi-layer printed circuit board, which is 30% thinner than its existing product and will be adopted in smartphones. Shares of Yamaichi Electronics Co., Ltd. advanced over 68% on news that this product will be produced in large quantities beginning this fall. Shares of Bic Camera, Inc. surged over 54% due to firm sales even after the consumption tax hike in April. Shares of S Foods, Inc. jumped over 38% due to strong earnings results for its fiscal year ended February 28, 2014. The Fund no longer holds Yamaichi Electronics Co., Ltd.
Conversely, the major detractors from the Fund’s performance were Tokai Tokyo Financial Holdings, Inc., a mid-sized securities firm, T.RAD Co., Ltd., a comprehensive manufacturer of heat exchangers, and Nichicon Corporation, a major global manufacturer of capacitors. Shares of Tokai Tokyo Financial Holdings, Inc. fell 16% on concerns over the decline in revenues from commissions, as the stock markets were sluggish. Shares of T.RAD Co., Ltd. fell 14% after the firm lowered its earnings forecast for its fiscal year ended March 31, 2014. Finally, shares of Nichicon Corporation fell 26% on concerns over the strong Yen’s negative impact on earnings for its fiscal year ending March 31, 2015. The Fund no longer owns T.RAD Co., Ltd. or Nichicon Corporation.
Additional Portfolio Manager commentary and related investment outlook:
As move into the second half of 2014, we will continue to invest primarily in companies with strong growth potential. In addition, we will also focus on consumption-related companies and real estate companies whose share prices have stagnated due to concerns about the negative impact of the consumption tax increase, which was implemented on April 1, 2014. Furthermore, we will weigh the benefits of investing in low liquidity stocks, because we expect retail investors to regain their appetite for investing in these companies.
The Russell/Nomura Small Cap™ Index contains the bottom 15% of the Russell/Nomura Total Market™ Index, which contains the top 98% of all stocks listed on Japan’s stock exchange and registered on Japan’s OTC market in terms of market capitalization. The Tokyo Price Index (TOPIX) is a market capitalization-weighted index of all companies listed on the First Section of the Tokyo Stock Exchange. The Russell/Nomura Small Cap™ and TOPIX indices are presented in U.S. dollar terms and take into account reinvestment of dividends. You cannot invest directly in an index. Performance data for an index does not reflect any deductions for fees, expenses or taxes. The Fund invests in small- and medium-capitalization companies, which may have limited liquidity and greater price volatility than large-capitalization companies. Investments in foreign securities involve greater volatility and political, economic and currency risk and differences in accounting methods. The Fund may invest in IPOs, which may fluctuate considerably due to the absence of a prior public market and may have a magnified impact on the Fund. References to specific securities should not be considered a recommendation to buy or sell any security. Fund holdings and sector allocations are subject to change. Please refer to the Schedule of Investments included in this report for additional portfolio information.
Each Morningstar category average represents a universe of funds with similar investment objectives. © Morningstar, Inc. All Rights Reserved. The information contained herein: 1) is proprietary to Morningstar; 2) may not be copied or distributed and 3) is not warranted to be accurate, complete or timely. Neither Morningstar nor its content providers are responsible for any damages or losses arising from any use of this information. Past performance does not guarantee future results.
HENNESSY FUNDS �� 1-800-966-4354
Schedule of Investments
HENNESSY JAPAN SMALL CAP FUND
As of April 30, 2014 (Unaudited)
(% of Net Assets)
| | TOP TEN HOLDINGS (EXCLUDING CASH/CASH EQUIVALENTS) | % NET ASSETS |
| | Bic Camera, Inc. | 2.74% |
| | S Foods, Inc. | 2.57% |
| | Sumida Corp. | 2.50% |
| | Okamura Corp. | 2.42% |
| | Information Services International – Dentsu, Ltd. | 2.39% |
| | Fujibo Holdings, Inc. | 2.31% |
| | Towa Corp. | 2.24% |
| | Nittoku Engineering Co., Ltd. | 2.18% |
| | SBS Holdings, Inc. | 2.17% |
| | Seiren Co., Ltd. | 2.16% |
Note: For presentation purposes, the Fund has grouped some of the industry categories. For purposes of categorizing securities for compliance with Section 8(b)(1) of the Investment Company Act of 1940, the Fund uses more specific industry classifications.
| | COMMON STOCKS – 96.45% | | Number | | | | | | % of | |
| | | | of Shares | | | Value | | | Net Assets | |
| | Consumer Discretionary – 27.09% | | | | | | | | | |
| | Ahresty Corp. | | | 35,000 | | | $ | 297,932 | | | | 1.91 | % |
| | Alpen Co., Ltd. | | | 9,000 | | | | 165,813 | | | | 1.06 | % |
| | Bic Camera, Inc. | | | 58,500 | | | | 426,687 | | | | 2.74 | % |
| | Doshisha Co., Ltd. | | | 18,700 | | | | 280,378 | | | | 1.80 | % |
| | Eagle Industry Co. | | | 15,000 | | | | 237,417 | | | | 1.52 | % |
| | Faltec Co., Ltd. | | | 7,000 | | | | 246,808 | | | | 1.59 | % |
| | Fujibo Holdings, Inc. | | | 156,000 | | | | 359,128 | | | | 2.31 | % |
| | Hagihara Industries, Inc. | | | 8,800 | | | | 116,489 | | | | 0.75 | % |
| | Haseko Corp. | | | 44,500 | | | | 281,807 | | | | 1.81 | % |
| | Komeri Co., Ltd. | | | 12,000 | | | | 324,939 | | | | 2.09 | % |
| | Nissei Build Kogyo Co., Ltd. | | | 140,000 | | | | 315,781 | | | | 2.03 | % |
| | Sankyo Seiko Co. | | | 79,000 | | | | 272,863 | | | | 1.75 | % |
| | Seiren Co., Ltd. | | | 40,100 | | | | 336,925 | | | | 2.16 | % |
| | SNT Corp. | | | 61,100 | | | | 245,667 | | | | 1.58 | % |
| | Starts Corp., Inc. | | | 12,000 | | | | 151,762 | | | | 0.97 | % |
| | Studio Alice Co., Ltd. | | | 11,400 | | | | 158,526 | | | | 1.02 | % |
| | | | | | | | | 4,218,922 | | | | 27.09 | % |
| | | | | | | | | | | | | | |
| | Consumer Staples – 2.57% | | | | | | | | | | | | |
| | S Foods, Inc. | | | 30,000 | | | | 400,405 | | | | 2.57 | % |
| | | | | | | | | | | | | | |
| | Energy – 0.57% | | | | | | | | | | | | |
| | Itochu Enex Co., Ltd. | | | 15,900 | | | | 89,275 | | | | 0.57 | % |
| | | | | | | | | | | | | | |
| | Financials – 3.79% | | | | | | | | | | | | |
| | The Tochigi Bank, Inc. | | | 86,000 | | | | 335,249 | | | | 2.15 | % |
| | Tokai Tokyo Financial Holdings, Inc. | | | 38,000 | | | | 255,303 | | | | 1.64 | % |
| | | | | | | | | 590,552 | | | | 3.79 | % |
| | | | | | | | | | | | | | |
| | Industrials – 32.48% | | | | | | | | | | | | |
| | Anest Iwata Corp. | | | 55,000 | | | | 332,623 | | | | 2.14 | % |
| | Central Glass Co., Ltd. | | | 101,000 | | | | 331,212 | | | | 2.13 | % |
| | Hanwa Co., Ltd. | | | 55,000 | | | | 215,119 | | | | 1.38 | % |
| | Hitachi Zosen Corp. | | | 49,500 | | | | 242,876 | | | | 1.56 | % |
| | Japan Pulp & Paper Co., Ltd. | | | 49,000 | | | | 166,905 | | | | 1.07 | % |
| | Kato Works Co., Ltd. | | | 30,000 | | | | 173,029 | | | | 1.11 | % |
| | Kito Corp. | | | 12,600 | | | | 231,031 | | | | 1.48 | % |
| | Kitz Corp. | | | 65,900 | | | | 311,185 | | | | 2.00 | % |
The accompanying notes are an integral part of these financial statements.
HENNESSY FUNDS 1-800-966-4354
| | COMMON STOCKS | | Number | | | | | | % of | |
| | | | of Shares | | | Value | | | Net Assets | |
| | Industrials (Continued) | | | | | | | | | |
| | Kondotec, Inc. | | | 35,700 | | | $ | 243,942 | | | | 1.57 | % |
| | Kyosan Electric Manufacturing Co., Ltd. | | | 84,000 | | | | 290,536 | | | | 1.87 | % |
| | Miyaji Engineering Group, Inc. | | | 120,000 | | | | 267,859 | | | | 1.72 | % |
| | Nittoku Engineering Co., Ltd. | | | 39,500 | | | | 340,294 | | | | 2.18 | % |
| | Okamura Corp. | | | 44,000 | | | | 376,381 | | | | 2.42 | % |
| | Prestige International, Inc. | | | 23,700 | | | | 222,419 | | | | 1.43 | % |
| | SBS Holdings, Inc. | | | 20,000 | | | | 338,642 | | | | 2.17 | % |
| | Shin Nippon Air Technologies Co., Ltd. | | | 30,100 | | | | 184,233 | | | | 1.18 | % |
| | Teikoku Electric Manufacturing Co., Ltd. | | | 5,600 | | | | 159,527 | | | | 1.02 | % |
| | Tocalo Co., Ltd. | | | 19,900 | | | | 311,115 | | | | 2.00 | % |
| | Tomoe Engineering Co., Ltd. | | | 20,200 | | | | 318,605 | | | | 2.05 | % |
| | | | | | | | | 5,057,533 | | | | 32.48 | % |
| | | | | | | | | | | | | | |
| | Information Technology – 22.49% | | | | | | | | | | | | |
| | Aiphone Co., Ltd. | | | 14,600 | | | | 238,678 | | | | 1.53 | % |
| | Asahi Net, Inc. | | | 30,700 | | | | 140,770 | | | | 0.90 | % |
| | Dai-ichi Seiko Co. | | | 25,000 | | | | 317,839 | | | | 2.04 | % |
| | Elecom Co., Ltd. | | | 15,000 | | | | 270,918 | | | | 1.74 | % |
| | Hakuto Co., Ltd. | | | 19,900 | | | | 183,721 | | | | 1.18 | % |
| | Information Services International – Dentsu, Ltd. | | | 29,800 | | | | 372,774 | | | | 2.39 | % |
| | Iriso Electronics | | | 4,500 | | | | 226,498 | | | | 1.46 | % |
| | Macnica, Inc. | | | 5,400 | | | | 160,116 | | | | 1.03 | % |
| | Panasonic Industrial Devices SUNX Co., Ltd. | | | 35,000 | | | | 158,474 | | | | 1.02 | % |
| | SIIX Corp. | | | 13,900 | | | | 204,110 | | | | 1.31 | % |
| | Sumida Corp. | | | 64,400 | | | | 388,374 | | | | 2.50 | % |
| | Towa Corp. | | | 68,700 | | | | 349,044 | | | | 2.24 | % |
| | Transcosmos, Inc. | | | 10,000 | | | | 186,432 | | | | 1.20 | % |
| | Yokowo Co., Ltd. | | | 61,100 | | | | 304,000 | | | | 1.95 | % |
| | | | | | | | | 3,501,748 | | | | 22.49 | % |
| | | | | | | | | | | | | | |
| | Materials – 7.46% | | | | | | | | | | | | |
| | Chuetsu Pulp & Paper Co., Ltd. | | | 126,000 | | | | 237,231 | | | | 1.52 | % |
| | Daiken Corp. | | | 100,000 | | | | 244,621 | | | | 1.57 | % |
| | Hakudo Co., Ltd. | | | 18,000 | | | | 157,293 | | | | 1.01 | % |
| | Harima Chemicals Group, Inc. | | | 500 | | | | 2,151 | | | | 0.02 | % |
| | Tomoku Co., Ltd. | | | 94,000 | | | | 252,472 | | | | 1.62 | % |
The accompanying notes are an integral part of these financial statements.
| | COMMON STOCKS | | Number | | | | | | % of | |
| | | | of Shares | | | Value | | | Net Assets | |
| | Materials (Continued) | | | | | | | | | |
| | Yushiro Chemical Industry Co., Ltd. | | | 26,600 | | | $ | 268,288 | | | | 1.72 | % |
| | | | | | | | | 1,162,056 | | | | 7.46 | % |
| | | | | | | | | | | | | | |
| | Total Common Stocks | | | | | | | | | | | | |
| | (Cost $13,404,200) | | | | | | | 15,020,491 | | | | 96.45 | % |
| | | | | | | | | | | | | | |
| | SHORT-TERM INVESTMENTS – 2.92% | | | | | | | | | | | | |
| | Money Market Funds – 2.92% | | | | | | | | | | | | |
| | Fidelity Government Portfolio – | | | | | | | | | | | | |
| | Institutional Class, 0.01% (a) | | | 454,012 | | | | 454,012 | | | | 2.92 | % |
| | | | | | | | | | | | | | |
| | Total Money Market Funds | | | | | | | | | | | | |
| | (Cost $454,012) | | | | | | | 454,012 | | | | 2.92 | % |
| | | | | | | | | | | | | | |
| | Total Short-Term Investments | | | | | | | | | | | | |
| | (Cost $454,012) | | | | | | | 454,012 | | | | 2.92 | % |
| | | | | | | | | | | | | | |
| | Total Investments | | | | | | | | | | | | |
| | (Cost $13,858,212) – 99.37% | | | | | | | 15,474,503 | | | | 99.37 | % |
| | Other Assets in Excess | | | | | | | | | | | | |
| | of Liabilities – 0.63% | | | | | | | 97,440 | | | | 0.63 | % |
| | TOTAL NET ASSETS – 100.00% | | | | | | $ | 15,571,943 | | | | 100.00 | % |
Percentages are stated as a percent of net assets.
| (a) | The rate listed is the fund’s 7-day yield as of April 30, 2014. |
The accompanying notes are an integral part of these financial statements.
HENNESSY FUNDS 1-800-966-4354
Summary of Fair Value Exposure at April 30, 2014
The following is a summary of the inputs used to value the Fund’s net assets as of April 30, 2014 (See Note 3 in the accompanying notes to the financial statements):
| Common Stock | | Level 1 | | | Level 2 | | | Level 3 | | | Total | |
| Consumer Discretionary | | $ | — | | | $ | 4,218,922 | | | $ | — | | | $ | 4,218,922 | |
| Consumer Staples | | | — | | | | 400,405 | | | | — | | | | 400,405 | |
| Energy | | | — | | | | 89,275 | | | | — | | | | 89,275 | |
| Financials | | | — | | | | 590,552 | | | | — | | | | 590,552 | |
| Industrials | | | — | | | | 5,057,533 | | | | — | | | | 5,057,533 | |
| Information Technology | | | — | | | | 3,501,748 | | | | — | | | | 3,501,748 | |
| Materials | | | — | | | | 1,162,056 | | | | — | | | | 1,162,056 | |
| Total Common Stock | | $ | — | | | $ | 15,020,491 | | | $ | — | | | $ | 15,020,491 | |
| Short-Term Investments | | | | | | | | | | | | | | | | |
| Money Market Funds | | $ | 454,012 | | | $ | — | | | $ | — | | | $ | 454,012 | |
| Total Short-Term Investments | | $ | 454,012 | | | $ | — | | | $ | — | | | $ | 454,012 | |
| Total Investments | | $ | 454,012 | | | $ | — | | | $ | — | | | $ | 15,474,503 | |
Transfers between levels are recognized at the end of the reporting period. During the six-month period ended April 30, 2014, the Fund recognized significant transfers between levels.
Transfers between Level 1 and Level 2 relate to the use of a fair valuation pricing service. On days when the fair valuation pricing service is used, non-U.S. dollar denominated securities move from a Level 1 to a Level 2 classification.
The accompanying notes are an integral part of these financial statements.
Financial Statements
Statement of Assets and Liabilities as of April 30, 2014 (Unaudited) |
| ASSETS: | | | |
| Investments in securities, at value (cost $13,858,212) | | $ | 15,474,503 | |
| Dividends and interest receivable | | | 160,390 | |
| Receivable for fund shares sold | | | 12,343 | |
| Receivable for securities sold | | | 122,316 | |
| Prepaid expenses and other assets | | | 14,678 | |
| Total Assets | | | 15,784,230 | |
| | | | | |
| LIABILITIES: | | | | |
| Payable for securities purchased | | | 157,612 | |
| Payable for fund shares redeemed | | | 8,222 | |
| Payable to advisor | | | 15,495 | |
| Payable to administrator | | | 5,436 | |
| Payable to auditor | | | 11,493 | |
| Accrued service fees | | | 1,291 | |
| Accrued trustees fees | | | 4,724 | |
| Accrued expenses and other payables | | | 8,014 | |
| Total Liabilities | | | 212,287 | |
| NET ASSETS | | $ | 15,571,943 | |
| | | | | |
| NET ASSETS CONSIST OF: | | | | |
| Capital stock | | $ | 13,781,875 | |
| Accumulated net investment loss | | | (19,150 | ) |
| Accumulated net realized gain on investments | | | 193,591 | |
| Unrealized net appreciation on investments | | | 1,615,627 | |
| Total Net Assets | | $ | 15,571,943 | |
| | | | | |
| NET ASSETS | | | | |
| Investor Class: | | | | |
| Shares authorized (no par value) | | Unlimited | |
| Net assets applicable to outstanding Investor Class shares | | | 15,571,943 | |
| Shares issued and outstanding | | | 1,604,588 | |
| Net asset value, offering price and redemption price per share | | $ | 9.70 | |
The accompanying notes are an integral part of these financial statements.
HENNESSY FUNDS 1-800-966-4354
Financial Statements
Statement of Operations Six Months Ended April 30, 2014 (Unaudited) |
| INVESTMENT INCOME: | | | |
Dividend income(1) | | $ | 177,644 | |
| Interest income | | | 49 | |
| Total investment income | | | 177,693 | |
| | | | | |
| EXPENSES: | | | | |
| Investment advisory fees | | | 92,790 | |
| Sub-transfer agent expenses – Investor Class (See Note 5) | | | 16,235 | |
| Administration, fund accounting, custody and transfer agent fees | | | 15,465 | |
| Federal and state registration fees | | | 11,609 | |
| Compliance expense | | | 10,655 | |
| Audit fees | | | 9,571 | |
| Service fees – Investor Class (See Note 5) | | | 7,732 | |
| Trustees’ fees and expenses | | | 6,793 | |
| Reports to shareholders | | | 2,753 | |
| Legal fees | | | 2,480 | |
| Interest expense (See Note 6) | | | 89 | |
| Other expenses | | | 3,916 | |
| Total expenses | | | 180,088 | |
| NET INVESTMENT LOSS | | $ | (2,395 | ) |
| | | | | |
| REALIZED AND UNREALIZED GAINS: | | | | |
| Net realized gain on investments | | $ | 353,014 | |
| Change in unrealized appreciation on investments | | | 368,084 | |
| Net gain on investments | | | 721,098 | |
| NET INCREASE IN NET ASSETS RESULTING FROM OPERATIONS | | $ | 718,703 | |
| (1) | Net of foreign taxes withheld of $30,981. |
The accompanying notes are an integral part of these financial statements.
Financial Statements
| Statements of Changes in Net Assets |
| | | Six Months Ended | | | | |
| | | April 30, 2014 | | | Year Ended | |
| | | (Unaudited) | | | October 31, 2013 | |
| OPERATIONS: | | | | | | |
| Net investment loss | | $ | (2,395 | ) | | $ | (15,072 | ) |
| Net realized gain on securities | | | 353,014 | | | | 3,128,752 | |
| Change in unrealized appreciation on securities | | | 368,084 | | | | 1,109,483 | |
| Net increase in net assets resulting from operations | | | 718,703 | | | | 4,223,163 | |
| | | | | | | | | |
| DISTRIBUTIONS TO SHAREHOLDERS FROM: | | | | | | | | |
| Net realized gains | | | | | | | | |
| Investor Class | | | (3,229,364 | ) | | | (1,115,069 | ) |
| Total distributions | | | (3,229,364 | ) | | | (1,115,069 | ) |
| | | | | | | | | |
| CAPITAL SHARE TRANSACTIONS: | | | | | | | | |
| Proceeds from shares subscribed – Investor Class | | | 11,334,915 | | | | 23,641,290 | |
| Dividends reinvested – Investor Class | | | 3,179,599 | | | | 1,067,157 | |
| Cost of shares redeemed – Investor Class | | | (11,255,253 | )(1) | | | (18,099,720 | ) |
| Net increase in net assets derived | | | | | | | | |
| from capital share transactions | | | 3,259,261 | | | | 6,608,727 | |
| TOTAL INCREASE IN NET ASSETS | | | 748,600 | | | | 9,716,821 | |
| | | | | | | | | |
| NET ASSETS: | | | | | | | | |
| Beginning of period | | | 14,823,343 | | | | 5,106,522 | |
| End of period | | $ | 15,571,943 | | | $ | 14,823,343 | |
| Undistributed net investment loss, end of period | | $ | (19,150 | ) | | $ | (16,755 | ) |
| | | | | | | | | |
| CHANGES IN SHARES OUTSTANDING: | | | | | | | | |
| Shares sold – Investor Class | | | 1,151,905 | | | | 2,326,376 | |
| Shares issued to holders as reinvestment | | | | | | | | |
| of dividends – Investor Class | | | 340,064 | | | | 121,406 | |
| Shares redeemed – Investor Class | | | (1,154,154 | ) | | | (1,665,417 | ) |
| Net increase in shares outstanding | | | 337,815 | | | | 782,365 | |
| (1) | Net of redemption fees of $47 related to redemption fees imposed by the Fund during a prior year but not received until the six-month period ended April 30, 2014. |
The accompanying notes are an integral part of these financial statements.
HENNESSY FUNDS 1-800-966-4354
Financial Highlights
| Hennessy Japan Small Cap Fund |
For an Investor Class share outstanding throughout each period
| | | Six Months Ended | |
| | | April 30, 2014 | |
| | | (Unaudited) | |
| PER SHARE DATA: | | | |
| Net asset value, beginning of period | | $ | 11.70 | |
| | | | | |
| Income from investment operations: | | | | |
| Net investment income (loss) | | | 0.00 | (2) |
| Net realized and unrealized gains (losses) on securities | | | 0.51 | |
| Total from investment operations | | | 0.51 | |
| | | | | |
| Less distributions: | | | | |
| Dividends from net investment income | | | — | |
| Dividends from net realized gains | | | (2.51 | ) |
| Total distributions | | | (2.51 | ) |
| Paid-in capital from redemption fees | | | — | |
| Net asset value, end of period | | $ | 9.70 | |
| | | | | |
| TOTAL RETURN | | | 5.20 | %(3) |
| | | | | |
| SUPPLEMENTAL DATA AND RATIOS: | | | | |
| Net assets, end of period (millions) | | $ | 15.57 | |
| Ratio of expenses to average net assets: | | | | |
| Before expense reimbursement | | | 2.33 | %(4) |
| After expense reimbursement | | | 2.33 | %(4) |
| Ratio of net investment income (loss) to average net assets: | | | | |
| Before expense reimbursement | | | (0.03 | )%(4) |
| After expense reimbursement | | | (0.03 | )%(4) |
| Portfolio turnover rate | | | 29 | %(3) |
| (1) | The financial highlights set forth for periods prior to September 17, 2009 represent the historical financial highlights of the SPARX Japan Smaller Companies Fund. On September 17, 2009, Hennessy Advisors, Inc. became the investment advisor to the Fund and the Fund changed its name to Hennessy Select SPARX Japan Smaller Companies Fund. In October 2012, the Fund changed its name to Hennessy Japan Small Cap Fund. |
| (2) | Amount is less than $0.01 or $(0.01). |
| (3) | Not annualized. |
| (4) | Annualized. |
The accompanying notes are an integral part of these financial statements.
| Year Ended October 31, | |
| 2013 | | | 2012 | | | 2011 | | | 2010 | | | 2009(1) | |
| | | | | | | | | | | | | | |
| $ | 10.54 | | | $ | 10.09 | | | $ | 9.23 | | | $ | 9.74 | | | $ | 6.87 | |
| | | | | | | | | | | | | | | | | | | |
| | | | | | | | | | | | | | | | | | | |
| | 0.06 | | | | (0.68 | ) | | | 0.06 | | | | 0.00 | (2) | | | 0.07 | |
| | 3.44 | | | | 1.17 | | | | 0.80 | | | | (0.10 | ) | | | 2.80 | |
| | 3.50 | | | | 0.49 | | | | 0.86 | | | | (0.10 | ) | | | 2.87 | |
| | | | | | | | | | | | | | | | | | | |
| | | | | | | | | | | | | | | | | | | |
| | — | | | | (0.04 | ) | | | — | | | | (0.42 | ) | | | — | |
| | (2.34 | ) | | | — | | | | — | | | | — | | | | — | |
| | (2.34 | ) | | | (0.04 | ) | | | — | | | | (0.42 | ) | | | — | |
| | — | | | | — | | | | — | | | | 0.01 | | | | 0.00 | (2) |
| $ | 11.70 | | | $ | 10.54 | | | $ | 10.09 | | | $ | 9.23 | | | $ | 9.74 | |
| | 40.59 | % | | | 4.91 | % | | | 9.32 | % | | | (0.72 | )% | | | 41.78 | % |
| | | | | | | | | | | | | | | | | | | |
| | | | | | | | | | | | | | | | | | | |
| $ | 14.82 | | | $ | 5.11 | | | $ | 24.08 | | | $ | 15.17 | | | $ | 16.20 | |
| | | | | | | | | | | | | | | | | | | |
| | 2.39 | % | | | 2.33 | % | | | 2.10 | % | | | 2.14 | % | | | 3.10 | % |
| | 2.39 | % | | | 2.33 | % | | | 2.10 | % | | | 2.01 | % | | | 1.60 | % |
| | | | | | | | | | | | | | | | | | | |
| | (0.11 | )% | | | (0.66 | )% | | | 0.17 | % | | | (0.14 | )% | | | (0.86 | )% |
| | (0.11 | )% | | | (0.66 | )% | | | 0.17 | % | | | (0.01 | )% | | | 0.64 | % |
| | 141 | % | | | 49 | % | | | 61 | % | | | 100 | % | | | 138 | % |
The accompanying notes are an integral part of these financial statements.
HENNESSY FUNDS 1-800-966-4354
Notes to the Financial Statements
April 30, 2014 (Unaudited)
1). ORGANIZATION
The Hennessy Japan Small Cap Fund (the “Fund”) is a series of Hennessy Funds Trust (the “Trust”), which was organized as a Delaware statutory trust on September 17, 1992. The Fund is an open-end management investment company registered under the Investment Company Act of 1940, as amended. The Fund is a successor to a fund with the same name (the “Predecessor Fund”) that was a series Hennessy SPARX Funds Trust, a Massachusetts business trust, pursuant to a reorganization that took place after the close of business on February 28, 2014. Prior to February 28, 2014, the Fund had no investment operations. As a result of the reorganization, holders of the Investor Class shares of the Predecessor Fund received Investor Class shares of the Fund (the Investor Class shares of the Fund are the successor to the accounting and performance information of the Predecessor Fund). The investment objective of the Fund is long-term capital appreciation. The Fund is a diversified fund, but may employ a relatively focused investment strategy and may hold securities of fewer issuers than other diversified funds.
The Fund offers Investor Class shares. Prior to October 26, 2012, the Investor Class shares were known as Original Class shares.
2). SIGNIFICANT ACCOUNTING POLICIES
The following is a summary of significant accounting policies consistently followed by the Fund in the preparation of the financial statements. These policies are in conformity with U.S. generally accepted accounting principles (“GAAP”).
| a). | Investment Valuation – All investments in securities are recorded at their estimated fair value, as described in Note 3. |
| b). | Federal Income Taxes – Provision for Federal income taxes or excise taxes has not been made since the Fund has elected to be taxed as a “regulated investment company” and intends to distribute substantially all of its taxable income to its shareholders and otherwise comply with the provisions of the Internal Revenue Code of 1986, as amended, applicable to regulated investment companies. Net investment income or loss and realized gains and losses for federal income tax purposes may differ from that reported on the financial statements because of temporary book and tax basis differences. Temporary differences are primarily the result of the treatment of wash sales for tax reporting purposes. Distributions from net realized gains for book purposes may include short-term capital gains, which are included as ordinary income to shareholders for tax purposes. |
| c). | Income and Expenses – Dividend income is recognized on the ex-dividend date or as soon as information is available to the Fund. Interest income, which includes the amortization of premium and accretion of discount, is recognized on an accrual basis. The Fund is charged for those expenses that are directly attributable to the portfolio, such as advisory, administration, and certain shareholder service fees. |
| d). | Distributions to Shareholders – Dividends from net investment income for the Fund, if any, are declared and paid out annually, usually in November or December. Distributions of net realized capital gains, if any, are declared and paid annually, usually in November or December. |
| e). | Security Transactions – Investment and shareholder transactions are recorded on the trade date. The Fund determines the gain or loss realized from the investment transactions by comparing the original cost of the security lot sold with the net sale proceeds. Discounts and premiums on securities purchased are accreted/amortized over the life of the respective security. |
| f). | Use of Estimates – The preparation of financial statements in conformity with GAAP requires management to make estimates and assumptions that affect the reported amounts of assets and liabilities and disclosure of contingent assets and liabilities at the date of the financial statements and the reported change in net assets during the reporting period. Actual results could differ from those estimates. |
| g). | Share Valuation – The net asset value (“NAV”) per share of the Fund is calculated by dividing the sum of the value of the securities held by the Fund, plus cash or other assets, minus all liabilities (including estimated accrued expenses) by the total number of shares outstanding for the Fund, rounded to the nearest cent. The Fund’s shares will not be priced on days the New York Stock Exchange is closed for trading. The offering and redemption price per share for the Fund is equal to the Fund’s net asset value per share. |
| h). | Foreign Currency – Values of investments denominated in foreign currencies, if any, are converted into U.S. dollars using the spot market rate of exchange at the time of valuation. Purchases and sales of investments and income are translated into U.S. dollars using the spot market rate of exchange prevailing on the respective dates of such transactions. The Fund does not isolate the portion of the results of operations resulting from fluctuations in foreign exchange rates on investments from fluctuations resulting from changes in the market prices of securities held. Such fluctuations are included with the net realized and unrealized gain or loss on investments. Foreign investments present additional risks due to currency fluctuations, economic and political factors, lower liquidity, government regulations, differences in accounting standards, and other factors. |
| i). | Forward Contracts – The Fund may enter into forward currency contracts to reduce its exposure to changes in foreign currency exchange rates on its foreign holdings and to lock in the U.S. dollar cost of firm purchase and sale commitments for securities denominated in foreign currencies. A forward currency contract is a commitment to purchase or sell a foreign currency at a future date at a negotiated forward rate. The gain or loss arising from the difference between the U.S. dollar cost of the original contract and the value of the foreign currency in U.S. dollars upon closing of such contract is included in net realized gain or loss from foreign currency transactions. During the six months ended April 30, 2014, the Fund did not enter into any forward contracts. |
| j). | Repurchase Agreements – The Fund may enter into repurchase agreements with member banks or security dealers of the Federal Reserve Board whom the investment advisor deems creditworthy. The repurchase price generally equals the price paid by the Fund plus interest negotiated on the basis of current short-term rates. |
| | Securities pledged as collateral for repurchase agreements are held by the custodian bank until the respective agreements mature. Provisions of the repurchase agreements ensure that the market value of the collateral, including accrued interest thereon, is sufficient in the event of default of the counterparty. If the counterparty defaults and the value of the collateral declines or if the counterparty enters an insolvency proceeding, realization of the collateral by the Fund may be delayed or limited. |
| k). | Accounting for Uncertainty in Income Taxes – The Fund has adopted accounting policies regarding recognition and measurement of tax positions taken or expected to |
HENNESSY FUNDS 1-800-966-4354
| | be taken on a tax return. The Fund has reviewed all open tax years in major jurisdictions and concluded that there is no impact on the Fund’s net assets and no tax liability resulting from unrecognized tax benefits relating to uncertain income tax positions taken or expected to be taken on a tax return. The Fund’s major tax jurisdictions are U.S. Federal and Delaware. As of April 30, 2014, open Federal and state tax years for the Fund include the tax years ended October 31, 2011 through 2013. |
| l). | Derivatives – The Fund may invest in, or enter into, derivatives, such as options, futures contracts, options on futures contracts, and swaps, for a variety of reasons, including to hedge certain risks, to provide a substitute for purchasing or selling particular securities, or to increase potential income gain. Derivatives may provide a cheaper, quicker, or more specifically focused way for a Fund to invest than “traditional” securities would. The main purpose of utilizing these derivative instruments is for hedging purposes. |
| | The Fund has adopted the financial accounting reporting rules as required by the Derivatives and Hedging Topic of the Financial Accounting Standards Board Accounting Standards Codification. Under such rules, the Fund is required to include enhanced disclosure that enables investors to understand how and why an entity uses derivatives, how derivatives are accounted for, and how derivatives instruments affect an entity’s results of operations and financial position. During the six months ended April 30, 2014, the Fund did not hold any derivative instruments. |
| m). | Events Subsequent to the Fiscal Period End – The Fund has adopted financial reporting rules regarding subsequent events that require an entity to recognize in the financial statements the effects of all subsequent events that provide additional evidence about conditions that existed at the date of the balance sheet. Management has evaluated the Fund’s related events and transactions that occurred subsequent to April 30, 2014 through the date of issuance of the Fund’s financial statements. There were no events or transactions that occurred during this period that materially impacted the amounts or disclosures in the Fund’s financial statements. |
3). SECURITIES VALUATION
The Fund has adopted authoritative fair valuation accounting standards that establish an authoritative definition of fair value and set out a hierarchy for measuring fair value. These standards require additional disclosures about the various inputs and valuation techniques used to develop the measurements of fair value and a discussion in changes in valuation techniques and related inputs during the period. These inputs are summarized in the three broad levels listed below:
| | Level 1 – | Quoted unadjusted prices for identical instruments in active markets to which the Fund has access at the date of measurement. |
| | | |
| | Level 2 – | Quoted prices for similar instruments in active markets; quoted prices for identical or similar instruments in markets that are not active; and model-derived valuations in which all significant inputs and significant value drivers are observable in active markets. Level 2 inputs are those in markets for which there are few transactions, the prices are not current, the prices are fair value adjusted due to post-market close subsequent events (foreign markets), little public information exists, or instances where prices vary substantially over time or among brokered market makers. These inputs may also include interest rates, prepayment speeds, credit risk curves, default rates, and similar data. |
| | Level 3 – | Model-derived valuations in which one or more significant inputs or significant value drivers are unobservable. Unobservable inputs are those inputs that reflect the Fund’s own assumptions about what market participants would use to price the asset or liability based on the best available information. |
Following is a description of the valuation techniques applied to the Fund’s major categories of assets and liabilities measured at fair value on a recurring basis.
Equity Securities – Equity securities, including common stocks, preferred stocks, foreign issued common stocks, exchange traded funds, closed-end mutual funds, and real estate investment trusts, that are traded on a securities exchange for which a last-quoted sales price is readily available will be valued at the last sales price as reported by the primary exchange on which the securities are listed. Securities listed on The NASDAQ Stock Market (“NASDAQ”) will be valued at the NASDAQ Official Closing Price, which may differ from the last sales price reported. Securities traded on a securities exchange for which a last-quoted sales price is not readily available will be valued at the mean between the bid and ask prices. To the extent these securities are actively traded and valuation adjustments are not applied, they are classified in Level 1 of the fair value hierarchy.
Investment Companies – Investments in investment companies (e.g., mutual funds and exchange traded funds) are generally priced at the ending NAV provided by the Fund’s service agent and will be classified in Level 1 of the fair value hierarchy.
Debt Securities – Debt securities, including corporate bonds, asset-backed securities, mortgage-backed securities, municipal bonds, U.S. Treasuries, and U.S. government agency issues, are valued at market on the basis of valuations furnished by an independent pricing service that utilizes both dealer-supplied valuations and formula-based techniques. The pricing service may consider recently executed transactions in securities of the issuer or comparable issuers, market price quotations (where observable), bond spreads, and fundamental data relating to the issuer. In addition, the model may incorporate market observable data such as reported sales of similar securities, broker quotes, yields, bids, offers, and reference data. Certain securities are valued principally using dealer quotations. These securities are generally classified in Level 2 of the fair value hierarchy.
Short-Term Securities – Short-term equity investments, including money market funds, are valued in the manner specified above. Short-term debt investments are valued at amortized cost, if their original maturity was 60 days or less, or by amortizing the values as of the 61st day prior to maturity, if their original term to maturity exceeded 60 days. Short-term securities are generally classified in Level 1 or Level 2 of the fair market hierarchy depending on the inputs used and market activity levels for specific securities.
The Board of Trustees of the Fund (the “Board”) has adopted fair value pricing procedures that are followed when a price for a security is not readily available or if a significant event has occurred that indicates the closing price of a security no longer represents the true value of that security. Fair value pricing determinations are made in good faith in accordance with these procedures. There are numerous criteria that will be given consideration in determining a fair value of a security. Some of these criteria are trading volume of security and markets, the value of other like securities, and news events with direct bearing to security or market. Fair value pricing results in an estimated price that reasonably reflects the current market conditions in order to rate the portfolio holdings such that shareholder transactions receive a fair net asset value. Depending on the relative significance of the valuation inputs, these securities may be classified in either Level 2 or Level 3 of the fair value hierarchy.
HENNESSY FUNDS 1-800-966-4354
Fair valuing of foreign securities may be determined with the assistance of a pricing service using correlations between the movement of prices of such securities and indices of domestic securities and other appropriate indicators, such as closing market prices of relevant American Depositary Receipts or futures contracts. The effect of using fair value pricing is that the Fund’s NAV will reflect the affected portfolio securities’ value as determined in the judgment of the Board or its designee instead of being determined by the market. Using a fair value pricing methodology to price foreign securities may result in a value that is different from a foreign security’s most recent closing price and from the prices used by other investment companies to calculate their net asset values and are generally considered Level 2 prices in the fair valuation hierarchy. Because the Fund may invest in foreign securities, the value of the Fund’s portfolio securities may change on days when you will not be able to purchase or redeem your shares.
The Board has delegated day-to-day valuation matters to a Valuation Committee comprised of one or more representatives from Hennessy Advisors, Inc., the Fund’s investment advisor. The function of the Valuation Committee is to value securities where current and reliable market quotations are not readily available. All actions taken by the Valuation Committee are reviewed by the Board.
The Fund has performed an analysis of all existing investments to determine the significance and character of all inputs to their fair value determination. Various inputs are used in determining the value of the Fund’s investments. The inputs or methodology used for valuing securities are not necessarily an indication of the risk associated with investing in those securities. Details related to the fair valuation hierarchy of the Fund’s securities as of April 30, 2014 are included in the Fund’s Schedule of Investments.
4). INVESTMENT TRANSACTIONS
Purchases and sales of investment securities (excluding government and short-term investments) for the Fund during the six months ended April 30, 2014 were $5,133,387 and $4,223,409, respectively.
There were no purchases or sales/maturities of long-term U.S. Government Securities for the Fund during the six months ended April 30, 2014.
5). INVESTMENT MANAGEMENT FEE AND OTHER TRANSACTIONS WITH AFFILIATES
Hennessy Advisors, Inc. (the “Advisor”) is the investment advisor of the Fund. The Advisor provides the Fund with investment management services under an Investment Advisory Agreement. The Advisor furnishes all investment advice, office space, facilities, and provides most of the personnel needed by the Fund. As compensation for its services, the Advisor is entitled to a monthly fee from the Fund. The fee is based upon the average daily net assets of the Fund at the annual rate of 1.20%. The net investment advisory fees payable for the Fund as of April 30, 2014 were $15,495.
The Advisor has delegated the day-to-day management of the Fund to a sub-advisor, SPARX Asset Management Co., Ltd. The Advisor pays the sub-advisor fees for the Fund from its own assets and these fees are not an additional expense of the Fund.
The Board has approved a Shareholder Servicing Agreement for the Fund, which was instituted to compensate the Advisor for the non-investment management services it provides to the Fund. The Shareholder Servicing Agreement provides for a monthly fee paid to the Advisor at an annual rate of 0.10% of the average daily net assets of the Fund. Shareholder servicing fees payable for the Fund as of April 30, 2014 were $1,291.
The Fund has entered into agreements with various brokers, dealers, and financial intermediaries in connection with the sale of shares of the Fund. The agreements provide
for periodic payments by the Fund to the brokers, dealers, and financial intermediaries for providing certain shareholder maintenance services (sub-transfer agent expenses). These shareholder services include the pre-processing and quality control of new accounts, shareholder correspondence, answering customer inquiries regarding account status, and facilitating shareholder telephone transactions. Fees paid by the Fund to various brokers, dealers, and financial intermediaries for the six months ended April 30, 2014 were $16,235.
U.S. Bancorp Fund Services, LLC (“USBFS”) provides the Fund with administrative, fund accounting, and transfer agent services, including all regulatory reporting, and necessary office equipment and personnel. As administrator, USBFS prepares various federal and state regulatory filings, reports, and returns for the Fund; prepares reports and materials to be supplied to the Board; monitors the activities of the Fund’s custodian, transfer agent, and accountants; and coordinates the preparation and payment of the Fund’s expenses and reviews the Fund’s expense accruals. Fees paid to USBFS for the six months ended April 30, 2014 were $15,465.
U.S. Bank, N.A., an affiliate of USBFS, serves as the Fund’s custodian. Quasar Distributors, LLC acts as the Fund’s principal underwriter in a continuous public offering of the Fund’s shares. Quasar Distributors, LLC is an affiliate of USBFS and U.S. Bank, N.A.
6). LINE OF CREDIT
The Fund has a line of credit with the other funds in the Hennessy Funds family of funds (the “Hennessy Funds”) in the amount of the lesser of (i) $100,000,000 or (ii) 33.33% of each Hennessy Fund’s net assets, or 30% for the Hennessy Gas Utility Index Fund and 10% for the Hennessy Balanced Fund, intended to provide short-term financing, if necessary, subject to certain restrictions, in connection with shareholder redemptions. The credit facility is with the Hennessy Funds’ custodian bank, U.S. Bank, N.A. Borrowings under this arrangement bear interest at the bank’s prime rate. During the six months ended April 30, 2014, the Fund had an outstanding average daily balance and a weighted average interest rate of $5,983 and 3.25%, respectively. The maximum amount outstanding for the Fund during the period was $515,000.
7). FEDERAL TAX INFORMATION
As of October 31, 2013, the Fund’s most recent fiscal year end, the components of accumulated earnings (losses) for income tax purposes for the Fund were as follows:
| | Cost of investments for tax purposes | | $ | 13,565,109 | |
| | Gross tax unrealized appreciation | | $ | 1,595,870 | |
| | Gross tax unrealized depreciation | | | (524,715 | ) |
| | Net tax unrealized appreciation/depreciation | | $ | 1,071,155 | |
| | Undistributed ordinary income | | $ | 2,248,979 | |
| | Undistributed long-term capital gains | | | 980,367 | |
| | Total distributable earnings | | $ | 3,229,346 | |
| | Other accumulated gain (loss) | | $ | 228 | |
| | Total accumulated gain (loss) | | $ | 4,300,729 | |
The difference between book-basis and tax-basis unrealized appreciation is attributable primarily to capital loss carry overs, wash sales, and partnership adjustments.
At October 31, 2013, the Fund’s most recent fiscal year end, the Fund had no tax basis capital losses to offset future capital gains.
Capital losses sustained in the year ended October 31, 2012 and in future taxable years will not expire and may be carried over by the Fund without limitation; however,
HENNESSY FUNDS 1-800-966-4354
they will retain the character of the original loss. Furthermore, any losses incurred during those taxable years will be required to be utilized prior to the losses incurred in the pre-enactment taxable years. As a result of this ordering rule, pre-enactment capital loss carryforwards may be more likely to expire unused. Under pre-enactment law, capital losses could be carried forward for eight years, and carried forward as short-term capital losses, irrespective of the character of the original loss.
At October 31, 2013, the Fund did not defer, on a tax basis, any post-December late year ordinary loss deferrals or post-December loss deferrals.
The tax character of distributions paid during fiscal year 2014 (year-to-date) and fiscal year 2013 for the Fund were as follows:
| | | | Six Months Ended | | | Year Ended | |
| | | | April 30, 2014 | | | October 31, 2013 | |
| | Ordinary income | | $ | 2,248,987 | | | $ | — | |
| | Long-term capital gain | | | 980,377 | | | | 1,115,069 | |
| | | | $ | 3,229,364 | | | $ | 1,115,069 | |
8). AGREEMENT AND PLAN OF REORGANIZATION
On December 11, 2013, the Board approved an Agreement and Plan of Reorganization (the “Agreement”), of the Hennessy Japan Small Cap Fund (the “New Fund”), pursuant to which the New Fund would be a successor to the corresponding series of the same name of Hennessy SPARX Funds Trust, a Massachusetts business trust (the “Predecessor Fund”). The Agreement provided for the transfer of assets of the Predecessor Fund to the New Fund and the assumption of the liabilities of the Predecessor Fund by the New Fund. The New Fund had the same investment objective and substantially similar principal investment strategies as the Predecessor Fund. The reorganization was effective as of the close of business on February 28, 2014. The following table illustrates the specifics of the reorganization:
| | | Shares of the New Fund | | | |
| | Predecessor Fund | Issued to Shareholders of | New Fund | Combined | Tax Status |
| | Net Assets | the Predecessor Fund | Net Assets | Net Assets | of Transfer |
| | $16,456,664(1) | 1,713,726 | $16,456,664 | $16,456,664 | Non-taxable |
| | (1) | Included accumulated realized gains and unrealized appreciation in the amounts of $3,437,805 and $1,625,651, respectively. |
Expense Example (Unaudited)
April 30, 2014
As a shareholder of the Fund, you incur two types of costs: (1) transaction costs, including sales charges (loads) on purchase payments, reinvested dividends, or other distributions; redemption fees; and exchange fees; and (2) ongoing costs, including management fees; service fees; and other Fund expenses. This Example is intended to help you understand your ongoing costs (in dollars) of investing in the Fund and to compare these costs with the ongoing costs of investing in other mutual funds. The Example is based on an investment of $1,000 invested at the beginning of the period and held for the entire period from November 1, 2013 through April 30, 2014.
Actual Expenses
The first line of the table below provides information about actual account values and actual expenses. Although the Fund charges no sales loads or transaction fees, you will be assessed fees for outgoing wire transfers, returned checks and stop payment orders at prevailing rates charged by U.S. Bancorp Fund Services, LLC, the Fund’s transfer agent. If you request that a redemption be made by wire transfer, currently a $15.00 fee is charged by the Fund’s transfer agent. IRA accounts will be charged a $15.00 annual maintenance fee. The example below includes, but is not limited to, management fees, shareholder servicing fees, fund accounting, custody, and transfer agent fees. However, the example below does not include portfolio trading commissions and related expenses, and other extraordinary expenses as determined under generally accepted accounting principles. You may use the information in this line, together with the amount you invested, to estimate the expenses that you paid over the period. Simply divide your account value by $1,000 (for example, an $8,600 account value divided by $1,000 = 8.6), then multiply the result by the number in the first line of the table under the heading entitled “Expenses Paid During Period” to estimate the expenses you paid on your account during this period.
Hypothetical Example for Comparison Purposes
The second line of the table below provides information about hypothetical account values and hypothetical expenses based on the Fund’s actual expense ratios and an assumed rate of return of 5% per year before expenses, which is not the Fund’s actual return. The hypothetical account values and expenses may not be used to estimate the actual ending account balance or expenses you paid for the period. You may use this information to compare the ongoing costs of investing in the Fund and other funds. To do so, compare this 5% hypothetical example with the 5% hypothetical examples that appear in the shareholder reports of the other funds. Please note that the expenses shown in the table are meant to highlight your ongoing costs only and do not reflect any transactional costs, such as sales charges (loads), or exchange fees. Therefore, the second line of the table is useful in comparing ongoing costs only, and will not help you determine the relative total costs of owning different funds. In addition, if these transactional costs were included, your costs would have been higher.
HENNESSY FUNDS 1-800-966-4354
| | | | Expenses Paid |
| | Beginning | Ending | During Period(1) |
| | Account Value | Account Value | November 1, 2013 – |
| | November 1, 2013 | April 30, 2014 | April 30, 2014 |
| Investor Class | | | |
| | | | |
| Actual | $1,000.00 | $1,052.00 | $11.85 |
| | | | |
| Hypothetical (5% return | | | |
| before expenses) | $1,000.00 | $1,013.24 | $11.63 |
| (1) | Expenses are equal to the Fund’s annualized expense ratio of 2.33%, multiplied by the average account value over the period, multiplied by 181/365 days (to reflect one-half year period). |
Proxy Voting
A description of the policies and procedures the Fund uses to determine how to vote proxies relating to portfolio securities is available without charge: (1) by calling 1-800-966-4354; (2) on the Hennessy Funds’ website at hennessyfunds.com; or (3) on the U.S. Securities and Exchange Commission’s (the “SEC”) website at www.sec.gov. The Fund’s proxy voting record is available on both the Hennessy Funds’ website at hennessyfunds.com and the SEC’s website at www.sec.gov no later than August 31 for the prior 12 months ending June 30.
Quarterly Filings on Form N-Q
The Fund files its complete schedule of portfolio holdings with the SEC for the first and third quarters of each fiscal year on Form N-Q. The Fund’s Forms N-Q are available on the SEC’s website at www.sec.gov. The Fund’s Forms N-Q may be reviewed and copied at the SEC’s Public Reference Room in Washington, DC and information on the operation of the Public Reference Room may be obtained by calling 1-800-SEC-0330. Information included in the Fund’s Forms N-Q will also be available upon request by calling 1-800-966-4354.
Householding
To help keep the Fund’s costs as low as possible, we generally deliver a single copy of most financial reports and prospectuses to shareholders who share an address, even if the accounts are registered under different names. This process, known as “householding,” does not apply to account statements. You may, of course, request an individual copy of a prospectus or financial report at any time. If you would like to receive separate mailings, please call the Administrator at 1-800-261-6950 or 1-414-765-4124 and we will begin individual delivery within 30 days of your request. If your account is held through a financial institution or other intermediary, please contact them directly to request individual delivery.
HENNESSY FUNDS 1-800-966-4354
Board Approval of Investment Advisory
Agreements
At its meeting on December 4, 2013, the Board of Trustees of the Fund (the “Board”) unanimously approved the investment advisory agreement and sub-advisory agreement of the Fund for an initial period of two years.
The Board reviewed a number of documents, including a memorandum provided by outside legal counsel that described the fiduciary duties of the Board with respect to approving the investment advisory agreement and the relevant factors for consideration, the Advisor’s most recent Form 10-K, a completed questionnaire from the sub-advisor, copies of the advisory and sub-advisory agreements, a fund fact sheet, and peer expense and performance comparisons. The Board considered and discussed numerous factors, including the following:
| | • | The Board considered the services identified below that are provided by the Advisor and the sub-advisor: |
| | | • | The sub-advisor acts as the portfolio manager to the Fund, managing the composition of the portfolio of the Fund, including the purchase, retention, and disposition of portfolio securities in accordance with the Fund’s investment objectives, policies, and restrictions. |
| | | • | The Advisor oversees distribution of the Fund through third-party broker/dealers and independent financial institutions such as Charles Schwab, Inc., Fidelity, TD Waterhouse, and Pershing. The Advisor participates in “no transaction fee” (“NTF”) programs with these companies on behalf of the Fund, which allows customers to purchase the Fund through third-party distribution channels without paying a transaction fee. The Advisor compensates a number of these third-party providers of NTF programs out of its own revenues and not those of the Fund. |
| | | • | The Advisor oversees service providers that support the Fund in providing fund accounting, fund administration, fund distribution, transfer agency, and custodial services. |
| | • | The Board considered that the advisory services to be provided by the Advisor and the sub-advisor are services required for the operation of the Fund. |
| | • | The Board considered the nature and quality of the advisory services offered by the Advisor and the sub-advisor to the Fund. |
| | • | The Board considered that the terms of the advisory and sub-advisory agreements are fair and reasonable . |
| | • | The Board compared the performance of the Fund to benchmark indices over various periods of time and concluded that the positive performance of the Fund warranted the approval of the advisory and sub-advisory agreements. |
| | • | The Board reviewed the Fund’s expense ratio and comparable expense ratios for funds comparable to the Fund. The Board used data from Morningstar showing funds similar in asset size and investment objective to the Fund and determined that the expense ratio of the Fund falls within the range of the ratios of other comparable funds and concluded that the expenses of the Fund were reasonable. |
| | • | The Board considered the fees charged by the Advisor to those of funds similar in asset size and investment objective to the Fund and concluded the advisory fee of the Fund was reasonable and warranted approval of the advisory and sub-advisory agreements. |
| | • | The Board considered the profitability of the Advisor and the sub-advisor with respect to the Fund and concluded the profits were reasonable and not excessive when compared to profitability guidelines set forth in relevant court cases. |
| | • | The Board considered the high level of professionalism and knowledge of the Advisor’s and sub-advisor’s employees, along with an extremely low level of turnover of the employees of the Advisor, and concluded that this was beneficial to the Fund and its shareholders, as it ensures that the Fund is operated efficiently. |
All of the factors above were considered separately by the Board, including the Trustees who are not “interested persons” (as defined in the Investment Company Act of 1940, as amended) of the Fund (the “Independent Trustees”) meeting in an executive session. The factors were viewed in their totality by the Board, with no single factor being the principal or determinative factor in the Board’s determination of whether to approve the advisory and sub-advisory agreements. Based on the factors discussed above, the Board, including all of the Independent Trustees, recommended approval of the advisory and sub-advisory agreements.
HENNESSY FUNDS 1-800-966-4354
(This Page Intentionally Left Blank.)
For information, questions or assistance, please call
The Hennessy Funds
1-800-966-4354 or 1-415-899-1555
INVESTMENT ADVISOR
Hennessy Advisors, Inc.
7250 Redwood Blvd., Suite 200
Novato, California 94945
ADMINISTRATOR,
TRANSFER AGENT,
DIVIDEND PAYING AGENT &
SHAREHOLDER SERVICING AGENT
U.S. Bancorp Fund Services, LLC
P.O. Box 701
Milwaukee, Wisconsin 53201-0701
CUSTODIAN
U.S. Bank N.A.
Custody Operations
1555 North River Center Dr., Suite 302
Milwaukee, Wisconsin 53212
TRUSTEES
Neil J. Hennessy
Robert T. Doyle
J. Dennis DeSousa
Gerald P. Richardson
COUNSEL
Foley & Lardner LLP
777 East Wisconsin Avenue
Milwaukee, Wisconsin 53202-5306
INDEPENDENT REGISTERED
PUBLIC ACCOUNTING FIRM
KPMG LLP
777 East Wisconsin Avenue
Milwaukee, Wisconsin 53202-5306
DISTRIBUTOR
Quasar Distributors, LLC
615 East Michigan Street
Milwaukee, Wisconsin 53202
hennessyfunds.com | 1-800-966-4354
This report has been prepared for shareholders and may be distributed to
others only if preceded or accompanied by a current prospectus.
Item 2. Code of Ethics.
Not applicable for semi-annual reports.
Item 3. Audit Committee Financial Expert.
Not applicable for semi-annual reports.
Item 4. Principal Accountant Fees and Services.
Not applicable for semi-annual reports.
Item 5. Audit Committee of Listed Registrants.
Not applicable to registrants who are not listed issuers (as defined in Rule 10A-3 under the Securities Exchange Act of 1934).
Item 6. Investments.
Schedules of Investments are included as part of the reports to stockholders filed under Item 1 of this report.
Item 7. Disclosure of Proxy Voting Policies and Procedures for Closed-End Management Investment Companies.
Not applicable to open-end investment companies.
Item 8. Portfolio Managers of Closed-End Management Investment Companies.
Not applicable to open-end investment companies.
Item 9. Purchases of Equity Securities by Closed-End Management Investment Company and Affiliated Purchasers.
Not applicable to open-end investment companies.
Item 10. Submission of Matters to a Vote of Security Holders.
None.
Item 11. Controls and Procedures.
| (a) | The Registrant’s President and Treasurer have reviewed the Registrant’s disclosure controls and procedures (as defined in Rule 30a-3(c) under the Investment Company Act of 1940 (the “Act”)) as of a date within 90 days of the filing of this report, as required by Rule 30a-3(b) under the Act and Rules 13a-15(b) or 15d-15(b) under the Securities Exchange Act of 1934. Based on their review, such officers have concluded that the disclosure controls and procedures are effective in ensuring that information required to be disclosed in this report is appropriately recorded, processed, summarized and reported and made known to them by others within the Registrant and by the Registrant’s service provider. |
| (b) | There were no changes in the Registrant’s internal control over financial reporting (as defined in Rule 30a-3(d) under the Act) that occurred during the second fiscal quarter of the period covered by this report that has materially affected, or is reasonably likely to materially affect, the Registrant’s internal control over financial reporting. |
Item 12. Exhibits.
| (a) | (1) Any code of ethics or amendment thereto, that is the subject of the disclosure required by Item 2, to the extent that the registrant intends to satisfy Item 2 requirements through filing of an exhibit. Not applicable. |
(2) A separate certification for each principal executive and principal financial officer pursuant to Rule 30a-2(a) under the Act and Section 302 of the Sarbanes-Oxley Act of 2002. Filed herewith.
(3) Any written solicitation to purchase securities under Rule 23c-1 under the Act sent or given during the period covered by the report by or on behalf of the registrant to 10 or more persons. Not applicable to open-end investment companies.
| (b) | Certifications pursuant to Rule 30a-2(b) under the Act and Section 906 of the Sarbanes-Oxley Act of 2002. Furnished herewith. |
SIGNATURES
Pursuant to the requirements of the Securities Exchange Act of 1934 and the Investment Company Act of 1940, the registrant has duly caused this report to be signed on its behalf by the undersigned, thereunto duly authorized.
(Registrant) Hennessy Funds Trust
By (Signature and Title)* /s/ Neil J. Hennessy
Neil J. Hennessy, President
Date: July 7, 2014
Pursuant to the requirements of the Securities Exchange Act of 1934 and the Investment Company Act of 1940, this report has been signed below by the following persons on behalf of the registrant and in the capacities and on the dates indicated.
By (Signature and Title)* /s/ Neil J. Hennessy
Neil J. Hennessy, President
Date: July 7, 2014
By (Signature and Title)* /s/ Teresa M. Nilsen
Teresa M. Nilsen, Treasurer
Date: July 7, 2014