UNITED STATES
SECURITIES AND EXCHANGE COMMISSION
Washington, D.C. 20549
FORM N-CSR
CERTIFIED SHAREHOLDER REPORT OF REGISTERED
MANAGEMENT INVESTMENT COMPANIES
Investment Company Act file number (811-07168)
Hennessy Funds Trust
(Exact name of registrant as specified in charter)
7250 Redwood Blvd., Suite 200
Novato, CA 94945
(Address of principal executive offices) (Zip code)
Neil J. Hennessy
Hennessy Advisors, Inc.
7250 Redwood Blvd., Suite 200
Novato, CA 94945
(Name and address of agent for service)
800-966-4354
Registrant's telephone number, including area code
Date of fiscal year end: October 31, 2011
Date of reporting period: April 30, 2011
Item 1. Reports to Stockholders.
HENNESSY FUNDS
SEMI-ANNUAL REPORT
APRIL 30, 2011
Hennessy Cornerstone Growth Fund
Hennessy Cornerstone Growth Fund, Series II
Hennessy Focus 30 Fund
Hennessy Cornerstone Large Growth Fund
Hennessy Cornerstone Value Fund
Hennessy Total Return Fund
Hennessy Balanced Fund
Contents
| Letter to shareholders | 1 |
| Performance overview | |
| Hennessy Cornerstone Growth Fund | 4 |
| Hennessy Cornerstone Growth Fund, Series II | 6 |
| Hennessy Focus 30 Fund | 8 |
| Hennessy Cornerstone Large Growth Fund | 10 |
| Hennessy Cornerstone Value Fund | 12 |
| Hennessy Total Return Fund | 14 |
| Hennessy Balanced Fund | 15 |
| Financial statements | |
| Schedules of investments | |
| Hennessy Cornerstone Growth Fund | 17 |
| Hennessy Cornerstone Growth Fund, Series II | 22 |
| Hennessy Focus 30 Fund | 27 |
| Hennessy Cornerstone Large Growth Fund | 32 |
| Hennessy Cornerstone Value Fund | 37 |
| Hennessy Total Return Fund | 43 |
| Schedule of Reverse Repurchase Agreements | 47 |
| Hennessy Balanced Fund | 48 |
| Statements of assets and liabilities | 52 |
| Statements of operations | 54 |
| Statements of changes in net assets | 56 |
| Statement of cash flows – Hennessy Total Return Fund | 63 |
| Financial highlights | |
| Hennessy Cornerstone Growth Fund | 64 |
| Hennessy Cornerstone Growth Fund, Series II | 68 |
| Hennessy Focus 30 Fund | 72 |
| Hennessy Cornerstone Large Growth Fund | 76 |
| Hennessy Cornerstone Value Fund | 80 |
| Hennessy Total Return Fund | 84 |
| Hennessy Balanced Fund | 86 |
| Notes to the financial statements | 89 |
| Expense example | 99 |
| Proxy voting policy | 101 |
| Quarterly Filings on Form N-Q | 101 |
| Directors and Officers | 101 |
| Board approval of continuation | |
| of investment advisory agreements | 102 |
June, 2011
Dear Hennessy Funds Shareholder:
When I last wrote to you, I discussed the themes of low confidence and lack of clarity from Washington that dominated the fiscal year ended October 31, 2010. And here we are, six months into our current fiscal year, and those themes are still front and center and affecting the recovery of our financial markets. We could add the global impact of the earthquake and tsunami in Japan, the political unrest in the Middle East and North Africa, the deadly storms and flooding in the southern part of the U.S. and fires in the state of Texas that all occurred during the last quarter to the events holding back market performance. However, despite all these global and national hurdles, what truly stands out to me is that our markets have been resilient. Through all this negativity, our economy continues to fight its way back to health.
Many developed nations, including the U.S., are grappling with high deficits, stagnant or falling home prices and stubbornly high unemployment rates, and this is causing some investors to fear that growth here in the U.S. is just not on firm footing yet. Many investors do, on the other hand, feel optimistic that an economic recovery is clearly underway, and that can be seen in the strong performance of the major U.S. indices. For example, the Dow Jones Industrial Average and the S&P 500 Indices each returned approximately 16-17% for the six-month period ended April 30, 2011. And, we are once again seeing high-quality stocks, those with strong fundamentals and growth potential, returning to favor and leading the market. I think that this past six-month period can best be characterized as a battle between fear and optimism in the financial markets.
There are some heroes in this battle of fear and optimism, and those definitely include U.S. corporations. Many companies are lean and productive. They have strong balance sheets and are growing stronger each quarter. The facts are that consumer spending is improving and the interest rate environment remains favorable. Here at Hennessy, we believe that the financial markets are still undervalued and are poised for long-term, moderate growth. We are enthusiastic about the outlook for the equity market and believe that it should continue to grow even through this onslaught of negativity.
I honestly believe that the average investor is bewildered by the volatile responses of Wall Street to the ebb-and-flow of what is basic economic data. But Wall Street is not the lone villain in this market drama. Unfortunately, we still don’t have any clear and actionable direction from our leaders in Washington, and in my opinion, this could
HENNESSY FUNDS 1-800-966-4354
continue to hinder economic recovery. Many U.S. companies are making a tremendous amount of money, but they are not hiring to grow their businesses until the rules and regulations and taxes are clearly laid out. How can the market make a strong recovery if Business and the Investor are sidelined by uncertainty and fear?
I would like to answer that. At Hennessy, we use history as our guide to running a business and to investing. I believe that the solution to many of our economic problems is not very complex. Throughout our history, the United States has not been a nation of “savers.” We are consumers. I believe that if taxes were lowered, average Americans would have more money in their pockets, and they may feel more comfortable spending. That increase in demand would cause a need for a rise in inventories, and companies would need to supply those inventories by increasing production, which of course, means hiring and job growth.
Even without lowered taxes the economy is forging ahead. The majority of companies continue to navigate through the mine field of uncertainty, while still making plenty of money for their shareholders. I believe that with strong leadership and clarity from our government, companies should begin to gain confidence, to reinvest in their business models, and most importantly to hire, which should lead to an expanded and sustainable economic recovery.
When I hear our elected officials discuss “Too Big to Fail” when describing our financial institutions, I am in dismay. The U.S. Government is following the exact path that these financial companies took to their eventual demise. These financial firms leveraged themselves to the hilt (think growing U.S. deficit) by continuing to borrow, and then they were bailed out by TARP. I am here to tell you that there is no TARP for the U.S. Government; rather the bailout will come in the form of an increased burden on each of us taxpayers.
Despite the continued fear and uncertainty in the current markets, I continue to fall on the side of optimism and I believe the recovery is real and should just get stronger as we, as a nation, address the issues facing us. As always, we will continue to manage money for the long term, in the sole interest of our shareholders. At Hennessy Funds, we pride ourselves on serving each of our investors directly, so please don’t ever hesitate to contact us at 800-966-4354 if we can answer any questions or can be of service.
Best regards,
Neil J. Hennessy
Portfolio Manager & Chief Investment Officer
LETTER TO SHAREHOLDERS
Past performance does not guarantee future results.
Mutual fund investing involves risk. Principal loss is possible.
Opinions expressed are those of Neil Hennessy and are subject to change, are not guaranteed and should not be considered investment advice.
The Dow Jones Industrial Average and S&P 500 are unmanaged indices commonly used to measure performance of U.S. stocks and assume reinvestment of dividends. You cannot invest directly in an index.
HENNESSY FUNDS 1-800-966-4354
Hennessy Cornerstone Growth Fund
Original Class Shares (HFCGX)
AVERAGE ANNUAL TOTAL RETURN PERIODS ENDED APRIL 30, 2011
| | Six | One | Five | Ten |
| | Months | Year | Years | Years |
| Hennessy Cornerstone | | | | |
| Growth Fund – Original Class | 20.04% | 16.42% | -6.44% | 4.81% |
| Russell 2000 Index | 23.73% | 22.20% | 3.89% | 7.34% |
| S&P 500 Index | 16.36% | 17.22% | 2.95% | 2.82% |
Gross expense ratio: 1.34%
Performance data quoted represents past performance; past performance does not guarantee future results. The investment return and principal value of an investment will fluctuate so that an investor’s shares, when redeemed, may be worth more or less than their original cost. Current performance of the Fund may be lower or higher than the performance quoted. Performance data current to the most recent month end may be obtained by visiting www.hennessyfunds.com. The gross expense ratio presented is that from the most recent prospectus.
PERFORMANCE NARRATIVE
The Hennessy Cornerstone Growth Fund returned 20.04% for the six-month period ended April 30, 2011, underperforming its benchmark, the Russell 2000 Index, which returned 23.73%, but outperforming the S&P 500 Index, which returned 16.36%, for the same period. Prior to its rebalance in the winter, the Fund underperformed the benchmark and after the rebalance it has subsequently outperformed the benchmark. Before the rebalance took place, we had a positive allocation effect led by the portfolio’s overweight position in the Energy sector and underweight position in the Financial sector. This was offset by individual stock selection within the portfolio, which dragged down its relative returns. Prior to the rebalance, the best performing stock was American Axel & Manufacturing Holdings (AXL), which issued a better than expected Q3 ‘10 earnings report, while the worst performer was Global Cash Access Holdings (GCA), as the company delivered weak earnings for Q3 and lowered guidance going forward. Post-rebalance, the Fund’s relative outperformance versus its benchmark was driven largely by security selection. We had a slight underperformance to the benchmark due to an overweight allocation to the Consumer Discretionary sector and an underweight position in the Health Care sector, but this was more than made up for by the positive contribution from security selection. The top performing company after the rebalance was Sauer-Danfoss (SHS), which rose sharply after strong Q4 ‘10 earnings, while the worst performing stock was CPI Corp. (CPY), which issued a worse than expected earnings for Q4 ‘10. In general, stocks within the Energy, Materials and Industrial sectors were positive contributors to relative returns.
PERFORMANCE REVIEW — HENNESSY CORNERSTONE GROWTH FUND
Hennessy Cornerstone Growth Fund
Institutional Class Shares (HICGX)
AVERAGE ANNUAL TOTAL RETURN PERIODS ENDED APRIL 30, 2011
| | Six | | Since Inception |
| | Months | One Year | (3/3/08) |
| Hennessy Cornerstone | | | |
| Growth Fund – Institutional Class | 20.25% | 16.87% | -2.23% |
| Russell 2000 Index | 23.73% | 22.20% | 9.26% |
| S&P 500 Index | 16.36% | 17.22% | 3.02% |
Gross expense ratio: 1.09%. Net expense ratio: 0.98%. The expense ratio is contractually capped at 0.98% indefinitely.
Performance data quoted represents past performance; past performance does not guarantee future results. The investment return and principal value of an investment will fluctuate so that an investor’s shares, when redeemed, may be worth more or less than their original cost. Current performance of the Fund may be lower or higher than the performance quoted. Performance data current to the most recent month end may be obtained by visiting www.hennessyfunds.com. Investment performance reflects fee waivers in effect. In the absence of such waivers, total return would be reduced. The expense ratios presented are that from the most recent prospectus.
The S&P 500 Index and Russell 2000 Index are unmanaged indices commonly used to measure the performance of U.S. Stocks. You cannot invest directly in an index. Small and medium-capitalization companies tend to have limited liquidity and greater price volatility than large-capitalization companies. Investments in foreign securities involve greater volatility and political, economic and currency risk and differences in accounting methods. References to specific securities should not be considered a recommendation to buy or sell any security. Fund holdings and sector allocations are subject to change. Please refer to the included Schedule of Investments.
HENNESSY FUNDS 1-800-966-4354
Hennessy Cornerstone Growth Fund, Series II
Original Class Shares (HENLX)
AVERAGE ANNUAL TOTAL RETURN PERIODS ENDED APRIL 30, 2011
| | Six | One | Five | Since Inception |
| | Months | Year | Years | (7/1/05) |
| Hennessy Cornerstone Growth | | | | |
| Fund, Series II – Original Class | 21.02% | 19.39% | -8.24% | -3.24% |
| Russell 2000 Growth Index | 27.07% | 30.29% | 5.14% | 8.11% |
| S&P 500 Index | 16.36% | 17.22% | 2.95% | 4.44% |
Gross expense ratio: 1.62%.
Performance data quoted represents past performance; past performance does not guarantee future results. The investment return and principal value of an investment will fluctuate so that an investor’s shares, when redeemed, may be worth more or less than their original cost. Current performance of the Fund may be lower or higher than the performance quoted. Performance data current to the most recent month end may be obtained by visiting www.hennessyfunds.com. The gross expense ratio presented is that from the most recent prospectus.
PERFORMANCE NARRATIVE
The Hennessy Cornerstone Growth Fund, Series II returned 21.02% for the six-month period ended April 30, 2011, underperforming its benchmark, the Russell 2000 Growth Index, which returned 27.07%, but outperforming the S&P 500 Index, which returned 16.36%, for the same period. Security selection in the Consumer Discretionary and Telecommunications Services sectors drove the strong performance but was offset relative to the benchmark with weaker security selection in the Information Technology and Financial sectors. The Fund’s overweight allocation to Industrials and underweight allocation to Information Technology also contributed to a lag in relative performance. The best performing stock in the Fund was IDT Corp (IDT), which was up over 100% due to better than expected Q1 ‘11 earnings released in December. The worst performing stock in the Fund was Lionbridge Technologies (LIOX), which was down nearly -33% after missing earnings estimates for Q3 ‘10.
PERFORMANCE REVIEW — HENNESSY CORNERSTONE GROWTH FUND, SERIES II
Hennessy Cornerstone Growth Fund, Series II
Institutional Class Shares (HINLX)
AVERAGE ANNUAL TOTAL RETURN PERIODS ENDED APRIL 30, 2011
| | Six | | Since Inception |
| | Months | One Year | (3/3/08) |
| Hennessy Cornerstone Growth | | | |
| Fund, Series II – Institutional Class | 21.36% | 20.10% | -3.25% |
| Russell 2000 Growth Index | 27.07% | 30.29% | 10.75% |
| S&P 500 Index | 16.36% | 17.22% | 3.02% |
Gross expense ratio: 1.40%. Net expense ratio: 0.98%. The expense ratio is contractually capped at 0.98% indefinitely.
Performance data quoted represents past performance; past performance does not guarantee future results. The investment return and principal value of an investment will fluctuate so that an investor’s shares, when redeemed, may be worth more or less than their original cost. Current performance of the Fund may be lower or higher than the performance quoted. Performance data current to the most recent month end may be obtained by visiting www.hennessyfunds.com. Investment performance reflects fee waivers in effect. In the absence of such waivers, total return would be reduced. The expense ratios presented are that from the most recent prospectus.
The Russell 2000 Growth Index and S&P 500 Index are unmanaged indices commonly used to measure the performance of U.S. Stocks. You cannot invest directly in an index. Small and medium-capitalization companies tend to have limited liquidity and greater price volatility than large-capitalization companies. Investments in foreign securities involve greater volatility and political, economic and currency risk and differences in accounting methods. References to specific securities should not be considered a recommendation to buy or sell any security. Fund holdings and sector allocations are subject to change. Please refer to the included Schedule of Investments.
HENNESSY FUNDS 1-800-966-4354
Hennessy Focus 30 Fund
Original Class Shares (HFTFX)
AVERAGE ANNUAL TOTAL RETURN PERIODS ENDED APRIL 30, 2011
| | Six | One | Five | Since Inception |
| | Months | Year | Years | (9/17/03) |
| Hennessy Focus 30 Fund – | | | | |
| Original Class | 22.72% | 29.43% | 3.82% | 11.63% |
| S&P Midcap 400 Index | 23.25% | 25.07% | 6.35% | 10.52% |
| S&P 500 Index | 16.36% | 17.22% | 2.95% | 5.90% |
Gross expense ratio: 1.40%
Performance data quoted represents past performance; past performance does not guarantee future results. The investment return and principal value of an investment will fluctuate so that an investor’s shares, when redeemed, may be worth more or less than their original cost. Current performance of the Fund may be lower or higher than the performance quoted. Performance data current to the most recent month end may be obtained by visiting www.hennessyfunds.com. The gross expense ratio presented is that from the most recent prospectus.
PERFORMANCE NARRATIVE
While the Hennessy Focus 30 Fund returned 22.72% for the six-month period ended April 30, 2011, it slightly underperformed its benchmark, the S&P 400 Mid-cap Index, which returned 23.25%, but outperformed the S&P 500 Index, which returned 16.36%, for the same period. Security selection in the Industrials and Information Technology sectors hampered the Fund’s relative performance and offset positive security selection in the Consumer Discretionary and Health Care sectors. Even with the positive impact of sector allocation, including overweight positions in Materials and Consumer Discretionary sector and an underweight position in the Utilities sector, the Fund still marginally underperformed its benchmark. The best performing stock in the Fund over the six-month period was Ulta Salon Cosmetics & Fragrance (ULTA), up over 72% on strong earnings and sales, while the worst performing stock was US Airways Group (LCC), falling -23% amid contract disputes with their pilots and higher oil costs.
PERFORMANCE REVIEW — HENNESSY FOCUS 30 FUND
Hennessy Focus 30 Fund
Institutional Class Shares (HIFTX)
AVERAGE ANNUAL TOTAL RETURN PERIODS ENDED APRIL 30, 2011
| | Six | | Since Inception |
| | Months | One Year | (3/3/08) |
| Hennessy Focus 30 Fund – | | | |
| Institutional Class | 23.03% | 30.06% | 7.20% |
| S&P Midcap 400 Index | 23.25% | 25.07% | 9.99% |
| S&P 500 Index | 16.36% | 17.22% | 3.02% |
Gross expense ratio: 1.17%. Net expense ratio: 0.98%. The expense ratio is contractually capped at 0.98% indefinitely.
Performance data quoted represents past performance; past performance does not guarantee future results. The investment return and principal value of an investment will fluctuate so that an investor’s shares, when redeemed, may be worth more or less than their original cost. Current performance of the Fund may be lower or higher than the performance quoted. Performance data current to the most recent month end may be obtained by visiting www.hennessyfunds.com. Investment performance reflects fee waivers in effect. In the absence of such waivers, total return would be reduced. The expense ratios presented are that from the most recent prospectus.
The S&P 500 Index and S&P Midcap 400 Index are unmanaged indices commonly used to measure the performance of U.S. Stocks. You cannot invest directly in an index. Small and medium-capitalization companies tend to have limited liquidity and greater price volatility than large-capitalization companies. References to specific securities should not be considered a recommendation to buy or sell any security. Fund holdings and sector allocations are subject to change. Please refer to the included Schedule of Investments.
HENNESSY FUNDS 1-800-966-4354
Hennessy Cornerstone Large Growth Fund
Original Class Shares (HFLGX)
AVERAGE ANNUAL TOTAL RETURN PERIODS ENDED APRIL 30, 2011
| | Six | | Since Inception |
| | Months | One Year | (3/20/09) |
| Hennessy Cornerstone Large | | | |
| Growth Fund – Original Class* | 16.27% | 21.68% | 39.85% |
| Russell 1000 Index | 17.12% | 18.02% | 35.29% |
| S&P 500 Index | 16.36% | 17.22% | 33.88% |
Gross expense ratio: 1.30%.
Performance data quoted represents past performance; past performance does not guarantee future results. The investment return and principal value of an investment will fluctuate so that an investor’s shares, when redeemed, may be worth more or less than their original cost. Current performance of the Fund may be lower or higher than the performance quoted. Performance data current to the most recent month end may be obtained by visiting www.hennessyfunds.com. The gross expense ratio presented is that from the most recent prospectus.
| * | On March 20, 2009, the Tamarack Large Cap Growth Fund was reorganized into the Hennessy Cornerstone Large Growth Fund. At that time, the Fund began utilizing a purely quantitative formula to choose stocks for the portfolio, which differs from the investment strategy employed by the previous investment manager. Accordingly, performance is being reported for the period after the reorganization. |
PERFORMANCE NARRATIVE
The Hennessy Cornerstone Large Growth Fund returned 16.27% for the six-month period ended April 30, 2011, slightly underperforming its benchmark, the Russell 1000 Index, which returned 17.12%, and the S&P 500 Index, which returned 16.36%, for the same period. While the portfolio’s underweight position in the Information Technology, Utilities and Financials sectors were positive contributors to overall allocation effect, the underweight position in the Energy sector versus the benchmark effectively negated the positive allocation effect from the other sectors. The Fund had a positive effect from security selection during the period, with the major contributions coming from the Industrial and Financial sectors. The portfolio’s holdings within the Consumer Discretionary and Consumer Staples sectors had a negative selection effect, but that was not enough to offset the gains from the Industrials and Financials sectors. The best performing stock in the portfolio was Consol Energy (CNX), which gained nearly 48% on strong earnings and higher commodity prices. The worst performer was Best Buy (BBY), down nearly -27% for the period due to weaker earning reported for Q3 ‘10.
PERFORMANCE REVIEW — HENNESSY CORNERSTONE LARGE GROWTH FUND
Hennessy Cornerstone Large Growth Fund
Institutional Class Shares (HILGX)
AVERAGE ANNUAL TOTAL RETURN PERIODS ENDED APRIL 30, 2011
| | Six | | Since Inception |
| | Months | One Year | (3/20/09) |
| Hennessy Cornerstone Large | | | |
| Growth Fund – Institutional Class | 16.45% | 22.06% | 40.30% |
| Russell 1000 Index | 17.12% | 18.02% | 35.29% |
| S&P 500 Index | 16.36% | 17.22% | 33.88% |
Gross expense ratio: 1.16%. Net expense ratio: 0.98%. The expense ratio is contractually capped at 0.98% indefinitely.
Performance data quoted represents past performance; past performance does not guarantee future results. The investment return and principal value of an investment will fluctuate so that an investor’s shares, when redeemed, may be worth more or less than their original cost. Current performance of the Fund may be lower or higher than the performance quoted. Performance data current to the most recent month end may be obtained by visiting www.hennessyfunds.com. Investment performance reflects fee waivers in effect. In the absence of such waivers, total return would be reduced. The expense ratios presented are that from the most recent prospectus.
The S&P 500 and Russell 1000 are unmanaged indices commonly used to measure the performance of U.S. stocks. One cannot invest directly in an index. Medium-capitalization companies tend to have limited liquidity and greater price volatility than large-capitalization companies. Growth stocks typically are more volatile than value stocks; however value stocks have a lower expected growth rate in earnings and sales. References to specific securities should not be considered a recommendation to buy or sell any security. Fund holdings and sector allocations are subject to change. Please refer to the included Schedule of Investments.
HENNESSY FUNDS 1-800-966-4354
Hennessy Cornerstone Value Fund
Original Class Shares (HFCVX)
AVERAGE ANNUAL TOTAL RETURN PERIODS ENDED APRIL 30, 2011
| | Six | One | Five | Ten |
| | Months | Year | Years | Years |
| Hennessy Cornerstone | | | | |
| Value Fund – Original Class | 10.52% | 15.40% | 2.50% | 3.88% |
| Russell 1000 Value Index | 17.29% | 15.24% | 1.40% | 4.31% |
| S&P 500 Index | 16.36% | 17.22% | 2.95% | 2.82% |
Gross expense ratio: 1.30%
Performance data quoted represents past performance; past performance does not guarantee future results. The investment return and principal value of an investment will fluctuate so that an investor’s shares, when redeemed, may be worth more or less than their original cost. Current performance of the Fund may be lower or higher than the performance quoted. Performance data current to the most recent month end may be obtained by visiting www.hennessyfunds.com. The gross expense ratio presented is that from the most recent prospectus.
PERFORMANCE NARRATIVE
The Hennessy Cornerstone Value Fund returned 10.52% for the six-month period ending April 30, 2011, underperforming its benchmark, the Russell 1000 Value, which returned 17.29%, and the S&P 500, which returned 16.36%, for the same period. The Fund’s underperformance was the result of security selection across a number of sectors, specifically Telecommunication Services, Energy and Industrials. The positive effects of security selection in the Consumer Discretionary, Financials and Information Technologies sectors were not enough to offset stock selections in other sectors. Sector allocation contributed slightly to overall performance and can be largely attributed to the Fund’s underweight position versus the benchmark in the Financials sector. The top performer in the portfolio was Chevron Corp. (CVX), up nearly 35%, which benefitted from strong oil prices. ConocoPhillips (COP) and Statoil ASA (STO) both also performed well while in the portfolio, with each stock gaining approximately 34%. The weakest performing stock in the portfolio was Nokia (NOK), which slid nearly -14% after its CEO outlined serious challenges in a memo to employees where he suggested that Nokia had made errors that left the firm “years behind” rivals such as Apple and Google.
PERFORMANCE REVIEW — HENNESSY CORNERSTONE VALUE FUND
Hennessy Cornerstone Value Fund
Institutional Class Shares (HICVX)
AVERAGE ANNUAL TOTAL RETURN PERIODS ENDED APRIL 30, 2011
| | Six | | Since Inception |
| | Months | One Year | (3/3/08) |
| Hennessy Cornerstone Value Fund – | | | |
| Institutional Class | 10.78% | 15.77% | 3.13% |
| Russell 1000 Value Index | 17.29% | 15.24% | 1.17% |
| S&P 500 Index | 16.36% | 17.22% | 3.02% |
Gross expense ratio: 1.11%. Net expense ratio: 0.98%. The expense ratio is contractually capped at 0.98% indefinitely.
Performance data quoted represents past performance; past performance does not guarantee future results. The investment return and principal value of an investment will fluctuate so that an investor’s shares, when redeemed, may be worth more or less than their original cost. Current performance of the Fund may be lower or higher than the performance quoted. Performance data current to the most recent month end may be obtained by visiting www.hennessyfunds.com. Investment performance reflects fee waivers in effect. In the absence of such waivers, total return would be reduced. The expense ratios presented are that from the most recent prospectus.
The Russell 1000 Value Index and S&P 500 Index are unmanaged indices commonly used to measure the performance of U.S. Stocks. You cannot invest directly in an index. The Fund may invest in medium-capitalization companies which tend to have limited liquidity and greater price volatility than large-capitalization companies. Investments in foreign securities involve greater volatility and political, economic and currency risk and differences in accounting methods. References to specific securities should not be considered a recommendation to buy or sell any security. Fund holdings and sector allocations are subject to change. Please refer to the included Schedule of Investments.
HENNESSY FUNDS 1-800-966-4354
Hennessy Total Return Fund
Original Class Shares (HDOGX)
AVERAGE ANNUAL TOTAL RETURN PERIODS ENDED APRIL 30, 2011
| | Six | One | Five | Ten |
| | Months | Year | Years | Years |
| Hennessy Total Return Fund | 10.60% | 16.84% | 2.68% | 3.00% |
| Dow Jones Industrial Average | 16.71% | 19.50% | 5.20% | 4.28% |
| S&P 500 Index | 16.36% | 17.22% | 2.95% | 2.82% |
Gross expense ratio: 1.34%
Expenses net of interest expense: 1.26%
Performance data quoted represents past performance; past performance does not guarantee future results. The investment return and principal value of an investment will fluctuate so that an investor’s shares, when redeemed, may be worth more or less than their original cost. Current performance of the Fund may be lower or higher than the performance quoted. Performance data current to the most recent month end may be obtained by visiting www.hennessyfunds.com. The gross and net expense ratios presented is that from the most recent prospectus.
PERFORMANCE NARRATIVE
The Hennessy Total Return Fund returned 10.60% for the six-month period ended April 30, 2011, compared to the Dow Jones Industrial Average, which returned 16.71%, and the S&P 500 Index, which returned 16.36% for the same period. The Fund’s relative underperformance to its benchmark is due primarily to low yields on the Total Return Fund’s approximately 25% position in short-term Treasury Bills. A number of the “Dogs of the Dow” companies held in the portfolio performed well during the period, including Chevron (CVX), which gained nearly 35%, General Electric (GE), which gained nearly 30% and Pfizer (PFE), which gained 23% for the six-month period. Chevron was the top performing stock in the portfolio, while Merck (MRK) was the poorest performer, gaining just 1%. Many of these large companies increased their dividend during the period.
The Dow Jones Industrial Average and S&P 500 Index are unmanaged indices commonly used to measure the performance of U.S. Stocks. You cannot invest directly in an index. The Hennessy Total Return Fund is non-diversified, meaning it may concentrate its assets in fewer individual holdings than a diversified fund, making it more exposed to individual stock volatility than a diversified fund. References to specific securities should not be considered a recommendation to buy or sell any security. Fund holdings are subject to change. Please refer to the included Schedule of Investments.
PERFORMANCE REVIEW — HENNESSY TOTAL RETURN FUND AND HENNESSY BALANCED FUND
Hennessy Balanced Fund
Original Class Shares (HBFBX)
AVERAGE ANNUAL TOTAL RETURN PERIODS ENDED APRIL 30, 2011
| | Six | One | Five | Ten |
| | Months | Year | Years | Years |
| Hennessy Balanced Fund | 7.53% | 11.98% | 3.17% | 2.39% |
| Dow Jones Industrial Average | 16.71% | 19.50% | 5.20% | 4.28% |
| S&P 500 Index | 16.36% | 17.22% | 2.95% | 2.82% |
Gross expense ratio: 1.66%
Performance data quoted represents past performance; past performance does not guarantee future results. The investment return and principal value of an investment will fluctuate so that an investor’s shares, when redeemed, may be worth more or less than their original cost. Current performance of the Fund may be lower or higher than the performance quoted. Performance data current to the most recent month end may be obtained by visiting www.hennessyfunds.com. The gross expense ratio presented is that from the most recent prospectus.
PERFORMANCE NARRATIVE
The Hennessy Balanced Fund returned 7.53% for the six-month period ended April 30, 2011, compared to the Dow Jones Industrial Average, which returned 16.71%, and the S&P 500 Index, which returned 16.36%, for the same period. The Fund’s relative underperformance to its benchmark is due primarily to low yields on the Balanced Fund’s approximately 50% position in short-term Treasury Bills. A number of the “Dogs of the Dow” companies held in the portfolio performed well during the period, including Chevron (CVX), which gained nearly 35%, General Electric (GE), which gained nearly 30%, and Pfizer (PFE), which gained 23%. Chevron was the top performing stock in the portfolio, while Merck (MRK) was the poorest performer, gaining just 1%. Many of these large companies increased their dividend during the period.
The Dow Jones Industrial Average and S&P 500 Index are unmanaged indices commonly used to measure the performance of U.S. Stocks. You cannot invest directly in an index. The Hennessy Balanced Fund is non-diversified, meaning it may concentrate its assets in fewer individual holdings than a diversified fund, making it more exposed to individual stock volatility than a diversified fund. References to specific securities should not be considered a recommendation to buy or sell any security. Fund holdings are subject to change. Please refer to the included Schedule of Investments.
HENNESSY FUNDS 1-800-966-4354
(This Page Intentionally Left Blank.)
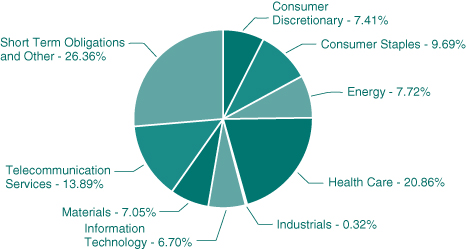
SCHEDULE OF INVESTMENTS — HENNESSY CORNERSTONE GROWTH FUND
Schedules of Investments
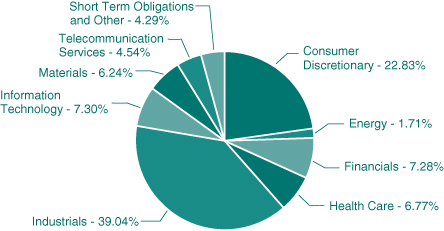
HENNESSY CORNERSTONE GROWTH FUND
As of April 30, 2011 (Unaudited)
(% of Net Assets)
| TOP TEN EQUITY HOLDINGS | % of net assets |
| Sauer-Danfoss, Inc. | 3.23% |
| Atlas Energy LP | 3.10% |
| Mercer International, Inc. | 3.08% |
| Innospec, Inc. | 2.98% |
| Titan International, Inc. | 2.86% |
| Western Refining, Inc. | 2.74% |
| Atlas Pipeline Partners LP | 2.56% |
| TPC Group, Inc. | 2.42% |
| iStar Financial, Inc. | 2.37% |
| Buckeye Technologies, Inc. | 2.30% |
HENNESSY FUNDS 1-800-966-4354
| | COMMON STOCKS – 98.10% | | Number | | | | | | % of Net | |
| | | | of Shares | | | Value | | | Assets | |
| | Consumer Discretionary – 26.40% | | | | | | | | | |
| | Ann, Inc. (a) | | | 140,400 | | | $ | 4,381,884 | | | | 2.00 | % |
| | Borg Warner, Inc. (a) | | | 56,200 | | | | 4,340,888 | | | | 1.98 | % |
| | Cost Plus, Inc. (a) | | | 365,200 | | | | 3,977,028 | | | | 1.82 | % |
| | CPI Corp. | | | 131,600 | | | | 2,364,852 | | | | 1.08 | % |
| | Dillards, Inc. | | | 103,400 | | | | 4,965,268 | | | | 2.27 | % |
| | DineEquity, Inc. (a) | | | 67,700 | | | | 3,382,969 | | | | 1.55 | % |
| | Krispy Kreme Doughnuts, Inc. (a) | | | 514,600 | | | | 2,886,906 | | | | 1.32 | % |
| | Libbey, Inc. (a) | | | 260,000 | | | | 4,433,000 | | | | 2.03 | % |
| | Pier 1 Imports, Inc. (a) | | | 356,900 | | | | 4,347,042 | | | | 1.98 | % |
| | Quiksilver, Inc. (a) | | | 740,500 | | | | 3,221,175 | | | | 1.47 | % |
| | Ruby Tuesday, Inc. (a) | | | 275,200 | | | | 2,892,352 | | | | 1.32 | % |
| | Tenneco, Inc. (a) | | | 91,000 | | | | 4,205,110 | | | | 1.92 | % |
| | Tractor Supply Co. | | | 78,900 | | | | 4,881,543 | | | | 2.23 | % |
| | TRW Automotive Holdings Corp. (a) | | | 71,800 | | | | 4,096,908 | | | | 1.87 | % |
| | Tuesday Morning Corp. (a) | | | 681,500 | | | | 3,407,500 | | | | 1.56 | % |
| | | | | | | | | 57,784,425 | | | | 26.40 | % |
| | Consumer Staples – 3.46% | | | | | | | | | | | | |
| | Pricesmart, Inc. | | | 97,300 | | | | 4,051,572 | | | | 1.85 | % |
| | SunOpta, Inc. (a)(b) | | | 500,200 | | | | 3,531,412 | | | | 1.61 | % |
| | | | | | | | | 7,582,984 | | | | 3.46 | % |
| | Energy – 8.40% | | | | | | | | | | | | |
| | Atlas Energy LP | | | 254,200 | | | | 6,776,972 | | | | 3.10 | % |
| | Atlas Pipeline Partners LP | | | 151,300 | | | | 5,592,048 | | | | 2.56 | % |
| | Western Refining, Inc. (a) | | | 354,200 | | | | 6,007,232 | | | | 2.74 | % |
| | | | | | | | | 18,376,252 | | | | 8.40 | % |
| | Financials – 7.72% | | | | | | | | | | | | |
| | Ashford Hospitality Trust, Inc. (a) | | | 368,800 | | | | 4,598,936 | | | | 2.10 | % |
| | Grupo Financiero Galicia SA – ADR (a)(b) | | | 243,200 | | | | 3,108,096 | | | | 1.42 | % |
| | iStar Financial, Inc. (a) | | | 539,000 | | | | 5,185,180 | | | | 2.37 | % |
| | Newcastle Investment Corp. (a) | | | 635,500 | | | | 4,010,005 | | | | 1.83 | % |
| | | | | | | | | 16,902,217 | | | | 7.72 | % |
| | Health Care – 1.71% | | | | | | | | | | | | |
| | MedCath Corp. (a) | | | 276,600 | | | | 3,736,866 | | | | 1.71 | % |
The accompanying notes are an integral part of these financial statements.
SCHEDULE OF INVESTMENTS — HENNESSY CORNERSTONE GROWTH FUND
| | COMMON STOCKS | | Number | | | | | | % of Net | |
| | | | of Shares | | | Value | | | Assets | |
| | Industrials – 25.88% | | | | | | | | | |
| | Air Transport Services Group, Inc. (a) | | | 470,800 | | | $ | 3,851,144 | | | | 1.76 | % |
| | Amerco (a) | | | 36,000 | | | | 3,661,920 | | | | 1.67 | % |
| | Commercial Vehicle Group, Inc. (a) | | | 214,500 | | | | 3,702,270 | | | | 1.69 | % |
| | Greenbrier Companies, Inc. (a) | | | 164,300 | | | | 4,447,601 | | | | 2.03 | % |
| | Interface, Inc. | | | 241,900 | | | | 4,509,016 | | | | 2.06 | % |
| | NACCO Industries, Inc. | | | 35,100 | | | | 3,693,573 | | | | 1.69 | % |
| | Sauer-Danfoss, Inc. (a) | | | 119,600 | | | | 7,057,596 | | | | 3.23 | % |
| | Timken Co. | | | 78,700 | | | | 4,437,893 | | | | 2.03 | % |
| | Titan International, Inc. | | | 202,800 | | | | 6,264,492 | | | | 2.86 | % |
| | Trimas Corp. (a) | | | 167,600 | | | | 3,889,996 | | | | 1.78 | % |
| | United Continental Holdings, Inc. (a) | | | 144,100 | | | | 3,288,362 | | | | 1.50 | % |
| | United Rentals, Inc. (a) | | | 160,000 | | | | 4,707,200 | | | | 2.15 | % |
| | US Airways Group, Inc. (a) | | | 344,200 | | | | 3,128,778 | | | | 1.43 | % |
| | | | | | | | | 56,639,841 | | | | 25.88 | % |
| | Information Technology – 6.68% | | | | | | | | | | | | |
| | DDi Corp. | | | 322,900 | | | | 3,103,069 | | | | 1.42 | % |
| | Kemet Corp. (a) | | | 292,300 | | | | 4,597,879 | | | | 2.10 | % |
| | Newport Corp. (a) | | | 220,100 | | | | 4,122,473 | | | | 1.88 | % |
| | Power One, Inc. (a) | | | 337,700 | | | | 2,789,402 | | | | 1.28 | % |
| | | | | | | | | 14,612,823 | | | | 6.68 | % |
| | Materials – 14.53% | | | | | | | | | | | | |
| | Buckeye Technologies, Inc. | | | 179,100 | | | | 5,043,456 | | | | 2.30 | % |
| | Innospec, Inc. (a) | | | 172,900 | | | | 6,511,414 | | | | 2.98 | % |
| | Materion Corp. (a) | | | 97,900 | | | | 4,088,304 | | | | 1.87 | % |
| | Mercer International, Inc. (a) | | | 554,000 | | | | 6,742,180 | | | | 3.08 | % |
| | Quaker Chem Corp. | | | 91,000 | | | | 4,111,380 | | | | 1.88 | % |
| | TPC Group, Inc. (a) | | | 134,400 | | | | 5,300,736 | | | | 2.42 | % |
| | | | | | | | | 31,797,470 | | | | 14.53 | % |
| | Telecommunication Services – 3.32% | | | | | | | | | | | | |
| | General Communication, Inc. (a) | | | 301,700 | | | | 3,469,550 | | | | 1.59 | % |
| | IDT Corp. | | | 130,600 | | | | 3,786,094 | | | | 1.73 | % |
| | | | | | | | | 7,255,644 | | | | 3.32 | % |
| | | | | | | | | | | | | | |
| | Total Common Stocks (Cost $188,353,254) | | | | | | | 214,688,522 | | | | 98.10 | % |
The accompanying notes are an integral part of these financial statements.
HENNESSY FUNDS 1-800-966-4354
| | SHORT-TERM INVESTMENTS – 0.00% | | Number of | | | | | | % of Net | |
| | | | Shares | | | Value | | | Assets | |
| | Money Market Funds – 0.00% | | | | | | | | | |
| | Fidelity Government Portfolio – | | | | | | | | | |
| | Institutional Class, 0.0100% (c) | | | 262 | | | $ | 262 | | | | 0.00 | % |
| | | | | | | | | | | | | | |
| | Total Money Market Funds | | | | | | | | | | | | |
| | (Cost $262) | | | | | | | 262 | | | | 0.00 | % |
| | | | | | | | | | | | | | |
| | Total Short-Term Investments | | | | | | | | | | | | |
| | (Cost $262) | | | | | | | 262 | | | | 0.00 | % |
| | | | | | | | | | | | | | |
| | Total Investments – 98.10% | | | | | | | | | | | | |
| | (Cost $188,353,516) | | | | | | | 214,688,784 | | | | 98.10 | % |
| | | | | | | | | | | | | | |
| | Other Assets in Excess of Liabilities – 1.90% | | | | | | | 4,157,216 | | | | 1.90 | % |
| | TOTAL NET ASSETS – 100.00% | | | | | | $ | 218,846,000 | | | | 100.00 | % |
Percentages are stated as a percent of net assets.
ADR American Depository Receipt
(a)Non-income producing security.
(b)Foreign issued security.
(c)The rate listed is the Fund’s 7-day yield as of April 30, 2011.
Summary of Fair Value Exposure at April 30, 2011
The Fund has adopted authoritative fair valuation accounting standards which establish an authoritative definition of fair value and set out a hierarchy for measuring fair value. These standards require additional disclosures about the various inputs and valuation techniques used to develop the measurements of fair value and a discussion in changes in valuation techniques and related inputs during the period. These inputs are summarized in the three broad levels listed below.
Securities which are traded on a national or recognized stock exchange are valued at the last sale price on the securities exchange on which such securities are primarily traded. Exchange-traded securities for which there were no transactions that day and debt securities are valued at the most recent bid prices. Instruments with a remaining maturity of 60 days or less are valued on an amortized cost basis. When a price for an underlying security is not readily available or if a significant event has occurred that indicates the closing price of a security no longer represents the true value of that security, fair value pricing procedures have been adopted by the Board of Directors of the Funds. Fair value pricing determinations are made in good faith in accordance with these procedures. There are numerous criteria that will be given consideration in determining a fair value of a security. Some of these criteria are: trading volume of security and markets, value of other like securities and news events with direct bearing to security or market. Fair value pricing results in an estimated price that reasonably reflects the current market conditions in order to rate the portfolio holdings such that shareholder transactions receive a fair net asset value.
The accompanying notes are an integral part of these financial statements.
SCHEDULE OF INVESTMENTS — HENNESSY CORNERSTONE GROWTH FUND
The Fund has performed an analysis of all existing investments to determine the significance and character of all inputs to their fair value determination.
| | Level 1 – | Quoted unadjusted prices for identical instruments in active markets to which the Fund has access at the date of measurement. |
| | Level 2 – | Quoted prices for similar instruments in active markets; quoted prices for identical or similar instruments in markets that are not active; and model-derived valuations in which all significant inputs and significant value drivers are observable in active markets. Level 2 inputs are those in markets for which there are few transactions, the prices are not current, little public information exists or instances where prices vary substantially over time or among brokered market makers. |
| | Level 3 – | Model derived valuations in which one or more significant inputs or significant value drivers are unobservable. Unobservable inputs are those inputs that reflect the Fund’s own assumptions that market participants would use to price the asset or liability based on the best available information. |
The inputs or methodology used for valuing securities are not an indication of the risk associated with investing in those securities.
The following is a summary of the inputs used to value the Fund’s net assets as of April 30, 2011:
| | Common Stock | | Level 1 | | | Level 2 | | | Level 3 | | | Total | |
| | Consumer Discretionary | | $ | 57,784,425 | | | $ | — | | | $ | — | | | $ | 57,784,425 | |
| | Consumer Staples | | | 7,582,984 | | | | — | | | | — | | | | 7,582,984 | |
| | Energy | | | 18,376,252 | | | | — | | | | — | | | | 18,376,252 | |
| | Financials | | | 16,902,217 | | | | — | | | | — | | | | 16,902,217 | |
| | Health Care | | | 3,736,866 | | | | — | | | | — | | | | 3,736,866 | |
| | Industrials | | | 56,639,841 | | | | — | | | | — | | | | 56,639,841 | |
| | Information Technology | | | 14,612,823 | | | | — | | | | — | | | | 14,612,823 | |
| | Materials | | | 31,797,470 | | | | — | | | | — | | | | 31,797,470 | |
| | Telecommunication Services | | | 7,255,644 | | | | — | | | | — | | | | 7,255,644 | |
| | Total Common Stock | | $ | 214,688,522 | | | $ | — | | | $ | — | | | $ | 214,688,522 | |
| | Short-Term Investments | | $ | 262 | | | $ | — | | | $ | — | | | $ | 262 | |
| | Total Investments in Securities | | $ | 214,688,784 | | | $ | — | | | $ | — | | | $ | 214,688,784 | |
Transfers between levels are recognized at the end of the reporting period. During the period ended April 30, 2011, the Fund recognized no significant transfers between levels.
The accompanying notes are an integral part of these financial statements.
HENNESSY FUNDS 1-800-966-4354
HENNESSY CORNERSTONE
GROWTH FUND, SERIES II
As of April 30, 2011 (Unaudited)
(% of Net Assets)
| TOP TEN EQUITY HOLDINGS | % of net assets |
| IDT Corp. | 4.54% |
| Ulta Salon Cosmetics & Fragrance, Inc. | 3.27% |
| Trimas Corp. | 3.04% |
| TRW Automotive Holdings Corp. | 2.87% |
| Macquarie Infrastructure Co. LLC | 2.76% |
| Gardner Denver, Inc. | 2.71% |
| Crocs, Inc. | 2.70% |
| Sinclair Broadcast Group, Inc. | 2.65% |
| Loral Space & Communications, Inc. | 2.58% |
| Cardtronics, Inc. | 2.58% |
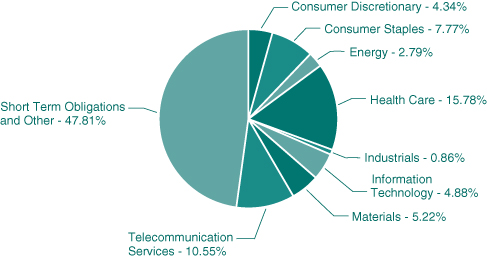
SCHEDULE OF INVESTMENTS — HENNESSY CORNERSTONE GROWTH FUND, SERIES II
| | COMMON STOCKS – 95.71% | | Number | | | | | | % of Net | |
| | | | of Shares | | | Value | | | Assets | |
| | Consumer Discretionary – 22.83% | | | | | | | | | |
| | Brown Shoe, Inc. | | | 30,100 | | | $ | 380,765 | | | | 1.16 | % |
| | Crocs, Inc. (a) | | | 44,100 | | | | 886,851 | | | | 2.70 | % |
| | Libbey, Inc. (a) | | | 37,200 | | | | 634,260 | | | | 1.93 | % |
| | Lifetime Brands, Inc. (a) | | | 31,700 | | | | 504,664 | | | | 1.54 | % |
| | Media General, Inc. (a) | | | 46,600 | | | | 251,174 | | | | 0.77 | % |
| | Select Comfort Corp. (a) | | | 53,000 | | | | 841,110 | | | | 2.56 | % |
| | Sinclair Broadcast Group, Inc. | | | 75,700 | | | | 869,793 | | | | 2.65 | % |
| | Skechers USA, Inc. (a) | | | 12,600 | | | | 240,030 | | | | 0.73 | % |
| | TRW Automotive Holdings Corp. (a) | | | 16,500 | | | | 941,490 | | | | 2.87 | % |
| | Ulta Salon Cosmetics & Fragrance, Inc. (a) | | | 20,200 | | | | 1,074,438 | | | | 3.27 | % |
| | Valassis Communications, Inc. (a) | | | 14,500 | | | | 418,035 | | | | 1.28 | % |
| | Whirlpool Corp. | | | 5,200 | | | | 448,136 | | | | 1.37 | % |
| | | | | | | | | 7,490,746 | | | | 22.83 | % |
| | Energy – 1.71% | | | | | | | | | | | | |
| | Callon Petroleum Co. (a) | | | 82,000 | | | | 561,700 | | | | 1.71 | % |
| | | | | | | | | | | | | | |
| | Financials – 7.28% | | | | | | | | | | | | |
| | American International Group, Inc. (a) | | | 13,600 | | | | 423,640 | | | | 1.29 | % |
| | Banco Macro SA – ADR (b) | | | 16,300 | | | | 602,937 | | | | 1.84 | % |
| | Cardtronics, Inc. (a) | | | 39,800 | | | | 845,750 | | | | 2.58 | % |
| | Zions Bancorporation | | | 21,100 | | | | 515,895 | | | | 1.57 | % |
| | | | | | | | | 2,388,222 | | | | 7.28 | % |
| | Health Care – 6.77% | | | | | | | | | | | | |
| | Hill-Rom Holdings, Inc. | | | 16,100 | | | | 724,661 | | | | 2.21 | % |
| | SXC Health Solutions Corp. (a)(b) | | | 13,700 | | | | 755,692 | | | | 2.30 | % |
| | Universal American Corp. | | | 32,100 | | | | 741,510 | | | | 2.26 | % |
| | | | | | | | | 2,221,863 | | | | 6.77 | % |
| | Industrials – 39.04% | | | | | | | | | | | | |
| | Air Transport Services Group, Inc. (a) | | | 96,100 | | | | 786,098 | | | | 2.39 | % |
| | Alamo Group, Inc. | | | 22,300 | | | | 638,003 | | | | 1.94 | % |
| | Alaska Air Group, Inc. (a) | | | 10,600 | | | | 698,222 | | | | 2.13 | % |
| | Cascade Corp. | | | 12,800 | | | | 586,240 | | | | 1.79 | % |
| | Commercial Vehicle Group, Inc. (a) | | | 43,000 | | | | 742,180 | | | | 2.26 | % |
| | Consolidated Graphics, Inc. (a) | | | 10,800 | | | | 606,420 | | | | 1.85 | % |
The accompanying notes are an integral part of these financial statements.
HENNESSY FUNDS 1-800-966-4354
| | COMMON STOCKS | | Number | | | | | | % of Net | |
| | | | of Shares | | | Value | | | Assets | |
| | Industrials (Continued) | | | | | | | | | |
| | Esterline Technologies Corp. (a) | | | 9,900 | | | $ | 710,820 | | | | 2.17 | % |
| | Gardner Denver, Inc. | | | 10,300 | | | | 890,023 | | | | 2.71 | % |
| | Interface, Inc. | | | 41,500 | | | | 773,560 | | | | 2.36 | % |
| | Macquarie Infrastructure Co. LLC (a) | | | 36,100 | | | | 906,110 | | | | 2.76 | % |
| | Meritor, Inc. (a) | | | 33,600 | | | | 578,256 | | | | 1.76 | % |
| | NACCO Industries, Inc. | | | 5,200 | | | | 547,196 | | | | 1.67 | % |
| | Owens Corning (a) | | | 15,600 | | | | 590,304 | | | | 1.80 | % |
| | Pacer International, Inc. (a) | | | 70,000 | | | | 419,300 | | | | 1.28 | % |
| | Standex International Corp. | | | 18,900 | | | | 690,984 | | | | 2.11 | % |
| | Tennant Co. | | | 14,600 | | | | 598,892 | | | | 1.82 | % |
| | Trimas Corp. (a) | | | 43,000 | | | | 998,030 | | | | 3.04 | % |
| | United Continental Holdings, Inc. (a) | | | 24,100 | | | | 549,962 | | | | 1.68 | % |
| | US Airways Group, Inc. (a) | | | 55,000 | | | | 499,950 | | | | 1.52 | % |
| | | | | | | | | 12,810,550 | | | | 39.04 | % |
| | Information Technology – 7.30% | | | | | | | | | | | | |
| | Lionbridge Technologies, Inc. (a) | | | 100,100 | | | | 337,337 | | | | 1.03 | % |
| | Loral Space & Communications, Inc. (a) | | | 12,100 | | | | 845,790 | | | | 2.58 | % |
| | Power One, Inc. (a) | | | 67,700 | | | | 559,202 | | | | 1.70 | % |
| | Ultra Clean Holdings, Inc. (a) | | | 56,800 | | | | 652,632 | | | | 1.99 | % |
| | | | | | | | | 2,394,961 | | | | 7.30 | % |
| | Materials – 6.24% | | | | | | | | | | | | |
| | Clearwater Paper Corp. (a) | | | 8,500 | | | | 667,080 | | | | 2.03 | % |
| | Neenah Paper, Inc. | | | 25,800 | | | | 601,914 | | | | 1.83 | % |
| | Quaker Chem Corp. | | | 17,300 | | | | 781,614 | | | | 2.38 | % |
| | | | | | | | | 2,050,608 | | | | 6.24 | % |
| | Telecommunication Services – 4.54% | | | | | | | | | | | | |
| | IDT Corp. | | | 51,400 | | | | 1,490,086 | | | | 4.54 | % |
| | | | | | | | | | | | | | |
| | Total Common Stocks (Cost $23,162,513) | | | | | | | 31,408,736 | | | | 95.71 | % |
| | | | | | | | | | | | | | |
| | WARRANTS – 0.00% | | | | | | | | | | | | |
| | American International Group, Inc.(a) | | | | | | | | | | | | |
| | Expiration: January, 2021, Exercise Price: $45.00 | | | 0.004 | | | | 0 | | | | 0.00 | % |
| | | | | | | | | | | | | | |
| | Total Warrants (Cost $0) | | | | | | | 0 | | | | 0.00 | % |
The accompanying notes are an integral part of these financial statements.
SCHEDULE OF INVESTMENTS — HENNESSY CORNERSTONE GROWTH FUND, SERIES II
| | SHORT-TERM INVESTMENTS – 4.52% | | Principal | | | | | | % of Net | |
| | | | Value | | | Value | | | Assets | |
| | Demand Notes# – 4.52% | | | | | | | | | |
| | American Family Financial Services, 0.1001% | | $ | 1,484,155 | | | $ | 1,484,155 | | | | 4.52 | % |
| | | | | | | | | | | | | | |
| | Total Demand Notes | | | | | | | | | | | | |
| | (Cost $1,484,155) | | | | | | | 1,484,155 | | | | 4.52 | % |
| | | | | | | | | | | | | | |
| | Total Short-Term Investments | | | | | | | | | | | | |
| | (Cost $1,484,155) | | | | | | | 1,484,155 | | | | 4.52 | % |
| | | | | | | | | | | | | | |
| | Total Investments – 100.23% | | | | | | | | | | | | |
| | (Cost $24,646,668) | | | | | | | 32,892,891 | | | | 100.23 | % |
| | | | | | | | | | | | | | |
| | Liabilities in Excess of Other Assets – (0.23)% | | | | | | | (75,117 | ) | | | (0.23 | )% |
| | TOTAL NET ASSETS – 100.00% | | | | | | $ | 32,817,774 | | | | 100.00 | % |
Percentages are stated as a percent of net assets.
ADR American Depository Receipt
(a) Non-income producing security.
(b) Foreign issued security.
# Variable rate demand notes are considered short-term obligations and are payable on demand. Interest rates change periodically on specified dates. Interest rates listed are as of April 30, 2011.
Summary of Fair Value Exposure at April 30, 2011
The Fund has adopted authoritative fair valuation accounting standards which establish an authoritative definition of fair value and set out a hierarchy for measuring fair value. These standards require additional disclosures about the various inputs and valuation techniques used to develop the measurements of fair value and a discussion in changes in valuation techniques and related inputs during the period. These inputs are summarized in the three broad levels listed below.
Securities which are traded on a national or recognized stock exchange are valued at the last sale price on the securities exchange on which such securities are primarily traded. Exchange-traded securities for which there were no transactions that day and debt securities are valued at the most recent bid prices. Instruments with a remaining maturity of 60 days or less are valued on an amortized cost basis. When a price for an underlying security is not readily available or if a significant event has occurred that indicates the closing price of a security no longer represents the true value of that security, fair value pricing procedures have been adopted by the Board of Directors of the Funds. Fair value pricing determinations are made in good faith in accordance with these procedures. There are numerous criteria that will be given consideration in determining a fair value of a security. Some of these criteria are: trading volume of security and markets, value of other like securities and news events with direct bearing to security or market. Fair value pricing results in an estimated price that reasonably reflects the current market conditions in order to rate the portfolio holdings such that shareholder transactions receive a fair net asset value.
The Fund has performed an analysis of all existing investments to determine the significance and character of all inputs to their fair value determination.
The accompanying notes are an integral part of these financial statements.
HENNESSY FUNDS 1-800-966-4354
| | Level 1 – | Quoted unadjusted prices for identical instruments in active markets to which the Fund has access at the date of measurement. |
| | Level 2 – | Quoted prices for similar instruments in active markets; quoted prices for identical or similar instruments in markets that are not active; and model-derived valuations in which all significant inputs and significant value drivers are observable in active markets. Level 2 inputs are those in markets for which there are few transactions, the prices are not current, little public information exists or instances where prices vary substantially over time or among brokered market makers. |
| | Level 3 – | Model derived valuations in which one or more significant inputs or significant value drivers are unobservable. Unobservable inputs are those inputs that reflect the Fund’s own assumptions that market participants would use to price the asset or liability based on the best available information. |
The inputs or methodology used for valuing securities are not an indication of the risk associated with investing in those securities.
The following is a summary of the inputs used to value the Fund’s net assets as of April 30, 2011:
| | Common Stock | | Level 1 | | | Level 2 | | | Level 3 | | | Total | |
| | Consumer Discretionary | | $ | 7,490,746 | | | $ | — | | | $ | — | | | $ | 7,490,746 | |
| | Energy | | | 561,700 | | | | — | | | | — | | | | 561,700 | |
| | Financials | | | 2,388,222 | | | | — | | | | — | | | | 2,388,222 | |
| | Health Care | | | 2,221,863 | | | | — | | | | — | | | | 2,221,863 | |
| | Industrials | | | 12,810,550 | | | | — | | | | — | | | | 12,810,550 | |
| | Information Technology | | | 2,394,961 | | | | — | | | | — | | | | 2,394,961 | |
| | Materials | | | 2,050,608 | | | | — | | | | — | | | | 2,050,608 | |
| | Telecommunication Services | | | 1,490,086 | | | | — | | | | — | | | | 1,490,086 | |
| | Total Common Stock | | $ | 31,408,736 | | | $ | — | | | $ | — | | | $ | 31,408,736 | |
| | Warrants | | $ | — | | | $ | — | | | $ | — | | | $ | — | |
| | Short-Term Investments | | $ | — | | | $ | 1,484,155 | | | $ | — | | | $ | 1,484,155 | |
| | Total Investments in Securities | | $ | 31,408,736 | | | $ | 1,484,155 | | | $ | — | | | $ | 32,892,891 | |
Transfers between levels are recognized at the end of the reporting period. During the period ended April 30, 2011, the Fund recognized no significant transfers between levels.
The accompanying notes are an integral part of these financial statements.
SCHEDULE OF INVESTMENTS — HENNESSY FOCUS 30 FUND
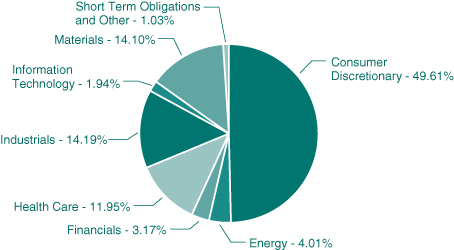
HENNESSY FOCUS 30 FUND
As of April 30, 2011 (Unaudited)
(% of Net Assets)
| TOP TEN EQUITY HOLDINGS | % of net assets |
| Ulta Salon Cosmetics & Fragrance, Inc. | 4.82% |
| Rockwood Holdings, Inc. | 4.59% |
| Healthspring, Inc. | 4.54% |
| Amerigroup Corp. | 4.48% |
| Crocs, Inc. | 4.38% |
| Tenneco, Inc. | 4.21% |
| Tractor Supply Co. | 4.09% |
| Borg Warner, Inc. | 4.08% |
| Complete Production Services Co. | 4.01% |
| TRW Automotive Holdings Corp. | 4.00% |
HENNESSY FUNDS 1-800-966-4354
| | COMMON STOCKS – 98.97% | | Number | | | | | | % of Net | |
| | | | of Shares | | | Value | | | Assets | |
| | Consumer Discretionary – 49.61% | | | | | | | | | |
| | Advance Auto Parts, Inc. | | | 71,400 | | | $ | 4,673,844 | | | | 2.83 | % |
| | Autoliv, Inc. | | | 68,400 | | | | 5,480,892 | | | | 3.32 | % |
| | Borg Warner, Inc. (a) | | | 87,300 | | | | 6,743,052 | | | | 4.08 | % |
| | Crocs, Inc. (a) | | | 359,800 | | | | 7,235,578 | | | | 4.38 | % |
| | Dollar Tree, Inc. (a) | | | 87,200 | | | | 5,014,000 | | | | 3.04 | % |
| | Family Dollar Stores, Inc. | | | 96,100 | | | | 5,209,581 | | | | 3.16 | % |
| | HSN, Inc. (a) | | | 138,000 | | | | 4,578,840 | | | | 2.77 | % |
| | Tenneco, Inc. (a) | | | 150,600 | | | | 6,959,226 | | | | 4.21 | % |
| | Tractor Supply Co. | | | 109,200 | | | | 6,756,204 | | | | 4.09 | % |
| | TRW Automotive Holdings Corp. (a) | | | 115,900 | | | | 6,613,254 | | | | 4.00 | % |
| | Ulta Salon Cosmetics & Fragrance, Inc. (a) | | | 149,600 | | | | 7,957,224 | | | | 4.82 | % |
| | Valassis Communications, Inc. (a) | | | 124,800 | | | | 3,597,984 | | | | 2.18 | % |
| | Williams Sonoma, Inc. | | | 135,200 | | | | 5,869,032 | | | | 3.55 | % |
| | Wyndham Worldwide Corp. | | | 151,600 | | | | 5,246,876 | | | | 3.18 | % |
| | | | | | | | | 81,935,587 | | | | 49.61 | % |
| | Energy – 4.01% | | | | | | | | | | | | |
| | Complete Production Services Co. (a) | | | 195,100 | | | | 6,621,694 | | | | 4.01 | % |
| | | | | | | | | | | | | | |
| | Financials – 3.17% | | | | | | | | | | | | |
| | Jones Lang Lasalle, Inc. | | | 51,200 | | | | 5,241,856 | | | | 3.17 | % |
| | | | | | | | | | | | | | |
| | Health Care – 11.95% | | | | | | | | | | | | |
| | Amerigroup Corp. (a) | | | 108,200 | | | | 7,390,060 | | | | 4.48 | % |
| | Healthspring, Inc. (a) | | | 180,900 | | | | 7,505,541 | | | | 4.54 | % |
| | Magellan Health Services, Inc. (a) | | | 93,000 | | | | 4,837,860 | | | | 2.93 | % |
| | | | | | | | | 19,733,461 | | | | 11.95 | % |
| | Industrials – 14.19% | | | | | | | | | | | | |
| | Applied Industrial Technologies, Inc. | | | 140,300 | | | | 4,946,978 | | | | 3.00 | % |
| | Meritor, Inc. (a) | | | 288,500 | | | | 4,965,085 | | | | 3.01 | % |
| | Toro Co. | | | 74,400 | | | | 5,052,504 | | | | 3.06 | % |
| | United Continental Holdings, Inc. (a) | | | 188,400 | | | | 4,299,288 | | | | 2.60 | % |
| | US Airways Group, Inc. (a) | | | 458,600 | | | | 4,168,674 | | | | 2.52 | % |
| | | | | | | | | 23,432,529 | | | | 14.19 | % |
| | Information Technology – 1.94% | | | | | | | | | | | | |
| | Lexmark International (a) | | | 99,400 | | | | 3,205,650 | | | | 1.94 | % |
The accompanying notes are an integral part of these financial statements.
SCHEDULE OF INVESTMENTS — HENNESSY FOCUS 30 FUND
| | COMMON STOCKS | | Number | | | | | | % of Net | |
| | | | of Shares | | | Value | | | Assets | |
| | Materials – 14.10% | | | | | | | | | |
| | Ferro Corp. (a) | | | 336,000 | | | $ | 5,040,000 | | | | 3.05 | % |
| | Lubrizol Corp. | | | 39,400 | | | | 5,300,088 | | | | 3.21 | % |
| | Polyone Corp. | | | 370,500 | | | | 5,364,840 | | | | 3.25 | % |
| | Rockwood Holdings, Inc. (a) | | | 133,500 | | | | 7,574,790 | | | | 4.59 | % |
| | | | | | | | | 23,279,718 | | | | 14.10 | % |
| | | | | | | | | | | | | | |
| | Total Common Stocks (Cost $120,199,778) | | | | | | | 163,450,495 | | | | 98.97 | % |
| | | | | | | | | | | | | | |
| | SHORT-TERM INVESTMENTS – 1.18% | | | | | | | | | | | | |
| | Money Market Funds – 1.18% | | | | | | | | | | | | |
| | Fidelity Government Portfolio – | | | | | | | | | | | | |
| | Institutional Class, 0.0100% (b) | | | 1,951,280 | | | | 1,951,280 | | | | 1.18 | % |
| | | | | | | | | | | | | | |
| | Total Money Market Funds | | | | | | | | | | | | |
| | (Cost $1,951,280) | | | | | | | 1,951,280 | | | | 1.18 | % |
| | | | | | | | | | | | | | |
| | Total Short-Term Investments | | | | | | | | | | | | |
| | (Cost $1,951,280) | | | | | | | 1,951,280 | | | | 1.18 | % |
| | | | | | | | | | | | | | |
| | Total Investments – 100.15% | | | | | | | | | | | | |
| | (Cost $122,151,058) | | | | | | | 165,401,775 | | | | 100.15 | % |
| | | | | | | | | | | | | | |
| | Liabilities in Excess of Other Assets – (0.15)% | | | | | | | (255,596 | ) | | | (0.15 | )% |
| | TOTAL NET ASSETS – 100.00% | | | | | | $ | 165,146,179 | | | | 100.00 | % |
Percentages are stated as a percent of net assets.
(a)Non-income producing security.
(b)The rate listed is the Fund’s 7-day yield as of April 30, 2011.
Summary of Fair Value Exposure at April 30, 2011
The Fund has adopted authoritative fair valuation accounting standards which establish an authoritative definition of fair value and set out a hierarchy for measuring fair value. These standards require additional disclosures about the various inputs and valuation techniques used to develop the measurements of fair value and a discussion in changes in valuation techniques and related inputs during the period. These inputs are summarized in the three broad levels listed below.
Securities which are traded on a national or recognized stock exchange are valued at the last sale price on the securities exchange on which such securities are primarily traded. Exchange-traded securities for which there were no transactions that day and debt securities are valued at the most recent bid prices. Instruments with a remaining maturity of 60 days or less are valued on an amortized cost basis. When a price for an underlying security is not
The accompanying notes are an integral part of these financial statements.
HENNESSY FUNDS 1-800-966-4354
readily available or if a significant event has occurred that indicates the closing price of a security no longer represents the true value of that security, fair value pricing procedures have been adopted by the Board of Directors of the Funds. Fair value pricing determinations are made in good faith in accordance with these procedures. There are numerous criteria that will be given consideration in determining a fair value of a security. Some of these criteria are: trading volume of security and markets, value of other like securities and news events with direct bearing to security or market. Fair value pricing results in an estimated price that reasonably reflects the current market conditions in order to rate the portfolio holdings such that shareholder transactions receive a fair net asset value.
The Fund has performed an analysis of all existing investments to determine the significance and character of all inputs to their fair value determination.
| | Level 1 – | Quoted unadjusted prices for identical instruments in active markets to which the Fund has access at the date of measurement. |
| | Level 2 – | Quoted prices for similar instruments in active markets; quoted prices for identical or similar instruments in markets that are not active; and model-derived valuations in which all significant inputs and significant value drivers are observable in active markets. Level 2 inputs are those in markets for which there are few transactions, the prices are not current, little public information exists or instances where prices vary substantially over time or among brokered market makers. |
| | Level 3 – | Model derived valuations in which one or more significant inputs or significant value drivers are unobservable. Unobservable inputs are those inputs that reflect the Fund’s own assumptions that market participants would use to price the asset or liability based on the best available information. |
The inputs or methodology used for valuing securities are not an indication of the risk associated with investing in those securities.
The following is a summary of the inputs used to value the Fund’s net assets as of April 30, 2011:
| | Common Stock | | Level 1 | | | Level 2 | | | Level 3 | | | Total | |
| | Consumer Discretionary | | $ | 81,935,587 | | | $ | — | | | $ | — | | | $ | 81,935,587 | |
| | Energy | | | 6,621,694 | | | | — | | | | — | | | | 6,621,694 | |
| | Financials | | | 5,241,856 | | | | — | | | | — | | | | 5,241,856 | |
| | Health Care | | | 19,733,461 | | | | — | | | | — | | | | 19,733,461 | |
| | Industrials | | | 23,432,529 | | | | — | | | | — | | | | 23,432,529 | |
| | Information Technology | | | 3,205,650 | | | | — | | | | — | | | | 3,205,650 | |
| | Materials | | | 23,279,718 | | | | — | | | | — | | | | 23,279,718 | |
| | Total Common Stock | | $ | 163,450,495 | | | $ | — | | | $ | — | | | $ | 163,450,495 | |
| | Short-Term Investments | | $ | 1,951,280 | | | $ | — | | | $ | — | | | $ | 1,951,280 | |
| | Total Investments in Securities | | $ | 165,401,775 | | | $ | — | | | $ | — | | | $ | 165,401,775 | |
Transfers between levels are recognized at the end of the reporting period. During the period ended April 30, 2011, the Fund recognized no significant transfers between levels.
The accompanying notes are an integral part of these financial statements.
SCHEDULE OF INVESTMENTS — HENNESSY FOCUS 30 FUND
Level 3 Reconciliation Disclosure
Following is a reconciliation of Level 3 assets for which significant unobservable inputs were used to determine fair value.
| | | | Warrants(1) | |
| | Balance as of 10/31/10 | | $ | — | |
| | Accrued discounts/premiums | | | — | |
| | Realized gain (loss) | | | — | |
| | Change in unrealized appreciation (depreciation) | | | — | |
| | Purchases | | | — | |
| | (Sales) | | | — | |
| | Transfer in and/or out of Level 3 | | | — | |
| | Balance as of 4/30/11 | | $ | — | |
| | Change in unrealized appreciation/depreciation during | | | | |
| | the period for level 3 investments held at April 30, 2011 | | $ | — | |
(1) The Lantronix, Inc. warrants held at October 31, 2010 expired in February, 2011.
The accompanying notes are an integral part of these financial statements.
HENNESSY FUNDS 1-800-966-4354
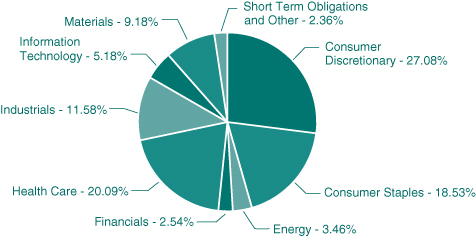
HENNESSY CORNERSTONE
LARGE GROWTH FUND
As of April 30, 2011 (Unaudited)
(% of Net Assets)
| | TOP TEN EQUITY HOLDINGS | % of net assets |
| | Humana, Inc. | 2.81% |
| | Liberty Global, Inc. | 2.73% |
| | Joy Global, Inc. | 2.69% |
| | Moody’s Corp. | 2.54% |
| | AutoZone, Inc. | 2.51% |
| | Lubrizol Corp. | 2.39% |
| | CIGNA Corp. | 2.33% |
| | Freeport-McMoRan Copper & Gold, Inc. | 2.32% |
| | Philip Morris International, Inc. | 2.31% |
| | Dollar Tree, Inc. | 2.27% |
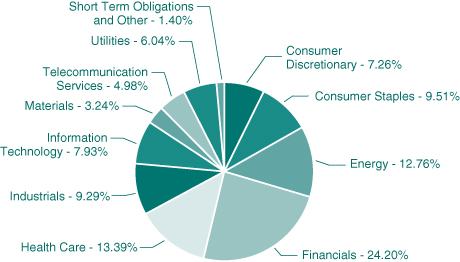
SCHEDULE OF INVESTMENTS — HENNESSY CORNERSTONE LARGE GROWTH FUND
| | COMMON STOCKS – 97.64% | | Number | | | | | | % of | |
| | | | of Shares | | | Value | | | Net Assets | |
| | Consumer Discretionary – 27.08% | | | | | | | | | |
| | Apollo Group, Inc. (a) | | | 23,200 | | | $ | 928,696 | | | | 1.04 | % |
| | AutoZone, Inc. (a) | | | 7,900 | | | | 2,230,802 | | | | 2.51 | % |
| | Best Buy Co., Inc. | | | 30,800 | | | | 961,576 | | | | 1.08 | % |
| | DIRECTV (a) | | | 39,800 | | | | 1,933,882 | | | | 2.17 | % |
| | Dish Network Corp. (a) | | | 65,100 | | | | 1,630,104 | | | | 1.83 | % |
| | Dollar Tree, Inc. (a) | | | 35,100 | | | | 2,018,250 | | | | 2.27 | % |
| | Family Dollar Stores, Inc. | | | 36,500 | | | | 1,978,665 | | | | 2.23 | % |
| | Liberty Global, Inc. (a) | | | 52,300 | | | | 2,431,950 | | | | 2.73 | % |
| | Mattel, Inc. | | | 61,600 | | | | 1,645,952 | | | | 1.85 | % |
| | Ross Stores, Inc. | | | 25,100 | | | | 1,849,619 | | | | 2.08 | % |
| | The Gap, Inc. | | | 57,000 | | | | 1,324,680 | | | | 1.49 | % |
| | The McGraw-Hill Companies, Inc. | | | 42,600 | | | | 1,724,022 | | | | 1.94 | % |
| | TJX Companies, Inc. | | | 30,500 | | | | 1,635,410 | | | | 1.84 | % |
| | Yum Brands, Inc. | | | 33,500 | | | | 1,796,940 | | | | 2.02 | % |
| | | | | | | | | 24,090,548 | | | | 27.08 | % |
| | Consumer Staples – 18.53% | | | | | | | | | | | | |
| | Altria Group, Inc. | | | 68,500 | | | | 1,838,540 | | | | 2.07 | % |
| | Campbell Soup Co. | | | 40,800 | | | | 1,370,472 | | | | 1.54 | % |
| | Clorox Co. | | | 22,500 | | | | 1,567,350 | | | | 1.76 | % |
| | General Mills, Inc. | | | 41,300 | | | | 1,593,354 | | | | 1.79 | % |
| | H.J. Heinz Co. | | | 31,500 | | | | 1,613,745 | | | | 1.81 | % |
| | Kellogg Co. | | | 27,300 | | | | 1,563,471 | | | | 1.76 | % |
| | Kimberly – Clark Corp. | | | 23,600 | | | | 1,559,016 | | | | 1.75 | % |
| | Lorillard, Inc. | | | 18,500 | | | | 1,970,250 | | | | 2.22 | % |
| | Philip Morris International, Inc. | | | 29,600 | | | | 2,055,424 | | | | 2.31 | % |
| | Sysco Corp. | | | 46,800 | | | | 1,352,988 | | | | 1.52 | % |
| | | | | | | | | 16,484,610 | | | | 18.53 | % |
| | Energy – 3.46% | | | | | | | | | | | | |
| | Consol Energy, Inc. | | | 33,100 | | | | 1,790,379 | | | | 2.01 | % |
| | Diamond Offshore Drilling | | | 17,000 | | | | 1,289,790 | | | | 1.45 | % |
| | | | | | | | | 3,080,169 | | | | 3.46 | % |
| | Financials – 2.54% | | | | | | | | | | | | |
| | Moody’s Corp. | | | 57,700 | | | | 2,258,378 | | | | 2.54 | % |
The accompanying notes are an integral part of these financial statements.
HENNESSY FUNDS 1-800-966-4354
| | COMMON STOCKS | | Number | | | | | | % of | |
| | | | of Shares | | | Value | | | Net Assets | |
| | Health Care – 20.09% | | | | | | | | | |
| | Baxter International, Inc. | | | 30,200 | | | $ | 1,718,380 | | | | 1.93 | % |
| | Becton, Dickinson & Co. | | | 18,900 | | | | 1,624,266 | | | | 1.83 | % |
| | Bristol-Myers Squibb Co. | | | 59,200 | | | | 1,663,520 | | | | 1.87 | % |
| | Cardinal Health, Inc. | | | 40,200 | | | | 1,756,338 | | | | 1.97 | % |
| | CIGNA Corp. | | | 44,300 | | | | 2,074,569 | | | | 2.33 | % |
| | Eli Lilly & Co. | | | 41,100 | | | | 1,521,111 | | | | 1.71 | % |
| | Forest Laboratories, Inc. (a) | | | 53,000 | | | | 1,757,480 | | | | 1.98 | % |
| | Humana, Inc. (a) | | | 32,900 | | | | 2,504,348 | | | | 2.81 | % |
| | Johnson & Johnson | | | 22,300 | | | | 1,465,556 | | | | 1.65 | % |
| | Laboratory Corp. of America Holdings (a) | | | 18,500 | | | | 1,784,695 | | | | 2.01 | % |
| | | | | | | | | 17,870,263 | | | | 20.09 | % |
| | Industrials – 11.58% | | | | | | | | | | | | |
| | Flowserve Corp. | | | 12,400 | | | | 1,570,088 | | | | 1.77 | % |
| | Fluor Corp. | | | 27,400 | | | | 1,916,356 | | | | 2.15 | % |
| | Honeywell International, Inc. | | | 30,500 | | | | 1,867,515 | | | | 2.10 | % |
| | Joy Global, Inc. | | | 23,700 | | | | 2,392,515 | | | | 2.69 | % |
| | Lockheed Martin Corp. | | | 17,000 | | | | 1,347,250 | | | | 1.51 | % |
| | Raytheon Co. | | | 24,900 | | | | 1,208,895 | | | | 1.36 | % |
| | | | | | | | | 10,302,619 | | | | 11.58 | % |
| | Information Technology – 5.18% | | | | | | | | | | | | |
| | International Business Machines Corp. | | | 11,100 | | | | 1,893,438 | | | | 2.13 | % |
| | SAIC, Inc. (a) | | | 79,600 | | | | 1,385,040 | | | | 1.55 | % |
| | Western Digital Corp. (a) | | | 33,500 | | | | 1,333,300 | | | | 1.50 | % |
| | | | | | | | | 4,611,778 | | | | 5.18 | % |
| | Materials – 9.18% | | | | | | | | | | | | |
| | Crown Holdings, Inc. (a) | | | 53,200 | | | | 1,989,680 | | | | 2.24 | % |
| | FMC Corp. | | | 22,500 | | | | 1,986,300 | | | | 2.23 | % |
| | Freeport-McMoRan Copper & Gold, Inc. | | | 37,600 | | | | 2,069,128 | | | | 2.32 | % |
| | Lubrizol Corp. | | | 15,800 | | | | 2,125,416 | | | | 2.39 | % |
| | | | | | | | | 8,170,524 | | | | 9.18 | % |
| | | | | | | | | | | | | | |
| | Total Common Stocks (Cost $65,740,257) | | | | | | | 86,868,889 | | | | 97.64 | % |
The accompanying notes are an integral part of these financial statements.
SCHEDULE OF INVESTMENTS — HENNESSY CORNERSTONE LARGE GROWTH FUND
| | SHORT-TERM INVESTMENTS – 2.42% | | Number | | | | | | % of | |
| | | | of Shares | | | Value | | | Net Assets | |
| | Money Market Funds – 2.42% | | | | | | | | | |
| | Fidelity Government Portfolio – | | | | | | | | | |
| | Institutional Class, 0.0100% (b) | | | 2,152,938 | | | $ | 2,152,938 | | | | 2.42 | % |
| | | | | | | | | | | | | | |
| | Total Short-Term Investments | | | | | | | | | | | | |
| | (Cost $2,152,938) | | | | | | | 2,152,938 | | | | 2.42 | % |
| | | | | | | | | | | | | | |
| | Total Investments – 100.06% | | | | | | | | | | | | |
| | (Cost $67,893,195) | | | | | | | 89,021,827 | | | | 100.06 | % |
| | | | | | | | | | | | | | |
| | Liabilities in Excess of Other Assets – (0.06)% | | | | | | | (52,945 | ) | | | (0.06 | )% |
| | TOTAL NET ASSETS – 100.00% | | | | | | $ | 88,968,882 | | | | 100.00 | % |
Percentages are stated as a percent of net assets.
(a)Non-income producing security.
(b)The rate listed is the Fund’s 7-day yield as of April 30, 2011.
Summary of Fair Value Exposure at April 30, 2011
The Fund has adopted authoritative fair valuation accounting standards which establish an authoritative definition of fair value and set out a hierarchy for measuring fair value. These standards require additional disclosures about the various inputs and valuation techniques used to develop the measurements of fair value and a discussion in changes in valuation techniques and related inputs during the period.
Securities which are traded on a national or recognized stock exchange are valued at the last sale price on the securities exchange on which such securities are primarily traded. Exchange-traded securities for which there were no transactions that day and debt securities are valued at the most recent bid prices. Instruments with a remaining maturity of 60 days or less are valued on an amortized cost basis. When a price for an underlying security is not readily available or if a significant event has occurred that indicates the closing price of a security no longer represents the true value of that security, fair value pricing procedures have been adopted by the Board of Directors of the Funds. Fair value pricing determinations are made in good faith in accordance with these procedures. There are numerous criteria that will be given consideration in determining a fair value of a security. Some of these criteria are: trading volume of security and markets, value of other like securities and news events with direct bearing to security or market. Fair value pricing results in an estimated price that reasonably reflects the current market conditions in order to rate the portfolio holdings such that shareholder transactions receive a fair net asset value.
The Fund has performed an analysis of all existing investments to determine the significance and character of all inputs to their fair value determination.
The accompanying notes are an integral part of these financial statements.
HENNESSY FUNDS 1-800-966-4354
| | Level 1 – | Quoted unadjusted prices for identical instruments in active markets to which the Fund has access at the date of measurement. |
| | Level 2 – | Quoted prices for similar instruments in active markets; quoted prices for identical or similar instruments in markets that are not active; and model-derived valuations in which all significant inputs and significant value drivers are observable in active markets. Level 2 inputs are those in markets for which there are few transactions, the prices are not current, little public information exists or instances where prices vary substantially over time or among brokered market makers. |
| | Level 3 – | Model derived valuations in which one or more significant inputs or significant value drivers are unobservable. Unobservable inputs are those inputs that reflect the Fund’s own assumptions that market participants would use to price the asset or liability based on the best available information. |
The inputs or methodology used for valuing securities are not an indication of the risk associated with investing in those securities.
The following is a summary of the inputs used to value the Fund’s net assets as of April 30, 2011:
| | Common Stock | | Level 1 | | | Level 2 | | | Level 3 | | | Total | |
| | Consumer Discretionary | | $ | 24,090,548 | | | $ | — | | | $ | — | | | $ | 24,090,548 | |
| | Consumer Staples | | | 16,484,610 | | | | — | | | | — | | | | 16,484,610 | |
| | Energy | | | 3,080,169 | | | | — | | | | — | | | | 3,080,169 | |
| | Financials | | | 2,258,378 | | | | — | | | | — | | | | 2,258,378 | |
| | Health Care | | | 17,870,263 | | | | — | | | | — | | | | 17,870,263 | |
| | Industrials | | | 10,302,619 | | | | — | | | | — | | | | 10,302,619 | |
| | Information Technology | | | 4,611,778 | | | | — | | | | — | | | | 4,611,778 | |
| | Materials | | | 8,170,524 | | | | — | | | | — | | | | 8,170,524 | |
| | Total Common Stock | | $ | 86,868,889 | | | $ | — | | | $ | — | | | $ | 86,868,889 | |
| | Short-Term Investments | | $ | 2,152,938 | | | $ | — | | | $ | — | | | $ | 2,152,938 | |
| | Total Investments in Securities | | $ | 89,021,827 | | | $ | — | | | $ | — | | | $ | 89,021,827 | |
Transfers between levels are recognized at the end of the reporting period. During the period ended April 30, 2011, the Fund recognized no significant transfers between levels.
The accompanying notes are an integral part of these financial statements.
SCHEDULE OF INVESTMENTS — HENNESSY CORNERSTONE VALUE FUND
HENNESSY CORNERSTONE VALUE FUND
As of April 30, 2011 (Unaudited)
(% of Net Assets)
| | TOP TEN EQUITY HOLDINGS | % of net assets |
| | Statoil ASA – ADR | 2.46% |
| | Chevron Corp. | 2.30% |
| | ConocoPhillips | 2.27% |
| | Pfizer, Inc. | 2.23% |
| | EI Du Pont de Nemours & Co. | 2.19% |
| | Taiwan Semiconductor Manufacturing Ltd. – ADR | 2.18% |
| | ENI SPA – ADR | 2.16% |
| | Automatic Data Processing, Inc. | 2.14% |
| | Total SA – ADR | 2.14% |
| | Marsh & McLennan Companies, Inc. | 2.12% |
HENNESSY FUNDS 1-800-966-4354
| | COMMON STOCKS – 98.30% | | Number | | | | | | % of Net | |
| | | | of Shares | | | Value | | | Assets | |
| | Consumer Discretionary – 2.02% | | | | | | | | | |
| | Mattel, Inc. | | | 110,800 | | | $ | 2,960,576 | | | | 2.02 | % |
| | | | | | | | | | | | | | |
| | Consumer Staples – 21.26% | | | | | | | | | | | | |
| | Altria Group, Inc. | | | 105,700 | | | | 2,836,988 | | | | 1.94 | % |
| | Campbell Soup Co. | | | 75,300 | | | | 2,529,327 | | | | 1.73 | % |
| | ConAgra Foods, Inc. | | | 120,700 | | | | 2,951,115 | | | | 2.02 | % |
| | Diageo PLC – ADR (c) | | | 34,900 | | | | 2,839,813 | | | | 1.94 | % |
| | General Mills, Inc. | | | 72,800 | | | | 2,808,624 | | | | 1.92 | % |
| | H.J. Heinz Co. | | | 54,200 | | | | 2,776,666 | | | | 1.90 | % |
| | Kellogg Co. | | | 53,500 | | | | 3,063,945 | | | | 2.10 | % |
| | Kimberly Clark Corp. | | | 42,000 | | | | 2,774,520 | | | | 1.90 | % |
| | Kraft Foods, Inc. | | | 84,700 | | | | 2,844,226 | | | | 1.95 | % |
| | Philip Morris International, Inc. | | | 43,900 | | | | 3,048,416 | | | | 2.08 | % |
| | Sysco Corp. | | | 90,200 | | | | 2,607,682 | | | | 1.78 | % |
| | | | | | | | | 31,081,322 | | | | 21.26 | % |
| | Energy – 17.23% | | | | | | | | | | | | |
| | Chevron Corp. | | | 30,700 | | | | 3,359,808 | | | | 2.30 | % |
| | ConocoPhillips | | | 42,000 | | | | 3,315,060 | | | | 2.27 | % |
| | ENI SPA – ADR (c) | | | 58,900 | | | | 3,165,286 | | | | 2.16 | % |
| | Enterprise Products Partners LP | | | 60,300 | | | | 2,609,181 | | | | 1.78 | % |
| | Petrochina Co. Ltd. – ADR (c) | | | 20,200 | | | | 2,940,716 | | | | 2.01 | % |
| | Royal Dutch Shell PLC – ADR (c) | | | 39,900 | | | | 3,091,452 | | | | 2.11 | % |
| | Statoil ASA – ADR (c) | | | 122,800 | | | | 3,599,268 | | | | 2.46 | % |
| | Total SA – ADR (c) | | | 48,600 | | | | 3,121,578 | | | | 2.14 | % |
| | | | | | | | | 25,202,349 | | | | 17.23 | % |
| | Financials – 2.12% | | | | | | | | | | | | |
| | Marsh & McLennan Companies, Inc. | | | 102,500 | | | | 3,103,700 | | | | 2.12 | % |
| | | | | | | | | | | | | | |
| | Health Care – 17.74% | | | | | | | | | | | | |
| | Abbott Labs | | | 54,200 | | | | 2,820,568 | | | | 1.93 | % |
| | Bristol-Myers Squibb Co. | | | 99,100 | | | | 2,784,710 | | | | 1.90 | % |
| | Eli Lilly & Co. | | | 75,300 | | | | 2,786,853 | | | | 1.91 | % |
| | GlaxoSmithKline PLC – ADR (c) | | | 66,500 | | | | 2,903,390 | | | | 1.99 | % |
| | Johnson & Johnson | | | 40,700 | | | | 2,674,804 | | | | 1.83 | % |
The accompanying notes are an integral part of these financial statements.
SCHEDULE OF INVESTMENTS — HENNESSY CORNERSTONE VALUE FUND
| | COMMON STOCKS | | Number | | | | | | % of Net | |
| | | | of Shares | | | Value | | | Assets | |
| | Health Care (Continued) | | | | | | | | | |
| | Merck & Co., Inc. | | | 75,500 | | | $ | 2,714,225 | | | | 1.86 | % |
| | Pfizer, Inc. | | | 155,800 | | | | 3,265,568 | | | | 2.23 | % |
| | Roche Holdings Ltd. – ADR (c) | | | 72,000 | | | | 2,918,160 | | | | 1.99 | % |
| | Sanofi Aventis – ADR (c) | | | 77,700 | | | | 3,070,704 | | | | 2.10 | % |
| | | | | | | | | 25,938,982 | | | | 17.74 | % |
| | Industrials – 7.79% | | | | | | | | | | | | |
| | Lockheed Martin Corp. | | | 37,600 | | | | 2,979,800 | | | | 2.04 | % |
| | Pitney Bowes, Inc. | | | 111,800 | | | | 2,745,808 | | | | 1.88 | % |
| | Raytheon Co. | | | 56,100 | | | | 2,723,655 | | | | 1.86 | % |
| | Waste Management, Inc. | | | 74,600 | | | | 2,943,716 | | | | 2.01 | % |
| | | | | | | | | 11,392,979 | | | | 7.79 | % |
| | Information Technology – 7.86% | | | | | | | | | | | | |
| | Automatic Data Processing, Inc. | | | 57,500 | | | | 3,125,125 | | | | 2.14 | % |
| | Intel Corp. | | | 122,500 | | | | 2,840,775 | | | | 1.94 | % |
| | Nokia Corp. – ADR (c) | | | 253,100 | | | | 2,336,113 | | | | 1.60 | % |
| | Taiwan Semiconductor | | | | | | | | | | | | |
| | Manufacturing Ltd. – ADR (c) | | | 235,900 | | | | 3,184,650 | | | | 2.18 | % |
| | | | | | | | | 11,486,663 | | | | 7.86 | % |
| | Materials – 3.86% | | | | | | | | | | | | |
| | Companhia Siderurgica Nacional – ADR (c) | | | 153,500 | | | | 2,445,255 | | | | 1.67 | % |
| | EI Du Pont de Nemours & Co. | | | 56,300 | | | | 3,197,277 | | | | 2.19 | % |
| | | | | | | | | 5,642,532 | | | | 3.86 | % |
| | Telecommunication Services – 18.42% | | | | | | | | | | | | |
| | AT&T, Inc. | | | 91,100 | | | | 2,835,032 | | | | 1.94 | % |
| | BCE, Inc. (c) | | | 79,600 | | | | 2,979,428 | | | | 2.04 | % |
| | CenturyLink, Inc. | | | 61,600 | | | | 2,512,048 | | | | 1.72 | % |
| | China Mobile Ltd. – ADR (c) | | | 50,900 | | | | 2,345,981 | | | | 1.60 | % |
| | France Telecom – ADR (c) | | | 114,000 | | | | 2,672,160 | | | | 1.83 | % |
| | KT Corp. – ADR (c) | | | 119,000 | | | | 2,415,700 | | | | 1.65 | % |
| | Mobile Telesystems OJSC – ADR (c) | | | 121,900 | | | | 2,578,185 | | | | 1.76 | % |
| | Telefonica de Argentina (a) (c) Ω | | | 100 | | | | 0 | | | | 0.00 | % |
| | Telefonica SA – ADR (c) | | | 106,100 | | | | 2,860,456 | | | | 1.96 | % |
| | Verizon Communications, Inc. | | | 79,600 | | | | 3,007,288 | | | | 2.06 | % |
The accompanying notes are an integral part of these financial statements.
HENNESSY FUNDS 1-800-966-4354
| | COMMON STOCKS | | Number | | | | | | % of Net | |
| | | | of Shares | | | Value | | | Assets | |
| | Telecommunication Services (Continued) | | | | | | | | | |
| | Vodafone Group PLC – ADR (c) | | | 93,600 | | | $ | 2,725,632 | | | | 1.86 | % |
| | | | | | | | | 26,931,910 | | | | 18.42 | % |
| | | | | | | | | | | | | | |
| | Total Common Stocks (Cost $122,776,090) | | | | | | | 143,741,013 | | | | 98.30 | % |
| | | | | | | | | | | | | | |
| | SHORT-TERM INVESTMENTS – 1.72% | | | | | | | | | | | | |
| | Money Market Funds – 0.41% | | | | | | | | | | | | |
| | Fidelity Government Portfolio – | | | | | | | | | | | | |
| | Institutional Class, 0.0100% (b) | | | 600,316 | | | | 600,316 | | | | 0.41 | % |
| | | | | | | | | | | | | | |
| | Total Money Market Funds | | | | | | | | | | | | |
| | (Cost $600,316) | | | | | | | 600,316 | | | | 0.41 | % |
| | | | | | | | | | | | | | |
| | | | | Principal | | | | | | | | | |
| | | | | Amount | | | | | | | | | |
| | Demand Notes# – 1.31% | | | | | | | | | | | | |
| | American Family Financial Services, 0.1001% | | $ | 1,909,720 | | | | 1,909,720 | | | | 1.31 | % |
| | | | | | | | | | | | | | |
| | Total Demand Notes | | | | | | | | | | | | |
| | (Cost $1,909,720) | | | | | | | 1,909,720 | | | | 1.31 | % |
| | | | | | | | | | | | | | |
| | Total Short-Term Investments | | | | | | | | | | | | |
| | (Cost $2,510,036) | | | | | | | 2,510,036 | | | | 1.72 | % |
| | | | | | | | | | | | | | |
| | Total Investments – 100.02% | | | | | | | | | | | | |
| | (Cost $125,286,126) | | | | | | | 146,251,049 | | | | 100.02 | % |
| | | | | | | | | | | | | | |
| | Liabilities in Excess of Other Assets – (0.02)% | | | | | | | (29,524 | ) | | | (0.02 | )% |
| | TOTAL NET ASSETS – 100.00% | | | | | | $ | 146,221,525 | | | | 100.00 | % |
Percentages are stated as a percent of net assets.
ADR American Depository Receipt
| (b) | The rate listed is the Fund’s 7-day yield as of April 30, 2011. |
| (c) | Foreign issued security. |
| Ω | Security is fair valued. |
| # | Variable rate demand notes are considered short-term obligations and are payable on demand. Interest rates change periodically on specified dates. Interest rates listed are as of April 30, 2011. |
The accompanying notes are an integral part of these financial statements.
SCHEDULE OF INVESTMENTS — HENNESSY CORNERSTONE VALUE FUND
Summary of Fair Value Exposure at April 30, 2011
The Fund has adopted authoritative fair valuation accounting standards which establish an authoritative definition of fair value and set out a hierarchy for measuring fair value. These standards require additional disclosures about the various inputs and valuation techniques used to develop the measurements of fair value and a discussion in changes in valuation techniques and related inputs during the period. These inputs are summarized in the three broad levels listed below.
Securities which are traded on a national or recognized stock exchange are valued at the last sale price on the securities exchange on which such securities are primarily traded. Exchange-traded securities for which there were no transactions that day and debt securities are valued at the most recent bid prices. Instruments with a remaining maturity of 60 days or less are valued on an amortized cost basis. When a price for an underlying security is not readily available or if a significant event has occurred that indicates the closing price of a security no longer represents the true value of that security, fair value pricing procedures have been adopted by the Board of Directors of the Funds. Fair value pricing determinations are made in good faith in accordance with these procedures. There are numerous criteria that will be given consideration in determining a fair value of a security. Some of these criteria are: trading volume of security and markets, value of other like securities and news events with direct bearing to security or market. Fair value pricing results in an estimated price that reasonably reflects the current market conditions in order to rate the portfolio holdings such that shareholder transactions receive a fair net asset value.
The Fund has performed an analysis of all existing investments to determine the significance and character of all inputs to their fair value determination.
| | Level 1 – | Quoted unadjusted prices for identical instruments in active markets to which the Fund has access at the date of measurement. |
| | Level 2 – | Quoted prices for similar instruments in active markets; quoted prices for identical or similar instruments in markets that are not active; and model-derived valuations in which all significant inputs and significant value drivers are observable in active markets. Level 2 inputs are those in markets for which there are few transactions, the prices are not current, little public information exists or instances where prices vary substantially over time or among brokered market makers. |
| | Level 3 – | Model derived valuations in which one or more significant inputs or significant value drivers are unobservable. Unobservable inputs are those inputs that reflect the Fund’s own assumptions that market participants would use to price the asset or liability based on the best available information. |
The inputs or methodology used for valuing securities are not an indication of the risk associated with investing in those securities.
The accompanying notes are an integral part of these financial statements.
HENNESSY FUNDS 1-800-966-4354
The following is a summary of the inputs used to value the Fund’s net assets as of April 30, 2011:
| | Common Stock | | Level 1 | | | Level 2 | | | Level 3 | | | Total | |
| | Consumer Discretionary | | $ | 2,960,576 | | | $ | — | | | $ | — | | | $ | 2,960,576 | |
| | Consumer Staples | | | 31,081,322 | | | | — | | | | — | | | | 31,081,322 | |
| | Energy | | | 25,202,349 | | | | — | | | | — | | | | 25,202,349 | |
| | Financials | | | 3,103,700 | | | | — | | | | — | | | | 3,103,700 | |
| | Health Care | | | 25,938,982 | | | | — | | | | — | | | | 25,938,982 | |
| | Industrials | | | 11,392,979 | | | | — | | | | — | | | | 11,392,979 | |
| | Information Technology | | | 11,486,663 | | | | — | | | | — | | | | 11,486,663 | |
| | Materials | | | 5,642,532 | | | | — | | | | — | | | | 5,642,532 | |
| | Telecommunication Services | | | 26,931,910 | | | | — | | | | — | (1) | | | 26,931,910 | |
| | Total Common Stock | | $ | 143,741,013 | | | $ | — | | | $ | — | | | $ | 143,741,013 | |
| | Short-Term Investments | | $ | 600,316 | | | $ | 1,909,720 | | | $ | — | | | $ | 2,510,036 | |
| | Total Investments in Securities | | $ | 144,341,329 | | | $ | 1,909,720 | | | $ | — | | | $ | 146,251,049 | |
Transfers between levels are recognized at the end of the reporting period. During the period ended April 30, 2011, the Fund recognized no significant transfers between levels.
| (1) | If Telefonica de Argentina would have had a value, it would have been a Level 3 fair value. The security has been fair valued at $0 during the entire reporting period. |
Level 3 Reconciliation Disclosure
Following is a reconciliation of Level 3 assets for which significant unobservable inputs were used to determine fair value.
| | | | Common Stock | |
| | Balance as of 10/31/10 | | $ | — | |
| | Accrued discounts/premiums | | | — | |
| | Realized gain (loss) | | | — | |
| | Change in unrealized appreciation (depreciation) | | | — | |
| | Purchases | | | — | |
| | (Sales) | | | — | |
| | Transfer in and/or out of Level 3 | | | — | |
| | Balance as of 4/30/11 | | $ | — | |
| | Change in unrealized appreciation/depreciation during | | | | |
| | the period for level 3 investments held at April 30, 2011 | | $ | — | |
The accompanying notes are an integral part of these financial statements.
SCHEDULE OF INVESTMENTS — HENNESSY TOTAL RETURN FUND
HENNESSY TOTAL RETURN FUND
As of April 30, 2011 (Unaudited)
(% of Net Assets)
| | TOP TEN EQUITY HOLDINGS | % of net assets |
| | Chevron Corp. | 7.72% |
| | Pfizer, Inc. | 7.67% |
| | Verizon Communications, Inc. | 7.20% |
| | EI Du Pont de Nemours & Co. | 7.05% |
| | Intel Corp. | 6.70% |
| | AT&T, Inc. | 6.66% |
| | Merck & Co., Inc. | 6.64% |
| | Kraft Foods, Inc. | 6.57% |
| | Johnson & Johnson | 6.55% |
| | McDonald’s Corp. | 4.12% |
HENNESSY FUNDS 1-800-966-4354
| | COMMON STOCKS – 73.64% | | Number | | | | | | % of Net | |
| | | | of Shares | | | Value | | | Assets | |
| | Consumer Discretionary – 7.41% | | | | | | | | | |
| | Home Depot, Inc. | | | 62,300 | | | $ | 2,313,822 | | | | 3.29 | % |
| | McDonald’s Corp. | | | 36,900 | | | | 2,889,639 | | | | 4.12 | % |
| | | | | | | | | 5,203,461 | | | | 7.41 | % |
| | Consumer Staples – 9.69% | | | | | | | | | | | | |
| | Coca-Cola Co. | | | 18,300 | | | | 1,234,518 | | | | 1.76 | % |
| | Kraft Foods, Inc. | | | 137,300 | | | | 4,610,534 | | | | 6.57 | % |
| | Procter & Gamble Co. | | | 14,700 | | | | 954,030 | | | | 1.36 | % |
| | | | | | | | | 6,799,082 | | | | 9.69 | % |
| | Energy – 7.72% | | | | | | | | | | | | |
| | Chevron Corp. | | | 49,500 | | | | 5,417,280 | | | | 7.72 | % |
| | | | | | | | | | | | | | |
| | Health Care – 20.86% | | | | | | | | | | | | |
| | Johnson & Johnson | | | 69,900 | | | | 4,593,828 | | | | 6.55 | % |
| | Merck & Co., Inc. | | | 129,700 | | | | 4,662,715 | | | | 6.64 | % |
| | Pfizer, Inc. | | | 256,800 | | | | 5,382,528 | | | | 7.67 | % |
| | | | | | | | | 14,639,071 | | | | 20.86 | % |
| | Industrials – 0.32% | | | | | | | | | | | | |
| | General Electric Co. | | | 11,000 | | | | 224,950 | | | | 0.32 | % |
| | | | | | | | | | | | | | |
| | Information Technology – 6.70% | | | | | | | | | | | | |
| | Intel Corp. | | | 202,900 | | | | 4,705,251 | | | | 6.70 | % |
| | | | | | | | | | | | | | |
| | Materials – 7.05% | | | | | | | | | | | | |
| | EI Du Pont de Nemours & Co. | | | 87,100 | | | | 4,946,409 | | | | 7.05 | % |
| | | | | | | | | | | | | | |
| | Telecommunication Services – 13.89% | | | | | | | | | | | | |
| | AT&T, Inc. | | | 150,100 | | | | 4,671,112 | | | | 6.66 | % |
| | Frontier Communications Corp. | | | 2,736 | | | | 22,627 | | | | 0.03 | % |
| | Verizon Communications, Inc. | | | 133,700 | | | | 5,051,186 | | | | 7.20 | % |
| | | | | | | | | 9,744,925 | | | | 13.89 | % |
| | | | | | | | | | | | | | |
| | Total Common Stocks (Cost $43,698,015) | | | | | | | 51,680,429 | | | | 73.64 | % |
The accompanying notes are an integral part of these financial statements.
SCHEDULE OF INVESTMENTS — HENNESSY TOTAL RETURN FUND
| | SHORT-TERM INVESTMENTS – 58.45% | | Principal | | | | | | % of Net | |
| | | | Value | | | Value | | | Assets | |
| | Money Market Funds – 1.45% | | | | | | | | | |
| | Fidelity Government Portfolio – | | | | | | | | | |
| | Institutional Class, 0.0100% (a) | | $ | 1,020,422 | | | $ | 1,020,422 | | | | 1.45 | % |
| | | | | | | | | | | | | | |
| | Total Money Market Funds | | | | | | | | | | | | |
| | (Cost $1,020,422) | | | | | | | 1,020,422 | | | | 1.45 | % |
| | | | | | | | | | | | | | |
| | | | Number | | | | | | | | | |
| | | | of Shares | | | | | | | | | |
| | US Treasury Bills* – 57.00% | | | | | | | | | | | | |
| | 0.0300%, 05/26/2011 (b) | | | 15,000,000 | | | | 14,999,166 | | | | 21.37 | % |
| | 0.0250%, 06/16/2011 (b) | | | 14,000,000 | | | | 13,998,748 | | | | 19.95 | % |
| | 0.0150%, 07/14/2011 (b) | | | 11,000,000 | | | | 10,999,670 | | | | 15.68 | % |
| | | | | | | | | | | | | | |
| | Total U.S. Treasury Bills | | | | | | | | | | | | |
| | (Cost $39,996,784) | | | | | | | 39,997,584 | | | | 57.00 | % |
| | | | | | | | | | | | | | |
| | Total Short-Term Investments | | | | | | | | | | | | |
| | (Cost $41,017,206) | | | | | | | 41,018,006 | | | | 58.45 | % |
| | | | | | | | | | | | | | |
| | Total Investments – 132.09% | | | | | | | | | | | | |
| | (Cost $84,715,221) | | | | | | | 92,698,435 | | | | 132.09 | % |
| | | | | | | | | | | | | | |
| | Liabilities in Excess of Other Assets – (32.09)% | | | | | | | (22,520,351 | ) | | | (32.09 | )% |
| | TOTAL NET ASSETS – 100.00% | | | | | | $ | 70,178,084 | | | | 100.00 | % |
Percentages are stated as a percent of net assets.
| (a) | The rate listed is the Fund’s 7-day yield as of April 30, 2011 |
| (b) | The rate listed is the discount rate at issue. |
| * | Collateral or partial collateral for reverse repurchase agreements. |
Summary of Fair Value Exposure at April 30, 2011
The Fund has adopted authoritative fair valuation accounting standards which establish an authoritative definition of fair value and set out a hierarchy for measuring fair value. These standards require additional disclosures about the various inputs and valuation techniques used to develop the measurements of fair value and a discussion in changes in valuation techniques and related inputs during the period. These inputs are summarized in the three broad levels listed below.
Securities which are traded on a national or recognized stock exchange are valued at the last sale price on the securities exchange on which such securities are primarily traded. Exchange-traded securities for which there were no transactions that day and debt securities are valued at the most recent bid prices. Instruments with a remaining maturity of 60 days or less are valued on an amortized cost basis. When a price for an underlying security is not
The accompanying notes are an integral part of these financial statements.
HENNESSY FUNDS 1-800-966-4354
readily available or if a significant event has occurred that indicates the closing price of a security no longer represents the true value of that security, fair value pricing procedures have been adopted by the Board of Directors of the Funds. Fair value pricing determinations are made in good faith in accordance with these procedures. There are numerous criteria that will be given consideration in determining a fair value of a security. Some of these criteria are: trading volume of security and markets, value of other like securities and news events with direct bearing to security or market. Fair value pricing results in an estimated price that reasonably reflects the current market conditions in order to rate the portfolio holdings such that shareholder transactions receive a fair net asset value.
The Fund has performed an analysis of all existing investments to determine the significance and character of all inputs to their fair value determination.
| | Level 1 – | Quoted unadjusted prices for identical instruments in active markets to which the Fund has access at the date of measurement. |
| | Level 2 – | Quoted prices for similar instruments in active markets; quoted prices for identical or similar instruments in markets that are not active; and model-derived valuations in which all significant inputs and significant value drivers are observable in active markets. Level 2 inputs are those in markets for which there are few transactions, the prices are not current, little public information exists or instances where prices vary substantially over time or among brokered market makers. |
| | Level 3 – | Model derived valuations in which one or more significant inputs or significant value drivers are unobservable. Unobservable inputs are those inputs that reflect the Fund’s own assumptions that market participants would use to price the asset or liability based on the best available information. |
The inputs or methodology used for valuing securities are not an indication of the risk associated with investing in those securities.
The following is a summary of the inputs used to value the Fund’s net assets as of April 30, 2011:
| | Common Stock | | Level 1 | | | Level 2 | | | Level 3 | | | Total | |
| | Consumer Discretionary | | $ | 5,203,461 | | | $ | — | | | $ | — | | | $ | 5,203,461 | |
| | Consumer Staples | | | 6,799,082 | | | | — | | | | — | | | | 6,799,082 | |
| | Energy | | | 5,417,280 | | | | — | | | | — | | | | 5,417,280 | |
| | Health Care | | | 14,639,071 | | | | — | | | | — | | | | 14,639,071 | |
| | Industrials | | | 224,950 | | | | — | | | | — | | | | 224,950 | |
| | Information Technology | | | 4,705,251 | | | | — | | | | — | | | | 4,705,251 | |
| | Materials | | | 4,946,409 | | | | — | | | | — | | | | 4,946,409 | |
| | Telecommunication Services | | | 9,744,925 | | | | — | | | | — | | | | 9,744,925 | |
| | Total Common Stock | | $ | 51,680,429 | | | $ | — | | | $ | — | | | $ | 51,680,429 | |
| | Short-Term Investments | | $ | 1,020,422 | | | $ | 39,997,584 | | | $ | — | | | $ | 41,018,006 | |
| | Total Investments in Securities | | $ | 52,700,851 | | | $ | 39,997,584 | | | $ | — | | | $ | 92,698,435 | |
Transfers between levels are recognized at the end of the reporting period. During the period ended April 30, 2011, the Fund recognized no significant transfers between levels.
The accompanying notes are an integral part of these financial statements.
SCHEDULE OF REVERSE REPURCHASE AGREEMENTS — HENNESSY TOTAL RETURN FUND
Schedule of Reverse Repurchase Agreements
Hennessy Total Return Fund April 30, 2011 |
| Face | | | | Principal | Maturity | | Maturity | |
| Value | | Counterparty | Rate | Trade Date | Date | | Amount | |
| $ | 8,095,500 | | UBS Financial Services, Inc. | 0.30% | 2/18/11 | 5/26/11 | | $ | 8,102,044 | |
| $ | 6,296,500 | | UBS Financial Services, Inc. | 0.35% | 3/18/11 | 6/16/11 | | | 6,302,009 | |
| $ | 8,095,500 | | UBS Financial Services, Inc. | 0.35% | 4/15/11 | 7/14/11 | | | 8,102,584 | |
| $ | 22,487,500 | | | | | | | $ | 22,506,637 | |
As of April 30, 2011, the fair value of securities held as collateral on reverse repurchase agreements was $39,997,584 as noted on the Schedule of Investments.
The accompanying notes are an integral part of these financial statements.
HENNESSY FUNDS 1-800-966-4354
HENNESSY BALANCED FUND
As of April 30, 2011 (Unaudited)
(% of Net Assets)
| | TOP TEN EQUITY HOLDINGS | % of net assets |
| | EI Du Pont de Nemours & Co. | 5.22% |
| | Pfizer, Inc. | 5.45% |
| | AT&T, Inc. | 5.29% |
| | Verizon Communications, Inc. | 5.25% |
| | Johnson & Johnson | 5.18% |
| | Merck & Co., Inc. | 5.15% |
| | Kraft Foods, Inc. | 4.92% |
| | Intel Corp. | 4.88% |
| | McDonald's Corp. | 3.93% |
| | Chevron Corp. | 2.79% |
SCHEDULE OF INVESTMENTS — HENNESSY BALANCED FUND
| | COMMON STOCKS – 52.19% | | Number | | | | | | % of Net | |
| | | | of Shares | | | Value | | | Assets | |
| | Consumer Discretionary – 4.34% | | | | | | | | | |
| | Home Depot, Inc. | | | 1,400 | | | $ | 51,996 | | | | 0.41 | % |
| | McDonald’s Corp. | | | 6,300 | | | | 493,353 | | | | 3.93 | % |
| | | | | | | | | 545,349 | | | | 4.34 | % |
| | Consumer Staples – 7.77% | | | | | | | | | | | | |
| | Coca-Cola Co. | | | 400 | | | | 26,984 | | | | 0.21 | % |
| | Kraft Foods, Inc. | | | 18,400 | | | | 617,872 | | | | 4.92 | % |
| | Procter & Gamble Co. | | | 5,100 | | | | 330,990 | | | | 2.64 | % |
| | | | | | | | | 975,846 | | | | 7.77 | % |
| | Energy – 2.79% | | | | | | | | | | | | |
| | Chevron Corp. | | | 3,200 | | | | 350,208 | | | | 2.79 | % |
| | | | | | | | | | | | | | |
| | Health Care – 15.78% | | | | | | | | | | | | |
| | Johnson & Johnson | | | 9,900 | | | | 650,628 | | | | 5.18 | % |
| | Merck & Co., Inc. | | | 17,950 | | | | 645,303 | | | | 5.15 | % |
| | Pfizer, Inc. | | | 32,650 | | | | 684,344 | | | | 5.45 | % |
| | | | | | | | | 1,980,275 | | | | 15.78 | % |
| | Industrials – 0.86% | | | | | | | | | | | | |
| | General Electric Co. | | | 5,300 | | | | 108,385 | | | | 0.86 | % |
| | | | | | | | | | | | | | |
| | Information Technology – 4.88% | | | | | | | | | | | | |
| | Intel Corp. | | | 26,400 | | | | 612,216 | | | | 4.88 | % |
| | | | | | | | | | | | | | |
| | Materials – 5.22% | | | | | | | | | | | | |
| | EI Du Pont de Nemours & Co. | | | 11,550 | | | | 655,924 | | | | 5.22 | % |
| | | | | | | | | | | | | | |
| | Telecommunication Services – 10.55% | | | | | | | | | | | | |
| | AT&T, Inc. | | | 21,350 | | | | 664,412 | | | | 5.29 | % |
| | Frontier Communications Corp. | | | 168 | | | | 1,389 | | | | 0.01 | % |
| | Verizon Communications, Inc. | | | 17,450 | | | | 659,261 | | | | 5.25 | % |
| | | | | | | | | 1,325,062 | | | | 10.55 | % |
| | | | | | | | | | | | | | |
| | Total Common Stocks (Cost $5,705,245) | | | | | | | 6,553,265 | | | | 52.19 | % |
The accompanying notes are an integral part of these financial statements.
HENNESSY FUNDS 1-800-966-4354
| | SHORT-TERM INVESTMENTS – 45.82% | | Principal | | | | | | % of | |
| | | | Amount | | | Value | | | Net Assets | |
| | Short-Term Investments – 2.57% | | | | | | | | | |
| | Fidelity Government Portfolio – | | | | | | | | | |
| | Institutional Class, 0.0100% (a) | | $ | 323,095 | | | $ | 323,095 | | | | 2.57 | % |
| | | | | | | | | | | | | | |
| | Total Money Market Funds | | | | | | | | | | | | |
| | (Cost $323,095) | | | | | | | 323,095 | | | | 2.57 | % |
| | | | | | | | | | | | | | |
| | | | Number | | | | | | | | | |
| | | | of Shares | | | | | | | | | |
| | US Treasury Bills – 43.25% | | | | | | | | | | | | |
| | 0.875%, 05/31/2011 (b) | | | 300,000 | | | | 300,234 | | | | 2.39 | % |
| | 5.000%, 08/15/2011 (b) | | | 900,000 | | | | 913,008 | | | | 7.27 | % |
| | 4.500%, 09/30/2011 (b) | | | 900,000 | | | | 916,453 | | | | 7.30 | % |
| | 0.0700%, 11/17/2011 (b) | | | 700,000 | | | | 699,652 | | | | 5.57 | % |
| | 0.7500%, 11/30/2011 (b) | | | 700,000 | | | | 702,543 | | | | 5.60 | % |
| | 0.3050%, 02/09/2012 (b) | | | 1,900,000 | | | | 1,898,060 | | | | 15.12 | % |
| | | | | | | | | | | | | | |
| | Total U.S. Treasury Bills | | | | | | | | | | | | |
| | (Cost $5,427,828) | | | | | | | 5,429,950 | | | | 43.25 | % |
| | | | | | | | | | | | | | |
| | Total Short-Term Investments | | | | | | | | | | | | |
| | (Cost $5,750,923) | | | | | | | 5,753,045 | | | | 45.82 | % |
| | | | | | | | | | | | | | |
| | Total Investments – 99.61% | | | | | | | | | | | | |
| | (Cost $11,456,168) | | | | | | | 12,306,310 | | | | 98.01 | % |
| | | | | | | | | | | | | | |
| | Other Assets in Excess of Liabilities – 0.39% | | | | | | | 249,368 | | | | 1.99 | % |
| | TOTAL NET ASSETS – 100.00% | | | | | | $ | 12,555,678 | | | | 100.00 | % |
Percentages are stated as a percent of net assets.
(a)The rate listed is the Fund’s 7-day yield as of April 30, 2011
(b)The rate listed is the rate at issue.
Summary of Fair Value Exposure at April 30, 2011
The Fund has adopted authoritative fair valuation accounting standards which establish an authoritative definition of fair value and set out a hierarchy for measuring fair value. These standards require additional disclosures about the various inputs and valuation techniques used to develop the measurements of fair value and a discussion in changes in valuation techniques and related inputs during the period. These inputs are summarized in the three broad levels listed below.
Securities which are traded on a national or recognized stock exchange are valued at the last sale price on the securities exchange on which such securities are primarily traded.
The accompanying notes are an integral part of these financial statements.
SCHEDULE OF INVESTMENTS — HENNESSY BALANCED FUND
Exchange-traded securities for which there were no transactions that day and debt securities are valued at the most recent bid prices. Instruments with a remaining maturity of 60 days or less are valued on an amortized cost basis. When a price for an underlying security is not readily available or if a significant event has occurred that indicates the closing price of a security no longer represents the true value of that security, fair value pricing procedures have been adopted by the Board of Directors of the Funds. Fair value pricing determinations are made in good faith in accordance with these procedures. There are numerous criteria that will be given consideration in determining a fair value of a security. Some of these criteria are: trading volume of security and markets, value of other like securities and news events with direct bearing to security or market. Fair value pricing results in an estimated price that reasonably reflects the current market conditions in order to rate the portfolio holdings such that shareholder transactions receive a fair net asset value.
The Fund has performed an analysis of all existing investments to determine the significance and character of all inputs to their fair value determination.
| | Level 1 – | Quoted unadjusted prices for identical instruments in active markets to which the Fund has access at the date of measurement. |
| | Level 2 – | Quoted prices for similar instruments in active markets; quoted prices for identical or similar instruments in markets that are not active; and model-derived valuations in which all significant inputs and significant value drivers are observable in active markets. Level 2 inputs are those in markets for which there are few transactions, the prices are not current, little public information exists or instances where prices vary substantially over time or among brokered market makers. |
| | Level 3 – | Model derived valuations in which one or more significant inputs or significant value drivers are unobservable. Unobservable inputs are those inputs that reflect the Fund’s own assumptions that market participants would use to price the asset or liability based on the best available information. |
The inputs or methodology used for valuing securities are not an indication of the risk associated with investing in those securities.
The following is a summary of the inputs used to value the Fund’s net assets as of April 30, 2011:
| | Common Stock | | Level 1 | | | Level 2 | | | Level 3 | | | Total | |
| | Consumer Discretionary | | $ | 545,349 | | | $ | — | | | $ | — | | | $ | 545,349 | |
| | Consumer Staples | | | 975,846 | | | | — | | | | — | | | | 975,846 | |
| | Energy | | | 350,208 | | | | — | | | | — | | | | 350,208 | |
| | Health Care | | | 1,980,275 | | | | — | | | | — | | | | 1,980,275 | |
| | Industrials | | | 108,385 | | | | — | | | | — | | | | 108,385 | |
| | Information Technology | | | 612,216 | | | | — | | | | — | | | | 612,216 | |
| | Materials | | | 655,924 | | | | — | | | | — | | | | 655,924 | |
| | Telecommunication Services | | | 1,325,062 | | | | — | | | | — | | | | 1,325,062 | |
| | Total Common Stock | | $ | 6,553,265 | | | $ | — | | | $ | — | | | $ | 6,553,265 | |
| | Short-Term Investments | | $ | 323,095 | | | $ | 5,429,950 | | | $ | — | | | $ | 5,753,045 | |
| | Total Investments in Securities | | $ | 6,876,360 | | | $ | 5,429,950 | | | $ | — | | | $ | 12,306,310 | |
Transfers between levels are recognized at the end of the reporting period. During the period ended April 30, 2011, the Fund recognized no significant transfers between levels.
The accompanying notes are an integral part of these financial statements.
HENNESSY FUNDS 1-800-966-4354
Financial Statements
Statements of Assets and Liabilities as of April 30, 2011 (Unaudited) |
| | | HENNESSY | |
| | | CORNERSTONE | |
| | | GROWTH FUND | |
| ASSETS: | | | |
| Investments in securities, at value (cost $188,353,516, $24,646,668, $122,151,058 | | $ | 214,688,784 | |
| $67,893,195, $125,286,126, $84,715,221 and $11,656,168, respectively) | | | | |
| Dividends and interest receivable | | | 4,344 | |
| Receivable for fund shares sold | | | 24,435 | |
| Receivable for securities sold | | | 4,981,519 | |
| Prepaid expenses and other assets | | | 22,778 | |
| Total Assets | | | 219,721,860 | |
| | | | | |
| LIABILITIES: | | | | |
| Loan Payable | | | 288,000 | |
| Payable for securities purchased | | | — | |
| Payable for fund shares redeemed | | | 185,974 | |
| Payable to Advisor | | | 130,941 | |
| Payable to Administrator | | | 176,384 | |
| Reverse repurchase agreement | | | — | |
| Accrued interest payable | | | — | |
| Accrued directors fees | | | 3,174 | |
| Accrued service fees | | | 17,447 | |
| Accrued expenses and other payables | | | 73,940 | |
| Total Liabilities | | | 875,860 | |
| NET ASSETS | | $ | 218,846,000 | |
| | | | | |
| NET ASSETS CONSIST OF: | | | | |
| Capital stock | | $ | 431,140,030 | |
| Accumulated net investment income (loss) | | | (937,213 | ) |
| Accumulated net realized gain (loss) on investments | | | (237,692,085 | ) |
| Unrealized net appreciation (depreciation) on investments | | | 26,335,268 | |
| Total Net Assets | | $ | 218,846,000 | |
| | | | | |
| NET ASSETS | | | | |
| Original Class: | | | | |
| Shares authorized ($.0001 par value) | | | 25,000,000,000 | |
| Net assets applicable to outstanding Original Class shares | | | 215,728,401 | |
| Shares issued and outstanding | | | 17,482,931 | |
| Net asset value, offering price and redemption price per share | | $ | 12.34 | |
| | | | | |
| Institutional Class: | | | | |
| Shares authorized ($.0001 par value) | | | 25,000,000,000 | |
| Net assets applicable to outstanding Institutional Class shares | | | 3,117,599 | |
| Shares issued and outstanding | | | 249,985 | |
| Net asset value, offering price and redemption price per share | | $ | 12.47 | |
The accompanying notes are an integral part of these financial statements.
FINANCIAL STATEMENTS — STATEMENTS OF ASSETS AND LIABILITIES
| HENNESSY | | | | | | HENNESSY | | | | | | | | | | |
| CORNERSTONE | | | HENNESSY | | | CORNERSTONE | | | HENNESSY | | | HENNESSY | | | HENNESSY | |
| GROWTH FUND, | | | FOCUS 30 | | | LARGE GROWTH | | | CORNERSTONE | | | TOTAL RETURN | | | BALANCED | |
| SERIES II | | | FUND | | | FUND | | | VALUE FUND | | | FUND | | | FUND | |
| | | | | | | | | | | | | | | | | |
| | | | | | | | | | | | | | | | | |
| $ | 32,892,891 | | | $ | 165,401,775 | | | $ | 89,021,827 | | | $ | 146,251,049 | | | $ | 92,698,435 | | | $ | 12,306,310 | |
| | 3,433 | | | | 23,003 | | | | 92,612 | | | | 264,412 | | | | 137,254 | | | | 37,144 | |
| | 2,151 | | | | 85,143 | | | | 1,604 | | | | — | | | | 31,500 | | | | — | |
| | — | | | | — | | | | — | | | | — | | | | — | | | | 317,840 | |
| | 23,863 | | | | 23,286 | | | | 21,500 | | | | 26,590 | | | | 14,618 | | | | 16,782 | |
| | 32,922,338 | | | | 165,533,207 | | | | 89,137,543 | | | | 146,542,051 | | | | 92,881,807 | | | | 12,678,076 | |
| | | | | | | | | | | | | | | | | | | | | | | |
| | | | | | | | | | | | | | | | | | | | | | | |
| | — | | | | — | | | | — | | | | — | | | | — | | | | — | |
| | — | | | | — | | | | — | | | | — | | | | — | | | | 79,680 | |
| | 21,068 | | | | 94,232 | | | | 2,553 | | | | 60,991 | | | | 66,231 | | | | — | |
| | 20,061 | | | | 97,980 | | | | 65,345 | | | | 87,237 | | | | 34,114 | | | | 6,124 | |
| | 28,582 | | | | 122,925 | | | | 70,550 | | | | 116,225 | | | | 57,348 | | | | 10,376 | |
| | — | | | | — | | | | — | | | | — | | | | 22,487,500 | | | | — | |
| | — | | | | — | | | | — | | | | — | | | | 9,676 | | | | — | |
| | 2,009 | | | | 2,230 | | | | 649 | | | | 1,826 | | | | 1,362 | | | | 1,384 | |
| | 2,678 | | | | 11,314 | | | | 7,128 | | | | 11,696 | | | | 5,685 | | | | 1,021 | |
| | 30,166 | | | | 58,347 | | | | 22,436 | | | | 42,551 | | | | 41,807 | | | | 23,813 | |
| | 104,564 | | | | 387,028 | | | | 168,661 | | | | 320,526 | | | | 22,703,723 | | | | 122,398 | |
| $ | 32,817,774 | | | $ | 165,146,179 | | | $ | 88,968,882 | | | $ | 146,221,525 | | | $ | 70,178,084 | | | $ | 12,555,678 | |
| | | | | | | | | | | | | | | | | | | | | | | |
| | | | | | | | | | | | | | | | | | | | | | | |
| $ | 78,012,029 | | | $ | 185,114,634 | | | $ | 67,101,486 | | | $ | 172,681,734 | | | $ | 74,666,662 | | | $ | 13,527,422 | |
| | (134,174 | ) | | | (702,644 | ) | | | 312,133 | | | | 916,684 | | | | 61,228 | | | | 3,387 | |
| | (53,306,304 | ) | | | (62,516,528 | ) | | | 426,631 | | | | (48,341,816 | ) | | | (12,533,020 | ) | | | (1,825,273 | ) |
| | 8,246,223 | | | | 43,250,717 | | | | 21,128,632 | | | | 20,964,923 | | | | 7,983,214 | | | | 850,142 | |
| $ | 32,817,774 | | | $ | 165,146,179 | | | $ | 88,968,882 | | | $ | 146,221,525 | | | $ | 70,178,084 | | | $ | 12,555,678 | |
| | | | | | | | | | | | | | | | | | | | | | | |
| | | | | | | | | | | | | | | | | | | | | | | |
| | | | | | | | | | | | | | | | | | | | | | | |
| Unlimited | | | | 25,000,000,000 | | | Unlimited | | | | 25,000,000,000 | | | | 100,000,000 | | | | 100,000,000 | |
| | 32,333,536 | | | | 140,837,003 | | | | 88,866,095 | | | | 145,069,635 | | | | 70,178,084 | | | | 12,555,678 | |
| | 1,910,297 | | | | 10,261,862 | | | | 6,590,502 | | | | 10,791,192 | | | | 6,049,690 | | | | 1,121,679 | |
| $ | 16.93 | | | $ | 13.72 | | | $ | 13.48 | | | $ | 13.44 | | | $ | 11.60 | | | $ | 11.19 | |
| | | | | | | | | | | | | | | | | | | | | | | |
| Unlimited | | | | 25,000,000,000 | | | Unlimited | | | | 25,000,000,000 | | | | N/A | | | | N/A | |
| | 484,238 | | | | 24,309,176 | | | | 102,787 | | | | 1,151,890 | | | | | | | | | |
| | 28,038 | | | | 1,750,454 | | | | 7,591 | | | | 85,721 | | | | | | | | | |
| $ | 17.27 | | | $ | 13.89 | | | $ | 13.54 | | | $ | 13.44 | | | | | | | | | |
HENNESSY FUNDS 1-800-966-4354
Financial Statements
Statements of Operations Six Months Ended April 30, 2011 (Unaudited) |
| | | HENNESSY | |
| | | CORNERSTONE | |
| | | GROWTH FUND | |
| INVESTMENT INCOME: | | | |
Dividend income(1) | | $ | 460,742 | |
| Interest income | | | 1,985 | |
| Total investment income | | | 462,727 | |
| | | | | |
| EXPENSES: | | | | |
| Investment advisory fees | | | 780,297 | |
| Administration, fund accounting, custody and transfer agent fees | | | 268,886 | |
| Distribution fees – Original Class (See Note 5) | | | — | |
| Service fees – Original Class (See Note 5) | | | 103,924 | |
| Federal and state registration fees | | | 15,883 | |
| Audit fees | | | 12,149 | |
| Legal fees | | | 5,951 | |
| Compliance expense | | | 3,602 | |
| Reports to shareholders | | | 36,200 | |
| Directors’ fees and expenses | | | 4,300 | |
| Sub-transfer agent expenses – Original Class (See Note 5) | | | 155,886 | |
| Sub-transfer agent expenses – Institutional Class (See Note 5) | | | 362 | |
| Interest expense (See Note 3 and 6) | | | 116 | |
| Other | | | 14,297 | |
| Total expenses before reimbursement from advisor | | | 1,401,853 | |
| Expense recoupment by advisor – Original Class | | | — | |
| Expense reimbursement from advisor – Institutional Class | | | — | |
| Administration expense waiver (See Note 5) | | | (1,913 | ) |
| Net expenses | | | 1,399,940 | |
| NET INVESTMENT INCOME (LOSS) | | $ | (937,213 | ) |
| | | | | |
| REALIZED AND UNREALIZED GAINS (LOSSES): | | | | |
| Net realized gain (loss) on investments | | $ | 40,308,124 | |
| Change in unrealized appreciation (depreciation) on investments | | | (475,472 | ) |
| Net gain (loss) on investments | | | 39,832,652 | |
| NET INCREASE (DECREASE) IN NET ASSETS RESULTING FROM OPERATIONS | | $ | 38,895,439 | |
(1) Net of foreign taxes withheld of $2,555, $0, $0, $0, $84,988 $0 and $0, respectively.
The accompanying notes are an integral part of these financial statements.
FINANCIAL STATEMENTS — STATEMENTS OF OPERATIONS
| HENNESSY | | | | | | HENNESSY | | | | | | | | | | |
| CORNERSTONE | | | HENNESSY | | | CORNERSTONE | | | HENNESSY | | | HENNESSY | | | HENNESSY | |
| GROWTH FUND, | | | FOCUS 30 | | | LARGE GROWTH | | | CORNERSTONE | | | TOTAL RETURN | | | BALANCED | |
| SERIES II | | | FUND | | | FUND | | | VALUE FUND | | | FUND | | | FUND | |
| | | | | | | | | | | | | | | | | |
| $ | 125,579 | | | $ | 324,120 | | | $ | 844,171 | | | $ | 2,571,760 | | | $ | 961,832 | | | $ | 125,039 | |
| | 1,291 | | | | 631 | | | | 250 | | | | 1,624 | | | | 21,302 | | | | 6,865 | |
| | 126,870 | | | | 324,751 | | | | 844,421 | | | | 2,573,384 | | | | 983,134 | | | | 131,904 | |
| | | | | | | | | | | | | | | | | | | | | | | |
| | | | | | | | | | | | | | | | | | | | | | | |
| | 124,437 | | | | 577,822 | | | | 303,123 | | | | 533,598 | | | | 203,062 | | | | 36,947 | |
| | 42,880 | | | | 199,114 | | | | 104,455 | | | | 183,875 | | | | 86,301 | | | | 15,703 | |
| | — | | | | — | | | | — | | | | — | | | | 50,766 | | | | 9,237 | |
| | 16,575 | | | | 66,940 | | | | 40,918 | | | | 71,493 | | | | 33,844 | | | | 6,158 | |
| | 14,926 | | | | 17,263 | | | | 24,465 | | | | 20,728 | | | | 14,263 | | | | 13,894 | |
| | 9,589 | | | | 9,298 | | | | 8,927 | | | | 10,474 | | | | 9,578 | | | | 9,785 | |
| | 5,951 | | | | 4,463 | | | | 5,949 | | | | 6,199 | | | | 3,472 | | | | 2,976 | |
| | 3,602 | | | | 3,602 | | | | 3,602 | | | | 3,602 | | | | 3,602 | | | | 3,539 | |
| | 7,439 | | | | 24,795 | | | | 7,439 | | | | 17,356 | | | | 6,000 | | | | 1,587 | |
| | 4,604 | | | | 4,469 | | | | 4,959 | | | | 4,881 | | | | 1,971 | | | | 2,471 | |
| | 28,184 | | | | 120,492 | | | | 10,219 | | | | 71,493 | | | | — | | | | — | |
| | 180 | | | | 6,654 | | | | — | | | | 105 | | | | N/A | | | | N/A | |
| | 651 | | | | 1,763 | | | | — | | | | 703 | | | | 35,829 | | | | — | |
| | 2,945 | | | | 9,535 | | | | 5,767 | | | | 9,866 | | | | 4,080 | | | | 1,598 | |
| | 261,963 | | | | 1,046,210 | | | | 519,823 | | | | 934,373 | | | | 452,768 | | | | 103,895 | |
| | — | | | | — | | | | 12,540 | | | | — | | | | — | | | | — | |
| | (305 | ) | | | — | | | | — | | | | — | | | | N/A | | | | N/A | |
| | (614 | ) | | | (18,815 | ) | | | (75 | ) | | | (814 | ) | | | — | | | | — | |
| | 261,044 | | | | 1,027,395 | | | | 532,288 | | | | 933,559 | | | | 452,768 | | | | 103,895 | |
| $ | (134,174 | ) | | $ | (702,644 | ) | | $ | 312,133 | | | $ | 1,639,825 | | | $ | 530,366 | | | $ | 28,009 | |
| | | | | | | | | | | | | | | | | | | | | | | |
| | | | | | | | | | | | | | | | | | | | | | | |
| $ | 983,599 | | | $ | 2,923,141 | | | $ | 426,662 | | | $ | 10,148,372 | | | $ | 1,273,110 | | | $ | 436,166 | |
| | 5,370,644 | | | | 29,868,463 | | | | 11,855,553 | | | | 2,633,514 | | | | 5,085,656 | | | | 436,708 | |
| | 6,354,243 | | | | 32,791,604 | | | | 12,282,215 | | | | 12,781,886 | | | | 6,358,766 | | | | 872,874 | |
| $ | 6,220,069 | | | $ | 32,088,960 | | | $ | 12,594,348 | | | $ | 14,421,711 | | | $ | 6,889,132 | | | $ | 900,883 | |
HENNESSY FUNDS 1-800-966-4354
| Statements of Changes in Net Assets |
| | | | |
| | | Hennessy Cornerstone Growth Fund | |
| | | Six Months Ended | | | | |
| | | April 30, 2011 | | | Year Ended | |
| | | (Unaudited) | | | October 31, 2010 | |
| OPERATIONS: | | | | | | |
| Net investment income (loss) | | $ | (937,213 | ) | | $ | (1,966,127 | ) |
| Net realized gain (loss) | | | 40,308,124 | | | | 14,472,259 | |
| Change in unrealized appreciation (depreciation) | | | (475,472 | ) | | | 22,544,637 | |
| Net increase (decrease) in net assets resulting from operations | | | 38,895,439 | | | | 35,050,769 | |
| | | | | | | | | |
| CAPITAL SHARE TRANSACTIONS: | | | | | | | | |
| Proceeds from shares subscribed – Original Class | | | 3,151,245 | | | | 7,339,703 | |
| Proceeds from shares subscribed – Institutional Class | | | 46,605 | | | | 101,206 | |
| Dividends reinvested – Original Class | | | — | | | | — | |
| Dividends reinvested – Institutional Class | | | — | | | | — | |
| Cost of shares redeemed – Original Class | | | (32,872,400 | ) | | | (63,688,140 | ) |
| Cost of shares redeemed – Institutional Class | | | (608,322 | ) | | | (2,208,458 | ) |
| Net increase (decrease) in net assets | | | | | | | | |
| derived from capital share transactions | | | (30,282,872 | ) | | | (58,455,689 | ) |
| TOTAL INCREASE (DECREASE) IN NET ASSETS | | | 8,612,567 | | | | (23,404,920 | ) |
| | | | | | | | | |
| NET ASSETS: | | | | | | | | |
| Beginning of period | | | 210,233,433 | | | | 233,638,353 | |
| End of period | | $ | 218,846,000 | | | $ | 210,233,433 | |
| Accumulated net investment income (loss), end of period | | $ | (937,213 | ) | | $ | — | |
| | | | | | | | | |
| CHANGES IN SHARES OUTSTANDING: | | | | | | | | |
| Shares sold – Original Class | | | 283,053 | | | | 762,956 | |
| Shares sold – Institutional Class | | | 4,074 | | | | 9,629 | |
| Shares redeemed – Original Class | | | (2,945,030 | ) | | | (6,593,042 | ) |
| Shares redeemed – Institutional Class | | | (55,337 | ) | | | (236,335 | ) |
| Net increase (decrease) in shares outstanding | | | (2,713,240 | ) | | | (6,056,792 | ) |
The accompanying notes are an integral part of these financial statements.
FINANCIAL STATEMENTS — STATEMENTS OF CHANGES IN NET ASSETS
| Hennessy Cornerstone | | | | |
| Growth Fund, Series II | | | Hennessy Focus 30 Fund | |
| Six Months Ended | | | | | | Six Months Ended | | | | |
| April 30, 2011 | | | Year Ended | | | April 30, 2011 | | | Year Ended | |
| (Unaudited) | | | October 31, 2010 | | | (Unaudited) | | | October 31, 2010 | |
| | | | | | | | | | | |
| $ | (134,174 | ) | | $ | (239,567 | ) | | $ | (702,644 | ) | | $ | (285,570 | ) |
| | 983,599 | | | | 7,072,147 | | | | 2,923,141 | | | | 23,675,034 | |
| | 5,370,644 | | | | 377,453 | | | | 29,868,463 | | | | 13,440,791 | |
| | 6,220,069 | | | | 7,210,033 | | | | 32,088,960 | | | | 36,830,255 | |
| | | | | | | | | | | | | | | |
| | 2,607,158 | | | | 2,100,537 | | | | 12,699,154 | | | | 9,963,583 | |
| | 28,658 | | | | 213,468 | | | | 1,620,294 | | | | 1,798,787 | |
| | — | | | | — | | | | — | | | | — | |
| | — | | | | — | | | | — | | | | — | |
| | (6,571,241 | ) | | | (8,878,696 | ) | | | (22,495,426 | ) | | | (45,927,136 | ) |
| | (60,164 | ) | | | (149,711 | ) | | | (3,343,731 | ) | | | (13,886,035 | ) |
| | | | | | | | | | | | | | | |
| | (3,995,589 | ) | | | (6,714,402 | ) | | | (11,519,709 | ) | | | (48,050,801 | ) |
| | 2,224,480 | | | | 495,631 | | | | 20,569,251 | | | | (11,220,546 | ) |
| | | | | | | | | | | | | | | |
| | 30,593,294 | | | | 30,097,663 | | | | 144,576,928 | | | | 155,797,474 | |
| $ | 32,817,774 | | | $ | 30,593,294 | | | $ | 165,146,179 | | | $ | 144,576,928 | |
| $ | (134,174 | ) | | $ | — | | | $ | (702,644 | ) | | $ | — | |
| | | | | | | | | | | | | | | |
| | 162,144 | | | | 159,641 | | | | 1,043,131 | | | | 981,821 | |
| | 1,782 | | | | 16,034 | | | | 127,896 | | | | 182,320 | |
| | (408,138 | ) | | | (692,223 | ) | | | (1,803,026 | ) | | | (4,668,242 | ) |
| | (3,619 | ) | | | (11,474 | ) | | | (271,086 | ) | | | (1,414,793 | ) |
| | (247,831 | ) | | | (528,022 | ) | | | (903,085 | ) | | | (4,918,894 | ) |
HENNESSY FUNDS 1-800-966-4354
Financial Statements
| Statements of Changes in Net Assets |
OPERATIONS:
Net investment income (loss)
Net realized gain (loss)
Change in unrealized appreciation (depreciation)
Net increase (decrease) in net assets resulting from operations
DISTRIBUTIONS TO SHAREHOLDERS FROM:
Net investment income – Original Class
Net investment income – Institutional Class
Net realized gains – Original Class
Net realized gains – Institutional Class
Total distributions
CAPITAL SHARE TRANSACTIONS:
Proceeds from shares subscribed – Original Class
Proceeds from shares subscribed – Institutional Class
Dividends reinvested – Original Class
Dividends reinvested – Institutional Class
Cost of shares redeemed – Original Class
Cost of shares redeemed – Institutional Class
Net increase (decrease) in net assets derived from capital share transactions
TOTAL INCREASE (DECREASE) IN NET ASSETS
NET ASSETS:
Beginning of period
End of period
Accumulated net investment income (loss), end of period
CHANGES IN SHARES OUTSTANDING:
Shares sold – Original Class
Shares sold – Institutional Class
Shares issued to holders as reinvestment of dividends – Original Class
Shares issued to holders as reinvestment of dividends – Institutional Class
Shares redeemed – Original Class
Shares redeemed – Institutional Class
Net increase (decrease) in shares outstanding
The accompanying notes are an integral part of these financial statements.
FINANCIAL STATEMENTS — STATEMENTS OF CHANGES IN NET ASSETS
| Hennessy Cornerstone | | | Hennessy Cornerstone | |
| Large Growth Fund | | | Value Fund | |
| Six Months Ended | | | | | | Six Months Ended | | | | |
| April 30, 2011 | | | Year Ended | | | April 30, 2011 | | | Year Ended | |
| (Unaudited) | | | October 31, 2010 | | | (Unaudited) | | | October 31, 2010 | |
| | | | | | | | | | | |
| $ | 312,133 | | | $ | 631,108 | | | $ | 1,639,825 | | | $ | 3,555,372 | |
| | 426,662 | | | | 21,551,713 | | | | 10,148,372 | | | | 18,520,349 | |
| | 11,855,553 | | | | (6,245,779 | ) | | | 2,633,514 | | | | 6,342,542 | |
| | 12,594,348 | | | | 15,937,042 | | | | 14,421,711 | | | | 28,418,263 | |
| | | | | | | | | | | | | | | |
| | (626,839 | ) | | | (358,186 | ) | | | (4,238,610 | ) | | | (2,734,232 | ) |
| | (968 | ) | | | (235 | ) | | | (44,764 | ) | | | (23,987 | ) |
| | (109,149 | ) | | | — | | | | — | | | | — | |
| | (99 | ) | | | — | | | | — | | | | — | |
| | (737,055 | ) | | | (358,421 | ) | | | (4,283,374 | ) | | | (2,758,219 | ) |
| | | | | | | | | | | | | | | |
| | 658,726 | | | | 993,869 | | | | 6,829,223 | | | | 49,512,976 | |
| | 44,308 | | | | 19,385 | | | | 17,127 | | | | 131,171 | |
| | 671,356 | | | | 322,821 | | | | 3,846,379 | | | | 2,464,535 | |
| | 1,067 | | | | 235 | | | | 25,543 | | | | 14,973 | |
| | (3,141,033 | ) | | | (7,463,986 | ) | | | (31,537,195 | ) | | | (67,467,108 | ) |
| | (21,081 | ) | | | (2,812 | ) | | | (319,832 | ) | | | (106,415 | ) |
| | (1,786,657 | ) | | | (6,130,488 | ) | | | (21,138,755 | ) | | | (15,449,868 | ) |
| | 10,070,636 | | | | 9,448,133 | | | | (11,000,418 | ) | | | 10,210,176 | |
| | | | | | | | | | | | | | | |
| | | | | | | | | | | | | | | |
| | 78,898,246 | | | | 69,450,113 | | | | 157,221,943 | | | | 147,011,767 | |
| $ | 88,968,882 | | | $ | 78,898,246 | | | $ | 146,221,525 | | | $ | 157,221,943 | |
| $ | 312,133 | | | $ | 627,807 | | | $ | 916,684 | | | $ | 3,560,233 | |
| | | | | | | | | | | | | | | |
| | 52,921 | | | | 94,024 | | | | 540,539 | | | | 4,255,144 | |
| | 3,648 | | | | 1,859 | | | | 1,368 | | | | 11,283 | |
| | 55,671 | | | | 31,251 | | | | 312,206 | | | | 216,187 | |
| | 88 | | | | 23 | | | | 2,077 | | | | 1,315 | |
| | (254,799 | ) | | | (699,229 | ) | | | (2,504,283 | ) | | | (5,758,045 | ) |
| | (1,715 | ) | | | (278 | ) | | | (25,234 | ) | | | (9,166 | ) |
| | (144,186 | ) | | | (572,350 | ) | | | (1,673,327 | ) | | | (1,283,282 | ) |
HENNESSY FUNDS 1-800-966-4354
Financial Statements
| Statements of Changes in Net Assets |
OPERATIONS:
Net investment income (loss)
Net realized gain (loss)
Change in unrealized appreciation (depreciation)
Net increase (decrease) in net assets resulting from operations
DISTRIBUTIONS TO SHAREHOLDERS FROM:
Net investment income – Original Class
Net realized gains – Original Class
Total distributions
CAPITAL SHARE TRANSACTIONS:
Proceeds from shares subscribed – Original Class
Dividends reinvested – Original Class
Cost of shares redeemed – Original Class
Net increase (decrease) in net assets
derived from capital share transactions
TOTAL INCREASE (DECREASE) IN NET ASSETS
NET ASSETS:
Beginning of period
End of period
Accumulated net investment income (loss), end of period
CHANGES IN SHARES OUTSTANDING:
Shares sold
Original Class
Shares issued to holders as reinvestment of dividends
Original Class
Shares redeemed
Original Class
Net increase (decrease) in shares outstanding
The accompanying notes are an integral part of these financial statements.
FINANCIAL STATEMENTS — STATEMENTS OF CHANGES IN NET ASSETS
| | | | | |
| Hennessy Total Return Fund | | | Hennessy Balanced Fund | |
| Six Months Ended | | | | | | Six Months Ended | | | | |
| April 30, 2011 | | | Year Ended | | | April 30, 2011 | | | Year Ended | |
| (Unaudited) | | | October 31, 2010 | | | (Unaudited) | | | October 31, 2010 | |
| | | | | | | | | | | |
| $ | 530,366 | | | $ | 912,419 | | | $ | 28,009 | | | $ | 54,804 | |
| | 1,273,110 | | | | 5,573,895 | | | | 436,166 | | | | 1,256,664 | |
| | 5,085,656 | | | | 3,246,579 | | | | 436,708 | | | | (115,945 | ) |
| | 6,889,132 | | | | 9,732,893 | | | | 900,883 | | | | 1,195,523 | |
| | | | | | | | | | | | | | | |
| | | | | | | | | | | | | | | |
| | (525,891 | ) | | | (942,536 | ) | | | (28,788 | ) | | | (55,545 | ) |
| | — | | | | — | | | | — | | | | — | |
| | (525,891 | ) | | | (942,536 | ) | | | (28,788 | ) | | | (55,545 | ) |
| | | | | | | | | | | | | | | |
| | | | | | | | | | | | | | | |
| | 5,782,895 | | | | 16,112,008 | | | | 395,602 | | | | 1,313,838 | |
| | 477,376 | | | | 869,098 | | | | 27,968 | | | | 54,019 | |
| | (11,521,229 | ) | | | (9,075,344 | ) | | | (1,243,751 | ) | | | (1,475,154 | ) |
| | | | | | | | | | | | | | | |
| | (5,260,958 | ) | | | 7,905,762 | | | | (820,181 | ) | | | (107,297 | ) |
| | 1,102,283 | | | | 16,696,119 | | | | 51,914 | | | | 1,032,681 | |
| | | | | | | | | | | | | | | |
| | 69,075,801 | | | | 52,379,682 | | | | 12,503,764 | | | �� | 11,471,083 | |
| $ | 70,178,084 | | | $ | 69,075,801 | | | $ | 12,555,678 | | | $ | 12,503,764 | |
| $ | 61,228 | | | $ | 56,753 | | | $ | 3,387 | | | $ | 4,166 | |
| | | | | | | | | | | | | | | |
| | | | | | | | | | | | | | | |
| | | | | | | | | | | | | | | |
| | 534,001 | | | | 1,607,841 | | | | 37,192 | | | | 130,219 | |
| | | | | | | | | | | | | | | |
| | 42,930 | | | | 87,092 | | | | 2,600 | | | | 5,440 | |
| | | | | | | | | | | | | | | |
| | (1,063,176 | ) | | | (916,937 | ) | | | (116,445 | ) | | | (147,584 | ) |
| | (486,245 | ) | | | 777,996 | | | | (76,653 | ) | | | (11,925 | ) |
HENNESSY FUNDS 1-800-966-4354
(This Page Intentionally Left Blank.)
FINANCIAL STATEMENTS — STATEMENT OF CASH FLOWS
Statement of Cash Flows
Hennessy Total Return Fund For the Six Months Ended April 30, 2011 (Unaudited) |
| Cash Flows From Operating Activities: | | | |
| | | | |
| Net decrease in net assets from operations | | $ | 6,889,132 | |
| Adjustments to reconcile net decrease in net assets from | | | | |
| operations to net cash provided by operating activities: | | | | |
| Purchase of investment securities | | | (119,965,900 | ) |
| Proceeds on sale of securities | | | 126,839,350 | |
| Decrease in other receivables, net | | | 150,814 | |
| Decrease in other assets | | | 4,105 | |
| Decrease in accrued expenses and other payables | | | 48,017 | |
| Net accretion of discount on securities | | | (20,903 | ) |
| Net realized gain on investments | | | (1,273,110 | ) |
| Unrealized appreciation on securities | | | (5,085,656 | ) |
| Net cash provided by operating activities | | $ | 7,585,849 | |
| | | | | |
| Cash Flows From Financing Activities: | | | | |
| | | | | |
| Decrease in reverse repurchase agreements | | $ | (1,799,000 | ) |
| Proceeds on shares sold | | | 5,782,895 | |
| Payment on shares repurchased | | | (11,521,229 | ) |
| Cash dividends paid | | | (48,515 | ) |
| Net cash used in financing activities | | $ | (7,585,849 | ) |
| | | | | |
| Cash at beginning of period | | | — | |
| Cash at end of period | | | — | |
| Net increase (decrease) in cash | | $ | — | |
| | | | | |
| Cash paid for interest | | $ | 32,240 | |
The accompanying notes are an integral part of these financial statements.
HENNESSY FUNDS 1-800-966-4354
Financial Highlights
| Hennessy Cornerstone Growth Fund |
For an Original Class share outstanding throughout each period
| | | Six Months Ended | |
| | | April 30, 2011 | |
| | | (Unaudited) | |
| PER SHARE DATA: | | | |
| Net asset value, beginning of period | | $ | 10.28 | |
| | | | | |
| Income from investment operations: | | | | |
| Net investment income (loss) | | | (0.05 | ) |
| Net realized and unrealized gains (losses) on securities | | | 2.11 | |
| Total from investment operations | | | 2.06 | |
| | | | | |
| Less Distributions: | | | | |
| Dividends from net investment income | | | — | |
| Dividends from net realized gains | | | — | |
| Total distributions | | | — | |
| Net asset value, end of period | | $ | 12.34 | |
| | | | | |
| TOTAL RETURN | | | 20.04 | %(1) |
| | | | | |
| SUPPLEMENTAL DATA AND RATIOS: | | | | |
| Net assets, end of period (millions) | | $ | 215.73 | |
| Ratio of expenses to average net assets: | | | 1.33 | %(2) |
| Ratio of net investment loss to average net assets | | | (0.44 | )%(2) |
Portfolio turnover rate(3) | | | 100 | %(1) |
| (3) | Portfolio turnover is calculated on the basis of the Fund as a whole. |
The accompanying notes are an integral part of these financial statements.
FINANCIAL HIGHLIGHTS — HENNESSY CORNERSTONE GROWTH FUND
| Year Ended October 31, | |
| 2010 | | | 2009 | | | 2008 | | | 2007 | | | 2006 | |
| | | | | | | | | | | | | | |
| $ | 8.81 | | | $ | 8.80 | | | $ | 19.41 | | | $ | 20.77 | | | $ | 19.49 | |
| | | | | | | | | | | | | | | | | | | |
| | | | | | | | | | | | | | | | | | | |
| | (0.10 | ) | | | (0.04 | ) | | | (0.05 | ) | | | (0.07 | ) | | | (0.04 | ) |
| | 1.57 | | | | 0.05 | | | | (8.32 | ) | | | 1.82 | | | | 2.55 | |
| | 1.47 | | | | 0.01 | | | | (8.37 | ) | | | 1.75 | | | | 2.51 | |
| | | | | | | | | | | | | | | | | | | |
| | | | | | | | | | | | | | | | | | | |
| | — | | | | — | | | | — | | | | — | | | | — | |
| | — | | | | — | | | | (2.24 | ) | | | (3.11 | ) | | | (1.23 | ) |
| | — | | | | — | | | | (2.24 | ) | | | (3.11 | ) | | | (1.23 | ) |
| $ | 10.28 | | | $ | 8.81 | | | $ | 8.80 | | | $ | 19.41 | | | $ | 20.77 | |
| | | | | | | | | | | | | | | | | | | |
| | 16.69 | % | | | 0.11 | % | | | (48.00 | )% | | | 9.65 | % | | | 13.59 | % |
| | | | | | | | | | | | | | | | | | | |
| | | | | | | | | | | | | | | | | | | |
| $ | 207.11 | | | $ | 228.96 | | | $ | 312.50 | | | $ | 990.43 | | | $ | 1,250.67 | |
| | 1.34 | % | | | 1.36 | % | | | 1.25 | % | | | 1.20 | % | | | 1.21 | % |
| | (0.89 | )% | | | (0.42 | )% | | | (0.29 | )% | | | (0.32 | )% | | | (0.20 | )% |
| | 103 | % | | | 108 | % | | | 103 | % | | | 97 | % | | | 90 | % |
HENNESSY FUNDS 1-800-966-4354
| Hennessy Cornerstone Growth Fund |
For an Institutional Class share outstanding throughout each period
| | | Six Months Ended | |
| | | April 30, 2011 | |
| | | (Unaudited) | |
| PER SHARE DATA: | | | |
| Net asset value, beginning of period | | $ | 10.37 | |
| | | | | |
| Income from investment operations: | | | | |
| Net investment income (loss) | | | (0.03 | ) |
| Net realized and unrealized gains (losses) on securities | | | 2.13 | |
| Total from investment operations | | | 2.10 | |
| | | | | |
| Less Distributions: | | | | |
| Dividends from net investment income | | | — | |
| Dividends from net realized gains | | | — | |
| Total distributions | | | — | |
| Net asset value, end of period | | $ | 12.47 | |
| | | | | |
| TOTAL RETURN | | | 20.25 | %(2) |
| | | | | |
| SUPPLEMENTAL DATA AND RATIOS: | | | | |
| Net assets, end of period (millions) | | $ | 3.12 | |
| Ratio of expenses to average net assets: | | | | |
| Before expense reimbursement | | | 1.11 | %(3) |
After expense reimbursement(4) | | | 0.98 | %(3) |
| Ratio of net investment income (loss) to average net assets | | | | |
| Before expense reimbursement | | | (0.67 | )%(3) |
After expense reimbursement(4) | | | (0.54 | )%(3) |
Portfolio turnover rate(5) | | | 100 | %(2) |
| (1) | Institutional Class shares commenced operations on March 3, 2008. |
| (4) | The Advisor and/or Administrator reimbursed expenses in order to cap the Institutional Class share expenses. Please refer to Note 5 for more information. |
| (5) | Portfolio turnover is calculated on the basis of the Fund as a whole. |
The accompanying notes are an integral part of these financial statements.
FINANCIAL HIGHLIGHTS — HENNESSY CORNERSTONE GROWTH FUND
| Year Ended October 31, | | | Period Ended | |
| | | | | | | October 31, | |
| 2010 | | | 2009 | | | 2008(1) | |
| | | | | | | | |
| $ | 8.86 | | | $ | 8.82 | | | $ | 13.29 | |
| | | | | | | | | | | |
| | | | | | | | | | | |
| | (0.07 | ) | | | — | | | | 0.01 | |
| | 1.58 | | | | 0.04 | | | | (4.48 | ) |
| | 1.51 | | | | 0.04 | | | | (4.47 | ) |
| | | | | | | | | | | |
| | | | | | | | | | | |
| | — | | | | — | | | | — | |
| | — | | | | — | | | | — | |
| | — | | | | — | | | | — | |
| $ | 10.37 | | | $ | 8.86 | | | $ | 8.82 | |
| | | | | | | | | | | |
| | 17.04 | % | | | 0.45 | % | | | (34.13 | )%(2) |
| | | | | | | | | | | |
| | | | | | | | | | | |
| $ | 3.12 | | | $ | 4.68 | | | $ | 5.09 | |
| | | | | | | | | | | |
| | 1.09 | % | | | 1.11 | % | | | 1.12 | %(3) |
| | 0.98 | % | | | 0.98 | % | | | 0.98 | %(3) |
| | | | | | | | | | | |
| | (0.64 | )% | | | (0.17 | )% | | | 0.15 | %(3) |
| | (0.53 | )% | | | (0.04 | )% | | | 0.29 | %(3) |
| | 103 | % | | | 108 | % | | | 103 | %(2) |
HENNESSY FUNDS 1-800-966-4354
| Hennessy Cornerstone Growth Fund, Series II |
For an Original Class share outstanding throughout each period
| | | Six Months Ended | |
| | | April 30, 2011 | |
| | | (Unaudited) | |
| PER SHARE DATA: | | | |
| Net asset value, beginning of period | | $ | 13.99 | |
| | | | | |
| Income from investment operations: | | | | |
| Net investment income (loss) | | | (0.07 | ) |
| Net realized and unrealized gains (losses) on securities | | | 3.01 | |
| Total from investment operations | | | 2.94 | |
| | | | | |
| Less Distributions: | | | | |
| Dividends from net investment income | | | — | |
| Dividends from net realized gains | | | — | |
| Total distributions | | | — | |
| Net asset value, end of period | | $ | 16.93 | |
| | | | | |
| TOTAL RETURN | | | 21.02 | %(3) |
| | | | | |
| SUPPLEMENTAL DATA AND RATIOS: | | | | |
| Net assets, end of period (millions) | | $ | 32.33 | |
| Ratio of expenses to average net assets | | | 1.56 | %(4) |
| Ratio of net investment loss to average net assets | | | (0.81 | )%(4) |
Portfolio turnover rate(5) | | | 8 | %(3) |
| (1) | For the four months ended October 31, 2006. Effective October 31, 2006 the Fund changed its fiscal year end to October 31st from June 30th. |
| (2) | Net investment loss per share is calculated using average shares outstanding. |
| (5) | Portfolio turnover is calculated on the basis of the Fund as a whole. |
The accompanying notes are an integral part of these financial statements.
FINANCIAL HIGHLIGHTS — HENNESSY CORNERSTONE GROWTH FUND, SERIES II
| Year Ended October 31, | | | Period Ended | | | Year Ended | |
| | | | | | | | | | | | | October 31, | | | June 30, | |
| 2010 | | | 2009 | | | 2008 | | | 2007 | | | 2006(1) | | | 2006 | |
| | | | | | | | | | | | | | | | | |
| $ | 11.09 | | | $ | 10.35 | | | $ | 30.32 | | | $ | 30.75 | | | $ | 32.19 | | | $ | 31.29 | |
| | | | | | | | | | | | | | | | | | | | | | | |
| | | | | | | | | | | | | | | | | | | | | | | |
| | (0.11 | ) | | | (0.05 | ) | | | (0.09 | ) | | | (0.25 | ) | | | (0.03 | ) | | | (0.07 | )(2) |
| | 3.01 | | | | 0.79 | | | | (13.75 | ) | | | 1.02 | | | | (1.41 | ) | | | 4.65 | |
| | 2.90 | | | | 0.74 | | | | (13.84 | ) | | | 0.77 | | | | (1.44 | ) | | | 4.58 | |
| | | | | | | | | | | | | | | | | | | | | | | |
| | | | | | | | | | | | | | | | | | | | | | | |
| | — | | | | — | | | | — | | | | — | | | | — | | | | — | |
| | — | | | | — | | | | (6.13 | ) | | | (1.20 | ) | | | — | | | | (3.68 | ) |
| | — | | | | — | | | | (6.13 | ) | | | (1.20 | ) | | | — | | | | (3.68 | ) |
| $ | 13.99 | | | $ | 11.09 | | | $ | 10.35 | | | $ | 30.32 | | | $ | 30.75 | | | $ | 32.19 | |
| | | | | | | | | | | | | | | | | | | | | | | |
| | 26.15 | % | | | 7.15 | % | | | (55.79 | )% | | | 2.60 | % | | | (4.47 | )%(3) | | | 16.48 | % |
| | | | | | | | | | | | | | | | | | | | | | | |
| | | | | | | | | | | | | | | | | | | | | | | |
| $ | 30.17 | | | $ | 29.81 | | | $ | 36.27 | | | $ | 138.58 | | | $ | 244.19 | | | $ | 279.30 | |
| | 1.62 | % | | | 1.70 | % | | | 1.37 | % | | | 1.27 | % | | | 1.25 | %(4) | | | 1.25 | % |
| | (0.77 | )% | | | (0.43 | )% | | | (0.40 | )% | | | (0.59 | )% | | | (0.24 | )%(4) | | | (0.22 | )% |
| | 95 | % | | | 94 | % | | | 75 | % | | | 86 | % | | | 93 | %(3) | | | 109 | % |
HENNESSY FUNDS 1-800-966-4354
Financial Highlights
| Hennessy Cornerstone Growth Fund, Series II |
For an Institutional Class share outstanding throughout each period
| | | Six Months Ended | |
| | | April 30, 2011 | |
| | | (Unaudited) | |
| PER SHARE DATA: | | | |
| Net asset value, beginning of period | | $ | 14.23 | |
| | | | | |
| Income from investment operations: | | | | |
| Net investment income (loss) | | | (0.02 | ) |
| Net realized and unrealized gains (losses) on securities | | | 3.06 | |
| Total from investment operations | | | 3.04 | |
| | | | | |
| Less Distributions: | | | | |
| Dividends from net investment income | | | — | |
| Dividends from net realized gains | | | — | |
| Total distributions | | | — | |
| Net asset value, end of period | | $ | 17.27 | |
| | | | | |
| TOTAL RETURN | | | 20.25 | %(2) |
| | | | | |
| SUPPLEMENTAL DATA AND RATIOS: | | | | |
| Net assets, end of period (millions) | | $ | 0.48 | |
| Ratio of expenses to average net assets | | | | |
| Before expense reimbursement | | | 1.37 | %(3) |
After expense reimbursement(4) | | | 0.98 | %(3) |
| Ratio of net investment income (loss) to average net assets | | | | |
| Before expense reimbursement | | | (0.62 | )%(3) |
After expense reimbursement(4) | | | (0.23 | )%(3) |
Portfolio turnover rate(5) | | | 8 | %(2) |
| (1) | Institutional Class shares commenced operations on March 3, 2008. |
| (4) | The Advisor and/or Administrator reimbursed expenses in order to cap the Institutional Class share expenses. Please refer to Note 5 for more information. |
| (5) | Portfolio turnover is calculated on the basis of the Fund as a whole. |
The accompanying notes are an integral part of these financial statements.
FINANCIAL HIGHLIGHTS — HENNESSY CORNERSTONE GROWTH FUND, SERIES II
| Year Ended October 31, | | | Period Ended | |
| | | | | | | October 31, | |
| 2010 | | | 2009 | | | 2008(1) | |
| | | | | | | | |
| $ | 11.21 | | | $ | 10.39 | | | $ | 19.17 | |
| | | | | | | | | | | |
| | | | | | | | | | | |
| | (0.01 | ) | | | 0.02 | | | | 0.02 | |
| | 3.03 | | | | 0.80 | | | | (8.80 | ) |
| | 3.02 | | | | 0.82 | | | | (8.78 | ) |
| | | | | | | | | | | |
| | | | | | | | | | | |
| | — | | | | — | | | | — | |
| | — | | | | — | | | | — | |
| | — | | | | — | | | | — | |
| $ | 14.23 | | | $ | 11.21 | | | $ | 10.39 | |
| | | | | | | | | | | |
| | 26.94 | % | | | 7.89 | % | | | (45.80 | )%(2) |
| | | | | | | | | | | |
| | | | | | | | | | | |
| $ | 0.43 | | | $ | 0.28 | | | $ | 0.06 | |
| | | | | | | | | | | |
| | 1.40 | % | | | 1.46 | % | | | 1.22 | %(3) |
| | 0.98 | % | | | 0.98 | % | | | 0.98 | %(3) |
| | | | | | | | | | | |
| | (0.53 | )% | | | (0.19 | )% | | | 0.17 | %(3) |
| | (0.11 | )% | | | 0.29 | % | | | 0.41 | %(3) |
| | 95 | % | | | 94 | % | | | 75 | %(2) |
HENNESSY FUNDS 1-800-966-4354
Financial Highlights
For an Original Class share outstanding throughout each period
| | | Six Months Ended | |
| | | April 30, 2011 | |
| | | (Unaudited) | |
| PER SHARE DATA: | | | |
| Net asset value, beginning of period | | $ | 11.18 | |
| | | | | |
| Income from investment operations: | | | | |
| Net investment income (loss) | | | (0.06 | ) |
| Net realized and unrealized gains (losses) on investments | | | 2.60 | |
| Total from investment operations | | | 2.54 | |
| | | | | |
| Less Distributions: | | | | |
| Dividends from net investment income | | | — | |
| Dividends from net realized gains | | | — | |
| Total distributions | | | — | |
| Redemption fees retained | | | — | |
| Net asset value, end of period | | $ | 13.72 | |
| | | | | |
| TOTAL RETURN | | | 22.72 | %(2) |
| | | | | |
| SUPPLEMENTAL DATA AND RATIOS: | | | | |
| Net assets, end of period (millions) | | $ | 140.84 | |
| Ratio of expenses to average net assets: | | | 1.37 | %(3) |
| Ratio of net investment loss to average net assets: | | | (0.96 | )%(3) |
Portfolio turnover rate(4) | | | 4 | %(2) |
| (1) | Amount is less than $0.01. |
| (4) | Portfolio turnover is calculated on the basis of the Fund as a whole. |
The accompanying notes are an integral part of these financial statements.
FINANCIAL HIGHLIGHTS — HENNESSY FOCUS 30 FUND
| Year Ended October 31, | |
| 2010 | | | 2009 | | | 2008 | | | 2007 | | | 2006 | |
| | | | | | | | | | | | | | |
| $ | 8.73 | | | $ | 8.02 | | | $ | 13.67 | | | $ | 12.39 | | | $ | 12.21 | |
| | | | | | | | | | | | | | | | | | | |
| | | | | | | | | | | | | | | | | | | |
| | (0.03 | ) | | | (0.02 | ) | | | (0.06 | ) | | | (0.09 | ) | | | (0.08 | ) |
| | 2.48 | | | | 0.73 | | | | (3.57 | ) | | | 1.47 | | | | 1.86 | |
| | 2.45 | | | | 0.71 | | | | (3.63 | ) | | | 1.38 | | | | 1.78 | |
| | | | | | | | | | | | | | | | | | | |
| | | | | | | | | | | | | | | | | | | |
| | — | | | | — | | | | — | | | | — | | | | — | |
| | — | | | | — | | | | (2.02 | ) | | | (0.10 | ) | | | (1.61 | ) |
| | — | | | | — | | | | (2.02 | ) | | | (0.10 | ) | | | (1.61 | ) |
| | — | | | | — | | | | — | (1) | | | — | (1) | | | 0.01 | |
| $ | 11.18 | | | $ | 8.73 | | | $ | 8.02 | | | $ | 13.67 | | | $ | 12.39 | |
| | | | | | | | | | | | | | | | | | | |
| | 28.06 | % | | | 8.85 | % | | | (30.81 | )% | | | 11.30 | % | | | 16.18 | % |
| | | | | | | | | | | | | | | | | | | |
| | | | | | | | | | | | | | | | | | | |
| $ | 123.20 | | | $ | 128.36 | | | $ | 167.32 | | | $ | 233.37 | | | $ | 240.63 | |
| | 1.39 | % | | | 1.39 | % | | | 1.27 | % | | | 1.23 | % | | | 1.21 | % |
| | (0.26 | )% | | | (0.20 | )% | | | (0.62 | )% | | | (0.61 | )% | | | (0.65 | )% |
| | 87 | % | | | 90 | % | | | 123 | % | | | 112 | % | | | 124 | % |
HENNESSY FUNDS 1-800-966-4354
For an Institutional Class share outstanding throughout each period
| | | Six Months Ended | |
| | | April 30, 2011 | |
| | | (Unaudited) | |
| PER SHARE DATA: | | | |
| Net asset value, beginning of period | | $ | 11.29 | |
| | | | | |
| Income from investment operations: | | | | |
| Net investment income (loss) | | | (0.04 | ) |
| Net realized and unrealized gains (losses) on investments | | | 2.64 | |
| Total from investment operations | | | 2.60 | |
| | | | | |
| Less Distributions: | | | | |
| Dividends from net investment income | | | — | |
| Dividends from net realized gains | | | — | |
| Total distributions | | | — | |
| Net asset value, end of period | | $ | 13.89 | |
| | | | | |
| TOTAL RETURN | | | 23.03 | %(2) |
| | | | | |
| SUPPLEMENTAL DATA AND RATIOS: | | | | |
| Net assets, end of period (millions) | | $ | 24.31 | |
| Ratio of expenses to average net assets: | | | | |
| Before expense reimbursement | | | 1.15 | %(3) |
After expense reimbursement(4) | | | 0.98 | %(3) |
| Ratio of net investment income (loss) to average net assets: | | | | |
| Before expense reimbursement | | | (0.74 | )%(3) |
After expense reimbursement(4) | | | (0.57 | )%(3) |
Portfolio turnover rate(5) | | | 4 | %(2) |
| (1) | Institutional Class shares commenced operations on March 3, 2008. |
| (4) | The Advisor and/or Administrator reimbursed expenses in order to cap the Institutional Class share expenses. Please refer to Note 5 for more information. |
| (5) | Portfolio turnover is calculated on the basis of the Fund as a whole. |
The accompanying notes are an integral part of these financial statements.
FINANCIAL HIGHLIGHTS — HENNESSY FOCUS 30 FUND
| Year Ended October 31, | | | Period Ended | |
| | | | | | | October 31, | |
| 2010 | | | 2009 | | | 2008(1) | |
| | | | | | | | |
| $ | 8.78 | | | $ | 8.04 | | | $ | 11.15 | |
| | | | | | | | | | | |
| | | | | | | | | | | |
| | 0.02 | | | | 0.02 | | | | (0.02 | ) |
| | 2.49 | | | | 0.72 | | | | (3.09 | ) |
| | 2.51 | | | | 0.74 | | | | (3.11 | ) |
| | | | | | | | | | | |
| | | | | | | | | | | |
| | — | | | | — | | | | — | |
| | — | | | | — | | | | — | |
| | — | | | | — | | | | — | |
| $ | 11.29 | | | $ | 8.78 | | | $ | 8.04 | |
| | | | | | | | | | | |
| | 28.59 | % | | | 9.20 | % | | | (27.89 | )%(2) |
| | | | | | | | | | | |
| | | | | | | | | | | |
| $ | 21.38 | | | $ | 27.44 | | | $ | 26.78 | |
| | | | | | | | | | | |
| | 1.16 | % | | | 1.15 | % | | | 1.13 | %(3) |
| | 0.98 | % | | | 0.98 | % | | | 0.98 | %(3) |
| | | | | | | | | | | |
| | (0.03 | )% | | | 0.04 | % | | | (0.28 | )%(3) |
| | 0.15 | % | | | 0.21 | % | | | (0.13 | )%(3) |
| | 87 | % | | | 90 | % | | | 123 | %(2) |
HENNESSY FUNDS 1-800-966-4354
| Hennessy Cornerstone Large Growth Fund |
For an Original Class share outstanding throughout each period
| | | Six Months Ended | |
| | | April 30, 2011 | |
| | | (Unaudited) | |
| PER SHARE DATA: | | | |
| Net asset value, beginning of period | | $ | 11.70 | |
| Income from investment operations: | | | | |
| Net investment income (loss) | | | 0.05 | |
| Net realized and unrealized gains (losses) on securities | | | 1.84 | |
| Total from investment operations | | | 1.89 | |
| Less Distributions: | | | | |
| Dividends from net investment income | | | (0.09 | ) |
| Dividends from net realized gains | | | (0.02 | ) |
| Total distributions | | | (0.11 | ) |
| Net asset value, end of period | | $ | 13.48 | |
| TOTAL RETURN | | | 16.27 | %(5) |
| SUPPLEMENTAL DATA AND RATIOS: | | | | |
| Net assets, end of period (millions) | | $ | 88.87 | |
| Ratio of expenses to average net assets: | | | | |
| Before expense reimbursement/recoupment | | | 1.27 | %(6) |
| After expense reimbursement/recoupment | | | 1.30 | %(6) |
| Ratio of net investment income (loss) to average net assets | | | | |
| Before expense reimbursement/recoupment | | | 0.79 | %(6) |
| After expense reimbursement/recoupment | | | 0.76 | %(6) |
Portfolio turnover rate(7) | | | 0 | %(5) |
| (1) | For the one month period ended October 31, 2009. Effective October 31, 2009, the Fund changed its fiscal year end to October 31st from September 30th. |
| (2) | The financial highlights set forth for periods prior to March 20, 2009 represent the historical financial highlights of the Tamarack Large Cap Growth Fund, Class S shares. The assets of the Tamarack Large Cap Growth Fund were acquired by the Hennessy Cornerstone Large Growth Fund on March 20, 2009. At that time RBC Global Asset Management (U.S.), Inc. (formerly known as Voyageur Asset Management Inc.) ceased to be investment advisor and Hennessy Advisors, Inc. became investment advisor. The return of the Tamarack Large Cap Growth Fund, Class S shares during the period October 1, 2008 through March 20, 2009 was (33.30)%. The return of the Hennessy Cornerstone Large Growth Fund, Original Class shares during the period March 20, 2009 through September 30, 2009 was 42.64%. |
| (3) | Amount is less than $0.01 or ($0.01) per share. |
| (4) | Per share net investment income (loss) has been calculated using the average daily shares method. |
| (7) | Portfolio turnover is calculated on the basis of the Fund as a whole. |
The accompanying notes are an integral part of these financial statements.
FINANCIAL HIGHLIGHTS — HENNESSY CORNERSTONE LARGE GROWTH FUND
| Year Ended | | | One Month Ended | | | Year Ended September 30, | |
| October 31, | | | October 31, | | | | | | | | | | | | | |
| 2010 | | | 2009(1) | | | 2009(2) | | | 2008 | | | 2007 | | | 2006 | |
| | | | | | | | | | | | | | | | | |
| $ | 9.49 | | | $ | 9.60 | | | $ | 10.09 | | | $ | 12.61 | | | $ | 10.98 | | | $ | 10.75 | |
| | | | | | | | | | | | | | | | | | | | | | | |
| | 0.09 | | | | — | (3) | | | 0.05 | | | | — | (3)(4) | | | — | (3) | | | — | (3) |
| | 2.17 | | | | (0.11 | ) | | | (0.54 | ) | | | (2.52 | ) | | | 1.63 | | | | 0.23 | |
| | 2.26 | | | | (0.11 | ) | | | (0.49 | ) | | | (2.52 | ) | | | 1.63 | | | | 0.23 | |
| | | | | | | | | | | | | | | | | | | | | | | |
| | (0.05 | ) | | | — | | | | — | | | | — | | | | — | | | | — | (3) |
| | — | | | | — | | | | — | | | | — | | | | — | | | | — | |
| | (0.05 | ) | | | — | | | | — | | | | — | | | | — | | | | — | |
| $ | 11.70 | | | $ | 9.49 | | | $ | 9.60 | | | $ | 10.09 | | | $ | 12.61 | | | $ | 10.98 | |
| | 23.88 | % | | | (1.15 | )%(5) | | | (4.86 | )% | | | (19.98 | )% | | | 14.85 | % | | | 2.18 | % |
| | | | | | | | | | | | | | | | | | | | | | | |
| $ | 78.83 | | | $ | 69.41 | | | $ | 70.61 | | | $ | 80.91 | | | $ | 113.15 | | | $ | 125.25 | |
| | | | | | | | | | | | | | | | | | | | | | | |
| | 1.30 | % | | | 1.26 | %(6) | | | 1.40 | % | | | 1.16 | % | | | 1.18 | % | | | 1.18 | % |
| | 1.30 | % | | | 1.30 | %(6) | | | 1.17 | % | | | 0.98 | % | | | 1.00 | % | | | 1.00 | % |
| | | | | | | | | | | | | | | | | | | | | | | |
| | 0.84 | % | | | (0.01 | )%(6) | | | 0.36 | % | | | (0.19 | )% | | | (0.19 | )% | | | (0.20 | )% |
| | 0.84 | % | | | (0.05 | )%(6) | | | 0.59 | % | | | (0.01 | )% | | | (0.01 | )% | | | (0.02 | )% |
| | 83 | % | | | 0 | %(5) | | | 116 | % | | | 38 | % | | | 25 | % | | | 35 | % |
HENNESSY FUNDS 1-800-966-4354
| Hennessy Cornerstone Large Growth Fund |
For an Institutional Class share outstanding throughout each period
| | | Six Months Ended | |
| | | April 30, 2011 | |
| | | (Unaudited) | |
| PER SHARE DATA: | | | |
| Net asset value, beginning of period | | $ | 11.76 | |
| | | | | |
| Income from investment operations: | | | | |
| Net investment income | | | 0.03 | |
| Net realized and unrealized gains (losses) on securities | | | 1.89 | |
| Total from investment operations | | | 1.92 | |
| | | | | |
| Less Distributions: | | | | |
| Dividends from net investment income | | | (0.12 | ) |
| Dividends from net realized gains | | | (0.02 | ) |
| Total distributions | | | (0.14 | ) |
| Net asset value, end of period | | $ | 13.54 | |
| | | | | |
| TOTAL RETURN | | | 16.45 | %(4) |
| | | | | |
| SUPPLEMENTAL DATA AND RATIOS: | | | | |
| Net assets, end of period (millions) | | $ | 0.10 | |
| Ratio of expenses to average net assets: | | | | |
| Before expense reimbursement | | | 1.15 | %(5) |
After expense reimbursement(6) | | | 0.98 | %(5) |
| Ratio of net investment income (loss) to average net assets | | | | |
| Before expense reimbursement | | | 0.89 | %(5) |
After expense reimbursement(6) | | | 1.06 | %(5) |
Portfolio turnover rate(7) | | | 0 | %(4) |
| (1) | For the one month period ended October 31, 2009. Effective October 31, 2009, the Fund changed its fiscal year end to October 31st from September 30th. |
| (2) | Institutional Class shares commenced operations on March 20, 2009. |
| (3) | Amount is less than $0.01 or ($0.01) per share. |
| (6) | The Advisor and/or Administrator reimbursed expenses in order to cap the Institutional Class share expenses. Please refer to Note 5 for more information. |
| (7) | Portfolio turnover is calculated on the basis of the Fund as a whole. |
The accompanying notes are an integral part of these financial statements.
FINANCIAL HIGHLIGHTS — HENNESSY CORNERSTONE LARGE GROWTH FUND
| Year Ended | | | One Month Ended | | | Period Ended | |
| October 31, | | | October 31, | | | September 30, | |
| 2010 | | | 2009(1) | | | 2009(2) | |
| | | | | | | | |
| $ | 9.51 | | | $ | 9.61 | | | $ | 6.73 | |
| | | | | | | | | | | |
| | | | | | | | | | | |
| | 0.10 | | | | — | | | | 0.03 | |
| | 2.20 | | | | (0.10 | ) | | | 2.85 | |
| | 2.30 | | | | (0.10 | ) | | | 2.88 | |
| | | | | | | | | | | |
| | | | | | | | | | | |
| | (0.05 | ) | | | — | | | | — | |
| | — | | | | — | | | | — | |
| | (0.05 | ) | | | — | | | | — | |
| $ | 11.76 | | | $ | 9.51 | | | $ | 9.61 | |
| | | | | | | | | | | |
| | 24.26 | % | | | (1.04 | )%(3) | | | 42.79 | %(3) |
| | | | | | | | | | | |
| | | | | | | | | | | |
| $ | 0.07 | | | $ | 0.04 | | | $ | 0.04 | |
| | | | | | | | | | | |
| | 1.16 | % | | | 1.14 | %(4) | | | 16.51 | %(4) |
| | 0.98 | % | | | 0.98 | %(4) | | | 0.98 | %(4) |
| | | | | | | | | | | |
| | 0.90 | % | | | 0.12 | %(4) | | | (14.54 | )%(4) |
| | 1.08 | % | | | 0.28 | %(4) | | | 0.99 | %(4) |
| | 83 | % | | | 0 | %(3) | | | 116 | %(3) |
HENNESSY FUNDS 1-800-966-4354
Financial Highlights
| Hennessy Cornerstone Value Fund |
For an Original Class share outstanding throughout each period
| | | Six Months Ended | |
| | | April 30, 2011 | |
| | | (Unaudited) | |
| PER SHARE DATA: | | | |
| Net asset value, beginning of period | | $ | 12.53 | |
| | | | | |
| Income from investment operations: | | | | |
| Net investment income (loss) | | | 0.17 | |
| Net realized and unrealized gains (losses) on investments | | | 1.11 | |
| Total from investment operations | | | 1.28 | |
| | | | | |
| Less Distributions: | | | | |
| Dividends from net investment income | | | (0.37 | ) |
| Dividends from net realized gains | | | — | |
| Total distributions | | | (0.37 | ) |
| Net asset value, end of period | | $ | 13.44 | |
| | | | | |
| TOTAL RETURN | | | 10.52 | %(1) |
| | | | | |
| SUPPLEMENTAL DATA AND RATIOS: | | | | |
| Net assets, end of period (millions) | | $ | 145.07 | |
| Ratio of expenses to average net assets | | | 1.30 | %(2) |
| Ratio of net investment income to average net assets | | | 2.27 | %(2) |
Portfolio turnover rate(3) | | | 38 | %(1) |
| (3) | Portfolio turnover is calculated on the basis of the Fund as a whole. |
The accompanying notes are an integral part of these financial statements.
FINANCIAL HIGHLIGHTS — HENNESSY CORNERSTONE VALUE FUND
| Year Ended October 31, | |
| 2010 | | | 2009 | | | 2008 | | | 2007 | | | 2006 | |
| | | | | | | | | | | | | | |
| $ | 10.63 | | | $ | 9.05 | | | $ | 17.06 | | | $ | 15.27 | | | $ | 12.95 | |
| | | | | | | | | | | | | | | | | | | |
| | | | | | | | | | | | | | | | | | | |
| | 0.29 | | | | 0.24 | | | | 0.55 | | | | 0.46 | | | | 0.30 | |
| | 1.81 | | | | 1.87 | | | | (8.15 | ) | | | 1.68 | | | | 2.36 | |
| | 2.10 | | | | 2.11 | | | | (7.60 | ) | | | 2.14 | | | | 2.66 | |
| | | | | | | | | | | | | | | | | | | |
| | | | | | | | | | | | | | | | | | | |
| | (0.20 | ) | | | (0.53 | ) | | | (0.41 | ) | | | (0.35 | ) | | | (0.34 | ) |
| | — | | | | — | | | | — | | | | — | | | | — | |
| | (0.20 | ) | | | (0.53 | ) | | | (0.41 | ) | | | (0.35 | ) | | | (0.34 | ) |
| $ | 12.53 | | | $ | 10.63 | | | $ | 9.05 | | | $ | 17.06 | | | $ | 15.27 | |
| | | | | | | | | | | | | | | | | | | |
| | 19.98 | % | | | 25.51 | % | | | (45.50 | )% | | | 14.26 | % | | | 21.00 | % |
| | | | | | | | | | | | | | | | | | | |
| | | | | | | | | | | | | | | | | | | |
| $ | 155.87 | | | $ | 145.91 | | | $ | 97.10 | | | $ | 204.50 | | | $ | 256.80 | |
| | 1.29 | % | | | 1.27 | % | | | 1.20 | % | | | 1.17 | % | | | 1.15 | % |
| | 2.33 | % | | | 3.19 | % | | | 3.92 | % | | | 2.64 | % | | | 2.49 | % |
| | 91 | % | | | 59 | % | | | 53 | % | | | 40 | % | | | 35 | % |
HENNESSY FUNDS 1-800-966-4354
Financial Highlights
| Hennessy Cornerstone Value Fund |
For an Institutional Class share outstanding throughout each period
| | | Six Months Ended | |
| | | April 30, 2011 | |
| | | (Unaudited) | |
| PER SHARE DATA: | | | |
| Net asset value, beginning of period | | $ | 12.54 | |
| | | | | |
| Income from investment operations: | | | | |
| Net investment income (loss) | | | 0.11 | |
| Net realized and unrealized gains (losses) on investments | | | 1.20 | |
| Total from investment operations | | | 1.31 | |
| | | | | |
| Less Distributions: | | | | |
| Dividends from net investment income | | | (0.41 | ) |
| Dividends from net realized gains | | | — | |
| Total distributions | | | (0.41 | ) |
| Net asset value, end of period | | $ | 13.44 | |
| | | | | |
| TOTAL RETURN | | | 10.78 | %(2) |
| | | | | |
| SUPPLEMENTAL DATA AND RATIOS: | | | | |
| Net assets, end of period (millions) | | $ | 1.15 | |
| Ratio of expenses to average net assets | | | | |
| Before expense reimbursement | | | 1.11 | %(3) |
After expense reimbursement(4) | | | 0.98 | %(3) |
| Ratio of net investment income to average net assets | | | | |
| Before expense reimbursement | | | 2.40 | %(3) |
After expense reimbursement(4) | | | 2.53 | %(3) |
Portfolio turnover rate(5) | | | 38 | %(2) |
| (1) | Institutional Class shares commenced operations on March 3, 2008. |
| (4) | The Advisor and/or Administrator reimbursed expenses in order to cap the Institutional Class share expenses. Please refer to Note 5 for more information. |
| (5) | Portfolio turnover is calculated on the basis of the Fund as a whole. |
The accompanying notes are an integral part of these financial statements.
FINANCIAL HIGHLIGHTS — HENNESSY CORNERSTONE VALUE FUND
| Year Ended October 31, | | | Period Ended | |
| | | | | | | October 31, | |
| 2010 | | | 2009 | | | 2008(1) | |
| | | | | | | | |
| $ | 10.63 | | | $ | 9.06 | | | $ | 13.79 | |
| | | | | | | | | | | |
| | | | | | | | | | | |
| | 0.30 | | | | 0.30 | | | | 0.34 | |
| | 1.83 | | | | 1.83 | | | | (5.07 | ) |
| | 2.13 | | | | 2.13 | | | | (4.73 | ) |
| | | | | | | | | | | |
| | | | | | | | | | | |
| | (0.22 | ) | | | (0.56 | ) | | | — | |
| | — | | | | — | | | | — | |
| | (0.22 | ) | | | (0.56 | ) | | | — | |
| $ | 12.54 | | | $ | 10.63 | | | $ | 9.06 | |
| | | | | | | | | | | |
| | 20.31 | % | | | 25.87 | % | | | (34.30 | )%(2) |
| | | | | | | | | | | |
| | | | | | | | | | | |
| $ | 1.35 | | | $ | 1.11 | | | $ | 0.87 | |
| | | | | | | | | | | |
| | 1.10 | % | | | 1.13 | % | | | 1.14 | %(3) |
| | 0.98 | % | | | 0.98 | % | | | 0.98 | %(3) |
| | | | | | | | | | | |
| | 2.52 | % | | | 3.33 | % | | | 4.94 | %(3) |
| | 2.64 | % | | | 3.48 | % | | | 5.10 | %(3) |
| | 91 | % | | | 59 | % | | | 53 | %(2) |
HENNESSY FUNDS 1-800-966-4354
| Hennessy Total Return Fund |
For an Original Class share outstanding throughout each period
| | | Six Months Ended | |
| | | April 30, 2011 | |
| | | (Unaudited) | |
| PER SHARE DATA: | | | |
| Net asset value, beginning of period | | $ | 10.57 | |
| | | | | |
| Income from investment operations: | | | | |
| Net investment income | | | 0.09 | |
| Net realized and unrealized gains (losses) on securities | | | 1.03 | |
| Total from investment operations | | | 1.12 | |
| | | | | |
| Less Distributions: | | | | |
| Dividends from net investment income | | | (0.09 | ) |
| Dividends from realized capital gains | | | — | |
| Total distributions | | | (0.09 | ) |
| Net asset value, end of period | | $ | 11.60 | |
| | | | | |
| TOTAL RETURN | | | 10.60 | %(1) |
| | | | | |
| SUPPLEMENTAL DATA AND RATIOS: | | | | |
| Net assets, end of period (millions) | | $ | 70.18 | |
| Ratio of expenses, including interest expense, to average net assets | | | 1.34 | %(2) |
| Ratio of interest expense to average net assets | | | 0.11 | %(2) |
| Ratio of expenses, excluding interest expense, to average net assets | | | 1.23 | %(2) |
| Ratio of net investment income to average net assets | | | 1.57 | %(2) |
| Portfolio turnover rate | | | 6 | %(1) |
The accompanying notes are an integral part of these financial statements.
FINANCIAL HIGHLIGHTS — HENNESSY TOTAL RETURN FUND
| Year Ended October 31, | |
| 2010 | | | 2009 | | | 2008 | | | 2007 | | | 2006 | |
| | | | | | | | | | | | | | |
| $ | 9.10 | | | $ | 9.22 | | | $ | 13.73 | | | $ | 12.61 | | | $ | 10.57 | |
| | | | | | | | | | | | | | | | | | | |
| | | | | | | | | | | | | | | | | | | |
| | 0.16 | | | | 0.18 | | | | 0.28 | | | | 0.33 | | | | 0.31 | |
| | 1.48 | | | | (0.14 | ) | | | (4.49 | ) | | | 1.13 | | | | 2.03 | |
| | 1.64 | | | | 0.04 | | | | (4.21 | ) | | | 1.46 | | | | 2.34 | |
| | | | | | | | | | | | | | | | | | | |
| | | | | | | | | | | | | | | | | | | |
| | (0.17 | ) | | | (0.16 | ) | | | (0.30 | ) | | | (0.34 | ) | | | (0.30 | ) |
| | — | | | | — | | | | — | | | | — | | | | — | |
| | (0.17 | ) | | | (0.16 | ) | | | (0.30 | ) | | | (0.34 | ) | | | (0.30 | ) |
| $ | 10.57 | | | $ | 9.10 | | | $ | 9.22 | | | $ | 13.73 | | | $ | 12.61 | |
| | | | | | | | | | | | | | | | | | | |
| | 18.09 | % | | | 0.69 | % | | | (30.97 | )% | | | 11.70 | % | | | 22.48 | % |
| | | | | | | | | | | | | | | | | | | |
| | | | | | | | | | | | | | | | | | | |
| $ | 69.08 | | | $ | 52.38 | | | $ | 58.22 | | | $ | 96.31 | | | $ | 113.26 | |
| | 1.33 | % | | | 1.56 | % | | | 2.36 | % | | | 3.04 | % | | | 2.80 | % |
| | 0.08 | % | | | 0.29 | % | | | 1.16 | % | | | 1.88 | % | | | 1.64 | % |
| | 1.25 | % | | | 1.27 | % | | | 1.20 | % | | | 1.16 | % | | | 1.16 | % |
| | 1.62 | % | | | 2.12 | % | | | 2.43 | % | | | 2.48 | % | | | 2.79 | % |
| | 41 | % | | | 41 | % | | | 16 | % | | | 12 | % | | | 24 | % |
HENNESSY FUNDS 1-800-966-4354
For an Original Class share outstanding throughout each period
| | | Six Months Ended | |
| | | April 30, 2011 | |
| | | (Unaudited) | |
| PER SHARE DATA: | | | |
| Net asset value, beginning of period | | $ | 10.43 | |
| | | | | |
| Income from investment operations: | | | | |
| Net investment income | | | 0.02 | |
| Net realized and unrealized gains (losses) on securities | | | 0.76 | |
| Total from investment operations | | | 0.78 | |
| | | | | |
| Less Distributions: | | | | |
| Dividends from net investment income | | | (0.02 | ) |
| Dividends from realized capital gains | | | — | |
| Total distributions | | | (0.02 | ) |
| Net asset value, end of period | | $ | 11.19 | |
| | | | | |
| TOTAL RETURN | | | 7.53 | %(1) |
| | | | | |
| SUPPLEMENTAL DATA AND RATIOS: | | | | |
| Net assets, end of period (millions) | | $ | 12.56 | |
| Ratio of net expenses to average net assets | | | 1.69 | %(2) |
| Ratio of net investment income to average net assets | | | 0.45 | %(2) |
| Portfolio turnover rate | | | 23 | %(1) |
The accompanying notes are an integral part of these financial statements.
FINANCIAL HIGHLIGHTS — HENNESSY BALANCED FUND
| Year Ended October 31, | |
| 2010 | | | 2009 | | | 2008 | | | 2007 | | | 2006 | |
| | | | | | | | | | | | | | |
| $ | 9.48 | | | $ | 9.11 | | | $ | 12.51 | | | $ | 11.83 | | | $ | 10.56 | |
| | | | | | | | | | | | | | | | | | | |
| | | | | | | | | | | | | | | | | | | |
| | 0.05 | | | | 0.10 | | | | 0.25 | | | | 0.38 | | | | 0.30 | |
| | 0.95 | | | | 0.38 | | | | (2.80 | ) | | | 0.69 | | | | 1.25 | |
| | 1.00 | | | | 0.48 | | | | (2.55 | ) | | | 1.07 | | | | 1.55 | |
| | | | | | | | | | | | | | | | | | | |
| | | | | | | | | | | | | | | | | | | |
| | (0.05 | ) | | | (0.11 | ) | | | (0.26 | ) | | | (0.39 | ) | | | (0.28 | ) |
| | — | | | | — | | | | (0.59 | ) | | | — | | | | — | |
| | (0.05 | ) | | | (0.11 | ) | | | (0.85 | ) | | | (0.39 | ) | | | (0.28 | ) |
| $ | 10.43 | | | $ | 9.48 | | | $ | 9.11 | | | $ | 12.51 | | | $ | 11.83 | |
| | | | | | | | | | | | | | | | | | | |
| | 10.53 | % | | | 5.46 | % | | | (21.55 | )% | | | 9.16 | % | | | 14.92 | % |
| | | | | | | | | | | | | | | | | | | |
| | | | | | | | | | | | | | | | | | | |
| $ | 12.50 | | | $ | 11.47 | | | $ | 11.46 | | | $ | 16.82 | | | $ | 26.14 | |
| | 1.65 | % | | | 1.73 | % | | | 1.56 | % | | | 1.36 | % | | | 1.34 | % |
| | 0.45 | % | | | 1.17 | % | | | 2.31 | % | | | 2.86 | % | | | 2.75 | % |
| | 57 | % | | | 46 | % | | | 13 | % | | | 35 | % | | | 88 | % |
HENNESSY FUNDS 1-800-966-4354
(This Page Intentionally Left Blank.)
NOTES TO THE FINANCIAL STATEMENTS
Notes to the Financial Statements
April 30, 2011 (Unaudited)
1). ORGANIZATION
The Hennessy Mutual Funds, Inc. was organized as a Maryland corporation on May 20, 1996 and consists of three separate series: Hennessy Cornerstone Growth Fund (the “Growth Fund”), Hennessy Cornerstone Value Fund (the “Value Fund”) and the Hennessy Focus 30 Fund (the “Focus 30 Fund”). These Funds are open-end, diversified management investment companies registered under the Investment Company Act of 1940, as amended. The investment objective of the Growth and Focus 30 Funds is long-term growth of capital. The investment objective of the Value Fund is total return, consisting of capital appreciation and current income.
The Hennessy Funds, Inc. was organized as a Maryland corporation on January 11, 1996 and consists of two separate series: Hennessy Balanced Fund (the “Balanced Fund”) and Hennessy Total Return Fund (the “Total Return Fund”). The Balanced and Total Return Funds are open-end, non-diversified management investment companies registered under the Investment Company Act of 1940, as amended. The investment objective of the Balanced Fund is a combination of capital appreciation and current income. The investment objective of the Total Return Fund is total return, consisting of capital appreciation and current income.
The Hennessy Funds Trust (the “Trust”) was organized as a Delaware Statutory Trust on September 17, 1992 and consists of three series: Hennessy Cornerstone Growth Fund, Series II (the “Growth II Fund”), Hennessy Select Large Value Fund and Hennessy Cornerstone Large Growth Fund (the “Large Growth Fund”). The financial results of the Hennessy Select Large Value Fund are not contained in this report. The Growth II and Large Growth Funds are open-end, diversified management investment companies registered under the Investment Company Act of 1940, as amended. The investment objective of the Growth II and Large Growth Funds is long-term growth of capital.
The Growth, Growth II, Focus 30, Large Growth, Value, Total Return and Balanced Funds collectively represent the Hennessy Cornerstone Series Funds (the “Funds”).
The Growth, Growth II, Focus 30, Large Growth and Value Funds offer Original and Institutional Class shares. Each class of shares differs principally in its respective administration, shareholder servicing and transfer agent expenses and sales charges, if any. Each class has identical rights to earnings, assets and voting privileges, except for class-specific expenses and exclusive rights to vote on matters affecting only individual classes. The Balanced and Total Return Funds offer only Original Class shares.
2). SIGNIFICANT ACCOUNTING POLICIES
The following is a summary of significant accounting policies consistently followed by the Funds in the preparation of the financial statements. These
HENNESSY FUNDS 1-800-966-4354
policies are in conformity with U.S. generally accepted accounting principles (“GAAP”).
a). Investment Valuation – Securities which are traded on a national or recognized stock exchange are valued at the last sale price on the securities exchange on which such securities are primarily traded. Exchange-traded securities for which there were no transactions that day and debt securities are valued at the most recent bid prices. Instruments with a remaining maturity of 60 days or less are valued on an amortized cost basis. When a price for an underlying security is not readily available or if a significant event has occurred that indicates the closing price of a security no longer represents the true value of that security, fair value pricing procedures have been adopted by the Board of Directors of the Funds. Fair value pricing determinations are made in good faith in accordance with these procedures. There are numerous criteria that will be given consideration in determining a fair value of a security. Some of these criteria are: trading volume of security and markets, value of other like securities and news events with direct bearing to security or market. Fair value pricing results in an estimated price that reasonably reflects the current market conditions in order to rate the portfolio holdings such that shareholder transactions receive a fair net asset value.
b). Federal Income Taxes – Provision for federal income taxes or excise taxes has not been made since the Funds have elected to be taxed as “regulated investment companies” and intend to distribute substantially all taxable income to shareholders and otherwise comply with the provisions of the Internal Revenue Code applicable to regulated investment companies. Net investment income and realized gains and losses for federal income tax purposes may differ from that reported on the financial statements because of temporary book and tax basis differences. Temporary differences are primarily the result of the treatment of wash sales for tax reporting purposes. Distributions from net realized gains for book purposes may include short-term capital gains, which are included as ordinary income to shareholders for tax purposes.
c). Income and Expenses – Dividend income is recognized on the ex-dividend date or as soon as information is available to the Funds and interest income is recognized on an accrual basis. Income, expenses (other than expenses attributable to a specific class), and realized and unrealized gains or losses on investments are allocated to each class of shares based on its respective net assets.
d). Distributions to Shareholders – Dividends from net investment income for the Growth, Growth II, Focus 30, Large Growth and Value Funds, if any, are declared and paid out annually, usually in November or December of each year. Dividends from net investment income for the Total Return and Balanced Funds are declared and paid on a calendar quarter basis. Distributions of net realized capital gains, if any, are declared and paid annually, usually in November or December of each year, for all of the Funds.
e). Security Transactions – Investment and shareholder transactions are recorded on the trade date. The Funds determine the gain or loss realized
NOTES TO THE FINANCIAL STATEMENTS
from the investment transactions by comparing the original cost of the security lot sold with the net sale proceeds. Discounts and premiums on securities purchased are accreted/amortized over the life of the respective security.
f). Use of Estimates – The preparation of financial statements in conformity with GAAP requires management to make estimates and assumptions that affect the reported amounts of assets and liabilities and disclosure of contingent assets and liabilities at the date of the financial statements and the reported change in net assets during the reporting period. Actual results could differ from those estimates.
g). Share Valuation – The net asset value (“NAV”) per share of each Fund is calculated by dividing the sum of the value of the securities held by each Fund, plus cash or other assets, minus all liabilities (including estimated accrued expenses) by the total number of shares outstanding for each Fund, rounded to the nearest cent. The Funds’ shares will not be priced on the days on which the New York Stock Exchange is closed for trading. The offering and redemption price per share for each Fund is equal to each Fund’s net asset value per share. The Funds charged a 1.50% redemption fee on shares held less than 90 days through August 29, 2008. These fees were deducted from the redemption proceeds otherwise payable to the shareholder. These fees were retained by each Fund and treated as additional paid-in capital and allocated to each respective class of shares (if applicable).
h). Repurchase Agreements – Each Fund may enter into repurchase agreements with member banks or security dealers of the Federal Reserve whom the investment advisor deems creditworthy. The repurchase price generally equals the price paid by the Fund plus interest negotiated on the basis of current short-term rates.
Securities pledged as collateral for repurchase agreements are held by the custodian bank until the respective agreements mature. Provisions of the repurchase agreements ensure that the market value of the collateral, including accrued interest thereon, is sufficient, in the event of default of the counterparty. If the counterparty defaults and the value of the collateral declines or if the counterparty enters an insolvency proceeding, realization of the collateral by the Fund may be delayed or limited.
i). Accounting for Uncertainty in Income Taxes – The Funds have adopted accounting policies regarding recognition and measurement of tax positions taken or expected to be taken on a tax return. The Funds have reviewed all open tax years and major jurisdictions and concluded that there is no impact on the Funds’ net assets and no tax liability resulting from unrecognized tax benefits relating to uncertain income tax positions taken or expected to be taken on a tax return. As of April 30, 2011, open Federal and state tax years for the Large Growth Fund include the tax years ended September 30, 2008 through 2009, tax period ended October 31, 2009 and tax year ended October 31, 2010. As of April 30, 2011, open Federal and state tax years for the Growth, Growth II, Focus, Value, Total Return and Balanced Fund include the tax years ended October 31, 2008 through 2010.
HENNESSY FUNDS 1-800-966-4354
j). Derivatives – The Funds may invest in, or enter into, derivatives, such as options, futures contracts, options on futures contracts and swaps, for a variety of reasons, including to hedge certain risks, to provide a substitute for purchasing or selling particular securities or to increase potential income gain. Derivatives may provide a cheaper, quicker or more specifically focused way for a Fund to invest than “traditional” securities would. The main purpose of utilizing these derivative instruments is for hedging purposes.
The Funds have adopted the financial accounting reporting rules as required by the Derivatives and Hedging Topic of the FASB Accounting Standards Codification (“FASB ASC”). The Funds are required to include enhanced disclosure that enables investors to understand how and why an entity uses derivatives, how derivatives are accounted for, and how derivatives instruments affect an entity’s results of operations and financial position. During the six months ended April 30, 2011, the Funds did not hold any derivative instruments.
k). Events Subsequent to the Fiscal Period End – The Funds have adopted financial reporting rules regarding subsequent events which requires an entity to recognize in the financial statements the effects of all subsequent events that provide additional evidence about conditions that existed at the date of the balance sheet. Management has evaluated the Funds’ related events and transactions that occurred subsequent to April 30, 2011, through the date of issuance of the Funds’ financial statements. There were no events or transactions that occurred during this period that materially impacted the amounts or disclosures in the Funds’ financial statements.
l). New Accounting Pronouncement – In January 2010, the FASB issued Accounting Standards Update “Improving Disclosures about Fair Value Measurements” (“ASU”). The ASU requires enhanced disclosures about a) transfers into and out of Levels 1 and 2, and b) purchases, sales, issuances, and settlements on a gross basis relating to Level 3 measurements. The first disclosure is effective for the first reporting period beginning after December 15, 2009, and for interim periods within those fiscal years. Additional information describing significant transfers, if any, is contained in each Fund’s Schedule of Investments contained in this report.
The second disclosure will become effective for fiscal years beginning after December 15, 2010, and for interim periods within those fiscal years. Management is currently evaluating the impact this disclosure may have on the Funds’ financial statements.
3). REVERSE REPURCHASE AGREEMENTS
The Total Return Fund may enter into reverse repurchase agreements with the same parties with whom it may enter into repurchase agreements. Under a reverse repurchase agreement, the Fund sells securities and agrees to repurchase them at a mutually agreed upon date and price. Under the 1940 Act, reverse repurchase agreements will be regarded as a form of borrowing by the Fund unless, at the time it enters into a reverse repurchase agreement, it establishes and maintains a segregated account with its custodian containing securities from its portfolio having a value not less than the repurchase price (including accrued
NOTES TO THE FINANCIAL STATEMENTS
interest). The Total Return Fund has established and maintained such an account for its reverse repurchase agreements.
Reverse repurchase agreements involve the risk that the market value of the securities retained in lieu of sale by the Fund may decline below the price of the securities the Fund has sold but is obligated to repurchase. In the event the buyer or its trustee or receiver may receive an extension of time to determine whether to enforce the Fund’s obligation to repurchase the securities, and the Fund’s use of the proceeds of the reverse repurchase agreement may effectively be restricted pending such decision. Also, the Fund would bear the risk of loss to the extent that the proceeds of the reverse repurchase agreements are less than the value of the securities subject to such agreements.
For the six months ended April 30, 2011, the average daily balance and average interest rate in effect for reverse repurchase agreements was $22,596,831 and 0.31%, respectively. At April 30, 2011, the interest rate in effect for the outstanding reverse repurchase agreements, scheduled to mature on May 26, 2011 ($8,095,500), June 16, 2011 ($6,296,500) and July 14, 2011 ($8,095,500) was 0.30%, 0.35% and 0.35%, respectively. Outstanding reverse repurchase agreements at April 30, 2011 were equal to 32.04% of the Total Return Fund’s total net assets.
4). INVESTMENT TRANSACTIONS
Purchases and sales of investment securities (excluding government and short-term investments) during the six months ended April 30, 2011 were as follows:
| | | Growth | | | Growth II | | | Focus 30 | | | Large Growth | | | Value | | | Total Return | | | Balanced | |
| | | Fund | | | Fund | | | Fund | | | Fund | | | Fund | | | Fund | | | Fund | |
| Purchases | | $ | 206,855,039 | | | $ | 2,500,810 | | | $ | 5,723,273 | | | $ | — | | | $ | 53,546,648 | | | $ | 2,902,108 | | | $ | 1,474,265 | |
| Sales | | $ | 238,570,404 | | | $ | 8,029,974 | | | $ | 17,035,216 | | | $ | 2,869,697 | | | $ | 75,804,556 | | | $ | 5,406,690 | | | $ | 2,051,652 | |
There were no purchases or sales/maturities of long-term U.S. Government securities in the Funds during the six months ended April 30, 2011.
5). INVESTMENT MANAGEMENT FEE AND OTHER TRANSACTIONS WITH AFFILIATES
Hennessy Advisors, Inc. (the “Advisor”) is the Advisor of the Funds. The Advisor provides the Funds with investment management services under a Management Agreement. The Advisor furnishes all investment advice, office space, facilities, and provides most of the personnel needed by the Funds. As compensation for its services, the Advisor is entitled to a monthly fee from each Fund. The fee is based upon the average daily net assets of the Funds at the annual rate of:
| | Growth Fund | 0.74% | |
| | Growth II Fund | 0.74% | |
| | Focus 30 Fund | 0.74% | |
| | Large Growth Fund | 0.74% | |
| | Value Fund | 0.74% | |
| | Total Return Fund | 0.60% | |
| | Balanced Fund | 0.60% | |
The Advisor has agreed to waive its fees and absorb expenses to the extent that the total annual operating expenses (excluding all Federal, state and local taxes, interest, brokerage commissions, acquired fund fees and expenses and other costs incurred in connection with the purchase and sale of securities and
HENNESSY FUNDS 1-800-966-4354
extraordinary items) do not exceed 0.98% of the Funds’ net assets for the Institutional Class shares in the Growth, Growth II, Focus 30, Large Growth and Value Funds. The expense limitation agreement for the Institutional Class shares can only be terminated by the Board of Directors/Trustees. For a period of three years after the year in which the Advisor waives or reimburses expenses, the Advisor may seek reimbursement from the Funds to the extent that total annual Fund operating expenses are less than the expense limitation in effect at the time of the reimbursement. The Advisor reimbursed Institutional Class expenses of $305 for the Growth II for the six months ended April 30, 2011.
The Advisor recouped $12,540 of previously reimbursed Original Class expenses for the Large Growth Fund for the six months ended April 30, 2011.
As of April 30, 2011, cumulative expenses subject to potential recovery to the aforementioned conditions and year of expiration are as follows:
| | | Oct. 31, 2011 | | | Oct. 31, 2012 | | | Oct. 31,2013 | | | Oct. 31,2014 | | | Total | |
| Growth Fund – Institutional Class | | $ | 7,464 | | | $ | 6,062 | | | $ | — | | | $ | — | | | $ | 13,526 | |
| Growth II Fund – Institutional Class | | $ | 137 | | | $ | 706 | | | $ | 531 | | | $ | 305 | | | $ | 1,679 | |
| Focus 30 Fund – Institutional Class | | $ | 35,499 | | | $ | 43,673 | | | $ | — | | | $ | — | | | $ | 79,172 | |
| Large Growth Fund – Original Class | | $ | 24,832 | | | $ | — | | | $ | — | | | $ | — | | | $ | 24,832 | |
| Large Growth Fund – Institutional Class | | $ | 2,051 | | | $ | 5 | | | $ | — | | | $ | — | | | $ | 2,056 | |
| Value Fund – Institutional Class | | $ | 1,056 | | | $ | 1,298 | | | $ | — | | | $ | — | | | $ | 2,354 | |
The Board of Directors/Trustees has approved a Shareholder Servicing Plan for the Original Class shares of the Growth, Growth II, Focus 30, Large Growth, Value, Total Return and Balanced Funds which was instituted to compensate the Advisor for the non-investment management services it provides to the Funds. The Plan provides for a monthly fee paid to the Advisor at an annual rate of 0.10% of the average daily net assets of the Funds.
The Growth, Growth II, Focus 30, Large Growth and Value Funds have entered into agreements with various brokers, dealers and financial intermediaries in connection with the sale of shares of the Funds. The agreements provide for periodic payments by the Funds to the brokers, dealers and financial intermediaries for providing certain shareholder maintenance services (sub-transfer agent expenses). These shareholder services include: the pre-processing and quality control of new accounts, shareholder correspondence, answering customer inquiries regarding account status and facilitating shareholder telephone transactions. Fees paid by the Growth, Growth II, Focus 30, Large Growth and Value Funds to various brokers, dealers and financial intermediaries for the six months ended April 30, 2011, were $156,248, $28,364, $127,146, $10,219 and $71,598, respectively.
The Total Return and Balanced Funds have adopted a plan pursuant to Rule 12b-1 which authorizes payments in connection with the distribution of the Total Return and Balanced Fund shares at an annual rate not to exceed 0.15% of each Fund’s average daily net assets. Amounts paid under the Plan may be spent on any activities or expenses primarily intended to result in the sale of shares, including but not limited to, advertising, compensation for sales and marketing activities or financial institutions and others such as dealers and distributors, shareholder account servicing, the printing and mailing of prospectuses to other than current shareowners and the printing and mailing of sales literature.
NOTES TO THE FINANCIAL STATEMENTS
U.S. Bancorp Fund Services, LLC (the “Administrator”) acts as the Funds’ administrator under an Administration Agreement. Administrative services under this agreement include custody, distribution, fund accounting, fund administration and transfer agent services. In addition, the Administrator prepares various federal and state regulatory filings, reports and returns for the Funds; prepares reports and materials to be supplied to the directors; monitors the activities of the Funds’ custodian, transfer agent and accountants; coordinates the preparation and payment of the Funds’ expenses and reviews the Funds’ expense accruals. Fees paid to U.S. Bancorp Fund Services, LLC for the six months ended April 30, 2011, were $268,886, $42,880, $199,114, $104,455, $183,875, $86,301 and $15,703 for Growth, Growth II, Focus 30, Large Growth, Value, Total Return and Balanced Funds, respectively. The Administrator has voluntarily waived all or a portion of its administration fees allocated to the Institutional Class shares of the Growth, Growth II, Focus 30, Large Growth and Value Funds. The administration fees voluntarily waived by the Administrator during the six months ended April 30, 2011 were $1,913, $614, $18,815, $75 and $816, respectively.
Quasar Distributors, LLC (the “Distributor”) acts as the Funds’ principal underwriter in a continuous public offering of the Funds’ shares. The Distributor is an affiliated company of U.S. Bank, N.A.
6). LINE OF CREDIT
The Growth, Growth II, Focus 30, and Value Funds have $40,000,000, $1,500,000, $25,000,000 and $10,000,000 lines of credit, respectively, intended to provide short-term financing, if necessary, subject to certain restrictions, in connection with shareholder redemptions. The credit facility is with its custodian bank, U.S. Bank, N.A. Borrowings under this arrangement bear interest at the bank’s prime rate. During the six months ended April 30, 2011, the Growth Fund had an outstanding average daily balance and a weighted average interest rate of $8,597 and 3.25%, respectively. The maximum amount outstanding for the Growth Fund during the period was $661,000. During the six months ended April 30, 2011, the Growth II Fund had an outstanding average daily balance and a weighted average interest rate of $35,122 and 3.25%, respectively. The maximum amount outstanding for the Growth II Fund during the period was $1,500,000. During the six months ended April 30, 2011, the Focus 30 Fund had an outstanding average daily balance and a weighted average interest rate of $107,912 and 3.25%, respectively. The maximum amount outstanding for the Focus 30 Fund during the period was $3,586,000. During the six months ended April 30, 2011, the Value Fund had no line of credit activity.
HENNESSY FUNDS 1-800-966-4354
7). FEDERAL TAX INFORMATION
As of October 31, 2010, the components of accumulated earnings (losses) for income tax purposes were as follows:
| | | Growth | | | Growth II | | | Focus 30 | |
| | | Fund | | | Fund | | | Fund | |
| Cost of investments for tax purposes | | $ | 183,696,546 | | | $ | 27,823,349 | | | $ | 130,808,572 | |
| Gross tax unrealized appreciation | | | 39,262,640 | | | | 4,577,908 | | | | 14,422,821 | |
| Gross tax unrealized depreciation | | | (12,452,253 | ) | | | (1,702,329 | ) | | | (1,040,567 | ) |
| Net tax unrealized | | | | | | | | | | | | |
| appreciation (depreciation) | | | 26,810,387 | | | | 2,875,579 | | | | 13,382,254 | |
| Undistributed ordinary income | | $ | — | | | $ | — | | | $ | — | |
| Undistributed long-term capital gains | | | — | | | | — | | | | — | |
| Total distributable earnings | | $ | — | | | $ | — | | | $ | — | |
| Other accumulated gains/(loss) | | $ | (277,999,856 | ) | | $ | (54,289,903 | ) | | $ | (65,439,669 | ) |
| Total accumulated earnings/(loss) | | $ | (251,189,469 | ) | | $ | (51,414,324 | ) | | $ | (52,057,415 | ) |
| | | Large | | | | | | Total | | | | |
| | | Growth | | | Value | | | Return | | | Balanced | |
| | | Fund | | | Fund | | | Fund | | | Fund | |
| Cost of investments | | | | | | | | | | | | |
| for tax purposes | | $ | 69,685,306 | | | $ | 139,773,894 | | | $ | 90,484,010 | | | $ | 12,061,922 | |
| Gross tax | | | | | | | | | | | | | | | | |
| unrealized appreciation | | | 10,972,375 | | | | 21,871,148 | | | | 4,762,248 | | | | 747,143 | |
| Gross tax | | | | | | | | | | | | | | | | |
| unrealized depreciation | | | (1,699,296 | ) | | | (4,510,078 | ) | | | (2,054,042 | ) | | | (337,670 | ) |
| Net tax unrealized | | | | | | | | | | | | | | | | |
| appreciation (depreciation) | | $ | 9,273,079 | | | $ | 17,361,070 | | | $ | 2,708,206 | | | $ | 409,473 | |
| Undistributed ordinary income | | $ | 627,807 | | | $ | 3,560,233 | | | $ | 56,753 | | | $ | 4,166 | |
| Undistributed long-term | | | | | | | | | | | | | | | | |
| capital gains | | | 109,217 | | | | — | | | | — | | | | — | |
| Total distributable earnings | | $ | 737,024 | | | $ | 3,560,233 | | | $ | 56,753 | | | $ | 4,166 | |
| Other accumulated gains/(loss) | | $ | — | | | $ | (57,519,849 | ) | | $ | (13,616,778 | ) | | $ | (2,257,478 | ) |
| Total accumulated | | | | | | | | | | | | | | | | |
| earnings/(loss) | | $ | 10,010,103 | | | $ | (36,598,546 | ) | | $ | (10,851,819 | ) | | $ | (1,843,839 | ) |
The difference between book-basis and tax-basis unrealized appreciation is attributable primarily to wash sales and partnership adjustments.
At October 31, 2010, the Growth Fund had tax basis capital losses of $277,999,856, to offset future capital gains. Of such losses, $100,898,505 expire October 31, 2016 and $177,101,351 expire October 31, 2017.
At October 31, 2010, the Growth II Fund had tax basis capital losses of $54,289,903, to offset future capital gains. Of such losses, $29,176,218 expire October 31, 2016 and $25,113,685 expire October 31, 2017.
At October 31, 2010, the Focus 30 Fund had tax basis capital losses of $65,439,669, to offset future capital gains. Of such losses, $24,304,531 expire October 31, 2016 and $41,135,138 expire October 31, 2017.
NOTES TO THE FINANCIAL STATEMENTS
At October 31, 2010, the Large Growth Fund had no tax basis capital losses to offset future capital gains.
At October 31, 2010, the Value Fund had tax basis capital losses of $57,519,849, to offset future capital gains. Of such losses, $712,595 expire October 31, 2011 and $56,807,254 expire on October 31, 2017.
At October 31, 2010, the Total Return Fund had tax basis capital losses of $13,616,778, which may be carried over to offset future capital gains. Of such $13,616,778 expire October 31, 2017.
At October 31, 2010, the Balanced Fund had tax basis capital losses of $2,257,478, to offset future capital gains. Of such losses, $2,257,478 expire October 31, 2017.
The tax character of distributions paid during 2011 and 2010 for the Funds were as follows:
| | | | Six Months Ended | | | Year Ended | |
| | Growth Fund | | April 30, 2011 | | | October 31, 2010 | |
| | Ordinary income | | $ | — | | | $ | — | |
| | Long-term capital gain | | | — | | | | — | |
| | | | $ | — | | | $ | — | |
| | | | | | | | |
| | | | Six Months Ended | | | Year Ended | |
| | Growth II Fund | | April 30, 2011 | | | October 31, 2010 | |
| | Ordinary income | | $ | — | | | $ | — | |
| | Long-term capital gain | | | — | | | | — | |
| | | | $ | — | | | $ | — | |
| | | | | | | | |
| | | | Six Months Ended | | | Year Ended | |
| | Focus 30 Fund | | April 30, 2011 | | | October 31, 2010 | |
| | Ordinary income | | $ | — | | | $ | — | |
| | Long-term capital gain | | | — | | | | — | |
| | | | $ | — | | | $ | — | |
| | | | | | | | |
| | | | Six Months Ended | | | Year Ended | |
| | Large Growth Fund | | April 30, 2011 | | | October 31, 2010 | |
| | Ordinary income | | $ | 627,807 | | | $ | 358,421 | |
| | Long-term capital gain | | | — | | | | — | |
| | | | $ | 627,807 | | | $ | 358,421 | |
| | | | | | | | | | |
| | | | Six Months Ended | | | Year Ended | |
| | Value Fund | | April 30, 2011 | | | October 31, 2010 | |
| | Ordinary income | | $ | 4,283,374 | | | $ | 2,758,219 | |
| | Long-term capital gain | | | — | | | | — | |
| | | | $ | 4,283,374 | | | $ | 2,758,219 | |
HENNESSY FUNDS 1-800-966-4354
| | | | Six Months Ended | | | Year Ended | |
| | Total Return Fund | | April 30, 2011 | | | October 31, 2010 | |
| | Ordinary income | | $ | 525,891 | | | $ | 942,536 | |
| | Long-term capital gain | | | — | | | | — | |
| | | | $ | 525,891 | | | $ | 942,536 | |
| | | | | | | | |
| | | | Six Months Ended | | | Year Ended | |
| | Balanced Fund | | April 30, 2011 | | | October 31, 2010 | |
| | Ordinary income | | $ | 28,788 | | | $ | 55,545 | |
| | Long-term capital gain | | | — | | | | — | |
| | | | $ | 28,788 | | | $ | 55,545 | |
EXPENSE EXAMPLE
Expense Example
April 30, 2011 (Unaudited)
As a shareholder of the Funds, you incur two types of costs: (1) transaction costs, including sales charges (loads) on purchase payments, reinvested dividends, or other distributions; redemption fees; and exchange fees; and (2) ongoing costs, including management fees; service fees; and other Fund expenses. This Example is intended to help you understand your ongoing costs (in dollars) of investing in each of the Funds and to compare these costs with the ongoing costs of investing in other mutual funds. The Example is based on an investment of $1,000 invested at the beginning of the period and held for the entire period from November 1, 2010 through April 30, 2011.
Actual Expenses
The first set of lines of the table below provide information about actual account values and actual expenses. Although the Funds charge no sales loads or transaction fees, you will be assessed fees for outgoing wire transfers, returned checks and stop payment orders at prevailing rates charged by U.S. Bancorp Fund Services, LLC, the Funds’ transfer agent. If you request that a redemption be made by wire transfer, currently a $15.00 fee is charged by the Funds’ transfer agent. IRA accounts will be charged a $15.00 annual maintenance fee. The example below includes, but is not limited to, management fees, shareholder servicing fees, fund accounting, custody and transfer agent fees. However, the example below does not include portfolio trading commissions and related expenses, interest expense or dividends on short positions taken by the Fund and other extraordinary expenses as determined under generally accepted accounting principles. You may use the information within these lines, together with the amount you invested, to estimate the expenses that you paid over the six-month period. Simply divide your account value by $1,000 (for example, an $8,600 account value divided by $1,000 = 8.6), then multiply the result by the number in the first line under the heading entitled “Expenses Paid During Period” to estimate the expenses you paid on your account during this period.
Hypothetical Example for Comparison Purposes
The second set of lines within the table below provide information about hypothetical account values and hypothetical expenses based on the Funds’ actual expense ratios and an assumed rate of return of 5% per year before expenses, which is not the Funds’ actual return. The hypothetical account values and expenses may not be used to estimate the actual ending account balance or expenses you paid for the period. You may use this information to compare the ongoing costs of investing in the Funds and other funds. To do so, compare this 5% hypothetical example with the 5% hypothetical examples that appear in the shareholder reports of the other funds. Please note that the expenses shown in the table are meant to highlight your ongoing costs only and do not reflect any transactional costs, such as sales charges (loads), or exchange fees. Therefore, the second line of the table is useful in comparing ongoing costs only, and will not help you determine the relative total costs of owning different funds. In addition, if these transactional costs were included, your costs would have been higher.
HENNESSY FUNDS 1-800-966-4354
| | | Beginning | | | Ending | | | Expenses Paid | |
| | | Account Value | | | Account Value | | | During Period(1) | |
| Original Class | | 11/1/2010 | | | 4/30/2011 | | | 11/1/10 – 4/30/11 | |
| | | | | | | | | | |
| Actual | | | | | | | | | |
| Growth Fund – Original Class | | $ | 1,000.00 | | | $ | 1,200.40 | | | $ | 7.26 | |
| Growth II Fund – Original Class | | $ | 1,000.00 | | | $ | 1,210.20 | | | $ | 8.55 | |
| Focus 30 Fund – Original Class | | $ | 1,000.00 | | | $ | 1,227.20 | | | $ | 7.57 | |
| Large Growth Fund – Original Class | | $ | 1,000.00 | | | $ | 1,162.70 | | | $ | 6.97 | |
| Value Fund – Original Class | | $ | 1,000.00 | | | $ | 1,105.20 | | | $ | 6.79 | |
| Total Return Fund – Original Class | | $ | 1,000.00 | | | $ | 1,106.00 | | | $ | 7.00 | |
| Balanced Fund – Original Class | | $ | 1,000.00 | | | $ | 1,075.30 | | | $ | 8.70 | |
| | | | | | | | | | | | | |
| Hypothetical (5% return | | | | | | | | | | | | |
| before expenses) | | | | | | | | | | | | |
| Growth Fund – Original Class | | $ | 1,000.00 | | | $ | 1,018.20 | | | $ | 6.66 | |
| Growth II Fund – Original Class | | $ | 1,000.00 | | | $ | 1,017.06 | | | $ | 7.80 | |
| Focus 30 Fund – Original Class | | $ | 1,000.00 | | | $ | 1,018.00 | | | $ | 6.85 | |
| Large Growth Fund – Original Class | | $ | 1,000.00 | | | $ | 1,018.35 | | | $ | 6.51 | |
| Value Fund – Original Class | | $ | 1,000.00 | | | $ | 1,018.35 | | | $ | 6.51 | |
| Total Return Fund – Original Class | | $ | 1,000.00 | | | $ | 1,018.15 | | | $ | 6.71 | |
| Balanced Fund – Original Class | | $ | 1,000.00 | | | $ | 1,016.41 | | | $ | 8.45 | |
| (1) | Expenses are equal to the Growth Fund’s expense ratio of 1.33%, the Growth II Fund’s expense ratio of 1.56%, the Focus 30 Fund’s expense ratio of 1.37%, the Large Growth Fund’s expense ratio of 1.30%, the Value Fund’s expense ratio of 1.30%, the Total Return Fund’s expense ratio of 1.34%, and the Balanced Fund’s expense ratio of 1.69%, multiplied by the average account value over the period, multiplied by 181/365 days (to reflect one-half year period). |
| | | Beginning | | | Ending | | | Expenses Paid | |
| | | Account Value | | | Account Value | | | During Period(2) | |
| Institutional Class | | 11/1/2010 | | | 4/30/2011 | | | 11/1/10 – 4/30/11 | |
| | | | | | | | | | |
| Actual | | | | | | | | | |
| Growth Fund – Institutional Class | | $ | 1,000.00 | | | $ | 1,031.54 | | | $ | 4.94 | |
| Growth II Fund – Institutional Class | | $ | 1,000.00 | | | $ | 1,033.27 | | | $ | 4.94 | |
| Focus 30 Fund – Institutional Class | | $ | 1,000.00 | | | $ | 1,035.87 | | | $ | 4.95 | |
| Large Growth Fund – Institutional Class | | $ | 1,000.00 | | | $ | 1,025.62 | | | $ | 4.92 | |
| Value Fund – Institutional Class | | $ | 1,000.00 | | | $ | 1,016.79 | | | $ | 4.90 | |
| | | | | | | | | | | | | |
| Hypothetical (5% return | | | | | | | | | | | | |
| before expenses) | | | | | | | | | | | | |
| Growth Fund – Institutional Class | | $ | 1,000.00 | | | $ | 1,003.10 | | | $ | 4.87 | |
| Growth II Fund – Institutional Class | | $ | 1,000.00 | | | $ | 1,003.10 | | | $ | 4.87 | |
| Focus 30 Fund – Institutional Class | | $ | 1,000.00 | | | $ | 1,003.10 | | | $ | 4.87 | |
| Large Growth Fund – Institutional Class | | $ | 1,000.00 | | | $ | 1,003.10 | | | $ | 4.87 | |
| Value Fund – Institutional Class | | $ | 1,000.00 | | | $ | 1,003.10 | | | $ | 4.87 | |
| (2) | Expenses are equal to the Growth, Growth II, Focus 30, Large Growth, and Value Fund’s expense ratio of 0.98%, multiplied by the average account value over the period, multiplied by 181/365 days (to reflect one-half year period). |
EXPENSE EXAMPLE AND PROXY VOTING POLICY
How to Obtain a Copy of the Funds’ Proxy Voting Policy and Proxy Voting Records
A description of the policies and procedures that the Funds use to determine how to vote proxies relating to portfolio securities is available without charge: (1) by calling 1-800-966-4354; (2) on the Hennessy Funds website at www.hennessyfunds.com; or (3) on the U.S. Securities and Exchange Commission’s website at www.sec.gov. Hennessy Funds’ proxy voting record is available on the SEC’s website at www.sec.gov no later than August 31 for the prior 12 months ending June 30.
Quarterly Filings on Form N-Q
The Funds file their complete schedules of investments with the SEC for the first and third quarters of each fiscal year on Form N-Q. The Funds’ Form N-Q will be available on the SEC’s website at www.sec.gov. The Funds’ Form N-Q may be reviewed and copied at the SEC’s Public Reference Room in Washington, DC and information on the operation of the Public Reference Room may be obtained by calling 1-800-SEC-0330. Information included in the Funds’ N-Q will also be available upon request by calling 1-800-966-4354.
Directors and Officers
The Funds’ Statement of Additional Information includes additional information about the Funds’ Directors and Officers and is available, without charge, upon request by calling 1-800-966-4354 or by visiting the Hennessy Funds website at www.hennessyfunds.com.
Federal Tax Distribution Information (Unaudited)
The Large Growth, Value, Total Return and Balanced Fund designated 100%, 100%, 100% and 100%, respectively, of the dividend declared from net investment income during the year ended October 31, 2010, as qualified dividend income under the Jobs Growth and Tax Reconciliation Act of 2003.
For the year ended October 31, 2010, 100%, 77.80%, 100% and 100% of the ordinary income distributions paid by the Large Growth, Value, Total Return and Balanced Funds, respectively, qualify for the dividends received deduction available to corporate shareholders. A portion of the dividend income received by the Value Fund was from American Depositary Receipts which does not qualify for the dividend received deduction available to corporate shareholders.
HENNESSY FUNDS 1-800-966-4354
Board Approval of Continuation of Investment Advisory Agreements
At its meeting on March 2, 2011, the Board of Directors (the “Board”) of The Hennessy Funds, Inc. (the “Company”) and its two series, the Hennessy Balanced Fund (the “Balanced Fund”) and the Hennessy Total Return Fund (the “Total Return Fund”) (each a “Fund” or collectively the “Funds”), The Hennessy Mutual Funds, Inc. (the “Company”) and its three series, the Hennessy Cornerstone Growth Fund (the “Growth Fund”), the Hennessy Cornerstone Value Fund (the “Value Fund”), and the Hennessy Focus 30 Fund (the “Focus 30 Fund”), The Hennessy Funds Trust (the “Company”) which includes the Hennessy Cornerstone Growth Fund, Series II (the “Growth II Fund”), Hennessy Cornerstone Large Growth Fund (the “Large Growth” Fund), and the Hennessy Select Large Value Fund (the “Large Value” Fund), and the Hennessy SPARX Funds Trust (the “Company”) and its two series, the Hennessy Select SPARX Japan Fund (the “Japan Fund”) and the Hennessy Select SPARX Japan Smaller Companies Fund ( the “Japan Smaller Companies Fund” or collectively with the Growth, Growth II, Value, Focus 30, Total Return, Balanced, Large Value and Large Growth funds, the “Funds”) or collectively with The Hennessy Funds, Inc., and The Hennessy Mutual Funds, Inc., and Hennessy Funds Trust, the “Companies”) including the Directors who are not “interested persons” (as defined in the Investment Company Act of 1940) of the Funds voted to re-approve the current investment advisory agreements for the Funds. The Board reviewed and discussed the specific services provided by the Advisor. The Advisor:
• Provides formula driven investment management for the Hennessy Total Return and Balanced funds; and the Hennessy Cornerstone Growth, Growth Series II, Focus 30, Value and Large Growth funds. Hennessy Advisors, Inc. holds the patent rights to the formulas used for the Cornerstone Growth and Value Funds. In providing investment management, Hennessy Advisors, Inc. will direct and oversee the trading of securities within and the rebalancing of the portfolios of the Funds.
• Provides oversight of the sub-advisors for the Hennessy Select Large Value, Hennessy Select SPARX Japan, and Hennessy Select SPARX Japan Smaller Companies funds.
• Pays the incentive compensation of the Funds’ Chief Compliance Officer.
• Provides responsive customer and shareholder servicing which consists of providing a call center to respond to shareholder inquiries, including specific mutual fund account information. Shareholders can contact Hennessy Advisors, Inc. directly during office hours. The firm endeavors to answer all calls in person within two rings of the telephone.
• Oversees distribution of the Funds through third-party broker/dealers and independent financial institutions such as Charles Schwab, Inc., Fidelity, TD Ameritrade and Pershing. Hennessy Advisors participates in “no transaction fee” (“NTF”) programs with these companies, which allows
BOARD APPROVAL OF CONTINUATION OF INVESTMENT ADVISORY AGREEMENTS
customers to purchase the Hennessy Funds through third party distribution channels without paying a transaction fee. Hennessy Advisors compensates these third party distributors under a pre-determined contractual agreement.
• Oversees those third party service providers that support the Funds in providing fund accounting, fund administration, fund distribution, transfer agency and custodial services.
Hennessy Advisors, Inc. provides its services to The Hennessy Funds, Inc.; The Hennessy Mutual Funds, Inc.; The Hennessy Funds Trust, and The SPARX Funds Trust. The firm also operates a small Limited Liability Company designed for highly qualified investors. Services are provided to no other clients. The firm does not offer investment advice to individual persons or entities other than the mutual funds it manages.
The Board also: (i) compared the performance of each Fund to benchmark indices over various periods of time and concluded that the performance of each Fund warranted the continuation of the Advisory Agreements; (ii) compared the expense ratios of funds similar in asset size and investment objective to each of the Funds and concluded the actual or projected expenses of each Fund were reasonable and warranted continuation of the Advisory Agreements; (iii) considered the fees charged by Hennessy Advisors, Inc. to those of funds similar in asset size and investment objective to each of the Funds and concluded the advisory fees of each Fund were reasonable and warranted continuation of the Advisory Agreements; (iv) considered the profitability of Hennessy Advisors, Inc. with respect to each Fund and the profitability of the Sub-Advisors with respect to the Select Series Funds and concluded the profits were reasonable and not excessive when compared to profitability guidelines set forth in relevant court cases; (v) considered the high level of professionalism and knowledge, along with an extremely low level of turnover, of the employees of the Advisor; and (vi) considered that Neil Hennessy was named one of the top 100 portfolio managers in the nation six of the previous eight years by Barron’s.
The Board then discussed economies of scale and breakpoints and determined that the Funds managed by Hennessy Advisors, Inc. have not yet grown in size, nor has their marketplace demonstrated significantly rapid potential growth to any extent that would warrant the use of breakpoints. The Board took into consideration the profitability of Hennessy Advisors, Inc. and the advisory fees of comparable mutual funds.
The Board reviewed the Funds’ expense ratios and comparable expense ratios for funds like the ten funds being considered for contract renewal by Hennessy Advisors, Inc. The Board used data from Lipper as presented in the charts in the Board Materials showing funds similar in nature to the Hennessy Funds (Mid-Cap Blend, Small Cap Blend, etc.). The Board determined that the expense ratios of the Funds fall within the range of the ratios of other funds in their classification. The Board also referenced the Advisor’s Form ADV and copies of the current Investment Advisory Agreements. All of the factors above were considered separately by the non-interested Directors in an executive session during which management of the Advisor was not present. The factors were viewed in their totality by the Board, with no single factor being the principal or determinative factor in the Board’s determination of whether to approve the
HENNESSY FUNDS 1-800-966-4354
continuation of the Advisory Agreements. The Board was also assisted in its review, consideration and discussion of the Advisory Agreements by a memorandum prepared by legal counsel that summarized the Board’s obligations. Based on the factors discussed above, the Board, including all Independent Directors, recommended continuation of the Advisory Agreements.
BOARD APPROVAL OF CONTINUATION OF INVESTMENT ADVISORY AGREEMENT
(This Page Intentionally Left Blank.)
HENNESSY FUNDS 1-800-966-4354
For information, questions
or assistance, please call
The Hennessy Funds
1-800-966-4354 or 1-415-899-1555
INVESTMENT ADVISOR
Hennessy Advisors, Inc.
7250 Redwood Blvd., Suite 200
Novato, California 94945
ADMINISTRATOR, TRANSFER
AGENT, DIVIDEND PAYING
AGENT & SHAREHOLDER
SERVICING AGENT
U.S. Bancorp Fund Services, LLC
P.O. Box 701
Milwaukee, Wisconsin 53201-0701
CUSTODIAN
U.S. Bank N.A.
Custody Operations
1555 North River Center Dr., Suite 302
Milwaukee, Wisconsin 53212
TRUSTEES
Neil J. Hennessy
Robert T. Doyle
J. Dennis DeSousa
Gerald P. Richardson
COUNSEL
Foley & Lardner LLP
777 East Wisconsin Avenue
Milwaukee, Wisconsin 53202-5306
INDEPENDENT REGISTERED
PUBLIC ACCOUNTING FIRM
KPMG LLP
303 East Wacker Drive
Chicago, Illinois 60601
DISTRIBUTOR
Quasar Distributors, LLC
615 East Michigan Street
Milwaukee, Wisconsin 53202
WWW.HENNESSYFUNDS.COM
This report has been prepared for shareholders and may be distributed
to others only if preceded or accompanied by a current prospectus.
HENNESSY FUNDS
SEMI-ANNUAL REPORT
APRIL 30, 2011
Hennessy Select Large Value Fund
Hennessy Select SPARX Japan Fund
Hennessy Select SPARX Japan Smaller Companies Fund
Contents
| Letter to shareholders | 1 |
| Performance overview | |
| Hennessy Select Large Value Fund | 5 |
| Hennessy Select SPARX Japan Fund | 7 |
| Hennessy Select SPARX Japan Smaller Companies Fund | 8 |
| Financial statements | |
| Schedules of investments | |
| Hennessy Select Large Value Fund | 10 |
| Hennessy Select SPARX Japan Fund | 16 |
| Hennessy Select SPARX Japan Smaller Companies Fund | 20 |
| Statements of assets and liabilities | 26 |
| Statements of operations | 28 |
| Statements of changes in net assets | 30 |
| Financial highlights | |
| Hennessy Select Large Value Fund | 34 |
| Hennessy Select SPARX Japan Fund | 38 |
| Hennessy Select SPARX Japan Smaller Companies Fund | 42 |
| Notes to the financial statements | 44 |
| Expense example | 52 |
| Additional information | 54 |
| Board approval of continuation | |
| of investment advisory agreements | 55 |
June, 2011
Dear Hennessy Funds Shareholder:
When I last wrote to you, I discussed the themes of low confidence and lack of clarity from Washington that dominated the fiscal year ended October 31, 2010. And here we are, six months into our current fiscal year, and those themes are still front and center and affecting the recovery of our financial markets. We could add the global impact of the earthquake and tsunami in Japan, the political unrest in the Middle East and North Africa, the deadly storms and flooding in the southern part of the U.S. and fires in the state of Texas that all occurred during the last quarter to the events holding back market performance. However, despite all these global and national hurdles, what truly stands out to me is that our markets have been resilient. Through all this negativity, our economy continues to fight its way back to health.
Many developed nations, including the U.S., are grappling with high deficits, stagnant or falling home prices and stubbornly high unemployment rates, and this is causing some investors to fear that growth here in the U.S. is just not on firm footing yet. Many investors do, on the other hand, feel optimistic that an economic recovery is clearly underway, and that can be seen in the strong performance of the major U.S. indices. For example, the Dow Jones Industrial Average and the S&P 500 Indices each returned approximately 16-17% for the six-month period ended April 30, 2011. And, we are once again seeing high-quality stocks, those with strong fundamentals and growth potential, returning to favor and leading the market. I think that this past six-month period can best be characterized as a battle between fear and optimism in the financial markets.
There are some heroes in this battle of fear and optimism, and those definitely include U.S. corporations. Many companies are lean and productive. They have strong balance sheets and are growing stronger each quarter. The facts are that consumer spending is improving and the interest rate environment remains favorable. Here at Hennessy, we believe that the financial markets are still undervalued and are poised for long-term, moderate growth. We are enthusiastic about the outlook for the equity market and believe that it should continue to grow even through this onslaught of negativity.
I honestly believe that the average investor is bewildered by the volatile responses of Wall Street to the ebb-and-flow of what is basic economic data. But Wall Street is not the lone villain in this market
HENNESSY FUNDS 1-800-966-4354
drama. Unfortunately, we still don’t have any clear and actionable direction from our leaders in Washington, and in my opinion, this could continue to hinder economic recovery. Many U.S. companies are making a tremendous amount of money, but they are not hiring to grow their businesses until the rules and regulations and taxes are clearly laid out. How can the market make a strong recovery if business and the investor are sidelined by uncertainty and fear?
I would like to answer that. At Hennessy, we use history as our guide to running a business and to investing. I believe that the solution to many of our economic problems is not very complex. Throughout our history, the United States has not been a nation of “savers.” We are consumers. I believe that if taxes were lowered, average Americans would have more money in their pockets, and they may feel more comfortable spending. That increase in demand would cause a need for a rise in inventories, and companies would need to supply those inventories by increasing production, which of course, means hiring and job growth.
Even without lowered taxes the economy is forging ahead. The majority of companies continue to navigate through the mine field of uncertainty, while still making plenty of money for their shareholders. I believe that with strong leadership and clarity from our government, companies should begin to gain confidence, to reinvest in their business models, and most importantly to hire, which should lead to an expanded and sustainable economic recovery.
When I hear our elected officials discuss “Too Big to Fail” when describing our financial institutions, I am in dismay. The U.S. Government is following the exact path that these financial companies took to their eventual demise. These financial firms leveraged themselves to the hilt (think growing U.S. deficit) by continuing to borrow, and then they were bailed out by TARP. I am here to tell you that there is no TARP for the U.S. Government; rather the bailout will come in the form of an increased burden on each of us taxpayers.
Despite the continued fear and uncertainty in the current markets, I continue to fall on the side of optimism and I believe the recovery is real and should just get stronger as we, as a nation, address the issues facing us.
Overview of the Japan Market
The Japanese stock market posted moderate gains for the six-month period ended April 30, 2011. The equity market rose in November following the better than expected U.S. non-farm payroll report and the
LETTER TO SHAREHOLDERS
Federal Reserve Board’s decision to buy an additional $600 billion of treasuries. Japanese stocks were also lifted mid-month after a report showed that the Japanese gross domestic product rose 0.9% in the July – September period versus the second quarter, beating analysts’ expectations. In December, a slew of positive Japanese economic data triggered a further rally in the stock market. Additionally, the strong showing of the U.S. and European equity markets also provided a tailwind for the Nikkei 225, which at one point recovered to a level of 10,300, a seven-month high. January was somewhat volatile, with the equity market rising at the beginning of the month on the back of strong performance in the U.S., followed by a drop mid-month onwards due to the strengthening of the Yen and anti-government riots in Egypt. Come mid-February, demonstrations in the Middle East spread to Libya, the world’s eighth biggest oil producer. The upward momentum in the global stock market came to a halt from mid-March onwards as oil prices surged. Stocks then fell sharply following the Japan’s largest earthquake, which occurred on March 11th. The Nikkei 225 Stock Average dropped below 8,500 for the first time in two years on increasing concerns over the negative impact of the earthquake. The Yen renewed its historical high of 76 against the US dollar for the first time in 16 years on expectations of repatriation by Japanese companies. In April, while positive overseas markets supported Japanese stocks, the equity market was weighed down by fears related to the impact of the damaged nuclear power plants and the halt in production among Japanese manufacturers.
While the impact of damaged nuclear power plants and parts shortages on Corporate Japan’s earnings remains uncertain, our view is that concerns related to disrupted production lines and the supply capacity are beginning to ease, which is likely to benefit the Japanese equity market going forward.
We also believe that short-term uncertainty will increase globally due to fears related to the political unrest in the Middle East and North Africa, heightened concerns over the sovereign debt situation in Europe and weaker U.S. economic data. With that, we will selectively invest in companies that we feel are undervalued and have the potential for high earnings growth.
We continue to uncover great investment opportunities in Japan, with low valuations on many firms, despite a recovery in global demand. Given that, we believe that investors will hunt for individual names which not only offer attractive valuations, but also have strong balance sheets, a competitive manufacturing edge, high-quality craftsmanship, exposure to developing economies and/or energy-efficient technologies.
HENNESSY FUNDS 1-800-966-4354
As always, we will continue to manage money for the long term, in the sole interest of our shareholders. At Hennessy Funds, we pride ourselves on serving each of our investors directly, so please don’t ever hesitate to contact us at 800-966-4354 if we can answer any questions or can be of service.
Best regards,
Neil J. Hennessy
Portfolio Manager & Chief Investment Officer
Past performance does not guarantee future results.
Mutual fund investing involves risk. Principal loss is possible. Investments in foreign securities involve greater volatility and political, economic and current risk and differences in accounting methods.
Opinions expressed are those of Neil Hennessy and are subject to change, are not guaranteed and should not be considered investment advice.
The Dow Jones Industrial Average and S&P 500 are unmanaged indices commonly used to measure performance of U.S. stocks and assume reinvestment of dividends. The Tokyo Stock Price Index (TOPIX) is a market capitalization-weighted index of all companies listed on the First Section of the Tokyo Stock Exchange. The Nikkei 225 is a stock market index for the Tokyo Stock Exchange (TSE). You cannot invest directly in an index.
PERFORMANCE OVERVIEW — HENNESSY SELECT LARGE VALUE FUND
Hennessy Select Large Value Fund
Original Class Shares (HSFVX)
AVERAGE ANNUAL TOTAL RETURN PERIODS ENDED APRIL 30, 2011
| | Six | One | Five | Ten |
| | Months | Year | Years | Years |
| Hennessy Select Large Value Fund | | | | |
| – Original Class | 15.77% | 11.96% | 0.35% | 2.57% |
| Russell 1000 Value Index | 17.29% | 15.24% | 1.40% | 4.31% |
| S&P 500 Index | 16.36% | 17.22% | 2.95% | 2.82% |
Gross expense ratio: 1.41%.
Performance data quoted represents past performance; past performance does not guarantee future results. The performance for periods prior to March 20, 2009 reflects the performance of the Tamarack Value Fund, the predecessor to the Hennessy Select Large Value Fund. The investment return and principal value of an investment will fluctuate so that an investor’s shares, when redeemed, may be worth more or less than their original cost. Current performance of the Fund may be lower or higher than the performance quoted. Performance data current to the most recent month end may be obtained by visiting www.hennessyfunds.com. The gross expense ratio presented is that from the most recent prospectus.
PERFORMANCE NARRATIVE FROM RBC GLOBAL
ASSET MANAGEMENT (U.S.), SUB-ADVISOR
The Hennessy Select Large Value Fund produced strong returns for the six-month period ended April 30, 2011, gaining 15.77%. For the same period, the Russell 1000 Value Index gained 17.29% while the S&P 500 gained 16.36%. Because the Fund employs a sector neutral approach, its relative performance is the result of stock selection, not sector selection. Versus the Fund’s benchmark, the Russell 1000 Value Index, the Fund’s stock selection performed best in the Information Technology and Health Care sectors, while results in the Energy and Utility sectors hampered overall Fund performance.
Oil rose strongly during the six-month period, moving from $86 to $114 per barrel. Consequently, returns in the Energy sector were striking, with a gain of 37%. The Fund also showed very strong gains in the Energy sector, rising 35%, but not quite strong enough to match the returns in the Index. The Fund had its share of excellent performing Energy stocks, including Walter Energy, a metallurgical coal company, which gained 47%, and Devon Energy, a mid-sized oil and gas producer, which gained 40%. However, in this very strong sector, the largest gains were found in companies that were both mid-size and strongly concentrated in oil rather than gas or coal. The Fund did not hold enough of these types of companies to keep pace with the Index.
In the Utilities sector, two holdings held back Fund results. American Electric Power was flat for the period, enduring losses from October through March based on fears about forthcoming coal burning regulations expected to be issued under the Clean Air Act. The stock rebounded strongly in March as those regulations, once known, were not as burdensome as initially feared. NextEra Energy also hurt results, with a loss of -6% while the Fund held the security. NextEra surprised investors by issuing additional equity, diluting current shareholders, and then using the proceeds to buy more wind power projects, which was judged adversely by the markets.
HENNESSY FUNDS 1-800-966-4354
Stock selection also drove results in the sectors where the Fund performed better than its benchmark. Within the Information Technology sector, Accenture, an international consulting company, led results with a 23% gain due to strong growth in revenues. Stock selection in the Health Care sector, specifically in the Pharmaceutical industry resulted in positive relative performance in the Fund. Watson Pharmaceuticals, a maker of both generic and branded drugs, rose 23% while held in the Fund. Johnson and Johnson performed very poorly through the first four months of the period, and that poor performance led to an attractive valuation. When that attractive evaluation became apparent, Johnson and Johnson was added to the Select Large Value portfolio, and the stock has since performed well.
In contrast to the first stages of the current stock market rally, the strong fundamentals of many individual stocks began to materialize in earnest during the last six months. We believe that as the market returns to fully favoring quality stocks with strong fundamentals, the better the Fund should do relative to its benchmark.
Hennessy Select Large Value Fund
Institutional Class Shares (HSVIX)
AVERAGE ANNUAL TOTAL RETURN PERIODS ENDED APRIL 30, 2011
| | Six | One | Since Inception |
| | Months | Year | (3/20/09) |
| Hennessy Select Large Value Fund | | | |
| – Institutional Class | 16.01% | 12.47% | 28.71% |
| Russell 1000 Value Index | 17.29% | 15.24% | 35.21% |
| S&P 500 Index | 16.36% | 17.22% | 33.88% |
Gross expense ratio: 1.22%. Net expense ratio: 0.98%. The expense ratio is contractually capped at 0.98% indefinitely.
Performance data quoted represents past performance; past performance does not guarantee future results. The investment return and principal value of an investment will fluctuate so that an investor’s shares, when redeemed, may be worth more or less than their original cost. Current performance of the Fund may be lower or higher than the performance quoted. Performance data current to the most recent month end may be obtained by visiting www.hennessyfunds.com. Investment performance reflects fee waivers in effect. In the absence of such waivers, total return would be reduced. The expense ratios presented are those from the most recent prospectus.
The S&P 500 and Russell 1000 Value are unmanaged indices commonly used to measure the performance of U.S. stocks. The Russell 1000 Value measures large-cap, value-oriented stocks. One cannot invest directly in an index.
Medium-capitalization companies tend to have limited liquidity and greater price volatility than large-capitalization companies.
The Fund’s composition and sector weightings are shown as a percentage of the Fund’s total net assets. Portfolio composition and sector weightings are subject to change at any time and should not be considered a recommendation to buy or sell a particular security. Please refer to the Schedule of Investments within this Semi-Annual Report for additional portfolio information, including percentages of holdings.
PERFORMANCE OVERVIEW — HENNESSY SELECT SPARX JAPAN FUND
Hennessy Select SPARX Japan Fund
Original Class Shares (SPXJX)
AVERAGE ANNUAL TOTAL RETURN PERIODS ENDED APRIL 30, 2011
| | Six | One | Five | Since Inception |
| | Months | Year | Years | (10/31/03) |
| Hennessy Select SPARX Japan Fund | | | | |
| – Original Class | 17.97% | 22.14% | -5.36% | 6.79% |
| MSCI Japan Index | 4.94% | 2.13% | -5.05% | 3.36% |
| TOPIX | 4.81% | 1.43% | -5.58% | 2.71% |
Gross expense ratio: 1.73%.
Performance data quoted represents past performance; past performance does not guarantee future results. The investment return and principal value of an investment will fluctuate so that an investor’s shares, when redeemed, may be worth more or less than their original cost. Current performance of the Fund may be lower or higher than the performance quoted. Performance data current to the most recent month end may be obtained by visiting www.hennessyfunds.com. The gross expense ratio presented is that from the most recent prospectus.
PERFORMANCE NARRATIVE FROM SPARX ASSET MANAGEMENT CO., SUB-ADVISOR
The Hennessy Select SPARX Japan Fund gained 17.97% during the six-month period ended April 30, 2011, significantly outperforming the MSCI Japan Index, which gained 4.94%, and the TOPIX, which gained 4.81% for the same period. The largest contributors to the Fund’s performance among the TOPIX 33 sub-industries included shares of wholesalers, retailers and miscellaneous manufacturing firms. Alternatively, banks, pharmaceutical makers and iron & steel manufacturers were among the worst performers.
The chief positive contributors to the Fund’s strong performance were Ryohin Keikaku Co., Ltd., the operator of the MUJI brand retail chain, and general trading firms, such as Mitsubishi Corporation and Misumi Group, Inc. Ryohin Keikaku gained on speculation of a positive earnings surprise for the fiscal year ended February, 2011. The company has recouped its past two years of underperformance and was the best performing stock in the portfolio during the period. Shares of the two trading firms Mitsubishi and Misumi gained 13% and 18% respectively during the period, as concerns over a possible economic slowdown in China eased and commodity prices rose worldwide.
During the six-month period, the worst performing stocks were drug maker, Rohto Pharmaceutical Co., Ltd., and Japanese air-conditioner manufacturer, Daikin Industries, Ltd. Rohto shares slid -18% during the period as investors were left disappointed by the company’s mid-term operating profit results released in November, which showed sharp appreciation in the Yen and lower U.S. sales. In addition, the firm’s management revised its full-year profit target downward, citing sluggish U.S. demand and increased promotional spending in Asia. Shares of Daikin Industries lost -8% after its announcement in January that the firm might buy U.S. rival Goodman Global, which raised financing concerns and prompted investors to sell the stock on speculation that additional stock might need to be issued in order to pay for the acquisition.
HENNESSY FUNDS 1-800-966-4354
Hennessy Select SPARX Japan Fund
Institutional Class Shares (SPARX)
AVERAGE ANNUAL TOTAL RETURN PERIODS ENDED APRIL 30, 2011
| | Six | One | Five | Since Inception |
| | Months | Year | Years | (10/31/03) |
| Hennessy Select SPARX Japan Fund | | | | |
| – Institutional Class | 18.33% | 22.59% | -5.24% | 6.93% |
| MSCI Japan Index | 4.94% | 2.13% | -5.05% | 3.36% |
| TOPIX | 4.81% | 1.43% | -5.58% | 2.71% |
Gross expense ratio: 1.47%.
Performance data quoted represents past performance; past performance does not guarantee future results. The investment return and principal value of an investment will fluctuate so that an investor’s shares, when redeemed, may be worth more or less than their original cost. Current performance of the Fund may be lower or higher than the performance quoted. Performance data current to the most recent month end may be obtained by visiting www.hennessyfunds.com. The gross expense ratio presented is that from the most recent prospectus.
The MSCI Japan Index is a market capitalization-weighted index of Japanese equities. The Tokyo Stock Price Index (TOPIX) is a market capitalization-weighted index of all companies listed on the First Section of the Tokyo Stock Exchange. The MSCI Japan and TOPIX indices are presented in U.S. Dollar terms and take into account reinvestment of dividends. One cannot invest directly in an index.
Small and medium-capitalization companies tend to have limited liquidity and greater price volatility than large-capitalization companies. Investments in foreign securities involve greater volatility and political, economic and currency risk and differences in accounting methods.
The Fund’s composition and sector weightings are shown as a percentage of the Fund’s total net assets. Portfolio composition and sector weightings are subject to change at any time and should not be considered a recommendation to buy or sell a particular security. Please refer to the Schedule of Investments within this Semi-Annual Report for additional portfolio information, including percentages of holdings.
Hennessy Select SPARX Japan Smaller Companies
Fund (SPJSX)
AVERAGE ANNUAL TOTAL RETURN PERIODS ENDED APRIL 30, 2011
| | Six | One | Three | Since Inception |
| | Months | Year | Years | (8/31/07) |
| Hennessy Select SPARX Japan Smaller | | | | |
| Companies Fund – Original Class | 14.30% | 5.92% | 1.86% | 2.96% |
| MSCI Japan Small Cap Index | 11.05% | 6.23% | 0.46% | -2.35% |
| TOPIX | 4.81% | 1.43% | -5.34% | -5.68% |
Gross expense ratio: 2.15%.
Performance data quoted represents past performance; past performance does not guarantee future results. The investment return and principal value of an investment will fluctuate so that an investor’s shares, when redeemed, may be worth more or less than their original cost. Current performance of the Fund may be lower or higher than the performance quoted. Performance data current to the most recent month end may be obtained by visiting www.hennessyfunds.com. The gross expense ratio presented is that from the most recent prospectus.
PERFORMANCE OVERVIEW — HENNESSY SELECT SPARX JAPAN SMALLER COMPANIES FUND
PERFORMANCE NARRATIVE FROM SPARX ASSET MANAGEMENT CO., SUB-ADVISOR
The Hennessy Select SPARX Japan Smaller Companies Fund gained 14.30% during the six-month period ended April 30, 2011, outperforming both the MSCI Japan Small Cap Index, which gained 11.05%, and the TOPIX, which gained 4.81% for the same period. The biggest contributors to the Fund’s performance among the TOPIX 33 sub-industries included shares of electronic appliance makers, information & communication-related firms and machinery manufacturers. On the other hand, negative contributors included chemical makers, precision instrument makers and food manufacturers.
The chief positive contributors to the Fund’s strong performance during the period were Takeei Corporation, an industrial waste processor, Yamaichi Electronics Co., Ltd., a leading manufacturer of integrated circuit sockets, and Anest Iwata Corporation, a manufacturer of painting machines with a domestic market share of over 60%. Takeei shares surged 148% due to expectations for improved business performance based on post-quake reconstruction demand. Shares of Yamaichi Electronics gained +6% after the firm announced favorable second-quarter earnings results for the fiscal year ended March 31, 2011, which was driven by increased overseas sales. Shares of Anest Iwata also climbed 64% due to bargain hunting, as investors took advantage of its low price-to-earnings ratio.
Among the worst performing stocks during the six-month period were Adeka Corporation, a specialty chemical company, and NPC Inc., which makes solar-panel manufacturing equipment and vacuum packaging machines. Shares of Adeka declined -7% on earnings concerns as the company suffered earthquake damage to its main factories. Shares of NPC dropped -15% during the period due to profit taking after its stock price surged beginning in September of last year.
The MSCI Japan Small Cap Index represents the universe of small capitalization companies in the Japanese equity markets. The Tokyo Stock Price Index (TOPIX) is a market capitalization-weighted index of all companies listed on the First Section of the Tokyo Stock Exchange. The MSCI Japan Small Cap and TOPIX indices are presented in U.S. Dollar terms and take into account reinvestment of dividends. One cannot invest directly in an index.
Small and medium-capitalization companies tend to have limited liquidity and greater price volatility than large-capitalization companies. Investments in foreign securities involve greater volatility and political, economic and currency risk and differences in accounting methods.
The Fund’s composition and sector weightings are shown as a percentage of the Fund’s total net assets. Portfolio composition and sector weightings are subject to change at any time and should not be considered a recommendation to buy or sell a particular security. Please refer to the Schedule of Investments within this Semi-Annual Report for additional portfolio information, including percentages of holdings.
Price to Earnings Ratio (P/E) is a common tool for comparing the prices of different common stocks and is calculated by dividing the current market price of a stock by the earnings per share.
HENNESSY FUNDS 1-800-966-4354
Schedules of Investments
HENNESSY SELECT
LARGE VALUE FUND
As of April 30, 2011 (Unaudited)
(% of Net Assets)
| | TOP TEN EQUITY HOLDINGS | % of net assets |
| | J.P. Morgan Chase & Co. | 3.76% |
| | Wells Fargo & Co. | 2.69% |
| | Chevron Corp. | 2.51% |
| | Proctor & Gamble Co. | 2.50% |
| | Intel Corp. | 2.42% |
| | Devon Energy Corp. | 2.41% |
| | Verizon Communications, Inc. | 2.33% |
| | Marathon Oil Corp. | 2.20% |
| | The Walt Disney Co. | 2.17% |
| | Bank of America Corp. | 2.09% |
SCHEDULE OF INVESTMENTS — HENNESSY SELECT LARGE VALUE FUND
| | COMMON STOCKS – 98.60% | | Number | | | | | | % of | |
| | | | of Shares | | | Value | | | Net Assets | |
| | Consumer Discretionary – 7.26% | | | | | | | | | |
| | Comcast Corp. | | | 113,505 | | | $ | 2,978,371 | | | | 2.09 | % |
| | Johnson Controls, Inc. | | | 29,670 | | | | 1,216,470 | | | | 0.85 | % |
| | Macy’s, Inc. | | | 63,715 | | | | 1,523,426 | | | | 1.07 | % |
| | The Walt Disney Co. | | | 71,860 | | | | 3,097,166 | | | | 2.17 | % |
| | Wyndham Worldwide Corp. | | | 44,685 | | | | 1,546,548 | | | | 1.08 | % |
| | | | | | | | | 10,361,981 | | | | 7.26 | % |
| | Consumer Staples – 9.51% | | | | | | | | | | | | |
| | Coca-Cola Co. | | | 41,495 | | | | 2,799,253 | | | | 1.96 | % |
| | Dr. Pepper Snapple Group, Inc. | | | 42,705 | | | | 1,674,036 | | | | 1.17 | % |
| | Kroger Co. | | | 57,375 | | | | 1,394,786 | | | | 0.98 | % |
| | Philip Morris International, Inc. | | | 34,845 | | | | 2,419,637 | | | | 1.70 | % |
| | Procter & Gamble Co. | | | 55,080 | | | | 3,574,692 | | | | 2.50 | % |
| | Wal-Mart Stores, Inc. | | | 31,085 | | | | 1,709,053 | | | | 1.20 | % |
| | | | | | | | | 13,571,457 | | | | 9.51 | % |
| | Energy – 12.76% | | | | | | | | | | | | |
| | Chevron Corp. | | | 32,785 | | | | 3,587,990 | | | | 2.51 | % |
| | ConocoPhillips | | | 17,855 | | | | 1,409,295 | | | | 0.99 | % |
| | Devon Energy Corp. | | | 37,780 | | | | 3,437,980 | | | | 2.41 | % |
| | Diamond Offshore Drilling, Inc. | | | 20,455 | | | | 1,551,921 | | | | 1.09 | % |
| | EOG Resources, Inc. | | | 6,075 | | | | 685,928 | | | | 0.48 | % |
| | Halliburton Co. | | | 44,305 | | | | 2,236,517 | | | | 1.57 | % |
| | Marathon Oil Corp. | | | 58,045 | | | | 3,136,752 | | | | 2.20 | % |
| | National Oilwell Varco, Inc. | | | 28,225 | | | | 2,164,575 | | | | 1.51 | % |
| | | | | | | | | 18,210,958 | | | | 12.76 | % |
| | Financials – 24.20% | | | | | | | | | | | | |
| | Ace Ltd. (b) | | | 23,325 | | | | 1,568,606 | | | | 1.10 | % |
| | Affiliated Managers Group, Inc. (a) | | | 21,395 | | | | 2,333,767 | | | | 1.64 | % |
| | Aon Corp. | | | 30,935 | | | | 1,613,879 | | | | 1.13 | % |
| | Bank of America Corp. | | | 242,630 | | | | 2,979,496 | | | | 2.09 | % |
| | Berkshire Hathaway, Inc. – Class B (a) | | | 17,710 | | | | 1,475,243 | | | | 1.03 | % |
| | Boston Properties, Inc. | | | 18,595 | | | | 1,943,735 | | | | 1.36 | % |
| | Capital One Financial Corp. | | | 41,565 | | | | 2,274,853 | | | | 1.59 | % |
| | Citigroup, Inc. (a) | | | 78,970 | | | | 362,472 | | | | 0.25 | % |
The accompanying notes are an integral part of these financial statements.
HENNESSY FUNDS 1-800-966-4354
| | COMMON STOCKS | | Number | | | | | | % of | |
| | | | of Shares | | | Value | | | Net Assets | |
| | Financials (Continued) | | | | | | | | | |
| | Digital Realty Trust, Inc. | | | 24,350 | | | $ | 1,469,279 | | | | 1.03 | % |
| | Fifth Third Bancorp | | | 103,810 | | | | 1,377,559 | | | | 0.97 | % |
| | IntercontinentalExchange, Inc. (a) | | | 8,665 | | | | 1,042,833 | | | | 0.73 | % |
| | J.P. Morgan Chase & Co. | | | 117,470 | | | | 5,360,156 | | | | 3.76 | % |
| | Prudential Financial, Inc. | | | 31,760 | | | | 2,014,219 | | | | 1.41 | % |
| | Simon Property Group, Inc. | | | 20,273 | | | | 2,322,070 | | | | 1.63 | % |
| | The Goldman Sachs Group, Inc. | | | 16,910 | | | | 2,553,579 | | | | 1.79 | % |
| | Wells Fargo & Co. | | | 131,785 | | | | 3,836,261 | | | | 2.69 | % |
| | | | | | | | | 34,528,007 | | | | 24.20 | % |
| | Health Care – 13.39% | | | | | | | | | | | | |
| | Amgen, Inc. (a) | | | 29,935 | | | | 1,701,805 | | | | 1.19 | % |
| | Celgene Corp. (a) | | | 38,725 | | | | 2,280,128 | | | | 1.60 | % |
| | CIGNA Corp. | | | 55,885 | | | | 2,617,094 | | | | 1.83 | % |
| | Mckesson Corp. | | | 29,990 | | | | 2,489,470 | | | | 1.75 | % |
| | Merck & Co., Inc. | | | 20,952 | | | | 753,224 | | | | 0.53 | % |
| | Pfizer, Inc. | | | 140,990 | | | | 2,955,151 | | | | 2.07 | % |
| | St. Jude Medical, Inc. | | | 40,860 | | | | 2,183,558 | | | | 1.53 | % |
| | Thermo Electron Corp. (a) | | | 34,515 | | | | 2,070,555 | | | | 1.45 | % |
| | Watson Pharmaceuticals, Inc. (a) | | | 33,025 | | | | 2,048,211 | | | | 1.44 | % |
| | | | | | | | | 19,099,196 | | | | 13.39 | % |
| | Industrials – 9.29% | | | | | | | | | | | | |
| | CSX Corp. | | | 28,785 | | | | 2,265,092 | | | | 1.59 | % |
| | Eaton Corp. | | | 34,555 | | | | 1,849,729 | | | | 1.30 | % |
| | General Electric Co. | | | 122,540 | | | | 2,505,943 | | | | 1.76 | % |
| | Honeywell International, Inc. | | | 37,110 | | | | 2,272,245 | | | | 1.59 | % |
| | PACCAR, Inc. | | | 17,305 | | | | 919,069 | | | | 0.65 | % |
| | Timken Co. | | | 25,400 | | | | 1,432,306 | | | | 1.00 | % |
| | Tyco International Ltd. (b) | | | 22,040 | | | | 1,074,229 | | | | 0.75 | % |
| | United Rentals, Inc. (a) | | | 31,595 | | | | 929,525 | | | | 0.65 | % |
| | | | | | | | | 13,248,138 | | | | 9.29 | % |
| | Information Technology – 7.93% | | | | | | | | | | | | |
| | Corning, Inc. | | | 68,945 | | | | 1,443,708 | | | | 1.01 | % |
| | eBay, Inc. (a) | | | 29,380 | | | | 1,010,672 | | | | 0.71 | % |
The accompanying notes are an integral part of these financial statements.
SCHEDULE OF INVESTMENTS — HENNESSY SELECT LARGE VALUE FUND
| | COMMON STOCKS | | Number | | | | | | % of | |
| | | | of Shares | | | Value | | | Net Assets | |
| | Information Technology (Continued) | | | | | | | | | |
| | Intel Corp. | | | 148,935 | | | $ | 3,453,803 | | | | 2.42 | % |
| | MasterCard, Inc. | | | 4,665 | | | | 1,287,027 | | | | 0.90 | % |
| | Microsoft Corp. | | | 81,915 | | | | 2,131,428 | | | | 1.49 | % |
| | Motorola Solutions, Inc. (a) | | | 43,360 | | | | 1,989,357 | | | | 1.40 | % |
| | | | | | | | | 11,315,995 | | | | 7.93 | % |
| | Materials – 3.24% | | | | | | | | | | | | |
| | Alcoa, Inc. | | | 75,810 | | | | 1,288,770 | | | | 0.90 | % |
| | Eastman Chemical Co. | | | 16,385 | | | | 1,757,291 | | | | 1.23 | % |
| | Solutia, Inc. (a) | | | 60,085 | | | | 1,583,240 | | | | 1.11 | % |
| | | | | | | | | 4,629,301 | | | | 3.24 | % |
| | Telecommunication Services – 4.98% | | | | | | | | | | | | |
| | AT&T, Inc. | | | 75,760 | | | | 2,357,651 | | | | 1.65 | % |
| | CenturyLink, Inc. | | | 34,767 | | | | 1,417,799 | | | | 1.00 | % |
| | Verizon Communications, Inc. | | | 87,995 | | | | 3,324,451 | | | | 2.33 | % |
| | | | | | | | | 7,099,901 | | | | 4.98 | % |
| | Utilities – 6.04% | | | | | | | | | | | | |
| | American Electric Power, Inc. | | | 63,240 | | | | 2,306,995 | | | | 1.62 | % |
| | Entergy Corp. | | | 20,575 | | | | 1,434,489 | | | | 1.01 | % |
| | Sempra Energy | | | 44,390 | | | | 2,445,889 | | | | 1.71 | % |
| | Xcel Energy, Inc. | | | 99,725 | | | | 2,426,309 | | | | 1.70 | % |
| | | | | | | | | 8,613,682 | | | | 6.04 | % |
| | | | | | | | | | | | | | |
| | Total Common Stocks (Cost $118,641,818) | | | | | | | 140,678,616 | | | | 98.60 | % |
| | | | | | | | | | | | | | |
| | SHORT-TERM INVESTMENTS – 0.41% | | | | | | | | | | | | |
| | Money Market Funds – 0.41% | | | | | | | | | | | | |
| | Fidelity Government Portfolio – | | | | | | | | | | | | |
| | Institutional Class, 0.01% (c) | | | 590,504 | | | | 590,504 | | | | 0.41 | % |
| | | | | | | | | | | | | | |
| | Total Short-Term Investments | | | | | | | | | | | | |
| | (Cost $590,504) | | | | | | | 590,504 | | | | 0.41 | % |
| | | | | | | | | | | | | | |
| | Total Investments – 99.01% | | | | | | | | | | | | |
| | (Cost $119,232,322) | | | | | | | 141,269,120 | | | | 99.01 | % |
| | | | | | | | | | | | | | |
| | Other Assets in Excess of Liabilities – 0.99% | | | | | | | 1,408,690 | | | | 0.99 | % |
| | TOTAL NET ASSETS – 100.00% | | | | | | $ | 142,677,810 | | | | 100.00 | % |
The accompanying notes are an integral part of these financial statements.
HENNESSY FUNDS 1-800-966-4354
Percentages are stated as a percent of net assets.
(a)Non-income producing security.
(b)Foreign issued security.
(c)The rate listed is the Fund’s 7-day yield as of April 30, 2011.
Summary of Fair Value Exposure at April 30, 2011
The Fund has adopted authoritative fair valuation accounting standards which establish an authoritative definition of fair value and set out a hierarchy for measuring fair value. These standards require additional disclosures about the various inputs and valuation techniques used to develop the measurements of fair value and a discussion in changes in valuation techniques and related inputs during the period.
Securities which are traded on a national or recognized stock exchange are valued at the last sale price on the securities exchange on which such securities are primarily traded. Exchange-traded securities for which there were no transactions that day and debt securities are valued at the most recent bid prices. Instruments with a remaining maturity of 60 days or less are valued on an amortized cost basis. When a price for an underlying security is not readily available or if a significant event has occurred that indicates the closing price of a security no longer represents the true value of that security, fair value pricing procedures have been adopted by the Board of Directors of the Funds. Fair value pricing determinations are made in good faith in accordance with these procedures. There are numerous criteria that will be given consideration in determining a fair value of a security. Some of these criteria are: trading volume of security and markets, value of other like securities and news events with direct bearing to security or market. Fair value pricing results in an estimated price that reasonably reflects the current market conditions in order to rate the portfolio holdings such that shareholder transactions receive a fair net asset value.
The Fund has performed an analysis of all existing investments to determine the significance and character of all inputs to their fair value determination.
| | Level 1 – | Quoted unadjusted prices for identical instruments in active markets to which the Fund has access at the date of measurement. |
| | Level 2 – | Quoted prices for similar instruments in active markets; quoted prices for identical or similar instruments in markets that are not active; and model-derived valuations in which all significant inputs and significant value drivers are observable in active markets. Level 2 inputs are those in markets for which there are few transactions, the prices are not current, little public information exists or instances where prices vary substantially over time or among brokered market makers. |
| | Level 3 – | Model derived valuations in which one or more significant inputs or significant value drivers are unobservable. Unobservable inputs are those inputs that reflect the Fund’s own assumptions that market participants would use to price the asset or liability based on the best available information. |
The inputs or methodology used for valuing securities are not an indication of the risk associated with investing in those securities.
The accompanying notes are an integral part of these financial statements.
SCHEDULE OF INVESTMENTS — HENNESSY SELECT LARGE VALUE FUND
The following is a summary of the inputs used to value the Fund’s net assets as of April 30, 2011:
| | Common Stock | | Level 1 | | | Level 2 | | | Level 3 | | | Total | |
| | Consumer Discretionary | | $ | 10,361,981 | | | $ | — | | | $ | — | | | $ | 10,361,981 | |
| | Consumer Staples | | | 13,571,457 | | | | — | | | | — | | | | 13,571,457 | |
| | Energy | | | 18,210,958 | | | | — | | | | — | | | | 18,210,958 | |
| | Financials | | | 34,528,007 | | | | — | | | | — | | | | 34,528,007 | |
| | Health Care | | | 19,099,196 | | | | — | | | | — | | | | 19,099,196 | |
| | Industrials | | | 13,248,138 | | | | — | | | | — | | | | 13,248,138 | |
| | Information Technology | | | 11,315,995 | | | | — | | | | — | | | | 11,315,995 | |
| | Materials | | | 4,629,301 | | | | — | | | | — | | | | 4,629,301 | |
| | Telecommunication Services | | | 7,099,901 | | | | — | | | | — | | | | 7,099,901 | |
| | Utilities | | | 8,613,682 | | | | — | | | | — | | | | 8,613,682 | |
| | Total Common Stock | | $ | 140,678,616 | | | $ | — | | | $ | — | | | $ | 140,678,616 | |
| | Short-Term Investments | | $ | 590,504 | | | $ | — | | | $ | — | | | $ | 590,504 | |
| | Total Investments in Securities | | $ | 141,269,120 | | | $ | — | | | $ | — | | | $ | 141,269,120 | |
Transfers between levels are recognized at the end of the reporting period. During the period ended April 30, 2011, the Fund recognized no significant transfers between levels.
The accompanying notes are an integral part of these financial statements.
HENNESSY FUNDS 1-800-966-4354
HENNESSY SELECT SPARX
JAPAN FUND
As of April 30, 2011 (Unaudited)
(% of Net Assets)
| | TOP TEN EQUITY HOLDINGS | % of net assets |
| | Shimano, Inc. | 5.61% |
| | Keyence Corp. | 5.48% |
| | Ryohin Keikaku Co., Ltd. | 5.29% |
| | Mitsubishi Corp. | 5.26% |
| | Asics Corp. | 5.14% |
| | Sumitomo Corp. | 5.08% |
| | Daikin Industries | 5.03% |
| | Kao Corp. | 4.93% |
| | Itochu Corp. | 4.91% |
| | Misumi Group, Inc. | 4.52% |
SCHEDULE OF INVESTMENTS — HENNESSY SELECT SPARX JAPAN FUND
| | COMMON STOCKS – 93.44% | | Number | | | | | | % of | |
| | | | of Shares | | | Value | | | Net Assets | |
| | Consumer Discretionary – 21.92% | | | | | | | | | |
| | Asics Corp. | | | 68,000 | | | $ | 979,153 | | | | 5.14 | % |
| | Isuzu Motors, Ltd. | | | 81,000 | | | | 345,510 | | | | 1.82 | % |
| | Ryohin Keikaku Co., Ltd. | | | 21,900 | | | | 1,007,052 | | | | 5.29 | % |
| | Shimano, Inc. | | | 20,000 | | | | 1,067,620 | | | | 5.61 | % |
| | Toyota Motor Corp. | | | 19,400 | | | | 772,508 | | | | 4.06 | % |
| | | | | | | | | 4,171,843 | | | | 21.92 | % |
| | Consumer Staples – 7.20% | | | | | | | | | | | | |
| | Kao Corp. | | | 37,600 | | | | 938,204 | | | | 4.93 | % |
| | Unicharm Corp. | | | 10,900 | | | | 431,350 | | | | 2.27 | % |
| | | | | | | | | 1,369,554 | | | | 7.20 | % |
| | Financials – 7.36% | | | | | | | | | | | | |
| | Mizuho Financial Group | | | 422,500 | | | | 666,708 | | | | 3.50 | % |
| | Sumitomo Mitsui Financial Group, Inc. | | | 23,900 | | | | 735,135 | | | | 3.86 | % |
| | | | | | | | | 1,401,843 | | | | 7.36 | % |
| | Health Care – 8.37% | | | | | | | | | | | | |
| | Mani, Inc. | | | 18,800 | | | | 656,603 | | | | 3.45 | % |
| | Rohto Pharmaceutical Co., Ltd. | | | 66,000 | | | | 669,642 | | | | 3.52 | % |
| | Terumo Corp. | | | 4,800 | | | | 266,289 | | | | 1.40 | % |
| | | | | | | | | 1,592,534 | | | | 8.37 | % |
| | Industrials – 31.27% | | | | | | | | | | | | |
| | Daikin Industries | | | 30,300 | | | | 958,513 | | | | 5.03 | % |
| | Itochu Corp. | | | 90,400 | | | | 935,038 | | | | 4.91 | % |
| | Komatsu, Ltd. | | | 13,100 | | | | 458,657 | | | | 2.41 | % |
| | Marubeni Corp. | | | 107,000 | | | | 773,001 | | | | 4.06 | % |
| | Misumi Group, Inc. | | | 34,200 | | | | 859,691 | | | | 4.52 | % |
| | Mitsubishi Corp. | | | 37,300 | | | | 1,001,994 | | | | 5.26 | % |
| | Sumitomo Corp. | | | 70,800 | | | | 966,228 | | | | 5.08 | % |
| | | | | | | | | 5,953,122 | | | | 31.27 | % |
| | Information Technology – 5.48% | | | | | | | | | | | | |
| | Keyence Corp. | | | 4,000 | | | | 1,043,457 | | | | 5.48 | % |
| | | | | | | | | | | | | | |
| | Materials – 11.84% | | | | | | | | | | | | |
| | Fuji Seal International, Inc. | | | 28,200 | | | | 587,884 | | | | 3.09 | % |
| | Sumitomo Metal Industries | | | 300,000 | | | | 628,737 | | | | 3.30 | % |
The accompanying notes are an integral part of these financial statements.
HENNESSY FUNDS 1-800-966-4354
| | COMMON STOCKS | | Number | | | | | | % of | |
| | | | of Shares | | | Value | | | Net Assets | |
| | Materials (Continued) | | | | | | | | | |
| | Sumitomo Metal Mining Co., Ltd. | | | 44,000 | | | $ | 779,486 | | | | 4.10 | % |
| | Taiyo Nippon Sanso Corp. | | | 32,000 | | | | 257,215 | | | | 1.35 | % |
| | | | | | | | | 2,253,322 | | | | 11.84 | % |
| | | | | | | | | | | | | | |
| | Total Common Stocks (Cost $15,167,461) | | | | | | | 17,785,675 | | | | 93.44 | % |
| | | | | | | | | | | | | | |
| | SHORT-TERM INVESTMENTS – 2.42% | | | | | | | | | | | | |
| | Money Market Funds – 2.42% | | | | | | | | | | | | |
| | Fidelity Government Portfolio – | | | | | | | | | | | | |
| | Institutional Class, 0.01% (a) | | | 459,947 | | | | 459,947 | | | | 2.42 | % |
| | | | | | | | | | | | | | |
| | Total Short-Term Investments | | | | | | | | | | | | |
| | (Cost $459,947) | | | | | | | 459,947 | | | | 2.42 | % |
| | | | | | | | | | | | | | |
| | Total Investments – 95.86% | | | | | | | | | | | | |
| | (Cost $15,627,408) | | | | | | | 18,245,622 | | | | 95.86 | % |
| | | | | | | | | | | | | | |
| | Other Assets in Excess of Liabilities – 4.14% | | | | | | | 789,389 | | | | 4.14 | % |
| | TOTAL NET ASSETS – 100.00% | | | | | | $ | 19,035,011 | | | | 100.00 | % |
Percentages are stated as a percent of net assets.
(a)The rate listed is the Fund’s 7-day yield as of April 30, 2011.
Summary of Fair Value Exposure at April 30, 2011
The Fund has adopted authoritative fair valuation accounting standards which establish an authoritative definition of fair value and set out a hierarchy for measuring fair value. These standards require additional disclosures about the various inputs and valuation techniques used to develop the measurements of fair value and a discussion in changes in valuation techniques and related inputs during the period.
Securities which are traded on a national or recognized stock exchange are valued at the last sale price on the securities exchange on which such securities are primarily traded. Exchange-traded securities for which there were no transactions that day and debt securities are valued at the most recent bid prices. Instruments with a remaining maturity of 60 days or less are valued on an amortized cost basis. When a price for an underlying security is not readily available or if a significant event has occurred that indicates the closing price of a security no longer represents the true value of that security, fair value pricing procedures have been adopted by the Board of Directors of the Funds. Fair value pricing determinations are made in good faith in accordance with these procedures. There are numerous criteria that will be given consideration in determining a fair value of a security. Some of these criteria are: trading volume of security and markets, value of other like securities and news events with direct bearing to security or market. Fair value pricing results in an estimated price that
The accompanying notes are an integral part of these financial statements.
SCHEDULE OF INVESTMENTS — HENNESSY SELECT SPARX JAPAN FUND
reasonably reflects the current market conditions in order to rate the portfolio holdings such that shareholder transactions receive a fair net asset value.
Fair valuing of foreign securities may be determined with the assistance of a pricing service using correlations between the movement of prices of such securities and indices of domestic securities and other appropriate indicators, such as closing market prices of relevant American Depositary Receipts or futures contracts. The effect of using fair value pricing is that the Funds’ NAV will reflect the affected portfolio securities’ value as determined in the judgement of the Board of Trustees or its designee instead of being determined by the market. Using a fair value pricing methodology to price securities may result in a value that is different from a security’s most recent closing price and from the prices used by other investment companies to calculate their net asset values are considered level 2 prices in the fair valuation hierarchy.
The Fund has performed an analysis of all existing investments to determine the significance and character of all inputs to their fair value determination.
| | Level 1 – | Quoted unadjusted prices for identical instruments in active markets to which the Fund has access at the date of measurement. |
| | Level 2 – | Quoted prices for similar instruments in active markets; quoted prices for identical or similar instruments in markets that are not active; and model-derived valuations in which all significant inputs and significant value drivers are observable in active markets. Level 2 inputs are those in markets for which there are few transactions, the prices are not current, the prices are fair value adjusted due to post market close subsequent events (foreign markets), little public information exists or instances where prices vary substantially over time or among brokered market makers. |
| | Level 3 – | Model derived valuations in which one or more significant inputs or significant value drivers are unobservable. Unobservable inputs are those inputs that reflect the Fund’s own assumptions that market participants would use to price the asset or liability based on the best available information. |
The inputs or methodology used for valuing securities are not an indication of the risk associated with investing in those securities.
The following is a summary of the inputs used to value the Fund’s net assets as of April 30, 2011:
| | Common Stock | | Level 1 | | | Level 2 | | | Level 3 | | | Total | |
| | Consumer Discretionary | | $ | 4,171,843 | | | $ | — | | | $ | — | | | $ | 4,171,843 | |
| | Consumer Staples | | | 1,369,554 | | | | — | | | | — | | | | 1,369,554 | |
| | Financials | | | 1,401,843 | | | | — | | | | — | | | | 1,401,843 | |
| | Health Care | | | 1,592,534 | | | | — | | | | — | | | | 1,592,534 | |
| | Industrials | | | 5,953,122 | | | | — | | | | — | | | | 5,953,122 | |
| | Information Technology | | | 1,043,457 | | | | — | | | | — | | | | 1,043,457 | |
| | Materials | | | 2,253,322 | | | | — | | | | — | | | | 2,253,322 | |
| | Total Common Stock | | $ | 17,785,675 | | | $ | — | | | $ | — | | | $ | 17,785,675 | |
| | Short-Term Investments | | $ | 459,947 | | | $ | — | | | $ | — | | | $ | 459,947 | |
| | Total Investments in Securities | | $ | 18,245,622 | | | $ | — | | | $ | — | | | $ | 18,245,622 | |
Transfers between levels are recognized at the end of the reporting period. During the period ended April 30, 2011, the Fund recognized no significant transfers between levels.
The accompanying notes are an integral part of these financial statements.
HENNESSY FUNDS �� 1-800-966-4354
HENNESSY SELECT SPARX
JAPAN SMALLER COMPANIES FUND
As of April 30, 2011 (Unaudited)
(% of Net Assets)
| | TOP TEN EQUITY HOLDINGS | % of net assets |
| | Juki Corp. | 2.40% |
| | Tokyo Rope Manufacturing Co., Ltd. | 2.37% |
| | Village Vanguard Co., Ltd. | 2.29% |
| | Arc Land Sakamoto Co., Ltd. | 2.28% |
| | Macnica, Inc. | 2.24% |
| | Nippon Chemi-con Corp. | 2.17% |
| | NEC Capital Solutions, Ltd. | 2.17% |
| | Nisshin Steel Co., Ltd. | 2.07% |
| | SIIX Corp. | 2.05% |
| | Nitto Boseki Co., Ltd. | 2.04% |
SCHEDULE OF INVESTMENTS — HENNESSY SELECT SPARX JAPAN SMALLER COMPANIES FUND
| | COMMON STOCKS – 98.94% | | Number | | | | | | % of | |
| | | | of Shares | | | Value | | | Net Assets | |
| | Consumer Discretionary – 19.95% | | | | | | | | | |
| | Arc Land Sakamoto Co., Ltd. | | | 45,500 | | | $ | 627,683 | | | | 2.28 | % |
| | ASKUL Corp. | | | 11,900 | | | | 163,576 | | | | 0.60 | % |
| | Bals Corp. | | | 340 | | | | 319,817 | | | | 1.16 | % |
| | Endo Manufacturing Co., Ltd. | | | 67,600 | | | | 375,023 | | | | 1.36 | % |
| | Haruyama Trading Co., Ltd. | | | 38,200 | | | | 183,665 | | | | 0.67 | % |
| | Nippon Seiki Co., Ltd. | | | 40,000 | | | | 460,581 | | | | 1.67 | % |
| | Nissin Kogyo Co., Ltd. | | | 23,400 | | | | 393,486 | | | | 1.43 | % |
| | Otsuka Kagu, Ltd. | | | 27,900 | | | | 244,897 | | | | 0.89 | % |
| | Press Kogyo Co., Ltd. (a) | | | 80,000 | | | | 362,941 | | | | 1.32 | % |
| | Sanden Corp. | | | 95,000 | | | | 445,047 | | | | 1.62 | % |
| | Seiko Holdings Corp. | | | 130,000 | | | | 424,706 | | | | 1.54 | % |
| | Tohokushinsha Film Corp. | | | 77,400 | | | | 393,131 | | | | 1.43 | % |
| | Topre Corp. | | | 56,700 | | | | 464,840 | | | | 1.69 | % |
| | Village Vanguard Co., Ltd. | | | 142 | | | | 629,341 | | | | 2.29 | % |
| | | | | | | | | 5,488,734 | | | | 19.95 | % |
| | Consumer Staples – 1.85% | | | | | | | | | | | | |
| | Cawachi Ltd. | | | 26,800 | | | | 509,469 | | | | 1.85 | % |
| | | | | | | | | | | | | | |
| | Financials – 4.32% | | | | | | | | | | | | |
| | Anicom Holdings, Inc. (a) | | | 7,400 | | | | 268,212 | | | | 0.98 | % |
| | Suruga Bank, Ltd. | | | 52,000 | | | | 432,719 | | | | 1.57 | % |
| | Tokyo Tomin Bank, Ltd. | | | 36,700 | | | | 486,830 | | | | 1.77 | % |
| | | | | | | | | 1,187,761 | | | | 4.32 | % |
| | Health Care – 1.26% | | | | | | | | | | | | |
| | Message Co., Ltd. | | | 120 | | | | 345,435 | | | | 1.26 | % |
| | | | | | | | | | | | | | |
| | Industrials – 33.97% | | | | | | | | | | | | |
| | Aichi Corp. | | | 111,200 | | | | 527,794 | | | | 1.92 | % |
| | Anest Iwata Corp. | | | 93,000 | | | | 418,480 | | | | 1.52 | % |
| | Asunaro Aoki Construction, Ltd. | | | 68,500 | | | | 352,148 | | | | 1.28 | % |
| | Benefit One, Inc. | | | 332 | | | | 222,247 | | | | 0.81 | % |
| | Juki Corp. (a) | | | 268,000 | | | | 660,790 | | | | 2.40 | % |
| | Kyosan Electric Manufacturing Co., Ltd. | | | 94,000 | | | | 531,912 | | | | 1.93 | % |
| | Mirait Holdings Corp. | | | 66,400 | | | | 500,978 | | | | 1.82 | % |
| | Morita Holdings Corp. | | | 86,000 | | | | 537,533 | | | | 1.95 | % |
The accompanying notes are an integral part of these financial statements.
HENNESSY FUNDS 1-800-966-4354
| | COMMON STOCKS | | Number | | | | | | % of | |
| | | | of Shares | | | Value | | | Net Assets | |
| | Industrials (Continued) | | | | | | | | | |
| | NEC Capital Solutions Ltd. | | | 40,300 | | | $ | 596,687 | | | | 2.17 | % |
| | Nippon Yusoki Co., Ltd. | | | 217,000 | | | | 505,615 | | | | 1.84 | % |
| | Nitto Boseki Co., Ltd. | | | 233,000 | | | | 560,131 | | | | 2.04 | % |
| | Nitto Kogyo Corp. | | | 35,700 | | | | 367,497 | | | | 1.34 | % |
| | NPC, Inc. | | | 22,000 | | | | 427,714 | | | | 1.56 | % |
| | Prestige International, Inc. | | | 151 | | | | 242,002 | | | | 0.88 | % |
| | SBS Holdings, Inc. | | | 287 | | | | 272,087 | | | | 0.99 | % |
| | Senko Co., Ltd. | | | 113,000 | | | | 335,733 | | | | 1.22 | % |
| | Shin Nippon Air Technologies Co., Ltd. | | | 70,900 | | | | 356,620 | | | | 1.30 | % |
| | Takeei Corp. | | | 16,100 | | | | 383,470 | | | | 1.39 | % |
| | Toshiba Machine Co., Ltd. | | | 90,000 | | | | 474,881 | | | | 1.73 | % |
| | Toshin Group Co., Ltd. | | | 12,000 | | | | 297,356 | | | | 1.08 | % |
| | Weathernews, Inc. | | | 21,900 | | | | 490,027 | | | | 1.78 | % |
| | Yushin Precision Equipment Co., Ltd. | | | 15,300 | | | | 281,611 | | | | 1.02 | % |
| | | | | | | | | 9,343,313 | | | | 33.97 | % |
| | Information Technology – 22.82% | | | | | | | | | | | | |
| | Dwango Co., Ltd. | | | 184 | | | | 489,291 | | | | 1.78 | % |
| | Elecom Co., Ltd. | | | 42,400 | | | | 518,010 | | | | 1.88 | % |
| | Information Services International – Dentsu, Ltd. | | | 78,200 | | | | 537,947 | | | | 1.96 | % |
| | ITC Networks Corp. | | | 75,500 | | | | 432,812 | | | | 1.57 | % |
| | Macnica, Inc. | | | 26,100 | | | | 615,859 | | | | 2.24 | % |
| | Nifty Corp. | | | 341 | | | | 491,437 | | | | 1.79 | % |
| | Nippon Chemi-con Corp. | | | 116,000 | | | | 597,769 | | | | 2.17 | % |
| | Roland DG Corp. | | | 15,300 | | | | 245,207 | | | | 0.89 | % |
| | SIIX Corp. | | | 42,000 | | | | 564,384 | | | | 2.05 | % |
| | SRA Holdings, Inc. | | | 52,400 | | | | 467,055 | | | | 1.70 | % |
| | Tamura Corp. | | | 173,000 | | | | 520,397 | | | | 1.89 | % |
| | UKC Holdings Corp. | | | 39,200 | | | | 420,440 | | | | 1.53 | % |
| | Yamaichi Electronics Co., Ltd. (a) | | | 131,900 | | | | 375,626 | | | | 1.37 | % |
| | | | | | | | | 6,276,234 | | | | 22.82 | % |
| | Materials – 14.77% | | | | | | | | | | | | |
| | Adeka Corp. | | | 49,900 | | | | 491,526 | | | | 1.79 | % |
| | Daiso Co., Ltd. | | | 168,000 | | | | 544,708 | | | | 1.98 | % |
The accompanying notes are an integral part of these financial statements.
SCHEDULE OF INVESTMENTS — HENNESSY SELECT SPARX JAPAN SMALLER COMPANIES FUND
| COMMON STOCKS | | Number | | | | | | % of | |
| | | of Shares | | | Value | | | Net Assets | |
| Materials (Continued) | | | | | | | | | |
| Fujikura Kasei Co., Ltd. | | | 80,100 | | | $ | 468,069 | | | | 1.70 | % |
| Nisshin Steel Co., Ltd. | | | 288,000 | | | | 568,082 | | | | 2.07 | % |
| NOF Corp. | | | 125,000 | | | | 545,522 | | | | 1.98 | % |
| Tokyo Rope Manufacturing Co., Ltd. | | | 167,000 | | | | 652,641 | | | | 2.37 | % |
| Tokyo Tekko Co., Ltd. | | | 87,000 | | | | 256,340 | | | | 0.93 | % |
| Wood One Co., Ltd. | | | 115,000 | | | | 537,323 | | | | 1.95 | % |
| | | | | | | | 4,064,211 | | | | 14.77 | % |
| | | | | | | | | | | | | |
Total Common Stocks (Cost $25,216,619) | | | | | | | 27,215,157 | | | | 98.94 | % |
| | | | | | | | | | | | | |
| SHORT-TERM INVESTMENTS – 8.98% | | | | | | | | | | | | |
| Money Market Funds – 8.98% | | | | | | | | | | | | |
| Federated Government Obligations – | | | | | | | | | | | | |
| Institutional Class, 0.01% (b) | | | 1,068,908 | | | | 1,068,908 | | | | 3.89 | % |
| Fidelity Government Portfolio – | | | | | | | | | | | | |
| Institutional Class, 0.01% (b) | | | 1,400,796 | | | | 1,400,796 | | | | 5.09 | % |
| | | | | | | | | | | | | |
| Total Short-Term Investments | | | | | | | | | | | | |
| (Cost $2,469,704) | | | | | | | 2,469,704 | | | | 8.98 | % |
| | | | | | | | | | | | | |
Total Investments – 107.92% | | | | | | | | | | | | |
| (Cost $27,686,323) | | | | | | | 29,684,861 | | | | 107.92 | % |
| | | | | | | | | | | | | |
| Liabilities in Excess of Other Assets – (7.92)% | | | | | | | (2,178,704 | ) | | | (7.92 | )% |
TOTAL NET ASSETS – 100.00% | | | | | | $ | 27,506,157 | | | | 100.00 | % |
Percentages are stated as a percent of net assets.
(a)Non-income producing security.
(b)The rate listed is the Fund’s 7-day yield as of April 30, 2011.
Summary of Fair Value Exposure at April 30, 2011
The Fund has adopted authoritative fair valuation accounting standards which establish an authoritative definition of fair value and set out a hierarchy for measuring fair value. These standards require additional disclosures about the various inputs and valuation techniques used to develop the measurements of fair value and a discussion in changes in valuation techniques and related inputs during the period.
Securities which are traded on a national or recognized stock exchange are valued at the last sale price on the securities exchange on which such securities are primarily traded. Exchange-traded securities for which there were no transactions that day and debt securities are valued at the most recent bid prices. Instruments with a remaining maturity of 60 days or
The accompanying notes are an integral part of these financial statements.
HENNESSY FUNDS 1-800-966-4354
less are valued on an amortized cost basis. When a price for an underlying security is not readily available or if a significant event has occurred that indicates the closing price of a security no longer represents the true value of that security, fair value pricing procedures have been adopted by the Board of Directors of the Funds. Fair value pricing determinations are made in good faith in accordance with these procedures. There are numerous criteria that will be given consideration in determining a fair value of a security. Some of these criteria are: trading volume of security and markets, value of other like securities and news events with direct bearing to security or market. Fair value pricing results in an estimated price that reasonably reflects the current market conditions in order to rate the portfolio holdings such that shareholder transactions receive a fair net asset value.
Fair valuing of foreign securities may be determined with the assistance of a pricing service using correlations between the movement of prices of such securities and indices of domestic securities and other appropriate indicators, such as closing market prices of relevant American Depositary Receipts or futures contracts. The effect of using fair value pricing is that the Funds’ NAV will reflect the affected portfolio securities’ value as determined in the judgement of the Board of Trustees or its designee instead of being determined by the market. Using a fair value pricing methodology to price securities may result in a value that is different from a security’s most recent closing price and from the prices used by other investment companies to calculate their net asset values are considered level 2 prices in the fair valuation hierarchy.
The Fund has performed an analysis of all existing investments to determine the significance and character of all inputs to their fair value determination.
| | Level 1 – | Quoted unadjusted prices for identical instruments in active markets to which the Fund has access at the date of measurement. |
| | Level 2 – | Quoted prices for similar instruments in active markets; quoted prices for identical or similar instruments in markets that are not active; and model-derived valuations in which all significant inputs and significant value drivers are observable in active markets. Level 2 inputs are those in markets for which there are few transactions, the prices are not current, the prices are fair value adjusted due to post market close subsequent events (foreign markets), little public information exists or instances where prices vary substantially over time or among brokered market makers. |
| | Level 3 – | Model derived valuations in which one or more significant inputs or significant value drivers are unobservable. Unobservable inputs are those inputs that reflect the Fund’s own assumptions that market participants would use to price the asset or liability based on the best available information. |
The inputs or methodology used for valuing securities are not an indication of the risk associated with investing in those securities.
The accompanying notes are an integral part of these financial statements.
SCHEDULE OF INVESTMENTS — HENNESSY SELECT SPARX JAPAN SMALLER COMPANIES FUND
The following is a summary of the inputs used to value the Fund’s net assets as of April 30, 2011:
| | Common Stock | | Level 1 | | | Level 2 | | | Level 3 | | | Total | |
| | Consumer Discretionary | | $ | 5,488,734 | | | $ | — | | | $ | — | | | $ | 5,488,734 | |
| | Consumer Staples | | | 509,469 | | | | — | | | | — | | | | 509,469 | |
| | Financials | | | 1,187,761 | | | | — | | | | — | | | | 1,187,761 | |
| | Health Care | | | 345,435 | | | | — | | | | — | | | | 345,435 | |
| | Industrials | | | 9,343,313 | | | | — | | | | — | | | | 9,343,313 | |
| | Information Technology | | | 6,276,234 | | | | — | | | | — | | | | 6,276,234 | |
| | Materials | | | 4,064,211 | | | | — | | | | — | | | | 4,064,211 | |
| | Total Common Stock | | $ | 27,215,157 | | | $ | — | | | $ | — | | | $ | 27,215,157 | |
| | Short-Term Investments | | $ | 2,469,704 | | | $ | — | | | $ | — | | | $ | 2,469,704 | |
| | Total Investments in Securities | | $ | 29,684,861 | | | $ | — | | | $ | — | | | $ | 29,684,861 | |
Transfers between levels are recognized at the end of the reporting period. During the period ended April 30, 2011, the Fund recognized no significant transfers between levels.
The accompanying notes are an integral part of these financial statements.
HENNESSY FUNDS 1-800-966-4354
Financial Statements
Statements of Assets and Liabilities as of April 30, 2011 (Unaudited) |
ASSETS:
Investments in securities, at value (cost $119,232,322,
$15,627,408, and $27,686,323, respectively)
Dividends and interest receivable
Receivable for fund shares sold
Receivable for securities sold
Prepaid expenses and other assets
Total Assets
LIABILITIES:
Due to custodian
Payable for securities purchased
Payable for fund shares redeemed
Payable to advisor
Payable to administrator
Payable to auditor
Payable to directors
Accrued service fees
Accrued expenses and other payables
Total Liabilities
NET ASSETS
NET ASSETS CONSIST OF:
Capital stock
Accumulated net investment income (loss)
Accumulated net realized loss on investments
Unrealized net appreciation (depreciation) on investments and foreign currency related transactions
Total Net Assets
NET ASSETS
Original Class:
Shares authorized (no par value, $0.001 and $0.001 par value, respectively)
Net assets applicable to outstanding Original Class shares
Shares issued and outstanding
Net asset value, offering price and redemption price per share
Institutional Class:
Shares authorized (no par value and $0.001 par value, respectively)
Net assets applicable to outstanding Institutional Class shares
Shares issued and outstanding
Net asset value, offering price and redemption price per share
The accompanying notes are an integral part of these financial statements.
FINANCIAL STATEMENTS – STATEMENTS OF ASSETS AND LIABILITIES
| | | | | | | HENNESSY | |
| HENNESSY | | | HENNESSY | | | SELECT SPARX | |
| SELECT LARGE | | | SELECT SPARX | | | JAPAN SMALLER | |
| VALUE FUND | | | JAPAN FUND | | | COMPANIES FUND | |
| | | | | | | | |
| | | | | | | | |
| $ | 141,269,120 | | | $ | 18,245,622 | | | $ | 29,684,861 | |
| | 188,476 | | | | 225,718 | | | | 290,161 | |
| | 15,118 | | | | 304,724 | | | | 57,800 | |
| | 9,420,848 | | | | 336,472 | | | | — | |
| | 25,258 | | | | 1,410 | | | | 7,410 | |
| | 150,918,820 | | | | 19,113,946 | | | | 30,040,232 | |
| | | | | | | | | | | |
| | | | | | | | | | | |
| | 301,420 | | | | — | | | | — | |
| | 7,531,769 | | | | — | | | | 831,450 | |
| | 141,095 | | | | 1,687 | | | | 1,636,345 | |
| | 98,702 | | | | 15,362 | | | | 27,580 | |
| | 118,360 | | �� | | 36,336 | | | | 20,298 | |
| | 11,131 | | | | 13,570 | | | | 13,407 | |
| | 898 | | | | 698 | | | | 1,087 | |
| | 11,608 | | | | 601 | | | | 2,298 | |
| | 26,027 | | | | 10,681 | | | | 1,610 | |
| | 8,241,010 | | | | 78,935 | | | | 2,534,075 | |
| | | | | | | | | | | |
| $ | 142,677,810 | | | $ | 19,035,011 | | | $ | 27,506,157 | |
| | | | | | | | | | | |
| | | | | | | | | | | |
| $ | 157,703,551 | | | $ | 49,634,499 | | | $ | 26,746,082 | |
| | 152,240 | | | | (123,647 | ) | | | (117,370 | ) |
| | (37,214,779 | ) | | | (33,100,032 | ) | | | (1,119,364 | ) |
| | 22,036,798 | | | | 2,624,191 | | | | 1,996,809 | |
| $ | 142,677,810 | | | $ | 19,035,011 | | | $ | 27,506,157 | |
| | | | | | | | | | | |
| | | | | | | | | | | |
| Unlimited | | | Unlimited | | | Unlimited | |
| | 142,632,379 | | | | 7,276,639 | | | | 27,506,157 | |
| | 6,045,841 | | | | 490,434 | | | | 2,606,031 | |
| $ | 23.59 | | | $ | 14.84 | | | $ | 10.55 | |
| | | | | | | | | | | |
| | | | | | | | | | | |
| Unlimited | | | Unlimited | | | | N/A | |
| | 45,431 | | | | 11,758,372 | | | | | |
| | 1,921 | | | | 784,940 | | | | | |
| $ | 23.65 | | | $ | 14.98 | | | | | |
HENNESSY FUNDS 1-800-966-4354
Financial Statements
Statements of Operations Six Months Ended April 30, 2011 (Unaudited) |
INVESTMENT INCOME:
Dividend income(1)
Interest income
Total investment income
EXPENSES:
Investment advisory fees
Administration, fund accounting, custody and transfer agent fees
Service fees – Original Class (See Note 4)
Federal and state registration fees
Audit fees
Legal fees
Compliance expense
Reports to shareholders
Directors’ fees and expenses
Sub-transfer agent expenses – Original Class (See Note 4)
Sub-transfer agent expenses – Institutional Class (See Note 4)
Interest expense (See Note 5)
Other
Total expenses before reimbursement/waiver
Administration expense waiver – Institutional Class (See Note 4)
Net expenses
NET INVESTMENT INCOME (LOSS)
REALIZED AND UNREALIZED GAINS (LOSSES):
Net realized gain (loss) on investments
Change in unrealized appreciation (depreciation) on investments in securities
NET REALIZED GAIN (LOSS) AND UNREALIZED GAIN (LOSS) ON INVESTMENTS
NET INCREASE (DECREASE) IN NET ASSETS RESULTING FROM OPERATIONS
(1) Net of foreign taxes withheld of $0, $17,608, and $24,626, respectively.
The accompanying notes are an integral part of these financial statements.
FINANCIAL STATEMENTS – STATEMENTS OF OPERATIONS
| | | | | | | HENNESSY | |
| HENNESSY | | | HENNESSY | | | SELECT SPARX | |
| SELECT LARGE | | | SELECT SPARX | | | JAPAN SMALLER | |
| VALUE FUND | | | JAPAN FUND | | | COMPANIES FUND | |
| | | | | | | | |
| $ | 1,716,128 | | | $ | 233,930 | | | $ | 324,521 | |
| | 178 | | | | 191 | | | | 147 | |
| | 1,716,306 | | | | 234,121 | | | | 324,668 | |
| | | | | | | | | | | |
| | | | | | | | | | | |
| | 583,595 | | | | 194,372 | | | | 127,706 | |
| | 175,079 | | | | 49,565 | | | | 27,138 | |
| | 68,637 | | | | 13,229 | | | | 10,642 | |
| | 21,008 | | | | 13,444 | | | | 10,578 | |
| | 10,864 | | | | 10,165 | | | | 8,651 | |
| | 5,951 | | | | 5,951 | | | | 5,951 | |
| | 3,602 | | | | 3,602 | | | | 3,602 | |
| | 16,860 | | | | 7,439 | | | | 2,232 | |
| | 4,958 | | | | 3,959 | | | | 4,959 | |
| | 54,910 | | | | 33,662 | | | | 16,838 | |
| | — | | | | 968 | | | | N/A | |
| | — | | | | 10,234 | | | | — | |
| | 8,914 | | | | 11,178 | | | | 6,246 | |
| | 954,378 | | | | 357,768 | | | | 224,543 | |
| | (49 | ) | | | — | | | | N/A | |
| | 954,329 | | | | 357,768 | | | | 224,543 | |
| $ | 761,977 | | | $ | (123,647 | ) | | $ | 100,125 | |
| | | | | | | | | | | |
| | | | | | | | | | | |
| $ | 14,146,527 | | | $ | 1,063,953 | | | $ | 1,005,728 | |
| | 5,270,887 | | | | (2,799,661 | ) | | | 1,147,057 | |
| | 19,417,414 | | | | (1,735,708 | ) | | | 2,152,785 | |
| | | | | | | | | | | |
| $ | 20,179,391 | | | $ | (1,859,355 | ) | | $ | 2,252,910 | |
HENNESSY FUNDS 1-800-966-4354
| Statements of Changes in Net Assets |
OPERATIONS:
Net investment income (loss)
Net realized gain (loss)
Change in unrealized appreciation (depreciation)
Net increase (decrease) in net assets resulting from operations
DISTRIBUTIONS TO SHAREHOLDERS FROM:
Net investment income – Original Class
Net investment income – Institutional Class
Total distributions
CAPITAL SHARE TRANSACTIONS:
Proceeds from shares subscribed – Original Class
Proceeds from shares subscribed – Institutional Class
Dividends reinvested – Original Class
Dividends reinvested – Institutional Class
Cost of shares redeemed – Original Class
Cost of shares redeemed – Institutional Class
Net increase (decrease) in net assets derived from capital share transactions
TOTAL INCREASE (DECREASE) IN NET ASSETS
NET ASSETS:
Beginning of period
End of period
Accumulated net investment income (loss), end of period
CHANGES IN SHARES OUTSTANDING:
Shares sold – Original Class
Shares sold – Institutional Class
Shares issued to holders as reinvestment of dividends – Original Class
Shares issued to holders as reinvestment of dividends – Institutional Class
Shares redeemed – Original Class
Shares redeemed – Institutional Class
Net increase (decrease) in shares outstanding
The accompanying notes are an integral part of these financial statements.
FINANCIAL STATEMENTS – STATEMENTS OF CHANGES IN NET ASSETS
| Hennessy Select Large Value Fund | |
| | | | | |
| Six Months Ended | | | | |
| April 30, 2011 | | | Year Ended | |
| (Unaudited) | | | October 31, 2010 | |
| | | | | |
| $ | 761,977 | | | $ | 899,788 | |
| | 14,146,527 | | | | 11,884,038 | |
| | 5,270,887 | | | | 378,192 | |
| | 20,179,391 | | | | 13,162,018 | |
| | | | | | | |
| | | | | | | |
| | (1,291,601 | ) | | | (1,607,669 | ) |
| | (582 | ) | | | (468 | ) |
| | (1,292,183 | ) | | | (1,608,137 | ) |
| | | | | | | |
| | | | | | | |
| | 1,161,067 | | | | 1,644,633 | |
| | 6,470 | | | | 10,259 | |
| | 1,235,299 | | | | 1,542,668 | |
| | 528 | | | | 468 | |
| | (10,187,007 | ) | | | (15,965,046 | ) |
| | (4,161 | ) | | | (5,496 | ) |
| | (7,787,804 | ) | | | (12,772,514 | ) |
| | 11,099,404 | | | | (1,218,633 | ) |
| | | | | | | |
| | | | | | | |
| | 131,578,406 | | | | 132,797,039 | |
| $ | 142,677,810 | | | $ | 131,578,406 | |
| | | | | | | |
| $ | 152,240 | | | $ | 682,446 | |
| | | | | | | |
| | | | | | | |
| | 52,214 | | | | 81,862 | |
| | 302 | | | | 514 | |
| | 56,743 | | | | 76,941 | |
| | 24 | | | | 23 | |
| | (457,435 | ) | | | (795,699 | ) |
| | (191 | ) | | | (278 | ) |
| | (348,343 | ) | | | (636,637 | ) |
HENNESSY FUNDS 1-800-966-4354
| Statements of Changes in Net Assets |
OPERATIONS:
Net investment income (loss)
Net realized gain (loss) on securities
Change in unrealized appreciation (depreciation) on securities
Net increase (decrease) in net assets resulting from operations
DISTRIBUTIONS TO SHAREHOLDERS FROM:
Net investment income – Original Class
Net investment income – Institutional Class
Return of capital – Original Class
Return of capital – Institutional Class
Total distributions
CAPITAL SHARE TRANSACTIONS:
Proceeds from shares subscribed – Original Class
Proceeds from shares subscribed – Institutional Class
Dividends reinvested – Original Class
Dividends reinvested – Institutional Class
Cost of shares redeemed – Original Class
Cost of shares redeemed – Institutional Class
Redemption fees retained – Original Class
Redemption fees retained – Institutional Class
Net increase (decrease) in net assets derived from capital share transactions
TOTAL INCREASE (DECREASE) IN NET ASSETS
NET ASSETS:
Beginning of period
End of period
Accumulated net investment income (loss), end of period
CHANGES IN SHARES OUTSTANDING:
Shares sold – Original Class
Shares sold – Institutional Class
Shares issued to holders as reinvestment of dividends – Original Class
Shares issued to holders as reinvestment of dividends – Institutional Class
Shares redeemed – Original Class
Shares redeemed – Institutional Class
Net increase (decrease) in shares outstanding
The accompanying notes are an integral part of these financial statements.
FINANCIAL STATEMENTS – STATEMENTS OF CHANGES IN NET ASSETS
| Hennessy Select SPARX | | | Hennessy Select SPARX | |
| Japan Fund | | | Japan Smaller Companies Fund | |
| Six Months Ended | | | | | | Six Months Ended | | | | |
| April 30, 2011 | | | Year Ended | | | April 30, 2011 | | | Year Ended | |
| (Unaudited) | | | October 31, 2010 | | | (Unaudited) | | | October 31, 2010 | |
| | | | | | | | | | | |
| $ | (123,647 | ) | | $ | (28,134 | ) | | $ | 100,125 | | | $ | (1,744 | ) |
| | 1,063,953 | | | | (6,199,173 | ) | | | 1,005,728 | | | | 1,822,388 | |
| | (2,799,661 | ) | | | 11,415,124 | | | | 1,147,057 | | | | (2,019,798 | ) |
| | (1,859,355 | ) | | | 5,187,817 | | | | 2,252,910 | | | | (199,154 | ) |
| | | | | | | | | | | | | | | |
| | | | | | | | | | | | | | | |
| | — | | | | (30,697 | ) | | | — | | | | (675,389 | ) |
| | — | | | | (22,666 | ) | | | N/A | | | | N/A | |
| | — | | | | (28,764 | ) | | | — | | | | — | |
| | — | | | | (21,239 | ) | | | N/A | | | | N/A | |
| | — | | | | (103,366 | ) | | | — | | | | (675,389 | ) |
| | | | | | | | | | | | | | | |
| | | | | | | | | | | | | | | |
| | 53,930,884 | | | | 12,134,525 | | | | 15,242,782 | | | | 3,996,704 | |
| | 1,144,754 | | | | 9,038,569 | | | | N/A | | | | N/A | |
| | — | | | | 58,305 | | | | — | | | | 654,011 | |
| | — | | | | 42,669 | | | | N/A | | | | N/A | |
| | (62,490,674 | ) | | | (23,363,751 | ) | | | (5,154,592 | ) | | | (4,829,993 | ) |
| | (15,274,423 | ) | | | (13,290,361 | ) | | | N/A | | | | N/A | |
| | — | | | | 36,375 | | | | — | | | | 18,198 | |
| | — | | | | — | | | | N/A | | | | N/A | |
| | (22,689,459 | ) | | | (15,343,669 | ) | | | 10,088,190 | | | | (161,080 | ) |
| | (24,548,814 | ) | | | (10,259,218 | ) | | | 12,341,100 | | | | (1,035,623 | ) |
| | | | | | | | | | | | | | | |
| | | | | | | | | | | | | | | |
| | 43,583,825 | | | | 53,843,043 | | | | 15,165,057 | | | | 16,200,680 | |
| $ | 19,035,011 | | | $ | 43,583,825 | | | $ | 27,506,157 | | | $ | 15,165,057 | |
| | | | | | | | | | | | | | | |
| $ | (123,647 | ) | | $ | — | | | $ | (117,370 | ) | | $ | (217,495 | ) |
| | | | | | | | | | | | | | | |
| | | | | | | | | | | | | | | |
| | 3,819,244 | | | | 1,011,968 | | | | 1,465,232 | | | | 424,911 | |
| | 78,296 | | | | 740,046 | | | | N/A | | | | N/A | |
| | — | | | | 4,983 | | | | — | | | | 74,659 | |
| | — | | | | 3,628 | | | | N/A | | | | N/A | |
| | (4,919,270 | ) | | | (1,911,383 | ) | | | (502,788 | ) | | | (519,710 | ) |
| | (1,155,342 | ) | | | (1,114,529 | ) | | | N/A | | | | N/A | |
| | (2,177,072 | ) | | | (1,265,287 | ) | | | 962,444 | | | | (20,140 | ) |
HENNESSY FUNDS 1-800-966-4354
Financial Highlights
| Hennessy Select Large Value Fund |
For an Original Class share outstanding throughout each period
| | | Six Months | |
| | | Ended | |
| | | April 30, 2011 | |
| | | (Unaudited) | |
| PER SHARE DATA: | | | |
| Net asset value, beginning of period | | $ | 20.57 | |
| Income from investment operations: | | | | |
| Net investment income (loss) | | | 0.13 | |
| Net realized and unrealized gains (losses) on securities | | | 3.10 | |
| Total from investment operations | | | 3.23 | |
| Less Distributions: | | | | |
| Dividends from net investment income | | | (0.21 | ) |
| Dividends from net realized gains | | | — | |
| Total distributions | | | (0.21 | ) |
| Net asset value, end of period | | $ | 23.59 | |
| TOTAL RETURN | | | 15.77 | %(4) |
| SUPPLEMENTAL DATA AND RATIOS: | | | | |
| Net assets, end of period (millions) | | $ | 142.63 | |
| Ratio of expenses to average net assets: | | | | |
| Before expense reimbursement | | | 1.39 | %(5) |
| After expense reimbursement | | | 1.39 | %(5) |
| Ratio of net investment income to average net assets | | | | |
| Before expense reimbursement | | | 1.11 | %(5) |
| After expense reimbursement | | | 1.11 | %(5) |
Portfolio turnover rate(6) | | | 81 | %(4) |
| (1) | For the one month ended October 31, 2009. Effective October 31, 2009, the Fund changed its fiscal year end to October 31st from September 30th. |
| (2) | The financial highlights set forth for periods prior to March 20, 2009 represent the historical financial highlights of the Tamarack Value Fund, Class S shares. The assets of the Tamarack Value Fund were acquired by the Hennessy Select Large Value Fund on March 20, 2009. Prior to the reorganization, Tamarack Value Fund also offered Class A, Class C and R shares. At that time RBC Global Asset Management (U.S.), Inc., (formerly known as Voyageur Asset Management Inc.) ceased to be the investment advisor and Hennessy Advisors, Inc. became the investment advisor. The return of the Tamarack Value Fund, Class S shares during the period October 1, 2008 through March 20, 2009 was (33.09)%. The return of the Hennessy Select Large Value Fund, Original Class shares during the period March 20, 2009 through September 30, 2009 was 36.84%. |
| (3) | Per share net investment income (loss) has been calculated using the average daily shares method. |
| (6) | Portfolio turnover is calculated on the basis of the Fund as a whole. |
The accompanying notes are an integral part of these financial statements.
FINANCIAL HIGHLIGHTS — HENNESSY SELECT LARGE VALUE FUND
| | | | One Month | | | | | | | | | | | | | |
| Year Ended | | | Ended | | | Year Ended September 30, | |
| October 31, | | | October 31, | | | | | | | | | | | | | |
| 2010 | | | 2009(1) | | | 2009(2) | | | 2008(2) | | | 2007(2) | | | 2006(2) | |
| | | | | | | | | | | | | | | | | |
| $ | 18.88 | | | $ | 19.49 | | | $ | 21.80 | | | $ | 43.12 | | | $ | 41.74 | | | $ | 45.78 | |
| | | | | | | | | | | | | | | | | | | | | | | |
| | 0.14 | | | | 0.01 | | | | 0.31 | | | | 0.42 | (3) | | | 0.58 | (3) | | | 0.55 | (3) |
| | 1.78 | | | | (0.62 | ) | | | (2.21 | ) | | | (7.43 | ) | | | 5.04 | | | | 3.07 | |
| | 1.92 | | | | (0.61 | ) | | | (1.90 | ) | | | (7.01 | ) | | | 5.62 | | | | 3.62 | |
| | | | | | | | | | | | | | | | | | | | | | | |
| | (0.23 | ) | | | — | | | | (0.41 | ) | | | (0.78 | ) | | | (0.63 | ) | | | (0.61 | ) |
| | — | | | | — | | | | — | | | | (13.53 | ) | | | (3.61 | ) | | | (7.05 | ) |
| | (0.23 | ) | | | — | | | | (0.41 | ) | | | (14.31 | ) | | | (4.24 | ) | | | (7.66 | ) |
| $ | 20.57 | | | $ | 18.88 | | | $ | 19.49 | | | $ | 21.80 | | | $ | 43.12 | | | $ | 41.74 | |
| | 10.22 | % | | | (3.13 | )%(4) | | | (8.43 | )% | | | (22.42 | )% | | | 14.19 | % | | | 9.10 | % |
| | | | | | | | | | | | | | | | | | | | | | | |
| $ | 131.54 | | | $ | 132.77 | | | $ | 138.34 | | | $ | 174.23 | | | $ | 269.37 | | | $ | 291.66 | |
| | | | | | | | | | | | | | | | | | | | | | | |
| | 1.41 | % | | | 1.37 | %(5) | | | 1.42 | % | | | 1.22 | % | | | 1.26 | % | | | 1.22 | % |
| | 1.38 | % | | | 1.30 | %(5) | | | 1.17 | % | | | 1.02 | % | | | 1.03 | % | | | 1.05 | % |
| | | | | | | | | | | | | | | | | | | | | | | |
| | 0.64 | % | | | 0.28 | %(5) | | | 1.46 | % | | | 1.32 | % | | | 1.13 | % | | | 1.16 | % |
| | 0.67 | % | | | 0.35 | %(5) | | | 1.71 | % | | | 1.52 | % | | | 1.36 | % | | | 1.33 | % |
| | 146 | % | | | 10 | %(4) | | | 142 | % | | | 162 | % | | | 136 | % | | | 38 | % |
HENNESSY FUNDS 1-800-966-4354
Financial Highlights
| Hennessy Select Large Value Fund |
For an Institutional Class share outstanding throughout each period
| | | Six Months | |
| | | Ended | |
| | | April 30, 2011 | |
| | | (Unaudited) | |
| PER SHARE DATA: | | | |
| Net asset value, beginning of period | | $ | 20.65 | |
| | | | | |
| Income from investment operations: | | | | |
| Net investment income (loss) | | | 0.14 | |
| Net realized and unrealized gains (losses) on securities | | | 3.14 | |
| Total from investment operations | | | 3.28 | |
| | | | | |
| Less Distributions: | | | | |
| Dividends from net investment income | | | (0.28 | ) |
| Dividends from net realized gains | | | — | |
| Total distributions | | | (0.28 | ) |
| Net asset value, end of period | | $ | 23.65 | |
| | | | | |
| TOTAL RETURN | | | 16.01 | %(4) |
| | | | | |
| SUPPLEMENTAL DATA AND RATIOS: | | | | |
| Net assets, end of period (millions) | | $ | 0.04 | |
| Ratio of expenses to average net assets: | | | | |
| Before expense reimbursement | | | 1.21 | %(5) |
After expense reimbursement(6) | | | 0.98 | %(5) |
| Ratio of net investment income (loss) to average net assets | | | | |
| Before expense reimbursement | | | 1.27 | %(5) |
After expense reimbursement(6) | | | 1.50 | %(5) |
Portfolio turnover rate(7) | | | 81 | %(4) |
| (1) | For the one month ended October 31, 2009. Effective October 31, 2009, the Fund changed its fiscal year end to October 31st from September 30th. |
| (2) | Institutional Class shares commenced operations on March 20, 2009. |
| (3) | Amount is less than $0.01 or $(0.01). |
| (6) | The Advisor and/or Administrator reimbursed expenses in order to cap the Institutional Class share expenses. Please refer to Note 4 for more information. |
| (7) | Portfolio turnover is calculated on the basis of the Fund as a whole. |
The accompanying notes are an integral part of these financial statements.
FINANCIAL HIGHLIGHTS — HENNESSY SELECT LARGE VALUE FUND
| | | | One Month | | | | |
| Year Ended | | | Ended | | | Period Ended | |
| October 31, | | | October 31, | | | September 30, | |
| 2010 | | | 2009(1) | | | 2009(2) | |
| | | | | | | | |
| $ | 18.92 | | | $ | 19.53 | | | $ | 14.25 | |
| | | | | | | | | | | |
| | | | | | | | | | | |
| | 0.21 | | | | — | (3) | | | 0.08 | |
| | 1.80 | | | | (0.61 | ) | | | 5.20 | |
| | 2.01 | | | | (0.61 | ) | | | 5.28 | |
| | | | | | | | | | | |
| | | | | | | | | | | |
| | (0.28 | ) | | | — | | | | — | |
| | — | | | | — | | | | — | |
| | (0.28 | ) | | | — | | | | — | |
| $ | 20.65 | | | $ | 18.92 | | | $ | 19.53 | |
| | | | | | | | | | | |
| | 10.65 | % | | | (3.12 | )%(4) | | | 37.05 | %(4) |
| | | | | | | | | | | |
| | | | | | | | | | | |
| $ | 0.04 | | | $ | 0.03 | | | $ | 0.03 | |
| | | | | | | | | | | |
| | 1.22 | % | | | 1.20 | %(5) | | | 26.18 | %(5) |
| | 0.98 | % | | | 0.98 | %(5) | | | 0.98 | %(5) |
| | | | | | | | | | | |
| | 0.80 | % | | | 0.44 | %(5) | | | (24.06 | )%(5) |
| | 1.04 | % | | | 0.66 | %(5) | | | 1.14 | %(5) |
| | 146 | % | | | 10 | %(4) | | | 142 | %(4) |
HENNESSY FUNDS 1-800-966-4354
Financial Highlights
| Hennessy Select SPARX Japan Fund |
For an Original Class share outstanding throughout each period
| | | Six Months | |
| | | Ended | |
| | | April 30, 2011 | |
| | | (Unaudited) | |
| PER SHARE DATA: | | | |
| Net asset value, beginning of period | | $ | 12.58 | |
| | | | | |
| Income from investment operations: | | | | |
| Net investment income (loss) | | | (0.26 | ) |
| Net realized and unrealized gains (losses) on securities | | | 2.52 | |
| Total from investment operations | | | 2.26 | |
| | | | | |
| Less Distributions: | | | | |
| Dividends from net investment income | | | — | |
| Dividends from net realized gains | | | — | |
| Return of capital | | | — | |
| Total distributions | | | — | |
| Redemption fees retained | | | — | |
| Net asset value, end of period | | $ | 14.84 | |
| | | | | |
| TOTAL RETURN | | | 17.97 | %(4) |
| | | | | |
| SUPPLEMENTAL DATA AND RATIOS: | | | | |
| Net assets, end of period (millions) | | $ | 7.28 | |
| Ratio of expenses to average net assets: | | | | |
| Before expense reimbursement | | | 1.92 | %(5) |
| After expense reimbursement | | | 1.92 | %(5) |
| Ratio of net investment income (loss) to average net assets | | | | |
| Before expense reimbursement | | | (0.98 | )%(5) |
| After expense reimbursement | | | (0.98 | )%(5) |
Portfolio turnover rate(6) | | | 117 | %(4) |
| (1) | The financial highlights set forth for periods prior to September 17, 2009 represent the historical financial highlights of the SPARX Japan Fund. On September 17, 2009 Hennessy Advisors, Inc., became the investment advisor to the Fund and the Fund changed its name to Hennessy Select SPARX Japan Fund. In addition, the Investor Class shares were redesignated Original Class shares. |
| (2) | Amount is less than $0.01. |
| (3) | Calculated based on average shares outstanding. |
| (6) | Portfolio turnover is calculated on the basis of the Fund as a whole. |
The accompanying notes are an integral part of these financial statements.
FINANCIAL HIGHLIGHTS — HENNESSY SELECT SPARX JAPAN FUND
| Year Ended October 31, | |
| 2010 | | | 2009(1) | | | 2008 | | | 2007 | | | 2006 | |
| | | | | | | | | | | | | | |
| $ | 11.38 | | | $ | 9.73 | | | $ | 16.24 | | | $ | 17.20 | | | $ | 17.41 | |
| | | | | | | | | | | | | | | | | | | |
| | | | | | | | | | | | | | | | | | | |
| | (0.04 | ) | | | 0.02 | | | | 0.05 | | | | (0.03 | ) | | | (0.10 | )(3) |
| | 1.25 | | | | 1.66 | | | | (6.56 | ) | | | (0.93 | ) | | | 0.60 | |
| | 1.21 | | | | 1.68 | | | | (6.51 | ) | | | (0.96 | ) | | | 0.50 | |
| | | | | | | | | | | | | | | | | | | |
| | | | | | | | | | | | | | | | | | | |
| | (0.01 | ) | | | (0.03 | ) | | | — | | | | — | | | | (0.55 | ) |
| | — | | | | — | | | | — | | | | — | | | | (0.17 | ) |
| | (0.01 | ) | | | — | | | | — | | | | — | | | | — | |
| | (0.02 | ) | | | (0.03 | ) | | | — | | | | — | | | | (0.72 | ) |
| | 0.01 | | | | — | (2) | | | — | (2) | | | — | | | | 0.01 | |
| $ | 12.58 | | | $ | 11.38 | | | $ | 9.73 | | | $ | 16.24 | | | $ | 17.20 | |
| | | | | | | | | | | | | | | | | | | |
| | 11.04 | % | | | 17.36 | % | | | (40.09 | )% | | | (5.58 | )% | | | 2.64 | % |
| | | | | | | | | | | | | | | | | | | |
| | | | | | | | | | | | | | | | | | | |
| $ | 20.01 | | | $ | 28.29 | | | $ | 15.86 | | | $ | 19.54 | | | $ | 26.23 | |
| | | | | | | | | | | | | | | | | | | |
| | 1.71 | % | | | 1.75 | % | | | 1.72 | % | | | 1.87 | % | | | 2.22 | % |
| | 1.59 | % | | | 1.24 | % | | | 1.25 | % | | | 1.45 | % | | | 1.50 | % |
| | | | | | | | | | | | | | | | | | | |
| | (0.27 | )% | | | (0.34 | )% | | | (0.10 | )% | | | (0.62 | )% | | | (1.27 | )% |
| | (0.15 | )% | | | 0.17 | % | | | 0.37 | % | | | (0.20 | )% | | | (0.55 | )% |
| | 8 | % | | | 17 | % | | | 35 | % | | | 111 | % | | | 89 | % |
HENNESSY FUNDS 1-800-966-4354
| Hennessy Select SPARX Japan Fund |
For an Institutional Class share outstanding throughout each period
| | | Six Months | |
| | | Ended | |
| | | April 30, 2011 | |
| | | (Unaudited) | |
| PER SHARE DATA: | | | |
| Net asset value, beginning of period | | $ | 12.66 | |
| | | | | |
| Income from investment operations: | | | | |
| Net investment income (loss) | | | 0.01 | |
| Net realized and unrealized gains (losses) on securities | | | 2.31 | |
| Total from investment operations | | | 2.32 | |
| | | | | |
| Less Distributions: | | | | |
| Dividends from net investment income | | | — | |
| Dividends from net realized gains | | | — | |
| Return of capital | | | — | |
| Total distributions | | | — | |
| Redemption fees retained | | | — | |
| Net asset value, end of period | | $ | 14.98 | |
| | | | | |
| TOTAL RETURN | | | 18.33 | %(4) |
| | | | | |
| SUPPLEMENTAL DATA AND RATIOS: | | | | |
| Net assets, end of period (millions) | | $ | 11.76 | |
| Ratio of expenses to average net assets: | | | | |
| Before expense reimbursement | | | 1.67 | %(5) |
| After expense reimbursement | | | 1.67 | %(5) |
| Ratio of net investment income (loss) to average net assets | | | | |
| Before expense reimbursement | | | 0.09 | %(5) |
| After expense reimbursement | | | 0.09 | %(5) |
Portfolio turnover rate(6) | | | 117 | %(4) |
| (1) | The financial highlights set forth for periods prior to September 17, 2009 represent the historical financial highlights of the SPARX Japan Fund. On September 17, 2009 Hennessy Advisors, Inc., became the investment advisor to the Fund and the Fund changed its name to Hennessy Select SPARX Japan Fund. |
| (2) | Amount is less than $0.01 or $(0.01). |
| (3) | Calculated based on average shares outstanding. |
| (6) | Portfolio turnover is calculated on the basis of the Fund as a whole. |
The accompanying notes are an integral part of these financial statements.
FINANCIAL HIGHLIGHTS — HENNESSY SELECT SPARX JAPAN FUND
| Year Ended October 31, | |
| 2010 | | | 2009(1) | | | 2008 | | | 2007 | | | 2006 | |
| | | | | | | | | | | | | | |
| $ | 11.44 | | | $ | 9.78 | | | $ | 16.33 | | | $ | 17.27 | | | $ | 17.44 | |
| | | | | | | | | | | | | | | | | | | |
| | | | | | | | | | | | | | | | | | | |
| | 0.01 | | | | 0.03 | | | | 0.05 | | | | — | (2) | | | (0.06 | )(3) |
| | 1.23 | | | | 1.66 | | | | (6.60 | ) | | | (0.94 | ) | | | 0.61 | |
| | 1.24 | | | | 1.69 | | | | (6.55 | ) | | | (0.94 | ) | | | 0.55 | |
| | | | | | | | | | | | | | | | | | | |
| | | | | | | | | | | | | | | | | | | |
| | (0.01 | ) | | | (0.03 | ) | | | — | | | | — | | | | (0.56 | ) |
| | — | | | | — | | | | — | | | | — | | | | (0.17 | ) |
| | (0.01 | ) | | | — | | | | — | | | | — | | | | — | |
| | (0.02 | ) | | | (0.03 | ) | | | — | | | | — | | | | (0.73 | ) |
| | — | | | | — | (2) | | | — | (2) | | | — | | | | 0.01 | |
| $ | 12.66 | | | $ | 11.44 | | | $ | 9.78 | | | $ | 16.33 | | | $ | 17.27 | |
| | | | | | | | | | | | | | | | | | | |
| | 11.07 | % | | | 17.37 | % | | | (40.11 | )% | | | (5.44 | )% | | | 2.90 | % |
| | | | | | | | | | | | | | | | | | | |
| | | | | | | | | | | | | | | | | | | |
| $ | 23.57 | | | $ | 25.55 | | | $ | 37.03 | | | $ | 82.94 | | | $ | 105.15 | |
| | | | | | | | | | | | | | | | | | | |
| | 1.45 | % | | | 1.75 | % | | | 1.72 | % | | | 1.67 | % | | | 1.66 | % |
| | 1.40 | % | | | 1.24 | % | | | 1.25 | % | | | 1.25 | % | | | 1.25 | % |
| | | | | | | | | | | | | | | | | | | |
| | 0.02 | % | | | (0.34 | )% | | | (0.10 | )% | | | (0.42 | )% | | | (0.71 | )% |
| | 0.07 | % | | | 0.17 | % | | | 0.37 | % | | | 0.00 | % | | | (0.30 | )% |
| | 8 | % | | | 17 | % | | | 35 | % | | | 111 | % | | | 89 | % |
HENNESSY FUNDS 1-800-966-4354
| Hennessy Select SPARX Japan Smaller Companies Fund |
For an Original Class share outstanding throughout each period
| | | Six Months | |
| | | Ended | |
| | | April 30, 2011 | |
| | | (Unaudited) | |
| PER SHARE DATA: | | | |
| Net asset value, beginning of period | | $ | 9.23 | |
| | | | | |
| Income from investment operations: | | | | |
| Net investment income (loss) | | | 0.09 | |
| Net realized and unrealized gains (losses) on securities | | | 1.23 | |
| Total from investment operations | | | 1.32 | |
| | | | | |
| Less Distributions: | | | | |
| Dividends from net investment income | | | — | |
| Dividends from net realized gains | | | — | |
| Total distributions | | | — | |
| Redemption fees retained | | | — | |
| Net asset value, end of period | | $ | 10.55 | |
| | | | | |
| TOTAL RETURN | | | 14.30 | %(5) |
| | | | | |
| SUPPLEMENTAL DATA AND RATIOS: | | | | |
| Net assets, end of period (millions) | | $ | 27.51 | |
| Ratio of expenses to average net assets: | | | | |
| Before expense reimbursement | | | 2.11 | %(6) |
| After expense reimbursement | | | 2.11 | %(6) |
| Ratio of net investment income (loss) to average net assets | | | | |
| Before expense reimbursement | | | 0.94 | %(6) |
| After expense reimbursement | | | 0.94 | %(6) |
| Portfolio turnover rate | | | 30 | %(5) |
| (1) | The financial highlights set forth for periods prior to September 17, 2009 represent the historical financial highlights of the SPARX Japan Fund. On September 17, 2009 Hennessy Advisors, Inc., became the investment advisor to the Fund and the Fund changed its name to Hennessy Select SPARX Japan Smaller Companies Fund. In addition, the Investor Class shares were redesignated Original Class shares. |
| (2) | The Fund commenced operations on August 31, 2007 |
| (3) | Calculated based on average shares outstanding. |
| (4) | Amount is less than $0.01 or $(0.01). |
The accompanying notes are an integral part of these financial statements.
FINANCIAL HIGHLIGHTS — HENNESSY SELECT SPARX JAPAN SMALLER COMPANIES FUND
| | | | | | | | | | Period Ended | |
| Year Ended October 31, | | | October 31, | |
| 2010 | | | 2009(1) | | | 2008 | | | 2007(2) | |
| | | | | | | | | | | |
| $ | 9.74 | | | $ | 6.87 | | | $ | 10.98 | | | $ | 10.00 | |
| | | | | | | | | | | | | | | |
| | | | | | | | | | | | | | | |
| | — | (4) | | | 0.07 | | | | 0.02 | (3) | | | — | (4) |
| | (0.10 | ) | | | 2.80 | | | | (4.08 | ) | | | 0.98 | |
| | (0.10 | ) | | | 2.87 | | | | (4.06 | ) | | | 0.98 | |
| | | | | | | | | | | | | | | |
| | | | | | | | | | | | | | | |
| | (0.42 | ) | | | — | | | | (0.07 | ) | | | — | |
| | — | | | | — | | | | — | | | | — | |
| | (0.42 | ) | | | — | | | | (0.07 | ) | | | — | |
| | 0.01 | | | | — | (4) | | | 0.02 | | | | — | |
| $ | 9.23 | | | $ | 9.74 | | | $ | 6.87 | | | $ | 10.98 | |
| | | | | | | | | | | | | | | |
| | (0.72 | )% | | | 41.78 | % | | | (37.00 | )% | | | 9.80 | %(5) |
| | | | | | | | | | | | | | | |
| | | | | | | | | | | | | | | |
| $ | 15.17 | | | $ | 16.20 | | | $ | 11.74 | | | $ | 5.58 | |
| | | | | | | | | | | | | | | |
| | 2.14 | % | | | 3.10 | % | | | 4.47 | % | | | 9.73 | %(6) |
| | 2.01 | % | | | 1.60 | % | | | 1.60 | % | | | 1.60 | %(6) |
| | | | | | | | | | | | | | | |
| | (0.14 | )% | | | (0.86 | )% | | | (2.60 | )% | | | (8.15 | )%(6) |
| | (0.01 | )% | | | 0.64 | % | | | 0.26 | % | | | (0.02 | )%(6) |
| | 100 | % | | | 138 | % | | | 55 | % | | | 13 | %(5) |
HENNESSY FUNDS 1-800-966-4354
Notes to the Financial Statements
April 30, 2011 (Unaudited)
1). ORGANIZATION
The Hennessy Select Large Value Fund (the “Large Value Fund”) is organized as a separate investment portfolio or series of Hennessy Funds Trust, a Delaware statutory trust that was organized on September 17, 1992. The Large Value Fund is an open-end, diversified management investment company registered under the Investment Company Act of 1940, as amended. The investment objective of the Large Value Fund is long-term growth of capital and current income.
The Hennessy Select SPARX Japan Fund (the “Japan Fund”) and the Hennessy Select SPARX Japan Smaller Companies Fund (the “Japan Smaller Companies Fund”) are organized as separate investment portfolios or series of Hennessy SPARX Funds Trust, a Massachusetts business trust that was organized on July 24, 1995. The Japan Fund and the Japan Smaller Companies Fund are open-end, diversified management investment companies registered under the Investment Company Act of 1940, as amended. Although these Funds will each be considered a “diversified” mutual fund, the Funds may employ a relatively focused investment strategy and may hold securities of fewer issuers than other diversified funds. The investment objective of the Japan Fund and the Japan Smaller Companies Fund is long-term capital appreciation.
The Large Value Fund, Japan Fund and Japan Smaller Companies Fund collectively represent the Hennessy Select Series Funds (the “Funds”).
The Large Value Fund and Japan Fund offer Original and Institutional Class shares. Each class of shares differs principally in its respective administration, shareholder servicing and transfer agent expenses and sales charges, if any. Each class has identical rights to earnings, assets and voting privileges, except for class-specific expenses and exclusive rights to vote on matters affecting only individual classes. The Japan Smaller Companies Fund offers only Original Class shares.
2). SIGNIFICANT ACCOUNTING POLICIES
The following is a summary of significant accounting policies consistently followed by the Funds in the preparation of the financial statements. These policies are in conformity with U.S. generally accepted accounting principles (“GAAP”).
a). Investment Valuation – Securities which are traded on a national or recognized stock exchange are valued at the last sale price on the securities exchange on which such securities are primarily traded. Exchange-traded securities for which there were no transactions that day and debt securities are valued at the most recent bid prices. Instruments with a remaining maturity of 60 days or less are valued on an amortized cost basis. When a price for an underlying security is not readily available or if a significant event has occurred that indicates the closing price of a security no longer
NOTES TO THE FINANCIAL STATEMENTS
represents the true value of that security, fair value pricing procedures have been adopted by the Board of Trustees of the Funds. Fair value pricing determinations are made in good faith in accordance with these procedures. There are numerous criteria that will be given consideration in determining a fair value of a security. Some of these criteria are: trading volume of security and markets, value of other like securities and news events with direct bearing to security or market. Fair value pricing results in an estimated price that reasonably reflects the current market conditions in order to rate the portfolio holdings such that shareholder transactions receive a fair net asset value.
Fair valuing of foreign securities may be determined with the assistance of a pricing service using correlations between the movement of prices of such securities and indices of domestic securities and other appropriate indicators, such as closing market prices of relevant American Depositary Receipts or futures contracts. The effect of using fair value pricing is that the Funds’ NAV will reflect the affected portfolio securities’ value as determined in the judgment of the Board of Trustees or its designee instead of being determined by the market. Using a fair value pricing methodology to price securities may result in a value that is different from a security’s most recent closing price and from the prices used by other investment companies to calculate their net asset values and are considered level 2 prices in the fair valuation hierarchy. Because the Funds invest in foreign securities, the value of the Funds’ portfolio securities may change on days when you will not be able to purchase or redeem your shares.
Foreign securities are recorded in the financial statements after translation to U.S. dollars based on the applicable exchange rate at the end of the period. The Funds do not isolate that portion of the results of operations resulting from changes in the currency exchange rate from the fluctuations resulting from changes in the market prices of investments.
b). Federal Income Taxes – Provision for federal income taxes or excise taxes has not been made since the Funds have elected to be taxed as a “regulated investment company” and intend to distribute substantially all taxable income to shareholders and otherwise comply with the provisions of the Internal Revenue Code applicable to regulated investment companies. Net investment income and realized gains and losses for federal income tax purposes may differ from that reported on the financial statements because of temporary book and tax basis differences. Temporary differences are primarily the result of the treatment of wash sales for tax reporting purposes. Distributions from net realized gains for book purposes may include short-term capital gains, which are included as ordinary income to shareholders for tax purposes.
c). Income and Expenses – Dividend income is recognized on the ex-dividend date or as soon as information is available to the Funds and interest income is recognized on an accrual basis. Income, expenses (other than expenses attributable to a specific class), and realized and unrealized gains or losses on investments are allocated to each class of shares based on its respective net assets.
HENNESSY FUNDS 1-800-966-4354
d). Distributions to Shareholders – Dividends from net investment income and distributions of net realized capital gains for the Funds, if any, are declared and paid out annually, usually in November or December of each year.
e). Security Transactions – Investment and shareholder transactions are recorded on the trade date. The Funds determine the gain or loss realized from the investment transactions by comparing the original cost of the security lot sold with the net sale proceeds. Discounts and premiums on securities purchased are accreted/amortized over the life of the respective security.
f). Use of Estimates – The preparation of financial statements in conformity with GAAP requires management to make estimates and assumptions that affect the reported amounts of assets and liabilities and disclosure of contingent assets and liabilities at the date of the financial statements and the reported change in net assets during the reporting period. Actual results could differ from those estimates.
g). Share Valuation – The net asset value (“NAV”) per share of each Fund is calculated by dividing the sum of the value of the securities held, plus cash or other assets, minus all liabilities (including estimated accrued expenses) by the total number of shares outstanding, rounded to the nearest cent. The Funds’ shares will not be priced on the days on which the New York Stock Exchange is closed for trading. The offering and redemption price per share for each Fund is equal to each Fund’s net asset value per share. The Japan Fund and Japan Smaller Companies Funds charged a 2.00% redemption fee on shares held less than 60 days through January 29, 2010. These fees were retained by each Fund and treated as additional paid-in-capital and allocated to each respective class of shares (if applicable).
h). Foreign Currency – Values of investments denominated in foreign currencies are converted into U.S. dollars using the spot market rate of exchange at the time of valuation. Purchases and sales of investments and income are translated into U.S. dollars using the spot market rate of exchange prevailing on the respective dates of such transactions. The effect of changes in foreign exchange rates on realized and unrealized security gains and losses is reflected as a component of such gains or losses. Foreign investments present additional risks due to currency fluctuations, economic and political factors, lower liquidity, government regulations, differences in accounting standards and other factors.
i). Forward Contracts – The Funds may enter into forward currency contracts to reduce their exposure to changes in foreign currency exchange rates on their foreign holdings and to lock in the U.S. dollar cost of firm purchase and sale commitments for securities denominated in foreign currencies. A forward currency contract is a commitment to purchase or sell a foreign currency at a future date at a negotiated forward rate. The gain or loss arising from the difference between the U.S. dollar cost of the original contract and the value of the foreign currency in U.S. dollars upon closing of such contract is included in net realized gain or loss from foreign currency transactions.
NOTES TO THE FINANCIAL STATEMENTS
j). Repurchase Agreements – The Funds may enter into repurchase agreements with member banks or security dealers of the Federal Reserve whom the investment advisor deems creditworthy. The repurchase price generally equals the price paid by the Fund plus interest negotiated on the basis of current short-term rates.
Securities pledged as collateral for repurchase agreements are held by the custodian bank until the respective agreements mature. Provisions of the repurchase agreements ensure that the market value of the collateral, including accrued interest thereon, is sufficient, in the event of default of the counterparty. If the counterparty defaults and the value of the collateral declines or if the counterparty enters an insolvency proceeding, realization of the collateral by the Fund may be delayed or limited.
k). Accounting for Uncertainty in Income Taxes – The Funds have adopted financial reporting rules regarding recognition and measurement of tax positions taken or expected to be taken on a tax return. The Funds have reviewed all open tax years and major jurisdictions and concluded that there is no impact on the Funds’ net assets and no tax liability resulting from unrecognized tax benefits relating to uncertain income tax positions taken or expected to be taken on a tax return. As of April 30, 2011, open Federal and state tax years for the Large Value Fund include the tax years ended September 30, 2008 through 2009, the tax period ended October 31, 2009 and the tax year ended October 31, 2010. As of April 30, 2011, open Federal and state tax years for the Japan Fund and Japan Smaller Companies Fund include the tax years ended October 31, 2008 through 2010.
l). Derivatives – The Funds may invest in, or enter into, derivatives, such as options, futures contracts, options on futures contracts and swaps, for a variety of reasons, including to hedge certain risks, to provide a substitute for purchasing or selling particular securities or to increase potential income gain. Derivatives may provide a cheaper, quicker or more specifically focused way for a Fund to invest than “traditional” securities would. The main purpose of utilizing these derivative instruments is for hedging purposes.
The Funds have adopted the financial accounting reporting rules as required by the Derivatives and Hedging Topic of the FASB Accounting Standards Codification (“FASB ASC”). The Funds are required to include enhanced disclosure that enables investors to understand how and why an entity uses derivatives, how derivatives are accounted for, and how derivatives instruments affect any entity’s results of operations and financial position. During the six months ended April 30, 2011, the Funds did not hold any derivative instruments.
m). Events Subsequent to the Fiscal Period End – The Funds have adopted financial reporting rules regarding subsequent events which requires an entity to recognize in the financial statements the effects of all subsequent events that provide additional evidence about conditions that existed at the date of the balance sheet. Management has evaluated the Funds’ related events and transactions that occurred subsequent to April 30, 2011, through the date of issuance of the Funds’ financial statements. There were no
HENNESSY FUNDS 1-800-966-4354
events or transactions that occurred during this period that materially impacted the amounts or disclosures in the Funds’ financial statements.
n.) New Accounting Pronouncement – In January 2010, the FASB issued Accounting Standards Update “Improving Disclosures about Fair Value Measurements” (“ASU”). The ASU requires enhanced disclosures about a) transfers into and out of Levels 1 and 2, and b) purchases, sales, issuances, and settlements on a gross basis relating to Level 3 measurements. The first disclosure is effective for the first reporting period beginning after December 15, 2009, and for interim periods within the fiscal years. Additional information describing significant transfers, if any, is contained in each Fund’s Schedule of Investments contained in this report.
The second disclosure will become effective for fiscal years beginning after December 15, 2010, and for interim periods within those fiscal years. Management is currently evaluating the impact this disclosure may have on the Funds’ financial statements.
3). INVESTMENT TRANSACTIONS
Purchases and sales of investment securities (excluding government and short-term investments) during the following fiscal periods were as follows:
| | | Purchases | | | Sales | |
| Large Value Fund | | $ | 111,239,395 | | | $ | 119,110,478 | |
| Japan Fund | | $ | 43,890,497 | | | $ | 67,598,254 | |
| Japan Smaller Companies Fund | | $ | 16,408,046 | | | $ | 6,076,615 | |
There were no purchases or sales/maturities of long term U.S. Government securities in the Funds during the six months ended April 30, 2011.
4). INVESTMENT MANAGEMENT FEE AND OTHER TRANSACTIONS WITH AFFILIATES
Hennessy Advisors, Inc. (the “Advisor”) is the advisor of the Funds. The Advisor provides the Funds with investment management services under an Investment Advisory Agreement. The Advisor furnishes all investment advice, office space, facilities, and provides most of the personnel needed by the Funds. As compensation for its services, the Advisor is entitled to a monthly fee from each Fund. The fee is based upon the average daily net assets of the Funds at the annual rate of:
| | Large Value Fund | | | 0.85 | % | |
| | Japan Fund | | | 1.00 | % | |
| | Japan Smaller Companies Fund | | | 1.20 | % | |
The Advisor has delegated the day to day management of the Large Value Fund to a Sub-Advisor, RBC Global Asset Management (U.S.), Inc. (“RBC”). The Advisor has delegated the day to day management of the Japan and Japan Smaller Companies Funds to a Sub-Advisor, SPARX Asset Management Co. Ltd. (“SPARX”). The Advisor pays the Sub-Advisor fees for each of the Funds from its own assets and these fees are not an additional expense of the Funds.
The Advisor had agreed to absorb expenses to the extent that the total annual operating expenses (excluding all Federal, state and local taxes, interest, brokerage commissions, acquired fund fees and expenses and other costs incurred in connection with the purchase and sale of securities and extraordinary items) do not exceed 0.98% of the Large Value Fund’s net assets for the
NOTES TO THE FINANCIAL STATEMENTS
Institutional Class shares. The expense limitation agreement for the Institutional Class shares of the Large Value Fund can only be terminated by the Board of Trustees. For a period of three years after the year in which the Advisor waives or reimburses expenses, the Advisor may seek reimbursement from the Fund to the extent that total annual fund operating expenses are less than the expense limitation in effect at the time of the waiver or reimbursement. The Advisor did not reimburse any expenses during the six months ended April 30, 2011. As of April 30, 2011, cumulative expenses subject to potential recovery to the aforementioned conditions and year of expiration are as follows:
| | | | Oct. 31, 2011 | | | Oct. 31, 2012 | | | Oct. 31, 2013 | | | Oct. 31, 2014 | | | Total | |
| | Large Value Fund – Orig. Class | | $ | 91,061 | | | $ | 7,641 | | | $ | 38,444 | | | $ | — | | | $ | 137,146 | |
| | Large Value Fund – Inst. Class | | $ | 2,239 | | | $ | 6 | | | $ | — | | | $ | — | | | $ | 2,245 | |
| | Japan Fund – Orig. Class | | $ | — | | | $ | — | | | $ | 37,425 | | | $ | — | | | $ | 37,425 | |
| | Japan Fund – Inst. Class | | $ | — | | | $ | — | | | $ | 12,915 | | | $ | — | | | $ | 12,915 | |
| | Japan Smaller Companies | | | | | | | | | | | | | | | | | | | | |
| | Fund – Orig. Class | | $ | — | | | $ | — | | | $ | 19,527 | | | $ | — | | | $ | 19,527 | |
The Board of Trustees has approved a Shareholder Servicing Plan for the Original Class shares of the Funds which was instituted to compensate the Advisor for the non-investment management services it provides to the Fund. The Plan provides for a monthly fee paid to the Advisor at an annual rate of 0.10% of the average daily net assets of the Original Class shares of the Funds.
The Funds have entered into agreements with various brokers, dealers and financial intermediaries in connection with the sale of shares of the Funds. The agreements provide for periodic payments by the Funds to the brokers, dealers and financial intermediaries for providing certain shareholder maintenance services (sub-transfer agent expenses). These shareholder services include: the pre-processing and quality control of new accounts, shareholder correspondence, answering customer inquiries regarding account status and facilitating shareholder telephone transactions. Fees paid by the Large Value, Japan and Japan Smaller Companies Funds to various brokers, dealers and financial intermediaries for the six months ended April 30, 2011, were $54,910, $34,630, and $16,838, respectively.
U.S. Bancorp Fund Services, LLC (the “Administrator”) acts as the Funds’ administrator under an Administration Agreement. Administrative services under this agreement include custody, distribution, fund accounting, fund administration and transfer agent services. In addition, the Administrator prepares various federal and state regulatory filings, reports and returns for the Fund; prepares reports and materials to be supplied to the directors; monitors the activities of the Funds’ custodian, transfer agent and accountants; coordinates the preparation and payment of the Funds’ expenses and reviews the Funds’ expense accruals. Fees paid to U.S. Bancorp Fund Services, LLC for the six months ended April 30, 2011, were $175,079, $49,565 and $27,138, for the Large Value, Japan and Japan Smaller Companies Funds, respectively. The Administrator has voluntarily waived all or a portion of its administration fees allocated to the Institutional Class shares of the Large Value Fund. The administration fees voluntarily waived by the Administrator during the six months ended April 30, 2011 were $49.
HENNESSY FUNDS 1-800-966-4354
Quasar Distributors, LLC (“Quasar”) acts as the Funds’ principal underwriter in a continuous public offering of the Funds’ shares. Quasar is an affiliated company of U.S. Bank, N.A.
5). LINE OF CREDIT
The SPARX Japan and SPARX Japan Smaller Companies Funds have $22,000,000 and $3,000,000 lines of credit, respectively, intended to provide short-term financing, if necessary, subject to certain restrictions, in connection with shareholder redemptions. The credit facility is with its custodian bank, U.S. Bank, N.A. Borrowings under this arrangement bear interest at the bank’s prime rate. During the period ended April 30, 2011, the SPARX Japan Fund had an outstanding average daily balance and a weighted average interest rate of $637,392 and 3.25%, respectively. The maximum amount outstanding for the SPARX Japan Fund during the period was $15,000,000. During the period ended April 30, 2011, the SPARX Japan Smaller Companies Fund had no line of credit activity.
6). FEDERAL TAX INFORMATION
The following balances for the Funds are as of October 31, 2010, the Funds’ most recent fiscal year end:
| | | | | | | | | Japan | |
| | | Large | | | | | | Smaller | |
| | | Value | | | Japan | | | Companies | |
| | | Fund | | | Fund | | | Fund | |
| Cost of investments for tax purposes | | $ | 115,270,414 | | | $ | 37,383,357 | | | $ | 14,831,609 | |
| Gross tax unrealized appreciation | | | 18,200,874 | | | | 7,183,919 | | | | 1,979,812 | |
| Gross tax unrealized depreciation | | | (2,268,578 | ) | | | (1,866,093 | ) | | | (1,356,296 | ) |
| Net tax unrealized appreciation | | | | | | | | | | | | |
| (depreciation) on investments | | | 15,932,296 | | | | 5,317,826 | | | | 623,516 | |
| Undistributed ordinary income | | $ | 682,446 | | | $ | — | | | $ | — | |
| Undistributed long-term capital gains | | $ | — | | | $ | — | | | $ | — | |
| Total distributable earnings | | $ | 682,446 | | | $ | — | | | $ | — | |
| Other accumulated gains (losses) | | $ | (50,527,691 | ) | | $ | (34,057,959 | ) | | $ | (2,116,351 | ) |
| Total accumulated earnings (losses) | | $ | (33,912,949 | ) | | $ | (28,740,133 | ) | | $ | (1,492,835 | ) |
At October 31, 2010, the Large Value Fund had tax basis capital losses of $50,527,691, to offset future capital gains. Of such losses, $19,583,141 expire October 31, 2016 and $30,944,550 expire on October 31, 2017. Additionally, the Large Value Fund had no post-October loss deferrals as of October 31, 2010.
At October 31, 2010, the Japan Fund had tax basis capital losses of $34,116,747, to offset future capital gains. Of such losses, $967,738 expire October 31, 2014, $5,345,663 expire on October 31, 2015, $6,231,544 expire October 31, 2016 and $15,450,664 expire October 31, 2017, and $6,121,138 expire October 31, 2018. Additionally, the Japan Fund had no post-October loss deferrals as of October 31, 2010.
At October 31, 2010, the Japan Smaller Companies Fund had tax basis capital losses of $2,122,189, to offset future capital gains. The losses expire on October 31, 2017. Additionally, the Japan Smaller Companies Fund had no post-October loss deferrals as of October 31, 2010.
NOTES TO THE FINANCIAL STATEMENTS
The tax character of distributions paid during 2011 and 2010 for the Funds were as follows:
| | | | Six Months Ended | | | | |
| | | | April 30, 2011 | | | Year Ended | |
| | Large Value Fund | | (Unaudited) | | | October 31, 2010 | |
| | Ordinary income | | $ | 1,292,183 | | | $ | 1,608,137 | |
| | Long-term capital gain | | | — | | | | — | |
| | | | $ | 1,292,183 | | | $ | 1,608,137 | |
| | | | | | | | | |
| | | | Six Months Ended | | | | | |
| | | | April 30, 2011 | | | Year Ended | |
| | Japan Fund | | (Unaudited) | | | October 31, 2010 | |
| | Ordinary income | | $ | — | | | $ | 53,363 | |
| | Long-term capital gain | | | — | | | | — | |
| | Return of capital | | | — | | | | 50,003 | |
| | | | $ | — | | | $ | 103,366 | |
| | | | | | | | | |
| | | | Six Months Ended | | | | | |
| | | | April 30, 2011 | | | Year Ended | |
| | Japan Smaller Companies Fund | | (Unaudited) | | | October 31, 2010 | |
| | Ordinary income | | $ | — | | | $ | 675,389 | |
| | Long-term capital gain | | | — | | | | — | |
| | | | $ | — | | | $ | 675,389 | |
HENNESSY FUNDS 1-800-966-4354
April 30, 2011 (Unaudited)
As a shareholder of the Funds, you incur two types of costs: (1) transaction costs, including sales charges (loads) on purchase payments, reinvested dividends, or other distributions; redemption fees; and exchange fees; and (2) ongoing costs, including management fees; service fees; and other Fund expenses. This Example is intended to help you understand your ongoing costs (in dollars) of investing in each of the Funds and to compare these costs with the ongoing costs of investing in other mutual funds. The Example is based on an investment of $1,000 invested at the beginning of the period and held for the entire period from November 1, 2010 through April 30, 2011.
Actual Expenses
The first set of lines of the table below provide information about actual account values and actual expenses. Although the Funds charge no sales loads or transaction fees, you will be assessed fees for outgoing wire transfers, returned checks and stop payment orders at prevailing rates charged by U.S. Bancorp Fund Services, LLC, the Funds’ transfer agent. If you request that a redemption be made by wire transfer, currently a $15.00 fee is charged by the Funds’ transfer agent. IRA accounts will be charged a $15.00 annual maintenance fee (not to exceed $30 per social security number). The example below includes, but is not limited to, management fees, shareholder servicing fees, fund accounting, custody and transfer agent fees. However, the example below does not include portfolio trading commissions and related expenses, interest expense or dividends on short positions taken by the Fund and other extraordinary expenses as determined under generally accepted accounting principles. You may use the information within these lines, together with the amount you invested, to estimate the expenses that you paid over the six-month period. Simply divide your account value by $1,000 (for example, an $8,600 account value divided by $1,000 = 8.6), then multiply the result by the number in the first line under the heading entitled “Expenses Paid During Period” to estimate the expenses you paid on your account during this period.
Hypothetical Example for Comparison Purposes
The second set of lines within the table below provide information about hypothetical account values and hypothetical expenses based on the Funds’ actual expense ratios and an assumed rate of return of 5% per year before expenses, which is not the Funds’ actual return. The hypothetical account values and expenses may not be used to estimate the actual ending account balance or expenses you paid for the period. You may use this information to compare the ongoing costs of investing in the Funds and other funds. To do so, compare this 5% hypothetical example with the 5% hypothetical examples that appear in the shareholder reports of the other funds. Please note that the expenses shown in the table are meant to highlight your ongoing costs only and do not reflect any transactional costs, such as sales charges (loads), or exchange fees. Therefore, the second line of the table is useful in comparing ongoing costs only, and will not help you determine the relative total costs of owning different funds. In addition, if these transactional costs were included, your costs would have been higher.
EXPENSE EXAMPLE
| | | Beginning | | | Ending | | | Expenses Paid | |
| | | Account Value | | | Account Value | | | During Period(1) | |
| Original Class | | 11/1/10 | | | 4/30/11 | | | 11/1/10 – 4/30/11 | |
| | | | | | | | | | |
| Actual | | | | | | | | | |
| Large Value Fund – Original Class | | $ | 1,000.00 | | | $ | 1,157.70 | | | $ | 7.44 | |
| Japan Fund – Original Class | | $ | 1,000.00 | | | $ | 1,179.70 | | | $ | 10.38 | |
| Japan Smaller Companies | | | | | | | | | | | | |
| Fund – Original Class | | $ | 1,000.00 | | | $ | 1,143.00 | | | $ | 11.21 | |
| | | | | | | | | | | | | |
| Hypothetical (5% return | | | | | | | | | | | | |
| before expenses) | | | | | | | | | | | | |
| Large Value Fund – Original Class | | $ | 1,000.00 | | | $ | 1,017.90 | | | $ | 6.95 | |
| Japan Fund – Original Class | | $ | 1,000.00 | | | $ | 1,015.27 | | | $ | 9.59 | |
| Japan Smaller Companies | | | | | | | | | | | | |
| Fund – Original Class | | $ | 1,000.00 | | | $ | 1,014.33 | | | $ | 10.54 | |
| (1) | Expenses are equal to the Large Value Fund’s expense ratio of 1.39%, the Japan Fund’s expense ratio of 1.92%, and the Smaller Companies Fund’s expense ratio of 2.11%, multiplied by the average account value over the period, multiplied by 181/365 days (to reflect one-half year period). |
| | | Beginning | | | Ending | | | Expenses Paid | |
| | | Account Value | | | Account Value | | | During Period(2) | |
| Institutional Class | | 11/1/10 | | | 4/30/11 | | | 11/1/10 – 4/30/11 | |
| | | | | | | | | | |
| Actual | | | | | | | | | |
| Large Value Fund – Institutional Class | | $ | 1,000.00 | | | $ | 1,024.93 | | | $ | 4.92 | |
| Japan Fund – Institutional Class | | $ | 1,000.00 | | | $ | 1,183.30 | | | $ | 9.04 | |
| | | | | | | | | | | | | |
| Hypothetical (5% return | | | | | | | | | | | | |
| before expenses) | | | | | | | | | | | | |
| Large Value Fund – Institutional Class | | $ | 1,000.00 | | | $ | 1,003.10 | | | $ | 4.87 | |
| Japan Fund – Institutional Class | | $ | 1,000.00 | | | $ | 1,016.51 | | | $ | 8.35 | |
| (2) | Expenses are equal to the Large Value Fund’s expense ratio of 0.98%, and the Japan Fund’s expense ratio of 1.67%, multiplied by the average account value over the period, multiplied by 181/365 days (to reflect one-half year period). |
HENNESSY FUNDS 1-800-966-4354
How to Obtain a Copy of the Fund’s Proxy Voting Policy and Proxy Voting Records
A description of the policies and procedures that the Funds use to determine how to vote proxies relating to portfolio securities is available without charge: (1) by calling 1-800-966-4354; (2) on the Hennessy Funds website at www.hennessyfunds.com; or (3) on the U.S. Securities and Exchange Commission’s website at www.sec.gov. Hennessy Funds’ proxy voting record is available on the SEC’s website at www.sec.gov no later than August 31 for the prior 12 months ending June 30.
Quarterly Filings on Form N-Q
The Funds file their complete schedules of investments with the SEC for the first and third quarters of each fiscal year on Form N-Q. The Funds’ Form N-Q will be available on the SEC’s website at www.sec.gov. The Funds’ Form N-Q may be reviewed and copied at the SEC’s Public Reference Room in Washington, DC and information on the operation of the Public Reference Room may be obtained by calling 1-800-SEC-0330. Information included in the Funds’ N-Q will also be available upon request by calling 1-800-966-4354.
Directors and Officers
The Funds’ Statement of Additional Information includes additional information about the Funds’ Directors and Officers and is available, without charge, upon request by calling 1-800-966-4354 or by visiting the Hennessy Funds website at www.hennessyfunds.com.
Federal Tax Distribution Information (Unaudited)
The Large Value, Japan and Japan Smaller Companies Funds designate 100%, 100% and 100%, respectively, of the dividends declared from net investment income during the year ended October 31, 2010, as qualified dividend income under the Jobs Growth and Tax Reconciliation Act of 2003.
For the year ended October 31, 2010, 100%, 0% and 0%, of the ordinary distributions paid by the Large Value, Japan and Japan Smaller Companies Funds qualify for the dividend received deduction available to corporate shareholders. All of the dividend income received by the Japan and Japan Smaller Companies Funds was from foreign investments which does not qualify for the dividend received deduction available to corporate shareholders.
BOARD APPROVAL OF CONTINUATION OF INVESTMENT ADVISORY AGREEMENTS
Board Approval of Continuation of Investment Advisory Agreements
At its meeting on March 2, 2011, the Board of Directors (the “Board”) of The Hennessy Funds, Inc. (the “Company”) and its two series, the Hennessy Balanced Fund (the “Balanced Fund”) and the Hennessy Total Return Fund (the “Total Return Fund”) (each a “Fund” or collectively the “Funds”), The Hennessy Mutual Funds, Inc. (the “Company”) and its three series, the Hennessy Cornerstone Growth Fund (the “Growth Fund”), the Hennessy Cornerstone Value Fund (the “Value Fund”), and the Hennessy Focus 30 Fund (the “Focus 30 Fund”), The Hennessy Funds Trust (the “Company”) which includes the Hennessy Cornerstone Growth Fund, Series II (the “Growth II Fund”), Hennessy Cornerstone Large Growth Fund (the “Large Growth” Fund), and the Hennessy Select Large Value Fund (the “Large Value” Fund), and the Hennessy SPARX Funds Trust (the “Company”) and its two series, the Hennessy Select SPARX Japan Fund (the “Japan Fund”) and the Hennessy Select SPARX Japan Smaller Companies Fund ( the “Japan Smaller Companies Fund” or collectively with the Growth, Growth II, Value, Focus 30, Total Return, Balanced, Large Value and Large Growth funds, the “Funds”) or collectively with The Hennessy Funds, Inc., and The Hennessy Mutual Funds, Inc., and Hennessy Funds Trust, the “Companies”) including the Directors who are not “interested persons” (as defined in the Investment Company Act of 1940) of the Funds voted to re-approve the current investment advisory agreements for the Funds. The Board reviewed and discussed the specific services provided by the Advisor. The Advisor:
• Provides formula driven investment management for the Hennessy Total Return and Balanced funds; and the Hennessy Cornerstone Growth, Growth Series II, Focus 30, Value and Large Growth funds. Hennessy Advisors, Inc. holds the patent rights to the formulas used for the Cornerstone Growth and Value Funds. In providing investment management, Hennessy Advisors, Inc. will direct and oversee the trading of securities within and the rebalancing of the portfolios of the Funds.
• Provides oversight of the sub-advisors for the Hennessy Select Large Value, Hennessy Select SPARX Japan, and Hennessy Select SPARX Japan Smaller Companies funds.
•Pays the incentive compensation of the Funds’ Chief Compliance Officer.
• Provides responsive customer and shareholder servicing which consists of providing a call center to respond to shareholder inquiries, including specific mutual fund account information. Shareholders can contact Hennessy Advisors, Inc. directly during office hours. The firm endeavors to answer all calls in person within two rings of the telephone.
• Oversees distribution of the Funds through third-party broker/dealers and independent financial institutions such as Charles Schwab, Inc., Fidelity, TD Ameritrade and Pershing. Hennessy Advisors participates in “no transaction fee” (“NTF”) programs with these companies, which allows
HENNESSY FUNDS 1-800-966-4354
customers to purchase the Hennessy Funds through third party distribution channels without paying a transaction fee. Hennessy Advisors compensates these third party distributors under a pre-determined contractual agreement.
• Oversees those third party service providers that support the Funds in providing fund accounting, fund administration, fund distribution, transfer agency and custodial services.
Hennessy Advisors, Inc. provides its services to The Hennessy Funds, Inc.; The Hennessy Mutual Funds, Inc.; The Hennessy Funds Trust, and The SPARX Funds Trust. The firm also operates a small Limited Liability Company designed for highly qualified investors. Services are provided to no other clients. The firm does not offer investment advice to individual persons or entities other than the mutual funds it manages.
The Board also: (i) compared the performance of each Fund to benchmark indices over various periods of time and concluded that the performance of each Fund warranted the continuation of the Advisory Agreements; (ii) compared the expense ratios of funds similar in asset size and investment objective to each of the Funds and concluded the actual or projected expenses of each Fund were reasonable and warranted continuation of the Advisory Agreements; (iii) considered the fees charged by Hennessy Advisors, Inc. to those of funds similar in asset size and investment objective to each of the Funds and concluded the advisory fees of each Fund were reasonable and warranted continuation of the Advisory Agreements; (iv) considered the profitability of Hennessy Advisors, Inc. with respect to each Fund and the profitability of the Sub-Advisors with respect to the Select Series Funds and concluded the profits were reasonable and not excessive when compared to profitability guidelines set forth in relevant court cases; (v) considered the high level of professionalism and knowledge, along with an extremely low level of turnover, of the employees of the Advisor; and (vi) considered that Neil Hennessy was named one of the top 100 portfolio managers in the nation six of the previous eight years by Barron’s.
The Board then discussed economies of scale and breakpoints and determined that the Funds managed by Hennessy Advisors, Inc. have not yet grown in size, nor has their marketplace demonstrated significantly rapid potential growth to any extent that would warrant the use of breakpoints. The Board took into consideration the profitability of Hennessy Advisors, Inc. and the advisory fees of comparable mutual funds.
The Board reviewed the Funds’ expense ratios and comparable expense ratios for funds like the ten funds being considered for contract renewal by Hennessy Advisors, Inc. The Board used data from Lipper as presented in the charts in the Board Materials showing funds similar in nature to the Hennessy Funds (Mid-Cap Blend, Small Cap Blend, etc.). The Board determined that the expense ratios of the Funds fall within the range of the ratios of other funds in their classification. The Board also referenced the Advisor’s Form ADV and copies of the current Investment Advisory Agreements. All of the factors above were considered separately by the non-interested Directors in an executive session during which management of the Advisor was not present. The factors were viewed in their totality by the Board, with no single factor being the principal or determinative factor in the Board’s determination of whether to approve the
BOARD APPROVAL OF CONTINUATION OF INVESTMENT ADVISORY AGREEMENTS
continuation of the Advisory Agreements. The Board was also assisted in its review, consideration and discussion of the Advisory Agreements by a memorandum prepared by legal counsel that summarized the Board’s obligations. Based on the factors discussed above, the Board, including all Independent Directors, recommended continuation of the Advisory Agreements.
HENNESSY FUNDS 1-800-966-4354
For information, questions
or assistance, please call
The Hennessy Funds
1-800-966-4354 or 1-415-899-1555
INVESTMENT ADVISOR
Hennessy Advisors, Inc.
7250 Redwood Blvd., Suite 200
Novato, California 94945
ADMINISTRATOR, TRANSFER
AGENT, DIVIDEND PAYING
AGENT & SHAREHOLDER
SERVICING AGENT
U.S. Bancorp Fund Services, LLC
P.O. Box 701
Milwaukee, Wisconsin 53201-0701
CUSTODIAN
U.S. Bank N.A.
Custody Operations
1555 North River Center Dr., Suite 302
Milwaukee, Wisconsin 53212
TRUSTEES
Neil J. Hennessy
Robert T. Doyle
J. Dennis DeSousa
Gerald P. Richardson
COUNSEL
Foley & Lardner LLP
777 East Wisconsin Avenue
Milwaukee, Wisconsin 53202-5306
INDEPENDENT REGISTERED
PUBLIC ACCOUNTING FIRM
KPMG LLP
777 East Wisconsin Avenue, 15th Floor
Milwaukee, Wisconsin 53202
DISTRIBUTOR
Quasar Distributors, LLC
615 East Michigan Street
Milwaukee, Wisconsin 53202
WWW.HENNESSYFUNDS.COM
This report has been prepared for shareholders and may be distributed
to others only if preceded or accompanied by a current prospectus.
Item 2. Code of Ethics.
Not applicable for semi-annual reports.
Item 3. Audit Committee Financial Expert.
Not applicable for semi-annual reports.
Item 4. Principal Accountant Fees and Services.
Not applicable for semi-annual reports.
Item 5. Audit Committee of Listed Registrants.
Not applicable to registrants who are not listed issuers (as defined in Rule 10A-3 under the Securities Exchange Act of 1934).
Item 6. Investments.
Schedule of Investments is included as part of the report to shareholders filed under Item 1 of this Form.
Item 7. Disclosure of Proxy Voting Policies and Procedures for Closed-End Management Investment Companies.
Not applicable to open-end investment companies.
Item 8. Portfolio Managers of Closed-End Management Investment Companies.
Not applicable to open-end investment companies.
Item 9. Purchases of Equity Securities by Closed-End Management Investment Company and Affiliated Purchasers.
Not applicable to open-end investment companies.
Item 10. Submission of Matters to a Vote of Security Holders.
Not Applicable.
Item 11. Controls and Procedures.
| (a) | The Registrant’s President and Treasurer have reviewed the Registrant's disclosure controls and procedures (as defined in Rule 30a-3(c) under the Investment Company Act of 1940 (the “Act”)) as of a date within 90 days of the filing of this report, as required by Rule 30a-3(b) under the Act and Rules 13a-15(b) or 15d-15(b) under the Securities Exchange Act of 1934. Based on their review, such officers have concluded that the disclosure controls and procedures are effective in ensuring that information required to be disclosed in this report is appropriately recorded, processed, summarized and reported and made known to them by others within the Registrant and by the Registrant’s service provider. |
| (b) | There were no changes in the Registrant's internal control over financial reporting (as defined in Rule 30a-3(d) under the Act) that occurred during the second fiscal quarter of the period covered by this report that has materially affected, or is reasonably likely to materially affect, the Registrant's internal control over financial reporting. |
Item 12. Exhibits.
| (a) | (1) Any code of ethics or amendment thereto, that is the subject of the disclosure required by Item 2, to the extent that the registrant intends to satisfy Item 2 requirements through filing an exhibit. Not Applicable |
(2) A separate certification for each principal executive and principal financial officer pursuant to Section 302 of the Sarbanes-Oxley Act of 2002. Filed herewith.
(3) Any written solicitation to purchase securities under Rule 23c-1 under the Act sent or given during the period covered by the report by or on behalf of the registrant to 10 or more persons. Not applicable to open-end investment companies.
| (b) | Certifications pursuant to Section 906 of the Sarbanes-Oxley Act of 2002. Furnished herewith. |
SIGNATURES
Pursuant to the requirements of the Securities Exchange Act of 1934 and the Investment Company Act of 1940, the registrant has duly caused this report to be signed on its behalf by the undersigned, thereunto duly authorized.
(Registrant) Hennessy Funds Trust
By (Signature and Title)* /s/Neil J. Hennessy
Neil J. Hennessy, President
Date July 6, 2011
Pursuant to the requirements of the Securities Exchange Act of 1934 and the Investment Company Act of 1940, this report has been signed below by the following persons on behalf of the registrant and in the capacities and on the dates indicated.
By (Signature and Title)* /s/Neil J. Hennessy
Neil J. Hennessy, President
Date July 6, 2011
By (Signature and Title)* /s/Teresa M Nilsen
Teresa M Nilsen, Treasurer
Date July 6, 2011
.