UNITED STATES
SECURITIES AND EXCHANGE COMMISSION
Washington, D.C. 20549
FORM N-CSR
CERTIFIED SHAREHOLDER REPORT OF REGISTERED
MANAGEMENT INVESTMENT COMPANIES
Investment Company Act file number (811-07168)
Hennessy Funds Trust
(Exact name of registrant as specified in charter)
7250 Redwood Blvd., Suite 200
Novato, CA 94945
(Address of principal executive offices) (Zip code)
Neil J. Hennessy
Hennessy Advisors, Inc.
7250 Redwood Blvd., Suite 200
Novato, CA 94945
(Name and address of agent for service)
800-966-4354
Registrant's telephone number, including area code
Date of fiscal year end: October 31, 2010
Date of reporting period: April 30, 2010
Item 1. Reports to Stockholders.
HENNESSY FUNDS
SEMI-ANNUAL REPORT
APRIL 30, 2010
Hennessy Cornerstone Growth Fund
Hennessy Cornerstone Growth Fund, Series II
Hennessy Focus 30 Fund
Hennessy Cornerstone Large Growth Fund
Hennessy Cornerstone Value Fund
Hennessy Total Return Fund
Hennessy Balanced Fund
Contents
| Letter to shareholders | | 1 |
| Fund performance review | | 4 |
| Summaries of investments | | |
| Hennessy Cornerstone Growth Fund | | 7 |
| Hennessy Cornerstone Growth Fund, Series II | | 12 |
| Hennessy Focus 30 Fund | | 17 |
| Hennessy Cornerstone Large Growth Fund | | 21 |
| Hennessy Cornerstone Value Fund | | 26 |
| Hennessy Total Return Fund | | 31 |
| Hennessy Balanced Fund | | 35 |
| Financial statements | | |
| Statements of assets and liabilities | | 40 |
| Statements of operations | | 42 |
| Statements of changes in net assets | | 44 |
| Financial highlights | | |
| Hennessy Cornerstone Growth Fund | | 54 |
| Hennessy Cornerstone Growth Fund, Series II | | 58 |
| Hennessy Focus 30 Fund | | 62 |
| Hennessy Cornerstone Large Growth Fund | | 66 |
| Hennessy Cornerstone Value Fund | | 70 |
| Hennessy Total Return Fund | | 74 |
| Hennessy Balanced Fund | | 76 |
| Statement of cash flows – Hennessy Total Return Fund | | 78 |
| Notes to the financial statements | | 79 |
| Expense example | | 89 |
| Proxy voting policy | | 91 |
| Board approval of continuation | | |
| of investment advisory agreement | | 92 |
LETTER TO SHAREHOLDERS
June, 2010
Dear Hennessy Funds Shareholder:
In the past six months, the investing landscape continued to be wrought with fear, panic and unending volatility. Every one of us, professional and individual investors alike, feel like we have been in a heavyweight fight; battered and bruised, but we are still standing. As I really focus on the fundamentals, and don’t get caught up in the headlines, I believe that we will see moderate, sustainable growth. But, just as the recovery felt like it was finally gathering steam, the market plunge last month has sent investors fleeing for cover once again. Watching the markets is beginning to feel like watching a “vertical tennis match” – lobs going up and lobs coming down, up and down.
We all know firsthand that investor confidence is still shaken. Despite very strong returns for the markets since the lows in March, 2009, people don’t believe the recovery is real and are still on the sidelines in money market funds, or perhaps even worse in my view, they are pouring their money into bonds and fixed income products. I can completely understand investors’ fears, but I was shocked to find out that many people I have spoken to believe the returns of the major indices last year were actually negative (the Dow Jones Industrial Average returned +23% for the 2009 calendar year; the S&P Index +26%). That shows me just how much emotion can cloud reality.
With long-term history as my guide, I continue to believe that we should see annualized returns in the equity markets in the 8-10% range over the long run. In my opinion, interest rates will increase to more historically normal levels, and that may cause trouble for bond investments. I also foresee companies may move toward increasing or initiating dividends. During the recent downturn, many companies took the opportunity to lay off excess employees, take write offs and close unprofitable business lines. These firms have emerged “lean and mean,” and any increase in sales will likely fall directly to their bottom lines. This lower growth environment provides a great opportunity for companies to increase dividends in order to try and drive their un derlying stock prices higher. Companies with strong retained earnings and cash positions should have no problem covering these dividends in the future. The S&P 500 companies alone have approximately $600 billion in cash on their balance sheets currently.
HENNESSY FUNDS 1-800-966-4354
I don’t mean to come off as cavalier or uncaring, but the market will do what the market will do. We can’t control it. What we can control are our emotions and reactions to the volatility and headlines. We can control our own individual investment goals and decisions, and we can maintain a disciplined approach to investing. I know it is hard to tune out all the noise about recession, double dips and sovereign debt, but if you can stick with buying and holding high quality investments, and you rebalance regularly, I truly believe that over the long run you should do just fine. Some pundits would say that the markets are fundamentally different today and that we are in for dramatically different types of market cycles in the future. Not to say we won’t continue to see big swings, but my 30+ years in the business has shown me that the more things change, the more they stay the same. We have been through hard times in our economy before, and we will survive these hard times as well. Over time, I hope we will all be able to view this period in its proper historical context.
Thank you for your continued support and investment in the Hennessy Funds. You can be confident that we will maintain our strict adherence to our time tested investment strategies. We appreciate your business and want you to know that in every decision we make, we put our shareholders first.
Best regards,
Neil J. Hennessy
Portfolio Manager & Chief Investment Officer
Past performance does not guarantee future results.
Mutual fund investing involves risk. Principal loss is possible.
The S&P 500 Index and Dow Jones Industrial Average are unmanaged indices commonly used to measure the performance of U.S. stocks. One cannot invest directly in an index.
Opinions expressed are those of Neil Hennessy and are subject to change, are not guaranteed and should not be considered investment advice.
LETTER TO SHAREHOLDERS
(This Page Intentionally Left Blank.)
HENNESSY FUNDS 1-800-966-4354
Fund Performance Review
For the six month period ended April 30, 2010, small and mid-cap stocks generally outperformed large caps, and we saw that play out in our Funds’ performance. Many of our portfolios were overweight in Consumer Discretionary stocks for the period, which benefitted their performance. During the stock selection process, our formulas have identified a theme that we term “getting more for less,” and many of these stocks, such as discount retailers, have performed well during the period.
We are pleased with the performance of the Cornerstone Funds during the period, with our five equity funds returning between 15% and 27%.
Hennessy Cornerstone Growth Fund
The Fund returned 20.32% for the six-month period ended April 30, 2010, underperforming its benchmark, the Russell 2000 Index, which returned 28.17%. Prior to the Fund’s rebalance in the winter, the best performing stock was FGX International Holdings (FGXI), as they issued a better than expected Q3 ’09 earnings report, while the worst performer was Hot Topic (HOTT), as the company issued a weak October sales report. Post rebalance, the Fund’s relative underperformance versus its benchmark was driven by security selection in each sector except Energy. The best performing stock was Brunswick Corp. (BC), while the worst performing stock was Telvent (TLVT), which issued a worse than expected earnings release for Q4 ’09.
Hennessy Cornerstone Growth Fund, Series II
The Fund returned 27.86% for the six-month period ended April 30, 2010, outperforming its benchmark, the Russell 2000 Growth Index, which returned 25.49%. Security selection in the Consumer Discretionary, Industrial, and Health Care sectors specifically drove the strong performance and more than offset weaker security selection in the Consumer Staples, Materials and Energy sectors. Sector allocation was neutral, as a positive contribution from an overweight position in Consumer Discretionary stocks was offset by overweight positions in the Consumer Staples, Materials, and Financials sectors. The best performing stock in the fund was Dollar Thrifty Automotive Group (DTG), which was up 138%, as it released better than expected earnings in February and fielded a takeover offer in late April. The worst performing stock in the fund was Fuqi In ternational (FUQI), which was down 49% upon issuing an accounting restatement. Discount retailer, 99 Cents Stores (NDN) gained 37% during the period.
Hennessy Focus 30 Fund
While the Fund returned 21.42% for the six-month period ended April 30, 2010, it underperformed its benchmark, the S&P 400 Mid-cap Index, which returned 25.78%. Security selection in the Materials, Energy, Industrial and IT sectors hampered the Fund’s relative performance and offset positive security selection in other sectors such as Financials and Consumer Staples, as well as the positive impact of sector allocation, including overweight positions in Materials and
FUND PERFORMANCE REVIEW
Consumer Discretionary stocks and an underweight position in the Utilities sector. The best performing stock in the Fund over the six-month period was Tractor Supply Co. (TSCO), which was up 50%, as the company pre-released stellar guidance for Q1 ’10, while the worst performing was Tetra Tech (TTEK), which was down 5%, as the company reduced its outlook for Fiscal Year 2010. Discount retailers Dollar Tree (DLTR) and Ross Stores (ROST) returned 35% and 27% for the period, respectively.
Hennessy Cornerstone Large Growth Fund
The Fund returned 18.37% for the six-month period ended April 30, 2010, outperforming its benchmark, the Russell 1000 Index, which returned 16.77%. The outperformance was the result of sector allocation. Prior to the Fund’s rebalance, overweight positions in the Industrial and Consumer Discretionary sectors, as well as an underweight position in the Consumer Staples sector more than offset a negative contribution from an overweight position in Energy. The best performing stocks in the portfolio prior to rebalance were Cummins, Inc. (CMI), who reported strong Q4 ‘09 earnings, while the worst performer was Diamond Offshore Drilling (DO), who had an earnings miss in Q4 ‘09. Post rebalance, the top performing stocks were Fluor Corp. (FLR) and discount retailer, TJX Companies (TJX). Family Dollar Stores (FDO) also had strong performance while in the portfolio.
Hennessy Cornerstone Value Fund
The Fund returned 14.90% for the six-month period ended April 30, 2010, underperforming its benchmark, the Russell 1000 Value Index, which returned 17.77%. Prior to its rebalance in the winter, the Fund was outpacing its benchmark, due to positive sector allocation from overweight positions in the Materials and Consumer Discretionary sectors and underweight positions in the Financial and Energy sectors. Strong security selection in the Materials and IT sectors also helped performance. Post rebalance, the Fund’s relative underperformance was driven by sector allocation and security selection. Negative contributions from overweight positions in Consumer Staples and Telecom stocks and an underweight position in Financials more than offset the positive contribution from an overweight position in Industrials stocks. Weak security selecti on in the Energy and IT sectors more than offset strong security selection in the Telecom and Consumer Staples sectors. The top performer in the Fund post-rebalance was Limited Brands, Inc. (LTD), which benefited from stronger than expected Q4 earnings. Home Depot (HD) also had strong performance while in the portfolio.
Hennessy Total Return and Hennessy Balanced Funds
The Hennessy Total Return Fund returned 11.78% and the Hennessy Balanced Fund returned 6.15% for the six-month period ended April 30, 2010, compared to the Dow Jones Industrial Average, which returned 14.87%. The Funds’ relative underperformance to their benchmark is due primarily to low yields on the Total Return Fund’s 25% position and the Balanced Fund’s 50% position in short-term Treasury Bills. A number of companies in these portfolios have increased their dividends during the period, including Home Depot (HD), whose stock gained 41% for the six-month period, Johnson and Johnson (JNJ), which gained 9%,
HENNESSY FUNDS 1-800-966-4354
and Chevron (CVX), which gained 6%. Boeing Co. (BA) was the top performing stock in the portfolios, returning 52% for the period, while Exxon Mobil was the poorest performer, losing -5%.
Past performance does not guarantee future results.
Mutual fund investing involves risk. Principal loss is possible. Small and medium-capitalization companies tend to have limited liquidity and greater price volatility than large-capitalization companies. Investments in foreign securities involve greater volatility and political, economic and currency risk and differences in accounting methods. Growth stocks typically are more volatile than value stocks; however, value stocks have a lower expected growth rate in earnings and sales. The Hennessy Total Return and the Hennessy Balanced Funds are non-diversified, meaning they may concentrate assets in fewer individual holdings than a diversified fund, making them more exposed to individual stock volatility than a diversified fund.
References to specific securities should not be considered a recommendation to buy or sell any security. Fund holdings are subject to change. Please refer to the Schedule of Investments within this semi-annual report for additional portfolio information, including percentages of holdings.
The Dow Jones Industrial Average is an unmanaged index commonly used to measure the performance of U.S. stocks. The Russell 2000 and Russell 2000 Growth Indices are unmanaged indices commonly used to measure the performance of small cap stocks, while the Russell 1000 and Russell 1000 Value indices measure the performance of large cap stocks. The S&P 400 Mid-cap Index is an unmanaged index commonly used to measure the performance of mid-cap stocks. One cannot invest directly in an index.
Current and future holdings are subject to risk.
SUMMARY OF INVESTMENTS — HENNESSY CORNERSTONE GROWTH FUND
Summaries of Investments
The following summaries of investment portfolios are designed to help investors better understand each fund’s principal holdings. Each summary is as of April 30, 2010 (Unaudited).
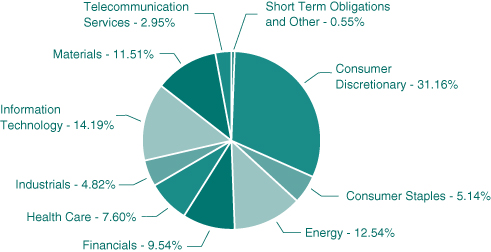
HENNESSY CORNERSTONE GROWTH FUND
(% of Net Assets)
| | TOP TEN EQUITY HOLDINGS | % of net assets |
| | Sanmina-SCI Corp. | 3.58% |
| | Brunswick Corp. | 3.29% |
| | KapStone Paper & Packaging Corp. | 2.76% |
| | American Axle & Manufacturing Holdings, Inc. | 2.62% |
| | Patriot Coal Corp. | 2.59% |
| | Ford Motor Co. | 2.44% |
| | Kirkland’s, Inc. | 2.38% |
| | H.H. Gregg, Inc. | 2.30% |
| | La-Z-Boy, Inc. | 2.30% |
| | Jo-Ann Stores, Inc. | 2.26% |
HENNESSY FUNDS 1-800-966-4354
| COMMON STOCKS – 99.45% | | Number | | | | | | % of Net | |
| | | of Shares | | | Value | | | Assets | |
Consumer Discretionary – 31.16% | | | | | | | | | |
| American Axle & Manufacturing | | | | | | | | | |
| Holdings Inc. (a) | | | 584,000 | | | $ | 6,283,840 | | | | 2.62 | % |
| Big 5 Sporting Goods Corp. | | | 242,400 | | | | 4,108,680 | | | | 1.71 | % |
| Brunswick Corp. | | | 377,700 | | | | 7,893,930 | | | | 3.29 | % |
| CarMax, Inc. (a) | | | 201,000 | | | | 4,938,570 | | | | 2.06 | % |
| Cia Brasileira de Distribuicao | | | | | | | | | | | | |
| Grupo Pao de Acucar – ADR (b) | | | 59,800 | | | | 4,096,898 | | | | 1.71 | % |
| Ford Motor Co. (a) | | | 449,900 | | | | 5,857,698 | | | | 2.44 | % |
| H.H. Gregg, Inc. (a) | | | 193,200 | | | | 5,531,316 | | | | 2.30 | % |
| Jo-Ann Stores, Inc. (a) | | | 123,200 | | | | 5,435,584 | | | | 2.26 | % |
| Kirkland’s, Inc. (a) | | | 257,200 | | | | 5,727,844 | | | | 2.38 | % |
| Knology, Inc. (a) | | | 393,900 | | | | 5,171,907 | | | | 2.15 | % |
| La-Z-Boy, Inc. (a) | | | 424,000 | | | | 5,528,960 | | | | 2.30 | % |
| Lumber Liquidators Holdings, Inc. (a) | | | 157,300 | | | | 4,791,358 | | | | 1.99 | % |
| Ulta Salon Cosmetics & Fragrance, Inc. (a) | | | 222,700 | | | | 5,148,824 | | | | 2.14 | % |
| Virgin Media, Inc. | | | 246,500 | | | | 4,335,935 | | | | 1.81 | % |
| | | | | | | | 74,851,344 | | | | 31.16 | % |
| Consumer Staples – 5.14% | | | | | | | | | | | | |
| Cott Corp. (b) | | | 489,500 | | | | 4,097,115 | | | | 1.70 | % |
| Nu Skin Enterprises, Inc. | | | 146,300 | | | | 4,397,778 | | | | 1.83 | % |
| Revlon, Inc. (a) | | | 220,200 | | | | 3,857,904 | | | | 1.61 | % |
| | | | | | | | 12,352,797 | | | | 5.14 | % |
| Energy – 12.54% | | | | | | | | | | | | |
| Acergy SA – ADR (b) | | | 264,400 | | | | 5,052,684 | | | | 2.11 | % |
| Calumet Specialty Products | | | 213,300 | | | | 4,786,452 | | | | 1.99 | % |
| DCP Midstream Partners LP | | | 161,500 | | | | 5,402,175 | | | | 2.25 | % |
| Massey Energy Corp. | | | 106,000 | | | | 3,882,780 | | | | 1.62 | % |
| Patriot Coal Corp. (a) | | | 316,200 | | | | 6,225,978 | | | | 2.59 | % |
| Regency Energy Partners LP | | | 209,800 | | | | 4,760,362 | | | | 1.98 | % |
| | | | | | | | 30,110,431 | | | | 12.54 | % |
| Financials – 9.54% | | | | | | | | | | | | |
| Advance America Cash Advance Centers, Inc. | | | 673,300 | | | | 3,851,276 | | | | 1.60 | % |
| AmeriCredit Corp. (a) | | | 216,300 | | | | 5,178,222 | | | | 2.16 | % |
| Cardtronics, Inc. (a) | | | 342,000 | | | | 4,767,480 | | | | 1.98 | % |
The accompanying notes are an integral part of these financial statements.
SUMMARY OF INVESTMENTS — HENNESSY CORNERSTONE GROWTH FUND
| COMMON STOCKS | | Number | | | | | | % of Net | |
| | | of Shares | | | Value | | | Assets | |
| Financials (Continued) | | | | | | | | | |
| Encore Capital Group, Inc. (a) | | | 225,900 | | | $ | 5,197,959 | | | | 2.17 | % |
| XL Capital Ltd. (b) | | | 220,200 | | | | 3,919,560 | | | | 1.63 | % |
| | | | | | | | 22,914,497 | | | | 9.54 | % |
| Health Care – 7.60% | | | | | | | | | | | | |
| CIGNA Corp. | | | 121,500 | | | | 3,895,290 | | | | 1.62 | % |
| Cooper Companies, Inc. | | | 117,200 | | | | 4,557,908 | | | | 1.90 | % |
| Providence Service Corp. (a) | | | 276,700 | | | | 4,595,987 | | | | 1.91 | % |
| SXC Health Solutions Corp. (a)(b) | | | 74,800 | | | | 5,213,560 | | | | 2.17 | % |
| | | | | | | | 18,262,745 | | | | 7.60 | % |
| Industrials – 4.82% | | | | | | | | | | | | |
| Bucyrus International, Inc. | | | 77,000 | | | | 4,851,770 | | | | 2.02 | % |
| GenCorp, Inc. (a) | | | 482,500 | | | | 3,001,150 | | | | 1.25 | % |
| M&F Worldwide Corp. (a) | | | 121,700 | | | | 3,731,322 | | | | 1.55 | % |
| | | | | | | | 11,584,242 | | | | 4.82 | % |
| Information Technology – 14.19% | | | | | | | | | | | | |
| Advanced Micro Devices, Inc. (a) | | | 555,200 | | | | 5,030,112 | | | | 2.09 | % |
| Global Cash Access Holdings, Inc. (a) | | | 539,700 | | | | 4,684,596 | | | | 1.95 | % |
| GSI Commerce, Inc. (a) | | | 173,100 | | | | 4,716,975 | | | | 1.96 | % |
| Sanmina-SCI Corp. (a) | | | 482,500 | | | | 8,602,975 | | | | 3.58 | % |
| Tech Data Corp. (a) | | | 95,700 | | | | 4,105,530 | | | | 1.71 | % |
| Telvent GIT SA (b) | | | 120,300 | | | | 3,476,670 | | | | 1.45 | % |
| Unisys Corp. (a) | | | 124,100 | | | | 3,477,282 | | | | 1.45 | % |
| | | | | | | | 34,094,140 | | | | 14.19 | % |
| Materials – 11.51% | | | | | | | | | | | | |
| Braskem SA – ADR (b) | | | 275,000 | | | | 3,918,750 | | | | 1.63 | % |
| Huntsman Corp. | | | 408,600 | | | | 4,662,126 | | | | 1.94 | % |
| KapStone Paper & Packaging Corp.(a) | | | 513,700 | | | | 6,626,730 | | | | 2.76 | % |
| NewMarket Corp. | | | 37,200 | | | | 4,092,000 | | | | 1.70 | % |
| Omnova Solutions, Inc. (a) | | | 602,300 | | | | 4,607,595 | | | | 1.92 | % |
| Schweitzer-Mauduit International, Inc. | | | 65,900 | | | | 3,751,028 | | | | 1.56 | % |
| | | | | | | | 27,658,229 | | | | 11.51 | % |
| Telecommunication Services – 2.95% | | | | | | | | | | | | |
| Tim Participacoes SA – ADR (b) | | | 143,800 | | | | 3,737,362 | | | | 1.56 | % |
The accompanying notes are an integral part of these financial statements.
HENNESSY FUNDS 1-800-966-4354
| COMMON STOCKS | | Number | | | | | | % of Net | |
| | | of Shares | | | Value | | | Assets | |
| Telecommunication Services (Continued) | | | | | | | | | |
| Vivo Participacoes SA – ADR (b) | | | 126,400 | | | $ | 3,345,808 | | | | 1.39 | % |
| | | | | | | | 7,083,170 | | | | 2.95 | % |
| | | | | | | | | | | | | |
Total Common Stocks (Cost $203,644,626) | | | | | | | 238,911,595 | | | | 99.45 | % |
| | | | | | | | | | | | | |
| SHORT-TERM INVESTMENTS – 0.69% | | | | | | | | | | | | |
| Money Market Funds – 0.69% | | | | | | | | | | | | |
| Fidelity Government Portfolio, 0.0400% (c) | | | 1,654,303 | | | | 1,654,303 | | | | 0.69 | % |
| | | | | | | | | | | | | |
Total Money Market Funds (Cost $1,654,303) | | | | | | | 1,654,303 | | | | 0.69 | % |
| | | | | | | | | | | | | |
| Total Short-Term Investments | | | | | | | | | | | | |
| (Cost $1,654,303) | | | | | | | 1,654,303 | | | | 0.69 | % |
| | | | | | | | | | | | | |
Total Investments – 100.14% | | | | | | | | | | | | |
| (Cost $205,298,929) | | | | | | | 240,565,898 | | | | 100.14 | % |
| | | | | | | | | | | | | |
| Liabilities in Excess of Other Assets – (0.14)% | | | | | | | (324,478 | ) | | | (0.14 | )% |
TOTAL NET ASSETS – 100.00% | | | | | | $ | 240,241,420 | | | | 100.00 | % |
Percentages are stated as a percent of net assets.
(a)Non Income Producing
(b)Foreign Issued Security
(c)The rate listed is the Fund’s 7-day yield as of April 30, 2010.
The accompanying notes are an integral part of these financial statements.
SUMMARY OF INVESTMENTS — HENNESSY CORNERSTONE GROWTH FUND
Summary of Fair Value Exposure at April 30, 2010 (Unaudited)
The Fund has adopted authoritative fair valuation accounting standards which establish an authoritative definition of fair value and set out a hierarchy for measuring fair value. These standards require additional disclosures about the various inputs and valuation techniques used to develop the measurements of fair value and a discussion in changes in valuation techniques and related inputs during the period. These inputs are summarized in the three broad levels listed below.
The Fund has performed an analysis of all existing investments to determine the significance and character of all inputs to their fair value determination.
| | Level 1 – | Quoted unadjusted prices for identical instruments in active markets to which the Fund has access at the date of measurement. |
| | Level 2 – | Quoted prices for similar instruments in active markets; quoted prices for identical or similar instruments in markets that are not active; and model-derived valuations in which all significant inputs and significant value drivers are observable in active markets. Level 2 inputs are those in markets for which there are few transactions, the prices are not current, little public information exists or instances where prices vary substantially over time or among brokered market makers. |
| | Level 3 – | Model derived valuations in which one or more significant inputs or significant value drivers are unobservable. Unobservable inputs are those inputs that reflect the Fund’s own assumptions that market participants would use to price the asset or liability based on the best available information. |
The inputs or methodology used for valuing securities are not an indication of the risk associated with investing in those securities.
The following is a summary of the inputs used to value the Fund’s net assets as of April 30, 2010:
| | | Level 1 | | | Level 2 | | | Level 3 | | | Total | |
| Equity | | | | | | | | | | | | |
| Consumer Discretionary | | $ | 74,851,344 | | | $ | — | | | $ | — | | | $ | 74,851,344 | |
| Consumer Staples | | | 12,352,797 | | | | — | | | | — | | | | 12,352,797 | |
| Energy | | | 30,110,431 | | | | — | | | | — | | | | 30,110,431 | |
| Financials | | | 22,914,497 | | | | — | | | | — | | | | 22,914,497 | |
| Health Care | | | 18,262,745 | | | | — | | | | — | | | | 18,262,745 | |
| Industrials | | | 11,584,242 | | | | — | | | | — | | | | 11,584,242 | |
| Information Technology | | | 34,094,140 | | | | — | | | | — | | | | 34,094,140 | |
| Materials | | | 27,658,229 | | | | — | | | | — | | | | 27,658,229 | |
| Telecommunication Services | | | 7,083,170 | | | | — | | | | — | | | | 7,083,170 | |
| Total Equity | | $ | 238,911,595 | | | $ | — | | | $ | — | | | $ | 238,911,595 | |
| Short-Term Investments | | $ | 1,654,303 | | | $ | — | | | $ | — | | | $ | 1,654,303 | |
| Total Investments in Securities | | $ | 240,565,898 | | | $ | — | | | $ | — | | | $ | 240,565,898 | |
The accompanying notes are an integral part of these financial statements.
HENNESSY FUNDS 1-800-966-4354
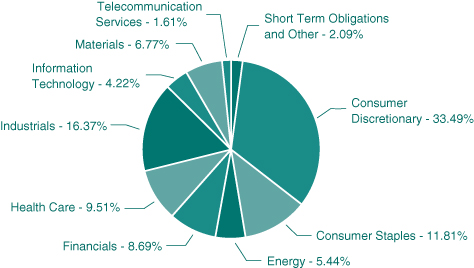
HENNESSY CORNERSTONE
GROWTH FUND, SERIES II
(% of Net Assets)
| | TOP TEN EQUITY HOLDINGS | % of net assets |
| | Dollar Thrifty Automotive Group Co. | 6.41% |
| | SXC Health Solutions Corp. | 3.87% |
| | Kirkland’s, Inc. | 3.40% |
| | Madden Steven Ltd. | 3.08% |
| | Schweitzer-Mauduit International, Inc. | 3.07% |
| | Jos. A. Bank Clothiers, Inc. | 2.79% |
| | Encore Cap Group, Inc. | 2.67% |
| | Evercore Partners, Inc. | 2.60% |
| | H.H. Gregg, Inc. | 2.54% |
| | Cott Corporation | 2.33% |
SUMMARY OF INVESTMENTS — HENNESSY CORNERSTONE GROWTH FUND, SERIES II
| COMMON STOCKS – 97.91% | | Number | | | | | | % of Net | |
| | | of Shares | | | Value | | | Assets | |
| Consumer Discretionary – 33.49% | | | | | | | | | |
| 99 Cents Only Stores (a) | | | 35,800 | | | $ | 555,616 | | | | 1.62 | % |
| Aaron’s, Inc. | | | 23,700 | | | | 534,909 | | | | 1.56 | % |
| Carter’s, Inc. (a) | | | 20,500 | | | | 660,510 | | | | 1.93 | % |
| Fuqi International, Inc. (a) | | | 27,800 | | | | 292,178 | | | | 0.85 | % |
| H. H .Gregg, Inc. (a) | | | 30,400 | | | | 870,352 | | | | 2.54 | % |
| Isle Of Capri Casinos, Inc. (a) | | | 39,200 | | | | 426,888 | | | | 1.25 | % |
| Jos. A. Bank Clothiers, Inc. (a) | | | 15,700 | | | | 955,502 | | | | 2.79 | % |
| Kirkland’s, Inc. (a) | | | 52,300 | | | | 1,164,721 | | | | 3.40 | % |
| Lincoln Educational Services Corp. (a) | | | 25,900 | | | | 646,464 | | | | 1.89 | % |
| Madden Steven Ltd. (a) | | | 18,200 | | | | 1,054,872 | | | | 3.08 | % |
| National Presto Industries, Inc. | | | 6,200 | | | | 694,214 | | | | 2.03 | % |
| P. F. Changs China Bistro, Inc. (a) | | | 15,400 | | | | 672,056 | | | | 1.96 | % |
| Peet’s Coffee & Tea, Inc. (a) | | | 18,600 | | | | 736,932 | | | | 2.15 | % |
| Pep Boys Manny Moe & Jack | | | 50,800 | | | | 636,524 | | | | 1.86 | % |
| Spartan Motors, Inc. | | | 44,900 | | | | 277,033 | | | | 0.81 | % |
| Sturm Ruger & Co., Inc. | | | 38,500 | | | | 642,565 | | | | 1.88 | % |
| Texas Roadhouse, Inc. (a) | | | 43,900 | | | | 648,842 | | | | 1.89 | % |
| | | | | | | | 11,470,178 | | | | 33.49 | % |
| Consumer Staples – 11.81% | | | | | | | | | | | | |
| Calavo Growers, Inc. | | | 24,200 | | | | 419,628 | | | | 1.22 | % |
| Central Garden & Pet Co. (a) | | | 50,500 | | | | 521,665 | | | | 1.52 | % |
| Coca Cola Bottling Co. | | | 8,800 | | | | 484,704 | | | | 1.42 | % |
| Cott Corp. (a)(b) | | | 95,300 | | | | 797,661 | | | | 2.33 | % |
| J & J Snack Foods Corp. | | | 13,500 | | | | 628,965 | | | | 1.84 | % |
| Lancaster Colony Corp. | | | 10,900 | | | | 599,173 | | | | 1.75 | % |
| United Natural Foods, Inc. (a) | | | 19,300 | | | | 592,317 | | | | 1.73 | % |
| | | | | | | | 4,044,113 | | | | 11.81 | % |
| Energy – 5.44% | | | | | | | | | | | | |
| Nustar Energy LP | | | 9,400 | | | | 578,664 | | | | 1.69 | % |
| Sunoco Logistics Partners LP | | | 9,000 | | | | 615,690 | | | | 1.80 | % |
| World Fuel Services Corp. | | | 23,500 | | | | 668,105 | | | | 1.95 | % |
| | | | | | | | 1,862,459 | | | | 5.44 | % |
The accompanying notes are an integral part of these financial statements.
HENNESSY FUNDS 1-800-966-4354
| COMMON STOCKS | | Number | | | | | | % of Net | |
| | | of Shares | | | Value | | | Assets | |
| Financials – 8.69% | | | | | | | | | |
| Encore Cap Group, Inc. (a) | | | 39,800 | | | $ | 915,798 | | | | 2.67 | % |
| Evercore Partners, Inc. | | | 24,800 | | | | 888,832 | | | | 2.60 | % |
| First Horizon National Corp. (a) | | | 40,000 | | | | 566,000 | | | | 1.65 | % |
| Stifel Financial Corp. (a) | | | 10,600 | | | | 607,698 | | | | 1.77 | % |
| | | | | | | | 2,978,328 | | | | 8.69 | % |
| Health Care – 9.51% | | | | | | | | | | | | |
| Bio-reference Labs, Inc. (a) | | | 30,800 | | | | 720,720 | | | | 2.10 | % |
| Cantel Medical Corp. (a) | | | 30,100 | | | | 600,796 | | | | 1.76 | % |
| Rehabcare Group, Inc. (a) | | | 21,400 | | | | 610,328 | | | | 1.78 | % |
| SXC Health Solutions Corp. (a)(b) | | | 19,000 | | | | 1,324,300 | | | | 3.87 | % |
| | | | | | | | 3,256,144 | | | | 9.51 | % |
| Industrials – 16.37% | | | | | | | | | | | | |
| Apac Customer Services, Inc. (a) | | | 95,100 | | | | 546,825 | | | | 1.60 | % |
| Baker Michael Corp. (a) | | | 11,900 | | | | 420,546 | | | | 1.23 | % |
| Cubic Corp. | | | 13,700 | | | | 511,147 | | | | 1.49 | % |
| Dollar Thrifty Automotive Group Co. (a) | | | 49,900 | | | | 2,195,101 | | | | 6.41 | % |
| Force Protection, Inc. (a) | | | 62,100 | | | | 332,235 | | | | 0.97 | % |
| Goodrich Corp. | | | 9,500 | | | | 704,710 | | | | 2.06 | % |
| Marten Transport Ltd (a) | | | 22,700 | | | | 495,995 | | | | 1.45 | % |
| Tetra Tech, Inc. (a) | | | 16,400 | | | | 399,340 | | | | 1.16 | % |
| | | | | | | | 5,605,899 | | | | 16.37 | % |
| Information Technology – 4.22% | | | | | | | | | | | | |
| Black Box Corp. | | | 13,300 | | | | 414,827 | | | | 1.21 | % |
| Global Cash Access Holdings, Inc. (a) | | | 67,900 | | | | 589,372 | | | | 1.72 | % |
| NCI, Inc. (a) | | | 15,500 | | | | 440,355 | | | | 1.29 | % |
| | | | | | | | 1,444,554 | | | | 4.22 | % |
| Materials – 6.77% | | | | | | | | | | | | |
| Bway Holding Co. (a) | | | 30,100 | | | | 595,378 | | | | 1.74 | % |
| Rock-Tenn Co. | | | 13,000 | | | | 670,800 | | | | 1.96 | % |
| Schweitzer-Mauduit International, Inc. | | | 18,500 | | | | 1,053,020 | | | | 3.07 | % |
| | | | | | | | 2,319,198 | | | | 6.77 | % |
The accompanying notes are an integral part of these financial statements.
SUMMARY OF INVESTMENTS — HENNESSY CORNERSTONE GROWTH FUND, SERIES II
| COMMON STOCKS | | Number | | | | | | % of Net | |
| | | of Shares | | | Value | | | Assets | |
| Telecommunication Services – 1.61% | | | | | | | | | |
| USA Mobility, Inc. | | | 39,600 | | | $ | 552,024 | | | | 1.61 | % |
| | | | | | | | | | | | | |
Total Common Stocks (Cost $23,578,994) | | | | | | | 33,532,897 | | | | 97.91 | % |
| | | | | | | | | | | | | |
| SHORT-TERM INVESTMENTS – 2.29% | | Principal | | | | | | | % of Net | |
| | | Amount | | | Value | | | Assets | |
| Demand Notes# – 2.29% | | | | | | | | | | | | |
| American Family Financial Services, Inc. 0.1001% | | $ | 784,913 | | | | 784,913 | | | | 2.29 | % |
| | | | | | | | | | | | | |
| Total Demand Notes ($784,913) | | | | | | | 784,913 | | | | 2.29 | % |
| | | | | | | | | | | | | |
| Total Short-Term Investments | | | | | | | | | | | | |
| (Cost $784,913) | | | | | | | 784,913 | | | | 2.29 | % |
| | | | | | | | | | | | | |
Total Investments – 100.20% | | | | | | | | | | | | |
| (Cost $24,363,907) | | | | | | | 34,317,810 | | | | 100.20 | % |
| | | | | | | | | | | | | |
| Liabilities in Excess of Other Assets – (0.20)% | | | | | | | (70,075 | ) | | | (0.20 | )% |
TOTAL NET ASSETS – 100.00% | | | | | | $ | 34,247,735 | | | | 100.00 | % |
Percentages are stated as a percent of net assets.
| (b) | Foreign Issued Security |
| # | Variable rate demand notes are considered short-term obligations and are payable on demand. Interest rates change periodically on specified dates. The rates listed are as of April 30, 2010. |
The accompanying notes are an integral part of these financial statements.
HENNESSY FUNDS 1-800-966-4354
Summary of Fair Value Exposure at April 30, 2010 (Unaudited)
The Fund has adopted authoritative fair valuation accounting standards which establish an authoritative definition of fair value and set out a hierarchy for measuring fair value. These standards require additional disclosures about the various inputs and valuation techniques used to develop the measurements of fair value and a discussion in changes in valuation techniques and related inputs during the period. These inputs are summarized in the three broad levels listed below.
The Fund has performed an analysis of all existing investments to determine the significance and character of all inputs to their fair value determination.
| | Level 1 – | Quoted unadjusted prices for identical instruments in active markets to which the Fund has access at the date of measurement. |
| | Level 2 – | Quoted prices for similar instruments in active markets; quoted prices for identical or similar instruments in markets that are not active; and model-derived valuations in which all significant inputs and significant value drivers are observable in active markets. Level 2 inputs are those in markets for which there are few transactions, the prices are not current, little public information exists or instances where prices vary substantially over time or among brokered market makers. |
| | Level 3 – | Model derived valuations in which one or more significant inputs or significant value drivers are unobservable. Unobservable inputs are those inputs that reflect the Fund’s own assumptions that market participants would use to price the asset or liability based on the best available information. |
The inputs or methodology used for valuing securities are not an indication of the risk associated with investing in those securities.
The following is a summary of the inputs used to value the Fund’s net assets as of April 30, 2010:
| | | Level 1 | | | Level 2 | | | Level 3 | | | Total | |
| Equity | | | | | | | | | | | | |
| Consumer Discretionary | | $ | 11,470,178 | | | $ | — | | | $ | — | | | $ | 11,470,178 | |
| Consumer Staples | | | 4,044,113 | | | | — | | | | — | | | | 4,044,113 | |
| Energy | | | 1,862,459 | | | | — | | | | — | | | | 1,862,459 | |
| Financials | | | 2,978,328 | | | | — | | | | — | | | | 2,978,328 | |
| Health Care | | | 3,256,144 | | | | — | | | | — | | | | 3,256,144 | |
| Industrials | | | 5,605,899 | | | | — | | | | — | | | | 5,605,899 | |
| Information Technology | | | 1,444,554 | | | | — | | | | — | | | | 1,444,554 | |
| Materials | | | 2,319,198 | | | | — | | | | — | | | | 2,319,198 | |
| Telecommunication Services | | | 552,024 | | | | — | | | | — | | | | 552,024 | |
| Total Equity | | $ | 33,532,897 | | | $ | — | | | $ | — | | | $ | 33,532,897 | |
| Short-Term Investments | | $ | — | | | $ | 784,913 | | | $ | — | | | $ | 784,913 | |
| Total Investments in Securities | | $ | 33,532,897 | | | $ | 784,913 | | | $ | — | | | $ | 34,317,810 | |
The accompanying notes are an integral part of these financial statements.
SUMMARY OF INVESTMENTS — HENNESSY FOCUS 30 FUND
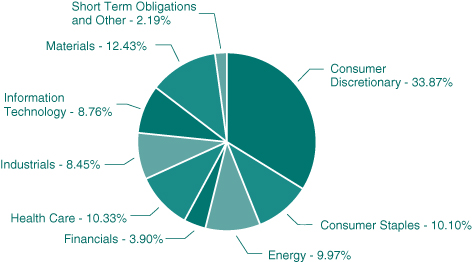
HENNESSY FOCUS 30 FUND
(% of Net Assets)
| | TOP TEN EQUITY HOLDINGS | % of net assets |
| | Mylan, Inc. | 4.04% |
| | Virgin Media, Inc. | 3.97% |
| | AmeriCredit Corp. | 3.90% |
| | Tractor Supply Co. | 3.80% |
| | Coca-Cola Enterprises, Inc. | 3.64% |
| | Tupperware Brands Corp. | 3.60% |
| | Del Monte Foods Co. | 3.54% |
| | Goodrich Corp. | 3.53% |
| | NewMarket Corp. | 3.50% |
| | O’ Reilly Automotive, Inc. | 3.47% |
HENNESSY FUNDS 1-800-966-4354
| COMMON STOCKS – 97.81% | | Number | | | | | | % of Net | |
| | | of Shares | | | Value | | | Assets | |
Consumer Discretionary – 33.87% | | | | | | | | | |
| Aeropostale, Inc. (a) | | | 144,100 | | | $ | 4,184,664 | | | | 2.79 | % |
| Carter’s, Inc. (a) | | | 159,200 | | | | 5,129,424 | | | | 3.42 | % |
| Darden Restaurants, Inc. | | | 116,300 | | | | 5,204,425 | | | | 3.46 | % |
| Dollar Tree, Inc. (a) | | | 81,400 | | | | 4,942,608 | | | | 3.29 | % |
| Gymboree Corp. (a) | | | 88,500 | | | | 4,348,005 | | | | 2.89 | % |
| O’Reilly Automotive, Inc. (a) | | | 106,600 | | | | 5,211,674 | | | | 3.47 | % |
| Ross Stores, Inc. | | | 85,200 | | | | 4,771,200 | | | | 3.18 | % |
| Tractor Supply Co. (a) | | | 84,900 | | | | 5,702,733 | | | | 3.80 | % |
| Tupperware Brands Corp. | | | 106,000 | | | | 5,413,420 | | | | 3.60 | % |
| Virgin Media, Inc. | | | 339,100 | | | | 5,964,769 | | | | 3.97 | % |
| | | | | | | | 50,872,922 | | | | 33.87 | % |
| Consumer Staples – 10.10% | | | | | | | | | | | | |
| Coca-Cola Enterprises, Inc. | | | 196,900 | | | | 5,460,037 | | | | 3.64 | % |
| Del Monte Foods Co. | | | 356,000 | | | | 5,318,640 | | | | 3.54 | % |
| Lancaster Colony Corp. | | | 79,800 | | | | 4,386,606 | | | | 2.92 | % |
| | | | | | | | 15,165,283 | | | | 10.10 | % |
| Energy – 9.97% | | | | | | | | | | | | |
| Linn Energy LLC | | | 188,700 | | | | 5,113,770 | | | | 3.41 | % |
| Plains All American Pipeline L.P. | | | 83,400 | | | | 4,836,366 | | | | 3.22 | % |
| World Fuel Services Corp. | | | 176,600 | | | | 5,020,738 | | | | 3.34 | % |
| | | | | | | | 14,970,874 | | | | 9.97 | % |
| Financials – 3.90% | | | | | | | | | | | | |
| AmeriCredit Corp. (a) | | | 245,000 | | | | 5,865,300 | | | | 3.90 | % |
| | | | | | | | | | | | | |
| Health Care – 10.33% | | | | | | | | | | | | |
| Emergency Medical Services Corp. (a) | | | 85,500 | | | | 4,521,240 | | | | 3.01 | % |
| Mylan, Inc. (a) | | | 275,400 | | | | 6,067,062 | | | | 4.04 | % |
| Watson Pharmaceuticals, Inc. (a) | | | 114,900 | | | | 4,920,018 | | | | 3.28 | % |
| | | | | | | | 15,508,320 | | | | 10.33 | % |
| Industrials – 8.45% | | | | | | | | | | | | |
| Goodrich Corp. | | | 71,500 | | | | 5,303,870 | | | | 3.53 | % |
| KBR, Inc. | | | 183,500 | | | | 4,051,680 | | | | 2.70 | % |
| Tetra Tech, Inc. (a) | | | 137,200 | | | | 3,340,820 | | | | 2.22 | % |
| | | | | | | | 12,696,370 | | | | 8.45 | % |
The accompanying notes are an integral part of these financial statements.
SUMMARY OF INVESTMENTS — HENNESSY FOCUS 30 FUND
| COMMON STOCKS | | Number | | | | | | % of Net | |
| | | of Shares | | | Value | | | Assets | |
| Information Technology – 8.76% | | | | | | | | | |
| Broadridge Financial Solutions Inc. | | | 186,400 | | | $ | 4,438,184 | | | | 2.96 | % |
| Computer Sciences Corp. (a) | | | 82,400 | | | | 4,316,936 | | | | 2.87 | % |
| Tech Data Corp. (a) | | | 102,700 | | | | 4,405,830 | | | | 2.93 | % |
| | | | | | | | 13,160,950 | | | | 8.76 | % |
| Materials – 12.43% | | | | | | | | | | | | |
| Ball Corp. | | | 82,700 | | | | 4,400,467 | | | | 2.93 | % |
| NewMarket Corp. | | | 47,800 | | | | 5,258,000 | | | | 3.50 | % |
| Rock-Tenn Co. | | | 81,100 | | | | 4,184,760 | | | | 2.79 | % |
| Scotts Miracle Gro Co. | | | 99,700 | | | | 4,830,465 | | | | 3.21 | % |
| | | | | | | | 18,673,692 | | | | 12.43 | % |
| | | | | | | | | | | | | |
Total Common Stocks (Cost $119,666,813) | | | | | | | 146,913,711 | | | | 97.81 | % |
| | | | | | | | | | | | | |
| WARRANTS – 0.00% | | | | | | | | | | | | |
| Lantronix Inc., Warrant Ω | | | | | | | | | | | | |
| Expiration: February, 2011, | | | | | | | | | | | | |
| Exercise Price: $0.850 | | | 158 | | | | 0 | | | | 0.00 | % |
| | | | | | | | | | | | | |
Total Warrants (Cost $0) | | | | | | | 0 | | | | 0.00 | % |
| | | | | | | | | | | | | |
| SHORT-TERM INVESTMENTS – 2.29% | | | | | | | | | | | | |
| Money Market Funds – 2.29% | | | | | | | | | | | | |
| Fidelity Government Portfolio, 0.0400% (b) | | | 3,441,975 | | | | 3,441,975 | | | | 2.29 | % |
| | | | | | | | | | | | | |
Total Money Market Funds (Cost $3,441,975) | | | | | | | 3,441,975 | | | | 2.29 | % |
| | | | | | | | | | | | | |
| Total Short-Term Investments | | | | | | | | | | | | |
| (Cost $3,441,975) | | | | | | | 3,441,975 | | | | 2.29 | % |
| | | | | | | | | | | | | |
Total Investments – 100.10% | | | | | | | | | | | | |
| (Cost $123,108,788) | | | | | | | 150,355,686 | | | | 100.10 | % |
| | | | | | | | | | | | | |
| Liabilities in Excess of Other Assets – (0.10)% | | | | | | | (153,739 | ) | | | (0.10 | )% |
TOTAL NET ASSETS – 100.00% | | | | | | $ | 150,201,947 | | | | 100.00 | % |
Percentages are stated as a percent of net assets.
| (b) | The rate listed is the Fund’s 7-day yield as of April 30, 2010 |
The accompanying notes are an integral part of these financial statements.
HENNESSY FUNDS 1-800-966-4354
Summary of Fair Value Exposure at April 30, 2010 (Unaudited)
The Fund has adopted authoritative fair valuation accounting standards which establish an authoritative definition of fair value and set out a hierarchy for measuring fair value. These standards require additional disclosures about the various inputs and valuation techniques used to develop the measurements of fair value and a discussion in changes in valuation techniques and related inputs during the period. These inputs are summarized in the three broad levels listed below.
The Fund has performed an analysis of all existing investments to determine the significance and character of all inputs to their fair value determination.
| | Level 1 – | Quoted unadjusted prices for identical instruments in active markets to which the Fund has access at the date of measurement. |
| | Level 2 – | Quoted prices for similar instruments in active markets; quoted prices for identical or similar instruments in markets that are not active; and model-derived valuations in which all significant inputs and significant value drivers are observable in active markets. Level 2 inputs are those in markets for which there are few transactions, the prices are not current, little public information exists or instances where prices vary substantially over time or among brokered market makers. |
| | Level 3 – | Model derived valuations in which one or more significant inputs or significant value drivers are unobservable. Unobservable inputs are those inputs that reflect the Fund’s own assumptions that market participants would use to price the asset or liability based on the best available information. |
The inputs or methodology used for valuing securities are not an indication of the risk associated with investing in those securities.
The following is a summary of the inputs used to value the Fund’s net assets as of April 30, 2010:
| | | Level 1 | | | Level 2 | | | Level 3 | | | Total | |
| Equity | | | | | | | | | | | | |
| Consumer Discretionary | | $ | 50,872,922 | | | $ | — | | | $ | — | | | $ | 50,872,922 | |
| Consumer Staples | | | 15,165,283 | | | | — | | | | — | | | | 15,165,283 | |
| Energy | | | 14,970,874 | | | | — | | | | — | | | | 14,970,874 | |
| Financials | | | 5,865,300 | | | | — | | | | — | | | | 5,865,300 | |
| Health Care | | | 15,508,320 | | | | — | | | | — | | | | 15,508,320 | |
| Industrials | | | 12,696,370 | | | | — | | | | — | | | | 12,696,370 | |
| Information Technology | | | 13,160,950 | | | | — | | | | — | | | | 13,160,950 | |
| Materials | | | 18,673,692 | | | | — | | | | — | | | | 18,673,692 | |
| Total Equity | | $ | 146,913,711 | | | $ | — | | | $ | — | | | $ | 146,913,711 | |
| Warrants | | $ | — | | | $ | — | | | $ | — | (1) | | $ | — | |
| Short-Term Investments | | $ | 3,441,975 | | | $ | — | | | $ | — | | | $ | 3,441,975 | |
| Total Investments in Securities | | $ | 150,355,686 | | | $ | — | | | $ | — | | | $ | 150,355,686 | |
| (1) | If the Lantronix, Inc. warrant would have had a value, it would have been a Level 3 fair value. The warrant has been fair valued at $0 during the entire reporting period. |
The accompanying notes are an integral part of these financial statements.
SUMMARY OF INVESTMENTS — HENNESSY CORNERSTONE LARGE GROWTH FUND
HENNESSY CORNERSTONE
LARGE GROWTH FUND
(% of Net Assets)
| | TOP TEN EQUITY HOLDINGS | % of net assets |
| | Humana, Inc. | 2.04% |
| | Kellogg Co. | 2.04% |
| | Bristol-Myers Squibb Co. | 2.04% |
| | Consol Energy, Inc. | 2.01% |
| | H.J. Heinz Co. | 2.01% |
| | Sysco Corp. | 2.00% |
| | General Mills, Inc. | 1.99% |
| | Campbell Soup Co. | 1.99% |
| | AutoZone, Inc. | 1.98% |
| | Clorox Co. | 1.98% |
HENNESSY FUNDS 1-800-966-4354
| COMMON STOCKS – 97.31% | | Number | | | | | | % of | |
| | | of Shares | | | Value | | | Net Assets | |
| Consumer Discretionary – 27.01% | | | | | | | | | |
| Apollo Group, Inc. (a) | | | 24,700 | | | $ | 1,418,027 | | | | 1.81 | % |
| AutoZone, Inc. (a) | | | 8,400 | | | | 1,554,084 | | | | 1.98 | % |
| Best Buy Co, Inc. | | | 32,900 | | | | 1,500,240 | | | | 1.91 | % |
| DIRECTV (a) | | | 42,400 | | | | 1,536,152 | | | | 1.96 | % |
| Dish Network Corp. (a) | | | 69,500 | | | | 1,539,425 | | | | 1.96 | % |
| Dollar Tree, Inc. (a) | | | 25,000 | | | | 1,518,000 | | | | 1.93 | % |
| Family Dollar Stores, Inc. | | | 38,900 | | | | 1,538,884 | | | | 1.96 | % |
| The Gap, Inc. | | | 60,800 | | | | 1,503,584 | | | | 1.91 | % |
| Liberty Global, Inc. (a) | | | 55,800 | | | | 1,529,478 | | | | 1.95 | % |
| Mattel, Inc. | | | 65,700 | | | | 1,514,385 | | | | 1.93 | % |
| The McGraw-Hill Companies, Inc. | | | 45,400 | | | | 1,530,888 | | | | 1.95 | % |
| Ross Stores, Inc. | | | 26,800 | | | | 1,500,800 | | | | 1.91 | % |
| TJX Companies, Inc. | | | 32,500 | | | | 1,506,050 | | | | 1.92 | % |
| Yum Brands, Inc. | | | 35,700 | | | | 1,514,394 | | | | 1.93 | % |
| | | | | | | | 21,204,391 | | | | 27.01 | % |
| Consumer Staples – 19.89% | | | | | | | | | | | | |
| Altria Group, Inc. | | | 73,100 | | | | 1,548,989 | | | | 1.97 | % |
| Campbell Soup Co. | | | 43,500 | | | | 1,559,910 | | | | 1.99 | % |
| Clorox Co. | | | 24,000 | | | | 1,552,800 | | | | 1.98 | % |
| General Mills, Inc. (a) | | | 22,000 | | | | 1,565,960 | | | | 1.99 | % |
| H.J. Heinz Co. | | | 33,600 | | | | 1,574,832 | | | | 2.01 | % |
| Kellogg Co. | | | 29,200 | | | | 1,604,248 | | | | 2.04 | % |
| Kimberly - Clark Corp. | | | 25,200 | | | | 1,543,752 | | | | 1.97 | % |
| Lorillard, Inc. | | | 19,700 | | | | 1,543,889 | | | | 1.97 | % |
| Philip Morris International, Inc. | | | 31,600 | | | | 1,550,928 | | | | 1.97 | % |
| Sysco Corp. | | | 49,900 | | | | 1,573,846 | | | | 2.00 | % |
| | | | | | | | 15,619,154 | | | | 19.89 | % |
| Energy – 3.83% | | | | | | | | | | | | |
| Consol Energy, Inc. | | | 35,300 | | | | 1,577,204 | | | | 2.01 | % |
| Diamond Offshore Drilling | | | 18,100 | | | | 1,431,710 | | | | 1.82 | % |
| | | | | | | | 3,008,914 | | | | 3.83 | % |
| Financials – 1.94% | | | | | | | | | | | | |
| Moody’s Corp. | | | 61,500 | | | | 1,520,280 | | | | 1.94 | % |
The accompanying notes are an integral part of these financial statements.
SUMMARY OF INVESTMENTS — HENNESSY CORNERSTONE LARGE GROWTH FUND
| COMMON STOCKS | | Number | | | | | | % of | |
| | | of Shares | | | Value | | | Net Assets | |
| Health Care – 19.62% | | | | | | | | | |
| Baxter International, Inc. | | | 32,200 | | | $ | 1,520,484 | | | | 1.94 | % |
| Becton, Dickinson & Co. | | | 20,100 | | | | 1,535,037 | | | | 1.95 | % |
| Bristol-Myers Squibb Co. | | | 63,200 | | | | 1,598,328 | | | | 2.04 | % |
| Cardinal Health, Inc. | | | 42,800 | | | | 1,484,732 | | | | 1.89 | % |
| CIGNA Corp. | | | 47,200 | | | | 1,513,232 | | | | 1.93 | % |
| Eli Lilly & Co. | | | 43,800 | | | | 1,531,686 | | | | 1.95 | % |
| Forest Laboratories, Inc. (a) | | | 56,500 | | | | 1,540,190 | | | | 1.96 | % |
| Humana, Inc. (a) | | | 35,100 | | | | 1,604,772 | | | | 2.04 | % |
| Johnson & Johnson | | | 23,800 | | | | 1,530,340 | | | | 1.95 | % |
| Laboratory Corp. of America Holdings (a) | | | 19,700 | | | | 1,547,829 | | | | 1.97 | % |
| | | | | | | | 15,406,630 | | | | 19.62 | % |
| Industrials – 11.62% | | | | | | | | | | | | |
| Flowserve Corp. | | | 13,200 | | | | 1,512,456 | | | | 1.92 | % |
| Fluor Corp. | | | 29,300 | | | | 1,548,212 | | | | 1.97 | % |
| Honeywell International, Inc. | | | 32,600 | | | | 1,547,522 | | | | 1.97 | % |
| Joy Global, Inc. | | | 25,300 | | | | 1,437,293 | | | | 1.83 | % |
| Lockheed Martin Corp. | | | 18,100 | | | | 1,536,509 | | | | 1.96 | % |
| Raytheon Co. | | | 26,500 | | | | 1,544,950 | | | | 1.97 | % |
| | | | | | | | 9,126,942 | | | | 11.62 | % |
| Information Technology – 5.71% | | | | | | | | | | | | |
| International Business Machines Corp. | | | 11,900 | | | | 1,535,100 | | | | 1.96 | % |
| SAIC, Inc. (a) | | | 84,900 | | | | 1,478,109 | | | | 1.88 | % |
| Western Digital Corp. (a) | | | 35,700 | | | | 1,466,913 | | | | 1.87 | % |
| | | | | | | | 4,480,122 | | | | 5.71 | % |
| Materials – 7.69% | | | | | | | | | | | | |
| Crown Holdings, Inc. (a) | | | 56,800 | | | | 1,476,800 | | | | 1.88 | % |
| FMC Corp. | | | 24,000 | | | | 1,527,360 | | | | 1.95 | % |
| Freeport-McMoRan Copper & Gold, Inc. | | | 20,100 | | | | 1,518,153 | | | | 1.93 | % |
| Lubrizol Corp. | | | 16,800 | | | | 1,517,712 | | | | 1.93 | % |
| | | | | | | | 6,040,025 | | | | 7.69 | % |
| | | | | | | | | | | | | |
Total Common Stocks (Cost $70,232,308) | | | | | | | 76,406,458 | | | | 97.31 | % |
The accompanying notes are an integral part of these financial statements.
HENNESSY FUNDS 1-800-966-4354
| SHORT-TERM INVESTMENTS – 1.93% | | Number | | | | | | % of | |
| | | of Shares | | | Value | | | Net Assets | |
| Money Market Funds – 1.93% | | | | | | | | | |
| Fidelity Government Portfolio, 0.06% (b) | | | 1,516,422 | | | $ | 1,516,423 | | | | 1.93 | % |
| | | | | | | | | | | | | |
| Total Short-Term Investments | | | | | | | | | | | | |
| (Cost $1,516,423) | | | | | | | 1,516,423 | | | | 1.93 | % |
| | | | | | | | | | | | | |
Total Investments – 99.24% | | | | | | | | | | | | |
| (Cost $71,748,731) | | | | | | | 77,922,881 | | | | 99.24 | % |
| | | | | | | | | | | | | |
| Other Assets in Excess of Liabilities – 0.76% | | | | | | | 594,238 | | | | 0.76 | % |
TOTAL NET ASSETS – 100.00% | | | | | | $ | 78,517,119 | | | | 100.00 | % |
Percentages are stated as a percent of net assets.
| (b) | The rate listed is the Fund’s 7-day yield as of April 30, 2010 |
Summary of Fair Value Exposure at April 30, 2010 (Unaudited)
The Fund has adopted authoritative fair valuation accounting standards which establish an authoritative definition of fair value and set out a hierarchy for measuring fair value. These standards require additional disclosures about the various inputs and valuation techniques used to develop the measurements of fair value and a discussion in changes in valuation techniques and related inputs during the period. These inputs are summarized in the three broad levels listed below.
The Fund has performed an analysis of all existing investments to determine the significance and character of all inputs to their fair value determination.
| Level 1 – | Quoted unadjusted prices for identical instruments in active markets to which the Fund has access at the date of measurement. |
| Level 2 – | Quoted prices for similar instruments in active markets; quoted prices for identical or similar instruments in markets that are not active; and model-derived valuations in which all significant inputs and significant value drivers are observable in active markets. Level 2 inputs are those in markets for which there are few transactions, the prices are not current, little public information exists or instances where prices vary substantially over time or among brokered market makers. |
| Level 3 – | Model derived valuations in which one or more significant inputs or significant value drivers are unobservable. Unobservable inputs are those inputs that reflect the Fund’s own assumptions that market participants would use to price the asset or liability based on the best available information. |
The inputs or methodology used for valuing securities are not an indication of the risk associated with investing in those securities.
The accompanying notes are an integral part of these financial statements.
SUMMARY OF INVESTMENTS — HENNESSY CORNERSTONE LARGE GROWTH FUND
The following is a summary of the inputs used to value the Fund’s net assets as of April 30, 2010:
| Common Stock | | Level 1 | | | Level 2 | | | Level 3 | | | Total | |
| Consumer Discretionary | | $ | 21,204,391 | | | $ | — | | | $ | — | | | $ | 21,204,391 | |
| Consumer Staples | | | 15,619,154 | | | | — | | | | — | | | | 15,619,154 | |
| Energy | | | 3,008,914 | | | | — | | | | — | | | | 3,008,914 | |
| Financials | | | 1,520,280 | | | | — | | | | — | | | | 1,520,280 | |
| Health Care | | | 15,406,630 | | | | — | | | | — | | | | 15,406,630 | |
| Industrials | | | 9,126,942 | | | | — | | | | — | | | | 9,126,942 | |
| Information Technology | | | 4,480,122 | | | | — | | | | — | | | | 4,480,122 | |
| Materials | | | 6,040,025 | | | | — | | | | — | | | | 6,040,025 | |
| Total Common Stock | | $ | 76,406,458 | | | $ | — | | | $ | — | | | $ | 76,406,458 | |
| Short Term Investments | | $ | 1,516,423 | | | $ | — | | | $ | — | | | $ | 1,516,423 | |
| Total Investments in Securities | | $ | 77,922,881 | | | $ | — | | | $ | — | | | $ | 77,922,881 | |
The accompanying notes are an integral part of these financial statements.
HENNESSY FUNDS 1-800-966-4354
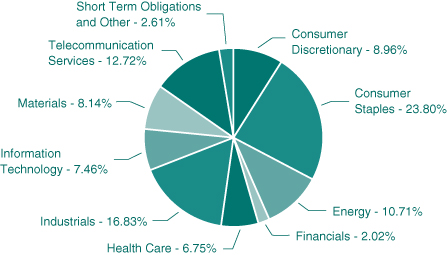
HENNESSY CORNERSTONE VALUE FUND
(% of Net Assets)
| | TOP TEN EQUITY HOLDINGS | % of net assets |
| | Limited Brands, Inc. | 2.57% |
| | Boeing Co. | 2.46% |
| | Hershey Co. | 2.41% |
| | Emerson Electric Co. | 2.27% |
| | EI du Pont de Nemours & Co. | 2.27% |
| | Home Depot, Inc. | 2.23% |
| | Eaton Corp. | 2.21% |
| | PPG Industries, Inc. | 2.21% |
| | United Parcel Service, Inc. | 2.16% |
| | Sara Lee Corp. | 2.16% |
SUMMARY OF INVESTMENTS — HENNESSY CORNERSTONE VALUE FUND
| COMMON STOCKS – 97.39% | | Number | | | | | | % of Net | |
| | | of Shares | | | Value | | | Assets | |
| Consumer Discretionary – 8.96% | | | | | | | | | |
| Home Depot, Inc. | | | 103,700 | | | $ | 3,655,425 | | | | 2.23 | % |
| Limited Brands, Inc. | | | 157,200 | | | | 4,212,960 | | | | 2.57 | % |
| Mattel, Inc. | | | 149,100 | | | | 3,436,755 | | | | 2.10 | % |
| McDonald’s Corp. | | | 47,800 | | | | 3,374,202 | | | | 2.06 | % |
| | | | | | | | 14,679,342 | | | | 8.96 | % |
| Consumer Staples – 23.80% | | | | | | | | | | | | |
| Altria Group, Inc. | | | 151,200 | | | | 3,203,928 | | | | 1.95 | % |
| Campbell Soup Co. | | | 90,000 | | | | 3,227,400 | | | | 1.97 | % |
| ConAgra Foods, Inc. | | | 134,000 | | | | 3,278,980 | | | | 2.00 | % |
| Diageo PLC – ADR (b) | | | 43,600 | | | | 2,970,904 | | | | 1.81 | % |
| HJ Heinz Co. | | | 70,700 | | | | 3,313,709 | | | | 2.02 | % |
| Hershey Co. | | | 84,200 | | | | 3,958,242 | | | | 2.41 | % |
| Kimberly Clark Corp. | | | 46,900 | | | | 2,873,094 | | | | 1.75 | % |
| Kraft Foods, Inc. | | | 110,000 | | | | 3,256,000 | | | | 1.99 | % |
| Philip Morris International, Inc. | | | 61,000 | | | | 2,993,880 | | | | 1.83 | % |
| Reynolds American, Inc. | | | 55,900 | | | | 2,986,178 | | | | 1.82 | % |
| Sara Lee Corp. | | | 248,800 | | | | 3,537,936 | | | | 2.16 | % |
| Sysco Corp. | | | 108,400 | | | | 3,418,936 | | | | 2.09 | % |
| | | | | | | | 39,019,187 | | | | 23.80 | % |
| Energy – 10.71% | | | | | | | | | | | | |
| BP PLC – ADR (b) | | | 52,900 | | | | 2,758,735 | | | | 1.68 | % |
| Chevron Corp. | | | 38,600 | | | | 3,143,584 | | | | 1.92 | % |
| ENI SPA – ADR (b) | | | 61,000 | | | | 2,711,450 | | | | 1.65 | % |
| Marathon Oil Corp. | | | 96,100 | | | | 3,089,615 | | | | 1.88 | % |
| Royal Dutch Shell PLC – ADR (b) | | | 51,100 | | | | 3,206,525 | | | | 1.96 | % |
| Total SA – ADR (b) | | | 48,700 | | | | 2,648,306 | | | | 1.62 | % |
| | | | | | | | 17,558,215 | | | | 10.71 | % |
| Financials – 2.02% | | | | | | | | | | | | |
| Marsh & McLennan Companies, Inc. | | | 136,900 | | | | 3,315,718 | | | | 2.02 | % |
| | | | | | | | | | | | | |
| Health Care – 6.75% | | | | | | | | | | | | |
| Bristol-Myers Squibb Co. | | | 115,200 | | | | 2,913,408 | | | | 1.78 | % |
| GlaxoSmithKline PLC – ADR (b) | | | 71,100 | | | | 2,651,319 | | | | 1.62 | % |
| Merck & Co., Inc. | | | 79,400 | | | | 2,782,176 | | | | 1.70 | % |
The accompanying notes are an integral part of these financial statements.
HENNESSY FUNDS 1-800-966-4354
| COMMON STOCKS | | Number | | | | | | % of Net | |
| | | of Shares | | | Value | | | Assets | |
| Health Care (Continued) | | | | | | | | | |
| Pfizer, Inc. | | | 162,300 | | | $ | 2,713,656 | | | | 1.65 | % |
| | | | | | | | 11,060,559 | | | | 6.75 | % |
| Industrials – 16.83% | | | | | | | | | | | | |
| Boeing Co. | | | 55,600 | | | | 4,027,108 | | | | 2.46 | % |
| Eaton Corp. | | | 46,900 | | | | 3,618,804 | | | | 2.21 | % |
| Emerson Electric Co. | | | 71,100 | | | | 3,713,553 | | | | 2.27 | % |
| Lockheed Martin Corp. | | | 38,900 | | | | 3,302,221 | | | | 2.01 | % |
| Pitney Bowes, Inc. | | | 130,100 | | | | 3,304,540 | | | | 2.02 | % |
| RR Donnelley & Sons Co. | | | 137,400 | | | | 2,952,726 | | | | 1.80 | % |
| United Parcel Service, Inc. | | | 51,200 | | | | 3,539,968 | | | | 2.16 | % |
| Waste Management, Inc. | | | 90,000 | | | | 3,121,200 | | | | 1.90 | % |
| | | | | | | | 27,580,120 | | | | 16.83 | % |
| Information Technology – 7.46% | | | | | | | | | | | | |
| Automatic Data Processing, Inc. | | | 70,100 | | | | 3,039,536 | | | | 1.85 | % |
| Intel Corp. | | | 151,300 | | | | 3,454,179 | | | | 2.11 | % |
| Nokia OYJ – ADR (b) | | | 238,600 | | | | 2,901,376 | | | | 1.77 | % |
| Taiwan Semiconductor | | | | | | | | | | | | |
| Manufacturing Ltd.- ADR (b) | | | 267,400 | | | | 2,831,766 | | | | 1.73 | % |
| | | | | | | | 12,226,857 | | | | 7.46 | % |
| Materials – 8.14% | | | | | | | | | | | | |
| EI du Pont de Nemours & Co. | | | 93,200 | | | | 3,713,088 | | | | 2.27 | % |
| MeadWestvaco Corp. | | | 108,000 | | | | 2,934,360 | | | | 1.79 | % |
| Nucor Corp. | | | 67,800 | | | | 3,072,696 | | | | 1.87 | % |
| PPG Industries, Inc. | | | 51,400 | | | | 3,617,018 | | | | 2.21 | % |
| | | | | | | | 13,337,162 | | | | 8.14 | % |
| Telecommunication Services – 12.72% | | | | | | | | | | | | |
| AT&T, Inc. | | | 108,700 | | | | 2,832,722 | | | | 1.73 | % |
| BCE, Inc. (b) | | | 114,500 | | | | 3,446,450 | | | | 2.10 | % |
| China Mobile Ltd. – ADR (b) | | | 64,600 | | | | 3,158,940 | | | | 1.93 | % |
| Mobile Telesystems OJSC – ADR (b) | | | 61,500 | | | | 3,397,875 | | | | 2.07 | % |
| Telefonica De Argentina (a)(b)Ω | | | 100 | | | | 0 | | | | 0.00 | % |
| Telefonica SA – ADR (b) | | | 36,100 | | | | 2,446,858 | | | | 1.49 | % |
| Verizon Communications, Inc. | | | 90,600 | | | | 2,617,434 | | | | 1.60 | % |
The accompanying notes are an integral part of these financial statements.
SUMMARY OF INVESTMENTS — HENNESSY CORNERSTONE VALUE FUND
| COMMON STOCKS | | Number | | | | | | % of Net | |
| | | of Shares | | | Value | | | Assets | |
| Telecommunication Services (Continued) | | | | | | | | | |
| Vodafone Group PLC – ADR (b) | | | 132,800 | | | $ | 2,948,160 | | | | 1.80 | % |
| | | | | | | | 20,848,439 | | | | 12.72 | % |
| | | | | | | | | | | | | |
Total Common Stocks (Cost $146,141,449) | | | | | | | 159,625,599 | | | | 97.39 | % |
| | | | | | | | | | | | | |
| SHORT-TERM INVESTMENTS – 0.00% | | | | | | | | | | | | |
| Money Market Funds – 0.00% | | | | | | | | | | | | |
| Fidelity Government Portfolio, 0.0400% (c) | | | 249 | | | | 249 | | | | 0.00 | % |
| | | | | | | | | | | | | |
Total Money Market Funds (Cost $249) | | | | | | | 249 | | | | 0.00 | % |
| | | | | | | | | | | | | |
| Total Short-Term Investments | | | | | | | | | | | | |
| (Cost $249) | | | | | | | 249 | | | | 0.00 | % |
| | | | | | | | | | | | | |
Total Investments – 97.39% | | | | | | | | | | | | |
| (Cost $146,141,698) | | | | | | | 159,625,848 | | | | 97.39 | % |
| | | | | | | | | | | | | |
| Other Assets in Excess of Liabilities – 2.61% | | | | | | | 4,277,416 | | | | 2.61 | % |
TOTAL NET ASSETS – 100.00% | | | | | | $ | 163,903,264 | | | | 100.00 | % |
Percentages are stated as a percent of net assets.
| (b) | Foreign Issued Security |
| (c) | The rate listed is the Fund’s 7-day yield as of April 30, 2010. |
The accompanying notes are an integral part of these financial statements.
HENNESSY FUNDS 1-800-966-4354
Summary of Fair Value Exposure at April 30, 2010 (Unaudited)
The Fund has adopted authoritative fair valuation accounting standards which establish an authoritative definition of fair value and set out a hierarchy for measuring fair value. These standards require additional disclosures about the various inputs and valuation techniques used to develop the measurements of fair value and a discussion in changes in valuation techniques and related inputs during the period. These inputs are summarized in the three broad levels listed below.
The Fund has performed an analysis of all existing investments to determine the significance and character of all inputs to their fair value determination.
| Level 1 – | Quoted unadjusted prices for identical instruments in active markets to which the Fund has access at the date of measurement. |
| Level 2 – | Quoted prices for similar instruments in active markets; quoted prices for identical or similar instruments in markets that are not active; and model-derived valuations in which all significant inputs and significant value drivers are observable in active markets. Level 2 inputs are those in markets for which there are few transactions, the prices are not current, little public information exists or instances where prices vary substantially over time or among brokered market makers. |
| Level 3 – | Model derived valuations in which one or more significant inputs or significant value drivers are unobservable. Unobservable inputs are those inputs that reflect the Fund’s own assumptions that market participants would use to price the asset or liability based on the best available information. |
The inputs or methodology used for valuing securities are not an indication of the risk associated with investing in those securities.
The following is a summary of the inputs used to value the Fund’s net assets as of April 30, 2010:
| | | Level 1 | | | Level 2 | | | Level 3 | | | Total | |
| Equity | | | | | | | | | | | | |
| Consumer Discretionary | | $ | 14,679,342 | | | $ | — | | | $ | — | | | $ | 14,679,342 | |
| Consumer Staples | | | 39,019,187 | | | | — | | | | — | | | | 39,019,187 | |
| Energy | | | 17,558,215 | | | | — | | | | — | | | | 17,558,215 | |
| Financials | | | 3,315,718 | | | | — | | | | — | | | | 3,315,718 | |
| Health Care | | | 11,060,559 | | | | — | | | | — | | | | 11,060,559 | |
| Industrials | | | 27,580,120 | | | | — | | | | — | | | | 27,580,120 | |
| Information Technology | | | 12,226,857 | | | | — | | | | — | | | | 12,226,857 | |
| Materials | | | 13,337,162 | | | | — | | | | — | | | | 13,337,162 | |
| Telecommunication Services | | | 20,848,439 | | | | — | | | | — | | | | 20,848,439 | |
| Total Equity | | $ | 159,625,599 | | | $ | — | | | $ | — | | | $ | 159,625,599 | |
| Short-Term Investments | | $ | 249 | | | $ | — | | | $ | — | | | $ | 249 | |
| Total Investments in Securities | | $ | 159,625,848 | | | $ | — | | | $ | — | | | $ | 159,625,848 | |
The accompanying notes are an integral part of these financial statements.
SUMMARY OF INVESTMENTS — HENNESSY TOTAL RETURN FUND
HENNESSY TOTAL RETURN FUND
(% of Net Assets)
| | TOP TEN EQUITY HOLDINGS | % of net assets |
| | EI Du Pont de Nemours & Co. | 8.28% |
| | Chevron Corp. | 6.97% |
| | AT&T, Inc. | 6.71% |
| | Pfizer, Inc. | 6.55% |
| | Kraft Foods, Inc. | 6.38% |
| | Verizon Communications, Inc. | 6.34% |
| | Merck & Co., Inc. | 6.33% |
| | McDonald’s Corp. | 6.28% |
| | Home Depot, Inc. | 6.26% |
| | Boeing Co. | 4.60% |
HENNESSY FUNDS 1-800-966-4354
| COMMON STOCKS – 73.22% | | Number | | | | | | % of Net | |
| | | of Shares | | | Value | | | Assets | |
| Consumer Discretionary – 12.54% | | | | | | | | | |
| Home Depot, Inc. | | | 96,900 | | | $ | 3,415,725 | | | | 6.26 | % |
| McDonald’s Corp. | | | 48,600 | | | | 3,430,674 | | | | 6.28 | % |
| | | | | | | | 6,846,399 | | | | 12.54 | % |
| Consumer Staples – 8.10% | | | | | | | | | | | | |
| Coca-Cola Co. | | | 17,600 | | | | 940,720 | | | | 1.72 | % |
| Kraft Foods, Inc. | | | 117,600 | | | | 3,480,960 | | | | 6.38 | % |
| | | | | | | | 4,421,680 | | | | 8.10 | % |
| Energy – 6.97% | | | | | | | | | | | | |
| Chevron Corp. | | | 46,700 | | | | 3,803,248 | | | | 6.97 | % |
| | | | | | | | | | | | | |
| Health Care – 15.84% | | | | | | | | | | | | |
| Johnson & Johnson | | | 25,100 | | | | 1,613,930 | | | | 2.96 | % |
| Merck & Co., Inc. | | | 98,600 | | | | 3,454,944 | | | | 6.33 | % |
| Pfizer, Inc. | | | 214,000 | | | | 3,578,080 | | | | 6.55 | % |
| | | | | | | | 8,646,954 | | | | 15.84 | % |
| Industrials – 7.28% | | | | | | | | | | | | |
| Boeing Co. | | | 34,700 | | | | 2,513,321 | | | | 4.60 | % |
| Caterpillar, Inc. | | | 21,500 | | | | 1,463,935 | | | | 2.68 | % |
| | | | | | | | 3,977,256 | | | | 7.28 | % |
| Information Technology – 1.16% | | | | | | | | | | | | |
| Intel Corp. | | | 27,700 | | | | 632,391 | | | | 1.16 | % |
| | | | | | | | | | | | | |
| Materials – 8.28% | | | | | | | | | | | | |
| EI Du Pont de Nemours & Co. | | | 113,500 | | | | 4,521,840 | | | | 8.28 | % |
| | | | | | | | | | | | | |
| Telecommunication Services – 13.05% | | | | | | | | | | | | |
| AT&T, Inc. | | | 140,500 | | | | 3,661,430 | | | | 6.71 | % |
| Verizon Communications, Inc. | | | 119,800 | | | | 3,461,022 | | | | 6.34 | % |
| | | | | | | | 7,122,452 | | | | 13.05 | % |
| | | | | | | | | | | | | |
Total Common Stocks (Cost $38,394,858) | | | | | | | 39,972,220 | | | | 73.22 | % |
The accompanying notes are an integral part of these financial statements.
SUMMARY OF INVESTMENTS — HENNESSY TOTAL RETURN FUND
| SHORT-TERM INVESTMENTS – 56.49% | | Number | | | | | | % of Net | |
| | | of Shares | | | Value | | | Assets | |
| Money Market Funds – 5.21% | | | | | | | | | |
| Fidelity Government Obligation, 0.0200% (a) | | | 404,267 | | | $ | 404,267 | | | | 0.74 | % |
| Fidelity Government Portfolio, 0.0400% (a) | | | 2,441,981 | | | | 2,441,981 | | | | 4.47 | % |
| | | | | | | | | | | | | |
Total Money Market Funds (Cost $2,846,248) | | | | | | | 2,846,248 | | | | 5.21 | % |
| | | | | | | | | | | | | |
| U.S. Treasury Bills* – 51.28% | | | | | | | | | | | | |
| 0.2500%, 6/10/2010 | | | 28,000,000 | | | | 27,996,111 | | | | 51.28 | % |
| | | | | | | | | | | | | |
Total U.S. Treasury Bills (Cost $27,996,111) | | | | | | | 27,996,111 | | | | 51.28 | % |
| | | | | | | | | | | | | |
| Total Short-Term Investments | | | | | | | | | | | | |
| (Cost $30,842,359) | | | | | | | 30,842,359 | | | | 56.49 | % |
| | | | | | | | | | | | | |
Total Investments – 129.71% | | | | | | | | | | | | |
| (Cost $69,237,217) | | | | | | | 70,814,579 | | | | 129.71 | % |
| | | | | | | | | | | | | |
| Liabilities in Excess of Other Assets – (29.71)% | | | | | | | (16,220,187 | ) | | | (29.71 | )% |
TOTAL NET ASSETS – 100.00% | | | | | | $ | 54,594,392 | | | | 100.00 | % |
| (a) | The rate listed is the Fund’s 7-day yield as of April 30, 2010. |
| * | Collateral or partial collateral for securities sold subject to repurchase. |
Summary of Fair Value Exposure at April 30, 2010 (Unaudited)
The Fund has adopted authoritative fair valuation accounting standards which establish an authoritative definition of fair value and set out a hierarchy for measuring fair value. These standards require additional disclosures about the various inputs and valuation techniques used to develop the measurements of fair value and a discussion in changes in valuation techniques and related inputs during the period. These inputs are summarized in the three broad levels listed below.
The Fund has performed an analysis of all existing investments to determine the significance and character of all inputs to their fair value determination.
| Level 1 – | Quoted unadjusted prices for identical instruments in active markets to which the Fund has access at the date of measurement. |
| Level 2 – | Quoted prices for similar instruments in active markets; quoted prices for identical or similar instruments in markets that are not active; and model-derived valuations in which all significant inputs and significant value drivers are observable in active markets. Level 2 inputs are those in markets for which there are few transactions, the prices are not current, little public information exists or instances where prices vary substantially over time or among brokered market makers. |
| Level 3 – | Model derived valuations in which one or more significant inputs or significant value drivers are unobservable. Unobservable inputs are those inputs that reflect the Fund’s own assumptions that market participants would use to price the asset or liability based on the best available information. |
The accompanying notes are an integral part of these financial statements.
HENNESSY FUNDS 1-800-966-4354
The inputs or methodology used for valuing securities are not an indication of the risk associated with investing in those securities.
The following is a summary of the inputs used to value the Fund’s net assets as of April 30, 2010:
| | | Level 1 | | | Level 2 | | | Level 3 | | | Total | |
| Equity | | | | | | | | | | | | |
| Consumer Discretionary | | $ | 6,846,399 | | | $ | — | | | $ | — | | | $ | 6,846,399 | |
| Consumer Staples | | | 4,421,680 | | | | — | | | | — | | | | 4,421,680 | |
| Energy | | | 3,803,248 | | | | — | | | | — | | | | 3,803,248 | |
| Health Care | | | 8,646,954 | | | | — | | | | — | | | | 8,646,954 | |
| Industrials | | | 3,977,256 | | | | — | | | | — | | | | 3,977,256 | |
| Information Technology | | | 632,391 | | | | — | | | | — | | | | 632,391 | |
| Materials | | | 4,521,840 | | | | — | | | | — | | | | 4,521,840 | |
| Telecommunication Services | | | 7,122,452 | | | | — | | | | — | | | | 7,122,452 | |
| Total Equity | | $ | 39,972,220 | | | $ | — | | | $ | — | | | $ | 39,972,220 | |
| Short-Term Investments | | $ | 2,846,248 | | | $ | 27,996,111 | | | $ | — | | | $ | 30,842,359 | |
| Total Investments in Securities | | $ | 42,818,468 | | | $ | 27,996,111 | | | $ | — | | | $ | 70,814,579 | |
The accompanying notes are an integral part of these financial statements.
SUMMARY OF INVESTMENTS — HENNESSY BALANCED FUND
HENNESSY BALANCED FUND
(% of Net Assets)
| | TOP TEN EQUITY HOLDINGS | % of net assets |
| | EI Du Pont de Nemours & Co. | 5.69% |
| | Home Depot, Inc. | 5.38% |
| | Chevron Corp. | 5.36% |
| | McDonald’s Corp. | 5.01% |
| | AT&T, Inc. | 4.98% |
| | Kraft Foods, Inc. | 4.92% |
| | Verizon Communications, Inc. | 4.75% |
| | Pfizer, Inc. | 4.62% |
| | Merck & Co., Inc. | 4.61% |
| | Coca-Cola Co. | 2.30% |
HENNESSY FUNDS 1-800-966-4354
| COMMON STOCKS – 51.57% | | Number | | | | | | % of Net | |
| | | of Shares | | | Value | | | Assets | |
| Consumer Discretionary – 10.39% | | | | | | | | | |
| Home Depot, Inc. | | | 18,800 | | | $ | 662,700 | | | | 5.38 | % |
| McDonald’s Corp. | | | 8,750 | | | | 617,663 | | | | 5.01 | % |
| | | | | | | | 1,280,363 | | | | 10.39 | % |
| Consumer Staples – 7.22% | | | | | | | | | | | | |
| Coca-Cola Co. | | | 5,300 | | | | 283,285 | | | | 2.30 | % |
| Kraft Foods, Inc. | | | 20,500 | | | | 606,800 | | | | 4.92 | % |
| | | | | | | | 890,085 | | | | 7.22 | % |
| Energy – 5.36% | | | | | | | | | | | | |
| Chevron Corp. | | | 8,100 | | | | 659,664 | | | | 5.36 | % |
| | | | | | | | | | | | | |
| Health Care – 9.70% | | | | | | | | | | | | |
| Johnson & Johnson | | | 900 | | | | 57,870 | | | | 0.47 | % |
| Merck & Co., Inc. | | | 16,200 | | | | 567,648 | | | | 4.61 | % |
| Pfizer, Inc. | | | 34,050 | | | | 569,316 | | | | 4.62 | % |
| | | | | | | | 1,194,834 | | | | 9.70 | % |
| Industrials – 2.72% | | | | | | | | | | | | |
| Boeing Co. | | | 2,000 | | | | 144,860 | | | | 1.17 | % |
| Caterpillar, Inc. | | | 2,800 | | | | 190,652 | | | | 1.55 | % |
| | | | | | | | 335,512 | | | | 2.72 | % |
| Information Technology – 0.76% | | | | | | | | | | | | |
| Intel Corp. | | | 4,100 | | | | 93,603 | | | | 0.76 | % |
| | | | | | | | | | | | | |
| Materials – 5.69% | | | | | | | | | | | | |
| EI Du Pont de Nemours & Co. | | | 17,600 | | | | 701,184 | | | | 5.69 | % |
| | | | | | | | | | | | | |
| Telecommunication Services – 9.73% | | | | | | | | | | | | |
| AT&T, Inc. | | | 23,550 | | | | 613,713 | | | | 4.98 | % |
| Verizon Communications, Inc. | | | 20,250 | | | | 585,022 | | | | 4.75 | % |
| | | | | | | | 1,198,735 | | | | 9.73 | % |
| | | | | | | | | | | | | |
Total Common Stocks (Cost $6,249,264) | | | | | | | 6,353,980 | | | | 51.57 | % |
The accompanying notes are an integral part of these financial statements.
SUMMARY OF INVESTMENTS — HENNESSY BALANCED FUND
| SHORT-TERM INVESTMENTS – 47.94% | | Number | | | | | | % of Net | |
| | | of Shares | | | Value | | | Assets | |
| U.S. Treasury Bills – 45.48% | | | | | | | | | |
| 3.625%, 06/15/2010 | | | 300,000 | | | $ | 301,254 | | | | 2.44 | % |
| 4.125%, 08/15/2010 | | | 1,000,000 | | | | 1,011,367 | | | | 8.21 | % |
| 4.250%, 10/15/2010 | | | 900,000 | | | | 916,312 | | | | 7.44 | % |
| 1.250%, 11/30/2010 | | | 1,100,000 | | | | 1,106,145 | | | | 8.98 | % |
| 4.250%, 01/15/2011 | | | 700,000 | | | | 719,277 | | | | 5.84 | % |
| 5.000%, 02/15/2011 | | | 1,300,000 | | | | 1,347,277 | | | | 10.94 | % |
| 0.875%, 04/30/2011 | | | 200,000 | | | | 200,844 | | | | 1.63 | % |
| | | | | | | | | | | | | |
Total U.S. Treasury Bills (Cost $5,602,434) | | | | | | | 5,602,476 | | | | 45.48 | % |
| Money Market Funds – 2.46% | | | | | | | | | | | | |
| Fidelity Government Portfolio, 0.0400% (a) | | | 303,470 | | | | 303,470 | | | | 2.46 | % |
| | | | | | | | | | | | | |
Total Money Market Funds (Cost $303,470) | | | | | | | 303,470 | | | | 2.46 | % |
| | | | | | | | | | | | | |
| Total Short-Term Investments | | | | | | | | | | | | |
| (Cost $5,905,904) | | | | | | | 5,905,946 | | | | 47.94 | % |
| | | | | | | | | | | | | |
Total Investments – 99.51% | | | | | | | | | | | | |
| (Cost $12,155,168) | | | | | | | 12,259,926 | | | | 99.51 | % |
| | | | | | | | | | | | | |
| Other Assets in Excess of Liabilities – 0.49% | | | | | | | 59,874 | | | | 0.49 | % |
TOTAL NET ASSETS – 100.00% | | | | | | $ | 12,319,800 | | | | 100.00 | % |
| (a) | The rate listed is the Fund’s 7 -day yield as of April 30, 2010. |
The accompanying notes are an integral part of these financial statements.
HENNESSY FUNDS 1-800-966-4354
Summary of Fair Value Exposure at April 30, 2010 (Unaudited)
The Fund has adopted authoritative fair valuation accounting standards which establish an authoritative definition of fair value and set out a hierarchy for measuring fair value. These standards require additional disclosures about the various inputs and valuation techniques used to develop the measurements of fair value and a discussion in changes in valuation techniques and related inputs during the period. These inputs are summarized in the three broad levels listed below.
The Fund has performed an analysis of all existing investments to determine the significance and character of all inputs to their fair value determination.
| Level 1 – | Quoted unadjusted prices for identical instruments in active markets to which the Fund has access at the date of measurement. |
| Level 2 – | Quoted prices for similar instruments in active markets; quoted prices for identical or similar instruments in markets that are not active; and model-derived valuations in which all significant inputs and significant value drivers are observable in active markets. Level 2 inputs are those in markets for which there are few transactions, the prices are not current, little public information exists or instances where prices vary substantially over time or among brokered market makers. |
| Level 3 – | Model derived valuations in which one or more significant inputs or significant value drivers are unobservable. Unobservable inputs are those inputs that reflect the Fund’s own assumptions that market participants would use to price the asset or liability based on the best available information. |
The inputs or methodology used for valuing securities are not an indication of the risk associated with investing in those securities.
The following is a summary of the inputs used to value the Fund’s net assets as of April 30, 2010:
| | | Level 1 | | | Level 2 | | | Level 3 | | | Total | |
| Equity | | | | | | | | | | | | |
| Consumer Discretionary | | $ | 1,280,363 | | | $ | — | | | $ | — | | | $ | 1,280,363 | |
| Consumer Staples | | | 890,085 | | | | — | | | | — | | | | 890,085 | |
| Energy | | | 659,664 | | | | — | | | | — | | | | 659,664 | |
| Health Care | | | 1,194,834 | | | | — | | | | — | | | | 1,194,834 | |
| Industrials | | | 335,512 | | | | — | | | | — | | | | 335,512 | |
| Information Technology | | | 93,603 | | | | — | | | | — | | | | 93,603 | |
| Materials | | | 701,184 | | | | — | | | | — | | | | 701,184 | |
| Telecommunication Services | | | 1,198,735 | | | | — | | | | — | | | | 1,198,735 | |
| Total Equity | | $ | 6,353,980 | | | $ | — | | | $ | — | | | $ | 6,353,980 | |
| Short-Term Investments | | $ | 303,470 | | | $ | 5,602,476 | | | $ | — | | | $ | 5,905,946 | |
| Total Investments in Securities | | $ | 6,657,450 | | | $ | 5,602,476 | | | $ | — | | | $ | 12,259,926 | |
The accompanying notes are an integral part of these financial statements.
SUMMARY OF INVESTMENTS — HENNESSY BALANCED FUND
(This Page Intentionally Left Blank.)
HENNESSY FUNDS 1-800-966-4354
Financial Statements
Statements of Assets and Liabilities as of April 30, 2010 (Unaudited) |
| | | HENNESSY | |
| | | CORNERSTONE | |
| | | GROWTH FUND | |
| ASSETS: | | | |
| Investments in securities, at value (cost $205,298,929, $24,363,907, | | | |
| $123,108,788, $71,748,731, $146,141,698, $69,237,217 and $12,155,168, respectively) | | $ | 240,565,898 | |
| Cash | | | — | |
| Dividends and interest receivable | | | 366,073 | |
| Receivable for fund shares sold | | | 17,589 | |
| Receivable for securities sold | | | — | |
| Prepaid expenses and other assets | | | 22,120 | |
| Total Assets | | | 240,971,680 | |
| | | | | |
| LIABILITIES: | | | | |
| Loan Payable | | | — | |
| Payable for securities purchased | | | 36,489 | |
| Payable for fund shares redeemed | | | 223,600 | |
| Payable to Advisor | | | 149,688 | |
| Payable to Administrator | | | 147,039 | |
| Due to Custodian | | | 73,967 | |
| Reverse repurchase agreement | | | — | |
| Accrued interest payable | | | — | |
| Accrued service fees | | | 19,831 | |
| Accrued expenses and other payables | | | 79,646 | |
| Total Liabilities | | | 730,260 | |
| NET ASSETS | | $ | 240,241,420 | |
| | | | | |
| NET ASSETS CONSIST OF: | | | | |
| Capital stock | | $ | 484,492,078 | |
| Accumulated net investment income (loss) | | | (993,296 | ) |
| Accumulated net realized gain (loss) on investments | | | (278,524,331 | ) |
| Unrealized net appreciation (depreciation) on investments | | | 35,266,969 | |
| Total Net Assets | | $ | 240,241,420 | |
| | | | | |
| NET ASSETS | | | | |
| Original Class: | | | | |
| Shares authorized ($.0001 par value) | | | 25,000,000,000 | |
| Net assets applicable to outstanding Original Class shares | | | 235,542,400 | |
| Shares issued and outstanding | | | 22,229,988 | |
| Net asset value, offering price and redemption price per share | | $ | 10.60 | |
| | | | | |
| Institutional Class: | | | | |
| Shares authorized ($.0001 par value) | | | 25,000,000,000 | |
| Net assets applicable to outstanding Institutional Class shares | | | 4,699,020 | |
| Shares issued and outstanding | | | 440,332 | |
| Net asset value, offering price and redemption price per share | | $ | 10.67 | |
The accompanying notes are an integral part of these financial statements.
FINANCIAL STATEMENTS — STATEMENTS OF ASSETS AND LIABILITIES
| HENNESSY | | | | | | HENNESSY | | | | | | | | | | |
| CORNERSTONE | | | HENNESSY | | | CORNERSTONE | | | HENNESSY | | | HENNESSY | | | HENNESSY | |
| GROWTH FUND, | | | FOCUS 30 | | | LARGE GROWTH | | | CORNERSTONE | | | TOTAL RETURN | | | BALANCED | |
| SERIES II | | | FUND | | | FUND | | | VALUE FUND | | | FUND | | | FUND | |
| | | | | | | | | | | | | | | | | |
| | | | | | | | | | | | | | | | | |
| $ | 34,317,810 | | | $ | 150,355,686 | | | $ | 77,922,881 | | | $ | 159,625,848 | | | $ | 70,814,579 | | | $ | 12,259,926 | |
| | — | | | | — | | | | 2,340 | | | | — | | | | — | | | | — | |
| | 2,007 | | | | 138,218 | | | | 58,655 | | | | 274,300 | | | | 126,723 | | | | 62,918 | |
| | 428 | | | | 99,416 | | | | 4,002 | | | | 4,295 | | | | 1,278 | | | | 31 | |
| | — | | | | — | | | | 58,184,413 | | | | 5,758,359 | | | | — | | | | 77,561 | |
| | 24,791 | | | | 22,759 | | | | 63,441 | | | | 22,510 | | | | 10,706 | | | | 15,139 | |
| | 34,345,036 | | | | 150,616,079 | | | | 136,235,732 | | | | 165,685,312 | | | | 70,953,286 | | | | 12,415,575 | |
| | | | | | | | | | | | | | | | | | | | | | | |
| | — | | | | — | | | | — | | | | 472,000 | | | | — | | | | — | |
| | — | | | | — | | | | 57,591,447 | | | | — | | | | — | | | | 56,074 | |
| | 21,111 | | | | 179,781 | | | | 7,552 | | | | 142,242 | | | | 44,329 | | | | — | |
| | 20,411 | | | | 93,063 | | | | 49,407 | | | | 103,900 | | | | 27,153 | | | | 6,168 | |
| | 19,932 | | | | 84,046 | | | | 47,696 | | | | 98,776 | | | | 34,013 | | | | 7,738 | |
| | — | | | | — | | | | — | | | | 941,000 | | | | — | | | | — | |
| | — | | | | — | | | | — | | | | — | | | | 16,191,000 | | | | — | |
| | — | | | | — | | | | — | | | | — | | | | 5,761 | | | | — | |
| | 2,740 | | | | 10,675 | | | | 6,486 | | | | 13,932 | | | | 4,526 | | | | 1,028 | |
| | 33,107 | | | | 46,567 | | | | 16,025 | | | | 10,198 | | | | 52,112 | | | | 24,767 | |
| | 97,301 | | | | 414,132 | | | | 57,718,613 | | | | 1,782,048 | | | | 16,358,894 | | | | 95,775 | |
| $ | 34,247,735 | | | $ | 150,201,947 | | | $ | 78,517,119 | | | $ | 163,903,264 | | | $ | 54,594,392 | | | $ | 12,319,800 | |
| | | | | | | | | | | | | | | | | | | | | | | |
| $ | 85,266,962 | | | $ | 209,499,816 | | | $ | 71,943,835 | | | $ | 215,553,505 | | | $ | 68,805,793 | | | $ | 14,603,214 | |
| | (131,255 | ) | | | (146,757 | ) | | | 372,538 | | | | 1,300,266 | | | | (76,309 | ) | | | 4,470 | |
| | (60,841,875 | ) | | | (86,398,010 | ) | | | 26,596 | | | | (66,434,657 | ) | | | (15,712,454 | ) | | | (2,392,642 | ) |
| | 9,953,903 | | | | 27,246,898 | | | | 6,174,150 | | | | 13,484,150 | | | | 1,577,362 | | | | 104,758 | |
| $ | 34,247,735 | | | $ | 150,201,947 | | | $ | 78,517,119 | | | $ | 163,903,264 | | | $ | 54,594,392 | | | $ | 12,319,800 | |
| | | | | | | | | | | | | | | | | | | | | | | |
| | | | | | | | | | | | | | | | | | | | | | | |
| Unlimited | | | | 25,000,000,000 | | | Unlimited | | | | 25,000,000,000 | | | | 100,000,000 | | | | 100,000,000 | |
| | 33,942,238 | | | | 127,914,103 | | | | 78,460,173 | | | | 162,629,403 | | | | 54,594,392 | | | | 12,319,800 | |
| | 2,394,084 | | | | 12,066,115 | | | | 7,016,401 | | | | 13,548,701 | | | | 5,427,915 | | | | 1,225,575 | |
| $ | 14.18 | | | $ | 10.60 | | | $ | 11.18 | | | $ | 12.00 | | | $ | 10.06 | | | $ | 10.05 | |
| | | | | | | | | | | | | | | | | | | | | | | |
| Unlimited | | | | 25,000,000,000 | | | Unlimited | | | | 25,000,000,000 | | | | | | | | | |
| | 305,497 | | | | 22,287,844 | | | | 56,946 | | | | 1,273,861 | | | | | | | | | |
| | 21,248 | | | | 2,085,978 | | | | 5,076 | | | | 106,184 | | | | | | | | | |
| $ | 14.38 | | | $ | 10.68 | | | $ | 11.22 | | | $ | 12.00 | | | | | | | | | |
HENNESSY FUNDS 1-800-966-4354
Financial Statements
Statements of Operations Six Months Ended April 30, 2010 (Unaudited) |
| | | | |
| | | HENNESSY | |
| | | CORNERSTONE | |
| | | GROWTH FUND | |
| INVESTMENT INCOME: | | | |
Dividend income(1) | | $ | 576,539 | |
| Interest income | | | 2,216 | |
| Total investment income | | | 578,755 | |
| | | | | |
| EXPENSES: | | | | |
| Investment advisory fees | | | 875,451 | |
| Administration, fund accounting, custody and transfer agent fees | | | 301,676 | |
| Distribution fees – Original Class (See Note 5) | | | — | |
| Service fees – Original Class (See Note 5) | | | 116,038 | |
| Federal and state registration fees | | | 15,062 | |
| Audit fees | | | 12,256 | |
| Legal fees | | | 7,456 | |
| Compliance expense | | | 1,740 | |
| Reports to shareholders | | | 43,398 | |
| Directors’ fees and expenses | | | 5,305 | |
| Sub-transfer agent expenses – Original Class (See Note 5) | | | 180,267 | |
| Sub-transfer agent expenses – Institutional Class (See Note 5) | | | 215 | |
| Interest expense (See Note 3 and 6) | | | — | |
| Other | | | 15,654 | |
| Total expenses before reimbursement from advisor | | | 1,574,518 | |
| Expense recoupment from advisor – Original Class | | | — | |
| Expense reimbursement from advisor – Institutional Class | | | — | |
| Administrative Expense Waiver (See Note 5) | | | (2,467 | ) |
| Net expenses | | | 1,572,051 | |
| NET INVESTMENT INCOME (LOSS) | | $ | (993,296 | ) |
| | | | | |
| REALIZED AND UNREALIZED GAINS (LOSSES): | | | | |
| Net realized gain (loss) on: | | | | |
| Unaffiliated investments | | $ | 13,948,137 | |
| Affiliated investments | | | — | |
| Change in unrealized appreciation (depreciation) on investments | | | 31,000,866 | |
| Net gain (loss) on investments | | | 44,949,003 | |
| NET INCREASE (DECREASE) IN NET ASSETS RESULTING FROM OPERATIONS | | $ | 43,955,707 | |
| (1) | Net of foreign taxes withheld of $7,561, $0, $0, $0, $55,933, $0 and $0, respectively. |
The accompanying notes are an integral part of these financial statements.
FINANCIAL STATEMENTS — STATEMENTS OF OPERATIONS
| HENNESSY | | | | | | HENNESSY | | | | | | | | | | |
| CORNERSTONE | | | HENNESSY | | | CORNERSTONE | | | HENNESSY | | | HENNESSY | | | HENNESSY | |
| GROWTH FUND, | | | FOCUS 30 | | | LARGE GROWTH | | | CORNERSTONE | | | TOTAL RETURN | | | BALANCED | |
| SERIES II | | | FUND | | | FUND | | | VALUE FUND | | | FUND | | | FUND | |
| | | | | | | | | | | | | | | | | |
| $ | 125,428 | | | $ | 864,137 | | | $ | 854,759 | | | $ | 2,432,043 | | | $ | 775,839 | | | $ | 105,559 | |
| | 438 | | | | 1,455 | | | | 501 | | | | 1,158 | | | | 13,740 | | | | 10,224 | |
| | 125,866 | | | | 865,592 | | | | 855,260 | | | | 2,433,201 | | | | 789,579 | | | | 115,783 | |
| | | | | | | | | | | | | | | | | | | | | | | |
| | | | | | | | | | | | | | | | | | | | | | | |
| | 117,136 | | | | 566,571 | | | | 274,853 | | | | 582,131 | | | | 161,378 | | | | 36,524 | |
| | 40,364 | | | | 195,237 | | | | 94,713 | | | | 200,599 | | | | 68,586 | | | | 15,523 | |
| | — | | | | — | | | | — | | | | — | | | | 40,345 | | | | 9,131 | |
| | 15,690 | | | | 63,271 | | | | 37,118 | | | | 78,055 | | | | 26,896 | | | | 6,087 | |
| | 16,270 | | | | 18,017 | | | | 20,392 | | | | 14,797 | | | | 8,996 | | | | 9,945 | |
| | 10,465 | | | | 9,592 | | | | 11,893 | | | | 10,826 | | | | 10,074 | | | | 10,069 | |
| | 7,439 | | | | 6,206 | | | | 5,950 | | | | 6,206 | | | | 4,965 | | | | 4,960 | |
| | 1,740 | | | | 1,740 | | | | 1,740 | | | | 1,740 | | | | 1,740 | | | | 1,740 | |
| | 7,458 | | | | 24,740 | | | | 6,199 | | | | 13,927 | | | | 5,202 | | | | 1,339 | |
| | 5,256 | | | | 5,306 | | | | 4,959 | | | | 5,058 | | | | 3,969 | | | | 3,720 | |
| | 28,812 | | | | 123,492 | | | | 7,424 | | | | 65,450 | | | | — | | | | — | |
| | 118 | | | | 6,869 | | | | — | | | | 91 | | | | — | | | | — | |
| | — | | | | 904 | | | | — | | | | 43 | | | | 14,961 | | | | — | |
| | 7,001 | | | | 12,651 | | | | 6,979 | | | | 7,602 | | | | 4,357 | | | | 1,369 | |
| | 257,749 | | | | 1,034,596 | | | | 472,220 | | | | 986,525 | | | | 351,469 | | | | 100,407 | |
| | — | | | | — | | | | 10,544 | | | | — | | | | — | | | | — | |
| | (273 | ) | | | — | | | | — | | | | — | | | | — | | | | — | |
| | (355 | ) | | | (22,247 | ) | | | (42 | ) | | | (652 | ) | | | — | | | | — | |
| | 257,121 | | | | 1,012,349 | | | | 482,722 | | | | 985,873 | | | | 351,469 | | | | 100,407 | |
| $ | (131,255 | ) | | $ | (146,757 | ) | | $ | 372,538 | | | $ | 1,447,328 | | | $ | 438,110 | | | $ | 15,376 | |
| | | | | | | | | | | | | | | | | | | | | | | |
| | | | | | | | | | | | | | | | | | | | | | | |
| | | | | | | | | | | | | | | | | | | | | | | |
| $ | 557,933 | | | $ | 2,716,693 | | | $ | 21,469,092 | | | $ | 18,863,775 | | | $ | 3,667,571 | | | $ | 1,125,462 | |
| | — | | | | — | | | | — | | | | 166,409 | | | | — | | | | — | |
| | 7,455,777 | | | | 27,305,435 | | | | (9,344,708 | ) | | | 1,495,283 | | | | 1,926,383 | | | | (424,621 | ) |
| | 8,013,710 | | | | 30,022,128 | | | | 12,124,384 | | | | 20,525,467 | | | | 5,593,954 | | | | 700,841 | |
| $ | 7,882,455 | | | $ | 29,875,371 | | | $ | 12,496,922 | | | $ | 21,972,795 | | | $ | 6,032,064 | | | $ | 716,217 | |
HENNESSY FUNDS 1-800-966-4354
Financial Statements
| Statements of Changes in Net Assets |
| | | Hennessy Cornerstone Growth Fund | |
| | | Six Months Ended | | | | |
| | | April 30, 2010 | | | Year Ended | |
| | | (Unaudited) | | | October 31, 2009 | |
| OPERATIONS: | | | | | | |
| Net investment income (loss) | | $ | (993,296 | ) | | $ | (1,059,159 | ) |
| Net realized gain (loss) on securities | | | 13,948,137 | | | | (175,588,612 | ) |
| Change in unrealized appreciation (depreciation) on securities | | | 31,000,866 | | | | 171,339,271 | |
| Net increase (decrease) in net assets resulting from operations | | | 43,955,707 | | | | (5,308,500 | ) |
| | | | | | | | | |
| DISTRIBUTIONS TO SHAREHOLDERS FROM: | | | | | | | | |
| Net investment income – Original Class | | | — | | | | — | |
| Net investment income – Institutional Class | | | — | | | | — | |
| Net realized gains – Original Class | | | — | | | | — | |
| Net realized gains – Institutional Class | | | — | | | | — | |
| Total distributions | | | — | | | | — | |
| | | | | | | | | |
| CAPITAL SHARE TRANSACTIONS: | | | | | | | | |
| Proceeds from shares subscribed – Original Class | | | 3,883,666 | | | | 13,769,357 | |
| Proceeds from shares subscribed – Institutional Class | | | 76,163 | | | | 135,313 | |
| Dividends reinvested – Original Class | | | — | | | | — | |
| Dividends reinvested – Institutional Class | | | — | | | | — | |
| Cost of shares redeemed – Original Class | | | (40,389,596 | ) | | | (92,048,170 | ) |
| Cost of shares redeemed – Institutional Class | | | (922,873 | ) | | | (498,966 | ) |
| Net increase (decrease) in net assets | | | | | | | | |
| derived from capital share transactions | | | (37,352,640 | ) | | | (78,642,466 | ) |
| TOTAL INCREASE (DECREASE) IN NET ASSETS | | | 6,603,067 | | | | (83,950,966 | ) |
| | | | | | | | | |
| NET ASSETS: | | | | | | | | |
| Beginning of period | | | 233,638,353 | | | | 317,589,319 | |
| End of period | | $ | 240,241,420 | | | $ | 233,638,353 | |
| Accumulated net investment income (loss), end of period | | $ | (993,296 | ) | | $ | — | |
| | | | | | | | | |
| CHANGES IN SHARES OUTSTANDING: | | | | | | | | |
| Shares sold – Original Class | | | 395,601 | | | | 1,670,446 | |
| Shares sold – Institutional Class | | | 7,153 | | | | 16,333 | |
| Shares issued to holders as reinvestment of dividends | | | | | | | | |
| Original Class | | | — | | | | — | |
| Institutional Class | | | — | | | | — | |
| Shares redeemed – Original Class | | | (4,140,607 | ) | | | (11,189,297 | ) |
| Shares redeemed – Institutional Class | | | (94,775 | ) | | | (65,345 | ) |
| Net increase (decrease) in shares outstanding | | | (3,832,628 | ) | | | (9,567,863 | ) |
The accompanying notes are an integral part of these financial statements.
FINANCIAL STATEMENTS — STATEMENTS OF CHANGES IN NET ASSETS
Hennessy Cornerstone Growth Fund, Series II | | | Hennessy Focus 30 Fund | |
| Six Months Ended | | | | | | Six Months Ended | | | | |
| April 30, 2010 | | | Year Ended | | | April 30, 2010 | | | Year Ended | |
| (Unaudited) | | | October 31, 2009 | | | (Unaudited) | | | October 31, 2009 | |
| | | | | | | | | | | |
| $ | (131,255 | ) | | $ | (130,836 | ) | | $ | (146,757 | ) | | $ | (225,481 | ) |
| | 557,933 | | | | (25,002,829 | ) | | | 2,716,693 | | | | (41,135,146 | ) |
| | 7,455,777 | | | | 26,641,700 | | | | 27,305,435 | | | | 51,687,206 | |
| | 7,882,455 | | | | 1,508,035 | | | | 29,875,371 | | | | 10,326,579 | |
| | | | | | | | | | | | | | | |
| | — | | | | — | | | | — | | | | — | |
| | — | | | | — | | | | — | | | | — | |
| | — | | | | — | | | | — | | | | — | |
| | — | | | | — | | | | — | | | | — | |
| | — | | | | — | | | | — | | | | — | |
| | | | | | | | | | | | | | | |
| | 628,845 | | | | 884,541 | | | | 5,143,348 | | | | 28,044,578 | |
| | 5,895 | | | | 229,027 | | | | 1,079,094 | | | | 3,182,769 | |
| | — | | | | — | | | | — | | | | — | |
| | — | | | | — | | | | — | | | | — | |
| | (4,311,817 | ) | | | (8,829,446 | ) | | | (30,501,142 | ) | | | (75,221,408 | ) |
| | (55,306 | ) | | | (21,810 | ) | | | (11,192,198 | ) | | | (4,641,964 | ) |
| | | | | | | | | | | | | | | |
| | (3,732,383 | ) | | | (7,737,688 | ) | | | (35,470,898 | ) | | | (48,636,025 | ) |
| | 4,150,072 | | | | (6,229,653 | ) | | | (5,595,527 | ) | | | (38,309,446 | ) |
| | | | | | | | | | | | | | | |
| | | | | | | | | | | | | | | |
| | 30,097,663 | | | | 36,327,316 | | | | 155,797,474 | | | | 194,106,920 | |
| $ | 34,247,735 | | | $ | 30,097,663 | | | $ | 150,201,947 | | | $ | 155,797,474 | |
| $ | (131,255 | ) | | $ | — | | | $ | (146,757 | ) | | $ | — | |
| | | | | | | | | | | | | | | |
| | 49,448 | | | | 90,535 | | | | 520,277 | | | | 3,800,184 | |
| | 476 | | | | 21,589 | | | | 112,283 | | | | 412,433 | |
| | | | | | | | | | | | | | | |
| | — | | | | — | | | | — | | | | — | |
| | — | | | | — | | | | — | | | | — | |
| | (344,238 | ) | | | (904,443 | ) | | | (3,162,340 | ) | | | (9,945,713 | ) |
| | (4,542 | ) | | | (2,266 | ) | | | (1,152,422 | ) | | | (619,087 | ) |
| | (298,856 | ) | | | (794,585 | ) | | | (3,682,202 | ) | | | (6,352,183 | ) |
HENNESSY FUNDS 1-800-966-4354
Financial Statements
| Statements of Changes in Net Assets |
| | |
| | |
| | |
| | |
| | |
| | |
| OPERATIONS: | |
| Net investment income (loss) | |
| Net realized gain (loss) on securities | |
| Change in unrealized appreciation (depreciation) on securities | |
Net increase (decrease) in net assets resulting from operations | |
| | |
| DISTRIBUTIONS TO SHAREHOLDERS FROM: | |
| Net investment income – Original Class | |
| Net investment income – Institutional Class | |
| Net realized gains – Original Class | |
| Net realized gains – Institutional Class | |
| Total distributions | |
| | |
| CAPITAL SHARE TRANSACTIONS: | |
| Proceeds from shares issued in the reorganization (See Note 8) | |
| Proceeds from shares subscribed – Original Class | |
| Proceeds from shares subscribed – Institutional Class | |
| Proceeds from shares subscribed – Predecessor Class A | |
| Proceeds from shares subscribed – Predecessor Class I | |
| Proceeds from shares subscribed – Predecessor Class C | |
| Proceeds from shares subscribed – Predecessor Class S | |
| Dividends reinvested – Original Class | |
| Dividends reinvested – Institutional Class | |
| Cost of shares redeemed – Original Class | |
| Cost of shares redeemed – Institutional Class | |
| Cost of shares redeemed – Predecessor Class A | |
| Cost of shares redeemed – Predecessor Class I | |
| Cost of shares redeemed – Predecessor Class C | |
| Cost of shares redeemed – Predecessor Class R | |
| Cost of shares redeemed – Predecessor Class S | |
| Cost of shares redeemed in the reorganization – Predecessor Class A (See Note 8) | |
| Cost of shares redeemed in the reorganization – Predecessor Class I (See Note 8) | |
| Cost of shares redeemed in the reorganization – Predecessor Class C (See Note 8) | |
| Cost of shares redeemed in the reorganization – Predecessor Class R (See Note 8) | |
| Cost of shares redeemed in the reorganization – Predecessor Class S (See Note 8) | |
| Net increase (decrease) in net assets derived from capital share transactions | |
| | |
| TOTAL INCREASE (DECREASE) IN NET ASSETS | |
| NET ASSETS: | |
| Beginning of period | |
| End of period | |
| | |
| Accumulated net investment income (loss), end of period | |
| * | For the one month period ended October 31, 2009. Effective October 31, 2009, the Fund changed its fiscal year end to October 31st from September 30th. |
The accompanying notes are an integral part of these financial statements.
FINANCIAL STATEMENTS — STATEMENTS OF CHANGES IN NET ASSETS
Hennessy Cornerstone Large Growth Fund | |
| Six Months Ended | | | | | | | |
| April 30, 2010 | | | One Month Ended | | | Year Ended | |
| (Unaudited) | | | October 31, 2009* | | | September 30, 2009 | |
| | | | | | | | |
| $ | 372,538 | | | $ | (3,301 | ) | | $ | 356,226 | |
| | 21,469,092 | | | | 810,847 | | | | (21,384,860 | ) |
| | (9,344,708 | ) | | | (1,552,441 | ) | | | 14,850,433 | |
| | 12,496,922 | | | | (744,895 | ) | | | (6,178,201 | ) |
| | | | | | | | | | | |
| | (358,186 | ) | | | — | | | | — | |
| | (235 | ) | | | — | | | | — | |
| | — | | | | — | | | | — | |
| | — | | | | — | | | | — | |
| | (358,421 | ) | | | — | | | | — | |
| | | | | | | | | | | |
| | — | | | | — | | | | 51,980,253 | |
| | 664,730 | | | | 92,349 | | | | 399,858 | |
| | 14,036 | | | | 914 | | | | 30,524 | |
| | — | | | | — | | | | 354,913 | |
| | — | | | | — | | | | 1,450 | |
| | — | | | | — | | | | — | |
| | — | | | | — | | | | 226,710 | |
| | 322,821 | | | | — | | | | — | |
| | 235 | | | | — | | | | — | |
| | (4,070,505 | ) | | | (549,997 | ) | | | (3,502,412 | ) |
| | (2,812 | ) | | | — | | | | — | |
| | — | | | | — | | | | (394,647 | ) |
| | — | | | | — | | | | (103,571 | ) |
| | — | | | | — | | | | (1,916 | ) |
| | — | | | | — | | | | (1,961 | ) |
| | — | | | | — | | | | (4,936,283 | ) |
| | — | | | | — | | | | (2,045,574 | ) |
| | — | | | | — | | | | (293,648 | ) |
| | — | | | | — | | | | (81,763 | ) |
| | — | | | | — | | | | (3,654 | ) |
| | — | | | | — | | | | (49,555,614 | ) |
| | (3,071,495 | ) | | | (456,734 | ) | | | (7,927,335 | ) |
| | 9,067,006 | | | | (1,201,629 | ) | | | (14,105,536 | ) |
| | | | | | | | | | | |
| | 69,450,113 | | | | 70,651,742 | | | | 84,757,278 | |
| $ | 78,517,119 | | | $ | 69,450,113 | | | $ | 70,651,742 | |
| $ | 372,538 | | | $ | 358,421 | | | $ | 358,421 | |
HENNESSY FUNDS 1-800-966-4354
Financial Statements
| Statements of Changes in Net Assets |
| |
| |
| |
| |
| |
| |
| CHANGES IN SHARES OUTSTANDING: |
| Shares issued in connection with reorganization |
| Shares sold – Original Class |
| Shares sold – Institutional Class |
| Shares sold – Predecessor Class A |
| Shares sold – Predecessor Class I |
| Shares sold – Predecessor Class C |
| Shares sold – Predecessor Class S |
| Shares issued to holders as reinvestment of dividends – Original Class |
| Shares issued to holders as reinvestment of dividends – Institutional Class |
| Shares redeemed – Original Class |
| Shares redeemed – Institutional Class |
| Shares redeemed – Predecessor Class A |
| Shares redeemed – Predecessor Class I |
| Shares redeemed – Predecessor Class C |
| Shares redeemed – Predecessor Class R |
| Shares redeemed – Predecessor Class S |
| Shares redeemed in the reorganization – Predecessor Class A |
| Shares redeemed in the reorganization – Predecessor Class I |
| Shares redeemed in the reorganization – Predecessor Class C |
| Shares redeemed in the reorganization – Predecessor Class R |
| Shares redeemed in the reorganization – Predecessor Class S |
| |
| Net increase (decrease) in shares outstanding |
| * | For the one month period ended October 31, 2009. Effective October 31, 2009, the Fund changed its fiscal year end to October 31st from September 30th. |
The accompanying notes are an integral part of these financial statements.
FINANCIAL STATEMENTS — STATEMENTS OF CHANGES IN NET ASSETS
Hennessy Cornerstone Large Growth Fund | |
| Six Months Ended | | | | | | | |
| April 30, 2010 | | | One Month Ended | | | Year Ended | |
| (Unaudited) | | | October 31, 2009* | | | September 30, 2009 | |
| | | | | | | | |
| | — | | | | — | | | | 7,722,854 | |
| | 63,738 | | | | 9,537 | | | | 47,603 | |
| | 1,365 | | | | 93 | | | | 3,873 | |
| | — | | | | — | | | | 49,665 | |
| | — | | | | — | | | | 198 | |
| | — | | | | — | | | | — | |
| | — | | | | — | | | | 30,610 | |
| | 31,251 | | | | — | | | | — | |
| | 23 | | | | — | | | | — | |
| | (389,251 | ) | | | (55,752 | ) | | | (413,579 | ) |
| | (278 | ) | | | — | | | | — | |
| | — | | | | — | | | | (55,087 | ) |
| | — | | | | — | | | | (14,533 | ) |
| | — | | | | — | | | | (317 | ) |
| | — | | | | — | | | | (316 | ) |
| | — | | | | — | | | | (685,035 | ) |
| | — | | | | — | | | | (309,689 | ) |
| | — | | | | — | | | | (43,625 | ) |
| | — | | | | — | | | | (12,829 | ) |
| | — | | | | — | | | | (560 | ) |
| | — | | | | — | | | | (7,362,580 | ) |
| | (293,152 | ) | | | (46,122 | ) | | | (1,043,347 | ) |
HENNESSY FUNDS 1-800-966-4354
Financial Statements
| Statements of Changes in Net Assets |
| | | Hennessy Cornerstone Value Fund | |
| | | Six Months Ended | | | | |
| | | April 30, 2010 | | | Year Ended | |
| | | (Unaudited) | | | October 31, 2009 | |
| OPERATIONS: | | | | | | |
| Net investment income (loss) | | $ | 1,447,328 | | | $ | 3,055,816 | |
| Net realized gain (loss) on securities | | | 19,030,184 | | | | (56,656,130 | ) |
| Change in unrealized appreciation (depreciation) on securities | | | 1,495,283 | | | | 74,246,459 | |
| Net increase (decrease) in net assets resulting from operations | | | 21,972,795 | | | | 20,646,145 | |
| | | | | | | | | |
| DISTRIBUTIONS TO SHAREHOLDERS FROM: | | | | | | | | |
| Net investment income – Original Class | | | (2,734,232 | ) | | | (5,597,237 | ) |
| Net investment income – Institutional Class | | | (23,987 | ) | | | (55,214 | ) |
| Net realized gains – Original Class | | | — | | | | — | |
| Net realized gains – Institutional Class | | | — | | | | — | |
| Total distributions | | | (2,758,219 | ) | | | (5,652,451 | ) |
| | | | | | | | | |
| CAPITAL SHARE TRANSACTIONS: | | | | | | | | |
| Proceeds from shares subscribed – Original Class | | | 25,411,399 | | | | 43,322,159 | |
| Proceeds from shares subscribed – Institutional Class | | | 65,424 | | | | 39,402 | |
| Dividends reinvested – Original Class | | | 2,464,535 | | | | 4,981,771 | |
| Dividends reinvested – Institutional Class | | | 14,974 | | | | 33,372 | |
| Cost of shares redeemed – Original Class | | | (30,220,715 | ) | | | (14,327,901 | ) |
| Cost of shares redeemed – Institutional Class | | | (58,696 | ) | | | (10,708 | ) |
| Net increase (decrease) in net assets | | | | | | | | |
| derived from capital share transactions | | | (2,323,079 | ) | | | 34,038,095 | |
| | | | | | | | | |
| TOTAL INCREASE (DECREASE) IN NET ASSETS | | | 16,891,497 | | | | 49,031,789 | |
| | | | | | | | | |
| NET ASSETS: | | | | | | | | |
| Beginning of period | | | 147,011,767 | | | | 97,979,978 | |
| End of period | | $ | 163,903,264 | | | $ | 147,011,767 | |
| | | | | | | | | |
| Accumulated net investment income (loss), end of period | | $ | 1,300,266 | | | $ | 2,611,157 | |
The accompanying notes are an integral part of these financial statements.
FINANCIAL STATEMENTS — STATEMENTS OF CHANGES IN NET ASSETS
| Hennessy Total Return Fund | | | Hennessy Balanced Fund | |
| Six Months Ended | | | | | | Six Months Ended | | | | |
| April 30, 2010 | | | Year Ended | | | April 30, 2010 | | | Year Ended | |
| (Unaudited) | | | October 31, 2009 | | | (Unaudited) | | | October 31, 2009 | |
| | | | | | | | | | | |
| $ | 438,110 | | | $ | 1,043,226 | | | $ | 15,376 | | | $ | 123,592 | |
| | 3,667,571 | | | | (17,884,613 | ) | | | 1,125,462 | | | | (2,906,301 | ) |
| | 1,926,383 | | | | 16,495,364 | | �� | | (424,621 | ) | | | 3,283,017 | |
| | 6,032,064 | | | | (346,023 | ) | | | 716,217 | | | | 500,308 | |
| | | | | | | | | | | | | | | |
| | (601,289 | ) | | | (956,356 | ) | | | (15,813 | ) | | | (138,030 | ) |
| | N/A | | | | N/A | | | | N/A | | | | N/A | |
| | — | | | | — | | | | — | | | | — | |
| | N/A | | | | N/A | | | | N/A | | | | N/A | |
| | (601,289 | ) | | | (956,356 | ) | | | (15,813 | ) | | | (138,030 | ) |
| | | | | | | | | | | | | | | |
| | 1,284,159 | | | | 657,981 | | | | 759,455 | | | | 795,947 | |
| | N/A | | | | N/A | | | | N/A | | | | N/A | |
| | 554,393 | | | | 884,126 | | | | 15,406 | | | | 134,495 | |
| | N/A | | | | N/A | | | | N/A | | | | N/A | |
| | (5,054,617 | ) | | | (6,082,697 | ) | | | (626,548 | ) | | | (1,280,181 | ) |
| | N/A | | | | N/A | | | | N/A | | | | N/A | |
| | | | | | | | | | | | | | | |
| | (3,216,065 | ) | | | (4,540,590 | ) | | | 148,313 | | | | (349,739 | ) |
| | | | | | | | | | | | | | | |
| | 2,214,710 | | | | (5,842,969 | ) | | | 848,717 | | | | 12,539 | |
| | | | | | | | | | | | | | | |
| | | | | | | | | | | | | | | |
| | 52,379,682 | | | | 58,222,651 | | | | 11,471,083 | | | | 11,458,544 | |
| $ | 54,594,392 | | | $ | 52,379,682 | | | $ | 12,319,800 | | | $ | 11,471,083 | |
| | | | | | | | | | | | | | | |
| $ | (76,309 | ) | | $ | 86,870 | | | $ | 4,470 | | | $ | 4,907 | |
HENNESSY FUNDS 1-800-966-4354
Financial Statements
| Statements of Changes in Net Assets |
| | | Hennessy Cornerstone Value Fund | |
| | | Six Months Ended | | | | |
| | | April 30, 2010 | | | Year Ended | |
| | | (Unaudited) | | | October 31, 2009 | |
| CHANGES IN SHARES OUTSTANDING: | | | | | | |
| Shares sold | | | | | | |
| Original Class | | | 2,208,667 | | | | 4,111,585 | |
| Institutional Class | | | 5,786 | | | | 4,670 | |
| Shares issued to holders as reinvestment of dividends | | | | | | | | |
| Original Class | | | 216,187 | | | | 638,689 | |
| Institutional Class | | | 1,315 | | | | 4,290 | |
| Shares redeemed | | | | | | | | |
| Original Class | | | (2,605,596 | ) | | | (1,749,104 | ) |
| Institutional Class | | | (4,996 | ) | | | (1,328 | ) |
| Net increase (decrease) in shares outstanding | | | (178,637 | ) | | | 3,008,802 | |
The accompanying notes are an integral part of these financial statements.
FINANCIAL STATEMENTS — STATEMENTS OF CHANGES IN NET ASSETS
| Hennessy Total Return Fund | | | Hennessy Balanced Fund | |
| Six Months Ended | | | | | | Six Months Ended | | | | |
| April 30, 2010 | | | Year Ended | | | April 30, 2010 | | | Year Ended | |
| (Unaudited) | | | October 31, 2009 | | | (Unaudited) | | | October 31, 2009 | |
| | | | | | | | | | | |
| | | | | | | | | | | |
| | 131,479 | | | | 79,969 | | | | 76,666 | | | | 91,298 | |
| | N/A | | | | N/A | | | | N/A | | | | N/A | |
| | | | | | | | | | | | | | | |
| | 55,865 | | | | 110,321 | | | | 1,544 | | | | 16,328 | |
| | N/A | | | | N/A | | | | N/A | | | | N/A | |
| | | | | | | | | | | | | | | |
| | (517,368 | ) | | | (746,373 | ) | | | (62,892 | ) | | | (155,366 | ) |
| | N/A | | | | N/A | | | | N/A | | | | N/A | |
| | (330,024 | ) | | | (556,083 | ) | | | 15,318 | | | | (47,740 | ) |
HENNESSY FUNDS 1-800-966-4354
Financial Highlights
| Hennessy Cornerstone Growth Fund |
For an Original Class share outstanding throughout each period
| | | Six Months | |
| | | Ended | |
| | | April 30, 2010 | |
| | | (Unaudited) | |
| PER SHARE DATA: | | | |
| Net asset value, beginning of period | | $ | 8.81 | |
| | | | | |
| Income from investment operations: | | | | |
| Net investment gain (loss) | | | (0.04 | ) |
| Net realized and unrealized gains (losses) on securities | | | 1.83 | |
| Total from investment operations | | | 1.79 | |
| | | | | |
| Less Distributions: | | | | |
| Dividends from net investment income | | | — | |
| Dividends from net realized gains | | | — | |
| Total distributions | | | — | |
Redemption fees retained(1) | | | — | |
| Net asset value, end of period | | $ | 10.60 | |
| | | | | |
| TOTAL RETURN | | | 20.32 | %(2) |
| | | | | |
| SUPPLEMENTAL DATA AND RATIOS: | | | | |
| Net assets, end of period (millions) | | $ | 235.54 | |
| Ratio of expenses to average net assets: | | | 1.34 | %(3) |
| Ratio of net investment income to average net assets | | | (0.42 | )%(3) |
Portfolio turnover rate(4) | | | 97 | %(2) |
| (1) | Amount is less than $0.01. |
| (4) | Portfolio turnover is calculated on the basis of the Fund as a whole. |
The accompanying notes are an integral part of these financial statements.
FINANCIAL HIGHLIGHTS — HENNESSY CORNERSTONE GROWTH FUND
| Year Ended October 31, | |
| 2009 | | | 2008 | | | 2007 | | | 2006 | | | 2005 | |
| | | | | | | | | | | | | | |
| $ | 8.80 | | | $ | 19.41 | | | $ | 20.77 | | | $ | 19.49 | | | $ | 19.38 | |
| | | | | | | | | | | | | | | | | | | |
| | | | | | | | | | | | | | | | | | | |
| | (0.04 | ) | | | (0.05 | ) | | | (0.07 | ) | | | (0.04 | ) | | | (0.14 | ) |
| | 0.05 | | | | (8.32 | ) | | | 1.82 | | | | 2.55 | | | | 4.13 | |
| | 0.01 | | | | (8.37 | ) | | | 1.75 | | | | 2.51 | | | | 3.99 | |
| | | | | | | | | | | | | | | | | | | |
| | | | | | | | | | | | | | | | | | | |
| | — | | | | — | | | | — | | | | — | | | | — | |
| | — | | | | (2.24 | ) | | | (3.11 | ) | | | (1.23 | ) | | | (3.88 | ) |
| | — | | | | (2.24 | ) | | | (3.11 | ) | | | (1.23 | ) | | | (3.88 | ) |
| | — | | | | — | | | | — | | | | — | | | | — | |
| $ | 8.81 | | | $ | 8.80 | | | $ | 19.41 | | | $ | 20.77 | | | $ | 19.49 | |
| | | | | | | | | | | | | | | | | | | |
| | 0.11 | % | | | (48.00 | )% | | | 9.65 | % | | | 13.59 | % | | | 23.17 | % |
| | | | | | | | | | | | | | | | | | | |
| | | | | | | | | | | | | | | | | | | |
| $ | 228.96 | | | $ | 312.50 | | | $ | 990.43 | | | $ | 1,250.67 | | | $ | 1,071.78 | |
| | 1.36 | % | | | 1.25 | % | | | 1.20 | % | | | 1.21 | % | | | 1.23 | % |
| | (0.42 | )% | | | (0.29 | )% | | | (0.32 | )% | | | (0.20 | )% | | | (0.78 | )% |
| | 108 | % | | | 103 | % | | | 97 | % | | | 90 | % | | | 89 | % |
HENNESSY FUNDS 1-800-966-4354
Financial Highlights
| Hennessy Cornerstone Growth Fund |
For an Institutional Class share outstanding throughout each period
| | | Six Months | |
| | | Ended | |
| | | April 30, 2010 | |
| | | (Unaudited) | |
| PER SHARE DATA: | | | |
| Net asset value, beginning of period | | $ | 8.86 | |
| | | | | |
| Income from investment operations: | | | | |
| Net investment gain (loss) | | | (0.03 | ) |
| Net realized and unrealized gains (losses) on securities | | | 1.84 | |
| Total from investment operations | | | 1.81 | |
| | | | | |
| Less Distributions: | | | | |
| Dividends from net investment income | | | — | |
| Dividends from net realized gains | | | — | |
| Total distributions | | | — | |
Redemption fees retained(2) | | | — | |
| Net asset value, end of period | | $ | 10.67 | |
| | | | | |
| TOTAL RETURN | | | 20.43 | %(3) |
| | | | | |
| SUPPLEMENTAL DATA AND RATIOS: | | | | |
| Net assets, end of period (millions) | | $ | 4.70 | |
| Ratio of expenses to average net assets: | | | | |
| Before expense reimbursement | | | 1.09 | %(4) |
After expense reimbursement(5) | | | 0.98 | %(4) |
| Ratio of net investment income to average net assets | | | | |
| Before expense reimbursement | | | (0.60 | )%(4) |
After expense reimbursement(5) | | | (0.49 | )%(4) |
Portfolio turnover rate(6) | | | 97 | %(3) |
| (1) | Institutional Class shares commenced operations on March 3, 2008. |
| (2) | Amount is less than $0.01. |
| (5) | The Advisor has agreed to reimburse expenses in order to cap the Institutional Class share expenses. Please refer to Note 5 for more information. |
| (6) | Portfolio turnover is calculated on the basis of the Fund as a whole. |
The accompanying notes are an integral part of these financial statements.
FINANCIAL HIGHLIGHTS — HENNESSY CORNERSTONE GROWTH FUND
| | | | | |
| Year Ended October 31, | |
| 2009 | | | 2008(1) | |
| | | | | |
| $ | 8.82 | | | $ | 13.29 | |
| | | | | | | |
| | | | | | | |
| | — | | | | 0.01 | |
| | 0.04 | | | | (4.48 | ) |
| | 0.04 | | | | (4.47 | ) |
| | | | | | | |
| | | | | | | |
| | — | | | | — | |
| | — | | | | — | |
| | — | | | | — | |
| | — | | | | — | |
| $ | 8.86 | | | $ | 8.82 | |
| | | | | | | |
| | 0.45 | % | | | (34.13 | )%(3) |
| | | | | | | |
| | | | | | | |
| $ | 4.68 | | | $ | 5.09 | |
| | | | | | | |
| | 1.11 | % | | | 1.12 | %(4) |
| | 0.98 | % | | | 0.98 | %(4) |
| | | | | | | |
| | (0.17 | )% | | | 0.15 | %(4) |
| | (0.04 | )% | | | 0.29 | %(4) |
| | 108 | % | | | 103 | %(3) |
HENNESSY FUNDS 1-800-966-4354
Financial Highlights
| Hennessy Cornerstone Growth Fund, Series II |
For an Original Class share outstanding throughout each period
| | | Six Months | |
| | | Ended | |
| | | April 30, 2010 | |
| | | (Unaudited) | |
| PER SHARE DATA: | | | |
| Net asset value, beginning of period | | $ | 11.09 | |
| | | | | |
| Income from investment operations: | | | | |
| Net investment gain (loss) | | | (0.05 | ) |
| Net realized and unrealized gains (losses) on securities | | | 3.14 | |
| Total from investment operations | | | 3.09 | |
| | | | | |
| Less Distributions: | | | | |
| Dividends from net investment income | | | — | |
| Dividends from net realized gains | | | — | |
| Total distributions | | | — | |
Redemption fees retained(4) | | | — | |
| Net asset value, end of period | | $ | 14.18 | |
| | | | | |
| TOTAL RETURN | | | 27.86 | %(5) |
| | | | | |
| SUPPLEMENTAL DATA AND RATIOS: | | | | |
| Net assets, end of period (millions) | | $ | 33.94 | |
| Ratio of expenses to average net assets | | | 1.63 | %(6) |
| Ratio of net investment income to average net assets | | | (0.83 | )%(6) |
Portfolio turnover rate(7) | | | 0 | %(5) |
| (1) | For the four months ended October 31, 2006. Effective October 31, 2006 the Fund changed its fiscal year end to October 31st from June 30th. |
| (2) | The financial highlights set forth herein include the historical highlights of The Henlopen Fund. On July 1, 2005 Hennessy Advisors, Inc. became the investment advisor to the Fund and the Fund changed its name from “The Henlopen Fund” to Hennessy Cornerstone Growth Fund, Series II. |
| (3) | Net investment loss per share is calculated using average shares outstanding. |
| (4) | Amount is less than $0.01. |
| (7) | Portfolio turnover is calculated on the basis of the Fund as a whole. |
The accompanying notes are an integral part of these financial statements.
FINANCIAL HIGHLIGHTS — HENNESSY CORNERSTONE GROWTH FUND, SERIES II
| | | | | | | | | | Period Ended | | | | | | | |
| Year Ended October 31, | | | October 31, | | | Year Ended June 30, | |
| 2009 | | | 2008 | | | 2007 | | | 2006(1) | | | 2006 | | | 2005(2) | |
| | | | | | | | | | | | | | | | | |
| $ | 10.35 | | | $ | 30.32 | | | $ | 30.75 | | | $ | 32.19 | | | $ | 31.29 | | | $ | 27.69 | |
| | | | | | | | | | | | | | | | | | | | | | | |
| | | | | | | | | | | | | | | | | | | | | | | |
| | (0.05 | ) | | | (0.09 | ) | | | (0.25 | ) | | | (0.03 | ) | | | (0.07 | )(3) | | | (0.14 | )(3) |
| | 0.79 | | | | (13.75 | ) | | | 1.02 | | | | (1.41 | ) | | | 4.65 | | | | 3.75 | |
| | 0.74 | | | | (13.84 | ) | | | 0.77 | | | | (1.44 | ) | | | 4.58 | | | | 3.61 | |
| | | | | | | | | | | | | | | | | | | | | | | |
| | | | | | | | | | | | | | | | | | | | | | | |
| | — | | | | — | | | | — | | | | — | | | | — | | | | (0.01 | ) |
| | — | | | | (6.13 | ) | | | (1.20 | ) | | | — | | | | (3.68 | ) | | | — | |
| | — | | | | (6.13 | ) | | | (1.20 | ) | | | — | | | | (3.68 | ) | | | (0.01 | ) |
| | — | | | | — | | | | — | | | | — | | | | — | | | | — | |
| $ | 11.09 | | | $ | 10.35 | | | $ | 30.32 | | | $ | 30.75 | | | $ | 32.19 | | | $ | 31.29 | |
| | | | | | | | | | | | | | | | | | | | | | | |
| | 7.15 | % | | | (55.79 | )% | | | 2.60 | % | | | (4.47 | )%(5) | | | 16.48 | % | | | 13.04 | % |
| | | | | | | | | | | | | | | | | | | | | | | |
| | | | | | | | | | | | | | | | | | | | | | | |
| $ | 29.81 | | | $ | 36.27 | | | $ | 138.58 | | | $ | 244.19 | | | $ | 279.30 | | | $ | 299.00 | |
| | 1.70 | % | | | 1.37 | % | | | 1.27 | % | | | 1.25 | %(6) | | | 1.25 | % | | | 1.33 | % |
| | (0.43 | )% | | | (0.40 | )% | | | (0.59 | )% | | | (0.24 | )%(6) | | | (0.22 | )% | | | (0.49 | )% |
| | 94 | % | | | 75 | % | | | 86 | % | | | 93 | %(5) | | | 109 | % | | | 192 | % |
HENNESSY FUNDS 1-800-966-4354
Financial Highlights
| Hennessy Cornerstone Growth Fund, Series II |
For an Institutional Class share outstanding throughout each period
| | | Six Months | |
| | | Ended | |
| | | April 30, 2010 | |
| | | (Unaudited) | |
| PER SHARE DATA: | | | |
| Net asset value, beginning of period | | $ | 11.21 | |
| | | | | |
| Income from investment operations: | | | | |
| Net investment gain (loss) | | | (0.01 | ) |
| Net realized and unrealized gains (losses) on securities | | | 3.18 | |
| Total from investment operations | | | 3.17 | |
| | | | | |
| Less Distributions: | | | | |
| Dividends from net investment income | | | — | |
| Dividends from net realized gains | | | — | |
| Total distributions | | | — | |
Redemption fees retained(2) | | | — | |
| Net asset value, end of period | | $ | 14.38 | |
| | | | | |
| TOTAL RETURN | | | 28.28 | %(3) |
| | | | | |
| SUPPLEMENTAL DATA AND RATIOS: | | | | |
| Net assets, end of period (millions) | | $ | 0.31 | |
| Ratio of expenses to average net assets | | | | |
| Before expense reimbursement | | | 1.43 | %(4) |
After expense reimbursement(5) | | | 0.98 | %(4) |
| Ratio of net investment income to average net assets | | | | |
| Before expense reimbursement | | | (0.64 | )%(4) |
After expense reimbursement(5) | | | (0.19 | )%(4) |
Portfolio turnover rate(6) | | | 0 | %(3) |
| (1) | Institutional Class shares commenced operations on March 3, 2008. |
| (2) | Amount is less than $0.01. |
| (5) | The Advisor has agreed to reimburse expenses in order to cap the Institutional Class share expenses. Please refer to Note 5 for more information. |
| (6) | Portfolio turnover is calculated on the basis of the Fund as a whole. |
The accompanying notes are an integral part of these financial statements.
FINANCIAL HIGHLIGHTS — HENNESSY CORNERSTONE GROWTH FUND, SERIES II
| | | | | |
| Year Ended | | | Period Ended | |
| October 31, | | | October 31, | |
| 2009 | | | 2008(1) | |
| | | | | |
| $ | 10.39 | | | $ | 19.17 | |
| | | | | | | |
| | | | | | | |
| | 0.02 | | | | 0.02 | |
| | 0.80 | | | | (8.80 | ) |
| | 0.82 | | | | (8.78 | ) |
| | | | | | | |
| | | | | | | |
| | — | | | | — | |
| | — | | | | — | |
| | — | | | | — | |
| | — | | | | — | |
| $ | 11.21 | | | $ | 10.39 | |
| | | | | | | |
| | 7.89 | % | | | (45.80 | )%(3) |
| | | | | | | |
| | | | | | | |
| $ | 0.28 | | | $ | 0.06 | |
| | | | | | | |
| | 1.46 | % | | | 1.22 | %(4) |
| | 0.98 | % | | | 0.98 | %(4) |
| | | | | | | |
| | (0.19 | )% | | | 0.17 | %(4) |
| | 0.29 | % | | | 0.41 | %(4) |
| | 94 | % | | | 75 | %(3) |
HENNESSY FUNDS 1-800-966-4354
Financial Highlights
For an Original Class share outstanding throughout each period
| | | Six Months | |
| | | Ended | |
| | | April 30, 2010 | |
| | | (Unaudited) | |
| PER SHARE DATA: | | | |
| Net asset value, beginning of period | | $ | 8.73 | |
| | | | | |
| Income from investment operations: | | | | |
| Net investment income (loss) | | | (0.01 | ) |
| Net realized and unrealized gains (losses) on investments | | | 1.88 | |
| Total from investment operations | | | 1.87 | |
| | | | | |
| Less Distributions: | | | | |
| Dividends from net investment income | | | — | |
| Dividends from net realized gains | | | — | |
| Total distributions | | | — | |
| Redemption fees retained | | | — | (1) |
| Net asset value, end of period | | $ | 10.60 | |
| | | | | |
| TOTAL RETURN | | | 21.42 | %(2) |
| | | | | |
| SUPPLEMENTAL DATA AND RATIOS: | | | | |
| Net assets, end of period (millions) | | $ | 127.91 | |
| Ratio of net expenses to average net assets: | | | 1.39 | %(3) |
| Ratio of net investment loss to average net assets: | | | (0.27 | )%(3) |
Portfolio turnover rate(4) | | | 0 | %(2) |
| (1) | Amount is less than $0.01. |
| (4) | Portfolio turnover is calculated on the basis of the Fund as a whole. |
The accompanying notes are an integral part of these financial statements.
FINANCIAL HIGHLIGHTS — HENNESSY FOCUS 30 FUND
| | | | | | | | | | | | | | |
| Year Ended October 31, | |
| 2009 | | | 2008 | | | 2007 | | | 2006 | | | 2005 | |
| $ | 8.02 | | | $ | 13.67 | | | $ | 12.39 | | | $ | 12.21 | | | $ | 8.67 | |
| | | | | | | | | | | | | | | | | | | |
| | (0.02 | ) | | | (0.06 | ) | | | (0.09 | ) | | | (0.08 | ) | | | (0.04 | ) |
| | 0.73 | | | | (3.57 | ) | | | 1.47 | | | | 1.86 | | | | 3.58 | |
| | 0.71 | | | | (3.63 | ) | | | 1.38 | | | | 1.78 | | | | 3.54 | |
| | | | | | | | | | | | | | | | | | | |
| | — | | | | — | | | | — | | | | — | | | | — | |
| | — | | | | (2.02 | ) | | | (0.10 | ) | | | (1.61 | ) | | | — | |
| | — | | | | (2.02 | ) | | | (0.10 | ) | | | (1.61 | ) | | | — | |
| | — | (1) | | | — | (1) | | | — | (1) | | | 0.01 | | | | — | (1) |
| $ | 8.73 | | | $ | 8.02 | | | $ | 13.67 | | | $ | 12.39 | | | $ | 12.21 | |
| | 8.85 | % | | | (30.81 | )% | | | 11.30 | % | | | 16.18 | % | | | 40.83 | % |
| | | | | | | | | | | | | | | | | | | |
| | | | | | | | | | | | | | | | | | | |
| $ | 128.36 | | | $ | 167.32 | | | $ | 233.37 | | | $ | 240.63 | | | $ | 125.31 | |
| | 1.39 | % | | | 1.27 | % | | | 1.23 | % | | | 1.21 | % | | | 1.35 | % |
| | (0.20 | )% | | | (0.62 | )% | | | (0.61 | )% | | | (0.65 | )% | | | (0.60 | )% |
| | 90 | % | | | 123 | % | | | 112 | % | | | 124 | % | | | 155 | % |
HENNESSY FUNDS 1-800-966-4354
Financial Highlights
For an Institutional Class share outstanding throughout each period
| | | Six Months | |
| | | Ended | |
| | | April 30, 2010 | |
| | | (Unaudited) | |
| PER SHARE DATA: | | | |
| Net asset value, beginning of period | | $ | 8.78 | |
| | | | | |
| Income from investment operations: | | | | |
| Net investment income (loss) | | | 0.01 | |
| Net realized and unrealized gains (losses) on investments | | | 1.89 | |
| Total from investment operations | | | 1.90 | |
| | | | | |
| Less Distributions: | | | | |
| Dividends from net investment income | | | — | |
| Dividends from net realized gains | | | — | |
| Total distributions | | | — | |
Redemption fees retained(2) | | | — | |
| Net asset value, end of period | | $ | 10.68 | |
| | | | | |
| TOTAL RETURN | | | 21.64 | %(3) |
| | | | | |
| SUPPLEMENTAL DATA AND RATIOS: | | | | |
| Net assets, end of period (millions) | | $ | 22.29 | |
| Ratio of net expenses to average net assets: | | | | |
| Before expense reimbursement | | | 1.15 | %(4) |
After expense reimbursement(5) | | | 0.98 | %(4) |
| Ratio of net investment loss to average net assets: | | | | |
| Before expense reimbursement | | | (0.01 | )%(4) |
After expense reimbursement(5) | | | 0.16 | %(4) |
Portfolio turnover rate(6) | | | 0 | %(3) |
| (1) | Institutional Class shares commenced operations on March 3, 2008. |
| (2) | Amount is less than $0.01. |
| (5) | The Advisor has agreed to reimburse expenses in order to cap the Institutional Class share expenses. Please refer to Note 5 for more information. |
| (6) | Portfolio turnover is calculated on the basis of the Fund as a whole. |
The accompanying notes are an integral part of these financial statements.
FINANCIAL HIGHLIGHTS — HENNESSY FOCUS 30 FUND
| | | | | |
| Year Ended | | | Period Ended | |
| October 31, | | | October 31, | |
| 2009 | | | 2008(1) | |
| | | | | |
| $ | 8.04 | | | $ | 11.15 | |
| | | | | | | |
| | | | | | | |
| | 0.02 | | | | (0.02 | ) |
| | 0.72 | | | | (3.09 | ) |
| | 0.74 | | | | (3.11 | ) |
| | | | | | | |
| | | | | | | |
| | — | | | | — | |
| | — | | | | — | |
| | — | | | | — | |
| | — | | | | — | |
| $ | 8.78 | | | $ | 8.04 | |
| | | | | | | |
| | 9.20 | % | | | (27.89 | )%(3) |
| | | | | | | |
| | | | | | | |
| $ | 27.44 | | | $ | 26.78 | |
| | | | | | | |
| | 1.15 | % | | | 1.13 | %(4) |
| | 0.98 | % | | | 0.98 | %(4) |
| | | | | | | |
| | 0.04 | % | | | (0.28 | )%(4) |
| | 0.21 | % | | | (0.13 | )%(4) |
| | 90 | % | | | 123 | %(3) |
HENNESSY FUNDS 1-800-966-4354
Financial Highlights
| Hennessy Cornerstone Large Growth Fund |
For an Original Class share outstanding throughout each period
| | | Six Months Ended | |
| | | April 30, 2010 | |
| | | (Unaudited) | |
| PER SHARE DATA: | | | |
| Net asset value, beginning of period | | $ | 9.49 | |
| | | | | |
| Income from investment operations: | | | | |
| Net investment income (loss) | | | 0.05 | |
| Net realized and unrealized gains (losses) on securities | | | 1.69 | |
| Total from investment operations | | | 1.74 | |
| | | | | |
| Less Distributions: | | | | |
| Dividends from net investment income | | | (0.05 | ) |
| Dividends from net realized gains | | | — | |
| Total distributions | | | (0.05 | ) |
Redemption fees retained(3) | | | — | |
| Net asset value, end of period | | $ | 11.18 | |
| | | | | |
| TOTAL RETURN | | | 18.37 | %(5) |
| | | | | |
| SUPPLEMENTAL DATA AND RATIOS: | | | | |
| Net assets, end of period (millions) | | $ | 78.46 | |
| Ratio of expenses to average net assets: | | | | |
| Before expense reimbursement/recoupment | | | 1.27 | %(6) |
After expense reimbursement/recoupment(7) | | | 1.30 | %(6) |
| Ratio of net investment income to average net assets | | | | |
| Before expense reimbursement/recoupment | | | 1.03 | %(6) |
After expense reimbursement/recoupment(7) | | | 1.00 | %(6) |
Portfolio turnover rate(8) | | | 84 | %(5) |
| (1) | | For the one month period ended October 31, 2009. Effective October 31, 2009, the Fund changed its fiscal year end to October 31st from September 30th. |
| (2) | The financial highlights set forth for periods prior to March 23, 2009 represent the historical financial highlights of the Tamarack Large Cap Growth Fund, Class S shares. The assets of the Tamarack Large Cap Growth Fund were acquired by the Hennessy Cornerstone Large Growth Fund on March 23, 2009. At the time RBC Global Asset Management (U.S.), Inc. (formerly known as Voyageur Asset Management Inc.) ceased to be investment advisor and Hennessy Advisors, Inc. became investment advisor. The return of the Tamarack Large Cap Growth Fund, Class S shares during the period October 1, 2008 through March 23, 2009 was (33.30)%. The return of the Hennessy Cornerstone Large Growth Fund, Original Class shares during the period March 23, 2009 through September 30, 2009 was 42.64%. |
| (3) | Amount is less than $0.01 or ($0.01) per share. |
| (4) | Per share net investment income (loss) has been calculated using the average daily shares method. |
| (7) | The Advisor had agreed to reimburse expenses in order to cap the Original Class share expenses. Please refer to Note 5 for more information. |
| (8) | Portfolio turnover is calculated on the basis of the Fund as a whole. |
The accompanying notes are an integral part of these financial statements.
FINANCIAL HIGHLIGHTS — HENNESSY CORNERSTONE LARGE GROWTH FUND
| One Month | | | | | | | | | | | | | | | | |
| Ended | | | | | | | | | | | | | | | | |
| October 31, | | | Year Ended September 30, | |
2009(1) | | | 2009(2) | | | 2008 | | | 2007 | | | 2006 | | | 2005 | |
| | | | | | | | | | | | | | | | | |
| $ | 9.60 | | | $ | 10.09 | | | $ | 12.61 | | | $ | 10.98 | | | $ | 10.75 | | | $ | 9.97 | |
| | | | | | | | | | | | | | | | | | | | | | | |
| | — | | | | 0.05 | | | | — | (3)(4) | | | — | (3) | | | — | (3) | | | 0.02 | |
| | (0.11 | ) | | | (0.54 | ) | | | (2.52 | ) | | | 1.63 | | | | 0.23 | | | | 0.78 | |
| | (0.11 | ) | | | (0.49 | ) | | | (2.52 | ) | | | 1.63 | | | | 0.23 | | | | 0.80 | |
| | | | | | | | | | | | | | | | | | | | | | | |
| | — | | | | — | | | | — | | | | — | | | | — | (3) | | | (0.02 | ) |
| | — | | | | — | | | | — | | | | — | | | | — | | | | — | |
| | — | | | | — | | | | — | | | | — | | | | — | | | | (0.02 | ) |
| | — | | | | — | | | | — | | | | — | | | | — | | | | — | |
| $ | 9.49 | | | $ | 9.60 | | | $ | 10.09 | | | $ | 12.61 | | | $ | 10.98 | | | $ | 10.75 | |
| | (1.15 | )%(5) | | | (4.86 | )% | | | (19.98 | )% | | | 14.85 | % | | | 2.18 | % | | | 8.04 | % |
| | | | | | | | | | | | | | | | | | | | | | | |
| | | | | | | | | | | | | | | | | | | | | | | |
| $ | 69.41 | | | $ | 70.61 | | | $ | 80.91 | | | $ | 113.15 | | | $ | 125.25 | | | $ | 145.65 | |
| | | | | | | | | | | | | | | | | | | | | | | |
| | 1.26 | %(6) | | | 1.40 | % | | | 1.16 | % | | | 1.18 | % | | | 1.18 | % | | | 1.25 | % |
| | 1.30 | %(6) | | | 1.17 | % | | | 0.98 | % | | | 1.00 | % | | | 1.00 | % | | | 0.91 | % |
| | | | | | | | | | | | | | | | | | | | | | | |
| | (0.01 | )%(6) | | | 0.36 | % | | | (0.19 | )% | | | (0.19 | )% | | | (0.20 | )% | | | (0.10 | )% |
| | (0.05 | )%(6) | | | 0.59 | % | | | (0.01 | )% | | | (0.01 | )% | | | (0.02 | )% | | | 0.24 | % |
| | 0 | %(5) | | | 116 | % | | | 38 | % | | | 25 | % | | | 35 | % | | | 28 | % |
HENNESSY FUNDS 1-800-966-4354
Financial Highlights
| Hennessy Cornerstone Large Growth Fund |
For an Institutional Class share outstanding throughout each period
| | | Six Months | |
| | | Ended | |
| | | April 30, 2010 | |
| | | (Unaudited) | |
| PER SHARE DATA: | | | |
| Net asset value, beginning of period | | $ | 9.51 | |
| | | | | |
| Income from investment operations: | | | | |
| Net investment income | | | 0.05 | |
| Net realized and unrealized gains (losses) on securities | | | 1.71 | |
| Total from investment operations | | | 1.76 | |
| | | | | |
| Less Distributions: | | | | |
| Dividends from net investment income | | | (0.05 | ) |
| Dividends from net realized gains | | | — | |
| Total distributions | | | (0.05 | ) |
Redemption fees retained(3) | | | — | |
| Net asset value, end of period | | $ | 11.22 | |
| | | | | |
| TOTAL RETURN | | | 18.56 | %(4) |
| | | | | |
| SUPPLEMENTAL DATA AND RATIOS: | | | | |
| Net assets, end of period (millions) | | $ | 0.06 | |
| Ratio of expenses to average net assets: | | | | |
| Before expense reimbursement | | | 1.15 | %(5) |
After expense reimbursement(6) | | | 0.98 | %(5) |
| Ratio of net investment income to average net assets | | | | |
| Before expense reimbursement | | | 1.01 | %(5) |
After expense reimbursement(6) | | | 1.18 | %(5) |
Portfolio turnover rate(7) | | | 84 | %(4) |
| (1) | For the one month period ended October 31, 2009. Effective October 31, 2009, the Fund changed its fiscal year end to October 31st from September 30th. |
| (2) | Institutional Class shares commenced operations on March 23, 2009. |
| (3) | Amount is less than $0.01 per share. |
| (6) | The Advisor has agreed to reimburse expenses in order to cap the Institutional Class share expenses. Please refer to Note 5 for more information. |
| (7) | Portfolio turnover is calculated on the basis of the Fund as a whole. |
The accompanying notes are an integral part of these financial statements.
FINANCIAL HIGHLIGHTS — HENNESSY CORNERSTONE LARGE GROWTH FUND
| One Month | | | | |
| Ended | | | Period Ended | |
| October 31, | | | September 30, | |
2009(1) | | | 2009(2) | |
| | | | | |
| $ | 9.61 | | | $ | 6.73 | |
| | | | | | | |
| | | | | | | |
| | — | | | | 0.03 | |
| | (0.10 | ) | | | 2.85 | |
| | (0.10 | ) | | | 2.88 | |
| | | | | | | |
| | | | | | | |
| | — | | | | — | |
| | — | | | | — | |
| | — | | | | — | |
| | — | | | | — | |
| $ | 9.51 | | | $ | 9.61 | |
| | | | | | | |
| | (1.04 | )%(4) | | | 42.79 | %(4) |
| | | | | | | |
| | | | | | | |
| $ | 0.04 | | | $ | 0.04 | |
| | | | | | | |
| | 1.14 | %(5) | | | 16.51 | %(5) |
| | .98 | %(5) | | | 0.98 | %(5) |
| | | | | | | |
| | 0.12 | %(5) | | | (14.54 | )%(5) |
| | 0.28 | %(5) | | | 0.99 | %(5) |
| | 0 | %(4) | | | 116 | %(4) |
HENNESSY FUNDS 1-800-966-4354
Financial Highlights
| Hennessy Cornerstone Value Fund |
For an Original Class share outstanding throughout each period
| | | Six Months | |
| | | Ended | |
| | | April 30, 2010 | |
| | | (Unaudited) | |
| PER SHARE DATA: | | | |
| Net asset value, beginning of period | | $ | 10.63 | |
| | | | | |
| Income from investment operations: | | | | |
| Net investment income (loss) | | | 0.11 | |
| Net realized and unrealized gains (losses) on investments | | | 1.46 | |
| Total from investment operations | | | 1.57 | |
| | | | | |
| Less Distributions: | | | | |
| Dividends from net investment income | | | (0.20 | ) |
| Dividends from net realized gains | | | — | |
| Total distributions | | | (0.20 | ) |
Redemption fees retained(1) | | | — | |
| Net asset value, end of period | | $ | 12.00 | |
| | | | | |
| TOTAL RETURN | | | 14.90 | %(2) |
| | | | | |
| SUPPLEMENTAL DATA AND RATIOS: | | | | |
| Net assets, end of period (millions) | | $ | 162.63 | |
| Ratio of net expenses to average net assets | | | 1.26 | %(3) |
| Ratio of net investment income to average net assets | | | 1.84 | %(3) |
Portfolio turnover rate(4) | | | 76 | %(2) |
| (1) | Amount is less than $0.01. |
| (4) | Portfolio turnover is calculated on the basis of the Fund as a whole. |
The accompanying notes are an integral part of these financial statements.
FINANCIAL HIGHLIGHTS — HENNESSY CORNERSTONE VALUE FUND
| | | | | | | | | | | | | | |
| Year Ended October 31, | |
| 2009 | | | 2008 | | | 2007 | | | 2006 | | | 2005 | |
| | | | | | | | | | | | | | |
| $ | 9.05 | | | $ | 17.06 | | | $ | 15.27 | | | $ | 12.95 | | | $ | 12.48 | |
| | | | | | | | | | | | | | | | | | | |
| | 0.24 | | | | 0.55 | | | | 0.46 | | | | 0.30 | | | | 0.30 | |
| | 1.87 | | | | (8.15 | ) | | | 1.68 | | | | 2.36 | | | | 0.41 | |
| | 2.11 | | | | (7.60 | ) | | | 2.14 | | | | 2.66 | | | | 0.71 | |
| | | | | | | | | | | | | | | | | | | |
| | (0.53 | ) | | | (0.41 | ) | | | (0.35 | ) | | | (0.34 | ) | | | (0.24 | ) |
| | — | | | | — | | | | — | | | | — | | | | — | |
| | (0.53 | ) | | | (0.41 | ) | | | (0.35 | ) | | | (0.34 | ) | | | (0.24 | ) |
| | — | | | | — | | | | — | | | | — | | | | — | |
| $ | 10.63 | | | $ | 9.05 | | | $ | 17.06 | | | $ | 15.27 | | | $ | 12.95 | |
| | | | | | | | | | | | | | | | | | | |
| | 25.51 | % | | | (45.50 | )% | | | 14.26 | % | | | 21.00 | % | | | 5.69 | % |
| | | | | | | | | | | | | | | | | | | |
| | | | | | | | | | | | | | | | | | | |
| $ | 145.91 | | | $ | 97.10 | | | $ | 204.50 | | | $ | 256.80 | | | $ | 183.76 | |
| | 1.27 | % | | | 1.20 | % | | | 1.17 | % | | | 1.15 | % | | | 1.20 | % |
| | 3.19 | % | | | 3.92 | % | | | 2.64 | % | | | 2.49 | % | | | 2.19 | % |
| | 59 | % | | | 53 | % | | | 40 | % | | | 35 | % | | | 32 | % |
HENNESSY FUNDS 1-800-966-4354
Financial Highlights
| Hennessy Cornerstone Value Fund |
For an Institutional Class share outstanding throughout each period
| | | Six Months | |
| | | Ended | |
| | | April 30, 2010 | |
| | | (Unaudited) | |
| PER SHARE DATA: | | | |
| Net asset value, beginning of period | | $ | 10.63 | |
| | | | | |
| Income from investment operations: | | | | |
| Net investment income (loss) | | | 0.12 | |
| Net realized and unrealized gains (losses) on investments | | | 1.47 | |
| Total from investment operations | | | 1.59 | |
| | | | | |
| Less Distributions: | | | | |
| Dividends from net investment income | | | (0.22 | ) |
| Dividends from net realized gains | | | — | |
| Total distributions | | | (0.22 | ) |
Redemption fees retained(2) | | | — | |
| Net asset value, end of period | | $ | 12.00 | |
| | | | | |
| TOTAL RETURN | | | 15.13 | %(3) |
| | | | | |
| SUPPLEMENTAL DATA AND RATIOS: | | | | |
| Net assets, end of period (millions) | | $ | 1.27 | |
| Ratio of net expenses to average net assets | | | | |
| Before expense reimbursement | | | 1.09 | %(4) |
After expense reimbursement(5) | | | 0.98 | %(4) |
| Ratio of net investment income to average net assets | | | | |
| Before expense reimbursement | | | 2.01 | %(4) |
After expense reimbursement(5) | | | 2.11 | %(4) |
Portfolio turnover rate(6) | | | 76 | %(3) |
| (1) | Institutional Class shares commenced operations on March 3, 2008. |
| (2) | Amount is less than $0.01. |
| (5) | The Advisor has agreed to reimburse expenses in order to cap the Institutional Class share expenses. Please refer to Note 5 for more information. |
| (6) | Portfolio turnover is calculated on the basis of the Fund as a whole. |
The accompanying notes are an integral part of these financial statements.
FINANCIAL HIGHLIGHTS — HENNESSY CORNERSTONE VALUE FUND
| | | | | |
| | | | | |
| Year Ended | | | Period Ended | |
| October 31, | | | October 31, | |
| 2009 | | | 2008(1) | |
| | | | | |
| $ | 9.06 | | | $ | 13.79 | |
| | | | | | | |
| | | | | | | |
| | 0.30 | | | | 0.34 | |
| | 1.83 | | | | (5.07 | ) |
| | 2.13 | | | | (4.73 | ) |
| | | | | | | |
| | | | | | | |
| | (0.56 | ) | | | — | |
| | — | | | | — | |
| | (0.56 | ) | | | — | |
| | — | | | | — | |
| $ | 10.63 | | | $ | 9.06 | |
| | | | | | | |
| | 25.87 | % | | | (34.30 | )%(3) |
| | | | | | | |
| | | | | | | |
| $ | 1.11 | | | $ | 0.87 | |
| | | | | | | |
| | 1.13 | % | | | 1.14 | %(4) |
| | 0.98 | % | | | 0.98 | %(4) |
| | | | | | | |
| | 3.33 | % | | | 4.94 | %(4) |
| | 3.48 | % | | | 5.10 | %(4) |
| | 59 | % | | | 53 | %(3) |
HENNESSY FUNDS 1-800-966-4354
Financial Highlights
| Hennessy Total Return Fund |
For an Original Class share outstanding throughout each period
| | | Six Months | |
| | | Ended | |
| | | April 30, 2010 | |
| | | (Unaudited) | |
| PER SHARE DATA: | | | |
| Net asset value, beginning of period | | $ | 9.10 | |
| | | | | |
| Income from investment operations: | | | | |
| Net investment income | | | 0.08 | |
| Net realized and unrealized gains (losses) on securities | | | 0.99 | |
| Total from investment operations | | | 1.07 | |
| | | | | |
| Less Distributions: | | | | |
| Dividends from net investment income | | | (0.11 | ) |
| Dividends from realized capital gains | | | — | |
| Total distributions | | | (0.11 | ) |
Redemption fees retained(1) | | | — | |
| Net asset value, end of period | | $ | 10.06 | |
| | | | | |
| TOTAL RETURN | | | 11.78 | %(2) |
| | | | | |
| SUPPLEMENTAL DATA AND RATIOS: | | | | |
| Net assets, end of period (millions) | | $ | 54.59 | |
| Gross ratio of expenses, including interest expense, to average net asset: | | | 1.31 | %(3) |
| Ratio of interest expense to average net assets | | | 0.06 | %(3) |
| Net ratio of expenses, excluding interest expense, to average net assets: | | | 1.25 | %(3) |
| Ratio of net investment income (loss) to average net assets: | | | 1.63 | %(3) |
| Portfolio turnover rate | | | 17 | %(2) |
| (1) | Amount is less than $0.01. |
The accompanying notes are an integral part of these financial statements.
FINANCIAL HIGHLIGHTS — HENNESSY TOTAL RETURN FUND
| | | | | | | | | | | | | | |
| | | | | | | | | | | | | | |
| Year Ended October 31, | |
| 2009 | | | 2008 | | | 2007 | | | 2006 | | | 2005 | |
| | | | | | | | | | | | | | | | | | | |
| $ | 9.22 | | | $ | 13.73 | | | $ | 12.61 | | | $ | 10.57 | | | $ | 10.40 | |
| | | | | | | | | | | | | | | | | | | |
| | 0.18 | | | | 0.28 | | | | 0.33 | | | | 0.31 | | | | 0.23 | |
| | (0.14 | ) | | | (4.49 | ) | | | 1.13 | | | | 2.03 | | | | 0.17 | |
| | 0.04 | | | | (4.21 | ) | | | 1.46 | | | | 2.34 | | | | 0.40 | |
| | | | | | | | | | | | | | | | | | | |
| | (0.16 | ) | | | (0.30 | ) | | | (0.34 | ) | | | (0.30 | ) | | | (0.23 | ) |
| | — | | | | — | | | | — | | | | — | | | | — | |
| | (0.16 | ) | | | (0.30 | ) | | | (0.34 | ) | | | (0.30 | ) | | | (0.23 | ) |
| | — | | | | — | | | | — | | | | — | | | | — | |
| $ | 9.10 | | | $ | 9.22 | | | $ | 13.73 | | | $ | 12.61 | | | $ | 10.57 | |
| | | | | | | | | | | | | | | | | | | |
| | 0.69 | % | | | (30.97 | )% | | | 11.70 | % | | | 22.48 | % | | | 3.83 | % |
| | | | | | | | | | | | | | | | | | | |
| | | | | | | | | | | | | | | | | | | |
| $ | 52.38 | | | $ | 58.22 | | | $ | 96.31 | | | $ | 113.26 | | | $ | 86.75 | |
| | 1.56 | % | | | 2.36 | % | | | 3.04 | % | | | 2.80 | % | | | 2.28 | % |
| | 0.29 | % | | | 1.16 | % | | | 1.88 | % | | | 1.64 | % | | | 1.05 | % |
| | 1.27 | % | | | 1.20 | % | | | 1.16 | % | | | 1.16 | % | | | 1.23 | % |
| | 2.12 | % | | | 2.43 | % | | | 2.48 | % | | | 2.79 | % | | | 2.07 | % |
| | 41 | % | | | 16 | % | | | 12 | % | | | 24 | % | | | 26 | % |
HENNESSY FUNDS 1-800-966-4354
Financial Highlights
For an Original Class share outstanding throughout each period
| | | Six Months | |
| | | Ended | |
| | | April 30, 2010 | |
| | | (Unaudited) | |
| PER SHARE DATA: | | | |
| Net asset value, beginning of period | | $ | 9.48 | |
| | | | | |
| Income from investment operations: | | | | |
| Net investment income | | | 0.01 | |
| Net realized and unrealized gains (losses) on securities | | | 0.57 | |
| Total from investment operations | | | 0.58 | |
| | | | | |
| Less Distributions: | | | | |
| Dividends from net investment income | | | (0.01 | ) |
| Dividends from realized capital gains | | | — | |
| Total distributions | | | (0.01 | ) |
Redemption fees retained(1) | | | — | |
| Net asset value, end of period | | $ | 10.05 | |
| | | | | |
| TOTAL RETURN | | | 6.15 | %(2) |
| | | | | |
| SUPPLEMENTAL DATA AND RATIOS: | | | | |
| Net assets, end of period (millions) | | $ | 12.32 | |
| Ratio of net expenses to average net assets | | | 1.65 | %(3) |
| Ratio of net investment income to average net assets | | | 0.25 | %(3) |
| Portfolio turnover rate | | | 53 | %(2) |
| (1) | Amount is less than $0.01. |
The accompanying notes are an integral part of these financial statements.
FINANCIAL HIGHLIGHTS — HENNESSY BALANCED FUND
| | | | | | | | | | | | | | |
| Year Ended October 31, | |
| 2009 | | | 2008 | | | 2007 | | | 2006 | | | 2005 | |
| | | | | | | | | | | | | | | | | | | |
| $ | 9.11 | | | $ | 12.51 | | | $ | 11.83 | | | $ | 10.56 | | | $ | 10.62 | |
| | | | | | | | | | | | | | | | | | | |
| | 0.10 | | | | 0.25 | | | | 0.38 | | | | 0.30 | | | | 0.18 | |
| | 0.38 | | | | (2.80 | ) | | | 0.69 | | | | 1.25 | | | | (0.07 | ) |
| | 0.48 | | | | (2.55 | ) | | | 1.07 | | | | 1.55 | | | | 0.11 | |
| | | | | | | | | | | | | | | | | | | |
| | (0.11 | ) | | | (0.26 | ) | | | (0.39 | ) | | | (0.28 | ) | | | (0.17 | ) |
| | — | | | | (0.59 | ) | | | — | | | | — | | | | — | |
| | (0.11 | ) | | | (0.85 | ) | | | (0.39 | ) | | | (0.28 | ) | | | (0.17 | ) |
| | — | | | | — | | | | — | | | | — | | | | — | |
| $ | 9.48 | | | $ | 9.11 | | | $ | 12.51 | | | $ | 11.83 | | | $ | 10.56 | |
| | | | | | | | | | | | | | | | | | | |
| | 5.46 | % | | | (21.55 | )% | | | 9.16 | % | | | 14.92 | % | | | 1.13 | % |
| | | | | | | | | | | | | | | | | | | |
| | | | | | | | | | | | | | | | | | | |
| $ | 11.47 | | | $ | 11.46 | | | $ | 16.82 | | | $ | 26.14 | | | $ | 19.27 | |
| | 1.73 | % | | | 1.56 | % | | | 1.36 | % | | | 1.34 | % | | | 1.49 | % |
| | 1.17 | % | | | 2.31 | % | | | 2.86 | % | | | 2.75 | % | | | 1.58 | % |
| | 46 | % | | | 13 | % | | | 35 | % | | | 88 | % | | | 21 | % |
HENNESSY FUNDS 1-800-966-4354
Statement of Cash Flows
Hennessy Total Return Fund For the Six Months Ended April 30, 2010 (Unaudited) |
| Cash Flows From Operating Activities: | | | |
| | | | |
| Net decrease in net assets from operations | | $ | 6,032,064 | |
| Adjustments to reconcile net decrease in net assets from | | | | |
| operations to net cash provided by operating activities: | | | | |
| Purchase of investment securities | | | (88,516,376 | ) |
| Proceeds on sale of securities | | | 89,574,697 | |
| Decrease in receivable for securities sold | | | 3,506,069 | |
| Decrease in other receivables, net | | | 25,025 | |
| Decrease in other assets | | | 1,339 | |
| Decrease in payable for securities purchased | | | (3,009,279 | ) |
| Decrease in accrued expenses and other payables | | | (1,257 | ) |
| Net accretion of discount on securities | | | (11,974 | ) |
| Net realized gain on investments | | | (3,667,571 | ) |
| Unrealized appreciation on securities | | | (1,926,383 | ) |
| Net cash provided by operating activities | | $ | 2,006,354 | |
| | | | | |
| Cash Flows From Financing Activities: | | | | |
| | | | | |
| Increase in reverse repurchase agreements | | $ | 1,811,000 | |
| Proceeds on shares sold | | | 1,284,159 | |
| Payment on shares repurchased | | | (5,054,617 | ) |
| Cash dividends paid | | | (46,896 | ) |
| Net cash used by financing activities | | $ | (2,006,354 | ) |
| Net increase (decrease) in cash | | | — | |
| | | | | |
| Cash at beginning of period | | | — | |
| Cash at end of period | | $ | — | |
| | | | | |
| Cash paid for interest | | $ | 22,650 | |
The accompanying notes are an integral part of these financial statements.
NOTES TO THE FINANCIAL STATEMENTS
Notes to the Financial Statements
April 30, 2010 (Unaudited)
1). ORGANIZATION
The Hennessy Mutual Funds, Inc. was organized as a Maryland corporation on May 20, 1996 and consists of three separate series: Hennessy Cornerstone Growth Fund (the “Growth Fund”), Hennessy Cornerstone Value Fund (the “Value Fund”) and the Hennessy Focus 30 Fund (the “Focus 30 Fund”), formerly SYM Select Growth Fund. These Funds are open-end, diversified management investment companies registered under the Investment Company Act of 1940, as amended. The Growth Fund and Value Fund commenced operations on November 1, 1996. On September 17, 2003, Hennessy Advisors, Inc. became the investment advisor to the SYM Select Growth Fund and the Fund changed its name to the Hennessy Focus 30 Fund.
The Hennessy Funds, Inc. was organized as a Maryland corporation on January 11, 1996 and consists of two separate series: Hennessy Balanced Fund (the “Balanced Fund”) and Hennessy Total Return Fund (the “Total Return Fund”). The Balanced and Total Return Funds are open-end, non-diversified management investment companies registered under the Investment Company Act of 1940, as amended. The Balanced Fund and Total Return Fund commenced operations on March 8, 1996 and July 29, 1998, respectively.
The Hennessy Funds Trust (the “Trust”) was organized as a Delaware Statutory Trust on September 17, 1992 and consists of three series: Hennessy Cornerstone Growth Fund, Series II (the “Growth II Fund”), Hennessy Select Large Value Fund and Hennessy Large Growth Fund (the “Large Growth Fund”). The financial results of the Hennessy Select Large Value Fund are not contained in this report. Prior to July 1, 2005, both the Trust and the Growth II Fund were known as The Henlopen Fund. On July 1, 2005, Hennessy Advisors, Inc., became the investment advisor to the Growth II Fund and the Growth II Fund changed its name from “The Henlopen Fund” to “Hennessy Cornerstone Growth Fund, Series II”. On M arch 23, 2009, Hennessy Advisors, Inc., became the investment advisor to the Large Growth Fund and the Large Growth Fund changed its name from “Tamarack Large Cap Growth Fund” to “Hennessy Cornerstone Large Growth Fund”. The Growth II and Large Growth Funds are open-end, diversified investment management companies registered under the Investment Company Act of 1940, as amended.
The Growth Fund, Growth II Fund, Focus 30 Fund, Large Growth Fund, Value Fund, Total Return Fund and Balanced Fund collectively represent the Hennessy Cornerstone Series Funds (the “Funds”).
The Growth, Growth II, Focus 30, Large Growth and Value Funds offer Original and Institutional Class shares. Each class of shares differs principally in its respective administration, shareholder servicing and sub-transfer agent expenses and sales charges, if any. Each class has identical rights to earnings, assets and voting privileges, except for class-specific expenses and exclusive rights to vote on matters affecting only individual classes. The Total Return and Balanced Funds offer Original Class shares only.
HENNESSY FUNDS 1-800-966-4354
2). SIGNIFICANT ACCOUNTING POLICIES
The following is a summary of significant accounting policies consistently followed by the Funds in the preparation of the financial statements. These policies are in conformity with U.S. generally accepted accounting principles (“GAAP”).
| a). | Investment Valuation – Securities which are traded on a national or recognized stock exchange are valued at the last sale price on the securities exchange on which such securities are primarily traded. Exchange-traded securities for which there were no transactions that day and debt securities are valued at the most recent bid prices. Instruments with a remaining maturity of 60 days or less are valued on an amortized cost basis. When a price for an underlying security is not readily available or if a significant event has occurred that indicates the closing price of a security no longer represents the true value of that security, fair value pricing procedures have been adopted by the Board of Directors of the Funds. Fair value pricing determinations are made in good faith in accordance with these procedures. There are num erous criteria that will be given consideration in determining a fair value of a security. Some of these criteria are: trading volume of security and markets, value of other like securities and news events with direct bearing to security or market. Fair value pricing results in an estimated price that reasonably reflects the current market conditions in order to rate the portfolio holdings such that shareholder transactions receive a fair net asset value. |
| b). | Federal Income Taxes – Provision for federal income taxes or excise taxes has not been made since the Funds have elected to be taxed as “regulated investment companies” and intend to distribute substantially all taxable income to shareholders and otherwise comply with the provisions of the Internal Revenue Code applicable to regulated investment companies. Net investment income and realized gains and losses for federal income tax purposes may differ from that reported on the financial statements because of temporary book and tax basis differences. Temporary differences are primarily the result of the treatment of wash sales for tax reporting purposes. Distributions from net realized gains for book purposes may include short-term capital gains, which are included as ordinary income to shareholders for tax purposes. |
| | Due to inherent differences in the recognition of income, expenses, and realized gains/losses under U.S. generally accepted accounting principles and federal income tax purposes, permanent differences between book and tax basis reporting for the 2009 fiscal year have been identified and appropriately reclassified on the Statement of Assets and Liabilities. |
| | | Accumulated Net | | | Accumulated Net | | | Paid In | |
| | �� | Investment Income/(Loss) | | | Realized Gain/(Loss) | | | Capital | |
| Growth Fund | | | 1,059,159 | | | | 369,963 | | | | (1,429,122 | ) |
| Growth II Fund | | | 130,836 | | | | (84 | ) | | | (130,752 | ) |
| Focus 30 Fund | | | 225,481 | | | | 8 | | | | (225,489 | ) |
| Large Growth Fund | | | 3,301 | | | | 2,915,217 | | | | (2,918,518 | ) |
| Value Fund | | | (112,103 | ) | | | 112,103 | | | | — | |
| Total Return Fund | | | — | | | | 34,658,579 | | | | (34,658,579 | ) |
| Balanced Fund | | | 1,555 | | | | 446,409 | | | | (447,964 | ) |
NOTES TO THE FINANCIAL STATEMENTS
| | The permanent differences primarily relate to net operating losses and capital loss carryovers lost due to expiration. |
| c). | Income and Expenses – Dividend income is recognized on the ex-dividend date or as soon as information is available to the Funds and interest income is recognized on an accrual basis. Income, expenses (other than expenses attributable to a specific class), and realized and unrealized gains or losses on investments are allocated to each class of shares based on its respective net assets. |
| d). | Distributions to Shareholders – Dividends from net investment income for the Growth, Growth II, Focus 30, Large Growth and Value Funds, if any, are declared and paid out annually, usually in November or December of each year. Dividends from net investment income for the Total Return and Balanced Funds are declared and paid on a calendar quarter basis. Distributions of net realized capital gains, if any, are declared and paid annually, usually in November or December of each year, for all of the Funds. |
| e). | Security Transactions – Investment and shareholder transactions are recorded on the trade date. The Funds determine the gain or loss realized from the investment transactions by comparing the original cost of the security lot sold with the net sale proceeds. Discounts and premiums on securities purchased are accreted/amortized over the life of the respective security. |
| f). | Use of Estimates – The preparation of financial statements in conformity with GAAP requires management to make estimates and assumptions that affect the reported amounts of assets and liabilities and disclosure of contingent assets and liabilities at the date of the financial statements and the reported change in net assets during the reporting period. Actual results could differ from those estimates. |
| g). | Share Valuation – The net asset value (“NAV”) per share of each Fund is calculated by dividing the sum of the value of the securities held by each Fund, plus cash or other assets, minus all liabilities (including estimated accrued expenses) by the total number of shares outstanding for each Fund, rounded to the nearest cent. The Funds’ shares will not be priced on the days on which the NYSE is closed for trading. The offering and redemption price per share for each Fund is equal to each Fund’s net asset value per share. The Funds charged a 1.50% redemption fee on shares held less than 90 days through August 29, 2008. These fees were deducted from the redemption proceeds otherwise payable to the shareholder. These fees were retained by each Fund and treated as additional paid-in capital and allocated to each r espective class of shares (if applicable). |
| h). | Repurchase Agreements – Each Fund may enter into repurchase agreements with member banks or security dealers of the Federal Reserve whom the investment advisor deems creditworthy. The repurchase price generally equals the price paid by the Fund plus interest negotiated on the basis of current short-term rates. |
| | Securities pledged as collateral for repurchase agreements are held by the custodian bank until the respective agreements mature. Provisions of the repurchase agreements ensure that the market value of the collateral, including accrued interest thereon, is sufficient, in the event of default of the |
HENNESSY FUNDS 1-800-966-4354
| | counterparty. If the counterparty defaults and the value of the collateral declines or if the counterparty enters an insolvency proceeding, realization of the collateral by the Fund may be delayed or limited. |
| i). | Accounting for Uncertainty in Income Taxes – The Funds have adopted accounting policies regarding recognition and measurement of tax positions taken or expected to be taken on a tax return. The Funds have reviewed all open tax years and major jurisdictions and concluded that there is no impact on the Funds’ net assets and no tax liability resulting from unrecognized tax benefits relating to uncertain income tax positions taken or expected to be taken on a tax return. As of April 30, 2010, open Federal and state tax years for the Large Growth Fund include the tax years ended September 30, 2006 through 2009 and the tax period ended October 31, 2009. As of April 30, 2010, open Federal and state tax years for the Growth, Growth II, Focus, Value, Total Return and Balanced Fund include the tax years ended October 31, 2006 through 2009. |
| j). | Derivatives – The Funds have adopted the financial accounting reporting rules as required by the Derivatives and Hedging Topic of the FASB Accounting Standards Codification (“FASB ASC”). The Funds are required to include enhanced disclosure that enables investors to understand how and why an entity uses derivatives, how derivatives are accounted for, and how derivatives instruments affect an entity’s results of operations and financial position. During the six months ended April 30, 2010, the Funds did not hold any derivative instruments. |
| k). | Events Subsequent to the Fiscal Period End – The Funds have adopted financial reporting rules regarding subsequent events which requires an entity to recognize in the financial statements the effects of all subsequent events that provide additional evidence about conditions that existed at the date of the balance sheet. Management has evaluated the Funds’ related events and transactions that occurred subsequent to April 30, 2010, through the date of issuance of the Funds’ financial statements. There were no events or transactions that occurred during this period that materially impacted the amounts or disclosures in the Fund’s financial statements. |
| l). | New Accounting Pronouncement – In January 2010, FASB issued Accounting Standards Update (“ASU”) No. 2010-06 “Improving Disclosures about Fair Value Measurements”. ASU 2010-06 amends FASB Accounting Standards Codification Topic 820, Fair Value Measurements and Disclosures, to require additional disclosures regarding fair value measurements. Certain disclosures required by ASU No. 2010-06 are effective for interim and annual reporting periods beginning after December 15, 2009, and other required disclosures are effective for fiscal years beginning after December 15, 2010, and for interim periods within those fiscal years. Management is currently evaluating the impact ASU No. 2010-06 will have on the Funds’ statement disclosures. |
3). REVERSE REPURCHASE AGREEMENTS
The Total Return Fund has entered into reverse repurchase agreements with UBS Financial Services, Inc., under which the Total Return Fund sells securities and agrees to repurchase them later at a mutually agreed upon price. For the six months ended April 30, 2010, the average daily balance and average interest rate
NOTES TO THE FINANCIAL STATEMENTS
in effect for reverse repurchase agreements was $13,309,000 and 0.24%, respectively. At April 30, 2010, the interest rate in effect for the outstanding reverse repurchase agreements, scheduled to mature on June 10, 2010 ($16,191,000) was 0.25%. Outstanding reverse repurchase agreements at April 30, 2010 were equal to 29.65% of the Total Return Fund’s total net assets.
4). INVESTMENT TRANSACTIONS
Purchases and sales of investment securities (excluding government and short-term investments) during the six months ended April 30, 2010 were as follows:
| | Growth | Growth II | Focus 30 | Large Growth | Value | Total Return | Balanced |
| | Fund | Fund | Fund | Fund | Fund | Fund | Fund |
| Purchases | $220,978,109 | $ — | $ — | $59,719,722 | $115,610,591 | $6,781,792 | $3,249,191 |
| Sales | $252,398,220 | $3,302,782 | $35,525,420 | $61,772,183 | $119,163,671 | $10,354,080 | $3,356,749 |
Purchases and sales of long-term U.S. Government Securities for the Balanced Fund were $3,400,505 and $0, respectively. There were no purchases or sales of long-term U.S. Government Securities for the Growth, Growth II, Focus 30, Large Growth, Value, or Total Return Funds.
5). INVESTMENT MANAGEMENT FEE AND OTHER TRANSACTIONS WITH AFFILIATES
Hennessy Advisors, Inc. (the “Advisor”) is the Advisor of the Funds. The Advisor provides the Funds with investment management services under a Management Agreement. The Advisor furnishes all investment advice, office space, facilities, and provides most of the personnel needed by the Funds. As compensation for its services, the Advisor is entitled to a monthly fee from each Fund. The fee is based upon the average daily net assets of the Funds at the annual rate of:
| | Growth Fund | 0.74% |
| | Growth II Fund | 0.74% |
| | Focus 30 Fund | 0.74% |
| | Large Growth Fund | 0.74% |
| | Value Fund | 0.74% |
| | Total Return Fund | 0.60% |
| | Balanced Fund | 0.60% |
The Advisor has agreed to waive its fees and absorb expenses to the extent that the total annual operating expenses (excluding all federal, state and local taxes, interest, brokerage commissions, acquired fund fees and expenses and other costs incurred in connection with the purchase and sale of securities and extraordinary items) do not exceed 0.98% of the Funds’ net assets for the Institutional Class shares in the Growth, Growth II, Focus 30, Large Growth and Value Funds or 1.30% of the Original Class shares of the Large Growth Fund. The expense limitation agreement for the Original Class shares of the Large Growth Fund expired on March 31, 2010. The expense limitation agreement for the Institutional Class shares can only be terminated by the Board of Directors /Trustees. For a period of three years after the year in which the Advisor waives or reimburses expenses, the Advisor may seek reimbursement from the Funds to the extent that total annual Fund operating expenses are less than the expense limitation in effect at the time of the reimbursement. The Advisor reimbursed Institutional Class expenses of $273 for the Growth II for the six months ended April 30, 2010.
HENNESSY FUNDS 1-800-966-4354
The Advisor recouped $10,544 of previously reimbursed Original Class expenses for the Large Growth Fund for the six months ended April 30, 2010.
As of April 30, 2010, cumulative expenses subject to potential recovery to the aforementioned conditions and year of expiration are as follows:
| | Oct. 31, 2011 | Oct. 31, 2012 | Oct. 31, 2013 | Total |
| Growth Fund – Institutional Class | $ 7,464 | $ 6,062 | $ — | $13,526 |
| Growth II Fund – Institutional Class | $ 137 | $ 706 | $273 | $ 1,116 |
| Focus 30 Fund – Institutional Class | $35,499 | $43,673 | $ — | $79,172 |
| Large Growth Fund – Original Class | $27,779 | $ — | $ — | $27,779 |
| Large Growth Fund – Institutional Class | $ 2,051 | $ 5 | $ — | $ 2,056 |
| Value Fund – Institutional Class | $ 1,056 | $ 1,298 | $ — | $ 2,354 |
The Board of Directors/Trustees has approved a Shareholder Servicing Plan for the Original Class shares of the Growth, Growth II, Focus 30, Large Growth, Value, Total Return and Balanced Funds which was instituted to compensate the Advisor for the non-investment management services it provides to the Funds. The Plan provides for a monthly fee paid to the Advisor at an annual rate of 0.10% of the average daily net assets of the Funds.
The Growth Fund, Growth II Fund, Focus 30 Fund, Large Growth and Value Fund have entered into agreements with various brokers, dealers and financial intermediaries in connection with the sale of shares of the Funds. The agreements provide for periodic payments by the Funds to the brokers, dealers and financial intermediaries for providing certain shareholder maintenance services (sub-transfer agent expenses). These shareholder services include: the pre-processing and quality control of new accounts, shareholder correspondence, answering customer inquiries regarding account status and facilitating shareholder telephone transactions. Fees paid by the Growth Fund, Growth II Fund, Focus 30 Fund, Large Growth and Value Fund to various brokers, dealers and financi al intermediaries for the six months ended April 30, 2010, were $180,482, $28,930, $130,361, $7,424 and $65,541, respectively.
The Total Return and Balanced Funds have adopted a plan pursuant to Rule 12b-1 which authorizes payments in connection with the distribution of the Total Return and Balanced Fund shares at an annual rate not to exceed 0.15% of each Fund’s average daily net assets. Amounts paid under the Plan may be spent on any activities or expenses primarily intended to result in the sale of shares, including but not limited to, advertising, compensation for sales and marketing activities or financial institutions and others such as dealers and distributors, shareholder account servicing, the printing and mailing of prospectuses to other than current shareowners and the printing and mailing of sales literature.
U.S. Bancorp Fund Services, LLC (the “Administrator”) acts as the Funds’ Administrator under an Administration Agreement. Administrative services under this agreement include custody, distribution, fund accounting, fund administration and transfer agent services. In addition, the Administrator prepares various federal and state regulatory filings, reports and returns for the Funds; prepares reports and materials to be supplied to the directors; monitors the activities of the Funds’ custodian, transfer agent and accountants; coordinates the preparation and payment of the Funds’ expenses and reviews the Funds’ expense accruals. Fees paid to U.S. Bancorp Fund Services, LLC for the
NOTES TO THE FINANCIAL STATEMENTS
six months ended April 30, 2010, were $301,676, $40,364, $195,237, $94,713, $200,599, $68,586 and $15,523 for Growth, Growth II, Focus 30, Large Growth, Value, Total Return and Balanced Funds, respectively. The Administrator has voluntarily waived all or a portion of its administration fees allocated to the Institutional Class shares of the Growth Fund, Growth II Fund, Focus 30 Fund, Large Growth and Value Fund. The administration fees voluntarily waived by the Administrator during the six months ended April 30, 2010 were $2,467, $355, $22,247, $42, and $652, respectively.
Quasar Distributors, LLC (the “Distributor”) acts as the Funds’ principal underwriter in a continuous public offering of the Funds’ shares. The Distributor is an affiliated company of U.S. Bank, N.A.
6). LINE OF CREDIT
The Growth, Growth II, Focus 30, and Value Funds have $40,000,000, $1,500,000, $25,000,000 and $10,000,000 lines of credit, respectively, intended to provide short-term financing, if necessary, subject to certain restrictions, in connection with shareholder redemptions. The credit facility is with its custodian bank, U.S. Bank, N.A. During the six months ended April 30, 2010, the Focus 30 Fund had an outstanding average daily balance and a weighted average interest rate of $53,923 and 3.25%, respectively. The maximum amount outstanding for the Focus 30 Fund during the period was $3,419,000. During the six months ended April 30, 2010, the Value Fund had an outstanding average daily balance and a weighted average interest rate of $10,414 and 3.25%, respectively. The maximum amount outstanding for the Value Fund during the period was $1,413,000. During the six months ended April 30, 2010, the Growth and Growth II Fund had no line of credit activity.
7). FEDERAL TAX INFORMATION
As of October 31, 2009, the components of accumulated earnings (losses) for income tax purposes were as follows:
| | | Growth | | | Growth II | | | Focus 30 | |
| | | Fund | | | Fund | | | Fund | |
| Cost of investments for tax purposes | | $ | 224,061,528 | | | $ | 27,673,681 | | | $ | 156,197,343 | |
| Gross tax unrealized appreciation | | | 24,112,218 | | | | 4,292,546 | | | | 5,600,584 | |
| Gross tax unrealized depreciation | | | (19,864,261 | ) | | | (1,794,420 | ) | | | (5,659,121 | ) |
| Net tax unrealized | | | | | | | | | | | | |
| appreciation (depreciation) | | | 4,247,957 | | | | 2,498,126 | | | | (58,537 | ) |
| Undistributed ordinary income | | $ | — | | | $ | — | | | $ | — | |
| Undistributed long-term capital gains | | $ | — | | | $ | — | | | $ | — | |
| Total distributable earnings | | $ | — | | | $ | — | | | $ | — | |
| Other accumulated gains/(loss) | | $ | (292,454,322 | ) | | $ | (61,399,808 | ) | | $ | (89,114,703 | ) |
| Total accumulated earnings/(loss) | | $ | (288,206,365 | ) | | $ | (58,901,682 | ) | | $ | (89,173,240 | ) |
HENNESSY FUNDS 1-800-966-4354
| | | Large | | | | | | Total | | | | |
| | | Growth | | | Value | | | Return | | | Balanced | |
| | | Fund | | | Fund | | | Fund | | | Fund | |
| Cost of investments | | | | | | | | | | | | |
| for tax purposes | | $ | 53,957,008 | | | $ | 134,897,164 | | | $ | 67,023,216 | | | $ | 11,355,997 | |
| Gross tax | | | | | | | | | | | | | | | | |
| unrealized appreciation | | | 16,656,370 | | | | 27,487,624 | | | | 4,107,674 | | | | 1,367,882 | |
| Gross tax | | | | | | | | | | | | | | | | |
| unrealized depreciation | | | (1,137,512 | ) | | | (15,673,257 | ) | | | (4,863,918 | ) | | | (849,113 | ) |
| Net tax unrealized | | | | | | | | | | | | | | | | |
| appreciation (depreciation) | | | 15,518,858 | | | | 11,814,367 | | | | (756,244 | ) | | | 518,769 | |
| Undistributed ordinary income | | $ | 358,421 | | | $ | 2,322,929 | | | $ | 86,870 | | | $ | 4,907 | |
| Undistributed long-term | | | | | | | | | | | | | | | | |
| capital gains | | $ | — | | | $ | — | | | $ | — | | | $ | — | |
| Total distributable earnings | | $ | 358,421 | | | $ | 2,322,929 | | | $ | 86,870 | | | $ | 4,907 | |
| Other accumulated gains/(loss) | | $ | (21,442,496 | ) | | $ | (85,002,113 | ) | | $ | (18,972,802 | ) | | $ | (3,507,494 | ) |
| Total accumulated | | | | | | | | | | | | | | | | |
| earnings/(loss) | | $ | (5,565,217 | ) | | $ | (70,864,817 | ) | | $ | (19,642,176 | ) | | $ | (2,983,818 | ) |
The difference between book-basis and tax-basis unrealized appreciation is attributable primarily to wash sales and partnership adjustments.
At October 31, 2009, the Growth Fund had tax basis capital losses of $292,454,322, to offset future capital gains, the use of a portion of which is limited by IRS regulations. Of such losses, $182,559 expire October 31, 2010, $115,170,412 expire October 31, 2016, and $177,101,351 expire October 31, 2017. Additionally, the Growth Fund had no post-October loss deferrals as of October 31, 2009.
At October 31, 2009, the Growth II Fund had tax basis capital losses of $61,399,808, to offset future capital gains, the use of a portion of which is limited by IRS regulations. Of such losses, $36,286,123 expire October 31, 2016 and $25,113,685 expire October 31, 2017. Additionally, the Growth II Fund had no post-October loss deferrals as of October 31, 2009.
At October 31, 2009, the Focus 30 Fund had tax basis capital losses of $89,114,703, to offset future capital gains, the use of a portion of which is limited by IRS regulations. Of such losses, $47,979,565 expire October 31, 2016 and $41,135,138 expire October 31, 2017. Additionally, the Focus 30 Fund had no post-October loss deferrals as of October 31, 2009.
At October 31, 2009, the Large Growth Fund had tax basis capital losses of $21,442,496, to offset future capital gains, the use of a portion of which is limited by IRS regulations. Of such losses, $612,261 expire October 31, 2015, $2,573,644 expire October 31, 2016 and $18,256,591 expire October 31, 2017. Additionally, the Large Growth Fund had no post-October loss deferrals as of October 31, 2009.
At October 31, 2009, the Value Fund had tax basis capital losses of $85,002,113, to offset future capital gains, the use of a portion of which is limited by IRS regulations. Of such losses, $27,482,264 expire October 31, 2010
NOTES TO THE FINANCIAL STATEMENTS
and $712,595 expire October 31, 2011 and $56,807,254 expire on October 31, 2017. Additionally, the Value Fund had no post-October loss deferrals as of October 31, 2009.
At October 31, 2009, the Total Return Fund had tax basis capital losses of $18,972,802, which may be carried over to offset future capital gains. Of such $18,972,802 expire October 31, 2017. Additionally, the Total Return Fund had no post-October loss deferrals as of October 31, 2009.
At October 31, 2009, the Balanced Fund had tax basis capital losses of $3,507,494, to offset future capital gains, the use of a portion of which is limited by IRS regulations. Of such losses, $447,964 expire October 31, 2010, $119,027 expire October 31, 2016 and $2,940,503 expire October 31, 2017. Additionally, the Balanced Fund had no post-October loss deferrals as of October 31, 2009.
The tax character of distributions paid during 2010 and 2009 for the Funds were as follows:
| | | Six Months Ended | | | | | | | |
| | | April 30, 2010 | | | Year Ended | | | | |
| Growth Fund | | (Unaudited) | | | October 31, 2009 | | | | |
| Ordinary income | | $ | — | | | $ | — | | | | |
| Long-term capital gain | | | — | | | | — | | | | |
| | | $ | — | | | $ | — | | | | |
| | | | | | | | | | | |
| | | Six Months Ended | | | | | | | | |
| | | April 30, 2010 | | | Year Ended | | | | |
| Growth II Fund | | (Unaudited) | | | October 31, 2009 | | | | |
| Ordinary income | | $ | — | | | $ | — | | | | |
| Long-term capital gain | | | — | | | | — | | | | |
| | | $ | — | | | $ | — | | | | |
| | | | | | | | | | | |
| | | Six Months Ended | | | | | | | | |
| | | April 30, 2010 | | | Year Ended | | | | |
| Focus 30 Fund | | (Unaudited) | | | October 31, 2009 | | | | |
| Ordinary income | | $ | — | | | $ | — | | | | |
| Long-term capital gain | | | — | | | | — | | | | |
| | | $ | — | | | $ | — | | | | |
| | | | | | | | | | | |
| | | Six Months Ended | | | | | | | | |
| | | April 30, 2010 | | | One Month Ended | | | Year Ended | |
| Large Growth Fund | | (Unaudited) | | | October 31, 2009 | | | September 30, 2009 | |
| Ordinary income | | $ | 358,421 | | | $ | — | | | $ | — | |
| Long-term capital gain | | | — | | | | — | | | | — | |
| | | $ | 358,421 | | | $ | — | | | $ | — | |
| | | | | | | | | | | | |
| | | Six Months Ended | | | | | | | | | |
| | | April 30, 2010 | | | Year Ended | | | | | |
| Value Fund | | (Unaudited) | | | October 31, 2009 | | | | | |
| Ordinary income | | $ | 2,758,219 | | | $ | 5,652,451 | | | | | |
| Long-term capital gain | | | — | | | | — | | | | | |
| | | $ | 2,758,219 | | | $ | 5,652,451 | | | | | |
HENNESSY FUNDS 1-800-966-4354
| | | Six Months Ended | | | | |
| | | April 30, 2010 | | | Year Ended | |
| Total Return Fund | | (Unaudited) | | | October 31, 2009 | |
| Ordinary income | | $ | 601,289 | | | $ | 956,356 | |
| Long-term capital gain | | | — | | | | — | |
| | | $ | 601,289 | | | $ | 956,356 | |
| | | | | | | | |
| | | Six Months Ended | | | | | |
| | | April 30, 2010 | | | Year Ended | |
| Balanced Fund | | (Unaudited) | | | October 31, 2009 | |
| Ordinary income | | $ | 15,813 | | | $ | 138,030 | |
| Long-term capital gain | | | — | | | | — | |
| | | $ | 15,813 | | | $ | 138,030 | |
8). FUND REORGANIZATION
On March 23, 2009 the shareholders of the Tamarack Large Cap Growth Fund approved the agreement and plan of reorganization providing for the transfer of assets of the Tamarack Large Cap Growth Fund to the Hennessy Cornerstone Large Growth Fund and the assumption of the liabilities of the Tamarack Large Cap Growth Fund by the Hennessy Cornerstone Large Growth Fund. The following table illustrates the specifics of the reorganization:
| | Shares issued to | | | |
| Acquired Fund | Shareholders of | Acquiring Fund | Combined | Tax Status |
| Net Assets | Acquired Fund | Net Assets | Net Assets | of Transfer |
$51,980,253(1) | 7,722,854 | — | $51,980,253 | Non-taxable |
| | (1) | Includes accumulated realized losses and unrealized depreciation in the amounts of ($13,369,709) and ($16,139,531) respectively. |
EXPENSE EXAMPLE
Expense Example
April 30, 2010 (Unaudited)
As a shareholder of the Funds, you incur two types of costs: (1) transaction costs, including sales charges (loads) on purchase payments, reinvested dividends, or other distributions; redemption fees; and exchange fees; and (2) ongoing costs, including management fees; service fees; and other Fund expenses. This Example is intended to help you understand your ongoing costs (in dollars) of investing in each of the Funds and to compare these costs with the ongoing costs of investing in other mutual funds. The Example is based on an investment of $1,000 invested at the beginning of the period and held for the entire period from November 1, 2009 through April 30, 2010.
Actual Expenses
The first set of lines of the table below provide information about actual account values and actual expenses. Although the Funds charge no sales loads or transaction fees, you will be assessed fees for outgoing wire transfers, returned checks and stop payment orders at prevailing rates charged by U.S. Bancorp Fund Services, LLC, the Funds’ transfer agent. If you request that a redemption be made by wire transfer, currently a $15.00 fee is charged by the Funds’ transfer agent. IRA accounts will be charged a $15.00 annual maintenance fee (not to exceed $30 per social security number). The example below includes, but is not limited to, management fees, shareholder servicing fees, fund accounting, custody and transfer agent fees. However, the example below does not include portfolio trading commissions and r elated expenses, interest expense or dividends on short positions taken by the Fund and other extraordinary expenses as determined under generally accepted accounting principles. You may use the information within these lines, together with the amount you invested, to estimate the expenses that you paid over the six-month period. Simply divide your account value by $1,000 (for example, an $8,600 account value divided by $1,000 = 8.6), then multiply the result by the number in the first line under the heading entitled “Expenses Paid During Period” to estimate the expenses you paid on your account during this period.
Hypothetical Example for Comparison Purposes
The second set of lines within the table below provide information about hypothetical account values and hypothetical expenses based on the Funds’ actual expense ratios and an assumed rate of return of 5% per year before expenses, which is not the Funds’ actual return. The hypothetical account values and expenses may not be used to estimate the actual ending account balance or expenses you paid for the period. You may use this information to compare the ongoing costs of investing in the Funds and other funds. To do so, compare this 5% hypothetical example with the 5% hypothetical examples that appear in the shareholder reports of the other funds. Please note that the expenses shown in the table are meant to highlight your ongoing costs only and do not reflect any transactional costs, such as sales charges (loads), o r exchange fees. Therefore, the second line of the table is useful in comparing ongoing costs only, and will not help you determine the relative total costs of owning different funds. In addition, if these transactional costs were included, your costs would have been higher.
HENNESSY FUNDS 1-800-966-4354
| | Beginning | Ending | Expenses Paid |
| | Account Value | Account Value | During Period(1) |
| Original Class | 11/1/09 | 4/30/10 | 11/1/09 - 4/30/10 |
| | | | |
| Actual | | | |
| Growth Fund – Original Class | $1,000.00 | $1,203.20 | $7.32 |
| Growth II Fund – Original Class | $1,000.00 | $1,278.60 | $9.21 |
| Focus 30 Fund – Original Class | $1,000.00 | $1,214.20 | $7.63 |
| Large Growth Fund – Original Class | $1,000.00 | $1,183.70 | $7.04 |
| Value Fund – Original Class | $1,000.00 | $1,149.00 | $6.71 |
| Total Return Fund – Original Class | $1,000.00 | $1,117.80 | $6.88 |
| Balanced Fund – Original Class | $1,000.00 | $1,061.50 | $8.43 |
| | | | |
| Hypothetical (5% return | | | |
| before expenses) | | | |
| Growth Fund – Original Class | $1,000.00 | $1,018.15 | $6.71 |
| Growth II Fund – Original Class | $1,000.00 | $1,016.71 | $8.15 |
| Focus 30 Fund – Original Class | $1,000.00 | $1,017.90 | $6.95 |
| Large Growth Fund – Original Class | $1,000.00 | $1,018.35 | $6.51 |
| Value Fund – Original Class | $1,000.00 | $1,018.55 | $6.31 |
| Total Return Fund – Original Class | $1,000.00 | $1,018.30 | $6.56 |
| Balanced Fund – Original Class | $1,000.00 | $1,016.61 | $8.25 |
| (1) | Expenses are equal to the Growth Fund’s expense ratio of 1.34%, the Growth II Fund’s expense ratio of 1.63%, the Focus 30 Fund’s expense ratio of 1.39%, the Large Growth Fund’s expense ratio of 1.30%, the Value Fund’s expense ratio of 1.26%, the Total Return Fund’s expense ratio of 1.31%, and the Balanced Fund’s expense ratio of 1.65%, multiplied by the average account value over the period, multiplied by 181/365 days (to reflect one-half year period.) |
| | Beginning | Ending | Expenses Paid |
| | Account Value | Account Value | During Period(2) |
| Institutional Class | 11/1/09 | 4/30/10 | 11/1/09 - 4/30/10 |
| | | | |
| Actual | | | |
| Growth Fund – Institutional Class | $1,000.00 | $1,031.82 | $4.94 |
| Growth II Fund – Institutional Class | $1,000.00 | $1,044.04 | $4.97 |
| Focus 30 Fund – Institutional Class | $1,000.00 | $1,033.70 | $4.94 |
| Large Growth Fund – Institutional Class | $1,000.00 | $1,028.90 | $4.93 |
| Value Fund – Institutional Class | $1,000.00 | $1,023.56 | $4.92 |
| | | | |
| Hypothetical (5% return | | | |
| before expenses) | | | |
| Growth Fund – Institutional Class | $1,000.00 | $1,003.10 | $4.87 |
| Growth II Fund – Institutional Class | $1,000.00 | $1,003.10 | $4.87 |
| Focus 30 Fund – Institutional Class | $1,000.00 | $1,003.10 | $4.87 |
| Large Growth Fund – Institutional Class | $1,000.00 | $1,003.10 | $4.87 |
| Value Fund – Institutional Class | $1,000.00 | $1,003.10 | $4.87 |
| (2) | Expenses are equal to the Growth, Growth II, Focus 30, Large Growth, and Value Funds’ expense ratio of 0.98%, multiplied by the average account value over the period, multiplied by 181/365 days (to reflect one-half year period.) |
EXPENSE EXAMPLE AND PROXY VOTING POLICY
How to Obtain a Copy of the Funds’ Proxy Voting Policy and Proxy Voting Records
A description of the policies and procedures that the Funds use to determine how to vote proxies relating to portfolio securities is available without charge: (1) by calling 1-800-966-4354; (2) on the Hennessy Funds website at www.hennessyfunds.com; or (3) on the U.S. Securities and Exchange Commission’s website at www.sec.gov. Hennessy Funds’ proxy voting record is available on the SEC’s website at www.sec.gov no later than August 31 for the prior 12 months ending June 30.
Quarterly Filings on Form N-Q
The Funds file their complete schedule of portfolio holdings with the SEC for the first and third quarters of each fiscal year on Form N-Q. The Funds’ Form N-Q will be available on the SEC’s website at www.sec.gov. The Funds’ Form N-Q may be reviewed and copied at the SEC’s Public Reference Room in Washington, DC and information on the operation of the Public Reference Room may be obtained by calling 1-800-SEC-0330. Information included in the Funds’ N-Q will also be available upon request by calling 1-800-966-4354.
Federal Tax Distribution Information (Unaudited)
The Value, Total Return and Balanced Fund designated 100%, 100% and 99.32%, respectively, of the dividend declared from net investment income during the year ended October 31, 2009, as qualified dividend income under the Jobs Growth and Tax Reconciliation Act of 2003.
For the year ended October 31, 2009, 84.20%, 100% and 99% of the ordinary income distributions paid by the Value, Total Return and Balanced Funds, respectively, qualify for the dividends received deduction available to corporate shareholders.
HENNESSY FUNDS 1-800-966-4354
Board Approval of Continuation of
Investment Advisory Agreement
At its meeting on March 3, 2010, the Board of Directors (the “Board”) of The Hennessy Funds, Inc. and its two series, the Hennessy Balanced Fund (the “Balanced Fund”) and the Hennessy Total Return Fund (the “Total Return Fund”), The Hennessy Mutual Funds, Inc. and its three series, the Hennessy Cornerstone Growth Fund (the “Growth Fund”), the Hennessy Cornerstone Value Fund (the “Value Fund”), and the Hennessy Focus 30 Fund (the “Focus 30 Fund”), The Hennessy Funds Trust which includes the Hennessy Cornerstone Growth Fund, Series II (the “Growth II Fund”), Hennessy Cornerstone Large Growth Fund (the “Large Growth Fund”), and the Hennessy Select Large Value Fund (the “Large Value” Fund), and the Hennessy SPARX Funds Trust and its two series, the Hennessy Select SPARX Japan Fund (the “Japan Fund”) and the Hennessy Select SPARX Japan Smaller Companies Fund (the “Japan Smaller Companies Fund” or collectively with the Growth, Growth II, Value, Focus 30, Total Return, Balanced, Large Value and Large Growth funds, the “Funds”) including the Directors who are not “interested persons” (as defined in the Investment Company Act of 1940) of the Funds’ voted to re-approve the current investment advisory and sub-advisory agreements (the “Advisory Agreements”) for the Funds. The Board reviewed and discussed the specific services provided by Hennessy Advisors, Inc. (the “Advisor”). The Advisor:
| | • | Provides formula driven investment management for the Balanced Fund, Total Return Fund, Growth Fund, Value Fund, Focus 30 Fund, Growth II Fund and Large Growth Fund. In providing investment management the Advisor directs the trading of securities and the rebalancing of the portfolios for these seven Funds. |
| | • | Provides oversight of the sub-advisors for the Hennessy Select Large Value Fund, Hennessy Select SPARX Japan Fund and Hennessy Select SPARX Japan Smaller Companies Fund. The sub-advisors for those three Funds provide portfolio management, including directing the trading of securities. |
| | • | Pays half of the salary and payroll expenses of the Funds’ Chief Compliance Officer. |
| | • | Provides responsive customer and shareholder servicing which consists of providing a call center to respond to shareholder inquiries, including specific mutual fund account information. Shareholders can contact the Advisor directly during office hours. The Advisor endeavors to answer all calls in person within two rings of the telephone. |
| | • | Oversees distribution of the Funds through third-party broker/dealers and independent financial institutions such as Charles Schwab, Inc., Fidelity, TD Waterhouse and Pershing. The Advisor participates in “no transaction fee” (“NTF”) programs with these companies, which allows customers to |
BOARD APPROVAL OF CONTINUATION OF INVESTMENT ADVISORY AGREEMENT
| | | purchase the Funds through third party distribution channels without paying a transaction fee. The Advisor pays a portion of the fees charged by these third party distributors. |
| | • | Oversees those third party service providers that support the Funds in providing fund accounting, fund administration, fund distribution, transfer agency and custodial services. |
The Board also: (i) compared the performance of each Fund to benchmark indices over various periods of time and concluded that the performance of each Fund warranted the continuation of the Advisory Agreement; (ii) compared the expense ratios of funds similar in asset size and investment objective to each of the Funds and concluded the actual or projected expenses of each Fund were reasonable and warranted continuation of the Advisory Agreement; (iii) considered the fees charged by Hennessy Advisors, Inc. to those of funds similar in asset size and investment objective to each of the Funds and concluded the advisory fees of each Fund were reasonable and warranted continuation of the Advisory Agreement; (iv) considered the profitability of Hennes sy Advisors, Inc. with respect to each Fund and the profitability of the Sub-Advisors with respect to the Select Series Funds and concluded the profits were reasonable and not excessive when compared to profitability guidelines set forth in relevant court cases; (v) considered the high level of professionalism and knowledge, along with an extremely low level of turnover, of the employees of the Advisor; and (vi) considered that Neil Hennessy was named one of the top 100 portfolio managers in the nation from 2003 through 2008 by Barron’s (there was no list in 2009).
The Board then discussed economies of scale and breakpoints and determined that the Funds managed by Hennessy Advisors, Inc. have not yet grown in size, nor has their marketplace demonstrated significantly rapid potential growth to any extent that would warrant the use of breakpoints. The Funds have, in fact, had their assets under management greatly diminish during 2008 and 2009. In reaching this conclusion the Board took into consideration the profitability of Hennessy Advisors, Inc. and the advisory fees of comparable mutual funds.
The Board reviewed the Funds’ expense ratios and comparable expense ratios for funds like the ten funds being considered for contract renewal by Hennessy Advisors, Inc. The Board used data from Lipper as presented in the charts in the Board Materials showing funds similar in nature to the Hennessy Funds (Mid-Cap Blend, Small Cap Blend, etc.). The Board determined that the expense ratios of the Funds fall within the range of the ratios of other funds in their classification. The Board also referenced the Advisor’s Form ADV and copies of the current Investment Advisory Agreements. All of the factors above were considered separately by the non-interested Directors in an executive session during which management of the Advisor was not present. The factors were viewed in their totality by the Board, with no single factor being the principal or determinative factor in the Board’s determination of whether to approve the continuation of the Advisory Agreements. Based on the factors discussed above, the Board, including all Independent Directors, recommended continuation of the Advisory Agreements.
HENNESSY FUNDS 1-800-966-4354
For information, questions
or assistance, please call
The Hennessy Funds
1-800-966-4354 or 1-415-899-1555
| INVESTMENT ADVISOR | TRUSTEES |
| Hennessy Advisors, Inc. | Neil J. Hennessy |
| 7250 Redwood Blvd., Suite 200 | Robert T. Doyle |
| Novato, California 94945 | J. Dennis DeSousa |
| | Gerald P. Richardson |
| ADMINISTRATOR, TRANSFER | |
| AGENT, DIVIDEND PAYING | COUNSEL |
| AGENT & SHAREHOLDER | Foley & Lardner LLP |
| SERVICING AGENT | 777 East Wisconsin Avenue |
| U.S. Bancorp Fund Services, LLC | Milwaukee, Wisconsin 53202-5306 |
| P.O. Box 701 | |
| Milwaukee, Wisconsin 53201-0701 | INDEPENDENT REGISTERED |
| | PUBLIC ACCOUNTING FIRM |
| CUSTODIAN | KPMG LLP |
| U.S. Bank N.A. | 303 East Wacker Drive |
| Custody Operations | Chicago, Illinois 60601 |
| 1555 North River Center Dr., Suite 302 | |
| Milwaukee, Wisconsin 53212 | DISTRIBUTOR |
| | Quasar Distributors, LLC |
| | 615 East Michigan Street |
| | Milwaukee, Wisconsin 53202 |
WWW.HENNESSYFUNDS.COM
This report has been prepared for shareholders and may be distributed to others only if preceded or accompanied by a current prospectus.
HENNESSY FUNDS
SEMI-ANNUAL REPORT
APRIL 30, 2010
Hennessy Select Large Value Fund
Hennessy Select SPARX Japan Fund
Hennessy Select SPARX Japan Smaller Companies Fund
Contents
| Letter to shareholders | | 1 |
| Fund performance review and outlook | | 4 |
| Summaries of investments | | |
| Hennessy Select Large Value Fund | | 8 |
| Hennessy Select SPARX Japan Fund | | 14 |
| Hennessy Select SPARX Japan Smaller Companies Fund | | 18 |
| Financial statements | | |
| Statements of assets and liabilities | | 24 |
| Statements of operations | | 26 |
| Statements of changes in net assets | | 28 |
| Financial highlights | | |
| Hennessy Select Large Value Fund | | 34 |
| Hennessy Select SPARX Japan Fund | | 38 |
| Hennessy Select SPARX Japan Smaller Companies Fund | | 42 |
| Notes to the financial statements | | 44 |
| Expense example | | 53 |
| Additional information | | 55 |
| Board approval of continuation | | |
| of investment advisory agreement | | 56 |
LETTER TO SHAREHOLDERS
June, 2010
Dear Hennessy Funds Shareholder:
In the past six months, the investing landscape continued to be wrought with fear, panic and unending volatility. Every one of us, professional and individual investors alike, feel like we have been in a heavyweight fight; battered and bruised, but we are still standing. As I really focus on the fundamentals, and don’t get caught up in the headlines, I believe that we will see moderate, sustainable growth. But, just as the recovery felt like it was finally gathering steam, the market plunge last month has sent investors fleeing for cover once again. Watching the markets is beginning to feel like watching a “vertical tennis match” – lobs going up and lobs coming down, up and down.
We all know firsthand that investor confidence is still shaken. Despite very strong returns for the markets since the lows in March, 2009, people don’t believe the recovery is real and are still on the sidelines in money market funds, or perhaps even worse in my view, they are pouring their money into bonds and fixed income products. I can completely understand investors’ fears, but I was shocked to find out that many people I have spoken to believe the returns of the major indices last year were actually negative (the Dow Jones Industrial Average returned +23% for the calendar year 2009; the S&P Index +26%). That shows me just how much emotion can cloud reality.
With long-term history as my guide, I continue to believe that we should see annualized returns in the equity markets in the 8-10% range over the long run. In my opinion, interest rates will increase to more historically normal levels, and that may cause trouble for bond investments. I also foresee that companies may move toward increasing or initiating dividends. During the recent downturn, many companies took the opportunity to lay off excess employees, take write offs and close unprofitable business lines. These firms have emerged “lean and mean,” and any increase in sales will likely fall directly to their bottom lines. This lower growth environment provides a great opportunity for companies to increase dividends in order to try and drive the ir underlying stock prices higher. Companies with strong retained earnings and cash positions should have no problem covering these dividends in the future. The S&P 500 companies alone have approximately $600 billion in cash on their balance sheets currently.
HENNESSY FUNDS 1-800-966-4354
I don’t mean to come off as cavalier or uncaring, but the market will do what the market will do. We can’t control it. What we can control are our emotions and reactions to the volatility and headlines. We can control our own individual investment goals and decisions, and we can maintain a disciplined approach to investing. I know it is hard to tune out all the noise about recession, double dips and sovereign debt, but if you can stick with buying and holding high quality investments, and you rebalance regularly, I truly believe that over the long run you should do just fine. Some pundits would say that the markets are fundamentally different today and that we are in for dramatically different types of market cycles in the future. Not to say we won’t continue to see big swings, but my 30+ years in the business has shown me that the more things change, the more they stay the same. We have been through hard times in our economy before, and we will survive these hard times as well. Over time, I hope we will all be able to view this period in its proper historical context.
Thank you for your continued support and investment in the Hennessy Funds. You can be confident that we will maintain our strict adherence to our time tested investment strategies. We appreciate your business and want you to know that in every decision we make, we put our shareholders first.
Best regards,
Neil J. Hennessy
Portfolio Manager & Chief Investment Officer
Past performance does not guarantee future results.
Mutual fund investing involves risk. Principal loss is possible.
The S&P 500 Index and Dow Jones Industrial Average are unmanaged indices commonly used to measure the performance of U.S. stocks. One cannot invest directly in an index.
Opinions expressed are those of Neil Hennessy and are subject to change, are not guaranteed and should not be considered investment advice.
LETTER TO SHAREHOLDERS
(This Page Intentionally Left Blank.)
HENNESSY FUNDS 1-800-966-4354
Fund Performance Review and Outlook
RBC GLOBAL ASSET MANAGEMENT (U.S.), SUB-ADVISOR
Hennessy Select Large Value Fund
For the six month period ended April 30, 2010, the Hennessy Select Large Value Fund returned 13.97%, underperforming its benchmark index, the Russell 1000 Value Index, which returned 17.77%. The Fund employs a sector neutral approach, so the Fund’s relative performance is the result of stock selection, not sector selection. Versus the Index, the Fund performed best in the Telecommunications and Utilities sectors, but saw the widest underperformance in the Financial and Industrial sectors.
Within the Financial sector, the portfolio was fully invested in commercial banks, holding an average of 5.5% of the portfolio in that industry, and recorded excellent returns, with that sector of the portfolio gaining 21.7%. However, that industry did even better within the Russell 1000 Value Index, returning 31.1%. The Fund has been positioned in the higher quality banks in the industry, such as US Bancorp, which gained 15.7% during the period. However, the lower quality banks have had much better returns as investors flocked to companies showing the most potential improvement rather than those with the highest quality earnings and balance sheets. Similarly, while slightly underweight the industry, the Fund had good returns in the Real Estate Investment Trust (REIT) part of the Financial sector, gaining 29.2%. However, with lower quality REITS leading the way, the sector overall gained 34.4%. Fund management believes that while the economic recovery will be solid and continuing, there has been excess enthusiasm for the lower quality companies in the Financial sector, and we are continuing to emphasize higher quality holdings.
The Fund’s experience in the Industrial sector was similar to the Financial sector. The portfolio showed good returns, gaining 25.5%, but the overall Industrial sector did even better, returning 32.0%. The entire shortfall versus the benchmark was in the machinery industry. Companies highly leveraged to the economic cycle, and especially to traditionally early cycle activities, did especially well as that sub-sector returned 28.9%. The Fund’s holding of Illinois Toolworks did well, gaining 12.6%, but not well enough to keep up. Fund management believes that the current prices of the highly cyclical machinery companies requires an earnings level in 2011 which they may well not attain, and continues to own companies which should not require as much earnings improvement for the sto ck prices to advance.
The Fund correctly anticipated that electric utilities would do poorly in the current environment, and owned gas utilities and multi-utilities instead. This proved highly beneficial, as the gas utility industry in the benchmark index gained 19.7% versus 7.2% for electric utilities. Stock selection within the gas utility industry also helped, as the portfolio gained 25.6% versus the aforementioned 19.7%.
FUND PERFORMANCE REVIEW AND OUTLOOK
The Telecommunications sector is dominated by two companies, AT&T and Verizon. The Fund performed in line with the market regarding those two losing a little ground in Verizon and gaining it back in AT&T. The sector performance of the portfolio was greatly helped by a position in Qwest Communication, which gained 51.5% during the period.
During the period the Fund’s performance was hampered, versus the benchmark, by being invested in higher quality and less cyclical companies. However, we believe that higher quality stocks should begin to perform more strongly and that the portfolio is very well positioned going forward.
SPARX ASSET MANAGEMENT CO., LTD., SUB-ADVISOR
During the six month period from November, 2009 through April, 2010, the Japanese equity market remained somewhat volatile. In the month of November, Japan’s stock indices fell as the US Dollar (USD) weakened against the Japanese Yen (JPY) to the lowest level in more than 14 years ($1 = 84 JPY). However, the equity market soon resumed its upward momentum from December forward after the nation’s central bank announced that it would “make utmost efforts to pull the economy out of deflation” underscoring hopes for an economic recovery in 2010. News of Greece’s bloated deficit, a weakening of the Euro against the JPY and concerns over the impact of Toyota’s vehicle recalls sent Japanese shares lower in February. Come March, reports that the Bank of Japan was considering further monetary easing caused the cu rrency to fall to the 90 level against the USD and consequently triggered a rally in the Japanese equity market that sent the Nikkei 225 above the 11,000 mark. In April, the market remained almost flat as investors awaited Japan Inc.’s earnings guidance for the fiscal year ending in March, 2011.
In our view, investors grow more and more relieved as many Japanese firms announce increased forecast revisions for the current fiscal year ending in March, 2011. Also, concerns about further drastic currency fluctuations have abated since the JPY continued to weaken against the USD. Our research indicates that now is the time to invest in Japan as we continue to see great investment opportunities based on our view that there are many firms that are still undervalued despite a recovery in corporate earnings. Given that, we believe that investors will hunt for these undervalued individual names that have stronger balance sheets, competitive manufacturing edge combined with high quality craftsmanship or energy-efficient technologies.
Hennessy Select SPARX Japan Fund
For the six-month period ended April 30, 2010, the Hennessy Select SPARX Japan Fund returned 6.99% while the TOPIX and MSCI Japan Indices gained 6.52% and 7.81% respectively. The largest contributors to the Fund’s performance among the TOPIX 33 sub-industries included shares of wholesalers, auto-related companies and electronic appliance makers. Conversely, drug makers, nonferrous metal producers and real estate firms were among the worst performers.
Among individual companies, the chief positive contributors to the Fund’s performance during the period came from Japan’s leading maker of trucks, Isuzu Motors Ltd., and the nation’s leading supplier of factory automation sensors,
HENNESSY FUNDS 1-800-966-4354
Keyence Corporation. Shares of Isuzu advanced +53% on optimism that its truck sales may increase in Thailand and the rest of Asia. Keyence shares rose +23% on the back of several positive brokerage reports on its rival company Omron Corporation, another leading factory automation sensor manufacturer, in which analysts highlighted Omron’s robust revenue trend in mainland China and its potential for long-term growth and market expansion in the region.
Taiyo Nippon Sanso Corp., the nation’s No. 1 producer of industrial gases, and drug maker, Rohto Pharmaceutical Co., Ltd., were among the leading detractors to the Fund’s performance for the period. The share price of Taiyo Nippon slid -17% on profit taking following a sharp increase in the second-half of 2009. Rohto’s stock price slumped -11% as investors shifted their investments from the so-called “defensive” names into cyclical stocks amid a global recovery.
Hennessy Select SPARX Japan Smaller Companies Fund
For the six-month period ended April 30, 2010, the Hennessy Select SPARX Japan Smaller Companies Fund had a total return of 7.14%, outperforming its benchmark index, the MSCI Small Cap Japan Index, which returned 5.86%. The biggest contributors to the Fund’s performance among the TOPIX 33 sub-industries included shares of electronic appliance makers, retailers and wholesalers. Conversely, textiles & apparels makers, construction firms, banks and real estate firms were among the worst performers.
Among individual companies, the chief positive contributors to the Fund’s performance during the period were Press Kogyo Co., Ltd. a leading manufacturer of press parts for automobiles, and Fujitsu General Ltd., a leading producer of air conditioners. Shares of Press Kogyo advanced +48% on growing expectations that domestic demand for trucks has bottomed. Fujitsu General gained +57% after the company, for a second time this year, boosted its earnings forecast for its fiscal year ended March, 2010, citing a recovery in overseas demand for air conditioners and aggressive cost-cutting measures. The company had previously raised its earnings guidance in October, 2009.
Asunaro Aoki Construction Co., Ltd., a medium-scale general contractor, and T-Gaia Corporation, a leading mobile phone retailer, were among the leading detractors to the Fund’s performance for the period. The share price of Asunaro Aoki plunged -27% after surging from the beginning of this year. T-Gaia shares retreated -11% on profit-taking, following a sharp increase in December.
FUND PERFORMANCE REVIEW AND OUTLOOK
Past performance does not guarantee future results.
Mutual fund investing involves risk. Principal loss is possible. Small and medium-capitalization companies tend to have limited liquidity and greater price volatility than large-capitalization companies. Growth stocks typically are more volatile than value stocks; however, value stocks have a lower expected growth rate in earnings and sales. Investments in foreign securities involve greater volatility and political, economic and currency risk and differences in accounting methods.
References to specific securities should not be considered a recommendation to buy or sell any security. Fund holdings are subject to change. Please refer to the Schedule of Investments within this semi-annual report for additional portfolio information, including percentages of holdings.
The Dow Jones Industrial Average is an unmanaged index commonly used to measure the performance of U.S. stocks. The Russell Value index measures the performance of large cap, value-oriented stocks. The MSCI Japan Index is a market capitalization-weighted index of Japanese equities. The MSCI Japan Small Cap Index represents the universe of small capitalization companies in the Japanese equity markets. The Tokyo Stock Price Index (TOPIX) is a market capitalization-weighted index of all companies listed on the First Section of the Tokyo Stock Exchange. The TOPIX and MSCI Japan indices are presented in U.S. Dollar terms and take into account reinvestment of dividends. The Nikkei 225 is a stock market index for the Tokyo Stock Exchange. One cannot invest directly in an index.
Current and future holdings are subject to risk.
HENNESSY FUNDS 1-800-966-4354
Summaries of Investments
The following summaries of investments are designed to help investors better understand the Funds’ principal holdings. The summaries are as of April 30, 2010 (Unaudited).
HENNESSY SELECT
LARGE VALUE FUND
(% of Net Assets)
| | TOP TEN EQUITY HOLDINGS | % of net assets |
| | Exxon Mobil Corp. | 4.79% |
| | Chevron Corp. | 4.25% |
| | General Electric Co. | 3.61% |
| | JPMorgan Chase & Co. | 3.61% |
| | Bank of America Corp. | 3.21% |
| | Wells Fargo & Co. | 2.39% |
| | Schlumberger Ltd. | 2.36% |
| | Apache Corp. | 2.31% |
| | Comcast Corp. | 2.10% |
| | US Bancorp | 2.10% |
SUMMARY OF INVESTMENTS — HENNESSY SELECT LARGE VALUE FUND
| COMMON STOCKS – 98.83% | | Number | | | | | | % of | |
| | | of Shares | | | Value | | | Net Assets | |
| Consumer Discretionary – 12.11% | | | | | | | | | |
| CBS Corp. | | | 63,325 | | | $ | 1,026,498 | | | | 0.72 | % |
| Comcast Corp. | | | 151,400 | | | | 2,988,636 | | | | 2.10 | % |
| The Walt Disney Co. | | | 80,030 | | | | 2,948,305 | | | | 2.07 | % |
| Dean Foods Co. (a) | | | 64,280 | | | | 1,009,196 | | | | 0.71 | % |
| Ford Motor Co. (a) | | | 107,105 | | | | 1,394,507 | | | | 0.98 | % |
| The Gap, Inc. | | | 58,120 | | | | 1,437,308 | | | | 1.01 | % |
| Home Depot, Inc. | | | 67,105 | | | | 2,365,451 | | | | 1.66 | % |
| Macy’s, Inc. | | | 74,430 | | | | 1,726,776 | | | | 1.21 | % |
| Mattel, Inc. | | | 36,955 | | | | 851,813 | | | | 0.60 | % |
| Pulte Homes, Inc. (a) | | | 52,920 | | | | 692,723 | | | | 0.49 | % |
| Starwood Hotels & Resorts Worldwide, Inc. | | | 14,720 | | | | 802,387 | | | | 0.56 | % |
| | | | | | | | 17,243,600 | | | | 12.11 | % |
| Consumer Staples – 4.79% | | | | | | | | | | | | |
| Conagra Foods, Inc. | | | 53,065 | | | | 1,298,501 | | | | 0.91 | % |
| CVS Caremark Corp. | | | 35,300 | | | | 1,303,629 | | | | 0.92 | % |
| Dr. Pepper Snapple Group, Inc. | | | 56,300 | | | | 1,842,699 | | | | 1.29 | % |
| Kellogg Co. | | | 43,190 | | | | 2,372,858 | | | | 1.67 | % |
| | | | | | | | 6,817,687 | | | | 4.79 | % |
| Energy – 17.61% | | | | | | | | | | | | |
| Anadarko Petroleum Corp. | | | 20,280 | | | | 1,260,605 | | | | 0.89 | % |
| Apache Corp. | | | 32,285 | | | | 3,285,322 | | | | 2.31 | % |
| Chevron Corp. | | | 74,240 | | | | 6,046,106 | | | | 4.25 | % |
| ConocoPhillips | | | 6,120 | | | | 362,243 | | | | 0.25 | % |
| Devon Energy Corp. | | | 36,660 | | | | 2,468,318 | | | | 1.73 | % |
| Exxon Mobil Corp. | | | 100,630 | | | | 6,827,745 | | | | 4.79 | % |
| Schlumberger Ltd. (b) | | | 47,125 | | | | 3,365,667 | | | | 2.36 | % |
| Valero Energy Corp. | | | 70,565 | | | | 1,467,046 | | | | 1.03 | % |
| | | | | | | | 25,083,052 | | | | 17.61 | % |
| Financials – 25.00% | | | | | | | | | | | | |
| American Express Co. | | | 32,090 | | | | 1,479,991 | | | | 1.04 | % |
| Bank of America Corp. | | | 256,625 | | | | 4,575,624 | | | | 3.21 | % |
| Bank Of New York Mellon Corp. | | | 34,445 | | | | 1,072,273 | | | | 0.75 | % |
| Citigroup, Inc. (a) | | | 358,355 | | | | 1,566,011 | | | | 1.10 | % |
The accompanying notes are an integral part of these financial statements.
HENNESSY FUNDS 1-800-966-4354
| COMMON STOCKS | | Number | | | | | | % of | |
| | | of Shares | | | Value | | | Net Assets | |
| Financials (Continued) | | | | | | | | | |
| CME Group, Inc. | | | 3,860 | | | $ | 1,267,663 | | | | 0.89 | % |
| Digital Realty Trust, Inc. | | | 23,090 | | | | 1,355,383 | | | | 0.95 | % |
| The Goldman Sachs Group, Inc. | | | 11,355 | | | | 1,648,746 | | | | 1.16 | % |
| JPMorgan Chase & Co. | | | 120,685 | | | | 5,138,767 | | | | 3.61 | % |
| Lincoln National Corp. | | | 46,610 | | | | 1,425,800 | | | | 1.00 | % |
| MetLife, Inc. | | | 23,045 | | | | 1,050,391 | | | | 0.74 | % |
| Morgan Stanley | | | 82,165 | | | | 2,483,026 | | | | 1.74 | % |
| PNC Financial Services Group, Inc. | | | 31,830 | | | | 2,139,294 | | | | 1.50 | % |
| Simon Property Group, Inc. | | | 17,483 | | | | 1,556,337 | | | | 1.09 | % |
| Travelers Companies, Inc. | | | 48,450 | | | | 2,458,353 | | | | 1.73 | % |
| US Bancorp (d) | | | 111,520 | | | | 2,985,390 | | | | 2.10 | % |
| Wells Fargo & Co. | | | 102,815 | | | | 3,404,205 | | | | 2.39 | % |
| | | | | | | | 35,607,254 | | | | 25.00 | % |
| Health Care – 8.25% | | | | | | | | | | | | |
| Abbott Laboratories | | | 51,845 | | | | 2,652,390 | | | | 1.86 | % |
| Community Health Systems Inc. (a) | | | 51,770 | | | | 2,115,322 | | | | 1.49 | % |
| Forest Laboratories, Inc. (a) | | | 32,755 | | | | 892,901 | | | | 0.63 | % |
| Merck & Co., Inc. | | | 52,822 | | | | 1,850,883 | | | | 1.30 | % |
| Pfizer, Inc. | | | 115,255 | | | | 1,927,064 | | | | 1.35 | % |
| UnitedHealth Group, Inc. | | | 76,195 | | | | 2,309,471 | | | | 1.62 | % |
| | | | | | | | 11,748,031 | | | | 8.25 | % |
| Industrials – 11.52% | | | | | | | | | | | | |
| Boeing Co. | | | 13,870 | | | | 1,004,604 | | | | 0.71 | % |
| Cummins, Inc. | | | 10,380 | | | | 749,747 | | | | 0.53 | % |
| Deere & Co. | | | 19,035 | | | | 1,138,674 | | | | 0.80 | % |
| Foster Wheeler AG (a)(b) | | | 35,835 | | | | 1,074,333 | | | | 0.75 | % |
| General Dynamics Corp. | | | 19,970 | | | | 1,524,909 | | | | 1.07 | % |
| General Electric Co. | | | 272,780 | | | | 5,144,631 | | | | 3.61 | % |
| Illinois Tool Works, Inc. | | | 36,220 | | | | 1,850,842 | | | | 1.30 | % |
| Precision Castparts Corp. | | | 11,365 | | | | 1,458,584 | | | | 1.02 | % |
| Union Pacific Corp. | | | 32,530 | | | | 2,461,220 | | | | 1.73 | % |
| | | | | | | | 16,407,544 | | | | 11.52 | % |
The accompanying notes are an integral part of these financial statements.
SUMMARY OF INVESTMENTS — HENNESSY SELECT LARGE VALUE FUND
| COMMON STOCKS | | Number | | | | | | % of | |
| | | of Shares | | | Value | | | Net Assets | |
| Information Technology – 4.94% | | | | | | | | | |
| Hewlett-Packard Co. | | | 53,385 | | | $ | 2,774,419 | | | | 1.95 | % |
| Intel Corp. | | | 67,000 | | | | 1,529,610 | | | | 1.07 | % |
| Microsoft Corp. | | | 89,530 | | | | 2,734,246 | | | | 1.92 | % |
| | | | | | | | 7,038,275 | | | | 4.94 | % |
| Materials – 5.16% | | | | | | | | | | | | |
| Eastman Chemical Co. | | | 32,195 | | | | 2,154,490 | | | | 1.51 | % |
| Freeport-McMoRan Copper & Gold, Inc. | | | 8,595 | | | | 649,180 | | | | 0.46 | % |
| International Paper Co. | | | 67,730 | | | | 1,811,100 | | | | 1.27 | % |
| Pactiv Corp. (a) | | | 77,485 | | | | 1,968,894 | | | | 1.38 | % |
| United States Steel Corp. | | | 13,920 | | | | 760,867 | | | | 0.54 | % |
| | | | | | | | 7,344,531 | | | | 5.16 | % |
| Telecommunication Services – 3.25% | | | | | | | | | | | | |
| Qwest Communications International Inc. | | | 334,985 | | | | 1,751,971 | | | | 1.23 | % |
| Verizon Communications, Inc. | | | 99,695 | | | | 2,880,189 | | | | 2.02 | % |
| | | | | | | | 4,632,160 | | | | 3.25 | % |
| Utilities – 6.20% | | | | | | | | | | | | |
| American Electric Power, Inc. | | | 30,130 | | | | 1,033,459 | | | | 0.73 | % |
| Dominion Resources, Inc. | | | 35,565 | | | | 1,486,617 | | | | 1.04 | % |
| Exelon Corp. | | | 60,225 | | | | 2,625,208 | | | | 1.84 | % |
| MDU Resources Group, Inc. | | | 59,045 | | | | 1,251,754 | | | | 0.88 | % |
| PG&E Corp. | | | 55,465 | | | | 2,429,367 | | | | 1.71 | % |
| | | | | | | | 8,826,405 | | | | 6.20 | % |
| | | | | | | | | | | | | |
Total Common Stocks (Cost $117,830,759) | | | | | | | 140,748,539 | | | | 98.83 | % |
The accompanying notes are an integral part of these financial statements.
HENNESSY FUNDS 1-800-966-4354
| SHORT-TERM INVESTMENTS – 1.19% | | Number | | | | | | % of | |
| | | of Shares | | | Value | | | Net Assets | |
| Money Market Funds – 1.19% | | | | | | | | | |
| Fidelity Government Portfolio, 0.04% (c) | | | 1,693,344 | | | $ | 1,693,344 | | | | 1.19 | % |
| | | | | | | | | | | | | |
| Total Short-Term Investments | | | | | | | | | | | | |
| (Cost $1,693,344) | | | | | | | 1,693,344 | | | | 1.19 | % |
| | | | | | | | | | | | | |
Total Investments – 100.02% | | | | | | | | | | | | |
| (Cost $119,524,103) | | | | | | | 142,441,883 | | | | 100.02 | % |
| | | | | | | | | | | | | |
| Liabilities in Excess of Other Assets – (0.02)% | | | | | | | (26,857 | ) | | | (0.02 | )% |
TOTAL NET ASSETS – 100.00% | | | | | | $ | 142,415,026 | | | | 100.00 | % |
Percentages are stated as a percent of net assets.
| | (b) | Foreign issued security |
| | (c) | The rate listed is the Fund’s 7-day yield as of April 30, 2010. |
| | (d) | Investment in affiliated security. Quasar Distributors, LLC, which serves as the funds’ distributor, is a subsidiary of US Bancorp. Details of transactions with this affiliated company for the six months ended April 30, 2010 were as follows: |
| | Beginning | Purchase | Sales | Ending | Dividend | | Market |
| Issuer | Cost | Cost | Cost | Cost | Income | Shares | Value |
| US Bancorp | $1,519,765 | $0 | $201,782 | $1,721,547 | $12,674 | 111,520 | $2,985,390 |
Summary of Fair Value Exposure at April 30, 2010 (Unaudited)
The Fund has adopted authoritative fair valuation accounting standards which establish an authoritative definition of fair value and set out a hierarchy for measuring fair value. These standards require additional disclosures about the various inputs and valuation techniques used to develop the measurements of fair value and a discussion in changes in valuation techniques and related inputs during the period. These inputs are summarized in the three broad levels listed below.
The Fund has performed an analysis of all existing investments to determine the significance and character of all inputs to their fair value determination.
| | Level 1 – | Quoted unadjusted prices for identical instruments in active markets to which the Fund has access at the date of measurement. |
| | Level 2 – | Quoted prices for similar instruments in active markets; quoted prices for identical or similar instruments in markets that are not active; and model-derived valuations in which all significant inputs and significant value drivers are observable in active markets. Level 2 inputs are those in markets for which there are few transactions, the prices are not current, little public information exists or instances where prices vary substantially over time or among brokered market makers. |
| | Level 3 – | Model derived valuations in which one or more significant inputs or significant value drivers are unobservable. Unobservable inputs are those inputs that reflect the Fund’s own assumptions that market participants would use to price the asset or liability based on the best available information. |
The accompanying notes are an integral part of these financial statements.
SUMMARY OF INVESTMENTS — HENNESSY SELECT LARGE VALUE FUND
The inputs or methodology used for valuing securities are not an indication of the risk associated with investing in those securities.
The following is a summary of the inputs used to value the Fund’s net assets as of April 30, 2010:
| Common Stock | | Level 1 | | | Level 2 | | | Level 3 | | | Total | |
| Consumer Discretionary | | $ | 17,243,600 | | | $ | — | | | $ | — | | | $ | 17,243,600 | |
| Consumer Staples | | | 6,817,687 | | | | — | | | | — | | | | 6,817,687 | |
| Energy | | | 25,083,052 | | | | — | | | | — | | | | 25,083,052 | |
| Financials | | | 35,607,254 | | | | — | | | | — | | | | 35,607,254 | |
| Health Care | | | 11,748,031 | | | | — | | | | — | | | | 11,748,031 | |
| Industrials | | | 16,407,544 | | | | — | | | | — | | | | 16,407,544 | |
| Information Technology | | | 7,038,275 | | | | — | | | | — | | | | 7,038,275 | |
| Materials | | | 7,344,531 | | | | — | | | | — | | | | 7,344,531 | |
| Telecommunication Services | | | 4,632,160 | | | | — | | | | — | | | | 4,632,160 | |
| Utilities | | | 8,826,405 | | | | — | | | | — | | | | 8,826,405 | |
| Total Common Stock | | $ | 140,748,539 | | | $ | — | | | $ | — | | | $ | 140,748,539 | |
| Short-Term Investments | | $ | 1,693,344 | | | $ | — | | | $ | — | | | $ | 1,693,344 | |
| Total Investments in Securities | | $ | 142,441,883 | | | $ | — | | | $ | — | | | $ | 142,441,883 | |
The accompanying notes are an integral part of these financial statements.
HENNESSY FUNDS 1-800-966-4354
HENNESSY SELECT SPARX
JAPAN FUND
(% of Net Assets)
| | TOP TEN EQUITY HOLDINGS | % of net assets |
| | Keyence Corp. | 7.42% |
| | Mitsubishi Corp. | 6.21% |
| | Asics Corp. | 5.65% |
| | Fuji Seal International, Inc. | 5.41% |
| | Misumi Group, Inc. | 5.40% |
| | Kao Corp. | 5.36% |
| | Unicharm Corp. | 4.81% |
| | Ryohin Keikaku Co., Ltd. | 4.29% |
| | Rohto Pharmaceutical Co., Ltd. | 4.15% |
| | Marubeni Corp. | 4.12% |
SUMMARY OF INVESTMENTS — HENNESSY SELECT SPARX JAPAN FUND
| COMMON STOCKS – 90.38% | | Number of | | | | | | % of | |
| | | Shares | | | Value | | | Net Assets | |
| Consumer Discretionary – 20.27% | | | | | | | | | |
| Asics Corp. | | | 350,000 | | | $ | 3,348,081 | | | | 5.65 | % |
| Isuzu Motors, Ltd. | | | 565,000 | | | | 1,797,629 | | | | 3.03 | % |
| Mizuno Corp. | | | 45,000 | | | | 200,431 | | | | 0.34 | % |
| Ryohin Keikaku Co., Ltd. | | | 55,900 | | | | 2,541,513 | | | | 4.29 | % |
| Shimano, Inc. | | | 48,200 | | | | 2,200,026 | | | | 3.71 | % |
| Toyota Motor Corp. | | | 49,800 | | | | 1,924,170 | | | | 3.25 | % |
| | | | | | | | 12,011,850 | | | | 20.27 | % |
| Consumer Staples – 11.58% | | | | | | | | | | | | |
| Ariake Japan Co., Ltd. | | | 30,700 | | | | 458,711 | | | | 0.77 | % |
| Kao Corp. | | | 130,400 | | | | 3,179,399 | | | | 5.36 | % |
| Unicharm Corp. | | | 29,300 | | | | 2,847,982 | | | | 4.81 | % |
| Unicharm Petcare Corp. | | | 11,300 | | | | 376,379 | | | | 0.64 | % |
| | | | | | | | 6,862,471 | | | | 11.58 | % |
| Financials – 2.99% | | | | | | | | | | | | |
| Mizuho Financial Group, Inc. | | | 411,400 | | | | 792,161 | | | | 1.33 | % |
| Sumitomo Mitsui Financial Group, Inc. | | | 29,700 | | | | 982,234 | | | | 1.66 | % |
| | | | | | | | 1,774,395 | | | | 2.99 | % |
| Health Care – 6.47% | | | | | | | | | | | | |
| Mani, Inc. | | | 15,000 | | | | 536,783 | | | | 0.91 | % |
| Rohto Pharmaceutical Co., Ltd. | | | 225,000 | | | | 2,461,248 | | | | 4.15 | % |
| Terumo Corp. | | | 16,400 | | | | 835,506 | | | | 1.41 | % |
| | | | | | | | 3,833,537 | | | | 6.47 | % |
| Industrials – 26.01% | | | | | | | | | | | | |
| Daikin Industries Ltd. | | | 33,100 | | | | 1,248,210 | | | | 2.11 | % |
| Itochu Corp. | | | 222,000 | | | | 1,923,332 | | | | 3.24 | % |
| Komatsu, Ltd. | | | 75,200 | | | | 1,515,831 | | | | 2.56 | % |
| Marubeni Corp. | | | 414,000 | | | | 2,442,744 | | | | 4.12 | % |
| Misumi Group, Inc. | | | 160,500 | | | | 3,198,946 | | | | 5.40 | % |
| Mitsubishi Corp. | | | 155,400 | | | | 3,681,099 | | | | 6.21 | % |
| Sumitomo Corp. | | | 116,800 | | | | 1,406,495 | | | | 2.37 | % |
| | | | | | | | 15,416,657 | | | | 26.01 | % |
| Information Technology – 8.00% | | | | | | | | | | | | |
| Keyence Corp. | | | 18,400 | | | | 4,396,590 | | | | 7.42 | % |
The accompanying notes are an integral part of these financial statements.
HENNESSY FUNDS 1-800-966-4354
| COMMON STOCKS | | Number of | | | | | | % of | |
| | | Shares | | | Value | | | Net Assets | |
| Information Technology (Continued) | | | | | | | | | |
| Toshiba Corp. | | | 60,000 | | | $ | 345,872 | | | | 0.58 | % |
| | | | | | | | 4,742,462 | | | | 8.00 | % |
| Materials – 15.06% | | | | | | | | | | | | |
| Fuji Seal International, Inc. | | | 155,100 | | | | 3,205,141 | | | | 5.41 | % |
| JFE Holdings, Inc. | | | 10,900 | | | | 388,715 | | | | 0.66 | % |
| Sumitomo Metal Industries, Ltd. | | | 451,000 | | | | 1,224,195 | | | | 2.06 | % |
| Sumitomo Metal Mining Co., Ltd. | | | 113,000 | | | | 1,671,780 | | | | 2.82 | % |
| Taiyo Nippon Sanso Corp. | | | 271,000 | | | | 2,434,550 | | | | 4.11 | % |
| | | | | | | | 8,924,381 | | | | 15.06 | % |
| | | | | | | | | | | | | |
Total Common Stocks (Cost $54,227,320) | | | | | | | 53,565,753 | | | | 90.38 | % |
| | | | | | | | | | | | | |
| SHORT-TERM INVESTMENTS – 10.74% | | | | | | | | | | | | |
| Money Market Funds – 10.74% | | | | | | | | | | | | |
| Federated Treasury Obligations, 0.01% (a) | | | 384,910 | | | | 384,910 | | | | 0.65 | % |
| Federated Government Obligations, 0.08% (a) | | | 2,799,232 | | | | 2,799,232 | | | | 4.72 | % |
| Fidelity Government Portfolio, 0.04% (a) | | | 3,181,784 | | | | 3,181,784 | | | | 5.37 | % |
| | | | | | | | | | | | | |
| | | | | | | | 6,365,926 | | | | 10.74 | % |
| | | | | | | | | | | | | |
| Total Short-Term Investments | | | | | | | | | | | | |
| (Cost $6,365,926) | | | | | | | 6,365,926 | | | | 10.74 | % |
| | | | | | | | | | | | | |
Total Investments – 101.12% | | | | | | | | | | | | |
| (Cost $60,593,246) | | | | | | | 59,931,679 | | | | 101.12 | % |
| | | | | | | | | | | | | |
| Liabilities in Excess of Other Assets – (1.12)% | | | | | | | (667,152 | ) | | | (1.12 | )% |
TOTAL NET ASSETS – 100.00% | | | | | | $ | 59,264,527 | | | | 100.00 | % |
Percentages are stated as a percent of net assets.
| | (a) | The rate listed is the Fund’s 7-day yield as of April 30, 2010. |
The accompanying notes are an integral part of these financial statements.
SUMMARY OF INVESTMENTS — HENNESSY SELECT SPARX JAPAN FUND
Summary of Fair Value Exposure at April 30, 2010 (Unaudited)
The Fund has adopted authoritative fair valuation accounting standards which establish an authoritative definition of fair value and set out a hierarchy for measuring fair value. These standards require additional disclosures about the various inputs and valuation techniques used to develop the measurements of fair value and a discussion in changes in valuation techniques and related inputs during the period. These inputs are summarized in the three broad levels listed below.
The Fund has performed an analysis of all existing investments to determine the significance and character of all inputs to their fair value determination.
| Level 1 – | Quoted unadjusted prices for identical instruments in active markets to which the Fund has access at the date of measurement. |
| Level 2 – | Quoted prices for similar instruments in active markets; quoted prices for identical or similar instruments in markets that are not active; and model-derived valuations in which all significant inputs and significant value drivers are observable in active markets. Level 2 inputs are those in markets for which there are few transactions, the prices are not current, little public information exists or instances where prices vary substantially over time or among brokered market makers. |
| Level 3 – | Model derived valuations in which one or more significant inputs or significant value drivers are unobservable. Unobservable inputs are those inputs that reflect the Fund’s own assumptions that market participants would use to price the asset or liability based on the best available information. |
The inputs or methodology used for valuing securities are not an indication of the risk associated with investing in those securities.
The following is a summary of the inputs used to value the Fund’s net assets as of April 30, 2010:
| Common Stock | | Level 1 | | | Level 2 | | | Level 3 | | | Total | |
| Consumer Discretionary | | $ | — | | | $ | 12,011,850 | | | $ | — | | | $ | 12,011,850 | |
| Consumer Staples | | | — | | | | 6,862,471 | | | | — | | | | 6,862,471 | |
| Financials | | | — | | | | 1,774,395 | | | | — | | | | 1,774,395 | |
| Health Care | | | — | | | | 3,833,537 | | | | — | | | | 3,833,537 | |
| Industrials | | | — | | | | 15,416,657 | | | | — | | | | 15,416,657 | |
| Information Technology | | | — | | | | 4,742,462 | | | | — | | | | 4,742,462 | |
| Materials | | | — | | | | 8,924,381 | | | | — | | | | 8,924,381 | |
| Total Common Stock | | $ | — | | | $ | 53,565,753 | | | $ | — | | | $ | 53,565,753 | |
| Short-Term Investments | | $ | 6,365,926 | | | $ | — | | | $ | — | | | $ | 6,365,926 | |
| Total Investments in Securities | | $ | 6,365,926 | | | $ | 53,565,753 | | | $ | — | | | $ | 59,931,679 | |
The accompanying notes are an integral part of these financial statements.
HENNESSY FUNDS 1-800-966-4354
HENNESSY SELECT SPARX
JAPAN SMALLER COMPANIES FUND
(% of Net Assets)
| | TOP TEN EQUITY HOLDINGS | % of net assets |
| | Bals Corp. | 2.53% |
| | Fujitsu General Ltd. | 2.39% |
| | So-net M3, Inc. | 2.38% |
| | Press Kogyo Co., Ltd. | 2.30% |
| | SBS Holdings, Inc. | 2.17% |
| | ASKUL Corp. | 2.17% |
| | Suruga Bank, Ltd. | 2.17% |
| | SRA Holdings, Inc. | 2.07% |
| | Aica Kogyo Co., Ltd. | 2.06% |
| | Takeei Corp. | 1.99% |
SUMMARY OF INVESTMENTS — HENNESSY SELECT SPARX JAPAN SMALLER COMPANIES FUND
| COMMON STOCKS – 97.13% | | Number of | | | | | | % of | |
| | | Shares | | | Value | | | Net Assets | |
| Consumer Discretionary – 28.93% | | | | | | | | | |
| Amiyaki Tei Co., Ltd. | | | 77 | | | $ | 205,630 | | | | 1.14 | % |
| ASKUL Corp. | | | 19,400 | | | | 392,633 | | | | 2.17 | % |
| Bals Corp. | | | 422 | | | | 457,275 | | | | 2.53 | % |
| Fujitsu General Ltd. | | | 85,000 | | | | 432,214 | | | | 2.39 | % |
| Honeys Co., Ltd | | | 29,360 | | | | 296,910 | | | | 1.64 | % |
| Ikyu Corp. | | | 517 | | | | 286,836 | | | | 1.59 | % |
| Kadokawa Group Holdings, Inc. | | | 9,700 | | | | 223,710 | | | | 1.24 | % |
| Meiwa Estate Co., Ltd. | | | 40,500 | | | | 288,138 | | | | 1.60 | % |
| Nippon Seiki Co., Ltd. | | | 26,000 | | | | 285,950 | | | | 1.58 | % |
| Otsuka Kagu, Ltd. | | | 29,500 | | | | 345,518 | | | | 1.91 | % |
| Press Kogyo Co., Ltd. | | | 132,000 | | | | 416,176 | | | | 2.30 | % |
| Sanden Corp. | | | 66,000 | | | | 247,060 | | | | 1.37 | % |
| Sankyo Seiko Co., Ltd. | | | 48,000 | | | | 139,027 | | | | 0.77 | % |
| Seiren Co., Ltd. | | | 43,500 | | | | 268,203 | | | | 1.48 | % |
| Tohokushinsha Film Corp. | | | 49,700 | | | | 314,590 | | | | 1.74 | % |
| Village Vanguard Co., Ltd. | | | 75 | | | | 338,761 | | | | 1.88 | % |
| Wowow, Inc. | | | 131 | | | | 289,365 | | | | 1.60 | % |
| | | | | | | | 5,227,996 | | | | 28.93 | % |
| Consumer Staples – 1.54% | | | | | | | | | | | | |
| Cawachi Ltd. | | | 13,600 | | | | 278,117 | | | | 1.54 | % |
| | | | | | | | | | | | | |
| Financials – 7.32% | | | | | | | | | | | | |
| Anicom Holdings, Inc. (a) | | | 5,400 | | | | 172,747 | | | | 0.96 | % |
| Kyokuto Securities Co., Ltd. | | | 31,200 | | | | 265,061 | | | | 1.47 | % |
| RISA Partners, Inc. | | | 343 | | | | 216,507 | | | | 1.20 | % |
| Suruga Bank, Ltd. | | | 40,000 | | | | 392,523 | | | | 2.17 | % |
| Tokyo Tomin Bank, Ltd. | | | 22,800 | | | | 276,690 | | | | 1.52 | % |
| | | | | | | | 1,323,528 | | | | 7.32 | % |
| Health Care – 5.17% | | | | | | | | | | | | |
| Message Co., Ltd. | | | 152 | | | | 325,343 | | | | 1.80 | % |
| Paramount Bed Co., Ltd. | | | 9,500 | | | | 179,127 | | | | 0.99 | % |
| So-net M3, Inc. | | | 119 | | | | 430,639 | | | | 2.38 | % |
| | | | | | | | 935,109 | | | | 5.17 | % |
The accompanying notes are an integral part of these financial statements.
HENNESSY FUNDS 1-800-966-4354
| COMMON STOCKS | | Number of | | | | | | % of | |
| | | Shares | | | Value | | | Net Assets | |
| Industrials – 28.34% | | | | | | | | | |
| Aica Kogyo Co., Ltd. | | | 29,000 | | | $ | 372,681 | | | | 2.06 | % |
| Asunaro Aoki Construction., Ltd. | | | 61,000 | | | | 197,875 | | | | 1.10 | % |
| Benefit One, Inc. | | | 448 | | | | 349,369 | | | | 1.93 | % |
| Hirano Tecseed Co., Ltd. | | | 15,000 | | | | 178,447 | | | | 0.99 | % |
| Ichinen Holdings Co., Ltd. | | | 64,700 | | | | 290,589 | | | | 1.61 | % |
| Kito Corp. | | | 233 | | | | 263,414 | | | | 1.46 | % |
| Kyosan Electric Manufacturing Co., Ltd. | | | 64,000 | | | | 322,801 | | | | 1.79 | % |
| Nitto Kogyo Corp. | | | 27,200 | | | | 286,529 | | | | 1.59 | % |
| NPC Inc. | | | 11,200 | | | | 221,937 | | | | 1.23 | % |
| Prestige International, Inc. | | | 200 | | | | 338,444 | | | | 1.87 | % |
| SBS Holdings, Inc. | | | 450 | | | | 392,981 | | | | 2.17 | % |
| Shin Nippon Air Technologies Co., Ltd. | | | 30,200 | | | | 210,304 | | | | 1.16 | % |
| Takeei Corp. | | | 24,800 | | | | 360,467 | | | | 1.99 | % |
| Teraoka Seisakusho Co., Ltd. | | | 72,900 | | | | 359,280 | | | | 1.99 | % |
| Tokyo Keiki, Inc. | | | 103,000 | | | | 186,635 | | | | 1.03 | % |
| Toshin Group Co., Ltd. | | | 16,100 | | | | 356,375 | | | | 1.97 | % |
| Uchida Yoko Co., Ltd. | | | 24,000 | | | | 77,034 | | | | 0.43 | % |
| Yushin Precision Equipment Co., Ltd. | | | 21,300 | | | | 356,151 | | | | 1.97 | % |
| | | | | | | | 5,121,313 | | | | 28.34 | % |
| Information Technology – 15.89% | | | | | | | | | | | | |
| Elecom Co., Ltd. | | | 31,300 | | | | 260,294 | | | | 1.44 | % |
| Macnica, Inc. | | | 15,200 | | | | 350,638 | | | | 1.94 | % |
| Nippon Chemi-con Corp. (a) | | | 75,000 | | | | 310,351 | | | | 1.72 | % |
| Otsuka Corp. | | | 4,800 | | | | 341,268 | | | | 1.89 | % |
| SRA Holdings, Inc. | | | 39,000 | | | | 373,302 | | | | 2.07 | % |
| Tamura Corp. | | | 102,000 | | | | 338,733 | | | | 1.87 | % |
| Works Applications Co., Ltd. | | | 466 | | | | 303,753 | | | | 1.68 | % |
| Yokowo Co., Ltd. | | | 47,800 | | | | 325,091 | | | | 1.80 | % |
| Zappallas, Inc. | | | 174 | | | | 267,938 | | | | 1.48 | % |
| | | | | | | | 2,871,368 | | | | 15.89 | % |
| Materials – 9.10% | | | | | | | | | | | | |
| Adeka Corp. | | | 36,000 | | | | 341,107 | | | | 1.89 | % |
| JSP Corp. | | | 19,400 | | | | 228,541 | | | | 1.26 | % |
The accompanying notes are an integral part of these financial statements.
SUMMARY OF INVESTMENTS — HENNESSY SELECT SPARX JAPAN SMALLER COMPANIES FUND
| COMMON STOCKS | | Number of | | | | | | % of | |
| | | Shares | | | Value | | | Net Assets | |
| Materials (Continued) | | | | | | | | | |
| Okura Industrial Co., Ltd. (a) | | | 51,000 | | | $ | 143,638 | | | | 0.80 | % |
| Senko Co., Ltd. | | | 70,000 | | | | 276,945 | | | | 1.53 | % |
| Shinagawa Refractories Co., Ltd. | | | 77,000 | | | | 240,005 | | | | 1.33 | % |
| Tokyo Tekko Co., Ltd. | | | 52,000 | | | | 156,719 | | | | 0.87 | % |
| Ube Material Industries, Ltd. | | | 92,000 | | | | 256,738 | | | | 1.42 | % |
| | | | | | | | 1,643,693 | | | | 9.10 | % |
| Utilities – 0.84% | | | | | | | | | | | | |
| Japan Wind Development Co., Ltd. | | | 60 | | | | 152,008 | | | | 0.84 | % |
| | | | | | | | | | | | | |
Total Common Stocks (Cost $14,918,212) | | | | | | | 17,553,132 | | | | 97.13 | % |
| | | | | | | | | | | | | |
| SHORT-TERM INVESTMENTS – 5.06% | | | | | | | | | | | | |
| Money Market Funds – 5.06% | | | | | | | | | | | | |
| Federated Government Obligations, 0.08% (b) | | | 137,968 | | | | 137,968 | | | | 0.76 | % |
| Fidelity Government Portfolio, 0.04% (b) | | | 776,348 | | | | 776,348 | | | | 4.30 | % |
| | | | | | | | | | | | | |
| Total Short-Term Investments | | | | | | | | | | | | |
| (Cost $914,316) | | | | | | | 914,316 | | | | 5.06 | % |
| | | | | | | | | | | | | |
Total Investments – 102.19% | | | | | | | | | | | | |
| (Cost $15,832,528) | | | | | | | 18,467,448 | | | | 102.19 | % |
| | | | | | | | | | | | | |
| Liabilities in Excess of Other Assets – (2.19)% | | | | | | | (396,239 | ) | | | (2.19 | )% |
TOTAL NET ASSETS – 100.00% | | | | | | $ | 18,071,209 | | | | 100.00 | % |
Percentages are stated as a percent of net assets.
| | (a) | Non-income producing security. |
| | (b) | The rate listed is the Fund’s 7-day yield as of April 30, 2010. |
The accompanying notes are an integral part of these financial statements.
HENNESSY FUNDS 1-800-966-4354
Summary of Fair Value Exposure at April 30, 2010 (Unaudited)
The Fund has adopted authoritative fair valuation accounting standards which establish an authoritative definition of fair value and set out a hierarchy for measuring fair value. These standards require additional disclosures about the various inputs and valuation techniques used to develop the measurements of fair value and a discussion in changes in valuation techniques and related inputs during the period. These inputs are summarized in the three broad levels listed below.
The Fund has performed an analysis of all existing investments to determine the significance and character of all inputs to their fair value determination.
| Level 1 – | Quoted unadjusted prices for identical instruments in active markets to which the Fund has access at the date of measurement. |
| Level 2 – | Quoted prices for similar instruments in active markets; quoted prices for identical or similar instruments in markets that are not active; and model-derived valuations in which all significant inputs and significant value drivers are observable in active markets. Level 2 inputs are those in markets for which there are few transactions, the prices are not current, little public information exists or instances where prices vary substantially over time or among brokered market makers. |
| Level 3 – | Model derived valuations in which one or more significant inputs or significant value drivers are unobservable. Unobservable inputs are those inputs that reflect the Fund’s own assumptions that market participants would use to price the asset or liability based on the best available information. |
The inputs or methodology used for valuing securities are not an indication of the risk associated with investing in those securities.
The following is a summary of the inputs used to value the Fund’s net assets as of April 30, 2010:
| Common Stock | | Level 1 | | | Level 2 | | | Level 3 | | | Total | |
| Consumer Discretionary | | $ | — | | | $ | 5,227,996 | | | $ | — | | | $ | 5,227,996 | |
| Consumer Staples | | | — | | | | 278,117 | | | | — | | | | 278,117 | |
| Financials | | | — | | | | 1,323,528 | | | | — | | | | 1,323,528 | |
| Health Care | | | — | | | | 935,109 | | | | — | | | | 935,109 | |
| Industrials | | | — | | | | 5,121,313 | | | | — | | | | 5,121,313 | |
| Information Technology | | | — | | | | 2,871,368 | | | | — | | | | 2,871,368 | |
| Materials | | | — | | | | 1,643,693 | | | | — | | | | 1,643,693 | |
| Utilities | | | — | | | | 152,008 | | | | — | | | | 152,008 | |
| Total Common Stock | | $ | — | | | $ | 17,553,132 | | | $ | — | | | $ | 17,553,132 | |
| Short-Term Investments | | $ | 914,316 | | | $ | — | | | $ | — | | | $ | 914,316 | |
| Total Investments in Securities | | $ | 914,316 | | | $ | 17,553,132 | | | $ | — | | | $ | 18,467,448 | |
The accompanying notes are an integral part of these financial statements.
SUMMARY OF INVESTMENTS — HENNESSY SELECT SPARX JAPAN SMALLER COMPANIES FUND
(This Page Intentionally Left Blank.)
HENNESSY FUNDS 1-800-966-4354
Financial Statements
Statements of Assets and Liabilities as of April 30, 2010 (Unaudited) |
| | |
| | |
| | |
| | |
| ASSETS: | |
| Investments in unaffiliated securities, at value | |
| (cost $117,802,556, $60,593,246, and $15,832,528, respectively) | |
| Investments in affiliated securities, at value | |
| (cost $1,721,547, $0, and $0, respectively) | |
| Dividends and interest receivable | |
| Receivable for fund shares sold | |
| Receivable for securities sold | |
| Prepaid expenses and other assets | |
| Total Assets | |
| | |
| LIABILITIES: | |
| Payable for securities purchased | |
| Payable for fund shares redeemed | |
| Payable to Advisor | |
| Payable to Administrator | |
| Payable to Auditor | |
| Accrued service fees | |
| Accrued expenses and other payables | |
| Total Liabilities | |
| | |
| NET ASSETS | |
| | |
| NET ASSETS CONSIST OF: | |
| Capital stock | |
| Accumulated net investment income | |
| Accumulated net realized loss on investments | |
| Unrealized net appreciation (depreciation) on investments and foreign currency related transactions | |
| Total Net Assets | |
| | |
| NET ASSETS | |
| Original Class: | |
| Shares authorized (no par value, $0.001 and $0.001 par value, respectively) | |
| Net assets applicable to outstanding Original Class shares | |
| Shares issued and outstanding | |
| Net asset value, offering price and redemption price per share | |
| | |
| Institutional Class: | |
| Shares authorized (no par value and $0.001 par value, respectively) | |
| Net assets applicable to outstanding Institutional Class shares | |
| Shares issued and outstanding | |
| Net asset value, offering price and redemption price per share | |
The accompanying notes are an integral part of these financial statements.
FINANCIAL STATEMENTS – STATEMENTS OF ASSETS AND LIABILITIES
| | | | | | | HENNESSY | |
| HENNESSY | | | HENNESSY | | | SELECT SPARX | |
| SELECT LARGE | | | SELECT SPARX | | | JAPAN SMALLER | |
| VALUE FUND | | | JAPAN FUND | | | COMPANIES FUND | |
| | | | | | | | |
| | | | | | | | |
| $ | 139,456,493 | | | $ | 59,931,679 | | | $ | 18,467,448 | |
| | | | | | | | | | | |
| | 2,985,390 | | | | — | | | | — | |
| | 104,462 | | | | 363,521 | | | | 162,931 | |
| | 1,099 | | | | 58,137 | | | | 33,666 | |
| | 4,177,021 | | | | — | | | | 108,059 | |
| | 36,995 | | | | 4,230 | | | | 7,748 | |
| | 146,761,460 | | | | 60,357,567 | | | | 18,779,852 | |
| | | | | | | | | | | |
| | 4,015,348 | | | | — | | | | 661,587 | |
| | 106,720 | | | | 969,427 | | | | — | |
| | 101,495 | | | | 52,065 | | | | 16,748 | |
| | 88,072 | | | | 38,069 | | | | 9,836 | |
| | 12,851 | | | | 19,188 | | | | 18,179 | |
| | 11,937 | | | | — | | | | — | |
| | 10,011 | | | | 14,291 | | | | 2,293 | |
| | 4,346,434 | | | | 1,093,040 | | | | 708,643 | |
| | | | | | | | | | | |
| $ | 142,415,026 | | | $ | 59,264,527 | | | $ | 18,071,209 | |
| | | | | | | | | | | |
| $ | 171,395,570 | | | $ | 89,924,384 | | | $ | 18,388,018 | |
| | 196,673 | | | | (50,769 | ) | | | (365,044 | ) |
| | (52,094,997 | ) | | | (29,941,027 | ) | | | (2,588,013 | ) |
| | 22,917,780 | | | | (668,061 | ) | | | 2,636,248 | |
| $ | 142,415,026 | | | $ | 59,264,527 | | | $ | 18,071,209 | |
| | | | | | | | | | | |
| | | | | | | | | | | |
| Unlimited | | | Unlimited | | | Unlimited | |
| | 142,376,598 | | | | 31,953,208 | | | | 18,071,209 | |
| | 6,694,063 | | | | 2,629,314 | | | | 1,814,687 | |
| $ | 21.27 | | | $ | 12.15 | | | $ | 9.96 | |
| | | | | | | | | | | |
| Unlimited | | | Unlimited | | | | N/A | |
| | 38,428 | | | | 27,311,319 | | | | | |
| | 1,804 | | | | 2,234,238 | | | | | |
| $ | 21.30 | | | $ | 12.22 | | | | | |
HENNESSY FUNDS 1-800-966-4354
Financial Statements
Statement of Operations Six Months ended April 30, 2010 (Unaudited) |
| | |
| | |
| | |
| | |
| | |
| INVESTMENT INCOME: | |
Dividend income from unaffiliated securities(1) | |
| Dividend income from affiliated securities | |
| Interest income | |
| Total investment income | |
| | |
| EXPENSES: | |
| Investment advisory fees | |
| Administration, fund accounting, custody and transfer agent fees | |
| Service fees – Original Class (See Note 4) | |
| Federal and state registration fees | |
| Audit fees | |
| Legal fees | |
| Compliance expense | |
| Reports to shareholders | |
| Directors’ fees and expenses | |
| Sub-transfer agent expenses – Original Class (See Note 4) | |
| Sub-transfer agent expenses – Institutional Class (See Note 4) | |
| Other | |
| Total expenses before reimbursement from advisor | |
| Expense reimbursement from advisor: | |
| Original Class | |
| Institutional Class | |
| Administration Expense Waiver (See Note 4) | |
| Net expenses | |
| | |
| NET INVESTMENT INCOME (LOSS) | |
| | |
| REALIZED AND UNREALIZED GAINS (LOSSES): | |
| Net realized gain(loss) on: | |
| Investments from unaffiliated securities | |
| Investments from affiliated securities | |
| Foreign currency transactions | |
| Change in unrealized appreciation (depreciation) on: | |
| Investments | |
| Foreign currency translation | |
| | |
| NET REALIZED GAIN (LOSS) AND UNREALIZED GAIN (LOSS) ON INVESTMENTS | |
| | |
| NET INCREASE (DECREASE) IN NET ASSETS RESULTING FROM OPERATIONS | |
| (1) | Net of foreign taxes withheld of $0, $28,533 and $15,810, respectively. |
The accompanying notes are an integral part of these financial statements.
FINANCIAL STATEMENTS – STATEMENT OF OPERATIONS
| | | | | | | | |
| | | | | | | HENNESSY | |
| HENNESSY | | | HENNESSY | | | SELECT SPARX | |
| SELECT LARGE | | | SELECT SPARX | | | JAPAN SMALLER | |
| VALUE FUND | | | JAPAN FUND | | | COMPANIES FUND | |
| | | | | | | | |
| $ | 1,316,658 | | | $ | 379,087 | | | $ | 210,046 | |
| | 12,674 | | | | — | | | | — | |
| | 400 | | | | 713 | | | | 120 | |
| | 1,329,732 | | | | 379,800 | | | | 210,166 | |
| | | | | | | | | | | |
| | | | | | | | | | | |
| | 587,043 | | | | 277,643 | | | | 90,605 | |
| | 176,113 | | | | 70,799 | | | | 19,253 | |
| | 69,047 | | | | — | | | | — | |
| | 17,356 | | | | 12,743 | | | | 9,805 | |
| | 11,455 | | | | 9,917 | | | | 8,927 | |
| | 5,951 | | | | 4,960 | | | | 4,959 | |
| | 1,740 | | | | 1,740 | | | | 1,740 | |
| | 16,199 | | | | 7,439 | | | | 1,488 | |
| | 4,958 | | | | 4,959 | | | | 4,959 | |
| | 51,785 | | | | 38,210 | | | | 14,261 | |
| | — | | | | 2,000 | | | | — | |
| | 12,486 | | | | 496 | | | | 1,240 | |
| | 954,133 | | | | 430,906 | | | | 157,237 | |
| | | | | | | | | | | |
| | (38,444 | ) | | | (37,425 | ) | | | (19,527 | ) |
| | — | | | | (12,915 | ) | | | — | |
| | (39 | ) | | | — | | | | — | |
| | 915,650 | | | | 380,566 | | | | 137,710 | |
| $ | 414,082 | | | $ | (766 | ) | | $ | 72,456 | |
| | | | | | | | | | | |
| | | | | | | | | | | |
| | | | | | | | | | | |
| $ | 11,165,963 | | | $ | (1,925,738 | ) | | $ | 1,231,274 | |
| | (15,683 | ) | | | — | | | | — | |
| | — | | | | (7,749 | ) | | | (758 | ) |
| | | | | | | | | | | |
| | 6,530,061 | | | | 5,334,632 | | | | (231,389 | ) |
| | — | | | | (11,421 | ) | | | (1,913 | ) |
| | 17,680,341 | | | | 3,389,724 | | | | 997,214 | |
| | | | | | | | | | | |
| $ | 18,094,423 | | | $ | 3,388,958 | | | $ | 1,069,670 | |
HENNESSY FUNDS 1-800-966-4354
Financial Statements
| Statements of Changes in Net Assets |
| | |
| | |
| | |
| | |
| OPERATIONS: | |
| Net investment income | |
| Net realized gain (loss) on securities | |
| Change in unrealized appreciation (depreciation) on securities | |
| Net decrease in net assets resulting from operations | |
| | |
| DISTRIBUTIONS TO SHAREHOLDERS FROM: | |
| Net investment income – Original Class | |
| Net investment income – Institutional Class | |
| Net investment income – Class A | |
| Net investment income – Class C | |
| Net investment income – Class R | |
| Net investment income – Class S | |
| Total distributions | |
| | |
| CAPITAL SHARE TRANSACTIONS: | |
| Proceeds from shares issued in the reorganization (See Note 6) | |
| Proceeds from shares subscribed – Original Class | |
| Proceeds from shares subscribed – Institutional Class | |
| Proceeds from shares subscribed – Predecessor Class A | |
| Proceeds from shares subscribed – Predecessor Class C | |
| Proceeds from shares subscribed – Predecessor Class S | |
| Dividends reinvested – Original Class | |
| Dividends reinvested – Institutional Class | |
| Dividends reinvested – Predecessor Class A | |
| Dividends reinvested – Predecessor Class C | |
| Dividends reinvested – Predecessor Class R | |
| Dividends reinvested – Predecessor Class S | |
| Cost of shares redeemed – Original Class | |
| Cost of shares redeemed – Institutional Class | |
| Cost of shares redeemed – Predecessor Class A | |
| Cost of shares redeemed – Predecessor Class C | |
| Cost of shares redeemed – Predecessor Class R | |
| Cost of shares redeemed – Predecessor Class S | |
| Cost of shares redeemed in the reorganization – Predecessor Class A (See Note 6) | |
| Cost of shares redeemed in the reorganization – Predecessor Class C (See Note 6) | |
| Cost of shares redeemed in the reorganization – Predecessor Class S (See Note 6) | |
| Net increase (decrease) in net assets derived from capital share transactions | |
| TOTAL INCREASE (DECREASE) IN NET ASSETS | |
| | |
| NET ASSETS: | |
| Beginning of period | |
| End of period | |
| | |
| Accumulated net investment income (loss), end of period | |
| * | For the one month ended October 31, 2009. Effective October 31, 2009, the Fund changed its fiscal year end to October 31st from September 30th. |
The accompanying notes are an integral part of these financial statements.
FINANCIAL STATEMENTS – STATEMENTS OF CHANGES IN NET ASSETS
| Hennessy Select Large Value Fund | |
| Six Months Ended | | | | | | | |
| April 30, 2010 | | | One Month Ended | | | Year Ended | |
| (Unaudited) | | | October 31, 2009* | | | September 30, 2009 | |
| | | | | | | | |
| $ | 414,082 | | | $ | 40,481 | | | $ | 2,147,657 | |
| | 11,150,280 | | | | 2,121,192 | | | | (38,033,622 | ) |
| | 6,530,061 | | | | (6,438,340 | ) | | | 17,930,480 | |
| | 18,094,423 | | | | (4,276,667 | ) | | | (17,955,485 | ) |
| | | | | | | | | | | |
| | (1,607,669 | ) | | | — | | | | — | |
| | (468 | ) | | | — | | | | — | |
| | — | | | | — | | | | (2,447 | ) |
| | — | | | | — | | | | (250 | ) |
| | — | | | | — | | | | (47 | ) |
| | — | | | | — | | | | (3,119,888 | ) |
| | (1,608,137 | ) | | | — | | | | (3,122,632 | ) |
| | | | | | | | | | | |
| | — | | | | — | | | | 106,344,111 | |
| | 949,342 | | | | 148,751 | | | | 913,870 | |
| | 8,121 | | | | 3,402 | | | | 22,275 | |
| | — | | | | — | | | | 4,294 | |
| | — | | | | — | | | | 300 | |
| | — | | | | — | | | | 1,105,178 | |
| | 1,542,668 | | | | — | | | | — | |
| | 468 | | | | — | | | | — | |
| | — | | | | — | | | | 2,160 | |
| | — | | | | — | | | | 250 | |
| | — | | | | — | | | | 47 | |
| | — | | | | — | | | | 2,990,948 | |
| | (9,365,902 | ) | | | (1,443,405 | ) | | | (7,303,823 | ) |
| | (2,996 | ) | | | — | | | | — | |
| | — | | | | — | | | | (206,038 | ) |
| | — | | | | — | | | | (2,369 | ) |
| | — | | | | — | | | | (2,172 | ) |
| | — | | | | — | | | | (12,805,550 | ) |
| | — | | | | — | | | | (130,787 | ) |
| | — | | | | — | | | | (14,058 | ) |
| | — | | | | — | | | | (106,199,266 | ) |
| | (6,868,299 | ) | | | (1,291,252 | ) | | | (15,280,630 | ) |
| | 9,617,987 | | | | (5,567,919 | ) | | | (36,358,747 | ) |
| | | | | | | | | | | |
| | 132,797,039 | | | | 138,364,958 | | | | 174,723,705 | |
| $ | 142,415,026 | | | $ | 132,797,039 | | | $ | 138,364,958 | |
| $ | 196,673 | | | $ | 1,390,728 | | | $ | 1,350,367 | |
HENNESSY FUNDS 1-800-966-4354
Financial Statements
| Statements of Changes in Net Assets |
| | |
| | |
| | |
| | |
| CHANGES IN SHARES OUTSTANDING: | |
| Shares issued in connection with reorganization | |
| Shares sold | |
| Original Class | |
| Institutional Class | |
| Predecessor Class A | |
| Predecessor Class C | |
| Predecessor Class S | |
| Shares issued to holders as reinvestment of dividends | |
| Original Class | |
| Institutional Class | |
| Predecessor Class A | |
| Predecessor Class C | |
| Predecessor Class R | |
| Predecessor Class S | |
| Shares redeemed | |
| Original Class | |
| Institutional Class | |
| Predecessor Class A | |
| Predecessor Class C | |
| Predecessor Class R | |
| Predecessor Class S | |
| Shares redeemed in the reorganization | |
| Predecessor Class A | |
| Predecessor Class C | |
| Predecessor Class S | |
| Net increase (decrease) in shares outstanding | |
| * | For the one month ended October 31, 2009. Effective October 31, 2009, the Fund changed its fiscal year end to October 31st from September 30th. |
The accompanying notes are an integral part of these financial statements.
FINANCIAL STATEMENTS – STATEMENTS OF CHANGES IN NET ASSETS
| | | | | | | | |
| Hennessy Select Large Value Fund |
| Six Months Ended | | | | | | | |
| April 30, 2010 | | | One Month Ended | | | Year Ended | |
| (Unaudited) | | | October 31, 2009* | | | September 30, 2009 | |
| | | | | | | | |
| | — | | | | — | | | | 7,462,745 | |
| | | | | | | | | | | |
| | 46,708 | | | | 7,564 | | | | 56,201 | |
| | 405 | | | | 172 | | | | 1,355 | |
| | — | | | | — | | | | 272 | |
| | — | | | | — | | | | 20 | |
| | — | | | | — | | | | 68,408 | |
| | | | | | | | | | | |
| | 76,941 | | | | — | | | | — | |
| | 23 | | | | — | | | | — | |
| | — | | | | — | | | | 134 | |
| | — | | | | — | | | | 16 | |
| | — | | | | — | | | | 3 | |
| | — | | | | — | | | | 187,051 | |
| | | | | | | | | | | |
| | (460,801 | ) | | | (72,961 | ) | | | (422,334 | ) |
| | (151 | ) | | | — | | | | — | |
| | — | | | | — | | | | (12,588 | ) |
| | — | | | | — | | | | (176 | ) |
| | — | | | | — | | | | (164 | ) |
| | — | | | | — | | | | (796,220 | ) |
| | | | | | | | | | | |
| | — | | | | — | | | | (9,127 | ) |
| | — | | | | — | | | | (1,000 | ) |
| | — | | | | — | | | | (7,452,580 | ) |
| | (336,875 | ) | | | (65,225 | ) | | | (917,984 | ) |
HENNESSY FUNDS 1-800-966-4354
Financial Statements
| Statements of Changes in Net Assets |
| | |
| | |
| | |
| | |
| OPERATIONS: | |
| Net investment income (loss) | |
| Net realized gain (loss) on securities | |
| Change in unrealized appreciation (depreciation) on securities | |
| Net increase (decrease) in net assets resulting from operations | |
| | |
| DISTRIBUTIONS TO SHAREHOLDERS FROM: | |
| Net investment income – Original Class | |
| Net investment income – Institutional Class | |
| Total distributions | |
| | |
| CAPITAL SHARE TRANSACTIONS: | |
| Proceeds from shares subscribed – Original Class | |
| Proceeds from shares subscribed – Institutional Class | |
| Dividends reinvested – Original Class | |
| Dividends reinvested – Institutional Class | |
| Cost of shares redeemed – Original Class | |
| Cost of shares redeemed – Institutional Class | |
| Redemption fees retained – Original Class | |
| Redemption fees retained – Institutional Class | |
| Net increase (decrease) in net assets derived from capital share transactions | |
| | |
| TOTAL INCREASE (DECREASE) IN NET ASSETS | |
| | |
| NET ASSETS: | |
| Beginning of period | |
| End of period | |
| | |
| Accumulated net investment income (loss), end of period | |
| | |
| CHANGES IN SHARES OUTSTANDING: | |
| Shares sold – Original Class | |
| Shares sold – Institutional Class | |
| Shares issued to holders as reinvestment of dividends – Original Class | |
| Shares issued to holders as reinvestment of dividends – Institutional Class | |
| Shares redeemed – Original Class | |
| Shares redeemed – Institutional Class | |
| Net increase (decrease) in shares outstanding | |
The accompanying notes are an integral part of these financial statements.
FINANCIAL STATEMENTS – STATEMENTS OF CHANGES IN NET ASSETS
| Hennessy Select SPARX | | | Hennessy Select SPARX | |
| Japan Fund | | | Japan Smaller Companies Fund | |
| Six Months Ended | | | | | | Six Months Ended | | | | |
| April 30, 2010 | | | Year Ended | | | April 30, 2010 | | | Year Ended | |
| (Unaudited) | | | October 31, 2009 | | | (Unaudited) | | | October 31, 2009 | |
| | | | | | | | | | | |
| $ | (766 | ) | | $ | 90,895 | | | $ | 72,456 | | | $ | 108,317 | |
| | (1,933,487 | ) | | | (12,474,339 | ) | | | 1,230,516 | | | | (3,569,270 | ) |
| | 5,323,211 | | | | 21,195,083 | | | | (233,302 | ) | | | 8,342,323 | |
| | 3,388,958 | | | | 8,811,639 | | | | 1,069,670 | | | | 4,881,370 | |
| | | | | | | | | | | | | | | |
| | (59,461 | ) | | | (65,133 | ) | | | (675,389 | ) | | | — | |
| | (43,905 | ) | | | (110,045 | ) | | | N/A | | | | N/A | |
| | (103,366 | ) | | | (175,178 | ) | | | (675,389 | ) | | | — | |
| | | | | | | | | | | | | | | |
| | 8,783,742 | | | | 14,425,238 | | | | 2,878,099 | | | | 10,635,183 | |
| | 8,213,907 | | | | 2,861,706 | | | | N/A | | | | N/A | |
| | 58,305 | | | | 63,659 | | | | 654,011 | | | | — | |
| | 42,669 | | | | 103,942 | | | | N/A | | | | N/A | |
| | (7,072,939 | ) | | | (5,945,945 | ) | | | (2,056,370 | ) | | | (11,060,855 | ) |
| | (7,889,894 | ) | | | (19,199,363 | ) | | | N/A | | | | N/A | |
| | 102 | | | | 2,875 | | | | 508 | | | | 3,412 | |
| | — | | | | 4,035 | | | | N/A | | | | N/A | |
| | 2,135,892 | | | | (7,683,853 | ) | | | 1,476,248 | | | | (422,260 | ) |
| | 5,421,484 | | | | 952,608 | | | | 1,870,529 | | | | 4,459,110 | |
| | | | | | | | | | | | | | | |
| | | | | | | | | | | | | | | |
| | 53,843,043 | | | | 52,890,435 | | | | 16,200,680 | | | | 11,741,570 | |
| $ | 59,264,527 | | | $ | 53,843,043 | | | $ | 18,071,209 | | | $ | 16,200,680 | |
| | | | | | | | | | | | | | | |
| $ | (50,769 | ) | | $ | 53,363 | | | $ | (365,044 | ) | | $ | 237,889 | |
| | | | | | | | | | | | | | | |
| | 728,892 | | | | 1,434,814 | | | | 305,641 | | | | 1,477,631 | |
| | 672,198 | | | | 275,108 | | | | N/A | | | | N/A | |
| | 4,983 | | | | 6,211 | | | | 74,659 | | | | — | |
| | 3,628 | | | | 10,082 | | | | N/A | | | | N/A | |
| | (589,453 | ) | | | (585,989 | ) | | | (229,340 | ) | | | (1,523,006 | ) |
| | (674,429 | ) | | | (1,837,630 | ) | | | N/A | | | | N/A | |
| | 145,819 | | | | (697,404 | ) | | | 150,960 | | | | (45,375 | ) |
HENNESSY FUNDS 1-800-966-4354
Financial Highlights
| Hennessy Select Large Value Fund |
For an Original Class share outstanding throughout each period
| | | Six Months | | | | |
| | | Ended | | | One Month | |
| | | April 30, | | | Ended | |
| | | 2010 | | | October 31, | |
| | | (Unaudited) | | | 2009(1) | |
| PER SHARE DATA: | | | | | | |
| Net asset value, beginning of period | | $ | 18.88 | | | $ | 19.49 | |
| Income from investment operations: | | | | | | | | |
| Net investment income (loss) | | | 0.06 | | | | 0.01 | |
| Net realized and unrealized gains (losses) on securities | | | 2.56 | | | | (0.62 | ) |
| Total from investment operations | | | 2.62 | | | | (0.61 | ) |
| Less Distributions: | | | | | | | | |
| Dividends from net investment income | | | (0.23 | ) | | | — | |
| Dividends from net realized gains | | | — | | | | — | |
| Total distributions | | | (0.23 | ) | | | — | |
Redemption fees retained(4) | | | — | | | | — | |
| Net asset value, end of period | | $ | 21.27 | | | $ | 18.88 | |
| TOTAL RETURN | | | 13.97 | %(5) | | | (3.13 | )%(5) |
| | | | | | | | | |
| SUPPLEMENTAL DATA AND RATIOS: | | | | | | | | |
| Net assets, end of period (millions) | | $ | 142.38 | | | $ | 132.77 | |
| Ratio of expenses to average net assets: | | | | | | | | |
| Before expense reimbursement | | | 1.38 | %(6) | | | 1.37 | %(6) |
After expense reimbursement(7) | | | 1.33 | %(6) | | | 1.30 | %(6) |
| Ratio of net investment income to average net assets | | | | | | | | |
| Before expense reimbursement | | | 0.55 | %(6) | | | 0.28 | %(6) |
After expense reimbursement(7) | | | 0.60 | %(6) | | | 0.35 | %(6) |
Portfolio turnover rate(8) | | | 73 | %(5) | | | 10 | %(5) |
| | | | | | | | | |
| (1) | For the one month ended October 31, 2009. Effective October 31, 2009, the Fund changed its fiscal year end to October 31st from September 30th. |
| (2) | The financial highlights set forth for periods prior to March 23, 2009 represent the historical financial highlights of the Tamarack Value Fund, Class S shares. The assets of the Tamarack Value Fund were acquired by the Hennessy Select Large Value Fund on March 23, 2009. Prior to the reorganization, Tamarack Value Fund also offered Class A, Class C and R shares. At that time RBC Global Asset Management (U.S.), Inc. (formerly known as Voyageur Asset Management Inc.) ceased to be investment advisor and Hennessy Advisors, Inc. became investment advisor. The return of the Tamarack Value Fund, Class S shares during the period October 1, 2008 through March 23, 2009 was (33.09)%. The return of the Hennessy Select Large Value Fund, Original Class shares during the period March 23, 2009 through Sept ember 30, 2009 was 36.84%. |
| (3) | Per share net investment income (loss) has been calculated using the average daily shares method. |
| (4) | Amount is less than $0.01 or $(0.01). |
| (7) | The Advisor had agreed to reimburse expenses in order to cap the Original Class share expenses. Please refer to Note 4 for more information. |
| (8) | Portfolio turnover is calculated on the basis of the Fund as a whole. |
The accompanying notes are an integral part of these financial statements.
FINANCIAL HIGHLIGHTS — HENNESSY SELECT LARGE VALUE FUND
| | | | | | | | | | | | | | |
| | | | | | | | | | | | | | |
| | | | | | | | | | | | | | |
| | | | | | | | | | | | | | |
| Year Ended September 30, | |
2009(2) | | | 2008 | | | 2007 | | | 2006 | | | 2005 | |
| | | | | | | | | | | | | | |
| $ | 21.80 | | | $ | 43.12 | | | $ | 41.74 | | | $ | 45.78 | | | $ | 45.05 | |
| | | | | | | | | | | | | | | | | | | |
| | 0.31 | | | | 0.42 | (3) | | | 0.58 | (3) | | | 0.55 | (3) | | | 0.74 | |
| | (2.21 | ) | | | (7.43 | ) | | | 5.04 | | | | 3.07 | | | | 4.35 | |
| | (1.90 | ) | | | (7.01 | ) | | | 5.62 | | | | 3.62 | | | | 5.09 | |
| | | | | | | | | | | | | | | | | | | |
| | (0.41 | ) | | | (0.78 | ) | | | (0.63 | ) | | | (0.61 | ) | | | (0.46 | ) |
| | — | | | | (13.53 | ) | | | (3.61 | ) | | | (7.05 | ) | | | (3.90 | ) |
| | (0.41 | ) | | | (14.31 | ) | | | (4.24 | ) | | | (7.66 | ) | | | (4.36 | ) |
| | — | | | | — | | | | — | | | | — | | | | — | |
| $ | 19.49 | | | $ | 21.80 | | | $ | 43.12 | | | $ | 41.74 | | | $ | 45.78 | |
| | | | | | | | | | | | | | | | | | | |
| | (8.43 | )% | | | (22.42 | )% | | | 14.19 | % | | | 9.10 | % | | | 11.42 | % |
| | | | | | | | | | | | | | | | | | | |
| $ | 138.34 | | | $ | 174.23 | | | $ | 269.37 | | | $ | 291.66 | | | $ | 366.95 | |
| | | | | | | | | | | | | | | | | | | |
| | 1.42 | % | | | 1.22 | % | | | 1.26 | % | | | 1.22 | % | | | 1.25 | % |
| | 1.17 | % | | | 1.02 | % | | | 1.03 | % | | | 1.05 | % | | | 1.01 | % |
| | | | | | | | | | | | | | | | | | | |
| | 1.46 | % | | | 1.32 | % | | | 1.13 | % | | | 1.16 | % | | | 1.28 | % |
| | 1.71 | % | | | 1.52 | % | | | 1.36 | % | | | 1.33 | % | | | 1.52 | % |
| | 142 | % | | | 162 | % | | | 136 | % | | | 38 | % | | | 35 | % |
HENNESSY FUNDS 1-800-966-4354
Financial Highlights
| Hennessy Select Large Value Fund |
For an Institutional Class share outstanding throughout each period
| | | Six Months | |
| | | Ended | |
| | | April 30, 2010 | |
| | | (Unaudited) | |
| PER SHARE DATA: | | | |
| Net asset value, beginning of period | | $ | 18.92 | |
| | | | | |
| Income from investment operations: | | | | |
| Net investment income (loss) | | | 0.09 | |
| Net realized and unrealized gains (losses) on securities | | | 2.57 | |
| Total from investment operations | | | 2.66 | |
| | | | | |
| Less distributions: | | | | |
| Dividends from net investment income | | | (0.28 | ) |
| Dividends from net realized gains | | | — | |
| Total distributions | | | (0.28 | ) |
Redemption fees retained(3) | | | — | |
| Net asset value, end of period | | $ | 21.30 | |
| | | | | |
| TOTAL RETURN | | | 14.13 | %(4) |
| | | | | |
| SUPPLEMENTAL DATA AND RATIOS: | | | | |
| Net assets, end of period (millions) | | $ | 0.04 | |
| Ratio of expenses to average net assets: | | | | |
| Before expense reimbursement | | | 1.21 | %(5) |
After expense reimbursement(6) | | | 0.98 | %(5) |
| Ratio of net investment income to average net assets | | | | |
| Before expense reimbursement | | | 0.66 | %(5) |
After expense reimbursement(6) | | | 0.89 | %(5) |
Portfolio turnover rate(7) | | | 73 | %(4) |
| (1) | For the one month ended October 31, 2009. Effective October 31, 2009, the Fund changed its fiscal year end to October 31st from September 30th. |
| (2) | Institutional Class shares commenced operations on March 23, 2009. |
| (3) | Amount is less than $0.01 or $(0.01). |
| (6) | The Advisor has agreed to reimburse expenses in order to cap the Institutional Class share expenses. Please refer to Note 4 for more information. |
| (7) | Portfolio turnover is calculated on the basis of the Fund as a whole. |
The accompanying notes are an integral part of these financial statements.
FINANCIAL HIGHLIGHTS — HENNESSY SELECT LARGE VALUE FUND
| One Month | | | | |
| Ended | | | Period Ended | |
| October 31, | | | September 30, | |
2009(1) | | | 2009(2) | |
| | | | | |
| $ | 19.53 | | | $ | 14.25 | |
| | | | | | | |
| | | | | | | |
| | — | (3) | | | 0.08 | |
| | (0.61 | ) | | | 5.20 | |
| | (0.61 | ) | | | 5.28 | |
| | | | | | | |
| | | | | | | |
| | — | | | | — | |
| | — | | | | — | |
| | — | | | | — | |
| | — | | | | — | |
| $ | 18.92 | | | $ | 19.53 | |
| | | | | | | |
| | (3.12 | )%(4) | | | 37.05 | %(4) |
| | | | | | | |
| | | | | | | |
| $ | 0.03 | | | $ | 0.03 | |
| | | | | | | |
| | 1.20 | %(5) | | | 26.18 | %(5) |
| | 0.98 | %(5) | | | 0.98 | %(5) |
| | | | | | | |
| | 0.44 | %(5) | | | (24.06 | )%(5) |
| | 0.66 | %(5) | | | 1.14 | %(5) |
| | 10 | %(4) | | | 142 | %(4) |
HENNESSY FUNDS 1-800-966-4354
Financial Highlights
| Hennessy Select SPARX Japan Fund |
For an Original Class share outstanding throughout each period
| | | Six Months | |
| | | Ended | |
| | | April 30, | |
| | | 2010 | |
| | | (Unaudited) | |
| PER SHARE DATA: | | | |
| Net asset value, beginning of period | | $ | 11.38 | |
| | | | | |
| Income from investment operations: | | | | |
| Net investment income (loss) | | | — | (2) |
| Net realized and unrealized gains (losses) on securities | | | 0.79 | |
| Total from investment operations | | | 0.79 | |
| | | | | |
| Less distributions: | | | | |
| Dividends from net investment income | | | (0.02 | ) |
| Dividends from net realized gains | | | — | |
| Total distributions | | | (0.02 | ) |
| Redemption fees retained | | | — | |
| Net asset value, end of period | | $ | 12.15 | |
| | | | | |
| TOTAL RETURN | | | 6.99 | %(4) |
| | | | | |
| SUPPLEMENTAL DATA AND RATIOS: | | | | |
| Net assets, end of period (millions) | | $ | 31.95 | |
| Ratio of expenses to average net assets: | | | | |
| Before expense reimbursement | | | 1.65 | %(5) |
After expense reimbursement(6) | | | 1.41 | %(5) |
| Ratio of net investment income to average net assets | | | | |
| Before expense reimbursement | | | (0.29 | )%(5) |
After expense reimbursement(6) | | | (0.05 | )%(5) |
Portfolio turnover rate(7) | | | 7 | %(4) |
| (1) | The financial highlights set forth for periods prior to September 18, 2009 represent the historical financial highlights of the SPARX Japan Fund. On September 18, 2009 Hennessy Advisors, Inc., became the investment advisor to the Fund and the Fund changed its name to Hennessy Select SPARX Japan Fund. In addition, the Investor Class shares were redesignated Original Class shares. |
| (2) | Amount is less than $0.01 or $(0.01). |
| (3) | Calculated based on average shares outstanding. |
| (6) | The Advisor had agreed to reimburse expenses in order to cap the Original Class share expenses. Please refer to Note 4 for more information. |
| (7) | Portfolio turnover is calculated on the basis of the Fund as a whole. |
The accompanying notes are an integral part of these financial statements.
FINANCIAL HIGHLIGHTS — HENNESSY SELECT SPARX JAPAN FUND
| Year Ended October 31, | |
2009(1) | | | 2008 | | | 2007 | | | 2006 | | | 2005 | |
| | | | | | | | | | | | | | |
| $ | 9.73 | | | $ | 16.24 | | | $ | 17.20 | | | $ | 17.41 | | | $ | 13.28 | |
| | | | | | | | | | | | | | | | | | | |
| | 0.02 | | | | 0.05 | | | | (0.03 | ) | | | (0.10 | )(3) | | | (0.06 | )(3) |
| | 1.66 | | | | (6.56 | ) | | | (0.93 | ) | | | 0.60 | | | | 4.90 | |
| | 1.68 | | | | (6.51 | ) | | | (0.96 | ) | | | 0.50 | | | | 4.84 | |
| | | | | | | | | | | | | | | | | | | |
| | (0.03 | ) | | | — | | | | — | | | | (0.55 | ) | | | — | (2) |
| | — | | | | — | | | | — | | | | (0.17 | ) | | | (0.71 | ) |
| | (0.03 | ) | | | — | | | | — | | | | (0.72 | ) | | | (0.71 | ) |
| | — | (2) | | | — | (2) | | | — | | | | 0.01 | | | | — | |
| $ | 11.38 | | | $ | 9.73 | | | $ | 16.24 | | | $ | 17.20 | | | $ | 17.41 | |
| | | | | | | | | | | | | | | | | | | |
| | 17.36 | % | | | (40.09 | )% | | | (5.58 | )% | | | 2.64 | % | | | 38.36 | % |
| | | | | | | | | | | | | | | | | | | |
| | | | | | | | | | | | | | | | | | | |
| $ | 28.29 | | | $ | 15.86 | | | $ | 19.54 | | | $ | 26.23 | | | $ | 23.49 | |
| | | | | | | | | | | | | | | | | | | |
| | 1.75 | % | | | 1.72 | % | | | 1.87 | % | | | 2.22 | % | | | 4.24 | % |
| | 1.24 | % | | | 1.25 | % | | | 1.45 | % | | | 1.50 | % | | | 1.50 | % |
| | | | | | | | | | | | | | | | | | | |
| | (0.34 | )% | | | (0.10 | )% | | | (0.62 | )% | | | (1.27 | )% | | | (3.14 | )% |
| | 0.17 | % | | | 0.37 | % | | | (0.20 | )% | | | (0.55 | )% | | | (0.40 | )% |
| | 17 | % | | | 35 | % | | | 111 | % | | | 89 | % | | | 73 | % |
HENNESSY FUNDS 1-800-966-4354
Financial Highlights
| Hennessy Select SPARX Japan Fund |
For an Institutional Class share outstanding throughout each period
| | | Six Months | |
| | | Ended | |
| | | April 30, | |
| | | 2010 | |
| | | (Unaudited) | |
| PER SHARE DATA: | | | |
| Net asset value, beginning of period | | $ | 11.44 | |
| | | | | |
| Income from investment operations: | | | | |
| Net investment income (loss) | | | 0.01 | |
| Net realized and unrealized gains (losses) on securities | | | 0.79 | |
| Total from investment operations | | | 0.80 | |
| | | | | |
| Less distributions: | | | | |
| Dividends from net investment income | | | (0.02 | ) |
| Dividends from net realized gains | | | — | |
| Total distributions | | | (0.02 | ) |
| Redemption fees retained | | | — | |
| Net asset value, end of period | | $ | 12.22 | |
| | | | | |
| TOTAL RETURN | | | 7.04 | %(4) |
| | | | | |
| SUPPLEMENTAL DATA AND RATIOS: | | | | |
| Net assets, end of period (millions) | | $ | 27.31 | |
| Ratio of expenses to average net assets: | | | | |
| Before expense reimbursement | | | 1.42 | %(5) |
After expense reimbursement(6) | | | 1.32 | %(5) |
| Ratio of net investment income to average net assets | | | | |
| Before expense reimbursement | | | (0.05 | )%(5) |
After expense reimbursement(6) | | | 0.05 | %(5) |
Portfolio turnover rate(7) | | | 7 | %(4) |
| (1) | The financial highlights set forth for periods prior to September 18, 2009 represent the historical financial highlights of the SPARX Japan Fund. On September 18, 2009 Hennessy Advisors, Inc., became the investment advisor to the Fund and the Fund changed its name to Hennessy Select SPARX Japan Fund. |
| (2) | Amount is less than $0.01 or $(0.01). |
| (3) | Calculated based on average shares outstanding. |
| (6) | The Advisor had agreed to reimburse expenses in order to cap the Institutional Class share expenses. Please refer to Note 4 for more information. |
| (7) | Portfolio turnover is calculated on the basis of the Fund as a whole. |
The accompanying notes are an integral part of these financial statements.
FINANCIAL HIGHLIGHTS — HENNESSY SELECT SPARX JAPAN FUND
| | | | | | | | | | | | | | |
| | | | | | | | | | | | | | |
| Year Ended October 31, | |
2009(1) | | | 2008 | | | 2007 | | | 2006 | | | 2005 | |
| | | | | | | | | | | | | | |
| $ | 9.78 | | | $ | 16.33 | | | $ | 17.27 | | | $ | 17.44 | | | $ | 13.31 | |
| | | | | | | | | | | | | | | | | | | |
| | 0.03 | | | | 0.05 | | | | — | (2) | | | (0.06 | )(3) | | | (0.02 | )(3) |
| | 1.66 | | | | (6.60 | ) | | | (0.94 | ) | | | 0.61 | | | | 4.87 | |
| | 1.69 | | | | (6.55 | ) | | | (0.94 | ) | | | 0.55 | | | | 4.85 | |
| | | | | | | | | | | | | | | | | | | |
| | (0.03 | ) | | | — | | | | — | | | | (0.56 | ) | | | — | |
| | — | | | | — | | | | — | | | | (0.17 | ) | | | (0.72 | ) |
| | (0.03 | ) | | | — | | | | — | | | | (0.73 | ) | | | (0.72 | ) |
| | — | (2) | | | — | (2) | | | — | | | | 0.01 | | | | — | (2) |
| $ | 11.44 | | | $ | 9.78 | | | $ | 16.33 | | | $ | 17.27 | | | $ | 17.44 | |
| | | | | | | | | | | | | | | | | | | |
| | 17.37 | % | | | (40.11 | )% | | | (5.44 | )% | | | 2.90 | % | | | 38.41 | % |
| | | | | | | | | | | | | | | | | | | |
| | | | | | | | | | | | | | | | | | | |
| $ | 25.55 | | | $ | 37.03 | | | $ | 82.94 | | | $ | 105.15 | | | $ | 53.17 | |
| | | | | | | | | | | | | | | | | | | |
| | 1.75 | % | | | 1.72 | % | | | 1.67 | % | | | 1.66 | % | | | 3.63 | % |
| | 1.24 | % | | | 1.25 | % | | | 1.25 | % | | | 1.25 | % | | | 1.25 | % |
| | | | | | | | | | | | | | | | | | | |
| | (0.34 | )% | | | (0.10 | )% | | | (0.42 | )% | | | (0.71 | )% | | | (2.53 | )% |
| | 0.17 | % | | | 0.37 | % | | | 0.00 | % | | | (0.30 | )% | | | (0.15 | )% |
| | 17 | % | | | 35 | % | | | 111 | % | | | 89 | % | | | 73 | % |
HENNESSY FUNDS 1-800-966-4354
Financial Highlights
| Hennessy Select SPARX Japan Smaller Companies Fund |
For an Original Class share outstanding throughout each period
| | | Six Months | |
| | | Ended | |
| | | April 30, | |
| | | 2010 | |
| | | (Unaudited) | |
| PER SHARE DATA: | | | |
| Net asset value, beginning of period | | $ | 9.74 | |
| | | | | |
| Income from investment operations: | | | | |
| Net investment income (loss) | | | 0.07 | |
| Net realized and unrealized gains (losses) on securities | | | 0.57 | |
| Total from investment operations | | | 0.64 | |
| | | | | |
| Less distributions: | | | | |
| Dividends from net investment income | | | (0.42 | ) |
| Dividends from net realized gains | | | — | |
| Total distributions | | | (0.42 | ) |
| Redemption fees retained | | | — | (4) |
| Net asset value, end of period | | $ | 9.96 | |
| | | | | |
| TOTAL RETURN | | | 7.14 | %(5) |
| | | | | |
| SUPPLEMENTAL DATA AND RATIOS: | | | | |
| Net assets, end of period (millions) | | $ | 18.07 | |
| Ratio of expenses to average net assets: | | | | |
| Before expense reimbursement | | | 2.08 | %(6) |
After expense reimbursement(7) | | | 1.82 | %(6) |
| Ratio of net investment income to average net assets | | | | |
| Before expense reimbursement | | | 0.70 | %(6) |
After expense reimbursement(7) | | | 0.96 | %(6) |
| Portfolio turnover rate | | | 56 | %(5) |
| (1) | The financial highlights set forth for periods prior to September 18, 2009 represent the historical financial highlights of the SPARX Japan Smaller Companies Fund. On September 18, 2009 Hennessy Advisors, Inc., became the investment advisor to the Fund and the Fund changed its name to Hennessy Select SPARX Japan Smaller Companies Fund. |
| (2) | The Fund commenced operations on August 31, 2007. |
| (3) | Calculated based on average shares outstanding. |
| (4) | Amount is less than $0.01 or $(0.01). |
| (7) | The Advisor had agreed to reimburse expenses in order to cap the Original Class share expenses. Please refer to Note 4 for more information. |
The accompanying notes are an integral part of these financial statements.
FINANCIAL HIGHLIGHTS — HENNESSY SELECT SPARX JAPAN SMALLER COMPANIES FUND
| Year Ended | | | Year Ended | | | Period Ended | |
| October 31, | | | October 31, | | | October 31, | |
2009(1) | | | 2008 | | | 2007(2) | |
| | | | | | | | |
| $ | 6.87 | | | $ | 10.98 | | | $ | 10.00 | |
| | | | | | | | | | | |
| | 0.07 | | | | 0.02 | (3) | | | — | (4) |
| | 2.80 | | | | (4.08 | ) | | | 0.98 | |
| | 2.87 | | | | (4.06 | ) | | | 0.98 | |
| | | | | | | | | | | |
| | — | | | | (0.07 | ) | | | — | |
| | — | | | | — | | | | — | |
| | — | | | | (0.07 | ) | | | — | |
| | — | (4) | | | 0.02 | | | | — | |
| $ | 9.74 | | | $ | 6.87 | | | $ | 10.98 | |
| | | | | | | | | | | |
| | 41.78 | % | | | (37.00 | )% | | | 9.80 | %(5) |
| | | | | | | | | | | |
| | | | | | | | | | | |
| $ | 16.20 | | | $ | 11.74 | | | $ | 5.58 | |
| | | | | | | | | | | |
| | 3.10 | % | | | 4.47 | % | | | 9.73 | %(6) |
| | 1.60 | % | | | 1.60 | % | | | 1.60 | %(6) |
| | | | | | | | | | | |
| | (0.86 | )% | | | (2.60 | )% | | | (8.15 | )%(6) |
| | 0.64 | % | | | 0.26 | % | | | (0.02 | )%(6) |
| | 138 | % | | | 55 | % | | | 13 | %(5) |
HENNESSY FUNDS 1-800-966-4354
Notes to the Financial Statements
April 30, 2010 (Unaudited)
1). ORGANIZATION
The Hennessy Select Large Value Fund (the “Large Value Fund,” formerly known as the Tamarack Value Fund) is organized as a separate investment portfolio or series of Hennessy Funds Trust, a Delaware statutory trust that was organized on September 17, 1992. Prior to July 1, 2005, the Hennessy Funds Trust was known as “The Henlopen Fund.” On March 23, 2009, Hennessy Advisors, Inc., became the investment advisor to the Large Value Fund. The Hennessy Funds Trust is an open-end, management investment company registered under the Investment Company Act of 1940, as amended. The Large Value Fund is a diversified portfolio. The Large Value Fund commenced operations on September 30, 1984.
The Hennessy Select SPARX Japan Fund (the “Japan Fund,” formerly known as the SPARX Japan Fund) and the Hennessy Select SPARX Japan Smaller Companies Fund (the “Japan Smaller Companies Fund,” formerly known as the SPARX Japan Smaller Companies Fund) are organized as separate investment portfolios or series of Hennessy SPARX Funds Trust, a Massachusetts business trust that was organized on July 24, 1995. From July 25, 2007 through September 17, 2009 the Hennessy SPARX Funds Trust name was “SPARX Asia Funds.” Prior to July 25, 2007, the Hennessy SPARX Funds Trust was known as “SPARX Funds Trust”. On September 18, 2009, Hennessy Advisors, Inc., became the investment advisor to the SPARX Japan Fund and SPARX Japan Smaller Companies Fund. The Hennessy SPARX Funds Trust is an open-end, management investment company registered under the Investment Company Act of 1940, as amended. The Japan Fund and Japan Smaller Companies Fund are each diversified portfolios. Although these funds will each be considered a “diversified” mutual fund, the fund may employ a relatively focused investment strategy and may hold securities of fewer issuers than other diversified funds. The Japan Fund commenced operations on October 31, 2003 and the Japan Smaller Companies Fund commenced operations on August 31, 2007.
The Large Value Fund, Japan Fund and Japan Smaller Companies Fund collectively represent the Hennessy Select Series Funds (the “Funds”).
The Large Value Fund and Japan Fund offer Original and Institutional Class shares. Each class of shares differs principally in its respective administration, shareholder servicing and sub-transfer agent expenses and sales charges, if any. Each class has identical rights to earnings, assets and voting privileges, except for class-specific expenses and exclusive rights to vote on matters affecting only individual classes. The Japan Smaller Companies Fund offers only Original Class shares.
2). SIGNIFICANT ACCOUNTING POLICIES
The following is a summary of significant accounting policies consistently followed by the Funds in the preparation of the financial statements. These policies are in conformity with U.S. generally accepted accounting principles (“GAAP”).
NOTES TO THE FINANCIAL STATEMENTS
| a). | Investment Valuation – Securities which are traded on a national or recognized stock exchange are valued at the last sale price on the securities exchange on which such securities are primarily traded. Exchange-traded securities for which there were no transactions that day and debt securities are valued at the most recent bid prices. Instruments with a remaining maturity of 60 days or less are valued on an amortized cost basis. When a price for an underlying security is not readily available or if a significant event has occurred that indicates the closing price of a security no longer represents the true value of that security, fair value pricing procedures have been adopted by the Board of Trustees of the Funds. Fair value pricing determinations are made in good faith in accordance with these procedures. There are nume rous criteria that will be given consideration in determining a fair value of a security. Some of these criteria are: trading volume of security and markets, value of other like securities and news events with direct bearing to security or market. Fair value pricing results in an estimated price that reasonably reflects the current market conditions in order to rate the portfolio holdings such that shareholder transactions receive a fair net asset value. |
| | Fair valuing of foreign securities may be determined with the assistance of a pricing service using correlations between the movement of prices of such securities and indices of domestic securities and other appropriate indicators, such as closing market prices of relevant American Depositary Receipts or futures contracts. The effect of using fair value pricing is that the Funds’ NAV will reflect the affected portfolio securities’ value as determined in the judgment of the Board of Trustees or its designee instead of being determined by the market. Using a fair value pricing methodology to price securities may result in a value that is different from a security’s most recent closing price and from the prices used by other investment companies to ca lculate their net asset values and are considered level 2 prices in the fair valuation hierarchy. Because the Funds invest in foreign securities, the value of the Funds’ portfolio securities may change on days when you will not be able to purchase or redeem your shares. |
| | Foreign securities are recorded in the financial statements after translation to U.S. dollars based on the applicable exchange rate at the end of the period. The Funds do not isolate that portion of the results of operations resulting from changes in the currency exchange rate from the fluctuations resulting from changes in the market prices of investments. |
| b). | Federal Income Taxes – Provision for federal income taxes or excise taxes has not been made since the Funds have elected to be taxed as a “regulated investment company” and intend to distribute substantially all taxable income to shareholders and otherwise comply with the provisions of the Internal Revenue Code applicable to regulated investment companies. Net investment income and realized gains and losses for federal income tax purposes may differ from that reported on the financial statements because of temporary book and tax basis differences. Temporary differences are primarily the result of the treatment of wash sales for tax reporting purposes. Distributions from net realized gains for book purposes may include short-term capital gains, which are included as ordinary income to shareholders for tax purposes. |
HENNESSY FUNDS 1-800-966-4354
| | Due to inherent differences in the recognition of income, expenses, and realized gains/losses under U.S. generally accepted accounting principles and federal income tax purposes, permanent differences between book and tax basis reporting for the 2009 fiscal year have been identified and appropriately reclassified on the Statement of Assets and Liabilities. |
| | | Accumulated Net | | | Accumulated Net | | | Paid In | |
| | | Investment Income/(Loss) | | | Realized Gain/(Loss) | | | Capital | |
| Large Value Fund | | | (120 | ) | | | 120 | | | | — | |
| Japan Fund | | | 10,720 | | | | (10,720 | ) | | | — | |
| Japan Smaller Companies Fund | | | 130,305 | | | | (130,265 | ) | | | (40 | ) |
| | The permanent differences primarily relate to foreign currency gain (loss) reclasses and adjustments related to passive foreign investment companies. |
| c). | Income and Expenses – Dividend income is recognized on the ex-dividend date or as soon as information is available to the Funds and interest income is recognized on an accrual basis. Income expenses (other than expenses attributable to a specific class), and realized and unrealized gains or losses on investments are allocated to each class of shares based on its respective net assets. |
| d). | Distributions to Shareholders – Dividends from net investment income and distributions of net realized capital gains for the Funds, if any, are declared and paid out annually, usually in November or December of each year. |
| e). | Security Transactions – Investment and shareholder transactions are recorded on the trade date. The Fund determines the gain or loss realized from the investment transactions by comparing the original cost of the security lot sold with the net sale proceeds. Discounts and premiums on securities purchased are accreted/amortized over the life of the respective security. |
| f). | Use of Estimates – The preparation of financial statements in conformity with GAAP requires management to make estimates and assumptions that affect the reported amounts of assets and liabilities and disclosure of contingent assets and liabilities at the date of the financial statements and the reported change in net assets during the reporting period. Actual results could differ from those estimates. |
| g). | Share Valuation – The net asset value (“NAV”) per share of each Fund is calculated by dividing the sum of the value of the securities held, plus cash or other assets, minus all liabilities (including estimated accrued expenses) by the total number of shares outstanding, rounded to the nearest cent. The Funds’ shares will not be priced on the days on which the NYSE is closed for trading. The offering and redemption price per share for each Fund is equal to each Fund’s net asset value per share. The Japan Fund and Japan Smaller Companies Funds charged a 2.00% redemption fee on shares held less than 60 days through January 29, 2010. These fees were retained by each Fund and treated as additional paid-in-capital and allocated to each respective class of shares (if applicable). |
| h). | Foreign Currency – Values of investments denominated in foreign currencies are converted into U.S. dollars using the spot market rate of exchange at the time of valuation. Purchases and sales of investments and income are |
NOTES TO THE FINANCIAL STATEMENTS
| | translated into U.S. dollars using the spot market rate of exchange prevailing on the respective dates of such transactions. The effect of changes in foreign exchange rates on realized and unrealized security gains and losses is reflected as a component of such gains or losses. Foreign investments present additional risks due to currency fluctuations, economic and political factors, lower liquidity, government regulations, differences in accounting standards and other factors. |
| i). | Forward Contracts – The Funds may enter into forward currency contracts to reduce their exposure to changes in foreign currency exchange rates on their foreign holdings and to lock in the U.S. dollar cost of firm purchase and sale commitments for securities denominated in foreign currencies. A forward currency contract is a commitment to purchase or sell a foreign currency at a future date at a negotiated forward rate. The gain or loss arising from the difference between the U.S. dollar cost of the original contract and the value of the foreign currency in U.S. dollars upon closing of such contract is included in net realized gain or loss from foreign currency transactions. |
| | The Funds may invest in, or enter into, derivatives, such as options, futures contracts, options on futures contracts and swaps, for a variety of reasons, including to hedge certain risks, to provide a substitute for purchasing or selling particular securities or to increase potential income gain. Derivatives may provide a cheaper, quicker or more specifically focused way for a Fund to invest than “traditional” securities would. The main purpose of utilizing these derivative instruments is for hedging purposes. |
| j). | Repurchase Agreements – The Funds may enter into repurchase agreements with member banks or security dealers of the Federal Reserve whom the investment advisor deems creditworthy. The repurchase price generally equals the price paid by the Fund plus interest negotiated on the basis of current short-term rates. |
| | Securities pledged as collateral for repurchase agreements are held by the custodian bank until the respective agreements mature. Provisions of the repurchase agreements ensure that the market value of the collateral, including accrued interest thereon, is sufficient, in the event of default of the counterparty. If the counterparty defaults and the value of the collateral declines or if the counterparty enters an insolvency proceeding, realization of the collateral by the Fund may be delayed or limited. |
| k). | Accounting for Uncertainty in Income Taxes – The Funds have adopted financial reporting rules regarding recognition and measurement of tax positions taken or expected to be taken on a tax return. The Funds have reviewed all open tax years and major jurisdictions and concluded that there is no impact on the Funds’ net assets and no tax liability resulting from unrecognized tax benefits relating to uncertain income tax positions taken or expected to be taken on a tax return. As of April 30, 2010, open Federal and state tax years for the Large Value Fund include the tax years ended September 30, 2006 through 2009 and the tax period ended October 31, 2009. As of April 30, 2010, open Federal and state tax years for the Japan Fund and Japan Smaller Companies Fund include the tax years ended October 3 1, 2006 through 2009. |
HENNESSY FUNDS 1-800-966-4354
| l). | Derivatives – The Funds have adopted the financial accounting reporting rules as required by the Derivatives and Hedging Topic of the FASB Accounting Standards Codification (“FASB ASC”). The Funds are required to include enhanced disclosure that enables investors to understand how and why an entity uses derivatives, how derivatives are accounted for, and how derivatives instruments affect an entity’s results of operations and financial position. During the six months ended April 30, 2010, the Funds did not hold any derivative instruments. |
| m). | Events Subsequent to the Fiscal Period End – The Funds have adopted financial reporting rules regarding subsequent events which requires an entity to recognize in the financial statements the effects of all subsequent events that provide additional evidence about conditions that existed at the date of the balance sheet. Management has evaluated the Funds’ related events and transactions that occurred subsequent to April 30, 2010, through the date of issuance of the Funds’ financial statements. At its quarterly board meeting held on June 4, 2010, the Board of Trustees approved a 10 basis point shareholder servicing fee on the Original Class shares of the Japan Fund and Japan Smaller Companies Fund. The effective date of the shareholder servicing fee was June 1, 2010. |
| n). | New Accounting Pronouncement – In January 2010, FASB issued Accounting Standards Update (“ASU”) No. 2010-06 “Improving Disclosures about Fair Value Measurements”. ASU 2010-06 amends FASB Accounting Standards Codification Topic 820, Fair Value Measurements and Disclosures, to require additional disclosures regarding fair value measurements. Certain disclosures required by ASU No. 2010-06 are effective for interim and annual reporting periods beginning after December 15, 2009, and other required disclosures are effective for fiscal years beginning after December 15, 2010, and for interim periods within those fiscal years. Management is currently evaluating the impact ASU No. 2010-06 will have on the Funds’ statement disclosures. |
3). INVESTMENT TRANSACTIONS
Purchases and sales of investment securities (excluding government and short-term investments) during the six months ended April 30, 2010 were as follows:
| | Purchases | Sales |
| Large Value Fund | $99,392,108 | $105,909,697 |
| Japan Fund | $ 3,598,908 | $ 5,545,148 |
| Japan Smaller Companies Fund | $ 9,264,527 | $ 8,387,798 |
There were no purchases or sales of long term U.S. Government securities in the Funds during the six months ended April 30, 2010.
4). INVESTMENT MANAGEMENT FEE AND OTHER TRANSACTIONS WITH AFFILIATES
Hennessy Advisors, Inc. (the “Advisor”) is the Advisor of the Funds. The Advisor provides the Funds with investment management services under an Investment Advisory Agreement. The Advisor furnishes all investment advice, office space, facilities, and provides most of the personnel needed by the Funds. As compensation for its services, the Advisor is entitled to a monthly fee from each Fund. The fee is based upon the average daily net assets of the Funds at the annual rate of:
NOTES TO THE FINANCIAL STATEMENTS
| | Large Value Fund | 0.85% |
| | Japan Fund | 1.00% |
| | Japan Smaller Companies Fund | 1.20% |
The Advisor has delegated the day to day management of the Large Value Fund to a Sub-Advisor, RBC Global Asset Management (U.S.), Inc. (“RBC”). The Advisor has delegated the day to day management of the Japan and Japan Smaller Companies Funds to a Sub-Advisor, SPARX Asset Management Co. Ltd. (“SPARX”). The Advisor pays the Sub-Advisor fees for each of the Funds from its own assets and these fees are not an additional expense of the Funds.
The Advisor has agreed to absorb expenses to the extent that the total annual operating expenses (excluding all federal, state and local taxes, interest, brokerage commissions, acquired fund fees and expenses and other costs incurred in connection with the purchase and sale of securities and extraordinary items) do not exceed 1.30% and 0.98% of the Large Value Fund’s net assets for the Original Class and Institutional Class shares, respectively. The expense limitation agreement for the Original Class shares of the Large Value Fund expired on March 31, 2010. The expense limitation agreement for the Institutional Class shares of the Large Value Fund can only be terminated by the Board of Trustees. Additionally, the Advisor had agreed to waive its fees an d absorb expenses to the extent that the total annual operating expenses (excluding all federal, state and local taxes, interest, brokerage commissions, acquired fund fees and expenses and other costs incurred in connection with the purchase and sale of securities and extraordinary items) do not exceed 1.25% of the Japan Fund’s net assets for both the Original Class shares and Institutional Class shares and 1.60% of the net assets of the Japan Smaller Companies Fund, Original Class shares. The expense limitation agreements for the Japan Fund and the Japan Smaller Companies Fund expired on February 28, 2010. For a period of three years after the year in which the Advisor waives or reimburses expenses, the Advisor may seek reimbursement from the Fund to the extent that total annual fund operating expenses are less than the expense limitation in effect at the time of the waiver or reimbursement. The Advisor reimbursed expenses of $38,444, $50,340 and $19,527 for the Large Value, Japa n and Japan Smaller Companies Funds, respectively, for the six months ended April 30, 2010. As of April 30, 2010, cumulative expenses subject to potential recovery to the aforementioned conditions and year of expiration are as follows:
| | | Oct. 31, 2011 | Oct. 31, 2012 | Oct. 31, 2013 | Total |
| | Large Value Fund – Original Class | $91,061 | $7,641 | $38,444 | $137,146 |
| | Large Value Fund – Institutional Class | $ 2,239 | $ 6 | $ — | $ 2,245 |
| | Japan Fund – Original Class | $ — | $ — | $37,425 | $ 37,425 |
| | Japan Fund – Institutional Class | $ — | $ — | $12,915 | $ 12,915 |
| | Japan Smaller Companies Fund – Original Class | $ — | $ — | $19,527 | $ 19,527 |
The Board of Trustees has approved a Shareholder Servicing Plan for the Original Class shares of the Large Value Fund which was instituted to compensate the Advisor for the non-investment management services it provides to the Fund. The Plan provides for a monthly fee paid to the Advisor at an annual rate of 0.10% of the average daily net assets of the Large Value Fund. On June 1, 2010, the Japan and Japan Smaller Companies Funds adopted a shareholder servicing plan; however, they did not incur any shareholder servicing fees during the six months ended April 30, 2010.
HENNESSY FUNDS 1-800-966-4354
The Funds have entered into agreements with various brokers, dealers and financial intermediaries in connection with the sale of shares of the Funds. The agreements provide for periodic payments by the Funds to the brokers, dealers and financial intermediaries for providing certain shareholder maintenance services (sub-transfer agent expenses). These shareholder services include: the pre-processing and quality control of new accounts, shareholder correspondence, answering customer inquiries regarding account status and facilitating shareholder telephone transactions. Fees paid by the Large Value, Japan and Japan Smaller Companies Funds to various brokers, dealers and financial intermediaries for the fiscal period ended October 31, 2009, were $51,785, $40,210 , and $14,261, respectively.
U.S. Bancorp Fund Services, LLC (the “Administrator”) acts as the Funds’ Administrator under an Administration Agreement. Administrative services under this agreement include custody, distribution, fund accounting, fund administration and transfer agent services. In addition, the Administrator prepares various federal and state regulatory filings, reports and returns for the Fund; prepares reports and materials to be supplied to the directors; monitors the activities of the Funds’ custodian, transfer agent and accountants; coordinates the preparation and payment of the Funds’ expenses and reviews the Funds’ expense accruals. Fees paid to U.S. Bancorp Fund Services, LLC for the six month period ended April 30, 2010, were $176,113, $70 ,799 and $19,253, for the Large Value, Japan and Japan Smaller Companies Funds, respectively. The Administrator has voluntarily waived all or a portion of its administration fees allocated to the Institutional Class shares of the Large Value Fund. The administration fees voluntarily waived by the Administrator during the six months ended April 30, 2010 were $39.
Quasar Distributors, LLC (“Quasar”) acts as the Funds’ principal underwriter in a continuous public offering of the Funds’ shares. Quasar is an affiliated company of U.S. Bank, N.A.
5). FEDERAL TAX INFORMATION
The following balances for the Funds are as of October 31, 2009, the Funds’ most recent fiscal year end:
| | | | | | | | | Japan | |
| | | Large | | | | | | Smaller | |
| | | Value | | | Japan | | | Companies | |
| | | Fund | | | Fund | | | Fund | |
| Cost of Investments for tax purposes | | $ | 114,795,217 | | | $ | 59,643,948 | | | $ | 13,458,638 | |
| Gross tax unrealized appreciation | | | 22,806,298 | | | | 5,599,157 | | | | 3,444,166 | |
| Gross tax unrealized depreciation | | | (7,123,722 | ) | | | (11,602,360 | ) | | | (1,012,116 | ) |
| Net tax unrealized appreciation | | | | | | | | | | | | |
| (depreciation) on investments | | $ | 15,682,576 | | | $ | (6,003,203 | ) | | $ | 2,432,050 | |
| Undistributed ordinary income | | $ | 1,390,728 | | | $ | 53,363 | | | $ | 675,389 | |
| Undistributed long-term capital gains | | | — | | | | — | | | | — | |
| Total distributable earnings | | $ | 1,390,728 | | | $ | 53,363 | | | $ | 675,389 | |
| Other accumulated gains (losses) | | $ | (65,540,134 | ) | | $ | (27,995,609 | ) | | $ | (3,818,529 | ) |
| Total accumulated earnings (losses) | | $ | (45,466,830 | ) | | $ | (33,945,449 | ) | | $ | (711,090 | ) |
NOTES TO THE FINANCIAL STATEMENTS
At October 31, 2009, the Large Value Fund had tax basis capital losses of $62,540,134, to offset future capital gains, the use of a portion of which is limited by IRS regulations. Of such losses, $31,599,923 expire October 31, 2016 and $30,940,211 expire on October 31, 2017. Additionally, the Large Value Fund had no post-October loss deferrals as of October 31, 2009.
At October 31, 2009, the Japan Fund had tax basis capital losses of $27,995,609, to offset future capital gains, the use of a portion of which is limited by IRS regulations. Of such losses, $967,738 expire October 31, 2014, $5,345,663 expire on October 31, 2015, $6,231,544 expire October 31, 2016 and $15,450,664 expire October 31, 2017. Additionally, the Japan Fund had no post-October loss deferrals as of October 31, 2009.
At October 31, 2009, the Japan Smaller Companies Fund had tax basis capital losses of $3,818,529, to offset future capital gains, the use of a portion of which is limited by IRS regulations. Of such losses, $6,584 expire October 31, 2015, $69,006 expire October 31, 2016 and $3,742,939 expire October 31, 2017. Additionally, the Japan Smaller Companies Fund had no post-October loss deferrals as of October 31, 2009.
The tax character of distributions paid during 2010 and 2009 for the Funds were as follows:
| | | Six Months Ended | | | | | | | |
| | | April 30, 2010 | | | One Month Ended | | | Year Ended | |
| Large Value Fund | | (Unaudited) | | | October 31, 2009* | | | September 30, 2009 | |
| Ordinary income | | $ | 1,608,137 | | | $ | — | | | $ | 3,122,632 | |
| Long-term capital gain | | | — | | | | — | | | | — | |
| | | $ | 1,608,137 | | | $ | — | | | $ | 3,122,632 | |
| | * | The Large Value Fund changed its fiscal year end to October 31 from September 30. |
| | | Six Months Ended | | | | |
| | | April 30, 2010 | | | Year Ended | |
| Japan Fund | | (Unaudited) | | | October 31, 2009 | |
| Ordinary income | | $ | 103,366 | | | $ | 175,178 | |
| Long-term capital gain | | | — | | | | — | |
| | | $ | 103,366 | | | $ | 175,178 | |
| | | | | | | | |
| | | Six Months Ended | | | | | |
| Japan Smaller | | April 30, 2010 | | | Year Ended | |
| Companies Fund | | (Unaudited) | | | October 31, 2009 | |
| Ordinary income | | $ | 675,389 | | | $ | — | |
| Long-term capital gain | | | — | | | | — | |
| | | $ | 675,389 | | | $ | — | |
HENNESSY FUNDS 1-800-966-4354
6). FUND REORGANIZATION
On March 23, 2009 the shareholders of the Tamarack Value Fund approved the agreement and plan of reorganization providing for the transfer of assets of the Tamarack Value Fund to the Hennessy Select Large Value Fund and the assumption of the liabilities of the Tamarack Value Fund by the Hennessy Select Large Value Fund. The following table illustrates the specifics of the reorganization:
| Acquired | Shares issued to | Acquiring | | |
| Fund | Shareholders of | Fund | Combined | Tax Status |
| Net Assets | Acquired Fund | Net Assets | Net Assets | of Transfer |
$106,344,111(1) | 7,462,745 | — | $106,344,111 | Non-taxable |
| | (1) | Includes accumulated realized losses and unrealized depreciation in the amounts of ($22,268,596) and ($20,869,681) respectively. |
EXPENSE EXAMPLE
Expense Example
April 30, 2010 (Unaudited)
As a shareholder of the Funds, you incur two types of costs: (1) transaction costs, including sales charges (loads) on purchase payments, reinvested dividends, or other distributions; redemption fees; and exchange fees; and (2) ongoing costs, including management fees; service fees; and other Fund expenses. This Example is intended to help you understand your ongoing costs (in dollars) of investing in each of the Funds and to compare these costs with the ongoing costs of investing in other mutual funds. The Example is based on an investment of $1,000 invested at the beginning of the period and held for the entire period from November 1, 2009 through April 30, 2010.
Actual Expenses
The first set of lines of the table below provide information about actual account values and actual expenses. Although the Funds charge no sales loads or transaction fees, you will be assessed fees for outgoing wire transfers, returned checks and stop payment orders at prevailing rates charged by U.S. Bancorp Fund Services, LLC, the Funds’ transfer agent. If you request that a redemption be made by wire transfer, currently a $15.00 fee is charged by the Funds’ transfer agent. IRA accounts will be charged a $15.00 annual maintenance fee (not to exceed $30 per social security number). The example below includes, but is not limited to, management fees, shareholder servicing fees, fund accounting, custody and transfer agent fees. However, the example below does not include portfolio trading commissions and r elated expenses, interest expense or dividends on short positions taken by the Fund and other extraordinary expenses as determined under generally accepted accounting principles. You may use the information within these lines, together with the amount you invested, to estimate the expenses that you paid over the six-month period. Simply divide your account value by $1,000 (for example, an $8,600 account value divided by $1,000 = 8.6), then multiply the result by the number in the first line under the heading entitled “Expenses Paid During Period” to estimate the expenses you paid on your account during this period.
Hypothetical Example for Comparison Purposes
The second set of lines within the table below provide information about hypothetical account values and hypothetical expenses based on the Funds’ actual expense ratios and an assumed rate of return of 5% per year before expenses, which is not the Funds’ actual return. The hypothetical account values and expenses may not be used to estimate the actual ending account balance or expenses you paid for the period. You may use this information to compare the ongoing costs of investing in the Funds and other funds. To do so, compare this 5% hypothetical example with the 5% hypothetical examples that appear in the shareholder reports of the other funds. Please note that the expenses shown in the table are meant to highlight your ongoing costs only and do not reflect any transactional costs, such as sales charges (loads), o r exchange fees. Therefore, the second line of the table is useful in comparing ongoing costs only, and will not
HENNESSY FUNDS 1-800-966-4354
help you determine the relative total costs of owning different funds. In addition, if these transactional costs were included, your costs would have been higher.
| | Beginning | Ending | Expenses Paid |
| | Account Value | Account Value | During Period(1) |
| Original Class | 11/1/09 | 4/30/10 | 11/1/09 – 4/30/10 |
| | | | |
| Actual | | | |
| Large Value Fund – Original Class | $1,000.00 | $1,139.70 | $7.06 |
| Japan Fund – Original Class | $1,000.00 | $1,069.90 | $7.24 |
| Japan Smaller Companies | | | |
| Fund – Original Class | $1,000.00 | $1,071.40 | $9.35 |
| | | | |
| Hypothetical (5% return | | | |
| before expenses) | | | |
| Large Value Fund – Original Class | $1,000.00 | $1,018.20 | $6.66 |
| Japan Fund – Original Class | $1,000.00 | $1,017.80 | $7.05 |
| Japan Smaller Companies | | | |
| Fund – Original Class | $1,000.00 | $1,015.77 | $9.10 |
| (1) | Expenses are equal to the Large Value Fund’s expense ratio of 1.33%, the Japan Fund’s expense ratio of 1.41%, and the Japan Smaller Companies Fund’s expense ratio of 1.82%, multiplied by the average account value over the period, multiplied by 181/365 days (to reflect one-half year period.) |
| | Beginning | Ending | Expenses Paid |
| | Account Value | Account Value | During Period(2) |
| Institutional Class | 11/1/09 | 4/30/10 | 11/1/09 – 4/30/10 |
| | | | |
| Actual | | | |
| Large Value Fund – Institutional Class | $1,000.00 | $1,022.01 | $4.91 |
| Japan Fund – Institutional Class | $1,000.00 | $1,070.40 | $6.78 |
| | | | |
| Hypothetical (5% return | | | |
| before expenses) | | | |
| Large Value Fund – Institutional Class | $1,000.00 | $1,003.10 | $4.87 |
| Japan Fund – Institutional Class | $1,000.00 | $1,018.25 | $6.61 |
| (2) | Expenses are equal to the Large Value Fund’s expense ratio of 0.98%, and the Japan Fund’s expense ratio of 1.32%, multiplied by the average account value over the period, multiplied by 181/365 days (to reflect one-half year period.) |
ADDITIONAL INFORMATION
How to Obtain a Copy of the Fund’s Proxy Voting Policy and Proxy Voting Records
A description of the policies and procedures that the Funds use to determine how to vote proxies relating to portfolio securities is available without charge: (1) by calling 1-800-966-4354; (2) on the Hennessy Funds website at www.hennessyfunds.com; or (3) on the U.S. Securities and Exchange Commission’s website at www.sec.gov. Hennessy Funds’ proxy voting record is available on the SEC’s website at www.sec.gov no later than August 31 for the prior 12 months ending June 30.
Quarterly Filings on Form N-Q
The Fund files its complete schedule of portfolio holdings with the SEC for the first and third quarters of each fiscal year on Form N-Q. The Fund’s Form N-Q will be available on the SEC’s website at www.sec.gov. The Fund’s Form N-Q may be reviewed and copied at the SEC’s Public Reference Room in Washington, DC and information on the operation of the Public Reference Room may be obtained by calling 1-800-SEC-0330. Information included in the Fund’s N-Q will also be available upon request by calling 1-800-966-4354.
Federal Tax Distribution Information (Unaudited)
The Large Value, Japan and Japan Smaller Companies Funds designate 0%, 0% and 0%, respectively, of the dividends declared from net investment income during the year ended October 31, 2009*, as qualified dividend income under the Jobs Growth and Tax Reconciliation Act of 2003.
For the year ended October 31, 2009*, 0%, 0% and 0%, of the ordinary distributions paid by the Large Value, Japan and Japan Smaller Companies Funds qualify for the dividend received deduction available to corporate shareholders.
| * | Effective October 31, 2009, the Large Value Fund changed its fiscal year end to October 31st from September 30th. The percentages listed for the Large Value Fund are for the one month period ended October 31, 2009. |
HENNESSY FUNDS 1-800-966-4354
Board Approval of Continuation of
Investment Advisory Agreement
At its meeting on March 3, 2010, the Board of Directors (the “Board”) of The Hennessy Funds, Inc. and its two series, the Hennessy Balanced Fund (the “Balanced Fund”) and the Hennessy Total Return Fund (the “Total Return Fund”), The Hennessy Mutual Funds, Inc. and its three series, the Hennessy Cornerstone Growth Fund (the “Growth Fund”), the Hennessy Cornerstone Value Fund (the “Value Fund”), and the Hennessy Focus 30 Fund (the “Focus 30 Fund”), The Hennessy Funds Trust which includes the Hennessy Cornerstone Growth Fund, Series II (the “Growth II Fund”), Hennessy Cornerstone Large Growth Fund (the “Large Growth Fund”), and the Hennessy Select Large Value Fund (the “Large Value” Fund), and the Hennessy SPARX Funds Trust and its two series, the Hennessy Select SPARX Japan Fund (the “Japan Fund”) and the Hennessy Select SPARX Japan Smaller Companies Fund ( the “Japan Smaller Companies Fund” or collectively with the Growth, Growth II, Value, Focus 30, Total Return, Balanced, Large Value and Large Growth funds, the “Funds”) including the Directors who are not “interested persons” (as defined in the Investment Company Act of 1940) of the Funds’ voted to re-approve the current investment advisory and sub-advisory agreements (the “Advisory Agreements”) for the Funds. The Board reviewed and discussed the specific services provided by Hennessy Advisors, Inc. (the “Advisor”). The Advisor:
| | • | Provides formula driven investment management for the Balanced Fund, Total Return Fund, Growth Fund, Value Fund, Focus 30 Fund, Growth II Fund and Large Growth Fund. In providing investment management the Advisor directs the trading of securities and the rebalancing of the portfolios for these seven Funds. |
| | • | Provides oversight of the sub-advisors for Large Value Fund, Japan Fund and Japan Smaller Companies Fund. The sub-advisors for those three Funds provide portfolio management, including directing the trading of securities. |
| | • | Pays half of the salary and payroll expenses of the Funds’ Chief Compliance Officer. |
| | • | Provides responsive customer and shareholder servicing which consists of providing a call center to respond to shareholder inquiries, including specific mutual fund account information. Shareholders can contact the Advisor directly during office hours. The Advisor endeavors to answer all calls in person within two rings of the telephone. |
| | • | Oversees distribution of the Funds through third-party broker/dealers and independent financial institutions such as Charles Schwab, Inc., Fidelity, TD Waterhouse and Pershing. The Advisor participates in “no transaction fee” (“NTF”) programs with these companies, which allows customers to purchase the Funds through third party distribution channels without paying a transaction fee. The Advisor pays a portion of the fees charged by these third party distributors. |
BOARD APPROVAL OF CONTINUATION OF INVESTMENT ADVISORY AGREEMENT
| | • | Oversee those third party service providers that support the Funds in providing fund accounting, fund administration, fund distribution, transfer agency and custodial services. |
The Board also: (i) compared the performance of each Fund to benchmark indices over various periods of time and concluded that the performance of each Fund warranted the continuation of the Advisory Agreement; (ii) compared the expense ratios of funds similar in asset size and investment objective to each of the Funds and concluded the actual or projected expenses of each Fund were reasonable and warranted continuation of the Advisory Agreement; (iii) considered the fees charged by Hennessy Advisors, Inc. to those of funds similar in asset size and investment objective to each of the Funds and concluded the advisory fees of each Fund were reasonable and warranted continuation of the Advisory Agreement; (iv) considered the profitability of Hennessy Advisors, Inc. with respect to each Fund and the profitability of the Sub-Advisors with respect to the Select Series Funds and concluded the profits were reasonable and not excessive when compared to profitability guidelines set forth in relevant court cases; (v) considered the high level of professionalism and knowledge, along with an extremely low level of turnover, of the employees of the Advisor; and (vi) considered that Neil Hennessy was named one of the top 100 portfolio managers in the nation by Barron’s from 2003 through 2008 (there was no list in 2009).
The Board then discussed economies of scale and breakpoints and determined that the Funds managed by Hennessy Advisors, Inc. have not yet grown in size, nor has their marketplace demonstrated significantly rapid potential growth to any extent that would warrant the use of breakpoints. The Funds have, in fact, had their assets under management greatly diminish during 2008 and 2009. In reaching this conclusion the Board took into consideration the profitability of Hennessy Advisors, Inc. and the advisory fees of comparable mutual funds.
The Board reviewed the Funds’ expense ratios and comparable expense ratios for funds like the ten funds being considered for contract renewal by Hennessy Advisors, Inc. The Board used data from Lipper as presented in the charts in the Board Materials showing funds similar in nature to the Hennessy Funds (Mid-Cap Blend, Small Cap Blend, etc.). The Board determined that the expense ratios of the Funds fall within the range of the ratios of other funds in their classification. The Board also referenced the Advisor’s Form ADV and copies of the current Investment Advisory Agreements. All of the factors above were considered separately by the non-interested Directors in an executive session during which management of the Advisor was not present. & #160;The factors were viewed in their totality by the Board, with no single factor being the principal or determinative factor in the Board’s determination of whether to approve the continuation of the Advisory Agreements. Based on the factors discussed above, the Board, including all Independent Directors, recommended continuation of the Advisory Agreements.
HENNESSY FUNDS 1-800-966-4354
For information, questions
or assistance, please call
The Hennessy Funds
1-800-966-4354 or 1-415-899-1555
| INVESTMENT ADVISOR | TRUSTEES |
| Hennessy Advisors, Inc. | Neil J. Hennessy |
| 7250 Redwood Blvd., Suite 200 | Robert T. Doyle |
| Novato, California 94945 | J. Dennis DeSousa |
| | Gerald P. Richardson |
| ADMINISTRATOR, TRANSFER | |
| AGENT, DIVIDEND PAYING | COUNSEL |
| AGENT & SHAREHOLDER | Foley & Lardner LLP |
| SERVICING AGENT | 777 East Wisconsin Avenue |
| U.S. Bancorp Fund Services, LLC | Milwaukee, Wisconsin 53202-5306 |
| P.O. Box 701 | |
| Milwaukee, Wisconsin 53201-0701 | INDEPENDENT REGISTERED |
| | PUBLIC ACCOUNTING FIRM |
| CUSTODIAN | KPMG LLP |
| U.S. Bank N.A. | 777 East Wisconsin Avenue, 15th Floor |
| Custody Operations | Milwaukee, Wisconsin 53202 |
| 1555 North River Center Dr., Suite 302 | |
| Milwaukee, Wisconsin 53212 | DISTRIBUTOR |
| | Quasar Distributors, LLC |
| | 615 East Michigan Street |
| | Milwaukee, Wisconsin 53202 |
WWW.HENNESSYFUNDS.COM
This report has been prepared for shareholders and may be distributed to others only if preceded or accompanied by a current prospectus.
Item 2. Code of Ethics.
Not applicable for semi-annual reports.
Item 3. Audit Committee Financial Expert.
Not applicable for semi-annual reports.
Item 4. Principal Accountant Fees and Services.
Not applicable for semi-annual reports.
Item 5. Audit Committee of Listed Registrants.
Not applicable to registrants who are not listed issuers (as defined in Rule 10A-3 under the Securities Exchange Act of 1934).
Item 6. Investments.
Schedule of Investments is included as part of the report to shareholders filed under Item 1 of this Form.
Item 7. Disclosure of Proxy Voting Policies and Procedures for Closed-End Management Investment Companies.
Not applicable to open-end investment companies.
Item 8. Portfolio Managers of Closed-End Management Investment Companies.
Not applicable to open-end investment companies.
Item 9. Purchases of Equity Securities by Closed-End Management Investment Company and Affiliated Purchasers.
Not applicable to open-end investment companies.
Item 10. Submission of Matters to a Vote of Security Holders.
Not Applicable.
Item 11. Controls and Procedures.
| (a) | The Registrant’s Chief Executive Officer and Treasurer have reviewed the Registrant's disclosure controls and procedures (as defined in Rule 30a-3(c) under the Investment Company Act of 1940 (the “Act”)) as of a date within 90 days of the filing of this report, as required by Rule 30a-3(b) under the Act and Rules 13a-15(b) or 15d-15(b) under the Securities Exchange Act of 1934. Based on their review, such officers have concluded that the disclosure controls and procedures are effective in ensuring that information required to be disclosed in this report is appropriately recorded, processed, summarized and reported and made known to them by others within the Registrant and by the Registrant’s service provider. |
| (b) | There were no changes in the Registrant's internal control over financial reporting (as defined in Rule 30a-3(d) under the Act) that occurred during the second fiscal quarter of the period covered by this report that has materially affected, or is reasonably likely to materially affect, the Registrant's internal control over financial reporting. |
Item 12. Exhibits.
| (a) | (1) Any code of ethics or amendment thereto, that is the subject of the disclosure required by Item 2, to the extent that the registrant intends to satisfy Item 2 requirements through filing an exhibit. Not Applicable |
(2) A separate certification for each principal executive and principal financial officer pursuant to Section 302 of the Sarbanes-Oxley Act of 2002. Filed herewith.
(3) Any written solicitation to purchase securities under Rule 23c-1 under the Act sent or given during the period covered by the report by or on behalf of the registrant to 10 or more persons. Not applicable to open-end investment companies.
| (b) | Certifications pursuant to Section 906 of the Sarbanes-Oxley Act of 2002. Furnished herewith. |
SIGNATURES
Pursuant to the requirements of the Securities Exchange Act of 1934 and the Investment Company Act of 1940, the registrant has duly caused this report to be signed on its behalf by the undersigned, thereunto duly authorized.
(Registrant) Hennessy Funds Trust.
By (Signature and Title)* /s/Neil J. Hennessy
Neil J. Hennessy, Principal Executive Officer
Date July 6, 2010
Pursuant to the requirements of the Securities Exchange Act of 1934 and the Investment Company Act of 1940, this report has been signed below by the following persons on behalf of the registrant and in the capacities and on the dates indicated.
By (Signature and Title)* /s/Neil J. Hennessy
Neil J. Hennessy, Principal Executive Officer
Date July 6, 2010
By (Signature and Title)* /s/Teresa M. Nilsen
Teresa M. Nilsen, Treasurer
Date July 6, 2010