ANNUAL REPORT
AUGUST 31, 2023
HENNESSY STANCE ESG ETF
Ticker STNC
This ETF is different from traditional ETFs.
Traditional ETFs tell the public what assets they hold each day. This ETF will not. This may create additional risks for your investment. For example:
• You may have to pay more money to trade the ETF’s shares. This ETF will provide less information to traders, who tend to charge more for trades when they have less information.
• The price you pay to buy ETF shares on an exchange may not match the value of the ETF’s portfolio. The same is true when you sell shares. These price differences may be greater for this ETF compared to other ETFs because it provides less information to traders.
• These additional risks may be even greater in bad or uncertain market conditions.
• The ETF will publish on its website each day a “Portfolio Reference Basket” designed to help trading in shares of the ETF. While the Portfolio Reference Basket includes all the names of the ETF’s holdings, it is not the ETF’s actual portfolio.
The differences between this ETF and other ETFs may also have advantages. By keeping certain information about the ETF portfolio secret, this ETF may face less risk that other traders can predict or copy its investment strategy. This may improve the ETF’s performance. If other traders are able to copy or predict the ETF’s investment strategy, however, this may hurt the ETF’s performance.
www.hennessyetfs.com | 1-800-966-4354
(This Page Intentionally Left Blank.)
Contents
| Letter to Shareholders | | 2 |
| Performance Overview | | 5 |
| Financial Statements | | |
| Schedule of Investments | | 7 |
| Statement of Assets and Liabilities | | 11 |
| Statement of Operations | | 12 |
| Statements of Changes in Net Assets | | 13 |
| Financial Highlights | | 14 |
| Notes to the Financial Statements | | 16 |
| Report of Independent Registered Public Accounting Firm | | 26 |
| Trustees and Officers of the Fund | | 27 |
| Expense Example | | 30 |
| Proxy Voting Policy and Proxy Voting Records | | 31 |
| Availability of Quarterly Portfolio Schedule | | 31 |
| Federal Tax Distribution Information | | 31 |
| Premium/Discount Information | | 31 |
| Important Notice Regarding Delivery of Shareholder Documents | | 32 |
| Electronic Delivery | | 32 |
| Board Approval of Investment Sub-Advisory Agreement | | 33 |
| Liquidity Risk Management Program | | 36 |
| Privacy Policy | | 37 |
| HENNESSY FUNDS | 1-877-671-3199 | |
September 2023
Dear Hennessy Stance ESG ETF Shareholder:
The last 12 months have been quite volatile with markets taking a rapid dip in 2022 and then rebounding in 2023. For the one-year period ended August 31, 2023, the total return of the Hennessy Stance ESG ETF (ticker: STNC) was 8.39%, as compared to the return of the S&P 500® Index of 15.94% for the same period.
To decompose this year by parts, the Fund outperformed the S&P 500® Index on a total return basis in the second half of 2022 by 3.98% (with four of those months included in the Fund’s fiscal year 2023), with the Fund returning 6.29% and the S&P 500® Index returning 2.31%. This was largely driven by our risk management focus on not concentrating too much in a single stock and aversion to mega cap stocks, which underperformed during the time period.
In contrast, the first six months of calendar year 2023 had the opposite story where a small number of mega-cap technology stocks rallied significantly while most of the market was flat. For that period, the Fund returned 6.45% versus 16.89% for the S&P 500® Index.
To break this down further:
| | 1. | The return of the S&P 500® Index was driven by a small amount of mega-cap constituents, thereby making active unbiased management challenging for the one-year period ended August 31, 2023. |
| | | |
| | 2. | Equal weight indexes and investment products and the investable universe in general underperformed, with only 30% of names outperforming. Therefore, our ability to outperform by stock selection was limited. |
| | | |
| | 3. | We generally expect the Fund to outperform in a down market and underperform in a straight up market environment after a large downturn. We believe this past year is very similar to 2020. The Fund’s inception date is March 15, 2021, but we have managed assets for the same strategy in a separate account format since 2014 (the “Strategy”). In calendar year 2020, the Strategy outperformed the S&P 500® Index strongly in the first calendar quarter but underperformed it in the second quarter despite ending up net ahead of the benchmark for the full six-month period. |
| | | |
| | 4. | A significant portion of the Fund’s underperformance occurred in the second calendar quarter of 2023. During that quarter, our first step of applying a rules-based methodology to score companies that align better with our environmental, social, and governance metrics than their peers yielded an investable universe with lower average returns than the broader market. Although our second step of applying a quantitative investment process yielded an investable universe with higher average returns than the overall market, intersecting the two steps yielded a universe with lower returns than the overall market. |
| | | |
| | 5. | Even if we had the same investable universe as the broader market, the Fund still would have underperformed the S&P 500® Index because of the outsized impact of a small amount of mega-cap constituents on the return of the S&P 500® Index and our reluctance to concentrate too much in a single security as part of our risk management processes. |
The majority of the Fund’s underperformance for the one-year period ended August 31, 2023, was because of the above effects. However, in some time periods, avoiding
concentration in mega-cap names can avoid losses (such as in calendar year 2022 when the Fund outperformed the S&P 500® Index by over 5%).
We believe strongly that the market will normalize and that our aversion to making risky concentrated bets will pay off. We do not think it would be prudent to change our risk rules or to increase allocation into highly-concentrated, under-diversified bets. We maintain our conviction that it is not wise from a risk-management standpoint to allocate 7.5% in a single security (Apple, Inc.’s approximate weight in the S&P 500® Index) and generally target a maximum position size in a single security of 3.5%.
We are constantly evaluating, testing, and implementing new sources of data and technology in order to continuously innovate and potentially deliver stronger outperformance and values alignment. We are confident that as we grow, our pace of innovation should accelerate, which we believe will deliver shareholder value. Despite the underperformance on a relative basis for the one-year period ended August 31, 2023, we believe our analytics show that our investment process remains very strong and that the Fund’s underperformance is driven by a challenging and risky market environment.
We thank you for your continued trust and support in us, and we hope to continuously earn and deliver upon it. Thank you for your investment in the Hennessy Funds.
Sincerely,

| |
| |
| |
 |
| Bill Davis |
| Portfolio Manager, Hennessy Stance ESG ETF |
| Managing Director, Stance Capital, LLC |
Stance Capital, LLC is the sub-advisor to the Hennessy Stance ESG ETF responsible for the day-to-day management of the Fund’s portfolio, other than the trading functions delegated to Vident Advisory, LLC.
Past performance does not guarantee future results.
Mutual fund investing involves risk. Principal loss is possible.
Opinions expressed are those of Bill Davis and are subject to change, are not guaranteed, and should not be considered investment advice.
Portfolio holdings are subject to change at any time. Please refer to the Schedule of Investments included in this report for additional portfolio information.
The S&P 500® Index is a capitalization-weighted index that is designed to represent the broad domestic economy through changes in aggregate market value of 500 stocks across all major industries. Index return does not include trading and management costs, which would lower performance. The index is used herein for comparative purposes in accordance with SEC regulations. One cannot invest directly in an index.
Performance data quoted represents past performance; past performance does not guarantee future results. The investment return and principal value of an investment will fluctuate so that an investor’s shares, when redeemed, may be worth more or less than their original cost. Current performance of the Fund may be lower or higher than the performance quoted. Performance data current to the most recent month end may be obtained by visiting hennessyetfs.com. Performance for periods including or prior to December 22, 2022, is that of the Stance Equity ESG Large Cap Core ETF.
| HENNESSY FUNDS | 1-877-671-3199 | |
(This Page Intentionally Left Blank.)
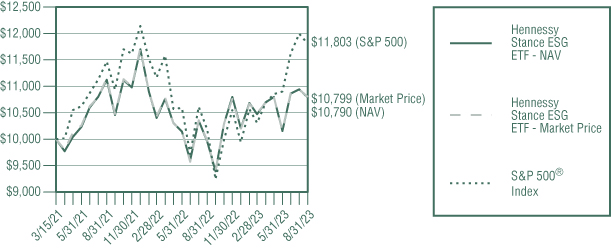
Performance Overview (Unaudited)
CHANGE IN VALUE OF $10,000 INVESTMENT
This graph illustrates the performance of an initial investment of $10,000 made in the Fund on its inception date and assumes the reinvestment of dividends and capital gains.
AVERAGE ANNUAL TOTAL RETURN FOR PERIODS ENDED AUGUST 31, 2023
| | | | Since |
| | Six | One | Inception |
| | Months(1) | Year | (3/15/21) |
| Hennessy Stance ESG | | | |
ETF (STNC) – NAV(2) | 3.03% | 8.39% | 3.13% |
| Hennessy Stance ESG | | | |
ETF (STNC) – Market Price(2) | 2.94% | 8.32% | 3.17% |
S&P 500® Index | 14.50% | 15.94% | 6.96% |
Expense ratio: Gross 0.95%, Net 0.85%(3)
(1) | Periods of less than one year are not annualized. |
(2) | Fund performance is shown based on both a net asset value (“NAV”) and market price basis. The Fund’s per share NAV is the value of one share of the Fund. NAV is calculated by taking the Fund’s total assets (including the fair value of securities owned), subtracting liabilities, and dividing by the number of shares outstanding. The NAV return is based on the NAV of the Fund, and the market price return is based on the market price per share of the Fund. The price used to calculate market price return is determined using the official closing price of the primary stock exchange (generally, 4:00 p.m. Eastern time) and may not represent the returns you would receive if shares were traded at other times. NAV and market price returns assume that dividends and capital gain distributions have been reinvested in the Fund at NAV and market price, respectively. |
(3) | The Fund’s investment advisor has contractually agreed to limit expenses until December 31, 2024. |
_______________
Performance data quoted represents past performance; past performance does not guarantee future results. The investment return and principal value of an investment will fluctuate so that an investor’s shares, when redeemed, may be worth more or less than their original cost. Shares are
| HENNESSY FUNDS | 1-877-671-3199 | |
bought and sold at market price (closing price), not NAV, and are not individually redeemed from the Fund. Brokerage commissions will reduce returns. The performance table does not reflect the deduction of taxes that a shareholder would pay on Fund distributions or the redemption of Fund shares. Current performance of the Fund may be lower or higher than the performance quoted. Performance data current to the most recent month end may be obtained by visiting www.hennessyetfs.com. Performance for periods including or prior to December 22, 2022, is that of the Stance Equity ESG Large Cap Core ETF.
The S&P 500® Index is a capitalization weighted index that is designed to represent the broad domestic economy through changes in the aggregate market value of 500 stocks across all major industries. Index return does not include trading and management costs, which would lower performance. One cannot invest directly in an index. This index is used for comparative purposes in accordance with Securities and Exchange Commission regulations.
Standard & Poor’s Financial Services is the source and owner of the S&P® and S&P 500® trademarks.
The expense ratio presented is from the most recent prospectus. The expense ratio for the current reporting period is available in the Financial Highlights section of this report.
| PERFORMANCE OVERVIEW/SCHEDULE OF INVESTMENTS |
Financial Statements
Schedule of Investments as of August 31, 2023 |
HENNESSY STANCE ESG ETF
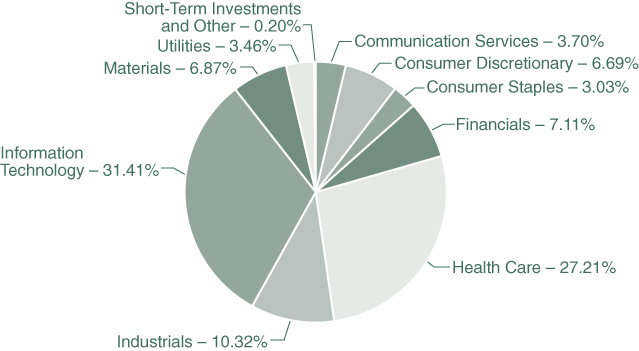
(% of Net Assets)
| TOP TEN HOLDINGS (EXCLUDING MONEY MARKET FUNDS) | % NET ASSETS |
| Eli Lilly & Co. | 4.11% |
| Regeneron Pharmaceuticals, Inc. | 4.06% |
| Avery Dennison Corp. | 3.82% |
| Verisk Analytics, Inc. | 3.72% |
| Alphabet, Inc., Class A | 3.70% |
| Mastercard, Inc., Class A | 3.66% |
| Accenture PLC, Class A | 3.59% |
| First Solar, Inc. | 3.59% |
| Autodesk, Inc. | 3.57% |
| Humana, Inc. | 3.55% |
Note: For presentation purposes, the Fund has grouped some of the industry categories. For purposes of categorizing securities for compliance with Section 8(b)(1) of the Investment Company Act of 1940, as amended, the Fund uses more specific industry classifications.
The Global Industry Classification Standard (GICS®) was developed by and is the exclusive property and a service mark of MSCI, Inc. and Standard & Poor’s Financial Services LLC. It has been licensed for use by the Hennessy Funds.
| HENNESSY FUNDS | 1-877-671-3199 | |
| COMMON STOCKS – 99.80% | | Number | | | | | | % of | |
| | | of Shares | | | Value | | | Net Assets | |
| Communication Services – 3.70% | | | | | | | | | |
| Alphabet, Inc., Class A (a) | | | 12,328 | | | $ | 1,678,704 | | | | 3.70 | % |
| | | | | | | | | | | | | |
| Consumer Discretionary – 6.69% | | | | | | | | | | | | |
| Carnival Corp. (b) | | | 16,747 | | | | 264,938 | | | | 0.59 | % |
| NIKE, Inc., Class B | | | 13,412 | | | | 1,364,134 | | | | 3.01 | % |
| Ulta Beauty, Inc. (a) | | | 3,375 | | | | 1,400,726 | | | | 3.09 | % |
| | | | | | | | 3,029,798 | | | | 6.69 | % |
| | | | | | | | | | | | | |
| Consumer Staples – 3.03% | | | | | | | | | | | | |
| The Hershey Co. | | | 6,385 | | | | 1,371,881 | | | | 3.03 | % |
| | | | | | | | | | | | | |
| Financials – 7.11% | | | | | | | | | | | | |
| Mastercard, Inc., Class A | | | 4,019 | | | | 1,658,400 | | | | 3.66 | % |
| S&P Global, Inc. | | | 4,000 | | | | 1,563,440 | | | | 3.45 | % |
| | | | | | | | 3,221,840 | | | | 7.11 | % |
| | | | | | | | | | | | | |
| Health Care – 27.21% | | | | | | | | | | | | |
| Agilent Technologies, Inc. | | | 2,341 | | | | 283,425 | | | | 0.63 | % |
| Biogen, Inc. (a) | | | 4,074 | | | | 1,089,225 | | | | 2.40 | % |
| Danaher Corp. | | | 4,920 | | | | 1,303,800 | | | | 2.88 | % |
| Davita, Inc. (a) | | | 12,898 | | | | 1,321,013 | | | | 2.92 | % |
| Eli Lilly & Co. | | | 3,357 | | | | 1,860,449 | | | | 4.11 | % |
| Humana, Inc. | | | 3,486 | | | | 1,609,242 | | | | 3.55 | % |
| Mettler-Toledo International, Inc. (a) | | | 849 | | | | 1,030,245 | | | | 2.27 | % |
| Regeneron Pharmaceuticals, Inc. (a) | | | 2,227 | | | | 1,840,593 | | | | 4.06 | % |
| Universal Health Services, Inc. | | | 10,051 | | | | 1,353,870 | | | | 2.99 | % |
| Zoetis, Inc. | | | 3,333 | | | | 634,970 | | | | 1.40 | % |
| | | | | | | | 12,326,832 | | | | 27.21 | % |
| | | | | | | | | | | | | |
| Industrials – 10.32% | | | | | | | | | | | | |
| Dover Corp. | | | 3,585 | | | | 531,655 | | | | 1.18 | % |
| Nordson Corp. | | | 6,444 | | | | 1,573,238 | | | | 3.47 | % |
| United Airlines Holdings, Inc. (a) | | | 17,748 | | | | 884,028 | | | | 1.95 | % |
| Verisk Analytics, Inc. | | | 6,962 | | | | 1,686,336 | | | | 3.72 | % |
| | | | | | | | 4,675,257 | | | | 10.32 | % |
| | | | | | | | | | | | | |
| Information Technology – 31.41% | | | | | | | | | | | | |
| Accenture PLC, Class A (b) | | | 5,024 | | | | 1,626,621 | | | | 3.59 | % |
| Amphenol Corp. | | | 17,167 | | | | 1,517,219 | | | | 3.35 | % |
| ANSYS, Inc. (a) | | | 4,488 | | | | 1,431,089 | | | | 3.16 | % |
The accompanying notes are an integral part of these financial statements.
| COMMON STOCKS | | Number | | | | | | % of | |
| | | of Shares | | | Value | | | Net Assets | |
| Information Technology (Continued) | | | | | | | | | |
| Apple, Inc. | | | 8,027 | | | $ | 1,508,033 | | | | 3.33 | % |
| Autodesk, Inc. (a) | | | 7,300 | | | | 1,620,162 | | | | 3.57 | % |
| Enphase Energy, Inc. (a) | | | 8,309 | | | | 1,051,338 | | | | 2.32 | % |
| First Solar, Inc. (a) | | | 8,611 | | | | 1,628,512 | | | | 3.59 | % |
| HP, Inc. | | | 42,340 | | | | 1,257,921 | | | | 2.78 | % |
| Keysight Technologies, Inc. (a) | | | 8,398 | | | | 1,119,453 | | | | 2.47 | % |
| Microsoft Corp. | | | 4,493 | | | | 1,472,626 | | | | 3.25 | % |
| | | | | | | | 14,232,974 | | | | 31.41 | % |
| | | | | | | | | | | | | |
| Materials – 6.87% | | | | | | | | | | | | |
| Avery Dennison Corp. | | | 9,198 | | | | 1,732,719 | | | | 3.82 | % |
| Nucor Corp. | | | 6,155 | | | | 1,059,275 | | | | 2.34 | % |
| Steel Dynamics, Inc. | | | 2,996 | | | | 319,344 | | | | 0.71 | % |
| | | | | | | | 3,111,338 | | | | 6.87 | % |
| | | | | | | | | | | | | |
| Utilities – 3.46% | | | | | | | | | | | | |
| Exelon Corp. | | | 39,037 | | | | 1,566,165 | | | | 3.46 | % |
| | | | | | | | | | | | | |
| Total Common Stocks | | | | | | | | | | | | |
| (Cost $45,558,812) | | | | | | | 45,214,789 | | | | 99.80 | % |
| | | | | | | | | | | | | |
| SHORT-TERM INVESTMENTS – 0.18% | | | | | | | | | | | | |
| | | | | | | | | | | | | |
| Money Market Funds – 0.18% | | | | | | | | | | | | |
| First American Treasury Obligations Fund, | | | | | | | | | | | | |
| Institutional Class, 5.26% (c) | | | 81,595 | | | | 81,595 | | | | 0.18 | % |
| | | | | | | | | | | | | |
| Total Short-Term Investments | | | | | | | | | | | | |
| (Cost $81,595) | | | | | | | 81,595 | | | | 0.18 | % |
| | | | | | | | | | | | | |
| Total Investments | | | | | | | | | | | | |
| (Cost $45,640,407) – 99.98% | | | | | | | 45,296,384 | | | | 99.98 | % |
| Other Assets in Excess of Liabilities – 0.02% | | | | | | | 9,457 | | | | 0.02 | % |
| | | | | | | | | | | | | |
TOTAL NET ASSETS – 100.00% | | | | | | $ | 45,305,841 | | | | 100.00 | % |
Percentages are stated as a percent of net assets.
ADR — American Depositary Receipt
PLC — Public Limited Company
| (a) | Non-income-producing security. |
| (b) | U.S.-traded security of a foreign corporation. |
| (c) | The rate listed is the fund’s seven-day yield as of August 31, 2023. |
The accompanying notes are an integral part of these financial statements.
| HENNESSY FUNDS | 1-877-671-3199 | |
Summary of Fair Value Exposure as of August 31, 2023
The following is a summary of the inputs used to value the Fund’s net assets as of August 31, 2023 (see Note 3 in the accompanying Notes to the Financial Statements):
| Common Stocks | | Level 1 | | | Level 2 | | | Level 3 | | | Total | |
| Communication Services | | $ | 1,678,704 | | | $ | — | | | $ | — | | | $ | 1,678,704 | |
| Consumer Discretionary | | | 3,029,798 | | | | — | | | | — | | | | 3,029,798 | |
| Consumer Staples | | | 1,371,881 | | | | — | | | | — | | | | 1,371,881 | |
| Financials | | | 3,221,840 | | | | — | | | | — | | | | 3,221,840 | |
| Health Care | | | 12,326,832 | | | | — | | | | — | | | | 12,326,832 | |
| Industrials | | | 4,675,257 | | | | — | | | | — | | | | 4,675,257 | |
| Information Technology | | | 14,232,974 | | | | — | | | | — | | | | 14,232,974 | |
| Materials | | | 3,111,338 | | | | — | | | | — | | | | 3,111,338 | |
| Utilities | | | 1,566,165 | | | | — | | | | — | | | | 1,566,165 | |
| Total Common Stocks | | $ | 45,214,789 | | | $ | — | | | $ | — | | | $ | 45,214,789 | |
| Short-Term Investments | | | | | | | | | | | | | | | | |
| Money Market Funds | | $ | 81,595 | | | $ | — | | | $ | — | | | $ | 81,595 | |
| Total Short-Term Investments | | $ | 81,595 | | | $ | — | | | $ | — | | | $ | 81,595 | |
| Total Investments | | $ | 45,296,384 | | | $ | — | | | $ | — | | | $ | 45,296,384 | |
The accompanying notes are an integral part of these financial statements.
| SCHEDULE OF INVESTMENTS/STATEMENT OF ASSETS AND LIABILITIES |
Financial Statements
Statement of Assets and Liabilities as of August 31, 2023 |
| ASSETS: | | | |
| Investments in securities, at value (cost $45,640,407) | | $ | 45,296,384 | |
| Dividends and interest receivable | | | 41,938 | |
| Total assets | | | 45,338,322 | |
| | | | | |
| LIABILITIES: | | | | |
| Payable to advisor | | | 32,481 | |
| Total liabilities | | | 32,481 | |
| NET ASSETS | | $ | 45,305,841 | |
| | | | | |
| NET ASSETS CONSIST OF: | | | | |
| Par value | | $ | 1,695 | |
| Capital stock | | | 46,956,944 | |
| Accumulated deficit | | | (1,652,798 | ) |
| Total net assets | | $ | 45,305,841 | |
| | | | | |
| NET ASSETS: | | | | |
| Shares authorized ($0.001 par value) | | | 100,000,000 | |
| Net assets applicable to outstanding shares | | $ | 45,305,841 | |
| Shares issued and outstanding | | | 1,695,000 | |
| Net asset value, offering price, and redemption price per share | | $ | 26.73 | |
The accompanying notes are an integral part of these financial statements.
| HENNESSY FUNDS | 1-877-671-3199 | |
Financial Statements
Statement of Operations for the year ended August 31, 2023 |
| INVESTMENT INCOME: | | | |
Dividend income(1) | | $ | 487,041 | |
| Interest income | | | 5,240 | |
| Total investment income | | | 492,281 | |
| | | | | |
| EXPENSES: | | | | |
| Investment advisory fees (See Note 5) | | | 418,300 | |
| Total expenses before waivers | | | 418,300 | |
| Expense reimbursement from advisor | | | (44,032 | ) |
| Net expenses | | | 374,268 | |
| NET INVESTMENT INCOME | | $ | 118,013 | |
| | | | | |
| REALIZED AND UNREALIZED GAINS (LOSSES): | | | | |
| Net realized gain on investments | | $ | 2,720,539 | |
| Net realized gain from redemption in-kind | | | 228,423 | |
| Net change in unrealized appreciation/depreciation on investments | | | 454,119 | |
| Net gain on investments | | | 3,403,081 | |
| NET INCREASE IN NET ASSETS RESULTING FROM OPERATIONS | | $ | 3,521,094 | |
(1) | Net of foreign taxes and issuance fees withheld of $195. |
The accompanying notes are an integral part of these financial statements.
| STATEMENT OF OPERATIONS/STATEMENTS OF CHANGES IN NET ASSETS |
Financial Statements
| Statements of Changes in Net Assets |
| | | Year Ended | | | Year Ended | |
| | | August 31, 2023 | | | August 31, 2022 | |
| OPERATIONS: | | | | | | |
| Net investment income | | $ | 118,013 | | | $ | 285,024 | |
| Net realized gain (loss) on investments | | | 2,948,962 | | | | (1,557,093 | ) |
| Net change in unrealized | | | | | | | | |
| appreciation/depreciation on investments | | | 454,119 | | | | (3,140,125 | ) |
| Net increase (decrease) in net | | | | | | | | |
| assets resulting from operations | | | 3,521,094 | | | | (4,412,194 | ) |
| | | | | | | | | |
| DISTRIBUTIONS TO SHAREHOLDERS: | | | | | | | | |
| Distributable earnings | | | (247,449 | ) | | | (164,737 | ) |
| Total distributions | | | (247,449 | ) | | | (164,737 | ) |
| | | | | | | | | |
| CAPITAL SHARE TRANSACTIONS: | | | | | | | | |
| Proceeds from shares subscribed | | | 4,008,931 | | | | 34,013,802 | |
| Cost of shares redeemed | | | (4,506,305 | ) | | | (24,191,858 | ) |
| Net increase (decrease) in net assets derived | | | | | | | | |
| from capital share transactions | | | (497,374 | ) | | | 9,821,944 | |
| TOTAL INCREASE IN NET ASSETS | | | 2,776,271 | | | | 5,245,013 | |
| | | | | | | | | |
| NET ASSETS: | | | | | | | | |
| Beginning of year | | | 42,529,570 | | | | 37,284,557 | |
| End of year | | $ | 45,305,841 | | | $ | 42,529,570 | |
| | | | | | | | | |
| CHANGES IN SHARES OUTSTANDING: | | | | | | | | |
| Shares sold | | | 155,000 | | | | 1,245,000 | |
| Shares redeemed | | | (175,000 | ) | | | (870,000 | ) |
| Net increase (decrease) in shares outstanding | | | (20,000 | ) | | | 375,000 | |
The accompanying notes are an integral part of these financial statements.
| HENNESSY FUNDS | 1-877-671-3199 | |
Financial Statements
For a share outstanding throughout each period
PER SHARE DATA:
Net asset value, beginning of period
Income from investment operations:
Net investment income(2)
Net realized and unrealized gains (losses) on investments
Total from investment operations
Less distributions:
Dividends from net investment income
Dividends from net realized gains
Total distributions
Net asset value, end of period
Market value, end of period
TOTAL RETURN ON NET ASSET VALUE(3)
TOTAL RETURN ON MARKET PRICE(4)
SUPPLEMENTAL DATA AND RATIOS:
Net assets, end of period (millions)
Ratio of expenses to average net assets:
Before expense reimbursement
After expense reimbursement
Ratio of net investment income to average net assets:
Before expense reimbursement
After expense reimbursement
Portfolio turnover rate(7)
(1) | Inception date of the Fund was March 15, 2021. |
(2) | Calculated using the average shares outstanding method. |
(3) | Total investment return/(loss) on net asset value is calculated assuming a purchase of shares on the first day and a sale of shares on the last day of each period reported and includes reinvestments of dividends and distributions, if any. |
(4) | Total investment return/(loss) on market price is calculated assuming an initial investment made at the market price on the first day of the period, reinvestment of dividends and distributions at market price during the period, and redemption at market price on the last day of the period. |
(5) | Not annualized. |
(6) | Annualized. |
(7) | Excludes effect of in-kind transfers. |
The accompanying notes are an integral part of these financial statements.
| Year Ended | | | Year Ended | | | Period Ended | | |
| August 31, | | | August 31, | | | August 31, | | |
| 2023 | | | 2022 | | | 2021(1) | | |
| | | | | | | | | |
| $ | 24.80 | | | $ | 27.82 | | | $ | 25.00 | | |
| | | | | | | | | | | | |
| | | | | | | | | | | | |
| | 0.07 | | | | 0.20 | | | | 0.02 | | |
| | 2.01 | | | | (3.10 | ) | | | 2.80 | | |
| | 2.08 | | | | (2.90 | ) | | | 2.82 | | |
| | | | | | | | | | | | |
| | | | | | | | | | | | |
| | (0.15 | ) | | | (0.10 | ) | | | — | | |
| | — | | | | (0.02 | ) | | | — | | |
| | (0.15 | ) | | | (0.12 | ) | | | — | | |
| $ | 26.73 | | | $ | 24.80 | | | $ | 27.82 | | |
| $ | 26.74 | | | $ | 24.83 | | | $ | 27.91 | | |
| | | | | | | | | | | | |
| | 8.39 | % | | | -10.50 | % | | | 11.23 | %(5) | |
| | 8.32 | % | | | -10.63 | % | | | 11.56 | %(5) | |
| | | | | | | | | | | | |
| | | | | | | | | | | | |
| $ | 45,306 | | | $ | 42,530 | | | $ | 37,285 | | |
| | | | | | | | | | | | |
| | 0.95 | % | | | 0.95 | % | | | 0.95 | %(6) | |
| | 0.85 | % | | | 0.85 | % | | | 0.85 | %(6) | |
| | | | | | | | | | | | |
| | 0.17 | % | | | 0.64 | % | | | 0.09 | %(6) | |
| | 0.27 | % | | | 0.74 | % | | | 0.19 | %(6) | |
| | 274 | % | | | 290 | % | | | 180 | %(5) | |
The accompanying notes are an integral part of these financial statements.
| HENNESSY FUNDS | 1-877-671-3199 | |
Financial Statements
Notes to the Financial Statements August 31, 2023 |
1). ORGANIZATION
The Hennessy Stance ESG ETF (the “Fund”) is a series of Hennessy Funds Trust (the “Trust”), which was organized as a Delaware statutory trust on September 17, 1992. The Fund is an actively managed exchange-traded fund that operates pursuant to an exemptive order from the Securities and Exchange Commission (the “SEC”). The Fund is a successor to the Stance Equity ESG Large Cap Core ETF (the “Predecessor Fund”) pursuant to a reorganization that took place after the close of business on December 22, 2022. Prior to December 22, 2022, the Fund had no investment operations. The Fund is the accounting and performance information successor of the Predecessor Fund. The investment objective of the Fund is long-term capital appreciation. The Fund is a diversified fund and offers one class of shares.
As an investment company, the Fund follows the investment company accounting and reporting guidance of the Financial Accounting Standards Board Accounting Standard Codification Topic 946 “Financial Services—Investment Companies.”
2). SIGNIFICANT ACCOUNTING POLICIES
The following is a summary of significant accounting policies consistently followed by the Fund in the preparation of the financial statements. These policies conform to U.S. generally accepted accounting principles (“GAAP”).
| a). | Securities Valuation – All investments in securities are valued in accordance with the Fund’s valuation policies and procedures, as described in Note 3. |
| | |
| b). | Federal Income Taxes – The Fund has elected to be taxed as a regulated investment company and intends to distribute substantially all of its taxable income to its shareholders and otherwise comply with the provisions of the Internal Revenue Code of 1986, as amended, applicable to regulated investment companies. As a result, the Fund has made no provision for federal income taxes or excise taxes. Net investment income/loss and realized gains/losses for federal income tax purposes may differ from those reported in the financial statements because of temporary book-basis and tax-basis differences. Temporary differences are primarily the result of the treatment of partnership income and wash sales for tax reporting purposes. The Fund recognizes interest and penalties related to income tax benefits, if any, in the Statement of Operations as an income tax expense. Distributions from net realized gains for book purposes may include short-term capital gains, which are included as ordinary income to shareholders for tax purposes. The Fund may utilize equalization accounting for tax purposes and designate earnings and profits, including net realized gains distributed to shareholders on redemption of shares, as part of the dividends paid deduction for income tax purposes. |
| | |
| | Due to inherent differences in the recognition of income, expenses, and realized gains/losses under GAAP and federal income tax regulations, permanent differences between book and tax basis for reporting are identified and appropriately reclassified in the Statement of Assets and Liabilities, as needed. The adjustments for fiscal year 2023 are as follows: |
| | Total | | |
| | Distributable | | |
| | Earnings | Capital Stock | |
| | $(2,436,072) | $2,436,072 | |
| NOTES TO THE FINANCIAL STATEMENTS |
| c). | Accounting for Uncertainty in Income Taxes – The Fund has accounting policies regarding recognition and measurement of tax positions taken or expected to be taken on a tax return. The tax returns of the Fund for the prior three fiscal years are open for examination. The Fund has reviewed all open tax years in major tax jurisdictions and concluded that there is no impact on the Fund’s net assets and no tax liability resulting from unrecognized tax benefits relating to uncertain income tax positions taken or expected to be taken on a tax return. The Fund’s major tax jurisdictions are U.S. federal and Delaware. |
| | |
| d). | Income and Expenses – Dividend income is recognized on the ex-dividend date or as soon as information is available to the Fund. Interest income, which includes the amortization of premium and accretion of discount, is recognized on an accrual basis. Market discounts, original issue discounts, and market premiums on debt securities are accreted or amortized to interest income over the life of a security with a corresponding increase or decrease, as applicable, in the cost basis of such security using the yield-to-maturity method or, where applicable, the first call date of the security. Other non-cash dividends are recognized as investment income at the fair value of the property received. Expenses and fees, including investment advisory fees, are accrued daily and taken into account for the purpose of determining the net asset value (“NAV”) of the Fund. As discussed further in Note 5, most expenses of the Fund are paid by Hennessy Advisors, Inc. (the “Advisor”) under a unitary fee arrangement. |
| | |
| e). | Distributions to Shareholders – Dividends from net investment income for the Fund, if any, are declared and paid annually, usually in December. Distributions of net realized capital gains, if any, are declared and paid annually, usually in December. |
| | |
| f). | Security Transactions – Investment transactions are recorded on the trade date. The Fund determines the realized gain/loss from an investment transaction by comparing the original cost of the security lot sold with the net sale proceeds. Discounts and premiums on securities purchased are accreted or amortized, respectively, over the life of each such security. |
| | |
| g). | Use of Estimates – Preparing financial statements in accordance with GAAP requires management to make estimates and assumptions that affect the reported amounts of assets and liabilities and disclosure of contingent assets and liabilities at the date of the financial statements, as well as the reported change in net assets during the reporting period. Actual results could differ from those estimates. |
| | |
| h). | Share Valuation – The NAV per share of the Fund is calculated by dividing (i) the total value of the securities held by the Fund, plus cash and other assets, minus all liabilities (including estimated accrued expenses) by (ii) the total number of Fund shares outstanding, rounded to the nearest $0.01. Fund shares are not priced on days the New York Stock Exchange is closed for trading. |
| | |
| i). | Illiquid Securities – Pursuant to Rule 22e-4 under the 1940 Act, the Fund has adopted a Liquidity Risk Management Program (the “Liquidity Program”). The Liquidity Program requires, among other things, that the Fund limit its illiquid investments to no more than 15% of its net assets. An illiquid investment is any investment that the Fund reasonably expects cannot be sold or disposed of by the Fund in current market conditions in seven calendar days or less without the sale or disposition significantly changing the market value of the investment. |
| | |
| j). | Recent Accounting Pronouncements and Regulatory Updates – In October 2022, the Securities and Exchange Commission (“SEC”) adopted a final rule relating to Tailored Shareholder Reports for Mutual Funds and Exchange-Traded Funds (ETFs); |
| HENNESSY FUNDS | 1-877-671-3199 | |
| | Fee Information in Investment Company Advertisements. The rule and form amendments will require mutual funds and ETFs to transmit concise and visually engaging shareholder reports that highlight key information. The amendments also will require that funds tag information in a structured data format. In addition, the rule amendments will require that certain more in-depth information be made available online and available for delivery free of charge to investors on request. The amendments became effective January 24, 2023. There is an 18-month transition period after the effective date of the amendment. |
| | |
| | In June 2022, the FASB issued ASU 2022-03, “Fair Value Measurement (Topic 820): Fair Value Measurement of Equity Securities Subject to Contractual Sale Restrictions.” The ASU clarifies that a contractual restriction on the sale of an equity security is not considered part of the unit of account of the equity security and, therefore, is not considered in measuring the fair value. The amendments also require additional disclosures related to equity securities subject to contractual sale restrictions. The ASU is effective for fiscal years beginning after December 15, 2023 and interim periods within those fiscal years. |
3). SECURITIES VALUATION
The Fund follows its valuation policies and procedures in determining its NAV and, in preparing these financial statements, the fair value accounting standards that establish an authoritative definition of fair value and set out a hierarchy for measuring fair value. These standards require additional disclosures about the various inputs and valuation techniques used to develop the measurements of fair value and a discussion of changes in valuation techniques and related inputs during the period. These inputs are summarized in the three broad levels listed below:
| | Level 1 – | Unadjusted, quoted prices in active markets for identical instruments that the Fund has the ability to access at the date of measurement. |
| | | |
| | Level 2 – | Other significant observable inputs other than quoted prices included in Level 1 (including, but not limited to, quoted prices in active markets for similar instruments, quoted prices in markets that are not active for identical or similar instruments, and model-derived valuations in which all significant inputs and significant value drivers are observable in active markets, such as interest rates, prepayment speeds, credit risk curves, default rates, and similar data). |
| | | |
| | Level 3 – | Significant unobservable inputs (including the Fund’s own assumptions about what market participants would use to price the asset or liability based on the best available information) when observable inputs are unavailable. |
The following is a description of the valuation techniques applied to the Fund’s major categories of assets and liabilities on a recurring basis:
| | Equity Securities – Equity securities, including common stocks, preferred stocks, foreign-issued common stocks, exchange-traded funds, and real estate investment trusts, that are traded on a securities exchange for which a last-quoted sales price is readily available generally are valued at the last sales price as reported by the primary exchange on which the securities are listed. Securities listed on The Nasdaq Stock Market (“Nasdaq”) generally are valued at the Nasdaq Official Closing Price, which may differ from the last sales price reported. Securities traded on a securities exchange for which a last-quoted sales price is not readily available generally are valued at the mean between the bid and ask prices. To the extent these securities are |
| NOTES TO THE FINANCIAL STATEMENTS |
| | actively traded and valuation adjustments are not applied, they are classified in Level 1 of the fair value hierarchy. Securities traded on foreign exchanges generally are not valued at the same time the Fund calculates its NAV because most foreign markets close well before such time. The earlier close of most foreign markets gives rise to the possibility that significant events, including broad market moves, may have occurred in the interim. In certain circumstances, it may be determined that a foreign security needs to be fair valued because it appears that the value of the security might have been materially affected by events occurring after the close of the market in which the security is principally traded, but before the time the Fund calculates its NAV, such as by a development that affects an entire market or region (e.g., a weather-related event) or a potentially global development (e.g., a terrorist attack that may be expected to have an effect on investor expectations worldwide). |
| | |
| | Registered Investment Companies – Investments in open-end registered investment companies, commonly referred to as mutual funds, generally are priced at the ending NAV provided by the applicable mutual fund’s service agent and are classified in Level 1 of the fair value hierarchy. |
| | |
| | Debt Securities – Debt securities, including corporate bonds, asset-backed securities, mortgage-backed securities, municipal bonds, U.S. Treasuries, and U.S. government agency issues, are generally valued at market on the basis of valuations furnished by an independent pricing service that utilizes both dealer-supplied valuations and formula-based techniques. The pricing service may consider recently executed transactions in securities of the issuer or comparable issuers, market price quotations (where observable), bond spreads, and fundamental data relating to the issuer. In addition, the model may incorporate observable market data, such as reported sales of similar securities, broker quotes, yields, bids, offers, and reference data. Certain securities are valued primarily using dealer quotations. These securities are generally classified in Level 2 of the fair value hierarchy. |
| | |
| | Short-Term Securities – Short-term equity investments, including money market funds, are valued in the manner specified above for equity securities. Short-term debt investments with an original term to maturity of 60 days or less are valued at amortized cost, which approximates fair market value. If the original term to maturity of a short-term debt investment exceeds 60 days, then the values as of the 61st day prior to maturity are amortized. Amortized cost is not used if its use would be inappropriate due to credit or other impairments of the issuer, in which case the security’s fair value would be determined as described below. Short-term securities are generally classified in Level 1 or Level 2 of the fair value hierarchy depending on the inputs used and market activity levels for specific securities. |
If market quotations are not readily available or if a significant event has occurred that indicates the closing price of a security no longer represents the true value of that security, any security or other asset will be valued at its fair value in accordance with Rule 2a-5 under the 1940 Act as determined by the Advisor under the Fund’s fair value pricing procedures, subject to oversight by the Board of Trustees of the Fund (the “Board”). Fair value pricing determinations are made in good faith in accordance with these procedures. There are numerous criteria considered in determining a fair value of a security, such as the trading volume of a security and markets, the values of other similar securities, and news events with direct bearing on a security or markets. Fair value pricing results in an estimated price for a security that reflects the amount the Fund might reasonably expect to receive in a current sale. Depending on the relative significance of the valuation inputs, these securities may be classified in either Level 2 or Level 3 of the
| HENNESSY FUNDS | 1-877-671-3199 | |
fair value hierarchy. The Advisor will regularly evaluate whether the Fund’s fair value pricing procedures continue to be appropriate in light of the specific circumstances of the Fund and the quality of prices obtained through their application of such procedures.
The fair value of foreign securities may be determined with the assistance of a pricing service using correlations between the movement of prices of such securities and indices of domestic securities and other appropriate indicators, such as closing market prices of relevant American Depositary Receipts or futures contracts. Using fair value pricing means that the Fund’s NAV reflects the affected portfolio securities’ values as determined by the Advisor, the Board’s valuation designee, pursuant to the Fund’s fair value pricing procedures, instead of being determined by the market. Using a fair value pricing methodology to price a foreign security may result in a value that is different from such foreign security’s most recent closing price and from the value used by other investment companies to calculate their NAVs. Such securities are generally classified in Level 2 of the fair value hierarchy. Because the Fund may invest in foreign securities, the value of the Fund’s portfolio securities may change on days when a shareholder is unable to purchase or redeem Fund shares.
The Fund has performed an analysis of all existing investments to determine the significance and character of all inputs to their fair value determinations. Various inputs are used to determine the value of the Fund’s investments. The inputs or methodology used for valuing securities are not necessarily an indication of the risk associated with investing in those securities. Details related to the fair value hierarchy of the Fund’s securities as of August 31, 2023, are included in the Schedule of Investments.
4). INVESTMENT TRANSACTIONS
Purchases and sales of investment securities (excluding government and short-term investments) for the Fund during fiscal year 2023 were $120,620,332 and $120,596,628, respectively.
There were no purchases or sales/maturities of long-term U.S. government securities for the Fund during fiscal year 2023.
Purchases and sales of in-kind transactions for the Fund during fiscal year 2023 were $3,928,126 and $4,415,168, respectively.
5). INVESTMENT ADVISORY FEE AND OTHER TRANSACTIONS WITH AFFILIATES
Prior to the close of business on December 22, 2022, Red Gate Advisors, LLC acted as the investment advisor to the Predecessor Fund. Red Gate Advisors, LLC furnished all investment advice, office space, and facilities, as well as most of the personnel needed by the Fund. As compensation for its services, Red Gate Advisors, LLC was entitled to a unitary management fee from the Predecessor Fund. The fee was based upon the average daily net assets of the Predecessor Fund at an annual rate of 0.95%. From the unitary management fee, Red Gate Advisors, LLC paid most of the expenses of the Predecessor Fund, including the cost of sub-advisory, transfer agency, custody, fund administration, legal, audit, and other services. The net investment advisory fees expensed by the Predecessor Fund during the period from September 1, 2022, to December 22, 2022, were $127,031.
Effective following the close of business on December 22, 2022, the Advisor provides the Fund with investment advisory services under an Investment Advisory Agreement (the “Investment Advisory Agreement”). The Advisor furnishes all investment advice, office space, and facilities and most of the personnel needed by the Fund. As compensation for its services, the Advisor is entitled to a unitary management fee from
| NOTES TO THE FINANCIAL STATEMENTS |
the Fund. The fee is based on the average daily net assets of the Fund at an annual rate of 0.95%. From the unitary management fee, the Advisor pays most of the expenses of the Fund, including the cost of sub-advisory, transfer agency, custody, fund administration, legal, audit, and other services. The net investment advisory fees expensed by the Fund during the period from December 23, 2022, to August 31, 2023, were $291,269.
The Advisor has contractually agreed to waive a portion of its unitary management fee to the extent necessary to limit the Fund’s annual operating expenses (excluding all federal, state, and local taxes, interest, brokerage commissions, dividend and interest expenses on short sales, extraordinary items, and acquired fund fees and expenses and other costs incurred in connection with the purchase and sale of securities) to 0.85% of the Fund’s net assets through December 31, 2024.
For a period of three years after the year in which the Advisor waives or reimburses expenses, the Advisor may seek reimbursement from the Fund to the extent that total annual fund operating expenses are less than the expense limitation that was in effect at the time the Advisor waived or reimbursed expenses. As of August 31, 2023, expenses subject to potential recovery were $30,660, which will expire in fiscal year 2026.
During the period from September 1, 2022, to the close of business on December 22, 2022, Red Gate Advisors, LLC had contractually agreed to limit total annual operating expenses and to maintain the expense limitation for the Predecessor Fund on the same terms as described above. The net investment advisory fees waived by the Predecessor Fund during the period from September 1, 2022, to December 22, 2022, were $13,372.
Stance Capital, LLC (“Stance Capital”) and Vident Advisory, LLC (“Vident”) each serve as an investment sub-advisor to the Fund. The Advisor has delegated the day-to-day management of the portfolio composition of the Fund to Stance Capital. Following the close of business on December 22, 2022, the Advisor (not the Fund) paid a sub-advisory fee to Stance Capital at the average rate of 0.40% of the daily net assets of the Fund. Pursuant to the sub-advisory agreement, the Advisor pays Stance Capital sub-advisory fees at an annual rate of 0.40% of the average daily net assets up to $125 million, 0.37% of average daily net assets for assets over $125 million and up to $250 million, and 0.35% for average daily net assets over $250 million. Prior to July 14, 2023, the Advisor had delegated the responsibility for selecting broker-dealers to execute purchase and sale transactions for the Fund to Vident Investment Advisory, LLC (“VIA”), as instructed by Stance Capital and subject to the supervision of the Advisor and the Board. On July 14, 2023, VIA completed an acquisition transaction that resulted in a change of control of VIA and automatic termination of our sub-advisory agreement with VIA. On the same date, we entered into a new sub-advisory agreement with Vident with the same terms and conditions as the prior sub-advisory agreement with VIA. Following the close of business on December 22, 2022, the Advisor (not the Fund) paid a sub-advisory fee to VIA or Vident, as applicable, at the average rate of 0.05% of the daily net assets of the Fund. Pursuant to the prior sub-advisory agreement with VIA and the current sub-advisory agreement with Vident, the Advisor pays sub-advisory fees at an annual rate of 0.05% of the Fund’s average daily net assets up to $250 million, 0.045% of average daily net assets for assets over $250 million and up to $500 million, and 0.04% for average daily net assets in excess of $500 million, subject to a minimum sub-advisory fee to of $18,750 on an annual basis. Prior to the close of business on December 22, 2022, Red Gate Advisors, LLC paid the sub-advisory fees to Stance Capital and VIA from its own assets, and these fees were not an additional expense of the Fund.
U.S. Bancorp Fund Services, LLC, d/b/a U.S. Bank Global Fund Services (“Fund Services”) provides the Fund with administrative, accounting, and transfer agent services.
| HENNESSY FUNDS | 1-877-671-3199 | |
As administrator, Fund Services is responsible for activities such as (i) preparing various federal and state regulatory filings, reports, and returns for the Fund, (ii) preparing reports and materials to be supplied to the Board, (iii) monitoring the activities of the Fund’s custodian, transfer agent, and accountants, and (iv) coordinating the preparation and payment of the Fund’s expenses and reviewing the Fund’s expense accruals. U.S. Bank N.A., an affiliate of Fund Services, serves as the Fund’s custodian. The servicing agreements between the Trust, Fund Services, and U.S. Bank N.A. contain a fee schedule that is inclusive of administrative, accounting, custody, and transfer agent fees. Under the terms of the Investment Advisory Agreement, the Advisor pays the Fund’s administrative, accounting, custody, and transfer agency fees.
Quasar Distributors, LLC, a wholly owned broker-dealer subsidiary of Foreside Financial Group, LLC, acts as the Fund’s principal underwriter in a continuous public offering of Fund shares.
During the period from September 1, 2022, to the close of business on December 22, 2022, the officers and Chief Compliance Officer of the Predecessor Fund were employees of Fund Services. Chief Compliance Officer fees paid by the Predecessor Fund to Fund services during the period from September 1, 2022, to December 22, 2022 were paid by Red Gate Advisors, LLC. Effective following the close of business on December 22, 2022, the officers of the Fund are affiliated with the Advisor. Under the terms of the Investment Advisory Agreement, the Advisor pays the Fund’s Chief Compliance Officer fees.
6). GUARANTEES AND INDEMNIFICATIONS
Under the Hennessy Funds’ organizational documents, their officers and trustees are indemnified by the Hennessy Funds against certain liabilities arising out of the performance of their duties to the Hennessy Funds. Additionally, in the normal course of business, the Hennessy Funds enter into contracts with service providers that contain general indemnification clauses. The Fund’s maximum exposure under these arrangements is unknown as this would involve future claims that may be made against the Fund that have not yet occurred. Currently, the Fund expects the risk of loss to be remote.
7). FEDERAL TAX INFORMATION
As of August 31, 2023, the components of accumulated earnings (losses) for income tax purposes were as follows:
| | | Investments | |
| Cost of investments for tax purposes | | $ | 45,710,319 | |
| Gross tax unrealized appreciation | | $ | 1,788,029 | |
| Gross tax unrealized depreciation | | | (2,201,964 | ) |
| Net tax unrealized appreciation/(depreciation) | | $ | (413,935 | ) |
As of October 31, 2022, the Fund’s tax year end, the tax-basis of distributable earnings/(accumulated losses) were as follows:
| Undistributed ordinary income | | $ | 220,465 | |
| Undistributed long-term capital gains | | | — | |
| Total distributable earnings | | $ | 220,465 | |
As of October 31, 2022, the Fund had $6,284,300 in unlimited short-term capital loss carryforwards.
As of October 31, 2022, the Fund did not defer, on a tax basis, any late-year ordinary losses. Late-year ordinary losses are net ordinary losses incurred after December 31, 2021, but within the taxable year, that are deemed to arise on the first day of the Fund’s next taxable year.
| NOTES TO THE FINANCIAL STATEMENTS |
During fiscal years 2023 and 2022, the tax character of distributions paid by the Fund was as follows:
| | | Year Ended | | | Year Ended | |
| | | August 31, 2023 | | | August 31, 2022 | |
Ordinary income(1) | | $ | 247,449 | | | $ | 134,419 | |
| Long-term capital gains | | | — | | | | 30,318 | |
| Total distributions | | $ | 247,449 | | | $ | 164,737 | |
| | (1) Ordinary income includes short-term capital gains. |
8). SHARE TRANSACTIONS
Shares of the Fund are listed and traded on the NYSE Arca, Inc. (the “Exchange”). Market prices for the shares may be different from their NAV. The Fund issues and redeems shares on a continuous basis at NAV only in blocks of 5,000 shares, called “Creation Units.” Creation Units are issued and redeemed principally in-kind for securities included in a specified universe. Once created, shares generally trade in the secondary market at market prices that change throughout the day. Except when aggregated in Creation Units, shares are not redeemable securities of the Fund. Creation Units may only be purchased or redeemed by certain financial institutions (“Authorized Participants”). An Authorized Participant is either (i) a broker-dealer or other participant in the clearing process through the Continuous Net Settlement System of the National Securities Clearing Corporation or (ii) a Depository Trust Company participant and, in each case, must have executed a Participant Agreement with the Distributor. Most retail investors do not qualify as Authorized Participants and do not have the resources to buy and sell whole Creation Units. Therefore, they are unable to purchase or redeem shares directly from the Fund. Rather, most retail investors may purchase shares in the secondary market with the assistance of a broker and are subject to customary brokerage commissions or fees.
The Fund currently offers one class of shares, which has no front-end sales load, no deferred sales charge, and no redemption fee. A fixed transaction fee is imposed for the transfer and other transaction costs associated with the purchase or sale of Creation Units. The standard fixed transaction fee for the Fund is $300, payable to the custodian. In addition, a variable fee may be charged on all cash transactions or substitutes for Creation Units of up to a maximum of 2% as a percentage of the value of the Creation Units subject to the transaction. Variable fees are imposed to compensate the Fund for the transaction costs associated with the cash transactions. Variable fees received by the Fund, if any, are displayed in the capital shares transactions section of the Statement of Changes in Net Assets. Shares of the Fund have equal rights and privileges.
From time to time, settlement of securities related to in-kind redemptions may be delayed. In such cases, securities related to in-kind transactions are reflected as a receivable or a payable in the Statements of Assets and Liabilities.
9). MARKET AND GEOPOLITICAL RISKS
The increasing interconnectivity between global economies and financial markets increases the likelihood that events or conditions in one region or financial market may adversely impact issuers in a different country, region or financial market. Securities in the Fund’s portfolios may underperform due to volatility in the banking sector, including bank failures, inflation (or expectations for inflation), increasing interest rates, global demand for particular products or resources, natural disasters, pandemics, epidemics, terrorism, international conflicts, regulatory events and governmental or quasi-governmental actions. The occurrence of global events similar to those in recent years
| HENNESSY FUNDS | 1-877-671-3199 | |
may result in market volatility and may have long-term effects on both the U.S. and global financial markets. It is not known how long such impacts, or any future impacts of other significant events described above, will or would last, but there could be a prolonged period of global economic slowdown, which may impact your Fund investment.
10). AGREEMENT AND PLAN OF REORGANIZATION
On December 6, 2022, shareholders of the Predecessor Fund approved an Agreement and Plan of Reorganization between the Trust, on behalf of the Fund, and The RBB Fund, Inc., a Maryland corporation, on behalf of the Predecessor Fund. The Agreement and Plan of Reorganization provided for the transfer of all of the assets of the Predecessor Fund to the Fund and the assumption of the liabilities (other than any excluded liabilities) of the Predecessor Fund by the Fund. The Fund was created to carry out the reorganization and has a substantially similar investment objective and substantially similar principal investment strategies as the Predecessor Fund. The following table illustrates the specifics of the reorganization of the Predecessor Fund into the Fund as of December 22, 2022:
| | Shares Issued to | | | |
| Predecessor | Shareholders of | Fund | Combined | Tax Status |
Fund Net Assets | Predecessor Fund | Net Assets | Net Assets | of Transfer |
$42,147,609(1) | 1,670,000 | $0 | $42,147,609 | Non-taxable |
| | (1) | Includes accumulated net investment income, accumulated realized gains, and unrealized appreciation in the amounts of $14,189, $5,465,299, and $2,059,710, respectively. |
11). MATTERS SUBMITTED TO A SHAREHOLDER VOTE (Unaudited)
A special meeting of shareholders of the Fund was held on July 14, 2023, and the following matters were approved:
Proposal to approve a new investment sub-advisory agreement between the Advisor and Vident, on behalf of the Fund.
For: 941,222
Against: 25
Abstain: 0
Nonvotes: 698,753
Proposal to approve for the Fund to operate under a “manager of managers” arrangement.
For: 941,121
Against: 126
Abstain: 0
Nonvotes: 698,753
12). EVENTS SUBSEQUENT TO YEAR END
Management has evaluated the Fund’s related events and transactions that occurred subsequent to August 31, 2023, through the date of issuance of the Fund’s financial statements. Other than as disclosed below, management has determined that there were no subsequent events requiring recognition or disclosure in the financial statements.
At a Board meeting held on October 8, 2023, the Board approved changing the fiscal year end of the Fund for financial reporting purposes from August 31 to October 31.
On October 24, 2023, shareholders of the CCM Small/Mid Cap Impact Value Fund approved an Agreement and Plan of Reorganization between the Trust, on behalf of the Fund, and the Quaker Investment Trust, a Delaware statutory trust, on behalf of the CCM
| NOTES TO THE FINANCIAL STATEMENTS |
Small/Mid Cap Impact Value Fund. The Agreement and Plan of Reorganization provided for the transfer of all of the assets of the CCM Small/Mid Cap Impact Value Fund to the Fund and the assumption of all liabilities of the CCM Small/ Mid Cap Impact Value Fund by the Fund. The CCM Small/Mid Cap Impact Value Fund and the Fund have substantially similar investment objectives. The reorganization is expected to be effective in November 2023.
The meeting of shareholders of the CCM Core Impact Equity Fund was postponed to November 2023.
| HENNESSY FUNDS | 1-877-671-3199 | |
Report of Independent Registered Public
Accounting Firm
To the Board of Trustees of Hennessy Funds Trust
and the shareholders of the Hennessy Stance ESG ETF
Novato, CA
Opinion on the Financial Statements
We have audited the accompanying statement of assets and liabilities of the Hennessy Stance ESG ETF Fund (the “Fund”), a series of Hennessy Funds Trust, including the schedule of investments, as of August 31, 2023, the related statement of operations, the statement of changes in net assets, and financial highlights for the year ended August 31, 2023, and the related notes (collectively referred to as the “financial statements”). In our opinion, the financial statements present fairly, in all material respects, the financial position of the Fund as of August 31, 2023, the results of its operations, the changes in its net assets and the financial highlights for the year then ended, in conformity with accounting principles generally accepted in the United States of America.
The statements of changes in net assets attributable to common stockholders for the year ended August 31, 2022, and the financial highlights for the year ended August 31, 2022 and for the period March 15, 2021 (commencement of operations) through August 31, 2021, were audited by other auditors, whose report dated October 28, 2022 expressed an unqualified opinion on such financial statements and financial highlights.
Basis for Opinion
These financial statements are the responsibility of the Fund’s management. Our responsibility is to express an opinion on the Fund’s financial statements based on our audit. We are a public accounting firm registered with the Public Company Accounting Oversight Board (United States) (“PCAOB”) and are required to be independent with respect to the Fund in accordance with the U.S. federal securities laws and the applicable rules and regulations of the Securities and Exchange Commission and the PCAOB. We have served as the auditor of one or more of the funds in the Trust since 2002.
We conducted our audit in accordance with the standards of the PCAOB. Those standards require that we plan and perform the audit to obtain reasonable assurance about whether the financial statements are free of material misstatement, whether due to error or fraud. The Fund is not required to have, nor were we engaged to perform, an audit of its internal control over financial reporting. As part of our audit we are required to obtain an understanding of internal control over financial reporting, but not for the purpose of expressing an opinion on the effectiveness of the Fund’s internal control over financial reporting. Accordingly, we express no such opinion.
Our audit included performing procedures to assess the risks of material misstatement of the financial statements, whether due to error or fraud, and performing procedures that respond to those risks. Such procedures included examining, on a test basis, evidence regarding the amounts and disclosures in the financial statements. Our audit also included evaluating the accounting principles used and significant estimates made by management, as well as evaluating the overall presentation of the financial statements. Our procedures included confirmation of securities owned as of August 31, 2023, by correspondence with the custodian. We believe that our audit provides a reasonable basis for our opinion.
| |  |
| | TAIT, WELLER & BAKER LLP |
Philadelphia, Pennsylvania
October 27, 2023
| REPORT OF INDEPENDENT REGISTERED PUBLIC ACCOUNTING FIRM/TRUSTEES AND OFFICERS |
Trustees and Officers of the Fund (Unaudited)
The business and affairs of the Funds are managed under the direction of the Board of Trustees of the Trust, and the Board of Trustees elects the officers of the Trust (“Officers”). From time to time, the Board of Trustees also has appointed advisers to the Board of Trustees (“Advisers”) with the intention of having qualified individuals serve in an advisory capacity to garner experience in the mutual fund and asset management industry and be considered as potential Trustees in the future. There are currently two Advisers, Brian Alexander and A.J. Hennessy. As Advisers, Mr. Alexander and Mr. A.J. Hennessy attend meetings of the Board of Trustees and act as non-voting participants. Information pertaining to the Trustees, Advisers, and the Officers of the Trust is set forth below. The Trustees and Officers serve until their successors are duly elected and qualified or until their earlier death, resignation, or removal. Each Trustee oversees all 17 Hennessy Funds. Unless otherwise indicated, the address of all persons listed below is 7250 Redwood Boulevard, Suite 200, Novato, CA 94945. The Fund’s Statement of Additional Information includes more information about the persons listed below and is available without charge by calling 1-800-966-4354 or by visiting www.hennessyetfs.com.
| | | | Other |
| | | | Directorships |
| | | | Held Outside |
| Name, Age, | | | of Fund |
| and Position Held | Start Date | Principal Occupation(s) | Complex During |
with the Trust | of Service | During Past Five Years | Past Five Years |
| | | |
Disinterested Trustees(1) and Disinterested Advisers | | |
| | | | |
| J. Dennis DeSousa | January 1996 | Mr. DeSousa is a real estate investor. | None. |
| 87 | | | |
| Trustee | | | |
| | | | |
| Robert T. Doyle | January 1996 | Mr. Doyle is retired. He served as the | None. |
| 75 | | Sheriff of Marin County, California | |
| Trustee | | from 1996 to June 2022. | |
| | | | |
| Doug Franklin | March 2016 | Mr. Franklin is a retired insurance | None. |
| 58 | as an Adviser | industry executive. From 1987 | |
| Trustee | to the Board | through 2015, he was employed by | |
| | and June 2023 | the Allianz-Fireman’s Fund Insurance | |
| | as a Trustee | Company in various positions, | |
| | | including as its Chief Actuary and | |
| | | Chief Risk Officer. | |
| | | | |
| Claire Garvie | December 2015 | Ms. Garvie is a founder of Kiosk and | None. |
| 48 | as an Adviser | has served as its Chief Operating | |
| Trustee | to the Board and | Officer since 2004. Kiosk is a full- | |
| | December 2021 | service marketing agency with | |
| | as a Trustee | offices in the San Francisco Bay Area | |
| | | and Liverpool, UK and staff across | |
| | | nine states in the U.S. | |
| | | | |
| Gerald P. Richardson | May 2004 | Mr. Richardson is an independent | None. |
| 77 | | consultant in the securities industry. | |
| Trustee | | | |
| HENNESSY FUNDS | 1-877-671-3199 | |
| | | | Other |
| | | | Directorships |
| | | | Held Outside |
| Name, Age, | | | of Fund |
| and Position Held | Start Date | Principal Occupation(s) | Complex During |
with the Trust | of Service | During Past Five Years | Past Five Years |
| Brian Alexander | March 2015 | Mr. Alexander has served as the | None. |
| 41 | | Chief Operating Officer of Solis | |
| Adviser to the Board | | Mammography since March 2023. | |
| | | Prior to that, he worked for the Sutter | |
| | | Health organization from 2011 to 2023 | |
| | | in various positions. He served as the | |
| | | Chief Executive Officer of the North | |
| | | Valley Hospital Area from 2021 to | |
| | | March 2023. From 2018 to 2021, he | |
| | | served as the Chief Executive Officer | |
| | | of Sutter Roseville Medical Center. | |
| | | From 2016 through 2018, he served | |
| | | as the Vice President of Strategy for | |
| | | the Sutter Health Valley Area, which | |
| | | includes 11 hospitals, 13 ambulatory | |
| | | surgery centers, 16,000 employees, | |
| | | and 1,900 physicians. | |
| | | | |
Interested Trustee and Interested Adviser(2) | | |
| | | | |
| Neil J. Hennessy | January 1996 as | Mr. Neil Hennessy has been employed | Hennessy |
| 67 | a Trustee and | by Hennessy Advisors, Inc. since | Advisors, Inc. |
| Chairman of the Board, | June 2008 as | 1989 and currently serves as its | |
| Chief Market Strategist, | an Officer | Chairman and Chief Executive Officer. | |
| Portfolio Manager, | | | |
| and President | | | |
| | | | |
| A.J. Hennessy | December 2022 | Mr. A.J. Hennessy has been employed | None. |
| 37 | | by Hennessy Advisors, Inc. since 2011. | |
| Adviser to the Board | | | |
| and Vice President, | | | |
| Corporate Development | | | |
| and Operations | | | |
| Name, Age, | | |
| and Position Held | Start Date | Principal Occupation(s) |
with the Trust | of Service | During Past Five Years |
| | | |
| Officers | | |
| | | |
| Teresa M. Nilsen | January 1996 | Ms. Nilsen has been employed by Hennessy Advisors, Inc. |
| 57 | | since 1989 and currently serves as its President, Chief |
| Executive Vice President | | Operating Officer, and Secretary. |
| and Treasurer | | |
| | | |
| Daniel B. Steadman | March 2000 | Mr. Steadman has been employed by Hennessy Advisors, Inc. |
| 67 | | since 2000 and currently serves as its Executive Vice President. |
| Executive Vice President | | |
| and Secretary | | |
| | | |
| Brian Carlson | December 2013 | Mr. Carlson has been employed by Hennessy Advisors, Inc. |
| 50 | | since December 2013 and currently serves as its Chief |
| Senior Vice President | | Compliance Officer and Senior Vice President. |
| and Head of Distribution | | |
| TRUSTEES AND OFFICERS OF THE FUND |
| Name, Age, | | |
| and Position Held | Start Date | Principal Occupation(s) |
with the Trust | of Service | During Past Five Years |
David Ellison(3) | October 2012 | Mr. Ellison has been employed by Hennessy Advisors, Inc. since |
| 65 | | October 2012. He has served as a Portfolio Manager of the |
| Senior Vice President | | Hennessy Large Cap Financial Fund and the Hennessy Small |
| and Portfolio Manager | | Cap Financial Fund since their inception. Mr. Ellison also served |
| | | as a Portfolio Manager of the Hennessy Technology Fund from |
| | | its inception until February 2017. Mr. Ellison served as Director, |
| | | CIO, and President of FBR Fund Advisers, Inc. from December |
| | | 1999 to October 2012. |
| | | |
Jennifer Emerson(4) | June 2013 | Ms. Emerson has been employed by Hennessy Advisors, Inc. |
| 46 | | as its General Counsel since June 2013. |
| Senior Vice President and | | |
| Chief Compliance Officer | | |
| | | |
Ryan Kelley(5) | March 2013 | Mr. Kelley has been employed by Hennessy Advisors, Inc. since |
| 50 | | October 2012. He has served as Chief Investment Officer of the |
| Senior Vice President, | | Hennessy Funds since March 2021 and has served as a Portfolio |
| Chief Investment Officer, | | Manager of the Hennessy Gas Utility Fund, the Hennessy Large |
| and Portfolio Manager | | Cap Financial Fund, and the Hennessy Small Cap Financial Fund |
| | | since October 2014. Mr. Kelley served as Co-Portfolio Manager |
| | | of these same funds from March 2013 through September |
| | | 2014 and as a Portfolio Analyst for the Hennessy Funds from |
| | | October 2012 through February 2013. He has also served as a |
| | | Portfolio Manager of the Hennessy Cornerstone Growth Fund, |
| | | the Hennessy Cornerstone Mid Cap 30 Fund, the Hennessy |
| | | Cornerstone Large Growth Fund, and the Hennessy |
| | | Cornerstone Value Fund since February 2017 and as a Portfolio |
| | | Manager of the Hennessy Total Return Fund, the Hennessy |
| | | Balanced Fund, and the Hennessy Technology Fund since May |
| | | 2018. He previously served as Co-Portfolio Manager of the |
| | | Hennessy Technology Fund from February 2017 until May 2018. |
| | | Mr. Kelley served as Portfolio Manager of FBR Fund Advisers, |
| | | Inc. from January 2008 to October 2012. |
| | | |
L. Joshua Wein(5) | September 2018 | Mr. Wein has been employed by Hennessy Advisors, Inc. since |
| 50 | | 2018. He has served as Portfolio Manager of the Hennessy |
| Vice President and | | Cornerstone Growth Fund, the Hennessy Cornerstone Mid |
| Portfolio Manager | | Cap 30 Fund, the Hennessy Cornerstone Large Growth Fund, |
| | | the Hennessy Cornerstone Value Fund, Hennessy Total Return |
| | | Fund, the Hennessy Balanced Fund, the Hennessy Gas Utility |
| | | Fund, and the Hennessy Technology Fund since February 2021, |
| | | and as the Co-Portfolio Manager of these Funds since February |
| | | 2019. He served as a Senior Analyst of those same Funds from |
| | | September 2018 through February 2019. He also has served as |
| | | a Portfolio Manager of the Hennessy Energy Transition Fund |
| | | and the Hennessy Midstream Fund since January 2022. Mr. Wein |
| | | served as Director of Alternative Investments and Co-Portfolio |
| | | Manager at Sterling Capital Management from 2008 to 2018. |
_______________
(1) | The Funds have determined that Mr. DeSousa, Mr. Doyle, Mr. Franklin, Ms. Garvie, and Mr. Richardson are not interested persons, as defined in the 1940 Act, of the Investment Manager or of any predecessor investment adviser for purposes of Section 15(f) of the 1940 Act. |
(2) | Each of Neil J. Hennessy and A.J. Hennessy is considered an interested person, as defined in the 1940 Act, because he is an officer of the Trust. |
(3) | The address of this officer is 101 Federal Street, Suite 1615B, Boston, MA 02110. |
(4) | The address of this officer is 4800 Bee Caves Road, Suite 100, Austin, TX 78746. |
(5) | The address of this officer is 1340 Environ Way, Chapel Hill, NC 27517. |
| HENNESSY FUNDS | 1-877-671-3199 | |
Expense Example (Unaudited)
August 31, 2023
As a shareholder of the Fund, you incur ongoing costs, including management fees, service fees, and other Fund expenses. This Example is intended to help you understand your ongoing costs (in dollars) of investing in the Fund and to compare these costs with the ongoing costs of investing in other mutual funds. The Example is based on an investment of $1,000 invested at the beginning of the period and held for the entire period from March 1, 2023, through August 31, 2023.
Actual Expenses
The first line of the table below provides information about actual account values and actual expenses. You may use this information, together with the amount you invested, to estimate the expenses that you paid over the period. Simply divide your account value by $1,000 (for example, an $8,600 account value divided by $1,000 = 8.6), then multiply the result by the number in the first line under the heading “Expenses Paid During Period” to estimate the expenses you paid on your account during this period. You may pay brokerage commissions on your purchases and sales of Fund shares, which are not reflected in the example.
Hypothetical Example for Comparison Purposes
The second line of the table below provides information about hypothetical account values and hypothetical expenses based on the Fund’s actual expense ratio and an assumed rate of return of 5% per year before expenses, which is not the Fund’s actual return. The hypothetical account values and expenses may not be used to estimate the actual ending account balance or expenses you paid for the period. You may use this information to compare the ongoing costs of investing in the Fund and other funds. To do so, compare this 5% hypothetical example with the 5% hypothetical examples that appear in the shareholder reports of the other funds. Please note that the expenses shown in the table are meant to highlight your ongoing costs only. Therefore, the second line is useful in comparing ongoing costs only and will not help you determine the relative total costs of owning different funds.
| | | | Expenses Paid |
| | Beginning | Ending | During Period(1) |
| | Account Value | Account Value | March 1, 2023 – |
| | March 1, 2023 | August 31, 2023 | August 31, 2023 |
| Investor Class | | | |
| Actual | $1,000.00 | $1,030.30 | $4.35 |
| Hypothetical (5% return before expenses) | $1,000.00 | $1,020.92 | $4.33 |
(1) | Expenses are equal to the Fund’s annualized expense ratio of 0.85%, multiplied by the average account value over the period, multiplied by 184/365 days (to reflect the half-year period). |
| EXPENSE EXAMPLE – PREMIUM/DISCOUNT INFORMATION |
How to Obtain a Copy of the Fund’s Proxy
Voting Policy and Proxy Voting Records
A description of the policies and procedures the Fund uses to determine how to vote proxies relating to portfolio securities is available without charge (1) by calling 800-966-4354, (2) on the Funds’ website at www.hennessyetfs.com/proxy-voting/voting-policy, or (3) on the U.S. Securities and Exchange Commission’s (the “SEC”) website at www.sec.gov. The Fund’s proxy voting record is available without charge on both the Funds’ website at www.hennessyetfs.com/proxy-voting/voting-record and the SEC’s website at www.sec.gov no later than August 31 for the prior 12 months ending June 30.
Availability of Quarterly Portfolio Schedule
The Fund files a complete schedule of portfolio holdings with the SEC for the first and third quarters of each fiscal year as an exhibit to its reports on Form N-PORT. The Fund’s Form N-PORT reports are available on the SEC’s website at www.sec.gov or on request by calling 800-966-4354.
Federal Tax Distribution Information (Unaudited)
For fiscal year 2023, certain dividends paid by the Fund may be subject to a maximum tax rate of 23.8%, as provided for by the Jobs and Growth Tax Relief Reconciliation Act of 2003. The percentage of dividends declared from ordinary income designated as qualified dividend income was 100.00%.
For corporate shareholders, the percent of ordinary income distributions that qualified for the corporate dividends received deduction for fiscal year 2023 was 100.00%.
The percentage of taxable ordinary income distributions that were designated as short-term capital gain distributions under Section 871(k)(2)(C) of the Internal Revenue Code of 1986, as amended, for the Fund was 0.00%.
Frequency Distributions of
Premiums and Discounts
Information regarding how often the shares of the Fund trade on an exchange at a price above (i.e., at a premium) or below (i.e., at a discount) the net asset value of the Fund is available, without charge, on the Funds’ website at www.hennessyetfs.com.
| HENNESSY FUNDS | 1-877-671-3199 | |
Important Notice Regarding Delivery
of Shareholder Documents
All of our shareholders other than banks, broker-dealers and other financial intermediaries acting as authorized participants of the Fund are beneficial owners, as shown on the records of The Depository Trust Company (“DTC”) or its participants. The DTC participants are the banks, broker-dealers and other financial intermediaries acting as authorized participants of the Fund, and these financial intermediaries are responsible to pass along communications to you, including notices, account statements, prospectuses, tax forms, and shareholder reports. Please contact your financial intermediary for information regarding electronic delivery of the Fund’s shareholder reports.
Householding is a method of delivery, based on the preference of the individual beneficial owner, in which a single copy of certain shareholder documents can be delivered to beneficial owners who share the same address, even if their accounts are registered under different names. Householding for the Fund may be available through the banks, broker-dealers and other financial intermediaries acting as authorized participants of the Fund. If you are interested in enrolling in householding and receiving a single copy of the prospectus and other shareholder documents, please contact your financial intermediary. If you currently are enrolled in householding and wish to change your householding status, please contact your financial intermediary.
As permitted by SEC regulations, the Fund’s shareholder reports will be made available to banks, broker-dealers and other financial intermediaries on a website, and unless the intermediaries sign for eDelivery or elect to receive paper copies, the financial intermediaries will be notified by mail each time a report is posted and provided with a website link to access the report.
Subscribe to receive our team’s unique market and sector insights delivered to your inbox www.hennessyfunds.com/subscribe
Follow us on social media
| IMPORTANT NOTICE/BOARD APPROVAL OF INVESTMENT SUB-ADVISORY AGREEMENT |
Board Approval of Investment Sub-Advisory
Agreement
At a meeting on June 7, 2023, the Board of Trustees of the Fund (the “Board,” and the members thereof, the “Trustees”) unanimously approved a sub-advisory agreement of the Fund for trading services between the Advisor and Vident Advisory, LLC (“Vident” or the “Sub-Advisor”). The Board had previously approved, on July 26, 2022, a new investment advisory agreement of the Fund with Hennessy Advisors, Inc. (the “Advisor”), a new sub-advisory agreement of the Fund for portfolio management services between the Advisor and Stance Capital, LLC, and a new sub-advisory agreement for the Fund for trading services between the Advisor and Vident Investment Advisory, LLC (“VIA”). On July 14, 2023, VIA completed an acquisition transaction that resulted in a change of control of VIA and an automatic termination of the sub-advisory agreement between the Advisor and VIA. As a result of the transaction, VIA ceased to exist and Vident is now the sole Vident enterprise carrying out Vident’s business and operations.
As part of the process of approving the sub-advisory agreement, the Trustees reviewed their fiduciary duties with respect to approving the sub-advisory agreement and the relevant factors for them to consider. In addition, the Trustees who are not deemed “interested persons” (as defined by the Investment Company Act of 1940, as amended) of the Fund (the “Independent Trustees”) met in executive session to discuss the approval of the sub-advisory agreement. As part of their discussion, the Independent Trustees confirmed that all of their questions related to their approval of the sub-advisory agreement had been answered.
In advance of the meeting, the Trustees received detailed information to assist them in their evaluation of the sub-advisory agreement. This information included, but was not limited to, the following:
| | (1) | A memorandum from outside legal counsel that described the fiduciary duties of the Board with respect to approving the sub-advisory agreement and the relevant factors for consideration; |
| | | |
| | (2) | The form of sub-advisory agreement; |
| | | |
| | (3) | A description of the range of services provided by the Advisor and the sub-advisors to the Fund and the distinction between the Advisor-provided services and the sub-advisor-provided services; and |
| | | |
| | (4) | A completed questionnaire from the Sub-Advisor; |
| | | |
| | (5) | A summary of the Sub-Advisor’s responses to the questionnaire, as well as relevant information from the Sub-Advisor’s Form ADV; |
| | | |
| | (6) | Financial information of the Sub-Advisor; |
| | | |
| | (7) | The Sub-Advisor’s Code of Ethics; and |
| | | |
| | (8) | A recent fact sheet for the Fund, which included, among other things, Fund performance over various periods. |
The Trustees reviewed and discussed all of the information provided by the Advisor and the Sub-Advisor. Following this review, and further discussion with the Advisor, the Trustees concluded that the information provided before and at the meeting addressed all of the relevant matters that they wanted to consider in assessing the Sub-Advisor, and that said information provided them with a fulsome understanding of the sub-advisory agreement and the services expected to be provided by the Sub-Advisor.
| HENNESSY FUNDS | 1-877-671-3199 | |
All of the factors discussed were considered as a whole by the Trustees, as well as by the Independent Trustees meeting in executive session. The Trustees viewed the relevant factors in their totality, with no single factor being the principal or determinative factor in the Trustees’ determination of whether to approve the sub-advisory agreement.
Prior to approving the sub-advisory agreement, the Trustees, including the Independent Trustees in executive session, considered, among other items:
| | (1) | The expected nature and quality of the advisory services to be provided by the Sub-Advisor, noting that none of the Sub-Advisor’s personnel responsible for servicing the Fund would change; |
| | | |
| | (2) | A comparison of the fees and expenses of the Fund to other similar funds; |
| | | |
| | (3) | Whether economies of scale were likely to be recognized by the Fund; |
| | | |
| | (4) | The expected costs and profitability of the Fund to the Sub-Advisor; |
| | | |
| | (5) | The performance of the Fund to date; |
| | | |
| | (6) | Any expected benefits to the Sub-Advisor from serving as an investment advisor to the Fund (other than the sub-advisory fee); |
| | | |
| | (7) | The Board received satisfactory responses from representatives of the Sub-Advisor with respect to a series of important questions, including questions related to any lawsuits or pending regulatory actions involving the Sub-Advisor, Vident Capital Holdings, LLC, and Casey Crawford (who would ultimately control the Sub-Advisor) that might materially impact the management of the Fund; whether the management of other accounts would conflict with its management of the Fund; and the procedures the Sub-Advisor has in place to fairly allocate trades among its respective clients; |
| | | |
| | (8) | Under the terms of the sub-advisory agreement, the Sub-Advisor, subject to oversight by the Board, would continue to provide the Fund with same level of investment services and would continuously furnish an investment trading program for the Fund consistent with the respective investment objective and policies of the Fund; and |
| | | |
| | (9) | The capitalization of the Sub-Advisor based on financial information and other materials provided by the Sub-Advisor. |
The material considerations and determinations of the Trustees, including the Independent Trustees, were as follows:
| | (1) | The Trustees concluded that the nature and extent of the services expected to be provided by the Sub-Advisor would be appropriate to assure that the operations of the Fund would be conducted in compliance with applicable laws, rules, and regulations. They noted that none of the Sub-Advisor personnel responsible for servicing the Fund would change, and that the Sub-Advisor will have access to the greater financial resources of its new parent company. The Trustees concluded that the Sub-Advisor had sufficient quality and depth of personnel, resources, investment methods, and compliance policies and procedures necessary to perform its duties under the sub-advisory agreement. |
| | | |
| | (2) | The Trustees concluded that the Sub-Advisor is sufficiently well-capitalized in order for the Sub-Advisor to meet its obligations to the Fund. |
| | | |
| | (3) | The Trustees considered the distinction between the services to be performed by the Advisor and the Sub-Advisor. The Trustees noted that the management of |
| BOARD APPROVAL OF INVESTMENT SUB-ADVISORY AGREEMENT |
| | | the Fund, including the oversight of the Sub-Advisor, would involve more comprehensive and substantive duties than the duties of the Sub-Advisor. Specifically, the Trustees considered that the services to be performed by the Advisor would require a higher level of service and oversight than the services performed by the Sub-Advisor. Based on this determination, the Trustees concluded that the differential in advisory fees between the Advisor and the Sub-Advisor is reasonable. |
| | | |
| | (4) | The Trustees reviewed the performance of the Fund as compared to its benchmark. They noted the limited performance history given the recent inception of the Fund. The Trustees considered that the Fund had over performed since its inception, noting this is a short period of time. Based on this, they concluded the Fund’s performance was satisfactory. |
| | | |
| | (5) | The Trustees reviewed the proposed unitary fee for the Fund as compared to similar ETFs using data from Morningstar and noted that the sub-advisory fee paid to the Sub-Advisor by the Advisor is covered by the unitary fee. As part of the discussion with management, the Trustees ensured that they understood and were comfortable with the criteria used to determine the ETFs included in the Morningstar comparison for purposes of the materials considered at the meeting. The Trustees determined that the unitary fee of the Fund falls within a reasonable range of fees of similar ETFs and concluded that the unitary fee is reasonable. The Board also considered the total net expense ratio of the Fund. |
| | | |
| | (6) | The Trustees also considered whether the Advisor was expected to realize economies of scale that should be shared with the shareholders of the Fund. They concluded that significant economies of scale would likely not be achieved in the near term. |
| | | |
| | (7) | The Trustees considered the expected profitability of the Fund to the Sub-Advisor, including the Sub-Advisor’s representation that it did not expect any material changes to the firm’s profitability post-transaction. After review and discussion, they concluded that based on the services provided by the Sub-Advisor, the current assets of the Fund, and the projected growth of the Fund, profits from the Sub-Advisor’s relationship with the Fund were not excessive. |
| | | |
| | (8) | The Trustees considered any expected benefits to the Sub-Advisor from serving as an adviser to the Fund other than the sub-advisory fee. They concluded that any such benefits were expected to be minimal. |
Based on the Trustees’ deliberations and their evaluation of the information described above and other factors and information they believed relevant, the Board, by separate vote of the Independent Trustees and the entire Board, unanimously approved the sub-advisory agreement.
| HENNESSY FUNDS | 1-877-671-3199 | |
Liquidity Risk Management Program
In accordance with Rule 22e-4 under the Investment Company Act of 1940, as amended (the “Liquidity Rule”), we have adopted and implemented a liquidity risk management program (the “Liquidity Program”). The purpose of the Liquidity Program is to assess and manage the Fund’s liquidity risk, which is the risk that the Fund would not be able to meet requests to redeem Fund shares without significant dilution of the remaining shareholders’ interests in the Fund. The Board of Trustees of the Fund (the “Board”) designated a committee comprising representatives of Hennessy Advisors, Inc., the investment adviser to the Fund, as the administrator of the Liquidity Program (the “Program Administrator”).
The Program Administrator provided a written report regarding the Liquidity Program to the Board at its meeting on October 8, 2023. The report covered the period from December 23, 2022 (the date Hennessy Advisors, Inc. became the investment advisor to the Fund), through August 31, 2023. The report addressed the operation of the Liquidity Program, assessed the adequacy and effectiveness of its implementation, and described any material changes to the Liquidity Program during the review period. The Trust’s chief compliance officer presented the report to the Board at the meeting and provided additional information regarding the Liquidity Program. The Board reviewed the Liquidity Program and considered, among other items, the following:
| | 1. | The Program Administrator considered that the Fund issues and redeems shares at net asset value only in large blocks known as “Creation Units,” which only Authorized Participants (typically broker-dealers) may purchase or redeem. The Program Administrator reviewed historical requests to redeem Creation Units during the review period and concluded that the Fund has historically been able to meet Creation Unit redemption requests without significant dilution to the Fund’s remaining shareholders, and the Program Administrator expects the Fund to be able to continue to do so in the future during both normal and reasonably foreseeable stressed conditions. |
| | | |
| | 2. | The Fund primarily holds assets that are highly liquid investments and is not required to establish a highly liquid investment minimum for the Fund or adopt policies and procedures for responding to a highly liquid investment minimum shortfall. |
| | | |
| | 3. | The Program Administrator did not make, or recommend, any material changes to the Liquidity Program during the review period. |
| | | |
| | 4. | The Program Administrator concluded that the Liquidity Program was reasonably designed to assess and manage the Fund’s liquidity risk, complies with the requirements of the Liquidity Rule, and was operating as intended during the review period. |
| LIQUIDITY RISK MANAGEMENT PROGRAM/PRIVACY POLICY |
Privacy Policy
We collect the following personal information about you:
| | 1. | Information we receive from you in applications or other forms, correspondence, or conversations, including, but not limited to, your name, address, phone number, social security number, assets, income, and date of birth; |
| | | |
| | 2. | Information about your transactions with us, our affiliates, or others, including, but not limited to, your account number and balance, payments history, parties to transactions, cost basis information, and other financial information; and |
| | | |
| | 3. | Other personal information we collect from various sources, even if you have not entered into a prior transaction with us, including the following: |
| | | • | Name, alias, address, unique personal identifier, online identifier, IP address, email address, telephone number, account name, and other similar identifiers; |
| | | | |
| | | • | Age and marital status; |
| | | | |
| | | • | Commercial information, including records of products purchased; |
| | | | |
| | | • | Browsing history, search history, and information on interaction with our website; |
| | | | |
| | | • | Geolocation data; |
| | | | |
| | | • | Employment and employment history, educational history, financial information, and purchasing and consuming histories or tendencies; and |
| | | | |
| | | • | Inferences drawn from the above-listed information to create a profile about your preferences, characteristics, predispositions, and behavior. |
We collect this information directly from you, indirectly in the course of providing services to you, directly and indirectly from your activity on our website, from broker dealers, marketing agencies, and other third parties that interact with us in connection with the services we perform and products we offer, and from anonymized and aggregated consumer information.
We use this information to fulfill the reason you provided the information to us, to provide you with other relevant products that you request from us, to provide you with information about products that may interest you, to improve our website or present our website’s contents to you, and as otherwise described to you when collecting your personal information.
We do not disclose any personal information to unaffiliated third parties, except as permitted by law. We may disclose your personal information to our affiliates, vendors, and service providers for a business purpose. For example, we are permitted by law to disclose all of the information we collect, as described above, to our transfer agent to process your transactions. When disclosing your personal information to third parties, we enter into a contract with each third party describing the purpose of such disclosure and requiring that such personal information be kept confidential and not used for any purpose except to perform the services contracted or respond to regulatory or law enforcement requests.
Furthermore, we restrict access to your personal information to those persons who require such information to provide products or services to you. As a result, we do not
| HENNESSY FUNDS | 1-877-671-3199 | |
provide a means for opting out of our limited sharing of your information. We maintain physical, electronic, and procedural safeguards that comply with federal standards to guard your personal information.
If you hold shares of the Funds through a financial intermediary, including, but not limited to, a broker-dealer, bank, or trust company, the privacy policy of your financial intermediary governs how your personal information is shared with unaffiliated third parties.
Supplemental Privacy Notice for Residents of California
The California Consumer Privacy Act of 2018 (the “CCPA”) provides you, as a California resident, with certain additional rights relating to your personal information.
Under the CCPA, you have the right to request that we disclose to you the categories of personal information we have collected about you over the past 12 months, the categories of sources of such information, our business purpose for collecting the information, the categories of third parties, if any, with whom we shared the information, and the specific information we have collected about you. You also have the right to request that we delete any of your personal information, and, unless an exception applies, we will delete such information upon receiving and confirming your request. To make a request, call us at 1-800-966-4354, email us at privacy@hennessyfunds.com, or go to www.hennessyfunds.com/contact. We will not discriminate against you for exercising your rights under the CCPA. Further, we will not collect additional categories of your personal information or use the personal information we collected for materially different, unrelated, or incompatible purposes without providing you notice.
(This Page Intentionally Left Blank.)
For information, questions, or assistance, please call
The Hennessy Funds
800-966-4354 or 415-899-1555
INVESTMENT ADVISOR
Hennessy Advisors, Inc.
7250 Redwood Boulevard, Suite 200
Novato, California 94945
ADMINISTRATOR,
TRANSFER AGENT,
DIVIDEND PAYING AGENT, &
SHAREHOLDER SERVICING AGENT
U.S. Bancorp Fund Services, LLC
d/b/a U.S. Bank Global Fund Services
P.O. Box 701
Milwaukee, Wisconsin 53201-0701
CUSTODIAN
U.S. Bank N.A.
Custody Operations
1555 North River Center Drive, Suite 302
Milwaukee, Wisconsin 53212
TRUSTEES
Neil J. Hennessy
Robert T. Doyle
J. Dennis DeSousa
Doug Franklin
Claire Garvie
Gerald P. Richardson
COUNSEL
Foley & Lardner LLP
777 East Wisconsin Avenue
Milwaukee, Wisconsin 53202-5306
INDEPENDENT REGISTERED
PUBLIC ACCOUNTING FIRM
Tait, Weller & Baker LLP
Two Liberty Place
50 South 16th Street, Suite 2900
Philadelphia, Pennsylvania 19102-2529
DISTRIBUTOR
Quasar Distributors, LLC
111 East Kilbourn Avenue, Suite 1250
Milwaukee, Wisconsin 53202
www.hennessyetfs.com | 1-800-966-4354
This report has been prepared for shareholders and may be distributed to
others only if preceded or accompanied by a current prospectus.
The registrant has adopted a code of ethics that applies to the registrant’s principal executive officer and principal financial officer. The registrant amended its code of ethics in February 2023 and again in August 2023 to (1) specify that each of the registrant and the investment advisor to the registrant’s series, as an entity, is prohibited from trading on the basis of material non‑public information or communicating material non‑public information to others in violation of law, (2) add a requirement that the implementation, modification, or termination of any Rule 10b5‑1 plan under the Securities Exchange Act of 1934, as amended (the “Exchange Act”), by the investment advisor to the registrant’s series or any director, trustee, officer, or employee of the registrant or the investment advisor to the registrant’s series must be approved in advance by external or internal legal counsel to the investment advisor to the registrant’s series, (3) exclude summer associates or other temporary employees of the registrant or of the investment advisor to the registrant’s series as access persons, (4) explicitly exempt in‑kind transfers from pre‑clearance requirements, and (5) remove the prohibition of frequent trading of securities (while retaining the 14‑day short swing period). The registrant has not granted any waivers from any provisions of the code of ethics during the period covered by this report.
A copy of the registrant’s Code of Ethics is filed herewith, along with an exhibit that shows the portions of the Code of Ethics that were updated, as discussed above.
The registrant’s board of directors has determined that it does not have an audit committee financial expert serving on its audit committee. At this time, the registrant believes that the financial and business experience provided by each member of the audit committee together offers the registrant adequate oversight for the registrant’s level of financial complexity.
The registrant has engaged the principal accountants to the Hennessy Stance ESG ETF to perform audit services, audit-related services, tax services, and other services during the past two fiscal years. “Audit services” refer to performing an audit of the registrant's annual financial statements or services that are normally provided by the accountant in connection with statutory and regulatory filings or engagements for those fiscal years. “Audit‑related services” refer to the assurance and related services by the principal accountants that are reasonably related to the performance of the audit. “Tax services” refer to professional services rendered by the principal accountants for tax compliance, tax advice, tax planning, and review of federal and state tax returns. The following table details the aggregate fees billed or expected to be billed for each of the last two fiscal years for audit fees, audit-related fees, tax fees, and other fees by the principal accountants to the Hennessy Stance ESG ETF.
(e)(1) The audit committee has adopted pre-approval procedures for audit and non-audit services provided to the registrant. Under the procedures, at any regularly scheduled audit committee meeting, the audit committee may pre-approve any audit, audit-related, tax, and other non-audit services to be rendered or that may be rendered by a principal accountant to the registrant and certain non-audit services to be rendered by a principal accountant to the investment advisor to the registrant’s series or such advisor’s affiliates that provide ongoing services to the registrant. The audit committee either specifically pre-approves the services or pre-approves a type of a service. No pre-approval is required for non-audit services that meet the following criteria: (1) the aggregate amount of fees to be paid for all such non-audit services is not more than 5% of the total revenues paid by the registrant to the principal accountant in the fiscal year in which the non-audit services are provided; (2) such services were not recognized by the registrant at the time of the engagement to be non-audit services; and (3) such services are promptly brought to the attention of the audit committee and approved prior to the completion of the audit.
The audit committee must pre-approve a principal accountant’s engagements for non-audit services with the investment advisor to the registrant’s series and such advisor’s affiliates that provide ongoing services to the registrant, if the engagement relates directly to the operations and financial reporting of the registrant, unless the aggregate amount of fees to be paid for all such services provided constitutes no more than 5% of the aggregate revenues paid to the principal accountant by the registrant, the investment advisor and such advisor’s affiliates that provide ongoing services to the registrant, during the fiscal year in which the services are to be provided.
If a service has not been pre-approved at a regularly scheduled audit committee meeting, and if, in the opinion of the Chief Compliance Officer of the registrant, a proposed engagement must commence before the next regularly scheduled audit committee meeting, any member of the audit committee is authorized under the procedures to pre-approve the engagement. The Chief Compliance Officer of the registrant will arrange for this interim review, coordinate with the designated member of the audit committee and provide, with the assistance of the principal accountant, information about the service to be pre-approved for the interim period. Any interim pre-approval decisions are reported (for informational purposes) to the audit committee at its next regularly scheduled meeting.
All of the tax services referenced above were pre-approved in accordance with the pre-approval procedures for audit and non-audit services.
The percentage of fees billed by Tait, Weller & Baker LLP applicable to non-audit services pursuant to waiver of pre-approval requirement were as follows:
(f) All of the principal accountants’ hours spent on auditing the registrant’s financial statements were attributed to work performed by full‑time permanent employees of the principal accountants.
(g) The principal accountants have not provided any non-audit services in the last two fiscal years to the registrant, to the investment advisor to the registrant’s series, Hennessy Advisors, Inc., or to any entity controlling, controlled by, or under common control with Hennessy Advisors, Inc.
(h) In assessing the independence of the registrant’s principal accountants, the board of trustees noted that the principal accountants have not provided any non-audit services to the investment advisor to the registrant’s series, Hennessy Advisors, Inc., or to any entity controlling, controlled by, or under common control with Hennessy Advisors, Inc.
(i) Not applicable.
(j) Not applicable.
The registrant is an issuer as defined in Rule 10A-3 under the Exchange Act and has a separately-designated standing audit committee established in accordance with Section 3(a)(58)(A) of the Exchange Act. The independent members of the committee are as follows: Robert Doyle, J. Dennis DeSousa, Claire Garvie, and Gerald Richardson.
(a) The Schedule of Investments are included as part of the reports to shareholders filed under Item 1 of this Form.
(b) Not applicable.
Not applicable to open-end investment companies.
Not applicable to open-end investment companies.
Not applicable to open-end investment companies.
Not applicable.
Not applicable to open-end investment companies.
Pursuant to the requirements of the Securities Exchange Act of 1934 and the Investment Company Act of 1940, the registrant has duly caused this report to be signed on its behalf by the undersigned, thereunto duly authorized.
Neil J. Hennessy
Pursuant to the requirements of the Securities Exchange Act of 1934 and the Investment Company Act of 1940, this report has been signed below by the following persons on behalf of the registrant and in the capacities and on the dates indicated.