Time, time, time…. is on my side, yes, it is!
Looking at the chart below depicting annual total returns of the Dow Jones Industrial Average from 1950 to 2021, we see how volatile the market can be on an annual basis. Investors experienced 16 years of negative returns during this time, the most painful being -31.93% in 2008.
volatility and uncertainty may continue to impact the markets in the short term, we encourage investors to stay the course, maintain a diversified portfolio, and keep a long-term perspective.
Past performance does not guarantee future results.
Mutual fund investing involves risk. Principal loss is possible.
Opinions expressed are those of Ryan C. Kelley and are subject to change, are not guaranteed, and should not be considered investment advice.
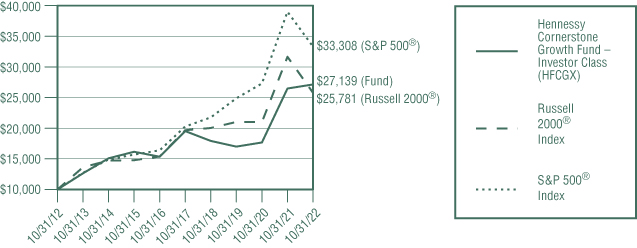
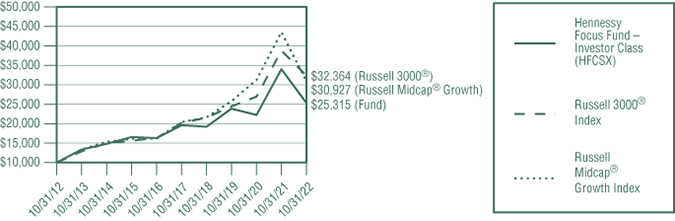
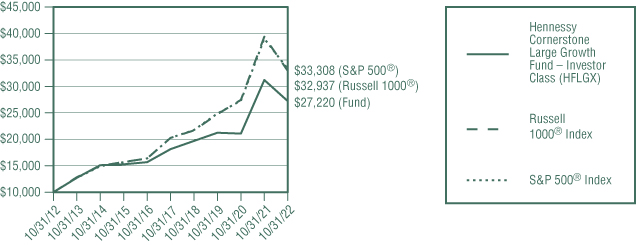
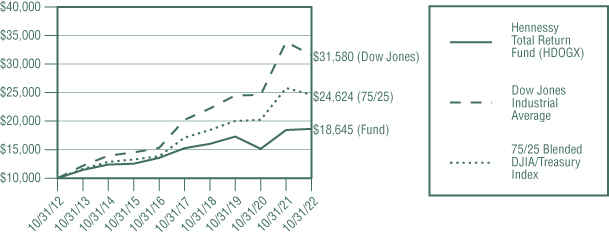
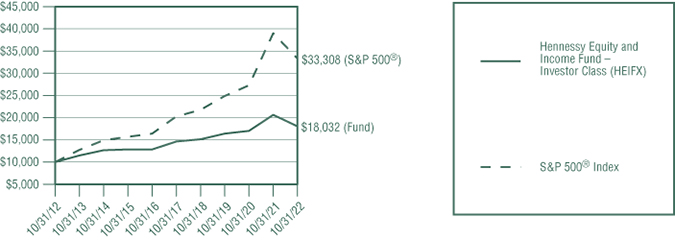
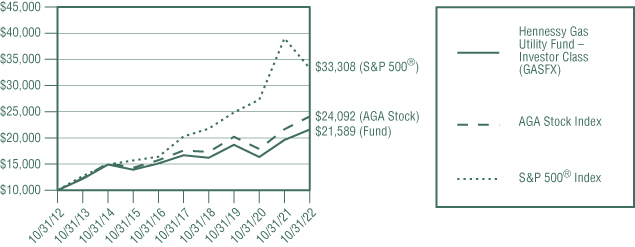
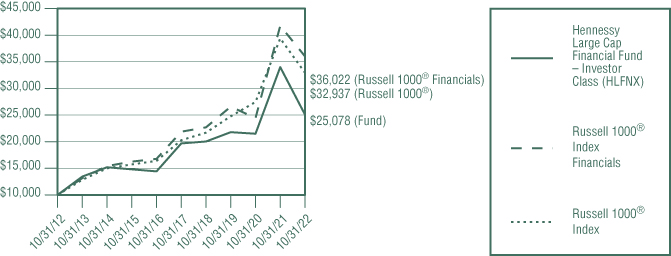
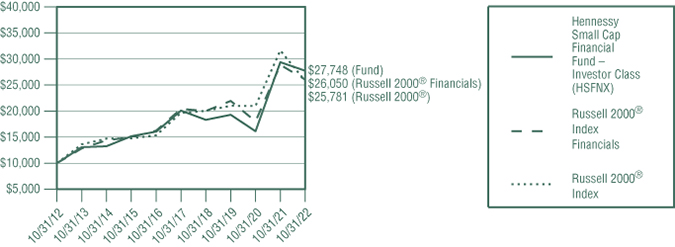
This graph illustrates the performance of an initial investment of $10,000 made in the Fund 10 years ago and assumes the reinvestment of dividends and capital gains.
Performance data quoted represents past performance; past performance does not guarantee future results. The investment return and principal value of an investment will fluctuate so that an investor’s shares, when redeemed, may be worth more or less than their original cost. The performance table does not reflect the deduction of taxes that a shareholder would pay on Fund distributions or the redemption of Fund shares. Current performance of the Fund may be lower or higher than the performance quoted. Performance data current to the most recent month end may be obtained by visiting www.hennessyfunds.com.
The 50/50 Blended DJIA/Treasury Index consists of 50% common stocks represented by the Dow Jones Industrial Average and 50% short-duration Treasury securities represented by the ICE BofAML 1-Year U.S. Treasury Note Index, which comprises U.S. Treasury securities maturing in approximately one year. The Dow Jones Industrial Average is a price-weighted average of 30 significant stocks traded on the New York Stock Exchange or The Nasdaq Stock Market LLC. One cannot invest directly in an index. These indices are used for comparative purposes in accordance with Securities and Exchange Commission regulations.
The expense ratio presented is from the most recent prospectus. The expense ratio for the current reporting period is available in the Financial Highlights section of this report.
Portfolio Managers Neil J. Hennessy, Ryan C. Kelley, CFA, and L. Joshua Wein, CAIA
For the one-year period ended October 31, 2022, the Hennessy Balanced Fund returned -0.70%, outperforming both the 50/50 Blended DJIA/Treasury Index (the Fund’s primary benchmark) and the Dow Jones Industrial Average, which returned -3.79% and -6.74%, respectively, for the same period.
The Fund outperformed its primary benchmark predominantly as a result of stock selection in the Energy and Health Care sectors. The largest contributor to performance within each of these sectors during the period were Chevron Corporation and Amgen, Inc. The largest detractors from performance during the period were investments in the Communication Services and Industrials sectors. The largest detractors from performance within these sectors were Verizon Communications, Inc. and 3M Company.
The Fund continues to own all the companies mentioned.
The Fund invests approximately 50% of its assets in the “Dogs of the Dow,” the 10 highest dividend-yielding Dow stocks, and 50% of its assets in U.S. Treasuries. As a result of this “blended” strategy, we expect the Fund to outperform equities in periods when equity markets fall and underperform in periods when equity markets rise. The Fund is designed to allow its investors to gain exposure to the equity market while maintaining a significant percentage of its investment in fixed income securities. We believe the Fund is well positioned for the more conservative investor because the equity portion of the portfolio is invested in what we deem to be high-quality companies, each of which pay a quarterly dividend, while the balance of the Fund is invested in lower-risk, short-duration U.S. Treasuries.
Notwithstanding a difficult market environment over the last twelve months, we believe that the outlook for U.S. stocks remains positive. We continue to believe that equities are attractive from a valuation standpoint, even as interest rates rise. While the Federal Reserve has raised rates several times throughout this calendar year, we believe that the prospect of slower economic growth may dampen inflationary pressures. With this possibility comes the potential for the Federal Reserve to take a more neutral stance toward future rate hikes. With the unemployment rate near record lows, high levels of cash on the balance sheets of U.S. companies, and the prospect of a more dovish Federal Reserve in 2023, we remain bullish on equities long-term.
If the market experiences further weakness, we would expect our more defensive holdings to perform well relative to the market. The relatively short duration of the 50% weighting of U.S. Treasuries in the portfolio (all less than one year) may allow us the ability to roll into higher-yielding Treasuries in the event interest rates continue to rise.
Opinions expressed are those of the Portfolio Managers as of the date written and are subject to change, are not guaranteed, and should not be considered investment advice or an indication of trading intent.
The Fund is non-diversified, meaning it may concentrate its assets in fewer individual holdings than a diversified fund, making it more exposed to individual stock volatility than a diversified fund. The Fund’s formula-based strategy may cause the Fund to buy or sell securities at times when it may not be advantageous. Please see the Fund’s prospectus for a more complete discussion of these and other risks.
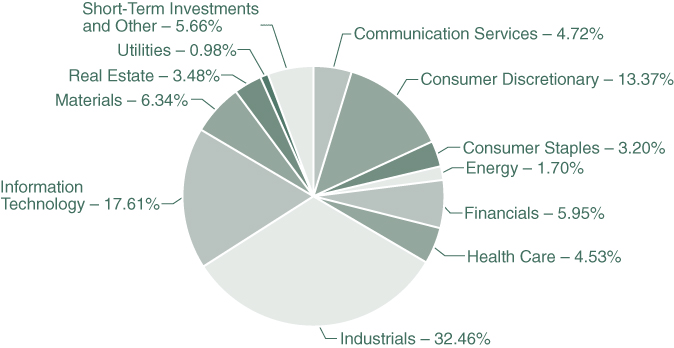
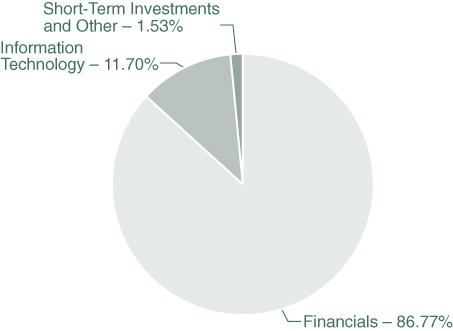
References to specific securities should not be considered a recommendation to buy or sell any security. Fund holdings and sector allocations are subject to change. Please refer to the Schedule of Investments included in this report for additional portfolio information.
Note: For presentation purposes, the Fund has grouped some of the industry categories. For purposes of categorizing securities for compliance with Section 8(b)(1) of the Investment Company Act of 1940, as amended, the Fund uses more specific industry classifications.
The accompanying notes are an integral part of these financial statements.
Percentages are stated as a percent of net assets.
The following is a summary of the inputs used to value the Fund’s net assets as of October 31, 2022 (see Note 3 in the accompanying Notes to the Financial Statements):
The accompanying notes are an integral part of these financial statements.
The accompanying notes are an integral part of these financial statements.
The accompanying notes are an integral part of these financial statements.
The accompanying notes are an integral part of these financial statements.
The accompanying notes are an integral part of these financial statements.
The accompanying notes are an integral part of these financial statements.
The Hennessy Balanced Fund (the “Fund”) is a series of Hennessy Funds Trust (the “Trust”), which was organized as a Delaware statutory trust on September 17, 1992. The Fund is an open-end management investment company registered under the Investment Company Act of 1940, as amended. The investment objective of the Fund is a combination of capital appreciation and current income. The Fund is a non-diversified fund and offers Investor Class shares.
As an investment company, the Fund follows the investment company accounting and reporting guidance of the Financial Accounting Standards Board (“FASB”) Accounting Standard Codification Topic 946 “Financial Services—Investment Companies.”
The following is a summary of significant accounting policies consistently followed by the Fund in the preparation of the financial statements. These policies conform to U.S. generally accepted accounting principles (“GAAP”).
The Fund follows its valuation policies and procedures in determining its NAV and, in preparing these financial statements, the fair value accounting standards that establish an authoritative definition of fair value and set out a hierarchy for measuring fair value. These standards require additional disclosures about the various inputs and valuation techniques used to develop the measurements of fair value and a discussion of changes in valuation techniques and related inputs during the period. These inputs are summarized in the three broad levels listed below:
The following is a description of the valuation techniques applied to the Fund’s major categories of assets and liabilities on a recurring basis:
The Board of Trustees of the Fund (the “Board”) has adopted fair value pricing procedures that are followed when a price for a security is not readily available or if a significant event has occurred that indicates the closing price of a security no longer represents the true value of that security. Fair value pricing determinations are made in good faith in accordance with these procedures. There are numerous criteria considered in determining a fair value of a security, such as the trading volume of a security and markets, the values of other similar securities, and news events with direct bearing on a security or markets. Fair value pricing results in an estimated price for a security that reflects the amount the Fund might reasonably expect to receive in a current sale. Depending on the relative significance of the valuation inputs, these securities may be classified in either Level 2 or Level 3 of the fair value hierarchy.
The Board has delegated day-to-day valuation matters to the Valuation and Liquidity Committee comprising representatives from Hennessy Advisors, Inc., the Fund’s investment advisor (the “Advisor”). The function of the Valuation and Liquidity Committee, among other things, is to value securities where current and reliable market quotations are not readily available. All actions taken by the Valuation and Liquidity Committee are reviewed by the Board.
The Fund has performed an analysis of all existing investments to determine the significance and character of all inputs to their fair value determinations. Various inputs are used to determine the value of the Fund’s investments. The inputs or methodology used for valuing securities are not necessarily an indication of the risk associated with investing in those securities. Details related to the fair value hierarchy of the Fund’s securities as of October 31, 2022, are included in the Schedule of Investments.
Purchases and sales of investment securities (excluding government and short-term investments) for the Fund during fiscal year 2022 were $1,928,438 and $2,627,767, respectively.
There were no purchases or sales/maturities of long-term U.S. government securities for the Fund during fiscal year 2022.
The Advisor provides the Fund with investment advisory services under an Investment Advisory Agreement. The Advisor furnishes all investment advice, office space, and facilities and most of the personnel needed by the Fund. As compensation for its services, the Advisor is entitled to a monthly fee from the Fund. The fee is based on the average daily net assets of the Fund at an annual rate of 0.60%. The net investment advisory fees expensed by the Fund during fiscal year 2022 are included in the Statement of Operations.
The Board has approved a Shareholder Servicing Agreement for the Fund, which compensates the Advisor for the non-investment advisory services it provides to the Fund. The Shareholder Servicing Agreement provides for a monthly fee paid to the Advisor at an annual rate of 0.10% of the average daily net assets of the Fund. The shareholder service fees expensed by the Fund during fiscal year 2022 are included in the Statement of Operations.
The Fund has adopted a plan pursuant to Rule 12b-1 under the Investment Company Act of 1940, as amended, that authorizes payments in connection with the distribution of Fund shares at an annual rate of up to 0.25% of the Fund’s average daily net assets. Even though the authorized rate is up to 0.25%, the Fund is currently only using up to 0.15% of its average daily net assets for such purpose. Amounts paid under the plan may be spent on any activities or expenses primarily intended to result in the sale of shares, including, but not limited to, advertising, shareholder account servicing, printing and mailing of prospectuses to other than current shareholders, printing and mailing of sales literature, and compensation for sales and marketing activities or to financial institutions and others, such as dealers and distributors. The distribution fees expensed by the Fund during fiscal year 2022 are included in the Statement of Operations.
The Fund has entered into agreements with various brokers, dealers, and financial intermediaries in connection with the sale of Fund shares. The agreements provide for periodic payments of sub-transfer agent expenses by the Fund to the brokers, dealers, and financial intermediaries for providing certain shareholder maintenance services. These shareholder services include the pre-processing and quality control of new accounts, shareholder correspondence, answering customer inquiries regarding account status, and facilitating shareholder telephone transactions. The sub-transfer agent fees expensed by the Fund during fiscal year 2022 are included in the Statement of Operations.
U.S. Bancorp Fund Services, LLC, d/b/a U.S. Bank Global Fund Services (“Fund Services”) provides the Fund with administrative, accounting, and transfer agent services. As administrator, Fund Services is responsible for activities such as (i) preparing various federal and state regulatory filings, reports, and returns for the Fund, (ii) preparing reports and materials to be supplied to the Board, (iii) monitoring the activities of the Fund’s custodian, transfer agent, and accountants, and (iv) coordinating the preparation and payment of the Fund’s expenses and reviewing the Fund’s expense accruals. U.S. Bank N.A., an affiliate of Fund Services, serves as the Fund’s custodian. The servicing agreements between the Trust, Fund Services, and U.S. Bank N.A. contain a fee schedule that is inclusive of administrative, accounting, custody, and transfer agent fees. The administrative, accounting, custody, and transfer agent fees expensed by the Fund during fiscal year 2022 are included in the Statement of Operations.
Quasar Distributors, LLC, a wholly owned broker-dealer subsidiary of Foreside Financial Group, LLC, acts as the Fund’s principal underwriter in a continuous public offering of Fund shares.
The officers of the Fund are affiliated with the Advisor. With the exception of the Chief Compliance Officer and, for a portion of the fiscal year, the Senior Compliance Officer, such officers receive no compensation from the Fund for serving in their respective roles. The Fund, along with the other funds in the Hennessy Funds family (collectively, the “Hennessy Funds”), makes reimbursement payments on an equal basis to the Advisor for a portion of the salary and benefits associated with the office of the Chief Compliance Officer and, for a portion of the fiscal year, for all of the salary and benefits associated with the office of the Senior Compliance Officer. The compliance fees expensed by the Fund during fiscal year 2022 for reimbursement payments to the Advisor are included in the Statement of Operations.
Under the Hennessy Funds’ organizational documents, their officers and trustees are indemnified by the Hennessy Funds against certain liabilities arising out of the performance of their duties to the Hennessy Funds. Additionally, in the normal course of business, the Hennessy Funds enter into contracts with service providers that contain general indemnification clauses. The Fund’s maximum exposure under these arrangements is unknown as this would involve future claims that may be made against the Fund that have not yet occurred. Currently, the Fund expects the risk of loss to be remote.
The Fund has an uncommitted line of credit with the other Hennessy Funds in the amount of the lesser of (i) $100,000,000 or (ii) 33.33% of each Hennessy Fund’s net assets, or 30% for the Hennessy Gas Utility Fund, the Hennessy Japan Fund, and the Hennessy Japan Small Cap Fund and 10% for the Fund. The line of credit is intended to provide any necessary short-term financing in connection with shareholder redemptions, subject to certain restrictions. The credit facility is with the Hennessy Funds’ custodian bank, U.S. Bank N.A. Borrowings under this arrangement bear interest at the bank’s prime rate and are secured by all of the Fund’s assets (as to its own borrowings only). During fiscal year 2022, the Fund had an outstanding average daily balance and a weighted average interest rate of $36,153 and 4.73%, respectively. The interest expensed by the Fund during fiscal year 2022 is included in the Statement of Operations. The maximum amount outstanding for the Fund during fiscal year 2022 was $742,000. As of October 31, 2022, the Fund did not have any borrowings outstanding under the line of credit.
As of October 31, 2022, the components of accumulated earnings (losses) for income tax purposes were as follows:
The difference between book-basis unrealized appreciation/depreciation and tax-basis unrealized appreciation/depreciation (as shown above) is attributable primarily to wash sales.
As of October 31, 2022, the Fund had no tax-basis capital losses to offset future capital gains.
As of October 31, 2022, the Fund did not defer, on a tax basis, any late-year ordinary losses. Late-year ordinary losses are net ordinary losses incurred after December 31, 2021, but within the taxable year, that are deemed to arise on the first day of the Fund’s next taxable year.
During fiscal years 2022 and 2021, the tax character of distributions paid by the Fund was as follows:
Certain local, regional, or global events such as wars, terrorism, pandemics or other public health mattes, and other geopolitical events could have a significant impact on securities markets generally or individual securities or instruments. For example, following Russia’s invasion of Ukraine, the President of the United States signed an Executive Order in February 2022 prohibiting U.S. persons from entering transactions with the Central Bank of Russia. Similarly, in June 2021, the President of the United States signed an Executive Order affirming and expanding the U.S. policy prohibiting U.S. persons from purchasing or investing in publicly-traded securities of companies identified by the U.S. Government as “Chinese Military-Industrial Complex Companies.” The list of such companies can change from time to time and the Advisor may be forced to hold securities it desires to sell or to sell securities it desires to buy, or the Advisor may not be able to participate in an investment it otherwise believes is attractive. The occurrence and duration of these types of events are hard to predict and could adversely affect the Fund’s performance.
Management has evaluated the Fund’s related events and transactions that occurred subsequent to October 31, 2022, through the date of issuance of the Fund’s financial statements. Other than as disclosed below, management has determined that there were no subsequent events requiring recognition or disclosure in the financial statements.
On December 8, 2022, capital gains were declared and paid to shareholders of record on December 7, 2022, as follows:
We have audited the accompanying statement of assets and liabilities of the Hennessy Balanced Fund (the “Fund”), a series of Hennessy Funds Trust, including the schedule of investments, as of October 31, 2022, the related statement of operations for the year then ended, the statements of changes in net assets for each of the two years in the period then ended, the financial highlights for each of the five years in the period then ended, and the related notes (collectively referred to as the “financial statements”). In our opinion, the financial statements present fairly, in all material respects, the financial position of the Fund as of October 31, 2022, the results of its operations for the year then ended, the changes in its net assets for each of the two years in the period then ended, and the financial highlights for each of the five years in the period then ended in conformity with accounting principles generally accepted in the United States of America.
These financial statements are the responsibility of the Fund’s management. Our responsibility is to express an opinion on the Fund’s financial statements based on our audits. We are a public accounting firm registered with the Public Company Accounting Oversight Board (United States) (“PCAOB”) and are required to be independent with respect to the Fund in accordance with the U.S. federal securities laws and the applicable rules and regulations of the Securities and Exchange Commission and the PCAOB. We have served as the auditor of one or more of the funds in the Trust since 2002.
We conducted our audits in accordance with the standards of the PCAOB. Those standards require that we plan and perform the audit to obtain reasonable assurance about whether the financial statements are free of material misstatement, whether due to error or fraud. The Fund is not required to have, nor were we engaged to perform, an audit of its internal control over financial reporting. As part of our audits we are required to obtain an understanding of internal control over financial reporting, but not for the purpose of expressing an opinion on the effectiveness of the Fund’s internal control over financial reporting. Accordingly, we express no such opinion.
Our audits included performing procedures to assess the risks of material misstatement of the financial statements, whether due to error or fraud, and performing procedures that respond to those risks. Such procedures included examining, on a test basis, evidence regarding the amounts and disclosures in the financial statements. Our audits also included evaluating the accounting principles used and significant estimates made by management, as well as evaluating the overall presentation of the financial statements. Our procedures included confirmation of securities owned as of October 31, 2022 by correspondence with the custodian. We believe that our audits provide a reasonable basis for our opinion.
The business and affairs of the Funds are managed under the direction of the Board of Trustees of the Trust, and the Board of Trustees elects the officers of the Trust. From time to time, the Board of Trustees also has appointed advisers to the Board of Trustees (“Advisers”) with the intention of having qualified individuals serve in an advisory capacity to garner experience in the mutual fund and asset management industry and be considered as potential Trustees in the future. There are currently two Advisers, Brian Alexander and Doug Franklin. As Advisers, Mr. Alexander and Mr. Franklin attend meetings of the Board of Trustees and act as non-voting participants. Information pertaining to the Trustees, Advisers, and the officers of the Trust is set forth below. The Trustees and officers serve until their successors are duly elected and qualified or until their earlier death, resignation, or removal. Each Trustee oversees all 16 Hennessy Funds. Unless otherwise indicated, the address of all persons listed below is 7250 Redwood Boulevard, Suite 200, Novato, CA 94945. The Fund’s Statement of Additional Information includes more information about the persons listed below and is available without charge by calling 1-800-966-4354 or by visiting www.hennessyfunds.com.
As a shareholder of the Fund, you incur ongoing costs, including management fees, service fees, and other Fund expenses. This Example is intended to help you understand your ongoing costs (in dollars) of investing in the Fund and to compare these costs with the ongoing costs of investing in other mutual funds. The Example is based on an investment of $1,000 invested at the beginning of the period and held for the entire period from May 1, 2022, through October 31, 2022.
The first line of the table below provides information about actual account values and actual expenses. You may use this information, together with the amount you invested, to estimate the expenses that you paid over the period. Simply divide your account value by $1,000 (for example, an $8,600 account value divided by $1,000 = 8.6), then multiply the result by the number in the first line under the heading “Expenses Paid During Period” to estimate the expenses you paid on your account during this period. Although the Fund charges no sales loads or transaction fees, you will be assessed fees for outgoing wire transfers, returned checks, and stop payment orders at prevailing rates charged by U.S. Bank Global Fund Services, the Fund’s transfer agent. If you request that a redemption be made by wire transfer, the Fund’s transfer agent charges a $15 fee. IRAs are charged a $15 annual maintenance fee (up to $30 maximum per shareholder for shareholders with multiple IRAs). The example below includes, but is not limited to, management, shareholder servicing, accounting, custody, and transfer agent fees. However, the example below does not include portfolio trading commissions and related expenses.
The second line of the table below provides information about hypothetical account values and hypothetical expenses based on the Fund’s actual expense ratio and an assumed rate of return of 5% per year before expenses, which is not the Fund’s actual return. The hypothetical account values and expenses may not be used to estimate the actual ending account balance or expenses you paid for the period. You may use this information to compare the ongoing costs of investing in the Fund and other funds. To do so, compare this 5% hypothetical example with the 5% hypothetical examples that appear in the shareholder reports of the other funds. Please note that the expenses shown in the table are meant to highlight your ongoing costs only. Therefore, the second line is useful in comparing ongoing costs only and will not help you determine the relative total costs of owning different funds.
A description of the policies and procedures the Fund uses to determine how to vote proxies relating to portfolio securities is available without charge (1) by calling 1-800-966-4354, (2) on the Hennessy Funds’ website at www.hennessyfunds.com/proxy-voting/voting-policy, or (3) on the U.S. Securities and Exchange Commission’s (the “SEC”) website at www.sec.gov. The Fund’s proxy voting record is available without charge on both the Hennessy Funds’ website at www.hennessyfunds.com/proxy-voting/voting-record and the SEC’s website at www.sec.gov no later than August 31 for the prior 12 months ending June 30.
The Fund files a complete schedule of portfolio holdings with the SEC for the first and third quarters of each fiscal year as an exhibit to its reports on Form N-PORT. The Fund’s Form N-PORT reports are available on the SEC’s website at www.sec.gov or on request by calling 1-800-966-4354.
For fiscal year 2022, certain dividends paid by the Fund may be subject to a maximum tax rate of 23.8%, as provided for by the Jobs and Growth Tax Relief Reconciliation Act of 2003. The percentage of dividends declared from ordinary income designated as qualified dividend income was 100.00%.
For corporate shareholders, the percent of ordinary income distributions that qualified for the corporate dividends received deduction for fiscal year 2022 was 100.00%.
The percentage of taxable ordinary income distributions that were designated as short-term capital gain distributions under Section 871(k)(2)(C) of the Internal Revenue Code of 1986, as amended, for the Fund was 15.18%.
To help keep the Fund’s costs as low as possible, we generally deliver a single copy of shareholder reports, proxy statements, and prospectuses to shareholders who share an address and have the same last name. This process does not apply to account statements. You may request an individual copy of a shareholder document at any time. If you would like to receive separate mailings of shareholder documents, please call U.S. Bank Global Fund Services at 1-800-261-6950 or 1-414-765-4124, and individual delivery will begin within 30 days of your request. If your account is held through a financial institution or other intermediary, please contact such intermediary directly to request individual delivery.
As permitted by SEC regulations, the Fund’s shareholder reports are made available on a website, and unless you sign for eDelivery or elect to receive paper copies as detailed below, you will be notified by mail each time a report is posted and provided with a website link to access the report.
The Fund also offers shareholders the option to receive all notices, account statements, prospectuses, tax forms, and shareholder reports electronically. To sign up for eDelivery or change your delivery preference, please visit www.hennessyfunds.com/account.
To elect to receive paper copies of all future reports free of charge, please call U.S. Bank Global Fund Services at 800-261-6950 or 414-765-4124.
Subscribe to receive our team’s unique market and sector insights delivered to your inbox
In accordance with Rule 22e-4 under the Investment Company Act of 1940, as amended (the “Liquidity Rule”), we have adopted and implemented a liquidity risk management program (the “Liquidity Program”). The purpose of the Liquidity Program is to assess and manage the Fund’s liquidity risk, which is the risk that the Fund would not be able to meet requests to redeem Fund shares without significant dilution of the remaining shareholders’ interests in the Fund. The Board of Trustees of the Fund (the “Board”) designated a committee comprising representatives of Hennessy Advisors, Inc., the investment adviser to the Fund, as the administrator of the Liquidity Program (the “Program Administrator”).
The Program Administrator provided a written report regarding the Liquidity Program to the Board in advance of its meeting on June 1, 2022. The report covered the period from June 1, 2021, through May 31, 2022. The report addressed the operation of the Liquidity Program, assessed the adequacy and effectiveness of its implementation, and described any material changes to the Liquidity Program during the review period. The Trust’s chief compliance officer presented the report to the Board at the meeting and provided additional information regarding the Liquidity Program. The Board reviewed the Liquidity Program and considered, among other items, the following:
We collect this information directly from you, indirectly in the course of providing services to you, directly and indirectly from your activity on our website, from broker dealers, marketing agencies, and other third parties that interact with us in connection with the services we perform and products we offer, and from anonymized and aggregated consumer information.
We use this information to fulfill the reason you provided the information to us, to provide you with other relevant products that you request from us, to provide you with information about products that may interest you, to improve our website or present our website’s contents to you, and as otherwise described to you when collecting your personal information.
We do not disclose any personal information to unaffiliated third parties, except as permitted by law. We may disclose your personal information to our affiliates, vendors, and service providers for a business purpose. For example, we are permitted by law to disclose all of the information we collect, as described above, to our transfer agent to process your transactions. When disclosing your personal information to third parties, we enter into a contract with each third party describing the purpose of such disclosure and requiring that such personal information be kept confidential and not used for any purpose except to perform the services contracted or respond to regulatory or law enforcement requests.
Furthermore, we restrict access to your personal information to those persons who require such information to provide products or services to you. As a result, we do not provide a means for opting out of our limited sharing of your information. We maintain physical, electronic, and procedural safeguards that comply with federal standards to guard your personal information.
If you hold shares of the Funds through a financial intermediary, including, but not limited to, a broker-dealer, bank, or trust company, the privacy policy of your financial intermediary governs how your personal information is shared with unaffiliated third parties.
The California Consumer Privacy Act of 2018 (the “CCPA”) provides you, as a California resident, with certain additional rights relating to your personal information.
Under the CCPA, you have the right to request that we disclose to you the categories of personal information we have collected about you over the past 12 months, the categories of sources of such information, our business purpose for collecting the information, the categories of third parties, if any, with whom we shared the information, and the specific information we have collected about you. You also have the right to request that we delete any of your personal information, and, unless an exception applies, we will delete such information upon receiving and confirming your request. To make a request, call us at 1-800-966-4354, email us at privacy@hennessyfunds.com, or go to www.hennessyfunds.com/contact. We will not discriminate against you for exercising your rights under the CCPA. Further, we will not collect additional categories of your personal information or use the personal information we collected for materially different, unrelated, or incompatible purposes without providing you notice.
Hennessy Advisors, Inc.
U.S. Bancorp Fund Services, LLC
d/b/a U.S. Bank Global Fund Services
P.O. Box 701
U.S. Bank N.A.
Neil J. Hennessy
Robert T. Doyle
J. Dennis DeSousa
Gerald P. Richardson
others only if preceded or accompanied by a current prospectus.
ANNUAL REPORT
OCTOBER 31, 2022
HENNESSY ENERGY TRANSITION FUND
Investor Class HNRGX
Institutional Class HNRIX
www.hennessyfunds.com | 1-800-966-4354
(This Page Intentionally Left Blank.)
Contents
| Letter to Shareholders | | 2 |
| Performance Overview | | 6 |
| Financial Statements | | |
| Schedule of Investments | | 10 |
| Statement of Assets and Liabilities | | 14 |
| Statement of Operations | | 15 |
| Statements of Changes in Net Assets | | 17 |
| Financial Highlights | | 18 |
| Notes to the Financial Statements | | 22 |
| Report of Independent Registered Public Accounting Firm | | 31 |
| Trustees and Officers of the Fund | | 32 |
| Expense Example | | 36 |
| Proxy Voting Policy and Proxy Voting Records | | 38 |
| Availability of Quarterly Portfolio Schedule | | 38 |
| Federal Tax Distribution Information | | 38 |
| Important Notice Regarding Delivery of Shareholder Documents | | 38 |
| Electronic Delivery | | 38 |
| Liquidity Risk Management Program | | 39 |
| Privacy Policy | | 39 |
| HENNESSY FUNDS | 1-800-966-4354 | |
December 2022
Dear Hennessy Funds Shareholder:
What a year it has been. By the close of the second trading day of 2022, we witnessed new all-time highs in both the S&P 500® Index and the Dow Jones Industrial Average, while the Nasdaq Composite Index hit its all-time high in November 2021. The market’s triumph was short lived, however. By the last day of our fiscal year on October 31, 2022, all three major indices were down significantly, with bleak year-to-date total returns of -8.42%, -17.70%, and -29.32% for the Dow, the S&P 500, and the Nasdaq, respectively. After almost 13 years of incredible resilience following the Financial Crisis of 2008, the equity markets have been shaken by stinging inflation, rapidly rising interest rates, soaring energy costs, and slowing economic growth teetering on recession. While many investors would like to forget 2022, we prefer to maintain perspective in this market downturn.
Time, time, time…. is on my side, yes, it is!
-Rolling Stones, 1964
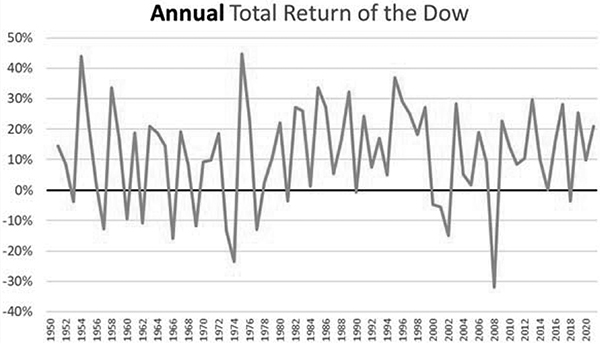
We believe time is on our side… when it comes to investing. Experiencing negative market movements on any given day can seem disappointing. Downdrafts lasting a month can feel relentless. Almost a full year of negative returns with little respite along the way? That is downright painful. However, equities generally trend up and to the right. Over the past 100 calendar years, the Dow had an average annual total return of 10.25%. While we admit that long-term returns like these make it easy to be a “consummate bull,” market bulls have been right over the long-term. Yet over shorter periods, market returns can be “choppy.”
Looking at the chart below depicting annual total returns of the Dow Jones Industrial Average from 1950 to 2021, we see how volatile the market can be on an annual basis. Investors experienced 16 years of negative returns during this time, the most painful being -31.93% in 2008.
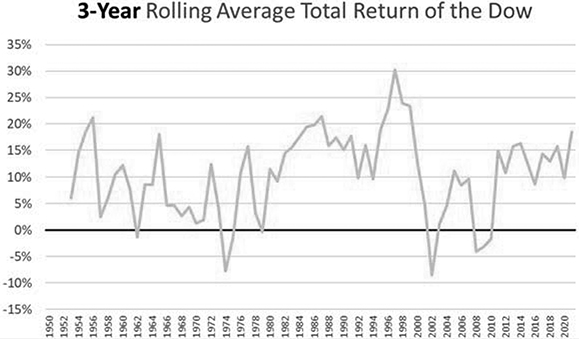
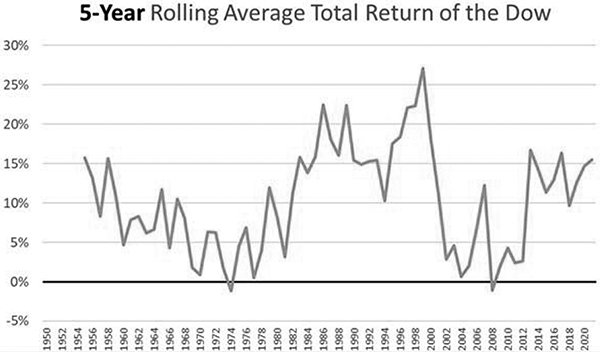
Time is what smooths out choppy markets. When we extend our investing intervals, and stop focusing on annual returns, the ups and downs feel less and less – and appear less and less. The two charts below depict the three-year and five-year rolling average total returns of the Dow over the same time period as the chart above. Each chart shows decreased volatility, with lower peaks and higher troughs, even though the charts show the same cumulative return of the Dow over the past 71 full calendar years.
When we extend our chart out to ten-year rolling averages, we can clearly see how investing over the long-term can make an investor bullish. In the past 71 years, there has never been a negative 10-year rolling average total return of the Dow. Never. The worst ten-year rolling average total return was a positive 0.29%, from 1965 to 1974, a period including the Great Inflation of the 1970s marked by dismal total returns of -13.28% in 1973 and -23.58% in 1974. The ten-year period from 2000 to 2009, which included the Financial Crisis of 2008, produced a positive average annual total return of 1.31%. Note that in the chart below, the line never crosses below zero.
| HENNESSY FUNDS | 1-800-966-4354 | |
When it comes to investing, time, time, time… is on our side, yes, it is! This is why we invest for the long term at Hennessy, focusing on fundamentals, valuations, and strong businesses, ever mindful of downside risk.
Value investing proved its worth this year, and many of our Funds did as well. The Russell 1000® Value Index was only down -7.00% during our fiscal year ended October 31, 2022, trouncing the Russell 1000® Growth Index’s total return of -24.60%. In addition, most of our Funds outperformed the broader market as well as their benchmarks. During the twelve months ended October 31, 2022, the Dow, the S&P 500, and the Nasdaq dropped -6.74%, -14.61%, and -28.56%, respectively, on a total return basis. During this time period when these three major indices saw significant declines, we were pleased that seven of our 16 Funds posted positive total returns, 11 of our 14 domestic Funds outperformed the S&P 500, and over two-thirds of our actively managed, domestic funds outperformed their primary benchmarks.
Top performers of the year included three of our Funds focused on the Energy and Utilities sectors. These sectors have benefitted from the rising cost of energy, as well as an increase in demand that has outpaced growth in supply. The Hennessy Energy Transition Fund, the Hennessy Midstream Fund, and the Hennessy Gas Utility Fund performed exceptionally well with positive total returns of 49.24%, 24.03%, and 10.14%, respectively, during the twelve-month period ended October 31, 2022. On a different note, our two international funds continue to be adversely affected by softening economies in Asia, rising interest rates, and growth to value rotation. The Hennessy Japan Fund and the Hennessy Japan Small Cap Fund experienced negative total returns of -37.86% and -27.35%, respectively, during our fiscal year.
Notwithstanding a difficult market environment over the last twelve months, we believe that the outlook for U.S. stocks remains positive. We continue to believe that equities are attractive from a valuation standpoint, even as interest rates rise. We believe that the prospect of slower economic growth may dampen inflationary pressures. While the Federal Reserve has raised rates several times in calendar 2022, we believe tempered inflation will allow the potential for the Federal Reserve to take a more neutral stance toward future rate hikes. We remain bullish on equities long term. The unemployment rate is near record lows, there are elevated levels of cash on the balance sheets of U.S. companies, and there is the prospect of a more dovish Federal Reserve in 2023. While
volatility and uncertainty may continue to impact the markets in the short term, we encourage investors to stay the course, maintain a diversified portfolio, and keep a long-term perspective.
We thank you for your continued interest in our Funds, and we are grateful for your trust. While we always prefer to post only positive returns for our shareholders, we are pleased that many of our Funds held up better than the broader market during this challenging year. If you have any questions or would like to speak with us, please call us directly at (800) 966-4354.
Best regards,

| |
| |
| |
 |
| Ryan C. Kelley, CFA |
| Chief Investment Officer, |
| Senior Vice President, and Portfolio Manager |
Past performance does not guarantee future results.
Mutual fund investing involves risk. Principal loss is possible.
Opinions expressed are those of Ryan C. Kelley and are subject to change, are not guaranteed, and should not be considered investment advice.
The Dow Jones Industrial Average and S&P 500® Index are commonly used to measure the performance of U.S. stocks. The Nasdaq Composite Index comprises all common stocks listed on The Nasdaq Stock Market and is commonly used to measure the performance of technology-related stocks. The indices are used herein for comparative purposes in accordance with SEC regulations. One cannot invest directly in an index. All returns are shown on a total return basis.
| HENNESSY FUNDS | 1-800-966-4354 | |
Performance Overview (Unaudited)
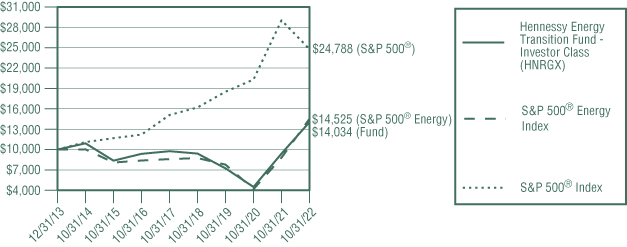
CHANGE IN VALUE OF $10,000 INVESTMENT
This graph illustrates the performance of an initial investment of $10,000 made in the Fund on its inception date and assumes the reinvestment of dividends and capital gains.
AVERAGE ANNUAL TOTAL RETURN FOR PERIODS ENDED OCTOBER 31, 2022
| | One | Five | Since Inception |
| | Year | Years | (12/31/13) |
| Hennessy Energy Transition Fund – | | | |
| Investor Class (HNRGX) | 49.24% | 7.54% | 3.91% |
| Hennessy Energy Transition Fund – | | | |
| Institutional Class (HNRIX) | 49.71% | 7.84% | 4.18% |
S&P 500® Energy Index | 64.97% | 11.07% | 4.32% |
S&P 500® Index | -14.61% | 10.44% | 10.82% |
Expense ratios: 2.96% (Investor Class); 2.61% (Institutional Class)
Performance data quoted represents past performance; past performance does not guarantee future results. The investment return and principal value of an investment will fluctuate so that an investor’s shares, when redeemed, may be worth more or less than their original cost. The performance table does not reflect the deduction of taxes that a shareholder would pay on Fund distributions or the redemption of Fund shares. Current performance of the Fund may be lower or higher than the performance quoted. Performance data current to the most recent month end may be obtained by visiting www.hennessyfunds.com. Performance for periods including or prior to October 26, 2018, is that of the BP Capital TwinLine Energy Fund.
The S&P 500® Energy Index comprises those companies included in the S&P 500® that are classified in the Energy sector. The S&P 500® Index is a capitalization-weighted index that is designed to represent the broad domestic economy through changes in the aggregate market value of 500 stocks across all major industries. One cannot invest directly in an index. These indices are used for comparative purposes in accordance with Securities and Exchange Commission regulations.
Standard & Poor’s Financial Services is the source and owner of the S&P® and S&P 500® trademarks.
The expense ratios presented are from the most recent prospectus. The expense ratios for the current reporting period are available in the Financial Highlights section of this report.
PERFORMANCE NARRATIVE
Portfolio Managers Ben Cook, CFA, and L. Joshua Wein, CAIA
Performance:
For the one-year period ended October 31, 2022, the Investor Class of the Hennessy Energy Transition Fund returned 49.24%, underperforming the S&P 500® Energy Index (the Fund’s primary benchmark), which returned 64.97% for the same period, but outperforming the S&P 500® Index, which returned -14.61% for the same period.
Relative energy equity performance during the period tracked the strong influence of energy commodity prices, favoring hydrocarbon energy equities that outperformed both the renewable energy equity category as well as broader market equity indexes. Hydrocarbon-oriented equity outperformance relative to renewable-oriented equity peers was particularly notable given the substantial policy support provided to renewable technologies by Congress through the passage of the Inflation Reduction Act of 2022, which was signed into law during August 2022.
As in the prior period, hydrocarbon company investment merit remained relatively attractive, benefiting from a combination of strong commodity fundamentals, desirable valuation, and shareholder friendly corporate governance. The global energy crisis precipitated by the Russian invasion of Ukraine exacerbated global hydrocarbon supply tightness, and in our view, strengthened the case for a durable commodity upcycle. Accordingly, we redirected a small quantity of renewable equity exposure toward hydrocarbon energy equity counterparts. By period end, Fund exposure to hydrocarbon-oriented equites remained elevated relative to historical averages.
Portfolio Strategy:
The Fund seeks to invest in companies across the energy value chain, including both hydrocarbons and renewable energy sources. This investible universe includes crude oil and natural gas exploration and production companies, oilfield service providers, midstream companies, refiners, and energy end users. The renewable energy value chain comprises materials producers, machinery and equipment manufacturers, service providers, and utilities. We believe the inclusion of energy end users, such as industrials and transportation companies, differentiates the Fund from traditional energy funds that do not include such companies. We believe including such companies in the investment universe enables the Fund to hold a broader range of energy-related themes and provides greater flexibility to adjust sub-sector weightings based on our investment outlook. The Fund typically owns 25 to 40 securities and historically has had little overlap with the top holdings of commonly used energy and commodity equity benchmarks.
Investment Commentary:
Energy market volatility rose meaningfully during the first quarter of the one-year period ended October 31, 2022 as rising global energy demand associated with an improving pace of economic growth post pandemic stressed a beleaguered global supply base, constrained by limited OPEC+ production resumption, Russian volume loss, and persistent upstream sector capacity underinvestment. Oil price volatility subsided in the latter half of the period dampened by the sizeable release of crude oil from the U.S. Strategic Petroleum Reserve (SPR). Though the price of NYMEX WTI crude oil doubled from its December 2021 low by March 2022, the WTI crude oil price moderated through the end of the one-year period ended October 31, 2022, to finish at $86.53 per barrel (bbl), up approximately 3.5% from the previous one-year period ended October 31, 2021.
| HENNESSY FUNDS | 1-800-966-4354 | |
Global natural gas markets also experienced significant volatility during the period as supply loss associated with curtailed Russian exports into Europe sent policy makers scrambling to secure alternative sources of supply critical to meeting regional wintertime needs. The corresponding spike in demand supported price gains around the globe as competition for liquified natural gas (LNG) cargos lifted Asian market pricing and provided a meaningful boost to U.S. pricing as well, as the U.S. committed to supplying the European Union (EU) with significant volumes on a go forward basis. During the summer, the untimely planned winddown of key nuclear facilities in Germany also added to regional baseload natural gas needs as renewable power sources proved insufficient in making up energy supply shortfall. Though NYMEX Henry Hub natural gas prices more than doubled from trough to peak during the period, the Henry Hub natural gas price moderated into period end, gaining approximately 17.1% to finish at $6.35 per thousand cubic feet (mcf).
Despite lingering fears of Covid-variant proliferation and the potential risk of slowing economic activity due to tightening monetary conditions, investment merit inherent in U.S. energy equities remains favorable given favorable commodity fundamentals, rising demand for U.S. energy exports, the sector’s defensive posture with respect to inflation, and its current attractive valuation.
On a global basis, crude oil and natural gas inventories remain well below historical norms, as years of underinvestment in industry capacity and only modest gains in production volume have proven insufficient to fully satisfy rising consumption and inventory replenishment needs. As a consequence, commodity prices are likely to remain elevated and provide U.S. upstream companies with incentive to develop the resources required to meet rising demand in the U.S and abroad. Existing and projected export capacity expansion in the U.S. should allow for export volume growth through the end of the decade. The market’s loss of Russian export volumes underscores the importance of energy security, reliability, and affordability, which are all qualities that likely will increase the appeal of U.S. energy resources. As one of few sectors offering the potential for strong returns and cash flows that are generally positively correlated with rising price levels, we believe hydrocarbon-oriented equities provide a logical hedge in an inflationary environment. Inflation protection coupled with attractive valuation relative to historical norms combine to offer unique appeal in the current environment.
As the world pursues greenhouse gas emission reduction targets, we believe policy and technology, as well as consumer and investor preference, will continue to drive change in the world’s primary fuel mix. In this environment, we believe that wind, solar, hydrogen, and other renewable technologies will expand at the expense of more carbon intensive fuels, namely coal and heavy fuel oil. Despite this, we expect critical impediments in the form of policy gaps, reliability issues, simple cost disadvantages, and geo-political disruption to the flow of traditional hydrocarbons will continue to hamper the pace of the transition toward renewables, and we see these drivers prolonging the dependence upon hydrocarbons. As a consequence, we envision a landscape that reflects the coexistence and need for diversity in energy supply, inclusive of both hydrocarbons and renewables, which should provide investment opportunity for investors for decades to come.
_______________
Opinions expressed are those of the Portfolio Managers as of the date written and are subject to change, are not guaranteed, and should not be considered investment advice or an indication of trading intent.
The Fund invests in small-capitalization and medium-capitalization companies, which involves additional risks such as limited liquidity and greater volatility. Funds that concentrate in a single sector may be subject to a higher degree of risk. Energy-related companies are subject to specific risks, including fluctuations in commodity prices and consumer demand, substantial government regulation, and depletion of reserves. Investments in lower-rated and non-rated securities present a greater risk of loss to principal and interest than higher-rated securities. Use of derivatives can increase the volatility of the Fund.
MLPs and MLP investments have unique characteristics. The Fund does not receive the same tax benefits as a direct investment in an MLP.
The prices of MLP units may fluctuate abruptly and trading volume may be low, making it difficult for the Fund to sell its units at a favorable price. MLP general partners have the power to take actions that adversely affect the interests of unit holders. Most MLPs do not pay U.S. federal income tax at the partnership level, but an adverse change in tax laws could result in MLPs being treated as corporations for federal income tax purposes, which could reduce or eliminate distributions paid by MLPs to the Fund. If the Fund’s MLP investments exceed 25% of its assets, the Fund may not qualify for treatment as a regulated investment company under the Internal Revenue Code. The Fund would be taxed as an ordinary corporation, which could substantially reduce the Fund’s net assets and its distributions to shareholders. Please see the Fund’s prospectus for a more complete discussion of these and other risks.
References to specific securities should not be considered a recommendation to buy or sell any security. Fund holdings and sector allocations are subject to change. Please refer to the Schedule of Investments included in this report for additional portfolio information.
Cash flow refers to the net amount of cash and cash equivalents transfered into and out of a company.
| HENNESSY FUNDS | 1-800-966-4354 | |
Financial Statements
Schedule of Investments as of October 31, 2022 |
HENNESSY ENERGY TRANSITION FUND
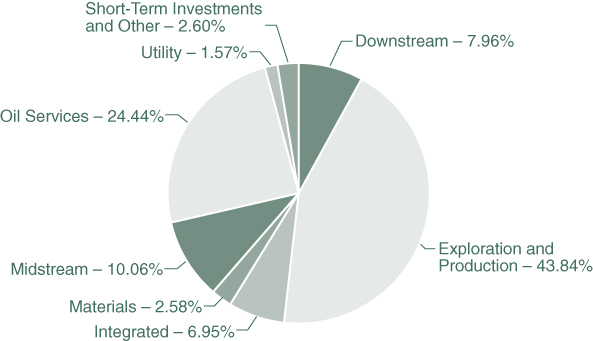
(% of Total Assets)
| TOP TEN HOLDINGS (EXCLUDING MONEY MARKET FUNDS) | % TOTAL ASSETS |
| Schlumberger Ltd. | 5.80% |
| EOG Resources, Inc. | 5.11% |
| Solaris Oilfield Infrastructure, Inc. | 5.07% |
| Suncor Energy, Inc. | 5.06% |
| ConocoPhillips | 4.88% |
| Antero Resources Corp. | 4.81% |
| Phillips 66 | 4.64% |
| Exxon Mobil Corp. | 4.22% |
| Halliburton Co. | 4.19% |
| Diamondback Energy, Inc. | 4.07% |
Note: The Fund concentrates its investments in the Energy industry. For presentation purposes, the Fund uses custom categories.
| COMMON STOCKS – 92.72% | | Number | | | | | | % of | |
| | | of Shares | | | Value | | | Net Assets | |
| Downstream – 7.98% | | | | | | | | | |
| Marathon Petroleum Corp. | | | 6,900 | | | $ | 783,978 | | | | 3.33 | % |
| Phillips 66 | | | 10,500 | | | | 1,095,045 | | | | 4.65 | % |
| | | | | | | | 1,879,023 | | | | 7.98 | % |
| | | | | | | | | | | | | |
| Exploration & Production – 43.97% | | | | | | | | | | | | |
| Antero Resources Corp. (a) | | | 31,000 | | | | 1,136,460 | | | | 4.83 | % |
| ConocoPhillips | | | 9,145 | | | | 1,153,093 | | | | 4.90 | % |
| Coterra Energy, Inc. | | | 25,510 | | | | 794,126 | | | | 3.37 | % |
| Diamondback Energy, Inc. | | | 6,120 | | | | 961,513 | | | | 4.08 | % |
| EOG Resources, Inc. | | | 8,830 | | | | 1,205,472 | | | | 5.12 | % |
| EQT Corp. | | | 22,600 | | | | 945,584 | | | | 4.02 | % |
| Magnolia Oil & Gas Corp. | | | 25,800 | | | | 662,544 | | | | 2.81 | % |
| Marathon Oil Corp. | | | 16,000 | | | | 487,200 | | | | 2.07 | % |
| PDC Energy, Inc. | | | 12,090 | | | | 872,173 | | | | 3.71 | % |
| Pioneer Natural Resources Co. | | | 3,650 | | | | 935,896 | | | | 3.98 | % |
| Suncor Energy, Inc. (b) | | | 34,760 | | | | 1,195,396 | | | | 5.08 | % |
| | | | | | | | 10,349,457 | | | | 43.97 | % |
| | | | | | | | | | | | | |
| Integrated – 6.97% | | | | | | | | | | | | |
| Chevron Corp. | | | 3,550 | | | | 642,195 | | | | 2.73 | % |
| Exxon Mobil Corp. | | | 9,000 | | | | 997,290 | | | | 4.24 | % |
| | | | | | | | 1,639,485 | | | | 6.97 | % |
| | | | | | | | | | | | | |
| Materials – 2.59% | | | | | | | | | | | | |
| Freeport-McMoRan, Inc. | | | 19,220 | | | | 609,082 | | | | 2.59 | % |
| | | | | | | | | | | | | |
| Midstream – 5.13% | | | | | | | | | | | | |
| Antero Midstream Corp. | | | 45,500 | | | | 484,575 | | | | 2.06 | % |
| Cheniere Energy, Inc. | | | 4,100 | | | | 723,281 | | | | 3.07 | % |
| | | | | | | | 1,207,856 | | | | 5.13 | % |
| | | | | | | | | | | | | |
| Oil Services – 24.51% | | | | | | | | | | | | |
| Halliburton Co. | | | 27,150 | | | | 988,803 | | | | 4.20 | % |
| Newpark Resources, Inc. (a) | | | 70,950 | | | | 259,677 | | | | 1.10 | % |
| Schlumberger Ltd. (b) | | | 26,310 | | | | 1,368,909 | | | | 5.81 | % |
| Select Energy Services, Inc. (a) | | | 49,660 | | | | 479,219 | | | | 2.04 | % |
| Solaris Oilfield Infrastructure, Inc. | | | 87,920 | | | | 1,197,470 | | | | 5.09 | % |
| TechnipFMC PLC – (a)(b) | | | 65,240 | | | | 690,892 | | | | 2.93 | % |
| Tenaris SA – ADR (b) | | | 25,000 | | | | 785,500 | | | | 3.34 | % |
| | | | | | | | 5,770,470 | | | | 24.51 | % |
The accompanying notes are an integral part of these financial statements.
| HENNESSY FUNDS | 1-800-966-4354 | |
| COMMON STOCKS | | Number | | | | | | % of | |
| | | of Shares | | | Value | | | Net Assets | |
| Utility – 1.57% | | | | | | | | | |
| NextEra Energy, Inc. | | | 4,770 | | | $ | 369,675 | | | | 1.57 | % |
| | | | | | | | | | | | | |
| Total Common Stocks | | | | | | | | | | | | |
| (Cost $13,358,968) | | | | | | | 21,825,048 | | | | 92.72 | % |
| | | | | | | | | | | | | |
| PARTNERSHIPS & TRUSTS – 4.95% | | | | | | | | | | | | |
| | | | | | | | | | | | | |
| Midstream – 4.95% | | | | | | | | | | | | |
| MPLX LP | | | 15,104 | | | | 506,588 | | | | 2.15 | % |
| Plains All American Pipeline LP | | | 55,010 | | | | 658,470 | | | | 2.80 | % |
| | | | | | | | | | | | | |
| Total Partnerships & Trusts | | | | | | | | | | | | |
| (Cost $963,001) | | | | | | | 1,165,058 | | | | 4.95 | % |
| | | | | | | | | | | | | |
| SHORT-TERM INVESTMENTS – 1.40% | | | | | | | | | | | | |
| | | | | | | | | | | | | |
| Money Market Funds – 1.40% | | | | | | | | | | | | |
| First American Government Obligations Fund, | | | | | | | | | | | | |
| Institutional Class, 2.93% (c) | | | 329,996 | | | | 329,996 | | | | 1.40 | % |
| | | | | | | | | | | | | |
| Total Short-Term Investments | | | | | | | | | | | | |
| (Cost $329,996) | | | | | | | 329,996 | | | | 1.40 | % |
| | | | | | | | | | | | | |
| Total Investments | | | | | | | | | | | | |
| (Cost $14,651,965) – 99.07% | | | | | | | 23,320,102 | | | | 99.07 | % |
| Other Assets in Excess of Liabilities – 0.93% | | | | | | | 219,654 | | | | 0.93 | % |
| | | | | | | | | | | | | |
TOTAL NET ASSETS – 100.00% | | | | | | $ | 23,539,756 | | | | 100.00 | % |
Percentages are stated as a percent of net assets.
ADR – American Depositary Receipt
PLC – Public Limited Company
| (a) | Non-income-producing security. |
| (b) | U.S.-traded security of a foreign corporation. |
| (c) | The rate listed is the fund’s seven-day yield as of October 31, 2022. |
The accompanying notes are an integral part of these financial statements.
Summary of Fair Value Exposure as of October 31, 2022
The following is a summary of the inputs used to value the Fund’s net assets as of October 31, 2022 (see Note 3 in the accompanying Notes to the Financial Statements):
| Common Stocks | | Level 1 | | | Level 2 | | | Level 3 | | | Total | |
| Downstream | | $ | 1,879,023 | | | $ | — | | | $ | — | | | $ | 1,879,023 | |
| Exploration & Production | | | 10,349,457 | | | | — | | | | — | | | | 10,349,457 | |
| Integrated | | | 1,639,485 | | | | — | | | | — | | | | 1,639,485 | |
| Materials | | | 609,082 | | | | — | | | | — | | | | 609,082 | |
| Midstream | | | 1,207,856 | | | | — | | | | — | | | | 1,207,856 | |
| Oil Services | | | 5,770,470 | | | | — | | | | — | | | | 5,770,470 | |
| Utility | | | 369,675 | | | | — | | | | — | | | | 369,675 | |
| Total Common Stocks | | $ | 21,825,048 | | | $ | — | | | $ | — | | | $ | 21,825,048 | |
| Partnerships & Trusts | | | | | | | | | | | | | | | | |
| Midstream | | $ | 1,165,058 | | | $ | — | | | $ | — | | | $ | 1,165,058 | |
| Total Partnerships & Trusts | | $ | 1,165,058 | | | $ | — | | | $ | — | | | $ | 1,165,058 | |
| Short-Term Investments | | | | | | | | | | | | | | | | |
| Money Market Funds | | $ | 329,996 | | | $ | — | | | $ | — | | | $ | 329,996 | |
| Total Short-Term Investments | | $ | 329,996 | | | $ | — | | | $ | — | | | $ | 329,996 | |
| Total Investments | | $ | 23,320,102 | | | $ | — | | | $ | — | | | $ | 23,320,102 | |
The accompanying notes are an integral part of these financial statements.
| HENNESSY FUNDS | 1-800-966-4354 | |
Financial Statements
Statement of Assets and Liabilities as of October 31, 2022 |
| ASSETS: | | | |
| Investments in securities, at value (cost $14,651,965) | | $ | 23,320,102 | |
| Dividends and interest receivable | | | 4,512 | |
| Receivable for fund shares sold | | | 251,682 | |
| Return of capital receivable | | | 20,974 | |
| Prepaid expenses and other assets | | | 8,787 | |
| Total assets | | | 23,606,057 | |
| | | | | |
| LIABILITIES: | | | | |
| Payable for fund shares redeemed | | | 6,013 | |
| Payable to advisor | | | 22,632 | |
| Payable to auditor | | | 23,405 | |
| Accrued distribution fees | | | 1,860 | |
| Accrued service fees | | | 784 | |
| Accrued trustees fees | | | 4,768 | |
| Accrued expenses and other payables | | | 6,839 | |
| Total liabilities | | | 66,301 | |
| NET ASSETS | | $ | 23,539,756 | |
| | | | | |
| NET ASSETS CONSISTS OF: | | | | |
| Capital stock | | $ | 56,076,672 | |
| Accumulated deficit | | | (32,536,916 | ) |
| Total net assets | | $ | 23,539,756 | |
| | | | | |
| NET ASSETS: | | | | |
| Investor Class | | | | |
| Shares authorized (no par value) | | Unlimited | |
| Net assets applicable to outstanding shares | | $ | 10,213,489 | |
| Shares issued and outstanding | | | 422,896 | |
| Net asset value, offering price, and redemption price per share | | $ | 24.15 | |
| | | | | |
| Institutional Class | | | | |
| Shares authorized (no par value) | | Unlimited | |
| Net assets applicable to outstanding shares | | $ | 13,326,267 | |
| Shares issued and outstanding | | | 541,880 | |
| Net asset value, offering price, and redemption price per share | | $ | 24.59 | |
The accompanying notes are an integral part of these financial statements.
| STATEMENT OF ASSETS AND LIABILITIES/STATEMENT OF OPERATIONS |
Financial Statements
Statement of Operations for the year ended October 31, 2022 |
| INVESTMENT INCOME: | | | |
| Distributions received from master limited partnerships | | $ | 114,520 | |
| Return of capital on distributions received | | | (114,520 | ) |
Dividend income from common stock(1) | | | 621,728 | |
| Interest income | | | 1,473 | |
| Total investment income | | | 623,201 | |
| | | | | |
| EXPENSES: | | | | |
| Investment advisory fees (See Note 5) | | | 255,316 | |
| Administration, accounting, custody, and transfer agent fees (See Note 5) | | | 34,994 | |
| Federal and state registration fees | | | 33,490 | |
| Sub-transfer agent expenses – Investor Class (See Note 5) | | | 15,082 | |
| Sub-transfer agent expenses – Institutional Class (See Note 5) | | | 11,074 | |
| Compliance expense (See Note 5) | | | 24,520 | |
| Audit fees | | | 23,397 | |
| Trustees’ fees and expenses | | | 16,247 | |
| Distribution fees – Investor Class (See Note 5) | | | 12,587 | |
| Reports to shareholders | | | 11,489 | |
| Service fees – Investor Class (See Note 5) | | | 8,391 | |
| Interest expense (See Note 7) | | | 1,096 | |
| Legal Fees | | | 866 | |
| Other expenses | | | 5,850 | |
| Total expenses before waiver | | | 454,399 | |
| Service provider expense waiver (See Note 5) | | | (34,994 | ) |
| Net expenses | | | 419,405 | |
| NET INVESTMENT INCOME | | $ | 203,796 | |
| | | | | |
| REALIZED AND UNREALIZED GAINS (LOSSES): | | | | |
| Net realized gain on investments | | $ | 1,336,639 | |
| Net change in unrealized appreciation/depreciation on investments | | | 6,207,910 | |
| Net gain on investments | | | 7,544,549 | |
| NET INCREASE IN NET ASSETS RESULTING FROM OPERATIONS | | $ | 7,748,345 | |
(1) | Net of foreign taxes withheld of $5,125. |
The accompanying notes are an integral part of these financial statements.
| HENNESSY FUNDS | 1-800-966-4354 | |
(This Page Intentionally Left Blank.)
| STATEMENTS OF CHANGES IN NET ASSETS |
Financial Statements
| Statements of Changes in Net Assets |
| | | Year Ended | | | Year Ended | |
| | | October 31, 2022 | | | October 31, 2021 | |
| OPERATIONS: | | | | | | |
| Net investment income | | $ | 203,796 | | | $ | 45,083 | |
| Net realized gain on investments | | | 1,336,639 | | | | 1,234,155 | |
| Net change in unrealized | | | | | | | | |
| appreciation/depreciation on investments | | | 6,207,910 | | | | 5,107,361 | |
| Net increase in net assets resulting from operations | | | 7,748,345 | | | | 6,386,599 | |
| | | | | | | | | |
| DISTRIBUTIONS TO SHAREHOLDERS: | | | | | | | | |
| Distributable earnings – Investor Class | | | (751,147 | ) | | | — | |
| Distributable earnings – Institutional Class | | | (1,188,176 | ) | | | — | |
| Total distributions | | | (1,939,323 | ) | | | — | |
| | | | | | | | | |
| CAPITAL SHARE TRANSACTIONS: | | | | | | | | |
| Proceeds from shares subscribed – Investor Class | | | 8,234,369 | | | | 7,710,426 | |
| Proceeds from shares subscribed – Institutional Class | | | 6,681,659 | | | | 5,598,042 | |
| Dividends reinvested – Investor Class | | | 698,292 | | | | — | |
| Dividends reinvested – Institutional Class | | | 1,181,355 | | | | — | |
| Cost of shares redeemed – Investor Class | | | (7,622,351 | ) | | | (6,158,757 | ) |
| Cost of shares redeemed – Institutional Class | | | (7,693,364 | ) | | | (3,599,017 | ) |
| Net increase in net assets derived | | | | | | | | |
| from capital share transactions | | | 1,479,960 | | | | 3,550,694 | |
| TOTAL INCREASE IN NET ASSETS | | | 7,288,982 | | | | 9,937,293 | |
| | | | | | | | | |
| NET ASSETS: | | | | | | | | |
| Beginning of year | | | 16,250,774 | | | | 6,313,481 | |
| End of year | | $ | 23,539,756 | | | $ | 16,250,774 | |
| | | | | | | | | |
| CHANGES IN SHARES OUTSTANDING: | | | | | | | | |
| Shares sold – Investor Class | | | 394,224 | | | | 521,054 | |
| Shares sold – Institutional Class | | | 331,064 | | | | 329,240 | |
| Shares issued to holders as reinvestment | | | | | | | | |
| of dividends – Investor Class | | | 44,449 | | | | — | |
| Shares issued to holders as reinvestment | | | | | | | | |
| of dividends – Institutional Class | | | 74,066 | | | | — | |
| Shares redeemed – Investor Class | | | (387,313 | ) | | | (435,171 | ) |
| Shares redeemed – Institutional Class | | | (371,343 | ) | | | (252,362 | ) |
| Net increase in shares outstanding | | | 85,147 | | | | 162,761 | |
The accompanying notes are an integral part of these financial statements.
| HENNESSY FUNDS | 1-800-966-4354 | |
Financial Statements
For an Investor Class share outstanding throughout each period
PER SHARE DATA:
Net asset value, beginning of period
Income from investment operations:
Net investment income (loss)(2)
Net realized and unrealized gains (losses) on investments
Total from investment operations
Less distributions:
Dividends from net investment income
Total distributions
Net asset value, end of period
TOTAL RETURN
SUPPLEMENTAL DATA AND RATIOS:
Net assets, end of period (millions)
Ratio of expenses to average net assets:
Before expense reimbursement
After expense reimbursement
Ratio of net investment income (loss) to average net assets:
Before expense reimbursement
After expense reimbursement
Portfolio turnover rate(7)
(1) | The period ended October 31, 2018, consists of 11 months due to the Fund’s fiscal year end change from November 30 to October 31, effective October 26, 2018. |
(2) | Calculated using the average shares outstanding method. |
(3) | Not annualized. |
(4) | Annualized. |
(5) | The Fund had an expense limitation agreement in place through October 25, 2020. |
(6) | Certain service provider expenses were voluntarily waived during the fiscal year. |
(7) | Calculated on the basis of the Fund as a whole. |
The accompanying notes are an integral part of these financial statements.
| FINANCIAL HIGHLIGHTS — INVESTOR CLASS |
| Year Ended October 31, | | | Period Ended | | | Year Ended | |
| | | October 31, | | | November 30, | |
| 2022 | | | 2021 | | | 2020 | | | 2019 | | | 2018(1) | | | 2017 | |
| | | | | | | | | | | | | | | | | |
| $ | 18.31 | | | $ | 8.74 | | | $ | 14.08 | | | $ | 18.32 | | | $ | 19.47 | | | $ | 20.54 | |
| | | | | | | | | | | | | | | | | | | | | | | |
| | | | | | | | | | | | | | | | | | | | | | | |
| | 0.16 | | | | 0.06 | | | | 0.04 | | | | (0.07 | ) | | | (0.20 | ) | | | (0.23 | ) |
| | 7.74 | | | | 9.51 | | | | (5.38 | ) | | | (4.17 | ) | | | (0.95 | ) | | | (0.84 | ) |
| | 7.90 | | | | 9.57 | | | | (5.34 | ) | | | (4.24 | ) | | | (1.15 | ) | | | (1.07 | ) |
| | | | | | | | | | | | | | | | | | | | | | | |
| | | | | | | | | | | | | | | | | | | | | | | |
| | (2.06 | ) | | | — | | | | — | | | | — | | | | — | | | | — | |
| | (2.06 | ) | | | — | | | | — | | | | — | | | | — | | | | — | |
| $ | 24.15 | | | $ | 18.31 | | | $ | 8.74 | | | $ | 14.08 | | | $ | 18.32 | | | $ | 19.47 | |
| | | | | | | | | | | | | | | | | | | | | | | |
| | 49.24 | % | | | 109.50 | % | | | -37.93 | % | | | -23.14 | % | | | -5.91 | %(3) | | | -5.21 | % |
| | | | | | | | | | | | | | | | | | | | | | | |
| | | | | | | | | | | | | | | | | | | | | | | |
| $ | 10.21 | | | $ | 6.80 | | | $ | 2.50 | | | $ | 6.83 | | | $ | 18.16 | | | $ | 22.66 | |
| | | | | | | | | | | | | | | | | | | | | | | |
| | 2.42 | % | | | 2.96 | % | | | 2.59 | % | | | 1.97 | % | | | 1.82 | %(4) | | | 1.87 | % |
| | 2.25 | %(6) | | | 2.74 | %(6) | | | 2.03 | %(5)(6) | | | 1.97 | % | | | 1.82 | %(4) | | | 1.87 | % |
| | | | | | | | | | | | | | | | | | | | | | | |
| | 0.64 | % | | | 0.16 | % | | | (0.18 | )% | | | (0.46 | )% | | | (1.05 | )%(4) | | | (1.21 | )% |
| | 0.81 | % | | | 0.38 | % | | | 0.38 | % | | | (0.46 | )% | | | (1.05 | )%(4) | | | (1.21 | )% |
| | 31 | % | | | 74 | % | | | 73 | % | | | 87 | % | | | 72 | %(3) | | | 84 | % |
The accompanying notes are an integral part of these financial statements.
| HENNESSY FUNDS | 1-800-966-4354 | |
Financial Statements
For an Institutional Class share outstanding throughout each period
PER SHARE DATA:
Net asset value, beginning of period
Income from investment operations:
Net investment income (loss)(2)
Net realized and unrealized gains (losses) on investments
Total from investment operations
Less distributions:
Dividends from net investment income
Total distributions
Net asset value, end of period
TOTAL RETURN
SUPPLEMENTAL DATA AND RATIOS:
Net assets, end of period (millions)
Ratio of expenses to average net assets:
Before expense reimbursement
After expense reimbursement
Ratio of net investment income (loss) to average net assets:
Before expense reimbursement
After expense reimbursement
Portfolio turnover rate(7)
(1) | The period ended October 31, 2018, consists of 11 months due to the Fund’s fiscal year end change from November 30 to October 31, effective October 26, 2018. |
(2) | Calculated using the average shares outstanding method. |
(3) | Not annualized. |
(4) | Annualized. |
(5) | The Fund had an expense limitation agreement in place through October 25, 2020. |
(6) | Certain service provider expenses were voluntarily waived during the fiscal year. |
(7) | Calculated on the basis of the Fund as a whole. |
The accompanying notes are an integral part of these financial statements.
| FINANCIAL HIGHLIGHTS — INSTITUTIONAL CLASS |
| Year Ended October 31, | | | Period Ended | | | Year Ended | |
| | | October 31, | | | November 30, | |
| 2022 | | | 2021 | | | 2020 | | | 2019 | | | 2018(1) | | | 2017 | |
| | | | | | | | | | | | | | | | | |
| $ | 18.60 | | | $ | 8.85 | | | $ | 14.26 | | | $ | 18.50 | | | $ | 19.61 | | | $ | 20.64 | |
| | | | | | | | | | | | | | | | | | | | | | | |
| | | | | | | | | | | | | | | | | | | | | | | |
| | 0.23 | | | | 0.07 | | | | 0.12 | | | | (0.02 | ) | | | (0.15 | ) | | | (0.19 | ) |
| | 7.87 | | | | 9.68 | | | | (5.50 | ) | | | (4.22 | ) | | | (0.96 | ) | | | (0.84 | ) |
| | 8.10 | | | | 9.75 | | | | (5.38 | ) | | | (4.24 | ) | | | (1.11 | ) | | | (1.03 | ) |
| | | | | | | | | | | | | | | | | | | | | | | |
| | | | | | | | | | | | | | | | | | | | | | | |
| | (2.11 | ) | | | — | | | | (0.03 | ) | | | — | | | | — | | | | — | |
| | (2.11 | ) | | | — | | | | (0.03 | ) | | | — | | | | — | | | | — | |
| $ | 24.59 | | | $ | 18.60 | | | $ | 8.85 | | | $ | 14.26 | | | $ | 18.50 | | | $ | 19.61 | |
| | | | | | | | | | | | | | | | | | | | | | | |
| | 49.71 | % | | | 110.17 | % | | | -37.80 | % | | | -22.92 | % | | | -5.66 | %(3) | | | -4.99 | % |
| | | | | | | | | | | | | | | | | | | | | | | |
| | | | | | | | | | | | | | | | | | | | | | | |
| $ | 13.33 | | | $ | 9.45 | | | $ | 3.82 | | | $ | 44.37 | | | $ | 78.81 | | | $ | 122.45 | |
| | | | | | | | | | | | | | | | | | | | | | | |
| | 2.09 | % | | | 2.61 | % | | | 2.01 | % | | | 1.66 | % | | | 1.57 | %(4) | | | 1.62 | % |
| | 1.92 | %(6) | | | 2.39 | %(6) | | | 1.77 | %(5)(6) | | | 1.66 | % | | | 1.57 | %(4) | | | 1.62 | % |
| | | | | | | | | | | | | | | | | | | | | | | |
| | 0.96 | % | | | 0.22 | % | | | 0.79 | % | | | (0.12 | )% | | | (0.79 | )%(4) | | | (0.98 | )% |
| | 1.13 | % | | | 0.44 | % | | | 1.03 | % | | | (0.12 | )% | | | (0.79 | )%(4) | | | (0.98 | )% |
| | 31 | % | | | 74 | % | | | 73 | % | | | 87 | % | | | 72 | %(3) | | | 84 | % |
The accompanying notes are an integral part of these financial statements.
| HENNESSY FUNDS | 1-800-966-4354 | |
Financial Statements
Notes to the Financial Statements October 31, 2022 |
1). ORGANIZATION
The Hennessy Energy Transition Fund (the “Fund”) is a series of Hennessy Funds Trust (the “Trust”), which was organized as a Delaware statutory trust on September 17, 1992. The Fund is an open-end management investment company registered under the Investment Company Act of 1940, as amended. The investment objective of the Fund is to seek total return. The Fund is a diversified fund.
The Fund offers Investor Class and Institutional Class shares. Each class of shares differs principally in its respective 12b-1 distribution and service, shareholder servicing, and sub-transfer agent expenses. There are no sales charges. Each class has identical rights to earnings, assets, and voting privileges, except for class-specific expenses and exclusive rights to vote on matters affecting only one class.
As an investment company, the Fund follows the investment company accounting and reporting guidance of the Financial Accounting Standards Board (“FASB”) Accounting Standard Codification Topic 946 “Financial Services—Investment Companies.”
2). SIGNIFICANT ACCOUNTING POLICIES
The following is a summary of significant accounting policies consistently followed by the Fund in the preparation of the financial statements. These policies conform to U.S. generally accepted accounting principles (“GAAP”).
| a). | Securities Valuation – All investments in securities are valued in accordance with the Fund’s valuation policies and procedures, as described in Note 3. |
| | |
| b). | Federal Income Taxes – The Fund has elected to be taxed as a regulated investment company and intends to distribute substantially all of its taxable income to its shareholders and otherwise comply with the provisions of the Internal Revenue Code of 1986, as amended, applicable to regulated investment companies. As a result, the Fund has made no provision for federal income taxes or excise taxes. Net investment income/loss and realized gains/losses for federal income tax purposes may differ from those reported in the financial statements because of temporary book-basis and tax-basis differences. Temporary differences are primarily the result of the treatment of wash sales for tax reporting purposes and investments in companies organized as partnerships for tax purposes. The Fund recognizes interest and penalties related to income tax benefits, if any, in the Statement of Operations as an income tax expense. Distributions from net realized gains for book purposes may include short-term capital gains, which are included as ordinary income to shareholders for tax purposes. The Fund may utilize equalization accounting for tax purposes and designate earnings and profits, including net realized gains distributed to shareholders on redemption of shares, as part of the dividends paid deduction for income tax purposes. |
| | |
| | Due to inherent differences in the recognition of income, expenses, and realized gains/losses under GAAP and federal income tax regulations, permanent differences between book and tax basis for reporting are identified and appropriately reclassified in the Statement of Assets and Liabilities, as needed. The adjustments for fiscal year 2022 are as follows: |
| | Total | | |
| | Distributable | | |
| | Earnings | Capital Stock | |
| | $701 | $(701) | |
| NOTES TO THE FINANCIAL STATEMENTS |
| c). | Accounting for Uncertainty in Income Taxes – The Fund has accounting policies regarding recognition and measurement of tax positions taken or expected to be taken on a tax return. The tax returns of the Fund for the prior three fiscal years are open for examination. The Fund has reviewed all open tax years in major tax jurisdictions and concluded that there is no impact on the Fund’s net assets and no tax liability resulting from unrecognized tax benefits relating to uncertain income tax positions taken or expected to be taken on a tax return. The Fund’s major tax jurisdictions are U.S. federal and Delaware. |
| | |
| d). | Income and Expenses – Dividend income is recognized on the ex-dividend date or as soon as information is available to the Fund. Interest income, which includes the amortization of premium and accretion of discount, is recognized on an accrual basis. Market discounts, original issue discounts, and market premiums on debt securities are accreted or amortized to interest income over the life of a security with a corresponding increase or decrease, as applicable, in the cost basis of such security using the yield-to-maturity method or, where applicable, the first call date of the security. Other non-cash dividends are recognized as investment income at the fair value of the property received. The Fund is charged for those expenses that are directly attributable to its portfolio, such as advisory, administration, and certain shareholder service fees. Income, expenses (other than expenses attributable to a specific class), and realized and unrealized gains/losses on investments are allocated to each class of shares based on such class’s net assets. Distributions received from the Fund’s investments in master limited partnerships (“MLPs”) generally consist of ordinary income, capital gains, and return of capital. The Fund records investment income on the ex-date of the distributions. For financial statement purposes, the Fund uses return of capital and income estimates to allocate the dividend income received. Such estimates are based on historical information available from the MLPs and other industry sources. These estimates may subsequently be revised based on information received from the MLPs after their tax reporting periods are concluded, as the actual character of these distributions is not known until after the fiscal year end of the Fund. |
| | |
| e). | Distributions to Shareholders – Dividends from net investment income for the Fund, if any, are declared and paid annually, usually in December. Distributions of net realized capital gains, if any, are declared and paid annually, usually in December. |
| | |
| f). | Security Transactions – Investment and shareholder transactions are recorded on the trade date. The Fund determines the realized gain/loss from an investment transaction by comparing the original cost of the security lot sold with the net sale proceeds. Discounts and premiums on securities purchased are accreted or amortized, respectively, over the life of each such security. |
| | |
| g). | Use of Estimates – Preparing financial statements in accordance with GAAP requires management to make estimates and assumptions that affect the reported amounts of assets and liabilities and disclosure of contingent assets and liabilities at the date of the financial statements, as well as the reported change in net assets during the reporting period. Actual results could differ from those estimates. |
| | |
| h). | Share Valuation – The net asset value (“NAV”) per share of the Fund is calculated by dividing (i) the total value of the securities held by the Fund, plus cash and other assets, minus all liabilities (including estimated accrued expenses) by (ii) the total number of Fund shares outstanding, rounded to the nearest $0.01. Fund shares are not priced on days the New York Stock Exchange is closed for trading. The offering and redemption price per share for the Fund is equal to the Fund’s NAV per share. |
| | |
| i). | Partnership Accounting Policy – To the extent the Fund receives distributions from underlying partnerships in which it invests, the Fund records its pro rata share of |
| HENNESSY FUNDS | 1-800-966-4354 | |
| | income/loss and capital gains/losses and accordingly adjusts the cost basis of the underlying partnerships for return of capital. |
| | |
| j). | Illiquid Securities – Pursuant to Rule 22e-4 under the 1940 Act, the Fund has adopted a Liquidity Risk Management Program (the “Liquidity Program”). The Liquidity Program requires, among other things, that the Fund limit its illiquid investments to no more than 15% of its net assets. An illiquid investment is any investment that the Fund reasonably expects cannot be sold or disposed of by the Fund in current market conditions in seven calendar days or less without the sale or disposition significantly changing the market value of the investment. |
| | |
| k). | Recent Accounting Pronouncements and Regulatory Updates – In October 2020, the Securities and Exchange Commission (“SEC”) adopted new regulations governing the use of derivatives by registered investment companies (“Rule 18f-4”). Rule 18f-4 imposes limits on the amount of derivatives a fund can enter into, eliminates the asset segregation framework currently used by funds to comply with Section 18 of the 1940 Act, and requires funds whose use of derivatives is greater than a limited specified amount to establish and maintain a comprehensive derivatives risk management program and appoint a derivatives risk manager. The Fund has adopted procedures in accordance with Rule 18f-4. |
| | |
| | In December 2020, the SEC adopted a new rule providing a framework for fund valuation practices (“Rule 2a-5”). Rule 2a-5 establishes requirements for determining fair value in good faith for purposes of the 1940 Act. Rule 2a-5 permits fund boards to designate certain parties to perform fair value determinations, subject to board oversight and certain other conditions. Rule 2a-5 also defines when market quotations are “readily available” for purposes of the 1940 Act and the threshold for determining whether a fund must fair value a security. In connection with Rule 2a-5, the SEC also adopted related recordkeeping requirements and is rescinding previously issued guidance, including with respect to the role of a board in determining fair value and the accounting and auditing of fund investments. The Fund has adopted procedures in accordance with Rule 2a-5. |
3). SECURITIES VALUATION
The Fund follows its valuation policies and procedures in determining its NAV and, in preparing these financial statements, the fair value accounting standards that establish an authoritative definition of fair value and set out a hierarchy for measuring fair value. These standards require additional disclosures about the various inputs and valuation techniques used to develop the measurements of fair value and a discussion of changes in valuation techniques and related inputs during the period. These inputs are summarized in the three broad levels listed below:
| | Level 1 – | Unadjusted, quoted prices in active markets for identical instruments that the Fund has the ability to access at the date of measurement. |
| | | |
| | Level 2 – | Other significant observable inputs (including, but not limited to, quoted prices in active markets for similar instruments, quoted prices in markets that are not active for identical or similar instruments, and model-derived valuations in which all significant inputs and significant value drivers are observable in active markets, such as interest rates, prepayment speeds, credit risk curves, default rates, and similar data). |
| | | |
| | Level 3 – | Significant unobservable inputs (including the Fund’s own assumptions about what market participants would use to price the asset or liability based on the best available information) when observable inputs are unavailable. |
| NOTES TO THE FINANCIAL STATEMENTS |
The following is a description of the valuation techniques applied to the Fund’s major categories of assets and liabilities on a recurring basis:
| | Equity Securities – Equity securities, including common stocks, preferred stocks, foreign-issued common stocks, exchange-traded funds, closed-end mutual funds, partnerships, rights, MLPs, and real estate investment trusts, that are traded on a securities exchange for which a last-quoted sales price is readily available generally are valued at the last sales price as reported by the primary exchange on which the securities are listed. Securities listed on The Nasdaq Stock Market (“Nasdaq”) generally are valued at the Nasdaq Official Closing Price, which may differ from the last sales price reported. Securities traded on a securities exchange for which a last-quoted sales price is not readily available generally are valued at the mean between the bid and ask prices. To the extent these securities are actively traded and valuation adjustments are not applied, they are classified in Level 1 of the fair value hierarchy. Securities traded on foreign exchanges generally are not valued at the same time the Fund calculates its NAV because most foreign markets close well before such time. The earlier close of most foreign markets gives rise to the possibility that significant events, including broad market moves, may have occurred in the interim. In certain circumstances, it may be determined that a foreign security needs to be fair valued because it appears that the value of the security might have been materially affected by events occurring after the close of the market in which the security is principally traded, but before the time the Fund calculates its NAV, such as by a development that affects an entire market or region (e.g., a weather-related event) or a potentially global development (e.g., a terrorist attack that may be expected to have an effect on investor expectations worldwide). |
| | |
| | Registered Investment Companies – Investments in open-end registered investment companies, commonly referred to as mutual funds, generally are priced at the ending NAV provided by the applicable mutual fund’s service agent and are classified in Level 1 of the fair value hierarchy. |
| | |
| | Debt Securities – Debt securities, including corporate bonds, asset-backed securities, mortgage-backed securities, municipal bonds, U.S. Treasuries, and U.S. government agency issues, are generally valued at market on the basis of valuations furnished by an independent pricing service that utilizes both dealer-supplied valuations and formula-based techniques. The pricing service may consider recently executed transactions in securities of the issuer or comparable issuers, market price quotations (where observable), bond spreads, and fundamental data relating to the issuer. In addition, the model may incorporate observable market data, such as reported sales of similar securities, broker quotes, yields, bids, offers, and reference data. Certain securities are valued primarily using dealer quotations. These securities are generally classified in Level 2 of the fair value hierarchy. |
| | |
| | Short-Term Securities – Short-term equity investments, including money market funds, are valued in the manner specified above for equity securities. Short-term debt investments with an original term to maturity of 60 days or less are valued at amortized cost, which approximates fair market value. If the original term to maturity of a short-term debt investment exceeds 60 days, then the values as of the 61st day prior to maturity are amortized. Amortized cost is not used if its use would be inappropriate due to credit or other impairments of the issuer, in which case the security’s fair value would be determined as described below. Short-term securities are generally classified in Level 1 or Level 2 of the fair value hierarchy depending on the inputs used and market activity levels for specific securities. |
| HENNESSY FUNDS | 1-800-966-4354 | |
The Board of Trustees of the Fund (the “Board”) has adopted fair value pricing procedures that are followed when a price for a security is not readily available or if a significant event has occurred that indicates the closing price of a security no longer represents the true value of that security. Fair value pricing determinations are made in good faith in accordance with these procedures. There are numerous criteria considered in determining a fair value of a security, such as the trading volume of a security and markets, the values of other similar securities, and news events with direct bearing on a security or markets. Fair value pricing results in an estimated price for a security that reflects the amount the Fund might reasonably expect to receive in a current sale. Depending on the relative significance of the valuation inputs, these securities may be classified in either Level 2 or Level 3 of the fair value hierarchy.
The fair value of foreign securities may be determined with the assistance of a pricing service using correlations between the movement of prices of such securities and indices of domestic securities and other appropriate indicators, such as closing market prices of relevant American Depositary Receipts or futures contracts. Using fair value pricing means that the Fund’s NAV reflects the affected portfolio securities’ values as determined by the Board or its designee, pursuant to the fair value pricing procedures adopted by the Board, instead of being determined by the market. Using a fair value pricing methodology to price a foreign security may result in a value that is different from such foreign security’s most recent closing price and from the value used by other investment companies to calculate their NAVs. Such securities are generally classified in Level 2 of the fair value hierarchy. Because the Fund may invest in foreign securities, the value of the Fund’s portfolio securities may change on days when a shareholder is unable to purchase or redeem Fund shares.
The Board has delegated day-to-day valuation matters to the Valuation and Liquidity Committee comprising representatives from Hennessy Advisors, Inc., the Fund’s investment advisor (the “Advisor”). The function of the Valuation and Liquidity Committee, among other things, is to value securities where current and reliable market quotations are not readily available. All actions taken by the Valuation and Liquidity Committee are reviewed by the Board.
The Fund has performed an analysis of all existing investments to determine the significance and character of all inputs to their fair value determinations. Various inputs are used to determine the value of the Fund’s investments. The inputs or methodology used for valuing securities are not necessarily an indication of the risk associated with investing in those securities. Details related to the fair value hierarchy of the Fund’s securities as of October 31, 2022, are included in the Schedule of Investments.
4). INVESTMENT TRANSACTIONS
Purchases and sales of investment securities (excluding government and short-term investments) for the Fund during fiscal year 2022 were $6,172,602 and $6,369,410, respectively.
There were no purchases or sales/maturities of long-term U.S. government securities for the Fund during fiscal year 2022.
5). INVESTMENT ADVISORY FEE AND OTHER TRANSACTIONS WITH AFFILIATES
The Advisor provides the Fund with investment advisory services under an Investment Advisory Agreement. The Advisor furnishes all investment advice, office space, and facilities and most of the personnel needed by the Fund. As compensation for its services, the Advisor is entitled to a monthly fee from the Fund. The fee is based on the average daily net assets of the Fund at an annual rate of 1.25 %. The net investment advisory fees expensed by the Fund during fiscal year 2022 are included in the Statement of Operations.
| NOTES TO THE FINANCIAL STATEMENTS |
Prior to January 31, 2022, the Advisor delegated the day-to-day management of the Fund to a sub-advisor. Effective January 31, 2022, the sub-advisory agreement between BP Capital Fund Advisors, LLC and the Advisor was terminated. The Advisor paid the sub-advisory fees from its own assets, and these fees were not an additional expense of the Fund. From November 1, 2021, through January 31, 2022, the Advisor (not the Fund) paid a sub-advisory fee at the rate of 0.40% of the daily net assets of the Fund.
From October 26, 2018, through October 25, 2020, the Advisor contractually agreed to limit total annual operating expenses to 2.00% of the Fund’s net assets for Investor Class shares and 1.75% of the Fund’s net assets for Institutional Class shares (in each case, excluding all federal, state, and local taxes, interest, brokerage commissions, dividend and interest expenses on short sales, extraordinary items, and acquired fund fees and expenses and other costs incurred in connection with the purchase and sale of securities).
For three years following the date on which expenses were waived or incurred, the Advisor may recoup waived or reimbursed expenses from the Fund if total operating expenses, including such recoupment, does not exceed the expense limitation in effect (i) at the time the Advisor waived or reimbursed such expenses and (ii) at the time the Advisor recoups such expenses. As of October 31, 2022, expenses subject to potential recovery were $22,749 for Investor Class shares and $38,580 for Institutional Class shares, both of which expire in fiscal year 2023. The Advisor did not recoup expenses from the Fund during fiscal year 2022.
The Board has approved a Shareholder Servicing Agreement for Investor Class shares of the Fund, which compensates the Advisor for the non-investment advisory services it provides to the Fund. The Shareholder Servicing Agreement provides for a monthly fee paid to the Advisor at an annual rate of 0.10% of the average daily net assets of the Fund attributable to Investor Class shares. The shareholder service fees expensed by the Fund during fiscal year 2022 are included in the Statement of Operations.
The Fund has adopted a plan pursuant to Rule 12b-1 under the Investment Company Act of 1940, as amended, that authorizes payments in connection with the distribution of Fund shares at an annual rate of up to 0.25% of the Fund’s average daily net assets attributable to Investor Class shares. Even though the authorized rate is up to 0.25%, the Fund is currently only using up to 0.15% of its average daily net assets attributable to Investor Class shares for such purpose. Amounts paid under the plan may be spent on any activities or expenses primarily intended to result in the sale of shares, including, but not limited to, advertising, shareholder account servicing, printing and mailing of prospectuses to other than current shareholders, printing and mailing of sales literature, and compensation for sales and marketing activities or to financial institutions and others, such as dealers and distributors. The distribution fees expensed by the Fund during fiscal year 2022 are included in the Statement of Operations.
The Fund has entered into agreements with various brokers, dealers, and financial intermediaries in connection with the sale of Fund shares. The agreements provide for periodic payments of sub-transfer agent expenses by the Fund to the brokers, dealers, and financial intermediaries for providing certain shareholder maintenance services. These shareholder services include the pre-processing and quality control of new accounts, shareholder correspondence, answering customer inquiries regarding account status, and facilitating shareholder telephone transactions. The sub-transfer agent fees expensed by the Fund during fiscal year 2022 are included in the Statement of Operations.
U.S. Bancorp Fund Services, LLC, d/b/a U.S. Bank Global Fund Services (“Fund Services”) provides the Fund with administrative, accounting, and transfer agent services. As administrator, Fund Services is responsible for activities such as (i) preparing various
| HENNESSY FUNDS | 1-800-966-4354 | |
federal and state regulatory filings, reports, and returns for the Fund, (ii) preparing reports and materials to be supplied to the Board, (iii) monitoring the activities of the Fund’s custodian, transfer agent, and accountants, and (iv) coordinating the preparation and payment of the Fund’s expenses and reviewing the Fund’s expense accruals. U.S. Bank N.A., an affiliate of Fund Services, serves as the Fund’s custodian. The servicing agreements between the Trust, Fund Services, and U.S. Bank N.A. contain a fee schedule that is inclusive of administrative, accounting, custody, and transfer agent fees. The administrative, accounting, custody, and transfer agent fees expensed by the Fund during fiscal year 2022 are included in the Statement of Operations. Fund Services has voluntarily waived all or a portion of its fees for the Fund. The fees voluntarily waived by Fund Services during fiscal year 2022 are included in the Statement of Operations.
Quasar Distributors, LLC, a wholly owned broker-dealer subsidiary of Foreside Financial Group, LLC, acts as the Fund’s principal underwriter in a continuous public offering of Fund shares.
The officers of the Fund are affiliated with the Advisor. With the exception of the Chief Compliance Officer and, for a portion of the fiscal year, the Senior Compliance Officer, such officers receive no compensation from the Fund for serving in their respective roles. The Fund, along with the other funds in the Hennessy Funds family (collectively, the “Hennessy Funds”), makes reimbursement payments on an equal basis to the Advisor for a portion of the salary and benefits associated with the office of the Chief Compliance Officer and, for a portion of the fiscal year, for all of the salary and benefits associated with the office of the Senior Compliance Officer. The compliance fees expensed by the Fund during fiscal year 2022 for reimbursement payments to the Advisor are included in the Statement of Operations.
6). GUARANTEES AND INDEMNIFICATIONS
Under the Hennessy Funds’ organizational documents, their officers and trustees are indemnified by the Hennessy Funds against certain liabilities arising out of the performance of their duties to the Hennessy Funds. Additionally, in the normal course of business, the Hennessy Funds enter into contracts with service providers that contain general indemnification clauses. The Fund’s maximum exposure under these arrangements is unknown as this would involve future claims that may be made against the Fund that have not yet occurred. Currently, the Fund expects the risk of loss to be remote.
7). LINE OF CREDIT
The Fund has an uncommitted line of credit with the other Hennessy Funds in the amount of the lesser of (i) $100,000,000 or (ii) 33.33% of each Hennessy Fund’s net assets, or 30% for the Hennessy Gas Utility Fund, the Hennessy Japan Fund, and the Hennessy Japan Small Cap Fund and 10% for the Hennessy Balanced Fund. The line of credit is intended to provide any necessary short-term financing in connection with shareholder redemptions, subject to certain restrictions. The credit facility is with the Hennessy Funds’ custodian bank, U.S. Bank N.A. Borrowings under this arrangement bear interest at the bank’s prime rate and are secured by all of the Fund’s assets (as to its own borrowings only). During fiscal year 2022, the Fund had an outstanding average daily balance and a weighted average interest rate of $24,148 and 4.48%, respectively. The interest expensed by the Fund during fiscal year 2022 is included in the Statement of Operations. The maximum amount outstanding for the Fund during fiscal year 2022 was $572,000. As of October 31, 2022, the Fund did not have any borrowings outstanding under the line of credit.
| NOTES TO THE FINANCIAL STATEMENTS |
8). FEDERAL TAX INFORMATION
As of October 31, 2022, the components of accumulated earnings (losses) for income tax purposes were as follows:
| | | Investments | |
| Cost of investments for tax purposes | | $ | 15,700,710 | |
| Gross tax unrealized appreciation | | $ | 8,830,273 | |
| Gross tax unrealized depreciation | | | (1,210,881 | ) |
| Net tax unrealized appreciation/(depreciation) | | $ | 7,619,392 | |
| Undistributed ordinary income | | $ | 138,769 | |
| Undistributed long-term capital gains | | | — | |
| Total distributable earnings | | $ | 138,769 | |
| Other accumulated gain/(loss) | | $ | (40,295,077 | ) |
| Total accumulated gain/(loss) | | $ | (32,536,916 | ) |
The difference between book-basis unrealized appreciation/depreciation and tax-basis unrealized appreciation/depreciation (as shown above) is attributable primarily to wash sales and partnership adjustments.
As of October 31, 2022, the Fund had $21,841,207 in unlimited long-term and $18,453,870 in unlimited short-term capital loss carryforwards. During fiscal year 2022, the capital losses utilized by the fund were $1,338,948.
Capital losses sustained in or after fiscal year 2012 can be carried forward indefinitely, but any such loss retains the character of the original loss and must be utilized prior to any loss incurred before fiscal year 2012. As a result of this ordering rule, capital loss carryforwards incurred prior to fiscal year 2012 may be more likely to expire unused. Capital losses sustained prior to fiscal year 2012 can be carried forward for eight years and can be carried forward as short-term capital losses regardless of the character of the original loss.
As of October 31, 2022, the Fund did not defer, on a tax basis, any late-year ordinary losses. Late-year ordinary losses are net ordinary losses incurred after December 31, 2021, but within the taxable year, that are deemed to arise on the first day of the Fund’s next taxable year.
During fiscal years 2022 and 2021, the tax character of distributions paid by the Fund was as follows:
| | | Year Ended | | | Year Ended | |
| | | October 31, 2022 | | | October 31, 2021 | |
Ordinary income(1) | | $ | 1,939,323 | | | $ | — | |
| Long-term capital gains | | | — | | | | — | |
| Total distributions | | $ | 1,939,323 | | | $ | — | |
(1) Ordinary income includes short-term capital gains.
9). MARKET DISRUPTION AND GEOPOLITICAL RISKS
Certain local, regional, or global events such as wars, terrorism, pandemics or other public health mattes, and other geopolitical events could have a significant impact on securities markets generally or individual securities or instruments. For example, following Russia’s invasion of Ukraine, the President of the United States signed an Executive Order in February 2022 prohibiting U.S. persons from entering transactions with the Central Bank of Russia. Similarly, in June 2021, the President of the United States signed an Executive
| HENNESSY FUNDS | 1-800-966-4354 | |
Order affirming and expanding the U.S. policy prohibiting U.S. persons from purchasing or investing in publicly-traded securities of companies identified by the U.S. Government as “Chinese Military-Industrial Complex Companies.” The list of such companies can change from time to time and the Advisor may be forced to hold securities it desires to sell or to sell securities it desires to buy, or the Advisor may not be able to participate in an investment it otherwise believes is attractive. The occurrence and duration of these types of events are hard to predict and could adversely affect the Fund’s performance.
10). EVENTS SUBSEQUENT TO YEAR END
Management has evaluated the Fund’s related events and transactions that occurred subsequent to October 31, 2022, through the date of issuance of the Fund’s financial statements. Management has determined that there were no subsequent events requiring recognition or disclosure in the financial statements.
| NOTES/REPORT OF INDEPENDENT REGISTERED PUBLIC ACCOUNTING FIRM |
Report of Independent Registered Public
Accounting Firm
To the Board of Trustees of Hennessy Funds Trust
and the shareholders of the Hennessy Energy Transition Fund
Novato, CA
Opinion on the Financial Statements
We have audited the accompanying statement of assets and liabilities of the Hennessy Energy Transition Fund (the “Fund”), a series of Hennessy Funds Trust, including the schedule of investments, as of October 31, 2022, the related statement of operations for the year then ended, the statements of changes in net assets for each of the two years in the period then ended, the financial highlights for each of the three years in the period then ended, for the eleven months ended October 31, 2018, and each of the two years in the period ended November 30, 2017, and the related notes (collectively referred to as the “financial statements”). In our opinion, the financial statements present fairly, in all material respects, the financial position of the Fund as of October 31, 2022, the results of its operations for the year then ended, the changes in its net assets for each of the two years in the period then ended and the financial highlights for each of the three years in the period then ended, for the eleven months ended October 31, 2018, and each of the two years in the period ended November 30, 2017, in conformity with accounting principles generally accepted in the United States of America.
Basis for Opinion
These financial statements are the responsibility of the Fund’s management. Our responsibility is to express an opinion on the Fund’s financial statements based on our audits. We are a public accounting firm registered with the Public Company Accounting Oversight Board (United States) (“PCAOB”) and are required to be independent with respect to the Fund in accordance with the U.S. federal securities laws and the applicable rules and regulations of the Securities and Exchange Commission and the PCAOB. We have served as the auditor of one or more of the funds in the Trust since 2002.
We conducted our audits in accordance with the standards of the PCAOB. Those standards require that we plan and perform the audit to obtain reasonable assurance about whether the financial statements are free of material misstatement, whether due to error or fraud. The Fund is not required to have, nor were we engaged to perform, an audit of its internal control over financial reporting. As part of our audits we are required to obtain an understanding of internal control over financial reporting, but not for the purpose of expressing an opinion on the effectiveness of the Fund’s internal control over financial reporting. Accordingly, we express no such opinion.
Our audits included performing procedures to assess the risks of material misstatement of the financial statements, whether due to error or fraud, and performing procedures that respond to those risks. Such procedures included examining, on a test basis, evidence regarding the amounts and disclosures in the financial statements. Our audits also included evaluating the accounting principles used and significant estimates made by management, as well as evaluating the overall presentation of the financial statements. Our procedures included confirmation of securities owned as of October 31, 2022, by correspondence with the custodian. We believe that our audits provide a reasonable basis for our opinion.
| |  |
| | TAIT, WELLER & BAKER LLP |
Philadelphia, Pennsylvania
December 22, 2022
| HENNESSY FUNDS | 1-800-966-4354 | |
Trustees and Officers of the Fund (Unaudited)
The business and affairs of the Funds are managed under the direction of the Board of Trustees of the Trust, and the Board of Trustees elects the officers of the Trust. From time to time, the Board of Trustees also has appointed advisers to the Board of Trustees (“Advisers”) with the intention of having qualified individuals serve in an advisory capacity to garner experience in the mutual fund and asset management industry and be considered as potential Trustees in the future. There are currently two Advisers, Brian Alexander and Doug Franklin. As Advisers, Mr. Alexander and Mr. Franklin attend meetings of the Board of Trustees and act as non-voting participants. Information pertaining to the Trustees, Advisers, and the officers of the Trust is set forth below. The Trustees and officers serve until their successors are duly elected and qualified or until their earlier death, resignation, or removal. Each Trustee oversees all 16 Hennessy Funds. Unless otherwise indicated, the address of all persons listed below is 7250 Redwood Boulevard, Suite 200, Novato, CA 94945. The Fund’s Statement of Additional Information includes more information about the persons listed below and is available without charge by calling 1-800-966-4354 or by visiting www.hennessyfunds.com.
| | | | Other |
| | | | Directorships |
| | | | Held Outside |
| Name, Age, | | | of Fund |
| and Position Held | Start Date | Principal Occupation(s) | Complex During |
with the Trust | of Service | During Past Five Years | Past Five Years |
| Disinterested Trustees and Advisers | | | |
| | | | |
| J. Dennis DeSousa | January 1996 | Mr. DeSousa is a real estate investor. | None. |
| 86 | | | |
| Trustee | | | |
| | | | |
| Robert T. Doyle | January 1996 | Mr. Doyle is retired. He served as the | None. |
| 75 | | Sheriff of Marin County, California | |
| Trustee | | from 1996 – June 2022. | |
| | | | |
| Claire Garvie | December 2015 | Ms. Garvie is a founder of Kiosk and | None. |
| 48 | as an Adviser | has served as its Chief Operating | |
| Trustee | to the Board | Officer since 2004. Kiosk is a full- | |
| | and | service marketing agency with | |
| | December 2021 | offices in the San Francisco Bay Area | |
| | as a Trustee | and Liverpool, UK and staff across | |
| | | nine states in the U.S. | |
| | | | |
| Gerald P. Richardson | May 2004 | Mr. Richardson is an independent | None. |
| 77 | | consultant in the securities industry. | |
| Trustee | | | |
| TRUSTEES AND OFFICERS OF THE FUND |
| | | | Other |
| | | | Directorships |
| | | | Held Outside |
| Name, Age, | | | of Fund |
| and Position Held | Start Date | Principal Occupation(s) | Complex During |
with the Trust | of Service | During Past Five Years | Past Five Years |
| Brian Alexander | March 2015 | Mr. Alexander has worked for the | None. |
| 41 | | Sutter Health organization since | |
| Adviser to the Board | | 2011 in various positions. He has | |
| | | served as the Chief Executive Officer | |
| | | of the North Valley Hospital Area | |
| | | since 2021. From 2018 to 2021, he | |
| | | served as the Chief Executive Officer | |
| | | of Sutter Roseville Medical Center. | |
| | | From 2016 through 2018, he served | |
| | | as the Vice President of Strategy for | |
| | | the Sutter Health Valley Area, which | |
| | | includes 11 hospitals, 13 ambulatory | |
| | | surgery centers, 16,000 employees, | |
| | | and 1,900 physicians. | |
| | | | |
| Doug Franklin | March 2016 | Mr. Franklin is a retired insurance | None. |
| 58 | | industry executive. From 1987 | |
| Adviser to the Board | | through 2015, he was employed by | |
| | | the Allianz-Fireman’s Fund Insurance | |
| | | Company in various positions, | |
| | | including as its Chief Actuary and | |
| | | Chief Risk Officer. | |
| | | | |
Interested Trustee(1) | | | |
| | | | |
| Neil J. Hennessy | January 1996 as | Mr. Hennessy has been employed | Hennessy |
| 66 | a Trustee and | by Hennessy Advisors, Inc. since | Advisors, Inc. |
| Chairman of the Board, | June 2008 as | 1989 and currently serves as its | |
| Chief Market Strategist, | an officer | Chairman and Chief Executive Officer. | |
| Portfolio Manager, | | | |
| and President | | | |
| | | | |
| Name, Age, | | | |
| and Position Held | Start Date | Principal Occupation(s) | |
with the Trust | of Service | During Past Five Years | |
| Officers | | | |
| | | | |
| Teresa M. Nilsen | January 1996 | Ms. Nilsen has been employed by Hennessy Advisors, Inc. | |
| 56 | | since 1989 and currently serves as its President, Chief | |
| Executive Vice President | | Operating Officer, and Secretary. | |
| and Treasurer | | | |
| | | | |
| Daniel B. Steadman | March 2000 | Mr. Steadman has been employed by Hennessy Advisors, Inc. | |
| 66 | | since 2000 and currently serves as its Executive Vice President. | |
| Executive Vice President’ | | | |
| and Secretary | | | |
| | | | |
| Brian Carlson | December 2013 | Mr. Carlson has been employed by Hennessy Advisors, Inc. | |
| 50 | | since December 2013 and currently serves as its Chief | |
| Senior Vice President | | Compliance Officer and Senior Vice President. | |
| and Head of Distribution | | | |
| HENNESSY FUNDS | 1-800-966-4354 | |
| Name, Age, | | |
| and Position Held | Start Date | Principal Occupation(s) |
with the Trust | of Service | During Past Five Years |
Jennifer Cheskiewicz(2) | June 2013 | Ms. Cheskiewicz has been employed by Hennessy Advisors, Inc. |
| 45 | | as its General Counsel since June 2013. |
| Senior Vice President and | | |
| Chief Compliance Officer | | |
| | | |
David Ellison(3) | October 2012 | Mr. Ellison has been employed by Hennessy Advisors, Inc. since |
| 64 | | October 2012. He has served as a Portfolio Manager of the |
| Senior Vice President | | Hennessy Large Cap Financial Fund and the Hennessy Small |
| and Portfolio Manager | | Cap Financial Fund since their inception. Mr. Ellison also served |
| | | as a Portfolio Manager of the Hennessy Technology Fund from |
| | | its inception until February 2017. Mr. Ellison served as Director, |
| | | CIO, and President of FBR Fund Advisers, Inc. from December |
| | | 1999 to October 2012. |
| | | |
Ryan Kelley(4) | March 2013 | Mr. Kelley has been employed by Hennessy Advisors, Inc. since |
| 50 | | October 2012. He has served as Chief Investment Officer of the |
| Chief Investment Officer, | | Hennessy Funds since March 2021 and has served as a Portfolio |
| Senior Vice President, | | Manager of the Hennessy Gas Utility Fund, the Hennessy Large |
| and Portfolio Manager | | Cap Financial Fund, and the Hennessy Small Cap Financial Fund |
| | | since October 2014. Mr. Kelley served as Co-Portfolio Manager |
| | | of these same funds from March 2013 through September |
| | | 2014 and as a Portfolio Analyst for the Hennessy Funds from |
| | | October 2012 through February 2013. He has also served as a |
| | | Portfolio Manager of the Hennessy Cornerstone Growth Fund, |
| | | the Hennessy Cornerstone Mid Cap 30 Fund, the Hennessy |
| | | Cornerstone Large Growth Fund, and the Hennessy |
| | | Cornerstone Value Fund since February 2017 and as a Portfolio |
| | | Manager of the Hennessy Total Return Fund, the Hennessy |
| | | Balanced Fund, and the Hennessy Technology Fund since May |
| | | 2018. He served as Co-Portfolio Manager of the Hennessy |
| | | Technology Fund from February 2017 until May 2018. Mr. Kelley |
| | | served as Portfolio Manager of FBR Fund Advisers, Inc. from |
| | | January 2008 to October 2012. |
| | | |
L. Joshua Wein(4) | September 2018 | Mr. Wein has been employed by Hennessy Advisors, Inc. since |
| 49 | | 2018. He has served as Co-Portfolio Manager of the Hennessy |
| Vice President and | | Cornerstone Growth Fund, the Hennessy Cornerstone |
| Co-Portfolio Manager | | Mid Cap 30 Fund, the Hennessy Cornerstone Large Growth |
| | | Fund, the Hennessy Cornerstone Value Fund, Hennessy Total |
| | | Return Fund, the Hennessy Balanced Fund, the Hennessy Gas |
| | | Utility Fund, and the Hennessy Technology Fund since February |
| | | 2019. He served as a Senior Analyst of these same funds from |
| | | September 2018 through February 2019. Mr. Wein served as |
| | | Director of Alternative Investments and Co-Portfolio Manager |
| | | at Sterling Capital Management from 2008 to 2018. |
_______________
(1) | Mr. Hennessy is considered an “interested person,” as defined in the Investment Company Act of 1940, as amended, because he is an officer of the Trust. |
(2) | The address of this officer is 4800 Bee Caves Road, Suite 100, Austin, TX 78746. |
(3) | The address of this officer is 101 Federal Street, Suite 1615B, Boston, MA 02110. |
(4) | The address of this officer is 1340 Environ Way, Chapel Hill, NC 27517. |
| TRUSTEES AND OFFICERS OF THE FUND |
(This Page Intentionally Left Blank.)
| HENNESSY FUNDS | 1-800-966-4354 | |
Expense Example (Unaudited)
October 31, 2022
As a shareholder of the Fund, you incur ongoing costs, including management fees, service fees, and other Fund expenses. This Example is intended to help you understand your ongoing costs (in dollars) of investing in the Fund and to compare these costs with the ongoing costs of investing in other mutual funds. The Example is based on an investment of $1,000 invested at the beginning of the period and held for the entire period from May 1, 2022, through October 31, 2022.
Actual Expenses
In the table below, the first line under each of the “Investor Class” and “Institutional Class” headings provides information about actual account values and actual expenses for each share class. You may use this information, together with the amount you invested, to estimate the expenses that you paid over the period. Simply divide your account value by $1,000 (for example, an $8,600 account value divided by $1,000 = 8.6), then multiply the result by the number in the first line under the heading “Expenses Paid During Period” to estimate the expenses you paid on your account during this period. Although the Fund charges no sales loads or transaction fees, you will be assessed fees for outgoing wire transfers, returned checks, and stop payment orders at prevailing rates charged by U.S. Bank Global Fund Services, the Fund’s transfer agent. If you request that a redemption be made by wire transfer, the Fund’s transfer agent charges a $15 fee. IRAs are charged a $15 annual maintenance fee (up to $30 maximum per shareholder for shareholders with multiple IRAs). The examples below include, but are not limited to, management, shareholder servicing, accounting, custody, and transfer agent fees. However, the examples below do not include portfolio trading commissions and related expenses.
Hypothetical Example for Comparison Purposes
In the table below, the second line under each of the “Investor Class” and “Institutional Class” headings provides information about hypothetical account values and hypothetical expenses based on the Fund’s actual expense ratio for each share class and an assumed rate of return of 5% per year before expenses, which is not the Fund’s actual return for such share class. The hypothetical account values and expenses may not be used to estimate the actual ending account balance or expenses you paid for the period. You may use this information to compare the ongoing costs of investing in the Fund and other funds. To do so, compare these 5% hypothetical examples with the 5% hypothetical examples that appear in the shareholder reports of the other funds. Please note that the expenses shown in the table are meant to highlight your ongoing costs only. Therefore, the second lines under “Investor Class” and “Institutional Class” are useful in comparing ongoing costs only and will not help you determine the relative total costs of owning different funds.
| | | | Expenses Paid |
| | Beginning | Ending | During Period(1) |
| | Account Value | Account Value | May 1, 2022 – |
| | May 1, 2022 | October 31, 2022 | October 31, 2022 |
| Investor Class | | | |
| Actual | $1,000.00 | $1,158.80 | $12.24 |
| Hypothetical (5% return before expenses) | $1,000.00 | $1,013.86 | $11.42 |
| | | | |
| Institutional Class | | | |
| Actual | $1,000.00 | $1,161.00 | $10.35 |
| Hypothetical (5% return before expenses) | $1,000.00 | $1,015.63 | $ 9.65 |
(1) | Expenses are equal to the Fund’s annualized expense ratio of 2.25% for Investor Class shares or 1.90% for Institutional Class shares, as applicable, multiplied by the average account value over the period, multiplied by 184/365 days (to reflect the half-year period). |
| HENNESSY FUNDS | 1-800-966-4354 | |
How to Obtain a Copy of the Fund’s Proxy
Voting Policy and Proxy Voting Records
A description of the policies and procedures the Fund uses to determine how to vote proxies relating to portfolio securities is available without charge (1) by calling 1-800-966-4354, (2) on the Hennessy Funds’ website at www.hennessyfunds.com/proxy-voting/voting-policy, or (3) on the U.S. Securities and Exchange Commission’s (the “SEC”) website at www.sec.gov. The Fund’s proxy voting record is available without charge on both the Hennessy Funds’ website at www.hennessyfunds.com/proxy-voting/voting-record and the SEC’s website at www.sec.gov no later than August 31 for the prior 12 months ending June 30.
Availability of Quarterly Portfolio Schedule
The Fund files a complete schedule of portfolio holdings with the SEC for the first and third quarters of each fiscal year as an exhibit to its reports on Form N-PORT. The Fund’s Form N-PORT reports are available on the SEC’s website at www.sec.gov or on request by calling 1-800-966-4354.
Federal Tax Distribution Information (Unaudited)
For fiscal year 2022, certain dividends paid by the Fund may be subject to a maximum tax rate of 23.8%, as provided for by the Jobs and Growth Tax Relief Reconciliation Act of 2003. The percentage of dividends declared from ordinary income designated as qualified dividend income was 15.91%.
For corporate shareholders, the percent of ordinary income distributions that qualified for the corporate dividends received deduction for fiscal year 2022 was 9.09%.
The percentage of taxable ordinary income distributions that were designated as short-term capital gain distributions under Section 871(k)(2)(C) of the Internal Revenue Code of 1986, as amended, for the Fund was 0.00%.
Important Notice Regarding Delivery
of Shareholder Documents
To help keep the Fund’s costs as low as possible, we generally deliver a single copy of shareholder reports, proxy statements, and prospectuses to shareholders who share an address and have the same last name. This process does not apply to account statements. You may request an individual copy of a shareholder document at any time. If you would like to receive separate mailings of shareholder documents, please call U.S. Bank Global Fund Services at 1-800-261-6950 or 1-414-765-4124, and individual delivery will begin within 30 days of your request. If your account is held through a financial institution or other intermediary, please contact such intermediary directly to request individual delivery.
Electronic Delivery
As permitted by SEC regulations, the Fund’s shareholder reports are made available on a website, and unless you sign for eDelivery or elect to receive paper copies as detailed below, you will be notified by mail each time a report is posted and provided with a website link to access the report.
The Fund also offers shareholders the option to receive all notices, account statements, prospectuses, tax forms, and shareholder reports electronically. To sign up for eDelivery or change your delivery preference, please visit www.hennessyfunds.com/account.
To elect to receive paper copies of all future reports free of charge, please call U.S. Bank Global Fund Services at 800-261-6950 or 414-765-4124.
Subscribe to receive our team’s unique market and sector insights delivered to your inbox
www.hennessyfunds.com/subscribe
Follow us on social media
| PROXY VOTING — PRIVACY POLICY |
Liquidity Risk Management Program
In accordance with Rule 22e-4 under the Investment Company Act of 1940, as amended (the “Liquidity Rule”), we have adopted and implemented a liquidity risk management program (the “Liquidity Program”). The purpose of the Liquidity Program is to assess and manage the Fund’s liquidity risk, which is the risk that the Fund would not be able to meet requests to redeem Fund shares without significant dilution of the remaining shareholders’ interests in the Fund. The Board of Trustees of the Fund (the “Board”) designated a committee comprising representatives of Hennessy Advisors, Inc., the investment adviser to the Fund, as the administrator of the Liquidity Program (the “Program Administrator”).
The Program Administrator provided a written report regarding the Liquidity Program to the Board in advance of its meeting on June 1, 2022. The report covered the period from June 1, 2021, through May 31, 2022. The report addressed the operation of the Liquidity Program, assessed the adequacy and effectiveness of its implementation, and described any material changes to the Liquidity Program during the review period. The Trust’s chief compliance officer presented the report to the Board at the meeting and provided additional information regarding the Liquidity Program. The Board reviewed the Liquidity Program and considered, among other items, the following:
| | 1. | The Program Administrator reviewed daily historical net redemption activity during the review period and during prior periods with higher-than-average redemption activity and concluded that the Fund has historically been able to meet requests to redeem Fund shares without significant dilution to the Fund’s remaining shareholders, and the Program Administrator expects the Fund to be able to continue to do so in the future during both normal and reasonably foreseeable stressed conditions. |
| | | |
| | 2. | The Fund primarily holds assets that are highly liquid investments and is therefore not required to establish a highly liquid investment minimum for the Fund or adopt policies and procedures for responding to a highly liquid investment minimum shortfall. |
| | | |
| | 3. | The Program Administrator did not make any material changes to the Liquidity Program during the review period and was not recommending any changes to the Liquidity Program or the model inputs used to determine the liquidity classification of each security held by the Fund. |
| | | |
| | 4. | The Program Administrator concluded that the Liquidity Program was reasonably designed to assess and manage the Fund’s liquidity risk, complies with the requirements of the Liquidity Rule, and was operating as intended during the review period. |
Privacy Policy
We collect the following personal information about you:
| | 1. | Information we receive from you in applications or other forms, correspondence, or conversations, including, but not limited to, your name, address, phone number, social security number, assets, income, and date of birth; |
| | | |
| | 2. | Information about your transactions with us, our affiliates, or others, including, but not limited to, your account number and balance, payments history, parties to transactions, cost basis information, and other financial information; and |
| HENNESSY FUNDS | 1-800-966-4354 | |
| | 3. | Other personal information we collect from various sources, even if you have not entered into a prior transaction with us, including the following: |
| | | • | Name, alias, address, unique personal identifier, online identifier, IP address, email address, telephone number, account name, and other similar identifiers; |
| | | | |
| | | • | Age and marital status; |
| | | | |
| | | • | Commercial information, including records of products purchased; |
| | | | |
| | | • | Browsing history, search history, and information on interaction with our website; |
| | | | |
| | | • | Geolocation data; |
| | | | |
| | | • | Employment and employment history, educational history, financial information, and purchasing and consuming histories or tendencies; and |
| | | | |
| | | • | Inferences drawn from the above-listed information to create a profile about your preferences, characteristics, predispositions, and behavior. |
We collect this information directly from you, indirectly in the course of providing services to you, directly and indirectly from your activity on our website, from broker dealers, marketing agencies, and other third parties that interact with us in connection with the services we perform and products we offer, and from anonymized and aggregated consumer information.
We use this information to fulfill the reason you provided the information to us, to provide you with other relevant products that you request from us, to provide you with information about products that may interest you, to improve our website or present our website’s contents to you, and as otherwise described to you when collecting your personal information.
We do not disclose any personal information to unaffiliated third parties, except as permitted by law. We may disclose your personal information to our affiliates, vendors, and service providers for a business purpose. For example, we are permitted by law to disclose all of the information we collect, as described above, to our transfer agent to process your transactions. When disclosing your personal information to third parties, we enter into a contract with each third party describing the purpose of such disclosure and requiring that such personal information be kept confidential and not used for any purpose except to perform the services contracted or respond to regulatory or law enforcement requests.
Furthermore, we restrict access to your personal information to those persons who require such information to provide products or services to you. As a result, we do not provide a means for opting out of our limited sharing of your information. We maintain physical, electronic, and procedural safeguards that comply with federal standards to guard your personal information.
If you hold shares of the Funds through a financial intermediary, including, but not limited to, a broker-dealer, bank, or trust company, the privacy policy of your financial intermediary governs how your personal information is shared with unaffiliated third parties.
Supplemental Privacy Notice for Residents of California
The California Consumer Privacy Act of 2018 (the “CCPA”) provides you, as a California resident, with certain additional rights relating to your personal information.
Under the CCPA, you have the right to request that we disclose to you the categories of personal information we have collected about you over the past 12 months, the categories of sources of such information, our business purpose for collecting the information, the categories of third parties, if any, with whom we shared the information, and the specific information we have collected about you. You also have the right to request that we delete any of your personal information, and, unless an exception applies, we will delete such information upon receiving and confirming your request. To make a request, call us at 1-800-966-4354, email us at privacy@hennessyfunds.com, or go to www.hennessyfunds.com/contact. We will not discriminate against you for exercising your rights under the CCPA. Further, we will not collect additional categories of your personal information or use the personal information we collected for materially different, unrelated, or incompatible purposes without providing you notice.
| HENNESSY FUNDS | 1-800-966-4354 | |
For information, questions, or assistance, please call
The Hennessy Funds
1-800-966-4354 or 1-415-899-1555
INVESTMENT ADVISOR
Hennessy Advisors, Inc.
7250 Redwood Boulevard, Suite 200
Novato, California 94945
ADMINISTRATOR,
TRANSFER AGENT,
DIVIDEND PAYING AGENT, &
SHAREHOLDER SERVICING AGENT
U.S. Bancorp Fund Services, LLC
d/b/a U.S. Bank Global Fund Services
P.O. Box 701
Milwaukee, Wisconsin 53201-0701
CUSTODIAN
U.S. Bank N.A.
Custody Operations
1555 North River Center Drive, Suite 302
Milwaukee, Wisconsin 53212
TRUSTEES
Neil J. Hennessy
Robert T. Doyle
J. Dennis DeSousa
Claire Garvie
Gerald P. Richardson
COUNSEL
Foley & Lardner LLP
777 East Wisconsin Avenue
Milwaukee, Wisconsin 53202-5306
INDEPENDENT REGISTERED
PUBLIC ACCOUNTING FIRM
Tait, Weller & Baker LLP
Two Liberty Place
50 South 16th Street, Suite 2900
Philadelphia, Pennsylvania 19102-2529
DISTRIBUTOR
Quasar Distributors, LLC
111 East Kilbourn Avenue, Suite 1250
Milwaukee, Wisconsin 53202
www.hennessyfunds.com | 800-966-4354
This report has been prepared for shareholders and may be distributed to
others only if preceded or accompanied by a current prospectus.

ANNUAL REPORT
OCTOBER 31, 2022
HENNESSY MIDSTREAM FUND
Investor Class HMSFX
Institutional Class HMSIX
www.hennessyfunds.com | 1-800-966-4354
(This Page Intentionally Left Blank.)
Contents
| Letter to Shareholders | | 2 |
| Performance Overview | | 6 |
| Financial Statements | | |
| Schedule of Investments | | 10 |
| Statement of Assets and Liabilities | | 13 |
| Statement of Operations | | 14 |
| Statements of Changes in Net Assets | | 15 |
| Financial Highlights | | 16 |
| Notes to the Financial Statements | | 20 |
| Report of Independent Registered Public Accounting Firm | | 30 |
| Trustees and Officers of the Fund | | 31 |
| Expense Example | | 34 |
| Proxy Voting Policy and Proxy Voting Records | | 36 |
| Availability of Quarterly Portfolio Schedule | | 36 |
| Important Notice Regarding Delivery of Shareholder Documents | | 36 |
| Electronic Delivery | | 36 |
| Liquidity Risk Management Program | | 37 |
| Privacy Policy | | 37 |
| HENNESSY FUNDS | 1-800-966-4354 | |
December 2022
Dear Hennessy Funds Shareholder:
What a year it has been. By the close of the second trading day of 2022, we witnessed new all-time highs in both the S&P 500® Index and the Dow Jones Industrial Average, while the Nasdaq Composite Index hit its all-time high in November 2021. The market’s triumph was short lived, however. By the last day of our fiscal year on October 31, 2022, all three major indices were down significantly, with bleak year-to-date total returns of -8.42%, -17.70%, and -29.32% for the Dow, the S&P 500, and the Nasdaq, respectively. After almost 13 years of incredible resilience following the Financial Crisis of 2008, the equity markets have been shaken by stinging inflation, rapidly rising interest rates, soaring energy costs, and slowing economic growth teetering on recession. While many investors would like to forget 2022, we prefer to maintain perspective in this market downturn.
Time, time, time…. is on my side, yes, it is!
-Rolling Stones, 1964
We believe time is on our side… when it comes to investing. Experiencing negative market movements on any given day can seem disappointing. Downdrafts lasting a month can feel relentless. Almost a full year of negative returns with little respite along the way? That is downright painful. However, equities generally trend up and to the right. Over the past 100 calendar years, the Dow had an average annual total return of 10.25%. While we admit that long-term returns like these make it easy to be a “consummate bull,” market bulls have been right over the long-term. Yet over shorter periods, market returns can be “choppy.”
Looking at the chart below depicting annual total returns of the Dow Jones Industrial Average from 1950 to 2021, we see how volatile the market can be on an annual basis. Investors experienced 16 years of negative returns during this time, the most painful being -31.93% in 2008.
Time is what smooths out choppy markets. When we extend our investing intervals, and stop focusing on annual returns, the ups and downs feel less and less – and appear less and less. The two charts below depict the three-year and five-year rolling average total returns of the Dow over the same time period as the chart above. Each chart shows decreased volatility, with lower peaks and higher troughs, even though the charts show the same cumulative return of the Dow over the past 71 full calendar years.
When we extend our chart out to ten-year rolling averages, we can clearly see how investing over the long-term can make an investor bullish. In the past 71 years, there has never been a negative 10-year rolling average total return of the Dow. Never. The worst ten-year rolling average total return was a positive 0.29%, from 1965 to 1974, a period including the Great Inflation of the 1970s marked by dismal total returns of -13.28% in 1973 and -23.58% in 1974. The ten-year period from 2000 to 2009, which included the Financial Crisis of 2008, produced a positive average annual total return of 1.31%. Note that in the chart below, the line never crosses below zero.
| HENNESSY FUNDS | 1-800-966-4354 | |
When it comes to investing, time, time, time… is on our side, yes, it is! This is why we invest for the long term at Hennessy, focusing on fundamentals, valuations, and strong businesses, ever mindful of downside risk.
Value investing proved its worth this year, and many of our Funds did as well. The Russell 1000® Value Index was only down -7.00% during our fiscal year ended October 31, 2022, trouncing the Russell 1000® Growth Index’s total return of -24.60%. In addition, most of our Funds outperformed the broader market as well as their benchmarks. During the twelve months ended October 31, 2022, the Dow, the S&P 500, and the Nasdaq dropped -6.74%, -14.61%, and -28.56%, respectively, on a total return basis. During this time period when these three major indices saw significant declines, we were pleased that seven of our 16 Funds posted positive total returns, 11 of our 14 domestic Funds outperformed the S&P 500, and over two-thirds of our actively managed, domestic funds outperformed their primary benchmarks.
Top performers of the year included three of our Funds focused on the Energy and Utilities sectors. These sectors have benefitted from the rising cost of energy, as well as an increase in demand that has outpaced growth in supply. The Hennessy Energy Transition Fund, the Hennessy Midstream Fund, and the Hennessy Gas Utility Fund performed exceptionally well with positive total returns of 49.24%, 24.03%, and 10.14%, respectively, during the twelve-month period ended October 31, 2022. On a different note, our two international funds continue to be adversely affected by softening economies in Asia, rising interest rates, and growth to value rotation. The Hennessy Japan Fund and the Hennessy Japan Small Cap Fund experienced negative total returns of -37.86% and -27.35%, respectively, during our fiscal year.
Notwithstanding a difficult market environment over the last twelve months, we believe that the outlook for U.S. stocks remains positive. We continue to believe that equities are attractive from a valuation standpoint, even as interest rates rise. We believe that the prospect of slower economic growth may dampen inflationary pressures. While the Federal Reserve has raised rates several times in calendar 2022, we believe tempered inflation will allow the potential for the Federal Reserve to take a more neutral stance toward future rate hikes. We remain bullish on equities long term. The unemployment rate is near record lows, there are elevated levels of cash on the balance sheets of U.S. companies, and there is the prospect of a more dovish Federal Reserve in 2023. While
volatility and uncertainty may continue to impact the markets in the short term, we encourage investors to stay the course, maintain a diversified portfolio, and keep a long-term perspective.
We thank you for your continued interest in our Funds, and we are grateful for your trust. While we always prefer to post only positive returns for our shareholders, we are pleased that many of our Funds held up better than the broader market during this challenging year. If you have any questions or would like to speak with us, please call us directly at (800) 966-4354.
Best regards,
| |
| |
| |
|
| Ryan C. Kelley, CFA |
| Chief Investment Officer, |
| Senior Vice President, and Portfolio Manager |
Past performance does not guarantee future results.
Mutual fund investing involves risk. Principal loss is possible.
Opinions expressed are those of Ryan C. Kelley and are subject to change, are not guaranteed, and should not be considered investment advice.
The Dow Jones Industrial Average and S&P 500® Index are commonly used to measure the performance of U.S. stocks. The Nasdaq Composite Index comprises all common stocks listed on The Nasdaq Stock Market and is commonly used to measure the performance of technology-related stocks. The indices are used herein for comparative purposes in accordance with SEC regulations. One cannot invest directly in an index. All returns are shown on a total return basis.
| HENNESSY FUNDS | 1-800-966-4354 | |
Performance Overview (Unaudited)
CHANGE IN VALUE OF $10,000 INVESTMENT
This graph illustrates the performance of an initial investment of $10,000 made in the Fund on its inception date and assumes the reinvestment of dividends and capital gains.
AVERAGE ANNUAL TOTAL RETURN FOR PERIODS ENDED OCTOBER 31, 2022
| | One | Five | Since Inception |
| | Year | Years | (12/31/13) |
| Hennessy Midstream Fund – | | | |
| Investor Class (HMSFX) | 24.03% | 2.18% | -0.02% |
| Hennessy Midstream Fund – | | | |
| Institutional Class (HMSIX) | 24.41% | 2.44% | 0.23% |
| Alerian US Midstream Energy Index | 26.22% | 9.11% | 3.49% |
S&P 500® Index | -14.61% | 10.44% | 10.82% |
| Expense ratios: | Gross 2.11%, Net 1.76%(1) (Investor Class); |
| | Gross 1.74%, Net 1.51%(1) (Institutional Class) |
(1) | The Fund’s investment advisor has contractually agreed to limit expenses until February 28, 2023. |
Performance data quoted represents past performance; past performance does not guarantee future results. The investment return and principal value of an investment will fluctuate so that an investor’s shares, when redeemed, may be worth more or less than their original cost. The performance table does not reflect the deduction of taxes that a shareholder would pay on Fund distributions or the redemption of Fund shares. Current performance of the Fund may be lower or higher than the performance quoted. Performance data current to the most recent month end may be obtained by visiting www.hennessyfunds.com. Performance for periods including or prior to October 26, 2018, is that of the BP Capital TwinLine MLP Fund.
The Alerian US Midstream Energy Index comprises companies that earn a majority of their cash flows from midstream activities involving energy commodities. The S&P 500® Index is a capitalization-weighted index that is designed to represent the broad domestic economy through changes in the aggregate market value of 500 stocks across all major industries. One cannot invest directly in an index. These indices are used for comparative purposes in accordance with Securities and Exchange Commission regulations.
The Alerian US Midstream Energy Index is a servicemark of GKD Index Partners, LLC d/b/a Alerian (“Alerian”), and its use is granted under a license from Alerian. Alerian makes no express or implied warranties, representations, or promises regarding the originality, merchantability, suitability, or fitness for a particular purpose or use with
respect to the Alerian indices. No party may rely on, and Alerian does not accept any liability for any errors, omissions, interruptions, or defects in, the Alerian indices or underlying data. In no event shall Alerian have any liability for any direct, indirect, special, incidental, punitive, consequential, or other damages (including lost profits), even if notified of the possibility of such damages.
Standard & Poor’s Financial Services is the source and owner of the S&P® and S&P 500® trademarks.
The expense ratios presented are from the most recent prospectus. The expense ratios for the current reporting period are available in the Financial Highlights section of this report.
PERFORMANCE NARRATIVE
Portfolio Managers Ben Cook, CFA, and L. Joshua Wein, CAIA
Performance:
For the one-year period ended October 31, 2022, the Investor Class of the Hennessy Midstream Fund returned 24.03%, slightly underperforming the Alerian US Midstream Energy Index (the Fund’s primary benchmark), which returned 26.22%, but outperforming the S&P 500® Index, which returned -14.61% for the same period.
The principal reason for the Fund’s underperformance relative to its primary benchmark was the absence of exposure to Cheniere Energy, Inc. (LNG), a top member of the Fund’s primary benchmark index, the Alerian US Midstream Energy Index. LNG’s absence from Fund holdings was a key detractor to relative Fund performance given the company’s material outperformance of the benchmark index. The Fund did not hold this stock due to its minimal dividend payout rate that was initiated at the onset of the one-year period ended October 31, 2022.
During the period, midstream assets with a crude oil/refined product orientation enjoyed a meaningful operating performance tailwind driven by gains in both crude oil pricing as well as crude oil production volume growth. NYMEX WTI crude oil prices rose approximately 3.5% while lower 48 U.S. crude oil production volume grew by approximately 10%. During the period, the Fund maintained an overweight position in crude oil/refined product-oriented companies relative to its benchmark, which afforded the Fund with positive excess return.
The Funds’ exposure to gathering and processing-oriented companies contributed slightly to Fund performance relative to its primary benchmark, as the sub-sector’s performance was generally in line with the broader benchmark and the Fund’s relative weighting was slightly higher than the benchmark’s weighting. Operating and financial results of gathering and processing-oriented companies generally improved on increases in both energy commodity prices and volumetric hydrocarbon throughput during the period.
The Fund’s exposure to natural gas/natural gas liquid-oriented companies was approximately in line with comparable benchmark exposures and contributed modestly to overall Fund performance given the slight outperformance of the sector relative to the primary benchmark during the period. The Fund was generally underweight refining and logistics-oriented companies relative to its benchmark, which detracted just slightly to relative Fund performance.
Portfolio exposure adjustments during the period were modest but reflected continued confidence in the uptrend in energy commodity pricing and rising activity levels in the U.S. upstream oil and gas sector. Portfolio exposure to gathering and
| HENNESSY FUNDS | 1-800-966-4354 | |
processing-oriented companies increased by approximately 10%, while exposures to both natural gas/natural gas liquid-oriented companies as well as crude oil/refined product-oriented companies diminished by approximately 5% each. At period end, approximately 50% of the portfolio represented exposure to companies operating natural gas/natural gas liquid-oriented assets while gathering and processing-oriented companies and crude oil/refined products-oriented companies represented approximately 25% each.
Portfolio Strategy:
The Fund generally seeks to build a concentrated portfolio of midstream energy companies with the following characteristics: (i) large and strategically protected integrated businesses, linking economic basins to strong demand centers; (ii) contracted and visible cash flows with strong counterparties such as utilities or power consumers; and (iii) strong balance sheets. However, given the current strong macroeconomic conditions, as well as favorable commodity prices and midstream energy company fundamentals, we expect that the Fund’s portfolio will continue to include companies with direct commodity sensitivity. We believe our industry experience and intensive, fundamental, “boots-on-the-ground” research process allows us to uncover potential equity mispricings that can meaningfully drive performance.
Investment Commentary:
Energy market volatility rose meaningfully during the first quarter of the one-year period ended October 31, 2022 as rising global energy demand associated with an improving pace of economic growth post pandemic stressed a beleaguered global supply base, constrained by limited OPEC+ production resumption, Russian volume loss, and persistent upstream sector capacity underinvestment. Oil price volatility subsided in the latter half of the period dampened by the sizeable release of crude oil from the U.S. Strategic Petroleum Reserve (SPR). Though the price of NYMEX WTI crude oil doubled from its December 2021 low by March 2022, the WTI crude oil price moderated through the end of the one-year period ended October 31, 2022, to finish at $86.53 per barrel (bbl), up approximately 3.5% from the previous one-year period ended October 31, 2021.
Global natural gas markets also experienced significant volatility during the period as supply loss associated with curtailed Russian exports into Europe sent policy makers scrambling to secure alternative sources of supply critical to meeting regional wintertime needs. The corresponding spike in demand supported price gains around the globe as competition for liquified natural gas (LNG) cargos lifted Asian market pricing and provided a meaningful boost to U.S. pricing as well, as the U.S. committed to supplying the European Union (EU) with significant volumes on a go forward basis. During the summer, the untimely planned winddown of key nuclear facilities in Germany also added to regional baseload natural gas needs as renewable power sources proved insufficient in making up energy supply shortfall. Though NYMEX Henry Hub natural gas prices more than doubled from trough to peak during the period, the Henry Hub natural gas price moderated into period end, gaining approximately 17.1% to finish at $6.35 per thousand cubic feet (mcf).
Rising energy commodity prices in the U.S. during the period prompted an uptick in U.S. upstream sector drilling and development activity levels that in turn provided support to domestic crude oil and natural gas production volume growth, which ultimately created a healthy environment for midstream company assets and the respective equities owned by the Fund.
Despite lingering fears of Covid-variant proliferation and the potential risk of slowing economic activity due to tightening monetary conditions, investment merit inherent in midstream equities remains favorable given favorable commodity fundamentals, rising
demand for U.S. energy exports, the sector’s defensive posture with respect to inflation, and its current attractive valuation.
On a global basis, crude oil and natural gas inventories remain well below historical norms, as years of underinvestment in industry capacity and only modest gains in production volume have proven insufficient to fully satisfy rising consumption and inventory replenishment needs. As a consequence, commodity prices are likely to remain elevated and provide U.S. upstream companies with incentive to develop the resources required to meet rising demand in the U.S and abroad. Existing and projected export capacity expansion in the U.S. should allow for export volume growth through the end of the decade. The market’s loss of Russian export volumes underscores the importance of energy security, reliability and affordability, which are all qualities that likely will increase the appeal of U.S. energy resources. As one of few sectors offering the potential for strong returns and cash flows that are generally positively correlated with rising price levels, we believe midstream equities provide a logical hedge in an inflationary environment. Inflation protection coupled with attractive valuation relative to historical norms combine to offer unique appeal in the current environment. In total, we believe these and other drivers should continue to benefit energy fundamentals and midstream energy equities going forward.
_______________
Opinions expressed are those of the Portfolio Managers as of the date written and are subject to change, are not guaranteed, and should not be considered investment advice or an indication of trading intent.
The Fund is non-diversified, meaning it may concentrate its assets in fewer individual holdings than a diversified fund, making it more exposed to individual stock volatility than a diversified fund. The Fund invests in small-capitalization and medium-capitalization companies, which involves additional risks such as limited liquidity and greater volatility. Funds that concentrate in a single sector may be subject to a higher degree of risk. Energy-related companies are subject to specific risks, including fluctuations in commodity prices and consumer demand, substantial government regulation, and depletion of reserves. Investments in lower-rated and non-rated securities present a greater risk of loss to principal and interest than higher-rated securities. Use of derivatives can increase the volatility of the Fund.
MLPs and MLP investments have unique characteristics. The Fund does not receive the same tax benefits as a direct investment in an MLP.
The prices of MLP units may fluctuate abruptly and trading volume may be low, making it difficult for the Fund to sell its units at a favorable price. MLP general partners have the power to take actions that adversely affect the interests of unit holders. Most MLPs do not pay U.S. federal income tax at the partnership level, but an adverse change in tax laws could result in MLPs being treated as corporations for federal income tax purposes, which could reduce or eliminate distributions paid by MLPs to the Fund. The Fund is treated as a regular corporation, or “C” corporation, for U.S. federal income tax purposes, and therefore, is subject to U.S. federal income tax on its taxable income at the graduated rates applicable to corporations (currently a maximum rate of 21%), as well as state and local income taxes. The Fund will not benefit from current favorable federal income tax rates on long-term capital gains, and Fund income and losses will not be passed on to shareholders. The Fund accrues deferred income taxes for future tax liabilities associated with the portion of MLP distributions considered to be a tax-deferred return of capital and for any net operating gains as well as capital appreciation of its investments. This deferred tax liability is reflected in the daily net asset value of the Fund and as a result the Fund’s after-tax performance could differ significantly from the underlying assets even if the pre-tax performance is closely tracked. Please see the Fund’s prospectus for a more complete discussion of these and other risks.
References to specific securities should not be considered a recommendation to buy or sell any security. Fund holdings and sector allocations are subject to change. Please refer to the Schedule of Investments included in this report for additional portfolio information.
Cash flow refers to the net amount of cash and cash equivalents transfered into and out of a company.
| HENNESSY FUNDS | 1-800-966-4354 | |
Financial Statements
Schedule of Investments as of October 31, 2022 |
HENNESSY MIDSTREAM FUND
(% of Total Assets)
| TOP TEN HOLDINGS (EXCLUDING MONEY MARKET FUNDS) | % TOTAL ASSETS |
| Energy Transfer LP | 13.78% |
| Enterprise Products Partners LP | 10.25% |
| MPLX LP | 9.20% |
| Plains All American Pipeline LP | 8.23% |
| Antero Midstream Corp. | 8.22% |
| The Williams Companies, Inc. | 7.76% |
| Targa Resources Corp. | 7.17% |
| Magellan Midstream Partners LP | 5.96% |
| ONEOK, Inc. | 5.84% |
| Western Midstream Partners LP | 4.59% |
Note: The Fund concentrates its investments in the Energy industry. For presentation purposes, the Fund uses custom categories.
| COMMON STOCKS – 42.41% | | Number of | | | | | | % of | |
| | | Shares | | | Value | | | Net Assets | |
| Gathering & Processing – 13.82% | | | | | | | | | |
| EnLink Midstream LLC | | | 109,000 | | | $ | 1,294,920 | | | | 2.91 | % |
| Equitrans Midstream Corp. | | | 194,500 | | | | 1,637,690 | | | | 3.68 | % |
| Targa Resources Corp. | | | 47,100 | | | | 3,220,227 | | | | 7.23 | % |
| | | | | | | | 6,152,837 | | | | 13.82 | % |
| | | | | | | | | | | | | |
| Midstream – 8.29% | | | | | | | | | | | | |
| Antero Midstream Corp. | | | 346,600 | | | | 3,691,290 | | | | 8.29 | % |
| | | | | | | | | | | | | |
| Natural Gas/NGL Transportation – 20.30% | | | | | | | | | | | | |
| DT Midstream, Inc. | | | 19,800 | | | | 1,182,060 | | | | 2.65 | % |
| Kinder Morgan, Inc. | | | 96,790 | | | | 1,753,835 | | | | 3.94 | % |
| ONEOK, Inc. | | | 44,226 | | | | 2,623,486 | | | | 5.89 | % |
| The Williams Companies, Inc. | | | 106,452 | | | | 3,484,174 | | | | 7.82 | % |
| | | | | | | | 9,043,555 | | | | 20.30 | % |
| | | | | | | | | | | | | |
| Total Common Stocks | | | | | | | | | | | | |
| (Cost $12,266,447) | | | | | | | 18,887,682 | | | | 42.41 | % |
| | | | | | | | | | | | | |
| PARTNERSHIPS & TRUSTS – 55.89% | | | | | | | | | | | | |
| | | | | | | | | | | | | |
| Crude Oil & Refined Products – 23.60% | | | | | | | | | | | | |
| Magellan Midstream Partners LP | | | 49,600 | | | | 2,675,920 | | | | 6.01 | % |
| MPLX LP | | | 123,249 | | | | 4,133,772 | | | | 9.28 | % |
| Plains All American Pipeline LP | | | 309,026 | | | | 3,699,041 | | | | 8.31 | % |
| | | | | | | | 10,508,733 | | | | 23.60 | % |
| | | | | | | | | | | | | |
| Gathering & Processing – 4.63% | | | | | | | | | | | | |
| Western Midstream Partners LP | | | 71,800 | | | | 2,061,378 | | | | 4.63 | % |
| | | | | | | | | | | | | |
| Natural Gas/NGL Transportation – 27.66% | | | | | | | | | | | | |
| DCP Midstream LP | | | 38,300 | | | | 1,522,425 | | | | 3.42 | % |
| Energy Transfer LP | | | 484,900 | | | | 6,192,173 | | | | 13.90 | % |
| Enterprise Products Partners LP | | | 182,400 | | | | 4,605,600 | | | | 10.34 | % |
| | | | | | | | 12,320,198 | | | | 27.66 | % |
| | | | | | | | | | | | | |
| Total Partnerships & Trusts | | | | | | | | | | | | |
| (Cost $14,985,305) | | | | | | | 24,890,309 | | | | 55.89 | % |
The accompanying notes are an integral part of these financial statements.
| HENNESSY FUNDS | 1-800-966-4354 | |
| SHORT-TERM INVESTMENTS – 0.00% | | Number of | | | | | | % of | |
| | | Shares | | | Value | | | Net Assets | |
| Money Market Funds – 0.00% | | | | | | | | | |
| First American Government Obligations Fund, | | | | | | | | | |
| Institutional Class, 2.93% (a) | | | 980 | | | $ | 980 | | | | 0.00 | % |
| | | | | | | | | | | | | |
| Total Short-Term Investments | | | | | | | | | | | | |
| (Cost $980) | | | | | | | 980 | | | | 0.00 | % |
| | | | | | | | | | | | | |
| Total Investments | | | | | | | | | | | | |
| (Cost $27,252,732) – 98.30% | | | | | | | 43,778,971 | | | | 98.30 | % |
| Other Assets in Excess of Liabilities – 1.70% | | | | | | | 755,222 | | | | 1.70 | % |
| | | | | | | | | | | | | |
TOTAL NET ASSETS – 100.00% | | | | | | $ | 44,534,193 | | | | 100.00 | % |
Percentages are stated as a percent of net assets.
| (a) | The rate listed is the fund’s seven-day yield as of October 31, 2022. |
Summary of Fair Value Exposure as of October 31, 2022
The following is a summary of the inputs used to value the Fund’s net assets as of October 31, 2022 (see Note 3 in the accompanying Notes to the Financial Statements):
| Common Stocks | | Level 1 | | | Level 2 | | | Level 3 | | | Total | |
| Gathering & Processing | | $ | 6,152,837 | | | $ | — | | | $ | — | | | $ | 6,152,837 | |
| Midstream | | | 3,691,290 | | | | — | | | | — | | | | 3,691,290 | |
| Natural Gas/NGL Transportation | | | 9,043,555 | | | | — | | | | — | | | | 9,043,555 | |
| Total Common Stocks | | $ | 18,887,682 | | | $ | — | | | $ | — | | | $ | 18,887,682 | |
| Partnerships & Trusts | | | | | | | | | | | | | | | | |
| Crude Oil & Refined Products | | $ | 10,508,733 | | | $ | — | | | $ | — | | | $ | 10,508,733 | |
| Gathering & Processing | | | 2,061,378 | | | | — | | | | — | | | | 2,061,378 | |
| Natural Gas/NGL Transportation | | | 12,320,198 | | | | — | | | | — | | | | 12,320,198 | |
| Total Partnerships & Trusts | | $ | 24,890,309 | | | $ | — | | | $ | — | | | $ | 24,890,309 | |
| Short-Term Investments | | | | | | | | | | | | | | | | |
| Money Market Funds | | $ | 980 | | | $ | — | | | $ | — | | | $ | 980 | |
| Total Short-Term Investments | | $ | 980 | | | $ | — | | | $ | — | | | $ | 980 | |
| Total Investments | | $ | 43,778,971 | | | $ | — | | | $ | — | | | $ | 43,778,971 | |
The accompanying notes are an integral part of these financial statements.
| SCHEDULE OF INVESTMENTS/STATEMENT OF ASSETS AND LIABILITIES |
Financial Statements
Statement of Assets and Liabilities as of October 31, 2022 |
| ASSETS: | | | |
| Investments in securities, at value (cost $27,252,732) | | $ | 43,778,971 | |
| Dividends and interest receivable | | | 31,256 | |
| Receivable for fund shares sold | | | 133,946 | |
| Receivable for securities sold | | | 604,600 | |
| Return of capital receivable | | | 360,427 | |
| Deferred income tax | | | — | |
| Prepaid expenses and other assets | | | 11,383 | |
| Total assets | | | 44,920,583 | |
| | | | | |
| LIABILITIES: | | | | |
| Loans payable | | | 287,000 | |
| Payable for fund shares redeemed | | | 6,249 | |
| Payable to advisor | | | 34,446 | |
| Payable to auditor | | | 41,301 | |
| Accrued distribution fees | | | 1,512 | |
| Accrued service fees | | | 880 | |
| Accrued trustees fees | | | 4,982 | |
| Accrued expenses and other payables | | | 10,020 | |
| Total liabilities | | | 386,390 | |
| NET ASSETS | | $ | 44,534,193 | |
| | | | | |
| NET ASSETS CONSISTS OF: | | | | |
| Capital stock | | $ | 51,940,352 | |
| Accumulated deficit | | | (7,406,159 | ) |
| Total net assets | | $ | 44,534,193 | |
| | | | | |
| NET ASSETS: | | | | |
| Investor Class | | | | |
| Shares authorized (no par value) | | Unlimited | |
| Net assets applicable to outstanding shares | | $ | 11,472,490 | |
| Shares issued and outstanding | | | 1,197,523 | |
| Net asset value, offering price, and redemption price per share | | $ | 9.58 | |
| | | | | |
| Institutional Class | | | | |
| Shares authorized (no par value) | | Unlimited | |
| Net assets applicable to outstanding shares | | $ | 33,061,703 | |
| Shares issued and outstanding | | | 3,337,488 | |
| Net asset value, offering price, and redemption price per share | | $ | 9.91 | |
The accompanying notes are an integral part of these financial statements.
| HENNESSY FUNDS | 1-800-966-4354 | |
Financial Statements
Statement of Operations for the year ended October 31, 2022 |
| INVESTMENT INCOME: | | | |
| Distributions received from master limited partnerships | | $ | 1,856,527 | |
| Return of capital on distributions received | | | (1,856,527 | ) |
Dividend income(1) | | | 401,703 | |
| Interest income | | | 7,677 | |
| Total investment income | | | 409,380 | |
| | | | | |
| EXPENSES: | | | | |
| Investment advisory fees (See Note 5) | | | 460,970 | |
| Administration, accounting, custody, and transfer agent fees (See Note 5) | | | 58,901 | |
| Sub-transfer agent expenses – Investor Class (See Note 5) | | | 18,228 | |
| Sub-transfer agent expenses – Institutional Class (See Note 5) | | | 30,390 | |
| Audit fees | | | 41,294 | |
| Federal and state registration fees | | | 33,827 | |
| Compliance expense (See Note 5) | | | 24,508 | |
| Trustees’ fees and expenses | | | 16,399 | |
| Reports to shareholders | | | 13,808 | |
| Distribution fees – Investor Class (See Note 5) | | | 13,343 | |
| Service fees – Investor Class (See Note 5) | | | 8,895 | |
| Interest expense (See Note 7) | | | 4,060 | |
| Legal fees | | | 1,474 | |
| Income tax expense | | | 800 | |
| Other expenses | | | 12,184 | |
| Total expenses before waivers and reimbursements | | | 739,081 | |
| Service provider expense waiver (See Note 5) | | | (58,901 | ) |
| Expense reimbursement by advisor – Investor Class (See Note 5) | | | (13,391 | ) |
| Expense reimbursement by advisor – Institutional Class (See Note 5) | | | (11,297 | ) |
| Net expenses | | | 655,492 | |
| NET INVESTMENT LOSS | | $ | (246,112 | ) |
| | | | | |
| REALIZED AND UNREALIZED GAINS (LOSSES): | | | | |
| Net realized gain on investments | | $ | 2,241,454 | |
| Net change in unrealized appreciation/depreciation on investments | | | 6,041,810 | |
| Income tax expense | | | — | |
| Net gain on investments | | | 8,283,264 | |
| NET INCREASE IN NET ASSETS RESULTING FROM OPERATIONS | | $ | 8,037,152 | |
(1) | Net of foreign taxes withheld of $8,845. |
The accompanying notes are an integral part of these financial statements.
| STATEMENT OF OPERATIONS/STATEMENTS OF CHANGES IN NET ASSETS |
Financial Statements
| Statements of Changes in Net Assets |
| | | Year Ended | | | Year Ended | |
| | | October 31, 2022 | | | October 31, 2021 | |
| OPERATIONS: | | | | | | |
| Net investment loss | | $ | (246,112 | ) | | $ | (230,996 | ) |
| Net realized gain on investments | | | 2,241,454 | | | | 357,263 | |
| Net change in unrealized | | | | | | | | |
| appreciation/deprecation on investments | | | 6,041,810 | | | | 17,111,950 | |
| Net increase in net assets resulting from operations | | | 8,037,152 | | | | 17,238,217 | |
| | | | | | | | | |
| DISTRIBUTIONS TO SHAREHOLDERS FROM: | | | | | | | | |
| Distributable earnings – Investor Class | | | (56,001 | ) | | | — | |
| Return of capital – Investor Class | | | (932,728 | ) | | | (756,323 | ) |
| Distributable earning – Institutional Class | | | (205,718 | ) | | | — | |
| Return of capital – Institutional Class | | | (3,426,419 | ) | | | (3,420,217 | ) |
| Total distributions | | | (4,620,866 | ) | | | (4,176,540 | ) |
| | | | | | | | | |
| CAPITAL SHARE TRANSACTIONS: | | | | | | | | |
| Proceeds from shares subscribed – Investor Class | | | 5,720,090 | | | | 2,502,132 | |
| Proceeds from shares subscribed – Institutional Class | | | 11,963,118 | | | | 3,761,293 | |
| Dividends reinvested – Investor Class | | | 840,503 | | | | 677,429 | |
| Dividends reinvested – Institutional Class | | | 3,393,598 | | | | 3,185,818 | |
| Cost of shares redeemed – Investor Class | | | (2,598,309 | ) | | | (2,532,516 | ) |
| Cost of shares redeemed – Institutional Class | | | (15,368,206 | ) | | | (5,635,003 | ) |
| Net increase in net assets derived | | | | | | | | |
| from capital share transactions | | | 3,950,794 | | | | 1,959,153 | |
| TOTAL INCREASE IN NET ASSETS | | | 7,367,080 | | | | 15,020,830 | |
| | | | | | | | | |
| NET ASSETS: | | | | | | | | |
| Beginning of year | | | 37,167,113 | | | | 22,146,283 | |
| End of year | | $ | 44,534,193 | | | $ | 37,167,113 | |
| | | | | | | | | |
| CHANGES IN SHARES OUTSTANDING: | | | | | | | | |
| Shares sold – Investor Class | | | 634,991 | | | | 321,069 | |
| Shares sold – Institutional Class | | | 1,295,385 | | | | 490,595 | |
| Shares issued to holders as reinvestment | | | | | | | | |
| of dividends – Investor Class | | | 93,668 | | | | 89,396 | |
| Shares issued to holders as reinvestment | | | | | | | | |
| of dividends – Institutional Class | | | 369,848 | | | | 410,703 | |
| Shares redeemed – Investor Class | | | (307,053 | ) | | | (320,846 | ) |
| Shares redeemed – Institutional Class | | | (1,747,350 | ) | | | (711,400 | ) |
| Net increase in shares outstanding | | | 339,489 | | | | 279,517 | |
The accompanying notes are an integral part of these financial statements.
| HENNESSY FUNDS | 1-800-966-4354 | |
Financial Statements
For an Investor Class share outstanding throughout each period
PER SHARE DATA:
Net asset value, beginning of period
Income from investment operations:
Net investment loss(2)(3)
Net realized and unrealized gains (losses) on investments
Total from investment operations
Less distributions:
Dividends from net investment income
Dividends from return of capital
Total distributions
Net asset value, end of period
TOTAL RETURN
SUPPLEMENTAL DATA AND RATIOS:
Net assets, end of period (millions)
Ratio of expenses to average net assets:
Before expense reimbursement
After expense reimbursement
Ratio of net investment loss to average net assets:
Before expense reimbursement(3)
After expense reimbursement(3)
Portfolio turnover rate(7)
(1) | The period ended October 31, 2018, consists of 11 months due to the Fund’s fiscal year end change from November 30 to October 31, effective October 26, 2018. |
(2) | Calculated using the average shares outstanding method. |
(3) | Includes current and deferred tax benefit/expense from net investment income/loss only. |
(4) | Not annualized. |
(5) | Annualized. |
(6) | Certain service provider expenses were voluntarily waived during the fiscal year. |
(7) | Calculated on the basis of the Fund as a whole. |
The accompanying notes are an integral part of these financial statements.
| FINANCIAL HIGHLIGHTS — INVESTOR CLASS |
| | | Period Ended | | | Year Ended | |
| Year Ended October 31, | | | October 31, | | | November 30, | |
| 2022 | | | 2021 | | | 2020 | | | 2019 | | | 2018(1) | | | 2017 | |
| | | | | | | | | | | | | | | | | |
| | | | | | | | | | | | | | | | | |
| $ | 8.66 | | | $ | 5.55 | | | $ | 10.90 | | | $ | 12.66 | | | $ | 14.51 | | | $ | 16.54 | |
| | | | | | | | | | | | | | | | | | | | | | | |
| | | | | | | | | | | | | | | | | | | | | | | |
| | (0.07 | ) | | | (0.07 | ) | | | (0.10 | ) | | | (0.10 | ) | | | (0.16 | ) | | | (0.22 | ) |
| | 2.02 | | | | 4.21 | | | | (4.22 | ) | | | (0.63 | ) | | | (0.66 | ) | | | (0.78 | ) |
| | 1.95 | | | | 4.14 | | | | (4.32 | ) | | | (0.73 | ) | | | (0.82 | ) | | | (1.00 | ) |
| | | | | | | | | | | | | | | | | | | | | | | |
| | | | | | | | | | | | | | | | | | | | | | | |
| | (0.06 | ) | | | — | | | | — | | | | — | | | | — | | | | — | |
| | (0.97 | ) | | | (1.03 | ) | | | (1.03 | ) | | | (1.03 | ) | | | (1.03 | ) | | | (1.03 | ) |
| | (1.03 | ) | | | (1.03 | ) | | | (1.03 | ) | | | (1.03 | ) | | | (1.03 | ) | | | (1.03 | ) |
| $ | 9.58 | | | $ | 8.66 | | | $ | 5.55 | | | $ | 10.90 | | | $ | 12.66 | | | $ | 14.51 | |
| | | | | | | | | | | | | | | | | | | | | | | |
| | 24.03 | % | | | 78.41 | % | | | -42.13 | % | | | -6.28 | % | | | -6.15 | %(4) | | | -6.49 | % |
| | | | | | | | | | | | | | | | | | | | | | | |
| | | | | | | | | | | | | | | | | | | | | | | |
| $ | 11.47 | | | $ | 6.72 | | | $ | 3.81 | | | $ | 9.20 | | | $ | 20.07 | | | $ | 16.86 | |
| | | | | | | | | | | | | | | | | | | | | | | |
| | 2.05 | % | | | 2.11 | % | | | 2.12 | % | | | 1.89 | % | | | 1.86 | %(5) | | | 1.91 | % |
| | 1.76 | %(6) | | | 1.76 | %(6) | | | 1.76 | %(6) | | | 1.76 | % | | | 1.78 | %(5) | | | 1.77 | % |
| | | | | | | | | | | | | | | | | | | | | | | |
| | (1.08 | )% | | | (1.26 | )% | | | (1.63 | )% | | | (0.92 | )% | | | (1.34 | )%(5) | | | (1.50 | )% |
| | (0.79 | )% | | | (0.91 | )% | | | (1.27 | )% | | | (0.79 | )% | | | (1.26 | )%(5) | | | (1.36 | )% |
| | 33 | % | | | 40 | % | | | 53 | % | | | 41 | % | | | 64 | %(4) | | | 63 | % |
The accompanying notes are an integral part of these financial statements.
| HENNESSY FUNDS | 1-800-966-4354 | |
Financial Statements
For an Institutional Class share outstanding throughout each period
PER SHARE DATA:
Net asset value, beginning of period
Income from investment operations:
Net investment loss(2)(3)
Net realized and unrealized gains (losses) on investments
Total from investment operations
Less distributions:
Dividends from net investment income
Dividends from return of capital
Total distributions
Net asset value, end of period
TOTAL RETURN
SUPPLEMENTAL DATA AND RATIOS:
Net assets, end of period (millions)
Ratio of expenses to average net assets:
Before expense reimbursement
After expense reimbursement
Ratio of net investment loss to average net assets:
Before expense reimbursement(3)
After expense reimbursement(3)
Portfolio turnover rate(7)
(1) | The period ended October 31, 2018, consists of 11 months due to the Fund’s fiscal year end change from November 30 to October 31, effective October 26, 2018. |
(2) | Calculated using the average shares outstanding method. |
(3) | Includes current and deferred tax benefit/expense from net investment income/loss only. |
(4) | Not annualized. |
(5) | Annualized. |
(6) | Certain service provider expenses were voluntarily waived during the fiscal year. |
(7) | Calculated on the basis of the Fund as a whole. |
The accompanying notes are an integral part of these financial statements.
| FINANCIAL HIGHLIGHTS — INSTITUTIONAL CLASS |
| | | Period Ended | | | Year Ended | |
| Year Ended October 31, | | | October 31, | | | November 30, | |
| 2022 | | | 2021 | | | 2020 | | | 2019 | | | 2018(1) | | | 2017 | |
| | | | | | | | | | | | | | | | | |
| | | | | | | | | | | | | | | | | |
| $ | 8.90 | | | $ | 5.68 | | | $ | 11.09 | | | $ | 12.83 | | | $ | 14.66 | | | $ | 16.66 | |
| | | | | | | | | | | | | | | | | | | | | | | |
| | | | | | | | | | | | | | | | | | | | | | | |
| | (0.05 | ) | | | (0.05 | ) | | | (0.10 | ) | | | (0.09 | ) | | | (0.14 | ) | | | (0.18 | ) |
| | 2.09 | | | | 4.30 | | | | (4.28 | ) | | | (0.62 | ) | | | (0.66 | ) | | | (0.79 | ) |
| | 2.04 | | | | 4.25 | | | | (4.38 | ) | | | (0.71 | ) | | | (0.80 | ) | | | (0.97 | ) |
| | | | | | | | | | | | | | | | | | | | | | | |
| | | | | | | | | | | | | | | | | | | | | | | |
| | (0.06 | ) | | | — | | | | — | | | | — | | | | — | | | | — | |
| | (0.97 | ) | | | (1.03 | ) | | | (1.03 | ) | | | (1.03 | ) | | | (1.03 | ) | | | (1.03 | ) |
| | (1.03 | ) | | | (1.03 | ) | | | (1.03 | ) | | | (1.03 | ) | | | (1.03 | ) | | | (1.03 | ) |
| $ | 9.91 | | | $ | 8.90 | | | $ | 5.68 | | | $ | 11.09 | | | $ | 12.83 | | | $ | 14.66 | |
| | | | | | | | | | | | | | | | | | | | | | | |
| | 24.41 | % | | | 78.57 | % | | | -41.93 | % | | | -6.10 | % | | | -5.94 | %(4) | | | -6.25 | % |
| | | | | | | | | | | | | | | | | | | | | | | |
| | | | | | | | | | | | | | | | | | | | | | | |
| $ | 33.06 | | | $ | 30.45 | | | $ | 18.33 | | | $ | 31.78 | | | $ | 61.92 | | | $ | 82.59 | |
| | | | | | | | | | | | | | | | | | | | | | | |
| | 1.69 | % | | | 1.74 | % | | | 1.79 | % | | | 1.56 | % | | | 1.58 | %(5) | | | 1.66 | % |
| | 1.51 | %(6) | | | 1.51 | %(6) | | | 1.51 | %(6) | | | 1.51 | % | | | 1.52 | %(5) | | | 1.52 | % |
| | | | | | | | | | | | | | | | | | | | | | | |
| | (0.71 | )% | | | (0.89 | )% | | | (1.55 | )% | | | (0.76 | )% | | | (1.15 | )%(5) | | | (1.28 | )% |
| | (0.53 | )% | | | (0.66 | )% | | | (1.27 | )% | | | (0.71 | )% | | | (1.09 | )%(5) | | | (1.14 | )% |
| | 33 | % | | | 40 | % | | | 53 | % | | | 41 | % | | | 64 | %(4) | | | 63 | % |
The accompanying notes are an integral part of these financial statements.
| HENNESSY FUNDS | 1-800-966-4354 | |
Financial Statements
Notes to the Financial Statements October 31, 2022 |
1). ORGANIZATION
The Hennessy Midstream Fund (the “Fund”) is a series of Hennessy Funds Trust (the “Trust”), which was organized as a Delaware statutory trust on September 17, 1992. The Fund is an open-end management investment company registered under the Investment Company Act of 1940, as amended. The investment objective of the Fund is to seek capital appreciation through distribution growth along with current income. The Fund is treated as a regular corporation, or “C” corporation, for U.S. federal income tax purposes. Because the Fund is treated as a “C” corporation, it is not taxed as a regulated investment company under Subchapter M of the Code and is not required to comply with the diversification requirements applicable to regulated investment companies. The Fund is a non-diversified fund.
The Fund offers Investor Class and Institutional Class shares. Each class of shares differs principally in its respective 12b-1 distribution and service, shareholder servicing, and sub-transfer agent expenses. There are no sales charges. Each class has identical rights to earnings, assets, and voting privileges, except for class-specific expenses and exclusive rights to vote on matters affecting only one class.
As an investment company, the Fund follows the investment company accounting and reporting guidance of the Financial Accounting Standards Board (“FASB”) Accounting Standard Codification Topic 946 “Financial Services—Investment Companies.”
2). SIGNIFICANT ACCOUNTING POLICIES
The following is a summary of significant accounting policies consistently followed by the Fund in the preparation of the financial statements. These policies conform to U.S. generally accepted accounting principles (“GAAP”).
| a). | Securities Valuation – All investments in securities are valued in accordance with the Fund’s valuation policies and procedures, as described in Note 3. |
| | |
| b). | Federal Income Taxes – The Fund is taxed as a corporation and is obligated to pay U.S. federal and state income tax on its taxable income. Currently, the maximum marginal regular federal income tax rate for a corporation is 21%. The Fund invests a substantial portion of its assets in master limited partnerships (“MLPs”), which are treated as partnerships for federal income tax purposes. As a limited partner in MLPs, the Fund reports its allocable share of each MLP’s taxable income in computing its own taxable income. |
| | |
| | The Fund includes any tax expense or benefit in the Statement of Operations based on the component of income or gains/losses to which such expense or benefit relates. Deferred income taxes reflect the net tax effects of temporary differences between the carrying amount of assets and liabilities for financial reporting purposes and the carrying amount of assets and liabilities for income tax purposes. The Fund recognizes a valuation allowance if, based on the weight of available evidence, it is more likely than not that the Fund will not realize some portion or all of the deferred income tax assets. As of October 31, 2022, the Fund has placed a full valuation allowance on its deferred tax assets. |
| NOTES TO THE FINANCIAL STATEMENTS |
| c). | Accounting for Uncertainty in Income Taxes – The Fund has accounting policies regarding recognition and measurement of tax positions taken or expected to be taken on a tax return. The tax returns of the Fund for the prior three fiscal years are open for examination. The Fund has reviewed all open tax years in major tax jurisdictions and concluded that there is no impact on the Fund’s net assets and no tax liability resulting from unrecognized tax benefits relating to uncertain income tax positions taken or expected to be taken on a tax return. The Fund files U.S. federal income tax returns and various state income tax returns. |
| | |
| d). | Income and Expenses – Dividend income is recognized on the ex-dividend date or as soon as information is available to the Fund. Interest income, which includes the amortization of premium and accretion of discount, is recognized on an accrual basis. Market discounts, original issue discounts, and market premiums on debt securities are accreted or amortized to interest income over the life of a security with a corresponding increase or decrease, as applicable, in the cost basis of such security using the yield-to-maturity method or, where applicable, the first call date of the security. Other non-cash dividends are recognized as investment income at the fair value of the property received. The Fund is charged for those expenses that are directly attributable to its portfolio, such as advisory, administration, and certain shareholder service fees. Income, expenses (other than expenses attributable to a specific class), and realized and unrealized gains/losses on investments are allocated to each class of shares based on such class’s net assets. Distributions received from the Fund’s investments in MLPs generally consist of ordinary income, capital gains, and return of capital. The Fund records investment income on the ex-date of the distributions. For financial statement purposes, the Fund uses return of capital and income estimates to allocate the dividend income received. Such estimates are based on historical information available from the MLPs and other industry sources. These estimates may subsequently be revised based on information received from the MLPs after their tax reporting periods are concluded, as the actual character of these distributions is not known until after the fiscal year end of the Fund. |
| | |
| e). | Distributions to Shareholders – The Fund typically makes cash distributions to its shareholders quarterly at the beginning of the months of March, June, September, and December. Due to the tax treatment of the Fund’s allocations and distributions from MLPs, a significant portion of the Fund’s distributions to shareholders typically is treated as return of capital to shareholders for U.S. federal income tax purposes (i.e., as distributions in excess of the Fund’s current and accumulated earnings and profits as described below). However, no assurance can be given in this regard; just as the Fund’s corporate income tax liability can fluctuate materially from year to year, the extent to which the Fund is able to make return-of-capital distributions also can vary materially from year to year depending on a number of different factors, including the composition of the Fund’s portfolio, the level of allocations of net income and other tax items for the Fund from its underlying MLP investments, the length of time the Fund has owned the MLP equity securities in its portfolio, and the extent to which the Fund disposes of MLP equity securities during a particular year, including to meet Fund shareholder redemption requests as necessary. |
| | |
| | In general, a distribution constitutes a return of capital to a shareholder rather than a dividend to the extent such distribution exceeds the Fund’s current and accumulated earnings and profits. The portion of any distribution treated as a return of capital constitutes a tax-free return of capital to the extent of a shareholder’s cost basis in Fund shares and thereafter generally is taxable to the shareholder as a capital gain. A return-of-capital distribution also reduces the shareholder’s cost basis in Fund |
| HENNESSY FUNDS | 1-800-966-4354 | |
| | shares (but not below zero). A lower cost basis means that a shareholder recognizes more gain or less loss when the shareholder eventually sells Fund shares, which increases the shareholder’s tax liability. |
| | |
| | The Fund attempts to maintain a stable distribution rate and therefore may distribute more or less than the actual amount of cash it receives from its investments in a particular period. Any undistributed cash would be available to supplement future distributions, and until distributed would increase the Fund’s net asset value (“NAV”). Correspondingly, such amounts, once distributed, decrease the Fund’s NAV. In addition, the Fund may opt not to make distributions in quarters in which the Fund believes that a distribution could cause adverse tax consequences to shareholders, including when the Fund believes that a distribution may not constitute a tax-free return of capital as described above. |
| | |
| f). | Security Transactions – Investment and shareholder transactions are recorded on the trade date. The Fund determines the realized gain/loss from an investment transaction by comparing the original cost of the security lot sold with the net sale proceeds. Discounts and premiums on securities purchased are accreted or amortized, respectively, over the life of each such security. |
| | |
| g). | Use of Estimates – Preparing financial statements in accordance with GAAP requires management to make estimates and assumptions that affect the reported amounts of assets and liabilities and disclosure of contingent assets and liabilities at the date of the financial statements, as well as the reported change in net assets during the reporting period. Actual results could differ from those estimates. |
| | |
| h). | Share Valuation – The NAV per share of the Fund is calculated by dividing (i) the total value of the securities held by the Fund, plus cash and other assets, minus all liabilities (including estimated accrued expenses) by (ii) the total number of Fund shares outstanding, rounded to the nearest $0.01. Fund shares are not priced on days the New York Stock Exchange is closed for trading. The offering and redemption price per share for the Fund is equal to the Fund’s NAV per share. |
| | |
| i). | Partnership Accounting Policy – To the extent the Fund receives distributions from underlying partnerships in which it invests, the Fund records its pro rata share of income/loss and capital gains/losses and accordingly adjusts the cost basis of the underlying partnerships for return of capital. |
| | |
| j). | Illiquid Securities – Pursuant to Rule 22e-4 under the 1940 Act, the Fund has adopted a Liquidity Risk Management Program (the “Liquidity Program”). The Liquidity Program requires, among other things, that the Fund limit its illiquid investments to no more than 15% of its net assets. An illiquid investment is any investment that the Fund reasonably expects cannot be sold or disposed of by the Fund in current market conditions in seven calendar days or less without the sale or disposition significantly changing the market value of the investment. |
| | |
| k). | Recent Accounting Pronouncements and Regulatory Updates – In October 2020, the Securities and Exchange Commission (“SEC”) adopted new regulations governing the use of derivatives by registered investment companies (“Rule 18f-4”). Rule 18f-4 imposes limits on the amount of derivatives a fund can enter into, eliminates the asset segregation framework currently used by funds to comply with Section 18 of the 1940 Act, and requires funds whose use of derivatives is greater than a limited specified amount to establish and maintain a comprehensive derivatives risk management program and appoint a derivatives risk manager. The Fund has adopted procedures in accordance with Rule 18f-4. |
| NOTES TO THE FINANCIAL STATEMENTS |
| | In December 2020, the SEC adopted a new rule providing a framework for fund valuation practices (“Rule 2a-5”). Rule 2a-5 establishes requirements for determining fair value in good faith for purposes of the 1940 Act. Rule 2a-5 permits fund boards to designate certain parties to perform fair value determinations, subject to board oversight and certain other conditions. Rule 2a-5 also defines when market quotations are “readily available” for purposes of the 1940 Act and the threshold for determining whether a fund must fair value a security. In connection with Rule 2a-5, the SEC also adopted related recordkeeping requirements and is rescinding previously issued guidance, including with respect to the role of a board in determining fair value and the accounting and auditing of fund investments. The Fund has adopted procedures in accordance with Rule 2a-5. |
3). SECURITIES VALUATION
The Fund follows its valuation policies and procedures in determining its NAV and, in preparing these financial statements, the fair value accounting standards that establish an authoritative definition of fair value and set out a hierarchy for measuring fair value. These standards require additional disclosures about the various inputs and valuation techniques used to develop the measurements of fair value and a discussion of changes in valuation techniques and related inputs during the period. These inputs are summarized in the three broad levels listed below:
| | Level 1 – | Unadjusted, quoted prices in active markets for identical instruments that the Fund has the ability to access at the date of measurement. |
| | | |
| | Level 2 – | Other significant observable inputs (including, but not limited to, quoted prices in active markets for similar instruments, quoted prices in markets that are not active for identical or similar instruments, and model-derived valuations in which all significant inputs and significant value drivers are observable in active markets, such as interest rates, prepayment speeds, credit risk curves, default rates, and similar data). |
| | | |
| | Level 3 – | Significant unobservable inputs (including the Fund’s own assumptions about what market participants would use to price the asset or liability based on the best available information) when observable inputs are unavailable. |
The following is a description of the valuation techniques applied to the Fund’s major categories of assets and liabilities on a recurring basis:
| | Equity Securities – Equity securities, including common stocks, preferred stocks, foreign-issued common stocks, exchange-traded funds, closed-end mutual funds, partnerships, rights, MLPs, and real estate investment trusts, that are traded on a securities exchange for which a last-quoted sales price is readily available generally are valued at the last sales price as reported by the primary exchange on which the securities are listed. Securities listed on The Nasdaq Stock Market (“Nasdaq”) generally are valued at the Nasdaq Official Closing Price, which may differ from the last sales price reported. Securities traded on a securities exchange for which a last-quoted sales price is not readily available generally are valued at the mean between the bid and ask prices. To the extent these securities are actively traded and valuation adjustments are not applied, they are classified in Level 1 of the fair value hierarchy. Securities traded on foreign exchanges generally are not valued at the same time the Fund calculates its NAV because most foreign markets close well before such time. The earlier close of most foreign markets gives rise to the possibility that significant events, including broad market moves, may have occurred in the interim. In certain |
| HENNESSY FUNDS | 1-800-966-4354 | |
| | circumstances, it may be determined that a foreign security needs to be fair valued because it appears that the value of the security might have been materially affected by events occurring after the close of the market in which the security is principally traded, but before the time the Fund calculates its NAV, such as by a development that affects an entire market or region (e.g., a weather-related event) or a potentially global development (e.g., a terrorist attack that may be expected to have an effect on investor expectations worldwide). |
| | |
| | Registered Investment Companies – Investments in open-end registered investment companies, commonly referred to as mutual funds, generally are priced at the ending NAV provided by the applicable mutual fund’s service agent and are classified in Level 1 of the fair value hierarchy. |
| | |
| | Debt Securities – Debt securities, including corporate bonds, asset-backed securities, mortgage-backed securities, municipal bonds, U.S. Treasuries, and U.S. government agency issues, are generally valued at market on the basis of valuations furnished by an independent pricing service that utilizes both dealer-supplied valuations and formula-based techniques. The pricing service may consider recently executed transactions in securities of the issuer or comparable issuers, market price quotations (where observable), bond spreads, and fundamental data relating to the issuer. In addition, the model may incorporate observable market data, such as reported sales of similar securities, broker quotes, yields, bids, offers, and reference data. Certain securities are valued primarily using dealer quotations. These securities are generally classified in Level 2 of the fair value hierarchy. |
| | |
| | Short-Term Securities – Short-term equity investments, including money market funds, are valued in the manner specified above for equity securities. Short-term debt investments with an original term to maturity of 60 days or less are valued at amortized cost, which approximates fair market value. If the original term to maturity of a short-term debt investment exceeds 60 days, then the values as of the 61st day prior to maturity are amortized. Amortized cost is not used if its use would be inappropriate due to credit or other impairments of the issuer, in which case the security’s fair value would be determined as described below. Short-term securities are generally classified in Level 1 or Level 2 of the fair value hierarchy depending on the inputs used and market activity levels for specific securities. |
The Board of Trustees of the Fund (the “Board”) has adopted fair value pricing procedures that are followed when a price for a security is not readily available or if a significant event has occurred that indicates the closing price of a security no longer represents the true value of that security. Fair value pricing determinations are made in good faith in accordance with these procedures. There are numerous criteria considered in determining a fair value of a security, such as the trading volume of a security and markets, the values of other similar securities, and news events with direct bearing on a security or markets. Fair value pricing results in an estimated price for a security that reflects the amount the Fund might reasonably expect to receive in a current sale. Depending on the relative significance of the valuation inputs, these securities may be classified in either Level 2 or Level 3 of the fair value hierarchy.
The fair value of foreign securities may be determined with the assistance of a pricing service using correlations between the movement of prices of such securities and indices of domestic securities and other appropriate indicators, such as closing market prices of relevant American Depositary Receipts or futures contracts. Using fair value pricing means that the Fund’s NAV reflects the affected portfolio securities’ values as determined by the Board or its designee, pursuant to the fair value pricing procedures adopted by the
| NOTES TO THE FINANCIAL STATEMENTS |
Board, instead of being determined by the market. Using a fair value pricing methodology to price a foreign security may result in a value that is different from such foreign security’s most recent closing price and from the value used by other investment companies to calculate their NAVs. Such securities are generally classified in Level 2 of the fair value hierarchy. Because the Fund may invest in foreign securities, the value of the Fund’s portfolio securities may change on days when a shareholder is unable to purchase or redeem Fund shares.
The Board has delegated day-to-day valuation matters to the Valuation and Liquidity Committee comprising representatives from Hennessy Advisors, Inc., the Fund’s investment advisor (the “Advisor”). The function of the Valuation and Liquidity Committee, among other things, is to value securities where current and reliable market quotations are not readily available. All actions taken by the Valuation and Liquidity Committee are reviewed by the Board.
The Fund has performed an analysis of all existing investments to determine the significance and character of all inputs to their fair value determinations. Various inputs are used to determine the value of the Fund’s investments. The inputs or methodology used for valuing securities are not necessarily an indication of the risk associated with investing in those securities. Details related to the fair value hierarchy of the Fund’s securities as of October 31, 2022, are included in the Schedule of Investments.
4). INVESTMENT TRANSACTIONS
Purchases and sales of investment securities (excluding government and short-term investments) for the Fund during fiscal year 2022 were $14,908,969 and $13,383,147, respectively.
There were no purchases or sales/maturities of long-term U.S. government securities for the Fund during fiscal year 2022.
5). INVESTMENT ADVISORY FEE AND OTHER TRANSACTIONS WITH AFFILIATES
The Advisor provides the Fund with investment advisory services under an Investment Advisory Agreement. The Advisor furnishes all investment advice, office space, and facilities and most of the personnel needed by the Fund. As compensation for its services, the Advisor is entitled to a monthly fee from the Fund. The fee is based on the average daily net assets of the Fund at an annual rate of 1.10%. The net investment advisory fees expensed by the Fund during fiscal year 2022 are included in the Statement of Operations.
Prior to January 31, 2022, the Advisor delegated the day-to-day management of the Fund to a sub-advisor. Effective January 31, 2022, the sub-advisory agreement between BP Capital Fund Advisors, LLC and the Advisor was terminated. The Advisor paid the sub-advisory fees from its own assets, and these fees were not an additional expense of the Fund. From November 1, 2021, through January 31, 2022, the Advisor (not the Fund) paid a sub-advisory fee at the rate of 0.40% of the daily net assets of the Fund.
The Advisor has contractually agreed to limit total annual operating expenses to 1.75% of the Fund’s net assets for Investor Class shares and 1.50% of the Fund’s net assets for Institutional Class shares (in each case, excluding all federal, state, and local taxes, interest, brokerage commissions, dividend and interest expenses on short sales, extraordinary items, and acquired fund fees and expenses and other costs incurred in connection with the purchase and sale of securities) through February 28, 2023.
For three years following the date on which expenses were waived or incurred, the Advisor may recoup waived or reimbursed expenses from the Fund if total operating expenses, including such recoupment, does not exceed the expense limitation in effect
| HENNESSY FUNDS | 1-800-966-4354 | |
(i) at the time the Advisor waived or reimbursed such expenses and (ii) at the time the Advisor recoups such expenses. As of October 31, 2022, expenses subject to potential recovery for Investor Class and Institutional Class shares and the fiscal years in which they expire were as follows:
| | | Fiscal Year | | | Fiscal Year | | | Fiscal Year | | | | |
| | | 2023 | | | 2024 | | | 2025 | | | Total | |
| Investor Class | | $ | 22,658 | | | $ | 12,376 | | | $ | 13,391 | | | $ | 48,425 | |
| Institutional Class | | $ | 60,422 | | | $ | 26,693 | | | $ | 11,840 | | | $ | 98,955 | |
The amount of the expense reimbursement by the Advisor for Institutional Class shares set forth in the Statement of Operations is net of $543 that the Advisor recouped from the Fund during fiscal year 2022.
The Board has approved a Shareholder Servicing Agreement for Investor Class shares of the Fund, which compensates the Advisor for the non-investment advisory services it provides to the Fund. The Shareholder Servicing Agreement provides for a monthly fee paid to the Advisor at an annual rate of 0.10% of the average daily net assets of the Fund attributable to Investor Class shares. The shareholder service fees expensed by the Fund during fiscal year 2022 are included in the Statement of Operations.
The Fund has adopted a plan pursuant to Rule 12b-1 under the Investment Company Act of 1940, as amended, that authorizes payments in connection with the distribution of Fund shares at an annual rate of up to 0.25% of the Fund’s average daily net assets attributable to Investor Class shares. Even though the authorized rate is up to 0.25%, the Fund is currently only using up to 0.15% of its average daily net assets attributable to Investor Class shares for such purpose. Amounts paid under the plan may be spent on any activities or expenses primarily intended to result in the sale of shares, including, but not limited to, advertising, shareholder account servicing, printing and mailing of prospectuses to other than current shareholders, printing and mailing of sales literature, and compensation for sales and marketing activities or to financial institutions and others, such as dealers and distributors. The distribution fees expensed by the Fund during fiscal year 2022 are included in the Statement of Operations.
The Fund has entered into agreements with various brokers, dealers, and financial intermediaries in connection with the sale of Fund shares. The agreements provide for periodic payments of sub-transfer agent expenses by the Fund to the brokers, dealers, and financial intermediaries for providing certain shareholder maintenance services. These shareholder services include the pre-processing and quality control of new accounts, shareholder correspondence, answering customer inquiries regarding account status, and facilitating shareholder telephone transactions. The sub-transfer agent fees expensed by the Fund during fiscal year 2022, are included in the Statement of Operations.
U.S. Bancorp Fund Services, LLC, d/b/a U.S. Bank Global Fund Services (“Fund Services”) provides the Fund with administrative, accounting, and transfer agent services. As administrator, Fund Services is responsible for activities such as (i) preparing various federal and state regulatory filings, reports, and returns for the Fund, (ii) preparing reports and materials to be supplied to the Board, (iii) monitoring the activities of the Fund’s custodian, transfer agent, and accountants, and (iv) coordinating the preparation and payment of the Fund’s expenses and reviewing the Fund’s expense accruals. U.S. Bank N.A., an affiliate of Fund Services, serves as the Fund’s custodian. The servicing agreements between the Trust, Fund Services, and U.S. Bank N.A. contain a fee schedule that is inclusive of administrative, accounting, custody, and transfer agent fees. The administrative, accounting, custody, and transfer agent fees expensed by the Fund during fiscal year 2022 are included in the Statement of Operations. Fund Services has
| NOTES TO THE FINANCIAL STATEMENTS |
voluntarily waived all or a portion of its fees for the Fund. The fees voluntarily waived by Fund Services during fiscal year 2022 are included in the Statement of Operations.
Quasar Distributors, LLC, a wholly owned broker-dealer subsidiary of Foreside Financial Group, LLC, acts as the Fund’s principal underwriter in a continuous public offering of Fund shares.
The officers of the Fund are affiliated with the Advisor. With the exception of the Chief Compliance Officer and, for a portion of the fiscal year, the Senior Compliance Officer, such officers receive no compensation from the Fund for serving in their respective roles. The Fund, along with the other funds in the Hennessy Funds family (collectively, the “Hennessy Funds”), makes reimbursement payments on an equal basis to the Advisor for a portion of the salary and benefits associated with the office of the Chief Compliance Officer and, for a portion of the fiscal year, for all of the salary and benefits associated with the office of the Senior Compliance Officer. The compliance fees expensed by the Fund during fiscal year 2022 for reimbursement payments to the Advisor are included in the Statement of Operations.
6). GUARANTEES AND INDEMNIFICATIONS
Under the Hennessy Funds’ organizational documents, their officers and trustees are indemnified by the Hennessy Funds against certain liabilities arising out of the performance of their duties to the Hennessy Funds. Additionally, in the normal course of business, the Hennessy Funds enter into contracts with service providers that contain general indemnification clauses. The Fund’s maximum exposure under these arrangements is unknown as this would involve future claims that may be made against the Fund that have not yet occurred. Currently, the Fund expects the risk of loss to be remote.
7). LINE OF CREDIT
The Fund has an uncommitted line of credit with the other Hennessy Funds in the amount of the lesser of (i) $100,000,000 or (ii) 33.33% of each Hennessy Fund’s net assets, or 30% for the Hennessy Gas Utility Fund, the Hennessy Japan Fund, and the Hennessy Japan Small Cap Fund and 10% for the Fund. The line of credit is intended to provide any necessary short-term financing in connection with shareholder redemptions, subject to certain restrictions. The credit facility is with the Hennessy Funds’ custodian bank, U.S. Bank N.A. Borrowings under this arrangement bear interest at the bank’s prime rate and are secured by all of the Fund’s assets (as to its own borrowings only). During fiscal year 2022, the Fund had an outstanding average daily balance and a weighted average interest rate of $83,019 and 4.82%, respectively. The interest expensed by the Fund during fiscal year 2022 is included in the Statement of Operations. The maximum amount outstanding for the Fund during fiscal year 2022 was $7,076,000. As of October 31, 2022, the Fund had $287,000 outstanding under the line of credit.
8). FEDERAL TAX INFORMATION
As of October 31, 2022, the components of accumulated earnings (losses) for income tax purposes were as follows:
| | | Investments | |
| Cost of investments for tax purposes | | $ | 24,505,040 | |
| Gross tax unrealized appreciation | | $ | 19,354,933 | |
| Gross tax unrealized depreciation | | | (81,002 | ) |
| Net tax unrealized appreciation/(depreciation) | | $ | 19,273,931 | |
| HENNESSY FUNDS | 1-800-966-4354 | |
As of October 31, 2022, deferred tax assets consisted of the following:
| Deferred tax assets (liabilities): | | | |
| Net operating losses | | $ | 348,392 | |
| Capital loss | | | 4,677,896 | |
| Unrealized (gain) loss on investments | | | (3,062,109 | ) |
| Total deferred tax assets, net | | | 1,964,179 | |
| Valuation allowance | | | (1,964,179 | ) |
| Net | | $ | — | |
For fiscal year 2022, the Fund had an effective tax rate of 0% and a federal statutory rate of 21%, with the difference resulting from a change in the balances of the deferred tax assets and liability and the related valuation allowance applied against the deferred tax assets and liability.
Deferred income tax assets and liabilities are recorded for differences between the financial statement and tax basis of the assets and liabilities that will result in taxable or deductible amounts in the future based on enacted laws and rates applicable to the periods in which the differences are expected to affect taxable income. Valuation allowances are established when necessary to reduce deferred tax assets to the amount expected to be realized. The Fund has evaluated the available evidence supporting the realization of its gross deferred tax assets, including the amount and timing of future taxable income, and has determined that, based on net losses to date, it may not utilize all of its deferred tax assets in the future. As of October 31, 2022, the Fund established a valuation allowance in the amount of $1,964,179 against its net deferred tax assets.
The Fund may carry forward any net capital loss five years to offset any future realized capital gains. The Fund may carry forward indefinitely any net operating loss arising in a tax year ending after December 31, 2018. As of October 31, 2022, the Fund had $20,663,230 in capital loss carryforwards that expire as follows:
| | Amount | | Expiration | |
| | $ | 4,512,944 | | 10/31/2023 | |
| | | 8,971,423 | | 10/31/2024 | |
| | | 7,178,863 | | 10/31/2025 | |
As of October 31, 2022, the Fund had $1,587,454 in net operating loss carryforwards that expire as follows:
| | Amount | | Expiration | |
| | $ | 1,587,454 | | Indefinite | |
Total income taxes have been computed by applying the federal statutory income tax rate of 21% plus a blended state income tax rate. The Fund applied this effective rate to net investment income and realized and unrealized gains on investments before taxes in computing its total income taxes.
| | Tax expense (benefit) at statutory rates | | $ | 1,687,801 | |
| | State income tax expense, net of federal benefit | | | 103,750 | |
| | Tax expense (benefit) on permanent items(1) | | | (22,052 | ) |
| | Tax expense (benefit) on expired carryforwards | | | — | |
| | Tax expense (benefit) due to change in effective state rates | | | — | |
| | Total current tax expense (benefit) | | | — | |
| | Change in valuation allowance | | | (1,769,499 | ) |
| | Total tax expense | | $ | — | |
| | (1) Permanent items consist of dividends-received deductions. |
| NOTES TO THE FINANCIAL STATEMENTS |
The Fund recognizes the tax benefits of uncertain tax positions only where the position is “more likely than not” to be sustained assuming examination by tax authorities. Management has analyzed the Fund’s tax positions in all open tax years and has concluded that no liability for unrecognized tax benefits should be recorded related to uncertain tax positions taken on U.S. federal tax returns and state tax returns filed or expected to be filed. No income tax returns are currently under examination. Generally, the tax returns of the Fund for the prior three fiscal years are open for examination. Due to the nature of the Fund’s investments, the Fund may be required to file income tax returns in several states. The Fund is not aware of any tax positions for which it is reasonably possible that the total amounts of unrecognized tax benefits will change materially.
During fiscal years 2022 (estimated) and 2021, the tax character of distributions paid by the Fund was as follows:
| | | Year Ended | | | Year Ended | |
| | | October 31, 2022 | | | October 31, 2021 | |
Ordinary income(1) | | $ | 261,719 | | | $ | — | |
| Long-term capital gains | | | — | | | | — | |
| Return of capital | | | 4,359,147 | | | | 4,176,540 | |
| Total distributions | | $ | 4,620,866 | | | $ | 4,176,540 | |
(1) Ordinary income includes short-term capital gains.
9). MARKET DISRUPTION AND GEOPOLITICAL RISKS
Certain local, regional, or global events such as wars, terrorism, pandemics or other public health mattes, and other geopolitical events could have a significant impact on securities markets generally or individual securities or instruments. For example, following Russia’s invasion of Ukraine, the President of the United States signed an Executive Order in February 2022 prohibiting U.S. persons from entering transactions with the Central Bank of Russia. Similarly, in June 2021, the President of the United States signed an Executive Order affirming and expanding the U.S. policy prohibiting U.S. persons from purchasing or investing in publicly-traded securities of companies identified by the U.S. Government as “Chinese Military-Industrial Complex Companies.” The list of such companies can change from time to time and the Advisor may be forced to hold securities it desires to sell or to sell securities it desires to buy, or the Advisor may not be able to participate in an investment it otherwise believes is attractive. The occurrence and duration of these types of events are hard to predict and could adversely affect the Fund’s performance.
10). EVENTS SUBSEQUENT TO YEAR END
Management has evaluated the Fund’s related events and transactions that occurred subsequent to October 31, 2022, through the date of issuance of the Fund’s financial statements. Other than as disclosed below, management has determined that there were no subsequent events requiring recognition or disclosure in the financial statements.
On December 1, 2022, distributions were declared and paid to shareholders of record on November 30, 2022, as follows:
| | | Return of Capital | |
| | Investor Class | $0.2575 | |
| | Institutional Class | $0.2575 | |
| HENNESSY FUNDS | 1-800-966-4354 | |
Report of Independent Registered Public
Accounting Firm
To the Board of Trustees of Hennessy Funds Trust
and the shareholders of the Hennessy Midstream Fund
Novato, CA
Opinion on the Financial Statements
We have audited the accompanying statement of assets and liabilities of the Hennessy Midstream Fund (the “Fund”), a series of Hennessy Funds Trust, including the schedule of investments, as of October 31, 2022, the related statement of operations for the year then ended, the statements of changes in net assets for each of the two years in the period then ended, financial highlights for each of the three years in the period then ended, for the eleven months ended October 31, 2018, and each of the two years in the period ended November 30, 2017, and the related notes (collectively referred to as the “financial statements”). In our opinion, the financial statements present fairly, in all material respects, the financial position of the Fund as of October 31, 2022, the results of its operations for the year then ended, the changes in its net assets for each of the two years in the period then ended and the financial highlights for each of the three years in the period then ended, for the eleven months ended October 31, 2018, and each of the two years in the period ended November 30, 2017, in conformity with accounting principles generally accepted in the United States of America.
Basis for Opinion
These financial statements are the responsibility of the Fund’s management. Our responsibility is to express an opinion on the Fund’s financial statements based on our audits. We are a public accounting firm registered with the Public Company Accounting Oversight Board (United States) (“PCAOB”) and are required to be independent with respect to the Fund in accordance with the U.S. federal securities laws and the applicable rules and regulations of the Securities and Exchange Commission and the PCAOB. We have served as the auditor of one or more of the funds in the Trust since 2002.
We conducted our audits in accordance with the standards of the PCAOB. Those standards require that we plan and perform the audit to obtain reasonable assurance about whether the financial statements are free of material misstatement, whether due to error or fraud. The Fund is not required to have, nor were we engaged to perform, an audit of its internal control over financial reporting. As part of our audits we are required to obtain an understanding of internal control over financial reporting, but not for the purpose of expressing an opinion on the effectiveness of the Fund’s internal control over financial reporting. Accordingly, we express no such opinion.
Our audits included performing procedures to assess the risks of material misstatement of the financial statements, whether due to error or fraud, and performing procedures that respond to those risks. Such procedures included examining, on a test basis, evidence regarding the amounts and disclosures in the financial statements. Our audits also included evaluating the accounting principles used and significant estimates made by management, as well as evaluating the overall presentation of the financial statements. Our procedures included confirmation of securities owned as of October 31, 2022, by correspondence with the custodian. We believe that our audits provide a reasonable basis for our opinion.
| | |
| | TAIT, WELLER & BAKER LLP |
Philadelphia, Pennsylvania
December 22, 2022
| REPORT OF INDEPENDENT REGISTERED PUBLIC ACCOUNTING FIRM/TRUSTEES AND OFFICERS |
Trustees and Officers of the Fund (Unaudited)
The business and affairs of the Funds are managed under the direction of the Board of Trustees of the Trust, and the Board of Trustees elects the officers of the Trust. From time to time, the Board of Trustees also has appointed advisers to the Board of Trustees (“Advisers”) with the intention of having qualified individuals serve in an advisory capacity to garner experience in the mutual fund and asset management industry and be considered as potential Trustees in the future. There are currently two Advisers, Brian Alexander and Doug Franklin. As Advisers, Mr. Alexander and Mr. Franklin attend meetings of the Board of Trustees and act as non-voting participants. Information pertaining to the Trustees, Advisers, and the officers of the Trust is set forth below. The Trustees and officers serve until their successors are duly elected and qualified or until their earlier death, resignation, or removal. Each Trustee oversees all 16 Hennessy Funds. Unless otherwise indicated, the address of all persons listed below is 7250 Redwood Boulevard, Suite 200, Novato, CA 94945. The Fund’s Statement of Additional Information includes more information about the persons listed below and is available without charge by calling 1-800-966-4354 or by visiting www.hennessyfunds.com.
| | | | Other |
| | | | Directorships |
| | | | Held Outside |
| Name, Age, | | | of Fund |
| and Position Held | Start Date | Principal Occupation(s) | Complex During |
with the Trust | of Service | During Past Five Years | Past Five Years |
| Disinterested Trustees and Advisers | | | |
| | | | |
| J. Dennis DeSousa | January 1996 | Mr. DeSousa is a real estate investor. | None. |
| 86 | | | |
| Trustee | | | |
| | | | |
| Robert T. Doyle | January 1996 | Mr. Doyle is retired. He served as the | None. |
| 75 | | Sheriff of Marin County, California | |
| Trustee | | from 1996 – June 2022. | |
| | | | |
| Claire Garvie | December 2015 | Ms. Garvie is a founder of Kiosk and | None. |
| 48 | as an Adviser | has served as its Chief Operating | |
| Trustee | to the Board | Officer since 2004. Kiosk is a full- | |
| | and | service marketing agency with | |
| | December 2021 | offices in the San Francisco Bay Area | |
| | as a Trustee | and Liverpool, UK and staff across | |
| | | nine states in the U.S. | |
| | | | |
| Gerald P. Richardson | May 2004 | Mr. Richardson is an independent | None. |
| 77 | | consultant in the securities industry. | |
| Trustee | | | |
| HENNESSY FUNDS | 1-800-966-4354 | |
| | | | Other |
| | | | Directorships |
| | | | Held Outside |
| Name, Age, | | | of Fund |
| and Position Held | Start Date | Principal Occupation(s) | Complex During |
with the Trust | of Service | During Past Five Years | Past Five Years |
| Brian Alexander | March 2015 | Mr. Alexander has worked for the | None. |
| 41 | | Sutter Health organization since | |
| Adviser to the Board | | 2011 in various positions. He has | |
| | | served as the Chief Executive Officer | |
| | | of the North Valley Hospital Area | |
| | | since 2021. From 2018 to 2021, he | |
| | | served as the Chief Executive Officer | |
| | | of Sutter Roseville Medical Center. | |
| | | From 2016 through 2018, he served | |
| | | as the Vice President of Strategy for | |
| | | the Sutter Health Valley Area, which | |
| | | includes 11 hospitals, 13 ambulatory | |
| | | surgery centers, 16,000 employees, | |
| | | and 1,900 physicians. | |
| | | | |
| Doug Franklin | March 2016 | Mr. Franklin is a retired insurance | None. |
| 58 | | industry executive. From 1987 | |
| Adviser to the Board | | through 2015, he was employed by | |
| | | the Allianz-Fireman’s Fund Insurance | |
| | | Company in various positions, | |
| | | including as its Chief Actuary and | |
| | | Chief Risk Officer. | |
| | | | |
Interested Trustee(1) | | | |
| | | | |
| Neil J. Hennessy | January 1996 as | Mr. Hennessy has been employed | Hennessy |
| 66 | a Trustee and | by Hennessy Advisors, Inc. since | Advisors, Inc. |
| Chairman of the Board, | June 2008 as | 1989 and currently serves as its | |
| Chief Market Strategist, | an officer | Chairman and Chief Executive Officer. | |
| Portfolio Manager, | | | |
| and President | | | |
| | | | |
| Name, Age, | | | |
| and Position Held | Start Date | Principal Occupation(s) | |
with the Trust | of Service | During Past Five Years | |
| Officers | | | |
| | | | |
| Teresa M. Nilsen | January 1996 | Ms. Nilsen has been employed by Hennessy Advisors, Inc. | |
| 56 | | since 1989 and currently serves as its President, Chief | |
| Executive Vice President | | Operating Officer, and Secretary. | |
| and Treasurer | | | |
| | | | |
| Daniel B. Steadman | March 2000 | Mr. Steadman has been employed by Hennessy Advisors, Inc. | |
| 66 | | since 2000 and currently serves as its Executive Vice President. | |
| Executive Vice President’ | | | |
| and Secretary | | | |
| | | | |
| Brian Carlson | December 2013 | Mr. Carlson has been employed by Hennessy Advisors, Inc. | |
| 50 | | since December 2013 and currently serves as its Chief | |
| Senior Vice President | | Compliance Officer and Senior Vice President. | |
| and Head of Distribution | | | |
| TRUSTEES AND OFFICERS OF THE FUND |
| Name, Age, | | |
| and Position Held | Start Date | Principal Occupation(s) |
with the Trust | of Service | During Past Five Years |
Jennifer Cheskiewicz(2) | June 2013 | Ms. Cheskiewicz has been employed by Hennessy Advisors, Inc. |
| 45 | | as its General Counsel since June 2013. |
| Senior Vice President and | | |
| Chief Compliance Officer | | |
| | | |
David Ellison(3) | October 2012 | Mr. Ellison has been employed by Hennessy Advisors, Inc. since |
| 64 | | October 2012. He has served as a Portfolio Manager of the |
| Senior Vice President | | Hennessy Large Cap Financial Fund and the Hennessy Small |
| and Portfolio Manager | | Cap Financial Fund since their inception. Mr. Ellison also served |
| | | as a Portfolio Manager of the Hennessy Technology Fund from |
| | | its inception until February 2017. Mr. Ellison served as Director, |
| | | CIO, and President of FBR Fund Advisers, Inc. from December |
| | | 1999 to October 2012. |
| | | |
Ryan Kelley(4) | March 2013 | Mr. Kelley has been employed by Hennessy Advisors, Inc. since |
| 50 | | October 2012. He has served as Chief Investment Officer of the |
| Chief Investment Officer, | | Hennessy Funds since March 2021 and has served as a Portfolio |
| Senior Vice President, | | Manager of the Hennessy Gas Utility Fund, the Hennessy Large |
| and Portfolio Manager | | Cap Financial Fund, and the Hennessy Small Cap Financial Fund |
| | | since October 2014. Mr. Kelley served as Co-Portfolio Manager |
| | | of these same funds from March 2013 through September |
| | | 2014 and as a Portfolio Analyst for the Hennessy Funds from |
| | | October 2012 through February 2013. He has also served as a |
| | | Portfolio Manager of the Hennessy Cornerstone Growth Fund, |
| | | the Hennessy Cornerstone Mid Cap 30 Fund, the Hennessy |
| | | Cornerstone Large Growth Fund, and the Hennessy |
| | | Cornerstone Value Fund since February 2017 and as a Portfolio |
| | | Manager of the Hennessy Total Return Fund, the Hennessy |
| | | Balanced Fund, and the Hennessy Technology Fund since May |
| | | 2018. He served as Co-Portfolio Manager of the Hennessy |
| | | Technology Fund from February 2017 until May 2018. Mr. Kelley |
| | | served as Portfolio Manager of FBR Fund Advisers, Inc. from |
| | | January 2008 to October 2012. |
| | | |
L. Joshua Wein(4) | September 2018 | Mr. Wein has been employed by Hennessy Advisors, Inc. since |
| 49 | | 2018. He has served as Co-Portfolio Manager of the Hennessy |
| Vice President and | | Cornerstone Growth Fund, the Hennessy Cornerstone |
| Co-Portfolio Manager | | Mid Cap 30 Fund, the Hennessy Cornerstone Large Growth |
| | | Fund, the Hennessy Cornerstone Value Fund, Hennessy Total |
| | | Return Fund, the Hennessy Balanced Fund, the Hennessy Gas |
| | | Utility Fund, and the Hennessy Technology Fund since February |
| | | 2019. He served as a Senior Analyst of these same funds from |
| | | September 2018 through February 2019. Mr. Wein served as |
| | | Director of Alternative Investments and Co-Portfolio Manager |
| | | at Sterling Capital Management from 2008 to 2018. |
_______________
(1) | Mr. Hennessy is considered an “interested person,” as defined in the Investment Company Act of 1940, as amended, because he is an officer of the Trust. |
(2) | The address of this officer is 4800 Bee Caves Road, Suite 100, Austin, TX 78746. |
(3) | The address of this officer is 101 Federal Street, Suite 1615B, Boston, MA 02110. |
(4) | The address of this officer is 1340 Environ Way, Chapel Hill, NC 27517. |
| HENNESSY FUNDS | 1-800-966-4354 | |
Expense Example (Unaudited)
October 31, 2022
As a shareholder of the Fund, you incur ongoing costs, including management fees, service fees, and other Fund expenses. This Example is intended to help you understand your ongoing costs (in dollars) of investing in the Fund and to compare these costs with the ongoing costs of investing in other mutual funds. The Example is based on an investment of $1,000 invested at the beginning of the period and held for the entire period from May 1, 2022, through October 31, 2022.
Actual Expenses
In the table below, the first line under each of the “Investor Class” and “Institutional Class” headings provides information about actual account values and actual expenses for each share class. You may use this information, together with the amount you invested, to estimate the expenses that you paid over the period. Simply divide your account value by $1,000 (for example, an $8,600 account value divided by $1,000 = 8.6), then multiply the result by the number in the first line under the heading “Expenses Paid During Period” to estimate the expenses you paid on your account during this period. Although the Fund charges no sales loads or transaction fees, you will be assessed fees for outgoing wire transfers, returned checks, and stop payment orders at prevailing rates charged by U.S. Bank Global Fund Services, the Fund’s transfer agent. If you request that a redemption be made by wire transfer, the Fund’s transfer agent charges a $15 fee. IRAs are charged a $15 annual maintenance fee (up to $30 maximum per shareholder for shareholders with multiple IRAs). The examples below include, but are not limited to, management, shareholder servicing, accounting, custody, and transfer agent fees. However, the examples below do not include portfolio trading commissions and related expenses.
Hypothetical Example for Comparison Purposes
In the table below, the second line under each of the “Investor Class” and “Institutional Class” headings provides information about hypothetical account values and hypothetical expenses based on the Fund’s actual expense ratio for each share class and an assumed rate of return of 5% per year before expenses, which is not the Fund’s actual return for such share class. The hypothetical account values and expenses may not be used to estimate the actual ending account balance or expenses you paid for the period. You may use this information to compare the ongoing costs of investing in the Fund and other funds. To do so, compare these 5% hypothetical examples with the 5% hypothetical examples that appear in the shareholder reports of the other funds. Please note that the expenses shown in the table are meant to highlight your ongoing costs only. Therefore, the second lines under “Investor Class” and “Institutional Class” are useful in comparing ongoing costs only and will not help you determine the relative total costs of owning different funds.
| | | | Expenses Paid |
| | Beginning | Ending | During Period(1) |
| | Account Value | Account Value | May 1, 2022 – |
| | May 1, 2022 | October 31, 2022 | October 31, 2022 |
| Investor Class | | | |
| Actual | $1,000.00 | $1,083.10 | $9.29 |
| Hypothetical (5% return before expenses) | $1,000.00 | $1,016.28 | $9.00 |
| | | | |
| Institutional Class | | | |
| Actual | $1,000.00 | $1,084.80 | $7.99 |
| Hypothetical (5% return before expenses) | $1,000.00 | $1,017.54 | $7.73 |
(1) | Expenses are equal to the Fund’s annualized expense ratio of 1.77% for Investor Class shares or 1.52% for Institutional Class shares, as applicable, multiplied by the average account value over the period, multiplied by 184/365 days (to reflect the half-year period). |
| HENNESSY FUNDS | 1-800-966-4354 | |
How to Obtain a Copy of the Fund’s Proxy
Voting Policy and Proxy Voting Records
A description of the policies and procedures the Fund uses to determine how to vote proxies relating to portfolio securities is available without charge (1) by calling 1-800-966-4354, (2) on the Hennessy Funds’ website at www.hennessyfunds.com/proxy-voting/voting-policy, or (3) on the U.S. Securities and Exchange Commission’s (the “SEC”) website at www.sec.gov. The Fund’s proxy voting record is available without charge on both the Hennessy Funds’ website at www.hennessyfunds.com/proxy-voting/voting-record and the SEC’s website at www.sec.gov no later than August 31 for the prior 12 months ending June 30.
Availability of Quarterly Portfolio Schedule
The Fund files a complete schedule of portfolio holdings with the SEC for the first and third quarters of each fiscal year as an exhibit to its reports on Form N-PORT. The Fund’s Form N-PORT reports are available on the SEC’s website at www.sec.gov or on request by calling 1-800-966-4354.
Important Notice Regarding Delivery
of Shareholder Documents
To help keep the Fund’s costs as low as possible, we generally deliver a single copy of shareholder reports, proxy statements, and prospectuses to shareholders who share an address and have the same last name. This process does not apply to account statements. You may request an individual copy of a shareholder document at any time. If you would like to receive separate mailings of shareholder documents, please call U.S. Bank Global Fund Services at 1-800-261-6950 or 1-414-765-4124, and individual delivery will begin within 30 days of your request. If your account is held through a financial institution or other intermediary, please contact such intermediary directly to request individual delivery.
Electronic Delivery
As permitted by SEC regulations, the Fund’s shareholder reports are made available on a website, and unless you sign for eDelivery or elect to receive paper copies as detailed below, you will be notified by mail each time a report is posted and provided with a website link to access the report.
The Fund also offers shareholders the option to receive all notices, account statements, prospectuses, tax forms, and shareholder reports electronically. To sign up for eDelivery or change your delivery preference, please visit www.hennessyfunds.com/account.
To elect to receive paper copies of all future reports free of charge, please call U.S. Bank Global Fund Services at 800-261-6950 or 414-765-4124.
Subscribe to receive our team’s unique market and sector insights delivered to your inbox
www.hennessyfunds.com/subscribe
Follow us on social media
| PROXY VOTING — PRIVACY POLICY |
Liquidity Risk Management Program
In accordance with Rule 22e-4 under the Investment Company Act of 1940, as amended (the “Liquidity Rule”), we have adopted and implemented a liquidity risk management program (the “Liquidity Program”). The purpose of the Liquidity Program is to assess and manage the Fund’s liquidity risk, which is the risk that the Fund would not be able to meet requests to redeem Fund shares without significant dilution of the remaining shareholders’ interests in the Fund. The Board of Trustees of the Fund (the “Board”) designated a committee comprising representatives of Hennessy Advisors, Inc., the investment adviser to the Fund, as the administrator of the Liquidity Program (the “Program Administrator”).
The Program Administrator provided a written report regarding the Liquidity Program to the Board in advance of its meeting on June 1, 2022. The report covered the period from June 1, 2021, through May 31, 2022. The report addressed the operation of the Liquidity Program, assessed the adequacy and effectiveness of its implementation, and described any material changes to the Liquidity Program during the review period. The Trust’s chief compliance officer presented the report to the Board at the meeting and provided additional information regarding the Liquidity Program. The Board reviewed the Liquidity Program and considered, among other items, the following:
| | 1. | The Program Administrator reviewed daily historical net redemption activity during the review period and during prior periods with higher-than-average redemption activity and concluded that the Fund has historically been able to meet requests to redeem Fund shares without significant dilution to the Fund’s remaining shareholders, and the Program Administrator expects the Fund to be able to continue to do so in the future during both normal and reasonably foreseeable stressed conditions. |
| | | |
| | 2. | The Fund primarily holds assets that are highly liquid investments and is therefore not required to establish a highly liquid investment minimum for the Fund or adopt policies and procedures for responding to a highly liquid investment minimum shortfall. |
| | | |
| | 3. | The Program Administrator did not make any material changes to the Liquidity Program during the review period and was not recommending any changes to the Liquidity Program or the model inputs used to determine the liquidity classification of each security held by the Fund. |
| | | |
| | 4. | The Program Administrator concluded that the Liquidity Program was reasonably designed to assess and manage the Fund’s liquidity risk, complies with the requirements of the Liquidity Rule, and was operating as intended during the review period. |
Privacy Policy
We collect the following personal information about you:
| | 1. | Information we receive from you in applications or other forms, correspondence, or conversations, including, but not limited to, your name, address, phone number, social security number, assets, income, and date of birth; |
| | | |
| | 2. | Information about your transactions with us, our affiliates, or others, including, but not limited to, your account number and balance, payments history, parties to transactions, cost basis information, and other financial information; and |
| HENNESSY FUNDS | 1-800-966-4354 | |
| | 3. | Other personal information we collect from various sources, even if you have not entered into a prior transaction with us, including the following: |
| | | • | Name, alias, address, unique personal identifier, online identifier, IP address, email address, telephone number, account name, and other similar identifiers; |
| | | | |
| | | • | Age and marital status; |
| | | | |
| | | • | Commercial information, including records of products purchased; |
| | | | |
| | | • | Browsing history, search history, and information on interaction with our website; |
| | | | |
| | | • | Geolocation data; |
| | | | |
| | | • | Employment and employment history, educational history, financial information, and purchasing and consuming histories or tendencies; and |
| | | | |
| | | • | Inferences drawn from the above-listed information to create a profile about your preferences, characteristics, predispositions, and behavior. |
We collect this information directly from you, indirectly in the course of providing services to you, directly and indirectly from your activity on our website, from broker dealers, marketing agencies, and other third parties that interact with us in connection with the services we perform and products we offer, and from anonymized and aggregated consumer information.
We use this information to fulfill the reason you provided the information to us, to provide you with other relevant products that you request from us, to provide you with information about products that may interest you, to improve our website or present our website’s contents to you, and as otherwise described to you when collecting your personal information.
We do not disclose any personal information to unaffiliated third parties, except as permitted by law. We may disclose your personal information to our affiliates, vendors, and service providers for a business purpose. For example, we are permitted by law to disclose all of the information we collect, as described above, to our transfer agent to process your transactions. When disclosing your personal information to third parties, we enter into a contract with each third party describing the purpose of such disclosure and requiring that such personal information be kept confidential and not used for any purpose except to perform the services contracted or respond to regulatory or law enforcement requests.
Furthermore, we restrict access to your personal information to those persons who require such information to provide products or services to you. As a result, we do not provide a means for opting out of our limited sharing of your information. We maintain physical, electronic, and procedural safeguards that comply with federal standards to guard your personal information.
If you hold shares of the Funds through a financial intermediary, including, but not limited to, a broker-dealer, bank, or trust company, the privacy policy of your financial intermediary governs how your personal information is shared with unaffiliated third parties.
Supplemental Privacy Notice for Residents of California
The California Consumer Privacy Act of 2018 (the “CCPA”) provides you, as a California resident, with certain additional rights relating to your personal information.
Under the CCPA, you have the right to request that we disclose to you the categories of personal information we have collected about you over the past 12 months, the categories of sources of such information, our business purpose for collecting the information, the categories of third parties, if any, with whom we shared the information, and the specific information we have collected about you. You also have the right to request that we delete any of your personal information, and, unless an exception applies, we will delete such information upon receiving and confirming your request. To make a request, call us at 1-800-966-4354, email us at privacy@hennessyfunds.com, or go to www.hennessyfunds.com/contact. We will not discriminate against you for exercising your rights under the CCPA. Further, we will not collect additional categories of your personal information or use the personal information we collected for materially different, unrelated, or incompatible purposes without providing you notice.
| HENNESSY FUNDS | 1-800-966-4354 | |
(This Page Intentionally Left Blank.)
For information, questions, or assistance, please call
The Hennessy Funds
1-800-966-4354 or 1-415-899-1555
INVESTMENT ADVISOR
Hennessy Advisors, Inc.
7250 Redwood Boulevard, Suite 200
Novato, California 94945
ADMINISTRATOR,
TRANSFER AGENT,
DIVIDEND PAYING AGENT, &
SHAREHOLDER SERVICING AGENT
U.S. Bancorp Fund Services, LLC
d/b/a U.S. Bank Global Fund Services
P.O. Box 701
Milwaukee, Wisconsin 53201-0701
CUSTODIAN
U.S. Bank N.A.
Custody Operations
1555 North River Center Drive, Suite 302
Milwaukee, Wisconsin 53212
TRUSTEES
Neil J. Hennessy
Robert T. Doyle
J. Dennis DeSousa
Claire Garvie
Gerald P. Richardson
COUNSEL
Foley & Lardner LLP
777 East Wisconsin Avenue
Milwaukee, Wisconsin 53202-5306
INDEPENDENT REGISTERED
PUBLIC ACCOUNTING FIRM
Tait, Weller & Baker LLP
Two Liberty Place
50 South 16th Street, Suite 2900
Philadelphia, Pennsylvania 19102-2529
DISTRIBUTOR
Quasar Distributors, LLC
111 East Kilbourn Avenue, Suite 1250
Milwaukee, Wisconsin 53202
www.hennessyfunds.com | 800-966-4354
This report has been prepared for shareholders and may be distributed to
others only if preceded or accompanied by a current prospectus.
ANNUAL REPORT
OCTOBER 31, 2022
HENNESSY GAS UTILITY FUND
Investor Class GASFX
Institutional Class HGASX
www.hennessyfunds.com | 1-800-966-4354
(This Page Intentionally Left Blank.)
Contents
| Letter to Shareholders | | 2 |
| Performance Overview | | 6 |
| Financial Statements | | |
| Schedule of Investments | | 9 |
| Statement of Assets and Liabilities | | 13 |
| Statement of Operations | | 14 |
| Statements of Changes in Net Assets | | 15 |
| Financial Highlights | | 16 |
| Notes to the Financial Statements | | 20 |
| Report of Independent Registered Public Accounting Firm | | 29 |
| Trustees and Officers of the Fund | | 30 |
| Expense Example | | 34 |
| Proxy Voting Policy and Proxy Voting Records | | 36 |
| Availability of Quarterly Portfolio Schedule | | 36 |
| Federal Tax Distribution Information | | 36 |
| Important Notice Regarding Delivery of Shareholder Documents | | 36 |
| Electronic Delivery | | 36 |
| Liquidity Risk Management Program | | 37 |
| Privacy Policy | | 37 |
| HENNESSY FUNDS | 1-800-966-4354 | |
December 2022
Dear Hennessy Funds Shareholder:
What a year it has been. By the close of the second trading day of 2022, we witnessed new all-time highs in both the S&P 500® Index and the Dow Jones Industrial Average, while the Nasdaq Composite Index hit its all-time high in November 2021. The market’s triumph was short lived, however. By the last day of our fiscal year on October 31, 2022, all three major indices were down significantly, with bleak year-to-date total returns of -8.42%, -17.70%, and -29.32% for the Dow, the S&P 500, and the Nasdaq, respectively. After almost 13 years of incredible resilience following the Financial Crisis of 2008, the equity markets have been shaken by stinging inflation, rapidly rising interest rates, soaring energy costs, and slowing economic growth teetering on recession. While many investors would like to forget 2022, we prefer to maintain perspective in this market downturn.
Time, time, time…. is on my side, yes, it is!
-Rolling Stones, 1964
We believe time is on our side… when it comes to investing. Experiencing negative market movements on any given day can seem disappointing. Downdrafts lasting a month can feel relentless. Almost a full year of negative returns with little respite along the way? That is downright painful. However, equities generally trend up and to the right. Over the past 100 calendar years, the Dow had an average annual total return of 10.25%. While we admit that long-term returns like these make it easy to be a “consummate bull,” market bulls have been right over the long-term. Yet over shorter periods, market returns can be “choppy.”
Looking at the chart below depicting annual total returns of the Dow Jones Industrial Average from 1950 to 2021, we see how volatile the market can be on an annual basis. Investors experienced 16 years of negative returns during this time, the most painful being -31.93% in 2008.
Time is what smooths out choppy markets. When we extend our investing intervals, and stop focusing on annual returns, the ups and downs feel less and less – and appear less and less. The two charts below depict the three-year and five-year rolling average total returns of the Dow over the same time period as the chart above. Each chart shows decreased volatility, with lower peaks and higher troughs, even though the charts show the same cumulative return of the Dow over the past 71 full calendar years.
When we extend our chart out to ten-year rolling averages, we can clearly see how investing over the long-term can make an investor bullish. In the past 71 years, there has never been a negative 10-year rolling average total return of the Dow. Never. The worst ten-year rolling average total return was a positive 0.29%, from 1965 to 1974, a period including the Great Inflation of the 1970s marked by dismal total returns of -13.28% in 1973 and -23.58% in 1974. The ten-year period from 2000 to 2009, which included the Financial Crisis of 2008, produced a positive average annual total return of 1.31%. Note that in the chart below, the line never crosses below zero.
| HENNESSY FUNDS | 1-800-966-4354 | |
When it comes to investing, time, time, time… is on our side, yes, it is! This is why we invest for the long term at Hennessy, focusing on fundamentals, valuations, and strong businesses, ever mindful of downside risk.
Value investing proved its worth this year, and many of our Funds did as well. The Russell 1000® Value Index was only down -7.00% during our fiscal year ended October 31, 2022, trouncing the Russell 1000® Growth Index’s total return of -24.60%. In addition, most of our Funds outperformed the broader market as well as their benchmarks. During the twelve months ended October 31, 2022, the Dow, the S&P 500, and the Nasdaq dropped -6.74%, -14.61%, and -28.56%, respectively, on a total return basis. During this time period when these three major indices saw significant declines, we were pleased that seven of our 16 Funds posted positive total returns, 11 of our 14 domestic Funds outperformed the S&P 500, and over two-thirds of our actively managed, domestic funds outperformed their primary benchmarks.
Top performers of the year included three of our Funds focused on the Energy and Utilities sectors. These sectors have benefitted from the rising cost of energy, as well as an increase in demand that has outpaced growth in supply. The Hennessy Energy Transition Fund, the Hennessy Midstream Fund, and the Hennessy Gas Utility Fund performed exceptionally well with positive total returns of 49.24%, 24.03%, and 10.14%, respectively, during the twelve-month period ended October 31, 2022. On a different note, our two international funds continue to be adversely affected by softening economies in Asia, rising interest rates, and growth to value rotation. The Hennessy Japan Fund and the Hennessy Japan Small Cap Fund experienced negative total returns of -37.86% and -27.35%, respectively, during our fiscal year.
Notwithstanding a difficult market environment over the last twelve months, we believe that the outlook for U.S. stocks remains positive. We continue to believe that equities are attractive from a valuation standpoint, even as interest rates rise. We believe that the prospect of slower economic growth may dampen inflationary pressures. While the Federal Reserve has raised rates several times in calendar 2022, we believe tempered inflation will allow the potential for the Federal Reserve to take a more neutral stance toward future rate hikes. We remain bullish on equities long term. The unemployment rate is near record lows, there are elevated levels of cash on the balance sheets of U.S. companies, and there is the prospect of a more dovish Federal Reserve in 2023. While
volatility and uncertainty may continue to impact the markets in the short term, we encourage investors to stay the course, maintain a diversified portfolio, and keep a long-term perspective.
We thank you for your continued interest in our Funds, and we are grateful for your trust. While we always prefer to post only positive returns for our shareholders, we are pleased that many of our Funds held up better than the broader market during this challenging year. If you have any questions or would like to speak with us, please call us directly at (800) 966-4354.
Best regards,
| |
| |
| |
|
| Ryan C. Kelley, CFA |
| Chief Investment Officer, |
| Senior Vice President, and Portfolio Manager |
Past performance does not guarantee future results.
Mutual fund investing involves risk. Principal loss is possible.
Opinions expressed are those of Ryan C. Kelley and are subject to change, are not guaranteed, and should not be considered investment advice.
The Dow Jones Industrial Average and S&P 500® Index are commonly used to measure the performance of U.S. stocks. The Nasdaq Composite Index comprises all common stocks listed on The Nasdaq Stock Market and is commonly used to measure the performance of technology-related stocks. The indices are used herein for comparative purposes in accordance with SEC regulations. One cannot invest directly in an index. All returns are shown on a total return basis.
| HENNESSY FUNDS | 1-800-966-4354 | |
Performance Overview (Unaudited)
CHANGE IN VALUE OF $10,000 INVESTMENT
This graph illustrates the performance of an initial investment of $10,000 made in the Fund 10 years ago and assumes the reinvestment of dividends and capital gains.
AVERAGE ANNUAL TOTAL RETURN FOR PERIODS ENDED OCTOBER 31, 2022
| | One | Five | Ten |
| | Year | Years | Years |
| Hennessy Gas Utility Fund – | | | |
| Investor Class (GASFX) | 10.14% | 5.29% | 8.00% |
| Hennessy Gas Utility Fund – | | | |
Institutional Class (HGASX)(1) | 10.53% | 5.64% | 8.20% |
| AGA Stock Index | 11.32% | 6.49% | 9.19% |
S&P 500® Index | -14.61% | 10.44% | 12.79% |
Expense ratios: 1.00% (Investor Class); 0.69% (Institutional Class)
(1) | The inception date of Institutional Class shares is March 1, 2017. Performance shown prior to the inception of Institutional Class shares reflects the performance of Investor Class shares and includes expenses that are not applicable to, and are higher than, those of Institutional Class shares. |
Performance data quoted represents past performance; past performance does not guarantee future results. The investment return and principal value of an investment will fluctuate so that an investor’s shares, when redeemed, may be worth more or less than their original cost. The performance table does not reflect the deduction of taxes that a shareholder would pay on Fund distributions or the redemption of Fund shares. Current performance of the Fund may be lower or higher than the performance quoted. Performance data current to the most recent month end may be obtained by visiting www.hennessyfunds.com.
The AGA Stock Index is a capitalization-weighted index that consists of members of the American Gas Association whose securities are traded on a U.S. stock exchange. The S&P 500® Index is a capitalization-weighted index that is designed to represent the broad domestic economy through changes in the aggregate market value of 500 stocks across all major industries. One cannot invest directly in an index. These indices are used for comparative purposes in accordance with Securities and Exchange Commission regulations.
Standard & Poor’s Financial Services is the source and owner of the S&P® and S&P 500® trademarks.
The expense ratios presented are from the most recent prospectus. The expense ratios for the current reporting period are available in the Financial Highlights section of this report.
PERFORMANCE NARRATIVE
Portfolio Managers Ryan C. Kelley, CFA, and L. Joshua Wein, CAIA
Performance:
For the one-year period ended October 31, 2022, the Investor Class of the Hennessy Gas Utility Fund returned 10.14%, underperforming the AGA Stock Index (the Fund’s primary benchmark), which returned 11.32%, and outperforming the S&P 500® Index, which returned -14.61%, for the same period.
The Fund slightly underperformed its primary benchmark due to Fund expenses, the timing of cash flows, trading costs, and the impact of holding cash. The Fund outperformed the broader domestic equity market, as represented by the S&P 500® Index, in part due to a renewed investor preference for more stable and defensive, income-oriented companies such as those in the Utilities sector. The Fund performed well on both an absolute and relative basis despite a sharp increase in interest rates during the year. Among the holdings that contributed the most to Fund performance were liquefied natural gas exporter Cheniere Energy, Inc., oil and gas exploration and production company EQT Corporation, and Sempra Energy, a large utility with both natural gas and electric operations. Among the holdings that detracted the most from performance over the period were energy infrastructure company TC Energy Corporation, multi-utility Dominion Energy, Inc., and Public Service Enterprise Group, Inc., also a multi-utility.
The Fund continues to own all the companies mentioned.
Portfolio Strategy:
The Fund’s objective is to maintain a high correlation with its primary benchmark, the AGA Stock Index. The Fund seeks to achieve this goal by owning all the companies in the AGA Stock Index in substantially the same proportion as their weightings in the AGA Stock Index. The Fund seeks positive returns by investing in natural gas distribution companies with the potential for both income and long-term stock appreciation.
Relative affordability, abundant domestic supply, increased accessibility, and new sources and uses of natural gas should lead to long-term, steady growth in demand that should drive growth of natural gas distribution. In turn, this should drive long-term growth in earnings of many of the Fund’s holdings. We believe that natural gas’s position as the cleanest of the fossil fuels should lead to additional increased demand, particularly for utility-scale electricity generation. Furthermore, the continued growth in demand for natural gas and electricity should benefit the significant portion of the Fund that is invested in multi- and electric- utilities, as well as pipeline and liquified natural gas (LNG) export companies.
Investment Commentary:
We believe the strategy of the Fund remains compelling. The production of natural gas in the United States, in particular from shale producers, continues to grow steadily. Demand for natural gas from domestic sources, especially the power industry, also continues to trend upwards. In addition, exports of natural gas via pipelines to Mexico and LNG to the rest of the world remain a key demand driver, especially considering Russia’s aggression in Ukraine. Demand for energy in general, and electricity and natural gas in particular, remains a positive tailwind for the Fund.
_______________
Opinions expressed are those of the Portfolio Manager as of the date written and are subject to change, are not guaranteed, and should not be considered investment advice or an indication of trading intent.
| HENNESSY FUNDS | 1-800-966-4354 | |
Investments in foreign securities may involve political, economic, and currency risks, greater volatility, and differences in accounting methods. Investments are focused in the natural gas distribution and transmission industry; sector funds may be subject to a higher degree of market risk. Please see the Fund’s prospectus for a more complete discussion of these and other risks.
References to specific securities should not be considered a recommendation to buy or sell any security. Fund holdings and sector allocations are subject to change. Please refer to the Schedule of Investments included in this report for additional portfolio information.
| PERFORMANCE OVERVIEW/SCHEDULE OF INVESTMENTS |
Financial Statements
Schedule of Investments as of October 31, 2022 |
HENNESSY GAS UTILITY FUND
(% of Net Assets)
| TOP TEN HOLDINGS (EXCLUDING MONEY MARKET FUNDS) | % NET ASSETS |
| EQT Corp. | 5.20% |
| Atmos Energy Corp. | 4.99% |
| Sempra Energy | 4.93% |
| Berkshire Hathaway, Inc., Class A | 4.91% |
| Kinder Morgan, Inc. | 4.90% |
| Enbridge, Inc. | 4.88% |
| TC Energy Corp. | 4.83% |
| Cheniere Energy, Inc. | 4.76% |
| Dominion Energy, Inc. | 4.68% |
| The Southern Co. | 4.42% |
Note: For presentation purposes, the Fund has grouped some of the industry categories. For purposes of categorizing securities for compliance with Section 8(b)(1) of the Investment Company Act of 1940, as amended, the Fund uses more specific industry classifications.
The Global Industry Classification Standard (GICS®) was developed by and is the exclusive property and a service mark of MSCI, Inc. and Standard & Poor’s Financial Services LLC. It has been licensed for use by the Hennessy Funds.
| HENNESSY FUNDS | 1-800-966-4354 | |
| COMMON STOCKS – 99.26% | | Number of | | | | | | % of | |
| | | Shares | | | Value | | | Net Assets | |
| Energy – 30.75% | | | | | | | | | |
| Cheniere Energy, Inc. | | | 149,217 | | | $ | 26,323,371 | | | | 4.76 | % |
| DT Midstream, Inc. | | | 171,500 | | | | 10,238,550 | | | | 1.85 | % |
| Enbridge, Inc. (a) | | | 692,865 | | | | 26,987,092 | | | | 4.88 | % |
| EQT Corp. | | | 687,300 | | | | 28,756,632 | | | | 5.20 | % |
| Kinder Morgan, Inc. | | | 1,496,801 | | | | 27,122,034 | | | | 4.90 | % |
| ONEOK, Inc. | | | 368,800 | | | | 21,877,216 | | | | 3.96 | % |
| TC Energy Corp. (a) | | | 608,200 | | | | 26,712,144 | | | | 4.83 | % |
| Tellurian, Inc. (b) | | | 746,690 | | | | 2,016,063 | | | | 0.37 | % |
| | | | | | | | 170,033,102 | | | | 30.75 | % |
| | | | | | | | | | | | | |
| Financials – 4.91% | | | | | | | | | | | | |
| Berkshire Hathaway, Inc., Class A (b) | | | 61 | | | | 27,148,050 | | | | 4.91 | % |
| | | | | | | | | | | | | |
| Industrials – 0.87% | | | | | | | | | | | | |
| MDU Resources Group, Inc. | | | 169,407 | | | | 4,824,711 | | | | 0.87 | % |
| | | | | | | | | | | | | |
| Utilities – 62.73% | | | | | | | | | | | | |
| Algonquin Power & Utilities Corp. (a) | | | 122,664 | | | | 1,356,664 | | | | 0.25 | % |
| ALLETE, Inc. | | | 425 | | | | 23,915 | | | | 0.00 | % |
| Alliant Energy Corp. | | | 39,300 | | | | 2,050,281 | | | | 0.37 | % |
| Ameren Corp. | | | 49,840 | | | | 4,062,957 | | | | 0.73 | % |
| Atmos Energy Corp. | | | 258,886 | | | | 27,584,303 | | | | 4.99 | % |
| Avangrid, Inc. | | | 103,100 | | | | 4,194,108 | | | | 0.76 | % |
| Avista Corp. | | | 28,372 | | | | 1,164,103 | | | | 0.21 | % |
| Black Hills Corp. | | | 73,247 | | | | 4,788,156 | | | | 0.87 | % |
| Centerpoint Energy, Inc. | | | 515,728 | | | | 14,754,978 | | | | 2.67 | % |
| Chesapeake Utilities Corp. | | | 23,558 | | | | 2,930,144 | | | | 0.53 | % |
| CMS Energy Corp. | | | 203,398 | | | | 11,603,856 | | | | 2.10 | % |
| Consolidated Edison, Inc. | | | 160,536 | | | | 14,120,747 | | | | 2.55 | % |
| Dominion Energy, Inc. | | | 369,977 | | | | 25,887,291 | | | | 4.68 | % |
| DTE Energy Co. | | | 59,904 | | | | 6,715,837 | | | | 1.21 | % |
| Duke Energy Corp. | | | 131,987 | | | | 12,298,549 | | | | 2.22 | % |
| Entergy Corp. | | | 3,760 | | | | 402,846 | | | | 0.07 | % |
| Essential Utilities, Inc. | | | 205,400 | | | | 9,082,788 | | | | 1.64 | % |
| Eversource Energy | | | 68,875 | | | | 5,253,785 | | | | 0.95 | % |
| Exelon Corp. | | | 123,531 | | | | 4,767,061 | | | | 0.86 | % |
| Fortis, Inc. (a) | | | 147,976 | | | | 5,771,064 | | | | 1.04 | % |
The accompanying notes are an integral part of these financial statements.
| COMMON STOCKS | | Number of | | | | | | % of | |
| | | Shares | | | Value | | | Net Assets | |
| Utilities (Continued) | | | | | | | | | |
| MGE Energy, Inc. | | | 12,029 | | | $ | 819,055 | | | | 0.15 | % |
| National Fuel Gas Co. | | | 102,824 | | | | 6,939,592 | | | | 1.25 | % |
| National Grid PLC – ADR (a) | | | 262,944 | | | | 14,362,001 | | | | 2.60 | % |
| New Jersey Resources Corp. | | | 147,134 | | | | 6,568,062 | | | | 1.19 | % |
| NiSource, Inc. | | | 487,881 | | | | 12,533,663 | | | | 2.27 | % |
| Northwest Natural Holding Co. | | | 63,903 | | | | 3,073,095 | | | | 0.56 | % |
| NorthWestern Corp. | | | 20,698 | | | | 1,093,475 | | | | 0.20 | % |
| ONE Gas, Inc. | | | 103,775 | | | | 8,040,487 | | | | 1.45 | % |
| PG&E Corp. (b) | | | 999,649 | | | | 14,924,760 | | | | 2.70 | % |
| PPL Corp. | | | 118,119 | | | | 3,128,972 | | | | 0.57 | % |
| Public Service Enterprise Group, Inc. | | | 214,890 | | | | 12,048,882 | | | | 2.18 | % |
| RGC Resources, Inc. | | | 20,254 | | | | 434,448 | | | | 0.08 | % |
| Sempra Energy | | | 180,540 | | | | 27,250,708 | | | | 4.93 | % |
| South Jersey Industries, Inc. | | | 203,271 | | | | 7,047,406 | | | | 1.27 | % |
| Southwest Gas Holdings, Inc. | | | 80,917 | | | | 5,912,605 | | | | 1.07 | % |
| Spire, Inc. | | | 74,091 | | | | 5,172,293 | | | | 0.94 | % |
| The Southern Co. | | | 373,700 | | | | 24,469,876 | | | | 4.42 | % |
| UGI Corp. | | | 117,652 | | | | 4,156,645 | | | | 0.75 | % |
| Unitil Corp. | | | 18,998 | | | | 1,001,385 | | | | 0.18 | % |
| WEC Energy Group, Inc. | | | 224,340 | | | | 20,488,972 | | | | 3.71 | % |
| Xcel Energy, Inc. | | | 132,299 | | | | 8,613,988 | | | | 1.56 | % |
| | | | | | | | 346,893,803 | | | | 62.73 | % |
| | | | | | | | | | | | | |
| Total Common Stocks | | | | | | | | | | | | |
| (Cost $310,414,943) | | | | | | | 548,899,666 | | | | 99.26 | % |
The accompanying notes are an integral part of these financial statements.
| HENNESSY FUNDS | 1-800-966-4354 | |
| SHORT-TERM INVESTMENTS – 0.64% | | Number of | | | | | | % of | |
| | | Shares | | | Value | | | Net Assets | |
| Money Market Funds – 0.64% | | | | | | | | | |
| First American Government Obligations Fund, | | | | | | | | | |
| Institutional Class, 2.93% (c) | | | 3,567,053 | | | $ | 3,567,053 | | | | 0.64 | % |
| | | | | | | | | | | | | |
| Total Short-Term Investments | | | | | | | | | | | | |
| (Cost $3,567,053) | | | | | | | 3,567,053 | | | | 0.64 | % |
| | | | | | | | | | | | | |
| Total Investments | | | | | | | | | | | | |
| (Cost $313,981,996) – 99.90% | | | | | | | 552,466,719 | | | | 99.90 | % |
| Other Assets in Excess of Liabilities – 0.10% | | | | | | | 532,587 | | | | 0.10 | % |
| | | | | | | | | | | | | |
TOTAL NET ASSETS – 100.00% | | | | | | $ | 552,999,306 | | | | 100.00 | % |
Percentages are stated as a percent of net assets.
ADR – American Depositary Receipt
PLC – Public Limited Company
| (a) | U.S.-traded security of a foreign corporation. |
| (b) | Non-income-producing security. |
| (c) | The rate listed is the fund’s seven-day yield as of October 31, 2022. |
Summary of Fair Value Exposure as of October 31, 2022
The following is a summary of the inputs used to value the Fund’s net assets as of October 31, 2022 (see Note 3 in the accompanying Notes to the Financial Statements):
| Common Stocks | | Level 1 | | | Level 2 | | | Level 3 | | | Total | |
| Energy | | $ | 170,033,102 | | | $ | — | | | $ | — | | | $ | 170,033,102 | |
| Financials | | | 27,148,050 | | | | — | | | | — | | | | 27,148,050 | |
| Industrials | | | 4,824,711 | | | | — | | | | — | | | | 4,824,711 | |
| Utilities | | | 346,893,803 | | | | — | | | | — | | | | 346,893,803 | |
| Total Common Stocks | | $ | 548,899,666 | | | $ | — | | | $ | — | | | $ | 548,899,666 | |
| Short-Term Investments | | | | | | | | | | | | | | | | |
| Money Market Funds | | $ | 3,567,053 | | | $ | — | | | $ | — | | | $ | 3,567,053 | |
| Total Short-Term Investments | | $ | 3,567,053 | | | $ | — | | | $ | — | | | $ | 3,567,053 | |
| Total Investments | | $ | 552,466,719 | | | $ | — | | | $ | — | | | $ | 552,466,719 | |
The accompanying notes are an integral part of these financial statements.
| SCHEDULE OF INVESTMENTS/STATEMENT OF ASSETS AND LIABILITIES |
Financial Statements
Statement of Assets and Liabilities as of October 31, 2022 |
| ASSETS: | | | |
| Investments in securities, at value (cost $313,981,996) | | $ | 552,466,719 | |
| Cash | | | 351,979 | |
| Dividends and interest receivable | | | 337,308 | |
| Receivable for fund shares sold | | | 133,867 | |
| Return of capital receivable | | | 598,121 | |
| Prepaid expenses and other assets | | | 46,623 | |
| Total assets | | | 553,934,617 | |
| | | | | |
| LIABILITIES: | | | | |
| Payable for fund shares redeemed | | | 451,135 | |
| Payable to advisor | | | 181,507 | |
| Payable to administrator | | | 110,206 | |
| Payable to auditor | | | 22,749 | |
| Accrued distribution fees | | | 66,418 | |
| Accrued service fees | | | 37,612 | |
| Accrued trustees fees | | | 9,430 | |
| Accrued expenses and other payables | | | 56,254 | |
| Total liabilities | | | 935,311 | |
| NET ASSETS | | $ | 552,999,306 | |
| | | | | |
| NET ASSETS CONSISTS OF: | | | | |
| Capital stock | | $ | 304,605,370 | |
| Total distributable earnings | | | 248,393,936 | |
| Total net assets | | $ | 552,999,306 | |
| | | | | |
| NET ASSETS: | | | | |
| Investor Class | | | | |
| Shares authorized (no par value) | | Unlimited | |
| Net assets applicable to outstanding shares | | $ | 459,414,406 | |
| Shares issued and outstanding | | | 17,729,771 | |
| Net asset value, offering price, and redemption price per share | | $ | 25.91 | |
| | | | | |
| Institutional Class | | | | |
| Shares authorized (no par value) | | Unlimited | |
| Net assets applicable to outstanding shares | | $ | 93,584,900 | |
| Shares issued and outstanding | | | 3,621,840 | |
| Net asset value, offering price, and redemption price per share | | $ | 25.84 | |
The accompanying notes are an integral part of these financial statements.
| HENNESSY FUNDS | 1-800-966-4354 | |
Financial Statements
Statement of Operations for the year ended October 31, 2022 |
| INVESTMENT INCOME: | | | |
Dividend income(1) | | $ | 16,196,201 | |
| Interest income | | | 45,199 | |
| Total investment income | | | 16,241,400 | |
| | | | | |
| EXPENSES: | | | | |
| Investment advisory fees (See Note 5) | | | 2,265,385 | |
| Sub-transfer agent expenses – Investor Class (See Note 5) | | | 755,765 | |
| Sub-transfer agent expenses – Institutional Class (See Note 5) | | | 72,294 | |
| Distribution fees – Investor Class (See Note 5) | | | 721,911 | |
| Administration, accounting, custody, and transfer agent fees (See Note 5) | | | 642,113 | |
| Service fees – Investor Class (See Note 5) | | | 481,274 | |
| Federal and state registration fees | | | 43,184 | |
| Reports to shareholders | | | 40,196 | |
| Trustees’ fees and expenses | | | 28,813 | |
| Compliance expense (See Note 5) | | | 24,504 | |
| Audit fees | | | 22,743 | |
| Legal fees | | | 9,653 | |
| Interest expense (See Note 7) | | | 3,528 | |
| Other expenses | | | 286,858 | |
| Total expenses | | | 5,398,221 | |
| NET INVESTMENT INCOME | | $ | 10,843,179 | |
| | | | | |
| REALIZED AND UNREALIZED GAINS (LOSSES): | | | | |
| Net realized gain on investments | | $ | 49,402,174 | |
| Net change in unrealized appreciation/depreciation on investments | | | (11,790,358 | ) |
| Net gain on investments | | | 37,611,816 | |
| NET INCREASE IN NET ASSETS RESULTING FROM OPERATIONS | | $ | 48,454,995 | |
(1) | Net of foreign taxes withheld and issuance fees of $440,164. |
The accompanying notes are an integral part of these financial statements.
| STATEMENT OF OPERATIONS/STATEMENTS OF CHANGES IN NET ASSETS |
Financial Statements
| Statements of Changes in Net Assets |
| | | Year Ended | | | Year Ended | |
| | | October 31, 2022 | | | October 31, 2021 | |
| OPERATIONS: | | | | | | |
| Net investment income | | $ | 10,843,179 | | | $ | 11,225,332 | |
| Net realized gain on investments | | | 49,402,174 | | | | 69,474,485 | |
| Net change in unrealized | | | | | | | | |
| appreciation/depreciation on investments | | | (11,790,358 | ) | | | 17,334,029 | |
| Net increase in net assets resulting from operations | | | 48,454,995 | | | | 98,033,846 | |
| | | | �� | | | | | |
| DISTRIBUTIONS TO SHAREHOLDERS: | | | | | | | | |
| Distributable earnings – Investor Class | | | (46,296,164 | ) | | | (48,578,658 | ) |
| Distributable earnings – Institutional Class | | | (7,042,572 | ) | | | (6,556,181 | ) |
| Total distributions | | | (53,338,736 | ) | | | (55,134,839 | ) |
| | | | | | | | | |
| CAPITAL SHARE TRANSACTIONS: | | | | | | | | |
| Proceeds from shares subscribed – Investor Class | | | 38,263,106 | | | | 10,282,767 | |
| Proceeds from shares subscribed – Institutional Class | | | 60,525,251 | | | | 16,158,873 | |
| Dividends reinvested – Investor Class | | | 43,695,547 | | | | 46,063,257 | |
| Dividends reinvested – Institutional Class | | | 6,632,283 | | | | 5,933,451 | |
| Cost of shares redeemed – Investor Class | | | (77,677,738 | ) | | | (121,059,136 | ) |
| Cost of shares redeemed – Institutional Class | | | (33,930,524 | ) | | | (29,927,336 | ) |
| Net increase (decrease) in net assets derived | | | | | | | | |
| from capital share transactions | | | 37,507,925 | | | | (72,548,124 | ) |
| TOTAL INCREASE (DECREASE) IN NET ASSETS | | | 32,624,184 | | | | (29,649,117 | ) |
| | | | | | | | | |
| NET ASSETS: | | | | | | | | |
| Beginning of year | | | 520,375,122 | | | | 550,024,239 | |
| End of year | | $ | 552,999,306 | | | $ | 520,375,122 | |
| | | | | | | | | |
| CHANGES IN SHARES OUTSTANDING: | | | | | | | | |
| Shares sold – Investor Class | | | 1,378,820 | | | | 412,697 | |
| Shares sold – Institutional Class | | | 2,219,309 | | | | 624,642 | |
| Shares issued to holders as reinvestment | | | | | | | | |
| of dividends – Investor Class | | | 1,762,321 | | | | 1,920,697 | |
| Shares issued to holders as reinvestment | | | | | | | | |
| of dividends – Institutional Class | | | 266,844 | | | | 247,846 | |
| Shares redeemed – Investor Class | | | (2,942,205 | ) | | | (4,884,070 | ) |
| Shares redeemed – Institutional Class | | | (1,288,690 | ) | | | (1,215,733 | ) |
| Net increase (decrease) in shares outstanding | | | 1,396,399 | | | | (2,893,921 | ) |
The accompanying notes are an integral part of these financial statements.
| HENNESSY FUNDS | 1-800-966-4354 | |
Financial Statements
For an Investor Class share outstanding throughout each year
PER SHARE DATA:
Net asset value, beginning of year
Income from investment operations:
Net investment income
Net realized and unrealized gains (losses) on investments
Total from investment operations
Less distributions:
Dividends from net investment income
Dividends from net realized gains
Total distributions
Net asset value, end of year
TOTAL RETURN
SUPPLEMENTAL DATA AND RATIOS:
Net assets, end of year (millions)
Ratio of expenses to average net assets
Ratio of net investment income to average net assets
Portfolio turnover rate(2)
(1) | Calculated using the average shares outstanding method. |
(2) | Calculated on the basis of the Fund as a whole. |
The accompanying notes are an integral part of these financial statements.
| FINANCIAL HIGHLIGHTS — INVESTOR CLASS |
| Year Ended October 31, | |
| 2022 | | | 2021 | | | 2020 | | | 2019 | | | 2018 | |
| | | | | | | | | | | | | | |
| $ | 26.09 | | | $ | 24.08 | | | $ | 29.64 | | | $ | 28.68 | | | $ | 30.35 | |
| | | | | | | | | | | | | | | | | | | |
| | | | | | | | | | | | | | | | | | | |
| | 0.50 | (1) | | | 0.52 | (1) | | | 0.58 | (1) | | | 0.56 | (1) | | | 0.65 | |
| | 1.98 | | | | 4.00 | | | | (4.14 | ) | | | 3.50 | | | | (1.52 | ) |
| | 2.48 | | | | 4.52 | | | | (3.56 | ) | | | 4.06 | | | | (0.87 | ) |
| | | | | | | | | | | | | | | | | | | |
| | | | | | | | | | | | | | | | | | | |
| | (0.50 | ) | | | (0.57 | ) | | | (0.56 | ) | | | (0.62 | ) | | | (0.64 | ) |
| | (2.16 | ) | | | (1.94 | ) | | | (1.44 | ) | | | (2.48 | ) | | | (0.16 | ) |
| | (2.66 | ) | | | (2.51 | ) | | | (2.00 | ) | | | (3.10 | ) | | | (0.80 | ) |
| $ | 25.91 | | | $ | 26.09 | | | $ | 24.08 | | | $ | 29.64 | | | $ | 28.68 | |
| | | | | | | | | | | | | | | | | | | |
| | 10.14 | % | | | 19.91 | % | | | -12.49 | % | | | 15.28 | % | | | -2.86 | % |
| | | | | | | | | | | | | | | | | | | |
| | | | | | | | | | | | | | | | | | | |
| $ | 459.41 | | | $ | 457.31 | | | $ | 483.56 | | | $ | 764.10 | | | $ | 825.18 | |
| | 1.00 | % | | | 1.00 | % | | | 1.02 | % | | | 1.00 | % | | | 1.01 | % |
| | 1.88 | % | | | 2.06 | % | | | 2.24 | % | | | 1.98 | % | | | 2.18 | % |
| | 31 | % | | | 15 | % | | | 16 | % | | | 12 | % | | | 14 | % |
The accompanying notes are an integral part of these financial statements.
| HENNESSY FUNDS | 1-800-966-4354 | |
Financial Statements
For an Institutional Class share outstanding throughout each year
PER SHARE DATA:
Net asset value, beginning of year
Income from investment operations:
Net investment income
Net realized and unrealized gains (losses) on investments
Total from investment operations
Less distributions:
Dividends from net investment income
Dividends from net realized gains
Total distributions
Net asset value, end of year
TOTAL RETURN
SUPPLEMENTAL DATA AND RATIOS:
Net assets, end of year (millions)
Ratio of expenses to average net assets
Ratio of net investment income to average net assets
Portfolio turnover rate(2)
(1) | Calculated using the average shares outstanding method. |
(2) | Calculated on the basis of the Fund as a whole. |
The accompanying notes are an integral part of these financial statements.
| FINANCIAL HIGHLIGHTS — INSTITUTIONAL CLASS |
| Year Ended October 31, | |
| 2022 | | | 2021 | | | 2020 | | | 2019 | | | 2018 | |
| | | | | | | | | | | | | | |
| $ | 26.01 | | | $ | 24.01 | | | $ | 29.56 | | | $ | 28.65 | | | $ | 30.32 | |
| | | | | | | | | | | | | | | | | | | |
| | | | | | | | | | | | | | | | | | | |
| | 0.57 | (1) | | | 0.59 | (1) | | | 0.66 | (1) | | | 0.64 | (1) | | | 0.71 | |
| | 1.99 | | | | 3.99 | | | | (4.13 | ) | | | 3.50 | | | | (1.47 | ) |
| | 2.56 | | | | 4.58 | | | | (3.47 | ) | | | 4.14 | | | | (0.76 | ) |
| | | | | | | | | | | | | | | | | | | |
| | | | | | | | | | | | | | | | | | | |
| | (0.58 | ) | | | (0.65 | ) | | | (0.64 | ) | | | (0.73 | ) | | | (0.75 | ) |
| | (2.15 | ) | | | (1.93 | ) | | | (1.44 | ) | | | (2.50 | ) | | | (0.16 | ) |
| | (2.73 | ) | | | (2.58 | ) | | | (2.08 | ) | | | (3.23 | ) | | | (0.91 | ) |
| $ | 25.84 | | | $ | 26.01 | | | $ | 24.01 | | | $ | 29.56 | | | $ | 28.65 | |
| | | | | | | | | | | | | | | | | | | |
| | 10.53 | % | | | 20.29 | % | | | -12.22 | % | | | 15.63 | % | | | -2.51 | % |
| | | | | | | | | | | | | | | | | | | |
| | | | | | | | | | | | | | | | | | | |
| $ | 93.58 | | | $ | 63.06 | | | $ | 66.46 | | | $ | 107.18 | | | $ | 107.75 | |
| | 0.68 | % | | | 0.69 | % | | | 0.70 | % | | | 0.69 | % | | | 0.65 | % |
| | 2.13 | % | | | 2.35 | % | | | 2.57 | % | | | 2.25 | % | | | 2.47 | % |
| | 31 | % | | | 15 | % | | | 16 | % | | | 12 | % | | | 14 | % |
The accompanying notes are an integral part of these financial statements.
| HENNESSY FUNDS | 1-800-966-4354 | |
Financial Statements
Notes to the Financial Statements October 31, 2022 |
1). ORGANIZATION
The Hennessy Gas Utility Fund (the “Fund”) is a series of Hennessy Funds Trust (the “Trust”), which was organized as a Delaware statutory trust on September 17, 1992. The Fund is an open-end management investment company registered under the Investment Company Act of 1940, as amended. The investment objective of the Fund is income and capital appreciation. The Fund is a diversified fund.
The Fund offers Investor Class and Institutional Class shares. Each class of shares differs principally in its respective 12b-1 distribution and service, shareholder servicing, and sub-transfer agent expenses. There are no sales charges. Each class has identical rights to earnings, assets, and voting privileges, except for class-specific expenses and exclusive rights to vote on matters affecting only one class.
As an investment company, the Fund follows the investment company accounting and reporting guidance of the Financial Accounting Standards Board (“FASB”) Accounting Standard Codification Topic 946 “Financial Services—Investment Companies.”
2). SIGNIFICANT ACCOUNTING POLICIES
The following is a summary of significant accounting policies consistently followed by the Fund in the preparation of the financial statements. These policies conform to U.S. generally accepted accounting principles (“GAAP”).
| a). | Securities Valuation – All investments in securities are valued in accordance with the Fund’s valuation policies and procedures, as described in Note 3. |
| | |
| b). | Federal Income Taxes – The Fund has elected to be taxed as a regulated investment company and intends to distribute substantially all of its taxable income to its shareholders and otherwise comply with the provisions of the Internal Revenue Code of 1986, as amended, applicable to regulated investment companies. As a result, the Fund has made no provision for federal income taxes or excise taxes. Net investment income/loss and realized gains/losses for federal income tax purposes may differ from those reported in the financial statements because of temporary book-basis and tax-basis differences. Temporary differences are primarily the result of the treatment of wash sales for tax reporting purposes. The Fund recognizes interest and penalties related to income tax benefits, if any, in the Statement of Operations as an income tax expense. Distributions from net realized gains for book purposes may include short-term capital gains, which are included as ordinary income to shareholders for tax purposes. The Fund may utilize equalization accounting for tax purposes and designate earnings and profits, including net realized gains distributed to shareholders on redemption of shares, as part of the dividends paid deduction for income tax purposes. |
| | |
| | Due to inherent differences in the recognition of income, expenses, and realized gains/losses under GAAP and federal income tax regulations, permanent differences between book and tax basis for reporting are identified and appropriately reclassified in the Statement of Assets and Liabilities, as needed. The adjustments for fiscal year 2022 are as follows: |
| | Total Distributable | | |
| | Earnings | Capital Stock | |
| | $(4,544,581) | $4,544,581 | |
| NOTES TO THE FINANCIAL STATEMENTS |
| c). | Accounting for Uncertainty in Income Taxes – The Fund has accounting policies regarding recognition and measurement of tax positions taken or expected to be taken on a tax return. The tax returns of the Fund for the prior three fiscal years are open for examination. The Fund has reviewed all open tax years in major tax jurisdictions and concluded that there is no impact on the Fund’s net assets and no tax liability resulting from unrecognized tax benefits relating to uncertain income tax positions taken or expected to be taken on a tax return. The Fund’s major tax jurisdictions are U.S. federal and Delaware. |
| | |
| d). | Income and Expenses – Dividend income is recognized on the ex-dividend date or as soon as information is available to the Fund. Interest income, which includes the amortization of premium and accretion of discount, is recognized on an accrual basis. Market discounts, original issue discounts, and market premiums on debt securities are accreted or amortized to interest income over the life of a security with a corresponding increase or decrease, as applicable, in the cost basis of such security using the yield-to-maturity method or, where applicable, the first call date of the security. Other non-cash dividends are recognized as investment income at the fair value of the property received. The Fund is charged for those expenses that are directly attributable to its portfolio, such as advisory, administration, and certain shareholder service fees. Income, expenses (other than expenses attributable to a specific class), and realized and unrealized gains/losses on investments are allocated to each class of shares based on such class’s net assets. Distributions received from the Fund’s investments in master limited partnerships (“MLPs”) generally consist of ordinary income, capital gains, and return of capital. The Fund records investment income on the ex-date of the distributions. For financial statement purposes, the Fund uses return of capital and income estimates to allocate the dividend income received. Such estimates are based on historical information available from the MLPs and other industry sources. These estimates may subsequently be revised based on information received from the MLPs after their tax reporting periods are concluded, as the actual character of these distributions is not known until after the fiscal year end of the Fund. |
| | |
| e). | Distributions to Shareholders – Dividends from net investment income for the Fund, if any, are declared and paid at the end of each calendar quarter. Distributions of net realized capital gains, if any, are declared and paid annually, usually in December. |
| | |
| f). | Security Transactions – Investment and shareholder transactions are recorded on the trade date. The Fund determines the realized gain/loss from an investment transaction by comparing the original cost of the security lot sold with the net sale proceeds. Discounts and premiums on securities purchased are accreted or amortized, respectively, over the life of each such security. |
| | |
| g). | Use of Estimates – Preparing financial statements in accordance with GAAP requires management to make estimates and assumptions that affect the reported amounts of assets and liabilities and disclosure of contingent assets and liabilities at the date of the financial statements, as well as the reported change in net assets during the reporting period. Actual results could differ from those estimates. |
| | |
| h). | Share Valuation – The net asset value (“NAV”) per share of the Fund is calculated by dividing (i) the total value of the securities held by the Fund, plus cash and other assets, minus all liabilities (including estimated accrued expenses) by (ii) the total number of Fund shares outstanding, rounded to the nearest $0.01. Fund shares are not priced on days the New York Stock Exchange is closed for trading. The offering and redemption price per share for the Fund is equal to the Fund’s NAV per share. |
| HENNESSY FUNDS | 1-800-966-4354 | |
| i). | Partnership Accounting Policy – To the extent the Fund receives distributions from underlying partnerships in which it invests, the Fund records its pro rata share of income/loss and capital gains/losses and accordingly adjusts the cost basis of the underlying partnerships for return of capital. |
| | |
| j). | Illiquid Securities – Pursuant to Rule 22e-4 under the 1940 Act, the Fund has adopted a Liquidity Risk Management Program (the “Liquidity Program”). The Liquidity Program requires, among other things, that the Fund limit its illiquid investments to no more than 15% of its net assets. An illiquid investment is any investment that the Fund reasonably expects cannot be sold or disposed of by the Fund in current market conditions in seven calendar days or less without the sale or disposition significantly changing the market value of the investment. |
| | |
| k). | Recent Accounting Pronouncements and Regulatory Updates – In October 2020, the Securities and Exchange Commission (“SEC”) adopted new regulations governing the use of derivatives by registered investment companies (“Rule 18f-4”). Rule 18f-4 imposes limits on the amount of derivatives a fund can enter into, eliminates the asset segregation framework currently used by funds to comply with Section 18 of the 1940 Act, and requires funds whose use of derivatives is greater than a limited specified amount to establish and maintain a comprehensive derivatives risk management program and appoint a derivatives risk manager. The Fund has adopted procedures in accordance with Rule 18f-4. |
| | |
| | In December 2020, the SEC adopted a new rule providing a framework for fund valuation practices (“Rule 2a-5”). Rule 2a-5 establishes requirements for determining fair value in good faith for purposes of the 1940 Act. Rule 2a-5 permits fund boards to designate certain parties to perform fair value determinations, subject to board oversight and certain other conditions. Rule 2a-5 also defines when market quotations are “readily available” for purposes of the 1940 Act and the threshold for determining whether a fund must fair value a security. In connection with Rule 2a-5, the SEC also adopted related recordkeeping requirements and is rescinding previously issued guidance, including with respect to the role of a board in determining fair value and the accounting and auditing of fund investments. The Fund has adopted procedures in accordance with Rule 2a-5. |
3). SECURITIES VALUATION
The Fund follows its valuation policies and procedures in determining its NAV and, in preparing these financial statements, the fair value accounting standards that establish an authoritative definition of fair value and set out a hierarchy for measuring fair value. These standards require additional disclosures about the various inputs and valuation techniques used to develop the measurements of fair value and a discussion of changes in valuation techniques and related inputs during the period. These inputs are summarized in the three broad levels listed below:
| | Level 1 – | Unadjusted, quoted prices in active markets for identical instruments that the Fund has the ability to access at the date of measurement. |
| | | |
| | Level 2 – | Other significant observable inputs (including, but not limited to, quoted prices in active markets for similar instruments, quoted prices in markets that are not active for identical or similar instruments, and model-derived valuations in which all significant inputs and significant value drivers are observable in active markets, such as interest rates, prepayment speeds, credit risk curves, default rates, and similar data). |
| NOTES TO THE FINANCIAL STATEMENTS |
| | Level 3 – | Significant unobservable inputs (including the Fund’s own assumptions about what market participants would use to price the asset or liability based on the best available information) when observable inputs are unavailable. |
The following is a description of the valuation techniques applied to the Fund’s major categories of assets and liabilities on a recurring basis:
| | Equity Securities – Equity securities, including common stocks, preferred stocks, foreign-issued common stocks, exchange-traded funds, closed-end mutual funds, partnerships, rights, MLPs, and real estate investment trusts, that are traded on a securities exchange for which a last-quoted sales price is readily available generally are valued at the last sales price as reported by the primary exchange on which the securities are listed. Securities listed on The Nasdaq Stock Market (“Nasdaq”) generally are valued at the Nasdaq Official Closing Price, which may differ from the last sales price reported. Securities traded on a securities exchange for which a last-quoted sales price is not readily available generally are valued at the mean between the bid and ask prices. To the extent these securities are actively traded and valuation adjustments are not applied, they are classified in Level 1 of the fair value hierarchy. Securities traded on foreign exchanges generally are not valued at the same time the Fund calculates its NAV because most foreign markets close well before such time. The earlier close of most foreign markets gives rise to the possibility that significant events, including broad market moves, may have occurred in the interim. In certain circumstances, it may be determined that a foreign security needs to be fair valued because it appears that the value of the security might have been materially affected by events occurring after the close of the market in which the security is principally traded, but before the time the Fund calculates its NAV, such as by a development that affects an entire market or region (e.g., a weather-related event) or a potentially global development (e.g., a terrorist attack that may be expected to have an effect on investor expectations worldwide). |
| | |
| | Registered Investment Companies – Investments in open-end registered investment companies, commonly referred to as mutual funds, generally are priced at the ending NAV provided by the applicable mutual fund’s service agent and are classified in Level 1 of the fair value hierarchy. |
| | |
| | Debt Securities – Debt securities, including corporate bonds, asset-backed securities, mortgage-backed securities, municipal bonds, U.S. Treasuries, and U.S. government agency issues, are generally valued at market on the basis of valuations furnished by an independent pricing service that utilizes both dealer-supplied valuations and formula-based techniques. The pricing service may consider recently executed transactions in securities of the issuer or comparable issuers, market price quotations (where observable), bond spreads, and fundamental data relating to the issuer. In addition, the model may incorporate observable market data, such as reported sales of similar securities, broker quotes, yields, bids, offers, and reference data. Certain securities are valued primarily using dealer quotations. These securities are generally classified in Level 2 of the fair value hierarchy. |
| | |
| | Short-Term Securities – Short-term equity investments, including money market funds, are valued in the manner specified above for equity securities. Short-term debt investments with an original term to maturity of 60 days or less are valued at amortized cost, which approximates fair market value. If the original term to maturity of a short-term debt investment exceeds 60 days, then the values as of the |
| HENNESSY FUNDS | 1-800-966-4354 | |
| | 61st day prior to maturity are amortized. Amortized cost is not used if its use would be inappropriate due to credit or other impairments of the issuer, in which case the security’s fair value would be determined as described below. Short-term securities are generally classified in Level 1 or Level 2 of the fair value hierarchy depending on the inputs used and market activity levels for specific securities. |
The Board of Trustees of the Fund (the “Board”) has adopted fair value pricing procedures that are followed when a price for a security is not readily available or if a significant event has occurred that indicates the closing price of a security no longer represents the true value of that security. Fair value pricing determinations are made in good faith in accordance with these procedures. There are numerous criteria considered in determining a fair value of a security, such as the trading volume of a security and markets, the values of other similar securities, and news events with direct bearing on a security or markets. Fair value pricing results in an estimated price for a security that reflects the amount the Fund might reasonably expect to receive in a current sale. Depending on the relative significance of the valuation inputs, these securities may be classified in either Level 2 or Level 3 of the fair value hierarchy.
The fair value of foreign securities may be determined with the assistance of a pricing service using correlations between the movement of prices of such securities and indices of domestic securities and other appropriate indicators, such as closing market prices of relevant American Depositary Receipts or futures contracts. Using fair value pricing means that the Fund’s NAV reflects the affected portfolio securities’ values as determined by the Board or its designee, pursuant to the fair value pricing procedures adopted by the Board, instead of being determined by the market. Using a fair value pricing methodology to price a foreign security may result in a value that is different from such foreign security’s most recent closing price and from the value used by other investment companies to calculate their NAVs. Such securities are generally classified in Level 2 of the fair value hierarchy. Because the Fund may invest in foreign securities, the value of the Fund’s portfolio securities may change on days when a shareholder is unable to purchase or redeem Fund shares.
The Board has delegated day-to-day valuation matters to the Valuation and Liquidity Committee comprising representatives from Hennessy Advisors, Inc., the Fund’s investment advisor (the “Advisor”). The function of the Valuation and Liquidity Committee, among other things, is to value securities where current and reliable market quotations are not readily available. All actions taken by the Valuation and Liquidity Committee are reviewed by the Board.
The Fund has performed an analysis of all existing investments to determine the significance and character of all inputs to their fair value determinations. Various inputs are used to determine the value of the Fund’s investments. The inputs or methodology used for valuing securities are not necessarily an indication of the risk associated with investing in those securities. Details related to the fair value hierarchy of the Fund’s securities as of October 31, 2022, are included in the Schedule of Investments.
4). INVESTMENT TRANSACTIONS
Purchases and sales of investment securities (excluding government and short-term investments) for the Fund during fiscal year 2022 were $171,017,479 and $175,899,801, respectively.
There were no purchases or sales/maturities of long-term U.S. government securities for the Fund during fiscal year 2022.
| NOTES TO THE FINANCIAL STATEMENTS |
5). INVESTMENT ADVISORY FEE AND OTHER TRANSACTIONS WITH AFFILIATES
The Advisor provides the Fund with investment advisory services under an Investment Advisory Agreement. The Advisor furnishes all investment advice, office space, and facilities and most of the personnel needed by the Fund. As compensation for its services, the Advisor is entitled to a monthly fee from the Fund. The fee is based on the average daily net assets of the Fund at an annual rate of 0.40%. The net investment advisory fees expensed by the Fund during fiscal year 2022 are included in the Statement of Operations.
The Board has approved a Shareholder Servicing Agreement for Investor Class shares of the Fund, which compensates the Advisor for the non-investment advisory services it provides to the Fund. The Shareholder Servicing Agreement provides for a monthly fee paid to the Advisor at an annual rate of 0.10% of the average daily net assets of the Fund attributable to Investor Class shares. The shareholder service fees expensed by the Fund during fiscal year 2022 are included in the Statement of Operations.
The Fund has adopted a plan pursuant to Rule 12b-1 under the Investment Company Act of 1940, as amended, that authorizes payments in connection with the distribution of Fund shares at an annual rate of up to 0.25% of the Fund’s average daily net assets attributable to Investor Class shares. Even though the authorized rate is up to 0.25%, the Fund is currently only using up to 0.15% of its average daily net assets attributable to Investor Class shares for such purpose. Amounts paid under the plan may be spent on any activities or expenses primarily intended to result in the sale of shares, including, but not limited to, advertising, shareholder account servicing, printing and mailing of prospectuses to other than current shareholders, printing and mailing of sales literature, and compensation for sales and marketing activities or to financial institutions and others, such as dealers and distributors. The distribution fees expensed by the Fund during fiscal year 2022 are included in the Statement of Operations.
The Fund has entered into agreements with various brokers, dealers, and financial intermediaries in connection with the sale of Fund shares. The agreements provide for periodic payments of sub-transfer agent expenses by the Fund to the brokers, dealers, and financial intermediaries for providing certain shareholder maintenance services. These shareholder services include the pre-processing and quality control of new accounts, shareholder correspondence, answering customer inquiries regarding account status, and facilitating shareholder telephone transactions. The sub-transfer agent fees expensed by the Fund during fiscal year 2022 are included in the Statement of Operations.
The Fund has entered into an Administrative Services Agreement among the Fund, the Advisor, and the American Gas Association (“AGA”), pursuant to which the AGA provides administrative services to the Fund, including overseeing the calculation of the AGA Stock Index. ScottMadden, Inc. performs the actual computations required to produce the AGA Stock Index and receives a fee for such calculations pursuant to a contractual arrangement with AGA. AGA does not furnish other securities advice to the Fund or the Advisor or make recommendations regarding the purchase or sale of securities by the Fund. Under the terms of the Administrative Services Agreement, which has been approved by the Board, AGA provides the Fund with current information regarding the common stock composition of the AGA Stock Index at least monthly. In addition, on request, AGA provides the Fund and the Advisor with information on the natural gas industry. The Fund pays AGA a fee at an annual rate of 0.04% of the average daily net assets of the Fund.
U.S. Bancorp Fund Services, LLC, d/b/a U.S. Bank Global Fund Services (“Fund Services”) provides the Fund with administrative, accounting, and transfer agent services.
| HENNESSY FUNDS | 1-800-966-4354 | |
As administrator, Fund Services is responsible for activities such as (i) preparing various federal and state regulatory filings, reports, and returns for the Fund, (ii) preparing reports and materials to be supplied to the Board, (iii) monitoring the activities of the Fund’s custodian, transfer agent, and accountants, and (iv) coordinating the preparation and payment of the Fund’s expenses and reviewing the Fund’s expense accruals. U.S. Bank N.A., an affiliate of Fund Services, serves as the Fund’s custodian. The servicing agreements between the Trust, Fund Services, and U.S. Bank N.A. contain a fee schedule that is inclusive of administrative, accounting, custody, and transfer agent fees. The administrative, accounting, custody, and transfer agent fees expensed by the Fund during fiscal year 2022 are included in the Statement of Operations.
Quasar Distributors, LLC, a wholly owned broker-dealer subsidiary of Foreside Financial Group, LLC, acts as the Fund’s principal underwriter in a continuous public offering of Fund shares.
The officers of the Fund are affiliated with the Advisor. With the exception of the Chief Compliance Officer and, for a portion of the fiscal year, the Senior Compliance Officer, such officers receive no compensation from the Fund for serving in their respective roles. The Fund, along with the other funds in the Hennessy Funds family (collectively, the “Hennessy Funds”), makes reimbursement payments on an equal basis to the Advisor for a portion of the salary and benefits associated with the office of the Chief Compliance Officer and, for a portion of the fiscal year, for all of the salary and benefits associated with the office of the Senior Compliance Officer. The compliance fees expensed by the Fund during fiscal year 2022 for reimbursement payments to the Advisor are included in the Statement of Operations.
6). GUARANTEES AND INDEMNIFICATIONS
Under the Hennessy Funds’ organizational documents, their officers and trustees are indemnified by the Hennessy Funds against certain liabilities arising out of the performance of their duties to the Hennessy Funds. Additionally, in the normal course of business, the Hennessy Funds enter into contracts with service providers that contain general indemnification clauses. The Fund’s maximum exposure under these arrangements is unknown as this would involve future claims that may be made against the Fund that have not yet occurred. Currently, the Fund expects the risk of loss to be remote.
7). LINE OF CREDIT
The Fund has an uncommitted line of credit with the other Hennessy Funds in the amount of the lesser of (i) $100,000,000 or (ii) 33.33% of each Hennessy Fund’s net assets, or 30% for the Fund, the Hennessy Japan Fund, and the Hennessy Japan Small Cap Fund and 10% for the Hennessy Balanced Fund. The line of credit is intended to provide any necessary short-term financing in connection with shareholder redemptions, subject to certain restrictions. The credit facility is with the Hennessy Funds’ custodian bank, U.S. Bank N.A. Borrowings under this arrangement bear interest at the bank’s prime rate and are secured by all of the Fund’s assets (as to its own borrowings only). During fiscal year 2022, the Fund had an outstanding average daily balance and a weighted average interest rate of $87,937 and 3.96%, respectively. The interest expensed by the Fund during fiscal year 2022 is included in the Statement of Operations. The maximum amount outstanding for the Fund during fiscal year 2022 was $1,972,000. As of October 31, 2022, the Fund did not have any borrowings outstanding under the line of credit.
| NOTES TO THE FINANCIAL STATEMENTS |
8). FEDERAL TAX INFORMATION
As of October 31, 2022, the components of accumulated earnings (losses) for income tax purposes were as follows:
| | | Investments | |
| Cost of investments for tax purposes | | $ | 338,135,370 | |
| Gross tax unrealized appreciation | | $ | 253,222,529 | |
| Gross tax unrealized depreciation | | | (38,891,180 | ) |
| Net tax unrealized appreciation/(depreciation) | | $ | 214,331,349 | |
| Undistributed ordinary income | | $ | 2,970,511 | |
| Undistributed long-term capital gains | | | 31,092,076 | |
| Total distributable earnings | | $ | 34,062,587 | |
| Other accumulated gain/(loss) | | $ | — | |
| Total accumulated gain/(loss) | | $ | 248,393,936 | |
The difference between book-basis unrealized appreciation/depreciation and tax-basis unrealized appreciation/depreciation (as shown above) is attributable primarily to wash sales.
As of October 31, 2022, the Fund had no tax-basis capital losses to offset future capital gains.
As of October 31, 2022, the Fund did not defer, on a tax basis, any late-year ordinary losses. Late-year ordinary losses are net ordinary losses incurred after December 31, 2021, but within the taxable year, that are deemed to arise on the first day of the Fund’s next taxable year.
During fiscal years 2022 and 2021, the tax character of distributions paid by the Fund was as follows:
| | | Year Ended | | | Year Ended | |
| | | October 31, 2022 | | | October 31, 2021 | |
Ordinary income(1) | | $ | 10,974,058 | | | $ | 12,094,090 | |
| Long-term capital gains | | | 42,364,678 | | | | 43,040,749 | |
| Total distributions | | $ | 53,338,736 | | | $ | 55,134,839 | |
(1) Ordinary income includes short-term capital gains.
9). MARKET DISRUPTION AND GEOPOLITICAL RISKS
Certain local, regional, or global events such as wars, terrorism, pandemics or other public health mattes, and other geopolitical events could have a significant impact on securities markets generally or individual securities or instruments. For example, following Russia’s invasion of Ukraine, the President of the United States signed an Executive Order in February 2022 prohibiting U.S. persons from entering transactions with the Central Bank of Russia. Similarly, in June 2021, the President of the United States signed an Executive Order affirming and expanding the U.S. policy prohibiting U.S. persons from purchasing or investing in publicly-traded securities of companies identified by the U.S. Government as “Chinese Military-Industrial Complex Companies.” The list of such companies can change from time to time and the Advisor may be forced to hold securities it desires to sell or to sell securities it desires to buy, or the Advisor may not be able to participate in an investment it otherwise believes is attractive. The occurrence and duration of these types of events are hard to predict and could adversely affect the Fund’s performance.
| HENNESSY FUNDS | 1-800-966-4354 | |
10). EVENTS SUBSEQUENT TO YEAR END
Management has evaluated the Fund’s related events and transactions that occurred subsequent to October 31, 2022, through the date of issuance of the Fund’s financial statements. Other than as disclosed below, management has determined that there were no subsequent events requiring recognition or disclosure in the financial statements.
On December 8, 2022, capital gains were declared and paid to shareholders of record on December 7, 2022, as follows:
| | | Long-term | Short-term | |
| | Investor Class | 1.50647 | 0.14394 | |
| | Institutional Class | 1.50271 | 0.14357 | |
| NOTES/REPORT OF INDEPENDENT REGISTERED PUBLIC ACCOUNTING FIRM |
Report of Independent Registered Public
Accounting Firm
To the Board of Trustees of Hennessy Funds Trust
and the shareholders of the Hennessy Gas Utility Fund
Novato, CA
Opinion on the Financial Statements
We have audited the accompanying statement of assets and liabilities of the Hennessy Gas Utility Fund (the “Fund”), a series of Hennessy Funds Trust, including the schedule of investments, as of October 31, 2022, the related statement of operations for the year then ended, the statements of changes in net assets for each of the two years in the period then ended, the financial highlights for each of the five years in the period then ended, and the related notes (collectively referred to as the “financial statements”). In our opinion, the financial statements present fairly, in all material respects, the financial position of the Fund as of October 31, 2022, the results of its operations for the year then ended, the changes in its net assets for each of the two years in the period then ended, and the financial highlights for each of the five years in the period then ended in conformity with accounting principles generally accepted in the United States of America.
Basis for Opinion
These financial statements are the responsibility of the Fund’s management. Our responsibility is to express an opinion on the Fund’s financial statements based on our audits. We are a public accounting firm registered with the Public Company Accounting Oversight Board (United States) (“PCAOB”) and are required to be independent with respect to the Fund in accordance with the U.S. federal securities laws and the applicable rules and regulations of the Securities and Exchange Commission and the PCAOB. We have served as the auditor of one or more of the funds in the Trust since 2002.
We conducted our audits in accordance with the standards of the PCAOB. Those standards require that we plan and perform the audit to obtain reasonable assurance about whether the financial statements are free of material misstatement, whether due to error or fraud. The Fund is not required to have, nor were we engaged to perform, an audit of its internal control over financial reporting. As part of our audits we are required to obtain an understanding of internal control over financial reporting, but not for the purpose of expressing an opinion on the effectiveness of the Fund’s internal control over financial reporting. Accordingly, we express no such opinion.
Our audits included performing procedures to assess the risks of material misstatement of the financial statements, whether due to error or fraud, and performing procedures that respond to those risks. Such procedures included examining, on a test basis, evidence regarding the amounts and disclosures in the financial statements. Our audits also included evaluating the accounting principles used and significant estimates made by management, as well as evaluating the overall presentation of the financial statements. Our procedures included confirmation of securities owned as of October 31, 2022 by correspondence with the custodian. We believe that our audits provide a reasonable basis for our opinion.
| | |
| | TAIT, WELLER & BAKER LLP |
Philadelphia, Pennsylvania
December 22, 2022
| HENNESSY FUNDS | 1-800-966-4354 | |
Trustees and Officers of the Fund (Unaudited)
The business and affairs of the Funds are managed under the direction of the Board of Trustees of the Trust, and the Board of Trustees elects the officers of the Trust. From time to time, the Board of Trustees also has appointed advisers to the Board of Trustees (“Advisers”) with the intention of having qualified individuals serve in an advisory capacity to garner experience in the mutual fund and asset management industry and be considered as potential Trustees in the future. There are currently two Advisers, Brian Alexander and Doug Franklin. As Advisers, Mr. Alexander and Mr. Franklin attend meetings of the Board of Trustees and act as non-voting participants. Information pertaining to the Trustees, Advisers, and the officers of the Trust is set forth below. The Trustees and officers serve until their successors are duly elected and qualified or until their earlier death, resignation, or removal. Each Trustee oversees all 16 Hennessy Funds. Unless otherwise indicated, the address of all persons listed below is 7250 Redwood Boulevard, Suite 200, Novato, CA 94945. The Fund’s Statement of Additional Information includes more information about the persons listed below and is available without charge by calling 1-800-966-4354 or by visiting www.hennessyfunds.com.
| | | | Other |
| | | | Directorships |
| | | | Held Outside |
| Name, Age, | | | of Fund |
| and Position Held | Start Date | Principal Occupation(s) | Complex During |
with the Trust | of Service | During Past Five Years | Past Five Years |
| Disinterested Trustees and Advisers | | | |
| | | | |
| J. Dennis DeSousa | January 1996 | Mr. DeSousa is a real estate investor. | None. |
| 86 | | | |
| Trustee | | | |
| | | | |
| Robert T. Doyle | January 1996 | Mr. Doyle is retired. He served as the | None. |
| 75 | | Sheriff of Marin County, California | |
| Trustee | | from 1996 – June 2022. | |
| | | | |
| Claire Garvie | December 2015 | Ms. Garvie is a founder of Kiosk and | None. |
| 48 | as an Adviser | has served as its Chief Operating | |
| Trustee | to the Board | Officer since 2004. Kiosk is a full- | |
| | and | service marketing agency with | |
| | December 2021 | offices in the San Francisco Bay Area | |
| | as a Trustee | and Liverpool, UK and staff across | |
| | | nine states in the U.S. | |
| | | | |
| Gerald P. Richardson | May 2004 | Mr. Richardson is an independent | None. |
| 77 | | consultant in the securities industry. | |
| Trustee | | | |
| TRUSTEES AND OFFICERS OF THE FUND |
| | | | Other |
| | | | Directorships |
| | | | Held Outside |
| Name, Age, | | | of Fund |
| and Position Held | Start Date | Principal Occupation(s) | Complex During |
with the Trust | of Service | During Past Five Years | Past Five Years |
| Brian Alexander | March 2015 | Mr. Alexander has worked for the | None. |
| 41 | | Sutter Health organization since | |
| Adviser to the Board | | 2011 in various positions. He has | |
| | | served as the Chief Executive Officer | |
| | | of the North Valley Hospital Area | |
| | | since 2021. From 2018 to 2021, he | |
| | | served as the Chief Executive Officer | |
| | | of Sutter Roseville Medical Center. | |
| | | From 2016 through 2018, he served | |
| | | as the Vice President of Strategy for | |
| | | the Sutter Health Valley Area, which | |
| | | includes 11 hospitals, 13 ambulatory | |
| | | surgery centers, 16,000 employees, | |
| | | and 1,900 physicians. | |
| | | | |
| Doug Franklin | March 2016 | Mr. Franklin is a retired insurance | None. |
| 58 | | industry executive. From 1987 | |
| Adviser to the Board | | through 2015, he was employed by | |
| | | the Allianz-Fireman’s Fund Insurance | |
| | | Company in various positions, | |
| | | including as its Chief Actuary and | |
| | | Chief Risk Officer. | |
| | | | |
Interested Trustee(1) | | | |
| | | | |
| Neil J. Hennessy | January 1996 as | Mr. Hennessy has been employed | Hennessy |
| 66 | a Trustee and | by Hennessy Advisors, Inc. since | Advisors, Inc. |
| Chairman of the Board, | June 2008 as | 1989 and currently serves as its | |
| Chief Market Strategist, | an officer | Chairman and Chief Executive Officer. | |
| Portfolio Manager, | | | |
| and President | | | |
| | | | |
| Name, Age, | | | |
| and Position Held | Start Date | Principal Occupation(s) | |
with the Trust | of Service | During Past Five Years | |
| Officers | | | |
| | | | |
| Teresa M. Nilsen | January 1996 | Ms. Nilsen has been employed by Hennessy Advisors, Inc. | |
| 56 | | since 1989 and currently serves as its President, Chief | |
| Executive Vice President | | Operating Officer, and Secretary. | |
| and Treasurer | | | |
| | | | |
| Daniel B. Steadman | March 2000 | Mr. Steadman has been employed by Hennessy Advisors, Inc. | |
| 66 | | since 2000 and currently serves as its Executive Vice President. | |
| Executive Vice President’ | | | |
| and Secretary | | | |
| | | | |
| Brian Carlson | December 2013 | Mr. Carlson has been employed by Hennessy Advisors, Inc. | |
| 50 | | since December 2013 and currently serves as its Chief | |
| Senior Vice President | | Compliance Officer and Senior Vice President. | |
| and Head of Distribution | | | |
| HENNESSY FUNDS | 1-800-966-4354 | |
| Name, Age, | | |
| and Position Held | Start Date | Principal Occupation(s) |
with the Trust | of Service | During Past Five Years |
Jennifer Cheskiewicz(2) | June 2013 | Ms. Cheskiewicz has been employed by Hennessy Advisors, Inc. |
| 45 | | as its General Counsel since June 2013. |
| Senior Vice President and | | |
| Chief Compliance Officer | | |
| | | |
David Ellison(3) | October 2012 | Mr. Ellison has been employed by Hennessy Advisors, Inc. since |
| 64 | | October 2012. He has served as a Portfolio Manager of the |
| Senior Vice President | | Hennessy Large Cap Financial Fund and the Hennessy Small |
| and Portfolio Manager | | Cap Financial Fund since their inception. Mr. Ellison also served |
| | | as a Portfolio Manager of the Hennessy Technology Fund from |
| | | its inception until February 2017. Mr. Ellison served as Director, |
| | | CIO, and President of FBR Fund Advisers, Inc. from December |
| | | 1999 to October 2012. |
| | | |
Ryan Kelley(4) | March 2013 | Mr. Kelley has been employed by Hennessy Advisors, Inc. since |
| 50 | | October 2012. He has served as Chief Investment Officer of the |
| Chief Investment Officer, | | Hennessy Funds since March 2021 and has served as a Portfolio |
| Senior Vice President, | | Manager of the Hennessy Gas Utility Fund, the Hennessy Large |
| and Portfolio Manager | | Cap Financial Fund, and the Hennessy Small Cap Financial Fund |
| | | since October 2014. Mr. Kelley served as Co-Portfolio Manager |
| | | of these same funds from March 2013 through September |
| | | 2014 and as a Portfolio Analyst for the Hennessy Funds from |
| | | October 2012 through February 2013. He has also served as a |
| | | Portfolio Manager of the Hennessy Cornerstone Growth Fund, |
| | | the Hennessy Cornerstone Mid Cap 30 Fund, the Hennessy |
| | | Cornerstone Large Growth Fund, and the Hennessy |
| | | Cornerstone Value Fund since February 2017 and as a Portfolio |
| | | Manager of the Hennessy Total Return Fund, the Hennessy |
| | | Balanced Fund, and the Hennessy Technology Fund since May |
| | | 2018. He served as Co-Portfolio Manager of the Hennessy |
| | | Technology Fund from February 2017 until May 2018. Mr. Kelley |
| | | served as Portfolio Manager of FBR Fund Advisers, Inc. from |
| | | January 2008 to October 2012. |
| | | |
L. Joshua Wein(4) | September 2018 | Mr. Wein has been employed by Hennessy Advisors, Inc. since |
| 49 | | 2018. He has served as Co-Portfolio Manager of the Hennessy |
| Vice President and | | Cornerstone Growth Fund, the Hennessy Cornerstone |
| Co-Portfolio Manager | | Mid Cap 30 Fund, the Hennessy Cornerstone Large Growth |
| | | Fund, the Hennessy Cornerstone Value Fund, Hennessy Total |
| | | Return Fund, the Hennessy Balanced Fund, the Hennessy Gas |
| | | Utility Fund, and the Hennessy Technology Fund since February |
| | | 2019. He served as a Senior Analyst of these same funds from |
| | | September 2018 through February 2019. Mr. Wein served as |
| | | Director of Alternative Investments and Co-Portfolio Manager |
| | | at Sterling Capital Management from 2008 to 2018. |
_______________
(1) | Mr. Hennessy is considered an “interested person,” as defined in the Investment Company Act of 1940, as amended, because he is an officer of the Trust. |
(2) | The address of this officer is 4800 Bee Caves Road, Suite 100, Austin, TX 78746. |
(3) | The address of this officer is 101 Federal Street, Suite 1615B, Boston, MA 02110. |
(4) | The address of this officer is 1340 Environ Way, Chapel Hill, NC 27517. |
| TRUSTEES AND OFFICERS OF THE FUND |
(This Page Intentionally Left Blank.)
| HENNESSY FUNDS | 1-800-966-4354 | |
Expense Example (Unaudited)
October 31, 2022
As a shareholder of the Fund, you incur ongoing costs, including management fees, service fees, and other Fund expenses. This Example is intended to help you understand your ongoing costs (in dollars) of investing in the Fund and to compare these costs with the ongoing costs of investing in other mutual funds. The Example is based on an investment of $1,000 invested at the beginning of the period and held for the entire period from May 1, 2022, through October 31, 2022.
Actual Expenses
In the table below, the first line under each of the “Investor Class” and “Institutional Class” headings provides information about actual account values and actual expenses for each share class. You may use this information, together with the amount you invested, to estimate the expenses that you paid over the period. Simply divide your account value by $1,000 (for example, an $8,600 account value divided by $1,000 = 8.6), then multiply the result by the number in the first line under the heading “Expenses Paid During Period” to estimate the expenses you paid on your account during this period. Although the Fund charges no sales loads or transaction fees, you will be assessed fees for outgoing wire transfers, returned checks, and stop payment orders at prevailing rates charged by U.S. Bank Global Fund Services, the Fund’s transfer agent. If you request that a redemption be made by wire transfer, the Fund’s transfer agent charges a $15 fee. IRAs are charged a $15 annual maintenance fee (up to $30 maximum per shareholder for shareholders with multiple IRAs). The examples below include, but are not limited to, management, shareholder servicing, accounting, custody, and transfer agent fees. However, the examples below do not include portfolio trading commissions and related expenses.
Hypothetical Example for Comparison Purposes
In the table below, the second line under each of the “Investor Class” and “Institutional Class” headings provides information about hypothetical account values and hypothetical expenses based on the Fund’s actual expense ratio for each share class and an assumed rate of return of 5% per year before expenses, which is not the Fund’s actual return for such share class. The hypothetical account values and expenses may not be used to estimate the actual ending account balance or expenses you paid for the period. You may use this information to compare the ongoing costs of investing in the Fund and other funds. To do so, compare these 5% hypothetical examples with the 5% hypothetical examples that appear in the shareholder reports of the other funds. Please note that the expenses shown in the table are meant to highlight your ongoing costs only. Therefore, the second lines under “Investor Class” and “Institutional Class” are useful in comparing ongoing costs only and will not help you determine the relative total costs of owning different funds.
| | | | Expenses Paid |
| | Beginning | Ending | During Period(1) |
| | Account Value | Account Value | May 1, 2022 – |
| | May 1, 2022 | October 31, 2022 | October 31, 2022 |
| Investor Class | | | |
| Actual | $1,000.00 | $ 944.60 | $4.90 |
| Hypothetical (5% return before expenses) | $1,000.00 | $1,020.16 | $5.09 |
| | | | |
| Institutional Class | | | |
| Actual | $1,000.00 | $ 946.50 | $3.34 |
| Hypothetical (5% return before expenses) | $1,000.00 | $1,021.78 | $3.47 |
(1) | Expenses are equal to the Fund’s annualized expense ratio of 1.00% for Investor Class shares or 0.68% for Institutional Class shares, as applicable, multiplied by the average account value over the period, multiplied by 184/365 days (to reflect the half-year period). |
| HENNESSY FUNDS | 1-800-966-4354 | |
How to Obtain a Copy of the Fund’s Proxy
Voting Policy and Proxy Voting Records
A description of the policies and procedures the Fund uses to determine how to vote proxies relating to portfolio securities is available without charge (1) by calling 1-800-966-4354, (2) on the Hennessy Funds’ website at www.hennessyfunds.com/proxy-voting/voting-policy, or (3) on the U.S. Securities and Exchange Commission’s (the “SEC”) website at www.sec.gov. The Fund’s proxy voting record is available without charge on both the Hennessy Funds’ website at www.hennessyfunds.com/proxy-voting/voting-record and the SEC’s website at www.sec.gov no later than August 31 for the prior 12 months ending June 30.
Availability of Quarterly Portfolio Schedule
The Fund files a complete schedule of portfolio holdings with the SEC for the first and third quarters of each fiscal year as an exhibit to its reports on Form N-PORT. The Fund’s Form N-PORT reports are available on the SEC’s website at www.sec.gov or on request by calling 1-800-966-4354.
Federal Tax Distribution Information (Unaudited)
For fiscal year 2022, certain dividends paid by the Fund may be subject to a maximum tax rate of 23.8%, as provided for by the Jobs and Growth Tax Relief Reconciliation Act of 2003. The percentage of dividends declared from ordinary income designated as qualified dividend income was 100.00%.
For corporate shareholders, the percent of ordinary income distributions that qualified for the corporate dividends received deduction for fiscal year 2022 was 91.72%.
The percentage of taxable ordinary income distributions that were designated as short-term capital gain distributions under Section 871(k)(2)(C) of the Internal Revenue Code of 1986, as amended, for the Fund was 1.26%.
Important Notice Regarding Delivery
of Shareholder Documents
To help keep the Fund’s costs as low as possible, we generally deliver a single copy of shareholder reports, proxy statements, and prospectuses to shareholders who share an address and have the same last name. This process does not apply to account statements. You may request an individual copy of a shareholder document at any time. If you would like to receive separate mailings of shareholder documents, please call U.S. Bank Global Fund Services at 1-800-261-6950 or 1-414-765-4124, and individual delivery will begin within 30 days of your request. If your account is held through a financial institution or other intermediary, please contact such intermediary directly to request individual delivery.
Electronic Delivery
As permitted by SEC regulations, the Fund’s shareholder reports are made available on a website, and unless you sign for eDelivery or elect to receive paper copies as detailed below, you will be notified by mail each time a report is posted and provided with a website link to access the report.
The Fund also offers shareholders the option to receive all notices, account statements, prospectuses, tax forms, and shareholder reports electronically. To sign up for eDelivery or change your delivery preference, please visit www.hennessyfunds.com/account.
To elect to receive paper copies of all future reports free of charge, please call U.S. Bank Global Fund Services at 800-261-6950 or 414-765-4124.
Subscribe to receive our team’s unique market and sector insights delivered to your inbox
www.hennessyfunds.com/subscribe
Follow us on social media
| PROXY VOTING — PRIVACY POLICY |
Liquidity Risk Management Program
In accordance with Rule 22e-4 under the Investment Company Act of 1940, as amended (the “Liquidity Rule”), we have adopted and implemented a liquidity risk management program (the “Liquidity Program”). The purpose of the Liquidity Program is to assess and manage the Fund’s liquidity risk, which is the risk that the Fund would not be able to meet requests to redeem Fund shares without significant dilution of the remaining shareholders’ interests in the Fund. The Board of Trustees of the Fund (the “Board”) designated a committee comprising representatives of Hennessy Advisors, Inc., the investment adviser to the Fund, as the administrator of the Liquidity Program (the “Program Administrator”).
The Program Administrator provided a written report regarding the Liquidity Program to the Board in advance of its meeting on June 1, 2022. The report covered the period from June 1, 2021, through May 31, 2022. The report addressed the operation of the Liquidity Program, assessed the adequacy and effectiveness of its implementation, and described any material changes to the Liquidity Program during the review period. The Trust’s chief compliance officer presented the report to the Board at the meeting and provided additional information regarding the Liquidity Program. The Board reviewed the Liquidity Program and considered, among other items, the following:
| | 1. | The Program Administrator reviewed daily historical net redemption activity during the review period and during prior periods with higher-than-average redemption activity and concluded that the Fund has historically been able to meet requests to redeem Fund shares without significant dilution to the Fund’s remaining shareholders, and the Program Administrator expects the Fund to be able to continue to do so in the future during both normal and reasonably foreseeable stressed conditions. |
| | | |
| | 2. | The Fund primarily holds assets that are highly liquid investments and is therefore not required to establish a highly liquid investment minimum for the Fund or adopt policies and procedures for responding to a highly liquid investment minimum shortfall. |
| | | |
| | 3. | The Program Administrator did not make any material changes to the Liquidity Program during the review period and was not recommending any changes to the Liquidity Program or the model inputs used to determine the liquidity classification of each security held by the Fund. |
| | | |
| | 4. | The Program Administrator concluded that the Liquidity Program was reasonably designed to assess and manage the Fund’s liquidity risk, complies with the requirements of the Liquidity Rule, and was operating as intended during the review period. |
Privacy Policy
We collect the following personal information about you:
| | 1. | Information we receive from you in applications or other forms, correspondence, or conversations, including, but not limited to, your name, address, phone number, social security number, assets, income, and date of birth; |
| | | |
| | 2. | Information about your transactions with us, our affiliates, or others, including, but not limited to, your account number and balance, payments history, parties to transactions, cost basis information, and other financial information; and |
| HENNESSY FUNDS | 1-800-966-4354 | |
| | 3. | Other personal information we collect from various sources, even if you have not entered into a prior transaction with us, including the following: |
| | | • | Name, alias, address, unique personal identifier, online identifier, IP address, email address, telephone number, account name, and other similar identifiers; |
| | | | |
| | | • | Age and marital status; |
| | | | |
| | | • | Commercial information, including records of products purchased; |
| | | | |
| | | • | Browsing history, search history, and information on interaction with our website; |
| | | | |
| | | • | Geolocation data; |
| | | | |
| | | • | Employment and employment history, educational history, financial information, and purchasing and consuming histories or tendencies; and |
| | | | |
| | | • | Inferences drawn from the above-listed information to create a profile about your preferences, characteristics, predispositions, and behavior. |
We collect this information directly from you, indirectly in the course of providing services to you, directly and indirectly from your activity on our website, from broker dealers, marketing agencies, and other third parties that interact with us in connection with the services we perform and products we offer, and from anonymized and aggregated consumer information.
We use this information to fulfill the reason you provided the information to us, to provide you with other relevant products that you request from us, to provide you with information about products that may interest you, to improve our website or present our website’s contents to you, and as otherwise described to you when collecting your personal information.
We do not disclose any personal information to unaffiliated third parties, except as permitted by law. We may disclose your personal information to our affiliates, vendors, and service providers for a business purpose. For example, we are permitted by law to disclose all of the information we collect, as described above, to our transfer agent to process your transactions. When disclosing your personal information to third parties, we enter into a contract with each third party describing the purpose of such disclosure and requiring that such personal information be kept confidential and not used for any purpose except to perform the services contracted or respond to regulatory or law enforcement requests.
Furthermore, we restrict access to your personal information to those persons who require such information to provide products or services to you. As a result, we do not provide a means for opting out of our limited sharing of your information. We maintain physical, electronic, and procedural safeguards that comply with federal standards to guard your personal information.
If you hold shares of the Funds through a financial intermediary, including, but not limited to, a broker-dealer, bank, or trust company, the privacy policy of your financial intermediary governs how your personal information is shared with unaffiliated third parties.
Supplemental Privacy Notice for Residents of California
The California Consumer Privacy Act of 2018 (the “CCPA”) provides you, as a California resident, with certain additional rights relating to your personal information.
Under the CCPA, you have the right to request that we disclose to you the categories of personal information we have collected about you over the past 12 months, the categories of sources of such information, our business purpose for collecting the information, the categories of third parties, if any, with whom we shared the information, and the specific information we have collected about you. You also have the right to request that we delete any of your personal information, and, unless an exception applies, we will delete such information upon receiving and confirming your request. To make a request, call us at 1-800-966-4354, email us at privacy@hennessyfunds.com, or go to www.hennessyfunds.com/contact. We will not discriminate against you for exercising your rights under the CCPA. Further, we will not collect additional categories of your personal information or use the personal information we collected for materially different, unrelated, or incompatible purposes without providing you notice.
| HENNESSY FUNDS | 1-800-966-4354 | |
(This Page Intentionally Left Blank.)
For information, questions, or assistance, please call
The Hennessy Funds
1-800-966-4354 or 1-415-899-1555
INVESTMENT ADVISOR
Hennessy Advisors, Inc.
7250 Redwood Boulevard, Suite 200
Novato, California 94945
ADMINISTRATOR,
TRANSFER AGENT,
DIVIDEND PAYING AGENT, &
SHAREHOLDER SERVICING AGENT
U.S. Bancorp Fund Services, LLC
d/b/a U.S. Bank Global Fund Services
P.O. Box 701
Milwaukee, Wisconsin 53201-0701
CUSTODIAN
U.S. Bank N.A.
Custody Operations
1555 North River Center Drive, Suite 302
Milwaukee, Wisconsin 53212
TRUSTEES
Neil J. Hennessy
Robert T. Doyle
J. Dennis DeSousa
Claire Garvie
Gerald P. Richardson
COUNSEL
Foley & Lardner LLP
777 East Wisconsin Avenue
Milwaukee, Wisconsin 53202-5306
INDEPENDENT REGISTERED
PUBLIC ACCOUNTING FIRM
Tait, Weller & Baker LLP
Two Liberty Place
50 South 16th Street, Suite 2900
Philadelphia, Pennsylvania 19102-2529
DISTRIBUTOR
Quasar Distributors, LLC
111 East Kilbourn Avenue, Suite 1250
Milwaukee, Wisconsin 53202
www.hennessyfunds.com | 800-966-4354
This report has been prepared for shareholders and may be distributed to
others only if preceded or accompanied by a current prospectus.
ANNUAL REPORT
OCTOBER 31, 2022
HENNESSY JAPAN FUND
Investor Class HJPNX
Institutional Class HJPIX
www.hennessyfunds.com | 1-800-966-4354
(This Page Intentionally Left Blank.)
Contents
| Letter to Shareholders | | 2 |
| Performance Overview | | 4 |
| Financial Statements | | |
| Schedule of Investments | | 7 |
| Statement of Assets and Liabilities | | 11 |
| Statement of Operations | | 12 |
| Statements of Changes in Net Assets | | 13 |
| Financial Highlights | | 14 |
| Notes to the Financial Statements | | 18 |
| Report of Independent Registered Public Accounting Firm | | 27 |
| Trustees and Officers of the Fund | | 28 |
| Expense Example | | 32 |
| Proxy Voting Policy and Proxy Voting Records | | 34 |
| Availability of Quarterly Portfolio Schedule | | 34 |
| Federal Tax Distribution Information | | 34 |
| Important Notice Regarding Delivery of Shareholder Documents | | 34 |
| Electronic Delivery | | 35 |
| Liquidity Risk Management Program | | 35 |
| Privacy Policy | | 36 |
| HENNESSY FUNDS | 1-800-966-4354 | |
November 2022
Dear Hennessy Funds Shareholder:
The Japanese stock market declined by 24.05% as measured by the Tokyo Stock Price Index (TOPIX) over the 12-month period ended October 31, 2022 (in U.S. dollar terms). Under the Kishida administration that began at the beginning of October 2021, the market has fluctuated due to Russia’s invasion of Ukraine, the harsh environment of global inflation, the outlook on U.S. monetary policy, and the depreciation of the yen.
The Japanese stock market has been influenced by the outlook on U.S. monetary policy. Japanese equities rose alongside an upturn in the U.S. stock market on the back of receding inflation fears. However, equities began to decline when the Federal Reserve’s decisive stance on inflation became apparent in the second half of August 2022. Nevertheless, the rate of decline in Japanese equity markets was more limited than in the U.S. and Europe. We believe this is due to the sense that Japanese stocks are undervalued and to the Bank of Japan’s continuing stance on monetary easing.
The Bank of Japan is clearly in a dilemma. That is to say, if the BOJ feels forced to raise rates to follow other central banks, the decision will likely negatively impact the domestic economy, which is still in a fragile state after the pandemic. On other hand, if the BOJ chooses to do nothing, then the yen could keep depreciating to reflect the widening of interest rate differentials with other countries, which may also hurt the Japanese economy through higher import prices (i.e., inflation).
In an environment of rising interest rates like today, where the growth-to-value market rotation is all the rage, all things “growth” are viewed as sure losers. Is it really true that all growth stocks, as defined by high price-to-earnings (P/E) multiples, are destined to fall? Should we think that all growth stocks are experiencing corrections because they were overpriced? We believe that may not be the case. In our view, certain conditions need to be met for the collective wisdom to exhibit its powerful predictive ability including: 1) opinions have to be amply diverse, 2) each individual’s opinion has to be formed independent of others, and 3) the result of the aggregated opinions must be expressed in a single output like a number. At that point, we believe that the one-sided growth-to-value rotation may abate.
Thank you for your continued confidence and investment in the Hennessy Funds.
Sincerely,
 |  |
| Tadahiro Fujimura | Masakazu Takeda |
| Portfolio Manager, | Portfolio Manager, |
| Hennessy Japan Small Cap Fund; | Hennessy Japan Fund; |
| Chief Investment Officer | Fund Manager |
| SPARX Asset Management Co., Ltd. | SPARX Asset Management Co., Ltd. |
SPARX Asset Management Co., Ltd., located in Tokyo, Japan, is the sub-advisor to the Hennessy Japan Fund and the Hennessy Japan Small Cap Fund.
Past performance does not guarantee future results.
Mutual fund investing involves risk. Principal loss is possible.
Opinions expressed are those of Tadahiro Fujimura and Masakazu Takeda and are subject to change, are not guaranteed, and should not be considered investment advice.
The Tokyo Stock Price Index (TOPIX) is a capitalization-weighted index of all of the companies listed on the First Section of the Tokyo Stock Exchange. The index is used herein for comparative purposes in accordance with SEC regulations. One cannot invest directly in an index.
P/E, or price to earnings, is calculated by dividing a company’s market price per share by its earnings per share.
| HENNESSY FUNDS | 1-800-966-4354 | |
Performance Overview (Unaudited)
CHANGE IN VALUE OF $10,000 INVESTMENT
This graph illustrates the performance of an initial investment of $10,000 made in the Fund 10 years ago and assumes the reinvestment of dividends and capital gains.
AVERAGE ANNUAL TOTAL RETURN FOR PERIODS ENDED OCTOBER 31, 2022
| | One | Five | Ten |
| | Year | Years | Years |
| Hennessy Japan Fund – | | | |
| Investor Class (HJPNX) | -37.86% | -1.91% | 6.81% |
| Hennessy Japan Fund – | | | |
| Institutional Class (HJPIX) | -37.63% | -1.51% | 7.18% |
Russell/Nomura Total MarketTM Index | -24.27% | -1.13% | 5.80% |
| Tokyo Stock Price Index (TOPIX) | -24.05% | -1.23% | 5.70% |
Expense ratios: 1.43% (Investor Class); 1.04% (Institutional Class)
Performance data quoted represents past performance; past performance does not guarantee future results. The investment return and principal value of an investment will fluctuate so that an investor’s shares, when redeemed, may be worth more or less than their original cost. The performance table does not reflect the deduction of taxes that a shareholder would pay on Fund distributions or the redemption of Fund shares. Current performance of the Fund may be lower or higher than the performance quoted. Performance data current to the most recent month end may be obtained by visiting www.hennessyfunds.com.
The Russell/Nomura Total Market™ Index represents approximately 98% of the investable Japan equity market. The Tokyo Stock Price Index (TOPIX) is a capitalization-weighted index of all of the companies listed on the First Section of the Tokyo Stock Exchange. One cannot invest directly in an index. These indices are used for comparative purposes in accordance with Securities and Exchange Commission regulations.
Frank Russell Company (“Russell”) is the source and owner of the trademarks, service marks, and copyrights related to the Russell Indexes. Russell® is a trademark of Frank Russell Company. Neither Russell nor its licensors accept any liability for any errors or omissions in the Russell Indexes or Russell ratings or underlying data and no party may rely on any Russell Indexes or Russell ratings or underlying data contained in this communication. No further distribution of Russell data is permitted without Russell’s express written consent. Russell does not promote, sponsor, or endorse the content of this communication.
The expense ratios presented are from the most recent prospectus. The expense ratios for the current reporting period are available in the Financial Highlights section of this report.
PERFORMANCE NARRATIVE
Portfolio Managers Masakazu Takeda, CFA and CMA*, and Yu Shimizu, CMA*
SPARX Asset Management Co., Ltd. (sub-advisor)
Performance:
For the one-year period ended October 31, 2022, the Investor Class of the Hennessy Japan Fund returned -37.86%, underperforming both the Russell/Nomura Total Market™ Index (the Fund’s primary benchmark) and the Tokyo Stock Price Index (TOPIX), which returned -24.27% and -24.05%, respectively, for the same period in U.S. dollar terms.
Among positive contributors in the Fund during the period were Rohto Pharmaceutical Co., Ltd., a leading skincare cosmetics and over-the-counter (OTC) ophthalmic medicines producer, Tokio Marine Holdings, Inc., and Hitachi, Ltd., one of Japan’s oldest electric equipment and heavy industrial machinery manufacturers. Personal care products of Rohto such as OTC eye drops, skincare cosmetics, and sunscreen are selling well across Asia due to their ability to produce hit products and to savvy online marketing. Tokio Marine has held up amid the market downturn due to its exposure to the insurance space, which is largely uncorrelated with overall economic trends. Hitachi continues to win new orders at a rapid pace in the area of green transformation such as HVDC (high voltage direct current) transmission system projects in North America and Europe, contributing to the long-term trend towards carbon neutrality.
The main detractors to the Fund’s performance were Mercari, Inc., the operator of Japan’s largest online flea market app “Mercari,” Recruit Holdings Co., Ltd., Japan’s unique print and online media giant specializing in classified ads as well as providing Human Resources services, and Sony Group Corporation, a diversified consumer and professional electronics, gaming, entertainment, and financial services conglomerate. Mercari has experienced significant de-rating amid rising yields as the company continues to invest heavily in growth initiatives, which leaves them unprofitable. Recruit fell due to concerns around the potential slowdown of the job market in the U.S. Sony Group saw a correction in share price as the market became increasingly concerned about possible slowdown in gaming, semiconductor, and electronics hardware businesses amid global recession fears.
The Fund continues to hold all the companies mentioned.
Portfolio Strategy:
The Fund seeks long-term capital appreciation by investing in equity securities of Japanese companies regardless of market capitalization. We screen for companies that we believe have strong businesses and management and are trading at attractive valuations. Through in-depth and rigorous analysis and on-site research, we identify stocks with a potential “value gap.” The portfolio is limited to our best ideas and maintains a concentrated number of holdings.
Investment Commentary:
Our portfolio approach is to construct a concentrated portfolio of what we believe are great global companies based in Japan, and we hold these companies for the long term to capture the potential capital compounding effect. Seeking out great companies means looking not just for businesses with sustainably high returns on invested capital, but also
| HENNESSY FUNDS | 1-800-966-4354 | |
for those that can grow consistently regardless of macroeconomic conditions. In our portfolio, you will find consumer stocks that we consider defensive, economically-sensitive but high-quality industrials, and recession-resistant healthcare and internet stocks, as well as companies with diversified business portfolios. We aim to blend these types of businesses to pursue our goal of a portfolio that we believe can perform better than average in both strong and weak markets. This strategy serves as our first line of defense against downside risk to the Fund’s performance in both absolute and relative terms.
The Fund continues to remain invested in its long-term holdings in growth names, and at the same time, we have been adding several new names to the portfolio lately that we believe can contribute to more risk diversification and also are trading at attractive valuations relative to their growth prospects. To this end, as a growth manager with price discipline, we have made major investments in Tokio Marine and Seven & i Holdings Co., Ltd. during the period, which are now among the Fund’s largest holdings. At the time of our purchase, both companies offered strong earnings prospects over the longer term yet were trading at “value-stock” like P/E multiples. Hence, we call them “growth stocks in disguise,” which means we believe the stocks have growth prospects that are as compelling as the Fund’s other portfolio holdings but they are valued at “value-stock” like P/E multiples. Within the Fund’s long-term positions, we expect to keep a balance of high-quality businesses with manufacturing excellence in industries like industrials, consumer products, and medical devices as well as those with differentiated strengths in intangible assets like entertainment content, network effects, and software, all of which have extremely long growth runways, in our view.
______________
* Chartered Member of the Security Analysts Association of Japan
Opinions expressed are those of the Portfolio Managers as of the date written and are subject to change, are not guaranteed, and should not be considered investment advice or an indication of trading intent.
The Fund invests in small-capitalization and medium-capitalization companies, which may have more limited liquidity and greater price volatility than large-capitalization companies. The Fund invests in the stocks of companies operating in Japan; single-country funds may be subject to a higher degree of risk. The Fund may experience higher fees due to investments in pooled investment vehicles (including ETFs). Please see the Fund’s prospectus for a more complete discussion of these and other risks.
References to specific securities should not be considered a recommendation to buy or sell any security. Fund holdings and sector allocations are subject to change. Please refer to the Schedule of Investments included in this report for additional portfolio information.
P/E, or price to earnings, is calculated by dividing a company’s market price per share by its earnings per share.
| PERFORMANCE OVERVIEW/SCHEDULE OF INVESTMENTS |
Financial Statements
Schedule of Investments as of October 31, 2022 |
HENNESSY JAPAN FUND
(% of Net Assets)
| TOP TEN HOLDINGS (EXCLUDING MONEY MARKET FUNDS) | % NET ASSETS |
| Hitachi Ltd. | 8.46% |
| Mitsubishi Corp. | 7.86% |
| Sony Group Corp. | 6.75% |
| Keyence Corp. | 5.66% |
| Tokio Marine Holdings, Inc. | 5.58% |
| Recruit Holdings Co., Ltd. | 4.94% |
| Rohto Pharmaceutical Co., Ltd. | 4.72% |
| Terumo Corp. | 4.17% |
| Seven & i Holdings Co., Ltd. | 4.09% |
| Daikin Industries, Ltd. | 3.81% |
Note: For presentation purposes, the Fund has grouped some of the industry categories. For purposes of categorizing securities for compliance with Section 8(b)(1) of the Investment Company Act of 1940, as amended, the Fund uses more specific industry classifications.
The Global Industry Classification Standard (GICS®) was developed by and is the exclusive property and a service mark of MSCI, Inc. and Standard & Poor’s Financial Services LLC. It has been licensed for use by the Hennessy Funds.
| HENNESSY FUNDS | 1-800-966-4354 | |
| COMMON STOCKS – 94.01% | | Number | | | | | | % of | |
| | | of Shares | | | Value | | | Net Assets | |
| Communication Services – 2.60% | | | | | | | | | |
| Dentsu Group, Inc. | | | 73,600 | | | $ | 2,289,208 | | | | 0.73 | % |
| SoftBank Group Corp. | | | 94,600 | | | | 4,060,821 | | | | 1.29 | % |
| Z Holdings Corp. | | | 712,600 | | | | 1,839,049 | | | | 0.58 | % |
| | | | | | | | 8,189,078 | | | | 2.60 | % |
| | | | | | | | | | | | | |
| Consumer Discretionary – 13.42% | | | | | | | | | | | | |
| Asics Corp. | | | 240,800 | | | | 3,689,957 | | | | 1.17 | % |
| Fast Retailing Co., Ltd. | | | 12,700 | | | | 7,075,693 | | | | 2.25 | % |
| Mercari, Inc. (a) | | | 196,700 | | | | 3,265,428 | | | | 1.04 | % |
| Shimano, Inc. | | | 45,100 | | | | 6,978,922 | | | | 2.21 | % |
| Sony Group Corp. | | | 315,100 | | | | 21,248,662 | | | | 6.75 | % |
| | | | | | | | 42,258,662 | | | | 13.42 | % |
| | | | | | | | | | | | | |
| Consumer Staples – 15.53% | | | | | | | | | | | | |
| Ariake Japan Co., Ltd. | | | 93,400 | | | | 3,235,777 | | | | 1.03 | % |
| Kao Corp. | | | 195,200 | | | | 7,291,100 | | | | 2.32 | % |
| Pigeon Corp. | | | 150,000 | | | | 1,964,859 | | | | 0.63 | % |
| Rohto Pharmaceutical Co., Ltd. | | | 477,900 | | | | 14,866,538 | | | | 4.72 | % |
| Seven & i Holdings Co., Ltd. | | | 345,200 | | | | 12,885,755 | | | | 4.09 | % |
| Unicharm Corp. | | | 284,000 | | | | 8,631,166 | | | | 2.74 | % |
| | | | | | | | 48,875,195 | | | | 15.53 | % |
| | | | | | | | | | | | | |
| Financials – 12.97% | | | | | | | | | | | | |
| Anicom Holdings, Inc. | | | 485,800 | | | | 1,940,969 | | | | 0.62 | % |
| MS&AD Insurance Group Holdings, Inc. (a) | | | 194,800 | | | | 5,158,538 | | | | 1.64 | % |
| ORIX Corp. | | | 686,500 | | | | 10,083,108 | | | | 3.20 | % |
| Sompo Holdings, Inc. | | | 146,100 | | | | 6,091,245 | | | | 1.93 | % |
| Tokio Marine Holdings, Inc. | | | 969,400 | | | | 17,551,153 | | | | 5.58 | % |
| | | | | | | | 40,825,013 | | | | 12.97 | % |
| | | | | | | | | | | | | |
| Health Care – 8.10% | | | | | | | | | | | | |
| Hoya Corp. | | | 44,200 | | | | 4,108,893 | | | | 1.30 | % |
| Olympus Corp. | | | 138,700 | | | | 2,924,419 | | | | 0.93 | % |
| Santen Pharmaceutical Co., Ltd. | | | 781,900 | | | | 5,350,542 | | | | 1.70 | % |
| Terumo Corp. | | | 432,100 | | | | 13,113,805 | | | | 4.17 | % |
| | | | | | | | 25,497,659 | | | | 8.10 | % |
| | | | | | | | | | | | | |
| Industrials – 32.58% | | | | | | | | | | | | |
| Daikin Industries, Ltd. | | | 80,100 | | | | 11,997,953 | | | | 3.81 | % |
| Hitachi Ltd. | | | 586,800 | | | | 26,625,362 | | | | 8.46 | % |
The accompanying notes are an integral part of these financial statements.
| COMMON STOCKS | | Number | | | | | | % of | |
| | | of Shares | | | Value | | | Net Assets | |
| Industrials (Continued) | | | | | | | | | |
| Kubota Corp. | | | 448,400 | | | $ | 6,254,997 | | | | 1.99 | % |
| MISUMI Group, Inc. | | | 494,800 | | | | 10,538,972 | | | | 3.35 | % |
| Mitsubishi Corp. | | | 914,000 | | | | 24,759,240 | | | | 7.86 | % |
| Nidec Corp. | | | 124,600 | | | | 6,851,009 | | | | 2.17 | % |
| Recruit Holdings Co., Ltd. | | | 505,000 | | | | 15,539,440 | | | | 4.94 | % |
| | | | | | | | 102,566,973 | | | | 32.58 | % |
| | | | | | | | | | | | | |
| Information Technology – 8.74% | | | | | | | | | | | | |
| FUJIFILM Holdings Corp. | | | 96,800 | | | | 4,428,590 | | | | 1.41 | % |
| Keyence Corp. | | | 47,300 | | | | 17,835,189 | | | | 5.66 | % |
| Murata Manufacturing Co., Ltd. | | | 111,100 | | | | 5,259,412 | | | | 1.67 | % |
| | | | | | | | 27,523,191 | | | | 8.74 | % |
| | | | | | | | | | | | | |
| Materials – 0.07% | | | | | | | | | | | | |
| Nissan Chemical Corp. | | | 4,800 | | | | 216,074 | | | | 0.07 | % |
| | | | | | | | | | | | | |
| Total Common Stocks | | | | | | | | | | | | |
| (Cost $252,432,435) | | | | | | | 295,951,845 | | | | 94.01 | % |
| | | | | | | | | | | | | |
| SHORT-TERM INVESTMENTS – 5.29% | | | | | | | | | | | | |
| | | | | | | | | | | | | |
| Money Market Funds – 5.29% | | | | | | | | | | | | |
| First American Government Obligations Fund, | | | | | | | | | | | | |
| Institutional Class, 2.93% (b) | | | 15,505,000 | | | | 15,505,000 | | | | 4.93 | % |
| First American Treasury Obligations Fund, | | | | | | | | | | | | |
| Institutional Class, 3.06% (b) | | | 1,142,718 | | | | 1,142,718 | | | | 0.36 | % |
| | | | | | | | | | | | | |
| Total Short-Term Investments | | | | | | | | | | | | |
| (Cost $16,647,718) | | | | | | | 16,647,718 | | | | 5.29 | % |
| | | | | | | | | | | | | |
| Total Investments | | | | | | | | | | | | |
| (Cost $269,080,153) – 99.30% | | | | | | | 312,599,563 | | | | 99.30 | % |
| Other Assets in Excess of Liabilities – 0.70% | | | | | | | 2,189,798 | | | | 0.70 | % |
| | | | | | | | | | | | | |
TOTAL NET ASSETS – 100.00% | | | | | | $ | 314,789,361 | | | | 100.00 | % |
Percentages are stated as a percent of net assets.
| (a) | Non-income-producing security. |
| (b) | The rate listed is the fund’s seven-day yield as of October 31, 2022. |
The accompanying notes are an integral part of these financial statements.
| HENNESSY FUNDS | 1-800-966-4354 | |
Summary of Fair Value Exposure as of October 31, 2022
The following is a summary of the inputs used to value the Fund’s net assets as of October 31, 2022 (see Note 3 in the accompanying Notes to the Financial Statements):
| Common Stocks | | Level 1 | | | Level 2 | | | Level 3 | | | Total | |
| Communication Services | | $ | — | | | $ | 8,189,078 | | | $ | — | | | $ | 8,189,078 | |
| Consumer Discretionary | | | — | | | | 42,258,662 | | | | — | | | | 42,258,662 | |
| Consumer Staples | | | — | | | | 48,875,195 | | | | — | | | | 48,875,195 | |
| Financials | | | — | | | | 40,825,013 | | | | — | | | | 40,825,013 | |
| Health Care | | | — | | | | 25,497,659 | | | | — | | | | 25,497,659 | |
| Industrials | | | — | | | | 102,566,973 | | | | — | | | | 102,566,973 | |
| Information Technology | | | — | | | | 27,523,191 | | | | — | | | | 27,523,191 | |
| Materials | | | — | | | | 216,074 | | | | — | | | | 216,074 | |
| Total Common Stocks | | $ | — | | | $ | 295,951,845 | | | $ | — | | | $ | 295,951,845 | |
| Short-Term Investments | | | | | | | | | | | | | | | | |
| Money Market Funds | | $ | 16,647,718 | | | $ | — | | | $ | — | | | $ | 16,647,718 | |
| Total Short-Term Investments | | $ | 16,647,718 | | | $ | — | | | $ | — | | | $ | 16,647,718 | |
| Total Investments | | $ | 16,647,718 | | | $ | 295,951,845 | | | $ | — | | | $ | 312,599,563 | |
The accompanying notes are an integral part of these financial statements.
| SCHEDULE OF INVESTMENTS/STATEMENT OF ASSETS AND LIABILITIES |
Financial Statements
Statement of Assets and Liabilities as of October 31, 2022 |
| ASSETS: | | | |
| Investments in securities, at value (cost $269,080,153) | | $ | 312,599,563 | |
| Dividends and interest receivable | | | 2,061,121 | |
| Receivable for fund shares sold | | | 1,903,386 | |
| Receivable for securities sold | | | 937,564 | |
| Dividend tax reclaim receivable | | | 127,737 | |
| Prepaid expenses and other assets | | | 44,538 | |
| Total assets | | | 317,673,909 | |
| | | | | |
| LIABILITIES: | | | | |
| Payable for securities purchased | | | 797,402 | |
| Payable for fund shares redeemed | | | 1,669,926 | |
| Payable to advisor | | | 214,861 | |
| Payable to administrator | | | 65,601 | |
| Payable to auditor | | | 22,753 | |
| Accrued distribution fees | | | 6,467 | |
| Accrued service fees | | | 3,392 | |
| Accrued trustees fees | | | 12,178 | |
| Accrued expenses and other payables | | | 91,968 | |
| Total liabilities | | | 2,884,548 | |
| NET ASSETS | | $ | 314,789,361 | |
| | | | | |
| NET ASSETS CONSISTS OF: | | | | |
| Capital stock | | $ | 303,550,861 | |
| Total distributable earnings | | | 11,238,500 | |
| Total net assets | | $ | 314,789,361 | |
| | | | | |
| NET ASSETS: | | | | |
| Investor Class | | | | |
| Shares authorized (no par value) | | Unlimited | |
| Net assets applicable to outstanding shares | | $ | 39,549,766 | |
| Shares issued and outstanding | | | 1,343,938 | |
| Net asset value, offering price, and redemption price per share | | $ | 29.43 | |
| | | | | |
| Institutional Class | | | | |
| Shares authorized (no par value) | | Unlimited | |
| Net assets applicable to outstanding shares | | $ | 275,239,595 | |
| Shares issued and outstanding | | | 9,044,141 | |
| Net asset value, offering price, and redemption price per share | | $ | 30.43 | |
The accompanying notes are an integral part of these financial statements.
| HENNESSY FUNDS | 1-800-966-4354 | |
Financial Statements
Statement of Operations for the year ended October 31, 2022 |
| INVESTMENT INCOME: | | | |
Dividend income(1) | | $ | 5,799,286 | |
| Interest income | | | 117,538 | |
| Total investment income | | | 5,916,824 | |
| | | | | |
| EXPENSES: | | | | |
| Investment advisory fees (See Note 5) | | | 4,320,459 | |
| Administration, accounting, custody, and transfer agent fees (See Note 5) | | | 610,229 | |
| Sub-transfer agent expenses – Investor Class (See Note 5) | | | 137,352 | |
| Sub-transfer agent expenses – Institutional Class (See Note 5) | | | 408,121 | |
| Distribution fees – Investor Class (See Note 5) | | | 92,682 | |
| Service fees – Investor Class (See Note 5) | | | 61,788 | |
| Federal and state registration fees | | | 53,418 | |
| Trustees’ fees and expenses | | | 35,776 | |
| Reports to shareholders | | | 34,508 | |
| Compliance expense (See Note 5) | | | 24,512 | |
| Audit fees | | | 22,752 | |
| Interest expense (See Note 7) | | | 12,682 | |
| Legal fees | | | 8,512 | |
| Other expenses | | | 89,222 | |
| Total expenses | | | 5,912,013 | |
| NET INVESTMENT INCOME | | $ | 4,811 | |
| | | | | |
| REALIZED AND UNREALIZED GAINS (LOSSES): | | | | |
| Net realized loss on investments | | $ | (12,342,481 | ) |
| Net change in unrealized appreciation/depreciation on investments | | | (265,779,808 | ) |
| Net loss on investments | | | (278,122,289 | ) |
| NET DECREASE IN NET ASSETS RESULTING FROM OPERATIONS | | $ | (278,117,478 | ) |
(1) | Net of foreign taxes withheld of $644,349. |
The accompanying notes are an integral part of these financial statements.
| STATEMENT OF OPERATIONS/STATEMENTS OF CHANGES IN NET ASSETS |
Financial Statements
| Statements of Changes in Net Assets |
| | | Year Ended | | | Year Ended | |
| | | October 31, 2022 | | | October 31, 2021 | |
| OPERATIONS: | | | | | | |
| Net investment income (loss) | | $ | 4,811 | | | $ | (1,149,197 | ) |
| Net realized gain (loss) on investments | | | (12,342,481 | ) | | | 19,086,546 | |
| Net change in unrealized | | | | | | | | |
| appreciation/depreciation on investments | | | (265,779,808 | ) | | | 68,905,761 | |
| Net increase (decrease) in net | | | | | | | | |
| assets resulting from operations | | | (278,117,478 | ) | | | 86,843,110 | |
| | | | | | | | | |
| DISTRIBUTIONS TO SHAREHOLDERS: | | | | | | | | |
| Distributable earnings – Investor Class | | | (747,296 | ) | | | — | |
| Distributable earnings – Institutional Class | | | (11,015,401 | ) | | | (48,044 | ) |
| Total distributions | | | (11,762,697 | ) | | | (48,044 | ) |
| | | | | | | | | |
| CAPITAL SHARE TRANSACTIONS: | | | | | | | | |
| Proceeds from shares subscribed – Investor Class | | | 15,554,341 | | | | 61,092,843 | |
| Proceeds from shares subscribed – Institutional Class | | | 190,629,014 | | | | 227,381,324 | |
| Dividends reinvested – Investor Class | | | 703,285 | | | | — | |
| Dividends reinvested – Institutional Class | | | 10,598,719 | | | | 47,024 | |
| Cost of shares redeemed – Investor Class | | | (30,693,545 | ) | | | (129,927,285 | ) |
| Cost of shares redeemed – Institutional Class | | | (395,706,790 | ) | | | (182,214,241 | ) |
| Net decrease in net assets derived | | | | | | | | |
| from capital share transactions | | | (208,914,976 | ) | | | (23,620,335 | ) |
| TOTAL INCREASE (DECREASE) IN NET ASSETS | | | (498,795,151 | ) | | | 63,174,731 | |
| | | | | | | | | |
| NET ASSETS: | | | | | | | | |
| Beginning of year | | | 813,584,512 | | | | 750,409,781 | |
| End of year | | $ | 314,789,361 | | | $ | 813,584,512 | |
| | | | | | | | | |
| CHANGES IN SHARES OUTSTANDING: | | | | | | | | |
| Shares sold – Investor Class | | | 403,264 | | | | 1,302,489 | |
| Shares sold – Institutional Class | | | 4,980,990 | | | | 4,688,665 | |
| Shares issued to holders as reinvestment | | | | | | | | |
| of dividends – Investor Class | | | 15,157 | | | | — | |
| Shares issued to holders as reinvestment | | | | | | | | |
| of dividends – Institutional Class | | | 221,545 | | | | 944 | |
| Shares redeemed – Investor Class | | | (876,884 | ) | | | (2,825,915 | ) |
| Shares redeemed – Institutional Class | | | (10,842,081 | ) | | | (3,765,795 | ) |
| Net decrease in shares outstanding | | | (6,098,009 | ) | | | (599,612 | ) |
The accompanying notes are an integral part of these financial statements.
| HENNESSY FUNDS | 1-800-966-4354 | |
Financial Statements
For an Investor Class share outstanding throughout each year
PER SHARE DATA:
Net asset value, beginning of year
Income from investment operations:
Net investment income (loss)
Net realized and unrealized gains (losses) on investments
Total from investment operations
Less distributions:
Dividends from net investment income
Dividends from net realized gains
Total distributions
Net asset value, end of year
TOTAL RETURN
SUPPLEMENTAL DATA AND RATIOS:
Net assets, end of year (millions)
Ratio of expenses to average net assets
Ratio of net investment income (loss) to average net assets
Portfolio turnover rate(3)
(1) | Calculated using the average shares outstanding method. |
(2) | Amount is between $(0.005) and $0.005. |
(3) | Calculated on the basis of the Fund as a whole. |
The accompanying notes are an integral part of these financial statements.
| FINANCIAL HIGHLIGHTS — INVESTOR CLASS |
| Year Ended October 31, | |
| 2022 | | | 2021 | | | 2020 | | | 2019 | | | 2018 | |
| | | | | | | | | | | | | | |
| $ | 47.78 | | | $ | 42.79 | | | $ | 37.17 | | | $ | 33.63 | | | $ | 32.75 | |
| | | | | | | | | | | | | | | | | | | |
| | | | | | | | | | | | | | | | | | | |
| | (0.11 | )(1) | | | (0.23 | )(1) | | | (0.14 | )(1) | | | 0.05 | (1) | | | (0.00 | )(2) |
| | (17.83 | ) | | | 5.22 | | | | 5.81 | | | | 3.50 | | | | 0.89 | |
| | (17.94 | ) | | | 4.99 | | | | 5.67 | | | | 3.55 | | | | 0.89 | |
| | | | | | | | | | | | | | | | | | | |
| | | | | | | | | | | | | | | | | | | |
| | (0.41 | ) | | | — | | | | (0.02 | ) | | | (0.01 | ) | | | (0.01 | ) |
| | — | | | | — | | | | (0.03 | ) | | | — | | | | — | |
| | (0.41 | ) | | | — | | | | (0.05 | ) | | | (0.01 | ) | | | (0.01 | ) |
| $ | 29.43 | | | $ | 47.78 | | | $ | 42.79 | | | $ | 37.17 | | | $ | 33.63 | |
| | | | | | | | | | | | | | | | | | | |
| | -37.86 | % | | | 11.66 | % | | | 15.27 | % | | | 10.60 | % | | | 2.70 | % |
| | | | | | | | | | | | | | | | | | | |
| | | | | | | | | | | | | | | | | | | |
| $ | 39.55 | | | $ | 86.11 | | | $ | 142.30 | | | $ | 87.22 | | | $ | 103.33 | |
| | 1.44 | % | | | 1.43 | % | | | 1.43 | % | | | 1.43 | % | | | 1.43 | % |
| | (0.30 | )% | | | (0.49 | )% | | | (0.37 | )% | | | 0.14 | % | | | (0.02 | )% |
| | 21 | % | | | 16 | % | | | 23 | % | | | 9 | % | | | 1 | % |
The accompanying notes are an integral part of these financial statements.
| HENNESSY FUNDS | 1-800-966-4354 | |
Financial Statements
For an Institutional Class share outstanding throughout each year
PER SHARE DATA:
Net asset value, beginning of year
Income from investment operations:
Net investment income (loss)
Net realized and unrealized gains (losses) on investments
Total from investment operations
Less distributions:
Dividends from net investment income
Dividends from net realized gains
Total distributions
Net asset value, end of year
TOTAL RETURN
SUPPLEMENTAL DATA AND RATIOS:
Net assets, end of year (millions)
Ratio of expenses to average net assets
Ratio of net investment income (loss) to average net assets
Portfolio turnover rate(3)
(1) | Calculated using the average shares outstanding method. |
(2) | Amount is between $(0.005) and $0.005. |
(3) | Calculated on the basis of the Fund as a whole. |
The accompanying notes are an integral part of these financial statements.
| FINANCIAL HIGHLIGHTS — INSTITUTIONAL CLASS |
| Year Ended October 31, | |
| 2022 | | | 2021 | | | 2020 | | | 2019 | | | 2018 | |
| | | | | | | | | | | | | | |
| $ | 49.54 | | | $ | 44.19 | | | $ | 38.37 | | | $ | 34.67 | | | $ | 33.64 | |
| | | | | | | | | | | | | | | | | | | |
| | | | | | | | | | | | | | | | | | | |
| | 0.02 | (1) | | | (0.03 | )(1) | | | 0.02 | (1) | | | 0.21 | (1) | | | 0.15 | |
| | (18.39 | ) | | | 5.38 | | | | 5.99 | | | | 3.60 | | | | 0.91 | |
| | (18.37 | ) | | | 5.35 | | | | 6.01 | | | | 3.81 | | | | 1.06 | |
| | | | | | | | | | | | | | | | | | | |
| | | | | | | | | | | | | | | | | | | |
| | (0.74 | ) | | | (0.00 | )(2) | | | (0.16 | ) | | | (0.11 | ) | | | (0.03 | ) |
| | — | | | | — | | | | (0.03 | ) | | | — | | | | — | |
| | (0.74 | ) | | | (0.00 | )(2) | | | (0.19 | ) | | | (0.11 | ) | | | (0.03 | ) |
| $ | 30.43 | | | $ | 49.54 | | | $ | 44.19 | | | $ | 38.37 | | | $ | 34.67 | |
| | | | | | | | | | | | | | | | | | | |
| | -37.63 | % | | | 12.11 | % | | | 15.72 | % | | | 11.02 | % | | | 3.14 | % |
| | | | | | | | | | | | | | | | | | | |
| | | | | | | | | | | | | | | | | | | |
| $ | 275.24 | | | $ | 727.47 | | | $ | 608.11 | | | $ | 611.41 | | | $ | 399.76 | |
| | 1.05 | % | | | 1.04 | % | | | 1.04 | % | | | 1.03 | % | | | 1.01 | % |
| | 0.04 | % | | | (0.07 | )% | | | 0.04 | % | | | 0.59 | % | | | 0.49 | % |
| | 21 | % | | | 16 | % | | | 23 | % | | | 9 | % | | | 1 | % |
The accompanying notes are an integral part of these financial statements.
| HENNESSY FUNDS | 1-800-966-4354 | |
Financial Statements
Notes to the Financial Statements October 31, 2022 |
1). ORGANIZATION
The Hennessy Japan Fund (the “Fund”) is a series of Hennessy Funds Trust (the “Trust”), which was organized as a Delaware statutory trust on September 17, 1992. The Fund is an open-end management investment company registered under the Investment Company Act of 1940, as amended. The investment objective of the Fund is long-term capital appreciation. The Fund is a diversified fund, but employs a relatively concentrated investment strategy and may hold securities of fewer issuers than other diversified funds.
The Fund offers Investor Class and Institutional Class shares. Each class of shares differs principally in its respective 12b-1 distribution and service, shareholder servicing, and sub-transfer agent expenses. There are no sales charges. Each class has identical rights to earnings, assets, and voting privileges, except for class-specific expenses and exclusive rights to vote on matters affecting only one class.
As an investment company, the Fund follows the investment company accounting and reporting guidance of the Financial Accounting Standards Board (“FASB”) Accounting Standard Codification Topic 946 “Financial Services—Investment Companies.”
2). SIGNIFICANT ACCOUNTING POLICIES
The following is a summary of significant accounting policies consistently followed by the Fund in the preparation of the financial statements. These policies conform to U.S. generally accepted accounting principles (“GAAP”).
| a). | Securities Valuation – All investments in securities are valued in accordance with the Fund’s valuation policies and procedures, as described in Note 3. |
| | |
| b). | Federal Income Taxes – The Fund has elected to be taxed as a regulated investment company and intends to distribute substantially all of its taxable income to its shareholders and otherwise comply with the provisions of the Internal Revenue Code of 1986, as amended, applicable to regulated investment companies. As a result, the Fund has made no provision for federal income taxes or excise taxes. Net investment income/loss and realized gains/losses for federal income tax purposes may differ from those reported in the financial statements because of temporary book-basis and tax-basis differences. Temporary differences are primarily the result of the treatment of wash sales for tax reporting purposes. The Fund recognizes interest and penalties related to income tax benefits, if any, in the Statement of Operations as an income tax expense. Distributions from net realized gains for book purposes may include short-term capital gains, which are included as ordinary income to shareholders for tax purposes. The Fund may utilize equalization accounting for tax purposes and designate earnings and profits, including net realized gains distributed to shareholders on redemption of shares, as part of the dividends paid deduction for income tax purposes. |
| | |
| | Due to inherent differences in the recognition of income, expenses, and realized gains/losses under GAAP and federal income tax regulations, permanent differences between book and tax basis for reporting are identified and appropriately reclassified in the Statement of Assets and Liabilities, as needed. The adjustments for fiscal year 2022 are as follows: |
| | Total | | |
| | Distributable | | |
| | Earnings | Capital Stock | |
| | $723,897 | $(723,897) | |
| NOTES TO THE FINANCIAL STATEMENTS |
| c). | Accounting for Uncertainty in Income Taxes – The Fund has accounting policies regarding recognition and measurement of tax positions taken or expected to be taken on a tax return. The tax returns of the Fund for the prior three fiscal years are open for examination. The Fund has reviewed all open tax years in major tax jurisdictions and concluded that there is no impact on the Fund’s net assets and no tax liability resulting from unrecognized tax benefits relating to uncertain income tax positions taken or expected to be taken on a tax return. The Fund’s major tax jurisdictions are U.S. federal and Delaware. |
| | |
| d). | Income and Expenses – Dividend income is recognized on the ex-dividend date or as soon as information is available to the Fund. Interest income, which includes the amortization of premium and accretion of discount, is recognized on an accrual basis. Market discounts, original issue discounts, and market premiums on debt securities are accreted or amortized to interest income over the life of a security with a corresponding increase or decrease, as applicable, in the cost basis of such security using the yield-to-maturity method or, where applicable, the first call date of the security. Other non-cash dividends are recognized as investment income at the fair value of the property received. The Fund is charged for those expenses that are directly attributable to its portfolio, such as advisory, administration, and certain shareholder service fees. Income, expenses (other than expenses attributable to a specific class), and realized and unrealized gains/losses on investments are allocated to each class of shares based on such class’s net assets. |
| | |
| e). | Distributions to Shareholders – Dividends from net investment income for the Fund, if any, are declared and paid annually, usually in December. Distributions of net realized capital gains, if any, are declared and paid annually, usually in December. |
| | |
| f). | Security Transactions – Investment and shareholder transactions are recorded on the trade date. The Fund determines the realized gain/loss from an investment transaction by comparing the original cost of the security lot sold with the net sale proceeds. Discounts and premiums on securities purchased are accreted or amortized, respectively, over the life of each such security. |
| | |
| g). | Use of Estimates – Preparing financial statements in accordance with GAAP requires management to make estimates and assumptions that affect the reported amounts of assets and liabilities and disclosure of contingent assets and liabilities at the date of the financial statements, as well as the reported change in net assets during the reporting period. Actual results could differ from those estimates. |
| | |
| h). | Share Valuation – The net asset value (“NAV”) per share of the Fund is calculated by dividing (i) the total value of the securities held by the Fund, plus cash and other assets, minus all liabilities (including estimated accrued expenses) by (ii) the total number of Fund shares outstanding, rounded to the nearest $0.01. Fund shares are not priced on days the New York Stock Exchange is closed for trading. The offering and redemption price per share for the Fund is equal to the Fund’s NAV per share. |
| | |
| i). | Foreign Currency – Values of investments denominated in foreign currencies are converted into U.S. dollars using the spot market exchange rate at the time of valuation. Purchases and sales of investments and income are translated into U.S. dollars using the spot market exchange rate prevailing on the respective dates of such transactions. The Fund does not isolate the portion of the results of operations resulting from fluctuations in foreign exchange rates on investments from fluctuations resulting from changes in the market prices of securities held. Such fluctuations are included with the net realized and unrealized gain/loss on investments. Foreign investments present additional risks due to currency fluctuations, economic and political factors, lower liquidity, government regulations, differences in accounting standards, and other factors. |
| HENNESSY FUNDS | 1-800-966-4354 | |
| j.) | REIT Equity Securities – Distributions received from real estate investment trusts (“REITs”) may be classified as dividends, capital gains, or return of capital. Investments in REITs may require the Fund to accrue and distribute income not yet received. To generate sufficient cash to make any required distributions, the Fund may be required to sell securities in its portfolio (including when it is not advantageous to do so) that it otherwise would have continued to hold. At other times, investments in a REIT may result in the Fund’s receipt of cash in excess of the REIT’s earnings. If the Fund distributes these amounts, these distributions could constitute a return of capital to Fund shareholders for U.S. federal income tax purposes. Dividends received by the Fund from a REIT generally do not constitute qualified dividend income and do not qualify for the dividends-received deduction. |
| | |
| k). | Illiquid Securities – Pursuant to Rule 22e-4 under the 1940 Act, the Fund has adopted a Liquidity Risk Management Program (the “Liquidity Program”). The Liquidity Program requires, among other things, that the Fund limit its illiquid investments to no more than 15% of its net assets. An illiquid investment is any investment that the Fund reasonably expects cannot be sold or disposed of by the Fund in current market conditions in seven calendar days or less without the sale or disposition significantly changing the market value of the investment. |
| | |
| l). | Recent Accounting Pronouncements and Regulatory Updates – In October 2020, the Securities and Exchange Commission (“SEC”) adopted new regulations governing the use of derivatives by registered investment companies (“Rule 18f-4”). Rule 18f-4 imposes limits on the amount of derivatives a fund can enter into, eliminates the asset segregation framework currently used by funds to comply with Section 18 of the 1940 Act, and requires funds whose use of derivatives is greater than a limited specified amount to establish and maintain a comprehensive derivatives risk management program and appoint a derivatives risk manager. The Fund has adopted procedures in accordance with Rule 18f-4. |
| | |
| | In December 2020, the SEC adopted a new rule providing a framework for fund valuation practices (“Rule 2a-5”). Rule 2a-5 establishes requirements for determining fair value in good faith for purposes of the 1940 Act. Rule 2a-5 permits fund boards to designate certain parties to perform fair value determinations, subject to board oversight and certain other conditions. Rule 2a-5 also defines when market quotations are “readily available” for purposes of the 1940 Act and the threshold for determining whether a fund must fair value a security. In connection with Rule 2a-5, the SEC also adopted related recordkeeping requirements and is rescinding previously issued guidance, including with respect to the role of a board in determining fair value and the accounting and auditing of fund investments. The Fund has adopted procedures in accordance with Rule 2a-5. |
3). SECURITIES VALUATION
The Fund follows its valuation policies and procedures in determining its NAV and, in preparing these financial statements, the fair value accounting standards that establish an authoritative definition of fair value and set out a hierarchy for measuring fair value. These standards require additional disclosures about the various inputs and valuation techniques used to develop the measurements of fair value and a discussion of changes in valuation techniques and related inputs during the period. These inputs are summarized in the three broad levels listed below:
| | Level 1 – | Unadjusted, quoted prices in active markets for identical instruments that the Fund has the ability to access at the date of measurement. |
| NOTES TO THE FINANCIAL STATEMENTS |
| | Level 2 – | Other significant observable inputs (including, but not limited to, quoted prices in active markets for similar instruments, quoted prices in markets that are not active for identical or similar instruments, and model-derived valuations in which all significant inputs and significant value drivers are observable in active markets, such as interest rates, prepayment speeds, credit risk curves, default rates, and similar data). |
| | | |
| | Level 3 – | Significant unobservable inputs (including the Fund’s own assumptions about what market participants would use to price the asset or liability based on the best available information) when observable inputs are unavailable. |
The following is a description of the valuation techniques applied to the Fund’s major categories of assets and liabilities on a recurring basis:
| | Equity Securities – Equity securities, including common stocks, preferred stocks, foreign-issued common stocks, exchange-traded funds, closed-end mutual funds, partnerships, rights, and real estate investment trusts, that are traded on a securities exchange for which a last-quoted sales price is readily available generally are valued at the last sales price as reported by the primary exchange on which the securities are listed. Securities listed on The Nasdaq Stock Market (“Nasdaq”) generally are valued at the Nasdaq Official Closing Price, which may differ from the last sales price reported. Securities traded on a securities exchange for which a last-quoted sales price is not readily available generally are valued at the mean between the bid and ask prices. To the extent these securities are actively traded and valuation adjustments are not applied, they are classified in Level 1 of the fair value hierarchy. Securities traded on foreign exchanges generally are not valued at the same time the Fund calculates its NAV because most foreign markets close well before such time. The earlier close of most foreign markets gives rise to the possibility that significant events, including broad market moves, may have occurred in the interim. In certain circumstances, it may be determined that a foreign security needs to be fair valued because it appears that the value of the security might have been materially affected by events occurring after the close of the market in which the security is principally traded, but before the time the Fund calculates its NAV, such as by a development that affects an entire market or region (e.g., a weather-related event) or a potentially global development (e.g., a terrorist attack that may be expected to have an effect on investor expectations worldwide). |
| | |
| | Registered Investment Companies – Investments in open-end registered investment companies, commonly referred to as mutual funds, generally are priced at the ending NAV provided by the applicable mutual fund’s service agent and are classified in Level 1 of the fair value hierarchy. |
| | |
| | Debt Securities – Debt securities, including corporate bonds, asset-backed securities, mortgage-backed securities, municipal bonds, U.S. Treasuries, and U.S. government agency issues, are generally valued at market on the basis of valuations furnished by an independent pricing service that utilizes both dealer-supplied valuations and formula-based techniques. The pricing service may consider recently executed transactions in securities of the issuer or comparable issuers, market price quotations (where observable), bond spreads, and fundamental data relating to the issuer. In addition, the model may incorporate observable market data, such as reported sales of similar securities, broker quotes, yields, bids, offers, and reference data. Certain securities are valued primarily using dealer quotations. These securities are generally classified in Level 2 of the fair value hierarchy. |
| HENNESSY FUNDS | 1-800-966-4354 | |
| | Short-Term Securities – Short-term equity investments, including money market funds, are valued in the manner specified above for equity securities. Short-term debt investments with an original term to maturity of 60 days or less are valued at amortized cost, which approximates fair market value. If the original term to maturity of a short-term debt investment exceeds 60 days, then the values as of the 61st day prior to maturity are amortized. Amortized cost is not used if its use would be inappropriate due to credit or other impairments of the issuer, in which case the security’s fair value would be determined as described below. Short-term securities are generally classified in Level 1 or Level 2 of the fair value hierarchy depending on the inputs used and market activity levels for specific securities. |
The Board of Trustees of the Fund (the “Board”) has adopted fair value pricing procedures that are followed when a price for a security is not readily available or if a significant event has occurred that indicates the closing price of a security no longer represents the true value of that security. Fair value pricing determinations are made in good faith in accordance with these procedures. There are numerous criteria considered in determining a fair value of a security, such as the trading volume of a security and markets, the values of other similar securities, and news events with direct bearing on a security or markets. Fair value pricing results in an estimated price for a security that reflects the amount the Fund might reasonably expect to receive in a current sale. Depending on the relative significance of the valuation inputs, these securities may be classified in either Level 2 or Level 3 of the fair value hierarchy.
The fair value of foreign securities may be determined with the assistance of a pricing service using correlations between the movement of prices of such securities and indices of domestic securities and other appropriate indicators, such as closing market prices of relevant American Depositary Receipts or futures contracts. Using fair value pricing means that the Fund’s NAV reflects the affected portfolio securities’ values as determined by the Board or its designee, pursuant to the fair value pricing procedures adopted by the Board, instead of being determined by the market. Using a fair value pricing methodology to price a foreign security may result in a value that is different from such foreign security’s most recent closing price and from the value used by other investment companies to calculate their NAVs. Such securities are generally classified in Level 2 of the fair value hierarchy. Because the Fund invests in foreign securities, the value of the Fund’s portfolio securities may change on days when a shareholder is unable to purchase or redeem Fund shares.
The Board has delegated day-to-day valuation matters to the Valuation and Liquidity Committee comprising representatives from Hennessy Advisors, Inc., the Fund’s investment advisor (the “Advisor”). The function of the Valuation and Liquidity Committee, among other things, is to value securities where current and reliable market quotations are not readily available. All actions taken by the Valuation and Liquidity Committee are reviewed by the Board.
The Fund has performed an analysis of all existing investments to determine the significance and character of all inputs to their fair value determinations. Various inputs are used to determine the value of the Fund’s investments. The inputs or methodology used for valuing securities are not necessarily an indication of the risk associated with investing in those securities. Details related to the fair value hierarchy of the Fund’s securities as of October 31, 2022, are included in the Schedule of Investments.
| NOTES TO THE FINANCIAL STATEMENTS |
4). INVESTMENT TRANSACTIONS
Purchases and sales of investment securities (excluding government and short-term investments) for the Fund during fiscal year 2022 were $107,287,810 and $319,648,171, respectively.
There were no purchases or sales/maturities of long-term U.S. government securities for the Fund during fiscal year 2022.
5). INVESTMENT ADVISORY FEE AND OTHER TRANSACTIONS WITH AFFILIATES
The Advisor provides the Fund with investment advisory services under an Investment Advisory Agreement. The Advisor oversees the provision of investment advice and furnishes office space, facilities, and most of the personnel needed by the Fund. As compensation for its services, the Advisor is entitled to a monthly fee from the Fund. The fee is based on the average daily net assets of the Fund at an annual rate of 0.80%. The net investment advisory fees expensed by the Fund during fiscal year 2022 are included in the Statement of Operations.
The Advisor has delegated the day-to-day management of the Fund to a sub-advisor, SPARX Asset Management Co., Ltd. The Advisor pays the sub-advisory fees from its own assets, and these fees are not an additional expense of the Fund. During fiscal year 2022, the Advisor (not the Fund) paid a sub-advisory fee at the average rate of 0.36% of the daily net assets of the Fund. Pursuant to the sub-advisory agreement, the Advisor pays sub-advisory fees at the rate of 0.35% of the first $500 million of daily net assets, 0.40% of daily net assets between $500 million and $1 billion, and 0.42% of daily net assets over $1 billion.
The Board has approved a Shareholder Servicing Agreement for Investor Class shares of the Fund, which compensates the Advisor for the non-investment advisory services it provides to the Fund. The Shareholder Servicing Agreement provides for a monthly fee paid to the Advisor at an annual rate of 0.10% of the average daily net assets of the Fund attributable to Investor Class shares. The shareholder service fees expensed by the Fund during fiscal year 2022 are included in the Statement of Operations.
The Fund has adopted a plan pursuant to Rule 12b-1 under the Investment Company Act of 1940, as amended, that authorizes payments in connection with the distribution of Fund shares at an annual rate of up to 0.25% of the Fund’s average daily net assets attributable to Investor Class shares. Even though the authorized rate is up to 0.25%, the Fund is currently only using up to 0.15% of its average daily net assets attributable to Investor Class shares for such purpose. Amounts paid under the plan may be spent on any activities or expenses primarily intended to result in the sale of shares, including, but not limited to, advertising, shareholder account servicing, printing and mailing of prospectuses to other than current shareholders, printing and mailing of sales literature, and compensation for sales and marketing activities or to financial institutions and others, such as dealers and distributors. The distribution fees expensed by the Fund during fiscal year 2022 are included in the Statement of Operations.
The Fund has entered into agreements with various brokers, dealers, and financial intermediaries in connection with the sale of Fund shares. The agreements provide for periodic payments of sub-transfer agent expenses by the Fund to the brokers, dealers, and financial intermediaries for providing certain shareholder maintenance services. These shareholder services include the pre-processing and quality control of new accounts, shareholder correspondence, answering customer inquiries regarding account status, and facilitating shareholder telephone transactions. The sub-transfer agent fees expensed by the Fund during fiscal year 2022 are included in the Statement of Operations.
| HENNESSY FUNDS | 1-800-966-4354 | |
U.S. Bancorp Fund Services, LLC, d/b/a U.S. Bank Global Fund Services (“Fund Services”) provides the Fund with administrative, accounting, and transfer agent services. As administrator, Fund Services is responsible for activities such as (i) preparing various federal and state regulatory filings, reports, and returns for the Fund, (ii) preparing reports and materials to be supplied to the Board, (iii) monitoring the activities of the Fund’s custodian, transfer agent, and accountants, and (iv) coordinating the preparation and payment of the Fund’s expenses and reviewing the Fund’s expense accruals. U.S. Bank N.A., an affiliate of Fund Services, serves as the Fund’s custodian. The servicing agreements between the Trust, Fund Services, and U.S. Bank N.A. contain a fee schedule that is inclusive of administrative, accounting, custody, and transfer agent fees. The administrative, accounting, custody, and transfer agent fees expensed by the Fund during fiscal year 2022 are included in the Statement of Operations.
Quasar Distributors, LLC, a wholly owned broker-dealer subsidiary of Foreside Financial Group, LLC, acts as the Fund’s principal underwriter in a continuous public offering of Fund shares.
The officers of the Fund are affiliated with the Advisor. With the exception of the Chief Compliance Officer and, for a portion of the fiscal year, the Senior Compliance Officer, such officers receive no compensation from the Fund for serving in their respective roles. The Fund, along with the other funds in the Hennessy Funds family (collectively, the “Hennessy Funds”), makes reimbursement payments on an equal basis to the Advisor for a portion of the salary and benefits associated with the office of the Chief Compliance Officer and, for a portion of the fiscal year, for all of the salary and benefits associated with the office of the Senior Compliance Officer. The compliance fees expensed by the Fund during fiscal year 2022 for reimbursement payments to the Advisor are included in the Statement of Operations.
6). GUARANTEES AND INDEMNIFICATIONS
Under the Hennessy Funds’ organizational documents, their officers and trustees are indemnified by the Hennessy Funds against certain liabilities arising out of the performance of their duties to the Hennessy Funds. Additionally, in the normal course of business, the Hennessy Funds enter into contracts with service providers that contain general indemnification clauses. The Fund’s maximum exposure under these arrangements is unknown as this would involve future claims that may be made against the Fund that have not yet occurred. Currently, the Fund expects the risk of loss to be remote.
7). LINE OF CREDIT
The Fund has an uncommitted line of credit with the other Hennessy Funds in the amount of the lesser of (i) $100,000,000 or (ii) 33.33% of each Hennessy Fund’s net assets, or 30% for the Fund, the Hennessy Gas Utility Fund, and the Hennessy Japan Small Cap Fund and 10% for the Hennessy Balanced Fund. The line of credit is intended to provide any necessary short-term financing in connection with shareholder redemptions, subject to certain restrictions. The credit facility is with the Hennessy Funds’ custodian bank, U.S. Bank N.A. Borrowings under this arrangement bear interest at the bank’s prime rate and are secured by all of the Fund’s assets (as to its own borrowings only). During fiscal year 2022, the Fund had an outstanding average daily balance and a weighted average interest rate of $360,022 and 3.47%, respectively. The interest expensed by the Fund during fiscal year 2022 is included in the Statement of Operations. The maximum amount outstanding for the Fund during fiscal year 2022 was $23,879,000. As of October 31, 2022, the Fund did not have any borrowings outstanding under the line of credit.
| NOTES TO THE FINANCIAL STATEMENTS |
8). FEDERAL TAX INFORMATION
As of October 31, 2022, the components of accumulated earnings (losses) for income tax purposes were as follows:
| | | Investments | |
| Cost of investments for tax purposes | | $ | 270,720,134 | |
| Gross tax unrealized appreciation | | $ | 72,298,598 | |
| Gross tax unrealized depreciation | | | (30,493,857 | ) |
| Net tax unrealized appreciation/(depreciation) | | $ | 41,804,741 | |
| Undistributed ordinary income | | $ | — | |
| Undistributed long-term capital gains | | | — | |
| Total distributable earnings | | $ | — | |
| Other accumulated gain/(loss) | | $ | (30,566,241 | ) |
| Total accumulated gain/(loss) | | $ | 11,238,500 | |
The difference between book-basis unrealized appreciation/depreciation and tax-basis unrealized appreciation/depreciation (as shown above) is attributable primarily to wash sales and investments in passive foreign investment companies.
As of October 31, 2022, the Fund had $9,301,859 in unlimited long-term and $13,400,862 in unlimited short-term capital loss carryforwards.
Capital losses sustained in or after fiscal year 2012 can be carried forward indefinitely, but any such loss retains the character of the original loss and must be utilized prior to any loss incurred before fiscal year 2012. As a result of this ordering rule, capital loss carryforwards incurred prior to fiscal year 2012 may be more likely to expire unused. Capital losses sustained prior to fiscal year 2012 can be carried forward for eight years and can be carried forward as short-term capital losses regardless of the character of the original loss.
As of October 31, 2022, the Fund deferred, on a tax basis, a late-year ordinary loss of $7,863,520. Late-year ordinary losses are net ordinary losses incurred after December 31, 2021, but within the taxable year, that are deemed to arise on the first day of the Fund’s next taxable year.
During fiscal years 2022 and 2021, the tax character of distributions paid by the Fund was as follows:
| | | Year Ended | | | Year Ended | |
| | | October 31, 2022 | | | October 31, 2021 | |
Ordinary income(1) | | $ | 11,762,697 | | | $ | 48,044 | |
| Long-term capital gains | | | — | | | | — | |
| Total distributions | | $ | 11,762,697 | | | $ | 48,044 | |
(1) Ordinary income includes short-term capital gains.
9). MARKET DISRUPTION AND GEOPOLITICAL RISKS
Certain local, regional, or global events such as wars, terrorism, pandemics or other public health mattes, and other geopolitical events could have a significant impact on securities markets generally or individual securities or instruments. For example, following Russia’s invasion of Ukraine, the President of the United States signed an Executive Order in February 2022 prohibiting U.S. persons from entering transactions with the Central Bank of Russia. Similarly, in June 2021, the President of the United States signed an Executive Order affirming and expanding the U.S. policy prohibiting U.S. persons from purchasing or
| HENNESSY FUNDS | 1-800-966-4354 | |
investing in publicly-traded securities of companies identified by the U.S. Government as “Chinese Military-Industrial Complex Companies.” The list of such companies can change from time to time and the Advisor may be forced to hold securities it desires to sell or to sell securities it desires to buy, or the Advisor may not be able to participate in an investment it otherwise believes is attractive. The occurrence and duration of these types of events are hard to predict and could adversely affect the Fund’s performance.
10). EVENTS SUBSEQUENT TO YEAR END
Management has evaluated the Fund’s related events and transactions that occurred subsequent to October 31, 2022, through the date of issuance of the Fund’s financial statements. Management has determined that there were no subsequent events requiring recognition or disclosure in the financial statements.
| NOTES/REPORT OF INDEPENDENT REGISTERED PUBLIC ACCOUNTING FIRM |
Report of Independent Registered Public
Accounting Firm
To the Board of Trustees of Hennessy Funds Trust
and the shareholders of the Hennessy Japan Fund
Novato, CA
Opinion on the Financial Statements
We have audited the accompanying statement of assets and liabilities of the Hennessy Japan Fund (the “Fund”), a series of Hennessy Funds Trust, including the schedule of investments, as of October 31, 2022, the related statement of operations for the year then ended, the statements of changes in net assets for each of the two years in the period then ended, the financial highlights for each of the five years in the period then ended, and the related notes (collectively referred to as the “financial statements”). In our opinion, the financial statements present fairly, in all material respects, the financial position of the Fund as of October 31, 2022, the results of its operations for the year then ended, the changes in its net assets for each of the two years in the period then ended, and the financial highlights for each of the five years in the period then ended in conformity with accounting principles generally accepted in the United States of America.
Basis for Opinion
These financial statements are the responsibility of the Fund’s management. Our responsibility is to express an opinion on the Fund’s financial statements based on our audits. We are a public accounting firm registered with the Public Company Accounting Oversight Board (United States) (“PCAOB”) and are required to be independent with respect to the Fund in accordance with the U.S. federal securities laws and the applicable rules and regulations of the Securities and Exchange Commission and the PCAOB. We have served as the auditor of one or more of the funds in the Trust since 2002.
We conducted our audits in accordance with the standards of the PCAOB. Those standards require that we plan and perform the audit to obtain reasonable assurance about whether the financial statements are free of material misstatement, whether due to error or fraud. The Fund is not required to have, nor were we engaged to perform, an audit of its internal control over financial reporting. As part of our audits we are required to obtain an understanding of internal control over financial reporting, but not for the purpose of expressing an opinion on the effectiveness of the Fund’s internal control over financial reporting. Accordingly, we express no such opinion.
Our audits included performing procedures to assess the risks of material misstatement of the financial statements, whether due to error or fraud, and performing procedures that respond to those risks. Such procedures included examining, on a test basis, evidence regarding the amounts and disclosures in the financial statements. Our audits also included evaluating the accounting principles used and significant estimates made by management, as well as evaluating the overall presentation of the financial statements. Our procedures included confirmation of securities owned as of October 31, 2022 by correspondence with the custodian and brokers; when replies were not received from brokers, we performed other auditing procedures. We believe that our audits provide a reasonable basis for our opinion.
| | |
| | TAIT, WELLER & BAKER LLP |
Philadelphia, Pennsylvania
December 22, 2022
| HENNESSY FUNDS | 1-800-966-4354 | |
Trustees and Officers of the Fund (Unaudited)
The business and affairs of the Funds are managed under the direction of the Board of Trustees of the Trust, and the Board of Trustees elects the officers of the Trust. From time to time, the Board of Trustees also has appointed advisers to the Board of Trustees (“Advisers”) with the intention of having qualified individuals serve in an advisory capacity to garner experience in the mutual fund and asset management industry and be considered as potential Trustees in the future. There are currently two Advisers, Brian Alexander and Doug Franklin. As Advisers, Mr. Alexander and Mr. Franklin attend meetings of the Board of Trustees and act as non-voting participants. Information pertaining to the Trustees, Advisers, and the officers of the Trust is set forth below. The Trustees and officers serve until their successors are duly elected and qualified or until their earlier death, resignation, or removal. Each Trustee oversees all 16 Hennessy Funds. Unless otherwise indicated, the address of all persons listed below is 7250 Redwood Boulevard, Suite 200, Novato, CA 94945. The Fund’s Statement of Additional Information includes more information about the persons listed below and is available without charge by calling 1-800-966-4354 or by visiting www.hennessyfunds.com.
| | | | Other |
| | | | Directorships |
| | | | Held Outside |
| Name, Age, | | | of Fund |
| and Position Held | Start Date | Principal Occupation(s) | Complex During |
with the Trust | of Service | During Past Five Years | Past Five Years |
| Disinterested Trustees and Advisers | | | |
| | | | |
| J. Dennis DeSousa | January 1996 | Mr. DeSousa is a real estate investor. | None. |
| 86 | | | |
| Trustee | | | |
| | | | |
| Robert T. Doyle | January 1996 | Mr. Doyle is retired. He served as the | None. |
| 75 | | Sheriff of Marin County, California | |
| Trustee | | from 1996 – June 2022. | |
| | | | |
| Claire Garvie | December 2015 | Ms. Garvie is a founder of Kiosk and | None. |
| 48 | as an Adviser | has served as its Chief Operating | |
| Trustee | to the Board | Officer since 2004. Kiosk is a full- | |
| | and | service marketing agency with | |
| | December 2021 | offices in the San Francisco Bay Area | |
| | as a Trustee | and Liverpool, UK and staff across | |
| | | nine states in the U.S. | |
| | | | |
| Gerald P. Richardson | May 2004 | Mr. Richardson is an independent | None. |
| 77 | | consultant in the securities industry. | |
| Trustee | | | |
| TRUSTEES AND OFFICERS OF THE FUND |
| | | | Other |
| | | | Directorships |
| | | | Held Outside |
| Name, Age, | | | of Fund |
| and Position Held | Start Date | Principal Occupation(s) | Complex During |
with the Trust | of Service | During Past Five Years | Past Five Years |
| Brian Alexander | March 2015 | Mr. Alexander has worked for the | None. |
| 41 | | Sutter Health organization since | |
| Adviser to the Board | | 2011 in various positions. He has | |
| | | served as the Chief Executive Officer | |
| | | of the North Valley Hospital Area | |
| | | since 2021. From 2018 to 2021, he | |
| | | served as the Chief Executive Officer | |
| | | of Sutter Roseville Medical Center. | |
| | | From 2016 through 2018, he served | |
| | | as the Vice President of Strategy for | |
| | | the Sutter Health Valley Area, which | |
| | | includes 11 hospitals, 13 ambulatory | |
| | | surgery centers, 16,000 employees, | |
| | | and 1,900 physicians. | |
| | | | |
| Doug Franklin | March 2016 | Mr. Franklin is a retired insurance | None. |
| 58 | | industry executive. From 1987 | |
| Adviser to the Board | | through 2015, he was employed by | |
| | | the Allianz-Fireman’s Fund Insurance | |
| | | Company in various positions, | |
| | | including as its Chief Actuary and | |
| | | Chief Risk Officer. | |
| | | | |
Interested Trustee(1) | | | |
| | | | |
| Neil J. Hennessy | January 1996 as | Mr. Hennessy has been employed | Hennessy |
| 66 | a Trustee and | by Hennessy Advisors, Inc. since | Advisors, Inc. |
| Chairman of the Board, | June 2008 as | 1989 and currently serves as its | |
| Chief Market Strategist, | an officer | Chairman and Chief Executive Officer. | |
| Portfolio Manager, | | | |
| and President | | | |
| | | | |
| Name, Age, | | | |
| and Position Held | Start Date | Principal Occupation(s) | |
with the Trust | of Service | During Past Five Years | |
| Officers | | | |
| | | | |
| Teresa M. Nilsen | January 1996 | Ms. Nilsen has been employed by Hennessy Advisors, Inc. | |
| 56 | | since 1989 and currently serves as its President, Chief | |
| Executive Vice President | | Operating Officer, and Secretary. | |
| and Treasurer | | | |
| | | | |
| Daniel B. Steadman | March 2000 | Mr. Steadman has been employed by Hennessy Advisors, Inc. | |
| 66 | | since 2000 and currently serves as its Executive Vice President. | |
| Executive Vice President’ | | | |
| and Secretary | | | |
| | | | |
| Brian Carlson | December 2013 | Mr. Carlson has been employed by Hennessy Advisors, Inc. | |
| 50 | | since December 2013 and currently serves as its Chief | |
| Senior Vice President | | Compliance Officer and Senior Vice President. | |
| and Head of Distribution | | | |
| HENNESSY FUNDS | 1-800-966-4354 | |
| Name, Age, | | |
| and Position Held | Start Date | Principal Occupation(s) |
with the Trust | of Service | During Past Five Years |
Jennifer Cheskiewicz(2) | June 2013 | Ms. Cheskiewicz has been employed by Hennessy Advisors, Inc. |
| 45 | | as its General Counsel since June 2013. |
| Senior Vice President and | | |
| Chief Compliance Officer | | |
| | | |
David Ellison(3) | October 2012 | Mr. Ellison has been employed by Hennessy Advisors, Inc. since |
| 64 | | October 2012. He has served as a Portfolio Manager of the |
| Senior Vice President | | Hennessy Large Cap Financial Fund and the Hennessy Small |
| and Portfolio Manager | | Cap Financial Fund since their inception. Mr. Ellison also served |
| | | as a Portfolio Manager of the Hennessy Technology Fund from |
| | | its inception until February 2017. Mr. Ellison served as Director, |
| | | CIO, and President of FBR Fund Advisers, Inc. from December |
| | | 1999 to October 2012. |
| | | |
Ryan Kelley(4) | March 2013 | Mr. Kelley has been employed by Hennessy Advisors, Inc. since |
| 50 | | October 2012. He has served as Chief Investment Officer of the |
| Chief Investment Officer, | | Hennessy Funds since March 2021 and has served as a Portfolio |
| Senior Vice President, | | Manager of the Hennessy Gas Utility Fund, the Hennessy Large |
| and Portfolio Manager | | Cap Financial Fund, and the Hennessy Small Cap Financial Fund |
| | | since October 2014. Mr. Kelley served as Co-Portfolio Manager |
| | | of these same funds from March 2013 through September |
| | | 2014 and as a Portfolio Analyst for the Hennessy Funds from |
| | | October 2012 through February 2013. He has also served as a |
| | | Portfolio Manager of the Hennessy Cornerstone Growth Fund, |
| | | the Hennessy Cornerstone Mid Cap 30 Fund, the Hennessy |
| | | Cornerstone Large Growth Fund, and the Hennessy |
| | | Cornerstone Value Fund since February 2017 and as a Portfolio |
| | | Manager of the Hennessy Total Return Fund, the Hennessy |
| | | Balanced Fund, and the Hennessy Technology Fund since May |
| | | 2018. He served as Co-Portfolio Manager of the Hennessy |
| | | Technology Fund from February 2017 until May 2018. Mr. Kelley |
| | | served as Portfolio Manager of FBR Fund Advisers, Inc. from |
| | | January 2008 to October 2012. |
| | | |
L. Joshua Wein(4) | September 2018 | Mr. Wein has been employed by Hennessy Advisors, Inc. since |
| 49 | | 2018. He has served as Co-Portfolio Manager of the Hennessy |
| Vice President and | | Cornerstone Growth Fund, the Hennessy Cornerstone |
| Co-Portfolio Manager | | Mid Cap 30 Fund, the Hennessy Cornerstone Large Growth |
| | | Fund, the Hennessy Cornerstone Value Fund, Hennessy Total |
| | | Return Fund, the Hennessy Balanced Fund, the Hennessy Gas |
| | | Utility Fund, and the Hennessy Technology Fund since February |
| | | 2019. He served as a Senior Analyst of these same funds from |
| | | September 2018 through February 2019. Mr. Wein served as |
| | | Director of Alternative Investments and Co-Portfolio Manager |
| | | at Sterling Capital Management from 2008 to 2018. |
_______________
(1) | Mr. Hennessy is considered an “interested person,” as defined in the Investment Company Act of 1940, as amended, because he is an officer of the Trust. |
(2) | The address of this officer is 4800 Bee Caves Road, Suite 100, Austin, TX 78746. |
(3) | The address of this officer is 101 Federal Street, Suite 1615B, Boston, MA 02110. |
(4) | The address of this officer is 1340 Environ Way, Chapel Hill, NC 27517. |
| TRUSTEES AND OFFICERS OF THE FUND |
(This Page Intentionally Left Blank.)
| HENNESSY FUNDS | 1-800-966-4354 | |
Expense Example (Unaudited)
October 31, 2022
As a shareholder of the Fund, you incur ongoing costs, including management fees, service fees, and other Fund expenses. This Example is intended to help you understand your ongoing costs (in dollars) of investing in the Fund and to compare these costs with the ongoing costs of investing in other mutual funds. The Example is based on an investment of $1,000 invested at the beginning of the period and held for the entire period from May 1, 2022, through October 31, 2022.
Actual Expenses
In the table below, the first line under each of the “Investor Class” and “Institutional Class” headings provides information about actual account values and actual expenses for each share class. You may use this information, together with the amount you invested, to estimate the expenses that you paid over the period. Simply divide your account value by $1,000 (for example, an $8,600 account value divided by $1,000 = 8.6), then multiply the result by the number in the first line under the heading “Expenses Paid During Period” to estimate the expenses you paid on your account during this period. Although the Fund charges no sales loads or transaction fees, you will be assessed fees for outgoing wire transfers, returned checks, and stop payment orders at prevailing rates charged by U.S. Bank Global Fund Services, the Fund’s transfer agent. If you request that a redemption be made by wire transfer, the Fund’s transfer agent charges a $15 fee. IRAs are charged a $15 annual maintenance fee (up to $30 maximum per shareholder for shareholders with multiple IRAs). The examples below include, but are not limited to, management, shareholder servicing, accounting, custody, and transfer agent fees. However, the examples below do not include portfolio trading commissions and related expenses.
Hypothetical Example for Comparison Purposes
In the table below, the second line under each of the “Investor Class” and “Institutional Class” headings provides information about hypothetical account values and hypothetical expenses based on the Fund’s actual expense ratio for each share class and an assumed rate of return of 5% per year before expenses, which is not the Fund’s actual return for such share class. The hypothetical account values and expenses may not be used to estimate the actual ending account balance or expenses you paid for the period. You may use this information to compare the ongoing costs of investing in the Fund and other funds. To do so, compare these 5% hypothetical examples with the 5% hypothetical examples that appear in the shareholder reports of the other funds. Please note that the expenses shown in the table are meant to highlight your ongoing costs only. Therefore, the second lines under “Investor Class” and “Institutional Class” are useful in comparing ongoing costs only and will not help you determine the relative total costs of owning different funds.
| | | | Expenses Paid |
| | Beginning | Ending | During Period(1) |
| | Account Value | Account Value | May 1, 2022 – |
| | May 1, 2022 | October 31, 2022 | October 31, 2022 |
| Investor Class | | | |
| Actual | $1,000.00 | $ 894.80 | $6.83 |
| Hypothetical (5% return before expenses) | $1,000.00 | $1,018.00 | $7.27 |
| | | | |
| Institutional Class | | | |
| Actual | $1,000.00 | $ 896.10 | $5.26 |
| Hypothetical (5% return before expenses) | $1,000.00 | $1,019.66 | $5.60 |
(1) | Expenses are equal to the Fund’s annualized expense ratio of 1.43% for Investor Class shares or 1.10% for Institutional Class shares, as applicable, multiplied by the average account value over the period, multiplied by 184/365 days (to reflect the half-year period). |
| HENNESSY FUNDS | 1-800-966-4354 | |
How to Obtain a Copy of the Fund’s Proxy
Voting Policy and Proxy Voting Records
A description of the policies and procedures the Fund uses to determine how to vote proxies relating to portfolio securities is available without charge (1) by calling 1-800-966-4354, (2) on the Hennessy Funds’ website at www.hennessyfunds.com/proxy-voting/voting-policy, or (3) on the U.S. Securities and Exchange Commission’s (the “SEC”) website at www.sec.gov. The Fund’s proxy voting record is available without charge on both the Hennessy Funds’ website at www.hennessyfunds.com/proxy-voting/voting-record and the SEC’s website at www.sec.gov no later than August 31 for the prior 12 months ending June 30.
Availability of Quarterly Portfolio Schedule
The Fund files a complete schedule of portfolio holdings with the SEC for the first and third quarters of each fiscal year as an exhibit to its reports on Form N-PORT. The Fund’s Form N-PORT reports are available on the SEC’s website at www.sec.gov or on request by calling 1-800-966-4354.
Federal Tax Distribution Information (Unaudited)
For fiscal year 2022, certain dividends paid by the Fund may be subject to a maximum tax rate of 23.8%, as provided for by the Jobs and Growth Tax Relief Reconciliation Act of 2003. The percentage of dividends declared from ordinary income designated as qualified dividend income was 69.62%.
For corporate shareholders, the percent of ordinary income distributions that qualified for the corporate dividends received deduction for fiscal year 2022 was 0.00%.
The percentage of taxable ordinary income distributions that were designated as short-term capital gain distributions under Section 871(k)(2)(C) of the Internal Revenue Code of 1986, as amended, for the Fund was 0.00%.
For the year ended October 31, 2022, the Fund earned no foreign-source income and paid no foreign taxes.
Important Notice Regarding Delivery of
Shareholder Documents
To help keep the Fund’s costs as low as possible, we generally deliver a single copy of shareholder reports, proxy statements, and prospectuses to shareholders who share an address and have the same last name. This process does not apply to account statements. You may request an individual copy of a shareholder document at any time. If you would like to receive separate mailings of shareholder documents, please call U.S. Bank Global Fund Services at 1-800-261-6950 or 1-414-765-4124, and individual delivery will begin within 30 days of your request. If your account is held through a financial institution or other intermediary, please contact such intermediary directly to request individual delivery.
| PROXY VOTING — LIQUIDITY RISK MANAGEMENT PROGRAM |
Electronic Delivery
As permitted by SEC regulations, the Fund’s shareholder reports are made available on a website, and unless you sign for eDelivery or elect to receive paper copies as detailed below, you will be notified by mail each time a report is posted and provided with a website link to access the report.
The Fund also offers shareholders the option to receive all notices, account statements, prospectuses, tax forms, and shareholder reports electronically. To sign up for eDelivery or change your delivery preference, please visit www.hennessyfunds.com/account.
To elect to receive paper copies of all future reports free of charge, please call U.S. Bank Global Fund Services at 800-261-6950 or 414-765-4124.
Subscribe to receive our team’s unique market and sector insights delivered to your inbox
www.hennessyfunds.com/subscribe
Follow us on social media
Liquidity Risk Management Program
In accordance with Rule 22e-4 under the Investment Company Act of 1940, as amended (the “Liquidity Rule”), we have adopted and implemented a liquidity risk management program (the “Liquidity Program”). The purpose of the Liquidity Program is to assess and manage the Fund’s liquidity risk, which is the risk that the Fund would not be able to meet requests to redeem Fund shares without significant dilution of the remaining shareholders’ interests in the Fund. The Board of Trustees of the Fund (the “Board”) designated a committee comprising representatives of Hennessy Advisors, Inc., the investment adviser to the Fund, as the administrator of the Liquidity Program (the “Program Administrator”).
The Program Administrator provided a written report regarding the Liquidity Program to the Board in advance of its meeting on June 1, 2022. The report covered the period from June 1, 2021, through May 31, 2022. The report addressed the operation of the Liquidity Program, assessed the adequacy and effectiveness of its implementation, and described any material changes to the Liquidity Program during the review period. The Trust’s chief compliance officer presented the report to the Board at the meeting and provided additional information regarding the Liquidity Program. The Board reviewed the Liquidity Program and considered, among other items, the following:
| | 1. | The Program Administrator reviewed daily historical net redemption activity during the review period and during prior periods with higher-than-average redemption activity and concluded that the Fund has historically been able to meet requests to redeem Fund shares without significant dilution to the Fund’s remaining shareholders, and the Program Administrator expects the Fund to be able to continue to do so in the future during both normal and reasonably foreseeable stressed conditions. |
| | | |
| | 2. | The Fund primarily holds assets that are highly liquid investments and is therefore not required to establish a highly liquid investment minimum for the Fund or adopt policies and procedures for responding to a highly liquid investment minimum shortfall. |
| HENNESSY FUNDS | 1-800-966-4354 | |
| | 3. | The Program Administrator did not make any material changes to the Liquidity Program during the review period and was not recommending any changes to the Liquidity Program or the model inputs used to determine the liquidity classification of each security held by the Fund. |
| | | |
| | 4. | The Program Administrator concluded that the Liquidity Program was reasonably designed to assess and manage the Fund’s liquidity risk, complies with the requirements of the Liquidity Rule, and was operating as intended during the review period. |
Privacy Policy
We collect the following personal information about you:
| | 1. | Information we receive from you in applications or other forms, correspondence, or conversations, including, but not limited to, your name, address, phone number, social security number, assets, income, and date of birth; |
| | | |
| | 2. | Information about your transactions with us, our affiliates, or others, including, but not limited to, your account number and balance, payments history, parties to transactions, cost basis information, and other financial information; and |
| | | |
| | 3. | Other personal information we collect from various sources, even if you have not entered into a prior transaction with us, including the following: |
| | | • | Name, alias, address, unique personal identifier, online identifier, IP address, email address, telephone number, account name, and other similar identifiers; |
| | | | |
| | | • | Age and marital status; |
| | | | |
| | | • | Commercial information, including records of products purchased; |
| | | | |
| | | • | Browsing history, search history, and information on interaction with our website; |
| | | | |
| | | • | Geolocation data; |
| | | | |
| | | • | Employment and employment history, educational history, financial information, and purchasing and consuming histories or tendencies; and |
| | | | |
| | | • | Inferences drawn from the above-listed information to create a profile about your preferences, characteristics, predispositions, and behavior. |
We collect this information directly from you, indirectly in the course of providing services to you, directly and indirectly from your activity on our website, from broker dealers, marketing agencies, and other third parties that interact with us in connection with the services we perform and products we offer, and from anonymized and aggregated consumer information.
We use this information to fulfill the reason you provided the information to us, to provide you with other relevant products that you request from us, to provide you with information about products that may interest you, to improve our website or present our website’s contents to you, and as otherwise described to you when collecting your personal information.
We do not disclose any personal information to unaffiliated third parties, except as permitted by law. We may disclose your personal information to our affiliates, vendors, and service providers for a business purpose. For example, we are permitted by law to disclose all of the information we collect, as described above, to our transfer agent to
| LIQUIDITY RISK MANAGEMENT PROGRAM — PRIVACY POLICY |
process your transactions. When disclosing your personal information to third parties, we enter into a contract with each third party describing the purpose of such disclosure and requiring that such personal information be kept confidential and not used for any purpose except to perform the services contracted or respond to regulatory or law enforcement requests.
Furthermore, we restrict access to your personal information to those persons who require such information to provide products or services to you. As a result, we do not provide a means for opting out of our limited sharing of your information. We maintain physical, electronic, and procedural safeguards that comply with federal standards to guard your personal information.
If you hold shares of the Funds through a financial intermediary, including, but not limited to, a broker-dealer, bank, or trust company, the privacy policy of your financial intermediary governs how your personal information is shared with unaffiliated third parties.
Supplemental Privacy Notice for Residents of California
The California Consumer Privacy Act of 2018 (the “CCPA”) provides you, as a California resident, with certain additional rights relating to your personal information.
Under the CCPA, you have the right to request that we disclose to you the categories of personal information we have collected about you over the past 12 months, the categories of sources of such information, our business purpose for collecting the information, the categories of third parties, if any, with whom we shared the information, and the specific information we have collected about you. You also have the right to request that we delete any of your personal information, and, unless an exception applies, we will delete such information upon receiving and confirming your request. To make a request, call us at 1-800-966-4354, email us at privacy@hennessyfunds.com, or go to www.hennessyfunds.com/contact. We will not discriminate against you for exercising your rights under the CCPA. Further, we will not collect additional categories of your personal information or use the personal information we collected for materially different, unrelated, or incompatible purposes without providing you notice.
| HENNESSY FUNDS | 1-800-966-4354 | |
For information, questions, or assistance, please call
The Hennessy Funds
1-800-966-4354 or 1-415-899-1555
INVESTMENT ADVISOR
Hennessy Advisors, Inc.
7250 Redwood Boulevard, Suite 200
Novato, California 94945
ADMINISTRATOR,
TRANSFER AGENT,
DIVIDEND PAYING AGENT, &
SHAREHOLDER SERVICING AGENT
U.S. Bancorp Fund Services, LLC
d/b/a U.S. Bank Global Fund Services
P.O. Box 701
Milwaukee, Wisconsin 53201-0701
CUSTODIAN
U.S. Bank N.A.
Custody Operations
1555 North River Center Drive, Suite 302
Milwaukee, Wisconsin 53212
TRUSTEES
Neil J. Hennessy
Robert T. Doyle
J. Dennis DeSousa
Claire Garvie
Gerald P. Richardson
COUNSEL
Foley & Lardner LLP
777 East Wisconsin Avenue
Milwaukee, Wisconsin 53202-5306
INDEPENDENT REGISTERED
PUBLIC ACCOUNTING FIRM
Tait, Weller & Baker LLP
Two Liberty Place
50 South 16th Street, Suite 2900
Philadelphia, Pennsylvania 19102-2529
DISTRIBUTOR
Quasar Distributors, LLC
111 East Kilbourn Avenue, Suite 1250
Milwaukee, Wisconsin 53202
www.hennessyfunds.com | 800-966-4354
This report has been prepared for shareholders and may be distributed to
others only if preceded or accompanied by a current prospectus.
ANNUAL REPORT
OCTOBER 31, 2022
HENNESSY JAPAN SMALL CAP FUND
Investor Class HJPSX
Institutional Class HJSIX
www.hennessyfunds.com | 1-800-966-4354
(This Page Intentionally Left Blank.)
Contents
| Letter to Shareholders | | 2 |
| Performance Overview | | 4 |
| Financial Statements | | |
| Schedule of Investments | | 7 |
| Statement of Assets and Liabilities | | 12 |
| Statement of Operations | | 13 |
| Statements of Changes in Net Assets | | 15 |
| Financial Highlights | | 16 |
| Notes to the Financial Statements | | 20 |
| Report of Independent Registered Public Accounting Firm | | 28 |
| Trustees and Officers of the Fund | | 29 |
| Expense Example | | 32 |
| Proxy Voting Policy and Proxy Voting Records | | 34 |
| Availability of Quarterly Portfolio Schedule | | 34 |
| Federal Tax Distribution Information | | 34 |
| Important Notice Regarding Delivery of Shareholder Documents | | 34 |
| Electronic Delivery | | 35 |
| Liquidity Risk Management Program | | 35 |
| Privacy Policy | | 36 |
| HENNESSY FUNDS | 1-800-966-4354 | |
November 2022
Dear Hennessy Funds Shareholder:
The Japanese stock market declined by 24.05% as measured by the Tokyo Stock Price Index (TOPIX) over the 12-month period ended October 31, 2022 (in U.S. dollar terms). Under the Kishida administration that began at the beginning of October 2021, the market has fluctuated due to Russia’s invasion of Ukraine, the harsh environment of global inflation, the outlook on U.S. monetary policy, and the depreciation of the yen.
The Japanese stock market has been influenced by the outlook on U.S. monetary policy. Japanese equities rose alongside an upturn in the U.S. stock market on the back of receding inflation fears. However, equities began to decline when the Federal Reserve’s decisive stance on inflation became apparent in the second half of August 2022. Nevertheless, the rate of decline in Japanese equity markets was more limited than in the U.S. and Europe. We believe this is due to the sense that Japanese stocks are undervalued and to the Bank of Japan’s continuing stance on monetary easing.
The Bank of Japan is clearly in a dilemma. That is to say, if the BOJ feels forced to raise rates to follow other central banks, the decision will likely negatively impact the domestic economy, which is still in a fragile state after the pandemic. On other hand, if the BOJ chooses to do nothing, then the yen could keep depreciating to reflect the widening of interest rate differentials with other countries, which may also hurt the Japanese economy through higher import prices (i.e., inflation).
In an environment of rising interest rates like today, where the growth-to-value market rotation is all the rage, all things “growth” are viewed as sure losers. Is it really true that all growth stocks, as defined by high price-to-earnings (P/E) multiples, are destined to fall? Should we think that all growth stocks are experiencing corrections because they were overpriced? We believe that may not be the case. In our view, certain conditions need to be met for the collective wisdom to exhibit its powerful predictive ability including: 1) opinions have to be amply diverse, 2) each individual’s opinion has to be formed independent of others, and 3) the result of the aggregated opinions must be expressed in a single output like a number. At that point, we believe that the one-sided growth-to-value rotation may abate.
Thank you for your continued confidence and investment in the Hennessy Funds.
Sincerely,
| |
| Tadahiro Fujimura | Masakazu Takeda |
| Portfolio Manager, | Portfolio Manager, |
| Hennessy Japan Small Cap Fund; | Hennessy Japan Fund; |
| Chief Investment Officer | Fund Manager |
| SPARX Asset Management Co., Ltd. | SPARX Asset Management Co., Ltd. |
SPARX Asset Management Co., Ltd., located in Tokyo, Japan, is the sub-advisor to the Hennessy Japan Fund and the Hennessy Japan Small Cap Fund.
Past performance does not guarantee future results.
Mutual fund investing involves risk. Principal loss is possible.
Opinions expressed are those of Tadahiro Fujimura and Masakazu Takeda and are subject to change, are not guaranteed, and should not be considered investment advice.
The Tokyo Stock Price Index (TOPIX) is a capitalization-weighted index of all of the companies listed on the First Section of the Tokyo Stock Exchange. The index is used herein for comparative purposes in accordance with SEC regulations. One cannot invest directly in an index.
P/E, or price to earnings, is calculated by dividing a company’s market price per share by its earnings per share.
| HENNESSY FUNDS | 1-800-966-4354 | |
Performance Overview (Unaudited)
CHANGE IN VALUE OF $10,000 INVESTMENT
This graph illustrates the performance of an initial investment of $10,000 made in the Fund 10 years ago and assumes the reinvestment of dividends and capital gains.
AVERAGE ANNUAL TOTAL RETURN FOR PERIODS ENDED OCTOBER 31, 2022
| | One | Five | Ten |
| | Year | Years | Years |
| Hennessy Japan Small Cap Fund – | | | |
| Investor Class (HJPSX) | -27.41% | -1.14% | 9.53% |
| Hennessy Japan Small Cap Fund – | | | |
Institutional Class (HJSIX)(1) | -27.05% | -0.71% | 9.83% |
Russell/Nomura Small CapTM Index | -24.44% | -3.76% | 5.61% |
| Tokyo Stock Price Index (TOPIX) | -24.05% | -1.23% | 5.70% |
Expense ratios: 1.53% (Investor Class); 1.13% (Institutional Class)
(1) | The inception date of Institutional Class shares is June 15, 2015. Performance shown prior to the inception of Institutional Class shares reflects the performance of Investor Class shares and includes expenses that are not applicable to, and are higher than, those of Institutional Class shares. |
Performance data quoted represents past performance; past performance does not guarantee future results. The investment return and principal value of an investment will fluctuate so that an investor’s shares, when redeemed, may be worth more or less than their original cost. The performance table does not reflect the deduction of taxes that a shareholder would pay on Fund distributions or the redemption of Fund shares. Current performance of the Fund may be lower or higher than the performance quoted. Performance data current to the most recent month end may be obtained by visiting www.hennessyfunds.com.
The Russell/Nomura Small Cap™ Index comprises the bottom 15% of the Russell/Nomura Total Market™ Index based on market capitalization. The Tokyo Stock Price Index (TOPIX) is a capitalization-weighted index of all of the companies listed on the First Section of the Tokyo Stock Exchange. One cannot invest directly in an index. These indices are used for comparative purposes in accordance with Securities and Exchange Commission regulations.
Frank Russell Company (“Russell”) is the source and owner of the trademarks, service marks, and copyrights related to the Russell Indexes. Russell® is a trademark of Frank Russell Company. Neither Russell nor its licensors accept any liability for any errors or omissions in the Russell Indexes or Russell ratings or underlying data and no party may
rely on any Russell Indexes or Russell ratings or underlying data contained in this communication. No further distribution of Russell data is permitted without Russell’s express written consent. Russell does not promote, sponsor, or endorse the content of this communication.
The expense ratios presented are from the most recent prospectus. The expense ratios for the current reporting period are available in the Financial Highlights section of this report.
PERFORMANCE NARRATIVE
Portfolio Managers Tadahiro Fujimura, CFA and CMA*, and Takenari Okumura, CMA*
SPARX Asset Management Co., Ltd. (sub-advisor)
Performance:
For the one-year period ended October 31, 2022, the Investor Class of the Hennessy Japan Small Cap Fund returned -27.41%, underperforming both the Russell/Nomura Small Cap™ Index (the Fund’s primary benchmark) and the Tokyo Stock Price Index (TOPIX), which returned -24.44% and -24.05%, respectively, for the same period in U.S. dollar terms.
Amid rising interest rates and growing fears of a recession in the West, domestic demand-related stocks, which are less susceptible to outside influences, and the manufacturing sector, which benefits from a weaker yen, contributed to performance. We also believe that the performance of small-cap stocks, which had been sluggish since last year, has been recovering compared with larger-cap stocks.
In terms of individual stocks, Lifenet Insurance Company, an internet-based life insurance company, positively contributed to the Fund’s performance after the Fund began investing during a dip. The share price of NGK Spark Plug Co., Ltd., a producer of automotive parts such as spark plugs and various sensors, rose due to a revised earnings forecast for the current fiscal year that is expected to achieve historic highs on the back of strong demand for engine spark plugs for new cars and a weaker yen. WingArc1st, Inc., a software developer and seller, also performed well following a robust earnings announcement on the back of increasing demand for the digitalization of business process such as invoicing.
One of the stocks that detracted most from the Fund’s performance was Benefit One, Inc., an employee benefits outsourcing contractor. The share price of the company fell due to profit-taking pressure after having favorably performed in 2021. SBS Holdings, Inc., a logistics company, also contributed negatively to the Fund’s performance. Although the company’s earnings results for the first half of 2022 were better than the company’s projections due to robust sales and an increase in international shipments, there was a fire in the warehouse of a subsidiary company and the company recorded an extraordinary loss associated with the loss of the building and compensation for the damaged shipper. HITO-Communications Holdings, Inc., which engages in sales support businesses, experienced selling pressure from profit taking as a pandemic-related surge in business is expected to decline for the next fiscal year.
The Fund continues to hold all the companies mentioned.
Portfolio Strategy and Investment Commentary:
We believe that the competitiveness of Japan’s manufacturing industry has increased due to the yen’s rapid depreciation, as well as lower upward wage pressures in Japan compared to other countries. We expect investments in factories to increase as industries review
| HENNESSY FUNDS | 1-800-966-4354 | |
supply chains in light of heightened geopolitical risks and as companies update to energy-efficient equipment due to the trend toward carbon neutrality. We are therefore increasing the Fund’s weighting in manufacturers that we expect to benefit from increased domestic investments while monitoring the negative impact of cost pressures and the risks of a recession in the West.
Despite the risk of a recession in the West, we believe the Japanese stock market will remain relatively strong because we believe it is highly undervalued with significant room for Japanese companies to recover earnings. The impact of rising energy and commodity prices, another prior risk, will be a factor in improving earnings going forward, as we believe these prices have peaked. Domestic consumption should also recover as COVID-19 restrictions are eased, and expected improvements in the domestic economy should positively influence Japanese equities.
_______________
* Chartered Member of the Security Analysts Association of Japan
Opinions expressed are those of the Portfolio Managers as of the date written and are subject to change, are not guaranteed, and should not be considered investment advice or an indication of trading intent.
The Fund invests in small-capitalization and medium-capitalization companies, which may have more limited liquidity and greater price volatility than large-capitalization companies. The Fund invests in the stocks of companies operating in Japan; single-country funds may be subject to a higher degree of risk. The Fund may experience higher fees due to investments in pooled investment vehicles (including ETFs). Please see the Fund’s prospectus for a more complete discussion of these and other risks.
References to specific securities should not be considered a recommendation to buy or sell any security. Fund holdings and sector allocations are subject to change. Please refer to the Schedule of Investments included in this report for additional portfolio information.
| PERFORMANCE OVERVIEW/SCHEDULE OF INVESTMENTS |
Financial Statements
Schedule of Investments as of October 31, 2022 |
HENNESSY JAPAN SMALL CAP FUND
(% of Net Assets)
| TOP TEN HOLDINGS (EXCLUDING MONEY MARKET FUNDS) | % NET ASSETS |
| Ship Healthcare Holdings, Inc. | 2.32% |
| Musashi Seimitsu Industry Co., Ltd. | 2.26% |
| Nihon Kohden Corp. | 2.21% |
| SIIX Corp. | 2.17% |
| Yamaichi Electronics Industry Co., Ltd. | 2.09% |
| AEON Financial Service Co., Ltd. | 2.00% |
| Asia Pile Holdings Corp. | 1.99% |
| Musashino Bank, Ltd. | 1.99% |
| Penta-Ocean Construction Co., Ltd. | 1.99% |
| NGK Spark Plug Co., Ltd. | 1.97% |
Note: For presentation purposes, the Fund has grouped some of the industry categories. For purposes of categorizing securities for compliance with Section 8(b)(1) of the Investment Company Act of 1940, as amended, the Fund uses more specific industry classifications.
The Global Industry Classification Standard (GICS®) was developed by and is the exclusive property and a service mark of MSCI, Inc. and Standard & Poor’s Financial Services LLC. It has been licensed for use by the Hennessy Funds.
| HENNESSY FUNDS | 1-800-966-4354 | |
| COMMON STOCKS – 94.34% | | Number | | | | | | % of | |
| | | of Shares | | | Value | | | Net Assets | |
| Communication Services – 4.72% | | | | | | | | | |
| Imagica Group, Inc. | | | 144,100 | | | $ | 857,135 | | | | 1.09 | % |
| Kufu Co, Inc. (a) | | | 123,500 | | | | 429,524 | | | | 0.54 | % |
| Macromill, Inc. | | | 151,200 | | | | 1,126,984 | | | | 1.43 | % |
| ValueCommerce Co., Ltd. | | | 89,800 | | | | 1,309,987 | | | | 1.66 | % |
| | | | | | | | 3,723,630 | | | | 4.72 | % |
| | | | | | | | | | | | | |
| Consumer Discretionary – 13.37% | | | | | | | | | | | | |
| Aeon Fantasy Co., Ltd. | | | 59,300 | | | | 1,175,456 | | | | 1.49 | % |
| Benesse Holdings, Inc. | | | 95,700 | | | | 1,411,813 | | | | 1.79 | % |
| J Front Retailing Co., Ltd. | | | 50,100 | | | | 404,960 | | | | 0.51 | % |
| Matsuoka Corp. | | | 57,900 | | | | 355,638 | | | | 0.45 | % |
| Musashi Seimitsu Industry Co., Ltd. | | | 154,200 | | | | 1,779,657 | | | | 2.26 | % |
| NGK Spark Plug Co., Ltd. | | | 85,300 | | | | 1,556,218 | | | | 1.97 | % |
| Nojima Corp. | | | 146,200 | | | | 1,217,604 | | | | 1.54 | % |
| Sac’s Bar Holdings, Inc. | | | 287,400 | | | | 1,361,712 | | | | 1.73 | % |
| Saizeriya Co., Ltd. | | | 68,800 | | | | 1,283,607 | | | | 1.63 | % |
| | | | | | | | 10,546,665 | | | | 13.37 | % |
| | | | | | | | | | | | | |
| Consumer Staples – 3.20% | | | | | | | | | | | | |
| Nishimoto Co., Ltd. | | | 53,000 | | | | 1,483,826 | | | | 1.88 | % |
| Sugi Holdings Co., Ltd. | | | 26,000 | | | | 1,042,733 | | | | 1.32 | % |
| | | | | | | | 2,526,559 | | | | 3.20 | % |
| | | | | | | | | | | | | |
| Energy – 1.70% | | | | | | | | | | | | |
| Iwatani Corp. | | | 36,300 | | | | 1,336,618 | | | | 1.70 | % |
| | | | | | | | | | | | | |
| Financials – 5.95% | | | | | | | | | | | | |
| AEON Financial Service Co., Ltd. | | | 161,500 | | | | 1,580,538 | | | | 2.00 | % |
| Lifenet Insurance Co. (a) | | | 231,500 | | | | 1,543,708 | | | | 1.96 | % |
| Musashino Bank, Ltd. | | | 135,600 | | | | 1,565,908 | | | | 1.99 | % |
| | | | | | | | 4,690,154 | | | | 5.95 | % |
| | | | | | | | | | | | | |
| Health Care – 4.53% | | | | | | | | | | | | |
| Nihon Kohden Corp. | | | 77,700 | | | | 1,739,870 | | | | 2.21 | % |
| Ship Healthcare Holdings, Inc. | | | 95,500 | | | | 1,831,582 | | | | 2.32 | % |
| | | | | | | | 3,571,452 | | | | 4.53 | % |
| | | | | | | | | | | | | |
| Industrials – 32.46% | | | | | | | | | | | | |
| Amada Co., Ltd. | | | 173,200 | | | | 1,218,215 | | | | 1.54 | % |
| Benefit One, Inc. | | | 78,600 | | | | 1,087,362 | | | | 1.38 | % |
| Creek & River Co., Ltd. | | | 100,900 | | | | 1,385,391 | | | | 1.76 | % |
The accompanying notes are an integral part of these financial statements.
| COMMON STOCKS | | Number | | | | | | % of | |
| | | of Shares | | | Value | | | Net Assets | |
| Industrials (Continued) | | | | | | | | | |
| Daihen Corp. | | | 30,300 | | | $ | 781,340 | | | | 0.99 | % |
| Glory Ltd. | | | 57,400 | | | | 885,030 | | | | 1.12 | % |
| Hanwa Co., Ltd. | | | 56,400 | | | | 1,363,976 | | | | 1.73 | % |
| Hito Communications Holdings, Inc. | | | 30,900 | | | | 345,775 | | | | 0.44 | % |
| Kawada Technologies, Inc. | | | 32,200 | | | | 784,255 | | | | 0.99 | % |
| Mitsubishi Logisnext Co., Ltd. | | | 144,700 | | | | 745,724 | | | | 0.95 | % |
| Nichiha Corp. | | | 60,700 | | | | 1,149,446 | | | | 1.46 | % |
| Nippon Koei Co., Ltd. | | | 67,500 | | | | 1,510,110 | | | | 1.91 | % |
| Nissei ASB Machine Co., Ltd. | | | 50,300 | | | | 1,254,467 | | | | 1.59 | % |
| Nittoku Co., Ltd. | | | 71,400 | | | | 1,215,449 | | | | 1.54 | % |
| Penta-Ocean Construction Co., Ltd. | | | 316,200 | | | | 1,572,527 | | | | 1.99 | % |
| Sato Holdings Corp. | | | 110,800 | | | | 1,366,856 | | | | 1.73 | % |
| SBS Holdings, Inc. | | | 61,300 | | | | 1,193,564 | | | | 1.51 | % |
| Tadano Ltd. | | | 110,900 | | | | 677,897 | | | | 0.86 | % |
| Takasago Thermal Engineering Co., Ltd. | | | 64,500 | | | | 784,647 | | | | 0.99 | % |
| Tanseisha Co., Ltd. | | | 263,200 | | | | 1,418,600 | | | | 1.80 | % |
| Tocalo Co., Ltd. | | | 92,400 | | | | 738,240 | | | | 0.94 | % |
| TRE Holdings Corp. | | | 141,200 | | | | 1,522,892 | | | | 1.93 | % |
| Tsubakimoto Chain Co. | | | 71,000 | | | | 1,520,092 | | | | 1.93 | % |
| Tsukishima Kikai Co., Ltd. | | | 160,000 | | | | 1,084,682 | | | | 1.38 | % |
| | | | | | | | 25,606,537 | | | | 32.46 | % |
| | | | | | | | | | | | | |
| Information Technology – 17.61% | | | | | | | | | | | | |
| Anritsu Corp. | | | 79,900 | | | | 804,183 | | | | 1.02 | % |
| Digital Garage, Inc. | | | 27,600 | | | | 660,874 | | | | 0.84 | % |
| Elecom Co., Ltd. | | | 72,600 | | | | 672,555 | | | | 0.85 | % |
| Macnica Fuji Electronics Holdings, Inc. | | | 63,900 | | | | 1,278,069 | | | | 1.62 | % |
| Maxell Ltd. | | | 113,200 | | | | 939,101 | | | | 1.19 | % |
| Mimaki Engineering Co., Ltd. | | | 280,200 | | | | 1,384,079 | | | | 1.76 | % |
| Nippon Signal Company, Ltd. | | | 200,000 | | | | 1,355,638 | | | | 1.72 | % |
| SIIX Corp. | | | 222,000 | | | | 1,711,590 | | | | 2.17 | % |
| Towa Corp. | | | 99,400 | | | | 1,199,612 | | | | 1.52 | % |
| Transcosmos, Inc. | | | 59,400 | | | | 1,365,562 | | | | 1.73 | % |
| WingArc1st, Inc. | | | 54,200 | | | | 869,290 | | | | 1.10 | % |
| Yamaichi Electronics Co., Ltd. | | | 114,700 | | | | 1,647,212 | | | | 2.09 | % |
| | | | | | | | 13,887,765 | | | | 17.61 | % |
The accompanying notes are an integral part of these financial statements.
| HENNESSY FUNDS | 1-800-966-4354 | |
| COMMON STOCKS | | Number | | | | | | % of | |
| | | of Shares | | | Value | | | Net Assets | |
| Materials – 6.34% | | | | | | | | | |
| Asia Pile Holdings Corp. | | | 463,200 | | | $ | 1,571,185 | | | | 1.99 | % |
| Kyoei Steel Ltd. | | | 160,600 | | | | 1,418,085 | | | | 1.80 | % |
| Rengo Co., Ltd. | | | 144,800 | | | | 804,454 | | | | 1.02 | % |
| Tokyo Ohka Kogyo Co., Ltd. | | | 28,000 | | | | 1,207,128 | | | | 1.53 | % |
| | | | | | | | 5,000,852 | | | | 6.34 | % |
| | | | | | | | | | | | | |
| Real Estate – 3.48% | | | | | | | | | | | | |
| Star Mica Holdings Co., Ltd. | | | 147,900 | | | | 1,393,974 | | | | 1.77 | % |
| Tosei Corp. | | | 141,900 | | | | 1,353,304 | | | | 1.71 | % |
| | | | | | | | 2,747,278 | | | | 3.48 | % |
| | | | | | | | | | | | | |
| Utilities – 0.98% | | | | | | | | | | | | |
| EF-ON, Inc. | | | 179,900 | | | | 774,609 | | | | 0.98 | % |
| | | | | | | | | | | | | |
| Total Common Stocks | | | | | | | | | | | | |
| (Cost $85,755,753) | | | | | | | 74,412,119 | | | | 94.34 | % |
| | | | | | | | | | | | | |
| SHORT-TERM INVESTMENTS – 4.30% | | | | | | | | | | | | |
| | | | | | | | | | | | | |
| Money Market Funds – 4.30% | | | | | | | | | | | | |
| First American Government Obligations Fund, | | | | | | | | | | | | |
| Institutional Class, 2.93% (b) | | | 3,392,742 | | | | 3,392,742 | | | | 4.30 | % |
| | | | | | | | | | | | | |
| Total Short-Term Investments | | | | | | | | | | | | |
| (Cost $3,392,742) | | | | | | | 3,392,742 | | | | 4.30 | % |
| | | | | | | | | | | | | |
| Total Investments | | | | | | | | | | | | |
| (Cost $89,148,495) – 98.64% | | | | | | | 77,804,861 | | | | 98.64 | % |
| Other Assets in Excess of Liabilities – 1.36% | | | | | | | 1,075,258 | | | | 1.36 | % |
| | | | | | | | | | | | | |
TOTAL NET ASSETS – 100.00% | | | | | | $ | 78,880,119 | | | | 100.00 | % |
Percentages are stated as a percent of net assets.
| (a) | Non-income-producing security. |
| (b) | The rate listed is the fund’s seven-day yield as of October 31, 2022. |
The accompanying notes are an integral part of these financial statements.
Summary of Fair Value Exposure as of October 31, 2022
The following is a summary of the inputs used to value the Fund’s net assets as of October 31, 2022 (see Note 3 in the accompanying Notes to the Financial Statements):
| Common Stocks | | Level 1 | | | Level 2 | | | Level 3 | | | Total | |
| Communication Services | | $ | — | | | $ | 3,723,630 | | | $ | — | | | $ | 3,723,630 | |
| Consumer Discretionary | | | — | | | | 10,546,665 | | | | — | | | | 10,546,665 | |
| Consumer Staples | | | — | | | | 2,526,559 | | | | — | | | | 2,526,559 | |
| Energy | | | — | | | | 1,336,618 | | | | — | | | | 1,336,618 | |
| Financials | | | — | | | | 4,690,154 | | | | — | | | | 4,690,154 | |
| Health Care | | | — | | | | 3,571,452 | | | | — | | | | 3,571,452 | |
| Industrials | | | — | | | | 25,606,537 | | | | — | | | | 25,606,537 | |
| Information Technology | | | — | | | | 13,887,765 | | | | — | | | | 13,887,765 | |
| Materials | | | — | | | | 5,000,852 | | | | — | | | | 5,000,852 | |
| Real Estate | | | — | | | | 2,747,278 | | | | — | | | | 2,747,278 | |
| Utilities | | | — | | | | 774,609 | | | | — | | | | 774,609 | |
| Total Common Stocks | | $ | — | | | $ | 74,412,119 | | | $ | — | | | $ | 74,412,119 | |
| Short-Term Investments | | | | | | | | | | | | | | | | |
| Money Market Funds | | $ | 3,392,742 | | | $ | — | | | $ | — | | | $ | 3,392,742 | |
| Total Short-Term Investments | | $ | 3,392,742 | | | $ | — | | | $ | — | | | $ | 3,392,742 | |
| Total Investments | | $ | 3,392,742 | | | $ | 74,412,119 | | | $ | — | | | $ | 77,804,861 | |
The accompanying notes are an integral part of these financial statements.
| HENNESSY FUNDS | 1-800-966-4354 | |
Financial Statements
Statement of Assets and Liabilities as of October 31, 2022 |
| ASSETS: | | | |
| Investments in securities, at value (cost $89,148,495) | | $ | 77,804,861 | |
| Cash | | | 1,528 | |
| Dividends and interest receivable | | | 567,994 | |
| Receivable for fund shares sold | | | 81,860 | |
| Receivable for securities sold | | | 630,128 | |
| Dividend tax reclaim receivable | | | 112,873 | |
| Prepaid expenses and other assets | | | 23,834 | |
| Total assets | | | 79,223,078 | |
| | | | | |
| LIABILITIES: | | | | |
| Payable for securities purchased | | | 92,422 | |
| Payable for fund shares redeemed | | | 118,430 | |
| Payable to advisor | | | 54,289 | |
| Payable to administrator | | | 17,427 | |
| Payable to auditor | | | 22,749 | |
| Accrued distribution fees | | | 5,176 | |
| Accrued service fees | | | 2,683 | |
| Accrued trustees fees | | | 5,624 | |
| Accrued expenses and other payables | | | 24,159 | |
| Total liabilities | | | 342,959 | |
| NET ASSETS | | $ | 78,880,119 | |
| | | | | |
| NET ASSETS CONSISTS OF: | | | | |
| Capital stock | | $ | 91,504,922 | |
| Accumulated deficit | | | (12,624,803 | ) |
| Total net assets | | $ | 78,880,119 | |
| | | | | |
| NET ASSETS: | | | | |
| Investor Class | | | | |
| Shares authorized (no par value) | | Unlimited | |
| Net assets applicable to outstanding shares | | $ | 31,228,193 | |
| Shares issued and outstanding | | | 2,382,955 | |
| Net asset value, offering price, and redemption price per share | | $ | 13.10 | |
| | | | | |
| Institutional Class | | | | |
| Shares authorized (no par value) | | Unlimited | |
| Net assets applicable to outstanding shares | | $ | 47,651,926 | |
| Shares issued and outstanding | | | 3,675,009 | |
| Net asset value, offering price, and redemption price per share | | $ | 12.97 | |
The accompanying notes are an integral part of these financial statements.
| STATEMENT OF ASSETS AND LIABILITIES/STATEMENT OF OPERATIONS |
Financial Statements
Statement of Operations for the year ended October 31, 2022 |
| INVESTMENT INCOME: | | | |
Dividend income(1) | | $ | 2,106,060 | |
| Interest income | | | 46,333 | |
| Total investment income | | | 2,152,393 | |
| | | | | |
| EXPENSES: | | | | |
| Investment advisory fees (See Note 5) | | | 719,729 | |
| Sub-transfer agent expenses – Investor Class (See Note 5) | | | 89,542 | |
| Sub-transfer agent expenses – Institutional Class (See Note 5) | | | 50,328 | |
| Administration, accounting, custody, and transfer agent fees (See Note 5) | | | 112,336 | |
| Distribution fees – Investor Class (See Note 5) | | | 56,437 | |
| Service fees – Investor Class (See Note 5) | | | 37,624 | |
| Federal and state registration fees | | | 36,827 | |
| Compliance expense (See Note 5) | | | 24,516 | |
| Audit fees | | | 22,743 | |
| Trustees’ fees and expenses | | | 18,509 | |
| Reports to shareholders | | | 14,571 | |
| Interest expense (See Note 7) | | | 1,702 | |
| Legal fees | | | 1,530 | |
| Other expenses | | | 16,350 | |
| Total expenses | | | 1,202,744 | |
| NET INVESTMENT INCOME | | $ | 949,649 | |
| | | | | |
| REALIZED AND UNREALIZED GAINS (LOSSES): | | | | |
| Net realized loss on investments | | $ | (2,110,306 | ) |
| Net change in unrealized appreciation/depreciation on investments | | | (29,078,282 | ) |
| Net loss on investments | | | (31,188,588 | ) |
| NET DECREASE IN NET ASSETS RESULTING FROM OPERATIONS | | $ | (30,238,939 | ) |
(1) | Net of foreign taxes withheld of $234,991. |
The accompanying notes are an integral part of these financial statements.
| HENNESSY FUNDS | 1-800-966-4354 | |
(This Page Intentionally Left Blank.)
| STATEMENTS OF CHANGES IN NET ASSETS |
Financial Statements
| Statements of Changes in Net Assets |
| | | Year Ended | | | Year Ended | |
| | | October 31, 2022 | | | October 31, 2021 | |
| OPERATIONS: | | | | | | |
| Net investment income | | $ | 949,649 | | | $ | 392,688 | |
| Net realized gain (loss) on investments | | | (2,110,306 | ) | | | 1,288,362 | |
| Net change in unrealized | | | | | | | | |
| appreciation/depreciation on investments | | | (29,078,282 | ) | | | 10,917,876 | |
| Net increase (decrease) in net | | | | | | | | |
| assets resulting from operations | | | (30,238,939 | ) | | | 12,598,926 | |
| | | | | | | | | |
| DISTRIBUTIONS TO SHAREHOLDERS: | | | | | | | | |
| Distributable earnings – Investor Class | | | (186,236 | ) | | | (121,856 | ) |
| Distributable earnings – Institutional Class | | | (589,255 | ) | | | (260,753 | ) |
| Total distributions | | | (775,491 | ) | | | (382,609 | ) |
| | | | | | | | | |
| CAPITAL SHARE TRANSACTIONS: | | | | | | | | |
| Proceeds from shares subscribed – Investor Class | | | 6,437,217 | | | | 10,823,523 | |
| Proceeds from shares subscribed – Institutional Class | | | 38,467,373 | | | | 45,926,109 | |
| Dividends reinvested – Investor Class | | | 180,038 | | | | 116,988 | |
| Dividends reinvested – Institutional Class | | | 571,970 | | | | 246,865 | |
| Cost of shares redeemed – Investor Class | | | (8,822,706 | ) | | | (18,166,242 | ) |
| Cost of shares redeemed – Institutional Class | | | (39,666,483 | ) | | | (19,434,438 | ) |
| Net increase (decrease) in net assets | | | | | | | | |
| derived from capital share transactions | | | (2,832,591 | ) | | | 19,512,805 | |
| TOTAL INCREASE (DECREASE) IN NET ASSETS | | | (33,847,021 | ) | | | 31,729,122 | |
| | | | | | | | | |
| NET ASSETS: | | | | | | | | |
| Beginning of year | | | 112,727,140 | | | | 80,998,018 | |
| End of year | | $ | 78,880,119 | | | $ | 112,727,140 | |
| | | | | | | | | |
| CHANGES IN SHARES OUTSTANDING: | | | | | | | | |
| Shares sold – Investor Class | | | 424,356 | | | | 607,997 | |
| Shares sold – Institutional Class | | | 2,624,209 | | | | 2,575,700 | |
| Shares issued to holders as reinvestment | | | | | | | | |
| of dividends – Investor Class | | | 10,154 | | | | 6,496 | |
| Shares issued to holders as reinvestment | | | | | | | | |
| of dividends – Institutional Class | | | 33,206 | | | | 13,885 | |
| Shares redeemed – Investor Class | | | (598,751 | ) | | | (1,018,588 | ) |
| Shares redeemed – Institutional Class | | | (2,693,301 | ) | | | (1,098,633 | ) |
| Net increase (decrease) in shares outstanding | | | (200,127 | ) | | | 1,086,857 | |
The accompanying notes are an integral part of these financial statements.
| HENNESSY FUNDS | 1-800-966-4354 | |
Financial Statements
For an Investor Class share outstanding throughout each year
PER SHARE DATA:
Net asset value, beginning of year
Income from investment operations:
Net investment income
Net realized and unrealized gains (losses) on investments
Total from investment operations
Less distributions:
Dividends from net investment income
Dividends from net realized gains
Total distributions
Net asset value, end of year
TOTAL RETURN
SUPPLEMENTAL DATA AND RATIOS:
Net assets, end of year (millions)
Ratio of expenses to average net assets
Ratio of net investment income to average net assets
Portfolio turnover rate(3)
(1) | Calculated using the average shares outstanding method. |
(2) | Amount is between $(0.005) and $0.005. |
(3) | Calculated on the basis of the Fund as a whole. |
The accompanying notes are an integral part of these financial statements.
| FINANCIAL HIGHLIGHTS — INVESTOR CLASS |
| Year Ended October 31, | |
| 2022 | | | 2021 | | | 2020 | | | 2019 | | | 2018 | |
| | | | | | | | | | | | | | |
| $ | 18.12 | | | $ | 15.73 | | | $ | 15.43 | | | $ | 14.99 | | | $ | 14.92 | |
| | | | | | | | | | | | | | | | | | | |
| | | | | | | | | | | | | | | | | | | |
| | 0.12 | (1) | | | 0.03 | (1) | | | 0.01 | (1) | | | 0.03 | (1) | | | 0.05 | |
| | (5.07 | ) | | | 2.40 | | | | 0.50 | | | | 0.88 | | | | 0.35 | |
| | (4.95 | ) | | | 2.43 | | | | 0.51 | | | | 0.91 | | | | 0.40 | |
| | | | | | | | | | | | | | | | | | | |
| | | | | | | | | | | | | | | | | | | |
| | (0.00 | )(2) | | | (0.04 | ) | | | (0.21 | ) | | | — | | | | (0.05 | ) |
| | (0.07 | ) | | | — | | | | — | | | | (0.47 | ) | | | (0.28 | ) |
| | (0.07 | ) | | | (0.04 | ) | | | (0.21 | ) | | | (0.47 | ) | | | (0.33 | ) |
| $ | 13.10 | | | $ | 18.12 | | | $ | 15.73 | | | $ | 15.43 | | | $ | 14.99 | |
| | | | | | | | | | | | | | | | | | | |
| | -27.41 | % | | | 15.46 | % | | | 3.27 | % | | | 6.30 | % | | | 2.64 | % |
| | | | | | | | | | | | | | | | | | | |
| | | | | | | | | | | | | | | | | | | |
| $ | 31.23 | | | $ | 46.15 | | | $ | 46.41 | | | $ | 66.30 | | | $ | 100.93 | |
| | 1.57 | % | | | 1.53 | % | | | 1.55 | % | | | 1.52 | % | | | 1.46 | % |
| | 0.83 | % | | | 0.16 | % | | | 0.09 | % | | | 0.23 | % | | | 0.21 | % |
| | 45 | % | | | 24 | % | | | 17 | % | | | 21 | % | | | 35 | % |
The accompanying notes are an integral part of these financial statements.
| HENNESSY FUNDS | 1-800-966-4354 | |
Financial Statements
For an Institutional Class share outstanding throughout each year
PER SHARE DATA:
Net asset value, beginning of year
Income from investment operations:
Net investment income
Net realized and unrealized gains (losses) on investments
Total from investment operations
Less distributions:
Dividends from net investment income
Dividends from net realized gains
Total distributions
Net asset value, end of year
TOTAL RETURN
SUPPLEMENTAL DATA AND RATIOS:
Net assets, end of year (millions)
Ratio of expenses to average net assets
Ratio of net investment income to average net assets
Portfolio turnover rate(2)
(1) | Calculated using the average shares outstanding method. |
(2) | Calculated on the basis of the Fund as a whole. |
The accompanying notes are an integral part of these financial statements.
| FINANCIAL HIGHLIGHTS — INSTITUTIONAL CLASS |
| Year Ended October 31, | |
| 2022 | | | 2021 | | | 2020 | | | 2019 | | | 2018 | |
| | | | | | | | | | | | | | |
| $ | 17.94 | | | $ | 15.58 | | | $ | 15.28 | | | $ | 14.83 | | | $ | 14.72 | |
| | | | | | | | | | | | | | | | | | | |
| | | | | | | | | | | | | | | | | | | |
| | 0.18 | (1) | | | 0.11 | (1) | | | 0.07 | (1) | | | 0.09 | (1) | | | 0.11 | |
| | (4.99 | ) | | | 2.37 | | | | 0.50 | | | | 0.86 | | | | 0.36 | |
| | (4.81 | ) | | | 2.48 | | | | 0.57 | | | | 0.95 | | | | 0.47 | |
| | | | | | | | | | | | | | | | | | | |
| | | | | | | | | | | | | | | | | | | |
| | (0.09 | ) | | | (0.12 | ) | | | (0.27 | ) | | | (0.04 | ) | | | (0.08 | ) |
| | (0.07 | ) | | | — | | | | — | | | | (0.46 | ) | | | (0.28 | ) |
| | (0.16 | ) | | | (0.12 | ) | | | (0.27 | ) | | | (0.50 | ) | | | (0.36 | ) |
| $ | 12.97 | | | $ | 17.94 | | | $ | 15.58 | | | $ | 15.28 | | | $ | 14.83 | |
| | | | | | | | | | | | | | | | | | | |
| | -27.05 | % | | | 15.90 | % | | | 3.69 | % | | | 6.73 | % | | | 3.12 | % |
| | | | | | | | | | | | | | | | | | | |
| | | | | | | | | | | | | | | | | | | |
| $ | 47.65 | | | $ | 66.58 | | | $ | 34.58 | | | $ | 63.78 | | | $ | 98.42 | |
| | 1.17 | % | | | 1.13 | % | | | 1.13 | % | | | 1.12 | % | | | 1.04 | % |
| | 1.22 | % | | | 0.63 | % | | | 0.45 | % | | | 0.61 | % | | | 0.77 | % |
| | 45 | % | | | 24 | % | | | 17 | % | | | 21 | % | | | 35 | % |
The accompanying notes are an integral part of these financial statements.
| HENNESSY FUNDS | 1-800-966-4354 | |
Financial Statements
Notes to the Financial Statements October 31, 2022 |
1). ORGANIZATION
The Hennessy Japan Small Cap Fund (the “Fund”) is a series of Hennessy Funds Trust (the “Trust”), which was organized as a Delaware statutory trust on September 17, 1992. The Fund is an open-end management investment company registered under the Investment Company Act of 1940, as amended. The investment objective of the Fund is long-term capital appreciation. The Fund is a diversified fund.
The Fund offers Investor Class and Institutional Class shares. Each class of shares differs principally in its respective 12b-1 distribution and service, shareholder servicing, and sub-transfer agent expenses. There are no sales charges. Each class has identical rights to earnings, assets, and voting privileges, except for class-specific expenses and exclusive rights to vote on matters affecting only one class.
As an investment company, the Fund follows the investment company accounting and reporting guidance of the Financial Accounting Standards Board (“FASB”) Accounting Standard Codification Topic 946 “Financial Services—Investment Companies.”
2). SIGNIFICANT ACCOUNTING POLICIES
The following is a summary of significant accounting policies consistently followed by the Fund in the preparation of the financial statements. These policies conform to U.S. generally accepted accounting principles (“GAAP”).
| a). | Securities Valuation – All investments in securities are valued in accordance with the Fund’s valuation policies and procedures, as described in Note 3. |
| | |
| b). | Federal Income Taxes – The Fund has elected to be taxed as a regulated investment company and intends to distribute substantially all of its taxable income to its shareholders and otherwise comply with the provisions of the Internal Revenue Code of 1986, as amended, applicable to regulated investment companies. As a result, the Fund has made no provision for federal income taxes or excise taxes. Net investment income/loss and realized gains/losses for federal income tax purposes may differ from those reported in the financial statements because of temporary book-basis and tax-basis differences. Temporary differences are primarily the result of the treatment of wash sales for tax reporting purposes. The Fund recognizes interest and penalties related to income tax benefits, if any, in the Statement of Operations as an income tax expense. Distributions from net realized gains for book purposes may include short-term capital gains, which are included as ordinary income to shareholders for tax purposes. The Fund may utilize equalization accounting for tax purposes and designate earnings and profits, including net realized gains distributed to shareholders on redemption of shares, as part of the dividends paid deduction for income tax purposes. |
| | |
| | Due to inherent differences in the recognition of income, expenses, and realized gains/losses under GAAP and federal income tax regulations, permanent differences between book and tax basis for reporting are identified and appropriately reclassified in the Statement of Assets and Liabilities, as needed. As of October 31, 2022, no such reclassifications were required for fiscal year 2022. |
| | |
| c). | Accounting for Uncertainty in Income Taxes – The Fund has accounting policies regarding recognition and measurement of tax positions taken or expected to be taken on a tax return. The tax returns of the Fund for the prior three fiscal years are |
| NOTES TO THE FINANCIAL STATEMENTS |
| | open for examination. The Fund has reviewed all open tax years in major tax jurisdictions and concluded that there is no impact on the Fund’s net assets and no tax liability resulting from unrecognized tax benefits relating to uncertain income tax positions taken or expected to be taken on a tax return. The Fund’s major tax jurisdictions are U.S. federal and Delaware. |
| | |
| d). | Income and Expenses – Dividend income is recognized on the ex-dividend date or as soon as information is available to the Fund. Interest income, which includes the amortization of premium and accretion of discount, is recognized on an accrual basis. Market discounts, original issue discounts, and market premiums on debt securities are accreted or amortized to interest income over the life of a security with a corresponding increase or decrease, as applicable, in the cost basis of such security using the yield-to-maturity method or, where applicable, the first call date of the security. Other non-cash dividends are recognized as investment income at the fair value of the property received. The Fund is charged for those expenses that are directly attributable to its portfolio, such as advisory, administration, and certain shareholder service fees. Income, expenses (other than expenses attributable to a specific class), and realized and unrealized gains/losses on investments are allocated to each class of shares based on such class’s net assets. |
| | |
| e). | Distributions to Shareholders – Dividends from net investment income for the Fund, if any, are declared and paid annually, usually in December. Distributions of net realized capital gains, if any, are declared and paid annually, usually in December. |
| | |
| f). | Security Transactions – Investment and shareholder transactions are recorded on the trade date. The Fund determines the realized gain/loss from an investment transaction by comparing the original cost of the security lot sold with the net sale proceeds. Discounts and premiums on securities purchased are accreted or amortized, respectively, over the life of each such security. |
| | |
| g). | Use of Estimates – Preparing financial statements in accordance with GAAP requires management to make estimates and assumptions that affect the reported amounts of assets and liabilities and disclosure of contingent assets and liabilities at the date of the financial statements, as well as the reported change in net assets during the reporting period. Actual results could differ from those estimates. |
| | |
| h). | Share Valuation – The net asset value (“NAV”) per share of the Fund is calculated by dividing (i) the total value of the securities held by the Fund, plus cash and other assets, minus all liabilities (including estimated accrued expenses) by (ii) the total number of Fund shares outstanding, rounded to the nearest $0.01. Fund shares are not priced on days the New York Stock Exchange is closed for trading. The offering and redemption price per share for the Fund is equal to the Fund’s NAV per share. |
| | |
| i). | Foreign Currency – Values of investments denominated in foreign currencies are converted into U.S. dollars using the spot market exchange rate at the time of valuation. Purchases and sales of investments and income are translated into U.S. dollars using the spot market exchange rate prevailing on the respective dates of such transactions. The Fund does not isolate the portion of the results of operations resulting from fluctuations in foreign exchange rates on investments from fluctuations resulting from changes in the market prices of securities held. Such fluctuations are included with the net realized and unrealized gain/loss on investments. Foreign investments present additional risks due to currency fluctuations, economic and political factors, lower liquidity, government regulations, differences in accounting standards, and other factors. |
| | |
| j.) | REIT Equity Securities – Distributions received from real estate investment trusts (“REITs”) may be classified as dividends, capital gains, or return of capital. Investments in REITs may require the Fund to accrue and distribute income not yet |
| HENNESSY FUNDS | 1-800-966-4354 | |
| | received. To generate sufficient cash to make any required distributions, the Fund may be required to sell securities in its portfolio (including when it is not advantageous to do so) that it otherwise would have continued to hold. At other times, investments in a REIT may result in the Fund’s receipt of cash in excess of the REIT’s earnings. If the Fund distributes these amounts, these distributions could constitute a return of capital to Fund shareholders for U.S. federal income tax purposes. Dividends received by the Fund from a REIT generally do not constitute qualified dividend income and do not qualify for the dividends-received deduction. |
| | |
| k). | Illiquid Securities – Pursuant to Rule 22e-4 under the 1940 Act, the Fund has adopted a Liquidity Risk Management Program (the “Liquidity Program”). The Liquidity Program requires, among other things, that the Fund limit its illiquid investments to no more than 15% of its net assets. An illiquid investment is any investment that the Fund reasonably expects cannot be sold or disposed of by the Fund in current market conditions in seven calendar days or less without the sale or disposition significantly changing the market value of the investment. |
| | |
| l). | Recent Accounting Pronouncements and Regulatory Updates – In October 2020, the Securities and Exchange Commission (“SEC”) adopted new regulations governing the use of derivatives by registered investment companies (“Rule 18f-4”). Rule 18f-4 imposes limits on the amount of derivatives a fund can enter into, eliminates the asset segregation framework currently used by funds to comply with Section 18 of the 1940 Act, and requires funds whose use of derivatives is greater than a limited specified amount to establish and maintain a comprehensive derivatives risk management program and appoint a derivatives risk manager. The Fund has adopted procedures in accordance with Rule 18f-4. |
| | |
| | In December 2020, the SEC adopted a new rule providing a framework for fund valuation practices (“Rule 2a-5”). Rule 2a-5 establishes requirements for determining fair value in good faith for purposes of the 1940 Act. Rule 2a-5 permits fund boards to designate certain parties to perform fair value determinations, subject to board oversight and certain other conditions. Rule 2a-5 also defines when market quotations are “readily available” for purposes of the 1940 Act and the threshold for determining whether a fund must fair value a security. In connection with Rule 2a-5, the SEC also adopted related recordkeeping requirements and is rescinding previously issued guidance, including with respect to the role of a board in determining fair value and the accounting and auditing of fund investments. The Fund has adopted procedures in accordance with Rule 2a-5. |
3). SECURITIES VALUATION
The Fund follows its valuation policies and procedures in determining its NAV and, in preparing these financial statements, the fair value accounting standards that establish an authoritative definition of fair value and set out a hierarchy for measuring fair value. These standards require additional disclosures about the various inputs and valuation techniques used to develop the measurements of fair value and a discussion of changes in valuation techniques and related inputs during the period. These inputs are summarized in the three broad levels listed below:
| | Level 1 – | Unadjusted, quoted prices in active markets for identical instruments that the Fund has the ability to access at the date of measurement. |
| | | |
| | Level 2 – | Other significant observable inputs (including, but not limited to, quoted prices in active markets for similar instruments, quoted prices in markets that are not active for identical or similar instruments, and model-derived |
| NOTES TO THE FINANCIAL STATEMENTS |
| | | valuations in which all significant inputs and significant value drivers are observable in active markets, such as interest rates, prepayment speeds, credit risk curves, default rates, and similar data). |
| | | |
| | Level 3 – | Significant unobservable inputs (including the Fund’s own assumptions about what market participants would use to price the asset or liability based on the best available information) when observable inputs are unavailable. |
The following is a description of the valuation techniques applied to the Fund’s major categories of assets and liabilities on a recurring basis:
| | Equity Securities – Equity securities, including common stocks, preferred stocks, foreign-issued common stocks, exchange-traded funds, closed-end mutual funds, partnerships, rights, and real estate investment trusts, that are traded on a securities exchange for which a last-quoted sales price is readily available generally are valued at the last sales price as reported by the primary exchange on which the securities are listed. Securities listed on The Nasdaq Stock Market (“Nasdaq”) generally are valued at the Nasdaq Official Closing Price, which may differ from the last sales price reported. Securities traded on a securities exchange for which a last-quoted sales price is not readily available generally are valued at the mean between the bid and ask prices. To the extent these securities are actively traded and valuation adjustments are not applied, they are classified in Level 1 of the fair value hierarchy. Securities traded on foreign exchanges generally are not valued at the same time the Fund calculates its NAV because most foreign markets close well before such time. The earlier close of most foreign markets gives rise to the possibility that significant events, including broad market moves, may have occurred in the interim. In certain circumstances, it may be determined that a foreign security needs to be fair valued because it appears that the value of the security might have been materially affected by events occurring after the close of the market in which the security is principally traded, but before the time the Fund calculates its NAV, such as by a development that affects an entire market or region (e.g., a weather-related event) or a potentially global development (e.g., a terrorist attack that may be expected to have an effect on investor expectations worldwide). |
| | |
| | Registered Investment Companies – Investments in open-end registered investment companies, commonly referred to as mutual funds, generally are priced at the ending NAV provided by the applicable mutual fund’s service agent and are classified in Level 1 of the fair value hierarchy. |
| | |
| | Debt Securities – Debt securities, including corporate bonds, asset-backed securities, mortgage-backed securities, municipal bonds, U.S. Treasuries, and U.S. government agency issues, are generally valued at market on the basis of valuations furnished by an independent pricing service that utilizes both dealer-supplied valuations and formula-based techniques. The pricing service may consider recently executed transactions in securities of the issuer or comparable issuers, market price quotations (where observable), bond spreads, and fundamental data relating to the issuer. In addition, the model may incorporate observable market data, such as reported sales of similar securities, broker quotes, yields, bids, offers, and reference data. Certain securities are valued primarily using dealer quotations. These securities are generally classified in Level 2 of the fair value hierarchy. |
| | |
| | Short-Term Securities – Short-term equity investments, including money market funds, are valued in the manner specified above for equity securities. Short-term debt investments with an original term to maturity of 60 days or less are valued at amortized cost, which approximates fair market value. If the original term to maturity of a short-term debt investment exceeds 60 days, then the values as of the 61st day prior to maturity are amortized. Amortized cost is not used if its use would |
| HENNESSY FUNDS | 1-800-966-4354 | |
| | be inappropriate due to credit or other impairments of the issuer, in which case the security’s fair value would be determined as described below. Short-term securities are generally classified in Level 1 or Level 2 of the fair value hierarchy depending on the inputs used and market activity levels for specific securities. |
The Board of Trustees of the Fund (the “Board”) has adopted fair value pricing procedures that are followed when a price for a security is not readily available or if a significant event has occurred that indicates the closing price of a security no longer represents the true value of that security. Fair value pricing determinations are made in good faith in accordance with these procedures. There are numerous criteria considered in determining a fair value of a security, such as the trading volume of a security and markets, the values of other similar securities, and news events with direct bearing on a security or markets. Fair value pricing results in an estimated price for a security that reflects the amount the Fund might reasonably expect to receive in a current sale. Depending on the relative significance of the valuation inputs, these securities may be classified in either Level 2 or Level 3 of the fair value hierarchy.
The fair value of foreign securities may be determined with the assistance of a pricing service using correlations between the movement of prices of such securities and indices of domestic securities and other appropriate indicators, such as closing market prices of relevant American Depositary Receipts or futures contracts. Using fair value pricing means that the Fund’s NAV reflects the affected portfolio securities’ values as determined by the Board or its designee, pursuant to the fair value pricing procedures adopted by the Board, instead of being determined by the market. Using a fair value pricing methodology to price a foreign security may result in a value that is different from such foreign security’s most recent closing price and from the value used by other investment companies to calculate their NAVs. Such securities are generally classified in Level 2 of the fair value hierarchy. Because the Fund invests in foreign securities, the value of the Fund’s portfolio securities may change on days when a shareholder is unable to purchase or redeem Fund shares.
The Board has delegated day-to-day valuation matters to the Valuation and Liquidity Committee comprising representatives from Hennessy Advisors, Inc., the Fund’s investment advisor (the “Advisor”). The function of the Valuation and Liquidity Committee, among other things, is to value securities where current and reliable market quotations are not readily available. All actions taken by the Valuation and Liquidity Committee are reviewed by the Board.
The Fund has performed an analysis of all existing investments to determine the significance and character of all inputs to their fair value determinations. Various inputs are used to determine the value of the Fund’s investments. The inputs or methodology used for valuing securities are not necessarily an indication of the risk associated with investing in those securities. Details related to the fair value hierarchy of the Fund’s securities as of October 31, 2022, are included in the Schedule of Investments.
4). INVESTMENT TRANSACTIONS
Purchases and sales of investment securities (excluding government and short-term investments) for the Fund during fiscal year 2022 were $38,165,059 and $38,140,545, respectively.
There were no purchases or sales/maturities of long-term U.S. government securities for the Fund during fiscal year 2022.
| NOTES TO THE FINANCIAL STATEMENTS |
5). INVESTMENT ADVISORY FEE AND OTHER TRANSACTIONS WITH AFFILIATES
The Advisor provides the Fund with investment advisory services under an Investment Advisory Agreement. The Advisor oversees the provision of investment advice and furnishes office space, facilities, and most of the personnel needed by the Fund. As compensation for its services, the Advisor is entitled to a monthly fee from the Fund. The fee is based on the average daily net assets of the Fund at an annual rate of 0.80%. The net investment advisory fees expensed by the Fund during fiscal year 2022 are included in the Statement of Operations.
The Advisor has delegated the day-to-day management of the Fund to a sub-advisor, SPARX Asset Management Co., Ltd. The Advisor pays the sub-advisory fees from its own assets, and these fees are not an additional expense of the Fund. During fiscal year 2022, the Advisor (not the Fund) paid a sub-advisory fee at the average rate of 0.35% of the daily net assets of the Fund. Pursuant to the sub-advisory agreement, the Advisor pays sub-advisory fees at the rate of 0.35% of the first $500 million of daily net assets, 0.40% of daily net assets between $500 million and $1 billion, and 0.42% of daily net assets over $1 billion.
The Board has approved a Shareholder Servicing Agreement for Investor Class shares of the Fund, which compensates the Advisor for the non-investment advisory services it provides to the Fund. The Shareholder Servicing Agreement provides for a monthly fee paid to the Advisor at an annual rate of 0.10% of the average daily net assets of the Fund attributable to Investor Class shares. The shareholder service fees expensed by the Fund during fiscal year 2022 are included in the Statement of Operations.
The Fund has adopted a plan pursuant to Rule 12b-1 under the Investment Company Act of 1940, as amended, that authorizes payments in connection with the distribution of Fund shares at an annual rate of up to 0.25% of the Fund’s average daily net assets attributable to Investor Class shares. Even though the authorized rate is up to 0.25%, the Fund is currently only using up to 0.15% of its average daily net assets attributable to Investor Class shares for such purpose. Amounts paid under the plan may be spent on any activities or expenses primarily intended to result in the sale of shares, including, but not limited to, advertising, shareholder account servicing, printing and mailing of prospectuses to other than current shareholders, printing and mailing of sales literature, and compensation for sales and marketing activities or to financial institutions and others, such as dealers and distributors. The distribution fees expensed by the Fund during fiscal year 2022 are included in the Statement of Operations.
The Fund has entered into agreements with various brokers, dealers, and financial intermediaries in connection with the sale of Fund shares. The agreements provide for periodic payments of sub-transfer agent expenses by the Fund to the brokers, dealers, and financial intermediaries for providing certain shareholder maintenance services. These shareholder services include the pre-processing and quality control of new accounts, shareholder correspondence, answering customer inquiries regarding account status, and facilitating shareholder telephone transactions. The sub-transfer agent fees expensed by the Fund during fiscal year 2022 are included in the Statement of Operations.
U.S. Bancorp Fund Services, LLC, d/b/a U.S. Bank Global Fund Services (“Fund Services”) provides the Fund with administrative, accounting, and transfer agent services. As administrator, Fund Services is responsible for activities such as (i) preparing various federal and state regulatory filings, reports, and returns for the Fund, (ii) preparing reports and materials to be supplied to the Board, (iii) monitoring the activities of the Fund’s custodian, transfer agent, and accountants, and (iv) coordinating the preparation and payment of the Fund’s expenses and reviewing the Fund’s expense accruals. U.S. Bank N.A., an affiliate of Fund Services, serves as the Fund’s custodian. The servicing agreements between the Trust, Fund Services, and U.S. Bank N.A. contain a fee schedule that is inclusive of administrative, accounting, custody, and transfer agent fees. The
| HENNESSY FUNDS | 1-800-966-4354 | |
administrative, accounting, custody, and transfer agent fees expensed by the Fund during fiscal year 2022 are included in the Statement of Operations.
Quasar Distributors, LLC, a wholly owned broker-dealer subsidiary of Foreside Financial Group, LLC, acts as the Fund’s principal underwriter in a continuous public offering of Fund shares.
The officers of the Fund are affiliated with the Advisor. With the exception of the Chief Compliance Officer and, for a portion of the fiscal year, the Senior Compliance Officer, such officers receive no compensation from the Fund for serving in their respective roles. The Fund, along with the other funds in the Hennessy Funds family (collectively, the “Hennessy Funds”), makes reimbursement payments on an equal basis to the Advisor for a portion of the salary and benefits associated with the office of the Chief Compliance Officer and, for a portion of the fiscal year, for all of the salary and benefits associated with the office of the Senior Compliance Officer. The compliance fees expensed by the Fund during fiscal year 2022 for reimbursement payments to the Advisor are included in the Statement of Operations.
6). GUARANTEES AND INDEMNIFICATIONS
Under the Hennessy Funds’ organizational documents, their officers and trustees are indemnified by the Hennessy Funds against certain liabilities arising out of the performance of their duties to the Hennessy Funds. Additionally, in the normal course of business, the Hennessy Funds enter into contracts with service providers that contain general indemnification clauses. The Fund’s maximum exposure under these arrangements is unknown as this would involve future claims that may be made against the Fund that have not yet occurred. Currently, the Fund expects the risk of loss to be remote.
7). LINE OF CREDIT
The Fund has an uncommitted line of credit with the other Hennessy Funds in the amount of the lesser of (i) $100,000,000 or (ii) 33.33% of each Hennessy Fund’s net assets, or 30% for the Fund, the Hennessy Gas Utility Fund, and the Hennessy Japan Fund and 10% for the Hennessy Balanced Fund. The line of credit is intended to provide any necessary short-term financing in connection with shareholder redemptions, subject to certain restrictions. The credit facility is with the Hennessy Funds’ custodian bank, U.S. Bank N.A. Borrowings under this arrangement bear interest at the bank’s prime rate and are secured by all of the Fund’s assets (as to its own borrowings only). During fiscal year 2022, the Fund had an outstanding average daily balance and a weighted average interest rate of $47,970 and 3.50%, respectively. The interest expensed by the Fund during fiscal year 2022 is included in the Statement of Operations. The maximum amount outstanding for the Fund during fiscal year 2022 was $3,666,000. As of October 31, 2022, the Fund did not have any borrowings outstanding under the line of credit.
8). FEDERAL TAX INFORMATION
As of October 31, 2022, the components of accumulated earnings (losses) for income tax purposes were as follows:
| | | Investments | |
| Cost of investments for tax purposes | | $ | 89,768,318 | |
| Gross tax unrealized appreciation | | $ | 5,052,323 | |
| Gross tax unrealized depreciation | | | (17,054,423 | ) |
| Net tax unrealized appreciation/(depreciation) | | $ | (12,002,100 | ) |
| Undistributed ordinary income | | $ | 812,870 | |
| Undistributed long-term capital gains | | | — | |
| Total distributable earnings | | $ | 812,870 | |
| Other accumulated gain/(loss) | | $ | (1,435,573 | ) |
| Total accumulated gain/(loss) | | $ | (12,624,803 | ) |
| NOTES TO THE FINANCIAL STATEMENTS |
The difference between book-basis unrealized appreciation/depreciation and tax-basis unrealized appreciation/depreciation (as shown above) is attributable primarily to wash sales and investments in passive foreign investment companies.
As of October 31, 2022, the Fund had $1,435,573 in unlimited short-term capital loss carryforwards.
Capital losses sustained in or after fiscal year 2012 can be carried forward indefinitely, but any such loss retains the character of the original loss and must be utilized prior to any loss incurred before fiscal year 2012. As a result of this ordering rule, capital loss carryforwards incurred prior to fiscal year 2012 may be more likely to expire unused. Capital losses sustained prior to fiscal year 2012 can be carried forward for eight years and can be carried forward as short-term capital losses regardless of the character of the original loss.
As of October 31, 2022, the Fund did not defer, on a tax basis, any late-year ordinary losses. Late-year ordinary losses are net ordinary losses incurred after December 31, 2021, but within the taxable year, that are deemed to arise on the first day of the Fund’s next taxable year.
During fiscal years 2022 and 2021, the tax character of distributions paid by the Fund was as follows:
| | | Year Ended | | | Year Ended | |
| | | October 31, 2022 | | | October 31, 2021 | |
Ordinary income(1) | | $ | 327,698 | | | $ | 382,609 | |
| Long-term capital gains | | | 447,793 | | | | — | |
| Total distributions | | $ | 775,491 | | | $ | 382,609 | |
(1) Ordinary income includes short-term capital gains.
9). MARKET DISRUPTION AND GEOPOLITICAL RISKS
Certain local, regional, or global events such as wars, terrorism, pandemics or other public health mattes, and other geopolitical events could have a significant impact on securities markets generally or individual securities or instruments. For example, following Russia’s invasion of Ukraine, the President of the United States signed an Executive Order in February 2022 prohibiting U.S. persons from entering transactions with the Central Bank of Russia. Similarly, in June 2021, the President of the United States signed an Executive Order affirming and expanding the U.S. policy prohibiting U.S. persons from purchasing or investing in publicly-traded securities of companies identified by the U.S. Government as “Chinese Military-Industrial Complex Companies.” The list of such companies can change from time to time and the Advisor may be forced to hold securities it desires to sell or to sell securities it desires to buy, or the Advisor may not be able to participate in an investment it otherwise believes is attractive. The occurrence and duration of these types of events are hard to predict and could adversely affect the Fund’s performance.
10). EVENTS SUBSEQUENT TO YEAR END
Management has evaluated the Fund’s related events and transactions that occurred subsequent to October 31, 2022, through the date of issuance of the Fund’s financial statements. Management has determined that there were no subsequent events requiring recognition or disclosure in the financial statements.
| HENNESSY FUNDS | 1-800-966-4354 | |
Report of Independent Registered Public
Accounting Firm
To the Board of Trustees of Hennessy Funds Trust
and the shareholders of the Hennessy Japan Small Cap Fund
Novato, CA
Opinion on the Financial Statements
We have audited the accompanying statement of assets and liabilities of the Hennessy Japan Small Cap Fund (the “Fund”), a series of Hennessy Funds Trust, including the schedule of investments, as of October 31, 2022, the related statement of operations for the year then ended, the statements of changes in net assets for each of the two years in the period then ended, the financial highlights for each of the five years in the period then ended, and the related notes (collectively referred to as the “financial statements”). In our opinion, the financial statements present fairly, in all material respects, the financial position of the Fund as of October 31, 2022, the results of its operations for the year then ended, the changes in its net assets for each of the two years in the period then ended, and the financial highlights for each of the five years in the period then ended in conformity with accounting principles generally accepted in the United States of America.
Basis for Opinion
These financial statements are the responsibility of the Fund’s management. Our responsibility is to express an opinion on the Fund’s financial statements based on our audits. We are a public accounting firm registered with the Public Company Accounting Oversight Board (United States) (“PCAOB”) and are required to be independent with respect to the Fund in accordance with the U.S. federal securities laws and the applicable rules and regulations of the Securities and Exchange Commission and the PCAOB. We have served as the auditor of one or more of the funds in the Trust since 2002.
We conducted our audits in accordance with the standards of the PCAOB. Those standards require that we plan and perform the audit to obtain reasonable assurance about whether the financial statements are free of material misstatement, whether due to error or fraud. The Fund is not required to have, nor were we engaged to perform, an audit of its internal control over financial reporting. As part of our audits we are required to obtain an understanding of internal control over financial reporting, but not for the purpose of expressing an opinion on the effectiveness of the Fund’s internal control over financial reporting. Accordingly, we express no such opinion.
Our audits included performing procedures to assess the risks of material misstatement of the financial statements, whether due to error or fraud, and performing procedures that respond to those risks. Such procedures included examining, on a test basis, evidence regarding the amounts and disclosures in the financial statements. Our audits also included evaluating the accounting principles used and significant estimates made by management, as well as evaluating the overall presentation of the financial statements. Our procedures included confirmation of securities owned as of October 31, 2022 by correspondence with the custodian and brokers; when replies were not received from brokers, we performed other auditing procedures. We believe that our audits provide a reasonable basis for our opinion.
| | |
| | TAIT, WELLER & BAKER LLP |
Philadelphia, Pennsylvania
December 22, 2022
| REPORT OF INDEPENDENT REGISTERED PUBLIC ACCOUNTING FIRM/TRUSTEES AND OFFICERS |
Trustees and Officers of the Fund (Unaudited)
The business and affairs of the Funds are managed under the direction of the Board of Trustees of the Trust, and the Board of Trustees elects the officers of the Trust. From time to time, the Board of Trustees also has appointed advisers to the Board of Trustees (“Advisers”) with the intention of having qualified individuals serve in an advisory capacity to garner experience in the mutual fund and asset management industry and be considered as potential Trustees in the future. There are currently two Advisers, Brian Alexander and Doug Franklin. As Advisers, Mr. Alexander and Mr. Franklin attend meetings of the Board of Trustees and act as non-voting participants. Information pertaining to the Trustees, Advisers, and the officers of the Trust is set forth below. The Trustees and officers serve until their successors are duly elected and qualified or until their earlier death, resignation, or removal. Each Trustee oversees all 16 Hennessy Funds. Unless otherwise indicated, the address of all persons listed below is 7250 Redwood Boulevard, Suite 200, Novato, CA 94945. The Fund’s Statement of Additional Information includes more information about the persons listed below and is available without charge by calling 1-800-966-4354 or by visiting www.hennessyfunds.com.
| | | | Other |
| | | | Directorships |
| | | | Held Outside |
| Name, Age, | | | of Fund |
| and Position Held | Start Date | Principal Occupation(s) | Complex During |
with the Trust | of Service | During Past Five Years | Past Five Years |
| Disinterested Trustees and Advisers | | | |
| | | | |
| J. Dennis DeSousa | January 1996 | Mr. DeSousa is a real estate investor. | None. |
| 86 | | | |
| Trustee | | | |
| | | | |
| Robert T. Doyle | January 1996 | Mr. Doyle is retired. He served as the | None. |
| 75 | | Sheriff of Marin County, California | |
| Trustee | | from 1996 – June 2022. | |
| | | | |
| Claire Garvie | December 2015 | Ms. Garvie is a founder of Kiosk and | None. |
| 48 | as an Adviser | has served as its Chief Operating | |
| Trustee | to the Board | Officer since 2004. Kiosk is a full- | |
| | and | service marketing agency with | |
| | December 2021 | offices in the San Francisco Bay Area | |
| | as a Trustee | and Liverpool, UK and staff across | |
| | | nine states in the U.S. | |
| | | | |
| Gerald P. Richardson | May 2004 | Mr. Richardson is an independent | None. |
| 77 | | consultant in the securities industry. | |
| Trustee | | | |
| HENNESSY FUNDS | 1-800-966-4354 | |
| | | | Other |
| | | | Directorships |
| | | | Held Outside |
| Name, Age, | | | of Fund |
| and Position Held | Start Date | Principal Occupation(s) | Complex During |
with the Trust | of Service | During Past Five Years | Past Five Years |
| Brian Alexander | March 2015 | Mr. Alexander has worked for the | None. |
| 41 | | Sutter Health organization since | |
| Adviser to the Board | | 2011 in various positions. He has | |
| | | served as the Chief Executive Officer | |
| | | of the North Valley Hospital Area | |
| | | since 2021. From 2018 to 2021, he | |
| | | served as the Chief Executive Officer | |
| | | of Sutter Roseville Medical Center. | |
| | | From 2016 through 2018, he served | |
| | | as the Vice President of Strategy for | |
| | | the Sutter Health Valley Area, which | |
| | | includes 11 hospitals, 13 ambulatory | |
| | | surgery centers, 16,000 employees, | |
| | | and 1,900 physicians. | |
| | | | |
| Doug Franklin | March 2016 | Mr. Franklin is a retired insurance | None. |
| 58 | | industry executive. From 1987 | |
| Adviser to the Board | | through 2015, he was employed by | |
| | | the Allianz-Fireman’s Fund Insurance | |
| | | Company in various positions, | |
| | | including as its Chief Actuary and | |
| | | Chief Risk Officer. | |
| | | | |
Interested Trustee(1) | | | |
| | | | |
| Neil J. Hennessy | January 1996 as | Mr. Hennessy has been employed | Hennessy |
| 66 | a Trustee and | by Hennessy Advisors, Inc. since | Advisors, Inc. |
| Chairman of the Board, | June 2008 as | 1989 and currently serves as its | |
| Chief Market Strategist, | an officer | Chairman and Chief Executive Officer. | |
| Portfolio Manager, | | | |
| and President | | | |
| | | | |
| Name, Age, | | | |
| and Position Held | Start Date | Principal Occupation(s) | |
with the Trust | of Service | During Past Five Years | |
| Officers | | | |
| | | | |
| Teresa M. Nilsen | January 1996 | Ms. Nilsen has been employed by Hennessy Advisors, Inc. | |
| 56 | | since 1989 and currently serves as its President, Chief | |
| Executive Vice President | | Operating Officer, and Secretary. | |
| and Treasurer | | | |
| | | | |
| Daniel B. Steadman | March 2000 | Mr. Steadman has been employed by Hennessy Advisors, Inc. | |
| 66 | | since 2000 and currently serves as its Executive Vice President. | |
| Executive Vice President’ | | | |
| and Secretary | | | |
| | | | |
| Brian Carlson | December 2013 | Mr. Carlson has been employed by Hennessy Advisors, Inc. | |
| 50 | | since December 2013 and currently serves as its Chief | |
| Senior Vice President | | Compliance Officer and Senior Vice President. | |
| and Head of Distribution | | | |
| TRUSTEES AND OFFICERS OF THE FUND |
| Name, Age, | | |
| and Position Held | Start Date | Principal Occupation(s) |
with the Trust | of Service | During Past Five Years |
Jennifer Cheskiewicz(2) | June 2013 | Ms. Cheskiewicz has been employed by Hennessy Advisors, Inc. |
| 45 | | as its General Counsel since June 2013. |
| Senior Vice President and | | |
| Chief Compliance Officer | | |
| | | |
David Ellison(3) | October 2012 | Mr. Ellison has been employed by Hennessy Advisors, Inc. since |
| 64 | | October 2012. He has served as a Portfolio Manager of the |
| Senior Vice President | | Hennessy Large Cap Financial Fund and the Hennessy Small |
| and Portfolio Manager | | Cap Financial Fund since their inception. Mr. Ellison also served |
| | | as a Portfolio Manager of the Hennessy Technology Fund from |
| | | its inception until February 2017. Mr. Ellison served as Director, |
| | | CIO, and President of FBR Fund Advisers, Inc. from December |
| | | 1999 to October 2012. |
| | | |
Ryan Kelley(4) | March 2013 | Mr. Kelley has been employed by Hennessy Advisors, Inc. since |
| 50 | | October 2012. He has served as Chief Investment Officer of the |
| Chief Investment Officer, | | Hennessy Funds since March 2021 and has served as a Portfolio |
| Senior Vice President, | | Manager of the Hennessy Gas Utility Fund, the Hennessy Large |
| and Portfolio Manager | | Cap Financial Fund, and the Hennessy Small Cap Financial Fund |
| | | since October 2014. Mr. Kelley served as Co-Portfolio Manager |
| | | of these same funds from March 2013 through September |
| | | 2014 and as a Portfolio Analyst for the Hennessy Funds from |
| | | October 2012 through February 2013. He has also served as a |
| | | Portfolio Manager of the Hennessy Cornerstone Growth Fund, |
| | | the Hennessy Cornerstone Mid Cap 30 Fund, the Hennessy |
| | | Cornerstone Large Growth Fund, and the Hennessy |
| | | Cornerstone Value Fund since February 2017 and as a Portfolio |
| | | Manager of the Hennessy Total Return Fund, the Hennessy |
| | | Balanced Fund, and the Hennessy Technology Fund since May |
| | | 2018. He served as Co-Portfolio Manager of the Hennessy |
| | | Technology Fund from February 2017 until May 2018. Mr. Kelley |
| | | served as Portfolio Manager of FBR Fund Advisers, Inc. from |
| | | January 2008 to October 2012. |
| | | |
L. Joshua Wein(4) | September 2018 | Mr. Wein has been employed by Hennessy Advisors, Inc. since |
| 49 | | 2018. He has served as Co-Portfolio Manager of the Hennessy |
| Vice President and | | Cornerstone Growth Fund, the Hennessy Cornerstone |
| Co-Portfolio Manager | | Mid Cap 30 Fund, the Hennessy Cornerstone Large Growth |
| | | Fund, the Hennessy Cornerstone Value Fund, Hennessy Total |
| | | Return Fund, the Hennessy Balanced Fund, the Hennessy Gas |
| | | Utility Fund, and the Hennessy Technology Fund since February |
| | | 2019. He served as a Senior Analyst of these same funds from |
| | | September 2018 through February 2019. Mr. Wein served as |
| | | Director of Alternative Investments and Co-Portfolio Manager |
| | | at Sterling Capital Management from 2008 to 2018. |
_______________
(1) | Mr. Hennessy is considered an “interested person,” as defined in the Investment Company Act of 1940, as amended, because he is an officer of the Trust. |
(2) | The address of this officer is 4800 Bee Caves Road, Suite 100, Austin, TX 78746. |
(3) | The address of this officer is 101 Federal Street, Suite 1615B, Boston, MA 02110. |
(4) | The address of this officer is 1340 Environ Way, Chapel Hill, NC 27517. |
| HENNESSY FUNDS | 1-800-966-4354 | |
Expense Example (Unaudited)
October 31, 2022
As a shareholder of the Fund, you incur ongoing costs, including management fees, service fees, and other Fund expenses. This Example is intended to help you understand your ongoing costs (in dollars) of investing in the Fund and to compare these costs with the ongoing costs of investing in other mutual funds. The Example is based on an investment of $1,000 invested at the beginning of the period and held for the entire period from May 1, 2022, through October 31, 2022.
Actual Expenses
In the table below, the first line under each of the “Investor Class” and “Institutional Class” headings provides information about actual account values and actual expenses for each share class. You may use this information, together with the amount you invested, to estimate the expenses that you paid over the period. Simply divide your account value by $1,000 (for example, an $8,600 account value divided by $1,000 = 8.6), then multiply the result by the number in the first line under the heading “Expenses Paid During Period” to estimate the expenses you paid on your account during this period. Although the Fund charges no sales loads or transaction fees, you will be assessed fees for outgoing wire transfers, returned checks, and stop payment orders at prevailing rates charged by U.S. Bank Global Fund Services, the Fund’s transfer agent. If you request that a redemption be made by wire transfer, the Fund’s transfer agent charges a $15 fee. IRAs are charged a $15 annual maintenance fee (up to $30 maximum per shareholder for shareholders with multiple IRAs). The examples below include, but are not limited to, management, shareholder servicing, accounting, custody, and transfer agent fees. However, the examples below do not include portfolio trading commissions and related expenses.
Hypothetical Example for Comparison Purposes
In the table below, the second line under each of the “Investor Class” and “Institutional Class” headings provides information about hypothetical account values and hypothetical expenses based on the Fund’s actual expense ratio for each share class and an assumed rate of return of 5% per year before expenses, which is not the Fund’s actual return for such share class. The hypothetical account values and expenses may not be used to estimate the actual ending account balance or expenses you paid for the period. You may use this information to compare the ongoing costs of investing in the Fund and other funds. To do so, compare these 5% hypothetical examples with the 5% hypothetical examples that appear in the shareholder reports of the other funds. Please note that the expenses shown in the table are meant to highlight your ongoing costs only. Therefore, the second lines under “Investor Class” and “Institutional Class” are useful in comparing ongoing costs only and will not help you determine the relative total costs of owning different funds.
| | | | Expenses Paid |
| | Beginning | Ending | During Period(1) |
| | Account Value | Account Value | May 1, 2022 – |
| | May 1, 2022 | October 31, 2022 | October 31, 2022 |
| Investor Class | | | |
| Actual | $1,000.00 | $ 942.40 | $7.78 |
| Hypothetical (5% return before expenses) | $1,000.00 | $1,017.19 | $8.08 |
| | | | |
| Institutional Class | | | |
| Actual | $1,000.00 | $ 945.30 | $5.88 |
| Hypothetical (5% return before expenses) | $1,000.00 | $1,019.16 | $6.11 |
(1) | Expenses are equal to the Fund’s annualized expense ratio of 1.59% for Investor Class shares or 1.20% for Institutional Class shares, as applicable, multiplied by the average account value over the period, multiplied by 184/365 days (to reflect the half-year period). |
| HENNESSY FUNDS | 1-800-966-4354 | |
How to Obtain a Copy of the Fund’s Proxy
Voting Policy and Proxy Voting Records
A description of the policies and procedures the Fund uses to determine how to vote proxies relating to portfolio securities is available without charge (1) by calling 1-800-966-4354, (2) on the Hennessy Funds’ website at www.hennessyfunds.com/proxy-voting/voting-policy, or (3) on the U.S. Securities and Exchange Commission’s (the “SEC”) website at www.sec.gov. The Fund’s proxy voting record is available without charge on both the Hennessy Funds’ website at www.hennessyfunds.com/proxy-voting/voting-record and the SEC’s website at www.sec.gov no later than August 31 for the prior 12 months ending June 30.
Availability of Quarterly Portfolio Schedule
The Fund files a complete schedule of portfolio holdings with the SEC for the first and third quarters of each fiscal year as an exhibit to its reports on Form N-PORT. The Fund’s Form N-PORT reports are available on the SEC’s website at www.sec.gov or on request by calling 1-800-966-4354.
Federal Tax Distribution Information (Unaudited)
For fiscal year 2022, certain dividends paid by the Fund may be subject to a maximum tax rate of 23.8%, as provided for by the Jobs and Growth Tax Relief Reconciliation Act of 2003. The percentage of dividends declared from ordinary income designated as qualified dividend income was 100.00%.
For corporate shareholders, the percent of ordinary income distributions that qualified for the corporate dividends received deduction for fiscal year 2022 was 0.00%.
The percentage of taxable ordinary income distributions that were designated as short-term capital gain distributions under Section 871(k)(2)(C) of the Internal Revenue Code of 1986, as amended, for the Fund was 0.00%.
For the year ended October 31, 2022, the Fund earned foreign-source income and paid foreign taxes as noted below, which it intends to pass through to its shareholders pursuant to Section 853 of the Internal Revenue Code.
| | Country | Gross Foreign Income | Foreign Tax Paid | |
| | Japan | $2,341,032 | $234,991 | |
Important Notice Regarding Delivery of
Shareholder Documents
To help keep the Fund’s costs as low as possible, we generally deliver a single copy of shareholder reports, proxy statements, and prospectuses to shareholders who share an address and have the same last name. This process does not apply to account statements. You may request an individual copy of a shareholder document at any time. If you would like to receive separate mailings of shareholder documents, please call U.S. Bank Global Fund Services at 1-800-261-6950 or 1-414-765-4124, and individual delivery will begin within 30 days of your request. If your account is held through a financial institution or other intermediary, please contact such intermediary directly to request individual delivery.
| PROXY VOTING — LIQUIDITY RISK MANAGEMENT PROGRAM |
Electronic Delivery
As permitted by SEC regulations, the Fund’s shareholder reports are made available on a website, and unless you sign for eDelivery or elect to receive paper copies as detailed below, you will be notified by mail each time a report is posted and provided with a website link to access the report.
The Fund also offers shareholders the option to receive all notices, account statements, prospectuses, tax forms, and shareholder reports electronically. To sign up for eDelivery or change your delivery preference, please visit www.hennessyfunds.com/account.
To elect to receive paper copies of all future reports free of charge, please call U.S. Bank Global Fund Services at 800-261-6950 or 414-765-4124.
Subscribe to receive our team’s unique market and sector insights delivered to your inbox
www.hennessyfunds.com/subscribe
Follow us on social media
Liquidity Risk Management Program
In accordance with Rule 22e-4 under the Investment Company Act of 1940, as amended (the “Liquidity Rule”), we have adopted and implemented a liquidity risk management program (the “Liquidity Program”). The purpose of the Liquidity Program is to assess and manage the Fund’s liquidity risk, which is the risk that the Fund would not be able to meet requests to redeem Fund shares without significant dilution of the remaining shareholders’ interests in the Fund. The Board of Trustees of the Fund (the “Board”) designated a committee comprising representatives of Hennessy Advisors, Inc., the investment adviser to the Fund, as the administrator of the Liquidity Program (the “Program Administrator”).
The Program Administrator provided a written report regarding the Liquidity Program to the Board in advance of its meeting on June 1, 2022. The report covered the period from June 1, 2021, through May 31, 2022. The report addressed the operation of the Liquidity Program, assessed the adequacy and effectiveness of its implementation, and described any material changes to the Liquidity Program during the review period. The Trust’s chief compliance officer presented the report to the Board at the meeting and provided additional information regarding the Liquidity Program. The Board reviewed the Liquidity Program and considered, among other items, the following:
| | 1. | The Program Administrator reviewed daily historical net redemption activity during the review period and during prior periods with higher-than-average redemption activity and concluded that the Fund has historically been able to meet requests to redeem Fund shares without significant dilution to the Fund’s remaining shareholders, and the Program Administrator expects the Fund to be able to continue to do so in the future during both normal and reasonably foreseeable stressed conditions. |
| | | |
| | 2. | The Fund primarily holds assets that are highly liquid investments and is therefore not required to establish a highly liquid investment minimum for the Fund or adopt policies and procedures for responding to a highly liquid investment minimum shortfall. |
| HENNESSY FUNDS | 1-800-966-4354 | |
| | 3. | The Program Administrator did not make any material changes to the Liquidity Program during the review period and was not recommending any changes to the Liquidity Program or the model inputs used to determine the liquidity classification of each security held by the Fund. |
| | | |
| | 4. | The Program Administrator concluded that the Liquidity Program was reasonably designed to assess and manage the Fund’s liquidity risk, complies with the requirements of the Liquidity Rule, and was operating as intended during the review period. |
Privacy Policy
We collect the following personal information about you:
| | 1. | Information we receive from you in applications or other forms, correspondence, or conversations, including, but not limited to, your name, address, phone number, social security number, assets, income, and date of birth; |
| | | |
| | 2. | Information about your transactions with us, our affiliates, or others, including, but not limited to, your account number and balance, payments history, parties to transactions, cost basis information, and other financial information; and |
| | | |
| | 3. | Other personal information we collect from various sources, even if you have not entered into a prior transaction with us, including the following: |
| | | • | Name, alias, address, unique personal identifier, online identifier, IP address, email address, telephone number, account name, and other similar identifiers; |
| | | | |
| | | • | Age and marital status; |
| | | | |
| | | • | Commercial information, including records of products purchased; |
| | | | |
| | | • | Browsing history, search history, and information on interaction with our website; |
| | | | |
| | | • | Geolocation data; |
| | | | |
| | | • | Employment and employment history, educational history, financial information, and purchasing and consuming histories or tendencies; and |
| | | | |
| | | • | Inferences drawn from the above-listed information to create a profile about your preferences, characteristics, predispositions, and behavior. |
We collect this information directly from you, indirectly in the course of providing services to you, directly and indirectly from your activity on our website, from broker dealers, marketing agencies, and other third parties that interact with us in connection with the services we perform and products we offer, and from anonymized and aggregated consumer information.
We use this information to fulfill the reason you provided the information to us, to provide you with other relevant products that you request from us, to provide you with information about products that may interest you, to improve our website or present our website’s contents to you, and as otherwise described to you when collecting your personal information.
We do not disclose any personal information to unaffiliated third parties, except as permitted by law. We may disclose your personal information to our affiliates, vendors, and service providers for a business purpose. For example, we are permitted by law to disclose all of the information we collect, as described above, to our transfer agent to process your transactions. When disclosing your personal information to third parties, we
| LIQUIDITY RISK MANAGEMENT PROGRAM — PRIVACY POLICY |
enter into a contract with each third party describing the purpose of such disclosure and requiring that such personal information be kept confidential and not used for any purpose except to perform the services contracted or respond to regulatory or law enforcement requests.
Furthermore, we restrict access to your personal information to those persons who require such information to provide products or services to you. As a result, we do not provide a means for opting out of our limited sharing of your information. We maintain physical, electronic, and procedural safeguards that comply with federal standards to guard your personal information.
If you hold shares of the Funds through a financial intermediary, including, but not limited to, a broker-dealer, bank, or trust company, the privacy policy of your financial intermediary governs how your personal information is shared with unaffiliated third parties.
Supplemental Privacy Notice for Residents of California
The California Consumer Privacy Act of 2018 (the “CCPA”) provides you, as a California resident, with certain additional rights relating to your personal information.
Under the CCPA, you have the right to request that we disclose to you the categories of personal information we have collected about you over the past 12 months, the categories of sources of such information, our business purpose for collecting the information, the categories of third parties, if any, with whom we shared the information, and the specific information we have collected about you. You also have the right to request that we delete any of your personal information, and, unless an exception applies, we will delete such information upon receiving and confirming your request. To make a request, call us at 1-800-966-4354, email us at privacy@hennessyfunds.com, or go to www.hennessyfunds.com/contact. We will not discriminate against you for exercising your rights under the CCPA. Further, we will not collect additional categories of your personal information or use the personal information we collected for materially different, unrelated, or incompatible purposes without providing you notice.
| HENNESSY FUNDS | 1-800-966-4354 | |
For information, questions, or assistance, please call
The Hennessy Funds
1-800-966-4354 or 1-415-899-1555
INVESTMENT ADVISOR
Hennessy Advisors, Inc.
7250 Redwood Boulevard, Suite 200
Novato, California 94945
ADMINISTRATOR,
TRANSFER AGENT,
DIVIDEND PAYING AGENT, &
SHAREHOLDER SERVICING AGENT
U.S. Bancorp Fund Services, LLC
d/b/a U.S. Bank Global Fund Services
P.O. Box 701
Milwaukee, Wisconsin 53201-0701
CUSTODIAN
U.S. Bank N.A.
Custody Operations
1555 North River Center Drive, Suite 302
Milwaukee, Wisconsin 53212
TRUSTEES
Neil J. Hennessy
Robert T. Doyle
J. Dennis DeSousa
Claire Garvie
Gerald P. Richardson
COUNSEL
Foley & Lardner LLP
777 East Wisconsin Avenue
Milwaukee, Wisconsin 53202-5306
INDEPENDENT REGISTERED
PUBLIC ACCOUNTING FIRM
Tait, Weller & Baker LLP
Two Liberty Place
50 South 16th Street, Suite 2900
Philadelphia, Pennsylvania 19102-2529
DISTRIBUTOR
Quasar Distributors, LLC
111 East Kilbourn Avenue, Suite 1250
Milwaukee, Wisconsin 53202
www.hennessyfunds.com | 800-966-4354
This report has been prepared for shareholders and may be distributed to
others only if preceded or accompanied by a current prospectus.
ANNUAL REPORT
OCTOBER 31, 2022
HENNESSY LARGE CAP FINANCIAL FUND
Investor Class HLFNX
Institutional Class HILFX
www.hennessyfunds.com | 1-800-966-4354
(This Page Intentionally Left Blank.)
Contents
| Letter to Shareholders | | 2 |
| Performance Overview | | 6 |
| Financial Statements | | |
| Schedule of Investments | | 9 |
| Statement of Assets and Liabilities | | 12 |
| Statement of Operations | | 13 |
| Statements of Changes in Net Assets | | 15 |
| Financial Highlights | | 16 |
| Notes to the Financial Statements | | 20 |
| Report of Independent Registered Public Accounting Firm | | 29 |
| Trustees and Officers of the Fund | | 30 |
| Expense Example | | 34 |
| Proxy Voting Policy and Proxy Voting Records | | 36 |
| Availability of Quarterly Portfolio Schedule | | 36 |
| Federal Tax Distribution Information | | 36 |
| Important Notice Regarding Delivery of Shareholder Documents | | 36 |
| Electronic Delivery | | 36 |
| Liquidity Risk Management Program | | 37 |
| Privacy Policy | | 37 |
| HENNESSY FUNDS | 1-800-966-4354 | |
December 2022
Dear Hennessy Funds Shareholder:
What a year it has been. By the close of the second trading day of 2022, we witnessed new all-time highs in both the S&P 500® Index and the Dow Jones Industrial Average, while the Nasdaq Composite Index hit its all-time high in November 2021. The market’s triumph was short lived, however. By the last day of our fiscal year on October 31, 2022, all three major indices were down significantly, with bleak year-to-date total returns of -8.42%, -17.70%, and -29.32% for the Dow, the S&P 500, and the Nasdaq, respectively. After almost 13 years of incredible resilience following the Financial Crisis of 2008, the equity markets have been shaken by stinging inflation, rapidly rising interest rates, soaring energy costs, and slowing economic growth teetering on recession. While many investors would like to forget 2022, we prefer to maintain perspective in this market downturn.
Time, time, time…. is on my side, yes, it is!
-Rolling Stones, 1964
We believe time is on our side… when it comes to investing. Experiencing negative market movements on any given day can seem disappointing. Downdrafts lasting a month can feel relentless. Almost a full year of negative returns with little respite along the way? That is downright painful. However, equities generally trend up and to the right. Over the past 100 calendar years, the Dow had an average annual total return of 10.25%. While we admit that long-term returns like these make it easy to be a “consummate bull,” market bulls have been right over the long-term. Yet over shorter periods, market returns can be “choppy.”
Looking at the chart below depicting annual total returns of the Dow Jones Industrial Average from 1950 to 2021, we see how volatile the market can be on an annual basis. Investors experienced 16 years of negative returns during this time, the most painful being -31.93% in 2008.
Time is what smooths out choppy markets. When we extend our investing intervals, and stop focusing on annual returns, the ups and downs feel less and less – and appear less and less. The two charts below depict the three-year and five-year rolling average total returns of the Dow over the same time period as the chart above. Each chart shows decreased volatility, with lower peaks and higher troughs, even though the charts show the same cumulative return of the Dow over the past 71 full calendar years.
When we extend our chart out to ten-year rolling averages, we can clearly see how investing over the long-term can make an investor bullish. In the past 71 years, there has never been a negative 10-year rolling average total return of the Dow. Never. The worst ten-year rolling average total return was a positive 0.29%, from 1965 to 1974, a period including the Great Inflation of the 1970s marked by dismal total returns of -13.28% in 1973 and -23.58% in 1974. The ten-year period from 2000 to 2009, which included the Financial Crisis of 2008, produced a positive average annual total return of 1.31%. Note that in the chart below, the line never crosses below zero.
| HENNESSY FUNDS | 1-800-966-4354 | |
When it comes to investing, time, time, time… is on our side, yes, it is! This is why we invest for the long term at Hennessy, focusing on fundamentals, valuations, and strong businesses, ever mindful of downside risk.
Value investing proved its worth this year, and many of our Funds did as well. The Russell 1000® Value Index was only down -7.00% during our fiscal year ended October 31, 2022, trouncing the Russell 1000® Growth Index’s total return of -24.60%. In addition, most of our Funds outperformed the broader market as well as their benchmarks. During the twelve months ended October 31, 2022, the Dow, the S&P 500, and the Nasdaq dropped -6.74%, -14.61%, and -28.56%, respectively, on a total return basis. During this time period when these three major indices saw significant declines, we were pleased that seven of our 16 Funds posted positive total returns, 11 of our 14 domestic Funds outperformed the S&P 500, and over two-thirds of our actively managed, domestic funds outperformed their primary benchmarks.
Top performers of the year included three of our Funds focused on the Energy and Utilities sectors. These sectors have benefitted from the rising cost of energy, as well as an increase in demand that has outpaced growth in supply. The Hennessy Energy Transition Fund, the Hennessy Midstream Fund, and the Hennessy Gas Utility Fund performed exceptionally well with positive total returns of 49.24%, 24.03%, and 10.14%, respectively, during the twelve-month period ended October 31, 2022. On a different note, our two international funds continue to be adversely affected by softening economies in Asia, rising interest rates, and growth to value rotation. The Hennessy Japan Fund and the Hennessy Japan Small Cap Fund experienced negative total returns of -37.86% and -27.35%, respectively, during our fiscal year.
Notwithstanding a difficult market environment over the last twelve months, we believe that the outlook for U.S. stocks remains positive. We continue to believe that equities are attractive from a valuation standpoint, even as interest rates rise. We believe that the prospect of slower economic growth may dampen inflationary pressures. While the Federal Reserve has raised rates several times in calendar 2022, we believe tempered inflation will allow the potential for the Federal Reserve to take a more neutral stance toward future rate hikes. We remain bullish on equities long term. The unemployment rate is near record lows, there are elevated levels of cash on the balance sheets of U.S. companies, and there is the prospect of a more dovish Federal Reserve in 2023. While
volatility and uncertainty may continue to impact the markets in the short term, we encourage investors to stay the course, maintain a diversified portfolio, and keep a long-term perspective.
We thank you for your continued interest in our Funds, and we are grateful for your trust. While we always prefer to post only positive returns for our shareholders, we are pleased that many of our Funds held up better than the broader market during this challenging year. If you have any questions or would like to speak with us, please call us directly at (800) 966-4354.
Best regards,
| |
| |
| |
|
| Ryan C. Kelley, CFA |
| Chief Investment Officer, |
| Senior Vice President, and Portfolio Manager |
Past performance does not guarantee future results.
Mutual fund investing involves risk. Principal loss is possible.
Opinions expressed are those of Ryan C. Kelley and are subject to change, are not guaranteed, and should not be considered investment advice.
The Dow Jones Industrial Average and S&P 500® Index are commonly used to measure the performance of U.S. stocks. The Nasdaq Composite Index comprises all common stocks listed on The Nasdaq Stock Market and is commonly used to measure the performance of technology-related stocks. The indices are used herein for comparative purposes in accordance with SEC regulations. One cannot invest directly in an index. All returns are shown on a total return basis.
| HENNESSY FUNDS | 1-800-966-4354 | |
Performance Overview (Unaudited)
CHANGE IN VALUE OF $10,000 INVESTMENT
This graph illustrates the performance of an initial investment of $10,000 made in the Fund 10 years ago and assumes the reinvestment of dividends and capital gains.
AVERAGE ANNUAL TOTAL RETURN FOR PERIODS ENDED OCTOBER 31, 2022
| | One | Five | Ten |
| | Year | Years | Years |
| Hennessy Large Cap Financial Fund – | | | |
| Investor Class (HLFNX) | -26.22% | 4.98% | 9.63% |
| Hennessy Large Cap Financial Fund – | | | |
Institutional Class (HILFX)(1) | -25.95% | 5.35% | 9.93% |
Russell 1000® Index Financials | -13.72% | 10.49% | 13.67% |
Russell 1000® Index | -16.38% | 10.19% | 12.66% |
Expense ratios: 1.68% (Investor Class); 1.32% (Institutional Class)
(1) | The inception date of Institutional Class shares is June 15, 2015. Performance shown prior to the inception of Institutional Class shares reflects the performance of Investor Class shares and includes expenses that are not applicable to, and are higher than, those of Institutional Class shares. |
Performance data quoted represents past performance; past performance does not guarantee future results. The investment return and principal value of an investment will fluctuate so that an investor’s shares, when redeemed, may be worth more or less than their original cost. The performance table does not reflect the deduction of taxes that a shareholder would pay on Fund distributions or the redemption of Fund shares. Current performance of the Fund may be lower or higher than the performance quoted. Performance data current to the most recent month end may be obtained by visiting www.hennessyfunds.com.
The Russell 1000® Index Financials is a subset of the Russell 1000® Index that measures the performance of securities classified in the Financials sector of the large-cap U.S. equity market. The Russell 1000® Index is a subset of the Russell 3000® Index that measures the performance of the large-cap segment of the U.S. equity market. The Russell 1000® Index comprises the 1,000 largest companies in the Russell 3000® Index based on market capitalization and current index membership, representing approximately 93% of the total market capitalization of the Russell 3000® Index. One cannot invest directly in an index. These indices are used for comparative purposes in accordance with Securities and Exchange Commission regulations.
Frank Russell Company (“Russell”) is the source and owner of the trademarks, service marks, and copyrights related to the Russell Indexes. Russell® is a trademark of Frank Russell Company. Neither Russell nor its licensors accept any liability for any errors or omissions in the Russell Indexes or Russell ratings or underlying data and no party may rely on any Russell Indexes or Russell ratings or underlying data contained in this communication. No further distribution of Russell data is permitted without Russell’s express written consent. Russell does not promote, sponsor, or endorse the content of this communication.
The expense ratios presented are from the most recent prospectus. The expense ratios for the current reporting period are available in the Financial Highlights section of this report.
PERFORMANCE NARRATIVE
Portfolio Managers David H. Ellison and Ryan C. Kelley, CFA
Performance:
For the one-year period ended October 31, 2022, the Investor Class of the Hennessy Large Cap Financial Fund returned -26.22%, underperforming both the Russell 1000® Index Financials (the Fund’s primary benchmark) and the Russell 1000® Index, which returned -13.72% and -16.38%, respectively, for the same period.
The Fund’s underperformance relative to its primary benchmark predominantly stemmed from its overweight allocation to diversified financial companies, as well as stock selection within the Financials sector. Positive contributors to Fund performance included investments in Apple, Inc., Regions Financial Corporation, and M&T Bank Corporation. Among the biggest detractors from Fund performance during the period were PayPal Holdings, Inc., SoFi Technologies, Inc. and Block, Inc.
The Fund continues to own all the companies mentioned except SoFi Technologies, Inc. and Block, Inc.
Portfolio Strategy:
Historically, the Fund has been invested primarily in large-cap banks and, to a lesser degree, insurance, real estate, and asset managers. While we increased our exposure to electronic payment companies and other financial technology companies over the last few years, we have repositioned the Fund back towards large-cap banks and regional banks recently, as we believe the more traditional financial institutions currently offer better investment opportunities.
In general, we seek companies that we believe have high-quality management teams, less complex business models, and the prospect of sustainable earnings growth over time. We believe the timing of changes in macro industry dynamics is difficult to predict and that greater opportunity exists by investing in companies that focus on the long term. We also try to identify companies that we expect will do better relative to peers in the current environment, which is characterized by rapidly rising interest rates, competitive loan markets, evolving electronic payment platforms, growing attention to costs, increasing potential for loan charge-offs, and business model repositioning.
Investment Commentary:
Given compelling relative valuations compared to the broader stock market as well as historical averages, we believe that attractive long-term opportunities exist within large-cap financial companies despite a challenging environment and increased economic
| HENNESSY FUNDS | 1-800-966-4354 | |
uncertainty. While rising interest rates should continue to help increase net interest margins and overall profitability, it can also cause a decline in capital levels and slow loan growth. Many investors are concerned about asset quality, although the industry has yet to experience any notable increases in non-performing loans or charge-offs. We are reassured that the industry as a whole continues to have high levels of reserves and excess capital in case of any significant asset quality problems. Overall, we expect earnings and profitability to continue to increase and believe that valuations appear attractive, all positives for our Fund.
_______________
Opinions expressed are those of the Portfolio Managers as of the date written and are subject to change, are not guaranteed, and should not be considered investment advice or an indication of trading intent.
The Fund is non-diversified, meaning it may concentrate its assets in fewer individual holdings than a diversified fund, making it more exposed to individual stock volatility than a diversified fund. Investments are focused on the financial services industry; sector funds may be subject to a higher degree of market risk. The Fund invests in medium-sized companies, which may have limited liquidity and greater volatility compared to larger companies. Please see the Fund’s prospectus for a more complete discussion of these and other risks.
References to specific securities should not be considered a recommendation to buy or sell any security. Fund holdings and sector allocations are subject to change. Please refer to the Schedule of Investments included in this report for additional portfolio information.
Earnings growth is not a measure of the Fund’s future performance.
| PERFORMANCE OVERVIEW/SCHEDULE OF INVESTMENTS |
Financial Statements
Schedule of Investments as of October 31, 2022 |
HENNESSY LARGE CAP FINANCIAL FUND
(% of Net Assets)
| TOP TEN HOLDINGS (EXCLUDING MONEY MARKET FUNDS) | % NET ASSETS |
| Citizens Financial Group, Inc. | 5.72% |
| Bank of America Corp. | 5.67% |
| JPMorgan Chase & Co. | 5.50% |
| Wells Fargo & Co. | 5.42% |
| Berkshire Hathaway, Inc., Class B | 5.16% |
| Capital One Financial Corp. | 4.98% |
| State Street Corp. | 4.53% |
| Fifth Third Bancorp | 4.52% |
| The Goldman Sachs Group, Inc. | 4.52% |
| KeyCorp | 4.25% |
Note: For presentation purposes, the Fund has grouped some of the industry categories. For purposes of categorizing securities for compliance with Section 8(b)(1) of the Investment Company Act of 1940, as amended, the Fund uses more specific industry classifications.
The Global Industry Classification Standard (GICS®) was developed by and is the exclusive property and a service mark of MSCI, Inc. and Standard & Poor’s Financial Services LLC. It has been licensed for use by the Hennessy Funds.
| HENNESSY FUNDS | 1-800-966-4354 | |
| COMMON STOCKS – 91.67% | | Number | | | | | | % of | |
| | | of Shares | | | Value | | | Net Assets | |
| Financials – 79.97% | | | | | | | | | |
| Bank of America Corp. | | | 72,000 | | | $ | 2,594,880 | | | | 5.67 | % |
| Berkshire Hathaway, Inc., Class B (a) | | | 8,000 | | | | 2,360,720 | | | | 5.16 | % |
| BlackRock, Inc. | | | 600 | | | | 387,546 | | | | 0.85 | % |
| Capital One Financial Corp. | | | 21,500 | | | | 2,279,430 | | | | 4.98 | % |
| Citigroup, Inc. | | | 41,000 | | | | 1,880,260 | | | | 4.11 | % |
| Citizens Financial Group, Inc. | | | 64,000 | | | | 2,617,600 | | | | 5.72 | % |
| Comerica, Inc. | | | 25,000 | | | | 1,762,500 | | | | 3.85 | % |
| Fifth Third Bancorp | | | 58,000 | | | | 2,070,020 | | | | 4.52 | % |
| Huntington Bancshares, Inc. | | | 128,000 | | | | 1,943,040 | | | | 4.24 | % |
| JPMorgan Chase & Co. | | | 20,000 | | | | 2,517,600 | | | | 5.50 | % |
| KeyCorp | | | 109,000 | | | | 1,947,830 | | | | 4.25 | % |
| M&T Bank Corp. | | | 7,000 | | | | 1,178,590 | | | | 2.57 | % |
| Morgan Stanley | | | 20,000 | | | | 1,643,400 | | | | 3.59 | % |
| Regions Financial Corp. | | | 12,000 | | | | 263,400 | | | | 0.58 | % |
| Signature Bank | | | 11,500 | | | | 1,823,095 | | | | 3.98 | % |
| State Street Corp. | | | 28,000 | | | | 2,072,000 | | | | 4.53 | % |
| The Goldman Sachs Group, Inc. | | | 6,000 | | | | 2,067,060 | | | | 4.52 | % |
| The PNC Financial Services Group, Inc. | | | 2,500 | | | | 404,575 | | | | 0.88 | % |
| Truist Financial Corp. | | | 20,000 | | | | 895,800 | | | | 1.96 | % |
| U.S. Bancorp | | | 15,000 | | | | 636,750 | | | | 1.39 | % |
| Wells Fargo & Co. | | | 54,000 | | | | 2,483,460 | | | | 5.42 | % |
| Zions Bancorp NA | | | 15,000 | | | | 779,100 | | | | 1.70 | % |
| | | | | | | | 36,608,656 | | | | 79.97 | % |
| | | | | | | | | | | | | |
| Information Technology – 11.70% | | | | | | | | | | | | |
| Apple, Inc. | | | 5,500 | | | | 843,370 | | | | 1.84 | % |
| Mastercard, Inc., Class A | | | 4,500 | | | | 1,476,810 | | | | 3.23 | % |
| PayPal Holdings, Inc. (a) | | | 16,000 | | | | 1,337,280 | | | | 2.92 | % |
| Visa, Inc., Class A | | | 8,200 | | | | 1,698,712 | | | | 3.71 | % |
| | | | | | | | 5,356,172 | | | | 11.70 | % |
| | | | | | | | | | | | | |
| Total Common Stocks | | | | | | | | | | | | |
| (Cost $36,081,067) | | | | | | | 41,964,828 | | | | 91.67 | % |
The accompanying notes are an integral part of these financial statements.
| REITS – 6.80% | | Number | | | | | | % of | |
| | | of Shares | | | Value | | | Net Assets | |
| Financials – 6.80% | | | | | | | | | |
| AGNC Investment Corp. | | | 110,000 | | | $ | 904,200 | | | | 1.97 | % |
| Annaly Capital Management, Inc. | | | 50,000 | | | | 927,500 | | | | 2.03 | % |
| Starwood Property Trust, Inc. | | | 62,000 | | | | 1,280,920 | | | | 2.80 | % |
| | | | | | | | | | | | | |
| Total REITS | | | | | | | | | | | | |
| (Cost $3,247,355) | | | | | | | 3,112,620 | | | | 6.80 | % |
| | | | | | | | | | | | | |
| SHORT-TERM INVESTMENTS – 3.62% | | | | | | | | | | | | |
| | | | | | | | | | | | | |
| Money Market Funds – 3.62% | | | | | | | | | | | | |
| First American Government Obligations Fund, | | | | | | | | | | | | |
| Institutional Class, 2.93% (b) | | | 1,658,427 | | | | 1,658,427 | | | | 3.62 | % |
| | | | | | | | | | | | | |
| Total Short-Term Investments | | | | | | | | | | | | |
| (Cost $1,658,427) | | | | | | | 1,658,427 | | | | 3.62 | % |
| | | | | | | | | | | | | |
| Total Investments | | | | | | | | | | | | |
| (Cost $40,986,849) – 102.09% | | | | | | | 46,735,875 | | | | 102.09 | % |
| Liabilities in Excess of Other Assets – (2.09)% | | | | | | | (959,284 | ) | | | (2.09 | )% |
| | | | | | | | | | | | | |
TOTAL NET ASSETS – 100.00% | | | | | | $ | 45,776,591 | | | | 100.00 | % |
Percentages are stated as a percent of net assets.
NV – Naamloze Vennootschap is a Dutch term for publicly traded companies.
REIT – Real Estate Investment Trust
| (a) | Non-income-producing security. |
| (b) | The rate listed is the fund’s seven-day yield as of October 31, 2022. |
Summary of Fair Value Exposure as of October 31, 2022
The following is a summary of the inputs used to value the Fund’s net assets as of October 31, 2022 (see Note 3 in the accompanying Notes to the Financial Statements):
| Common Stocks | | Level 1 | | | Level 2 | | | Level 3 | | | Total | |
| Financials | | $ | 36,608,656 | | | $ | — | | | $ | — | | | $ | 36,608,656 | |
| Information Technology | | | 5,356,172 | | | | — | | | | — | | | | 5,356,172 | |
| Total Common Stocks | | $ | 41,964,828 | | | $ | — | | | $ | — | | | $ | 41,964,828 | |
| REITS | | | | | | | | | | | | | | | | |
| Financials | | $ | 3,112,620 | | | $ | — | | | $ | — | | | $ | 3,112,620 | |
| Total REITS | | $ | 3,112,620 | | | $ | — | | | $ | — | | | $ | 3,112,620 | |
| Short-Term Investments | | | | | | | | | | | | | | | | |
| Money Market Funds | | $ | 1,658,427 | | | $ | — | | | $ | — | | | $ | 1,658,427 | |
| Total Short-Term Investments | | $ | 1,658,427 | | | $ | — | | | $ | — | | | $ | 1,658,427 | |
| Total Investments | | $ | 46,735,875 | | | $ | — | | | $ | — | | | $ | 46,735,875 | |
The accompanying notes are an integral part of these financial statements.
| HENNESSY FUNDS | 1-800-966-4354 | |
Financial Statements
Statement of Assets and Liabilities as of October 31, 2022 |
| ASSETS: | | | |
| Investments in securities, at value (cost $40,986,849) | | $ | 46,735,875 | |
| Cash | | | 11,440 | |
| Dividends and interest receivable | | | 49,034 | |
| Receivable for fund shares sold | | | 10,503 | |
| Prepaid expenses and other assets | | | 16,028 | |
| Total assets | | | 46,822,880 | |
| | | | | |
| LIABILITIES: | | | | |
| Payable for securities purchased | | | 410,654 | |
| Payable for fund shares redeemed | | | 545,578 | |
| Payable to advisor | | | 33,776 | |
| Payable to administrator | | | 10,529 | |
| Payable to auditor | | | 22,749 | |
| Accrued distribution fees | | | 3,376 | |
| Accrued service fees | | | 1,917 | |
| Accrued trustees fees | | | 5,274 | |
| Accrued expenses and other payables | | | 12,436 | |
| Total liabilities | | | 1,046,289 | |
| NET ASSETS | | $ | 45,776,591 | |
| | | | | |
| NET ASSETS CONSISTS OF: | | | | |
| Capital stock | | $ | 38,296,281 | |
| Total distributable earnings | | | 7,480,310 | |
| Total net assets | | $ | 45,776,591 | |
| | | | | |
| NET ASSETS: | | | | |
| Investor Class | | | | |
| Shares authorized (no par value) | | Unlimited | |
| Net assets applicable to outstanding shares | | $ | 23,625,419 | |
| Shares issued and outstanding | | | 952,453 | |
| Net asset value, offering price, and redemption price per share | | $ | 24.80 | |
| | | | | |
| Institutional Class | | | | |
| Shares authorized (no par value) | | Unlimited | |
| Net assets applicable to outstanding shares | | $ | 22,151,172 | |
| Shares issued and outstanding | | | 882,256 | |
| Net asset value, offering price, and redemption price per share | | $ | 25.11 | |
The accompanying notes are an integral part of these financial statements.
| STATEMENT OF ASSETS AND LIABILITIES/STATEMENT OF OPERATIONS |
Financial Statements
Statement of Operations for the year ended October 31, 2022 |
| INVESTMENT INCOME: | | | |
| Dividend income | | $ | 1,265,636 | |
| Interest income | | | 17,937 | |
| Total investment income | | | 1,283,573 | |
| | | | | |
| EXPENSES: | | | | |
| Investment advisory fees (See Note 5) | | | 518,101 | |
| Sub-transfer agent expenses – Investor Class (See Note 5) | | | 53,767 | |
| Sub-transfer agent expenses – Institutional Class (See Note 5) | | | 25,212 | |
| Administration, accounting, custody, and transfer agent fees (See Note 5) | | | 76,387 | |
| Distribution fees – Investor Class (See Note 5) | | | 42,271 | |
| Federal and state registration fees | | | 34,417 | |
| Service fees – Investor Class (See Note 5) | | | 28,180 | |
| Compliance expense (See Note 5) | | | 24,516 | |
| Audit fees | | | 22,743 | |
| Trustees’ fees and expenses | | | 17,595 | |
| Reports to shareholders | | | 11,019 | |
| Legal fees | | | 1,004 | |
| Interest expense (See Note 7) | | | 716 | |
| Other expenses | | | 12,401 | |
| Total expenses | | | 868,329 | |
| NET INVESTMENT INCOME | | $ | 415,244 | |
| | | | | |
| REALIZED AND UNREALIZED GAINS (LOSSES): | | | | |
| Net realized gain on investments: | | | 3,448,215 | |
| Net change in unrealized appreciation/deprecation on investments: | | | (23,178,978 | ) |
| Net loss on investments | | | (19,730,763 | ) |
| NET DECREASE IN NET ASSETS RESULTING FROM OPERATIONS | | $ | (19,315,519 | ) |
The accompanying notes are an integral part of these financial statements.
| HENNESSY FUNDS | 1-800-966-4354 | |
(This Page Intentionally Left Blank.)
| STATEMENTS OF CHANGES IN NET ASSETS |
Financial Statements
| Statements of Changes in Net Assets |
| | | Year Ended | | | Year Ended | |
| | | October 31, 2022 | | | October 31, 2021 | |
| OPERATIONS: | | | | | | |
| Net investment income (loss) | | $ | 415,244 | | | $ | (190,967 | ) |
| Net realized gain on investments | | | 3,448,215 | | | | 4,934,331 | |
| Net change in unrealized | | | | | | | | |
| appreciation/depreciation on investments | | | (23,178,978 | ) | | | 21,198,437 | |
| Net increase (decrease) in net | | | | | | | | |
| assets resulting from operations | | | (19,315,519 | ) | | | 25,941,801 | |
| | | | | | | | | |
| DISTRIBUTIONS TO SHAREHOLDERS: | | | | | | | | |
| Distributable earnings – Investor Class | | | (1,687,916 | ) | | | — | |
| Distributable earnings – Institutional Class | | | (1,797,726 | ) | | | — | |
| Total distributions | | | (3,485,642 | ) | | | — | |
| | | | | | | | | |
| CAPITAL SHARE TRANSACTIONS: | | | | | | | | |
| Proceeds from shares subscribed – Investor Class | | | 2,685,032 | | | | 10,760,638 | |
| Proceeds from shares subscribed – Institutional Class | | | 11,877,575 | | | | 24,725,649 | |
| Dividends reinvested – Investor Class | | | 1,636,787 | | | | — | |
| Dividends reinvested – Institutional Class | | | 1,782,399 | | | | — | |
| Cost of shares redeemed – Investor Class | | | (6,195,638 | ) | | | (10,552,763 | ) |
| Cost of shares redeemed – Institutional Class | | | (14,692,333 | ) | | | (23,051,103 | ) |
| Net increase (decrease) in net assets derived | | | | | | | | |
| from capital share transactions | | | (2,906,178 | ) | | | 1,882,421 | |
| TOTAL INCREASE (DECREASE) IN NET ASSETS | | | (25,707,339 | ) | | | 27,824,222 | |
| | | | | | | | | |
| NET ASSETS: | | | | | | | | |
| Beginning of year | | | 71,483,930 | | | | 43,659,708 | |
| End of year | | $ | 45,776,591 | | | $ | 71,483,930 | |
| | | | | | | | | |
| CHANGES IN SHARES OUTSTANDING: | | | | | | | | |
| Shares sold – Investor Class | | | 92,861 | | | | 356,674 | |
| Shares sold – Institutional Class | | | 380,400 | | | | 786,529 | |
| Shares issued to holders as reinvestment | | | | | | | | |
| of dividends – Investor Class | | | 50,270 | | | | — | |
| Shares issued to holders as reinvestment | | | | | | | | |
| of dividends – Institutional Class | | | 54,242 | | | | — | |
| Shares redeemed – Investor Class | | | (221,850 | ) | | | (333,681 | ) |
| Shares redeemed – Institutional Class | | | (536,409 | ) | | | (744,960 | ) |
| Net increase (decrease) in shares outstanding | | | (180,486 | ) | | | 64,562 | |
The accompanying notes are an integral part of these financial statements.
| HENNESSY FUNDS | 1-800-966-4354 | |
Financial Statements
For an Investor Class share outstanding throughout each year
PER SHARE DATA:
Net asset value, beginning of year
Income from investment operations:
Net investment income (loss)
Net realized and unrealized gains (losses) on investments
Total from investment operations
Less distributions:
Dividends from net realized gains
Total distributions
Net asset value, end of year
TOTAL RETURN
SUPPLEMENTAL DATA AND RATIOS:
Net assets, end of year (millions)
Ratio of expenses to average net assets
Ratio of net investment income (loss) to average net assets
Portfolio turnover rate(2)
(1) | Calculated using the average shares outstanding method. |
(2) | Calculated on the basis of the Fund as a whole. |
The accompanying notes are an integral part of these financial statements.
| FINANCIAL HIGHLIGHTS — INVESTOR CLASS |
| Year Ended October 31, | |
| 2022 | | | 2021 | | | 2020 | | | 2019 | | | 2018 | |
| | | | | | | | | | | | | | |
| $ | 35.32 | | | $ | 22.33 | | | $ | 22.63 | | | $ | 21.43 | | | $ | 22.02 | |
| | | | | | | | | | | | | | | | | | | |
| | | | | | | | | | | | | | | | | | | |
| | 0.15 | (1) | | | (0.15 | )(1) | | | (0.05 | )(1) | | | (0.05 | )(1) | | | (0.07 | ) |
| | (9.02 | ) | | | 13.14 | | | | (0.25 | ) | | | 1.84 | | | | 0.48 | |
| | (8.87 | ) | | | 12.99 | | | | (0.30 | ) | | | 1.79 | | | | 0.41 | |
| | | | | | | | | | | | | | | | | | | |
| | | | | | | | | | | | | | | | | | | |
| | (1.65 | ) | | | — | | | | — | | | | (0.59 | ) | | | (1.00 | ) |
| | (1.65 | ) | | | — | | | | — | | | | (0.59 | ) | | | (1.00 | ) |
| $ | 24.80 | | | $ | 35.32 | | | $ | 22.33 | | | $ | 22.63 | | | $ | 21.43 | |
| | | | | | | | | | | | | | | | | | | |
| | -26.22 | % | | | 58.17 | % | | | -1.33 | % | | | 8.75 | % | | | 1.82 | % |
| | | | | | | | | | | | | | | | | | | |
| | | | | | | | | | | | | | | | | | | |
| $ | 23.63 | | | $ | 36.42 | | | $ | 22.51 | | | $ | 23.63 | | | $ | 40.99 | |
| | 1.69 | % | | | 1.68 | % | | | 1.75 | % | | | 1.82 | % | | | 1.69 | % |
| | 0.55 | % | | | (0.47 | )% | | | (0.21 | )% | | | (0.23 | )% | | | (0.44 | )% |
| | 78 | % | | | 62 | % | | | 88 | % | | | 83 | % | | | 64 | % |
The accompanying notes are an integral part of these financial statements.
| HENNESSY FUNDS | 1-800-966-4354 | |
Financial Statements
For an Institutional Class share outstanding throughout each year
PER SHARE DATA:
Net asset value, beginning of year
Income from investment operations:
Net investment income (loss)
Net realized and unrealized gains (losses) on investments
Total from investment operations
Less distributions:
Dividends from net realized gains
Total distributions
Net asset value, end of year
TOTAL RETURN
SUPPLEMENTAL DATA AND RATIOS:
Net assets, end of year (millions)
Ratio of expenses to average net assets
Ratio of net investment income (loss) to average net assets
Portfolio turnover rate(2)
(1) | Calculated using the average shares outstanding method. |
(2) | Calculated on the basis of the Fund as a whole. |
The accompanying notes are an integral part of these financial statements.
| FINANCIAL HIGHLIGHTS — INSTITUTIONAL CLASS |
| Year Ended October 31, | |
| 2022 | | | 2021 | | | 2020 | | | 2019 | | | 2018 | |
| | | | | | | | | | | | | | |
| $ | 35.63 | | | $ | 22.44 | | | $ | 22.68 | | | $ | 21.39 | | | $ | 21.91 | |
| | | | | | | | | | | | | | | | | | | |
| | | | | | | | | | | | | | | | | | | |
| | 0.25 | (1) | | | (0.03 | )(1) | | | 0.02 | (1) | | | 0.01 | (1) | | | 0.03 | |
| | (9.10 | ) | | | 13.22 | | | | (0.26 | ) | | | 1.87 | | | | 0.45 | |
| | (8.85 | ) | | | 13.19 | | | | (0.24 | ) | | | 1.88 | | | | 0.48 | |
| | | | | | | | | | | | | | | | | | | |
| | | | | | | | | | | | | | | | | | | |
| | (1.67 | ) | | | — | | | | — | | | | (0.59 | ) | | | (1.00 | ) |
| | (1.67 | ) | | | — | | | | — | | | | (0.59 | ) | | | (1.00 | ) |
| $ | 25.11 | | | $ | 35.63 | | | $ | 22.44 | | | $ | 22.68 | | | $ | 21.39 | |
| | | | | | | | | | | | | | | | | | | |
| | -25.95 | % | | | 58.78 | % | | | -1.06 | % | | | 9.16 | % | | | 2.16 | % |
| | | | | | | | | | | | | | | | | | | |
| | | | | | | | | | | | | | | | | | | |
| $ | 22.15 | | | $ | 35.06 | | | $ | 21.15 | | | $ | 21.97 | | | $ | 8.85 | |
| | 1.33 | % | | | 1.32 | % | | | 1.45 | % | | | 1.43 | % | | | 1.34 | % |
| | 0.89 | % | | | (0.11 | )% | | | 0.08 | % | | | 0.05 | % | | | (0.07 | )% |
| | 78 | % | | | 62 | % | | | 88 | % | | | 83 | % | | | 64 | % |
The accompanying notes are an integral part of these financial statements.
| HENNESSY FUNDS | 1-800-966-4354 | |
Financial Statements
Notes to the Financial Statements October 31, 2022 |
1). ORGANIZATION
The Hennessy Large Cap Financial Fund (the “Fund”) is a series of Hennessy Funds Trust (the “Trust”), which was organized as a Delaware statutory trust on September 17, 1992. The Fund is an open-end management investment company registered under the Investment Company Act of 1940, as amended. The investment objective of the Fund is capital appreciation. The Fund is a non-diversified fund.
The Fund offers Investor Class and Institutional Class shares. Each class of shares differs principally in its respective 12b-1 distribution and service, shareholder servicing, and sub-transfer agent expenses. There are no sales charges. Each class has identical rights to earnings, assets, and voting privileges, except for class-specific expenses and exclusive rights to vote on matters affecting only one class.
As an investment company, the Fund follows the investment company accounting and reporting guidance of the Financial Accounting Standards Board (“FASB”) Accounting Standard Codification Topic 946 “Financial Services—Investment Companies.”
2). SIGNIFICANT ACCOUNTING POLICIES
The following is a summary of significant accounting policies consistently followed by the Fund in the preparation of the financial statements. These policies conform to U.S. generally accepted accounting principles (“GAAP”).
| a). | Securities Valuation – All investments in securities are valued in accordance with the Fund’s valuation policies and procedures, as described in Note 3. |
| | |
| b). | Federal Income Taxes – The Fund has elected to be taxed as a regulated investment company and intends to distribute substantially all of its taxable income to its shareholders and otherwise comply with the provisions of the Internal Revenue Code of 1986, as amended, applicable to regulated investment companies. As a result, the Fund has made no provision for federal income taxes or excise taxes. Net investment income/loss and realized gains/losses for federal income tax purposes may differ from those reported in the financial statements because of temporary book-basis and tax-basis differences. Temporary differences are primarily the result of the treatment of wash sales for tax reporting purposes. The Fund recognizes interest and penalties related to income tax benefits, if any, in the Statement of Operations as an income tax expense. Distributions from net realized gains for book purposes may include short-term capital gains, which are included as ordinary income to shareholders for tax purposes. The Fund may utilize equalization accounting for tax purposes and designate earnings and profits, including net realized gains distributed to shareholders on redemption of shares, as part of the dividends paid deduction for income tax purposes. |
| | |
| | Due to inherent differences in the recognition of income, expenses, and realized gains/losses under GAAP and federal income tax regulations, permanent differences between book and tax basis for reporting are identified and appropriately reclassified in the Statement of Assets and Liabilities, as needed. The adjustments for fiscal year 2022 are as follows: |
| | Total Distributable | | |
| | Earnings | Capital Stock | |
| | $(878,646) | $878,646 | |
| NOTES TO THE FINANCIAL STATEMENTS |
| c). | Accounting for Uncertainty in Income Taxes – The Fund has accounting policies regarding recognition and measurement of tax positions taken or expected to be taken on a tax return. The tax returns of the Fund for the prior three fiscal years are open for examination. The Fund has reviewed all open tax years in major tax jurisdictions and concluded that there is no impact on the Fund’s net assets and no tax liability resulting from unrecognized tax benefits relating to uncertain income tax positions taken or expected to be taken on a tax return. The Fund’s major tax jurisdictions are U.S. federal and Delaware. |
| | |
| d). | Income and Expenses – Dividend income is recognized on the ex-dividend date or as soon as information is available to the Fund. Interest income, which includes the amortization of premium and accretion of discount, is recognized on an accrual basis. Market discounts, original issue discounts, and market premiums on debt securities are accreted or amortized to interest income over the life of a security with a corresponding increase or decrease, as applicable, in the cost basis of such security using the yield-to-maturity method or, where applicable, the first call date of the security. Other non-cash dividends are recognized as investment income at the fair value of the property received. The Fund is charged for those expenses that are directly attributable to its portfolio, such as advisory, administration, and certain shareholder service fees. Income, expenses (other than expenses attributable to a specific class), and realized and unrealized gains/losses on investments are allocated to each class of shares based on such class’s net assets. |
| | |
| e). | Distributions to Shareholders – Dividends from net investment income for the Fund, if any, are declared and paid annually, usually in December. Distributions of net realized capital gains, if any, are declared and paid annually, usually in December. |
| | |
| f). | Security Transactions – Investment and shareholder transactions are recorded on the trade date. The Fund determines the realized gain/loss from an investment transaction by comparing the original cost of the security lot sold with the net sale proceeds. Discounts and premiums on securities purchased are accreted or amortized, respectively, over the life of each such security. |
| | |
| g). | Use of Estimates – Preparing financial statements in accordance with GAAP requires management to make estimates and assumptions that affect the reported amounts of assets and liabilities and disclosure of contingent assets and liabilities at the date of the financial statements, as well as the reported change in net assets during the reporting period. Actual results could differ from those estimates. |
| | |
| h). | Share Valuation – The net asset value (“NAV”) per share of the Fund is calculated by dividing (i) the total value of the securities held by the Fund, plus cash and other assets, minus all liabilities (including estimated accrued expenses) by (ii) the total number of Fund shares outstanding, rounded to the nearest $0.01. Fund shares are not priced on days the New York Stock Exchange is closed for trading. The offering and redemption price per share for the Fund is equal to the Fund’s NAV per share. |
| | |
| i). | Illiquid Securities – Pursuant to Rule 22e-4 under the 1940 Act, the Fund has adopted a Liquidity Risk Management Program (the “Liquidity Program”). The Liquidity Program requires, among other things, that the Fund limit its illiquid investments to no more than 15% of its net assets. An illiquid investment is any investment that the Fund reasonably expects cannot be sold or disposed of by the Fund in current market conditions in seven calendar days or less without the sale or disposition significantly changing the market value of the investment. |
| | |
| j). | Recent Accounting Pronouncements and Regulatory Updates – In October 2020, the Securities and Exchange Commission (“SEC”) adopted new regulations governing |
| HENNESSY FUNDS | 1-800-966-4354 | |
| | the use of derivatives by registered investment companies (“Rule 18f-4”). Rule 18f-4 imposes limits on the amount of derivatives a fund can enter into, eliminates the asset segregation framework currently used by funds to comply with Section 18 of the 1940 Act, and requires funds whose use of derivatives is greater than a limited specified amount to establish and maintain a comprehensive derivatives risk management program and appoint a derivatives risk manager. The Fund has adopted procedures in accordance with Rule 18f-4. |
| | |
| | In December 2020, the SEC adopted a new rule providing a framework for fund valuation practices (“Rule 2a-5”). Rule 2a-5 establishes requirements for determining fair value in good faith for purposes of the 1940 Act. Rule 2a-5 permits fund boards to designate certain parties to perform fair value determinations, subject to board oversight and certain other conditions. Rule 2a-5 also defines when market quotations are “readily available” for purposes of the 1940 Act and the threshold for determining whether a fund must fair value a security. In connection with Rule 2a-5, the SEC also adopted related recordkeeping requirements and is rescinding previously issued guidance, including with respect to the role of a board in determining fair value and the accounting and auditing of fund investments. The Fund has adopted procedures in accordance with Rule 2a-5. |
| | |
| | In March 2020, FASB issued Accounting Standards Update 2020 04, Reference Rate Reform: Facilitation of the Effects of Reference Rate Reform on Financial Reporting. The main objective of the new guidance was to provide relief to companies that would be impacted by the expected change in benchmark interest rates at the end of 2021, when participating banks would no longer be required to submit London Interbank Offered Rate (“LIBOR”) quotes by the UK Financial Conduct Authority. The new guidance allows companies to account for contract modifications as a continuance of the existing contract without additional analysis, provided that the only change to existing contracts is a change to an approved benchmark interest rate. In addition, derivative contracts that qualified for hedge accounting prior to contract modification will be allowed to continue to receive such treatment even if critical terms change due to a change in the benchmark interest rate. For new and existing contracts, the Fund may elect to apply the amendments as of March 12, 2020 through December 31, 2022. See Note 9 for more information. |
3). SECURITIES VALUATION
The Fund follows its valuation policies and procedures in determining its NAV and, in preparing these financial statements, the fair value accounting standards that establish an authoritative definition of fair value and set out a hierarchy for measuring fair value. These standards require additional disclosures about the various inputs and valuation techniques used to develop the measurements of fair value and a discussion of changes in valuation techniques and related inputs during the period. These inputs are summarized in the three broad levels listed below:
| | Level 1 – | Unadjusted, quoted prices in active markets for identical instruments that the Fund has the ability to access at the date of measurement. |
| | | |
| | Level 2 – | Other significant observable inputs (including, but not limited to, quoted prices in active markets for similar instruments, quoted prices in markets that are not active for identical or similar instruments, and model-derived valuations in which all significant inputs and significant value drivers are observable in active markets, such as interest rates, prepayment speeds, credit risk curves, default rates, and similar data). |
| NOTES TO THE FINANCIAL STATEMENTS |
| | Level 3 – | Significant unobservable inputs (including the Fund’s own assumptions about what market participants would use to price the asset or liability based on the best available information) when observable inputs are unavailable. |
The following is a description of the valuation techniques applied to the Fund’s major categories of assets and liabilities on a recurring basis:
| | Equity Securities – Equity securities, including common stocks, preferred stocks, foreign-issued common stocks, exchange-traded funds, closed-end mutual funds, partnerships, rights, and real estate investment trusts, that are traded on a securities exchange for which a last-quoted sales price is readily available generally are valued at the last sales price as reported by the primary exchange on which the securities are listed. Securities listed on The Nasdaq Stock Market (“Nasdaq”) generally are valued at the Nasdaq Official Closing Price, which may differ from the last sales price reported. Securities traded on a securities exchange for which a last-quoted sales price is not readily available generally are valued at the mean between the bid and ask prices. To the extent these securities are actively traded and valuation adjustments are not applied, they are classified in Level 1 of the fair value hierarchy. Securities traded on foreign exchanges generally are not valued at the same time the Fund calculates its NAV because most foreign markets close well before such time. The earlier close of most foreign markets gives rise to the possibility that significant events, including broad market moves, may have occurred in the interim. In certain circumstances, it may be determined that a foreign security needs to be fair valued because it appears that the value of the security might have been materially affected by events occurring after the close of the market in which the security is principally traded, but before the time the Fund calculates its NAV, such as by a development that affects an entire market or region (e.g., a weather-related event) or a potentially global development (e.g., a terrorist attack that may be expected to have an effect on investor expectations worldwide). |
| | |
| | Registered Investment Companies – Investments in open-end registered investment companies, commonly referred to as mutual funds, generally are priced at the ending NAV provided by the applicable mutual fund’s service agent and are classified in Level 1 of the fair value hierarchy. |
| | |
| | Debt Securities – Debt securities, including corporate bonds, asset-backed securities, mortgage-backed securities, municipal bonds, U.S. Treasuries, and U.S. government agency issues, are generally valued at market on the basis of valuations furnished by an independent pricing service that utilizes both dealer-supplied valuations and formula-based techniques. The pricing service may consider recently executed transactions in securities of the issuer or comparable issuers, market price quotations (where observable), bond spreads, and fundamental data relating to the issuer. In addition, the model may incorporate observable market data, such as reported sales of similar securities, broker quotes, yields, bids, offers, and reference data. Certain securities are valued primarily using dealer quotations. These securities are generally classified in Level 2 of the fair value hierarchy. |
| | |
| | Short-Term Securities – Short-term equity investments, including money market funds, are valued in the manner specified above for equity securities. Short-term debt investments with an original term to maturity of 60 days or less are valued at amortized cost, which approximates fair market value. If the original term to maturity of a short-term debt investment exceeds 60 days, then the values as of the 61st day prior to maturity are amortized. Amortized cost is not used if its use would |
| HENNESSY FUNDS | 1-800-966-4354 | |
| | be inappropriate due to credit or other impairments of the issuer, in which case the security’s fair value would be determined as described below. Short-term securities are generally classified in Level 1 or Level 2 of the fair value hierarchy depending on the inputs used and market activity levels for specific securities. |
The Board of Trustees of the Fund (the “Board”) has adopted fair value pricing procedures that are followed when a price for a security is not readily available or if a significant event has occurred that indicates the closing price of a security no longer represents the true value of that security. Fair value pricing determinations are made in good faith in accordance with these procedures. There are numerous criteria considered in determining a fair value of a security, such as the trading volume of a security and markets, the values of other similar securities, and news events with direct bearing on a security or markets. Fair value pricing results in an estimated price for a security that reflects the amount the Fund might reasonably expect to receive in a current sale. Depending on the relative significance of the valuation inputs, these securities may be classified in either Level 2 or Level 3 of the fair value hierarchy.
The fair value of foreign securities may be determined with the assistance of a pricing service using correlations between the movement of prices of such securities and indices of domestic securities and other appropriate indicators, such as closing market prices of relevant American Depositary Receipts or futures contracts. Using fair value pricing means that the Fund’s NAV reflects the affected portfolio securities’ values as determined by the Board or its designee, pursuant to the fair value pricing procedures adopted by the Board, instead of being determined by the market. Using a fair value pricing methodology to price a foreign security may result in a value that is different from such foreign security’s most recent closing price and from the value used by other investment companies to calculate their NAVs. Such securities are generally classified in Level 2 of the fair value hierarchy. Because the Fund may invest in foreign securities, the value of the Fund’s portfolio securities may change on days when a shareholder is unable to purchase or redeem Fund shares.
The Board has delegated day-to-day valuation matters to the Valuation and Liquidity Committee comprising representatives from Hennessy Advisors, Inc., the Fund’s investment advisor (the “Advisor”). The function of the Valuation and Liquidity Committee, among other things, is to value securities where current and reliable market quotations are not readily available. All actions taken by the Valuation and Liquidity Committee are reviewed by the Board.
The Fund has performed an analysis of all existing investments to determine the significance and character of all inputs to their fair value determinations. Various inputs are used to determine the value of the Fund’s investments. The inputs or methodology used for valuing securities are not necessarily an indication of the risk associated with investing in those securities. Details related to the fair value hierarchy of the Fund’s securities as of October 31, 2022, are included in the Schedule of Investments.
4). INVESTMENT TRANSACTIONS
Purchases and sales of investment securities (excluding government and short-term investments) for the Fund during fiscal year 2022 were $43,716,494 and $49,299,093, respectively.
There were no purchases or sales/maturities of long-term U.S. government securities for the Fund during fiscal year 2022.
| NOTES TO THE FINANCIAL STATEMENTS |
5). INVESTMENT ADVISORY FEE AND OTHER TRANSACTIONS WITH AFFILIATES
The Advisor provides the Fund with investment advisory services under an Investment Advisory Agreement. The Advisor furnishes all investment advice, office space, and facilities and most of the personnel needed by the Fund. As compensation for its services, the Advisor is entitled to a monthly fee from the Fund. The fee is based on the average daily net assets of the Fund at an annual rate of 0.90%. The net investment advisory fees expensed by the Fund during fiscal year 2022 are included in the Statement of Operations.
The Board has approved a Shareholder Servicing Agreement for Investor Class shares of the Fund, which compensates the Advisor for the non-investment advisory services it provides to the Fund. The Shareholder Servicing Agreement provides for a monthly fee paid to the Advisor at an annual rate of 0.10% of the average daily net assets of the Fund attributable to Investor Class shares. The shareholder service fees expensed by the Fund during fiscal year 2022 are included in the Statement of Operations.
The Fund has adopted a plan pursuant to Rule 12b-1 under the Investment Company Act of 1940, as amended, that authorizes payments in connection with the distribution of Fund shares at an annual rate of up to 0.25% of the Fund’s average daily net assets attributable to Investor Class shares. Even though the authorized rate is up to 0.25%, the Fund is currently only using up to 0.15% of its average daily net assets attributable to Investor Class shares for such purpose. Amounts paid under the plan may be spent on any activities or expenses primarily intended to result in the sale of shares, including, but not limited to, advertising, shareholder account servicing, printing and mailing of prospectuses to other than current shareholders, printing and mailing of sales literature, and compensation for sales and marketing activities or to financial institutions and others, such as dealers and distributors. The distribution fees expensed by the Fund during fiscal year 2022 are included in the Statement of Operations.
The Fund has entered into agreements with various brokers, dealers, and financial intermediaries in connection with the sale of Fund shares. The agreements provide for periodic payments of sub-transfer agent expenses by the Fund to the brokers, dealers, and financial intermediaries for providing certain shareholder maintenance services. These shareholder services include the pre-processing and quality control of new accounts, shareholder correspondence, answering customer inquiries regarding account status, and facilitating shareholder telephone transactions. The sub-transfer agent fees expensed by the Fund during fiscal year 2022 are included in the Statement of Operations.
U.S. Bancorp Fund Services, LLC, d/b/a U.S. Bank Global Fund Services (“Fund Services”) provides the Fund with administrative, accounting, and transfer agent services. As administrator, Fund Services is responsible for activities such as (i) preparing various federal and state regulatory filings, reports, and returns for the Fund, (ii) preparing reports and materials to be supplied to the Board, (iii) monitoring the activities of the Fund’s custodian, transfer agent, and accountants, and (iv) coordinating the preparation and payment of the Fund’s expenses and reviewing the Fund’s expense accruals. U.S. Bank N.A., an affiliate of Fund Services, serves as the Fund’s custodian. The servicing agreements between the Trust, Fund Services, and U.S. Bank N.A. contain a fee schedule that is inclusive of administrative, accounting, custody, and transfer agent fees. The administrative, accounting, custody, and transfer agent fees expensed by the Fund during fiscal year 2022 are included in the Statement of Operations.
Quasar Distributors, LLC, a wholly owned broker-dealer subsidiary of Foreside Financial Group, LLC, acts as the Fund’s principal underwriter in a continuous public offering of Fund shares.
| HENNESSY FUNDS | 1-800-966-4354 | |
The officers of the Fund are affiliated with the Advisor. With the exception of the Chief Compliance Officer and, for a portion of the fiscal year, the Senior Compliance Officer, such officers receive no compensation from the Fund for serving in their respective roles. The Fund, along with the other funds in the Hennessy Funds family (collectively, the “Hennessy Funds”), makes reimbursement payments on an equal basis to the Advisor for a portion of the salary and benefits associated with the office of the Chief Compliance Officer and, for a portion of the fiscal year, for all of the salary and benefits associated with the office of the Senior Compliance Officer. The compliance fees expensed by the Fund during fiscal year 2022 for reimbursement payments to the Advisor are included in the Statement of Operations.
6). GUARANTEES AND INDEMNIFICATIONS
Under the Hennessy Funds’ organizational documents, their officers and trustees are indemnified by the Hennessy Funds against certain liabilities arising out of the performance of their duties to the Hennessy Funds. Additionally, in the normal course of business, the Hennessy Funds enter into contracts with service providers that contain general indemnification clauses. The Fund’s maximum exposure under these arrangements is unknown as this would involve future claims that may be made against the Fund that have not yet occurred. Currently, the Fund expects the risk of loss to be remote.
7). LINE OF CREDIT
The Fund has an uncommitted line of credit with the other Hennessy Funds in the amount of the lesser of (i) $100,000,000 or (ii) 33.33% of each Hennessy Fund’s net assets, or 30% for the Hennessy Gas Utility Fund, the Hennessy Japan Fund, and the Hennessy Japan Small Cap Fund and 10% for the Hennessy Balanced Fund. The line of credit is intended to provide any necessary short-term financing in connection with shareholder redemptions, subject to certain restrictions. The credit facility is with the Hennessy Funds’ custodian bank, U.S. Bank N.A. Borrowings under this arrangement bear interest at the bank’s prime rate and are secured by all of the Fund’s assets (as to its own borrowings only). During fiscal year 2022, the Fund had an outstanding average daily balance and a weighted average interest rate of $20,181 and 3.50%, respectively. The interest expensed by the Fund during fiscal year 2022 is included in the Statement of Operations. The maximum amount outstanding for the Fund during fiscal year 2022 was $1,896,000. As of October 31, 2022, the Fund did not have any borrowings outstanding under the line of credit.
8). FEDERAL TAX INFORMATION
As of October 31, 2022, the components of accumulated earnings (losses) for income tax purposes were as follows:
| | | Investments | |
| Cost of investments for tax purposes | | $ | 42,121,163 | |
| Gross tax unrealized appreciation | | $ | 8,915,170 | |
| Gross tax unrealized depreciation | | | (4,300,458 | ) |
| Net tax unrealized appreciation/(depreciation) | | $ | 4,614,712 | |
| Undistributed ordinary income | | $ | 127,166 | |
| Undistributed long-term capital gains | | | 2,738,432 | |
| Total distributable earnings | | $ | 2,865,598 | |
| Other accumulated gain/(loss) | | $ | — | |
| Total accumulated gain/(loss) | | $ | 7,480,310 | |
| NOTES TO THE FINANCIAL STATEMENTS |
The difference between book-basis unrealized appreciation/depreciation and tax-basis unrealized appreciation/depreciation (as shown above) is attributable primarily to wash sales.
As of October 31, 2022, the Fund had no tax-basis capital losses to offset future capital gains.
As of October 31, 2022, the Fund did not defer, on a tax basis, any late-year ordinary losses. Late-year ordinary losses are net ordinary losses incurred after December 31, 2021, but within the taxable year, that are deemed to arise on the first day of the Fund’s next taxable year.
During fiscal years 2022 and 2021, the tax character of distributions paid by the Fund was as follows:
| | | Year Ended | | | Year Ended | |
| | | October 31, 2022 | | | October 31, 2021 | |
Ordinary income(1) | | $ | — | | | $ | — | |
| Long-term capital gains | | | 3,485,642 | | | | — | |
| Total distributions | | $ | 3,485,642 | | | $ | — | |
(1) Ordinary income includes short-term capital gains.
9). LIBOR TRANSITION
The Fund invests in financial instruments with payment obligations, financing terms, hedging strategies, or investment values based on, among other floating rates, LIBOR. Determined by the ICE Benchmark Administration, LIBOR is an average interest rate that banks charge one another for the use of short-term money. In 2017, the United Kingdom’s Financial Conduct Authority (the “FCA”), which regulates LIBOR, announced plans to phase out the use of LIBOR by the end of 2021. Most LIBOR settings are no longer being published as of December 31, 2021, and the FCA and ICE Benchmark Administrator have announced that a majority of U.S. dollar LIBOR settings will cease publication after June 30, 2023. The U.S. Federal Reserve has begun publishing the Secured Overnight Financing Rate (SOFR), which is intended to replace the U.S. dollar LIBOR. Other regulators and industry groups around the world have announced or begun publishing proposed alternative reference rates for other currencies, but global consensus is lacking, and the process for amending many existing contracts or instruments to transition away from LIBOR remains unclear. Uncertainty related to the liquidity impact of the change in reference rates and how to appropriately adjust these rates at the time of transition may lead to increased volatility and illiquidity in markets tied to LIBOR, reduce the value of LIBOR-related instruments, and reduce the effectiveness of hedging strategies, which could adversely affect the Fund’s performance. Moreover, the risks associated with this discontinuation and transition could be exacerbated if the work necessary to effect an orderly transition to an alternative reference rate is not completed in a timely manner. Accordingly, it is difficult to predict the full impact of the transition away from LIBOR on the Fund until new reference rates and fallbacks for both legacy and new instruments and contracts are commercially accepted and market practices become settled.
10). MARKET DISRUPTION AND GEOPOLITICAL RISKS
Certain local, regional, or global events such as wars, terrorism, pandemics or other public health mattes, and other geopolitical events could have a significant impact on securities markets generally or individual securities or instruments. For example,
| HENNESSY FUNDS | 1-800-966-4354 | |
following Russia’s invasion of Ukraine, the President of the United States signed an Executive Order in February 2022 prohibiting U.S. persons from entering transactions with the Central Bank of Russia. Similarly, in June 2021, the President of the United States signed an Executive Order affirming and expanding the U.S. policy prohibiting U.S. persons from purchasing or investing in publicly-traded securities of companies identified by the U.S. Government as “Chinese Military-Industrial Complex Companies.” The list of such companies can change from time to time and the Advisor may be forced to hold securities it desires to sell or to sell securities it desires to buy, or the Advisor may not be able to participate in an investment it otherwise believes is attractive. The occurrence and duration of these types of events are hard to predict and could adversely affect the Fund’s performance.
11). EVENTS SUBSEQUENT TO YEAR END
Management has evaluated the Fund’s related events and transactions that occurred subsequent to October 31, 2022, through the date of issuance of the Fund’s financial statements. Other than as disclosed below, management has determined that there were no subsequent events requiring recognition or disclosure in the financial statements.
On December 8, 2022, capital gains were declared and paid to shareholders of record on December 7, 2022, as follows:
| | | Long-term | |
| | Investor Class | 1.52629 | |
| | Institutional Class | 1.54542 | |
| NOTES TO THE FINANCIAL STATEMENTS/REPORT OF INDEPENDENT REGISTERED PUBLIC ACCOUNTING FIRM |
Report of Independent Registered Public
Accounting Firm
To the Board of Trustees of Hennessy Funds Trust
and the shareholders of the Hennessy Large Cap Financial Fund
Novato, CA
Opinion on the Financial Statements
We have audited the accompanying statement of assets and liabilities of the Hennessy Large Cap Financial Fund (the “Fund”), a series of Hennessy Funds Trust, including the schedule of investments, as of October 31, 2022, the related statement of operations for the year then ended, the statements of changes in net assets for each of the two years in the period then ended, financial highlights for each of the five years in the period then ended, and the related notes (collectively referred to as the “financial statements”). In our opinion, the financial statements present fairly, in all material respects, the financial position of the Fund as of October 31, 2022, the results of its operations for the year then ended, the changes in its net assets for each of the two years in the period then ended, and the financial highlights for each of the five years in the period then ended, in conformity with accounting principles generally accepted in the United States of America.
Basis for Opinion
These financial statements are the responsibility of the Fund’s management. Our responsibility is to express an opinion on the Fund’s financial statements based on our audits. We are a public accounting firm registered with the Public Company Accounting Oversight Board (United States) (“PCAOB”) and are required to be independent with respect to the Fund in accordance with the U.S. federal securities laws and the applicable rules and regulations of the Securities and Exchange Commission and the PCAOB. We have served as the auditor of one or more of the funds in the Trust since 2002.
We conducted our audits in accordance with the standards of the PCAOB. Those standards require that we plan and perform the audit to obtain reasonable assurance about whether the financial statements are free of material misstatement, whether due to error or fraud. The Fund is not required to have, nor were we engaged to perform, an audit of its internal control over financial reporting. As part of our audits we are required to obtain an understanding of internal control over financial reporting, but not for the purpose of expressing an opinion on the effectiveness of the Fund’s internal control over financial reporting. Accordingly, we express no such opinion.
Our audits included performing procedures to assess the risks of material misstatement of the financial statements, whether due to error or fraud, and performing procedures that respond to those risks. Such procedures included examining, on a test basis, evidence regarding the amounts and disclosures in the financial statements. Our audits also included evaluating the accounting principles used and significant estimates made by management, as well as evaluating the overall presentation of the financial statements. Our procedures included confirmation of securities owned as of October 31, 2022 by correspondence with the custodian and brokers; when replies were not received from brokers, we performed other auditing procedures. We believe that our audits provide a reasonable basis for our opinion.
| | |
| | TAIT, WELLER & BAKER LLP |
Philadelphia, Pennsylvania
December 22, 2022
| HENNESSY FUNDS | 1-800-966-4354 | |
Trustees and Officers of the Fund (Unaudited)
The business and affairs of the Funds are managed under the direction of the Board of Trustees of the Trust, and the Board of Trustees elects the officers of the Trust. From time to time, the Board of Trustees also has appointed advisers to the Board of Trustees (“Advisers”) with the intention of having qualified individuals serve in an advisory capacity to garner experience in the mutual fund and asset management industry and be considered as potential Trustees in the future. There are currently two Advisers, Brian Alexander and Doug Franklin. As Advisers, Mr. Alexander and Mr. Franklin attend meetings of the Board of Trustees and act as non-voting participants. Information pertaining to the Trustees, Advisers, and the officers of the Trust is set forth below. The Trustees and officers serve until their successors are duly elected and qualified or until their earlier death, resignation, or removal. Each Trustee oversees all 16 Hennessy Funds. Unless otherwise indicated, the address of all persons listed below is 7250 Redwood Boulevard, Suite 200, Novato, CA 94945. The Fund’s Statement of Additional Information includes more information about the persons listed below and is available without charge by calling 1-800-966-4354 or by visiting www.hennessyfunds.com.
| | | | Other |
| | | | Directorships |
| | | | Held Outside |
| Name, Age, | | | of Fund |
| and Position Held | Start Date | Principal Occupation(s) | Complex During |
with the Trust | of Service | During Past Five Years | Past Five Years |
| Disinterested Trustees and Advisers | | | |
| | | | |
| J. Dennis DeSousa | January 1996 | Mr. DeSousa is a real estate investor. | None. |
| 86 | | | |
| Trustee | | | |
| | | | |
| Robert T. Doyle | January 1996 | Mr. Doyle is retired. He served as the | None. |
| 75 | | Sheriff of Marin County, California | |
| Trustee | | from 1996 – June 2022. | |
| | | | |
| Claire Garvie | December 2015 | Ms. Garvie is a founder of Kiosk and | None. |
| 48 | as an Adviser | has served as its Chief Operating | |
| Trustee | to the Board | Officer since 2004. Kiosk is a full- | |
| | and | service marketing agency with | |
| | December 2021 | offices in the San Francisco Bay Area | |
| | as a Trustee | and Liverpool, UK and staff across | |
| | | nine states in the U.S. | |
| | | | |
| Gerald P. Richardson | May 2004 | Mr. Richardson is an independent | None. |
| 77 | | consultant in the securities industry. | |
| Trustee | | | |
| TRUSTEES AND OFFICERS OF THE FUND |
| | | | Other |
| | | | Directorships |
| | | | Held Outside |
| Name, Age, | | | of Fund |
| and Position Held | Start Date | Principal Occupation(s) | Complex During |
with the Trust | of Service | During Past Five Years | Past Five Years |
| Brian Alexander | March 2015 | Mr. Alexander has worked for the | None. |
| 41 | | Sutter Health organization since | |
| Adviser to the Board | | 2011 in various positions. He has | |
| | | served as the Chief Executive Officer | |
| | | of the North Valley Hospital Area | |
| | | since 2021. From 2018 to 2021, he | |
| | | served as the Chief Executive Officer | |
| | | of Sutter Roseville Medical Center. | |
| | | From 2016 through 2018, he served | |
| | | as the Vice President of Strategy for | |
| | | the Sutter Health Valley Area, which | |
| | | includes 11 hospitals, 13 ambulatory | |
| | | surgery centers, 16,000 employees, | |
| | | and 1,900 physicians. | |
| | | | |
| Doug Franklin | March 2016 | Mr. Franklin is a retired insurance | None. |
| 58 | | industry executive. From 1987 | |
| Adviser to the Board | | through 2015, he was employed by | |
| | | the Allianz-Fireman’s Fund Insurance | |
| | | Company in various positions, | |
| | | including as its Chief Actuary and | |
| | | Chief Risk Officer. | |
| | | | |
Interested Trustee(1) | | | |
| | | | |
| Neil J. Hennessy | January 1996 as | Mr. Hennessy has been employed | Hennessy |
| 66 | a Trustee and | by Hennessy Advisors, Inc. since | Advisors, Inc. |
| Chairman of the Board, | June 2008 as | 1989 and currently serves as its | |
| Chief Market Strategist, | an officer | Chairman and Chief Executive Officer. | |
| Portfolio Manager, | | | |
| and President | | | |
| | | | |
| Name, Age, | | | |
| and Position Held | Start Date | Principal Occupation(s) | |
with the Trust | of Service | During Past Five Years | |
| Officers | | | |
| | | | |
| Teresa M. Nilsen | January 1996 | Ms. Nilsen has been employed by Hennessy Advisors, Inc. | |
| 56 | | since 1989 and currently serves as its President, Chief | |
| Executive Vice President | | Operating Officer, and Secretary. | |
| and Treasurer | | | |
| | | | |
| Daniel B. Steadman | March 2000 | Mr. Steadman has been employed by Hennessy Advisors, Inc. | |
| 66 | | since 2000 and currently serves as its Executive Vice President. | |
| Executive Vice President’ | | | |
| and Secretary | | | |
| | | | |
| Brian Carlson | December 2013 | Mr. Carlson has been employed by Hennessy Advisors, Inc. | |
| 50 | | since December 2013 and currently serves as its Chief | |
| Senior Vice President | | Compliance Officer and Senior Vice President. | |
| and Head of Distribution | | | |
| HENNESSY FUNDS | 1-800-966-4354 | |
| Name, Age, | | |
| and Position Held | Start Date | Principal Occupation(s) |
with the Trust | of Service | During Past Five Years |
Jennifer Cheskiewicz(2) | June 2013 | Ms. Cheskiewicz has been employed by Hennessy Advisors, Inc. |
| 45 | | as its General Counsel since June 2013. |
| Senior Vice President and | | |
| Chief Compliance Officer | | |
| | | |
David Ellison(3) | October 2012 | Mr. Ellison has been employed by Hennessy Advisors, Inc. since |
| 64 | | October 2012. He has served as a Portfolio Manager of the |
| Senior Vice President | | Hennessy Large Cap Financial Fund and the Hennessy Small |
| and Portfolio Manager | | Cap Financial Fund since their inception. Mr. Ellison also served |
| | | as a Portfolio Manager of the Hennessy Technology Fund from |
| | | its inception until February 2017. Mr. Ellison served as Director, |
| | | CIO, and President of FBR Fund Advisers, Inc. from December |
| | | 1999 to October 2012. |
| | | |
Ryan Kelley(4) | March 2013 | Mr. Kelley has been employed by Hennessy Advisors, Inc. since |
| 50 | | October 2012. He has served as Chief Investment Officer of the |
| Chief Investment Officer, | | Hennessy Funds since March 2021 and has served as a Portfolio |
| Senior Vice President, | | Manager of the Hennessy Gas Utility Fund, the Hennessy Large |
| and Portfolio Manager | | Cap Financial Fund, and the Hennessy Small Cap Financial Fund |
| | | since October 2014. Mr. Kelley served as Co-Portfolio Manager |
| | | of these same funds from March 2013 through September |
| | | 2014 and as a Portfolio Analyst for the Hennessy Funds from |
| | | October 2012 through February 2013. He has also served as a |
| | | Portfolio Manager of the Hennessy Cornerstone Growth Fund, |
| | | the Hennessy Cornerstone Mid Cap 30 Fund, the Hennessy |
| | | Cornerstone Large Growth Fund, and the Hennessy |
| | | Cornerstone Value Fund since February 2017 and as a Portfolio |
| | | Manager of the Hennessy Total Return Fund, the Hennessy |
| | | Balanced Fund, and the Hennessy Technology Fund since May |
| | | 2018. He served as Co-Portfolio Manager of the Hennessy |
| | | Technology Fund from February 2017 until May 2018. Mr. Kelley |
| | | served as Portfolio Manager of FBR Fund Advisers, Inc. from |
| | | January 2008 to October 2012. |
| | | |
L. Joshua Wein(4) | September 2018 | Mr. Wein has been employed by Hennessy Advisors, Inc. since |
| 49 | | 2018. He has served as Co-Portfolio Manager of the Hennessy |
| Vice President and | | Cornerstone Growth Fund, the Hennessy Cornerstone |
| Co-Portfolio Manager | | Mid Cap 30 Fund, the Hennessy Cornerstone Large Growth |
| | | Fund, the Hennessy Cornerstone Value Fund, Hennessy Total |
| | | Return Fund, the Hennessy Balanced Fund, the Hennessy Gas |
| | | Utility Fund, and the Hennessy Technology Fund since February |
| | | 2019. He served as a Senior Analyst of these same funds from |
| | | September 2018 through February 2019. Mr. Wein served as |
| | | Director of Alternative Investments and Co-Portfolio Manager |
| | | at Sterling Capital Management from 2008 to 2018. |
_______________
(1) | Mr. Hennessy is considered an “interested person,” as defined in the Investment Company Act of 1940, as amended, because he is an officer of the Trust. |
(2) | The address of this officer is 4800 Bee Caves Road, Suite 100, Austin, TX 78746. |
(3) | The address of this officer is 101 Federal Street, Suite 1615B, Boston, MA 02110. |
(4) | The address of this officer is 1340 Environ Way, Chapel Hill, NC 27517. |
| TRUSTEES AND OFFICERS OF THE FUND |
(This Page Intentionally Left Blank.)
| HENNESSY FUNDS | 1-800-966-4354 | |
Expense Example (Unaudited)
October 31, 2022
As a shareholder of the Fund, you incur ongoing costs, including management fees, service fees, and other Fund expenses. This Example is intended to help you understand your ongoing costs (in dollars) of investing in the Fund and to compare these costs with the ongoing costs of investing in other mutual funds. The Example is based on an investment of $1,000 invested at the beginning of the period and held for the entire period from May 1, 2022, through October 31, 2022.
Actual Expenses
In the table below, the first line under each of the “Investor Class” and “Institutional Class” headings provides information about actual account values and actual expenses for each share class. You may use this information, together with the amount you invested, to estimate the expenses that you paid over the period. Simply divide your account value by $1,000 (for example, an $8,600 account value divided by $1,000 = 8.6), then multiply the result by the number in the first line under the heading “Expenses Paid During Period” to estimate the expenses you paid on your account during this period. Although the Fund charges no sales loads or transaction fees, you will be assessed fees for outgoing wire transfers, returned checks, and stop payment orders at prevailing rates charged by U.S. Bank Global Fund Services, the Fund’s transfer agent. If you request that a redemption be made by wire transfer, the Fund’s transfer agent charges a $15 fee. IRAs are charged a $15 annual maintenance fee (up to $30 maximum per shareholder for shareholders with multiple IRAs). The examples below include, but are not limited to, management, shareholder servicing, accounting, custody, and transfer agent fees. However, the examples below do not include portfolio trading commissions and related expenses.
Hypothetical Example for Comparison Purposes
In the table below, the second line under each of the “Investor Class” and “Institutional Class” headings provides information about hypothetical account values and hypothetical expenses based on the Fund’s actual expense ratio for each share class and an assumed rate of return of 5% per year before expenses, which is not the Fund’s actual return for such share class. The hypothetical account values and expenses may not be used to estimate the actual ending account balance or expenses you paid for the period. You may use this information to compare the ongoing costs of investing in the Fund and other funds. To do so, compare these 5% hypothetical examples with the 5% hypothetical examples that appear in the shareholder reports of the other funds. Please note that the expenses shown in the table are meant to highlight your ongoing costs only. Therefore, the second lines under “Investor Class” and “Institutional Class” are useful in comparing ongoing costs only and will not help you determine the relative total costs of owning different funds.
| | | | Expenses Paid |
| | Beginning | Ending | During Period(1) |
| | Account Value | Account Value | May 1, 2022 – |
| | May 1, 2022 | October 31, 2022 | October 31, 2022 |
| Investor Class | | | |
| Actual | $1,000.00 | $ 977.50 | $8.52 |
| Hypothetical (5% return before expenses) | $1,000.00 | $1,016.59 | $8.69 |
| | | | |
| Institutional Class | | | |
| Actual | $1,000.00 | $ 979.30 | $7.03 |
| Hypothetical (5% return before expenses) | $1,000.00 | $1,018.10 | $7.17 |
(1) | Expenses are equal to the Fund’s annualized expense ratio of 1.71% for Investor Class shares or 1.41% for Institutional Class shares, as applicable, multiplied by the average account value over the period, multiplied by 184/365 days (to reflect the half-year period). |
| HENNESSY FUNDS | 1-800-966-4354 | |
How to Obtain a Copy of the Fund’s Proxy
Voting Policy and Proxy Voting Records
A description of the policies and procedures the Fund uses to determine how to vote proxies relating to portfolio securities is available without charge (1) by calling 1-800-966-4354, (2) on the Hennessy Funds’ website at www.hennessyfunds.com/proxy-voting/voting-policy, or (3) on the U.S. Securities and Exchange Commission’s (the “SEC”) website at www.sec.gov. The Fund’s proxy voting record is available without charge on both the Hennessy Funds’ website at www.hennessyfunds.com/proxy-voting/voting-record and the SEC’s website at www.sec.gov no later than August 31 for the prior 12 months ending June 30.
Availability of Quarterly Portfolio Schedule
The Fund files a complete schedule of portfolio holdings with the SEC for the first and third quarters of each fiscal year as an exhibit to its reports on Form N-PORT. The Fund’s Form N-PORT reports are available on the SEC’s website at www.sec.gov or on request by calling 1-800-966-4354.
Federal Tax Distribution Information (Unaudited)
For fiscal year 2022, certain dividends paid by the Fund may be subject to a maximum tax rate of 23.8%, as provided for by the Jobs and Growth Tax Relief Reconciliation Act of 2003. The percentage of dividends declared from ordinary income designated as qualified dividend income was 0.00%.
For corporate shareholders, the percent of ordinary income distributions that qualified for the corporate dividends received deduction for fiscal year 2022 was 0.00%.
The percentage of taxable ordinary income distributions that were designated as short-term capital gain distributions under Section 871(k)(2)(C) of the Internal Revenue Code of 1986, as amended, for the Fund was 0.00%.
Important Notice Regarding Delivery
of Shareholder Documents
To help keep the Fund’s costs as low as possible, we generally deliver a single copy of shareholder reports, proxy statements, and prospectuses to shareholders who share an address and have the same last name. This process does not apply to account statements. You may request an individual copy of a shareholder document at any time. If you would like to receive separate mailings of shareholder documents, please call U.S. Bank Global Fund Services at 1-800-261-6950 or 1-414-765-4124, and individual delivery will begin within 30 days of your request. If your account is held through a financial institution or other intermediary, please contact such intermediary directly to request individual delivery.
Electronic Delivery
As permitted by SEC regulations, the Fund’s shareholder reports are made available on a website, and unless you sign for eDelivery or elect to receive paper copies as detailed below, you will be notified by mail each time a report is posted and provided with a website link to access the report.
The Fund also offers shareholders the option to receive all notices, account statements, prospectuses, tax forms, and shareholder reports electronically. To sign up for eDelivery or change your delivery preference, please visit www.hennessyfunds.com/account.
To elect to receive paper copies of all future reports free of charge, please call U.S. Bank Global Fund Services at 800-261-6950 or 414-765-4124.
Subscribe to receive our team’s unique market and sector insights delivered to your inbox
www.hennessyfunds.com/subscribe
Follow us on social media
| PROXY VOTING — PRIVACY POLICY |
Liquidity Risk Management Program
In accordance with Rule 22e-4 under the Investment Company Act of 1940, as amended (the “Liquidity Rule”), we have adopted and implemented a liquidity risk management program (the “Liquidity Program”). The purpose of the Liquidity Program is to assess and manage the Fund’s liquidity risk, which is the risk that the Fund would not be able to meet requests to redeem Fund shares without significant dilution of the remaining shareholders’ interests in the Fund. The Board of Trustees of the Fund (the “Board”) designated a committee comprising representatives of Hennessy Advisors, Inc., the investment adviser to the Fund, as the administrator of the Liquidity Program (the “Program Administrator”).
The Program Administrator provided a written report regarding the Liquidity Program to the Board in advance of its meeting on June 1, 2022. The report covered the period from June 1, 2021, through May 31, 2022. The report addressed the operation of the Liquidity Program, assessed the adequacy and effectiveness of its implementation, and described any material changes to the Liquidity Program during the review period. The Trust’s chief compliance officer presented the report to the Board at the meeting and provided additional information regarding the Liquidity Program. The Board reviewed the Liquidity Program and considered, among other items, the following:
| | 1. | The Program Administrator reviewed daily historical net redemption activity during the review period and during prior periods with higher-than-average redemption activity and concluded that the Fund has historically been able to meet requests to redeem Fund shares without significant dilution to the Fund’s remaining shareholders, and the Program Administrator expects the Fund to be able to continue to do so in the future during both normal and reasonably foreseeable stressed conditions. |
| | | |
| | 2. | The Fund primarily holds assets that are highly liquid investments and is therefore not required to establish a highly liquid investment minimum for the Fund or adopt policies and procedures for responding to a highly liquid investment minimum shortfall. |
| | | |
| | 3. | The Program Administrator did not make any material changes to the Liquidity Program during the review period and was not recommending any changes to the Liquidity Program or the model inputs used to determine the liquidity classification of each security held by the Fund. |
| | | |
| | 4. | The Program Administrator concluded that the Liquidity Program was reasonably designed to assess and manage the Fund’s liquidity risk, complies with the requirements of the Liquidity Rule, and was operating as intended during the review period. |
Privacy Policy
We collect the following personal information about you:
| | 1. | Information we receive from you in applications or other forms, correspondence, or conversations, including, but not limited to, your name, address, phone number, social security number, assets, income, and date of birth; |
| | | |
| | 2. | Information about your transactions with us, our affiliates, or others, including, but not limited to, your account number and balance, payments history, parties to transactions, cost basis information, and other financial information; and |
| HENNESSY FUNDS | 1-800-966-4354 | |
| | 3. | Other personal information we collect from various sources, even if you have not entered into a prior transaction with us, including the following: |
| | | • | Name, alias, address, unique personal identifier, online identifier, IP address, email address, telephone number, account name, and other similar identifiers; |
| | | | |
| | | • | Age and marital status; |
| | | | |
| | | • | Commercial information, including records of products purchased; |
| | | | |
| | | • | Browsing history, search history, and information on interaction with our website; |
| | | | |
| | | • | Geolocation data; |
| | | | |
| | | • | Employment and employment history, educational history, financial information, and purchasing and consuming histories or tendencies; and |
| | | | |
| | | • | Inferences drawn from the above-listed information to create a profile about your preferences, characteristics, predispositions, and behavior. |
We collect this information directly from you, indirectly in the course of providing services to you, directly and indirectly from your activity on our website, from broker dealers, marketing agencies, and other third parties that interact with us in connection with the services we perform and products we offer, and from anonymized and aggregated consumer information.
We use this information to fulfill the reason you provided the information to us, to provide you with other relevant products that you request from us, to provide you with information about products that may interest you, to improve our website or present our website’s contents to you, and as otherwise described to you when collecting your personal information.
We do not disclose any personal information to unaffiliated third parties, except as permitted by law. We may disclose your personal information to our affiliates, vendors, and service providers for a business purpose. For example, we are permitted by law to disclose all of the information we collect, as described above, to our transfer agent to process your transactions. When disclosing your personal information to third parties, we enter into a contract with each third party describing the purpose of such disclosure and requiring that such personal information be kept confidential and not used for any purpose except to perform the services contracted or respond to regulatory or law enforcement requests.
Furthermore, we restrict access to your personal information to those persons who require such information to provide products or services to you. As a result, we do not provide a means for opting out of our limited sharing of your information. We maintain physical, electronic, and procedural safeguards that comply with federal standards to guard your personal information.
If you hold shares of the Funds through a financial intermediary, including, but not limited to, a broker-dealer, bank, or trust company, the privacy policy of your financial intermediary governs how your personal information is shared with unaffiliated third parties.
Supplemental Privacy Notice for Residents of California
The California Consumer Privacy Act of 2018 (the “CCPA”) provides you, as a California resident, with certain additional rights relating to your personal information.
Under the CCPA, you have the right to request that we disclose to you the categories of personal information we have collected about you over the past 12 months, the categories of sources of such information, our business purpose for collecting the information, the categories of third parties, if any, with whom we shared the information, and the specific information we have collected about you. You also have the right to request that we delete any of your personal information, and, unless an exception applies, we will delete such information upon receiving and confirming your request. To make a request, call us at 1-800-966-4354, email us at privacy@hennessyfunds.com, or go to www.hennessyfunds.com/contact. We will not discriminate against you for exercising your rights under the CCPA. Further, we will not collect additional categories of your personal information or use the personal information we collected for materially different, unrelated, or incompatible purposes without providing you notice.
| HENNESSY FUNDS | 1-800-966-4354 | |
(This Page Intentionally Left Blank.)
For information, questions, or assistance, please call
The Hennessy Funds
1-800-966-4354 or 1-415-899-1555
INVESTMENT ADVISOR
Hennessy Advisors, Inc.
7250 Redwood Boulevard, Suite 200
Novato, California 94945
ADMINISTRATOR,
TRANSFER AGENT,
DIVIDEND PAYING AGENT, &
SHAREHOLDER SERVICING AGENT
U.S. Bancorp Fund Services, LLC
d/b/a U.S. Bank Global Fund Services
P.O. Box 701
Milwaukee, Wisconsin 53201-0701
CUSTODIAN
U.S. Bank N.A.
Custody Operations
1555 North River Center Drive, Suite 302
Milwaukee, Wisconsin 53212
TRUSTEES
Neil J. Hennessy
Robert T. Doyle
J. Dennis DeSousa
Claire Garvie
Gerald P. Richardson
COUNSEL
Foley & Lardner LLP
777 East Wisconsin Avenue
Milwaukee, Wisconsin 53202-5306
INDEPENDENT REGISTERED
PUBLIC ACCOUNTING FIRM
Tait, Weller & Baker LLP
Two Liberty Place
50 South 16th Street, Suite 2900
Philadelphia, Pennsylvania 19102-2529
DISTRIBUTOR
Quasar Distributors, LLC
111 East Kilbourn Avenue, Suite 1250
Milwaukee, Wisconsin 53202
www.hennessyfunds.com | 800-966-4354
This report has been prepared for shareholders and may be distributed to
others only if preceded or accompanied by a current prospectus.
ANNUAL REPORT
OCTOBER 31, 2022
HENNESSY SMALL CAP FINANCIAL FUND
Investor Class HSFNX
Institutional Class HISFX
www.hennessyfunds.com | 1-800-966-4354
(This Page Intentionally Left Blank.)
Contents
| Letter to Shareholders | | 2 |
| Performance Overview | | 6 |
| Financial Statements | | |
| Schedule of Investments | | 9 |
| Statement of Assets and Liabilities | | 12 |
| Statement of Operations | | 13 |
| Statements of Changes in Net Assets | | 15 |
| Financial Highlights | | 16 |
| Notes to the Financial Statements | | 20 |
| Report of Independent Registered Public Accounting Firm | | 29 |
| Trustees and Officers of the Fund | | 30 |
| Expense Example | | 34 |
| Proxy Voting Policy and Proxy Voting Records | | 36 |
| Availability of Quarterly Portfolio Schedule | | 36 |
| Federal Tax Distribution Information | | 36 |
| Important Notice Regarding Delivery of Shareholder Documents | | 36 |
| Electronic Delivery | | 36 |
| Liquidity Risk Management Program | | 37 |
| Privacy Policy | | 37 |
| HENNESSY FUNDS | 1-800-966-4354 | |
December 2022
Dear Hennessy Funds Shareholder:
What a year it has been. By the close of the second trading day of 2022, we witnessed new all-time highs in both the S&P 500® Index and the Dow Jones Industrial Average, while the Nasdaq Composite Index hit its all-time high in November 2021. The market’s triumph was short lived, however. By the last day of our fiscal year on October 31, 2022, all three major indices were down significantly, with bleak year-to-date total returns of -8.42%, -17.70%, and -29.32% for the Dow, the S&P 500, and the Nasdaq, respectively. After almost 13 years of incredible resilience following the Financial Crisis of 2008, the equity markets have been shaken by stinging inflation, rapidly rising interest rates, soaring energy costs, and slowing economic growth teetering on recession. While many investors would like to forget 2022, we prefer to maintain perspective in this market downturn.
Time, time, time…. is on my side, yes, it is!
-Rolling Stones, 1964
We believe time is on our side… when it comes to investing. Experiencing negative market movements on any given day can seem disappointing. Downdrafts lasting a month can feel relentless. Almost a full year of negative returns with little respite along the way? That is downright painful. However, equities generally trend up and to the right. Over the past 100 calendar years, the Dow had an average annual total return of 10.25%. While we admit that long-term returns like these make it easy to be a “consummate bull,” market bulls have been right over the long-term. Yet over shorter periods, market returns can be “choppy.”
Looking at the chart below depicting annual total returns of the Dow Jones Industrial Average from 1950 to 2021, we see how volatile the market can be on an annual basis. Investors experienced 16 years of negative returns during this time, the most painful being -31.93% in 2008.
Time is what smooths out choppy markets. When we extend our investing intervals, and stop focusing on annual returns, the ups and downs feel less and less – and appear less and less. The two charts below depict the three-year and five-year rolling average total returns of the Dow over the same time period as the chart above. Each chart shows decreased volatility, with lower peaks and higher troughs, even though the charts show the same cumulative return of the Dow over the past 71 full calendar years.
When we extend our chart out to ten-year rolling averages, we can clearly see how investing over the long-term can make an investor bullish. In the past 71 years, there has never been a negative 10-year rolling average total return of the Dow. Never. The worst ten-year rolling average total return was a positive 0.29%, from 1965 to 1974, a period including the Great Inflation of the 1970s marked by dismal total returns of -13.28% in 1973 and -23.58% in 1974. The ten-year period from 2000 to 2009, which included the Financial Crisis of 2008, produced a positive average annual total return of 1.31%. Note that in the chart below, the line never crosses below zero.
| HENNESSY FUNDS | 1-800-966-4354 | |
When it comes to investing, time, time, time… is on our side, yes, it is! This is why we invest for the long term at Hennessy, focusing on fundamentals, valuations, and strong businesses, ever mindful of downside risk.
Value investing proved its worth this year, and many of our Funds did as well. The Russell 1000® Value Index was only down -7.00% during our fiscal year ended October 31, 2022, trouncing the Russell 1000® Growth Index’s total return of -24.60%. In addition, most of our Funds outperformed the broader market as well as their benchmarks. During the twelve months ended October 31, 2022, the Dow, the S&P 500, and the Nasdaq dropped -6.74%, -14.61%, and -28.56%, respectively, on a total return basis. During this time period when these three major indices saw significant declines, we were pleased that seven of our 16 Funds posted positive total returns, 11 of our 14 domestic Funds outperformed the S&P 500, and over two-thirds of our actively managed, domestic funds outperformed their primary benchmarks.
Top performers of the year included three of our Funds focused on the Energy and Utilities sectors. These sectors have benefitted from the rising cost of energy, as well as an increase in demand that has outpaced growth in supply. The Hennessy Energy Transition Fund, the Hennessy Midstream Fund, and the Hennessy Gas Utility Fund performed exceptionally well with positive total returns of 49.24%, 24.03%, and 10.14%, respectively, during the twelve-month period ended October 31, 2022. On a different note, our two international funds continue to be adversely affected by softening economies in Asia, rising interest rates, and growth to value rotation. The Hennessy Japan Fund and the Hennessy Japan Small Cap Fund experienced negative total returns of -37.86% and -27.35%, respectively, during our fiscal year.
Notwithstanding a difficult market environment over the last twelve months, we believe that the outlook for U.S. stocks remains positive. We continue to believe that equities are attractive from a valuation standpoint, even as interest rates rise. We believe that the prospect of slower economic growth may dampen inflationary pressures. While the Federal Reserve has raised rates several times in calendar 2022, we believe tempered inflation will allow the potential for the Federal Reserve to take a more neutral stance toward future rate hikes. We remain bullish on equities long term. The unemployment rate is near record lows, there are elevated levels of cash on the balance sheets of U.S. companies, and there is the prospect of a more dovish Federal Reserve in 2023. While
volatility and uncertainty may continue to impact the markets in the short term, we encourage investors to stay the course, maintain a diversified portfolio, and keep a long-term perspective.
We thank you for your continued interest in our Funds, and we are grateful for your trust. While we always prefer to post only positive returns for our shareholders, we are pleased that many of our Funds held up better than the broader market during this challenging year. If you have any questions or would like to speak with us, please call us directly at (800) 966-4354.
Best regards,
| |
| |
| |
|
| Ryan C. Kelley, CFA |
| Chief Investment Officer, |
| Senior Vice President, and Portfolio Manager |
Past performance does not guarantee future results.
Mutual fund investing involves risk. Principal loss is possible.
Opinions expressed are those of Ryan C. Kelley and are subject to change, are not guaranteed, and should not be considered investment advice.
The Dow Jones Industrial Average and S&P 500® Index are commonly used to measure the performance of U.S. stocks. The Nasdaq Composite Index comprises all common stocks listed on The Nasdaq Stock Market and is commonly used to measure the performance of technology-related stocks. The indices are used herein for comparative purposes in accordance with SEC regulations. One cannot invest directly in an index. All returns are shown on a total return basis.
| HENNESSY FUNDS | 1-800-966-4354 | |
Performance Overview (Unaudited)
CHANGE IN VALUE OF $10,000 INVESTMENT
This graph illustrates the performance of an initial investment of $10,000 made in the Fund 10 years ago and assumes the reinvestment of dividends and capital gains.
AVERAGE ANNUAL TOTAL RETURN FOR PERIODS ENDED OCTOBER 31, 2022
| | One | Five | Ten |
| | Year | Years | Years |
| Hennessy Small Cap Financial Fund – | | | |
| Investor Class (HSFNX) | -5.60% | 6.67% | 10.74% |
| Hennessy Small Cap Financial Fund – | | | |
| Institutional Class (HISFX) | -5.21% | 7.07% | 11.14% |
Russell 2000® Index Financials | -9.81% | 4.99% | 10.05% |
Russell 2000® Index | -18.54% | 5.56% | 9.93% |
Expense ratios: 1.58% (Investor Class); 1.20% (Institutional Class)
Performance data quoted represents past performance; past performance does not guarantee future results. The investment return and principal value of an investment will fluctuate so that an investor’s shares, when redeemed, may be worth more or less than their original cost. The performance table does not reflect the deduction of taxes that a shareholder would pay on Fund distributions or the redemption of Fund shares. Current performance of the Fund may be lower or higher than the performance quoted. Performance data current to the most recent month end may be obtained by visiting www.hennessyfunds.com.
The Russell 2000® Index Financials is a subset of the Russell 2000® Index that measures the performance of securities classified in the Financials sector of the small-cap U.S. equity market. The Russell 2000® Index is a subset of the Russell 3000® Index that measures the performance of the small-cap segment of the U.S. equity market. The Russell 2000® Index comprises the smallest 2,000 companies in the Russell 3000® Index based on market capitalization and current index membership, representing approximately 7% of the total market capitalization of the Russell 3000® Index. One cannot invest directly in an index. These indices are used for comparative purposes in accordance with Securities and Exchange Commission regulations.
Frank Russell Company (“Russell”) is the source and owner of the trademarks, service marks, and copyrights related to the Russell Indexes. Russell® is a trademark of Frank Russell Company. Neither Russell nor its licensors accept any liability for any errors or omissions in the Russell Indexes or Russell ratings or underlying data and no party may
rely on any Russell Indexes or Russell ratings or underlying data contained in this communication. No further distribution of Russell data is permitted without Russell’s express written consent. Russell does not promote, sponsor, or endorse the content of this communication.
The expense ratios presented are from the most recent prospectus. The expense ratios for the current reporting period are available in the Financial Highlights section of this report.
PERFORMANCE NARRATIVE
Portfolio Managers David H. Ellison and Ryan C. Kelley, CFA
Performance:
For the one-year period ended October 31, 2022, the Investor Class of the Hennessy Small Cap Financial Fund returned -5.60%, outperforming both the Russell 2000® Index Financials (the Fund’s primary benchmark) and the Russell 2000® Index, which returned -9.81% and -18.54%, respectively, for the same period.
The Fund’s outperformance relative to its primary benchmark resulted predominantly from favorable stock selection, as well as a significantly overweight position in the Regional Banks sub-industry. Top contributors to Fund performance included Banner Corporation, First BanCorp, and Hancock Whitney Corporation. Conversely, the largest detractors from performance were Silvergate Capital Corporation (Class A), PacWest Bancorp, and ConnectOne Bancorp, Inc. In general, regional banks and other smaller, more traditional banking institutions performed relatively well this year compared to the broader stock market as well as other types of financials.
The Fund continues to own all the companies mentioned.
Portfolio Strategy:
Generally, the Fund invests more heavily within the Financials sector in regional banks, thrifts, and, at times, mortgage finance companies. Within these preferred sub-industries, we seek companies that we believe have high-quality management teams, uncomplicated business models, strong balance sheets, and sustainable earnings growth opportunities. Moreover, we seek to identify companies that we expect will do better than peers in the current environment, which is characterized by rapidly rising interest rates, competitive loan markets, growing attention to costs, and the potential for increased loan charge-offs. Finally, we believe the timing of changes in macro industry dynamics is difficult to predict, and we prefer to focus on companies that remain competitive over the long term.
Investment Commentary:
We continue to believe that attractive long-term opportunities exist within our investable universe of small-cap financials, despite a challenging environment and increased economic uncertainty. While rising interest rates should continue to help increase net interest margins and overall profitability, it can also cause a decline in capital levels and loan growth. While earnings and profitability are expected to continue to increase, many investors are concerned about asset quality, although the industry has yet to experience any notable increase in non-performing loans or charge-offs. Furthermore, we are reassured that the industry as a whole continues to have high levels of reserves and excess capital, albeit declining somewhat due to rising rates. While the current environment offers both benefits and challenges to many of our holdings, we continue to believe that valuations are attractive, given that banks are trading at a steep discount to the broader market and to their long-term historical averages.
| HENNESSY FUNDS | 1-800-966-4354 | |
_______________
Opinions expressed are those of the Portfolio Managers as of the date written and are subject to change, are not guaranteed, and should not be considered investment advice or an indication of trading intent.
The Fund is non-diversified, meaning it may concentrate its assets in fewer individual holdings than a diversified fund, making it more exposed to individual stock volatility than a diversified fund. Investments are focused on the financial services industry; sector funds may be subject to a higher degree of market risk. The Fund invests in smaller companies, which may have more limited liquidity and greater volatility compared to larger companies. Please see the Fund’s prospectus for a more complete discussion of these and other risks.
References to specific securities should not be considered a recommendation to buy or sell any security. Fund holdings and sector allocations are subject to change. Please refer to the Schedule of Investments included in this report for additional portfolio information.
Earnings growth is not a measure of the Fund’s future performance.
| PERFORMANCE OVERVIEW/SCHEDULE OF INVESTMENTS |
Financial Statements
Schedule of Investments as of October 31, 2022 |
HENNESSY SMALL CAP FINANCIAL FUND
(% of Net Assets)
| TOP TEN HOLDINGS (EXCLUDING MONEY MARKET FUNDS) | % NET ASSETS |
| Old National Bancorp | 5.42% |
| Hancock Whitney Corp. | 5.31% |
| Independent Bank Corp. | 5.06% |
| First BanCorp. | 5.00% |
| First Citizens BancShares, Inc. | 4.99% |
| Texas Capital Bancshares, Inc. | 4.75% |
| Associated Banc-Corp. | 4.72% |
| Banner Corp. | 4.61% |
| Lakeland Bancorp, Inc. | 4.24% |
| Hingham Institution for Savings | 4.14% |
Note: For presentation purposes, the Fund has grouped some of the industry categories. For purposes of categorizing securities for compliance with Section 8(b)(1) of the Investment Company Act of 1940, as amended, the Fund uses more specific industry classifications.
The Global Industry Classification Standard (GICS®) was developed by and is the exclusive property and a service mark of MSCI, Inc. and Standard & Poor’s Financial Services LLC. It has been licensed for use by the Hennessy Funds.
| HENNESSY FUNDS | 1-800-966-4354 | |
| COMMON STOCKS – 95.25% | | Number | | | | | | % of | |
| | | of Shares | | | Value | | | Net Assets | |
| Financials – 95.25% | | | | | | | | | |
| Associated Banc-Corp. | | | 220,000 | | | $ | 5,357,000 | | | | 4.72 | % |
| BankUnited, Inc. | | | 35,000 | | | | 1,258,250 | | | | 1.11 | % |
| Banner Corp. | | | 70,000 | | | | 5,232,500 | | | | 4.61 | % |
| Cadence Bank | | | 76,000 | | | | 2,101,400 | | | | 1.85 | % |
| Cambridge Bancorp | | | 38,000 | | | | 3,338,300 | | | | 2.94 | % |
| ConnectOne Bancorp, Inc. | | | 150,000 | | | | 3,757,500 | | | | 3.31 | % |
| Customers Bancorp, Inc. (a) | | | 58,000 | | | | 1,954,020 | | | | 1.72 | % |
| Eastern Bankshares, Inc. | | | 163,000 | | | | 3,124,710 | | | | 2.75 | % |
| First BanCorp. (b) | | | 360,000 | | | | 5,684,400 | | | | 5.00 | % |
| First Citizens BancShares, Inc. | | | 6,900 | | | | 5,672,628 | | | | 4.99 | % |
| Flushing Financial Corp. | | | 160,000 | | | | 3,152,000 | | | | 2.78 | % |
| Hancock Whitney Corp. | | | 108,000 | | | | 6,033,960 | | | | 5.31 | % |
| Hingham Institution for Savings | | | 19,000 | | | | 4,697,750 | | | | 4.14 | % |
| HomeTrust Bancshares, Inc. | | | 135,000 | | | | 3,244,050 | | | | 2.86 | % |
| Independent Bank Corp. | | | 66,000 | | | | 5,742,660 | | | | 5.06 | % |
| Kearny Financial Corp. of Maryland | | | 255,000 | | | | 2,585,700 | | | | 2.28 | % |
| Lakeland Bancorp, Inc. | | | 258,000 | | | | 4,811,700 | | | | 4.24 | % |
| Luther Burbank Corp. | | | 55,000 | | | | 694,650 | | | | 0.61 | % |
| New York Community Bancorp, Inc. | | | 320,000 | | | | 2,979,200 | | | | 2.62 | % |
| Northeast Community Bancorp, Inc. | | | 260,000 | | | | 3,421,600 | | | | 3.01 | % |
| OceanFirst Financial Corp. | | | 205,000 | | | | 4,628,900 | | | | 4.08 | % |
| Old National Bancorp | | | 315,000 | | | | 6,161,400 | | | | 5.42 | % |
| Orange County Bancorp, Inc. | | | 19,000 | | | | 842,270 | | | | 0.74 | % |
| PacWest Bancorp | | | 140,000 | | | | 3,480,400 | | | | 3.06 | % |
| Shore Bancshares, Inc. | | | 73,000 | | | | 1,455,620 | | | | 1.28 | % |
| Silvergate Capital Corp. (a) | | | 5,500 | | | | 312,180 | | | | 0.27 | % |
| Synovus Financial Corp. | | | 10,000 | | | | 398,500 | | | | 0.35 | % |
| Texas Capital Bancshares, Inc. (a) | | | 90,000 | | | | 5,400,000 | | | | 4.75 | % |
| Western New England Bancorp, Inc. | | | 435,000 | | | | 3,806,250 | | | | 3.35 | % |
| Wintrust Financial Corp. | | | 27,000 | | | | 2,527,740 | | | | 2.23 | % |
| WSFS Financial Corp. | | | 93,000 | | | | 4,330,080 | | | | 3.81 | % |
| | | | | | | | 108,187,318 | | | | 95.25 | % |
| | | | | | | | | | | | | |
| Total Common Stocks | | | | | | | | | | | | |
| (Cost $80,337,415) | | | | | | | 108,187,318 | | | | 95.25 | % |
The accompanying notes are an integral part of these financial statements.
| SHORT-TERM INVESTMENTS – 5.49% | | Number | | | | | | % of | |
| | | of Shares | | | Value | | | Net Assets | |
| Money Market Funds – 5.49% | | | | | | | | | |
| First American Government Obligations Fund, | | | | | | | | | |
| Institutional Class, 2.93% (c) | | | 5,674,000 | | | $ | 5,674,000 | | | | 5.00 | % |
| First American Treasury Obligations Fund, | | | | | | | | | | | | |
| Institutional Class, 3.07% (c) | | | 558,184 | | | | 558,184 | | | | 0.49 | % |
| | | | | | | | | | | | | |
| Total Short-Term Investments | | | | | | | | | | | | |
| (Cost $6,232,184) | | | | | | | 6,232,184 | | | | 5.49 | % |
| | | | | | | | | | | | | |
| Total Investments | | | | | | | | | | | | |
| (Cost $86,569,599) – 100.74% | | | | | | | 114,419,502 | | | | 100.74 | % |
| Liabilities in Excess of Other Assets – (0.74)% | | | | | | | (844,500 | ) | | | (0.74 | )% |
| | | | | | | | | | | | | |
TOTAL NET ASSETS – 100.00% | | | | | | $ | 113,575,002 | | | | 100.00 | % |
Percentages are stated as a percent of net assets.
| (a) | Non-income-producing security. |
| (b) | U.S.-traded security of a foreign corporation. |
| (c) | The rate listed is the fund’s seven-day yield as of October 31, 2022. |
Summary of Fair Value Exposure as of October 31, 2022
The following is a summary of the inputs used to value the Fund’s net assets as of October 31, 2022 (see Note 3 in the accompanying Notes to the Financial Statements):
| Common Stocks | | Level 1 | | | Level 2 | | | Level 3 | | | Total | |
| Financials | | $ | 108,187,318 | | | $ | — | | | $ | — | | | $ | 108,187,318 | |
| Total Common Stocks | | $ | 108,187,318 | | | $ | — | | | $ | — | | | $ | 108,187,318 | |
| Short-Term Investments | | | | | | | | | | | | | | | | |
| Money Market Funds | | $ | 6,232,184 | | | $ | — | | | $ | — | | | $ | 6,232,184 | |
| Total Short-Term Investments | | $ | 6,232,184 | | | $ | — | | | $ | — | | | $ | 6,232,184 | |
| Total Investments | | $ | 114,419,502 | | | $ | — | | | $ | — | | | $ | 114,419,502 | |
The accompanying notes are an integral part of these financial statements.
| HENNESSY FUNDS | 1-800-966-4354 | |
Financial Statements
Statement of Assets and Liabilities as of October 31, 2022 |
| ASSETS: | | | |
| Investments in securities, at value (cost $86,569,599) | | $ | 114,419,502 | |
| Dividends and interest receivable | | | 79,292 | |
| Receivable for fund shares sold | | | 22,240 | |
| Prepaid expenses and other assets | | | 21,334 | |
| Total assets | | | 114,542,368 | |
| | | | | |
| LIABILITIES: | | | | |
| Payable for securities purchased | | | 781,842 | |
| Payable for fund shares redeemed | | | 5,129 | |
| Payable to advisor | | | 85,432 | |
| Payable to administrator | | | 23,061 | |
| Payable to auditor | | | 22,749 | |
| Accrued distribution fees | | | 14,566 | |
| Accrued service fees | | | 7,577 | |
| Accrued trustees fees | | | 6,133 | |
| Accrued expenses and other payables | | | 20,877 | |
| Total liabilities | | | 967,366 | |
| NET ASSETS | | $ | 113,575,002 | |
| | | | | |
| NET ASSETS CONSISTS OF: | | | | |
| Capital stock | | $ | 79,043,743 | |
| Total distributable earnings | | | 34,531,259 | |
| Total net assets | | $ | 113,575,002 | |
| | | | | |
| NET ASSETS: | | | | |
| Investor Class | | | | |
| Shares authorized (no par value) | | Unlimited | |
| Net assets applicable to outstanding shares | | $ | 93,403,053 | |
| Shares issued and outstanding | | | 3,169,128 | |
| Net asset value, offering price, and redemption price per share | | $ | 29.47 | |
| | | | | |
| Institutional Class | | | | |
| Shares authorized (no par value) | | Unlimited | |
| Net assets applicable to outstanding shares | | $ | 20,171,949 | |
| Shares issued and outstanding | | | 1,170,122 | |
| Net asset value, offering price, and redemption price per share | | $ | 17.24 | |
The accompanying notes are an integral part of these financial statements.
| STATEMENT OF ASSETS AND LIABILITIES/STATEMENT OF OPERATIONS |
Financial Statements
Statement of Operations for the year ended October 31, 2022 |
| INVESTMENT INCOME: | | | |
Dividend income(1) | | $ | 3,013,457 | |
| Interest income | | | 46,027 | |
| Total investment income | | | 3,059,484 | |
| | | | | |
| EXPENSES: | | | | |
| Investment advisory fees (See Note 5) | | | 1,188,941 | |
| Sub-transfer agent expenses – Investor Class (See Note 5) | | | 206,577 | |
| Sub-transfer agent expenses – Institutional Class (See Note 5) | | | 18,334 | |
| Distribution fees – Investor Class (See Note 5) | | | 159,602 | |
| Administration, accounting, custody, and transfer agent fees (See Note 5) | | | 159,143 | |
| Service fees – Investor Class (See Note 5) | | | 106,401 | |
| Federal and state registration fees | | | 47,878 | |
| Compliance expense (See Note 5) | | | 24,504 | |
| Audit fees | | | 22,743 | |
| Trustees’ fees and expenses | | | 19,902 | |
| Reports to shareholders | | | 15,291 | |
| Interest expense (See Note 7) | | | 7,476 | |
| Legal fees | | | 2,399 | |
| Other expenses | | | 23,299 | |
| Total expenses | | | 2,002,490 | |
| NET INVESTMENT INCOME | | $ | 1,056,994 | |
| | | | | |
| REALIZED AND UNREALIZED GAINS (LOSSES): | | | | |
| Net realized gain on investments | | $ | 12,617,156 | |
| Net change in unrealized appreciation/depreciation on investments | | | (22,730,488 | ) |
| Net loss on investments | | | (10,113,332 | ) |
| NET DECREASE IN NET ASSETS RESULTING FROM OPERATIONS | | $ | (9,056,338 | ) |
(1) | Net of foreign taxes withheld of $20,150. |
The accompanying notes are an integral part of these financial statements.
| HENNESSY FUNDS | 1-800-966-4354 | |
(This Page Intentionally Left Blank.)
| STATEMENTS OF CHANGES IN NET ASSETS |
Financial Statements
| Statements of Changes in Net Assets |
| | | Year Ended | | | Year Ended | |
| | | October 31, 2022 | | | October 31, 2021 | |
| OPERATIONS: | | | | | | |
| Net investment income | | $ | 1,056,994 | | | $ | 1,237,630 | |
| Net realized gain on investments | | | 12,617,156 | | | | 7,181,600 | |
| Net change in unrealized | | | | | | | | |
| appreciation/depreciation on investments | | | (22,730,488 | ) | | | 46,273,638 | |
| Net increase (decrease) in net | | | | | | | | |
| assets resulting from operations | | | (9,056,338 | ) | | | 54,692,868 | |
| | | | | | | | | |
| DISTRIBUTIONS TO SHAREHOLDERS: | | | | | | | | |
| Distributable earnings – Investor Class | | | (1,276,583 | ) | | | (640,077 | ) |
| Distributable earnings – Institutional Class | | | (587,596 | ) | | | (266,480 | ) |
| Total distributions | | | (1,864,179 | ) | | | (906,557 | ) |
| | | | | | | | | |
| CAPITAL SHARE TRANSACTIONS: | | | | | | | | |
| Proceeds from shares subscribed – Investor Class | | | 21,043,349 | | | | 89,150,331 | |
| Proceeds from shares subscribed – Institutional Class | | | 13,669,099 | | | | 23,725,263 | |
| Dividends reinvested – Investor Class | | | 1,243,912 | | | | 621,958 | |
| Dividends reinvested – Institutional Class | | | 549,827 | | | | 237,659 | |
| Cost of shares redeemed – Investor Class | | | (60,100,417 | ) | | | (49,466,414 | ) |
| Cost of shares redeemed – Institutional Class | | | (24,017,634 | ) | | | (11,517,594 | ) |
| Net increase (decrease) in net assets | | | | | | | | |
| derived from capital share transactions | | | (47,611,864 | ) | | | 52,751,203 | |
| TOTAL INCREASE (DECREASE) IN NET ASSETS | | | (58,532,381 | ) | | | 106,537,514 | |
| | | | | | | | | |
| NET ASSETS: | | | | | | | | |
| Beginning of year | | | 172,107,383 | | | | 65,569,869 | |
| End of year | | $ | 113,575,002 | | | $ | 172,107,383 | |
| | | | | | | | | |
| CHANGES IN SHARES OUTSTANDING: | | | | | | | | |
| Shares sold – Investor Class | | | 685,704 | | | | 3,020,767 | |
| Shares sold – Institutional Class | | | 758,917 | | | | 1,373,793 | |
| Shares issued to holders as reinvestment | | | | | | | | |
| of dividends – Investor Class | | | 39,265 | | | | 28,361 | |
| Shares issued to holders as reinvestment | | | | | | | | |
| of dividends – Institutional Class | | | 29,680 | | | | 18,452 | |
| Shares redeemed – Investor Class | | | (1,998,475 | ) | | | (1,754,093 | ) |
| Shares redeemed – Institutional Class | | | (1,345,808 | ) | | | (688,529 | ) |
| Net increase (decrease) in shares outstanding | | | (1,830,717 | ) | | | 1,998,751 | |
The accompanying notes are an integral part of these financial statements.
| HENNESSY FUNDS | 1-800-966-4354 | |
Financial Statements
For an Investor Class share outstanding throughout each year
PER SHARE DATA:
Net asset value, beginning of year
Income from investment operations:
Net investment income
Net realized and unrealized gains (losses) on investments
Total from investment operations
Less distributions:
Dividends from net investment income
Dividends from net realized gains
Total distributions
Net asset value, end of year
TOTAL RETURN
SUPPLEMENTAL DATA AND RATIOS:
Net assets, end of year (millions)
Ratio of expenses to average net assets
Ratio of net investment income to average net assets
Portfolio turnover rate(3)
(1) | Calculated using the average shares outstanding method. |
(2) | Amount is between $(0.005) and $0.005. |
(3) | Calculated on the basis of the Fund as a whole. |
The accompanying notes are an integral part of these financial statements.
| FINANCIAL HIGHLIGHTS — INVESTOR CLASS |
| Year Ended October 31, | |
| 2022 | | | 2021 | | | 2020 | | | 2019 | | | 2018 | |
| | | | | | | | | | | | | | |
| $ | 31.52 | | | $ | 17.46 | | | $ | 21.60 | | | $ | 21.96 | | | $ | 26.02 | |
| | | | | | | | | | | | | | | | | | | |
| | | | | | | | | | | | | | | | | | | |
| | 0.22 | (1) | | | 0.25 | (1) | | | 0.16 | (1) | | | 0.10 | (1) | | | 0.03 | |
| | (1.96 | ) | | | 14.01 | | | | (3.55 | ) | | | 0.93 | | | | (2.12 | ) |
| | (1.74 | ) | | | 14.26 | | | | (3.39 | ) | | | 1.03 | | | | (2.09 | ) |
| | | | | | | | | | | | | | | | | | | |
| | | | | | | | | | | | | | | | | | | |
| | (0.22 | ) | | | (0.20 | ) | | | (0.09 | ) | | | (0.07 | ) | | | 0.00 | (2) |
| | (0.09 | ) | | | — | | | | (0.66 | ) | | | (1.32 | ) | | | (1.97 | ) |
| | (0.31 | ) | | | (0.20 | ) | | | (0.75 | ) | | | (1.39 | ) | | | (1.97 | ) |
| $ | 29.47 | | | $ | 31.52 | | | $ | 17.46 | | | $ | 21.60 | | | $ | 21.96 | |
| | | | | | | | | | | | | | | | | | | |
| | -5.60 | % | | | 82.20 | % | | | -16.37 | % | | | 5.27 | % | | | -8.79 | % |
| | | | | | | | | | | | | | | | | | | |
| | | | | | | | | | | | | | | | | | | |
| $ | 93.40 | | | $ | 140.03 | | | $ | 54.96 | | | $ | 89.36 | | | $ | 122.00 | |
| | 1.59 | % | | | 1.58 | % | | | 1.65 | % | | | 1.58 | % | | | 1.54 | % |
| | 0.72 | % | | | 0.90 | % | | | 0.96 | % | | | 0.47 | % | | | 0.11 | % |
| | 27 | % | | | 28 | % | | | 75 | % | | | 46 | % | | | 28 | % |
The accompanying notes are an integral part of these financial statements.
| HENNESSY FUNDS | 1-800-966-4354 | |
Financial Statements
For an Institutional Class share outstanding throughout each year
PER SHARE DATA:
Net asset value, beginning of year
Income from investment operations:
Net investment income
Net realized and unrealized gains (losses) on investments
Total from investment operations
Less distributions:
Dividends from net investment income
Dividends from net realized gains
Total distributions
Net asset value, end of year
TOTAL RETURN
SUPPLEMENTAL DATA AND RATIOS:
Net assets, end of year (millions)
Ratio of expenses to average net assets
Ratio of net investment income to average net assets
Portfolio turnover rate(2)
(1) | Calculated using the average shares outstanding method. |
(2) | Calculated on the basis of the Fund as a whole. |
The accompanying notes are an integral part of these financial statements.
| FINANCIAL HIGHLIGHTS — INSTITUTIONAL CLASS |
| Year Ended October 31, | |
| 2022 | | | 2021 | | | 2020 | | | 2019 | | | 2018 | |
| | | | | | | | | | | | | | |
| $ | 18.57 | | | $ | 10.37 | | | $ | 12.92 | | | $ | 13.28 | | | $ | 15.69 | |
| | | | | | | | | | | | | | | | | | | |
| | | | | | | | | | | | | | | | | | | |
| | 0.20 | (1) | | | 0.21 | (1) | | | 0.13 | (1) | | | 0.10 | (1) | | | 0.07 | |
| | (1.14 | ) | | | 8.26 | | | | (2.10 | ) | | | 0.54 | | | | (1.27 | ) |
| | (0.94 | ) | | | 8.47 | | | | (1.97 | ) | | | 0.64 | | | | (1.20 | ) |
| | | | | | | | | | | | | | | | | | | |
| | | | | | | | | | | | | | | | | | | |
| | (0.34 | ) | | | (0.27 | ) | | | (0.19 | ) | | | (0.18 | ) | | | (0.02 | ) |
| | (0.05 | ) | | | — | | | | (0.39 | ) | | | (0.82 | ) | | | (1.19 | ) |
| | (0.39 | ) | | | (0.27 | ) | | | (0.58 | ) | | | (1.00 | ) | | | (1.21 | ) |
| $ | 17.24 | | | $ | 18.57 | | | $ | 10.37 | | | $ | 12.92 | | | $ | 13.28 | |
| | | | | | | | | | | | | | | | | | | |
| | -5.21 | % | | | 82.88 | % | | | -16.05 | % | | | 5.57 | % | | | -8.42 | % |
| | | | | | | | | | | | | | | | | | | |
| | | | | | | | | | | | | | | | | | | |
| $ | 20.17 | | | $ | 32.08 | | | $ | 10.61 | | | $ | 20.74 | | | $ | 35.66 | |
| | 1.22 | % | | | 1.20 | % | | | 1.29 | % | | | 1.23 | % | | | 1.15 | % |
| | 1.13 | % | | | 1.31 | % | | | 1.27 | % | | | 0.84 | % | | | 0.51 | % |
| | 27 | % | | | 28 | % | | | 75 | % | | | 46 | % | | | 28 | % |
The accompanying notes are an integral part of these financial statements.
| HENNESSY FUNDS | 1-800-966-4354 | |
Financial Statements
Notes to the Financial Statements October 31, 2022 |
1). ORGANIZATION
The Hennessy Small Cap Financial Fund (the “Fund”) is a series of Hennessy Funds Trust (the “Trust”), which was organized as a Delaware statutory trust on September 17, 1992. The Fund is an open-end management investment company registered under the Investment Company Act of 1940, as amended. The investment objective of the Fund is capital appreciation. The Fund is a non-diversified fund.
The Fund offers Investor Class and Institutional Class shares. Each class of shares differs principally in its respective 12b-1 distribution and service, shareholder servicing, and sub-transfer agent expenses. There are no sales charges. Each class has identical rights to earnings, assets, and voting privileges, except for class-specific expenses and exclusive rights to vote on matters affecting only one class.
As an investment company, the Fund follows the investment company accounting and reporting guidance of the Financial Accounting Standards Board (“FASB”) Accounting Standard Codification Topic 946 “Financial Services—Investment Companies.”
2). SIGNIFICANT ACCOUNTING POLICIES
The following is a summary of significant accounting policies consistently followed by the Fund in the preparation of the financial statements. These policies conform to U.S. generally accepted accounting principles (“GAAP”).
| a). | Securities Valuation – All investments in securities are valued in accordance with the Fund’s valuation policies and procedures, as described in Note 3. |
| | |
| b). | Federal Income Taxes – The Fund has elected to be taxed as a regulated investment company and intends to distribute substantially all of its taxable income to its shareholders and otherwise comply with the provisions of the Internal Revenue Code of 1986, as amended, applicable to regulated investment companies. As a result, the Fund has made no provision for federal income taxes or excise taxes. Net investment income/loss and realized gains/losses for federal income tax purposes may differ from those reported in the financial statements because of temporary book-basis and tax-basis differences. Temporary differences are primarily the result of the treatment of wash sales for tax reporting purposes. The Fund recognizes interest and penalties related to income tax benefits, if any, in the Statement of Operations as an income tax expense. Distributions from net realized gains for book purposes may include short-term capital gains, which are included as ordinary income to shareholders for tax purposes. The Fund may utilize equalization accounting for tax purposes and designate earnings and profits, including net realized gains distributed to shareholders on redemption of shares, as part of the dividends paid deduction for income tax purposes. |
| | |
| | Due to inherent differences in the recognition of income, expenses, and realized gains/losses under GAAP and federal income tax regulations, permanent differences between book and tax basis for reporting are identified and appropriately reclassified in the Statement of Assets and Liabilities, as needed. The adjustments for fiscal year 2022 are as follows: |
| | Total | | |
| | Distributable | | |
| | Earnings | Capital Stock | |
| | $(4,017,913) | $4,017,913 | |
| NOTES TO THE FINANCIAL STATEMENTS |
| c). | Accounting for Uncertainty in Income Taxes – The Fund has accounting policies regarding recognition and measurement of tax positions taken or expected to be taken on a tax return. The tax returns of the Fund for the prior three fiscal years are open for examination. The Fund has reviewed all open tax years in major tax jurisdictions and concluded that there is no impact on the Fund’s net assets and no tax liability resulting from unrecognized tax benefits relating to uncertain income tax positions taken or expected to be taken on a tax return. The Fund’s major tax jurisdictions are U.S. federal and Delaware. |
| | |
| d). | Income and Expenses – Dividend income is recognized on the ex-dividend date or as soon as information is available to the Fund. Interest income, which includes the amortization of premium and accretion of discount, is recognized on an accrual basis. Market discounts, original issue discounts, and market premiums on debt securities are accreted or amortized to interest income over the life of a security with a corresponding increase or decrease, as applicable, in the cost basis of such security using the yield-to-maturity method or, where applicable, the first call date of the security. Other non-cash dividends are recognized as investment income at the fair value of the property received. The Fund is charged for those expenses that are directly attributable to its portfolio, such as advisory, administration, and certain shareholder service fees. Income, expenses (other than expenses attributable to a specific class), and realized and unrealized gains/losses on investments are allocated to each class of shares based on such class’s net assets. |
| | |
| e). | Distributions to Shareholders – Dividends from net investment income for the Fund, if any, are declared and paid annually, usually in December. Distributions of net realized capital gains, if any, are declared and paid annually, usually in December. |
| | |
| f). | Security Transactions – Investment and shareholder transactions are recorded on the trade date. The Fund determines the realized gain/loss from an investment transaction by comparing the original cost of the security lot sold with the net sale proceeds. Discounts and premiums on securities purchased are accreted or amortized, respectively, over the life of each such security. |
| | |
| g). | Use of Estimates – Preparing financial statements in accordance with GAAP requires management to make estimates and assumptions that affect the reported amounts of assets and liabilities and disclosure of contingent assets and liabilities at the date of the financial statements, as well as the reported change in net assets during the reporting period. Actual results could differ from those estimates. |
| | |
| h). | Share Valuation – The net asset value (“NAV”) per share of the Fund is calculated by dividing (i) the total value of the securities held by the Fund, plus cash and other assets, minus all liabilities (including estimated accrued expenses) by (ii) the total number of Fund shares outstanding, rounded to the nearest $0.01. Fund shares are not priced on days the New York Stock Exchange is closed for trading. The offering and redemption price per share for the Fund is equal to the Fund’s NAV per share. |
| | |
| i). | Illiquid Securities – Pursuant to Rule 22e-4 under the 1940 Act, the Fund has adopted a Liquidity Risk Management Program (the “Liquidity Program”). The Liquidity Program requires, among other things, that the Fund limit its illiquid investments to no more than 15% of its net assets. An illiquid investment is any investment that the Fund reasonably expects cannot be sold or disposed of by the Fund in current market conditions in seven calendar days or less without the sale or disposition significantly changing the market value of the investment. |
| | |
| j). | Recent Accounting Pronouncements and Regulatory Updates – In October 2020, the Securities and Exchange Commission (“SEC”) adopted new regulations governing |
| HENNESSY FUNDS | 1-800-966-4354 | |
| | the use of derivatives by registered investment companies (“Rule 18f-4”). Rule 18f-4 imposes limits on the amount of derivatives a fund can enter into, eliminates the asset segregation framework currently used by funds to comply with Section 18 of the 1940 Act, and requires funds whose use of derivatives is greater than a limited specified amount to establish and maintain a comprehensive derivatives risk management program and appoint a derivatives risk manager. The Fund has adopted procedures in accordance with Rule 18f-4. |
| | |
| | In December 2020, the SEC adopted a new rule providing a framework for fund valuation practices (“Rule 2a-5”). Rule 2a-5 establishes requirements for determining fair value in good faith for purposes of the 1940 Act. Rule 2a-5 permits fund boards to designate certain parties to perform fair value determinations, subject to board oversight and certain other conditions. Rule 2a-5 also defines when market quotations are “readily available” for purposes of the 1940 Act and the threshold for determining whether a fund must fair value a security. In connection with Rule 2a-5, the SEC also adopted related recordkeeping requirements and is rescinding previously issued guidance, including with respect to the role of a board in determining fair value and the accounting and auditing of fund investments. The Fund has adopted procedures in accordance with Rule 2a-5. |
| | |
| | In March 2020, FASB issued Accounting Standards Update 2020 04, Reference Rate Reform: Facilitation of the Effects of Reference Rate Reform on Financial Reporting. The main objective of the new guidance was to provide relief to companies that would be impacted by the expected change in benchmark interest rates at the end of 2021, when participating banks would no longer be required to submit London Interbank Offered Rate (“LIBOR”) quotes by the UK Financial Conduct Authority. The new guidance allows companies to account for contract modifications as a continuance of the existing contract without additional analysis, provided that the only change to existing contracts is a change to an approved benchmark interest rate. In addition, derivative contracts that qualified for hedge accounting prior to contract modification will be allowed to continue to receive such treatment even if critical terms change due to a change in the benchmark interest rate. For new and existing contracts, the Fund may elect to apply the amendments as of March 12, 2020 through December 31, 2022. See Note 9 for more information. |
3). SECURITIES VALUATION
The Fund follows its valuation policies and procedures in determining its NAV and, in preparing these financial statements, the fair value accounting standards that establish an authoritative definition of fair value and set out a hierarchy for measuring fair value. These standards require additional disclosures about the various inputs and valuation techniques used to develop the measurements of fair value and a discussion of changes in valuation techniques and related inputs during the period. These inputs are summarized in the three broad levels listed below:
| | Level 1 – | Unadjusted, quoted prices in active markets for identical instruments that the Fund has the ability to access at the date of measurement. |
| | | |
| | Level 2 – | Other significant observable inputs (including, but not limited to, quoted prices in active markets for similar instruments, quoted prices in markets that are not active for identical or similar instruments, and model-derived valuations in which all significant inputs and significant value drivers are observable in active markets, such as interest rates, prepayment speeds, credit risk curves, default rates, and similar data). |
| NOTES TO THE FINANCIAL STATEMENTS |
| | Level 3 – | Significant unobservable inputs (including the Fund’s own assumptions about what market participants would use to price the asset or liability based on the best available information) when observable inputs are unavailable. |
The following is a description of the valuation techniques applied to the Fund’s major categories of assets and liabilities on a recurring basis:
| | Equity Securities – Equity securities, including common stocks, preferred stocks, foreign-issued common stocks, exchange-traded funds, closed-end mutual funds, partnerships, rights, and real estate investment trusts, that are traded on a securities exchange for which a last-quoted sales price is readily available generally are valued at the last sales price as reported by the primary exchange on which the securities are listed. Securities listed on The Nasdaq Stock Market (“Nasdaq”) generally are valued at the Nasdaq Official Closing Price, which may differ from the last sales price reported. Securities traded on a securities exchange for which a last-quoted sales price is not readily available generally are valued at the mean between the bid and ask prices. To the extent these securities are actively traded and valuation adjustments are not applied, they are classified in Level 1 of the fair value hierarchy. Securities traded on foreign exchanges generally are not valued at the same time the Fund calculates its NAV because most foreign markets close well before such time. The earlier close of most foreign markets gives rise to the possibility that significant events, including broad market moves, may have occurred in the interim. In certain circumstances, it may be determined that a foreign security needs to be fair valued because it appears that the value of the security might have been materially affected by events occurring after the close of the market in which the security is principally traded, but before the time the Fund calculates its NAV, such as by a development that affects an entire market or region (e.g., a weather-related event) or a potentially global development (e.g., a terrorist attack that may be expected to have an effect on investor expectations worldwide). |
| | |
| | Registered Investment Companies – Investments in open-end registered investment companies, commonly referred to as mutual funds, generally are priced at the ending NAV provided by the applicable mutual fund’s service agent and are classified in Level 1 of the fair value hierarchy. |
| | |
| | Debt Securities – Debt securities, including corporate bonds, asset-backed securities, mortgage-backed securities, municipal bonds, U.S. Treasuries, and U.S. government agency issues, are generally valued at market on the basis of valuations furnished by an independent pricing service that utilizes both dealer-supplied valuations and formula-based techniques. The pricing service may consider recently executed transactions in securities of the issuer or comparable issuers, market price quotations (where observable), bond spreads, and fundamental data relating to the issuer. In addition, the model may incorporate observable market data, such as reported sales of similar securities, broker quotes, yields, bids, offers, and reference data. Certain securities are valued primarily using dealer quotations. These securities are generally classified in Level 2 of the fair value hierarchy. |
| | |
| | Short-Term Securities – Short-term equity investments, including money market funds, are valued in the manner specified above for equity securities. Short-term debt investments with an original term to maturity of 60 days or less are valued at amortized cost, which approximates fair market value. If the original term to maturity of a short-term debt investment exceeds 60 days, then the values as of the 61st day prior to maturity are amortized. Amortized cost is not used if its use would be inappropriate due to credit or other impairments of the issuer, in which case the |
| HENNESSY FUNDS | 1-800-966-4354 | |
| | security’s fair value would be determined as described below. Short-term securities are generally classified in Level 1 or Level 2 of the fair value hierarchy depending on the inputs used and market activity levels for specific securities. |
The Board of Trustees of the Fund (the “Board”) has adopted fair value pricing procedures that are followed when a price for a security is not readily available or if a significant event has occurred that indicates the closing price of a security no longer represents the true value of that security. Fair value pricing determinations are made in good faith in accordance with these procedures. There are numerous criteria considered in determining a fair value of a security, such as the trading volume of a security and markets, the values of other similar securities, and news events with direct bearing on a security or markets. Fair value pricing results in an estimated price for a security that reflects the amount the Fund might reasonably expect to receive in a current sale. Depending on the relative significance of the valuation inputs, these securities may be classified in either Level 2 or Level 3 of the fair value hierarchy.
The fair value of foreign securities may be determined with the assistance of a pricing service using correlations between the movement of prices of such securities and indices of domestic securities and other appropriate indicators, such as closing market prices of relevant American Depositary Receipts or futures contracts. Using fair value pricing means that the Fund’s NAV reflects the affected portfolio securities’ values as determined by the Board or its designee, pursuant to the fair value pricing procedures adopted by the Board, instead of being determined by the market. Using a fair value pricing methodology to price a foreign security may result in a value that is different from such foreign security’s most recent closing price and from the value used by other investment companies to calculate their NAVs. Such securities are generally classified in Level 2 of the fair value hierarchy. Because the Fund may invest in foreign securities, the value of the Fund’s portfolio securities may change on days when a shareholder is unable to purchase or redeem Fund shares.
The Board has delegated day-to-day valuation matters to the Valuation and Liquidity Committee comprising representatives from Hennessy Advisors, Inc., the Fund’s investment advisor (the “Advisor”). The function of the Valuation and Liquidity Committee, among other things, is to value securities where current and reliable market quotations are not readily available. All actions taken by the Valuation and Liquidity Committee are reviewed by the Board.
The Fund has performed an analysis of all existing investments to determine the significance and character of all inputs to their fair value determinations. Various inputs are used to determine the value of the Fund’s investments. The inputs or methodology used for valuing securities are not necessarily an indication of the risk associated with investing in those securities. Details related to the fair value hierarchy of the Fund’s securities as of October 31, 2022, are included in the Schedule of Investments.
4). INVESTMENT TRANSACTIONS
Purchases and sales of investment securities (excluding government and short-term investments) for the Fund during fiscal year 2022 were $34,261,038 and $83,013,815, respectively.
There were no purchases or sales/maturities of long-term U.S. government securities for the Fund during fiscal year 2022.
5). INVESTMENT ADVISORY FEE AND OTHER TRANSACTIONS WITH AFFILIATES
The Advisor provides the Fund with investment advisory services under an Investment Advisory Agreement. The Advisor furnishes all investment advice, office space, and
| NOTES TO THE FINANCIAL STATEMENTS |
facilities and most of the personnel needed by the Fund. As compensation for its services, the Advisor is entitled to a monthly fee from the Fund. The fee is based on the average daily net assets of the Fund at an annual rate of 0.90%. The net investment advisory fees expensed by the Fund during fiscal year 2022 are included in the Statement of Operations.
The Board has approved a Shareholder Servicing Agreement for Investor Class shares of the Fund, which compensates the Advisor for the non-investment advisory services it provides to the Fund. The Shareholder Servicing Agreement provides for a monthly fee paid to the Advisor at an annual rate of 0.10% of the average daily net assets of the Fund attributable to Investor Class shares. The shareholder service fees expensed by the Fund during fiscal year 2022 are included in the Statement of Operations.
The Fund has adopted a plan pursuant to Rule 12b-1 under the Investment Company Act of 1940, as amended, that authorizes payments in connection with the distribution of Fund shares at an annual rate of up to 0.25% of the Fund’s average daily net assets attributable to Investor Class shares. Even though the authorized rate is up to 0.25%, the Fund is currently only using up to 0.15% of its average daily net assets attributable to Investor Class shares for such purpose. Amounts paid under the plan may be spent on any activities or expenses primarily intended to result in the sale of shares, including, but not limited to, advertising, shareholder account servicing, printing and mailing of prospectuses to other than current shareholders, printing and mailing of sales literature, and compensation for sales and marketing activities or to financial institutions and others, such as dealers and distributors. The distribution fees expensed by the Fund during fiscal year 2022 are included in the Statement of Operations.
The Fund has entered into agreements with various brokers, dealers, and financial intermediaries in connection with the sale of Fund shares. The agreements provide for periodic payments of sub-transfer agent expenses by the Fund to the brokers, dealers, and financial intermediaries for providing certain shareholder maintenance services. These shareholder services include the pre-processing and quality control of new accounts, shareholder correspondence, answering customer inquiries regarding account status, and facilitating shareholder telephone transactions. The sub-transfer agent fees expensed by the Fund during fiscal year 2022 are included in the Statement of Operations.
U.S. Bancorp Fund Services, LLC, d/b/a U.S. Bank Global Fund Services (“Fund Services”) provides the Fund with administrative, accounting, and transfer agent services. As administrator, Fund Services is responsible for activities such as (i) preparing various federal and state regulatory filings, reports, and returns for the Fund, (ii) preparing reports and materials to be supplied to the Board, (iii) monitoring the activities of the Fund’s custodian, transfer agent, and accountants, and (iv) coordinating the preparation and payment of the Fund’s expenses and reviewing the Fund’s expense accruals. U.S. Bank N.A., an affiliate of Fund Services, serves as the Fund’s custodian. The servicing agreements between the Trust, Fund Services, and U.S. Bank N.A. contain a fee schedule that is inclusive of administrative, accounting, custody, and transfer agent fees. The administrative, accounting, custody, and transfer agent fees expensed by the Fund during fiscal year 2022 are included in the Statement of Operations.
Quasar Distributors, LLC, a wholly owned broker-dealer subsidiary of Foreside Financial Group, LLC, acts as the Fund’s principal underwriter in a continuous public offering of Fund shares.
The officers of the Fund are affiliated with the Advisor. With the exception of the Chief Compliance Officer and, for a portion of the fiscal year, the Senior Compliance Officer, such officers receive no compensation from the Fund for serving in their respective roles. The Fund, along with the other funds in the Hennessy Funds family
| HENNESSY FUNDS | 1-800-966-4354 | |
(collectively, the “Hennessy Funds”), makes reimbursement payments on an equal basis to the Advisor for a portion of the salary and benefits associated with the office of the Chief Compliance Officer and, for a portion of the fiscal year, for all of the salary and benefits associated with the office of the Senior Compliance Officer. The compliance fees expensed by the Fund during fiscal year 2022 for reimbursement payments to the Advisor are included in the Statement of Operations.
6). GUARANTEES AND INDEMNIFICATIONS
Under the Hennessy Funds’ organizational documents, their officers and trustees are indemnified by the Hennessy Funds against certain liabilities arising out of the performance of their duties to the Hennessy Funds. Additionally, in the normal course of business, the Hennessy Funds enter into contracts with service providers that contain general indemnification clauses. The Fund’s maximum exposure under these arrangements is unknown as this would involve future claims that may be made against the Fund that have not yet occurred. Currently, the Fund expects the risk of loss to be remote.
7). LINE OF CREDIT
The Fund has an uncommitted line of credit with the other Hennessy Funds in the amount of the lesser of (i) $100,000,000 or (ii) 33.33% of each Hennessy Fund’s net assets, or 30% for the Hennessy Gas Utility Fund, the Hennessy Japan Fund, and the Hennessy Japan Small Cap Fund and 10% for the Hennessy Balanced Fund. The line of credit is intended to provide any necessary short-term financing in connection with shareholder redemptions, subject to certain restrictions. The credit facility is with the Hennessy Funds’ custodian bank, U.S. Bank N.A. Borrowings under this arrangement bear interest at the bank’s prime rate and are secured by all of the Fund’s assets (as to its own borrowings only). During fiscal year 2022, the Fund had an outstanding average daily balance and a weighted average interest rate of $216,471 and 3.41%, respectively. The interest expensed by the Fund during fiscal year 2022 is included in the Statement of Operations. The maximum amount outstanding for the Fund during fiscal year 2022 was $15,682,000. As of October 31, 2022, the Fund did not have any borrowings outstanding under the line of credit.
8). FEDERAL TAX INFORMATION
As of October 31, 2022, the components of accumulated earnings (losses) for income tax purposes were as follows:
| | | Investments | |
| Cost of investments for tax purposes | | $ | 88,473,838 | |
| Gross tax unrealized appreciation | | $ | 29,900,101 | |
| Gross tax unrealized depreciation | | | (3,954,437 | ) |
| Net tax unrealized appreciation/(depreciation) | | $ | 25,945,664 | |
| Undistributed ordinary income | | $ | 252,167 | |
| Undistributed long-term capital gains | | | 8,333,428 | |
| Total distributable earnings | | $ | 8,585,595 | |
| Other accumulated gain/(loss) | | $ | — | |
| Total accumulated gain/(loss) | | $ | 34,531,259 | |
The difference between book-basis unrealized appreciation/depreciation and tax-basis unrealized appreciation/depreciation (as shown above) is attributable primarily to wash sales.
As of October 31, 2022, the Fund had no tax-basis capital losses to offset future capital gains.
| NOTES TO THE FINANCIAL STATEMENTS |
As of October 31, 2022, the Fund did not defer, on a tax basis, any late-year ordinary losses. Late-year ordinary losses are net ordinary losses incurred after December 31, 2021, but within the taxable year, that are deemed to arise on the first day of the Fund’s next taxable year.
During fiscal years 2022 and 2021, the tax character of distributions paid by the Fund was as follows:
| | | Year Ended | | | Year Ended | |
| | | October 31, 2022 | | | October 31, 2021 | |
Ordinary income(1) | | $ | 1,378,796 | | | $ | 906,557 | |
| Long-term capital gains | | | 485,383 | | | | — | |
| Total distributions | | $ | 1,864,179 | | | $ | 906,557 | |
(1) Ordinary income includes short-term capital gains.
9). LIBOR TRANSITION
The Fund invests in financial instruments with payment obligations, financing terms, hedging strategies, or investment values based on, among other floating rates, LIBOR. Determined by the ICE Benchmark Administration, LIBOR is an average interest rate that banks charge one another for the use of short-term money. In 2017, the United Kingdom’s Financial Conduct Authority (the “FCA”), which regulates LIBOR, announced plans to phase out the use of LIBOR by the end of 2021. Most LIBOR settings are no longer being published as of December 31, 2021, and the FCA and ICE Benchmark Administrator have announced that a majority of U.S. dollar LIBOR settings will cease publication after June 30, 2023. The U.S. Federal Reserve has begun publishing the Secured Overnight Financing Rate (SOFR), which is intended to replace the U.S. dollar LIBOR. Other regulators and industry groups around the world have announced or begun publishing proposed alternative reference rates for other currencies, but global consensus is lacking, and the process for amending many existing contracts or instruments to transition away from LIBOR remains unclear. Uncertainty related to the liquidity impact of the change in reference rates and how to appropriately adjust these rates at the time of transition may lead to increased volatility and illiquidity in markets tied to LIBOR, reduce the value of LIBOR-related instruments, and reduce the effectiveness of hedging strategies, which could adversely affect the Fund’s performance. Moreover, the risks associated with this discontinuation and transition could be exacerbated if the work necessary to effect an orderly transition to an alternative reference rate is not completed in a timely manner. Accordingly, it is difficult to predict the full impact of the transition away from LIBOR on the Fund until new reference rates and fallbacks for both legacy and new instruments and contracts are commercially accepted and market practices become settled.
10). MARKET DISRUPTION AND GEOPOLITICAL RISKS
Certain local, regional, or global events such as wars, terrorism, pandemics or other public health mattes, and other geopolitical events could have a significant impact on securities markets generally or individual securities or instruments. For example, following Russia’s invasion of Ukraine, the President of the United States signed an Executive Order in February 2022 prohibiting U.S. persons from entering transactions with the Central Bank of Russia. Similarly, in June 2021, the President of the United States signed an Executive Order affirming and expanding the U.S. policy prohibiting U.S. persons from purchasing or investing in publicly-traded securities of companies identified by the U.S. Government as “Chinese Military-Industrial Complex Companies.” The list of such companies can change from time to time and the Advisor may be forced to hold securities it desires to sell or to
| HENNESSY FUNDS | 1-800-966-4354 | |
sell securities it desires to buy, or the Advisor may not be able to participate in an investment it otherwise believes is attractive. The occurrence and duration of these types of events are hard to predict and could adversely affect the Fund’s performance.
11). EVENTS SUBSEQUENT TO YEAR END
Management has evaluated the Fund’s related events and transactions that occurred subsequent to October 31, 2022, through the date of issuance of the Fund’s financial statements. Other than as disclosed below, management has determined that there were no subsequent events requiring recognition or disclosure in the financial statements.
On December 8, 2022, capital gains were declared and paid to shareholders of record on December 7, 2022, as follows:
| | | Long-term | |
| | Investor Class | 2.16533 | |
| | Institutional Class | 1.26700 | |
| NOTES/REPORT OF INDEPENDENT REGISTERED PUBLIC ACCOUNTING FIRM |
Report of Independent Registered Public
Accounting Firm
To the Board of Trustees of Hennessy Funds Trust
and the shareholders of the Hennessy Small Cap Financial Fund
Novato, CA
Opinion on the Financial Statements
We have audited the accompanying statement of assets and liabilities of the Hennessy Small Cap Financial Fund (the “Fund”), a series of Hennessy Funds Trust, including the schedule of investments, as of October 31, 2022, the related statement of operations for the year then ended, the statements of changes in net assets for each of the two years in the period then ended, financial highlights for each of the five years in the period then ended, and the related notes (collectively referred to as the “financial statements”). In our opinion, the financial statements present fairly, in all material respects, the financial position of the Fund as of October 31, 2022, the results of its operations for the year then ended, the changes in its net assets for each of the two years in the period then ended, and the financial highlights for each of the five years in the period then ended, in conformity with accounting principles generally accepted in the United States of America.
Basis for Opinion
These financial statements are the responsibility of the Fund’s management. Our responsibility is to express an opinion on the Fund’s financial statements based on our audits. We are a public accounting firm registered with the Public Company Accounting Oversight Board (United States) (“PCAOB”) and are required to be independent with respect to the Fund in accordance with the U.S. federal securities laws and the applicable rules and regulations of the Securities and Exchange Commission and the PCAOB. We have served as the auditor of one or more of the funds in the Trust since 2002.
We conducted our audits in accordance with the standards of the PCAOB. Those standards require that we plan and perform the audit to obtain reasonable assurance about whether the financial statements are free of material misstatement, whether due to error or fraud. The Fund is not required to have, nor were we engaged to perform, an audit of its internal control over financial reporting. As part of our audits we are required to obtain an understanding of internal control over financial reporting, but not for the purpose of expressing an opinion on the effectiveness of the Fund’s internal control over financial reporting. Accordingly, we express no such opinion.
Our audits included performing procedures to assess the risks of material misstatement of the financial statements, whether due to error or fraud, and performing procedures that respond to those risks. Such procedures included examining, on a test basis, evidence regarding the amounts and disclosures in the financial statements. Our audits also included evaluating the accounting principles used and significant estimates made by management, as well as evaluating the overall presentation of the financial statements. Our procedures included confirmation of securities owned as of October 31, 2022 by correspondence with the custodian and brokers; when replies were not received from brokers, we performed other auditing procedures. We believe that our audits provide a reasonable basis for our opinion.
| | |
| | TAIT, WELLER & BAKER LLP |
Philadelphia, Pennsylvania
December 22, 2022
| HENNESSY FUNDS | 1-800-966-4354 | |
Trustees and Officers of the Fund (Unaudited)
The business and affairs of the Funds are managed under the direction of the Board of Trustees of the Trust, and the Board of Trustees elects the officers of the Trust. From time to time, the Board of Trustees also has appointed advisers to the Board of Trustees (“Advisers”) with the intention of having qualified individuals serve in an advisory capacity to garner experience in the mutual fund and asset management industry and be considered as potential Trustees in the future. There are currently two Advisers, Brian Alexander and Doug Franklin. As Advisers, Mr. Alexander and Mr. Franklin attend meetings of the Board of Trustees and act as non-voting participants. Information pertaining to the Trustees, Advisers, and the officers of the Trust is set forth below. The Trustees and officers serve until their successors are duly elected and qualified or until their earlier death, resignation, or removal. Each Trustee oversees all 16 Hennessy Funds. Unless otherwise indicated, the address of all persons listed below is 7250 Redwood Boulevard, Suite 200, Novato, CA 94945. The Fund’s Statement of Additional Information includes more information about the persons listed below and is available without charge by calling 1-800-966-4354 or by visiting www.hennessyfunds.com.
| | | | Other |
| | | | Directorships |
| | | | Held Outside |
| Name, Age, | | | of Fund |
| and Position Held | Start Date | Principal Occupation(s) | Complex During |
with the Trust | of Service | During Past Five Years | Past Five Years |
| Disinterested Trustees and Advisers | | | |
| | | | |
| J. Dennis DeSousa | January 1996 | Mr. DeSousa is a real estate investor. | None. |
| 86 | | | |
| Trustee | | | |
| | | | |
| Robert T. Doyle | January 1996 | Mr. Doyle is retired. He served as the | None. |
| 75 | | Sheriff of Marin County, California | |
| Trustee | | from 1996 – June 2022. | |
| | | | |
| Claire Garvie | December 2015 | Ms. Garvie is a founder of Kiosk and | None. |
| 48 | as an Adviser | has served as its Chief Operating | |
| Trustee | to the Board | Officer since 2004. Kiosk is a full- | |
| | and | service marketing agency with | |
| | December 2021 | offices in the San Francisco Bay Area | |
| | as a Trustee | and Liverpool, UK and staff across | |
| | | nine states in the U.S. | |
| | | | |
| Gerald P. Richardson | May 2004 | Mr. Richardson is an independent | None. |
| 77 | | consultant in the securities industry. | |
| Trustee | | | |
| TRUSTEES AND OFFICERS OF THE FUND |
| | | | Other |
| | | | Directorships |
| | | | Held Outside |
| Name, Age, | | | of Fund |
| and Position Held | Start Date | Principal Occupation(s) | Complex During |
with the Trust | of Service | During Past Five Years | Past Five Years |
| Brian Alexander | March 2015 | Mr. Alexander has worked for the | None. |
| 41 | | Sutter Health organization since | |
| Adviser to the Board | | 2011 in various positions. He has | |
| | | served as the Chief Executive Officer | |
| | | of the North Valley Hospital Area | |
| | | since 2021. From 2018 to 2021, he | |
| | | served as the Chief Executive Officer | |
| | | of Sutter Roseville Medical Center. | |
| | | From 2016 through 2018, he served | |
| | | as the Vice President of Strategy for | |
| | | the Sutter Health Valley Area, which | |
| | | includes 11 hospitals, 13 ambulatory | |
| | | surgery centers, 16,000 employees, | |
| | | and 1,900 physicians. | |
| | | | |
| Doug Franklin | March 2016 | Mr. Franklin is a retired insurance | None. |
| 58 | | industry executive. From 1987 | |
| Adviser to the Board | | through 2015, he was employed by | |
| | | the Allianz-Fireman’s Fund Insurance | |
| | | Company in various positions, | |
| | | including as its Chief Actuary and | |
| | | Chief Risk Officer. | |
| | | | |
Interested Trustee(1) | | | |
| | | | |
| Neil J. Hennessy | January 1996 as | Mr. Hennessy has been employed | Hennessy |
| 66 | a Trustee and | by Hennessy Advisors, Inc. since | Advisors, Inc. |
| Chairman of the Board, | June 2008 as | 1989 and currently serves as its | |
| Chief Market Strategist, | an officer | Chairman and Chief Executive Officer. | |
| Portfolio Manager, | | | |
| and President | | | |
| | | | |
| Name, Age, | | | |
| and Position Held | Start Date | Principal Occupation(s) | |
with the Trust | of Service | During Past Five Years | |
| Officers | | | |
| | | | |
| Teresa M. Nilsen | January 1996 | Ms. Nilsen has been employed by Hennessy Advisors, Inc. | |
| 56 | | since 1989 and currently serves as its President, Chief | |
| Executive Vice President | | Operating Officer, and Secretary. | |
| and Treasurer | | | |
| | | | |
| Daniel B. Steadman | March 2000 | Mr. Steadman has been employed by Hennessy Advisors, Inc. | |
| 66 | | since 2000 and currently serves as its Executive Vice President. | |
| Executive Vice President’ | | | |
| and Secretary | | | |
| | | | |
| Brian Carlson | December 2013 | Mr. Carlson has been employed by Hennessy Advisors, Inc. | |
| 50 | | since December 2013 and currently serves as its Chief | |
| Senior Vice President | | Compliance Officer and Senior Vice President. | |
| and Head of Distribution | | | |
| HENNESSY FUNDS | 1-800-966-4354 | |
| Name, Age, | | |
| and Position Held | Start Date | Principal Occupation(s) |
with the Trust | of Service | During Past Five Years |
Jennifer Cheskiewicz(2) | June 2013 | Ms. Cheskiewicz has been employed by Hennessy Advisors, Inc. |
| 45 | | as its General Counsel since June 2013. |
| Senior Vice President and | | |
| Chief Compliance Officer | | |
| | | |
David Ellison(3) | October 2012 | Mr. Ellison has been employed by Hennessy Advisors, Inc. since |
| 64 | | October 2012. He has served as a Portfolio Manager of the |
| Senior Vice President | | Hennessy Large Cap Financial Fund and the Hennessy Small |
| and Portfolio Manager | | Cap Financial Fund since their inception. Mr. Ellison also served |
| | | as a Portfolio Manager of the Hennessy Technology Fund from |
| | | its inception until February 2017. Mr. Ellison served as Director, |
| | | CIO, and President of FBR Fund Advisers, Inc. from December |
| | | 1999 to October 2012. |
| | | |
Ryan Kelley(4) | March 2013 | Mr. Kelley has been employed by Hennessy Advisors, Inc. since |
| 50 | | October 2012. He has served as Chief Investment Officer of the |
| Chief Investment Officer, | | Hennessy Funds since March 2021 and has served as a Portfolio |
| Senior Vice President, | | Manager of the Hennessy Gas Utility Fund, the Hennessy Large |
| and Portfolio Manager | | Cap Financial Fund, and the Hennessy Small Cap Financial Fund |
| | | since October 2014. Mr. Kelley served as Co-Portfolio Manager |
| | | of these same funds from March 2013 through September |
| | | 2014 and as a Portfolio Analyst for the Hennessy Funds from |
| | | October 2012 through February 2013. He has also served as a |
| | | Portfolio Manager of the Hennessy Cornerstone Growth Fund, |
| | | the Hennessy Cornerstone Mid Cap 30 Fund, the Hennessy |
| | | Cornerstone Large Growth Fund, and the Hennessy |
| | | Cornerstone Value Fund since February 2017 and as a Portfolio |
| | | Manager of the Hennessy Total Return Fund, the Hennessy |
| | | Balanced Fund, and the Hennessy Technology Fund since May |
| | | 2018. He served as Co-Portfolio Manager of the Hennessy |
| | | Technology Fund from February 2017 until May 2018. Mr. Kelley |
| | | served as Portfolio Manager of FBR Fund Advisers, Inc. from |
| | | January 2008 to October 2012. |
| | | |
L. Joshua Wein(4) | September 2018 | Mr. Wein has been employed by Hennessy Advisors, Inc. since |
| 49 | | 2018. He has served as Co-Portfolio Manager of the Hennessy |
| Vice President and | | Cornerstone Growth Fund, the Hennessy Cornerstone |
| Co-Portfolio Manager | | Mid Cap 30 Fund, the Hennessy Cornerstone Large Growth |
| | | Fund, the Hennessy Cornerstone Value Fund, Hennessy Total |
| | | Return Fund, the Hennessy Balanced Fund, the Hennessy Gas |
| | | Utility Fund, and the Hennessy Technology Fund since February |
| | | 2019. He served as a Senior Analyst of these same funds from |
| | | September 2018 through February 2019. Mr. Wein served as |
| | | Director of Alternative Investments and Co-Portfolio Manager |
| | | at Sterling Capital Management from 2008 to 2018. |
_______________
(1) | Mr. Hennessy is considered an “interested person,” as defined in the Investment Company Act of 1940, as amended, because he is an officer of the Trust. |
(2) | The address of this officer is 4800 Bee Caves Road, Suite 100, Austin, TX 78746. |
(3) | The address of this officer is 101 Federal Street, Suite 1615B, Boston, MA 02110. |
(4) | The address of this officer is 1340 Environ Way, Chapel Hill, NC 27517. |
| TRUSTEES AND OFFICERS OF THE FUND |
(This Page Intentionally Left Blank.)
| HENNESSY FUNDS | 1-800-966-4354 | |
Expense Example (Unaudited)
October 31, 2022
As a shareholder of the Fund, you incur ongoing costs, including management fees, service fees, and other Fund expenses. This Example is intended to help you understand your ongoing costs (in dollars) of investing in the Fund and to compare these costs with the ongoing costs of investing in other mutual funds. The Example is based on an investment of $1,000 invested at the beginning of the period and held for the entire period from May 1, 2022, through October 31, 2022.
Actual Expenses
In the table below, the first line under each of the “Investor Class” and “Institutional Class” headings provides information about actual account values and actual expenses for each share class. You may use this information, together with the amount you invested, to estimate the expenses that you paid over the period. Simply divide your account value by $1,000 (for example, an $8,600 account value divided by $1,000 = 8.6), then multiply the result by the number in the first line under the heading “Expenses Paid During Period” to estimate the expenses you paid on your account during this period. Although the Fund charges no sales loads or transaction fees, you will be assessed fees for outgoing wire transfers, returned checks, and stop payment orders at prevailing rates charged by U.S. Bank Global Fund Services, the Fund’s transfer agent. If you request that a redemption be made by wire transfer, the Fund’s transfer agent charges a $15 fee. IRAs are charged a $15 annual maintenance fee (up to $30 maximum per shareholder for shareholders with multiple IRAs). The examples below include, but are not limited to, management, shareholder servicing, accounting, custody, and transfer agent fees. However, the examples below do not include portfolio trading commissions and related expenses.
Hypothetical Example for Comparison Purposes
In the table below, the second line under each of the “Investor Class” and “Institutional Class” headings provides information about hypothetical account values and hypothetical expenses based on the Fund’s actual expense ratio for each share class and an assumed rate of return of 5% per year before expenses, which is not the Fund’s actual return for such share class. The hypothetical account values and expenses may not be used to estimate the actual ending account balance or expenses you paid for the period. You may use this information to compare the ongoing costs of investing in the Fund and other funds. To do so, compare these 5% hypothetical examples with the 5% hypothetical examples that appear in the shareholder reports of the other funds. Please note that the expenses shown in the table are meant to highlight your ongoing costs only. Therefore, the second lines under “Investor Class” and “Institutional Class” are useful in comparing ongoing costs only and will not help you determine the relative total costs of owning different funds.
| | | | Expenses Paid |
| | Beginning | Ending | During Period(1) |
| | Account Value | Account Value | May 1, 2022 – |
| | May 1, 2022 | October 31, 2022 | October 31, 2022 |
| Investor Class | | | |
| Actual | $1,000.00 | $1,075.50 | $8.63 |
| Hypothetical (5% return before expenses) | $1,000.00 | $1,016.89 | $8.39 |
| | | | |
| Institutional Class | | | |
| Actual | $1,000.00 | $1,078.20 | $6.55 |
| Hypothetical (5% return before expenses) | $1,000.00 | $1,018.90 | $6.36 |
(1) | Expenses are equal to the Fund’s annualized expense ratio of 1.65% for Investor Class shares or 1.25% for Institutional Class shares, as applicable, multiplied by the average account value over the period, multiplied by 184/365 days (to reflect the half-year period). |
| HENNESSY FUNDS | 1-800-966-4354 | |
How to Obtain a Copy of the Fund’s Proxy
Voting Policy and Proxy Voting Records
A description of the policies and procedures the Fund uses to determine how to vote proxies relating to portfolio securities is available without charge (1) by calling 1-800-966-4354, (2) on the Hennessy Funds’ website at www.hennessyfunds.com/proxy-voting/voting-policy, or (3) on the U.S. Securities and Exchange Commission’s (the “SEC”) website at www.sec.gov. The Fund’s proxy voting record is available without charge on both the Hennessy Funds’ website at www.hennessyfunds.com/proxy-voting/voting-record and the SEC’s website at www.sec.gov no later than August 31 for the prior 12 months ending June 30.
Availability of Quarterly Portfolio Schedule
The Fund files a complete schedule of portfolio holdings with the SEC for the first and third quarters of each fiscal year as an exhibit to its reports on Form N-PORT. The Fund’s Form N-PORT reports are available on the SEC’s website at www.sec.gov or on request by calling 1-800-966-4354.
Federal Tax Distribution Information (Unaudited)
For fiscal year 2022, certain dividends paid by the Fund may be subject to a maximum tax rate of 23.8%, as provided for by the Jobs and Growth Tax Relief Reconciliation Act of 2003. The percentage of dividends declared from ordinary income designated as qualified dividend income was 100.00%.
For corporate shareholders, the percent of ordinary income distributions that qualified for the corporate dividends received deduction for fiscal year 2022 was 100.00%.
The percentage of taxable ordinary income distributions that were designated as short-term capital gain distributions under Section 871(k)(2)(C) of the Internal Revenue Code of 1986, as amended, for the Fund was 0.00%.
Important Notice Regarding Delivery
of Shareholder Documents
To help keep the Fund’s costs as low as possible, we generally deliver a single copy of shareholder reports, proxy statements, and prospectuses to shareholders who share an address and have the same last name. This process does not apply to account statements. You may request an individual copy of a shareholder document at any time. If you would like to receive separate mailings of shareholder documents, please call U.S. Bank Global Fund Services at 1-800-261-6950 or 1-414-765-4124, and individual delivery will begin within 30 days of your request. If your account is held through a financial institution or other intermediary, please contact such intermediary directly to request individual delivery.
Electronic Delivery
As permitted by SEC regulations, the Fund’s shareholder reports are made available on a website, and unless you sign for eDelivery or elect to receive paper copies as detailed below, you will be notified by mail each time a report is posted and provided with a website link to access the report.
The Fund also offers shareholders the option to receive all notices, account statements, prospectuses, tax forms, and shareholder reports electronically. To sign up for eDelivery or change your delivery preference, please visit www.hennessyfunds.com/account.
To elect to receive paper copies of all future reports free of charge, please call U.S. Bank Global Fund Services at 800-261-6950 or 414-765-4124.
Subscribe to receive our team’s unique market and sector insights delivered to your inbox
www.hennessyfunds.com/subscribe
Follow us on social media
| PROXY VOTING — PRIVACY POLICY |
Liquidity Risk Management Program
In accordance with Rule 22e-4 under the Investment Company Act of 1940, as amended (the “Liquidity Rule”), we have adopted and implemented a liquidity risk management program (the “Liquidity Program”). The purpose of the Liquidity Program is to assess and manage the Fund’s liquidity risk, which is the risk that the Fund would not be able to meet requests to redeem Fund shares without significant dilution of the remaining shareholders’ interests in the Fund. The Board of Trustees of the Fund (the “Board”) designated a committee comprising representatives of Hennessy Advisors, Inc., the investment adviser to the Fund, as the administrator of the Liquidity Program (the “Program Administrator”).
The Program Administrator provided a written report regarding the Liquidity Program to the Board in advance of its meeting on June 1, 2022. The report covered the period from June 1, 2021, through May 31, 2022. The report addressed the operation of the Liquidity Program, assessed the adequacy and effectiveness of its implementation, and described any material changes to the Liquidity Program during the review period. The Trust’s chief compliance officer presented the report to the Board at the meeting and provided additional information regarding the Liquidity Program. The Board reviewed the Liquidity Program and considered, among other items, the following:
| | 1. | The Program Administrator reviewed daily historical net redemption activity during the review period and during prior periods with higher-than-average redemption activity and concluded that the Fund has historically been able to meet requests to redeem Fund shares without significant dilution to the Fund’s remaining shareholders, and the Program Administrator expects the Fund to be able to continue to do so in the future during both normal and reasonably foreseeable stressed conditions. |
| | | |
| | 2. | The Fund primarily holds assets that are highly liquid investments and is therefore not required to establish a highly liquid investment minimum for the Fund or adopt policies and procedures for responding to a highly liquid investment minimum shortfall. |
| | | |
| | 3. | The Program Administrator did not make any material changes to the Liquidity Program during the review period and was not recommending any changes to the Liquidity Program or the model inputs used to determine the liquidity classification of each security held by the Fund. |
| | | |
| | 4. | The Program Administrator concluded that the Liquidity Program was reasonably designed to assess and manage the Fund’s liquidity risk, complies with the requirements of the Liquidity Rule, and was operating as intended during the review period. |
Privacy Policy
We collect the following personal information about you:
| | 1. | Information we receive from you in applications or other forms, correspondence, or conversations, including, but not limited to, your name, address, phone number, social security number, assets, income, and date of birth; |
| | | |
| | 2. | Information about your transactions with us, our affiliates, or others, including, but not limited to, your account number and balance, payments history, parties to transactions, cost basis information, and other financial information; and |
| HENNESSY FUNDS | 1-800-966-4354 | |
| | 3. | Other personal information we collect from various sources, even if you have not entered into a prior transaction with us, including the following: |
| | | • | Name, alias, address, unique personal identifier, online identifier, IP address, email address, telephone number, account name, and other similar identifiers; |
| | | | |
| | | • | Age and marital status; |
| | | | |
| | | • | Commercial information, including records of products purchased; |
| | | | |
| | | • | Browsing history, search history, and information on interaction with our website; |
| | | | |
| | | • | Geolocation data; |
| | | | |
| | | • | Employment and employment history, educational history, financial information, and purchasing and consuming histories or tendencies; and |
| | | | |
| | | • | Inferences drawn from the above-listed information to create a profile about your preferences, characteristics, predispositions, and behavior. |
We collect this information directly from you, indirectly in the course of providing services to you, directly and indirectly from your activity on our website, from broker dealers, marketing agencies, and other third parties that interact with us in connection with the services we perform and products we offer, and from anonymized and aggregated consumer information.
We use this information to fulfill the reason you provided the information to us, to provide you with other relevant products that you request from us, to provide you with information about products that may interest you, to improve our website or present our website’s contents to you, and as otherwise described to you when collecting your personal information.
We do not disclose any personal information to unaffiliated third parties, except as permitted by law. We may disclose your personal information to our affiliates, vendors, and service providers for a business purpose. For example, we are permitted by law to disclose all of the information we collect, as described above, to our transfer agent to process your transactions. When disclosing your personal information to third parties, we enter into a contract with each third party describing the purpose of such disclosure and requiring that such personal information be kept confidential and not used for any purpose except to perform the services contracted or respond to regulatory or law enforcement requests.
Furthermore, we restrict access to your personal information to those persons who require such information to provide products or services to you. As a result, we do not provide a means for opting out of our limited sharing of your information. We maintain physical, electronic, and procedural safeguards that comply with federal standards to guard your personal information.
If you hold shares of the Funds through a financial intermediary, including, but not limited to, a broker-dealer, bank, or trust company, the privacy policy of your financial intermediary governs how your personal information is shared with unaffiliated third parties.
Supplemental Privacy Notice for Residents of California
The California Consumer Privacy Act of 2018 (the “CCPA”) provides you, as a California resident, with certain additional rights relating to your personal information.
Under the CCPA, you have the right to request that we disclose to you the categories of personal information we have collected about you over the past 12 months, the categories of sources of such information, our business purpose for collecting the information, the categories of third parties, if any, with whom we shared the information, and the specific information we have collected about you. You also have the right to request that we delete any of your personal information, and, unless an exception applies, we will delete such information upon receiving and confirming your request. To make a request, call us at 1-800-966-4354, email us at privacy@hennessyfunds.com, or go to www.hennessyfunds.com/contact. We will not discriminate against you for exercising your rights under the CCPA. Further, we will not collect additional categories of your personal information or use the personal information we collected for materially different, unrelated, or incompatible purposes without providing you notice.
| HENNESSY FUNDS | 1-800-966-4354 | |
(This Page Intentionally Left Blank.)
For information, questions, or assistance, please call
The Hennessy Funds
1-800-966-4354 or 1-415-899-1555
INVESTMENT ADVISOR
Hennessy Advisors, Inc.
7250 Redwood Boulevard, Suite 200
Novato, California 94945
ADMINISTRATOR,
TRANSFER AGENT,
DIVIDEND PAYING AGENT, &
SHAREHOLDER SERVICING AGENT
U.S. Bancorp Fund Services, LLC
d/b/a U.S. Bank Global Fund Services
P.O. Box 701
Milwaukee, Wisconsin 53201-0701
CUSTODIAN
U.S. Bank N.A.
Custody Operations
1555 North River Center Drive, Suite 302
Milwaukee, Wisconsin 53212
TRUSTEES
Neil J. Hennessy
Robert T. Doyle
J. Dennis DeSousa
Claire Garvie
Gerald P. Richardson
COUNSEL
Foley & Lardner LLP
777 East Wisconsin Avenue
Milwaukee, Wisconsin 53202-5306
INDEPENDENT REGISTERED
PUBLIC ACCOUNTING FIRM
Tait, Weller & Baker LLP
Two Liberty Place
50 South 16th Street, Suite 2900
Philadelphia, Pennsylvania 19102-2529
DISTRIBUTOR
Quasar Distributors, LLC
111 East Kilbourn Avenue, Suite 1250
Milwaukee, Wisconsin 53202
www.hennessyfunds.com | 800-966-4354
This report has been prepared for shareholders and may be distributed to
others only if preceded or accompanied by a current prospectus.
ANNUAL REPORT
OCTOBER 31, 2022
HENNESSY TECHNOLOGY FUND
Investor Class HTECX
Institutional Class HTCIX
www.hennessyfunds.com | 1-800-966-4354
(This Page Intentionally Left Blank.)
Contents
| Letter to Shareholders | | 2 |
| Performance Overview | | 6 |
| Financial Statements | | |
| Schedule of Investments | | 9 |
| Statement of Assets and Liabilities | | 13 |
| Statement of Operations | | 14 |
| Statements of Changes in Net Assets | | 15 |
| Financial Highlights | | 16 |
| Notes to the Financial Statements | | 20 |
| Report of Independent Registered Public Accounting Firm | | 28 |
| Trustees and Officers of the Fund | | 29 |
| Expense Example | | 32 |
| Proxy Voting Policy and Proxy Voting Records | | 34 |
| Availability of Quarterly Portfolio Schedule | | 34 |
| Federal Tax Distribution Information | | 34 |
| Important Notice Regarding Delivery of Shareholder Documents | | 34 |
| Electronic Delivery | | 34 |
| Liquidity Risk Management Program | | 35 |
| Privacy Policy | | 35 |
| HENNESSY FUNDS | 1-800-966-4354 | |
December 2022
Dear Hennessy Funds Shareholder:
What a year it has been. By the close of the second trading day of 2022, we witnessed new all-time highs in both the S&P 500® Index and the Dow Jones Industrial Average, while the Nasdaq Composite Index hit its all-time high in November 2021. The market’s triumph was short lived, however. By the last day of our fiscal year on October 31, 2022, all three major indices were down significantly, with bleak year-to-date total returns of -8.42%, -17.70%, and -29.32% for the Dow, the S&P 500, and the Nasdaq, respectively. After almost 13 years of incredible resilience following the Financial Crisis of 2008, the equity markets have been shaken by stinging inflation, rapidly rising interest rates, soaring energy costs, and slowing economic growth teetering on recession. While many investors would like to forget 2022, we prefer to maintain perspective in this market downturn.
Time, time, time…. is on my side, yes, it is!
-Rolling Stones, 1964
We believe time is on our side… when it comes to investing. Experiencing negative market movements on any given day can seem disappointing. Downdrafts lasting a month can feel relentless. Almost a full year of negative returns with little respite along the way? That is downright painful. However, equities generally trend up and to the right. Over the past 100 calendar years, the Dow had an average annual total return of 10.25%. While we admit that long-term returns like these make it easy to be a “consummate bull,” market bulls have been right over the long-term. Yet over shorter periods, market returns can be “choppy.”
Looking at the chart below depicting annual total returns of the Dow Jones Industrial Average from 1950 to 2021, we see how volatile the market can be on an annual basis. Investors experienced 16 years of negative returns during this time, the most painful being -31.93% in 2008.
Time is what smooths out choppy markets. When we extend our investing intervals, and stop focusing on annual returns, the ups and downs feel less and less – and appear less and less. The two charts below depict the three-year and five-year rolling average total returns of the Dow over the same time period as the chart above. Each chart shows decreased volatility, with lower peaks and higher troughs, even though the charts show the same cumulative return of the Dow over the past 71 full calendar years.
When we extend our chart out to ten-year rolling averages, we can clearly see how investing over the long-term can make an investor bullish. In the past 71 years, there has never been a negative 10-year rolling average total return of the Dow. Never. The worst ten-year rolling average total return was a positive 0.29%, from 1965 to 1974, a period including the Great Inflation of the 1970s marked by dismal total returns of -13.28% in 1973 and -23.58% in 1974. The ten-year period from 2000 to 2009, which included the Financial Crisis of 2008, produced a positive average annual total return of 1.31%. Note that in the chart below, the line never crosses below zero.
| HENNESSY FUNDS | 1-800-966-4354 | |
When it comes to investing, time, time, time… is on our side, yes, it is! This is why we invest for the long term at Hennessy, focusing on fundamentals, valuations, and strong businesses, ever mindful of downside risk.
Value investing proved its worth this year, and many of our Funds did as well. The Russell 1000® Value Index was only down -7.00% during our fiscal year ended October 31, 2022, trouncing the Russell 1000® Growth Index’s total return of -24.60%. In addition, most of our Funds outperformed the broader market as well as their benchmarks. During the twelve months ended October 31, 2022, the Dow, the S&P 500, and the Nasdaq dropped -6.74%, -14.61%, and -28.56%, respectively, on a total return basis. During this time period when these three major indices saw significant declines, we were pleased that seven of our 16 Funds posted positive total returns, 11 of our 14 domestic Funds outperformed the S&P 500, and over two-thirds of our actively managed, domestic funds outperformed their primary benchmarks.
Top performers of the year included three of our Funds focused on the Energy and Utilities sectors. These sectors have benefitted from the rising cost of energy, as well as an increase in demand that has outpaced growth in supply. The Hennessy Energy Transition Fund, the Hennessy Midstream Fund, and the Hennessy Gas Utility Fund performed exceptionally well with positive total returns of 49.24%, 24.03%, and 10.14%, respectively, during the twelve-month period ended October 31, 2022. On a different note, our two international funds continue to be adversely affected by softening economies in Asia, rising interest rates, and growth to value rotation. The Hennessy Japan Fund and the Hennessy Japan Small Cap Fund experienced negative total returns of -37.86% and -27.35%, respectively, during our fiscal year.
Notwithstanding a difficult market environment over the last twelve months, we believe that the outlook for U.S. stocks remains positive. We continue to believe that equities are attractive from a valuation standpoint, even as interest rates rise. We believe that the prospect of slower economic growth may dampen inflationary pressures. While the Federal Reserve has raised rates several times in calendar 2022, we believe tempered inflation will allow the potential for the Federal Reserve to take a more neutral stance toward future rate hikes. We remain bullish on equities long term. The unemployment rate is near record lows, there are elevated levels of cash on the balance sheets of U.S. companies, and there is the prospect of a more dovish Federal Reserve in 2023. While
volatility and uncertainty may continue to impact the markets in the short term, we encourage investors to stay the course, maintain a diversified portfolio, and keep a long-term perspective.
We thank you for your continued interest in our Funds, and we are grateful for your trust. While we always prefer to post only positive returns for our shareholders, we are pleased that many of our Funds held up better than the broader market during this challenging year. If you have any questions or would like to speak with us, please call us directly at (800) 966-4354.
Best regards,
| |
| |
| |
|
| Ryan C. Kelley, CFA |
| Chief Investment Officer, |
| Senior Vice President, and Portfolio Manager |
Past performance does not guarantee future results.
Mutual fund investing involves risk. Principal loss is possible.
Opinions expressed are those of Ryan C. Kelley and are subject to change, are not guaranteed, and should not be considered investment advice.
The Dow Jones Industrial Average and S&P 500® Index are commonly used to measure the performance of U.S. stocks. The Nasdaq Composite Index comprises all common stocks listed on The Nasdaq Stock Market and is commonly used to measure the performance of technology-related stocks. The indices are used herein for comparative purposes in accordance with SEC regulations. One cannot invest directly in an index. All returns are shown on a total return basis.
| HENNESSY FUNDS | 1-800-966-4354 | |
Performance Overview (Unaudited)
CHANGE IN VALUE OF $10,000 INVESTMENT
This graph illustrates the performance of an initial investment of $10,000 made in the Fund 10 years ago and assumes the reinvestment of dividends and capital gains.
AVERAGE ANNUAL TOTAL RETURN FOR PERIODS ENDED OCTOBER 31, 2022
| | One | Five | Ten |
| | Year | Years | Years |
| Hennessy Technology Fund – | | | |
| Investor Class (HTECX) | -26.44% | 8.97% | 10.27% |
| Hennessy Technology Fund – | | | |
| Institutional Class (HTCIX) | -26.28% | 9.24% | 10.58% |
| Nasdaq Composite Index | -28.56% | 11.32% | 15.20% |
S&P 500® Index | -14.61% | 10.44% | 12.79% |
| Expense ratios: | Gross 2.79%, Net 1.23%(1) (Investor Class); |
| | Gross 2.44%, Net 0.98%(1) (Institutional Class) |
(1) | The Fund’s investment advisor has contractually agreed to limit expenses until February 28, 2023. |
Performance data quoted represents past performance; past performance does not guarantee future results. The investment return and principal value of an investment will fluctuate so that an investor’s shares, when redeemed, may be worth more or less than their original cost. The performance table does not reflect the deduction of taxes that a shareholder would pay on Fund distributions or the redemption of Fund shares. Current performance of the Fund may be lower or higher than the performance quoted. Performance data current to the most recent month end may be obtained by visiting www.hennessyfunds.com.
The Nasdaq Composite Index is a broad-based capitalization-weighted index of all common stocks listed on The Nasdaq Stock Market LLC. The S&P 500® Index is a capitalization-weighted index that is designed to represent the broad domestic economy through changes in the aggregate market value of 500 stocks across all major industries. One cannot invest directly in an index. These indices are used for comparative purposes in accordance with Securities and Exchange Commission regulations.
Standard & Poor’s Financial Services is the source and owner of the S&P® and S&P 500® trademarks.
The expense ratios presented are from the most recent prospectus. The expense ratios for the current reporting period are available in the Financial Highlights section of this report.
PERFORMANCE NARRATIVE
Portfolio Managers Ryan C. Kelley, CFA, and L. Joshua Wein, CAIA
Performance:
For the one-year period ended October 31, 2022, the Investor Class of the Hennessy Technology Fund returned -26.44%, outperforming the Nasdaq Composite Index (the Fund’s primary benchmark), which returned -28.56%, and underperforming the S&P 500® Index, which returned -14.61%, for the same period.
The Fund’s outperformance relative to its primary benchmark resulted predominantly from stock selection within the Information Technology sector. Among the holdings that contributed the most to Fund performance were CommScope Holding Company, Inc., a network infrastructure solutions provider, Sanmina Corporation, a contract manufacturing services company, and Extreme Networks, Inc., a provider of cloud-driven network solutions. Among the holdings that detracted the most from Fund performance were DocuSign, Inc., a provider of electronic signature solutions, Shutterstock, Inc., a global marketplace for commercial digital imagery, and 1-800-Flowers.com, Inc. (Class A), an e-commerce provider of floral products and gifts.
The Fund continues to own all the companies mentioned except CommScope and 1-800-Flowers.com.
Portfolio Strategy:
The Fund utilizes a formula-based investment strategy designed to identify technology-related stocks that (1) exhibit strong cash flows and profits, (2) demonstrate the ability to sustain profitability, (3) have historically delivered returns in excess of their cost of capital, (4) have attractive balance sheet risk profiles, and (5) trade at attractive relative valuations.
Investment Commentary:
Notwithstanding a difficult market environment over the last twelve months, we believe that the outlook for U.S. stocks remains positive. We continue to believe that equities are attractive from a valuation standpoint, even as interest rates rise. While the Federal Reserve has raised rates several times throughout this calendar year, we believe that the prospect of slower economic growth may dampen inflationary pressures. With this possibility comes the potential for the Federal Reserve to take a more neutral stance toward future rate hikes. With the unemployment rate near record lows, high levels of cash on the balance sheets of U.S. companies, and the prospect of a more dovish Federal Reserve in 2023, we remain bullish on equities long-term.
We believe that the outlook for technology-related stocks is also positive. Earnings growth for technology companies, as measured by the technology-heavy Nasdaq Composite Index, has been outpacing earnings growth for the market by a significant margin. We believe that many technology stocks remain attractive compared to the broader stock market, especially given the decline in technology stocks broadly over the past year.
_______________
Opinions expressed are those of the Portfolio Manager as of the date written and are subject to change, are not guaranteed, and should not be considered investment advice or an indication of trading intent.
Investments are focused in the Technology sector as well as the following sub-industries: Internet & Direct Marketing Retail, Interactive Home Entertainment, and Interactive Media Services. Sector funds may be subject to a higher degree of market risk. Investments in foreign securities
| HENNESSY FUNDS | 1-800-966-4354 | |
may involve political, economic, and currency risks, greater volatility, and differences in accounting methods. The Fund invests in small-sized and medium-sized companies, which may have more limited liquidity and greater volatility compared to larger companies. Please see the Fund’s prospectus for a more complete discussion of these and other risks.
References to specific securities should not be considered a recommendation to buy or sell any security. Fund holdings and sector allocations are subject to change. Please refer to the Schedule of Investments included in this report for additional portfolio information.
Earnings growth is not a measure of the Fund’s future performance.
Cash flow refers to the net amount of cash and cash equivalents transferred into and out of a company.
| PERFORMANCE OVERVIEW/SCHEDULE OF INVESTMENTS |
Financial Statements
Schedule of Investments as of October 31, 2022 |
HENNESSY TECHNOLOGY FUND
(% of Net Assets)
| TOP TEN HOLDINGS (EXCLUDING MONEY MARKET FUNDS) | % NET ASSETS |
| Extreme Networks, Inc. | 2.02% |
| A10 Networks, Inc. | 1.85% |
| Enphase Energy, Inc. | 1.85% |
| Check Point Software Technologies Ltd. | 1.83% |
| Hewlett Packard Enterprise Co. | 1.82% |
| Sanmina Corp. | 1.82% |
| ScanSource, Inc. | 1.79% |
| Visa, Inc., Class A | 1.79% |
| Kimball Electronics, Inc. | 1.78% |
| Sciplay Corp. | 1.77% |
Note: For presentation purposes, the Fund has grouped some of the industry categories. For purposes of categorizing securities for compliance with Section 8(b)(1) of the Investment Company Act of 1940, as amended, the Fund uses more specific industry classifications.
The Global Industry Classification Standard (GICS®) was developed by and is the exclusive property and a service mark of MSCI, Inc. and Standard & Poor’s Financial Services LLC. It has been licensed for use by the Hennessy Funds.
| HENNESSY FUNDS | 1-800-966-4354 | |
| COMMON STOCKS – 97.31% | | Number | | | | | | % of | |
| | | of Shares | | | Value | | | Net Assets | |
| Communication Services – 3.27% | | | | | | | | | |
| Sciplay Corp. (a) | | | 6,790 | | | $ | 94,992 | | | | 1.77 | % |
| Shutterstock, Inc. | | | 1,619 | | | | 80,999 | | | | 1.50 | % |
| | | | | | | | 175,991 | | | | 3.27 | % |
| | | | | | | | | | | | | |
| Consumer Discretionary – 1.31% | | | | | | | | | | | | |
| Etsy, Inc. (a) | | | 749 | | | | 70,338 | | | | 1.31 | % |
| | | | | | | | | | | | | |
| Information Technology – 92.73% | | | | | | | | | | | | |
| A10 Networks, Inc. | | | 5,906 | | | | 99,221 | | | | 1.85 | % |
| Accenture PLC, Class A (b) | | | 316 | | | | 89,712 | | | | 1.67 | % |
| Adobe, Inc. (a) | | | 290 | | | | 92,365 | | | | 1.72 | % |
| Apple, Inc. | | | 618 | | | | 94,764 | | | | 1.76 | % |
| Applied Materials, Inc. | | | 988 | | | | 87,231 | | | | 1.62 | % |
| Arrow Electronics, Inc. (a) | | | 883 | | | | 89,413 | | | | 1.66 | % |
| ASML Holding NV – ADR (b) | | | 185 | | | | 87,398 | | | | 1.63 | % |
| Atlassian Corp. (a) | | | 352 | | | | 71,361 | | | | 1.33 | % |
| Autodesk, Inc. (a) | | | 422 | | | | 90,435 | | | | 1.68 | % |
| Automatic Data Processing, Inc. | | | 362 | | | | 87,495 | | | | 1.63 | % |
| Avnet, Inc. | | | 2,217 | | | | 89,101 | | | | 1.66 | % |
| Cadence Design Systems, Inc. (a) | | | 509 | | | | 77,058 | | | | 1.43 | % |
| CDW Corp. | | | 541 | | | | 93,490 | | | | 1.74 | % |
| Check Point Software Technologies Ltd. (a)(b) | | | 760 | | | | 98,215 | | | | 1.83 | % |
| CommVault Systems, Inc. (a) | | | 1,539 | | | | 93,710 | | | | 1.74 | % |
| Crowdstrike Holdings, Inc. (a) | | | 482 | | | | 77,698 | | | | 1.45 | % |
| Dell Technologies, Inc. | | | 2,271 | | | | 87,206 | | | | 1.62 | % |
| Dlocal Ltd. (a)(b) | | | 3,644 | | | | 81,261 | | | | 1.51 | % |
| DocuSign, Inc. (a) | | | 1,597 | | | | 77,135 | | | | 1.43 | % |
| Enphase Energy, Inc. (a) | | | 324 | | | | 99,468 | | | | 1.85 | % |
| Extreme Networks, Inc. (a) | | | 6,046 | | | | 108,465 | | | | 2.02 | % |
| Fortinet, Inc. (a) | | | 1,600 | | | | 91,456 | | | | 1.70 | % |
| Gartner, Inc. (a) | | | 290 | | | | 87,557 | | | | 1.63 | % |
| Hewlett Packard Enterprise Co. | | | 6,855 | | | | 97,821 | | | | 1.82 | % |
| Intel Corp. | | | 3,161 | | | | 89,867 | | | | 1.67 | % |
| Jabil, Inc. | | | 1,388 | | | | 89,179 | | | | 1.66 | % |
| Kimball Electronics, Inc. (a) | | | 4,639 | | | | 95,888 | | | | 1.78 | % |
| KLA-Tencor Corp. | | | 262 | | | | 82,910 | | | | 1.54 | % |
The accompanying notes are an integral part of these financial statements.
| COMMON STOCKS | | Number | | | | | | % of | |
| | | of Shares | | | Value | | | Net Assets | |
| Information Technology (Continued) | | | | | | | | | |
| KnowBe4, Inc. (a) | | | 3,850 | | | $ | 94,633 | | | | 1.76 | % |
| Lam Research Corp. | | | 220 | | | | 89,052 | | | | 1.66 | % |
| Mastercard, Inc., Class A | | | 286 | | | | 93,860 | | | | 1.75 | % |
| Microsoft Corp. | | | 348 | | | | 80,781 | | | | 1.50 | % |
| MKS Instruments, Inc. | | | 971 | | | | 79,768 | | | | 1.48 | % |
| NetApp, Inc. | | | 1,304 | | | | 90,328 | | | | 1.68 | % |
| Palo Alto Networks, Inc. (a) | | | 486 | | | | 83,393 | | | | 1.55 | % |
| Paychex, Inc. | | | 740 | | | | 87,549 | | | | 1.63 | % |
| Paycom Software, Inc. (a) | | | 246 | | | | 85,116 | | | | 1.58 | % |
| Pure Storage, Inc. (a) | | | 2,968 | | | | 91,592 | | | | 1.70 | % |
| Qorvo, Inc. (a) | | | 993 | | | | 85,477 | | | | 1.59 | % |
| QUALCOMM, Inc. | | | 688 | | | | 80,950 | | | | 1.51 | % |
| Sanmina Corp. (a) | | | 1,741 | | | | 97,583 | | | | 1.82 | % |
| ScanSource, Inc. (a) | | | 3,099 | | | | 96,007 | | | | 1.79 | % |
| Seagate Technology Holdings PLC (b) | | | 1,540 | | | | 76,476 | | | | 1.42 | % |
| ServiceNow, Inc. (a) | | | 202 | | | | 84,989 | | | | 1.58 | % |
| SMART Global Holdings, Inc. (a)(b) | | | 5,395 | | | | 72,994 | | | | 1.36 | % |
| Splunk, Inc. (a) | | | 1,105 | | | | 91,837 | | | | 1.71 | % |
| STMicroelectronics NV – ADR (b) | | | 2,503 | | | | 77,893 | | | | 1.45 | % |
| StoneCo Ltd. (a)(b) | | | 7,268 | | | | 76,314 | | | | 1.42 | % |
| Taiwan Semiconductor Manufacturing Co. Ltd. – ADR (b) | | | 1,169 | | | | 71,952 | | | | 1.34 | % |
| Telefonaktiebolaget LM Ericsson – ADR (b) | | | 13,950 | | | | 77,702 | | | | 1.45 | % |
| Teradata Corp. (a) | | | 2,709 | | | | 85,577 | | | | 1.59 | % |
| Texas Instruments, Inc. | | | 517 | | | | 83,046 | | | | 1.54 | % |
| The Western Union Co. | | | 6,101 | | | | 82,425 | | | | 1.53 | % |
| Visa, Inc., Class A | | | 464 | | | | 96,122 | | | | 1.79 | % |
| Vishay Intertechnology, Inc. | | | 4,435 | | | | 92,736 | | | | 1.72 | % |
| Vontier Corp. | | | 4,798 | | | | 91,642 | | | | 1.70 | % |
| Western Digital Corp. (a) | | | 2,349 | | | | 80,735 | | | | 1.50 | % |
| | | | | | | | 4,985,409 | | | | 92.73 | % |
| | | | | | | | | | | | | |
| Total Common Stocks | | | | | | | | | | | | |
| (Cost $5,349,607) | | | | | | | 5,231,738 | | | | 97.31 | % |
The accompanying notes are an integral part of these financial statements.
| HENNESSY FUNDS | 1-800-966-4354 | |
| SHORT-TERM INVESTMENTS – 2.96% | | Number | | | | | | % of | |
| | | of Shares | | | Value | | | Net Assets | |
| Money Market Funds – 2.96% | | | | | | | | | |
| First American Government Obligations Fund, | | | | | | | | | |
| Institutional Class, 2.93% (c) | | | 158,909 | | | $ | 158,909 | | | | 2.96 | % |
| | | | | | | | | | | | | |
| Total Short-Term Investments | | | | | | | | | | | | |
| (Cost $158,909) | | | | | | | 158,909 | | | | 2.96 | % |
| | | | | | | | | | | | | |
| Total Investments | | | | | | | | | | | | |
| (Cost $5,508,516) – 100.27% | | | | | | | 5,390,647 | | | | 100.27 | % |
| Liabilities in Excess of Other Assets – (0.27)% | | | | | | | (14,390 | ) | | | (0.27 | )% |
| | | | | | | | | | | | | |
TOTAL NET ASSETS – 100.00% | | | | | | $ | 5,376,257 | | | | 100.00 | % |
Percentages are stated as a percent of net assets.
ADR – American Depositary Receipt
NV – Naamloze Vennootschap is a Dutch term for publicly traded companies.
PLC – Public Limited Company
| (a) | Non-income-producing security. |
| (b) | U.S.-traded security of a foreign corporation. |
| (c) | The rate listed is the fund’s seven-day yield as of October 31, 2022. |
Summary of Fair Value Exposure as of October 31, 2022
The following is a summary of the inputs used to value the Fund’s net assets as of October 31, 2022 (see Note 3 in the accompanying Notes to the Financial Statements):
| Common Stocks | | Level 1 | | | Level 2 | | | Level 3 | | | Total | |
| Communication Services | | $ | 175,991 | | | $ | — | | | $ | — | | | $ | 175,991 | |
| Consumer Discretionary | | | 70,338 | | | | — | | | | — | | | | 70,338 | |
| Information Technology | | | 4,985,409 | | | | — | | | | — | | | | 4,985,409 | |
| Total Common Stocks | | $ | 5,231,738 | | | $ | — | | | $ | — | | | $ | 5,231,738 | |
| Short-Term Investments | | | | | | | | | | | | | | | | |
| Money Market Funds | | $ | 158,909 | | | $ | — | | | $ | — | | | $ | 158,909 | |
| Total Short-Term Investments | | $ | 158,909 | | | $ | — | | | $ | — | | | $ | 158,909 | |
| Total Investments | | $ | 5,390,647 | | | $ | — | | | $ | — | | | $ | 5,390,647 | |
The accompanying notes are an integral part of these financial statements.
| SCHEDULE OF INVESTMENTS/STATEMENT OF ASSETS AND LIABILITIES |
Financial Statements
Statement of Assets and Liabilities as of October 31, 2022 |
| ASSETS: | | | |
| Investments in securities, at value (cost $5,508,516) | | $ | 5,390,647 | |
| Dividends and interest receivable | | | 1,616 | |
| Prepaid expenses and other assets | | | 14,040 | |
| Due from advisor | | | 4,332 | |
| Total assets | | | 5,410,635 | |
| | | | | |
| LIABILITIES: | | | | |
| Payable to auditor | | | 22,747 | |
| Accrued distribution fees | | | 685 | |
| Accrued service fees | | | 323 | |
| Accrued trustees fees | | | 4,694 | |
| Accrued expenses and other payables | | | 5,929 | |
| Total liabilities | | | 34,378 | |
| NET ASSETS | | $ | 5,376,257 | |
| | | | | |
| NET ASSETS CONSISTS OF: | | | | |
| Capital stock | | $ | 6,388,291 | |
| Accumulated deficit | | | (1,012,034 | ) |
| Total net assets | | $ | 5,376,257 | |
| | | | | |
| NET ASSETS: | | | | |
| Investor Class | | | | |
| Shares authorized (no par value) | | Unlimited | |
| Net assets applicable to outstanding shares | | $ | 3,988,788 | |
| Shares issued and outstanding | | | 269,287 | |
| Net asset value, offering price, and redemption price per share | | $ | 14.81 | |
| | | | | |
| Institutional Class | | | | |
| Shares authorized (no par value) | | Unlimited | |
| Net assets applicable to outstanding shares | | $ | 1,387,469 | |
| Shares issued and outstanding | | | 90,893 | |
| Net asset value, offering price, and redemption price per share | | $ | 15.26 | |
The accompanying notes are an integral part of these financial statements.
| HENNESSY FUNDS | 1-800-966-4354 | |
Financial Statements
Statement of Operations for the year ended October 31, 2022 |
| INVESTMENT INCOME: | | | |
Dividend income(1) | | $ | 79,326 | |
| Interest income | | | 1,039 | |
| Total investment income | | | 80,365 | |
| | | | | |
| EXPENSES: | | | | |
| Investment advisory fees (See Note 5) | | | 47,434 | |
| Federal and state registration fees | | | 30,649 | |
| Compliance expense (See Note 5) | | | 24,520 | |
| Audit fees | | | 22,743 | |
| Administration, accounting, custody, and transfer agent fees (See Note 5) | | | 19,370 | |
| Trustees’ fees and expenses | | | 16,027 | |
| Distribution fees – Investor Class (See Note 5) | | | 7,213 | |
| Reports to shareholders | | | 6,624 | |
| Sub-transfer agent expenses – Investor Class (See Note 5) | | | 5,939 | |
| Sub-transfer agent expenses – Institutional Class (See Note 5) | | | 629 | |
| Service fees – Investor Class (See Note 5) | | | 4,809 | |
| Legal fees | | | 101 | |
| Other expenses | | | 4,903 | |
| Total expenses before waivers and reimbursements | | | 190,961 | |
| Service provider expense waiver (See Note 5) | | | (19,370 | ) |
| Expense reimbursement from advisor – Investor Class (See Note 5) | | | (73,628 | ) |
| Expense reimbursement from advisor – Institutional Class (See Note 5) | | | (23,122 | ) |
| Net expenses | | | 74,841 | |
| NET INVESTMENT INCOME | | $ | 5,524 | |
| | | | | |
| REALIZED AND UNREALIZED GAINS (LOSSES): | | | | |
| Net realized loss on investments | | $ | (867,706 | ) |
| Net change in unrealized appreciation/depreciation on investments | | | (1,169,054 | ) |
| Net loss on investments | | | (2,036,760 | ) |
| NET DECREASE IN NET ASSETS RESULTING FROM OPERATIONS | | $ | (2,031,236 | ) |
(1) | Net of foreign taxes withheld and issuance fees of $4,740. |
The accompanying notes are an integral part of these financial statements.
| STATEMENT OF OPERATIONS/STATEMENTS OF CHANGES IN NET ASSETS |
Financial Statements
| Statements of Changes in Net Assets |
| | | Year Ended | | | Year Ended | |
| | | October 31, 2022 | | | October 31, 2021 | |
| OPERATIONS: | | | | | | |
| Net investment income (loss) | | $ | 5,524 | | | $ | (1,224 | ) |
| Net realized gain (loss) on investments | | | (867,706 | ) | | | 2,211,486 | |
| Net change in unrealized | | | | | | | | |
| appreciation/depreciation on investments | | | (1,169,054 | ) | | | 358,442 | |
| Net increase (decrease) in net | | | | | | | | |
| assets resulting from operations | | | (2,031,236 | ) | | | 2,568,704 | |
| | | | | | | | | |
| DISTRIBUTIONS TO SHAREHOLDERS: | | | | | | | | |
| Distributable earnings – Investor Class | | | (1,498,176 | ) | | | (493,580 | ) |
| Distributable earnings – Institutional Class | | | (513,645 | ) | | | (175,930 | ) |
| Total distributions | | | (2,011,821 | ) | | | (669,510 | ) |
| | | | | | | | | |
| CAPITAL SHARE TRANSACTIONS: | | | | | | | | |
| Proceeds from shares subscribed – Investor Class | | | 265,541 | | | | 917,272 | |
| Proceeds from shares subscribed – Institutional Class | | | 89,997 | | | | 57,969 | |
| Dividends reinvested – Investor Class | | | 1,465,101 | | | | 482,162 | |
| Dividends reinvested – Institutional Class | | | 513,645 | | | | 175,930 | |
| Cost of shares redeemed – Investor Class | | | (779,866 | ) | | | (1,006,346 | ) |
| Cost of shares redeemed – Institutional Class | | | (262,162 | ) | | | (125,590 | ) |
| Net increase in net assets derived | | | | | | | | |
| from capital share transactions | | | 1,292,256 | | | | 501,397 | |
| TOTAL INCREASE (DECREASE) IN NET ASSETS | | | (2,750,801 | ) | | | 2,400,591 | |
| | | | | | | | | |
| NET ASSETS: | | | | | | | | |
| Beginning of year | | | 8,127,058 | | | | 5,726,467 | |
| End of year | | $ | 5,376,257 | | | $ | 8,127,058 | |
| | | | | | | | | |
| CHANGES IN SHARES OUTSTANDING: | | | | | | | | |
| Shares sold – Investor Class | | | 16,191 | | | | 35,433 | |
| Shares sold – Institutional Class | | | 5,427 | | | | 2,256 | |
| Shares issued to holders as reinvestment | | | | | | | | |
| of dividends – Investor Class | | | 73,365 | | | | 21,237 | |
| Shares issued to holders as reinvestment | | | | | | | | |
| of dividends – Institutional Class | | | 25,019 | | | | 7,528 | |
| Shares redeemed – Investor Class | | | (45,743 | ) | | | (38,822 | ) |
| Shares redeemed – Institutional Class | | | (14,199 | ) | | | (4,863 | ) |
| Net increase in shares outstanding | | | 60,060 | | | | 22,769 | |
The accompanying notes are an integral part of these financial statements.
| HENNESSY FUNDS | 1-800-966-4354 | |
Financial Statements
For an Investor Class share outstanding throughout each year
PER SHARE DATA:
Net asset value, beginning of year
Income from investment operations:
Net investment income (loss)
Net realized and unrealized gains (losses) on investments
Total from investment operations
Less distributions:
Dividends from net investment income
Dividends from net realized gains
Total distributions
Net asset value, end of year
TOTAL RETURN
SUPPLEMENTAL DATA AND RATIOS:
Net assets, end of year (millions)
Ratio of expenses to average net assets:
Before expense reimbursement
After expense reimbursement
Ratio of net investment income (loss) to average net assets:
Before expense reimbursement
After expense reimbursement
Portfolio turnover rate(4)
(1) | Calculated using the average shares outstanding method. |
(2) | Amount is between $(0.005) and $0.005. |
(3) | Certain service provider expenses were voluntarily waived during the fiscal year. |
(4) | Calculated on the basis of the Fund as a whole. |
The accompanying notes are an integral part of these financial statements.
| FINANCIAL HIGHLIGHTS — INVESTOR CLASS |
| Year Ended October 31, | |
| 2022 | | | 2021 | | | 2020 | | | 2019 | | | 2018 | |
| | | | | | | | | | | | | | |
| $ | 26.89 | | | $ | 20.50 | | | $ | 18.90 | | | $ | 18.04 | | | $ | 18.46 | |
| | | | | | | | | | | | | | | | | | | |
| | | | | | | | | | | | | | | | | | | |
| | 0.00 | (1)(2) | | | (0.02 | )(1) | | | 0.02 | (1) | | | (0.03 | )(1) | | | (0.05 | ) |
| | (5.38 | ) | | | 8.82 | | | | 2.10 | | | | 3.15 | | | | 1.26 | |
| | (5.38 | ) | | | 8.80 | | | | 2.12 | | | | 3.12 | | | | 1.21 | |
| | | | | | | | | | | | | | | | | | | |
| | | | | | | | | | | | | | | | | | | |
| | — | | | | (0.04 | ) | | | — | | | | — | | | | — | |
| | (6.70 | ) | | | (2.37 | ) | | | (0.52 | ) | | | (2.26 | ) | | | (1.63 | ) |
| | (6.70 | ) | | | (2.41 | ) | | | (0.52 | ) | | | (2.26 | ) | | | (1.63 | ) |
| $ | 14.81 | | | $ | 26.89 | | | $ | 20.50 | | | $ | 18.90 | | | $ | 18.04 | |
| | | | | | | | | | | | | | | | | | | |
| | -26.44 | % | | | 45.11 | % | | | 11.42 | % | | | 20.47 | % | | | 7.25 | % |
| | | | | | | | | | | | | | | | | | | |
| | | | | | | | | | | | | | | | | | | |
| $ | 3.99 | | | $ | 6.06 | | | $ | 4.26 | | | $ | 3.89 | | | $ | 3.31 | |
| | | | | | | | | | | | | | | | | | | |
| | 3.06 | % | | | 2.79 | % | | | 3.45 | % | | | 3.84 | % | | | 3.70 | % |
| | 1.23 | %(3) | | | 1.23 | %(3) | | | 1.23 | %(3) | | | 1.23 | % | | | 1.23 | % |
| | | | | | | | | | | | | | | | | | | |
| | (1.81 | )% | | | (1.64 | )% | | | (2.12 | )% | | | (2.80 | )% | | | (2.83 | )% |
| | 0.02 | % | | | (0.08 | )% | | | 0.10 | % | | | (0.19 | )% | | | (0.36 | )% |
| | 151 | % | | | 200 | % | | | 192 | % | | | 185 | % | | | 225 | % |
The accompanying notes are an integral part of these financial statements.
| HENNESSY FUNDS | 1-800-966-4354 | |
Financial Statements
For an Institutional Class share outstanding throughout each year
PER SHARE DATA:
Net asset value, beginning of year
Income from investment operations:
Net investment income
Net realized and unrealized gains (losses) on investments
Total from investment operations
Less distributions:
Dividends from net investment income
Dividends from net realized gains
Total distributions
Net asset value, end of year
TOTAL RETURN
SUPPLEMENTAL DATA AND RATIOS:
Net assets, end of year (millions)
Ratio of expenses to average net assets:
Before expense reimbursement
After expense reimbursement
Ratio of net investment income (loss) to average net assets:
Before expense reimbursement
After expense reimbursement
Portfolio turnover rate(3)
(1) | Calculated using the average shares outstanding method. |
(2) | Certain service provider expenses were voluntarily waived during the fiscal year. |
(3) | Calculated on the basis of the Fund as a whole. |
The accompanying notes are an integral part of these financial statements.
| FINANCIAL HIGHLIGHTS — INSTITUTIONAL CLASS |
| Year Ended October 31, | |
| 2022 | | | 2021 | | | 2020 | | | 2019 | | | 2018 | |
| | | | | | | | | | | | | | |
| $ | 27.65 | | | $ | 21.08 | | | $ | 19.40 | | | $ | 18.47 | | | $ | 18.85 | |
| | | | | | | | | | | | | | | | | | | |
| | | | | | | | | | | | | | | | | | | |
| | 0.05 | (1) | | | 0.05 | (1) | | | 0.07 | (1) | | | 0.01 | (1) | | | 0.01 | |
| | (5.55 | ) | | | 9.06 | | | | 2.15 | | | | 3.23 | | | | 1.28 | |
| | (5.50 | ) | | | 9.11 | | | | 2.22 | | | | 3.24 | | | | 1.29 | |
| | | | | | | | | | | | | | | | | | | |
| | | | | | | | | | | | | | | | | | | |
| | — | | | | (0.11 | ) | | | (0.01 | ) | | | — | | | | — | |
| | (6.89 | ) | | | (2.43 | ) | | | (0.53 | ) | | | (2.31 | ) | | | (1.67 | ) |
| | (6.89 | ) | | | (2.54 | ) | | | (0.54 | ) | | | (2.31 | ) | | | (1.67 | ) |
| $ | 15.26 | | | $ | 27.65 | | | $ | 21.08 | | | $ | 19.40 | | | $ | 18.47 | |
| | | | | | | | | | | | | | | | | | | |
| | -26.28 | % | | | 45.49 | % | | | 11.67 | % | | | 20.77 | % | | | 7.54 | % |
| | | | | | | | | | | | | | | | | | | |
| | | | | | | | | | | | | | | | | | | |
| $ | 1.39 | | | $ | 2.06 | | | $ | 1.47 | | | $ | 1.34 | | | $ | 1.09 | |
| | | | | | | | | | | | | | | | | | | |
| | 2.73 | % | | | 2.44 | % | | | 3.08 | % | | | 3.47 | % | | | 3.27 | % |
| | 0.98 | %(2) | | | 0.98 | %(2) | | | 0.98 | %(2) | | | 0.98 | % | | | 0.98 | % |
| | | | | | | | | | | | | | | | | | | |
| | (1.48 | )% | | | (1.29 | )% | | | (1.74 | )% | | | (2.43 | )% | | | (2.41 | )% |
| | 0.27 | % | | | 0.17 | % | | | 0.36 | % | | | 0.06 | % | | | (0.12 | )% |
| | 151 | % | | | 200 | % | | | 192 | % | | | 185 | % | | | 225 | % |
The accompanying notes are an integral part of these financial statements.
| HENNESSY FUNDS | 1-800-966-4354 | |
Financial Statements
Notes to the Financial Statements October 31, 2022 |
1). ORGANIZATION
The Hennessy Technology Fund (the “Fund”) is a series of Hennessy Funds Trust (the “Trust”), which was organized as a Delaware statutory trust on September 17, 1992. The Fund is an open-end management investment company registered under the Investment Company Act of 1940, as amended. The investment objective of the Fund is long-term capital appreciation. The Fund is a diversified fund.
The Fund offers Investor Class and Institutional Class shares. Each class of shares differs principally in its respective 12b-1 distribution and service, shareholder servicing, and sub-transfer agent expenses. There are no sales charges. Each class has identical rights to earnings, assets, and voting privileges, except for class-specific expenses and exclusive rights to vote on matters affecting only one class.
As an investment company, the Fund follows the investment company accounting and reporting guidance of the Financial Accounting Standards Board (“FASB”) Accounting Standard Codification Topic 946 “Financial Services—Investment Companies.”
2). SIGNIFICANT ACCOUNTING POLICIES
The following is a summary of significant accounting policies consistently followed by the Fund in the preparation of the financial statements. These policies conform to U.S. generally accepted accounting principles (“GAAP”).
| a). | Securities Valuation – All investments in securities are valued in accordance with the Fund’s valuation policies and procedures, as described in Note 3. |
| | |
| b). | Federal Income Taxes – The Fund has elected to be taxed as a regulated investment company and intends to distribute substantially all of its taxable income to its shareholders and otherwise comply with the provisions of the Internal Revenue Code of 1986, as amended, applicable to regulated investment companies. As a result, the Fund has made no provision for federal income taxes or excise taxes. Net investment income/loss and realized gains/losses for federal income tax purposes may differ from those reported in the financial statements because of temporary book-basis and tax-basis differences. Temporary differences are primarily the result of the treatment of wash sales for tax reporting purposes. The Fund recognizes interest and penalties related to income tax benefits, if any, in the Statement of Operations as an income tax expense. Distributions from net realized gains for book purposes may include short-term capital gains, which are included as ordinary income to shareholders for tax purposes. The Fund may utilize equalization accounting for tax purposes and designate earnings and profits, including net realized gains distributed to shareholders on redemption of shares, as part of the dividends paid deduction for income tax purposes. |
| | |
| | Due to inherent differences in the recognition of income, expenses, and realized gains/losses under GAAP and federal income tax regulations, permanent differences between book and tax basis for reporting are identified and appropriately reclassified in the Statement of Assets and Liabilities, as needed. The adjustments for fiscal year 2022 are as follows: |
| | Total | | |
| | Distributable | | |
| | Earnings | Capital Stock | |
| | $(347) | $347 | |
| NOTES TO THE FINANCIAL STATEMENTS |
| c). | Accounting for Uncertainty in Income Taxes – The Fund has accounting policies regarding recognition and measurement of tax positions taken or expected to be taken on a tax return. The tax returns of the Fund for the prior three fiscal years are open for examination. The Fund has reviewed all open tax years in major tax jurisdictions and concluded that there is no impact on the Fund’s net assets and no tax liability resulting from unrecognized tax benefits relating to uncertain income tax positions taken or expected to be taken on a tax return. The Fund’s major tax jurisdictions are U.S. federal and Delaware. |
| | |
| d). | Income and Expenses – Dividend income is recognized on the ex-dividend date or as soon as information is available to the Fund. Interest income, which includes the amortization of premium and accretion of discount, is recognized on an accrual basis. Market discounts, original issue discounts, and market premiums on debt securities are accreted or amortized to interest income over the life of a security with a corresponding increase or decrease, as applicable, in the cost basis of such security using the yield-to-maturity method or, where applicable, the first call date of the security. Other non-cash dividends are recognized as investment income at the fair value of the property received. The Fund is charged for those expenses that are directly attributable to its portfolio, such as advisory, administration, and certain shareholder service fees. Income, expenses (other than expenses attributable to a specific class), and realized and unrealized gains/losses on investments are allocated to each class of shares based on such class’s net assets. |
| | |
| e). | Distributions to Shareholders – Dividends from net investment income for the Fund, if any, are declared and paid annually, usually in December. Distributions of net realized capital gains, if any, are declared and paid annually, usually in December. |
| | |
| f). | Security Transactions – Investment and shareholder transactions are recorded on the trade date. The Fund determines the realized gain/loss from an investment transaction by comparing the original cost of the security lot sold with the net sale proceeds. Discounts and premiums on securities purchased are accreted or amortized, respectively, over the life of each such security. |
| | |
| g). | Use of Estimates – Preparing financial statements in accordance with GAAP requires management to make estimates and assumptions that affect the reported amounts of assets and liabilities and disclosure of contingent assets and liabilities at the date of the financial statements, as well as the reported change in net assets during the reporting period. Actual results could differ from those estimates. |
| | |
| h). | Share Valuation – The net asset value (“NAV”) per share of the Fund is calculated by dividing (i) the total value of the securities held by the Fund, plus cash and other assets, minus all liabilities (including estimated accrued expenses) by (ii) the total number of Fund shares outstanding, rounded to the nearest $0.01. Fund shares are not priced on days the New York Stock Exchange is closed for trading. The offering and redemption price per share for the Fund is equal to the Fund’s NAV per share. |
| | |
| i). | Illiquid Securities – Pursuant to Rule 22e-4 under the 1940 Act, the Fund has adopted a Liquidity Risk Management Program (the “Liquidity Program”). The Liquidity Program requires, among other things, that the Fund limit its illiquid investments to no more than 15% of its net assets. An illiquid investment is any investment that the Fund reasonably expects cannot be sold or disposed of by the Fund in current market conditions in seven calendar days or less without the sale or disposition significantly changing the market value of the investment. |
| | |
| j). | Recent Accounting Pronouncements and Regulatory Updates – In October 2020, the Securities and Exchange Commission (“SEC”) adopted new regulations governing |
| HENNESSY FUNDS | 1-800-966-4354 | |
| | the use of derivatives by registered investment companies (“Rule 18f-4”). Rule 18f-4 imposes limits on the amount of derivatives a fund can enter into, eliminates the asset segregation framework currently used by funds to comply with Section 18 of the 1940 Act, and requires funds whose use of derivatives is greater than a limited specified amount to establish and maintain a comprehensive derivatives risk management program and appoint a derivatives risk manager. The Fund has adopted procedures in accordance with Rule 18f-4. |
| | |
| | In December 2020, the SEC adopted a new rule providing a framework for fund valuation practices (“Rule 2a-5”). Rule 2a-5 establishes requirements for determining fair value in good faith for purposes of the 1940 Act. Rule 2a-5 permits fund boards to designate certain parties to perform fair value determinations, subject to board oversight and certain other conditions. Rule 2a-5 also defines when market quotations are “readily available” for purposes of the 1940 Act and the threshold for determining whether a fund must fair value a security. In connection with Rule 2a-5, the SEC also adopted related recordkeeping requirements and is rescinding previously issued guidance, including with respect to the role of a board in determining fair value and the accounting and auditing of fund investments. The Fund has adopted procedures in accordance with Rule 2a-5. |
3). SECURITIES VALUATION
The Fund follows its valuation policies and procedures in determining its NAV and, in preparing these financial statements, the fair value accounting standards that establish an authoritative definition of fair value and set out a hierarchy for measuring fair value. These standards require additional disclosures about the various inputs and valuation techniques used to develop the measurements of fair value and a discussion of changes in valuation techniques and related inputs during the period. These inputs are summarized in the three broad levels listed below:
| | Level 1 – | Unadjusted, quoted prices in active markets for identical instruments that the Fund has the ability to access at the date of measurement. |
| | | |
| | Level 2 – | Other significant observable inputs (including, but not limited to, quoted prices in active markets for similar instruments, quoted prices in markets that are not active for identical or similar instruments, and model-derived valuations in which all significant inputs and significant value drivers are observable in active markets, such as interest rates, prepayment speeds, credit risk curves, default rates, and similar data). |
| | | |
| | Level 3 – | Significant unobservable inputs (including the Fund’s own assumptions about what market participants would use to price the asset or liability based on the best available information) when observable inputs are unavailable. |
The following is a description of the valuation techniques applied to the Fund’s major categories of assets and liabilities on a recurring basis:
| | Equity Securities – Equity securities, including common stocks, preferred stocks, foreign-issued common stocks, exchange-traded funds, closed-end mutual funds, partnerships, rights, and real estate investment trusts, that are traded on a securities exchange for which a last-quoted sales price is readily available generally are valued at the last sales price as reported by the primary exchange on which the securities are listed. Securities listed on The Nasdaq Stock Market (“Nasdaq”) generally are valued at the Nasdaq Official Closing Price, which may differ from the last sales price reported. Securities traded on a securities exchange for which a last-quoted sales price is not readily available generally are valued at the mean between the bid and |
| NOTES TO THE FINANCIAL STATEMENTS |
| | ask prices. To the extent these securities are actively traded and valuation adjustments are not applied, they are classified in Level 1 of the fair value hierarchy. Securities traded on foreign exchanges generally are not valued at the same time the Fund calculates its NAV because most foreign markets close well before such time. The earlier close of most foreign markets gives rise to the possibility that significant events, including broad market moves, may have occurred in the interim. In certain circumstances, it may be determined that a foreign security needs to be fair valued because it appears that the value of the security might have been materially affected by events occurring after the close of the market in which the security is principally traded, but before the time the Fund calculates its NAV, such as by a development that affects an entire market or region (e.g., a weather-related event) or a potentially global development (e.g., a terrorist attack that may be expected to have an effect on investor expectations worldwide). |
| | |
| | Registered Investment Companies – Investments in open-end registered investment companies, commonly referred to as mutual funds, generally are priced at the ending NAV provided by the applicable mutual fund’s service agent and are classified in Level 1 of the fair value hierarchy. |
| | |
| | Debt Securities – Debt securities, including corporate bonds, asset-backed securities, mortgage-backed securities, municipal bonds, U.S. Treasuries, and U.S. government agency issues, are generally valued at market on the basis of valuations furnished by an independent pricing service that utilizes both dealer-supplied valuations and formula-based techniques. The pricing service may consider recently executed transactions in securities of the issuer or comparable issuers, market price quotations (where observable), bond spreads, and fundamental data relating to the issuer. In addition, the model may incorporate observable market data, such as reported sales of similar securities, broker quotes, yields, bids, offers, and reference data. Certain securities are valued primarily using dealer quotations. These securities are generally classified in Level 2 of the fair value hierarchy. |
| | |
| | Short-Term Securities – Short-term equity investments, including money market funds, are valued in the manner specified above for equity securities. Short-term debt investments with an original term to maturity of 60 days or less are valued at amortized cost, which approximates fair market value. If the original term to maturity of a short-term debt investment exceeds 60 days, then the values as of the 61st day prior to maturity are amortized. Amortized cost is not used if its use would be inappropriate due to credit or other impairments of the issuer, in which case the security’s fair value would be determined as described below. Short-term securities are generally classified in Level 1 or Level 2 of the fair value hierarchy depending on the inputs used and market activity levels for specific securities. |
The Board of Trustees of the Fund (the “Board”) has adopted fair value pricing procedures that are followed when a price for a security is not readily available or if a significant event has occurred that indicates the closing price of a security no longer represents the true value of that security. Fair value pricing determinations are made in good faith in accordance with these procedures. There are numerous criteria considered in determining a fair value of a security, such as the trading volume of a security and markets, the values of other similar securities, and news events with direct bearing on a security or markets. Fair value pricing results in an estimated price for a security that reflects the amount the Fund might reasonably expect to receive in a current sale. Depending on the relative significance of the valuation inputs, these securities may be classified in either Level 2 or Level 3 of the fair value hierarchy.
| HENNESSY FUNDS | 1-800-966-4354 | |
The fair value of foreign securities may be determined with the assistance of a pricing service using correlations between the movement of prices of such securities and indices of domestic securities and other appropriate indicators, such as closing market prices of relevant American Depositary Receipts or futures contracts. Using fair value pricing means that the Fund’s NAV reflects the affected portfolio securities’ values as determined by the Board or its designee, pursuant to the fair value pricing procedures adopted by the Board, instead of being determined by the market. Using a fair value pricing methodology to price a foreign security may result in a value that is different from such foreign security’s most recent closing price and from the value used by other investment companies to calculate their NAVs. Such securities are generally classified in Level 2 of the fair value hierarchy. Because the Fund may invest in foreign securities, the value of the Fund’s portfolio securities may change on days when a shareholder is unable to purchase or redeem Fund shares.
The Board has delegated day-to-day valuation matters to the Valuation and Liquidity Committee comprising representatives from Hennessy Advisors, Inc., the Fund’s investment advisor (the “Advisor”). The function of the Valuation and Liquidity Committee, among other things, is to value securities where current and reliable market quotations are not readily available. All actions taken by the Valuation and Liquidity Committee are reviewed by the Board.
The Fund has performed an analysis of all existing investments to determine the significance and character of all inputs to their fair value determinations. Various inputs are used to determine the value of the Fund’s investments. The inputs or methodology used for valuing securities are not necessarily an indication of the risk associated with investing in those securities. Details related to the fair value hierarchy of the Fund’s securities as of October 31, 2022, are included in the Schedule of Investments.
4). INVESTMENT TRANSACTIONS
Purchases and sales of investment securities (excluding government and short-term investments) for the Fund during fiscal year 2022 were $9,561,795 and $10,166,085, respectively.
There were no purchases or sales/maturities of long-term U.S. government securities for the Fund during fiscal year 2022.
5). INVESTMENT ADVISORY FEE AND OTHER TRANSACTIONS WITH AFFILIATES
The Advisor provides the Fund with investment advisory services under an Investment Advisory Agreement. The Advisor furnishes all investment advice, office space, and facilities and most of the personnel needed by the Fund. As compensation for its services, the Advisor is entitled to a monthly fee from the Fund. The fee is based on the average daily net assets of the Fund at an annual rate of 0.74%. The net investment advisory fees expensed by the Fund during fiscal year 2022 are included in the Statement of Operations.
The Advisor has contractually agreed to limit total annual operating expenses to 0.98% of the Fund’s net assets for both Investor Class shares and Institutional Class shares (excluding all federal, state and local taxes, interest, brokerage commissions, 12b-1 fees, shareholder servicing fees payable to the Advisor, extraordinary items, and acquired fund fees and expenses and other costs incurred in connection with the purchase and sale of securities) through February 28, 2023.
For three years following the date on which expenses were waived or incurred, the Advisor may recoup waived or reimbursed expenses from the Fund if total operating expenses, including such recoupment, does not exceed the expense limitation in effect (i) at the time the Advisor waived or reimbursed such expenses and (ii) at the time the
| NOTES TO THE FINANCIAL STATEMENTS |
Advisor recoups such expenses. As of October 31, 2022, expenses subject to potential recovery for Investor Class and Institutional Class shares and the fiscal years in which they expire were as follows:
| | | Fiscal Year | | | Fiscal Year | | | Fiscal Year | | | | |
| | | 2023 | | | 2024 | | | 2025 | | | Total | |
| Investor Class | | $ | 86,892 | | | $ | 75,956 | | | $ | 73,628 | | | $ | 236,476 | |
| Institutional Class | | $ | 27,643 | | | $ | 23,799 | | | $ | 23,122 | | | $ | 74,564 | |
The Advisor did not recoup expenses from the Fund during fiscal year 2022.
The Board has approved a Shareholder Servicing Agreement for Investor Class shares of the Fund, which compensates the Advisor for the non-investment advisory services it provides to the Fund. The Shareholder Servicing Agreement provides for a monthly fee paid to the Advisor at an annual rate of 0.10% of the average daily net assets of the Fund attributable to Investor Class shares. The shareholder service fees expensed by the Fund during fiscal year 2022 are included in the Statement of Operations.
The Fund has adopted a plan pursuant to Rule 12b-1 under the Investment Company Act of 1940, as amended, that authorizes payments in connection with the distribution of Fund shares at an annual rate of up to 0.25% of the Fund’s average daily net assets attributable to Investor Class shares. Even though the authorized rate is up to 0.25%, the Fund is currently only using up to 0.15% of its average daily net assets attributable to Investor Class shares for such purpose. Amounts paid under the plan may be spent on any activities or expenses primarily intended to result in the sale of shares, including, but not limited to, advertising, shareholder account servicing, printing and mailing of prospectuses to other than current shareholders, printing and mailing of sales literature, and compensation for sales and marketing activities or to financial institutions and others, such as dealers and distributors. The distribution fees expensed by the Fund during fiscal year 2022 are included in the Statement of Operations.
The Fund has entered into agreements with various brokers, dealers, and financial intermediaries in connection with the sale of Fund shares. The agreements provide for periodic payments of sub-transfer agent expenses by the Fund to the brokers, dealers, and financial intermediaries for providing certain shareholder maintenance services. These shareholder services include the pre-processing and quality control of new accounts, shareholder correspondence, answering customer inquiries regarding account status, and facilitating shareholder telephone transactions. The sub-transfer agent fees expensed by the Fund during fiscal year 2022 are included in the Statement of Operations.
U.S. Bancorp Fund Services, LLC, d/b/a U.S. Bank Global Fund Services (“Fund Services”) provides the Fund with administrative, accounting, and transfer agent services. As administrator, Fund Services is responsible for activities such as (i) preparing various federal and state regulatory filings, reports, and returns for the Fund, (ii) preparing reports and materials to be supplied to the Board, (iii) monitoring the activities of the Fund’s custodian, transfer agent, and accountants, and (iv) coordinating the preparation and payment of the Fund’s expenses and reviewing the Fund’s expense accruals. U.S. Bank N.A., an affiliate of Fund Services, serves as the Fund’s custodian. The servicing agreements between the Trust, Fund Services, and U.S. Bank N.A. contain a fee schedule that is inclusive of administrative, accounting, custody, and transfer agent fees. The administrative, accounting, custody, and transfer agent fees expensed by the Fund during fiscal year 2022 are included in the Statement of Operations. Fund Services has voluntarily waived all or a portion of its fees for the Fund. The fees voluntarily waived by Fund Services during fiscal year 2022 are included in the Statement of Operations.
| HENNESSY FUNDS | 1-800-966-4354 | |
Quasar Distributors, LLC, a wholly owned broker-dealer subsidiary of Foreside Financial Group, LLC, acts as the Fund’s principal underwriter in a continuous public offering of Fund shares.
The officers of the Fund are affiliated with the Advisor. With the exception of the Chief Compliance Officer and, for a portion of the fiscal year, the Senior Compliance Officer, such officers receive no compensation from the Fund for serving in their respective roles. The Fund, along with the other funds in the Hennessy Funds family (collectively, the “Hennessy Funds”), makes reimbursement payments on an equal basis to the Advisor for a portion of the salary and benefits associated with the office of the Chief Compliance Officer and, for a portion of the fiscal year, for all of the salary and benefits associated with the office of the Senior Compliance Officer. The compliance fees expensed by the Fund during fiscal year 2022 for reimbursement payments to the Advisor are included in the Statement of Operations.
6). GUARANTEES AND INDEMNIFICATIONS
Under the Hennessy Funds’ organizational documents, their officers and trustees are indemnified by the Hennessy Funds against certain liabilities arising out of the performance of their duties to the Hennessy Funds. Additionally, in the normal course of business, the Hennessy Funds enter into contracts with service providers that contain general indemnification clauses. The Fund’s maximum exposure under these arrangements is unknown as this would involve future claims that may be made against the Fund that have not yet occurred. Currently, the Fund expects the risk of loss to be remote.
7). LINE OF CREDIT
The Fund has an uncommitted line of credit with the other Hennessy Funds in the amount of the lesser of (i) $100,000,000 or (ii) 33.33% of each Hennessy Fund’s net assets, or 30% for the Hennessy Gas Utility Fund, the Hennessy Japan Fund, and the Hennessy Japan Small Cap Fund and 10% for the Hennessy Balanced Fund. The line of credit is intended to provide any necessary short-term financing in connection with shareholder redemptions, subject to certain restrictions. The credit facility is with the Hennessy Funds’ custodian bank, U.S. Bank N.A. Borrowings under this arrangement bear interest at the bank’s prime rate and are secured by all of the Fund’s assets (as to its own borrowings only). During fiscal year 2022, the Fund did not have any borrowings outstanding under the line of credit.
8). FEDERAL TAX INFORMATION
As of October 31, 2022, the components of accumulated earnings (losses) for income tax purposes were as follows:
| | | Investments | |
| Cost of investments for tax purposes | | $ | 5,559,041 | |
| Gross tax unrealized appreciation | | $ | 675,280 | |
| Gross tax unrealized depreciation | | | (843,674 | ) |
| Net tax unrealized appreciation/(depreciation) | | $ | (168,394 | ) |
| Undistributed ordinary income | | $ | 9,231 | |
| Undistributed long-term capital gains | | | — | |
| Total distributable earnings | | $ | 9,231 | |
| Other accumulated gain/(loss) | | $ | (852,871 | ) |
| Total accumulated gain/(loss) | | $ | (1,012,034 | ) |
The difference between book-basis unrealized appreciation/depreciation and tax-basis unrealized appreciation/depreciation (as shown above) is attributable primarily to wash sales.
| NOTES TO THE FINANCIAL STATEMENTS |
As of October 31, 2022, the Fund had no tax-basis capital losses to offset future capital gains.
As of October 31, 2022, the Fund did not defer, on a tax basis, any late-year ordinary losses. Late-year ordinary losses are net ordinary losses incurred after December 31, 2021, but within the taxable year, that are deemed to arise on the first day of the Fund’s next taxable year.
During fiscal years 2022 and 2021, the tax character of distributions paid by the Fund was as follows:
| | | Year Ended | | | Year Ended | |
| | | October 31, 2022 | | | October 31, 2021 | |
Ordinary income(1) | | $ | 1,183,102 | | | $ | 239,745 | |
| Long-term capital gains | | | 828,719 | | | | 429,765 | |
| Total distributions | | $ | 2,011,821 | | | $ | 669,510 | |
(1) Ordinary income includes short-term capital gains.
9). MARKET DISRUPTION AND GEOPOLITICAL RISKS
Certain local, regional, or global events such as wars, terrorism, pandemics or other public health mattes, and other geopolitical events could have a significant impact on securities markets generally or individual securities or instruments. For example, following Russia’s invasion of Ukraine, the President of the United States signed an Executive Order in February 2022 prohibiting U.S. persons from entering transactions with the Central Bank of Russia. Similarly, in June 2021, the President of the United States signed an Executive Order affirming and expanding the U.S. policy prohibiting U.S. persons from purchasing or investing in publicly-traded securities of companies identified by the U.S. Government as “Chinese Military-Industrial Complex Companies.” The list of such companies can change from time to time and the Advisor may be forced to hold securities it desires to sell or to sell securities it desires to buy, or the Advisor may not be able to participate in an investment it otherwise believes is attractive. The occurrence and duration of these types of events are hard to predict and could adversely affect the Fund’s performance.
10). EVENTS SUBSEQUENT TO YEAR END
Management has evaluated the Fund’s related events and transactions that occurred subsequent to October 31, 2022, through the date of issuance of the Fund’s financial statements. Management has determined that there were no subsequent events requiring recognition or disclosure in the financial statements.
| HENNESSY FUNDS | 1-800-966-4354 | |
Report of Independent Registered Public
Accounting Firm
To the Board of Trustees of Hennessy Funds Trust
and the shareholders of the Hennessy Technology Fund
Novato, CA
Opinion on the Financial Statements
We have audited the accompanying statement of assets and liabilities of the Hennessy Technology Fund (the “Fund”), a series of Hennessy Funds Trust, including the schedule of investments, as of October 31, 2022, the related statement of operations for the year then ended, the statements of changes in net assets for each of the two years in the period then ended, financial highlights for each of the five years in the period then ended, and the related notes (collectively referred to as the “financial statements”). In our opinion, the financial statements present fairly, in all material respects, the financial position of the Fund as of October 31, 2022, the results of its operations for the year then ended, the changes in its net assets for each of the two years in the period then ended, and the financial highlights for each of the five years in the period then ended, in conformity with accounting principles generally accepted in the United States of America.
Basis for Opinion
These financial statements are the responsibility of the Fund’s management. Our responsibility is to express an opinion on the Fund’s financial statements based on our audits. We are a public accounting firm registered with the Public Company Accounting Oversight Board (United States) (“PCAOB”) and are required to be independent with respect to the Fund in accordance with the U.S. federal securities laws and the applicable rules and regulations of the Securities and Exchange Commission and the PCAOB. We have served as the auditor of one or more of the funds in the Trust since 2002.
We conducted our audits in accordance with the standards of the PCAOB. Those standards require that we plan and perform the audit to obtain reasonable assurance about whether the financial statements are free of material misstatement, whether due to error or fraud. The Fund is not required to have, nor were we engaged to perform, an audit of its internal control over financial reporting. As part of our audits we are required to obtain an understanding of internal control over financial reporting, but not for the purpose of expressing an opinion on the effectiveness of the Fund’s internal control over financial reporting. Accordingly, we express no such opinion.
Our audits included performing procedures to assess the risks of material misstatement of the financial statements, whether due to error or fraud, and performing procedures that respond to those risks. Such procedures included examining, on a test basis, evidence regarding the amounts and disclosures in the financial statements. Our audits also included evaluating the accounting principles used and significant estimates made by management, as well as evaluating the overall presentation of the financial statements. Our procedures included confirmation of securities owned as of October 31, 2022 by correspondence with the custodian. We believe that our audits provide a reasonable basis for our opinion.
| | |
| | TAIT, WELLER & BAKER LLP |
Philadelphia, Pennsylvania
December 22, 2022
| REPORT OF INDEPENDENT REGISTERED PUBLIC ACCOUNTING FIRM/TRUSTEES AND OFFICERS |
Trustees and Officers of the Fund (Unaudited)
The business and affairs of the Funds are managed under the direction of the Board of Trustees of the Trust, and the Board of Trustees elects the officers of the Trust. From time to time, the Board of Trustees also has appointed advisers to the Board of Trustees (“Advisers”) with the intention of having qualified individuals serve in an advisory capacity to garner experience in the mutual fund and asset management industry and be considered as potential Trustees in the future. There are currently two Advisers, Brian Alexander and Doug Franklin. As Advisers, Mr. Alexander and Mr. Franklin attend meetings of the Board of Trustees and act as non-voting participants. Information pertaining to the Trustees, Advisers, and the officers of the Trust is set forth below. The Trustees and officers serve until their successors are duly elected and qualified or until their earlier death, resignation, or removal. Each Trustee oversees all 16 Hennessy Funds. Unless otherwise indicated, the address of all persons listed below is 7250 Redwood Boulevard, Suite 200, Novato, CA 94945. The Fund’s Statement of Additional Information includes more information about the persons listed below and is available without charge by calling 1-800-966-4354 or by visiting www.hennessyfunds.com.
| | | | Other |
| | | | Directorships |
| | | | Held Outside |
| Name, Age, | | | of Fund |
| and Position Held | Start Date | Principal Occupation(s) | Complex During |
with the Trust | of Service | During Past Five Years | Past Five Years |
| Disinterested Trustees and Advisers | | | |
| | | | |
| J. Dennis DeSousa | January 1996 | Mr. DeSousa is a real estate investor. | None. |
| 86 | | | |
| Trustee | | | |
| | | | |
| Robert T. Doyle | January 1996 | Mr. Doyle is retired. He served as the | None. |
| 75 | | Sheriff of Marin County, California | |
| Trustee | | from 1996 – June 2022. | |
| | | | |
| Claire Garvie | December 2015 | Ms. Garvie is a founder of Kiosk and | None. |
| 48 | as an Adviser | has served as its Chief Operating | |
| Trustee | to the Board | Officer since 2004. Kiosk is a full- | |
| | and | service marketing agency with | |
| | December 2021 | offices in the San Francisco Bay Area | |
| | as a Trustee | and Liverpool, UK and staff across | |
| | | nine states in the U.S. | |
| | | | |
| Gerald P. Richardson | May 2004 | Mr. Richardson is an independent | None. |
| 77 | | consultant in the securities industry. | |
| Trustee | | | |
| HENNESSY FUNDS | 1-800-966-4354 | |
| | | | Other |
| | | | Directorships |
| | | | Held Outside |
| Name, Age, | | | of Fund |
| and Position Held | Start Date | Principal Occupation(s) | Complex During |
with the Trust | of Service | During Past Five Years | Past Five Years |
| Brian Alexander | March 2015 | Mr. Alexander has worked for the | None. |
| 41 | | Sutter Health organization since | |
| Adviser to the Board | | 2011 in various positions. He has | |
| | | served as the Chief Executive Officer | |
| | | of the North Valley Hospital Area | |
| | | since 2021. From 2018 to 2021, he | |
| | | served as the Chief Executive Officer | |
| | | of Sutter Roseville Medical Center. | |
| | | From 2016 through 2018, he served | |
| | | as the Vice President of Strategy for | |
| | | the Sutter Health Valley Area, which | |
| | | includes 11 hospitals, 13 ambulatory | |
| | | surgery centers, 16,000 employees, | |
| | | and 1,900 physicians. | |
| | | | |
| Doug Franklin | March 2016 | Mr. Franklin is a retired insurance | None. |
| 58 | | industry executive. From 1987 | |
| Adviser to the Board | | through 2015, he was employed by | |
| | | the Allianz-Fireman’s Fund Insurance | |
| | | Company in various positions, | |
| | | including as its Chief Actuary and | |
| | | Chief Risk Officer. | |
| | | | |
Interested Trustee(1) | | | |
| | | | |
| Neil J. Hennessy | January 1996 as | Mr. Hennessy has been employed | Hennessy |
| 66 | a Trustee and | by Hennessy Advisors, Inc. since | Advisors, Inc. |
| Chairman of the Board, | June 2008 as | 1989 and currently serves as its | |
| Chief Market Strategist, | an officer | Chairman and Chief Executive Officer. | |
| Portfolio Manager, | | | |
| and President | | | |
| | | | |
| Name, Age, | | | |
| and Position Held | Start Date | Principal Occupation(s) | |
with the Trust | of Service | During Past Five Years | |
| Officers | | | |
| | | | |
| Teresa M. Nilsen | January 1996 | Ms. Nilsen has been employed by Hennessy Advisors, Inc. | |
| 56 | | since 1989 and currently serves as its President, Chief | |
| Executive Vice President | | Operating Officer, and Secretary. | |
| and Treasurer | | | |
| | | | |
| Daniel B. Steadman | March 2000 | Mr. Steadman has been employed by Hennessy Advisors, Inc. | |
| 66 | | since 2000 and currently serves as its Executive Vice President. | |
| Executive Vice President’ | | | |
| and Secretary | | | |
| | | | |
| Brian Carlson | December 2013 | Mr. Carlson has been employed by Hennessy Advisors, Inc. | |
| 50 | | since December 2013 and currently serves as its Chief | |
| Senior Vice President | | Compliance Officer and Senior Vice President. | |
| and Head of Distribution | | | |
| TRUSTEES AND OFFICERS OF THE FUND |
| Name, Age, | | |
| and Position Held | Start Date | Principal Occupation(s) |
with the Trust | of Service | During Past Five Years |
Jennifer Cheskiewicz(2) | June 2013 | Ms. Cheskiewicz has been employed by Hennessy Advisors, Inc. |
| 45 | | as its General Counsel since June 2013. |
| Senior Vice President and | | |
| Chief Compliance Officer | | |
| | | |
David Ellison(3) | October 2012 | Mr. Ellison has been employed by Hennessy Advisors, Inc. since |
| 64 | | October 2012. He has served as a Portfolio Manager of the |
| Senior Vice President | | Hennessy Large Cap Financial Fund and the Hennessy Small |
| and Portfolio Manager | | Cap Financial Fund since their inception. Mr. Ellison also served |
| | | as a Portfolio Manager of the Hennessy Technology Fund from |
| | | its inception until February 2017. Mr. Ellison served as Director, |
| | | CIO, and President of FBR Fund Advisers, Inc. from December |
| | | 1999 to October 2012. |
| | | |
Ryan Kelley(4) | March 2013 | Mr. Kelley has been employed by Hennessy Advisors, Inc. since |
| 50 | | October 2012. He has served as Chief Investment Officer of the |
| Chief Investment Officer, | | Hennessy Funds since March 2021 and has served as a Portfolio |
| Senior Vice President, | | Manager of the Hennessy Gas Utility Fund, the Hennessy Large |
| and Portfolio Manager | | Cap Financial Fund, and the Hennessy Small Cap Financial Fund |
| | | since October 2014. Mr. Kelley served as Co-Portfolio Manager |
| | | of these same funds from March 2013 through September |
| | | 2014 and as a Portfolio Analyst for the Hennessy Funds from |
| | | October 2012 through February 2013. He has also served as a |
| | | Portfolio Manager of the Hennessy Cornerstone Growth Fund, |
| | | the Hennessy Cornerstone Mid Cap 30 Fund, the Hennessy |
| | | Cornerstone Large Growth Fund, and the Hennessy |
| | | Cornerstone Value Fund since February 2017 and as a Portfolio |
| | | Manager of the Hennessy Total Return Fund, the Hennessy |
| | | Balanced Fund, and the Hennessy Technology Fund since May |
| | | 2018. He served as Co-Portfolio Manager of the Hennessy |
| | | Technology Fund from February 2017 until May 2018. Mr. Kelley |
| | | served as Portfolio Manager of FBR Fund Advisers, Inc. from |
| | | January 2008 to October 2012. |
| | | |
L. Joshua Wein(4) | September 2018 | Mr. Wein has been employed by Hennessy Advisors, Inc. since |
| 49 | | 2018. He has served as Co-Portfolio Manager of the Hennessy |
| Vice President and | | Cornerstone Growth Fund, the Hennessy Cornerstone |
| Co-Portfolio Manager | | Mid Cap 30 Fund, the Hennessy Cornerstone Large Growth |
| | | Fund, the Hennessy Cornerstone Value Fund, Hennessy Total |
| | | Return Fund, the Hennessy Balanced Fund, the Hennessy Gas |
| | | Utility Fund, and the Hennessy Technology Fund since February |
| | | 2019. He served as a Senior Analyst of these same funds from |
| | | September 2018 through February 2019. Mr. Wein served as |
| | | Director of Alternative Investments and Co-Portfolio Manager |
| | | at Sterling Capital Management from 2008 to 2018. |
_______________
(1) | Mr. Hennessy is considered an “interested person,” as defined in the Investment Company Act of 1940, as amended, because he is an officer of the Trust. |
(2) | The address of this officer is 4800 Bee Caves Road, Suite 100, Austin, TX 78746. |
(3) | The address of this officer is 101 Federal Street, Suite 1615B, Boston, MA 02110. |
(4) | The address of this officer is 1340 Environ Way, Chapel Hill, NC 27517. |
| HENNESSY FUNDS | 1-800-966-4354 | |
Expense Example (Unaudited)
October 31, 2022
As a shareholder of the Fund, you incur ongoing costs, including management fees, service fees, and other Fund expenses. This Example is intended to help you understand your ongoing costs (in dollars) of investing in the Fund and to compare these costs with the ongoing costs of investing in other mutual funds. The Example is based on an investment of $1,000 invested at the beginning of the period and held for the entire period from May 1, 2022, through October 31, 2022.
Actual Expenses
In the table below, the first line under each of the “Investor Class” and “Institutional Class” headings provides information about actual account values and actual expenses for each share class. You may use this information, together with the amount you invested, to estimate the expenses that you paid over the period. Simply divide your account value by $1,000 (for example, an $8,600 account value divided by $1,000 = 8.6), then multiply the result by the number in the first line under the heading “Expenses Paid During Period” to estimate the expenses you paid on your account during this period. Although the Fund charges no sales loads or transaction fees, you will be assessed fees for outgoing wire transfers, returned checks, and stop payment orders at prevailing rates charged by U.S. Bank Global Fund Services, the Fund’s transfer agent. If you request that a redemption be made by wire transfer, the Fund’s transfer agent charges a $15 fee. IRAs are charged a $15 annual maintenance fee (up to $30 maximum per shareholder for shareholders with multiple IRAs). The examples below include, but are not limited to, management, shareholder servicing, accounting, custody, and transfer agent fees. However, the examples below do not include portfolio trading commissions and related expenses.
Hypothetical Example for Comparison Purposes
In the table below, the second line under each of the “Investor Class” and “Institutional Class” headings provides information about hypothetical account values and hypothetical expenses based on the Fund’s actual expense ratio for each share class and an assumed rate of return of 5% per year before expenses, which is not the Fund’s actual return for such share class. The hypothetical account values and expenses may not be used to estimate the actual ending account balance or expenses you paid for the period. You may use this information to compare the ongoing costs of investing in the Fund and other funds. To do so, compare these 5% hypothetical examples with the 5% hypothetical examples that appear in the shareholder reports of the other funds. Please note that the expenses shown in the table are meant to highlight your ongoing costs only. Therefore, the second lines under “Investor Class” and “Institutional Class” are useful in comparing ongoing costs only and will not help you determine the relative total costs of owning different funds.
| | | | Expenses Paid |
| | Beginning | Ending | During Period(1) |
| | Account Value | Account Value | May 1, 2022 – |
| | May 1, 2022 | October 31, 2022 | October 31, 2022 |
| Investor Class | | | |
| Actual | $1,000.00 | $ 925.60 | $5.97 |
| Hypothetical (5% return before expenses) | $1,000.00 | $1,019.00 | $6.26 |
| | | | |
| Institutional Class | | | |
| Actual | $1,000.00 | $ 926.50 | $4.76 |
| Hypothetical (5% return before expenses) | $1,000.00 | $1,020.27 | $4.99 |
(1) | Expenses are equal to the Fund’s annualized expense ratio of 1.23% for Investor Class shares or 0.98% for Institutional Class shares, as applicable, multiplied by the average account value over the period, multiplied by 184/365 days (to reflect the half-year period). |
| HENNESSY FUNDS | 1-800-966-4354 | |
How to Obtain a Copy of the Fund’s Proxy
Voting Policy and Proxy Voting Records
A description of the policies and procedures the Fund uses to determine how to vote proxies relating to portfolio securities is available without charge (1) by calling 1-800-966-4354, (2) on the Hennessy Funds’ website at www.hennessyfunds.com/proxy-voting/voting-policy, or (3) on the U.S. Securities and Exchange Commission’s (the “SEC”) website at www.sec.gov. The Fund’s proxy voting record is available without charge on both the Hennessy Funds’ website at www.hennessyfunds.com/proxy-voting/voting-record and the SEC’s website at www.sec.gov no later than August 31 for the prior 12 months ending June 30.
Availability of Quarterly Portfolio Schedule
The Fund files a complete schedule of portfolio holdings with the SEC for the first and third quarters of each fiscal year as an exhibit to its reports on Form N-PORT. The Fund’s Form N-PORT reports are available on the SEC’s website at www.sec.gov or on request by calling 1-800-966-4354.
Federal Tax Distribution Information (Unaudited)
For fiscal year 2022, certain dividends paid by the Fund may be subject to a maximum tax rate of 23.8%, as provided for by the Jobs and Growth Tax Relief Reconciliation Act of 2003. The percentage of dividends declared from ordinary income designated as qualified dividend income was 7.34%.
For corporate shareholders, the percent of ordinary income distributions that qualified for the corporate dividends received deduction for fiscal year 2022 was 5.48%.
The percentage of taxable ordinary income distributions that were designated as short-term capital gain distributions under Section 871(k)(2)(C) of the Internal Revenue Code of 1986, as amended, for the Fund was 100.00%.
Important Notice Regarding Delivery
of Shareholder Documents
To help keep the Fund’s costs as low as possible, we generally deliver a single copy of shareholder reports, proxy statements, and prospectuses to shareholders who share an address and have the same last name. This process does not apply to account statements. You may request an individual copy of a shareholder document at any time. If you would like to receive separate mailings of shareholder documents, please call U.S. Bank Global Fund Services at 1-800-261-6950 or 1-414-765-4124, and individual delivery will begin within 30 days of your request. If your account is held through a financial institution or other intermediary, please contact such intermediary directly to request individual delivery.
Electronic Delivery
As permitted by SEC regulations, the Fund’s shareholder reports are made available on a website, and unless you sign for eDelivery or elect to receive paper copies as detailed below, you will be notified by mail each time a report is posted and provided with a website link to access the report.
The Fund also offers shareholders the option to receive all notices, account statements, prospectuses, tax forms, and shareholder reports electronically. To sign up for eDelivery or change your delivery preference, please visit www.hennessyfunds.com/account.
To elect to receive paper copies of all future reports free of charge, please call U.S. Bank Global Fund Services at 800-261-6950 or 414-765-4124.
Subscribe to receive our team’s unique market and sector insights delivered to your inbox
www.hennessyfunds.com/subscribe
Follow us on social media
| PROXY VOTING — PRIVACY POLICY |
Liquidity Risk Management Program
In accordance with Rule 22e-4 under the Investment Company Act of 1940, as amended (the “Liquidity Rule”), we have adopted and implemented a liquidity risk management program (the “Liquidity Program”). The purpose of the Liquidity Program is to assess and manage the Fund’s liquidity risk, which is the risk that the Fund would not be able to meet requests to redeem Fund shares without significant dilution of the remaining shareholders’ interests in the Fund. The Board of Trustees of the Fund (the “Board”) designated a committee comprising representatives of Hennessy Advisors, Inc., the investment adviser to the Fund, as the administrator of the Liquidity Program (the “Program Administrator”).
The Program Administrator provided a written report regarding the Liquidity Program to the Board in advance of its meeting on June 1, 2022. The report covered the period from June 1, 2021, through May 31, 2022. The report addressed the operation of the Liquidity Program, assessed the adequacy and effectiveness of its implementation, and described any material changes to the Liquidity Program during the review period. The Trust’s chief compliance officer presented the report to the Board at the meeting and provided additional information regarding the Liquidity Program. The Board reviewed the Liquidity Program and considered, among other items, the following:
| | 1. | The Program Administrator reviewed daily historical net redemption activity during the review period and during prior periods with higher-than-average redemption activity and concluded that the Fund has historically been able to meet requests to redeem Fund shares without significant dilution to the Fund’s remaining shareholders, and the Program Administrator expects the Fund to be able to continue to do so in the future during both normal and reasonably foreseeable stressed conditions. |
| | | |
| | 2. | The Fund primarily holds assets that are highly liquid investments and is therefore not required to establish a highly liquid investment minimum for the Fund or adopt policies and procedures for responding to a highly liquid investment minimum shortfall. |
| | | |
| | 3. | The Program Administrator did not make any material changes to the Liquidity Program during the review period and was not recommending any changes to the Liquidity Program or the model inputs used to determine the liquidity classification of each security held by the Fund. |
| | | |
| | 4. | The Program Administrator concluded that the Liquidity Program was reasonably designed to assess and manage the Fund’s liquidity risk, complies with the requirements of the Liquidity Rule, and was operating as intended during the review period. |
Privacy Policy
We collect the following personal information about you:
| | 1. | Information we receive from you in applications or other forms, correspondence, or conversations, including, but not limited to, your name, address, phone number, social security number, assets, income, and date of birth; |
| | | |
| | 2. | Information about your transactions with us, our affiliates, or others, including, but not limited to, your account number and balance, payments history, parties to transactions, cost basis information, and other financial information; and |
| HENNESSY FUNDS | 1-800-966-4354 | |
| | 3. | Other personal information we collect from various sources, even if you have not entered into a prior transaction with us, including the following: |
| | | • | Name, alias, address, unique personal identifier, online identifier, IP address, email address, telephone number, account name, and other similar identifiers; |
| | | | |
| | | • | Age and marital status; |
| | | | |
| | | • | Commercial information, including records of products purchased; |
| | | | |
| | | • | Browsing history, search history, and information on interaction with our website; |
| | | | |
| | | • | Geolocation data; |
| | | | |
| | | • | Employment and employment history, educational history, financial information, and purchasing and consuming histories or tendencies; and |
| | | | |
| | | • | Inferences drawn from the above-listed information to create a profile about your preferences, characteristics, predispositions, and behavior. |
We collect this information directly from you, indirectly in the course of providing services to you, directly and indirectly from your activity on our website, from broker dealers, marketing agencies, and other third parties that interact with us in connection with the services we perform and products we offer, and from anonymized and aggregated consumer information.
We use this information to fulfill the reason you provided the information to us, to provide you with other relevant products that you request from us, to provide you with information about products that may interest you, to improve our website or present our website’s contents to you, and as otherwise described to you when collecting your personal information.
We do not disclose any personal information to unaffiliated third parties, except as permitted by law. We may disclose your personal information to our affiliates, vendors, and service providers for a business purpose. For example, we are permitted by law to disclose all of the information we collect, as described above, to our transfer agent to process your transactions. When disclosing your personal information to third parties, we enter into a contract with each third party describing the purpose of such disclosure and requiring that such personal information be kept confidential and not used for any purpose except to perform the services contracted or respond to regulatory or law enforcement requests.
Furthermore, we restrict access to your personal information to those persons who require such information to provide products or services to you. As a result, we do not provide a means for opting out of our limited sharing of your information. We maintain physical, electronic, and procedural safeguards that comply with federal standards to guard your personal information.
If you hold shares of the Funds through a financial intermediary, including, but not limited to, a broker-dealer, bank, or trust company, the privacy policy of your financial intermediary governs how your personal information is shared with unaffiliated third parties.
Supplemental Privacy Notice for Residents of California
The California Consumer Privacy Act of 2018 (the “CCPA”) provides you, as a California resident, with certain additional rights relating to your personal information.
Under the CCPA, you have the right to request that we disclose to you the categories of personal information we have collected about you over the past 12 months, the categories of sources of such information, our business purpose for collecting the information, the categories of third parties, if any, with whom we shared the information, and the specific information we have collected about you. You also have the right to request that we delete any of your personal information, and, unless an exception applies, we will delete such information upon receiving and confirming your request. To make a request, call us at 1-800-966-4354, email us at privacy@hennessyfunds.com, or go to www.hennessyfunds.com/contact. We will not discriminate against you for exercising your rights under the CCPA. Further, we will not collect additional categories of your personal information or use the personal information we collected for materially different, unrelated, or incompatible purposes without providing you notice.
| HENNESSY FUNDS | 1-800-966-4354 | |
For information, questions, or assistance, please call
The Hennessy Funds
1-800-966-4354 or 1-415-899-1555
INVESTMENT ADVISOR
Hennessy Advisors, Inc.
7250 Redwood Boulevard, Suite 200
Novato, California 94945
ADMINISTRATOR,
TRANSFER AGENT,
DIVIDEND PAYING AGENT, &
SHAREHOLDER SERVICING AGENT
U.S. Bancorp Fund Services, LLC
d/b/a U.S. Bank Global Fund Services
P.O. Box 701
Milwaukee, Wisconsin 53201-0701
CUSTODIAN
U.S. Bank N.A.
Custody Operations
1555 North River Center Drive, Suite 302
Milwaukee, Wisconsin 53212
TRUSTEES
Neil J. Hennessy
Robert T. Doyle
J. Dennis DeSousa
Claire Garvie
Gerald P. Richardson
COUNSEL
Foley & Lardner LLP
777 East Wisconsin Avenue
Milwaukee, Wisconsin 53202-5306
INDEPENDENT REGISTERED
PUBLIC ACCOUNTING FIRM
Tait, Weller & Baker LLP
Two Liberty Place
50 South 16th Street, Suite 2900
Philadelphia, Pennsylvania 19102-2529
DISTRIBUTOR
Quasar Distributors, LLC
111 East Kilbourn Avenue, Suite 1250
Milwaukee, Wisconsin 53202
www.hennessyfunds.com | 800-966-4354
This report has been prepared for shareholders and may be distributed to
others only if preceded or accompanied by a current prospectus.