SECURITIES AND EXCHANGE COMMISSION
Washington, D.C. 20549
Form 6-K
REPORT OF FOREIGN PRIVATE ISSUER
PURSUANT TO RULE 13a-16 OR 15d-16 OF
THE SECURITIES EXCHANGE ACT OF 1934
For the month of November 2011
Commission File Number 1-14926
KT Corporation
(Translation of registrant’s name into English)
206 Jungja-dong
Bundang-gu, Sungnam
Kyunggi-do
463-711
Korea
(Address of principal executive offices)
Indicate by check mark whether the registrant files or will file annual reports under cover of Form 20-F or Form 40-F: Form 20-F x Form 40-F ¨
Indicate by check mark if the registrant is submitting the Form 6-K in paper as permitted by Regulation S-T Rule 101(b)(1): ¨
Indicate by check mark if the registrant is submitting the Form 6-K in paper as permitted by Regulation S-T Rule 101(b)(7): ¨
Indicate by check mark whether by furnishing the information contained in this Form, the registrant is also thereby furnishing the information to the Commission pursuant to Rule 12g3-2(b) under the Securities Exchange Act of 1934. Yes ¨ No x
If “Yes” is marked, indicate below the file number assigned to the registrant in connection with Rule 12g3-2(b): 82-
SIGNATURES
Pursuant to the requirements of the Securities Exchange Act of 1934, the registrant has duly caused this report to be signed on its behalf by the undersigned, thereunto duly authorized.
| Dated: November 10, 2011 | ||
| KT Corporation | ||
| By: | /s/ Thomas Bum Joon Kim | |
| Name: | Thomas Bum Joon Kim | |
| Title: | Managing Director | |
| By: | /s/ Young Jin Kim | |
| Name: | Young Jin Kim | |
| Title: | Director | |
Alleh KT 2011 3Q Earnings Release Investor Relations November 7, 2011
Disclaimer This presentation has been prepared by KT Corp. (“the Company”). This presentation contains forward-looking statements, which are subject to risks, uncertainties, and assumptions. This presentation is being presented solely for your information and is subject to change without notice. No representation or warranty, expressed or implied, is made and no reliance should be placed on the accuracy, actuality, fairness, or completeness of the information presented. The Company, its affiliates or representatives accept no liability whatsoever for any losses arising from any information contained in the presentation. This presentation does not constitute an offer or invitation to purchase or subscribe for any shares of the Company, and no part of this presentation shall form the Basis of or be relied upon in connection with any contract or commitment. Any decision to purchase shares of the Company should be made solely on the Basis of information, which has been publicly filed with the Securities and Exchange Commission or the Korea Stock Exchange and distributed to all investors. The contents of this presentation may not be reproduced, redistributed or passed on, directly or indirectly, to any other person or published, in whole or in part, for any purpose.
Financial Highlights I. Financial Highlights (Consolidated) 1.Consolidated Income Statement 2.Consolidated Statement of Financial Position & CAPEX (KT Only) II. Business Overview (Consolidated) III. ppendix
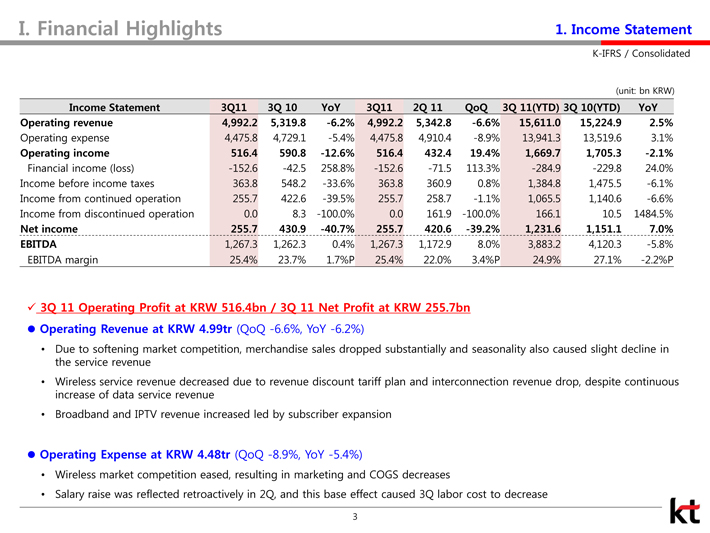
Financial Highlights1. Income Statement K-IFRS / Consolidated Income Statement 3Q11 3Q 10 YoY 3Q11 2Q 11 QoQ 3Q 11(YTD) 3Q 10(YTD) YoY Operating revenue 4,992.2 5,319.8 -6.2% 4,992.2 5,342.8 -6.6% 15,611.0 15,224.9 2.5% Operating expense 4,475.8 4,729.1 -5.4% 4,475.8 4,910.4 -8.9% 13,941.3 13,519.6 3.1% Operating income 516.4 590.8 -12.6% 516.4 432.4 19.4% 1,669.7 1,705.3 -2.1% Financial income (loss) -152.6 -42.5 258.8% -152.6 -71.5 113.3% -284.9 -229.8 24.0% Income before income taxes 363.8 548.2 -33.6% 363.8 360.9 0.8% 1,384.8 1,475.5 -6.1% Income from continued operation 255.7 422.6 -39.5% 255.7 258.7 -1.1% 1,065.5 1,140.6 -6.6% Income from discontinued operation 0.0 8.3 -100.0% 0.0 161.9 -100.0% 166.1 10.5 1484.5% Net income 255.7 430.9 -40.7% 255.7 420.6 -39.2% 1,231.6 1,151.1 7.0% EBITDA 1,267.3 1,262.3 0.4% 1,267.3 1,172.9 8.0% 3,883.2 4,120.3 -5.8% EBITDA margin 25.4% 23.7% 1.7%P 25.4% 22.0% 3.4%P 24.9% 27.1% -2.2%Pü?3Q 11 Operating Profit at KRW 516.4bn / 3Q 11 Net Profit at KRW 255.7bn ????Operating Revenue at KRW 4.99tr (QoQ -6.6%, YoY -6.2%) •Due to softening market competition, merchandise sales dropped substantially and seasonality also caused slight decline in the service revenue •Wireless service revenue decreased due to revenue discount tariff plan and interconnection revenue drop, despite continuous increase of data service revenue •Broadband and IPTV revenue increased led by subscriber expansion ??Operating Expense at KRW 4.48tr (QoQ -8.9%, YoY -5.4%) •Wireless market competition eased, resulting in marketing and COGS decreases •Salary raise was reflected retroactively in 2Q, and this base effect caused 3Q labor cost to decrease
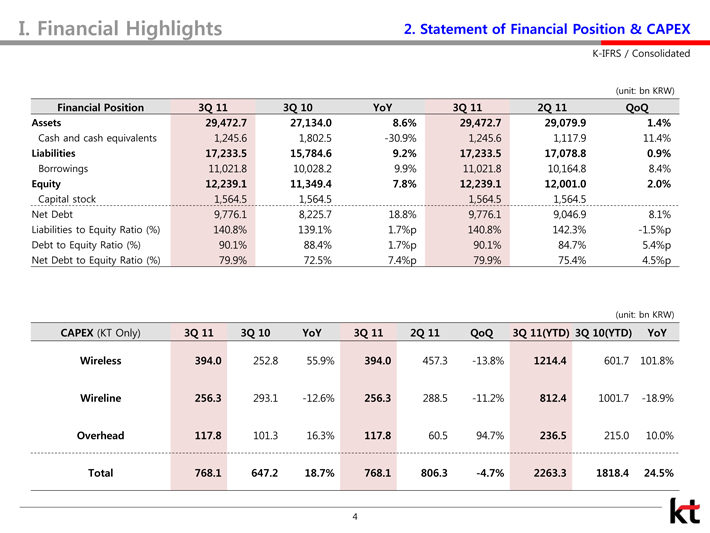
I. Financial Highlights2. Statement of Financial Position & CAPEXK-IFRS / Consolidated Financial Position 3Q 11 3Q 10 YoY 3Q 11 2Q 11 QoQ Assets 29,472.7 27,134.0 8.6% 29,472.7 29,079.9 1.4% Cash and cash equivalents 1,245.6 1,802.5 -30.9% 1,245.6 1,117.9 11.4% Liabilities 17,233.5 15,784.6 9.2% 17,233.5 17,078.8 0.9% Borrowings 11,021.8 10,028.2 9.9% 11,021.8 10,164.8 8.4% Equity 12,239.1 11,349.4 7.8% 12,239.1 12,001.0 2.0% Capital stock 1,564.5 1,564.5 1,564.5 1,564.5 Net Debt 9,776.1 8,225.7 18.8% 9,776.1 9,046.9 8.1% Liabilities to Equity Ratio (%) 140.8% 139.1% 1.7%p 140.8% 142.3% -1.5%p Debt to Equity Ratio (%) 90.1% 88.4% 1.7%p 90.1% 84.7% 5.4%p Net Debt to Equity Ratio (%) 79.9% 72.5% 7.4%p 79.9% 75.4% 4.5%p (unit: bn KRW) CAPEX (KT Only) 3Q 11 3Q 10 YoY 3Q 11 2Q 11 QoQ 3Q 11(YTD) 3Q 10(YTD) YoY Wireless 394.0 252.8 55.9% 394.0 457.3 -13.8% 1214.4 601.7 101.8% Wireline 256.3 293.1 -12.6% 256.3 288.5 -11.2% 812.4 1001.7 -18.9% Overhead 117.8 101.3 16.3% 117.8 60.5 94.7% 236.5 215.0 10.0% Total 768.1 647.2 18.7% 768.1 806.3 -4.7% 2263.3 1818.4 24.5%
Business OverviewI.Financial Highlights (Consolidated) II. Business Overview (Consolidated) 1.Wireless Service 2.Telephone Service 3.Internet Service 4.Other Services 5.Operating Expense III. Appendix
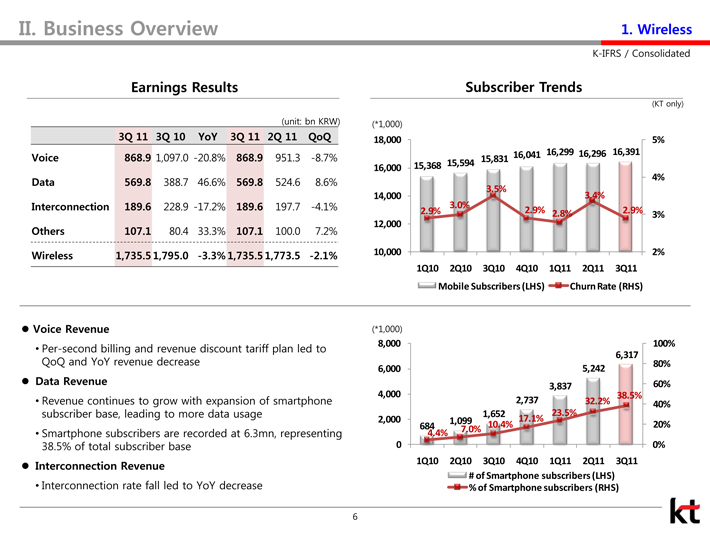
II. Business Overview1. Wireless (*1,000) (*1,000) (unit: bn KRW) (KT only) Earnings Results Subscriber Trends ??Voice Revenue •Per-second billing and revenue discount tariff plan led to QoQ and YoY revenue decrease ?Data Revenue •Revenue continues to grow with expansion of smartphone subscriber base, leading to more data usage •Smartphone subscribers are recorded at 6.3mn, representing 38.5% of total subscriber base ?Interconnection Revenue •Interconnection rate fall led to YoY decrease 3Q 11 3Q 10 YoY 3Q 11 2Q 11 QoQ Voice 868.9 1,097.0 -20.8% 868.9 951.3 -8.7% Data 569.8 388.7 46.6% 569.8 524.6 8.6% Interconnection 189.6 228.9 -17.2% 189.6 197.7 -4.1% Others 107.1 80.4 33.3% 107.1 100.0 7.2% Wireless 1,735.5 1,795.0 -3.3% 1,735.5 1,773.5 -2.1% K-IFRS /Consolidated6841,0991,6522,7373,8375,2426,3174.4%7.0%10.4%17.1%23.5%32.2%38.5%0%20%40%60%80%
100%02,0004,0006,0008,0001Q102Q103Q104Q101Q112Q113Q11# of Smartphone subscribers (LHS)% of Smartphone subscribers (RHS)(*1,000) (*1,000) (KT only) 15,36815,59415,83116,04116,29916,29616,3912.9%3.0%3.5%2.9%
2.8%3.4%2.9%2%3%4%5%10,00012,00014,00016,00018,0001Q102Q103Q104Q101Q112Q113Q11Mobile Subscribers (LHS)Churn Rate (RHS)
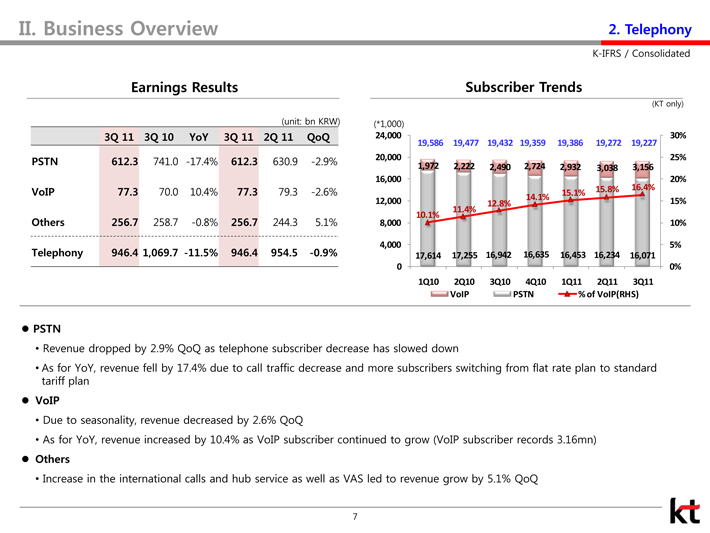
II. Business Overview2. Telephony (*1,000) 3Q 11 3Q 10 YoY 3Q 11 2Q 11 QoQ PSTN 612.3 741.0 -17.4% 612.3 630.9 -2.9% VoIP 77.3 70.0 10.4% 77.3 79.3 -2.6% Others 256.7 258.7 -0.8% 256.7 244.3 5.1% Telephony 946.4 1,069.7 -11.5% 946.4 954.5 -0.9% Subscriber Trends Earnings Results K-IFRS /
Consolidated17,61417,25516,94216,63516,45316,23416,0711,9722,2222,4902,7242,9323,0383,15610.1%11.4%12.8%14.1%
15.1%15.8%16.4%0%5%10%15%20%25%30%04,0008,00012,00016,00020,00024,0001Q102Q103Q104Q101Q112Q113Q11
VoIPPSTN% of VoIP(RHS)19,58619,47719,43219,35919,38619,27219,227(*1,000) 7 ??PSTN • Revenue dropped by 2.9% QoQ as telephone subscriber decrease has slowed down •As for YoY, revenue fell by 17.4% due to call traffic decrease and more subscribers switching from flat rate plan to standard tariff plan ?VoIP • Due to seasonality, revenue decreased by 2.6% QoQ • As for YoY, revenue increased by 10.4% as VoIP subscriber continued to grow (VoIP subscriber records 3.16mn) ?Others • Increase in the international calls and hub service as well as VAS led to revenue grow by 5.1% QoQ
II. Business Overview3. InternetK-IFRS / Consolidated7,0907,1897,3157,4247,5527,6297,7241.4%1.3%1.1%1.2%1.1%1.1%1.0%0%1%2%3%4%5%4,000
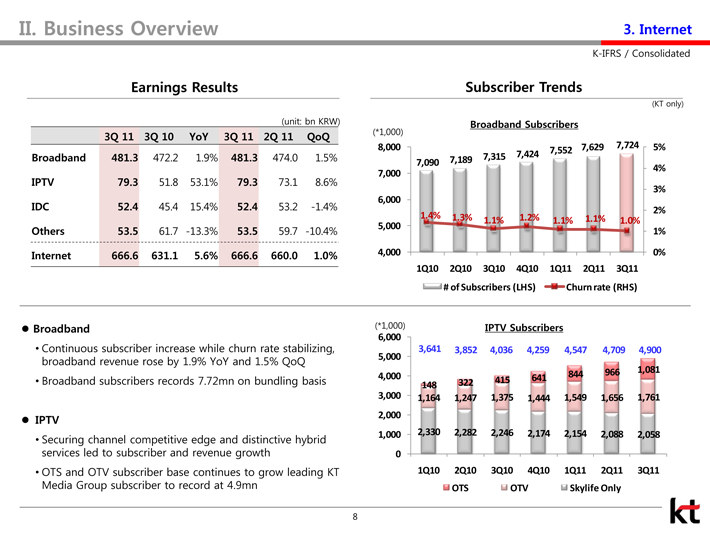
5,0006,0007,0008,0001Q102Q103Q104Q101Q112Q113Q11# of Subscribers (LHS)Churn rate (RHS)8 (*1,000) (*1,000) 3Q 11 3Q 10 YoY 3Q 11 2Q 11 QoQ Broadband 481.3 472.2 1.9% 481.3 474.0 1.5% IPTV 79.3 51.8 53.1% 79.3 73.1 8.6% IDC 52.4 45.4 15.4% 52.4 53.2 -1.4% Others 53.5 61.7 -13.3% 53.5 59.7 -10.4% Internet 666.6 631.1 5.6% 666.6 660.0 1.0% Subscriber Trends Earnings Results K-IFRS / Consolidated (KT only) (unit: bn KRW) Broadband Subscribers IPTV Subscribers ??Broadband •Continuous subscriber increase while churn rate stabilizing, broadband revenue rose by 1.9% YoY and 1.5% QoQ •Broadband subscribers records 7.72mn on bundling basis ?IPTV •Securing channel competitive edge and distinctive hybrid services led to subscriber and revenue growth •OTS and OTV subscriber base continues to grow leading KT Media Group subscriber to record at 4.9mn 2,3302,2822,2462,1742,1542,0882,0581,1641,2471,3751,4441,5491,6561,7611483224156418449661,08
101,0002,0003,0004,0005,0006,0001Q1Q103Q104Q101Q112Q113Q11OTSOTVSkylife Only3,6413,8524,0364,2594,5474,7094,900
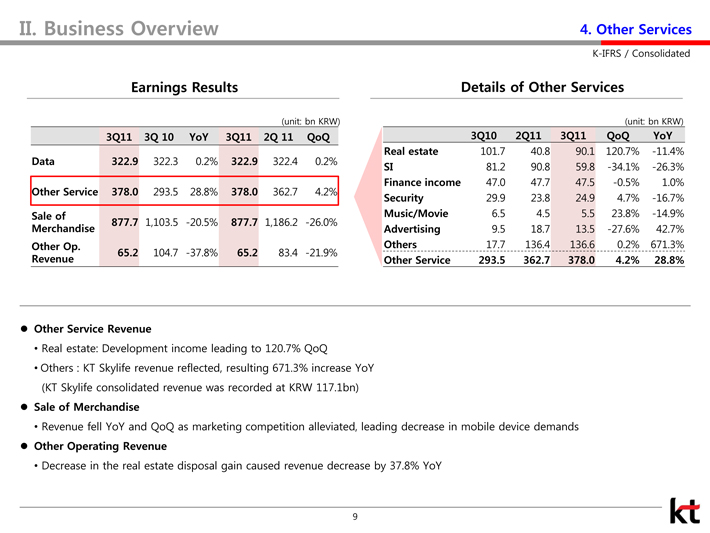
II. Business Overview4. Other ServicesK-IFRS / Consolidated 3Q11 3Q 10 YoY 3Q11 2Q 11 QoQ Data 322.9 322.3 0.2% 322.9 322.4 0.2% Other Service 378.0 293.5 28.8% 378.0 362.7 4.2% Sale of Merchandise 877.7 1,103.5 -20.5% 877.7 1,186.2 -26.0% Other Op. Revenue 65.2 104.7 -37.8% 65.2 83.4 -21.9% 9 Details of Other Services 3Q10 2Q11 3Q11 QoQ YoY Real estate 101.7 40.8 90.1 120.7% -11.4% SI 81.2 90.8 59.8 -34.1% -26.3% Finance income 47.0 47.7 47.5 -0.5% 1.0% Security 29.9 23.8 24.9 4.7% -16.7% Music/Movie 6.5 4.5 5.5 23.8% -14.9% Advertising 9.5 18.7 13.5 -27.6% 42.7% Others 17.7 136.4 136.6 0.2% 671.3% Other Service 293.5 362.7 378.0 4.2% 28.8% Earnings Results K-IFRS / Consolidated (unit: bn KRW) (unit: bn KRW) ?Other Service Revenue • Real estate: Development income leading to 120.7% QoQ •Others : KT Skylife revenue reflected, resulting 671.3% increase YoY (KT Skylife consolidated revenue was recorded at KRW 117.1bn) ?Sale of Merchandise • Revenue fell YoY and QoQ as marketing competition alleviated, leading decrease in mobile device demands ?Other Operating Revenue • Decrease in the real estate disposal gain caused revenue decrease by 37.8% YoY
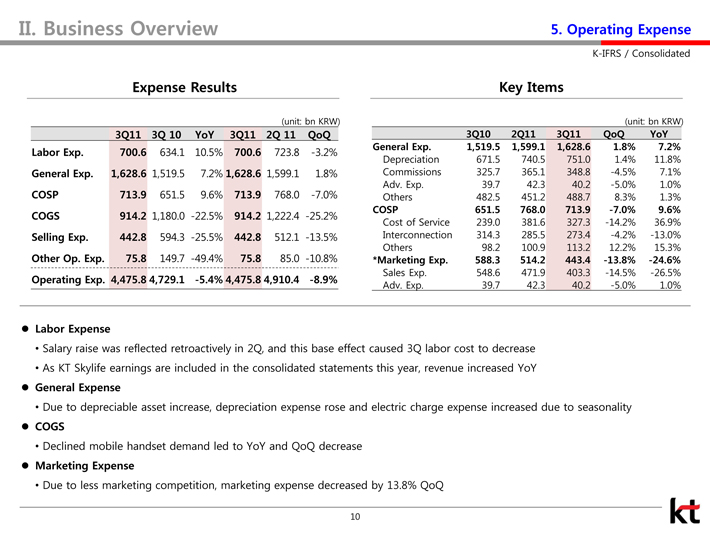
II. Business Overview5. Operating ExpenseK-IFRS / Consolidated10 Key Items 3Q11 3Q 10 YoY 3Q11 2Q 11 QoQ Labor Exp. 700.6 634.1 10.5% 700.6 723.8 -3.2% General Exp. 1,628.6 1,519.5 7.2% 1,628.6 1,599.1 1.8% COSP 713.9 651.5 9.6% 713.9 768.0 -7.0% COGS 914.2 1,180.0 -22.5% 914.2 1,222.4 -25.2% Selling Exp. 442.8 594.3 -25.5% 442.8 512.1 -13.5% Other Op. Exp. 75.8 149.7 -49.4% 75.8 85.0 -10.8% Operating Exp. 4,475.8 4,729.1 -5.4% 4,475.8 4,910.4 -8.9% 3Q10 2Q11 3Q11 QoQ YoY General Exp. 1,519.5 1,599.1 1,628.6 1.8% 7.2% Depreciation 671.5 740.5 751.0 1.4% 11.8% Commissions 325.7 365.1 348.8 -4.5% 7.1% Adv. Exp. 39.7 42.3 40.2 -5.0% 1.0% Others 482.5 451.2 488.7 8.3% 1.3% COSP 651.5 768.0 713.9 -7.0% 9.6% Cost of Service 239.0 381.6 327.3 -14.2% 36.9% Interconnection 314.3 285.5 273.4 -4.2% -13.0% Others 98.2 100.9 113.2 12.2% 15.3% *Marketing Exp. 588.3 514.2 443.4 -13.8% -24.6% Sales Exp. 548.6 471.9 403.3 -14.5% -26.5% Adv. Exp. 39.7 42.3 40.2 -5.0% 1.0% Expense Results K-IFRS / Consolidated (unit: bn KRW) (unit: bn KRW) ?Labor Expense • Salary raise was reflected retroactively in 2Q, and this base effect caused 3Q labor cost to decrease • As KT Skylife earnings are included in the consolidated statements this year, revenue increased YoY ?General Expense • Due to depreciable asset increase, depreciation expense rose and electric charge expense increased due to seasonality ?COGS • Declined mobile handset demand led to YoY and QoQ decrease ?Marketing Expense • Due to less marketing competition, marketing expense decreased by 13.8% QoQ
AppendixI.Financial Highlights (Consolidated) II. Business Overview (Consolidated) III. Appendix 1.Income Statement (Consolidated/Separate) 2.Statement of Financial Position (Consolidated/Separate) 3.Factsheet (KT Only)
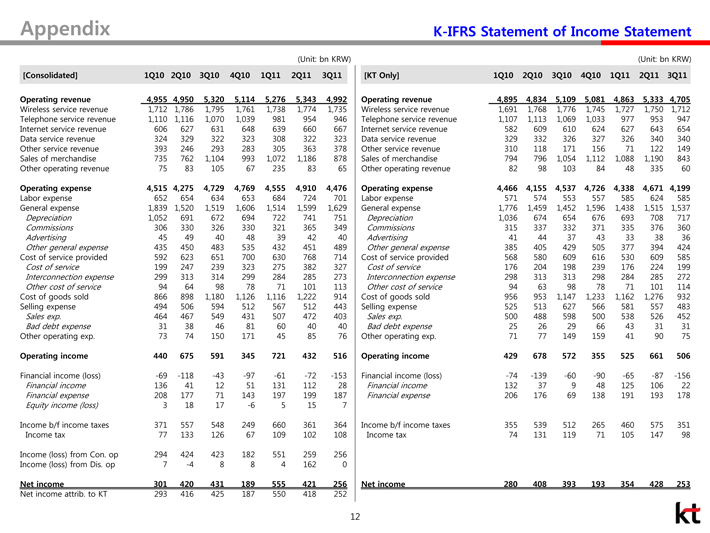
AppendixK-IFRS Statement of Income StatementK-IFRS Statement of Income Statement(Unit: bn KRW) (Unit: bn KRW) 12 [Consolidated] 1Q10 2Q10 3Q10 4Q10 1Q11 2Q11 3Q11 [KT Only] 1Q10 2Q10 3Q10 4Q10 1Q11 2Q11 3Q11 Operating revenue 4,955 4,950 5,320 5,114 5,276 5,343 4,992 Operating revenue 4,895 4,834 5,109 5,081 4,863 5,333 4,705 Wireless service revenue 1,712 1,786 1,795 1,761 1,738 1,774 1,735 Wireless service revenue 1,691 1,768 1,776 1,745 1,727 1,750 1,712 Telephone service revenue 1,110 1,116 1,070 1,039 981 954 946 Telephone service revenue 1,107 1,113 1,069 1,033 977 953 947 Internet service revenue 606 627 631 648 639 660 667 Internet service revenue 582 609 610 624 627 643 654 Data service revenue 324 329 322 323 308 322 323 Data service revenue 329 332 326 327 326 340 340 Other service revenue 393 246 293 283 305 363 378 Other service revenue 310 118 171 156 71 122 149 Sales of merchandise 735 762 1,104 993 1,072 1,186 878 Sales of merchandise 794 796 1,054 1,112 1,088 1,190 843 Other operating revenue 75 83 105 67 235 83 65 Other operating revenue 82 98 103 84 48 335 60 Operating expense 4,515 4,275 4,729 4,769 4,555 4,910 4,476 Operating expense 4,466 4,155 4,537 4,726 4,338 4,671 4,199 Labor expense 652 654 634 653 684 724 701 Labor expense 571 574 553 557 585 624 585 General expense 1,839 1,520 1,519 1,606 1,514 1,599 1,629 General expense 1,776 1,459 1,452 1,596 1,438 1,515 1,537 Depreciation 1,052 691 672 694 722 741 751 Depreciation 1,036 674 654 676 693 708 717 Commissions 306 330 326 330 321 365 349 Commissions 315 337 332 371 335 376 360 Advertising 45 49 40 48 39 42 40 Advertising 41 44 37 43 33 38 36 Other general expense 435 450 483 535 432 451 489 Other general expense 385 405 429 505 377 394 424 Cost of service provided 592 623 651 700 630 768 714 Cost of service provided 568 580 609 616 530 609 585 Cost of service 199 247 239 323 275 382 327 Cost of service 176 204 198 239 176 224 199 Interconnection expense 299 313 314 299 284 285 273 Interconnection expense 298 313 313 298 284 285 272 Other cost of service 94 64 98 78 71 101 113 Other cost of service 94 63 98 78 71 101 114 Cost of goods sold 866 898 1,180 1,126 1,116 1,222 914 Cost of goods sold 956 953 1,147 1,233 1,162 1,276 932 Selling expense 494 506 594 512 567 512 443 Selling expense 525 513 627 566 581 557 483 Sales exp. 464 467 549 431 507 472 403 Sales exp. 500 488 598 500 538 526 452 Bad debt expense 31 38 46 81 60 40 40 Bad debt expense 25 26 29 66 43 31 31 Other operating exp. 73 74 150 171 45 85 76 Other operating exp. 71 77 149 159 41 90 75 Operating income 440 675 591 345 721 432 516 Operating income 429 678 572 355 525 661 506 Financial income (loss) -69 -118 -43 -97 -61 -72 -153 Financial income (loss) -74 -139 -60 -90 -65 -87 -156 Financial income 136 41 12 51 131 112 28 Financial income 132 37 9 48 125 106 22 Financial expense 208 177 71 143 197 199 187 Financial expense 206 176 69 138 191 193 178 Equity income (loss) 3 18 17 -6 5 15 7 Income b/f income taxes 371 557 548 249 660 361 364 Income b/f income taxes 355 539 512 265 460 575 351 Income tax 77 133 126 67 109 102 108 Income tax 74 131 119 71 105 147 98 Income (loss) from Con. op 294 424 423 182 551 259 256 Income (loss) from Dis. op 7 -4 8 8 4 162 0 Net income 301 420 431 189 555 421 256 Net income 280 408 393 193 354 428 253 Net income attrib. to KT 293 416 425 187 550 418 252
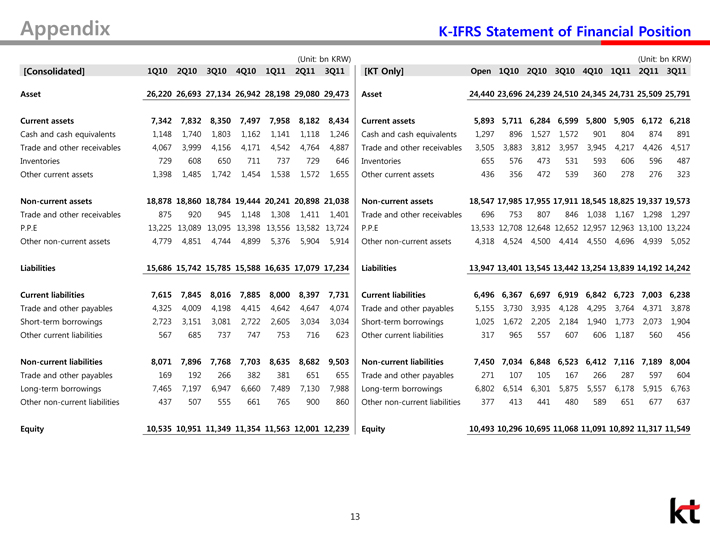
AppendixK-IFRS Statement of Financial Position [Consolidated] 1Q10 2Q10 3Q10 4Q10 1Q11 2Q11 3Q11 [KT Only] Open 1Q10 2Q10 3Q10 4Q10 1Q11 2Q11 3Q11 Asset 26,220 26,693 27,134 26,942 28,198 29,080 29,473 Asset 24,440 23,696 24,239 24,510 24,345 24,731 25,509 25,791 Current assets 7,342 7,832 8,350 7,497 7,958 8,182 8,434 Current assets 5,893 5,711 6,284 6,599 5,800 5,905 6,172 6,218 Cash and cash equivalents 1,148 1,740 1,803 1,162 1,141 1,118 1,246 Cash and cash equivalents 1,297 896 1,527 1,572 901 804 874 891 Trade and other receivables 4,067 3,999 4,156 4,171 4,542 4,764 4,887 Trade and other receivables 3,505 3,883 3,812 3,957 3,945 4,217 4,426 4,517 Inventories 729 608 650 711 737 729 646 Inventories 655 576 473 531 593 606 596 487 Other current assets 1,398 1,485 1,742 1,454 1,538 1,572 1,655 Other current assets 436 356 472 539 360 278 276 323 Non-current assets 18,878 18,860 18,784 19,444 20,241 20,898 21,038 Non-current assets 18,547 17,985 17,955 17,911 18,545 18,825 19,337 19,573 Trade and other receivables 875 920 945 1,148 1,308 1,411 1,401 Trade and other receivables 696 753 807 846 1,038 1,167 1,298 1,297 P.P.E 13,225 13,089 13,095 13,398 13,556 13,582 13,724 P.P.E 13,533 12,708 12,648 12,652 12,957 12,963 13,100 13,224 Other non-current assets 4,779 4,851 4,744 4,899 5,376 5,904 5,914 Other non-current assets 4,318 4,524 4,500 4,414 4,550 4,696 4,939 5,052 Liabilities 15,686 15,742 15,785 15,588 16,635 17,079 17,234 Liabilities 13,947 13,401 13,545 13,442 13,254 13,839 14,192 14,242 Current liabilities 7,615 7,845 8,016 7,885 8,000 8,397 7,731 Current liabilities 6,496 6,367 6,697 6,919 6,842 6,723 7,003 6,238 Trade and other payables 4,325 4,009 4,198 4,415 4,642 4,647 4,074 Trade and other payables 5,155 3,730 3,935 4,128 4,295 3,764 4,371 3,878 Short-term borrowings 2,723 3,151 3,081 2,722 2,605 3,034 3,034 Short-term borrowings 1,025 1,672 2,205 2,184 1,940 1,773 2,073 1,904 Other current liabilities 567 685 737 747 753 716 623 Other current liabilities 317 965 557 607 606 1,187 560 456 Non-current liabilities 8,071 7,896 7,768 7,703 8,635 8,682 9,503 Non-current liabilities 7,450 7,034 6,848 6,523 6,412 7,116 7,189 8,004 Trade and other payables 169 192 266 382 381 651 655 Trade and other payables 271 107 105 167 266 287 597 604 Long-term borrowings 7,465 7,197 6,947 6,660 7,489 7,130 7,988 Long-term borrowings 6,802 6,514 6,301 5,875 5,557 6,178 5,915 6,763 Other non-current liabilities 437 507 555 661 765 900 860 Other non-current liabilities 377 413 441 480 589 651 677 637 Equity 10,535 10,951 11,349 11,354 11,563 12,001 12,239 Equity 10,493 10,296 10,695 11,068 11,091 10,892 11,317 11,549 13 (Unit: bn KRW) (Unit: bn KRW)
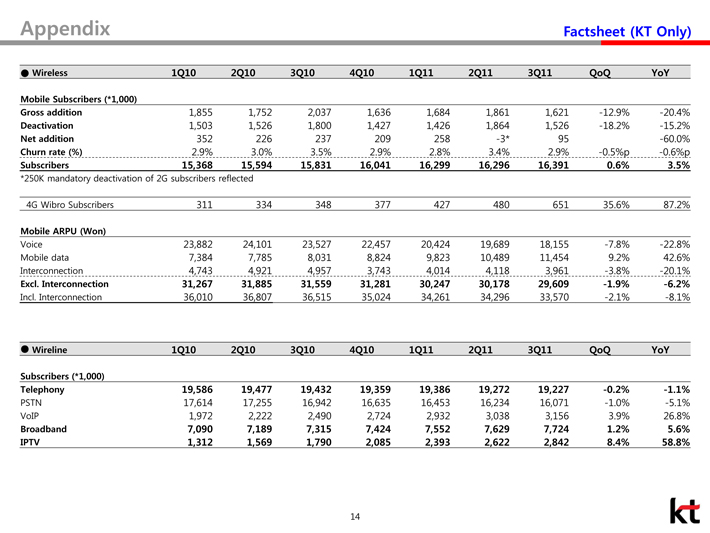
AppendixFactsheet (KT Only) 14 • Wireless 1Q10 2Q10 3Q10 4Q10 1Q11 2Q11 3Q11 QoQ YoY Mobile Subscribers (*1,000) Gross addition 1,855 1,752 2,037 1,636 1,684 1,861 1,621 -12.9% -20.4% Deactivation 1,503 1,526 1,800 1,427 1,426 1,864 1,526 -18.2% -15.2% Net addition 352 226 237 209 258 -3* 95 -60.0% Churn rate (%) 2.9% 3.0% 3.5% 2.9% 2.8% 3.4% 2.9% -0.5%p -0.6%p Subscribers 15,368 15,594 15,831 16,041 16,299 16,296 16,391 0.6% 3.5% *250K mandatory deactivation of 2G subscribers reflected 4G Wibro Subscribers 311 334 348 377 427 480 651 35.6% 87.2% Mobile ARPU (Won) Voice 23,882 24,101 23,527 22,457 20,424 19,689 18,155 -7.8% -22.8% Mobile data 7,384 7,785 8,031 8,824 9,823 10,489 11,454 9.2% 42.6% Interconnection 4,743 4,921 4,957 3,743 4,014 4,118 3,961 -3.8% -20.1% Excl. Interconnection 31,267 31,885 31,559 31,281 30,247 30,178 29,609 -1.9% -6.2% Incl. Interconnection 36,010 36,807 36,515 35,024 34,261 34,296 33,570 -2.1% -8.1% • Wireline 1Q10 2Q10 3Q10 4Q10 1Q11 2Q11 3Q11 QoQ YoY Subscribers (*1,000) Telephony 19,586 19,477 19,432 19,359 19,386 19,272 19,227 -0.2% -1.1% PSTN 17,614 17,255 16,942 16,635 16,453 16,234 16,071 -1.0% -5.1% VoIP 1,972 2,222 2,490 2,724 2,932 3,038 3,156 3.9% 26.8% Broadband 7,090 7,189 7,315 7,424 7,552 7,629 7,724 1.2% 5.6% IPTV 1,312 1,569 1,790 2,085 2,393 2,622 2,842 8.4% 58.8%