SECURITIES AND EXCHANGE COMMISSION
Washington, D.C. 20549
Form 6-K
REPORT OF FOREIGN PRIVATE ISSUER
PURSUANT TO RULE 13a-16 OR 15d-16 OF
THE SECURITIES EXCHANGE ACT OF 1934
For the month of August 2011
Commission File Number 1-14926
KT Corporation
(Translation of registrant’s name into English)
206 Jungja-dong
Bundang-gu, Sungnam
Kyunggi-do
463-711
Korea
(Address of principal executive offices)
Indicate by check mark whether the registrant files or will file annual reports under cover of Form 20-F or Form 40-F:
Form 20-F ü Form 40-F
Indicate by check mark if the registrant is submitting the Form 6-K in paper as permitted by Regulation S-T Rule 101(b)(1):
Indicate by check mark if the registrant is submitting the Form 6-K in paper as permitted by Regulation S-T Rule 101(b)(7):
Indicate by check mark whether by furnishing the information contained in this Form, the registrant is also thereby furnishing the information to the Commission pursuant to Rule 12g3-2(b) under the Securities Exchange Act of 1934.
Yes No ü
If “Yes” is marked, indicate below the file number assigned to the registrant in connection with Rule 12g3-2(b): 82-
SIGNATURES
Pursuant to the requirements of the Securities Exchange Act of 1934, the registrant has duly caused this report to be signed on its behalf by the undersigned, thereunto duly authorized.
| Dated: August 5, 2011 | ||
| KT Corporation | ||
| By: | /s/ Thomas Bum Joon Kim | |
| Name: | Thomas Bum Joon Kim | |
| Title: | Managing Director |
| By: | /s/ Young Jin Kim | |
| Name: | Young Jin Kim | |
| Title: | Director |
alleh KT 2011 2Q Earnings Release Investor Relations August 5, 2011
Disclaimer This presentation has been prepared by KT Corp. (“the-looking statements, which are subject to risks, uncertainties, and assumptions. This presentation is being presented solely for your information and is subject to change without notice. No representation or warranty, expressed or implied, is made and no reliance should be placed on the accuracy, actuality, fairness, or completeness of the information presented. The Company, its affiliates or representatives accept no liability whatsoever for any losses arising from any information contained in the presentation. This presentation does not constitute an offer or invitation to purchase or subscribe for any shares of the Company, and no part of this presentation shall form the Basis of or be relied upon in connection with any contract or commitment. Any decision to purchase shares of the Company should be made solely on the Basis of information, which has been publicly filed with the Securities and Exchange Commission or the Korea Stock Exchange and distributed to all investors. The contents of this presentation may not be reproduced, redistributed or passed on, directly or indirectly, to any other person or published, in whole or in part, for any purpose. 1
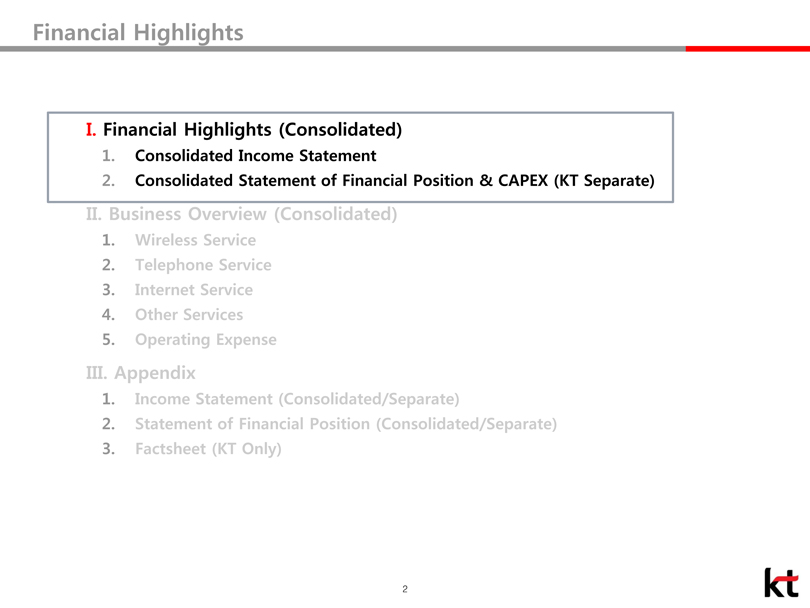
Financial Highlights I. Financial Highlights (Consolidated) 1. Consolidated Income Statement 2. Consolidated Statement of Financial Position & CAPEX (KT Separate) II. Business Overview (Consolidated) 1. Wireless Service 2. Telephone Service 3. Internet Service 4. Other Services 5. Operating Expense III. Appendix 1. Income Statement (Consolidated/Separate) 2. Statement of Financial Position (Consolidated/Separate) 3. Factsheet (KT Only) 2
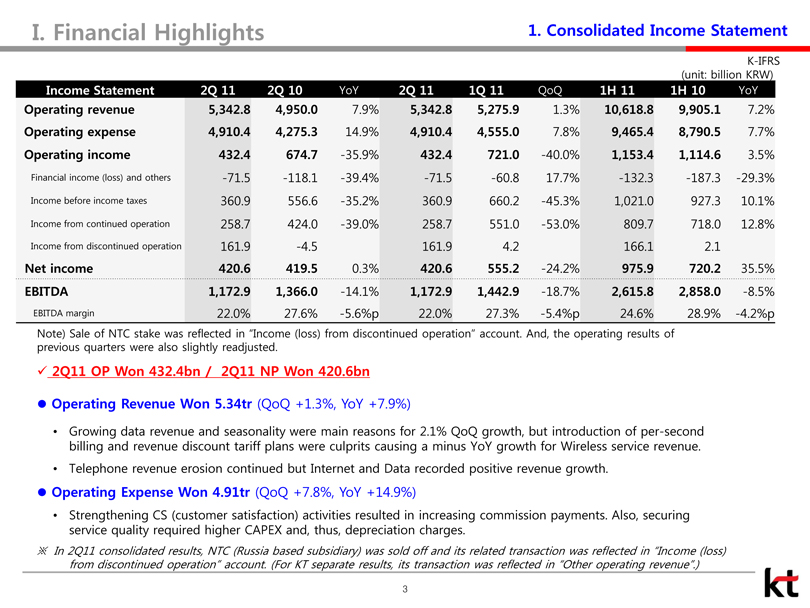
Financial Highlights 1. Consolidated Income Statement KFRS (unit: billion KRW) Income Statement 2Q 11 2Q 10 YoY 2Q 11 1Q 11 QoQ 1H 11 1H 10 YoY Operating revenue 5,342.8 4,950.0 7.9% 5,342.8 5,275.9 1.3% 10,618.8 9,905.1 7.2% Operating expense 4,910.4 4,275.3 14.9% 4,910.4 4,555.0 7.8% 9,465.4 8,790.5 7.7% Operating income 432.4 674.7 -35.9% 432.4 721.0 -40.0% 1,153.4 1,114.6 3.5% Financial income (loss) and others -71.5 -118.1 -39.4% -71.5 -60.8 17.7% -132.3 -187.3 -29.3% Income before income taxes 360.9 556.6 -35.2% 360.9 660.2 -45.3% 1,021.0 927.3 10.1% Income from continued operation 258.7 424.0 -39.0% 258.7 551.0 -53.0% 809.7 718.0 12.8% Income from discontinued operation 161.9 -4.5 161.9 4.2 166.1 2.1 Net income 420.6 419.5 0.3% 420.6 555.2 -24.2% 975.9 720.2 35.5% EBITDA 1,172.9 1,366.0 -14.1% 1,172.9 1,442.9 -18.7% 2,615.8 2,858.0 -8.5% EBITDA margin 22.0% 27.6% -5.6%p 22.0% 27.3% -5.4%p 24.6% 28.9% -4.2%p Note) Sale of NTC stake was reflected in “Income (loss) from discontinued operation” account. And, the operating results of previous quarters were also slightly readjusted. 2Q11 OP Won 432.4bn/ 2Q11 NP Won 420.6bn Operating Revenue Won 5.34tr (QoQ+1.3%, YoY+7.9%) Growing data revenue and seasonality were main reasons for 2.1% QoQgrowth, but introduction of per-second billing and revenue discount tariff plans were culprits causing a minus YoYgrowth for Wireless service revenue. Telephone revenue erosion continued but Internet and Data recorded positive revenue growth. Operating Expense Won 4.91tr(QoQ+7.8%, YoY+14.9%) Strengthening CS (customer satisfaction) activities resulted in increasing commission payments. Also, securing service quality required higher CAPEX and, thus, depreciation charges.※ In 2Q11 consolidated results, NTC (Russia based subsidiary) was sold off and its related transaction was reflected in “Income(loss) from discontinued operation” account. (For KT separate results, its transaction was reflected in “Other operating revenue”.) 3
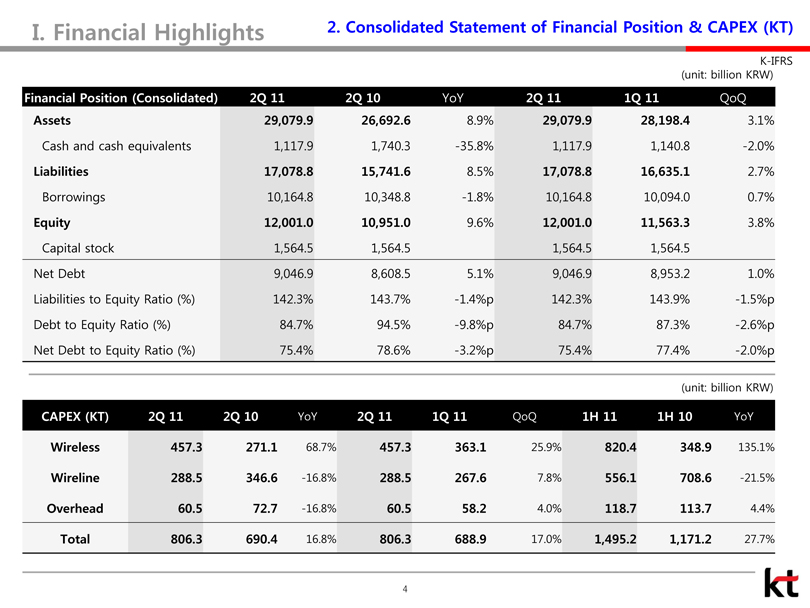
Financial Highlights 2. Consolidated Statement of Financial Position & CAPEX (KT) K-IFRS (unit: billion KRW) Financial Position (Consolidated) 2Q 11 2Q 10 YoY 2Q 11 1Q 11 QoQ Assets 29,079.9 26,692.6 8.9% 29,079.9 28,198.4 3.1% Cash and cash equivalents 1,117.9 1,740.3 -35.8% 1,117.9 1,140.8 -2.0% Liabilities 17,078.8 15,741.6 8.5% 17,078.8 16,635.1 2.7% Borrowings 10,164.8 10,348.8 -1.8% 10,164.8 10,094.0 0.7% Equity 12,001.0 10,951.0 9.6% 12,001.0 11,563.3 3.8% Capital stock 1,564.5 1,564.5 1,564.5 1,564.5 Net Debt 9,046.9 8,608.5 5.1% 9,046.9 8,953.2 1.0% Liabilities to Equity Ratio (%) 142.3% 143.7% -1.4%p 142.3% 143.9% -1.5%p Debt to Equity Ratio (%) 84.7% 94.5% -9.8%p 84.7% 87.3% -2.6%p Net Debt to Equity Ratio (%) 75.4% 78.6% -3.2%p 75.4% 77.4% -2.0%p (unit: billion KRW) CAPEX (KT) 2Q 11 2Q 10 YoY 2Q 11 1Q 11 QoQ 1H 11 1H 10 YoY Wireless 457.3 271.1 68.7% 457.3 363.1 25.9% 820.4 348.9 135.1% Wireline 288.5 346.6 -16.8% 288.5 267.6 7.8% 556.1 708.6 -21.5% Overhead 60.5 72.7 -16.8% 60.5 58.2 4.0% 118.7 113.7 4.4% Total 806.3 690.4 16.8% 806.3 688.9 17.0% 1,495.2 1,171.2 27.7% 4
Financial Highlights Financial Highlights (Consolidated) Consolidated Income Statement Consolidated Statement of Financial Position & CAPEX (KT Separate) Business Overview (Consolidated) Wireless Service Telephone Service Internet Service Other Services Operating Expense Appendix Income Statement (Consolidated/Separate) Statement of Financial Position (Consolidated/Separate) Factsheet (KT Only) 5
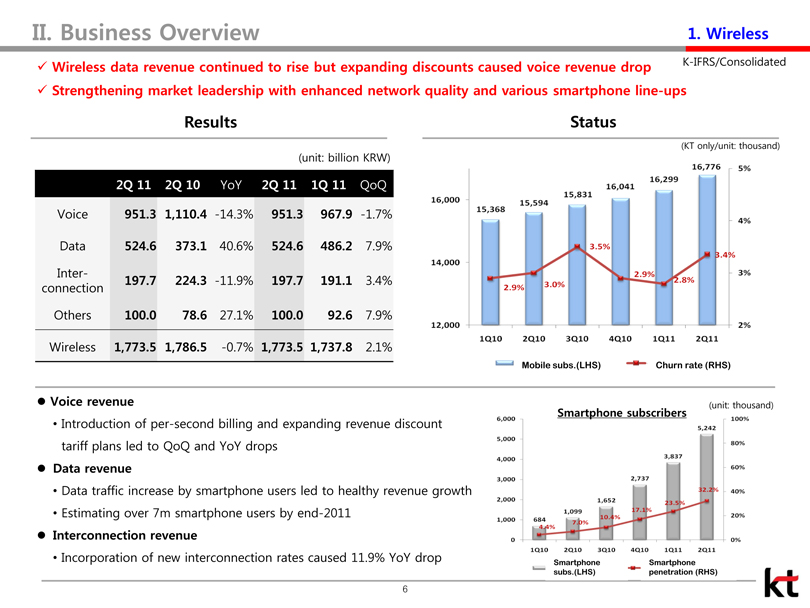
II. Business Overview 1. Wireless K-IFRS/Consolidated Wireless data revenue continued to rise but expanding discounts caused voice revenue drop Strengthening market leadership with enhanced network quality and various smartphone line-ups Results (unit: billion KRW) 2Q 11 2Q 10 YoY 2Q 11 1Q 11 QoQ Voice 951.3 1,110.4 -14.3% 951.3 967.9 -1.7% Data 524.6 373.1 40.6% 524.6 486.2 7.9% Inter- 197.7 224.3 -11.9% 197.7 191.1 3.4% connection Others 100.0 78.6 27.1% 100.0 92.6 7.9% Wireless 1,773.5 1,786.5 -0.7% 1,773.5 1,737.8 2.1% Status (KT only/unit: thousand) 16,000 14,000 12,000 15,368 15,594 15,831 16,041 16,299 16,776 1Q10 2Q10 3Q10 4Q10 1Q11 2Q11 5% 4% 3% 2% 2.9% 3.0% 3.5% 2.9% 2.8% 3.4% Mobile subs.(LHS) Churn rate (RHS) Voice revenue Introduction of per-second billing and expanding revenue discount tariff plans led to QoQ and YoY drops Data revenue Data traffic increase by smartphone users led to healthy revenue growth Estimating over 7m smartphone users by end-2011 Interconnection revenue Incorporation of new interconnection rates caused 11.9% YoY drop Smartphone subscribers (unit: thousand) 6,000 5,000 4,000 3,000 2,000 1,000 0 684 1,099 1,652 2,737 3,837 5,242 4.4% 7.0% 10.4% 17.1% 23.5% 32.2 100% 80% 60% 40% 20% 0% 1Q10 2Q10 3Q10 4Q10 1Q11 2Q11 Smartphone subs.(LHS) Smartphone penetration (RHS) 6
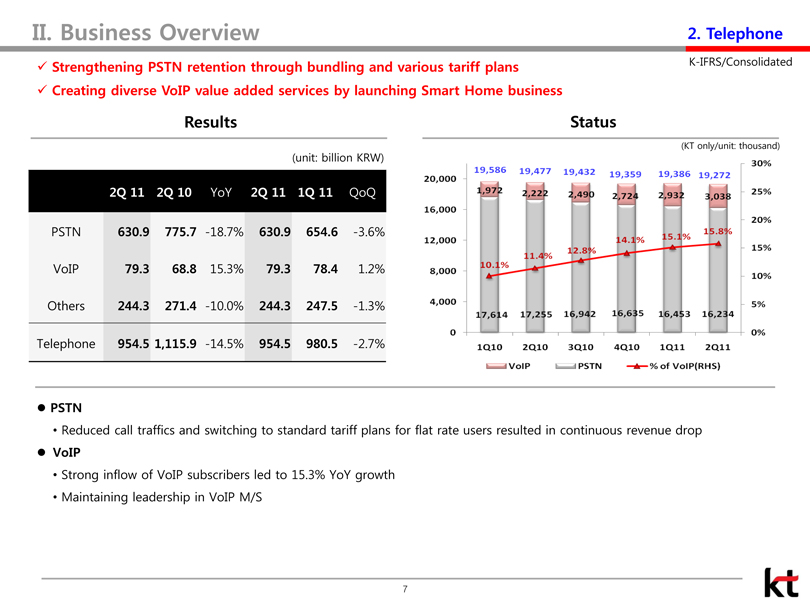
II. Business Overview 2. Telephone K-IFRS/Consolidated V Strengthening PSTN retention through bundling and various tariff plans V Creating diverse VoIP value added services by launching Smart Home business ResuIts (unit: billion KRW) 2Q11 2Q10 YoY 2Q11 1Q11 QoQ PSTN 630.9 775.7 -18.7% 630.9 654.6 -3.6% VoIP 79.3 68.8 15.3% 79.3 78.4 1.2% Others 244.3 271.4 -10.0% 244.3 247.5 -1.3% Telephone 954.5 1,115.9 -14.5% 954.5 980.5 -2.7% Status(KT only/unit: thousand) 20,000 16,000 12,000 8,000 4,000 19,586 19,477 19,432 19,359 19,386 19,272 1,972 2,222 2,490 2,724 2,932 3,038 (KT only/unit: thousand) 30% 25% 20% 15% 10% 5% 0% 4,000 0 7,6 .4 17,2 5 11.9 1Q10 2Q10 3Q10 LJVoIP JPSTN 4Q10 1Q11 2Q11 —à—% of VoIP(RI-IS) PSTN Reduced call traffics and switching to standard tariff plans for flat rate users resulted in continuous revenue drop VoIP Strong inflow of VoIP subscribers led to 15.3% YoY growth Maintaining leadership in VoIP Mi/S 7
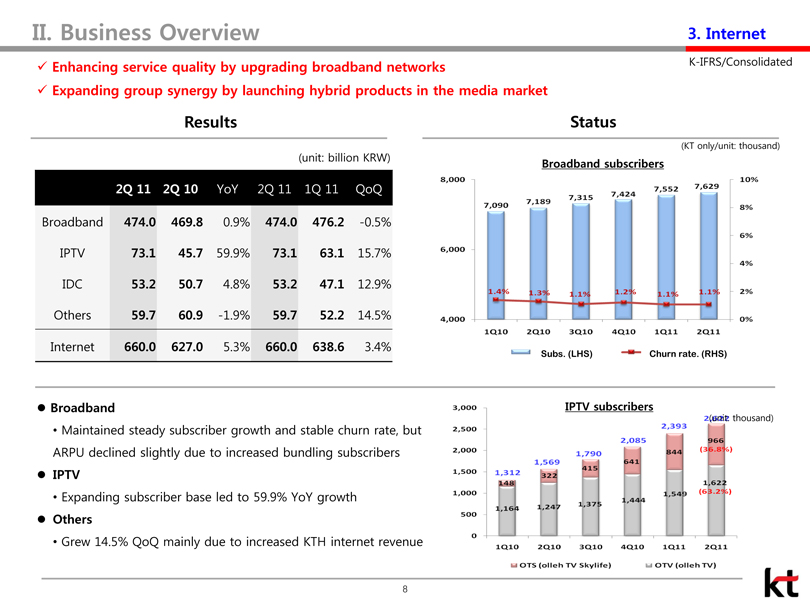
II. Business Overview 3. Internet Enhancing service quality by upgrading broadband networks Expanding group synergy by launching hybrid products in the media market K-IFRS/Consolidated Results (unit: billion KRW) 2Q 11 2Q 10 YoY 2Q 11 1Q 11 QoQ Broadband 474.0 469.8 0.9% 474.0 476.2 -0.5% IPTV 73.1 45.7 59.9% 73.1 63.1 15.7% IDC 53.2 50.7 4.8% 53.2 47.1 12.9% Others 59.7 60.9 -1.9% 59.7 52.2 14.5% Internet 660.0 627.0 5.3% 660.0 638.6 3.4% Status (KT only/unit: thousand) Broadband subscribers 8,000 6,000 4,000 Subs. (LHS) Churn rate. (RHS) Broadband Maintained steady subscriber growth and stable churn rate, but ARPU declined slightly due to increased bundling subscribers IPTV Expanding subscriber base led to 59.9% YoY growth Others Grew 14.5% QoQ mainly due to increased KTH internet revenue 8 4Q10 1Q11 2Q11 _J OTV(oIIehTV) 3,000 2,500 IPTV subscribers 2,085 2.000 1,500 1,000 500 0 1,312 4 I 1Q10 1,569 1,24 2Q10 1,790 I 41 !- 3Q10 Li OTS (ouch TV Skylife) 2,393 14 2C6Z thousand) (3 .8 ..) 1 62 (6 .2 ) 8
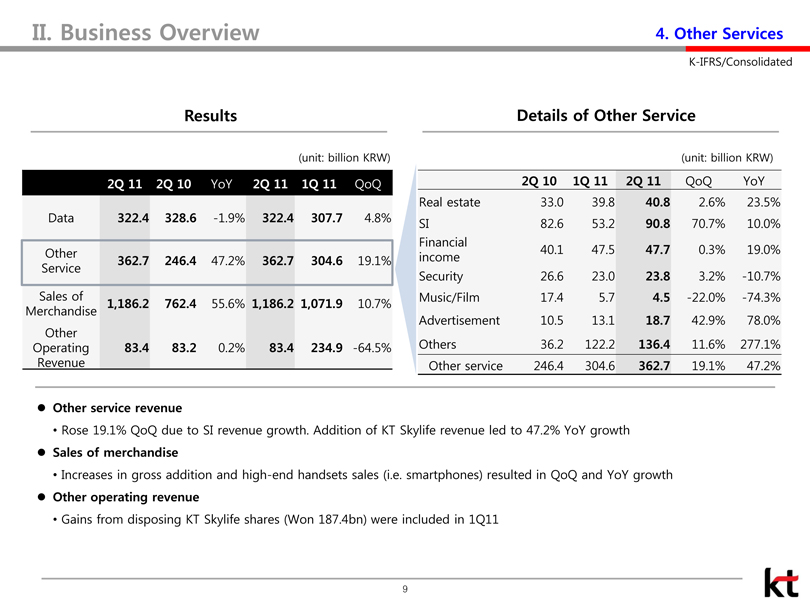
II. Business Overview 4. Other Services K-IFRS/Consolidated Results (unit: billion KRW) 2Q 11 2Q 10 YoY 2Q 11 1Q 11 QoQ Data 322.4 328.6 -1.9% 322.4 307.7 4.8% Other 362.7 246.4 47.2% 362.7 304.6 19.1% Service Sales of 1,186.2 762.4 55.6% 1,186.2 1,071.9 10.7% Merchandise Other Operating 83.4 83.2 0.2% 83.4 234.9 -64.5% Revenue Details of Other Service (unit: billion KRW) 2Q 10 1Q 11 2Q 11 QoQ YoY Real estate 33.0 39.8 40.8 2.6% 23.5% SI 82.6 53.2 90.8 70.7% 10.0% Financial 40.1 47.5 47.7 0.3% 19.0% income Security 26.6 23.0 23.8 3.2% -10.7% Music/Film 17.4 5.7 4.5 -22.0% -74.3% Advertisement 10.5 13.1 18.7 42.9% 78.0% Others 36.2 122.2 136.4 11.6% 277.1% Other service 246.4 304.6 362.7 19.1% 47.2% Other service revenue Rose 19.1% QoQ due to SI revenue growth. Addition of KT Skylife revenue led to 47.2% YoY growth Sales of merchandise Increases in gross addition and high-end handsets sales (i.e. smartphones) resulted in QoQ and YoY growth Other operating revenue Gains from disposing KT Skylife shares (Won 187.4bn) were included in 1Q11 9
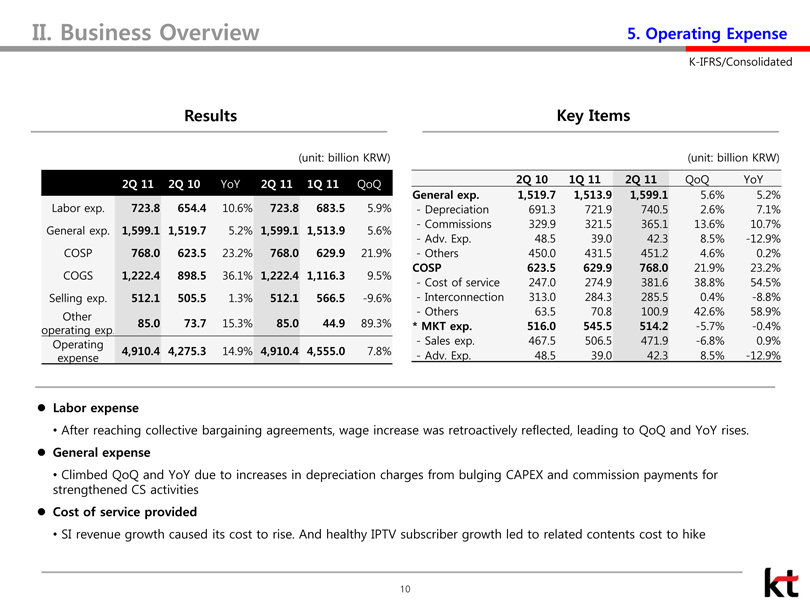
II. Business Overview 5. Operating Expense K-IFRS/Consolidated Results (unit: billion KRW) 2Q 11 2Q 10 YoY 2Q 11 1Q 11 QoQ Labor exp. 723.8 654.4 10.6% 723.8 683.5 5.9% General exp. 1,599.1 1,519.7 5.2% 1,599.1 1,513.9 5.6% COSP 768.0 623.5 23.2% 768.0 629.9 21.9% COGS 1,222.4 898.5 36.1% 1,222.4 1,116.3 9.5% Selling exp. 512.1 505.5 1.3% 512.1 566.5 -9.6% Other 85.0 73.7 15.3% 85.0 44.9 89.3% operating exp. Operating 4,910.4 4,275.3 14.9% 4,910.4 4,555.0 7.8% expense Key Items (unit: billion KRW) 2Q 10 1Q 11 2Q 11 QoQ YoY General exp. 1,519.7 1,513.9 1,599.1 5.6% 5.2% - Depreciation 691.3 721.9 740.5 2.6% 7.1% - Commissions 329.9 321.5 365.1 13.6% 10.7% - Adv. Exp. 48.5 39.0 42.3 8.5% -12.9% - Others 450.0 431.5 451.2 4.6% 0.2% COSP 623.5 629.9 768.0 21.9% 23.2% - Cost of service 247.0 274.9 381.6 38.8% 54.5% - Interconnection 313.0 284.3 285.5 0.4% -8.8% - Others 63.5 70.8 100.9 42.6% 58.9% * MKT exp. 516.0 545.5 514.2 -5.7% -0.4% - Sales exp. 467.5 506.5 471.9 -6.8% 0.9% - Adv. Exp. 48.5 39.0 42.3 8.5% -12.9% Labor expense After reaching collective bargaining agreements, wage increase was retroactively reflected, leading to QoQ and YoY rises. General expense Climbed QoQ and YoY due to increases in depreciation charges from bulging CAPEX and commission payments for strengthened CS activities Cost of service provided SI revenue growth caused its cost to rise. And healthy IPTV subscriber growth led to related contents cost to hike 10
Financial Highlights I. Financial Highlights (Consolidated) 1. Consolidated Income Statement 2. Consolidated Statement of Financial Position & CAPEX (KT Separate) II. Business Overview (Consolidated) 1. Wireless Service 2. Telephone Service 3. Internet Service 4. Other Services 5. Operating Expense III. Appendix 1. Income Statement (Consolidated/Separate) 2. Statement of Financial Position (Consolidated/Separate) 3. Factsheet (KT Only) 11
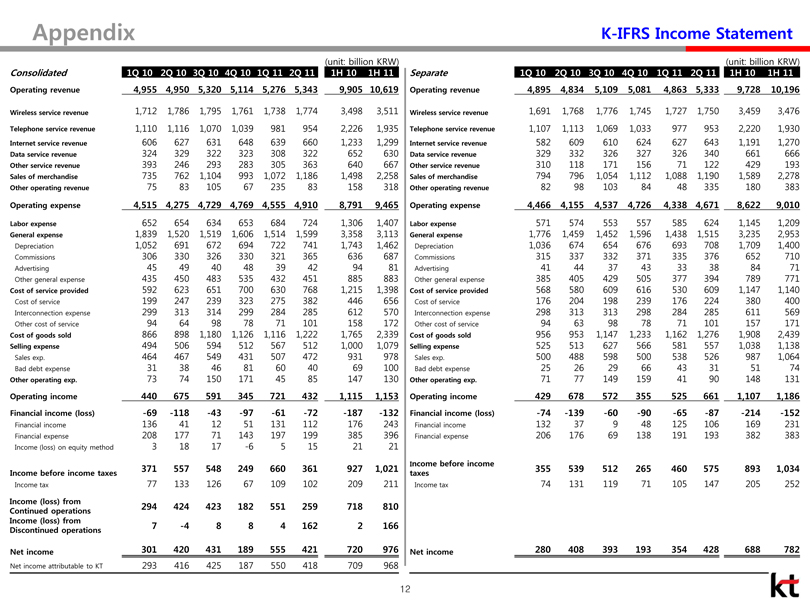
Appendix K-IFRS Income Statement (unit: billion KRW) Consolidated 1Q 10 2Q 10 3Q 10 4Q 10 1Q 11 2Q 11 1H 10 1H 11 Operating revenue 4,955 4,950 5,320 5,114 5,276 5,343 9,905 10,619 Wireless service revenue 1,712 1,786 1,795 1,761 1,738 1,774 3,498 3,511 Telephone service revenue 1,110 1,116 1,070 1,039 981 954 2,226 1,935 Internet service revenue 606 627 631 648 639 660 1,233 1,299 Data service revenue 324 329 322 323 308 322 652 630 Other service revenue 393 246 293 283 305 363 640 667 Sales of merchandise 735 762 1,104 993 1,072 1,186 1,498 2,258 Other operating revenue 75 83 105 67 235 83 158 318 Operating expense 4,515 4,275 4,729 4,769 4,555 4,910 8,791 9,465 Labor expense 652 654 634 653 684 724 1,306 1,407 General expense 1,839 1,520 1,519 1,606 1,514 1,599 3,358 3,113 Depreciation 1,052 691 672 694 722 741 1,743 1,462 Commissions 306 330 326 330 321 365 636 687 Advertising 45 49 40 48 39 42 94 81 Other general expense 435 450 483 535 432 451 885 883 Cost of service provided 592 623 651 700 630 768 1,215 1,398 Cost of service 199 247 239 323 275 382 446 656 Interconnection expense 299 313 314 299 284 285 612 570 Other cost of service 94 64 98 78 71 101 158 172 Cost of goods sold 866 898 1,180 1,126 1,116 1,222 1,765 2,339 Selling expense 494 506 594 512 567 512 1,000 1,079 Sales exp. 464 467 549 431 507 472 931 978 Bad debt expense 31 38 46 81 60 40 69 100 Other operating exp. 73 74 150 171 45 85 147 130 Operating income 440 675 591 345 721 432 1,115 1,153 Financial income (loss) -69 -118 -43 -97 -61 -72 -187 -132 Financial income 136 41 12 51 131 112 176 243 Financial expense 208 177 71 143 197 199 385 396 Income (loss) on equity method 3 18 17 -6 5 15 21 21 Income before income taxes 371 557 548 249 660 361 927 1,021 Income tax 77 133 126 67 109 102 209 211 Income (loss) from Continued operations 294 424 423 182 551 259 718 810 Income (loss) from Discontinued operations 7 -4 8 8 4 162 2 166 Net income 301 420 431 189 555 421 720 976 Net income attributable to KT 293 416 425 187 550 418 709 968 (unit: billion KRW) Separate 1Q 10 2Q 10 3Q 10 4Q 10 1Q 11 2Q 11 1H 10 1H 11 Operating revenue 4,895 4,834 5,109 5,081 4,863 5,333 9,728 10,196 Wireless service revenue 1,691 1,768 1,776 1,745 1,727 1,750 3,459 3,476 Telephone service revenue 1,107 1,113 1,069 1,033 977 953 2,220 1,930 Internet service revenue 582 609 610 624 627 643 1,191 1,270 Data service revenue 329 332 326 327 326 340 661 666 Other service revenue 310 118 171 156 71 122 429 193 Sales of merchandise 794 796 1,054 1,112 1,088 1,190 1,589 2,278 Other operating revenue 82 98 103 84 48 335 180 383 Operating expense 4,466 4,155 4,537 4,726 4,338 4,671 8,622 9,010 Labor expense 571 574 553 557 585 624 1,145 1,209 General expense 1,776 1,459 1,452 1,596 1,438 1,515 3,235 2,953 Depreciation 1,036 674 654 676 693 708 1,709 1,400 Commissions 315 337 332 371 335 376 652 710 Advertising 41 44 37 43 33 38 84 71 Other general expense 385 405 429 505 377 394 789 771 Cost of service provided 568 580 609 616 530 609 1,147 1,140 Cost of service 176 204 198 239 176 224 380 400 Interconnection expense 298 313 313 298 284 285 611 569 Other cost of service 94 63 98 78 71 101 157 171 Cost of goods sold 956 953 1,147 1,233 1,162 1,276 1,908 2,439 Selling expense 525 513 627 566 581 557 1,038 1,138 Sales exp. 500 488 598 500 538 526 987 1,064 Bad debt expense 25 26 29 66 43 31 51 74 Other operating exp. 71 77 149 159 41 90 148 131 Operating income 429 678 572 355 525 661 1,107 1,186 Financial income (loss) -74 -139 -60 -90 -65 -87 -214 -152 Financial income 132 37 9 48 125 106 169 231 Financial expense 206 176 69 138 191 193 382 383 Income before income taxes 355 539 512 265 460 575 893 1,034 Income tax 74 131 119 71 105 147 205 252 Net income 280 408 393 193 354 428 688 782 12
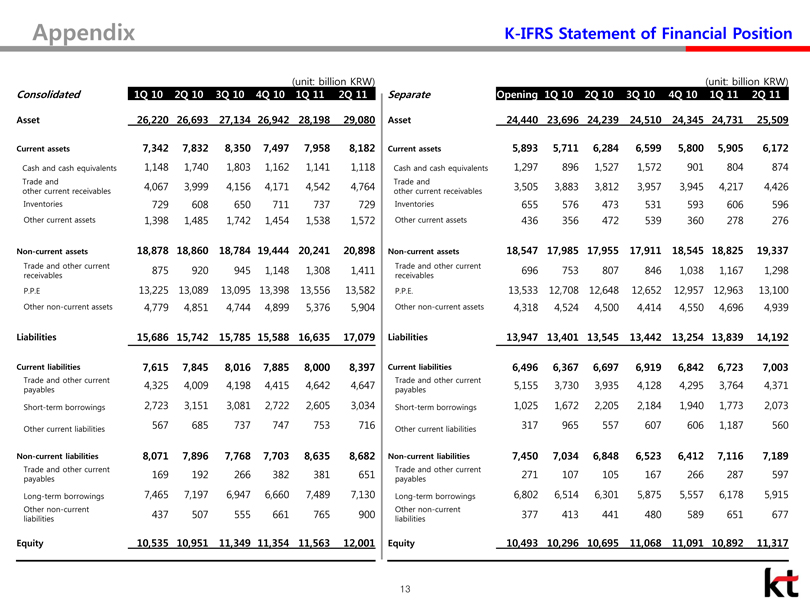
Appendix K-IFRS Statement of Financial Position (unit: billion KRW) Consolidated 1Q 10 2Q 10 3Q 10 4Q 10 1Q 11 2Q 11 Asset 26,220 26,693 27,134 26,942 28,198 29,080 Current assets 7,342 7,832 8,350 7,497 7,958 8,182 Cash and cash equivalents 1,148 1,740 1,803 1,162 1,141 1,118 Trade and 4,067 3,999 4,156 4,171 4,542 4,764 other current receivables Inventories 729 608 650 711 737 729 Other current assets 1,398 1,485 1,742 1,454 1,538 1,572 Non-current assets 18,878 18,860 18,784 19,444 20,241 20,898 Trade and other current 875 920 945 1,148 1,308 1,411 receivables P.P.E 13,225 13,089 13,095 13,398 13,556 13,582 Other non-current assets 4,779 4,851 4,744 4,899 5,376 5,904 Liabilities 15,686 15,742 15,785 15,588 16,635 17,079 Current liabilities 7,615 7,845 8,016 7,885 8,000 8,397 Trade and other current payables 4,325 4,009 4,198 4,415 4,642 4,647 Short-term borrowings 2,723 3,151 3,081 2,722 2,605 3,034 Other current liabilities 567 685 737 747 753 716 Non-current liabilities 8,071 7,896 7,768 7,703 8,635 8,682 Trade and other current payables 169 192 266 382 381 651 Long-term borrowings 7,465 7,197 6,947 6,660 7,489 7,130 Other non-current liabilities 437 507 555 661 765 900 Equity 10,535 10,951 11,349 11,354 11,563 12,001 (unit: billion KRW) Separate Opening 1Q 10 2Q 10 3Q 10 4Q 10 1Q 11 2Q 11 Asset 24,440 23,696 24,239 24,510 24,345 24,731 25,509 Current assets 5,893 5,711 6,284 6,599 5,800 5,905 6,172 Cash and cash equivalents 1,297 896 1,527 1,572 901 804 874 Trade and 3,505 3,883 3,812 3,957 3,945 4,217 4,426 other current receivables Inventories 655 576 473 531 593 606 596 Other current assets 436 356 472 539 360 278 276 Non-current assets 18,547 17,985 17,955 17,911 18,545 18,825 19,337 Trade and other current 696 753 807 846 1,038 1,167 1,298 receivables P.P.E. 13,533 12,708 12,648 12,652 12,957 12,963 13,100 Other non-current assets 4,318 4,524 4,500 4,414 4,550 4,696 4,939 Liabilities 13,947 13,401 13,545 13,442 13,254 13,839 14,192 Current liabilities 6,496 6,367 6,697 6,919 6,842 6,723 7,003 Trade and other current payables 5,155 3,730 3,935 4,128 4,295 3,764 4,371 Short-term borrowings 1,025 1,672 2,205 2,184 1,940 1,773 2,073 Other current liabilities 317 965 557 607 606 1,187 560 Non-current liabilities 7,450 7,034 6,848 6,523 6,412 7,116 7,189 Trade and other current payables 271 107 105 167 266 287 597 Long-term borrowings 6,802 6,514 6,301 5,875 5,557 6,178 5,915 Other non-current liabilities 377 413 441 480 589 651 677 Equity 10,493 10,296 10,695 11,068 11,091 10,892 11,317 13
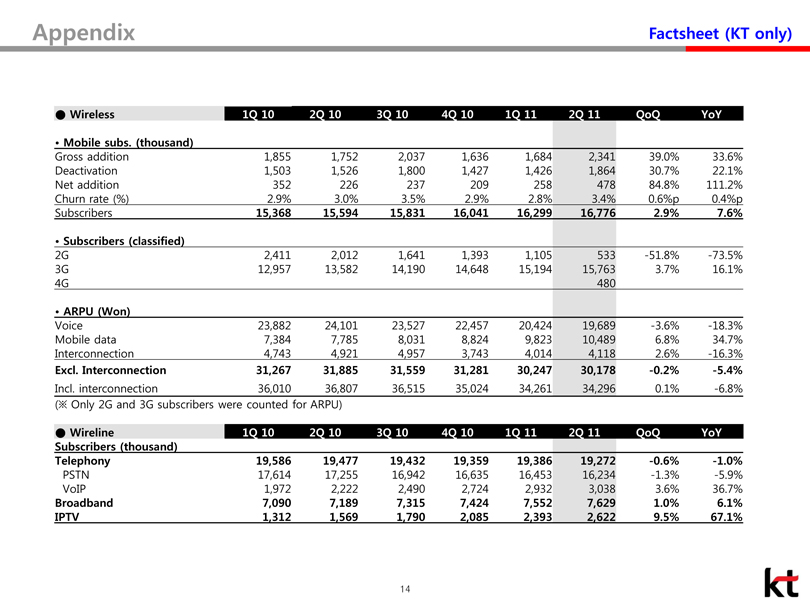
Appendix Factsheet (KT only) Wireless 1Q 10 2Q 10 3Q 10 4Q 10 1Q 11 2Q 11 QoQ YoY Mobile subs. (thousand) Gross addition 1,855 1,752 2,037 1,636 1,684 2,341 39.0% 33.6% Deactivation 1,503 1,526 1,800 1,427 1,426 1,864 30.7% 22.1% Net addition 352 226 237 209 258 478 84.8% 111.2% Churn rate (%) 2.9% 3.0% 3.5% 2.9% 2.8% 3.4% 0.6%p 0.4%p Subscribers 15,368 15,594 15,831 16,041 16,299 16,776 2.9% 7.6% Subscribers (classified) 2G 2,411 2,012 1,641 1,393 1,105 533 -51.8% -73.5% 3G 12,957 13,582 14,190 14,648 15,194 15,763 3.7% 16.1% 4G 480 ARPU(Won) Voice 23,882 24,101 23,527 22,457 20,424 19,689 -3.6% -18.3% Mobile data 7,384 7,785 8,031 8,824 9,823 10,489 6.8% 34.7% Interconnection 4,743 4,921 4,957 3,743 4,014 4,118 2.6% -16.3% Excl. Interconnection 31,267 31,885 31,559 31,281 30,247 30,178 -0.2% -5.4% Incl. interconnection 36,010 36,807 36,515 35,024 34,261 34,296 0.1% -6.8% (Only 2G and 3G subscribers were counted for ARPU) Wireline 1Q 10 2Q 10 3Q 10 4Q 10 1Q 11 2Q 11 QoQ YoY Subscribers (thousand) Telephony 19,586 19,477 19,432 19,359 19,386 19,272 -0.6% -1.0% PSTN 17,614 17,255 16,942 16,635 16,453 16,234 -1.3% -5.9% VoIP 1,972 2,222 2,490 2,724 2,932 3,038 3.6% 36.7% Broadband 7,090 7,189 7,315 7,424 7,552 7,629 1.0% 6.1% IPTV 1,312 1,569 1,790 2,085 2,393 2,622 9.5% 67.1% 14