SECURITIES AND EXCHANGE COMMISSION
Washington, D.C. 20549
Form 6-K
REPORT OF FOREIGN PRIVATE ISSUER
PURSUANT TO RULE 13a-16 OR 15d-16 OF
THE SECURITIES EXCHANGE ACT OF 1934
For the month of November 2012
Commission File Number 1-14926
KT Corporation
(Translation of registrant’s name into English)
206 Jungja-dong
Bundang-gu, Sungnam
Kyunggi-do
463-711
Korea
(Address of principal executive offices)
Indicate by check mark whether the registrant files or will file annual reports under cover of Form 20-F or Form 40-F:
Form 20-F x Form 40-F ¨
Indicate by check mark if the registrant is submitting the Form 6-K in paper as permitted by Regulation S-T Rule 101(b)(1): ¨
Indicate by check mark if the registrant is submitting the Form 6-K in paper as permitted by Regulation S-T Rule 101(b)(7): ¨
Indicate by check mark whether by furnishing the information contained in this Form, the registrant is also thereby furnishing the information to the Commission pursuant to Rule 12g3-2(b) under the Securities Exchange Act of 1934.
Yes¨ Nox
If “Yes” is marked, indicate below the file number assigned to the registrant in connection with Rule 12g3-2(b): 82-
SIGNATURES
Pursuant to the requirements of the Securities Exchange Act of 1934, the registrant has duly caused this report to be signed on its behalf by the undersigned, thereunto duly authorized.
| Dated: November 5, 2012 | ||
| KT Corporation | ||
| By: | /s/ Youngwoo Kim | |
| Name: | Youngwoo Kim | |
| Title: | Vice President | |
| By: | /s/ Jungsup Jung | |
| Name: | Jungsup Jung | |
| Title: | Team Leader | |
kt 3Q 12 Earnings Release Investor Relations 2012. 11. 5
Disclaimer This presentation has been prepared by KT Corp. (“the Company”). This presentation contains forward-looking statements, which are subject to risks, uncertainties, and assumptions. This presentation is being presented solely for your information and is subject to change without notice. No representation or warranty, expressed or implied, is made and no reliance should be placed on the accuracy, actuality, fairness, or completeness of the information presented. The Company, its affiliates or representatives accept no liability whatsoever for any losses arising from any information contained in the presentation. This presentation does not constitute an offer or invitation to purchase or subscribe for any shares of the Company, and no part of this presentation shall form the Basis of or be relied upon in connection with any contract or commitment. Any decision to purchase shares of the Company should be made solely on the Basis of information, which has been publicly filed with the Securities and Exchange Commission or the Korea Stock Exchange and distributed to all investors. The contents of this presentation may not be reproduced, redistributed or passed on, directly or indirectly, to any other person or published, in whole or in part, for any purpose.
Contents 1 Financial Highlights 2 Business Overview 3 Q&A 4 Appendix
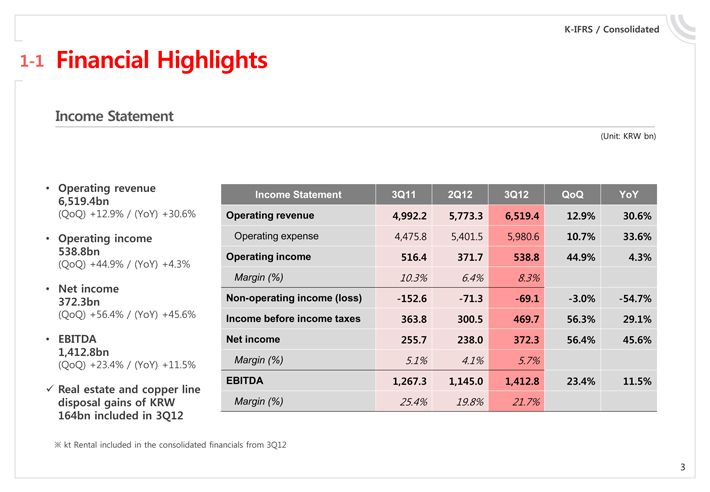
K-IFRS / Consolidated 1-1 Financial Highlights Income Statement (Unit: KRW bn) • Operating revenue 6,519.4bn (QoQ) +12.9% / (YoY) +30.6% • Operating income 538.8bn (QoQ) +44.9% / (YoY) +4.3% • Net income 372.3bn (QoQ) +56.4% / (YoY) +45.6% • EBITDA 1,412.8bn (QoQ) +23.4% / (YoY) +11.5% ??Real estate and copper line disposal gains of KRW 164bn included in 3Q12 ? kt Rental included in the consolidated financials from 3Q12 Income Statement 3Q11 2Q12 3Q12 QoQ YoY Operating revenue 4,992.2 5,773.3 6,519.4 12.9% 30.6% Operating expense 4,475.8 5,401.5 5,980.6 10.7% 33.6% Operating income 516.4 371.7 538.8 44.9% 4.3% Margin (%) 10.3% 6.4% 8.3% Non-operating income (loss) -152.6 -71.3 -69.1 -3.0% -54.7% Income before income taxes 363.8 300.5 469.7 56.3% 29.1% Net income 255.7 238.0 372.3 56.4% 45.6% Margin (%) 5.1% 4.1% 5.7% EBITDA 1,267.3 1,145.0 1,412.8 23.4% 11.5% Margin (%) 25.4% 19.8% 21.7%
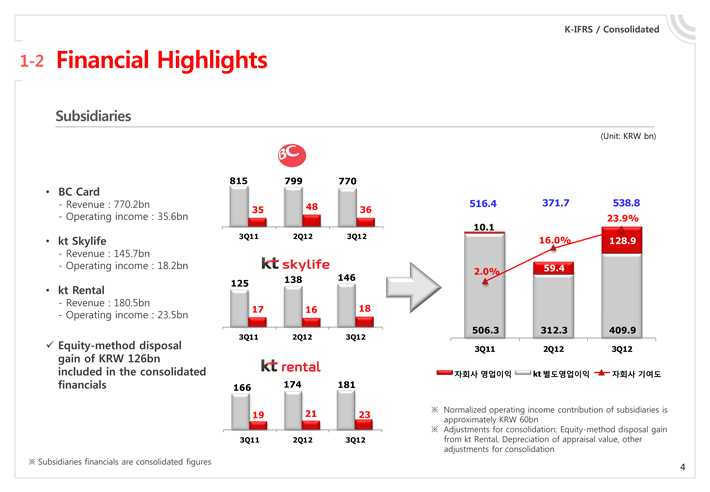
K-IFRS / Consolidated 1-2 Financial Highlights Subsidiaries (Unit: KRW bn) Normalized operating income contribution of subsidiaries is approximately KRW 60bn Adjustments for consolidation: Equity-method disposal gain from kt Rental, Depreciation of appraisal value, other adjustments for consolidation ? Subsidiaries financials are consolidated figures BC Card Revenue: 770.2bn Operating income : 35.6bn Kt Skylife Revenue: 145.7bn Operating income : 18.2bn Kt Rental Revenue: 180.5bn Operating income : 23.5bn Equity – method disposal Gain of KRW 126bn Included in the consolidated financials
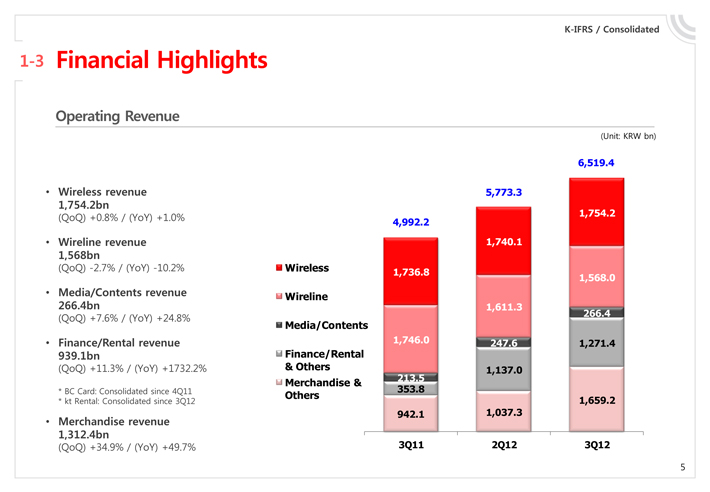
1-3 Financial Highlights K-IFRS / Consolidated Operating Revenue 6,519.4 5,773.3 1,754.2 4,992.2 1,740.1 1,736.8 1,568.0 1,611.3 266.4 1,746.0 247.6 1,271.4 1,137.0 213.5 353.8 1,659.2 942.1 1,037.3 3Q11 2Q12 3Q12 (Unit: KRW bn) Wireless Wireline Media/Contents Finance/Rental & Others Merchandise & Others Wireless revenue 1,754.2bn (QoQ) + 0.8% / (YoY) + 1.0% Wireline revenue (QoQ) – 2.7% / (YoY) + 10.2% Media/Contents revenue 266.4bn (QoQ) + 7.6% / (YoY) + 24.8% Finance/Rental revenue9.9.1bn (QoQ) + 11.3% / (YoY) + 1732.2% BC Card: Consolidated since 4Q11 Kt Rental: Consolidated since 3Q12 Merchandise revenue 1,312.4bn (QoQ) + 34.9% / (YoY) + 49.7%
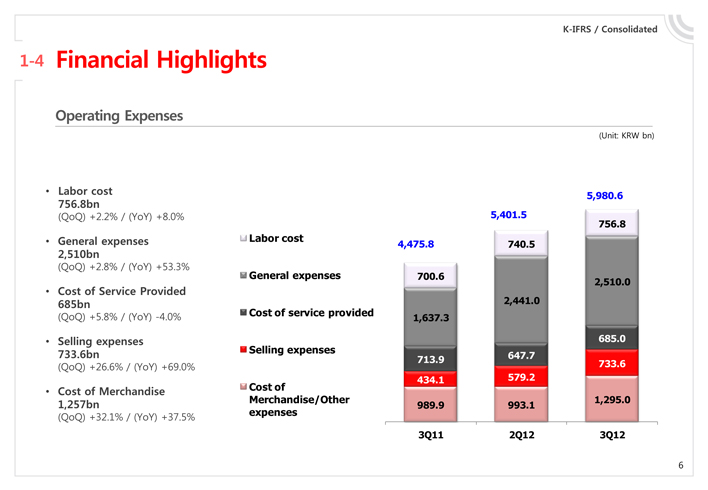
1.4 Financial Hightlights K-IFRS / Consolidated (Unit: KRW bn) Labor cost 756.8bn (QoQ) +2.2% / (YoY) +8.0% General expenses 2,510bn (QoQ) +2.8% / (YoY) +53.3% Cost of Service Provided 685bn (QoQ) +5.8% / (YoY) -4.0% Selling expenses 733.6bn (QoQ) +26.6% / (YoY) +69.0% Cost of Merchandise 1,257bn (QoQ) +32.1% / (YoY) +37.5% Operating Expenses Labor cost General expenses Cost of service provided Selling expenses Cost of Merchandise/Other expenses 5,980.6 5,401.5 756.8 4,475.8 740.5 700.6 2,510.0 2,441.0 1,637.3 685.0 713.9 647.7 733.6 434.1 579.2 1,295.0 989.9 993.1 3Q11 2Q12 3Q12
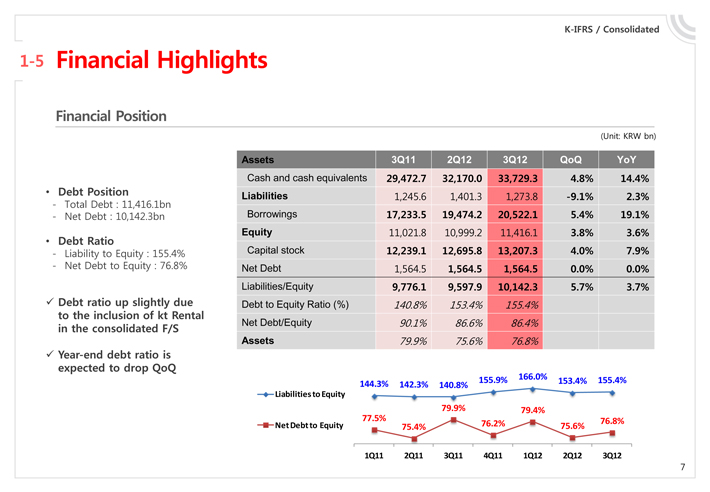
K-IFRS / Consolidated 1-5 Financial Highlights Financial Position (Unit: KRW bn) Debt Position —Total Debt : 11,416.1bn —Net Debt : 10,142.3bn Debt Ratio —Liability to Equity : 155.4% —Net Debt to Equity : 76.8% Debt ratio up slightly due to the inclusion of kt Rental in the consolidated F/S Year-end debt ratio is expected to drop QoQ Assets 3Q11 2Q12 3Q12 QoQ YoY Cash and cash equivalents 29,472.7 32,170.0 33,729.3 4.8% 14.4% Liabilities 1,245.6 1,401.3 1,273.8 -9.1% 2.3% Borrowings 17,233.5 19,474.2 20,522.1 5.4% 19.1% Equity 11,021.8 10,999.2 11,416.1 3.8% 3.6% Capital stock 12,239.1 12,695.8 13,207.3 4.0% 7.9% Net Debt 1,564.5 1,564.5 1,564.5 0.0% 0.0% Liabilities/Equity 9,776.1 9,597.9 10,142.3 5.7% 3.7% Debt to Equity Ratio (%) 140.8% 153.4% 155.4% Net Debt/Equity 90.1% 86.6% 86.4% Assets 79.9% 75.6% 76.8% 155.9% 166.0% 155.4% 144.3% 153.4% 142.3% 140.8% Liabilities to Equity 79.9% 79.4% 77.5% 76.8% Net Debt to Equity 75.4% 76.2% 75.6% 1Q11 2Q11 3Q11 4Q11 1Q12 2Q12 3Q12
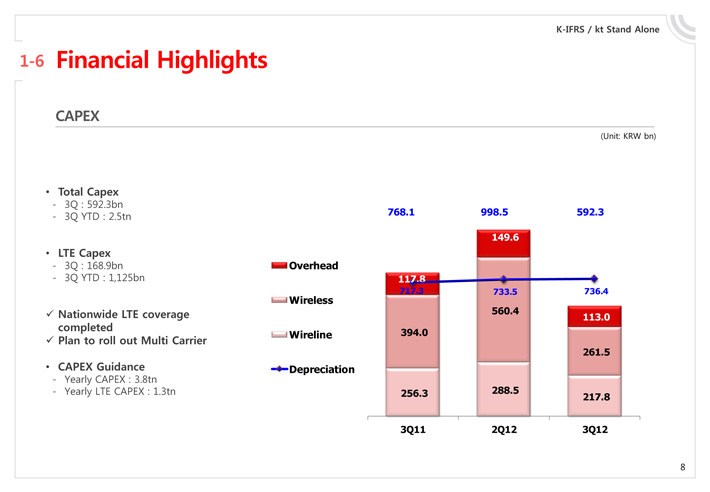
768.1 998.5 592.3 3Q11 2Q12 3Q12 CAPEX 1-6 Financial Highlights (Unit: KRW bn) K-IFRS / kt Stand Alone Overhead Wireless Wireline Depreciation Total Capex 3Q:592.3bn 3Q YTD: 2.5tn LTE Capex 3q:168.9bn 3Q YTD: 1,125bn Nationwide LTE coverage completed Plan to roll out Multi Carrier CAPEX Guidance Yearly CAPEX: 3.8tn Yearly LTE CAPEX : 13.tn
1 | Financial Highlights 2 Business Overview 3 Q&A 4 Appendix |
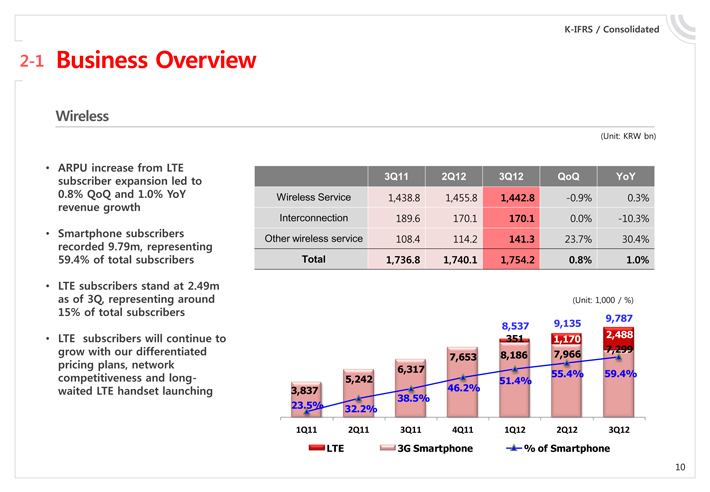
K-IFRS / Consolidated 2-1 Business Overview Wireless (Unit: KRW bn) 3Q11 2Q12 3Q12 QoQ YoY Wireless Service 1,438.8 1,455.8 1,442.8 -0.9% 0.3% Interconnection 189.6 170.1 170.1 0.0% -10.3% Other wireless service 108.4 114.2 141.3 23.7% 30.4% Total 1,736.8 1,740.1 1,754.2 0.8% 1.0% ARPU increase from LTE subscriber expansion led to 0.8% QoQ and 1.0% YoY revenue growth Smartphone subscribers recorded 9.79m, representing 59.4% of total subscribers LTE subscribers stand at 2.49m as of 3Q, representing around 15% of total subscribers LTE subscribers will continue to grow with our differentiated pricing plans, network competitiveness and long-waited LTE handset launching (Unit: 1,000 / %) 9,787 8,537 9,135 351 1,170 2,488 7,299 7,653 8,186 7,966 5,242 6,317 55.4% 59.4% 51.4% 3,837 46.2% 38.5% 23.5% 32.2% 1Q11 2Q11 3Q11 4Q11 1Q12 2Q12 3Q12 LTE 3G Smartphone % of Smartphone
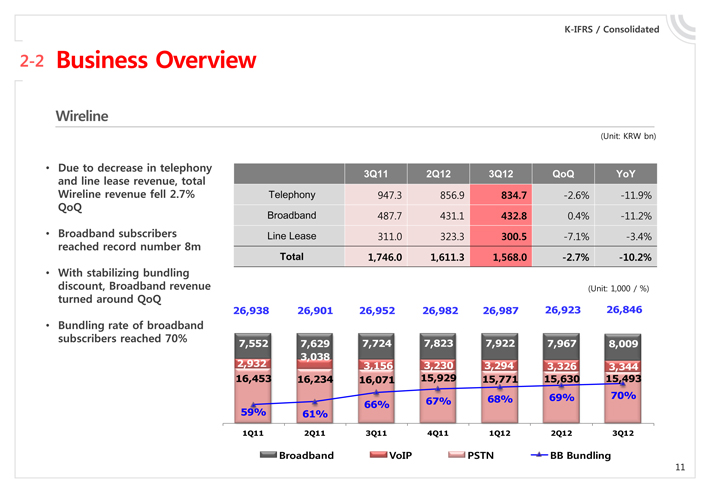
K-IFRS / Consolidated 2-2 Business Overview Wireline (Unit: KRW bn) 3Q11 2Q12 3Q12 QoQ YoY Telephony 947.3 856.9 834.7 -2.6% -11.9% Broadband 487.7 431.1 432.8 0.4% -11.2% Line Lease 311.0 323.3 300.5 -7.1% -3.4% Total 1,746.0 1,611.3 1,568.0 -2.7% -10.2% Due to decrease in telephony and line lease revenue, total Wireline revenue fell 2.7% QoQ Broadband subscribers reached record number 8m With stabilizing bundling discount, Broadband revenue turned around QoQ Bundling rate of broadband subscribers reached 70% 26,938 26,901 26,952 26,982 26,987 26,923 26,846 7,552 7,629 7,724 7,823 7,922 7,967 8,009 3,038 2,932 3,156 3,230 3,294 3,326 3,344 16,453 16,234 16,071 15,929 15,771 15,630 15,493 68% 69% 70% 66% 67% 59% 61% 1Q11 2Q11 3Q11 4Q11 1Q12 2Q12 3Q12 Broadband VoIP PSTN BB Bundling (Unit: 1,000 / %)
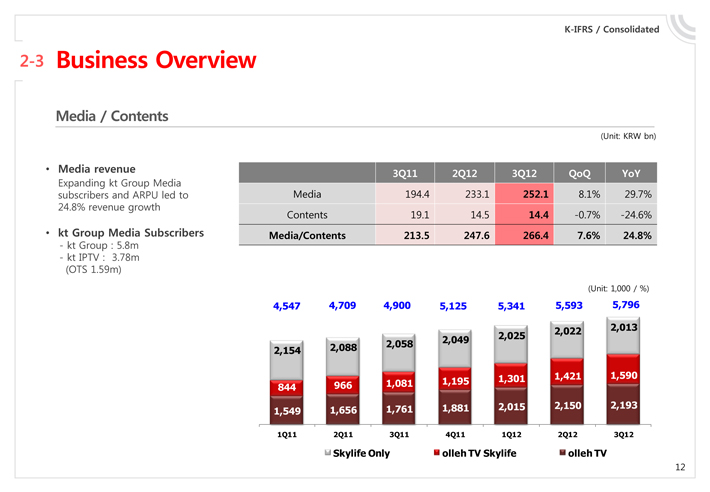
K-IFRS / Consolidated 2-3 Business Overview Media / Contents (Unit: KRW bn) 3Q11 2Q12 3Q12 QoQ YoY Media 194.4 233.1 252.1 8.1% 29.7% Contents 19.1 14.5 14.4 -0.7% -24.6% Media/Contents 213.5 247.6 266.4 7.6% 24.8% Media revenue Expanding kt Group Media subscribers and ARPU led to 24.8% revenue growth kt Group Media Subscribers —kt Group : 5.8m—kt IPTV : 3.78m (OTS 1.59m) (Unit: 1,000 / %) 4,547 4,709 4,900 5,125 5,341 5,593 5,796 2,022 2,013 2,049 2,025 2,088 2,058 2,154 1,301 1,421 1,590 966 1,081 1,195 844 1,761 1,881 2,015 2,150 2,193 1,549 1,656 1Q11 2Q11 3Q11 4Q11 1Q12 2Q12 3Q12 Skylife Only olleh TV Skylife olleh TV
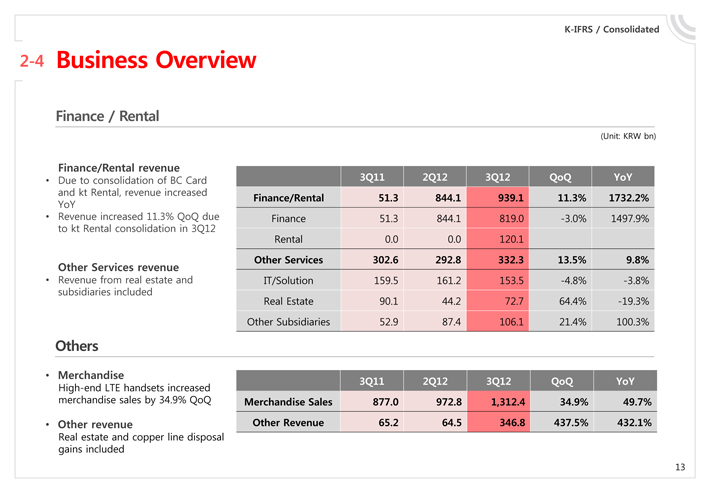
K-IFRS / Consolidated 2-4 Business Overview Finance / Rental (Unit: KRW bn) Finance/Rental revenue Due to consolidation of BC Card and kt Rental, revenue increased YoY Revenue increased 11.3% QoQ due to kt Rental consolidation in 3Q12 Other Services revenue Revenue from real estate and subsidiaries included Others Merchandise High-end LTE handsets increased merchandise sales by 34.9% QoQ Other revenue Real estate and copper line disposal gains included 3Q11 2Q12 3Q12 QoQ YoY Finance/Rental 51.3 844.1 939.1 11.3% 1732.2% Finance 51.3 844.1 819.0 -3.0% 1497.9% Rental 0.0 0.0 120.1 Other Services 302.6 292.8 332.3 13.5% 9.8% IT/Solution 159.5 161.2 153.5 -4.8% -3.8% Real Estate 90.1 44.2 72.7 64.4% -19.3% Other Subsidiaries 52.9 87.4 106.1 21.4% 100.3% 3Q11 2Q12 3Q12 QoQ YoY Merchandise Sales 877.0 972.8 1,312.4 34.9% 49.7% Other Revenue 65.2 64.5 346.8 437.5% 432.1%
1 | Financial Highlights 2 Business Overview 3 Q&A 4 Appendix |
1 | Financial Highlights 2 Business Overview 3 Q&A 4 Appendix |
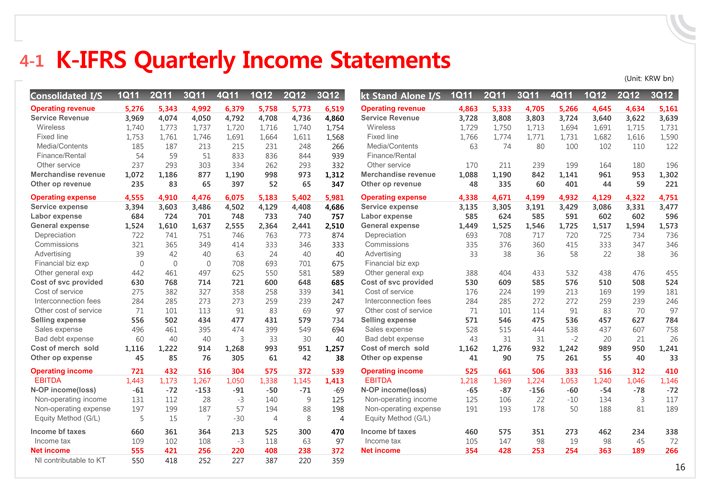
4-1 K-IFRS Quarterly Income Statements Consolidated I/S 1Q11 2Q11 3Q11 4Q11 1Q12 2Q12 3Q12 kt Stand Alone I/S 1Q11 2Q11 3Q11 4Q11 1Q12 2Q12 3Q12 Operating revenue 5,276 5,343 4,992 6,379 5,758 5,773 6,519 Operating revenue 4,863 5,333 4,705 5,266 4,645 4,634 5,161 Service Revenue 3,969 4,074 4,050 4,792 4,708 4,736 4,860 Service Revenue 3,728 3,808 3,803 3,724 3,640 3,622 3,639 Wireless 1,740 1,773 1,737 1,720 1,716 1,740 1,754 Wireless 1,729 1,750 1,713 1,694 1,691 1,715 1,731 Fixed line 1,753 1,761 1,746 1,691 1,664 1,611 1,568 Fixed line 1,766 1,774 1,771 1,731 1,682 1,616 1,590 Media/Contents 185 187 213 215 231 248 266 Media/Contents 63 74 80 100 102 110 122 Finance/Rental 54 59 51 833 836 844 939 Finance/Rental Other service 237 293 303 334 262 293 332 Other service 170 211 239 199 164 180 196 Merchandise revenue 1,072 1,186 877 1,190 998 973 1,312 Merchandise revenue 1,088 1,190 842 1,141 961 953 1,302 Other op revenue 235 83 65 397 52 65 347 Other op revenue 48 335 60 401 44 59 221 Operating expense 4,555 4,910 4,476 6,075 5,183 5,402 5,981 Operating expense 4,338 4,671 4,199 4,932 4,129 4,322 4,751 Service expense 3,394 3,603 3,486 4,502 4,129 4,408 4,686 Service expense 3,135 3,305 3,191 3,429 3,086 3,331 3,477 Labor expense 684 724 701 748 733 740 757 Labor expense 585 624 585 591 602 602 596 General expense 1,524 1,610 1,637 2,555 2,364 2,441 2,510 General expense 1,449 1,525 1,546 1,725 1,517 1,594 1,573 Depreciation 722 741 751 746 763 773 874 Depreciation 693 708 717 720 725 734 736 Commissions 321 365 349 414 333 346 333 Commissions 335 376 360 415 333 347 346 Advertising 39 42 40 63 24 40 40 Advertising 33 38 36 58 22 38 36 Financial biz exp 0 0 0 708 693 701 675 Financial biz exp Other general exp 442 461 497 625 550 581 589 Other general exp 388 404 433 532 438 476 455 Cost of svc provided 630 768 714 721 600 648 685 Cost of svc provided 530 609 585 576 510 508 524 Cost of service 275 382 327 358 258 339 341 Cost of service 176 224 199 213 169 199 181 Interconnection fees 284 285 273 273 259 239 247 Interconnection fees 284 285 272 272 259 239 246 Other cost of service 71 101 113 91 83 69 97 Other cost of service 71 101 114 91 83 70 97 Selling expense 556 502 434 477 431 579 734 Selling expense 571 546 475 536 457 627 784 Sales expense 496 461 395 474 399 549 694 Sales expense 528 515 444 538 437 607 758 Bad debt expense 60 40 40 3 33 30 40 Bad debt expense 43 31 31 -2 20 21 26 Cost of merch sold 1,116 1,222 914 1,268 993 951 1,257 Cost of merch sold 1,162 1,276 932 1,242 989 950 1,241 Other op expense 45 85 76 305 61 42 38 Other op expense 41 90 75 261 55 40 33 Operating income 721 432 516 304 575 372 539 Operating income 525 661 506 333 516 312 410 EBITDA 1,443 1,173 1,267 1,050 1,338 1,145 1,413 EBITDA 1,218 1,369 1,224 1,053 1,240 1,046 1,146 N-OP income(loss) -61 -72 -153 -91 -50 -71 -69 N-OP income(loss) -65 -87 -156 -60 -54 -78 -72 Non-operating income 131 112 28 -3 140 9 125 Non-operating income 125 106 22 -10 134 3 117 Non-operating expense 197 199 187 57 194 88 198 Non-operating expense 191 193 178 50 188 81 189 Equity Method (G/L) 5 15 7 -30 4 8 4 Equity Method (G/L) Income bf taxes 660 361 364 213 525 300 470 Income bf taxes 460 575 351 273 462 234 338 Income tax 109 102 108 -3 118 63 97 Income tax 105 147 98 19 98 45 72 Net income 555 421 256 220 408 238 372 Net income 354 428 253 254 363 189 266 NI contributable to KT 550 418 252 227 387 220 359
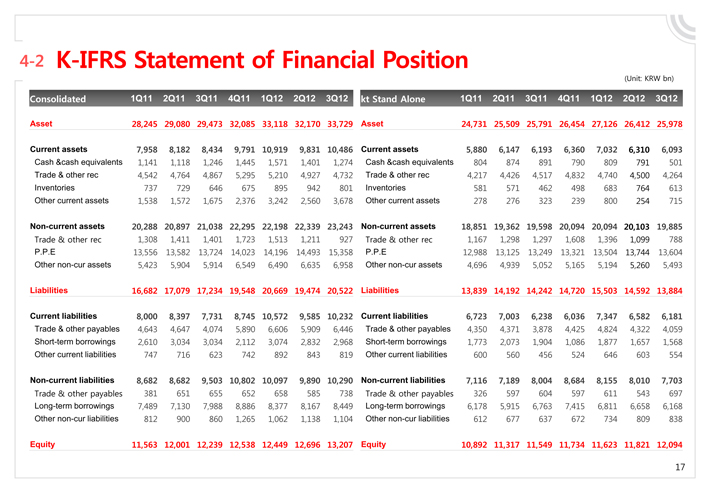
4-2 K-IFRS Statement of Financial Position Consolidated 1Q11 2Q11 3Q11 4Q11 1Q12 2Q12 3Q12 kt Stand Alone 1Q11 2Q11 3Q11 4Q11 1Q12 2Q12 3Q12 Asset 28,245 29,080 29,473 32,085 33,118 32,170 33,729 Asset 24,731 25,509 25,791 26,454 27,126 26,412 25,978 Current assets 7,958 8,182 8,434 9,791 10,919 9,831 10,486 Current assets 5,880 6,147 6,193 6,360 7,032 6,310 6,093 Cash &cash equivalents 1,141 1,118 1,246 1,445 1,571 1,401 1,274 Cash &cash equivalents 804 874 891 790 809 791 501 Trade & other rec 4,542 4,764 4,867 5,295 5,210 4,927 4,732 Trade & other rec 4,217 4,426 4,517 4,832 4,740 4,500 4,264 Inventories 737 729 646 675 895 942 801 Inventories 581 571 462 498 683 764 613 Other current assets 1,538 1,572 1,675 2,376 3,242 2,560 3,678 Other current assets 278 276 323 239 800 254 715 Non-current assets 20,288 20,897 21,038 22,295 22,198 22,339 23,243 Non-current assets 18,851 19,362 19,598 20,094 20,094 20,103 19,885 Trade & other rec 1,308 1,411 1,401 1,723 1,513 1,211 927 Trade & other rec 1,167 1,298 1,297 1,608 1,396 1,099 788 P.P.E 13,556 13,582 13,724 14,023 14,196 14,493 15,358 P.P.E 12,988 13,125 13,249 13,321 13,504 13,744 13,604 Other non-cur assets 5,423 5,904 5,914 6,549 6,490 6,635 6,958 Other non-cur assets 4,696 4,939 5,052 5,165 5,194 5,260 5,493 Liabilities 16,682 17,079 17,234 19,548 20,669 19,474 20,522 Liabilities 13,839 14,192 14,242 14,720 15,503 14,592 13,884 Current liabilities 8,000 8,397 7,731 8,745 10,572 9,585 10,232 Current liabilities 6,723 7,003 6,238 6,036 7,347 6,582 6,181 Trade & other payables 4,643 4,647 4,074 5,890 6,606 5,909 6,446 Trade & other payables 4,350 4,371 3,878 4,425 4,824 4,322 4,059 Short-term borrowings 2,610 3,034 3,034 2,112 3,074 2,832 2,968 Short-term borrowings 1,773 2,073 1,904 1,086 1,877 1,657 1,568 Other current liabilities 747 716 623 742 892 843 819 Other current liabilities 600 560 456 524 646 603 554 Non-current liabilities 8,682 8,682 9,503 10,802 10,097 9,890 10,290 Non-current liabilities 7,116 7,189 8,004 8,684 8,155 8,010 7,703 Trade & other payables 381 651 655 652 658 585 738 Trade & other payables 326 597 604 597 611 543 697 Long-term borrowings 7,489 7,130 7,988 8,886 8,377 8,167 8,449 Long-term borrowings 6,178 5,915 6,763 7,415 6,811 6,658 6,168 Other non-cur liabilities 812 900 860 1,265 1,062 1,138 1,104 Other non-cur liabilities 612 677 637 672 734 809 838 Equity 11,563 12,001 12,239 12,538 12,449 12,696 13,207 Equity 10,892 11,317 11,549 11,734 11,623 11,821 12,094 (Unit: KRW bn)
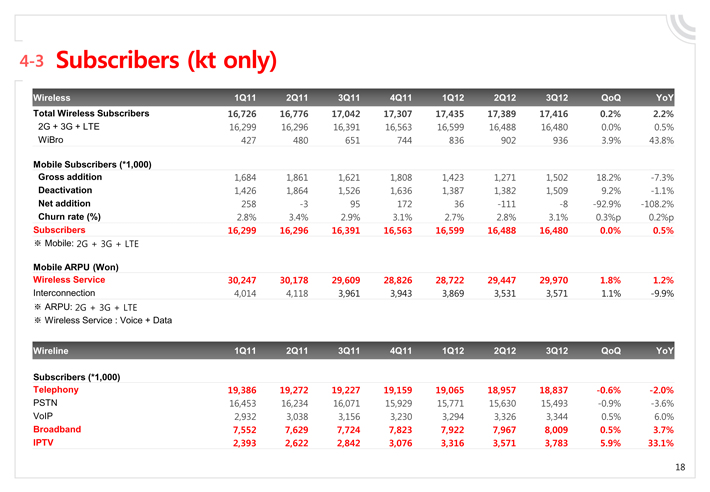
4-3 Subscribers (kt only) Wireless 1Q11 2Q11 3Q11 4Q11 1Q12 2Q12 3Q12 QoQ YoY Total Wireless Subscribers 16,726 16,776 17,042 17,307 17,435 17,389 17,416 0.2% 2.2% 2G + 3G + LTE 16,299 16,296 16,391 16,563 16,599 16,488 16,480 0.0% 0.5% WiBro 427 480 651 744 836 902 936 3.9% 43.8% Mobile Subscribers (*1,000) Gross addition 1,684 1,861 1,621 1,808 1,423 1,271 1,502 18.2% -7.3% Deactivation 1,426 1,864 1,526 1,636 1,387 1,382 1,509 9.2% -1.1% Net addition 258 -3 95 172 36 -111 -8 -92.9% -108.2% Churn rate (%) 2.8% 3.4% 2.9% 3.1% 2.7% 2.8% 3.1% 0.3%p 0.2%p Subscribers 16,299 16,296 16,391 16,563 16,599 16,488 16,480 0.0% 0.5% ? Mobile: 2G + 3G + LTE Mobile ARPU (Won) Wireless Service 30,247 30,178 29,609 28,826 28,722 29,447 29,970 1.8% 1.2% Interconnection 4,014 4,118 3,961 3,943 3,869 3,531 3,571 1.1% -9.9% ? ARPU: 2G + 3G + LTE ? Wireless Service : Voice + Data Wireline 1Q11 2Q11 3Q11 4Q11 1Q12 2Q12 3Q12 QoQ YoY Subscribers (*1,000) Telephony 19,386 19,272 19,227 19,159 19,065 18,957 18,837 -0.6% -2.0% PSTN 16,453 16,234 16,071 15,929 15,771 15,630 15,493 -0.9% -3.6% VoIP 2,932 3,038 3,156 3,230 3,294 3,326 3,344 0.5% 6.0% Broadband 7,552 7,629 7,724 7,823 7,922 7,967 8,009 0.5% 3.7% IPTV 2,393 2,622 2,842 3,076 3,316 3,571 3,783 5.9% 33.1%
Thank you kt