SECURITIES AND EXCHANGE COMMISSION
Washington, D.C. 20549
Form 6-K
REPORT OF FOREIGN PRIVATE ISSUER
PURSUANT TO RULE 13a-16 OR 15d-16 OF
THE SECURITIES EXCHANGE ACT OF 1934
For the month of February 2013
Commission File Number 1-14926
KT Corporation
(Translation of registrant’s name into English)
1692-1 Seocho-dong
Seocho-gu, Seoul
137-882
Korea
(Address of principal executive offices)
Indicate by check mark whether the registrant files or will file annual reports under cover of Form 20-F or Form 40-F:
Form 20-F x Form 40-F ¨
Indicate by check mark if the registrant is submitting the Form 6-K in paper as permitted by Regulation S-T Rule 101(b)(1): ¨
Indicate by check mark if the registrant is submitting the Form 6-K in paper as permitted by Regulation S-T Rule 101(b)(7): ¨
Indicate by check mark whether by furnishing the information contained in this Form, the registrant is also thereby furnishing the information to the Commission pursuant to Rule 12g3-2(b) under the Securities Exchange Act of 1934.
Yes ¨ No x
If “Yes” is marked, indicate below the file number assigned to the registrant in connection with Rule 12g3-2(b): 82-
SIGNATURES
Pursuant to the requirements of the Securities Exchange Act of 1934, the registrant has duly caused this report to be signed on its behalf by the undersigned, thereunto duly authorized.
| Dated: February 1, 2013 | ||
| KT Corporation | ||
| By: | /s/ Youngwoo Kim | |
| Name: | Youngwoo Kim | |
| Title: | Vice President | |
| By: | /s/ Tony Yongrae Jung | |
| Name: | Tony Yongrae Jung | |
| Title: | Team Leader | |
2012
Earnings Release
Investor Relations 2013. 2. 1
KT, global ICT convergence leader
Investor Relations 2013. 2.1
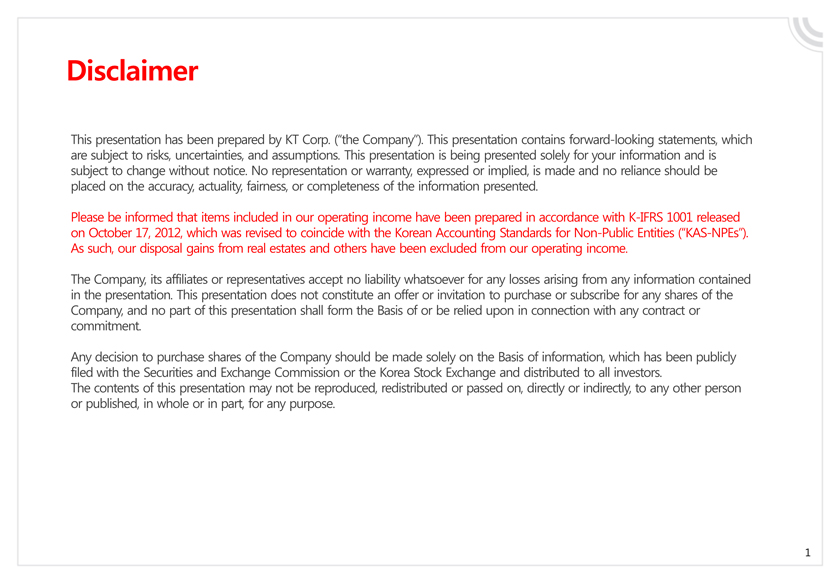
Disclaimer
1 |
This presentation has been prepared by KT Corp. (“the Company”). This presentation contains forward-looking statements, which are subject to risks, uncertainties, and assumptions. This presentation is being presented solely for your information and is subject to change without notice. No representation or warranty, expressed or implied, is made and no reliance should be placed on the accuracy, actuality, fairness, or completeness of the information presented.
Please be informed that items included in our operating income have been prepared in accordance with K-IFRS 1001 released on October 17, 2012, which was revised to coincide with the Korean Accounting Standards for Non-Public Entities (“KAS-NPEs”). As such, our disposal gains from real estates and others have been excluded from our operating income.
The Company, its affiliates or representatives accept no liability whatsoever for any losses arising from any information contained in the presentation. This presentation does not constitute an offer or invitation to purchase or subscribe for any shares of the Company, and no part of this presentation shall form the Basis of or be relied upon in connection with any contract or commitment.
Any decision to purchase shares of the Company should be made solely on the Basis of information, which has been publicly filed with the Securities and Exchange Commission or the Korea Stock Exchange and distributed to all investors.
The contents of this presentation may not be reproduced, redistributed or passed on, directly or indirectly, to any other person or published, in whole or in part, for any purpose.
2
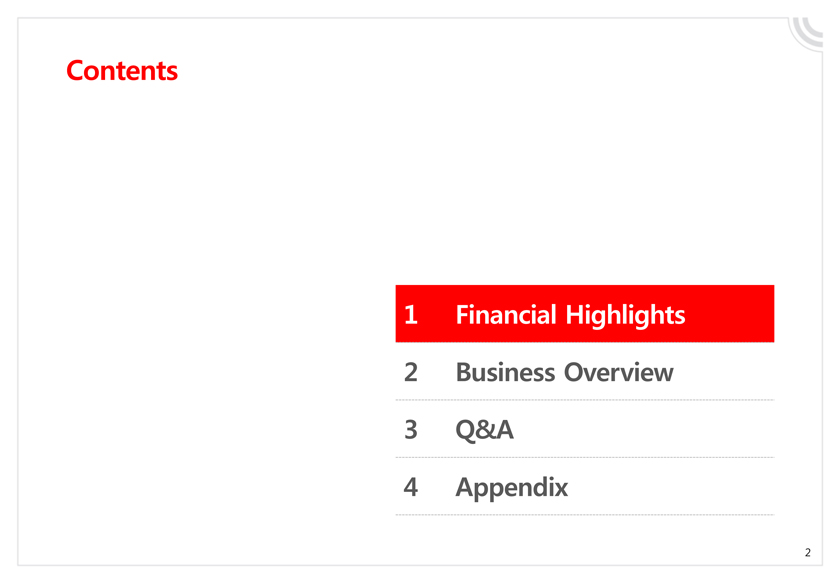
Contents
1 Financial Highlights
2 Business Overview
3 Q&A
4 Appendix
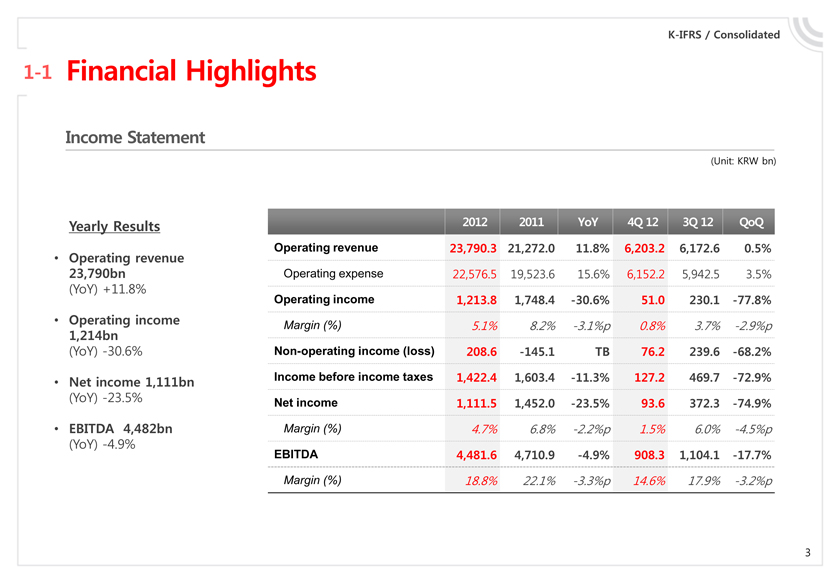
Yearly Results
Operating revenue 23,790bn
(YoY) +11.8%
Operating income 1,214bn
(YoY)—30.6%
Net income 1,111bn
(YoY)—23.5%
EBITDA 4,482bn
(YoY)—4.9%
K-IFRS / Consolidated
1-1 Financial Highlights
Income Statement
(Unit: KRW bn)
2012 2011 YoY 4Q 12 3Q 12 QoQ Operating revenue 23,790.3 21,272.0 11.8% 6,203.2 6,172.6 0.5%
Operating expense 22,576.5 19,523.6 15.6% 6,152.2 5,942.5 3.5%
Operating income 1,213.8 1,748.4—30.6% 51.0 230.1—77.8%
Margin (%) 5.1% 8.2%—3.1%p 0.8% 3.7%—2.9%p
Non-operating income (loss) 208.6—145.1 TB 76.2 239.6—68.2% Income before income taxes 1,422.4 1,603.4—11.3% 127.2 469.7—72.9% Net income 1,111.5 1,452.0—23.5% 93.6 372.3—74.9%
Margin (%) 4.7% 6.8%—2.2%p 1.5% 6.0%—4.5%p
EBITDA 4,481.6 4,710.9—4.9% 908.3 1,104.1—17.7%
Margin (%) 18.8% 22.1%—3.3%p 14.6% 17.9%—3.2%p
3
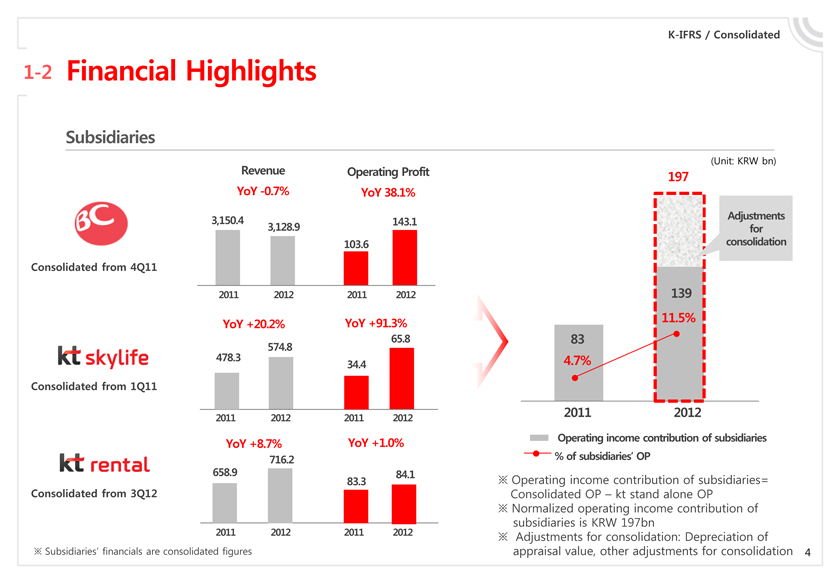
Operating income contribution of subsidiaries= Consolidated OP – kt stand alone OP
Normalized operating income contribution of subsidiaries is KRW 197bn
Adjustments for consolidation: Depreciation of
K-IFRS / Consolidated
1-2 Financial Highlights
Subsidiaries
Revenue Operating Profit YoY—0.7% YoY 38.1%
3,150.4 143.1 3,128.9 103.6 Consolidated from 4Q11
2011 2012 2011 2012
YoY +20.2% YoY +91.3%
65.8 574.8 478.3
34.4 Consolidated from 1Q11
2011 2012 2011 2012
YoY +8.7% YoY +1.0%
716.2
658.9 84.1 Consolidated from 3Q12 83.3
2011 2012 2011 2012
? Subsidiaries’ financials are consolidated figures
(Unit: KRW bn)
KT skylife
BC
83
83
4.7%
2011
197
139
11.5%
2012
Adjustments
for
consolidation
Operating income contribution of subsidiaries
% of subsidiaries’ OP
appraisal value, other adjustments for consolidation 4
(Unit: KRW bn)
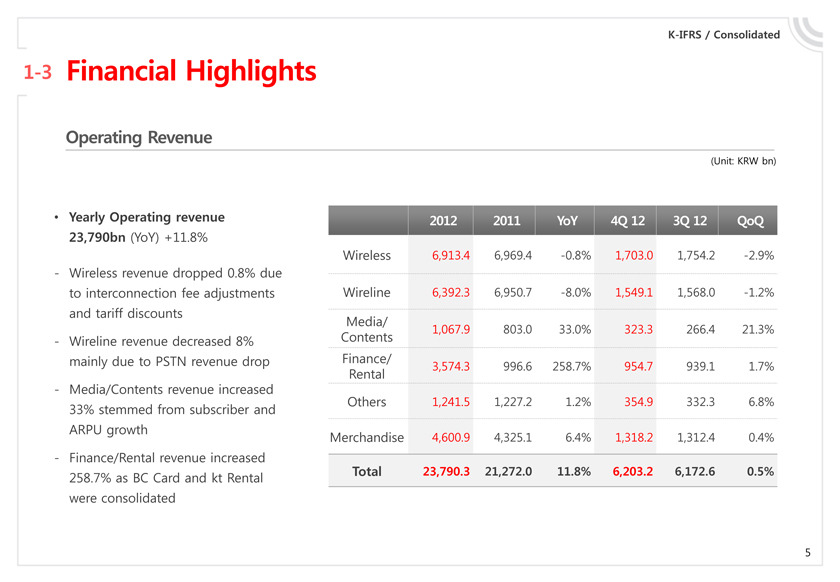
2012 2011 YoY 4Q 12 3Q 12 QoQ
Wireless 6,913.4 6,969.4—0.8% 1,703.0 1,754.2—2.9%
Wireline 6,392.3 6,950.7—8.0% 1,549.1 1,568.0—1.2%
Media/
1,067.9 803.0 33.0% 323.3 266.4 21.3%
Contents Finance/
3,574.3 996.6 258.7% 954.7 939.1 1.7%
Rental
Others 1,241.5 1,227.2 1.2% 354.9 332.3 6.8%
Merchandise 4,600.9 4,325.1 6.4% 1,318.2 1,312.4 0.4%
Total 23,790.3 21,272.0 11.8% 6,203.2 6,172.6 0.5%
K-IFRS / Consolidated
1-3 Financial Highlights
Operating Revenue
Yearly Operating revenue 23,790bn (YoY) +11.8%
Wireless revenue dropped 0.8% due to interconnection fee adjustments and tariff discounts
Wireline revenue decreased 8% mainly due to PSTN revenue drop
Media/Contents revenue increased 33% stemmed from subscriber and ARPU growth
Finance/Rental revenue increased 258.7% as BC Card and kt Rental were consolidated
5
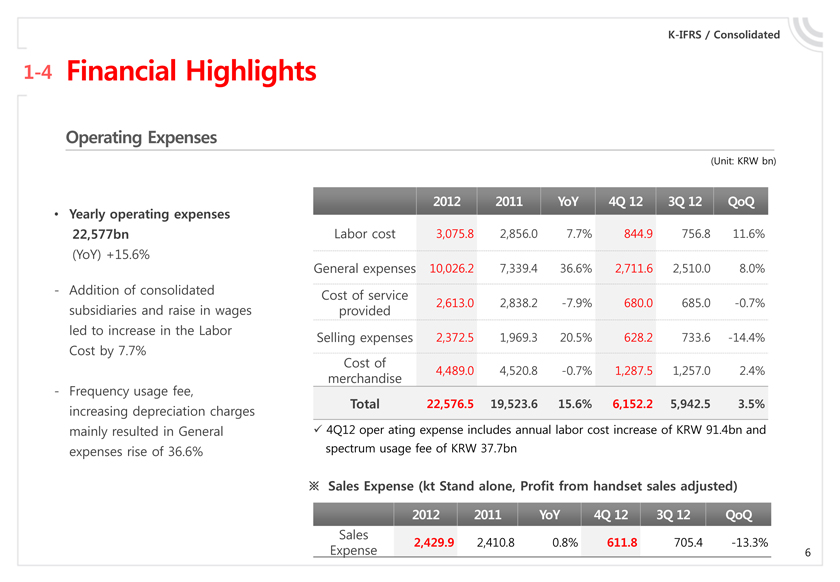
Yearly operating expenses 22,577bn (YoY) +15.6%
K-IFRS / Consolidated
1-4 Financial Highlights
Operating Expenses
Addition of consolidated subsidiaries and raise in wages led to increase in the Labor Cost by 7.7%
Frequency usage fee, increasing depreciation charges mainly resulted in General expenses rise of 36.6%
(Unit: KRW bn)
2012 2011 YoY 4Q 12 3Q 12 QoQ
Labor cost 3,075.8 2,856.0 7.7% 844.9 756.8 11.6%
General expenses 10,026.2 7,339.4 36.6% 2,711.6 2,510.0 8.0%
Cost of service
2,613.0 2,838.2—7.9% 680.0 685.0—0.7% provided
Selling expenses 2,372.5 1,969.3 20.5% 628.2 733.6—14.4%
Cost of
4,489.0 4,520.8—0.7% 1,287.5 1,257.0 2.4% merchandise
Total 22,576.5 19,523.6 15.6% 6,152.2 5,942.5 3.5%
ü 4Q12 oper ating expense includes annual labor cost increase of KRW 91.4bn and spectrum usage fee of KRW 37.7bn
Sales Expense (kt Stand alone, Profit from handset sales adjusted) 2012 2011 YoY 4Q 12 3Q 12 QoQ
Sales
2,429.9 2,410.8 0.8% 611.8 705.4—13.3%
Expense 6
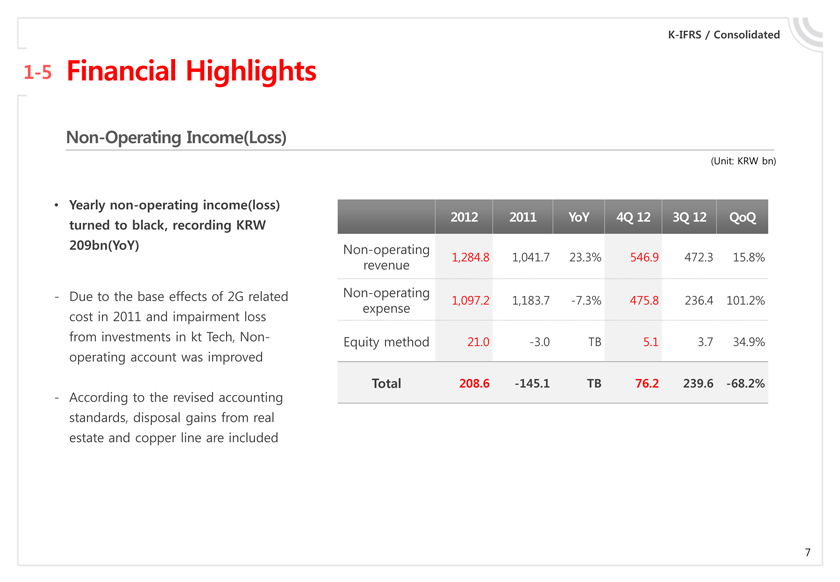
—Due to the base effects of 2G related cost in 2011 and impairment loss from investments in kt Tech, Non-operating account was improved
—According to the revised accounting standards, disposal gains from real estate and copper line are included
K-IFRS / Consolidated
1-5 Financial Highlights
Non-Operating Income(Loss)
• Yearly non-operating income(loss) turned to black, recording KRW 209bn(YoY)
(Unit: KRW bn)
2012 2011 YoY 4Q 12 3Q 12 QoQ
Non-operating
1,284.8 1,041.7 23.3% 546.9 472.3 15.8% revenue Non-operating
1,097.2 1,183.7—7.3% 475.8 236.4 101.2% expense
Equity method 21.0—3.0 TB 5.1 3.7 34.9%
Total 208.6—145.1 TB 76.2 239.6—68.2%
7
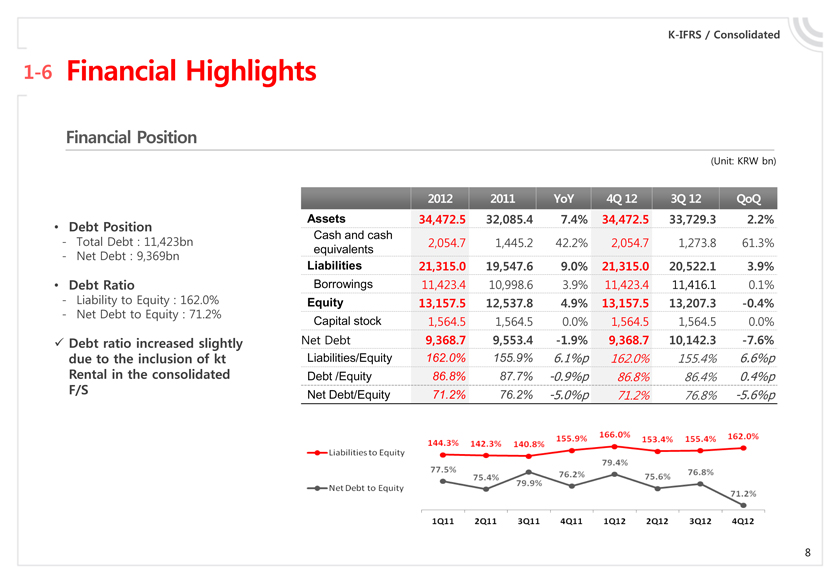
• Debt Position
—Total Debt : 11,423bn
—Net Debt : 9,369bn
• Debt Ratio
—Liability to Equity : 162.0%
—Net Debt to Equity : 71.2%
K-IFRS / Consolidated
1-6 Financial Highlights
Financial Position
ü?Debt ratio increased slightly
due to the inclusion of kt
Rental in the consolidated
F/S
(Unit: KRW bn)
2012 2011 YoY 4Q 12 3Q 12 QoQ Assets 34,472.5 32,085.4 7.4% 34,472.5 33,729.3 2.2%
Cash and cash
2,054.7 1,445.2 42.2% 2,054.7 1,273.8 61.3% equivalents
Liabilities 21,315.0 19,547.6 9.0% 21,315.0 20,522.1 3.9%
Borrowings 11,423.4 10,998.6 3.9% 11,423.4 11,416.1 0.1%
Equity 13,157.5 12,537.8 4.9% 13,157.5 13,207.3—0.4%
Capital stock 1,564.5 1,564.5 0.0% 1,564.5 1,564.5 0.0% Net Debt 9,368.7 9,553.4—1.9% 9,368.7 10,142.3—7.6%
Liabilities/Equity 162.0% 155.9% 6.1%p 162.0% 155.4% 6.6%p Debt /Equity 86.8% 87.7%—0.9%p 86.8% 86.4% 0.4%p Net Debt/Equity 71.2% 76.2%—5.0%p 71.2% 76.8%—5.6%p
8

üNationwide LTE coverage
completed
ü?Plan to roll out Multi Carrier
K-IFRS / kt Stand Alone
1-7 Financial Highlights
CAPEX
• Total Capex
—4Q12 : 1,222bn
—FY2012: 3,711bn (YoY +11.8%)
—Executed 98% of yearly
guidance of 3.8tn
overhead
wireless
wireline
1,222.4 149.4 622.4 450.6 4q12 3,710.6 499.2 2,105.2 1,106.2 2012
3,318.5 437.5 1,607.7 1,273.3 2011
• LTE Capex
—4Q12: 486bn
—FY2012: 1,499bn
(Unit: KRW bn)
9
1 | Financial Highlights |
2 | Business Overview |
3 | Q&A |
4 | Appendix |
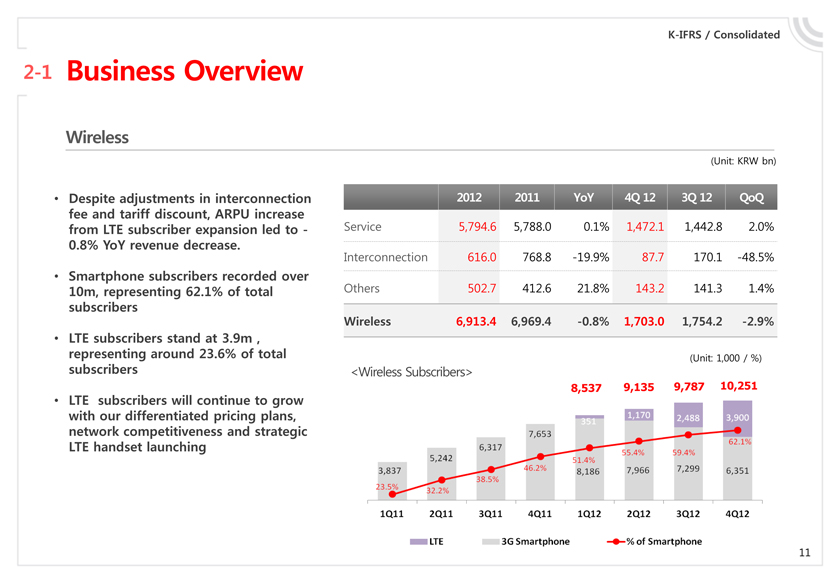
Despite adjustments in interconnection fee and tariff discount, ARPU increase from LTE subscriber expansion led to—
0.8% YoY revenue decrease.
Smartphone subscribers recorded over 10m, representing 62.1% of total subscribers
LTE subscribers stand at 3.9m , representing around 23.6% of total subscribers
LTE subscribers will continue to grow with our differentiated pricing plans, network competitiveness and strategic LTE handset launching
K-IFRS / Consolidated
2-1 Business Overview
Wireless
(Unit: KRW bn)
2012 2011 YoY 4Q 12 3Q 12 QoQ
Service 5,794.6 5,788.0 0.1% 1,472.1 1,442.8 2.0% Interconnection 616.0 768.8—19.9% 87.7 170.1—48.5% Others 502.7 412.6 21.8% 143.2 141.3 1.4%
Wireless 6,913.4 6,969.4—0.8% 1,703.0 1,754.2—2.9%
(Unit: 1,000 / %)
<Wireless Subscribers>
11
8,537 9,135 9,787 10,251
1q11 2q11 3q11 4q11 1q12 2q12 3q12 4q12
LTE 3g Smartphone % of Smartphone
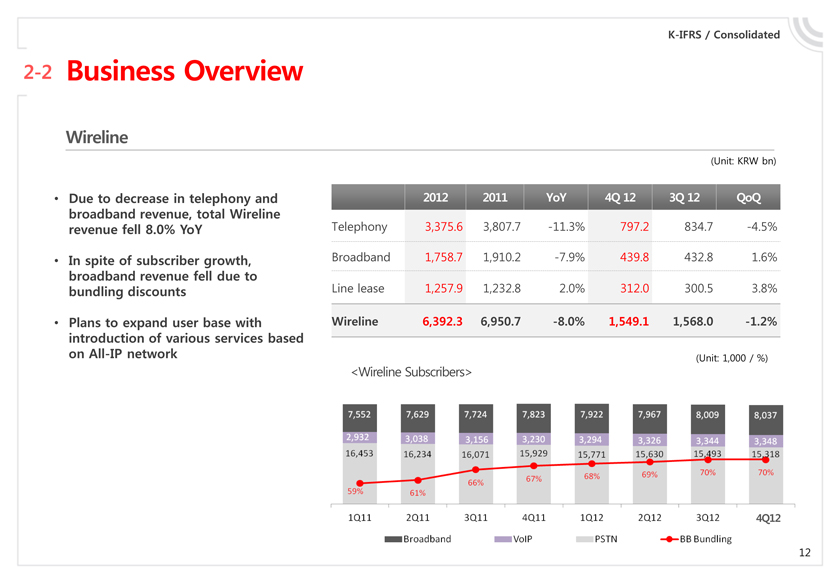
Due to decrease in telephony and broadband revenue, total Wireline revenue fell 8.0% YoY
In spite of subscriber growth, broadband revenue fell due to bundling discounts
Plans to expand user base with introduction of various services based on All-IP network
K-IFRS / Consolidated
2-2 Business Overview
Wireline
(Unit: KRW bn)
2012 2011 YoY 4Q 12 3Q 12 QoQ
Telephony 3,375.6 3,807.7—11.3% 797.2 834.7—4.5% Broadband 1,758.7 1,910.2—7.9% 439.8 432.8 1.6% Line lease 1,257.9 1,232.8 2.0% 312.0 300.5 3.8%
Wireline 6,392.3 6,950.7—8.0% 1,549.1 1,568.0—1.2%
(Unit: 1,000 / %)
<Wireline Subscribers>
4Q12
12
13
K-IFRS / Consolidated
2-3 Business Overview
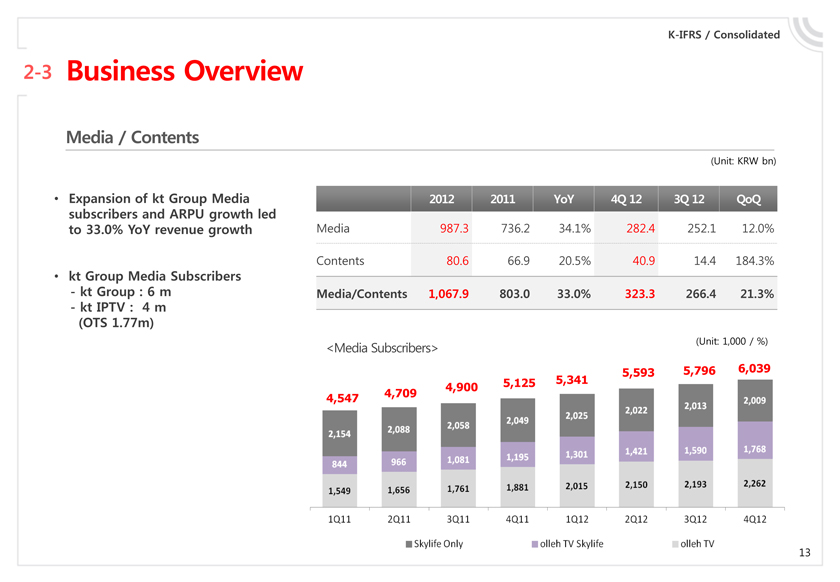
Media / Contents
• Expansion of kt Group Media subscribers and ARPU growth led to 33.0% YoY revenue growth
• kt Group Media Subscribers —kt Group : 6 m—kt IPTV : 4 m (OTS 1.77m)
(Unit: KRW bn)
2012 2011 YoY 4Q 12 3Q 12 QoQ
Media 987.3 736.2 34.1% 282.4 252.1 12.0%
Contents 80.6 66.9 20.5% 40.9 14.4 184.3%
Media/Contents 1,067.9 803.0 33.0% 323.3 266.4 21.3%
<Media Subscribers> (Unit: 1,000 / %)
5,341 5,593 5,796 6,039 4,900 5,125 4,547 4,709
(Unit: KRW bn)
2012 2011 YoY 4Q 12 3Q 12 QoQ
Finance/Rental 3,574.3 996.6 258.7% 954.7 939.1 1.7%
Finance 3,320.5 996.6 233.2% 821.0 819.0 0.2%
Rental 253.8—133.7 120.1 11.3%
Other Service 1,241.5 1,227.2 1.2% 354.9 332.3 6.8%
IT/Solution 618.5 690.5—10.4% 168.6 153.5 9.8%
Real estate 240.0 215.9 11.2% 78.6 72.7 8.1% Other 383.0 320.8 19.4% 107.7 106.1 1.5% Subsidiaries
K-IFRS / Consolidated
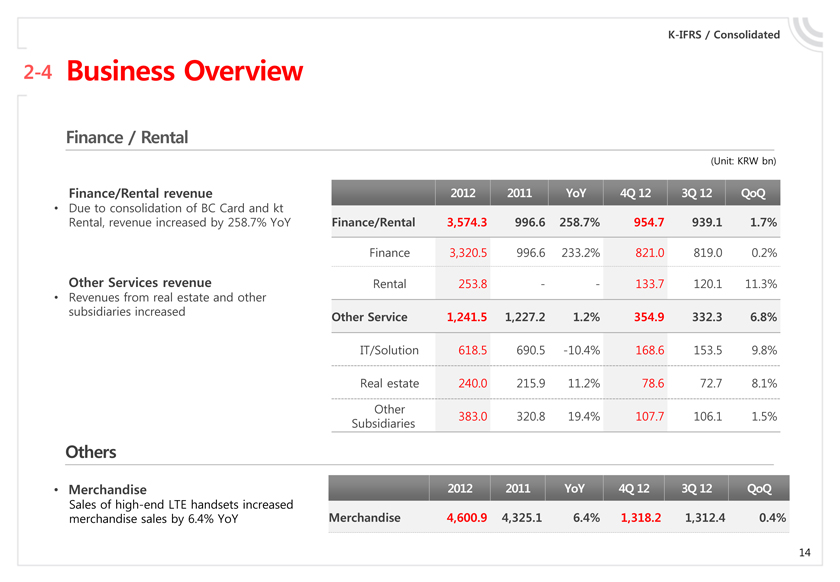
2-4 Business Overview
Finance / Rental
Finance/Rental revenue
• Due to consolidation of BC Card and kt Rental, revenue increased by 258.7% YoY
Other Services revenue
• Revenues from real estate and other subsidiaries increased
Others
• Merchandise 2012 2011 YoY 4Q 12 3Q 12 QoQ Sales of high-end LTE handsets increased Merchandise 4,600.9 4,325.1 6.4% 1,318.2 1,312.4 0.4% merchandise sales by 6.4% YoY
14
1 Financial Highlights
2 Business Overview
3 Q&A
4 Appendix
1 Financial Highlights
2 Business Overview
3 Q&A
4 Appendix
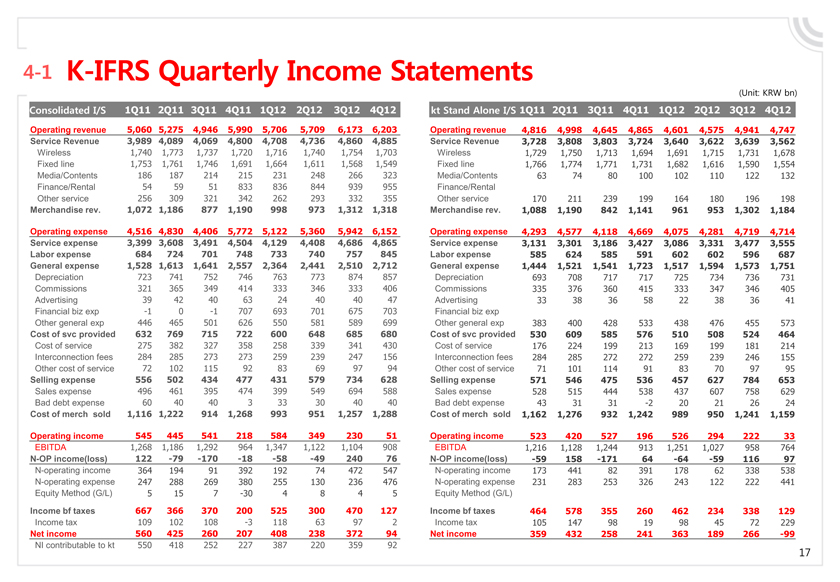
Operating revenue 4,816 4,998 4,645 4,865 4,601 4,575 4,941 4,747 Service Revenue 3,728 3,808 3,803 3,724 3,640 3,622 3,639 3,562 Wireless 1,729 1,750 1,713 1,694 1,691 1,715 1,731 1,678 Fixed line 1,766 1,774 1,771 1,731 1,682 1,616 1,590 1,554 Media/Contents 63 74 80 100 102 110 122 132 Finance/Rental Other service 170 211 239 199 164 180 196 198 Merchandise rev. 1,088 1,190 842 1,141 961 953 1,302 1,184 Operating expense 4,293 4,577 4,118 4,669 4,075 4,281 4,719 4,714 Service expense 3,131 3,301 3,186 3,427 3,086 3,331 3,477 3,555 Labor expense 585 624 585 591 602 602 596 687 General expense 1,444 1,521 1,541 1,723 1,517 1,594 1,573 1,751 Depreciation 693 708 717 717 725 734 736 731 Commissions 335 376 360 415 333 347 346 405 Advertising 33 38 36 58 22 38 36 41 Financial biz exp Other general exp 383 400 428 533 438 476 455 573 Cost of svc provided 530 609 585 576 510 508 524 464 Cost of service 176 224 199 213 169 199 181 214 Interconnection fees 284 285 272 272 259 239 246 155 Other cost of service 71 101 114 91 83 70 97 95 Selling expense 571 546 475 536 457 627 784 653 Sales expense 528 515 444 538 437 607 758 629 Bad debt expense 43 31 31—2 20 21 26 24 Cost of merch sold 1,162 1,276 932 1,242 989 950 1,241 1,159 Operating income 523 420 527 196 526 294 222 33 EBITDA 1,216 1,128 1,244 913 1,251 1,027 958 764 N-OP income(loss)—59 158—171 64—64—59 116 97 N-operating income 173 441 82 391 178 62 338 538 N-operating expense 231 283 253 326 243 122 222 441 Equity Method (G/L) Income bf taxes 464 578 355 260 462 234 338 129 Income tax 105 147 98 19 98 45 72 229 Net income 359 432 258 241 363 189 266—99 4-1 K-IFRS Quarterly Income Statements Consolidated I/S 1Q11 2Q11 3Q11 4Q11 1Q12 2Q12 3Q12 4Q12 Operating revenue 5,060 5,275 4,946 5,990 5,706 5,709 6,173 6,203 Service Revenue 3,989 4,089 4,069 4,800 4,708 4,736 4,860 4,885 Wireless 1,740 1,773 1,737 1,720 1,716 1,740 1,754 1,703 Fixed line 1,753 1,761 1,746 1,691 1,664 1,611 1,568 1,549 Media/Contents 186 187 214 215 231 248 266 323 Finance/Rental 54 59 51 833 836 844 939 955 Other service 256 309 321 342 262 293 332 355 Merchandise rev. 1,072 1,186 877 1,190 998 973 1,312 1,318 Operating expense 4,516 4,830 4,406 5,772 5,122 5,360 5,942 6,152 Service expense 3,399 3,608 3,491 4,504 4,129 4,408 4,686 4,865 Labor expense 684 724 701 748 733 740 757 845 General expense 1,528 1,613 1,641 2,557 2,364 2,441 2,510 2,712 Depreciation 723 741 752 746 763 773 874 857 Commissions 321 365 349 414 333 346 333 406 Advertising 39 42 40 63 24 40 40 47 Financial biz exp—1 0—1 707 693 701 675 703 Other general exp 446 465 501 626 550 581 589 699 Cost of svc provided 632 769 715 722 600 648 685 680 Cost of service 275 382 327 358 258 339 341 430 Interconnection fees 284 285 273 273 259 239 247 156 Other cost of service 72 102 115 92 83 69 97 94 Selling expense 556 502 434 477 431 579 734 628 Sales expense 496 461 395 474 399 549 694 588 Bad debt expense 60 40 40 3 33 30 40 40 Cost of merch sold 1,116 1,222 914 1,268 993 951 1,257 1,288 Operating income 545 445 541 218 584 349 230 51 EBITDA 1,268 1,186 1,292 964 1,347 1,122 1,104 908 N-OP income(loss) 122—79—170—18—58—49 240 76 N-operating income 364 194 91 392 192 74 472 547 N-operating expense 247 288 269 380 255 130 236 476 Equity Method (G/L) 5 15 7—30 4 8 4 5 Income bf taxes 667 366 370 200 525 300 470 127 Income tax 109 102 108—3 118 63 97 2 Net income 560 425 260 207 408 238 372 94 NI contributable to kt 550 418 252 227 387 220 359 92 (Unit: KRW bn) kt Stand Alone I/S 1Q11 2Q11 3Q11 4Q11 1Q12 2Q12 3Q12 4Q12 17
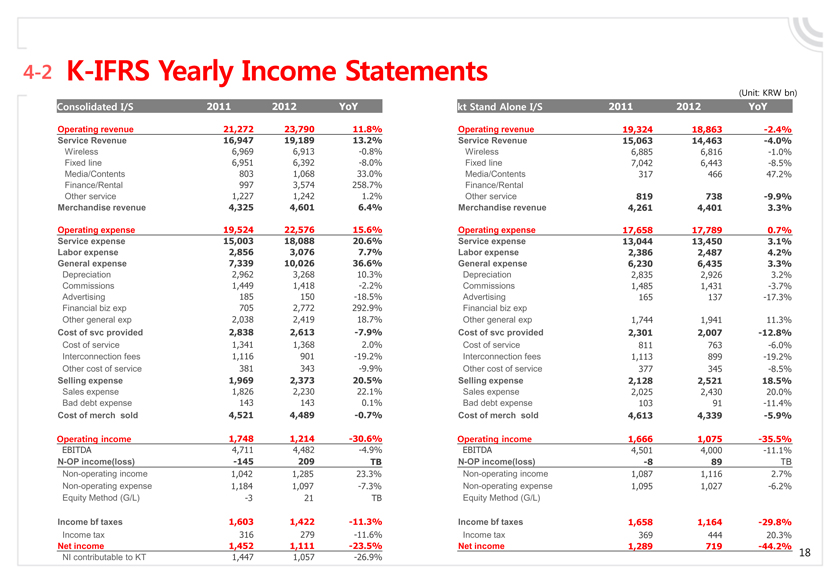
¸¼Àº°íµñµ¸¿ò4-2 K-IFRS Yearly Income Statements
(Unit: KRW bn)
Consolidated I/S 2011 2012 YoY kt Stand Alone I/S 2011 2012 YoY
Operating revenue 21,272 23,790 11.8% Operating revenue 19,324 18,863 -2.4%
Service Revenue 16,947 19,189 13.2% Service Revenue 15,063 14,463 -4.0%
Wireless 6,969 6,913 -0.8% Wireless 6,885 6,816 -1.0% Fixed line 6,951 6,392 -8.0% Fixed line 7,042 6,443 -8.5%
Media/Contents 803 1,068 33.0% Media/Contents 317 466 47.2% Finance/Rental 997 3,574 258.7% Finance/Rental Other service 1,227 1,242 1.2% Other service 819 738 -9.9%
Merchandise revenue 4,325 4,601 6.4% Merchandise revenue 4,261 4,401 3.3%
Operating expense 19,524 22,576 15.6% Operating expense 17,658 17,789 0.7%
Service expense 15,003 18,088 20.6% Service expense 13,044 13,450 3.1% Labor expense 2,856 3,076 7.7% Labor expense 2,386 2,487 4.2% General expense 7,339 10,026 36.6% General expense 6,230 6,435 3.3%
Depreciation 2,962 3,268 10.3% Depreciation 2,835 2,926 3.2% Commissions 1,449 1,418 -2.2% Commissions 1,485 1,431 -3.7% Advertising 185 150 -18.5% Advertising 165 137 -17.3%
Financial biz exp 705 2,772 292.9% Financial biz exp
Other general exp 2,038 2,419 18.7% Other general exp 1,744 1,941 11.3%
Cost of svc provided 2,838 2,613 -7.9% Cost of svc provided 2,301 2,007 -12.8%
Cost of service 1,341 1,368 2.0% Cost of service 811 763 -6.0% Interconnection fees 1,116 901 -19.2% Interconnection fees 1,113 899 -19.2% Other cost of service 381 343 -9.9% Other cost of service 377 345 -8.5%
Selling expense 1,969 2,373 20.5% Selling expense 2,128 2,521 18.5%
Sales expense 1,826 2,230 22.1% Sales expense 2,025 2,430 20.0%
Bad debt expense 143 143 0.1% Bad debt expense 103 91 -11.4%
Cost of merch sold 4,521 4,489 -0.7% Cost of merch sold 4,613 4,339 -5.9%
Operating income 1,748 1,214 -30.6% Operating income 1,666 1,075 -35.5%
EBITDA 4,711 4,482 -4.9% EBITDA 4,501 4,000 -11.1%
N-OP income(loss) -145 209 TB N-OP income(loss) -8 89 TB
Non-operating income 1,042 1,285 23.3% Non-operating income 1,087 1,116 2.7% Non-operating expense 1,184 1,097 -7.3% Non-operating expense 1,095 1,027 -6.2% Equity Method (G/L) -3 21 TB Equity Method (G/L)
Income bf taxes 1,603 1,422 -11.3% Income bf taxes 1,658 1,164 -29.8%
Income tax 316 279 -11.6% Income tax 369 444 20.3%
Net income 1,452 1,111 -23.5% Net income 1,289 719 -44.2% 18
NI contributable to KT 1,447 1,057 -26.9%
(Unit: KRW bn) kt Stand Alone I/S 2011 2012 YoY
Operating revenue 19,324 18,863—2.4%
Service Revenue 15,063 14,463—4.0%
Wireless 6,885 6,816—1.0% Fixed line 7,042 6,443—8.5%
Media/Contents 317 466 47.2% Finance/Rental Other service 819 738—9.9%
Merchandise revenue 4,261 4,401 3.3%
Operating expense 17,658 17,789 0.7%
Service expense 13,044 13,450 3.1% Labor expense 2,386 2,487 4.2%
General expense 6,230 6,435 3.3%
Depreciation 2,835 2,926 3.2% Commissions 1,485 1,431—3.7% Advertising 165 137—17.3%
Financial biz exp
Other general exp 1,744 1,941 11.3%
Cost of svc provided 2,301 2,007—12.8%
Cost of service 811 763—6.0% Interconnection fees 1,113 899—19.2% Other cost of service 377 345—8.5%
Selling expense 2,128 2,521 18.5%
Sales expense 2,025 2,430 20.0%
Bad debt expense 103 91—11.4%
Cost of merch sold 4,613 4,339—5.9%
Operating income 1,666 1,075—35.5%
EBITDA 4,501 4,000—11.1%
N-OP income(loss)—8 89 TB
Non-operating income 1,087 1,116 2.7% Non-operating expense 1,095 1,027—6.2% Equity Method (G/L)
Income bf taxes 1,658 1,164—29.8%
Income tax 369 444 20.3%
Net income 1,289 719—44.2% 18
4-2 K-IFRS Yearly Income Statements
Consolidated I/S 2011 2012 YoY
Operating revenue 21,272 23,790 11.8%
Service Revenue 16,947 19,189 13.2%
Wireless 6,969 6,913—0.8% Fixed line 6,951 6,392—8.0%
Media/Contents 803 1,068 33.0% Finance/Rental 997 3,574 258.7%
Other service 1,227 1,242 1.2%
Merchandise revenue 4,325 4,601 6.4%
Operating expense 19,524 22,576 15.6%
Service expense 15,003 18,088 20.6% Labor expense 2,856 3,076 7.7% General expense 7,339 10,026 36.6%
Depreciation 2,962 3,268 10.3% Commissions 1,449 1,418—2.2% Advertising 185 150—18.5%
Financial biz exp 705 2,772 292.9% Other general exp 2,038 2,419 18.7%
Cost of svc provided 2,838 2,613—7.9%
Cost of service 1,341 1,368 2.0%
Interconnection fees 1,116 901—19.2% Other cost of service 381 343—9.9%
Selling expense 1,969 2,373 20.5%
Sales expense 1,826 2,230 22.1%
Bad debt expense 143 143 0.1%
Cost of merch sold 4,521 4,489—0.7%
Operating income 1,748 1,214—30.6%
EBITDA 4,711 4,482—4.9%
N-OP income(loss)—145 209 TB
Non-operating income 1,042 1,285 23.3% Non-operating expense 1,184 1,097—7.3% Equity Method (G/L)—3 21 TB
Income bf taxes 1,603 1,422—11.3%
Income tax 316 279—11.6%
Net income 1,452 1,111—23.5%
NI contributable to KT 1,447 1,057—26.9%
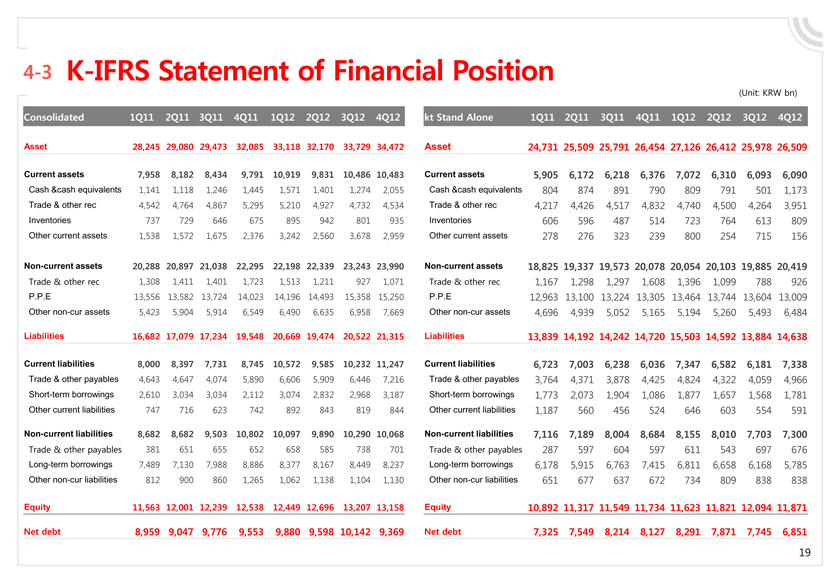
Consolidated 1Q11 2Q11 3Q11 4Q11 1Q12 2Q12 3Q12 4Q12
Asset 28,245 29,080 29,473 32,085 33,118 32,170 33,729 34,472
Current assets 7,958 8,182 8,434 9,791 10,919 9,831 10,486 10,483
Cash &cash equivalents 1,141 1,118 1,246 1,445 1,571 1,401 1,274 2,055 Trade & other rec 4,542 4,764 4,867 5,295 5,210 4,927 4,732 4,534 Inventories 737 729 646 675 895 942 801 935 Other current assets 1,538 1,572 1,675 2,376 3,242 2,560 3,678 2,959
Non-current assets 20,288 20,897 21,038 22,295 22,198 22,339 23,243 23,990
Trade & other rec 1,308 1,411 1,401 1,723 1,513 1,211 927 1,071 P.P.E 13,556 13,582 13,724 14,023 14,196 14,493 15,358 15,250 Other non-cur assets 5,423 5,904 5,914 6,549 6,490 6,635 6,958 7,669
Liabilities 16,682 17,079 17,234 19,548 20,669 19,474 20,522 21,315
Current liabilities 8,000 8,397 7,731 8,745 10,572 9,585 10,232 11,247
Trade & other payables 4,643 4,647 4,074 5,890 6,606 5,909 6,446 7,216 Short-term borrowings 2,610 3,034 3,034 2,112 3,074 2,832 2,968 3,187 Other current liabilities 747 716 623 742 892 843 819 844
Non-current liabilities 8,682 8,682 9,503 10,802 10,097 9,890 10,290 10,068
Trade & other payables 381 651 655 652 658 585 738 701 Long-term borrowings 7,489 7,130 7,988 8,886 8,377 8,167 8,449 8,237 Other non-cur liabilities 812 900 860 1,265 1,062 1,138 1,104 1,130
Equity 11,563 12,001 12,239 12,538 12,449 12,696 13,207 13,158
Net debt 8,959 9,047 9,776 9,553 9,880 9,598 10,142 9,369
4-3 K-IFRS Statement of Financial Position
(Unit: KRW bn) kt Stand Alone 1Q11 2Q11 3Q11 4Q11 1Q12 2Q12 3Q12 4Q12 Asset 24,731 25,509 25,791 26,454 27,126 26,412 25,978 26,509
Current assets 5,905 6,172 6,218 6,376 7,072 6,310 6,093 6,090
Cash &cash equivalents 804 874 891 790 809 791 501 1,173
Trade & other rec 4,217 4,426 4,517 4,832 4,740 4,500 4,264 3,951 Inventories 606 596 487 514 723 764 613 809 Other current assets 278 276 323 239 800 254 715 156
Non-current assets 18,825 19,337 19,573 20,078 20,054 20,103 19,885 20,419
Trade & other rec 1,167 1,298 1,297 1,608 1,396 1,099 788 926 P.P.E 12,963 13,100 13,224 13,305 13,464 13,744 13,604 13,009 Other non-cur assets 4,696 4,939 5,052 5,165 5,194 5,260 5,493 6,484
Liabilities 13,839 14,192 14,242 14,720 15,503 14,592 13,884 14,638
Current liabilities 6,723 7,003 6,238 6,036 7,347 6,582 6,181 7,338
Trade & other payables 3,764 4,371 3,878 4,425 4,824 4,322 4,059 4,966 Short-term borrowings 1,773 2,073 1,904 1,086 1,877 1,657 1,568 1,781
Other current liabilities 1,187 560 456 524 646 603 554 591
Non-current liabilities 7,116 7,189 8,004 8,684 8,155 8,010 7,703 7,300
Trade & other payables 287 597 604 597 611 543 697 676 Long-term borrowings 6,178 5,915 6,763 7,415 6,811 6,658 6,168 5,785 Other non-cur liabilities 651 677 637 672 734 809 838 838
Equity 10,892 11,317 11,549 11,734 11,623 11,821 12,094 11,871
Net debt 7,325 7,549 8,214 8,127 8,291 7,871 7,745 6,851
19
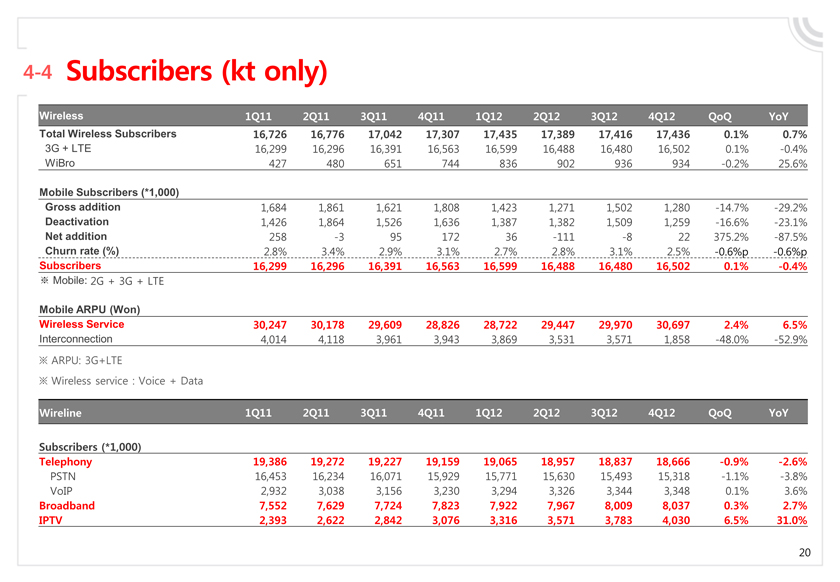
4-4 Subscribers (kt only) Wireless 1Q11 2Q11 3Q11 4Q11 1Q12 2Q12 3Q12 4Q12 QoQ YoY Total Wireless Subscribers 16,726 16,776 17,042 17,307 17,435 17,389 17,416 17,436 0.1% 0.7% 3G + LTE 16,299 16,296 16,391 16,563 16,599 16,488 16,480 16,502 0.1%—0.4%
WiBro 427 480 651 744 836 902 936 934—0.2% 25.6%
Mobile Subscribers (*1,000)
Gross addition 1,684 1,861 1,621 1,808 1,423 1,271 1,502 1,280—14.7%—29.2% Deactivation 1,426 1,864 1,526 1,636 1,387 1,382 1,509 1,259—16.6%—23.1%
Net addition 258—3 95 172 36—111—8 22 375.2%—87.5% Churn rate (%) 2.8% 3.4% 2.9% 3.1% 2.7% 2.8% 3.1% 2.5%—0.6%p—0.6%p
Subscribers 16,299 16,296 16,391 16,563 16,599 16,488 16,480 16,502 0.1%—0.4%
? Mobile: 2G + 3G + LTE
Mobile ARPU (Won)
Wireless Service 30,247 30,178 29,609 28,826 28,722 29,447 29,970 30,697 2.4% 6.5%
Interconnection 4,014 4,118 3,961 3,943 3,869 3,531 3,571 1,858—48.0%—52.9%
? ARPU: 3G+LTE
? Wireless service : Voice + Data
Wireline 1Q11 2Q11 3Q11 4Q11 1Q12 2Q12 3Q12 4Q12 QoQ YoY
Subscribers (*1,000)
Telephony 19,386 19,272 19,227 19,159 19,065 18,957 18,837 18,666—0.9%—2.6%
PSTN 16,453 16,234 16,071 15,929 15,771 15,630 15,493 15,318—1.1%—3.8%
VoIP 2,932 3,038 3,156 3,230 3,294 3,326 3,344 3,348 0.1% 3.6%
Broadband 7,552 7,629 7,724 7,823 7,922 7,967 8,009 8,037 0.3% 2.7% IPTV 2,393 2,622 2,842 3,076 3,316 3,571 3,783 4,030 6.5% 31.0%
Thank u KT