Table of Contents
SECURITIES AND EXCHANGE COMMISSION
Washington, D.C. 20549
Form 6-K
REPORT OF FOREIGN PRIVATE ISSUER
PURSUANT TO RULE 13a-16 OR 15d-16 OF
THE SECURITIES EXCHANGE ACT OF 1934
For the month of May 2013
Commission File Number 1-14926
KT Corporation
(Translation of registrant’s name into English)
1692-1 Seocho-dong
Seocho-gu, Seoul
137-882
Korea
(Address of principal executive offices)
Indicate by check mark whether the registrant files or will file annual reports under cover of Form 20-F or Form 40-F:
Form 20-F x Form 40-F ¨
Indicate by check mark if the registrant is submitting the Form 6-K in paper as permitted by Regulation S-T Rule 101(b)(1): ¨
Indicate by check mark if the registrant is submitting the Form 6-K in paper as permitted by Regulation S-T Rule 101(b)(7): ¨
Indicate by check mark whether by furnishing the information contained in this Form, the registrant is also thereby furnishing the information to the Commission pursuant to Rule 12g3-2(b) under the Securities Exchange Act of 1934.
Yes ¨ No x
If “Yes” is marked, indicate below the file number assigned to the registrant in connection with Rule 12g3-2(b): 82-
Table of Contents
SIGNATURES
Pursuant to the requirements of the Securities Exchange Act of 1934, the registrant has duly caused this report to be signed on its behalf by the undersigned, thereunto duly authorized.
| Dated: May 2, 2013 | ||
| KT Corporation | ||
| By: | /s/ Youngwoo Kim | |
| Name: | Youngwoo Kim | |
| Title: | Vice President | |
| By: | /s/ Tony Yongrae Jung | |
| Name: | Tony Yongrae Jung | |
| Title: | Director | |
Table of Contents
ANNUAL FINANCIAL REPORT
OF
KT CORPORATION
(From January 1, 2012 to December 31, 2012)
Table of Contents
 | Investor Relations | |
| Financial Office | ||
| 1692-1 Seocho-dong, Seocho-gu | ||
| Seoul, 137-882 | ||
| Korea |
29 April, 2013
Financial Conduct Authority
25 The North Colonnade
Canary Wharf
London
E14 5HS
Dear Sir/Madam,
I, Bum Joon Kim, Executive Vice President and Chief Financial Officer of KT Corporation (“KT”), as the person responsible for the submission of the annual financial report pursuant to Section 18.4.3A of Listing Rule and Section 4.1.3R of Disclosure and Transparency Rule, have reviewed the information contained herein and find that, to the best of my knowledge and having taken all reasonable care to ensure accuracy the information is in accordance with the facts and contains no omission likely to affect its import.
In particular, I confirm that:
(a) the financial statements, prepared in accordance with the applicable set of accounting standards, give a true and fair view of the assets, liabilities, financial position and profit or loss of KT and its subsidiaries included in the consolidation taken as a whole; and
(b) the management report includes a fair review of the development and performance of the business and the position of KT and its subsidiaries included in the consolidation taken as a whole, together with a description of the principal risks and uncertainties that they face.
In addition, all information provided by third parties has been accurately reproduced and, as far as KT is aware and is able to ascertain from information published by third parties, no facts have been omitted which would render the reproduced information inaccurate or misleading.
| Yours faithfully, | ||
| ||
| Name: | Bum Joon Kim | |
| Position: | Executive Vice President and Chief Financial Officer | |


Table of Contents
| 3 | ||||
| 3 | ||||
| 3 | ||||
| 4 | ||||
| 6 | ||||
| 6 | ||||
| 7 | ||||
| 7 | ||||
| 25 | ||||
| 30 | ||||
| 41 | ||||
| 42 | ||||
| 43 | ||||
| 43 | ||||
| 44 | ||||
| 45 | ||||
1. Auditor’s Opinion on the Consolidated Financial Statements | 45 | |||
2. Compensation to External Auditors for the Last Three Fiscal Years | 45 | |||
| 46 | ||||
| 46 | ||||
| 52 | ||||
| 54 | ||||
| 55 | ||||
| 56 | ||||
| 56 | ||||
| 56 | ||||
| 59 | ||||
| 59 | ||||
VII. The Principal Risks and Uncertainties Facing the Company | 60 | |||
| 60 | ||||
| 66 |
CONSOLIDATED FINANCIAL STATEMENTS FOR THE TWELVE MONTHS ENDED DECEMBER 31, 2012 AND 2011 AND INDEPENDENT AUDITORS’ REPORT
2
Table of Contents
1. Corporate Purpose of KT Corporation
Business Objectives
| 1. | Information and communications business; |
| 2. | New media business; |
| 3. | Development and sale of software and contents; |
| 4. | Sale and distribution of information communication equipment; |
| 5. | Testing and inspection of information communication equipment, devices and facilities; |
| 6. | Advertisement business; |
| 7. | Telecommunications retail business; |
| 8. | Development of information and technology, and electrical infrastructure; |
| 9. | Real estate and housing business; |
| 10. | Electronic banking and finance business; |
| 11. | Education and learning services business; |
| 12. | Security services business (including machinery system surveillance services and facilities security services); |
| 13. | Research and technical development, education, training and promotion, overseas businesses, export and import trade, manufacturing and distribution related to the activities mentioned in items 1 through 12; |
| 14. | Telecommunications services business, including frequency-based telecommunications business; |
| 15. | Value-added telecommunications business; |
| 16. | Production, supply (screening) and distribution of music albums, music videos, movies, videos and games. |
| 17. | Electronic finance and electronic payment gateway services, including issuance and management of pre-paid electronic payment methods; |
| 18. | Sales and leasing of equipment and facilities related to the activities mentioned in items 14 through 17; |
| 19. | Overseas and export and import trade related to activities mentioned in items 14 through 18; |
| 20. | Travel agency business; |
| 21. | (Deleted) |
| 22. | Alternative energy generation business |
| 23. | Health Bioinformatics business |
| 24. | Military telecommunication equipment manufacturing business; and |
| 25. | Energy inspection, energy conservation, and other energy use rationalization business |
| 26. | Any and all other activities or businesses incidental to or necessary for the attainment of the foregoing. |
A. Changes since Incorporation
(1) Date of Incorporation: December 10, 1981
(2) Location of Headquarters:
206 Jungja-dong
Bundang-gu, Seongnam-city
Kyeonggi-do 463-711
Korea
3
Table of Contents
(3) Major Changes in KT Corporation
| • | On March 27, 2009, KT Corporation (“KT”) signed a merger agreement with its mobile subsidiary KTF, which KT held a 54.25% interest in, and on June 1, 2009, the merger was completed. |
| • | At the annual shareholders’ meeting held on March 11, 2011, KT shareholders approved the addition of health bioinformatics business to KT’s business objectives, which is a new emerging industry that integrates IT with genetic data information sequencing, computation, accumulation, and application. The shareholders also approved the addition of military communication equipment, device and facility manufacturing to its business objectives. |
| • | Mr. Suk Chae Lee was reelected as the CEO and President of KT at the annual shareholders’ meeting held on March 16, 2012. |
| • | At the annual shareholders’ meeting held on March 15, 2013, KT shareholders approved the addition of energy inspection, energy conservation, and other energy use rationalization business to KT’s business objectives. |
3. Total Number of Shares and Related Matters
A. Total Number of Shares
| (As of December 31, 2012) | (Unit: Shares) | |||||||
| Type of Shares | ||||||||
Category | Common Shares | Total | ||||||
I. Total Number of Authorized Shares | 1,000,000,000 | 1,000,000,000 | ||||||
|
|
|
| |||||
II. Total Number of Issued Shares | 312,899,767 | 312,899,767 | ||||||
|
|
|
| |||||
III. Total Number of Shares Reduced | 51,787,959 | 51,787,959 | ||||||
|
|
|
| |||||
1. Reduction of Capital | — | — | ||||||
2. Share Retirement | 51,787,959 | 51,787,959 | ||||||
3. Redemption of Redeemable Shares | — | — | ||||||
4. Other | — | — | ||||||
IV. Current Number of Issued Shares (II – III) | 261,111,808 | 261,111,808 | ||||||
V. Number of Treasury Shares | 17,389,417 | 17,389,417 | ||||||
VI. Current Number of Issued and Outstanding Shares | 243,722,391 | 243,722,391 | ||||||
B. Status of Capital Increase/Decrease
| (As of December 31, 2012) | (Unit: Won, Shares) | |||||||||||||||||||
| Details of Issued (Retired) Shares | ||||||||||||||||||||
Date of Shares Issued (Retired) | Type of Shares Issued (Retired) | Type | Number of Issued (Retired) Shares | Par Value per Share | Par Value of Issued per Share | Note | ||||||||||||||
June 2, 2009 | — | Common Shares | 700,108 | 5,000 | 5,000 | Issuance of new shares for merger | ||||||||||||||
| • | For the merger with KTF, KT issued 700,108 new shares. As a result, the capital amount increased by Won 3.5 billion as follows. |
| (Unit: Won) | ||||||||||||
Category | Before Merger | Amount of Change | After Merger | |||||||||
Capital Amount | 1,560,998,295,000 | 3,500,540,000 | 1,564,498,835,000 | |||||||||
4
Table of Contents
C. Acquisition and Disposal of Treasury Shares
(As of Dec 31, 2012) | (Unit: Shares) | |||||||||||||||||||||||
Method of Acquisition | Type | Beginning of Term | Acquisition (+) | Disposition (–) | Retirement (–) | End of Term | ||||||||||||||||||
Direct Acquisition | Pursuant to Article 165-2 of Securities and Exchange Act | Common Shares | 17,449,209 | — | 59,792 | — | 17,389,417 | |||||||||||||||||
| Preferred Shares | — | — | — | — | — | |||||||||||||||||||
Reasons other than Article 165-2 of Securities and Exchange Act | Common Shares | 361,353 | — | 361,353 | — | — | ||||||||||||||||||
| Preferred Shares | — | — | — | — | — | |||||||||||||||||||
Subtotal | Common Shares | 17,810,562 | — | 421,145 | — | 17,389,417 | ||||||||||||||||||
|
|
|
|
|
|
|
|
|
| |||||||||||||||
| Preferred Shares | — | — | — | — | — | |||||||||||||||||||
|
|
|
|
|
|
|
|
|
| |||||||||||||||
Indirect Acquisition (e.g. Trust Contract) | Common Shares | — | — | — | — | — | ||||||||||||||||||
| Preferred Shares | — | — | — | — | — | |||||||||||||||||||
Total | Common Shares | 17,810,562 | — | 421,145 | — | 17,389,417 | ||||||||||||||||||
|
|
|
|
|
|
|
|
|
| |||||||||||||||
| Preferred Share | — | — | — | — | — | |||||||||||||||||||
|
|
|
|
|
|
|
|
|
| |||||||||||||||
| • | The above “Beginning of Term” means as of January 1, 2012 and “End of Term” means as of December 31, 2012. |
| • | Details of share buyback and retirement of treasury shares from January 1, 2012 to December 31, 2012 are as follows. |
(1) Acquisition of Treasury Shares
| • | Not Applicable |
(2) Disposition of Treasury Shares (421,145 shares)
| • | April 10, 2012: Disposition of treasury shares in connection with the exercise of stock options (361,353 shares) |
| • | May 21, 2012: Disposition of treasury shares to distribute long-term performance based bonus payments to company executives (59,792 shares) |
D. Share Ownership Status of the Employee Stock Ownership Association
(1) Transactions with the Employee Stock Ownership Association
| • | Not Applicable |
(2) Guidelines for Exercising the Voting Rights of the Employee Stock Ownership Association
| • | Association Account: The Employee Stock Ownership Association exercises its voting right in a manner that is exactly in proportion to the number of association members who wish to exercise their voting rights. |
| • | Association Member Account:Employee Stock Ownership Association may exercise its voting rights only if (i) the association receives a request by an association member to exercise his voting rights with a minimum notice period of seven days or (ii) the association member chooses to delegate his voting rights to the association. |
5
Table of Contents
(3) Shares Held by the Employee Stock Ownership Association
(As of December 31, 2012) | (Unit: Shares) | |||||||||
Type of Account | Type of Shares | Balance at Beginning of Term | Term-End Balance | |||||||
Association Account | Common Shares | 34,002 | 33,940 | |||||||
Association Member Account | Common Shares | 3,255,944 | 3,090,671 | |||||||
|
|
|
| |||||||
Total | 3,289,946 | 3,124,611 | ||||||||
|
|
|
| |||||||
(As of December 31, 2012) | (Unit: Shares) | |||||||||
Category | Number of Shares | Note | ||||||||
Total Issued Shares (A) | Common Shares | 261,111,808 | - | |||||||
|
| |||||||||
| Preferred Shares | — | |||||||||
|
| |||||||||
Shares without Voting Rights (B) | Common Shares | 17,476,002 | | Including Treasury Shares & BC Card stake | | |||||
| Preferred Shares | — | |||||||||
Shares with Restricted Voting Rights under the Stock Exchange Act and Other Laws (C) | - | — | - | |||||||
Shares with Reestablished Voting Rights (D) | - | — | - | |||||||
Shares with Exercisable Voting Rights (E = A – B – C + D) | Common Shares | 243,635,806 | - | |||||||
| Preferred Shares | — | |||||||||
| • | Shares without voting rights under the Commercial Code of Korea: 17,389,417 treasury shares held through treasury stock funds and 86,585 shares owned by BC Card. |
5. Dividends and Related Matters
A. Dividends
The shareholder return policy of KT is to pay its shareholders minimum Won 2,000 dividend until FY2014. However, KT’s return policy is subject to alter depending on its operating status and business environment.
B. Dividends Paid during the Past Three Fiscal Years
Category | FY2012 | FY2011 | FY2010 | |||||||||||
Par Value per Share (Won) | 5,000 | 5,000 | 5,000 | |||||||||||
Net Profit of the Current Term (in Millions of Won) | 719,351 | 1,289,055 | 1248,846 | |||||||||||
Net Profit per Share (Won) | 2,953 | 5,299 | 5,135 | |||||||||||
Year-end Cash Dividend (in Millions of Won) | 487,445 | 486,602 | 586,150 | |||||||||||
Year-end Share Dividend (in Millions of Won) | — | — | — | |||||||||||
Cash Dividend Propensity (%) | 67.8 | 37.7 | 46.9 | |||||||||||
Rate of Return on Cash Dividend (%) | Common Shares | 5.2 | 5.3 | 5.0 | ||||||||||
| Preferred Shares | — | — | — | |||||||||||
Rate of Return on Share Dividend (%) | Common Shares | — | — | — | ||||||||||
| Preferred Shares | — | — | — | |||||||||||
Cash Dividend per Share (Won) | Common Shares | 2,000 | 2,000 | 2,410 | ||||||||||
| Preferred Shares | — | — | — | |||||||||||
Share Dividend per Share (Share) | Common Shares | — | — | — | ||||||||||
| Preferred Shares | — | — | — | |||||||||||
| • | The dividend-related information is based on KT stand-alone results. |
6
Table of Contents
A. Present Conditions of the Industry
(1) Characteristics of the Industry
| • | Telecommunication (KT, KT Powertel) |
The existing markets for fixed-line telephony, broadband internet and mobile communications in Korea have reached their maturity. At the same time, with technical advances and changes in customer demands, the communications industry has been moving towards to a convergence with different technologies and industries.
KT had successfully shifted the mobile industry paradigm from the voice-centric market to the data-centric market by introducing iPhone from Apple to the Korean market at the end of 2009. KT further strengthened its handset competitiveness by introducing various types of smartphone handsets such as iPhone4S (Apple), Galaxy-S2 (Samsung), and Optimus-Black (LGE). In 2012, KT also introduced smartphones models including Galaxy-S3 (Samsung), Galaxy-Note2 (Samsung), Optimus-G (LGE), Vega-Racer3 (Pantech) and iphone5 (Apple) and focused on acquiring LTE customers.
In addition, in anticipation of an explosion in wireless data traffics, KT has been seeking to maximize its usage of 3W (WCDMA, WiFi, WiBro) networks and applied CCC (Cloud Communication Center) technology to its LTE networks in 2012, which enhanced KT’s mobile data traffic speed and stabilized its mobile service quality. KT also introduced ‘olleh market’ (KT’s appstore) and developed various applications such as ‘Genie’ (music streaming service using Cloud) and ‘olleh tv now’ (n-screen service with IPTV channels and VODs). In addition, KT enhanced its competitiveness of media business by promoting ‘olleh TV skylife’, a hybrid service combining HD satellite channels of KT Skylife and VODs of KT’s IPTV.
Meanwhile, TRS (Trunked Radio System) service, which combines nation-wide radio communication, 0130 mobile calls and wireless data, is expected to sustain its growth in the foreseeable future, mainly focused on specific markets such as logistics and industrial sites. Finally, NI / SI (Network Integration / System Integration) are expanding business boundary as we move into the convergence era of information and communication technology (ICT)-based smart society such as green IT, cloud computing, BcN, etc.
| • | Credit Cards Business (BC Card) |
In 1982, five domestic banks (Chohung, Commercial, First Korea, Hanil, Seoul Trusts) established Banks’ Credit Card Association (the predecessor of BC Card) and launched their card operations. Today’s credit card business shape was formed when the Credit Card Industry Act was enacted in 1987. In 2009, the government expanded possible credit cards’ payment accounts that had been limited to Commercial Bank’s accounts into CMA accounts of financial investment companies, which were allowed to issue CMA-based credit cards. Credit card industry has been expanding its business scale with the government’s credit card proliferation policy of which was designed to help the government correctly charge the taxable income. Recently, it is reinforcing its risk management in order to enhance profitability.
7
Table of Contents
| • | Satellite Broadcasting Service (KT Skylife) |
Since the broadcasting service becomes increasingly more integrated with the telecommunication, its value chain in the media industry has been reshuffled. New broadcasting communication technologies such as digital conversion and broad band of broadcasting along with convergence between broadcasting and telecommunication are spreading into the all industry areas. As a result, more customized broadcasting services are available to satisfy the customer needs.
| • | Car Rental Business (KT Rental) |
Along with increase in per capita income as well as economic growth, Korean consumers have increasingly attentive to car rental business because of its convenience. Accordingly, Korean car rental business began its noticeable growth. Further, since rental car demands from government offices and corporate for business uses have escalated, Korean car rental industry has been showing continuous growth.
| • | Online contents creation and e-commerce (KT Hitel) |
The internet service is a promising knowledge-based industry that can produce high added-values without production costs, such as raw materials and large-scale facilities, logistics cost and restrictions of sales area. The internet service market is rapidly expanding its territory from wired internet services of desk-top PC to mobile internet services. And, this provides new opportunities of excavating various business models. Smart mobile lifestyle is rapidly settling in our daily life as it becomes easier to use mobile internet anytime, anywhere. In tandem with these circumstances, KT Hitel has launched a variety of mobile internet services such as ‘Pudding Camera’, ‘Pudding Face Recognition’, ‘I’m In’ and ‘Pudding. to’.
| • | Security and Guards (KT Telecop) |
Because of a continuous rise in income, increasing participation by women in the public affairs and the impact of an aging society, consumers are more and more security conscious. The traditionally less volatile security market, with its high market entry barriers, is a stable business with high growth prospects. In addition, the existing simple electronic security market is developing into an integrated security market, which includes personal security and SI (system integration). And its market is expected to grow into an integrated safety management industry by blending with relevant industries.
| • | Lease and Corporate Loan (KT Capital) |
Installment finance refers to lending capital to individual customers when they purchase goods that are costly, such as automobiles, machinery or real estates, and charging monthly installments which includes principle and interests. Lease refers to an agreement between two parties whereby one party allows the other to use his/her property for a certain period of time in exchange for a periodic fee. Mostly, finance companies offer both installment finance and lease services.
8
Table of Contents
(2) Growth of the Industry
| • | Telecommunication (KT, KT Powertel) |
| (Unit: thousand persons) | ||||||||||||
Category | 2012 | 2011 | 2010 | |||||||||
Broadband internet Subscribers | 18,253 | 17,860 | 17,219 | |||||||||
Local Telephone Subscribers | 18,261 | 18,862 | 19,273 | |||||||||
Mobile Phone Subscribers | 53,624 | 52,507 | 50,767 | |||||||||
TRS Subscribers | 384 | 382 | 378 | |||||||||
| • | The 2010 to 2012 data were provided by the Korea Communications Commission (www.kcc.go.kr). |
| • | Credit Cards Business (BC card) |
 Annual Credit Card Transaction Market
Category | 2011 | 2010 | 2009 | |||||||||
Transaction amount (KRW billion) | 468,883 | 397,092 | 337,103 | |||||||||
YoY growth (%) | 18.1 | 17.8 | 10.1 | |||||||||
| • | BC Card’s internal data, the 2012 figures are not available yet. |
| • | Satellite Broadcasting Service (KT Skylife) |
In the future, broadcasting and telecommunication operators will provide not only voice and data with IPTV and VoIP but also offer interactive satellite and mobile services that integrate wireless and wireline characteristics.
Paid-TV subscriber trend
| (Unit: person) | ||||||||||||
| Subscribers (No. of Lines) | ||||||||||||
Paid TV Market | 2012 | 2011 | 2010 | |||||||||
Subscribers | 25,269,752 | 23,114,017 | 21,548,197 | |||||||||
| • | Source: Paid-TV Providers |
| • | Online contents creation and e-commerce (KT Hitel) |
The mobile internet market is growing rapidly with proliferation of smartphones compared to stagnant wired internet industry. Recently (2012.7.27), ABI research forecasted that global mobile data traffic will reach 107bn GB within 5 years (2017), which is 8 times more than the current data traffics. Therefore, advertising revenue is expected to grow sharply with the increase of mobile usage hours (Source: eMarketer 2011. 12)
| • | Security and Guards (KT Telecop) |
In the domestic security industry, affected by developments in electronics, computer, internet, telecommunications and film industries, value-added products are being introduced to the market. With an expectation of disposable income to grow continuously, the relevant security industry should continue to yield stable growth in coming years.
9
Table of Contents
| • | Car Rental Business (KT Rental) |
Domestic car rental market has shown stable growth along with increases in car sales. And the portion of rental cars to the registered vehicles has maintained above 2%. Considering past growth trend and expected increase in per capita income, the portion of rental cars to the registered vehicles will steadily rise.
Numbers of registered vehicles and rental cars in Korea
| (Units: 1,000, %) | ||||||||||||||||||||
| 2012 | 2011 | 2010 | 2009 | 2008 | ||||||||||||||||
Number of registered vehicles | 18,870 | 18,437 | 17,941 | 17,325 | 16,794 | |||||||||||||||
Number of registered cars | 14,577 | 14,198 | 13,632 | 13,024 | 12,483 | |||||||||||||||
Number of registered rental cars | 325 | 289 | 258 | 216 | 200 | |||||||||||||||
Growth rate of registered rental cars | 12.46 | % | 11.98 | % | 19.44 | % | 8.00 | % | 12.21 | % | ||||||||||
Rental cars to registered cars ratio | 2.23 | % | 2.03 | % | 1.89 | % | 1.66 | % | 1.60 | % | ||||||||||
| • | Source: Ministry of Land, Transport and Maritime Affairs / Korea Rent-A-Car Association |
| • | Lease and Corporate Loan (KT Capital) |
(a) Lease Items
| (Unit: KRW billion) | ||||||||||||
Items | 2011 | 2010 | 2009 | |||||||||
Industrial machinery | 2.294.5 | 1,663.4 | 896.0 | |||||||||
Transportation equipment | 6,524.7 | 6,338.8 | 4,876.4 | |||||||||
Medical devices | 890.3 | 836.8 | 508.0 | |||||||||
Pollution prevention equipment | 1.1 | 0.7 | 0.9 | |||||||||
Equipment for Science and Technology | 525.3 | 722.0 | 800.4 | |||||||||
Telecommunication Equipment | 122.1 | 163.1 | 191.0 | |||||||||
Industrial equipment for distribution | 36.8 | 10.0 | 5.3 | |||||||||
Other | 207.0 | 242.2 | 172.0 | |||||||||
|
|
|
|
|
| |||||||
Total | 10,601.8 | 9,977.0 | 7,450.0 | |||||||||
|
|
|
|
|
| |||||||
| • | Source: Credit Finance Association (2012 data unpublished) |
(b) Installment Finance
| (Units: KRW billion, thousand items) | ||||||||||||||||||||||||
| 2011 | 2010 | 2009 | ||||||||||||||||||||||
Items | Items | Amounts | Items | Amounts | Items | Amounts | ||||||||||||||||||
Durables | 619 | 9,391.6 | 623 | 9,322.6 | 427 | 6,247.2 | ||||||||||||||||||
Machinery | 12 | 619.0 | 13 | 690.3 | 9 | 389.3 | ||||||||||||||||||
Others | 3 | 89.6 | 3 | 62.3 | 1 | 25.8 | ||||||||||||||||||
|
|
|
|
|
|
|
|
|
|
|
| |||||||||||||
Total | 642 | 11,017.8 | 643 | 10,453.2 | 440 | 6,983.0 | ||||||||||||||||||
|
|
|
|
|
|
|
|
|
|
|
| |||||||||||||
| • | Source: Credit Finance Association (2012 data unpublished) |
10
Table of Contents
(3) Characteristics of Market Fluctuations and Seasonality
| • | Telecommunication (KT, KT Powertel) |
The demand for communications services does not fluctuate greatly with the economic conditions because such services are regarded as a necessity in modern life. However, if the Korean economy slows and per capita income declines, it could have an adverse impact on KT’s business activities.
| • | Credit Cards Business (BC card) |
The credit card industry is a typical domestic business which is highly affected by the private consumption trend and overall economic conditions.
| • | Satellite Broadcasting Service (KT Skylife) |
The paid-TV market is perceived as necessities rather than a luxury service. Unless there is a severe economic downturn, the customer churn rate is relatively stable. Moreover, the revenue from paid-TV service is based on monthly subscription fees, which are resilient to seasonality.
| • | Car Rental Business (KT Rental) |
Short-term rental market (less than one-year rental) generates more than 6% of revenue growth in summer due to a huge increase in demand for summer vacation compared to other seasons. Long-term rental market shows a temporary demand fluctuation in December and January due to personnel changes in corporate and fiscal year ending.
| • | Online contents creation and e-commerce (KT Hitel) |
Contents market has been less sensitive to seasonal factors than other businesses, with the dissemination of a variety of platforms and N-screen services. But normally, it is considered that the first and third quarters covering student vacations are typically peak seasons, whereas the second and fourth quarters covering student semester are considered low demand seasons. However, looking at the recent trend, the market is more affected by content line-ups rather than seasonal factors.
| • | Security and Guards (KT Telecop) |
The security business is less sensitive to economic fluctuations due to the conservative nature of the security business. But, the domestic economic slowdowns and price competition may dampen the growth outlook.
| • | Lease and Corporate Loan (KT Capital) |
Seasonality in credit finance industry is not clearly evident, but lease and installment payment markets are affected by the macro economy. Seasonality is also indistinctive for the new tech finance market.
11
Table of Contents
(4) Competition
| • | Telecommunication (KT, KT Powertel) |
 | KT |
(a) Competing Companies
| • | Local calls: SK Broadband, LG U+, etc. |
| • | Long distance calls: SK Broadband, SK Telink, LG U+, Onse Telecom, etc. |
| • | International calls: SK Broadband, SK Telink, LG U+, Onse Telecom, etc. |
| • | Broadband internet: SK Broadband, LG U+, Service Operators (cable television & relay wired broadcasting operators) |
| • | Mobile communications: SK Telecom, LG U+, etc. |
| • | Internet telephones (VoIP): SK Broadband, SK Networks, SK Telink, Samsung Networks, LG U+, etc. |
| • | IPTV: SK Broadband, LG U+ |
| • | Mobile internet (WiBro): SK Telecom |
(b) Market Entry Requirements
| • | Communication service providers: business operations must be approved by the Korea Communications Commission |
| • | Specific telecommunications service providers: registration is required |
| • | Value-added telecommunications service providers: reporting is required |
(c) Factors of Competition
| • | Service fees, product quality, marketing power, brand value and competitiveness of the distribution channel, etc. |
| KT Powertel |
KT Powertel aims to expand its market share by taking advantage of TRS’ (Trunked Radio System) uniqueness as an alternative service for mobile operators.
| • | Credit Cards Business (BC Card) |
(a) Competing Companies
| • | Samsung Card, Hyundai Card, Lotte Card, Shinhan Card, Kookmin Card and Hana-SK Card |
(b) Market Entry Requirements
| • | Not applicable |
(c) Factors of Competition
| • | Member sizes, the number of card transactions, member stores, and the number of issued cards |
12
Table of Contents
| • | Satellite Broadcasting Service (KT Skylife) |
(a) Competitors
The terrestrial broadcasting includes radio, television and terrestrial DMB. As of end-2012, there are 32 broadcasters in Korea – 3 terrestrial broadcasting companies which offer both television and radio channels (KBS, EBS and MBC) and 29 provincial broadcasters including 18 local MBC, SBS and OBS. There are 21 service providers offering only radio broadcasting, and 19 terrestrial DMB providers.
The paid-TV market is segmented by the operator base such as cable operators, satellite broadcasters and IPTV providers. Cable operators are again divided into cable TV operators and relay wired broadcasting operators. In 2012, the number of cable TV operators decreased from 94 to 93. The number of relay wired broadcasting operators also decreased by one to 96, declining from 638 relay wired broadcasting operators in 2001 due to M&A or closure of business.
There is currently one satellite service provider; KT Skylife (launched its service in March 2002). TU Media (launched its service in May 2005 and merged with SK Telink in November 2010) terminated its service on August 31, 2012.
The IPTV service was first commercialized in November 2008 after receiving a license in September 2008. Currently, there are three IPTV service providers – KT(olleh TV), SK Broadband(B TV) and LGU+ (LG U+ TV). The IPTV service is regulated by different regulations from those of cable TV business and satellite broadcasting business.
(b) Market Entry Requirements
Its regulation seems one of the entrance barriers in the paid-TV market. Not only that, paid-TV operators need to build economy of scales and to secure networks and contents sourcing.
(c) Factors of Competition
Main competing factors are channel availability, advertising and program production. Securing meaningful market share is also crucial for IPTV providers to be successful. Additionally, market share, vertical integration and regulatory environment are also other important aspects in the competitive dynamics.
| • | Car Rental Business (KT Rental) |
Car rental market is firmly positioned as a service industry since large companies have participated in this market from 2005. Currently, the market players are divided into two groups showing polarization. The first group is nationwide mid- to large-sized companies supported by the capital injection from large companies or consolidated through the M&A within mid-sized local companies. The second group is local small companies which operate on only local base. The first group’s market share has been on rising trend and the top 5 companies should further expand their market shares. KT Rental stands as the market leader in terms of the market share after the M&A with Kumho Rent Car. Going forward, KT Rental should solidify its market leadership by offering differentiated products and service enhancement.
13
Table of Contents
| • | Online contents creation and e-commerce (KT Hitel) |
Contents market is expected to grow continuously, receiving a spotlight as a high value-added business based on N-screen. Especially in the IP publication rights market, its competition seems to be heated with entries of numerous large companies. Nevertheless, KT Hitel has built a stable and diverse line-up portfolio with stable investments in publication rights every year. As a result, KT Hitel owns the most IP film rights in the country. Also, as the company owns numerous N-screen publication rights, KT Hitel should continue its leadership in the new platform markets such as the mobile platform.
| • | Security and Guards (KT Telecop) |
The safety market is currently dominated by three companies; KT Telecop, S1 and ADT Caps. KT Telecop has recently launched high tech services such as the video security services (Telecop-i, Smart CCTV, Smart Guard, Kids View, etc.) and the Building IT Convergence service. The entrance barriers in the security business include government regulations and the security licensing (machinery guard, facility guard, special guard and personnel protection). Also, other barriers are new comers should possess nationwide mobilization/control/AS service, brand value, distribution network and dispatch area, etc.
| • | Lease and Corporate Loan (KT Capital) |
According to the Credit Finance Act (Article 5-1), credit finance companies are required for mandated criteria such as a minimum capital amount (W20bn for up to two credit finance companies and W40bn for three and more), capital adequacy, prudent credit limit, liquidity and risk management. Nevertheless, entry barriers to credit finance industry are fairly low compared to other financial industries such as banking, insurance and credit card markets. However, except for auto loans, the current domestic credit loan market is not sizable enough and many small players are competing for a market share, resulting in very severe competitions.
14
Table of Contents
(5) Relevant Laws and Government Regulations
(a) Relevant Laws
| • | Telecommunications policy-related laws: Telecommunications Basic Act, Telecommunications Business Act (total 7) |
| • | Radio and broadcasting policy-related laws: Radio Regulation Law |
| • | Information related laws: Promotion of Information and Communication Basic Act (total 9) |
| • | Broadcast related laws: Broadcasting Law, internet Multimedia Broadcasting Business Law (IPTV related), etc. |
(b) Government Regulations
The Korea Communications Commission is responsible for managing the convergence between broadcasting and communications, as well as assuring their independence and role of providing public services. The commission is also responsible for issuing relevant licenses, permits, approvals, policy enactments and other matters relating to the promotion of broadcasting and communications and the enhancement of their global competitiveness.
The statements included in the above sections are based on KT’s forecasts and are offered for the sole purpose of providing a better understanding of the company’s current state. Consequently, investors must not rely solely on KT’s forecasts when making their investment decisions.
15
Table of Contents
B. Current Status of the Company
(1) Market Characteristics and Classification of Businesses
(a) Market Characteristics
| • | Telecommunication (KT, KT Powertel) |
The Korean communications market is currently experiencing stagnant growth as major services, including fixed-line telephony, broadband internet and mobile communications, have reached maturity, caused in part by intense competition in the industry. KT is also facing a difficult business environment with fixed-mobile substitution, emergence of internet telephone (VoIP) and price competition. Despite of the unfavorable environment, KT has made continuous efforts for cost-cutting and innovation of customer values. In order to communicate with customers efficiently, KT introduced its new brand name “olleh”. As a result, KT has maintained 8,037 thousands of broadband subscribers, 15,121 thousands of PSTN subscribers and 16,502 thousands of mobile subscribes as of end-2012.
Considering the highly saturated mobile phone market in Korea (107.2% penetration with 5,362 thousands subscribers as of end-2012), growth potential by adding new subscribers or raising voice service plans are limited. In such an environment, however, the mobile data business is considered as the only growth engine.
At the end of 2009, KT had not only successfully switched the paradigm of competition from voice- to data-centered services by introducing Apple’s iPhone to the Korea market but also enhanced its competitiveness by introducing emerging devices including iphone4 and ipads. KT is leading the market in terms of smartphone penetration in Korea with 10.26 million (62% of KT’s mobile subscribers) of smartphone subscribers including 3.9 million LTE users as of end-2012. In order to promote the data usage, KT increased data traffics of mobile subscribers and, by utilizing its 3W (WCDMA, WiFi, WiBro) networks to build “Mobile Woderland”, KT is making its best efforts to differentiate its network quality.
Although KT was late in launching LTE service against its peers, it had completed 84-cities nationwide deployment within four-month span in April 2012. With speedy construction of LTE networks and adoption of advanced LTE WARP technology, KT plans to offer the best service quality to customers. With its LTE WARP technology, KT received the Award of Best Network Operator at LTE World Summit held in May 2012. In August 2012, KT introduced LTE data carryover pricing plan and enhanced its competitiveness. In the contents area, KT is trying to increase usage of smartphones by offering ‘Genie’, 58 live broadcasting channels and ‘olleh tv now’ (25,000 VODs).
In the PSTN business, KT owns 82.8% of market share as of end-2012 with its high brand value and loyalty of customers. However, the market share has been continuously declined with intensified market competition. Competitors introduced fixed-mobile bundle services and focus on PSTN marketing with competitive price plans. PSTN revenue should continue to decline because of the fixed-mobile and voice-data substitution trends. Nevertheless, KT has been trying to mitigate its revenue decline through various price plans and valuable customer services with the CRM system.
16
Table of Contents
In the broadband internet arena, KT will aim to improve its customer value and marketing power by continually providing Fiber-To-The-Home (FTTH) services.
In order to maximize the fixed-mobile synergy, KT has introduced diverse bundling plans such as ‘olleh Toong’, ‘Unlimited plan for family’, ‘Family sponsor’, and ‘olleh together’. KT also launched ‘ucloud’ service and ‘olleh KT club’ which is a customer loyalty program for both fixed and mobile subscribers.
| • | Credit Cards Business (BC Card) |
BC Card’s main businesses include the recruit of credit card merchants, processing transaction of credit card payments, and credit card issuing as a surrogate for credit finance corporations under Specialized Credit Financial Business Act. In addition, BC Card is providing services to card holders such as money transfer, insurance, telecommunication sales and travel business.
| • | Satellite Broadcasting (KT Skylife) |
KT Skylife is leading the market with its competitive edge in HD channels and the hybrid service with KT’s IPTV. Moreover, its strong stance in the distribution led the subscribers to increase over 3.8 million. As a result, in 2012, subscriber gross additions were 864 thousand leading to 3.79 million total subscribers, meaning net additions of 529 thousand in the year.
| • | Car Rental Business (KT Rental) |
Car rental market is categorized into the short-term rental (less than one year) and the long-term rental (more than one year). The rental fee of short-term rental is relatively high compared to the original cost so that its payback period is short. However, if its turnover is low due to weak sales marketing, there is a risk that the return rate may deteriorate. For the long-term rental, it guarantees a stable return during average 3 years of rental period. However, during the contact period, if the client breaches the contract or defaults the fee, there may be a negative impact to the company’s profitability.
| • | Online contents creation and e-commerce (KT Hitel) |
In the middle of highly competitive mobile market, its mobile services maintain a leading position in the market. Especially, users of Pudding series of which includes ‘Pudding face recognition’, ‘Pudding Camera’ and ‘Pudding .to’ have increased in the overseas as well as in the domestic. And, Pudding series has exceeded 30 mil downloads as of end-June (48% of ‘Pudding camera’ and 40% of ‘Pudding. to’ are overseas users).
| • | Security and Guards (KT Telecop) |
So far, security companies have focused on price competition in an attempt to increase market share. In the future, it is expected that quality centric competition, rather than price driven competition, will intensify. We anticipate the launch of numerous new products and various additional services. Moreover, competition for skilled personnel to strengthen sales force seems likely to increase. KT Telecop provides personnel guard, CCTV and access control through machinery security as an individual base or an integrated system. It also provides BMS service in connection with customer’s ERP system. Based on these services KT Telecop is pursuing differentiated strategies by expanding into video security, in-building and FM businesses.
17
Table of Contents
| • | Lease and Corporate Loan (KT Capital) |
KT Capital has been offering various machinery leases and new tech financing services. Installment finance was mainly involving automobiles but KT Capital has recently expanded its business to include installment financing for construction machinery as well. As for the synergy project with KT, based on its assets, KT Capital is in a broad range of businesses in various sectors such as investments for new technology. Also, it is expanding into credit financing businesses including financial lease and IT venture investment.
(b) Operations Subject to Disclosure
KT’s main area of business is the telecommunications sector as classified by the Korea Standard Industry Code.
18
Table of Contents
(2) Market Share
| • | Telecommunication (KT, KT Powertel) |
Category | Operator | Market Share (%) | ||||||||||||
| 2012 | 2011 | 2010 | ||||||||||||
Local Telephone (Number of Subscribers) | KT | 82.8 | 84.3 | 85.7 | ||||||||||
| SK Broadband | 14.5 | 13.3 | 12.2 | |||||||||||
| LG U+ | 2.7 | 2.4 | 2.1 | |||||||||||
Mobile Telephone (Number of Subscribers) | KT | 30.8 | 31.5 | 31.6 | ||||||||||
| SK Telecom | 50.3 | 50.6 | 50.6 | |||||||||||
| LG U+ | 18.9 | 17.9 | 17.8 | |||||||||||
Broadband internet (Number of Subscribers) | KT | 44.0 | 43.8 | 43.1 | ||||||||||
| SK Broadband | 24.1 | 23.5 | 23.1 | |||||||||||
| LG U+ | 15.0 | 15.7 | 16.1 | |||||||||||
| Service Operators | 16.9 | 17.0 | 17.7 | |||||||||||
TRS (Number of Subscribers) | KT Powertel | 97.5 | 96.4 | 96.0 | ||||||||||
| Regional operators | 2.5 | 3.6 | 4.0 | |||||||||||
| • | The above data were provided by the Korea Communications Commission (www.kcc.go.kr). |
| • | Broadband internet market share of SK Broadband includes SK Telecom’s resale subscribers. |
| • | TRS regional operators include T-on Telecom, Powertel TRS and Daesung Global Networks. |
| • | Credit Cards Business (BC Card) |
Category | 2012 | 2011 | 2010 | |||||||||
Card transaction M/S | 25.0 | % | 26.2 | % | 29.4 | % | ||||||
| • | Source: BC Card’s internal data |
| • | Car Rental Business (KT Rental) |
Major car rental companies and market share status
| (Unit: each) | ||||||||||||||||||||||||
Companies | End-2012 | End-2011 | End-2010 | |||||||||||||||||||||
| Number of Cars | M/S | Number of Cars | M/S | Number of Cars | M/S | |||||||||||||||||||
KT Rental | 72,861 | 22.40 | % | 61,191 | 21.20 | % | 58,877 | 22.84 | % | |||||||||||||||
AJ Rent-A-Car | 46,741 | 14.37 | % | 40,767 | 14.10 | % | 38,126 | 14.79 | % | |||||||||||||||
Hyundai Capital | 32,024 | 9.84 | % | 28,747 | 10.00 | % | 23,958 | 9.30 | % | |||||||||||||||
Dongbu Express | 5,706 | 1.75 | % | 7,498 | 2.60 | % | 7,967 | 3.09 | % | |||||||||||||||
Red Cap Tour | 11,322 | 3.48 | % | 10,981 | 3.80 | % | 9,143 | 3.55 | % | |||||||||||||||
Others | 156,680 | 48.16 | % | 139,450 | 48.30 | % | 119,680 | 46.43 | % | |||||||||||||||
|
|
|
|
|
|
|
|
|
|
|
| |||||||||||||
Total | 325,334 | 100.00 | % | 288,634 | 100.00 | % | 257,751 | 100.00 | % | |||||||||||||||
|
|
|
|
|
|
|
|
|
|
|
| |||||||||||||
| • | Source: Korea Rent-A-Car Association |
19
Table of Contents
| • | Satellite Broadcasting (KT Skylife) |
Paid-TV market share (December 31, 2012)
Companies | Digital Market | Analog Market | Total Paid TV | |||||||||||||||||||||
| Subscriber | M/S | Subscriber | M/S | Subscriber | M/S | |||||||||||||||||||
- T-broad | 1,020,154 | 6.56 | % | 2,119,177 | 21.83 | % | 3,139,331 | 12.42 | % | |||||||||||||||
- CJ Hello Vision | 1,485,689 | 9.55 | % | 2,020,524 | 20.81 | % | 3,506,213 | 13.88 | % | |||||||||||||||
- CNM | 1,441,618 | 9.26 | % | 1,015,829 | 10.46 | % | 2,457,447 | 9.72 | % | |||||||||||||||
- CMB | 79,060 | 0.51 | % | 1,269,548 | 13.08 | % | 1,348,608 | 5.34 | % | |||||||||||||||
- Hyundai HCN | 547,874 | 3.52 | % | 756,370 | 7.79 | % | 1,304,244 | 5.16 | % | |||||||||||||||
|
|
|
|
|
|
|
|
|
|
|
| |||||||||||||
Total MSO | 4,574,395 | 29.40 | % | 7,181,448 | 73.97 | % | 11,755,843 | 46.52 | % | |||||||||||||||
|
|
|
|
|
|
|
|
|
|
|
| |||||||||||||
Minor SO Total | 621,832 | 4.00 | % | 2,527,342 | 26.03 | % | 3,149,174 | 12.46 | % | |||||||||||||||
|
|
|
|
|
|
|
|
|
|
|
| |||||||||||||
SO Total | 5,196,227 | 33.39 | % | 9,708,790 | 100.00 | % | 14,905,017 | 58.98 | % | |||||||||||||||
|
|
|
|
|
|
|
|
|
|
|
| |||||||||||||
Satellite broadcasting | 3,790,820 | 24.36 | % | 3,790,820 | 15.00 | % | ||||||||||||||||||
|
|
|
|
|
|
|
|
|
|
|
| |||||||||||||
IPTV Total | 6,573,915 | 42.25 | % | 6,573,915 | 26.01 | % | ||||||||||||||||||
|
|
|
|
|
|
|
|
|
|
|
| |||||||||||||
KT | 4,030,287 | 25.90 | % | 4,030,287 | 15.95 | % | ||||||||||||||||||
SK | 1,489,200 | 9.57 | % | 1,489,200 | 5.89 | % | ||||||||||||||||||
LG U+ | 1,054,428 | 6.78 | % | 1,054,428 | 4.17 | % | ||||||||||||||||||
|
|
|
|
|
|
|
|
|
|
|
| |||||||||||||
Total | 15,560,962 | 100.00 | % | 9,708,790 | 100.00 | % | 25,269,752 | 100.00 | % | |||||||||||||||
|
|
|
|
|
|
|
|
|
|
|
| |||||||||||||
 Skylife and KT subscribers: double-counted for bundled service (OTS) subscribers – 1.77 million as of December 2012
| • | Sources: Cable – KCTA, Satellite broadcasting – Subscriber data submitted to KCC, IPTV – Company IR data |
| • | Online contents creation and e-commerce (KT Hitel) |
As we terminated our portal service (www.paran.com), we no longer aggregate market share.
| • | Security and Guards (KT Telecop) |
Category | Company | Market Share (%) | ||||||||||||
| 2012 | 2011 | 2010 | ||||||||||||
Revenue | KT Telecop | 16.95 | % | 16.06 | % | 15.12 | % | |||||||
| S1 | 57.61 | % | 58.61 | % | 58.89 | % | ||||||||
| ADT caps | 25.44 | % | 25.33 | % | 25.98 | % | ||||||||
| • | Source: Financial Supervisory Service, Electronics Disclosure System (dart.fss.or.kr) |
| • | Lease and Corporate Loan (KT Capital) |
Market share information may be misleading as there are numerous players such as banks, securities firms and credit finance firms in the lease and corporate loan markets.
20
Table of Contents
(3) Status and Forecast of New Businesses
| • | Telecommunication (KT, KT Powertel) |
In order to overcome present market obstacles of limited growth in the voice service market and the sluggish growth in the broadband internet service market, KT has been actively involved in developing a wide range of new businesses with growth prospects.
KT aims to create a digital entertainment world that will enrich its customers’ lives through a ubiquitous environment, which can be accessed through various terminals regardless time and place. Furthermore, KT aims to offer customers convenient solutions that people may freely use without time or location limitations, and business solutions necessary to raise corporate efficiency and competitiveness. By excelling in these new business areas, KT strives to become a company that aids its clients in achieving their goals and enhancing their values.
Since introducing KT’s VoIP in 1H 2008, KT has been expanding its VoIP subscribers. As a result of continuous efforts to add new subscribers, KT reached 3.34 million VoIP subscribers as of December 31, 2012. Unlike other operators which have positioned VoIP as a substitute for PSTN, KT has tried to appeal its VoIP as both substitute and complement service for PSTN. On the back of these efforts, KT has maintained relatively stable PSTN subscriber base and minimized its revenue loss. At the same time, KT has been expanding its future revenue sources with IP based services.
KT also introduced ‘Home hub phone’ which is integrated terminal combining PSTN, VoIP and AP in October 2010. Furthermore, KT introduced ‘smart home pad’ for housewives and ‘Kibot’ for kids’ edutainment (education + entertainment). By releasing those new smart devices, KT is trying to expand its smart home customer base through providing value-added content services through VoIP. KT plans to solidify its customer base through the creation of a new market by offering convergent terminals with value-added services and integrated applications. Additionally, in January 2013, in order to transform conventional PSTN and VoIP oriented telephony customers into SoIP subscribers, KT launched smart-home phone HD which converged smart-home contents service and HD voice/data communication function with WiFi-only smartphones. This should strengthen retention of high-ARPU users and guide to addition of new subscribers in the All-IP business arena.
4G WiBro, which stands for Wireless Broadband, enables portable devices accessing broadband internet services, allowing universal internet access with high transmission speeds through personal handsets or laptop computers. 4G WiBro was first commercialized in the world using Korea’s own technology, and KT successfully provided its commercial 4G WiBro services in limited areas in 2006. Since April 2007, KT started to provide 4G WiBro services in the Seoul metropolitan area, including various major buildings and university campuses. In October 2008, the 4G WiBro service coverage was further expanded to 19 neighboring cities and its service speed became twice faster. Furthermore, in March 2011, KT expanded its 4G WiBro service coverage to 82 cities nationwide and major highways, offering the world’s first nationwide data-only network service.
21
Table of Contents
4G WiBro is the first commercialized 4th generation wireless broadband internet technology in Korea. Its download speed is maximum 40.3Mbps which is about 3 times faster than those of HSDPA/HSUPA 3G networks. KT’s nationwide 4G WiBro coverage is about 88% in the population base, which is significantly higher than those in major developed countries such as USA (36%) and Japan (70%). Currently, anyone may enjoy KT’s 4G WiBro service with personal computers, WiBro-compatible laptop computers, WiBro phones (WCDMA mobile phones with WiBro service), portable media players, navigation devices or Dongle (a USB device connecting to any laptop computer). In addition, “Egg”, which is a portable access point (AP) device launched at the beginning of 2009, enables customers to enjoy the WiBro service with various Wi-Fi embedded devices. KT will continuously expand its array of digital devices that are compatible with WiBro services. With explosively increasing data traffics, KT’s 3W network strategy is essential for success and the value of 4G WiBro will become even more important.
KT’s IPTV, “olleh TV”, is a service that integrates telecommunications and broadcasting services, brought about by accelerated development of high speed broadband internet and fast conversion of contents into multimedia. Also, olleh TV service provides traditional internet services, such as information searches, games, message functions, and shopping, and VOD services, which allow users to watch a variety of contents, such as movies, dramas and educational programs. From 2H 2007 to October of 2008, only non-real time VOD services and interactive services were provided due to regulatory restrictions. However, after the enactment of the Korean internet Multimedia Broadcasting Business Law by the National Assembly in December 2007 and after granting of the IPTV business license to KT on September 8, 2008, KT has been able to provide real-time broadcasting IPTV services starting November 17, 2008. KT provides 170 IPTV channels (in addition to 30 audio channels), about 139,000 VOD programs and 135 two-way services as of December 31, 2012. In February 2010, KT introduced the world’s first Open IPTV, in which KT has broadcasted channels and VODs produced by its subscribers. Further, KT launched ‘olleh TV now’ in April, 2011 for subscribers to watch IPTV’s contents with various devices such as smartphones and pads. And, as of end-2012, its app downloads surpassed 6.07 million.
In the corporate customer market, KT plans to expand its market not only limited to the domestic but also to overseas by fostering Global/ICT/Convergence businesses and developing IT solutions such as Mobile Office and Cloud Computing.
After launching in 2010, KT is leading the Cloud Service market with Multi-Data Center and abundant Cloud conversion know-how. In case of u-cloud personals, with 2.6 million subscriber base, 60 corporate commenced service commercialization of u-cloud personals API. Through introductions of VPC, Cloud NAS, Cloud HPC and other value-added services, KT aims to enhance and to diversify its product lines.
| • | Credit Cards Business (BC Card) |
BC Card is expanding its business into new areas such as standardization and commercialization of the next-generation mobile cards, C-POS (Cloud POS) business and payment processing in traditional markets. In addition, it expects to increase profits by innovating the payment processing.
22
Table of Contents
| • | Satellite Broadcasting (KT Skylife) |
In order to have a competitive edge in picture quality, which is the most important differentiating factor in real-time broadcasting service, KT Skylife is preparing the next technology UHD service so called 4K and 8K. Making the best use of nationwide and broad range coverage of satellite, KT Skylife expects to extend its leadership in the HD market into the UHD market. Also, KT Skylife plans to offer various VOD services and information for personalized broadcasting service so that subscribers can enjoy their services efficiently and conveniently. With internet-access enabled receivers, personalized interactive services such as two-way T-Commerce, social commerce and e-album will be offered. KT Skylife is developing and plans to offer interconnected services for web-mobile-TV which will enable subscribers to watch internet streaming videos on TV and through mobile App. Also, KT Skylife is preparing to commercialize solutions for customers under various conditions, such as DCS, MDU, overlay etc. This will improve stability of service quality without any interference from external conditions.
| • | Car Rental Business (KT Rental) |
KT Rental will foster the business area where it can create synergies between the car rental service and the equipment rental service by utilizing its 20-year expertise and core competency. Currently, KT Rental is considering various car related businesses, especially focusing on new business areas to generate group synergies between KT’s telecom business and its rental business. New business items and their release timings are carefully reviewed considering internal and external market situations and customers’ needs. KT rental envisions becoming a total rental company by launching various new business products and by entering to the new markets. KT rental plans to make its best efforts to improve its corporate value while meeting customer satisfaction through new business launches.
| • | Online contents creation and e-commerce (KT Hitel) |
Our company is focusing on achieving successful business models of previously released mobile services such as the domestic LBS based service ‘I’m IN’, ‘I’m real restaurant’ and ‘114 nationwide telephone’, and global success of ‘Pudding series’. In addition, the company aims to expand revenue generation of existing businesses while contributing to the competitiveness of kt group’s media contents platform.
| • | Security and Guards (KT Telecop) |
KT Telecop has reduced the price burden on small retailers and homeowners by launching economical ‘Smart CCTV’ and ‘Smart Guard’. And also, it provides secured and convenient services with features such as video surveillance via mobile phones and PCs, automatic light detected systems and remote video monitoring. In addition, KT Telecop launched ‘Kids View’ to provide nurseries with a specialized video surveillance service. In the future, the market is expected to grow into the integrated security areas including personnel guards, SI and BMS. And, eventually, it is expected to penetrate into the total safety management industry by blending with neighboring industries.
23
Table of Contents
| • | Lease and Corporate Loan (KT Capital) |
KT Capital had secured its stable growth basis by achieving Won 2 trillion of total asset size in 2010, and focused on maintaining financial stability in 2011. With this asset, in 2012, KT Capital has enhanced its business spectrum by focusing on the risk management and upgrading the customer management system. KT Capital will differentiate its business from competitors by specializing in the machinery lease services and investments in the new technology.
The statements included in the above sections are based on KT’s forecasts and are offered for the sole purpose of providing a better understanding of the company’s current state. Consequently, investors must not rely solely on KT’s forecasts when making their investment decisions.
24
Table of Contents
A. Status of Main Products
| • | Telecommunication (KT, KT Powertel) |
| KT |
| (Unit: KRW million) | ||||
Business category | 2012 | |||
Service revenue | 14,560,667 (77.2 | %) | ||
Merchandise sales(*) | 4,302,570 (22.8 | %) | ||
|
| |||
Total | 18,863,237 (100.0 | %) | ||
|
| |||
| • | 2012 results are calculated based on K-IFRS (KT stand alone). |
| • | * Progressive revenue from real estate development is included. |
| KT Powertel |
| (Unit: KRW million) | |||||||||
Business | Revenue type | Category | Brand | 2012 | ||||||
Telecommunication | Service | TRS | TRS | 111,953 (89.6 | %) | |||||
Distribution of Mobile Handset | Merchandise | Mobile handset | Double V | 12,982 (10.4 | %) | |||||
|
| |||||||||
Total | 124,935 (100.0 | %) | ||||||||
|
| |||||||||
| • | Results are based on K-IFRS |
| • | Credit Cards Business (BC Card) |
| (Unit: KRW billion) | ||||
Category | 2012 | |||
Card revenue | 230.3 (7.4 | %) | ||
Credit card processing | 2,662.6 (85.6 | %) | ||
Additional Service | 140.8 (4.5 | %) | ||
Others | 78.0 (2.5 | %) | ||
|
| |||
Total | 3,111.7 (100.0 | %) | ||
|
| |||
| • | Results are based on K-IFRS |
| • | Satellite Broadcasting (KT Skylife) |
| (Unit: KRW million) | ||||||||||||
Business | Revenue | Items | 2012 | 2011 | ||||||||
Satellite Broadcasting | Service | Domestic | 551,270 | 464,376 | ||||||||
| Overseas | — | — | ||||||||||
|
|
|
| |||||||||
Total | Total | 551,270 | 423,958 | |||||||||
|
|
|
| |||||||||
| • | Results are based on K-IFRS |
25
Table of Contents
| • | Car Rental Business (KT Rental) |
| (Unit: KRW million) | ||||||||||
| 2012 | ||||||||||
Business | Revenue | Ratio | ||||||||
Domestic | Car rental | 456,396 | 63.7 | % | ||||||
| Used car | 163,724 | 22.9 | % | |||||||
| Equipment rental | 60,660 | 8.5 | % | |||||||
| Auto lease | 35,427 | 4.9 | % | |||||||
|
|
|
| |||||||
| Total | 716,207 | 100.0 | % | |||||||
|
|
|
| |||||||
| • | Results are based on K-IFRS. |
| • | Online contents creation and e-commerce (KT Hitel) |
| (Unit: KRW million) | ||||||||||||||||
| 2012 | ||||||||||||||||
Division | Revenue type | Item | Specific Purpose | Service | Revenue | Ratio | ||||||||||
Internet based service | Internet Service | Search Ads, Display Ads, etc. | Internet, Smartphone | I’m In, Pudding, Paran.com | 9,127 | 2.0 | % | |||||||||
| Contents | Video, Game, etc. | Internet, IPTV, Smartphone | PLAYY | 53,003 | 11.6 | % | ||||||||||
| Platform build/operation | Olleh.com, Ringo, GIS, Cloud, etc. | Internet, IPTV, Smartphone | Olleh Map, uCloud | 64,809 | 14.2 | % | ||||||||||
|
|
|
| |||||||||||||
Total | 126,939 | 100.0 | % | |||||||||||||
|
|
|
| |||||||||||||
| • | Adopting IFRS from FY2011, results of FY2010 are recalculated from K-GAAP into IFRS. |
| • | Security and Guards (KT Telecop) |
| (Unit: KRW million) | ||||
Category | 2012 | |||
Security service revenue | 295,814 (99.9 | %) | ||
Other revenue | 366 (0.1 | %) | ||
|
| |||
Total | 296,180 (100.0 | %) | ||
|
| |||
| • | Adopting IFRS from FY2011, results of FY2010 are recalculated from K-GAAP into IFRS. |
| • | Lease and Corporate Loan (KT Capital) |
| (Unit: KRW million) | ||||||||
Services | 2012 | 2011 | ||||||
Installment | 7,079 | 6,321 | ||||||
Lease | 75,785 | 73,870 | ||||||
Loan | 88,874 | 107,080 | ||||||
New Tech Finance | 8,723 | 6,388 | ||||||
Others | 97,322 | 29,236 | ||||||
|
|
|
| |||||
Total | 277,783 | 222,895 | ||||||
|
|
|
| |||||
| • | Results are based on K-IFRS |
26
Table of Contents
B. Price Trend of Main Products
| • | Telecommunication (KT Powertel) |
When based on the general plan, the basic monthly fee is Won 17,000. And, there are additional fees of Won 12 per 10 seconds on individual radio calls, Won 22 on group calls, and Won 17 on mobile voice calls.
| • | Credit Cards Business (BC Card) |
| (Unit: %) | ||||||||
Category | 2012 | 2011 | 2010 | |||||
Member Store fee rate | 1.50 ~ 2.70 | 1.50 ~ 4.50 | 1.50 ~ 4.50 | |||||
Installment fee rate | 11.00 ~ 18.50 | 11.00 ~ 18.50 | 11.00 ~18.50 | |||||
Cash service interest rate | 15.00 ~ 25.92 | 15.00 ~ 25.92 | 15.00 ~ 25.92 | |||||
Card loan(credit loan) | — | — | 11.50 ~ 18.00 | |||||
| • | Security and Guards (KT Telecop) |
2012 | 2011 | 2010 | ||
<March, 2012>
• Entered health care industry
Selling ‘AED’ medical equipment that gives a shock to the heart of emergency patients who fallen with heart attack
<June, 2012>
• Olleh Smart Guard launched
Personal security service, combining communications & Security, which provides guardian situation notification with SOS request and location-based dispatch services
<November, 2012>
• Olleh CCTV telecop launched
Smart video security service that records with HD camera and store video in the cloud, so make it possible to check the video conveniently through mobile phones | <April, 2011>
• Smart Guard launched
Customized security service for HOME/SOHO customers, which minimized damage to interior through IP based video equipment and security machinery equipment and also high tech video security service which makes it possible to check the images of premises with PC or mobile phone through IP cameras.
<October, 2011>
• Telecop i Self launched Service that leases CCTV equipment to customers who only require video surveillance with which the customer can check real-time images of their business place through their PC or mobile phone.
• Home security service launched
Convergence service based on smart home pad that provides self-assured services and roadside assistance, targeted at one person households and middle aged housewives.
<December, 2011>
• Inavi safe launched Service that tracks the location of LBS based handset user and dispatch service in emergency situations | <November, 2010>
• Smart CCTV launched
Video security service that provides surveillance/recording during normal and sends warning texts to the designated mobile phone in the event of strange signals during the owners absence.
<December, 2010>
• Kids View launched
Reassuring image service specially designed for nurseries. It monitors the activities of children for parents who are members. | ||
27
Table of Contents
| • | Car Rental Business (KT Rental) |
Price frequently changes depending on economic condition and market competition.
| • | Online contents creation and e-commerce (KT Hitel) |
The company provides a variety of services such as advertising, game, music, video, etc. in the area of the portal sites and contents. It is not possible to calculate the price per item for all these services.
| • | Lease and Corporate Loan (KT Capital) |
Credit finance service pricing trend is not available due to the characteristics of such business.
28
Table of Contents
| • | Satellite Broadcasting (KT Skylife) |
| (Unit: Won) | ||||||||||||||||||||||||||||||||||||||||||||||||||||||
Services | 2012 | 2011 | 2010 | |||||||||||||||||||||||||||||||||||||||||||||||||||
| 1Q | 2Q | 3Q | 4Q | 1Q | 2Q | 3Q | 4Q | 1Q | 2Q | 3Q | 4Q | |||||||||||||||||||||||||||||||||||||||||||
| Skylife | HD Platinum (Plus) | 3yrs | Subscription | 33,000 | 33,000 | 33,000 | 33,000 | 33,000 | 33,000 | 33,000 | 33,000 | 30,000 | 30,000 | 33,000 | 33,000 | |||||||||||||||||||||||||||||||||||||||
| Install fee | — | — | — | — | — | — | — | — | — | — | — | — | ||||||||||||||||||||||||||||||||||||||||||
| 5yrs | Subscription | 30,000 | 30,000 | 30,000 | 30,000 | 30,000 | 30,000 | 30,000 | 30,000 | 28,000 | 28,000 | 30,000 | 30,000 | |||||||||||||||||||||||||||||||||||||||||
| Install fee | — | — | — | — | — | — | — | — | — | — | — | — | ||||||||||||||||||||||||||||||||||||||||||
HD Blue | 3yrs | Subscription | 16,000 | 16,000 | 16,000 | 16,000 | 18,000 | 18,000 | 18,000 | 18,000 | 18,000 | 18,000 | 18,000 | 18,000 | ||||||||||||||||||||||||||||||||||||||||
| Install fee | — | — | — | — | — | — | — | — | — | — | — | — | ||||||||||||||||||||||||||||||||||||||||||
| 5yrs | Subscription | 15,000 | 15,000 | 15,000 | 15,000 | 16,000 | 16,000 | 16,000 | 16,000 | 16,000 | 16,000 | 16,000 | 16,000 | |||||||||||||||||||||||||||||||||||||||||
| Install fee | — | — | — | — | — | — | — | — | — | — | — | — | ||||||||||||||||||||||||||||||||||||||||||
HD Green | 3yrs | Subscription | 12,000 | 12,000 | 12,000 | 12,000 | 13,000 | 13,000 | 13,000 | 13,000 | 13,000 | 13,000 | 13,000 | 13,000 | ||||||||||||||||||||||||||||||||||||||||
| Install fee | 10,000 | 10,000 | 10,000 | 10,000 | 30,000 | — | — | — | 30,000 | 30,000 | 30,000 | 30,000 | ||||||||||||||||||||||||||||||||||||||||||
| 5yrs | Subscription | 12,000 | 12,000 | 12,000 | 12,000 | 12,000 | 12,000 | 12,000 | 12,000 | 12,000 | 12,000 | 12,000 | 12,000 | |||||||||||||||||||||||||||||||||||||||||
| Install fee | — | — | — | — | 30,000 | — | — | — | 30,000 | 30,000 | 30,000 | 30,000 | ||||||||||||||||||||||||||||||||||||||||||
HD On | 3yrs | Subscription | 9,000 | 9,000 | 9,000 | 9,000 | 9,000 | 10,000 | 11,000 | 11,000 | N.C | N.C | N.C | N.C | ||||||||||||||||||||||||||||||||||||||||
| Install fee | 20,000 | 20,000 | 20,000 | 20,000 | 30,000 | 30,000 | 30,000 | 30,000 | ||||||||||||||||||||||||||||||||||||||||||||||
| 5yrs | Subscription | 8,000 | 8,000 | 8,000 | 8,000 | 8,000 | 9,000 | 10,000 | 10,000 | N.C | N.C | N.C | N.C | |||||||||||||||||||||||||||||||||||||||||
| Install fee | 10,000 | 10,000 | 10,000 | 10,000 | 30,000 | 30,000 | 30,000 | 30,000 | ||||||||||||||||||||||||||||||||||||||||||||||
OTS (Flat rate service launched in 2Q10 | Economy | 3yrs | Subscription | 12,000 | 12,000 | 12,000 | 12,000 | 12,000 | 12,000 | 12,000 | 12,000 | 14,400 | 12,000 | 12,000 | 12,000 | |||||||||||||||||||||||||||||||||||||||
| Install fee | — | — | — | — | — | — | — | — | — | — | — | — | ||||||||||||||||||||||||||||||||||||||||||
| Standard | 3yrs | Subscription | 15,000 | 15,000 | 15,000 | 15,000 | 15,000 | 15,000 | 15,000 | 15,000 | 18,000 | 15,000 | 15,000 | 15,000 | ||||||||||||||||||||||||||||||||||||||||
| Install fee | — | — | — | — | — | — | — | — | — | — | — | — | ||||||||||||||||||||||||||||||||||||||||||
| Premium | 3yrs | Subscription | 20,000 | 20,000 | 20,000 | 20,000 | 20,000 | 20,000 | 20,000 | 20,000 | 21,600 | 20,000 | 20,000 | 20,000 | ||||||||||||||||||||||||||||||||||||||||
| Install fee | — | — | — | — | — | — | — | — | — | — | — | — | ||||||||||||||||||||||||||||||||||||||||||
| • | *N.C : No contract sales |
29
Table of Contents
A. Performance in Terms of Revenue
| • | Telecommunication (KT, KT Powertel) |
| KT |
| (Unit: KRW million) | ||||||||||||
Business category | 2012 | 2011 | 2010 | |||||||||
Service revenue | 14,560,667 | 15,122,455 | 15,632,767 | |||||||||
Merchandise sales(*) | 4,302,570 | 4,201,178 | 4,285,611 | |||||||||
|
|
|
|
|
| |||||||
Total | 18,863,237 | 19,323,633 | 19,918,378 | |||||||||
|
|
|
|
|
| |||||||
| • | Adapting K-IFRS in FY2011 and FY2012, result of FY2010 is recalculated from K-GAAP into K-IFRS (KT stand alone). |
| • | FY2011 and FY2012 figures are calculated after reflecting K-IFRS Article 1001 “Financial statements report” amendment. |
| • | * Progressive revenue from real estate development is included. |
| KT Powertel |
| (Unit: KRW million) | ||||||||||||||||||
Business Unit | Revenue Type | Category | 2012 | 2011 | 2010 | |||||||||||||
Telecommunication | Service | Frequency Trunked Communications | Export | 276 | 245 | 302 | ||||||||||||
| Domestic | 111,678 | 113,629 | 110,877 | |||||||||||||||
|
|
|
|
|
| |||||||||||||
| Total | 111,954 | 113,874 | 111,179 | |||||||||||||||
|
|
|
|
|
| |||||||||||||
| Merchandise | Mobile Handsets | Export | 0 | 0 | 0 | |||||||||||||
| Domestic | 12,982 | 12,885 | 16,036 | |||||||||||||||
|
|
|
|
|
| |||||||||||||
| Total | 12,982 | 12,885 | 16,036 | |||||||||||||||
|
|
|
|
|
| |||||||||||||
Total | Export | 276 | 245 | 302 | ||||||||||||||
| Domestic | 124,660 | 126,514 | 126,912 | |||||||||||||||
|
|
|
|
|
| |||||||||||||
| Total | 124,936 | 126,759 | 127,214 | |||||||||||||||
|
|
|
|
|
| |||||||||||||
| • | Adopting K-IFRS from FY2011, result of 2010 is recalculated from K-GAAP into K-IFRS |
| • | Credit Cards Business (BC Card) |
| (Unit: KRW billion) | ||||||||||||
Category | 2012 | 2011 | 2010 | |||||||||
| Card revenue | 230.3 | 223.6 | 223.2 | |||||||||
| Credit card processing | 2,662.6 | 2,725.6 | 2,687.8 | |||||||||
| Additional Service | 140.8 | 121.2 | 99.0 | |||||||||
| Others | 78.0 | 66.9 | 62.5 | |||||||||
|
|
|
|
|
| |||||||
| Total | 3,111.7 | 3,137.3 | 3,072.5 | |||||||||
|
|
|
|
|
| |||||||
| • | Adopting K-IFRS from FY2011, result of 2010 is recalculated from K-GAAP into K-IFRS |
| • | Satellite Broadcasting (KT Skylife) |
| (Unit: KRW million) | ||||||||||||||
Business | Revenue Type | 2012 | 2011 | 2010 | ||||||||||
| Satellite Broadcasting | Monthly fee | 354,554 | 321,667 | 297,494 | ||||||||||
| Channel | 117,458 | 80,161 | 67,104 | |||||||||||
| Advertising | 14,498 | 12,233 | 15,605 | |||||||||||
| Others | 64,759 | 45,776 | 40,720 | |||||||||||
|
|
|
|
|
| |||||||||
| Total | 551,270 | 459,838 | 420,923 | |||||||||||
|
|
|
|
|
| |||||||||
30
Table of Contents
| • | Car Rental Business (KT Rental) |
| (Unit: KRW million) | ||||||||||||||
Business | 2012 | 2011 | 2010 | |||||||||||
Domestic | Car Rental | 456,396 | 414,103 | 252,650 | ||||||||||
| Used Car | 163,724 | 169,027 | 88,001 | |||||||||||
| Equipment Rental | 60,660 | 42,612 | 42,216 | |||||||||||
| Auto Lease | 35,427 | 35,805 | 26,161 | |||||||||||
|
|
|
|
|
| |||||||||
| Total | 716,027 | 661,547 | 409,028 | |||||||||||
|
|
|
|
|
| |||||||||
| • | Adopted K-IFRS from 2011 & 2010 results are readjusted in accordance with K-IFRS |
| • | Online contents creation and e-commerce (KT Hitel) |
| (Unit: KRW million) | ||||||||||||||
Division | Revenue type | 2012 | 2011 | 2010 | ||||||||||
| Internet based service | Internet Service | 9,127 | 11,073 | 11,587 | ||||||||||
| Contents | 53,003 | 57,194 | 58,489 | |||||||||||
| Platform building/operation | 64,809 | 62,456 | 80,037 | |||||||||||
|
|
|
|
|
| |||||||||
Total | 126,939 | 130,723 | 150,113 | |||||||||||
|
|
|
|
|
| |||||||||
| • | Adopted K-IFRS from 2011 & 2010 results are readjusted in accordance with K-IFRS |
| • | Security and Guards (KT Telecop) |
| (Unit : KRW million) | ||||||||||||
Category | 2012 | 2011 | 2010 | |||||||||
| Security service revenue | 295,814 | 259,110 | 216,400 | |||||||||
| Other revenue | 366 | 223 | 251 | |||||||||
|
|
|
|
|
| |||||||
| Total | 296,180 | 259,333 | 216,651 | |||||||||
|
|
|
|
|
| |||||||
| • | Adopted K-IFRS from 2011 & 2010 results are readjusted in accordance with K-IFRS |
| • | Lease and Corporate Loan (KT Capital) |
| (Unit: KRW million) | ||||||||
Services | 2012 | 2011 | ||||||
Installment | 7,079 | 6,321 | ||||||
Lease | 75,785 | 73,870 | ||||||
Loan | 88,874 | 107,080 | ||||||
New Tech Finance | 8,723 | 6,388 | ||||||
Others | 97,322 | 29,236 | ||||||
|
|
|
| |||||
Total | 277,783 | 222,895 | ||||||
|
|
|
| |||||
| • | Adopted K-IFRS from 2011 & 2010 results are readjusted in accordance with K-IFRS |
31
Table of Contents
B. Routes and Methods of Sales
| • | Telecommunication (KT) |
(1) Marketing Organizational Structure (As of March 26, 2013)
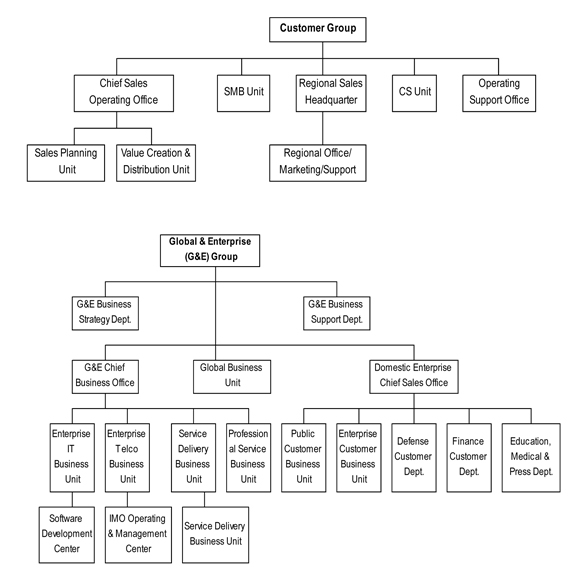
32
Table of Contents
(2) Sales Path
| • | Customer center and branch offices offer sales of goods and customer services. |
| • | Subscription to goods and services through the internet (www.olleh.com). |
| • | Attracting new subscribers and increasing cross-sales through business sales agreements and affiliation: sales agencies |
(3) Methods and Conditions of Sales
(a) Sales Methods
| • | Service fees are paid in cash (wire transfer, direct bank transfer and credit cards). Fixed and wireless telephone services are operated on a unit pricing system or a partial flat rate system, and broadband internet access service is operated on a flat rate system. |
| • | Sale of terminals may involve installment payments. |
| • | Rental of terminals is charged on a monthly basis, and a discounted rate is applied during the contract period. |
| • | Distribution fees are charged upon installation and additional periodic maintenance fees. |
(b) Conditions for Sales
| • | Discounts of Service Fees in accordance with the Subscription Period |
Discount rates based on Contract Periods
Category | 1-Year | 2-Year | 3-Year | 4-Year | ||||||||||
olleh internet | 5 | % | 10 | % | 15 | % | 20% (limited to Special) | |||||||
KORNET (Express/Premium) | 5 | % | 10 | % | 15 | % | — | |||||||
olleh TV (Live/VOD) | 5 | % | 10 | % | 20 | % | — | |||||||
Additional discounts after the 3-Year contract
Category | After 3 Years | After 4 Years | After 5 Years | Note | ||||
| olleh internet | 2% | 3% | 5% | - | ||||
KORNET (Express/Premium) | 2% (for additional | 3% (for additional | 5% (for additional 3 years) | When subscribers sign extended contracts |
| • | No additional discounts are available for new subscribers signing after November 1, 2008. |
Additional discounts for olleh internet subscribers renewing contracts
Category | Renewal for 1 year | Renewal for 2 years | Renewal for 3 years | Renewal for 4 years | ||||||||||||
Type A | KRW | 1,000 | KRW | 2,000 | KRW | 3,000 | KRW | 4,000 | ||||||||
Type B | — | 5 | % | 10 | % | — | ||||||||||
Optional discount based on the subscription period (SHOW-king sponsor basic type)
Monthly fee | Period of subscription | |||||
12 months | 18 months | 24 months | ||||
KRW 30,000 to KRW 40,000 | Discount up to KRW 3,000 | Discount up to KRW 5,000 | 100% discount (up to KRW 10,000) | |||
More than KRW 40,000 | Additional 10% discount | |||||
| * | VAT excluded |
33
Table of Contents
Monthly Discounts for i plan (SHOW-king sponsor/i type)
| (Unit: Won/Month, VAT excluded) | ||||||||||||||||||||||||
type plan | Slim | Lite/Talk* | Value | Medium | Special* | Premium | ||||||||||||||||||
Monthly discounts | 5,000 | 8,000 | 10,000 | 13,000 | 16,000 | �� | 22,000 | |||||||||||||||||
| • | Instead of offering handset subsidies, Smartsponsor is offering additional tariff discounts from KRW 6,000~11,000. |
| • | i-talk and i-special plans are newly added (March, 1, 2010) |
Smartsponsor Discount Plans
| (Unit: Won/Month, VAT excluded) | ||||||||||||||||||||||||||||
Type of plan | Basic fee | Amount of monthly discount | Amount of total discount | |||||||||||||||||||||||||
| Year 1 | Year 2 | Year 3 | After 3 years | Subscribed for 2 years | Subscribed for 3 years | |||||||||||||||||||||||
i-slim | 34,000 | 12,000 | 14,000 | 16,000 | 5,000 | 312,000 | 504,000 | |||||||||||||||||||||
i-teen | 34,000 | 12,000 | 14,000 | 16,000 | 5,000 | 312,000 | 504,000 | |||||||||||||||||||||
i-light/talk | 44,000 | 15,000 | 17,000 | 19,000 | 8,000 | 384,000 | 612,000 | |||||||||||||||||||||
i-value | 54,000 | 17,000 | 19,000 | 21,000 | 10,000 | 432,000 | 684,000 | |||||||||||||||||||||
i-medium | 64,000 | 20,000 | 22,000 | 24,000 | 13,000 | 504,000 | 792,000 | |||||||||||||||||||||
i-special | 78,000 | 23,000 | 25,000 | 27,000 | 16,000 | 576,000 | 900,000 | |||||||||||||||||||||
i-premium | 94,000 | 29,000 | 31,000 | 33,000 | 22,000 | 720,000 | 1,161,455 | |||||||||||||||||||||
DIY 340 | 34,000 | 12,000 | 14,000 | 16,000 | 5,000 | 312,000 | 504,000 | |||||||||||||||||||||
DIY 440 | 44,000 | 15,000 | 17,000 | 19,000 | 8,000 | 384,000 | 612,000 | |||||||||||||||||||||
DIY 540 | 54,000 | 18,000 | 20,000 | 22,000 | 11,000 | 456,000 | 720,000 | |||||||||||||||||||||
DIY 640 | 64,000 | 20,000 | 22,000 | 24,000 | 13,000 | 504,000 | 792,000 | |||||||||||||||||||||
DIY 790 | 79,000 | 23,000 | 25,000 | 27,000 | 16,000 | 576,000 | 900,000 | |||||||||||||||||||||
Style 270 | 27,000 | 8,500 | 8,500 | — | — | 204,000 | — | |||||||||||||||||||||
Style 350 | 35,000 | 13,000 | 13,000 | — | — | 312,000 | — | |||||||||||||||||||||
Style 450 | 45,000 | 16,000 | 16,000 | — | — | 384,000 | — | |||||||||||||||||||||
Style 550 | 55,000 | 18,000 | 18,000 | — | — | 432,000 | — | |||||||||||||||||||||
Style 750 | 75,000 | 23,000 | 23,000 | — | — | 552,000 | — | |||||||||||||||||||||
Style 950 | 95,000 | 30,000 | 30,000 | — | — | 720,000 | — | |||||||||||||||||||||
Al-smart 340 | 34,000 | 11,000 | 11,000 | 11,000 | 5,000 | 264,000 | 396,000 | |||||||||||||||||||||
Al-smart 440 | 44,000 | 14,500 | 14,500 | 14,500 | 7,000 | 348,000 | 522,000 | |||||||||||||||||||||
Campus-smart 340 | 34,000 | 12,000 | 14,000 | 16,000 | 5,000 | 312,000 | 504,000 | |||||||||||||||||||||
Campus-smart 440 | 44,000 | 15,000 | 17,000 | 19,000 | 8,000 | 384,000 | 612,000 | |||||||||||||||||||||
Mobile Bundling Plans
| (Unit: Won/Month, VAT excluded) | ||||||||||||||||||||||||||
Type | Basic fee | Total amount of usage | Complementary beneficiaries | Additional beneficiaries | Number of SIM | |||||||||||||||||||||
| Voice (minute) | SMS | Discount rate (max) | Youth- only SMS | Bundling benefits | 1 | |||||||||||||||||||||
Mobile Toong (Single) | 34,000 | 38,500 | 245 | 1,350 | 9 | % | — | Unlimited voice call time among family members | 1~5 | |||||||||||||||||
Mobile Toong (Small) | 64,000 | 72,000~120,000 | 566 | 3,000 | 46 | % | 500 | |||||||||||||||||||
Mobile Toong (Medium) | 94,000 | 122,000~170,000 | 1,019 | 5,500 | 44 | % | 1,000 | |||||||||||||||||||
Mobile Toong (Large) | 124,000 | 172,000~220,000 | 1,481 | 8,000 | 43 | % | 2,000 | |||||||||||||||||||
34
Table of Contents
A La Carte Plans
Adjustable voice/data/SMS volumes at own choice with fixed free basic volume
| (Unit: Won, VAT excluded) | ||||||||||||||||||||||||||
Price plan | Basic fee | Charge | Adjustable volume | SHOW-king sponsor discount | ||||||||||||||||||||||
| Voice | SMS | Data | ||||||||||||||||||||||||
| (per 10 seconds) | (per one) | (per 0.5KB) | ||||||||||||||||||||||||
A La Carte 340 | 34,000 | 18 | 20 | 0.25 | Free data of 50MB offering | 25,000 | 5,000 | |||||||||||||||||||
A La Carte 440 | 44,000 | 18 | 20 | 0.25 | 36,000 | 8,000 | ||||||||||||||||||||
A La Carte 540 | 54,000 | 18 | 20 | 0.25 | 48,000 | 11,000 | ||||||||||||||||||||
A La Carte 640 | 64,000 | 18 | 20 | 0.25 | 67,000 | 13,000 | ||||||||||||||||||||
A La Carte 790 | 79,000 | 18 | 20 | 0.25 | 96,000 | 16,000 | ||||||||||||||||||||
Unlimited 3G Data Plans
Subscribers who signed up for the basic fees of 54,000 and over can use unlimited 3G data service with no additional charges.
| (Unit: Won, Minute) | ||||||||||||||||||||
| Carryover data plans | Unlimited data plans | |||||||||||||||||||
Basic Fee | i-Slim | i-Talk | i-Lite | i-Value | i-Medium | i-Special | i-Premium | |||||||||||||
| 34,000 | 44,000 | 44,000 | 54,000 | 64,000 | 78,000 | 94,000 | ||||||||||||||
Benefits | Voice | 150 | 250 | 200 | 300 | 400 | 600 | Unlimited on-net 800 minutes free | ||||||||||||
| SMS | 200 | 300 | 400 | 600 | 1,000 | |||||||||||||||
| Data | Data roll-over | Unlimited 3G data | ||||||||||||||||||
| 100MB | 100MB | 500MB | ||||||||||||||||||
| Unlimited WiFi data | ||||||||||||||||||||
Campus Smart Plans
Adjustable voice/data/SMS volumes at own choice with additional discount at a specified campus zone targeting college students
| (Unit: Won, VAT excluded) | ||||||||||||||||||||||
Plan | Basic fee | Charge | Adjustment volume | Other benefit | ||||||||||||||||||
| Voice | SMS | Data | ||||||||||||||||||||
| (per second) | (per unit) | (per 0.5KB) | ||||||||||||||||||||
Campus smart 340 | 34,000 | 1.8 | 20 | 0.025 | 25,000 | 50% discount on out-going voice/data charge at one specified campus zone | ||||||||||||||||
Campus smart 440 | 44,000 | 1.8 | 20 | 0.025 | 36,000 | |||||||||||||||||
35
Table of Contents
LTE Plans
| (Unit: Won, VAT excluded) | ||||||||||||||||||
Plan | Basic fee | Charge | Benefit | |||||||||||||||
| Voice | SMS | Data | ||||||||||||||||
| (per second) | (per unit) | (per 0.5KB) | ||||||||||||||||
LTE-340 | 1.8 | 20 | 0.01 | Voice 160 minutes Data 500MB SMS 200 | ||||||||||||||
| 34,000 | ||||||||||||||||||
LTE-420 | 42,000 | 1.8 | 20 | 0.01 | Voice 200 minutes Data 1GB SMS 200 | |||||||||||||
LTE-520 | 1.8 | 20 | 0.01 | Voice 250 minutes Data 1.5GB SMS 250 | ||||||||||||||
| 52,000 | ||||||||||||||||||
LTE-620 | 62,000 | 1.8 | 20 | 0.01 | Voice 350 minutes Data 3GB SMS 350 | |||||||||||||
LTE-720 | 1.8 | 20 | 0.01 | Voice 450 minutes Data 5GB SMS 450 | ||||||||||||||
| 72,000 | ||||||||||||||||||
LTE-850 | 85,000 | 1.8 | 20 | 0.01 | Voice 650 minutes Data 7GB SMS 650 | |||||||||||||
LTE-1000 | 1.8 | 20 | 0.01 | Voice 1050 minutes Data 10GB SMS 1050 | ||||||||||||||
| 100,000 | ||||||||||||||||||
LTE Sponsor Tariff Discount
| (Unit: Won, VAT excluded) | ||||||||||||||||
Category | Monthly discount | Total discount | ||||||||||||||
Plan | Basic fee | Subscribed for 1 year | Subscribed for 2 years | |||||||||||||
LTE-340 | 34,000 | 7,000 | 84,000 | 168,000 | ||||||||||||
LTE-420 | 42,000 | 11,000 | 132,000 | 264,000 | ||||||||||||
LTE-520 | 52,000 | 14,000 | 168,000 | 336,000 | ||||||||||||
LTE-620 | 62,000 | 16,000 | 192,000 | 384,000 | ||||||||||||
LTE-720 | 72,000 | 18,000 | 216,000 | 432,000 | ||||||||||||
LTE-850 | 85,000 | 20,000 | 240,000 | 480,000 | ||||||||||||
LTE-1000 | 100,000 | 24,000 | 288,000 | 576,000 | ||||||||||||
36
Table of Contents
SIMple Discount Program
| (Unit: Won, VAT excluded) | ||||||||||||||||
Plans | 1-year subscription | 2-year subscription | ||||||||||||||
| Total discount | Monthly discount | Total discount | Monthly discount | |||||||||||||
LTE-340 | 33,000 | 2,750 | 231,000 | 7,700 | ||||||||||||
LTE-420 | 92,400 | 7,700 | 363,000 | 12,100 | ||||||||||||
LTE-520 | 132,000 | 11,000 | 462,000 | 15,400 | ||||||||||||
LTE-620 | 158,400 | 13,200 | 528,000 | 17,600 | ||||||||||||
LTE-G650 | 158,400 | 13,200 | 528,000 | 17,600 | ||||||||||||
LTE-720 | 184,800 | 15,400 | 594,000 | 19,800 | ||||||||||||
LTE-G750 | 184,800 | 15,400 | 594,000 | 19,800 | ||||||||||||
LTE-850 | 211,200 | 17,600 | 660,000 | 22,000 | ||||||||||||
LTE-1000 | 264,000 | 22,000 | 792,000 | 26,400 | ||||||||||||
LTE-1250 | 343,200 | 28,600 | 990,000 | 33,000 | ||||||||||||
LTE-Golden 275 | 33,000 | 2,750 | 247,500 | 8,250 | ||||||||||||
LTE-Al 240 | 13,200 | 1,100 | 33,000 | 1,100 | ||||||||||||
LTE-Al 340 | 33,000 | 2,750 | 231,000 | 7,700 | ||||||||||||
LTE-Al 420 | 92,400 | 7,700 | 363,000 | 12,100 | ||||||||||||
i-slim, i-teen | 66,000 | 5,500 | 343,200 | 14,300 | ||||||||||||
i-light, i-talk | 105,600 | 8,800 | 422,400 | 17,600 | ||||||||||||
i-value | 132,000 | 11,000 | 475,200 | 19,800 | ||||||||||||
i-midium | 171,600 | 14,300 | 554,400 | 23,100 | ||||||||||||
i-special | 211,200 | 17,600 | 633,600 | 26,400 | ||||||||||||
i-premium | 290,400 | 24,200 | 792,000 | 33,000 | ||||||||||||
Smart sharing | 39,600 | 3,300 | 290,400 | 12,100 | ||||||||||||
Golden smart 275 | 33,000 | 2,750 | 198,000 | 8,250 | ||||||||||||
Campus smart 340 | 66,000 | 5,500 | 343,200 | 14,300 | ||||||||||||
Campus smart 440 | 105,600 | 8,800 | 422,400 | 17,600 | ||||||||||||
Al smart 340 | 66,000 | 5,500 | 290,400 | 12,100 | ||||||||||||
Al smart 440 | 92,400 | 7,700 | 382,800 | 15,950 | ||||||||||||
Style 270 | 19,800 | 1,650 | 224,400 | 9,350 | ||||||||||||
Style 320 | 39,600 | 3,300 | 290,400 | 12,100 | ||||||||||||
Style 350 | 66,000 | 5,500 | 343,200 | 14,300 | ||||||||||||
Style 450 | 105,600 | 8,800 | 422,400 | 17,600 | ||||||||||||
Style 550 | 132,000 | 11,000 | 475,200 | 19,800 | ||||||||||||
Style 750 | 198,000 | 16,500 | 607,200 | 25,300 | ||||||||||||
Style 950 | 290,400 | 24,200 | 792,000 | 33,000 | ||||||||||||
A La Carte 340 | 66,000 | 5,500 | 343,200 | 14,300 | ||||||||||||
A La Carte 440 | 105,600 | 8,800 | 422,400 | 17,600 | ||||||||||||
A La Carte 540 | 145,200 | 12,100 | 501,600 | 20,900 | ||||||||||||
A La Carte 640 | 171,600 | 14,300 | 554,400 | 23,100 | ||||||||||||
A La Carte 790 | 211,200 | 17,600 | 633,600 | 26,400 | ||||||||||||
37
Table of Contents
(4) Sales Strategy
| • | Our main sale strategy is to provide differentiated experience for our customers by providing various bundled products at competitive prices. |
| (a) | Mobile Service |
| • | Enhancing leadership and competitiveness in smart phone and emerging device market: expanding smart phone subscriber base and pioneering the tablet PC market |
| • | Strengthening competitiveness by utilizing a differentiated network: Building a differentiated ‘Mobile Wonderland’ (a network usage environment) based on 3W(3G/WiFi/WiBro) network |
| • | Attracting high ARPU users by offering free WiFi/uCloud services to subscribers who signed for higher plans. |
| • | Offering differentiated service experience after forming optimized CS structure to smartphone users |
| • | Controlling marketing expenses by introducing a new sales program which provides special tariff discount instead of handset subsidy |
| • | Strengthen customer retention policy targeting the long-term contract customers whose contract period is matured. |
| (b) | IPTV Service |
| • | Promote IPTV (olleh TV) products to our existing internet subscribers. |
| • | Expand client base by offering free set-top box rentals (with a 3-year subscription contract) and opportunities to experience KT services |
| • | Increase synergy with Skylife by providing hybrid product to strengthen customer retention and to promote up-selling |
| (c) | Broadband Internet Service |
| • | Strengthen competitiveness of All-IP based products and solidify No.1 market stance with active FTTH investment |
| • | Expanding synergies with smart home businesses such as IPTV, home pad and Kibot |
| • | Satisfy a diverse range of customer needs by providing differentiated value-added services |
| • | Promote specialized high-quality and optimized products by analyzing patterns of users |
| (d) | Telephone Service |
| • | Minimize PSTN line loss by customer segmentation |
| • | Expand new customer base |
| • | Discover new business model and promote remodeling |
| (e) | WiBro Service |
| • | Enhance service competitiveness with nationwide coverage of 83 cities and position as ‘mobile WiFi’ with 11,000 of nationwide WiFi hot zones. |
| • | Plan to expand WiBro emerging devices(Pad, WiMax imbedded device, stc) |
38
Table of Contents
| • | Increase subscriber base by expanding distribution channels and terminal competitiveness. |
| • | Design various plans such as 3G/LTE bundling plan, fixe-mobile bundling plan, and WiBro only plan, etc. |
| • | Improve brand value by proactive promotion and marketing |
| • | KT Powertel |
(1) Methods and Conditions of Sales
| • | Through direct sales organization and cosigned dealers, KT Powertel is selling TRS services (voice and wireless data products) to customers. |
| • | KT Powertel is providing cosigned dealers with management fee of 7% of customer charges for 60 months. After 60 months, 7% of customer charges are paid to cosigned dealers as long-term customer care fee. |
| • | Credit Cards Business (BC Card) |
BC Card performs credit card (including debit card) issuing and payment processing based on the contract with credit card companies. BC card targets to provide card issuing and payment processing services to more credit card companies.
| • | Satellite Broadcasting (KT Skylife) |
KT Skylife currently has four different sales channels; 1) local channels; 2) kt; 3) customer centers and 4) KT Skylife head office. There are 200 sales offices which are organized under 7 branches (3 in Seoul and 1 each in Daejeon, Daegu, Busan, Gwangju). KT Skylife is offering ‘olleh TV Skylife’ through KT’s inbound and outbound sales channels. Also, since December 2012, KT Skylife is offering expanded bundled products ‘LTE together olleh’, which is a bundled product of KT’s fixed and mobile LTE services. Two customer service centers are located in Suwon and Gwangju, providing customer services and retention services like HD product promotion and new subscriber acquisition. In order to strengthen direct and indirect sales channels, KT Skylife is utilizing its homepage and partnership marketing with public offices and on-line companies.
| • | Car Rental Business (KT Rental) |
(1) Marketing Organizational Structure
Business | Department | Structure | ||
Car Rental | Strategic marketing department | 3 parts | ||
| 1stSales department | 2 teams, 9 offices, 17 branches, 14 reservation centers | |||
| 2nd Sales department | 1 team, 13 offices, 12 branches | |||
| 3rd Sales department | 1 team, 25 offices, 20 branches, 7 reservation centers | |||
Equipment Rental | Equipment rental department | 5 teams, 1 TF, 1 Center, 5 branches |
39
Table of Contents
(2) Sales Path
<Car Rental>
| * | Long-term rental |
| • | Dedicated corporate customer care by strategic marketing department |
| • | Attracting new customers through marketing branches |
| * | Short-term rental |
| • | Reservation to rental service through the online and call center |
| • | Attracting new customers through marketing branches |
<Equipment Rental>
| * | Long-term rental |
| • | Corporate customer and individual customer care in each equipment’s sales part |
‚ Attracting new customers through marketing branches
| • | Dedicated marketing department for group companies |
| * | Short-term rental |
| • | Attracting new customers through marketing branches |
| • | Corporate customer and individual customer care in each equipment’s sales part |
| • | Online contents creation and e-commerce (KT Hitel) |
Most of the sales made through the online and the revenue from portals and contents occurs from the final consumers on the internet.
| • | Security and guards (KT Telecop) |
Our sales channels which consist of internal sales staff and outside distribution network(allied store, special partners, etc.) attract new customers.
| • | Lease and Corporate Loan (KT Capital) |
KT Capital is currently conducting sales through its human resources and does not offer individual finance services.
40
Table of Contents
4. Research and Development Activities
A. Research and Development Activities
| • | Telecommunication (KT) |
| (1) | R&D Organization Structure |
| • | Structure (As of December 31, 2012) |
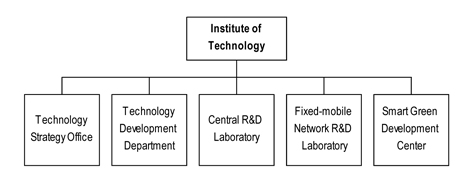
| • | Main Mission |
| • | General managing of R&D Center and suggesting mid-to-long term technology evolution |
| • | Support for common platform for enterprise and mid-to-long term technology development for new business |
| • | Core technology development and capacity building |
| • | Providing strategic direction of fixed-mobile networks and developing operational support systems for infra structure and commercialization |
| • | Green IT planning, business planning/development for Smart grid and Green Energy |
| (2) | R&D Costs |
| (Unit: KRW million) | ||||||||||||||
Category | 2012 | 2011 | 2010 | |||||||||||
Raw Materials | — | — | — | |||||||||||
Labor Costs | 29,877 | 24,018 | 47,156 | |||||||||||
Depreciation | 13,378 | 15,158 | 77,778 | |||||||||||
Commissions | 1,128 | 2,437 | 3,870 | |||||||||||
Others | 436,378 | 266,982 | 403,248 | |||||||||||
|
|
|
|
|
| |||||||||
Total R&D Costs | 480,760 | 308,596 | 532,052 | |||||||||||
|
|
|
|
|
| |||||||||
Accounting Treatment | Research and Ordinary Development Costs | 137,075 | 153,131 | 289,531 | ||||||||||
| Development Costs (Intangible Assets) | 343,685 | 155,465 | 242,521 | |||||||||||
Percentage of R&D Costs over Revenue | 2.55 | % | 1.53 | % | 2.67 | % | ||||||||
| • | Adopting K-IFRS from FY2011, results of FY2010 are recalculated from K-GAAP into K-IFRS. |
| • | Online contents creation and e-commerce (KT Hitel) |
Not applicable
41
Table of Contents
5. Other Matters Necessary for Making Investment Decisions
A. Intellectual Property Rights
| • | Telecommunication (KT) |
KT holds 5,399 domestic patents and 749 overseas patents as of December 31, 2012.
42
Table of Contents
1. Summary of Financial Statements (Consolidated)
| (Unit: KRW million) | ||||||||
Classification | 2012 | 2011 | ||||||
Current Assets | 10,482,845 | 9,790,659 | ||||||
• Cash and Cash Equivalents | 2,054,696 | 1,445,169 | ||||||
• Trade and Other Receivables | 5,877,523 | 6,158,914 | ||||||
• Inventories | 934,870 | 674,727 | ||||||
• Other Current Assets | 1,615,756 | 1,511,849 | ||||||
Non-current Assets | 23,996,654 | 22,294,750 | ||||||
• Trade and Other Receivables | 1,071,116 | 1,723,415 | ||||||
• Tangible Assets | 15,734,420 | 14,022,695 | ||||||
• Investment Property | 1,155,213 | 1,159,105 | ||||||
• Intangible Assets | 3,212,593 | 2,643,485 | ||||||
• Investments in Jointly Controlled Entities and Associates | 410,783 | 529,184 | ||||||
• Other Non-Current Assets | 2,412,529 | 2,216,866 | ||||||
|
|
|
| |||||
Total Assets | 34,479,499 | 32,085,409 | ||||||
|
|
|
| |||||
Current Liabilities | 11,247,314 | 8,745,125 | ||||||
Non-Current Liabilities | 10,067,673 | 10,802,475 | ||||||
|
|
|
| |||||
Total Liabilities | 21,314,987 | 19,547,600 | ||||||
|
|
|
| |||||
Capital Stock | 1,564,499 | 1,564,499 | ||||||
Share Premium | 1,440,258 | 1,440,258 | ||||||
Retained Earnings | 10,646,383 | 10,219,633 | ||||||
Accumulated Other Comprehensive Expense | 1,325 | (22,865 | ) | |||||
Other Components of Equity | (1,343,286 | ) | (1,497,289 | ) | ||||
Non-Controlling Interests | 855,333 | 833,573 | ||||||
|
|
|
| |||||
Total Shareholders’ Equity | 13,164,512 | 12,537,809 | ||||||
|
|
|
| |||||
| (Unit: KRW million) | ||||||||
Classification | 2012 | 2011 | ||||||
Operating Revenue | 23,790,359 | 21,272,033 | ||||||
Operating Profit | 1,213,880 | 1,748,409 | ||||||
Profit for the Period from the Continuing Operations | 1,142,984 | 1,287,425 | ||||||
Profit for the Period | 1,111,450 | 1,452,019 | ||||||
Number of Consolidated Companies | 61 | 52 | ||||||
43
Table of Contents
2. Summary of Financial Statements (Separate)
| (Unit: KRW million) | ||||||||
Classification | 2012 | 2011 | ||||||
Current Assets | 6,089,523 | 6,375,600 | ||||||
• Cash and Cash Equivalents | 1,172,981 | 790,107 | ||||||
• Trade and Other Receivables | 3,951,132 | 4,832,373 | ||||||
• Other Financial Assets | 8,785 | 57,473 | ||||||
• Inventories | 809,379 | 514,076 | ||||||
• Other Current Assets | 147,246 | 181,571 | ||||||
Non-Current Assets | 20,419,253 | 20,078,007 | ||||||
• Trade and Other Receivables | 926,081 | 1,607,843 | ||||||
• Other Financial Assets | 156,096 | 216,078 | ||||||
• Property and Equipment | 13,009,279 | 13,305,475 | ||||||
• Investment Property | 573,740 | 1,118,757 | ||||||
• Intangible Assets | 2,122,153 | 1,745,976 | ||||||
• Investments in Subsidiaries, Associates and Joint Ventures | 3,303,346 | 1,577,406 | ||||||
• Deferred Income Tax Assets | 290,596 | 467,890 | ||||||
• Other Non-Current Assets | 37,962 | 38,582 | ||||||
|
|
|
| |||||
Total Assets | 26,508,776 | 26,453,607 | ||||||
|
|
|
| |||||
Current Liabilities | 7,338,080 | 6,035,682 | ||||||
Non-Current Liabilities | 7,299,501 | 8,683,992 | ||||||
|
|
|
| |||||
Total Liabilities | 14,637,581 | 14,719,674 | ||||||
|
|
|
| |||||
Capital Stock | 1,564,499 | 1,564,499 | ||||||
Share Premium | 1,440,258 | 1,440,258 | ||||||
Retained Earnings | 10,103,996 | 10,008,964 | ||||||
Accumulated Other Comprehensive Income | –2,662 | –28,684 | ||||||
Other Components of Shareholders’ Equity | –1,234,896 | –1,251,104 | ||||||
|
|
|
| |||||
Total Shareholders’ Equity | 11,871,195 | 11,733,933 | ||||||
|
|
|
| |||||
| (Unit: KRW million) | ||||||||
Classification | 2012 | 2011 | ||||||
Operating Revenue | 18,863,237 | 19,323,633 | ||||||
Operating Profit | 1,074,656 | 1,665,922 | ||||||
Profit for the Period | 719,352 | 1,289,055 | ||||||
44
Table of Contents
1. Auditors’ opinion on the consolidated financial statements
A. Auditor’s opinion on the consolidated financial statements
FY 2012 | FY 2011 | FY 2010 | ||
Samil PwC | Samil PwC | Samil PwC |
B. Audit (or review) Comments
Fiscal Year | Audit (or review) Comments | Issues noted | ||
2012 | Unqualified | Not applicable | ||
2011 | Unqualified | Not applicable | ||
2010 | Unqualified | Not applicable |
2. Compensation to external auditors for the last three fiscal years
A. Audit services contract
| (Unit: KRW million, Hours) | ||||||||||||
Fiscal Year | Auditor | Contents | Compensation | Total Time | ||||||||
2012 | Samil PwC | Review interim financial statements | 2,685 | 41,919 | ||||||||
| Audit of Separate financial statements | ||||||||||||
| Audit of the consolidated financial statements | ||||||||||||
| 20-F Filing | ||||||||||||
2011 | Samil PwC | Review interim financial statements | 2,492 | 43,709 | ||||||||
| Audit of Separate financial statements | ||||||||||||
| Audit of the consolidated financial statements | ||||||||||||
| 20-F Filing | ||||||||||||
2010 | Samil PwC | Review interim financial statements | 2,439 | 36,159 | ||||||||
| Audit of Separate financial statements | ||||||||||||
| Audit of the consolidated financial statements | ||||||||||||
| Audit of financial statements based on US-GAAP | ||||||||||||
45
Table of Contents
V. Management and Affiliated Companies
1. Overview of the Board of Directors and Committees
A. Matters on the Board of Directors
(1) Organization
As of March 26, 2013, Board of Directors of KT Corp. consists of 11 Directors. (3 Inside Directors and 8 Outsider Directors) Under the Board of Directors, KT has seven different Committees as follows; Corporate Governance Committee, Audit Committee, Outside Director Candidate Recommendation Committee, Evaluation & Compensation Committee, Executive Committee, CEO recommendation committee and Related-Party Transaction Committee. The Board of Directors may establish additional committees if necessary.
46
Table of Contents
(2) Major Activities of the Board of Directors
Order | Date | Subject | Result of Discussion | |||
First | Jan. 20, 2012 | Proposal on paid-in capital increase for kt Capital | Original proposal approved | |||
| Proposal on the committee members in the BOD | Members of committees appointed | |||||
Second | Feb. 2,2012 | Proposal on ‘D Project’ | Re-Proposition | |||
| Approval of financial statements of the 30th term | Original proposal approved | |||||
| Report on consolidated financial statements of the 30th term | Original proposal received | |||||
| Business reports of the 30th Term | Original proposal approved | |||||
| Plan for issuance of bonds for 2012 | Original proposal received | |||||
Third | Feb. 16, 2012 | Proposal on the limit on remuneration of Board of Directors | Original proposal approved | |||
| Proposal on the compensation and payment system for Board of Directors | Original proposal approved | |||||
| Proposal on the members and limit on remuneration of Executive Director | Original proposal approved | |||||
| Approval of financial statements of the 30th term | Original proposal approved | |||||
| Business reports of the 30th Term | Original proposal approved | |||||
| Convocation of annual general meeting of shareholders of 30th term | Original proposal approved | |||||
| Report on operational condition of internal accounting management system | Original proposal received | |||||
| Audit committee’s report on operational condition of internal accounting management system | Original proposal received | |||||
| Proposal on the amendment of Article of Corporation | Original proposal approved | |||||
| Agreement on the recommendation of non-independent Directors | Original proposal approved | |||||
| Recommendation of Audit committee’s candidate | Original proposal approved | |||||
Fourth | Mar. 16, 2012 | Appointment of the Chairman of the Board of Directors and the proposal on the organization of committees under the Board of Directors | Chairman of BOD and members of committees appointed | |||
| Amendment to the policies on the Board of Directors and committees | Original proposal approved | |||||
| Proposal on disposal of treasury share | Original proposal approved | |||||
| Plan for securitization of handset sold in the first half of 2012 | Original proposal approved | |||||
| Report on the fund management performance of 2011 | Original proposal received | |||||
| Report on transactions under KRW 15 billion with other entities for 2011 | Original proposal approved | |||||
| Report on current status and plan for improvement of management performance of subsidiary companies | Original proposal approved | |||||
Fifth | May. 03, 2012 | Proposal on the committee members in the BOD | Members of committees appointed | |||
| Proposal on disposition of treasury shares for long-term performance based incentive payment | Original proposal approved | |||||
| Proposal on plans for the payment of long-term incentive for 2012 | Original proposal approved | |||||
| Proposal on investment in kt Rental’s shares owned by MBK | Original proposal approved | |||||
| Plan for sustainable growth in 2012 | Original proposal approved | |||||
| Proposal on establishment of compliance control standards and appointment of compliance supporting senior | Original proposal approved | |||||
| Proposal on Gimhae apartment interim loan payment guarantees | Original proposal approved | |||||
| Report on separate financial statement of the first quarter of 2012 fiscal year | Original proposal accepted | |||||
| Report on consolidated financial statement of the first quarter of 2012 fiscal year | Original proposal accepted | |||||
Sixth | Aug. 09, 2012 | Proposal on donation to the Spatial Information Industry Development Institute | Original proposal approved | |||
| Plan for Social contribution activities | Original proposal approved | |||||
| Proposal on improvement of Directors’ remuneration system | Modified approval | |||||
| Proposal on the members and limit on remuneration of Executive Director | Original proposal approved | |||||
| Plan for the ‘S2 Project’ | Original proposal approved | |||||
| Proposal on invest-in capital increase on kt m&s | Original proposal accepted | |||||
| Report on corporate partnership with National Pension Service | Original proposal approved | |||||
| Report on progress of investment in T-On telecom | Original proposal received | |||||
| Plan for securitization of handset sold in the second half of 2012 | Original proposal approved | |||||
| Report on separate financial statement of the first half of 2012 fiscal year | Original proposal received | |||||
| Report on consolidated financial statement of the first half of 2012 fiscal year | Original proposal received | |||||
Seventh | Sep. 20, 2012 | Proposal on approval of Spin off | Original proposal approved | |||
| Closure of Shareholders | Original proposal approved | |||||
| Proposal on monetization of Mock Dong IT center | Original proposal approved | |||||
| Plan for Yeongdeungpo branch secondary development | Original proposal approved | |||||
Eighth | Oct. 23. 2012 | Proposal on investment to kt Estate | Original proposal approved | |||
| Proposal on establishment of Media-Content company | Original proposal approved | |||||
| Convocation of Extraordinary general meeting of shareholders | Original proposal approved | |||||
Ninth | Nov. 01. 2012 | Report on current status of subsidiary companies | Original proposal received | |||
| Proposal on contract of kt Rental’s shareholders | Original proposal accepted | |||||
| Proposal on strategy for music content | Original proposal accepted | |||||
| Report on operation performance of fund in the first half of 2012 | Original proposal received | |||||
| Plan for the secondary asset monetization | Original proposal accepted | |||||
| Report on separate financial statement of the third quarter of 2012 fiscal year | Original proposal accepted | |||||
| Report on consolidated financial statement of the third quarter of 2012 fiscal year | Original proposal accepted | |||||
| Proposal on Improvements of corporate governance | Original proposal approved | |||||
Tenth | Dec. 03. 2012 | Proposal on announcement on Satellite business sector spin-off | Original proposal approved | |||
| Proposal on business transfer | Original proposal approved | |||||
Eleventh | Dec. 13. 2012 | Proposal on financial support for Smartchannel Corporation | Original proposal approved | |||
| Proposal on donation to labor welfare fund in 2012 | Original proposal accepted | |||||
| Proposal on severance payment obligations transaction | Original proposal accepted | |||||
| Proposal on change of plan of S2 Project | Original proposal accepted | |||||
| Proposal on kt group mid-term management plan | Original proposal accepted | |||||
| Proposal on the organization of outside director nomination committee | Chairman and members of committees appointed | |||||
47
Table of Contents
(3) The Status of Committees under the Board of Directors
| (a) | Organization of the Committees under the Board of Directors (As of March 26, 2013) |
Title | Organization | Name (after March 16, 2012) | Purpose of Establishment | Note (Before March 15, 2013) | ||||
| Corporate Governance Committee | 4 Outside Directors, & 1 non-independent Directors | Choon Ho Lee (Chairperson) E. Han Kim Byung Won Bahk Sang Kyun Cha Hyun-Myung Pyo | Improvement of Corporate Governance | Choon Ho Lee (Chairperson) E. Han Kim Byung Won Bahk Sang Kyun Cha Hyun-Myung Pyo | ||||
| Evaluation & Compensation Committee | 4 Outside Directors | Jong-Hwan Song (Chairperson) Choon Ho Lee Do Kyun Song Keuk-Je Sung | Management Agreement with the CEO and Assessment | Jong-Hwan Song (Chairperson) Choon Ho Lee Hyun Nak Lee Keuk-Je Sung | ||||
| Executive Committee | 3 non-independent Directors | Suk Chae Lee (Chairperson) Hyun Myung Pyo Yung Kim | Management and financial matters authorized by the Board of Directors | Suk-Chae Lee (Chairperson) Sang Hoon Lee Hyun Myung Pyo | ||||
| Related-party Transaction Committee | 4 Outside Directors | Keuk-Je Sung (Chairperson) Jong-Hwan Song Hyun Nak Lee Do Kyun Song | Internal transactions that require resolution by the Board of Directors as stipulated by the ‘Antitrust Regulation and Fair Trade Law’ and ‘Securities and Exchange Act’ | Keuk-Je Sung (Chairperson) Jong-Hwan Song Byong Won Bahk Sang Kyun Cha | ||||
| Outside Director Candidate Recommendation Committee | See V. Management and Affiliated Companies 1. Overview of the Board of Directors and Committees under the Board A. Matters on the Board of Directors (4) Independence of the Board of Directors | |||||||
| Audit Committee | See V. Management and Affiliated Companies B. Audit Committee | — | ||||||
| (b) | Activities of the Committees under the Board of Directors |
| • | Corporate Governance Committee |
Agenda | Results of discussion | Independent and Non-Executive Directors | ||||||||||
| Choon Ho Lee | E. H Kim | Hae Bang Chung | Hyun Nak Lee | |||||||||
| Attendance 100% | Attendance 100% | Attendance 100% | Attendance 100% | |||||||||
Meeting Date | Voting Result | |||||||||||
Feb 2, 2012 | Report on amendment of Article of Corporate | Original proposal accepted | For | For | For | For | ||||||
Outside director Hae Bang Chung resigned on April 20, 2012
48
Table of Contents
Agenda | Results of discussion | Independent and Non-Executive Directors | ||||||||||
| Choon Ho Lee | E. H Kim | Byung Won Bahk | Sang Kyun Cha | |||||||||
| Attendance 100% | Attendance 100% | Attendance 100% | Attendance 100% | |||||||||
Meeting Date | Voting Result | |||||||||||
Aug 9, 2012 | Proposal on management plan of Corporate Governance Committee for 2012 | Original proposal accepted | For | For | For | For | ||||||
Sep 20, 2012 | Proposal on improvement of corporate governance system | Original proposal approved | For | For | For | For | ||||||
Nov. 1, 2012 | Proposal on improvement of corporate governance system | Revised proposal accepted | For | For | For | For | ||||||
Dec. 12, 2012 | Report on the result of sustainable management for 2012 | Original proposal approved | For | For | For | For | ||||||
| Partial amendment to Articles of Incorporation and Provision | Revised proposal accepted | For | For | For | For | |||||||
| • | Evaluation & Compensation Committee |
Agenda | Results of discussion | Independent and Non-Executive Directors | ||||||||||||||
| Choon Ho Lee | Jong Hwan Song | Chan-Jin Lee | ||||||||||||||
| Attendance 100% | Attendance 100% | Attendance 100% | ||||||||||||||
Meeting Date | Voting Result | |||||||||||||||
Feb. 01, 2011 | Result of CEO management assessment for 2011 | Original proposal approved | For | For | For | |||||||||||
Feb. 15, 2012 | Proposal on the Limit on remuneration of Directors for 2012 | Original proposal approved | For | For | For | |||||||||||
| Proposal on remuneration standards and payment methods for Standing Directors | Original proposal approved | For | For | For | ||||||||||||
| Proposal on the members, limit on remuneration of Executive officers | Original proposal approved | For | For | For | ||||||||||||
Feb. 27, 2012 | CEO management goal for 2012 | Original proposal approved | For | For | For | |||||||||||
Agenda | Results of discussion | Independent and Non-Executive Directors | ||||||||||
| Choon Ho Lee | Jong Hwan Song | Chan-Jin Lee | Keuk-Je Sung | |||||||||
| Attendance 100% | Attendance 100% | Attendance 100% | Attendance 50% | |||||||||
Meeting Date | Voting Result | |||||||||||
May. 03, 2011 | Payment for long-term incentive and stock grant for the 2011 fiscal year | Original proposal approved | For | Against | For | Absence | ||||||
| Proposal on the long-term incentive and stock grant for the 2012 fiscal year | Original proposal approved | For | For | For | Absence | |||||||
Aug. 08, 2012 | Report on the CEO performance for the first half of 2012 | Original proposal accepted | For | For | For | For | ||||||
| Report on remuneration system improvement | Original proposal accepted | For | For | For | For | |||||||
49
Table of Contents
| • | Executive Committee |
Meeting Date | Agenda | Results of discussion | ||
| Feb. 23, 2012 | Proposal on IT-Master scholarship in 2012 | Original proposal approved | ||
| Mar. 15, 2012 | Proposal to award KT Company-Labor Union Youth Scholarship | Original proposal approved | ||
| Mar. 23, 2012 | Proposal on donation to Seoul National Univ. MBA program | Original proposal approved | ||
| Sponsoring Korea Digital Media Industry Association | Original proposal approved | |||
| May. 24, 2012 | Proposal on donation of WiBro Handset | Original proposal approved | ||
| Aug. 17, 2012 | Establishment, relocation of branches | Original proposal approved | ||
| Oct. 30, 2012 | Proposal on investment for establishment of Joint Venture ‘Project oxford’ | Original proposal approved | ||
| Nov. 22, 2012 | Proposal on partial acquisition of Dong-A Digital Center | Original proposal approved | ||
| Dec. 20, 2012 | Plan for issuance of foreign corporate bonds | Original proposal approved |
(4) Independence of the Board of Directors
| (a) | Independence of appointing BOD members |
In order to secure independence and transparency, all candidates to the Board of Directors should be selected and must receive approvals from the general meeting of shareholders. Also, the outside research and advisory service may be conducted if necessary.
| (b) | Appointment of new Directors |
Name | Expertise | Recommendation | Committees | Inside trading, | ||||
| Jong Hwan Song | Global Business | Outside Director Candidate Recommendation Committee | Evaluation & Compensation Committee / Related-party Transaction Committee(Chairman) | No | ||||
| Sang Kyun Cha | ICT Business | Outside Director Candidate Recommendation Committee | Corporate Governance Committee/ Related-party Transaction Committee | No | ||||
| Do Kyun Song | Media&Communication Policy | Outside Director Candidate Recommendation Committee | Evaluation & Compensation Committee Related-party Transaction Committee | No |
| (c) | Establishing separate committee to appoint new directors |
Name | Whether Outside Director | Note | ||
E. Han Kim | O | The number of the outsider Directors should be more than 50% | ||
Choon Ho Lee | O | |||
Hyun Nak Lee | O | |||
Byung Won Bahk | O | |||
Keuk-Je Sung | O | |||
Hyun Myung Pyo | X |
50
Table of Contents
| • | Outside Director Candidate Recommendation Committee |
Agenda | Results of discussion | Independent and Non-Executive Directors | ||||||||||||
| E. Han Kim | Choon Ho Lee | Hyun Nak Lee | Byung Won Bahk | Keuk-Je Sung | ||||||||||
| Attendance 100% | Attendance 100% | Attendance 100% | Attendance 100% | Attendance 100% | ||||||||||
Meeting Date | Voting Results | |||||||||||||
Jan. 17, 2013 | Plan on supporting recommendation of outside director candidate | Original proposal approved | For | For | For | For | For | |||||||
Jan. 31, 2013 | Selecting outside director candidate | Original proposal approved | For | For | For | For | For | |||||||
Feb. 7, 2013 | Finalization of outside director candidates | Original proposal approved | For | For | For | For | For | |||||||
(5) Expertise of outside directors
| (a) | Supportive team for outside directors |
| • | Corporate Governance Team at the Legal Department |
| (b) | Education for outside directors in 2011 |
| • | Programs provided by Korea Directors Association: Two outside directors (Keuk-Je Sung, Sang Kyun Cha) took the program |
51
Table of Contents
(1) Personal Information of Members of the Audit Committee
| (As of March 15, 2013) | ||||||
Name | Experience | Note | ||||
E. Han Kim | • Ph.D. in Finance, State University of New York • Independent Director and Non-Executive Chairman of the Board of Directors, POSCO • (Present) Tenured professor and Director of Financial Research, University of Michigan |
| Outside director |
| ||
Sang Kyun Cha | • Ph.D in Stanford Univ. • (present) Professor of Seoul Univ. |
| Outside director |
| ||
Hyun Nak Lee | • M.A. in Economics, Seoul National University • Executive Director and Chief Editor, Donga Ilbo Daily • President, Kyeonggi Ilbo Daily • (present) Professor of Sejong Univ. |
| Outside director |
| ||
Byong Won Bahk | • M.A. in Economics, Washington University • 7th Vice-Minister, Ministry of Finance and Economy (currently Ministry of Strategy and Finance) • Chairman of Board of Directors, Woori Finance Holdings and Chairman Board of Directors, Woori Bank |
| Outside director |
| ||
(2) Independence of Audit Committee
Audit committee is established within the BOD and member of audit committee is appointed at the Shareholders’ Meeting. The audit committee is composed of four outside directors. Among members, two members (E. Han Kim, Byong Won Bahk) are financial expert.
Audit Committee and members are performing its duties against company independently and audit company’s accounting work. If necessary, Audit Committee and members have right to require report on business and also investigate the company’s financial status.
52
Table of Contents
(3) Major Activities of the Audit Committee (Auditor)
Order | Date | Subject | Result of Discussion | |||
First | Feb. 1, 2012 | Approval of financial statements for 30th term | Original proposal approved | |||
| Report on consolidated financial statements for 30th term | Original proposal accepted | |||||
| Report of business report for 30th term | Original proposal accepted | |||||
| Report of final audit for fiscal year 2011 | Original proposal approved | |||||
Second | Feb. 15, 2021 | Report on operating result of internal accounting management system for fiscal year 2011 | Original proposal accepted | |||
| Report on operational condition of internal accounting management system for fiscal year 2011 (prepared by audit committee) | Original proposal accepted | |||||
| Report on audit records for 2011 and audit plan for 2012 | Original proposal approved | |||||
Third | Feb. 27, 2011 | Report on agenda of the annual general meeting of shareholders for 29th term and result on document review | Original proposal accepted | |||
| Pre-approval on non-audit services provided by external auditors | Original proposal approved | |||||
| Post-approval on Consolidated Subsidiaries non-audit services in FY 2011 | Original proposal approved | |||||
| Audit report for the annual general meeting of shareholders for 29th term | Original proposal accepted | |||||
| Evaluation report on operational status of internal compliance device of the audit committee | Original proposal approved | |||||
Fourth | Mar. 22, 2012 | Appointment of the chairman of Audit committee | Chairman appointed | |||
| Pre-approval on remuneration for non-audit services of external auditors | Original proposal approved | |||||
| Approval of remuneration of external auditors for fiscal year 2012 | Original proposal approved | |||||
| Approval of remuneration for audit and non-audit services of independent auditor of consolidated companies for fiscal year 2012 | Original proposal approved | |||||
Fifth | Apr. 19, 2012 | Report on filing of Form 20-F for fiscal year 2011 | Original proposal accepted | |||
| Appointment of the chairman of Audit committee | Original proposal approved | |||||
Sixth | May 2, 2012 | Pre-approval on remuneration for non-audit services of external auditors | Original proposal rejected | |||
| Report on statement of accounts for the first half of fiscal year 2012 | Original proposal accepted | |||||
| Report on consolidated statement of accounts for the first half of fiscal year 2012 | Original proposal accepted | |||||
| Report of audit performance for the first quarter of 2012 and audit plan for the second quarter of 2012 | Original proposal accepted | |||||
Seventh | Aug. 8, 2012 | Report on statement of accounts for the first half of fiscal year 2012 | Original proposal accepted | |||
| Report on consolidated statement of accounts for the first half of fiscal year 2012 | Original proposal accepted | |||||
| Pre-approval on non-audit services provided by external auditors | Original proposal approved | |||||
| Report of final audit for first half of fiscal year 2012 | Original proposal received | |||||
| Report of audit performance for the second quarter of 2012 and audit plan for third quarter of 2012 | Original proposal received | |||||
Eighth | Oct. 31, 2012 | Report on statement of accounts for the third quarter of fiscal year 2011 | Original proposal received | |||
| Report on consolidated statement of accounts for the third quarter of fiscal year 2012 | Original proposal received | |||||
| Approval of remuneration for audit service of independent auditor for consolidated company for fiscal year 2012 | Original proposal approved | |||||
| Pre-approval of remuneration for non-audit service of independent auditor for consolidated company | Original proposal approved | |||||
| Report on agenda of the extraordinary general meeting of shareholders and result on document review | Original proposal received | |||||
| Report of audit performance for the third quarter of 2012 and audit plan for the fourth quarter of 2012 | Original proposal received |
53
Table of Contents
3. Matters on Shareholder’s Exercise of Voting Rights
(1) Adoption of Cumulative Voting System
Automatic introduction of the cumulative voting system was implemented following the completion of the privatization process in 2002.
(2) Adoption of the Written Voting System or Electronic Voting
Adoption of the written voting system in accordance with the changes in the Articles of Incorporation at the 23rd General Meeting of Shareholders (March 11, 2005)
54
Table of Contents
| [As of December 31, 2012] | (Units: In Share, KRW million, %) | |||||||||||||||||||||||||||||||||||||||||||
Name of Company or Item | Beginning Balance | Increase (Decrease) | Ending Balance | Financial Facts (Latest fiscal year) | ||||||||||||||||||||||||||||||||||||||||
| Number of Shares | Equity Ratio | Book Value | Acquisition (disposal) | Valuation | Number of Shares | Equity Ratio | Book Value | Total Assets | Net Profits | |||||||||||||||||||||||||||||||||||
| Shares | Amounts | |||||||||||||||||||||||||||||||||||||||||||
kt Powertel Co. Ltd. | 7,771,418 | 44.8 | % | 37,419 | — | — | — | 7,771,418 | 44.8 | % | 37,419 | 167,075 | 14,569 | |||||||||||||||||||||||||||||||
Kt Networks Corporation | 2,000,000 | 100.0 | % | 48,684 | — | — | — | 2,000,000 | 100.0 | % | 48,684 | 212,867 | 389 | |||||||||||||||||||||||||||||||
kt Linkus co., Ltd. | 2,941,668 | 93.8 | % | 6,282 | — | — | — | 2,941,668 | 93.8 | % | 6,282 | 67,419 | –6,667 | |||||||||||||||||||||||||||||||
kt Capital Co., Ltd. | 319,398,460 | 81.6 | % | 226,092 | 4,712,103 | 41,000 | — | 36,651,949 | 83.6 | % | 267,092 | 2,632,129 | 29,733 | |||||||||||||||||||||||||||||||
kt Rental Co., Ltd. | 5,698,768 | 58.0 | % | 156,957 | — | — | — | 5,698,768 | 58.0 | % | 156,957 | 1,369,927 | 25,353 | |||||||||||||||||||||||||||||||
Kumho Rent-a-car Co., Ltd.* | 115,625 | 50.0 | % | 1,921 | –115,625 | –1,921 | — | 0 | 0.0 | % | 0 | 3,725 | 52 | |||||||||||||||||||||||||||||||
Telecop Service Co. Ltd. | 5,765,911 | 86.8 | % | 26,045 | — | — | — | 5,765,911 | 86.8 | % | 26,045 | 156,479 | 7,075 | |||||||||||||||||||||||||||||||
kt Skylife | 23,908,000 | 50.2 | % | 311,696 | — | — | — | 23,908,000 | 50.0 | % | 311,696 | 522,876 | 26,971 | |||||||||||||||||||||||||||||||
Softnix Co.Ltd. | 120,000 | 53.3 | % | 610 | 240,000 | 1,200 | — | 360,000 | 77.4 | % | 1,810 | 970 | –481 | |||||||||||||||||||||||||||||||
kt edui Co., Ltd. | 120,000 | 53.3 | % | 610 | 240,000 | 1,200 | — | 360,000 | 77.4 | % | 1,810 | 970 | –481 | |||||||||||||||||||||||||||||||
kt New Business Investment Fund No.1 | 200 | 90.9 | % | 20,112 | — | — | — | 200 | 90.9 | % | 20,112 | 21,878 | –1,169 | |||||||||||||||||||||||||||||||
kt Data System Co., Ltd. | 2,400,000 | 91.1 | % | 19,616 | — | — | — | 2,400,000 | 91.1 | % | 19,616 | 146,236 | 10,298 | |||||||||||||||||||||||||||||||
Gyeonggi-kt Green Growth Investment Association | 125 | 40.3 | % | 12,480 | –3 | –313 | — | 122 | 40.3 | % | 12,167 | 29,567 | –2,139 | |||||||||||||||||||||||||||||||
kt Capital Media Contents Investment Fund No. 2 | 3,043 | 43.5 | % | 3,045 | — | — | — | 3,043 | 43.5 | % | 3,045 | 6,988 | –35 | |||||||||||||||||||||||||||||||
kt Innotz | 2,000,000 | 100.0 | % | 10,000 | –2,000,000 | –10,000 | — | 0 | 0.00 | % | 0 | 5,520 | –4,623 | |||||||||||||||||||||||||||||||
kt oic | 6,100,000 | 79.2 | % | 5,883 | — | — | — | 6,100,000 | 79.2 | % | 5,883 | 5,201 | –396 | |||||||||||||||||||||||||||||||
kt Estate | 5,848,819 | 100.0 | % | 29,244 | 10,000,000 | 1,052,564 | — | 15,848,819 | 100.0 | % | 1,081,808 | 30,198 | 1,337 | |||||||||||||||||||||||||||||||
Kt Strategic Investment Fund No. 1 | 100 | 90.9 | % | 10,000 | 100 | 10,000 | — | 200 | 90.90 | % | 20,000 | 11,201 | –21 | |||||||||||||||||||||||||||||||
NexR | 306,667 | 65.7 | % | 4,600 | –306,667 | –4,600 | — | 0 | 0.00 | % | 0 | 3,887 | 756 | |||||||||||||||||||||||||||||||
Korea HD Broadcasting | 6,000,000 | 14.8 | % | 3,000 | — | — | — | 6,000,000 | 14.8 | % | 3,000 | 34,799 | –2,151 | |||||||||||||||||||||||||||||||
kt-SB Data Services | 3,774,000 | 51.0 | % | 18,870 | — | — | — | 3,774,000 | 51.0 | % | 18,870 | 58,755 | –149 | |||||||||||||||||||||||||||||||
kt cloudware | 200,000 | 100.0 | % | 1,000 | 3,095,287 | 27,600 | — | 3,295,287 | 86.2 | % | 28,600 | 916 | –165 | |||||||||||||||||||||||||||||||
Enswers | 17,861 | 35.5 | % | 15,957 | — | — | — | 17,861 | 35.5 | % | 15,957 | 16,638 | –331 | |||||||||||||||||||||||||||||||
kt smartservice | 266,667 | 82.8 | % | 13,984 | — | — | — | 266,667 | 82.8 | % | 13,984 | 25,493 | –377 | |||||||||||||||||||||||||||||||
H&C Network | — | — | 0 | 10,720 | 1,011 | — | 10,720 | 1.0 | % | 1,011 | 197,726 | 1,124 | ||||||||||||||||||||||||||||||||
Ustream Korea | — | — | — | 509,532 | 2,548 | — | 509,532 | 51.0 | % | 2,548 | 0 | — | ||||||||||||||||||||||||||||||||
kt innoedu | — | — | — | 1,749,000 | 7,775 | — | 1,749,000 | 48.4 | % | 7,775 | 8,043 | 142 | ||||||||||||||||||||||||||||||||
kt Hitel | 22,750,000 | 65.9 | % | 120,078 | — | — | — | 22,750,000 | 65.9 | % | 120,078 | 249,730 | –2,833 | |||||||||||||||||||||||||||||||
kt Commerce, Inc. | 266,000 | 19.0 | % | 1,782 | — | — | — | 266,000 | 19.0 | % | 1,782 | 53,177 | 4,370 | |||||||||||||||||||||||||||||||
kt mhows Co., Ltd. | 510,000 | 51.0 | % | 3,344 | — | — | — | 510,000 | 51.0 | % | 3,344 | 15,148 | 1,092 | |||||||||||||||||||||||||||||||
kt M&S Co., Ltd. | 30,000,000 | 100.0 | % | 37,564 | 17,400,000 | 87,000 | — | 47,400,000 | 100.0 | % | 124,564 | 249,280 | –3,256 | |||||||||||||||||||||||||||||||
kt Music Co., Ltd. | 14,494,258 | 48.7 | % | 17,417 | 6,410,256 | 20,000 | — | 20,904,514 | 57.8 | % | 37,417 | 27,840 | –2,385 | |||||||||||||||||||||||||||||||
Sidus FNH Co. | 2,297,000 | 51.0 | % | 3,522 | 3,500,000 | 3,500 | — | 5,797,000 | 72.4 | % | 7,022 | 9,838 | –2,975 | |||||||||||||||||||||||||||||||
Nasmedia Co., Ltd | 1,767,516 | 50.0 | % | 23,051 | 103,687 | — | — | 1,871,203 | 51.4 | % | 23,051 | 92,384 | 6,004 | |||||||||||||||||||||||||||||||
kt media hub | — | — | — | 1,000,000 | 80,000 | — | 1,000,000 | 100.0 | % | 80,000 | — | — | ||||||||||||||||||||||||||||||||
kt sat | — | — | — | 10,000,000 | 390,530 | — | 10,000,000 | 100.0 | % | 390,530 | — | — | ||||||||||||||||||||||||||||||||
BestPartners | — | — | — | 300,000 | 1,500 | — | 300,000 | 100.0 | % | 1,500 | — | — | ||||||||||||||||||||||||||||||||
kt Strategic Investment Fund No. 2 | — | — | — | 100 | 10,000 | — | 100 | 90.9 | % | 10,000 | — | — | ||||||||||||||||||||||||||||||||
Korea Telecom America, Inc.(USA) | 6,000 | 100.0 | % | 4,064 | — | — | — | 6,000 | 100.0 | % | 4,064 | 6,368 | 149 | |||||||||||||||||||||||||||||||
Korea Telecom Japan Co., Ltd.(Japan) | 12,856 | 100.0 | % | 3,995 | — | — | — | 12,856 | 100.0 | % | 3,995 | 15,359 | 731 | |||||||||||||||||||||||||||||||
Korea Telecom China Co., Ltd.(China) | — | 100.0 | % | 2,160 | — | — | — | — | 100.0 | % | 2,160 | 2,804 | 111 | |||||||||||||||||||||||||||||||
ktsc Investment Management B.V. | 5,146,962 | 93.8 | % | 0 | — | — | — | 5,146,962 | 93.8 | % | 0 | 110,923 | 246,948 | |||||||||||||||||||||||||||||||
PT.kt Indonesia | 198,000 | 99.0 | % | 108 | — | — | — | 198,000 | 99.0 | % | 108 | 52 | –8 | |||||||||||||||||||||||||||||||
55
Table of Contents
VI. DIRECTORS, SENIOR MANAGEMENT AND EMPLOYEES
Name | Position | Director Since | Date of Birth | Expiration of Term of Office | ||||
Non-Independent Directors(1) | ||||||||
Suk-Chae Lee | Chief Executive Officer | January 2009 | September 11, 1945 | 2015 | ||||
Hyun-Myung Pyo | President | March 2009 | October 21, 1958 | 2014 | ||||
Il Yung Kim | President | March 2013 | September 8, 1956 | 2014 | ||||
Outside Directors(1) | ||||||||
E. Han Kim | Chairperson of the Board of Directors, Professor, University of Michigan | March 2009 | May 27, 1946 | 2015 | ||||
Choon-Ho Lee | Chairperson of the Board of Directors of Korea Educational Broadcasting System | March 2009 | July 22, 1945 | 2015 | ||||
Jong-Hwan Song | Professor, Myongji University | March 2010 | September 5, 1944 | 2016 | ||||
Hyun Nak Lee | Professor, Sejong University | March 2011 | November 4, 1941 | 2014 | ||||
Byong Won Bahk | Chairperson, Korean Federation of Banks | March 2011 | September 24, 1952 | 2014 | ||||
Keuk Je Sung | Professor, Graduate School of Pan-Pacific International Studies, Kyunghee University | March 2012 | June 4, 1953 | 2015 | ||||
Sang Kyun Cha | Professor, Department of Electrical and Computer Engineering, Seoul National University | March 2012 | February 19, 1958 | 2016 | ||||
Do Kyun Song | Advisor, Bae, Kim & Lee LLC | March 2013 | September 20, 1943 | 2016 |
Name(1) | Title and Responsibilities | Current Position Held Since | Years with the Company | Date of Birth | ||||
Sung-Bok Jung | Vice Chairman, Group Legal & Ethics Group | January 2009 | 4 | December 7, 1954 | ||||
Yu-Yeol Seo | President, Customer Group | January 2010 | 34 | September 9, 1956 | ||||
Hong-Jin Kim | President, Global & Enterprise Group | December 2012 | 2 | April 25, 1953 | ||||
Kyu-Taek Nam | Senior Executive Vice President, Customer Group, Chief Sales Operating Officer | February 2013 | 26 | February 6, 1961 | ||||
Won-Ki Hong | Senior Executive Vice President, Advanced Institute of Technology | March 2012 | 1 | September 28, 1959 | ||||
Jung-Hee Song | Senior Executive Vice President, Platform & Innovation Group | January 2011 | 2 | February 18, 1958 | ||||
Hong-Seok Seo | Senior Executive Vice President, Corporate Relations Office | January 2011 | 2 | November 20, 1960 | ||||
Young-Whan Kim | Senior Advisor, Human Resources Office, Research Fellow | February 2013 | 30 | February 13, 1958 | ||||
Sang-Bong Nam | Executive Vice President, Group Legal & Ethics Group | January 2013 | 0 | December 19, 1963 | ||||
Hyeon-Mo Ku | Executive Vice President, Telecom & Convergence Group, Telecom & Convergence Chief Operating Officer | February 2013 | 26 | January 13, 1964 | ||||
Hae-Jung Park | Executive Vice President, Telecom & Convergence Group Marketing Unit | August 2012 | 6 | May 23, 1963 | ||||
Tae-Hyo Ahn | Executive Vice President, Telecom & Convergence Group Virtual Goods Business Unit | July 2011 | 28 | January 24, 1962 | ||||
Young-Hee Song | Executive Vice President, Telecom & Convergence Group Value Innovation Cross Functional Team | August 2012 | 3 | February 10, 1961 | ||||
Yong-Hwa Park | Executive Vice President, Customer Group Customer Satisfaction Unit | July 2011 | 29 | March 2, 1958 | ||||
Soo-Kyoung Lim | Executive Vice President, Global & Enterprise Group, Global & Enterprise Chief Business Officer | December 2012 | 0 | December 3, 1961 | ||||
Kyu-Shik Shin | Executive Vice President, Global & Enterprise Group, Domestic Enterprise Chief Sales Officer | January 2012 | 2 | June 7, 1957 | ||||
Dong-Myun Lee | Executive Vice President, Advanced Institute of Technology Infrastructure Laboratory | February 2013 | 21 | October 15, 1962 | ||||
Seong-Mok Oh | Executive Vice President, Network Group | December 2012 | 27 | August 20, 1960 | ||||
Se-Hyun Oh | Executive Vice President, New Business Unit | December 2012 | 2 | July 2, 1963 | ||||
Bum-Joon Kim | Executive Vice President, Value Management Office | February 2012 | 9 | March 25, 1965 | ||||
Seok-Keun Oh | Executive Vice President, Corporate Relations Support Office | January 2012 | 14 | August 28, 1961 | ||||
Eun-Hye Kim | Executive Vice President, Communications Office | December 2012 | 2 | January 6, 1971 |
56
Table of Contents
Name(1) | Title and Responsibilities | Current Position Held Since | Years with the Company | Date of Birth | ||||
Jae-Geun Choi | Executive Vice President, Communications Office Creating Shared Value Unit | December 2012 | 4 | November 30, 1961 | ||||
Sang-Hyo Kim | Executive Vice President, Human Resources Office | May 2010 | 2 | April 1, 1956 | ||||
Jeong-Tae Park | Executive Vice President, Group Shared Service Group | December 2012 | 29 | December 10, 1959 | ||||
Sa-Il Kwon | Executive Vice President, Group Shared Service Group | February 2013 | 35 | January 30, 1957 | ||||
Tae-Yol Yoo | Executive Vice President, Economics & Management Research Institute | January 2009 | 28 | April 4, 1960 | ||||
Sun-Cheol Gweon | Executive Vice President, Office of Chief Executive Officer | February 2013 | 22 | March 1, 1962 | ||||
Young-Hui Lee | Executive Vice President, Human Resources Office, Research Fellow | October 2011 | 31 | August 7, 1957 | ||||
Dong-Hoon Han | Executive Vice President, Human Resources Office, Research Fellow | February 2013 | 31 | September 12, 1959 | ||||
Tae-Il Park | Executive Vice President, Human Resources Office, Research Fellow | February 2013 | 35 | February 24, 1956 | ||||
Ki-Chul Kim | Executive Vice President, Human Resources Office, Research Fellow | February 2013 | 12 | January 1, 1955 | ||||
Young-Soo Woo | Senior Vice President, Group Corporate Center Strategy & Planning Office/Corporate Planning Department | February 2013 | 1 | August 13, 1964 | ||||
Doo-Seong Cheon | Senior Vice President, Group Corporate Center Strategy & Planning Office/Group Executives Department | February 2013 | 3 | May 1, 1968 | ||||
Sang-Wook Seo | Senior Vice President, Group Corporate Center Strategy & Planning Office/Strategic Investment Department | November 2011 | 1 | January 26, 1972 | ||||
Young-Lyoul Lee | Senior Vice President, Group Corporate Center Strategy & Planning Office/Special Task Force | February 2013 | 6 | September 17, 1962 | ||||
Sung-Hoon Shim | Senior Vice President, Group Corporate Center Synergy Management Office | February 2013 | 25 | February 25, 1964 | ||||
Hoon Cho | Senior Vice President, Group Corporate Center Synergy Management Office/Group Strategy Department | February 2013 | 20 | December 4, 1966 | ||||
Byung-Sam Park | Senior Vice President, Legal Department | March 2013 | 0 | October 13, 1966 | ||||
Sook-Kyung Sung | Senior Vice President, Intellectual Property Management Department | June 2010 | 13 | November 18, 1964 | ||||
Eung-Ho Lee | Senior Vice President, Telecom & Convergence Group, Telecom & Convergence Chief Operating Officer | February 2013 | 22 | December 7, 1962 | ||||
Bong-Goon Kwak | Senior Vice President, Telecom & Convergence Group Fast Incubation Unit | July 2011 | 28 | March 2, 1960 | ||||
Jin-Sik Kim | Senior Vice President, Telecom & Convergence Group, Chief Operating Officer of Global Media Business Task Force | March 2013 | 0 | June 21, 1969 | ||||
Sung-Kyu Yang | Senior Vice President, Telecom & Convergence Group Marketing Unit | January 2011 | 25 | March 14, 1962 | ||||
Hyung-Wook Kim | Senior Vice President, Telecom & Convergence Group Product Business Unit No. 1 | February 2013 | 16 | April 24, 1963 | ||||
Pill-Jai Lee | Senior Vice President, Telecom & Convergence Group Product Business Unit No. 2 | February 2013 | 25 | October 3, 1961 | ||||
Kyung-Kon Koh | Senior Vice President, Telecom & Convergence Group Online Business Unit | February 2013 | 3 | April 28, 1963 | ||||
Hye-Jeong Yun | Senior Vice President, Telecom & Convergence Group Internet Marketing Department | March 2011 | 22 | June 12, 1966 | ||||
Kuk-Hyun Kang | Senior Vice President, Telecom & Convergence Group Device Business Unit | February 2013 | 24 | September 8, 1963 | ||||
Hyon-Seog Lee | Senior Vice President, Customer Group Sales Planning Unit | February 2013 | 21 | March 10, 1962 | ||||
Eun-Hee Choi | Senior Vice President, Customer Group Value Creation & Distribution Unit | February 2013 | 26 | March 15, 1963 | ||||
Young-Sik Park | Senior Vice President, Small & Medium Business Customer Unit | December 2010 | 34 | April 9, 1957 | ||||
Seung-Gyum Kim | Senior Vice President, Customer Group Operating Support Office | February 2013 | 27 | June 21, 1961 | ||||
Myung-Bum Pyun | Senior Vice President, Customer Group Northern Seoul Sales Headquarter | August 2012 | 15 | June 19, 1960 | ||||
Seung-Dong Gye | Senior Vice President, Customer Group Southern Seoul Sales Headquarter | February 2013 | 35 | June 6, 1958 | ||||
Jae-Eui Choi | Senior Vice President, Customer Group Southern Seoul Sales Headquarter Youngdong Sales Branch | February 2013 | 26 | April 17, 1961 | ||||
Hyung-Chul Park | Senior Vice President, Customer Group Southern Seoul Sales Headquarter Shinsa Sales Branch | August 2012 | 27 | February 2, 1962 | ||||
Jong-Hack Kang | Senior Vice President, Customer Group Western Seoul Sales Headquarter | August 2012 | 27 | April 5, 1959 | ||||
Wook-Yeong Ryu | Senior Vice President, Customer Group Busan Sales Headquarter | January 2012 | 37 | December 20, 1956 | ||||
Jin-Hoon Kim | Senior Vice President, Customer Group Daegu Sales Headquarter | January 2012 | 26 | May 5, 1960 | ||||
Sang-Gyun Kim | Senior Vice President, Customer Group Jeonnam Sales Headquarter | February 2013 | 25 | July 20, 1959 | ||||
Hong-Jae Lee | Senior Vice President, Customer Group Jeonbuk Sales Headquarter | August 2012 | 27 | August 29, 1962 | ||||
Yun-Su Kim | Senior Vice President, Customer Group Chungnam Sales Headquarter | February 2013 | 20 | November 2, 1963 | ||||
Tae-Il Kwon | Senior Vice President, Customer Group Chungbuk Sales Headquarter | August 2012 | 28 | January 11, 1958 | ||||
Moon-Chul Jung | Senior Vice President, Customer Group Gangwon Sales Headquarter | February 2013 | 27 | August 5, 1957 |
57
Table of Contents
Name(1) | Title and Responsibilities | Current Position Held Since | Years with the Company | Date of Birth | ||||
Jun-Su Jeong | Senior Vice President, Customer Group Jeju Sales Headquarter | August 2012 | 21 | November 2, 1962 | ||||
Hee-Kyoung Song | Senior Vice President, Global & Enterprise Group Enterprise IT Business Unit | February 2013 | 0 | July 24, 1964 | ||||
Moon-Hwan Lee | Senior Vice President, Global & Enterprise Group Enterprise Telco Business Unit | February 2013 | 24 | October 1, 1963 | ||||
Han-Wook Jung | Senior Vice President, Global & Enterprise Group Service Delivery Business Unit | February 2013 | 27 | January 22, 1961 | ||||
Jae-Gyo Kim | Senior Vice President, Global & Enterprise Group Public Customer Business Unit | February 2013 | 34 | September 23, 1958 | ||||
Yoon-Sik Jeong | Senior Vice President, Global & Enterprise Group Enterprise Customer Business Unit | February 2013 | 4 | September 30, 1964 | ||||
Jun-Sick Bahk | Senior Vice President, Global & Enterprise Group Global Business Unit | February 2013 | 2 | February 16, 1967 | ||||
Sang-Wook Kim | Senior Vice President, Global & Enterprise Group Asia Department | January 2012 | 2 | February 14, 1965 | ||||
Jung-Sub Kwak | Senior Vice President, Global & Enterprise Group Global Project Group | February 2013 | 1 | April 2, 1961 | ||||
Pan-Sik Shin | Senior Vice President, Global & Enterprise Group Global Project Group | November 2012 | 26 | February 25, 1959 | ||||
Young-Suk Jeon | Senior Vice President, Global & Enterprise Group Global Project Group | November 2012 | 22 | December 14, 1963 | ||||
Hong-Beom Jeon | Senior Vice President, Advanced Institute of Technology Strategy Office | February 2013 | 21 | October 3, 1962 | ||||
Sung-Chun Lee | Senior Vice President, Advanced Institute of Technology Service Laboratory | February 2013 | 27 | May 28, 1960 | ||||
Yoon-Young Park | Senior Vice President, Advanced Institute of Technology Convergence Laboratory | February 2013 | 20 | April 18, 1962 | ||||
Jae-Yoon Park | Senior Vice President, Network Group Network Strategy Planning Unit | February 2013 | 26 | December 18, 1960 | ||||
Cha-Hyun Yoon | Senior Vice President, Network Group Network Building Unit | February 2013 | 28 | December 2, 1961 | ||||
Young-Sik Kim | Senior Vice President, Network Group Network Operation & Maintenance Unit | February 2013 | 22 | March 15, 1961 | ||||
Tae-Sung Lim | Senior Vice President, Network Group Global Technology Consulting Unit | February 2013 | 22 | March 4. 1963 | ||||
Young-Hyun Kim | Senior Vice President, Network Group Gangbuk Network Operation & Maintenance Headquarter | August 2012 | 35 | December 19, 1958 | ||||
Cheol-Gyu Lee | Senior Vice President, Network Group Honam Network Operation & Maintenance Headquarter | August 2012 | 27 | August 24, 1960 | ||||
Dae-San Lee | Senior Vice President, Network Group Daegu Network Operation & Maintenance Headquarter | February 2013 | 26 | January 10, 1961 | ||||
Yung-Sig Yoon | Senior Vice President, Network Group Busan Network Operation & Maintenance Headquarter | February 2013 | 29 | November 20, 1956 | ||||
Jae-Ho Jang | Senior Vice President, Platform & Innovation Group IT Strategy & Planning Unit | February 2012 | 1 | July 12, 1962 | ||||
June-Keun Kim | Senior Vice President, Platform & Innovation Group Management Infrastructure Innovation Department | December 2011 | 2 | November 12, 1966 | ||||
Sang-Yong Lee | Senior Vice President, Platform & Innovation Group Data & Information Security Department | November 2010 | 2 | December 23, 1967 | ||||
Jae Lee | Senior Vice President, Platform & Innovation Group Business & Information Transformation Unit | December 2010 | 2 | March 2, 1970 | ||||
Hyeon-Kyu Lee | Senior Vice President, Platform & Innovation Group Open Platform Development Unit | January 2011 | 2 | May 13, 1962 | ||||
Yi-Shik Kim | Senior Vice President, Platform & Innovation Group Big Data Department | December 2012 | 0 | December 16, 1968 | ||||
Dong-Sik Yun | Senior Vice President, Platform & Innovation Group Common Platform Development Unit | February 2013 | 25 | June 9, 1963 | ||||
Jung-Sik Suh | Senior Vice President, Platform & Innovation Group Cloud Convergence Task Force | March 2013 | 6 | June 21, 1969 | ||||
Ji-Yun Kim | Senior Vice President, Platform & Innovation Group Cloud Infra Development Unit | February 2012 | 1 | January 27, 1968 | ||||
Jae-Ho Song | Senior Vice President, Platform & Innovation Group Business Transformation Office Unit | February 2013 | 20 | March 26, 1966 | ||||
Gwang-Suk Shin | Senior Vice President, Value Management Office Value Management Department | March 2012 | 24 | January 5, 1960 | ||||
Seong-Jin Lee | Senior Vice President, Value Management Office Group Financial & Accounting Department | January 2009 | 16 | December 2, 1958 | ||||
Jae-Yon Cha | Senior Vice President, Value Management Office Cash Flow Management Department | January 2012 | 22 | September 25, 1965 | ||||
Choong-Seop Lee | Senior Vice President, Corporate Relations Support Office Corporate Relations Cooperation Department | January 2012 | 13 | June 3, 1958 | ||||
Young-Pil Park | Senior Vice President, Corporate Relations Support Office Corporate Relations Support Department | March 2009 | 8 | February 9, 1968 | ||||
Min-Woo Seo | Senior Vice President, Communications Office Public Affairs and Communications Department No. 1 | January 2009 | 27 | February 7, 1960 | ||||
Hwa Jung | Senior Vice President, Human Resources Office | December 2010 | 24 | August 10, 1964 |
58
Table of Contents
Name(1) | Title and Responsibilities | Current Position Held Since | Years with the Company | Date of Birth | ||||
Hyun-Yok Sheen | Senior Vice President, Group Shared Service Group General Affairs Office | February 2013 | 19 | August 25, 1968 | ||||
Sang-Pyo Kwon | Senior Vice President, Group Shared Service Group Procurement Strategy Office | January 2012 | 27 | January 7, 1960 | ||||
Young-Beum Joo | Senior Vice President, Group Shared Service Group KT Sports Department | August 2012 | 24 | October 1, 1963 | ||||
Hee-Su Kim | Senior Vice President, Economics & Management Research Institute | February 2012 | 2 | October 15, 1962 | ||||
Hyo-Sill Kim | Senior Vice President, Economics & Management Research Institute Network Value Task Force | February 2012 | 20 | April 17, 1963 | ||||
Kwang-Jin Oh | Senior Vice President, Economics & Management Research Institute Group Consulting Support Unit | January 2012 | 15 | January 15, 1959 | ||||
Jin-Soo Sohn | Senior Vice President, Group Consulting Support Unit Project Expert Group | February 2013 | 27 | December 15, 1960 | ||||
Dae-Su Park | Senior Vice President, Group Consulting Support Unit Project Expert Group | February 2013 | 23 | October 28, 1963 | ||||
Jin-Chul Kim | Senior Vice President, Human Resources Office | February 2013 | 24 | May 25, 1962 | ||||
Gang-Geun Lee | Senior Vice President, Human Resources Office | February 2013 | 24 | June 22, 1961 | ||||
Jae-Hyeon Kim | Senior Vice President, Human Resources Office | February 2013 | 15 | September 26, 1962 | ||||
Won-Sik Han | Senior Vice President, Human Resources Office | February 2013 | 28 | October 26, 1960 | ||||
Kyung-Seok Park | Senior Vice President, Human Resources Office, Research Fellow | February 2013 | 27 | February 10, 1958 | ||||
Jung-Won Park | Senior Vice President, Human Resources Office, Research Fellow | February 2013 | 27 | July 26, 1959 | ||||
Ki-Soong Jang | Senior Vice President, Human Resources Office, Research Fellow | February 2013 | 28 | October 17, 1958 | ||||
Youn-Mo Jeon | Senior Vice President, Human Resources Office, Research Fellow | February 2013 | 15 | September 6, 1960 | ||||
Sung-Hwan Gong | Senior Vice President, Human Resources Office, Research Fellow | February 2013 | 27 | December 21, 1960 |
3. Current Status of Employees
| (Unit: Persons, Years, KRW million) | ||||||||||||||||||||||||||
Type | Number of Employees | Average Years in Continuous Service | Total Payroll | Average Payroll per Person | Note | |||||||||||||||||||||
| General | Other | Total | ||||||||||||||||||||||||
Total | 31,336 | 850 | 32,186 | 19.6 | 1,942,640 | 62 | ||||||||||||||||||||
| • | Number of employees: As of December 31, 2012 (excluding executive directors) |
| • | Average years in continuous services: Calculated using aggregate years of service of employees as of December 31, 2012 divided by number of employees as of December 31, 2012 |
| • | Average payroll per person: Calculated using yearly average number of employees (31,280 employees) |
| * | Average payroll per person = total payroll amount / yearlyaverage number of employees. |
4. Remuneration to Executive Officers
| (1) | Remuneration paid to Directors (including Outside Directors) and Members of the Audit Committee (Auditors) |
| (Unit: KRW million) | ||||||||||||||||||||||||
Category | Total Amount Paid | Amount Approved by the General Meeting of Shareholders | Average Amount Paid per Person | Fair Value of Stock Option | Weight | Reference | ||||||||||||||||||
3 Non-Independent Directors | 39.9 | 65 | 13.3 | — | — | — | ||||||||||||||||||
8 Outside Directors | 5.4 | 0.7 | — | — | — | |||||||||||||||||||
The number of outside directors is including Hae-Bang Chung who is retired midway on April 20, 2012
Non-Independent directors of retirement benefits, employee benefits included in the amount paid
59
Table of Contents
| (2) | Grant and Exercise of Stock Option |
| * | Not applicable as of December 31, 2012 |
VII. The Principal Risks and Uncertainties Facing the Company
1. Risks Relating to Our Business
Competition in the Korean telecommunications industry is intense.
Competition in the telecommunications sector in Korea is intense. In recent years, business combinations in the telecommunications industry have significantly changed the competitive landscape of the Korean telecommunications industry. In particular, SK Telecom Co., Ltd. (or SK Telecom) acquired a controlling stake in Hanarotelecom Incorporated in 2008, which was renamed SK Broadband Co., Ltd. (or SK Broadband). The acquisition enabled SK Telecom to provide fixed-line telecommunications, broadband Internet access and Internet television (or IP-TV) services together with its mobile telecommunications services. On January 1, 2010, LG Dacom Corporation (or LG Dacom) and LG Powercom Co., Ltd. (or LG Powercom) merged into LG Telecom Co., Ltd., which subsequently changed its name to LG U+. The merger enabled LG U+ to provide a similar range of services as SK Telecom and us. Our inability to adapt to such changes in the competitive landscape could have a material adverse effect on our business, financial condition and results of operations.
In addition to our competition with integrated telecommunications service providers, we face increasing competition from specific service providers, such as Internet phone service providers, Internet text message service providers, voice resellers and call-back service providers. In recent years, the increasing popularity of Internet phone and free text message services, such as Skype and Kakao Talk, have had a negative impact on demand for our telecommunications and text message services while creating additional data transmission usage by our Internet and mobile subscribers. Our inability to adapt to such changes in the competitive landscape could have a material adverse effect on our business, financial condition and results of operations.
Mobile Service.We provide mobile services based on Wideband Code Division Multiple Access (or W-CDMA) technology and Long-Term Evolution (or LTE) technology. Competitors in the mobile telecommunications service industry are SK Telecom and LG U+. We had a market share of 30.8% as of December 31, 2012, making us the second largest mobile telecommunications service provider in Korea. SK Telecom had a market share of 50.3% as of December 31, 2012.
Mobile subscribers are allowed to switch their service provider while retaining the same mobile phone number. Mobile service providers also grant subsidies to subscribers who purchase new handsets and agree to a minimum subscription period. Mobile number portability and handset subsidies have intensified competition among the mobile service providers and increased their marketing expenses. If the mobile service providers adopt a strategy of expanding market share through price competition, it could lead to a decrease in our net profit margins.
Since 2011, SK Telecom, LG U+ and we have launched fourth-generation mobile telecommunications services based on LTE technology, which we believe has further intensified competition among the three companies and resulted in an increase in marketing expenses and capital expenditures related to implementing and providing 4G LTE services. SK Telecom and LG U+ began providing 4G LTE services in July 2011, and we commenced providing commercial 4G LTE services on January 3, 2012 utilizing our bandwidths in the 1.8 GHz spectrum that became available upon termination of our 2G services based on Code Division Multiple Access (or CDMA) technology. Although we expect that SK Telecom and LG U+ will face similar challenges to those that we expect to face in implementing this fourth-generation technology, we cannot assure you that we will continue to be able to successfully compete in fourth-generation mobile telecommunications services.
Fixed-line Telephone Services. Before December 1991, we were the sole provider of local, domestic long-distance and international long-distance telephone services in Korea. Since then, various competitors have entered the local, domestic long-distance and international long-distance telephone service markets in Korea, which have eroded our market shares. LG U+ and SK Broadband currently provide local, domestic long-distance and international long-distance telephone services. In addition, Onse Telecom Corporation and SK Telink, Inc. currently provide domestic long-distance and international long-distance telephone services. We also compete with specific service providers, such as Internet phone service providers, voice resellers and call-back service providers, that offer international long-distance service in Korea. While we offer our own Internet phone service, the entry of these and other potential competitors into the local, domestic long-distance and international long-distance telephone service markets has had and may continue to have a material adverse effect on our revenues and profitability from these businesses. As of December 31, 2012, we had a market share in local telephone service of 82.8% and a market share in domestic long distance service of 79.2%. Further increase in competition may decrease our market shares in such businesses.
60
Table of Contents
Internet Services. The Korean broadband Internet access service market has experienced significant growth in the past decade. SK Broadband (formerly Hanarotelecom) entered the broadband market in 1999 offering both Hybrid Fiber Coaxial (or HFC) and Asymmetric Digital Subscriber Line (or ADSL) services. We also began offering broadband Internet access service in 1999, followed by Dreamline, Onse and LG U+. In recent years, numerous cable television operators have also begun to offer HFC-based services at rates lower than ours. We had a market share of 44.0% as of December 31, 2012. As a result of having to compete with a number of competitors and the maturing of the Internet access service market, we currently encounter, and we expect to encounter, pressure to increase marketing expenses in the future.
The market for other Internet-related services in Korea, including IP-TV and Internet phone services, is also very competitive. We anticipate that competition will continue to intensify as the usage and popularity of the Internet grows and as new domestic and international competitors enter the Internet industry in Korea. The substantial growth of the Internet industry in Korea has attracted many competitors and as a result may lead to increasing price competition to provide Internet-related services. Increased competition in the Internet industry could have a material adverse effect on the number of subscribers of our Internet-related service and on our results of operations.
Failure to renew existing bandwidth spectrum, acquire adequate additional bandwidth spectrum or use our bandwidth efficiently may adversely affect our mobile telecommunications business and results of operations.
One of the principal limitations on a wireless network’s subscriber capacity is the amount of bandwidth spectrum allocated to the service provider. We have a license to use 40 MHz of bandwidth in the 2.1 GHz spectrum that we use to provide IMT-2000 services based on W-CDMA wireless network standards. Such license expires in December 2016, and we are required to pay approximately ₩1.3 trillion during the license period of 15 years. In April 2010, the Korea Communications Commission announced its decision to allocate 20 MHz of bandwidth in the 900 MHz spectrum to us, which became effective in July 2011, for which we are required to pay a portion of the actual sales generated from using the bandwidth in the 900 MHz spectrum during the license period of 10 years as a usage fee for the bandwidth, as well as a portion of expected sales that was determined by the Korea Communications Commission at the time of allocation. In June 2011, our right to use 40 MHz of bandwidth in the 1.8 GHz spectrum expired, and the Korea Communications Commission allocated back to us the right to use 20 MHz of such bandwidth in the 1.8 GHz spectrum upon expiration pursuant to our application, for which we are required to pay a portion of the actual sales generated from using the bandwidth in the 1.8 GHz spectrum during the license period of 10 years as a usage fee for the bandwidth, as well as a portion of expected sales that was determined by the Korea Communications Commission at the time of allocation.
In August 2011, the Korea Communications Commission auctioned the right to use the remaining 20 MHz of bandwidth in the 1.8 GHz spectrum that we relinquished, 10 MHz of additional bandwidth in the 800 MHz spectrum and 20 MHz of additional bandwidth in the 2.1 GHz spectrum. We acquired the right to use the 10 MHz of bandwidth in the 800 MHz spectrum, for which we are required to pay a total usage fee of ₩261 billion during the license period of 10 years, SK Telecom acquired the right to use the 20 MHz of bandwidth in the 1.8 GHz spectrum and LG U+ acquired the right to use the 20 MHz bandwidth in the 2.1 GHz spectrum. We began using the 20 MHz of bandwidth in the 1.8 GHz spectrum, which became available upon termination of our 2G PCS services, to provide our 4G LTE services starting in January 2012, and expect to utilize the newly allocated bandwidths in the 800 MHz and 900 MHz spectrums to further expand our 4G LTE services in the future, if necessary. The Korea Communications Commission announced in December 2012 that it will further auction 60 MHz of bandwidth in the 1.8 GHz spectrum, which had been used by governmental entities such as the military, and 80 MHz of bandwidth in the 2.6 GHz spectrum, which had been used for digital multimedia broadcasting services. The auction is expected to take place in June 2013.
The growth of our mobile telecommunications business and the increase in usage of wireless data transmission services have been significant factors in the increased utilization of our bandwidth, since wireless data applications are generally more bandwidth-intensive than voice services. The current trend of increasing data transmission use and the increasing sophistication of multimedia contents are likely to put additional strain on the bandwidth capacity of mobile service providers. In the event we are unable to maintain sufficient bandwidth capacity by renewing existing bandwidth spectrum, receiving additional bandwidth allocation, or cost-effectively implementing technologies that enhance bandwidth usage efficiency, our subscribers may perceive a general decrease in quality of mobile telecommunications services. No assurance can be given that bandwidth constraints will not adversely affect the growth of our mobile telecommunications business.
61
Table of Contents
Introduction of new services, including our 4G LTE services, poses challenges and risks to us.
The telecommunications industry is characterized by continual advances and improvements in telecommunications technology, and we have been continually researching and implementing technology upgrades and additional telecommunication services to maintain our competitiveness. For example, in March 2005, we acquired a license to provide wireless broadband Internet access (or WiBro) service for ₩126 billion, and commercially launched our service in June 2006. We completed the upgrade of our 4G WiBro network and expanded our WiBro service coverage to 84 cities nationwide and major highways in March 2011, which we believe allows us to provide WiBro services at speeds that are approximately three times faster than our previous 3G network at a lower cost, and had approximately 934,000 subscribers as of December 31, 2012. We are also upgrading our broadband network to enable FTTH connection, which enhances downstream speed and connection quality. FTTH is a telecommunication architecture in which a communication path is provided over optical fiber cables extending from the telecommunications operator’s switching equipment to the boundary of home or office. FTTH uses fiber optic cable, which is able to carry a high-bandwidth signal for longer distances without degradation. FTTH enables us to deliver enhanced products and services that require high bandwidth, such as IP-TV service and delivery of other digital media content.
In addition, we have been building more advanced mobile telecommunications networks based on LTE technology, which is generally referred to as a 4G technology, and commenced providing commercial 4G LTE services in the Seoul metropolitan area on January 3, 2012. We completed the expansion of our 4G LTE service coverage nationwide in October 2012. Several wireless carriers in the United States, Europe and Asia commenced LTE services in recent years and LTE technology is expected to be widely accepted as the standard 4G technology. LTE technology enables data to be transmitted faster than W-CDMA, up to 75 Mbps for downloading and up to 37.5 Mbps for uploading. We believe that the faster data transmission speed of the LTE network, combined with our existing 4G nationwide WiBro network, allows us to offer significantly improved wireless data transmission services, providing our subscribers with faster wireless access to multimedia content. No assurance can be given that our new services will gain broad market acceptance such that we will be able to derive revenues from such services to justify the license fee, capital expenditures and other investments required to provide such services.
Termination of our second generation Personal Communications Service (or 2G PCS) services may pose risks to us.
As part of our decision to apply for reallocation of the 20 MHz bandwidth in the 1.8 GHz spectrum, we applied to the Korea Communications Commission to terminate our 2G PCS services, and on November 23, 2011, the Korea Communications Commission approved our plan. However, on November 30, 2011, approximately 900 of our 2G PCS service subscribers filed a class-action suit against the Korea Communications Commission for its approval of our plan, claiming that we used improper means to reduce our 2G PCS subscribers to comply with regulatory requirements before terminating the 2G PSC services and that the Korea Communications Commission did not consider such factor in approving our plan. On December 6, 2011, the Seoul Administrative Court issued a preliminary injunction, which temporarily suspended our termination of the 2G PCS services until the case went to trial. We immediately appealed the decision and the Seoul High Court overruled the preliminary injunction on December 26, 2011 and reinstated the Korea Communications Commission’s approval. Accordingly, we terminated our 2G PCS services in the Seoul metropolitan area and began the termination process for the rest of Korea on January 3, 2012. On January 12, 2012, the 2G subscribers filed an appeal of the Seoul High Court’s decision with the Supreme Court of Korea, and on February 1, 2012, the Supreme Court of Korea denied such appeal. On January 17, 2012, trial for the original class-action suit filed by the 2G subscribers began in the Seoul Administrative Court. On May 8, 2012, the Seoul Administrative court ruled in our favor on all claims and the plaintiffs subsequently filed an appeal with the Seoul High Court. On September 15, 2012, the Seoul High Court denied the plaintiffs’ appeal, and the plaintiffs appealed the decision to the Supreme Court of Korea. On February 15, 2013, the Supreme Court of Korea denied the plaintiffs’ appeal. There are currently three other similar appeals pending in the Supreme Court of Korea. While we expect these appeals to also be resolved in our favor, there can be no assurance that we will not incur reputational damage from terminating our 2G PCS services, or that further complaints and other potential actions of our 2G PCS subscribers will not adversely affect our business, financial condition and results of operations.
62
Table of Contents
We may not be able to successfully pursue our strategy to acquire businesses and enter into joint ventures that complement or diversify our current business, and we may need to incur additional debt to finance such expansion activities.
One key aspect of our overall business strategy calls for acquisitions of businesses and entering into joint ventures that complement or diversify our current business. In October 2011, we, through our subsidiary KT Capital Co., Ltd., acquired 1,622,520 common shares of BC Card Co., Ltd. to further diversify our business and to create synergies through utilization of our mobile telecommunications network in financial services. In January 2011, we acquired 5,600,000 shares of redeemable convertible preferred stock with voting rights and convertible bonds that were convertible into 5,600,000 shares of common stock of KT Skylife Co., Ltd., a provider of satellite TV service which may also be packaged with our IP-TV services, from Dutch Savings Holdings B.V. for approximately W246 billion. We exercised the conversion rights on the redeemable convertible preferred stock and the convertible bonds in March 2011, and owned a 50.2% interest in KT Skylife Co., Ltd. as of December 31, 2012. In December 2012, we submitted a non-binding bid for Vivendi SA’s 53.0% controlling stake in Maroc Telecom SA, a telecommunications service provider based in Rabat, Morocco. While we announced our decision in March 2013 not to submit a formal bid for Maroc Telecom SA, we may consider various investment options with Maroc Telecom SA.
While we plan to continue our search for other suitable acquisition and joint venture opportunities, we cannot provide assurance that we will be able to identify additional attractive opportunities or that we will successfully complete the transactions, including the bid for Maroc Telcom SA, without encountering administrative, technical, political, financial or other difficulties, or at all. Even if we were to successfully complete the transactions, success of an acquisition or a joint venture depends largely on our ability to achieve the anticipated synergies, cost savings and growth opportunities from integrating the business of the acquired company or the joint venture with our business. There can be no assurance that we will achieve the anticipated benefits of the transaction, which may adversely affect our business, financial condition and results of operations.
Pursuing acquisitions or joint venture transactions also requires significant capital, and as we pursue further growth opportunities for the future, we may need to raise additional capital through incurring loans or through issuances of bonds or other securities in the international capital markets. The bid for Maroc Telcom SA may also require significant capital resources if our bid is eventually successful. However, we cannot guarantee that such capital will be available when needed due to conditions in the capital markets, or that even if such capital is available, it will be available on commercially acceptable terms or in sufficient amounts to make the expenditures required.
Disputes with our labor union may disrupt our business operations.
In the past, we have experienced opposition from our labor union for our strategy of restructuring to improve our efficiency and profitability by disposing of non-core businesses and reducing our employee base. Although we have not experienced any significant labor disputes or unrests in recent years, there can be no assurance that we will not experience labor disputes or unrests in the future, including expanded protests and strikes, which could disrupt our business operations and have an adverse effect on our financial condition and results of operations.
We also negotiate collective bargaining agreements every two years with our labor union and annually negotiate a wage agreement. Our current collective bargaining agreement expires on May 23, 2013. Although we have been able to reach collective bargaining agreements and wage agreements with our labor union in recent years, there can be no assurance that we will not experience labor disputes and unrests resulting from disagreements with the labor union in the future.
The Korean telecommunications and Internet protocol broadcasting industries are subject to extensive Government regulations, and changes in Government policy relating to these industries could have a material adverse effect on our operations and financial condition.
The Government, primarily through the Ministry of Science, ICT & Future Planning (the “MSIP”) (ICT standing for Information & Communication Technology) and the Korea Communications Commission, has authority to regulate the telecommunications industry. Until recently, regulation of the telecommunications industry has mainly been the responsibility of the Korea Communications Commission. With the establishment of the newly created MSIP on March 23, 2013, however, such regulatory responsibility has mostly been transferred to the MSIP. The MSIP’s policy is to promote competition in the Korean telecommunications markets through measures designed to prevent the dominant service provider in any such market from exercising its market power in such a way as to prevent the emergence and development of viable competitors.
63
Table of Contents
Under current Government regulations, if a network service provider has the largest market share for a specified type of service and its revenue from that service for the previous year exceeds a specific revenue amount set by the MSIP, it must obtain prior approval from the MSIP for the rates and the general terms for that service. Each year the MSIP designates service providers the rates and the general terms of which must be approved by the Korea Communications Commission. In recent years, the Korea Communications Commission had so designated us for local telephone service and SK Telecom for mobile service, and the MSIP, in consultation with the Ministry of Strategy and Finance, currently approves rates charged by us and SK Telecom for such services.
The MSIP currently does not regulate our domestic long-distance, international long-distance, broadband internet access and mobile service rates, but the inability to freely set our local telephone service rates may hurt profits from such business and impede our ability to compete effectively against our competitors. The form of our standard agreement for providing local network service and each agreement for interconnection with other service providers are also subject to approval by the MSIP. In addition, the MSIP may periodically announce public policy guidelines or suggestions that we take into consideration in setting our tariff for non-regulated services. In June 2011, upon recommendation of the Korea Communications Commission, SK Telecom announced tariff reduction measures, including a reduction of the monthly fee by ₩1,000 for every subscriber, an exemption of usage charges for short text message service, or SMS, up to 50 messages per month and the introduction of flexible service plans for smartphone users. In August 2011, after discussions with the Korea Communications Commission, we announced the adoption of various tariff reduction measures, including a reduction of the monthly fee by ₩1,000 for every mobile subscriber (effective October 21, 2011), an exemption of usage charges for SMS, of up to 50 messages per month (effective November 1, 2011) and the introduction of customized fixed rate plans for smartphone users (effective October 24, 2011). There can be no assurance that we will not adopt other tariff-reducing measures in the future to comply with the Government’s public policy guidelines or suggestions.
Based on investigations conducted in December 2012 and January 2013, the Korea Communications Commission imposed a combined fine of approximately ₩12 billion on SK Telecom, LG U+ and us in January 2013 (our fine being approximately ₩2.9 billion), for providing subsidies that were higher than those allowed under current regulations to new mobile phone purchasers and subscribers, and also imposed temporary suspensions from recruiting new customers ranging from 20 days to 24 days from signing new subscribers. In March 2013, the Korea Communications Commission again imposed a combined fine of approximately ₩5 billion on SK Telecom, LG U+ and us (our fine being approximately ₩1.6 billion), for continuing to offer subsidies during the suspension period.
President Park Geun-hye, who took office on February 25, 2013 as the 18th President of Korea, announced that the new Government will work toward reducing telecommunications service charges and promoting transparency in the decision making of telecommunications service providers. Accordingly, the new Government has set detailed policy objectives to (1) gradually reduce and abolish initial subscription fees by 2015, (2) expand mobile virtual network operator and mobile voice over Internet protocol (“m-VoIP”) service, (3) intensify regulations on handset subsidies and (4) construct a data-based tariff system. While it is questionable whether the new Government’s telecommunications policy will be effective in light of the previous Government’s failure to keep to its policy objective of reducing tariffs by more than 20.0%, which resulted in fee reductions as described above, if the new Government goes forward with its new telecommunications policy, it will increase competition among wireless service providers and our business and our profitability may be adversely affected.
The Government also sets the policies regarding the use of radio frequencies and allocates the spectrum of radio frequencies used for wireless telecommunications. For a discussion of the Government’s recent policies and practices on bandwidth spectrum allocation. The new allocations of bandwidth could increase competition among wireless service providers, which may have an adverse effect on our business.
We also plan to put more focus on the Internet protocol (or IP) media market, and we began offering IP-TV service in November 2008. IP-TV is a service which combines video-on-demand services with real-time high definition broadcasting via broadband networks. The MSIP and the Korea Communications Commission have the authority to regulate the IP media market, including IP-TV services. Under the Internet Multimedia Broadcasting Business Act, anyone intending to engage in the IP media broadcasting business must obtain a license from the MSIP, and anyone intending to engage in the production and dissemination of contents focused on news or contents generally combining news, culture, entertainment and other similar contents must obtain an additional approval from the Korea Communications Commission, and anyone intending to engage in the production and dissemination of contents relating to introduction of consumer products and other similar marketing contents must obtain an additional approval from the MSIP. In addition, KT Skylife Co. (formerly Korea Digital Satellite Broadcasting Co., Ltd.), which became our consolidated subsidiary starting in January 2011, offers satellite TV services, which may also be packaged with our IP-TV services. KT Skylife is also subject to the regulation of the MSIP pursuant to the Korea Broadcasting Act.
64
Table of Contents
Government policies and regulations relating to the above as well as other regulations involving the Korean telecommunications and IP broadcasting industries (including as a result of the implementation of free trade agreements between Korea and other countries, including the United States and the European Union) may change, which could have a material adverse effect on our operations and financial condition.
We are subject to various regulations under the Monopoly Regulation and Fair Trade Act.
The Monopoly Regulation and Fair Trade Act provides for various regulations and restrictions on large business groups enforced by the Korea Fair Trade Commission. The Korea Fair Trade Commission initially designated us as a large business group under the Monopoly Regulation and Fair Trade Act on April 1, 2002. Our business relationships and transactions with our subsidiaries, affiliates and other companies within the KT Group are subject to ongoing scrutiny by the Fair Trade Commission as to, among other things, whether such relationships and transactions constitute undue financial support among companies of the same business group. We are also subject to the fair trade regulations limiting debt guarantees for other domestic member companies of the same group and cross-shareholdings among domestic member companies of the same group. Any future determination by the Korea Fair Trade Commission that we have engaged in transactions that violate the fair trade laws and regulations may result in fines or other punitive measures and may have a material adverse effect on our reputation and our business.
Concerns that radio frequency emissions may be linked to various health concerns could adversely affect our business and we could be subject to litigation relating to these health concerns.
In the past, allegations that serious health risks may result from the use of wireless telecommunications devices or other transmission equipment have adversely affected share prices of some wireless telecommunications companies in the United States. In May 2011, the International Agency for Research on Cancer (“IARC”) announced that it has classified radiofrequency electromagnetic fields associated with wireless phone use as possibly carcinogenic to humans, based on an increased risk for glioma, a malignant type of brain cancer. The IARC is part of the World Health Organization that conducts research on the causes of human cancer and the mechanisms of carcinogenesis, and aims to develop scientific strategies for cancer control. We cannot assure you that such health concerns will not adversely affect our business. Several class action and personal injury lawsuits have been filed in the United States against several wireless phone manufacturers and carriers, asserting product liability, breach of warranty and other claims relating to radio transmissions to and from wireless phones. Certain of these lawsuits have been dismissed. We could be subject to liability or incur significant costs defending lawsuits brought by our subscribers or other parties who claim to have been harmed by or as a result of our services. In addition, the actual or perceived risk of wireless telecommunications devices could have an adverse effect on us by reducing our number of subscribers or our usage per subscriber.
Depreciation of the value of the Won against the Dollar and other major foreign currencies may have a material adverse effect on the results of our operations and on the prices of our securities.
Substantially all of our revenues are denominated in Won. Depreciation of the Won may materially affect the results of our operations because, among other things, it causes an increase in the amount of Won required by us to make interest and principal payments on our foreign-currency-denominated debt, the costs of telecommunications equipment that we purchase from overseas sources, net settlement payments to foreign carriers and certain payments related to our derivative instruments entered into for foreign exchange risk hedging purposes. Of the ₩8,237 billion total principal amount of long-term borrowings (less current portion) outstanding as of December 31, 2012, ₩2,749 billion was denominated in foreign currencies with an average weighted interest rate of 3.90%. The interest rates of such long-term debt denominated in foreign currencies ranged from 1.36% (for US$100 million floating rate notes due 2013 with an interest rate of three month London Interbank Offered Rate plus 1.05%) to 6.50% (for US$100 million fixed rate notes due 2034 issued under our medium-term note program). Upon identification and evaluation of our currency risk exposures, we, having considered various circumstances, enter into derivative financial instruments to try to manage some of such risks. Although the impact of exchange rate fluctuations has in the past been partially mitigated by such strategies, our results of operations have historically been affected by exchange rate fluctuations and there can be no assurance that such strategies will be sufficient to reduce or eliminate the adverse impact of such fluctuations in the future.
65
Table of Contents
Fluctuations in the exchange rate between the Won and the Dollar will also affect the Dollar equivalent of the Won price of the shares of our common stock on the KRX KOSPI Market and, as a result, will likely affect the market price of the ADSs. These fluctuations will also affect the Dollar conversion by the depositary for the ADRs of cash dividends, if any, paid in Won on shares of common stock represented by the ADSs.
| 2. | Risks Relating to Korea |
Korea is our most important market, and our current business and future growth could be materially and adversely affected if economic conditions in Korea deteriorate.
Substantially all of our operations, customers and assets are located in Korea. Accordingly, the performance and successful fulfillment of our operational strategies are necessarily dependent on the overall Korean economy and the resulting impact on the demand for telecommunications services. The economic indicators in Korea in recent years have shown mixed signs of growth and uncertainty, and future growth of the Korean economy is subject to many factors beyond our control, including developments in the global economy.
In recent years, adverse conditions and volatility in the worldwide financial markets, fluctuations in oil and commodity prices and the general weakness of the U.S. and global economy have contributed to the uncertainty of global economic prospects in general and have adversely affected, and may continue to adversely affect, the Korean economy. From the second half of 2008 to the first half of 2010, the value of the Won relative to major foreign currencies in general and the U.S. dollar in particular fluctuated widely. While the value of the Korean Won generally stabilized starting in the second half of 2010, there have been signs of relative increase in the volatility of exchange rates starting in the fourth quarter of 2012. Given the lingering uncertainty in the global economic environment, there is no guarantee that exchange rates will not once again fluctuate in the future at such levels as we experienced in the second half 2008 through the first half of 2010. A depreciation of the Won increases the cost of imported goods and services and the Won revenue needed by Korean companies to service foreign currency denominated debt. An appreciation of the Won, on the other hand, causes export products of Korean companies to be less competitive by raising their prices in terms of the relevant foreign currency and reduces the Won value of such export sales. Furthermore, as a result of adverse global and Korean economic conditions, there has been an overall decline and continuing volatility in the stock prices of Korean companies. The Korea Composite Stock Price Index, or KOSPI, declined from 1,897.1 on December 31, 2007 to 938.8 on October 24, 2008. While the KOSPI has recovered since 2008, closing at 1,944.6 on April 26, 2013, there is no guarantee that the stock prices of Korean companies will not decline again in the future. Future declines in the KOSPI and large amounts of sales of Korean securities by foreign investors and subsequent repatriation of the proceeds of such sales may continue to adversely affect the value of the Won, the foreign currency reserves held by financial institutions in Korea, and the ability of Korean companies to raise capital. Any future deterioration of the Korean or global economy could adversely affect our business, financial condition and results of operations.
Developments that could have an adverse impact on Korea’s economy in the future include:
| • | difficulties in the financial sectors in Europe and elsewhere and increased sovereign default risks in selected countries and the resulting adverse effects on the global financial markets; |
| • | adverse changes or volatility in foreign currency reserve levels, commodity prices (including oil prices), exchange rates (including fluctuation of the U.S. dollar or Japanese Yen exchange rates or revaluation of the Chinese Renminbi), interest rates, inflation rates or stock markets; |
| • | continuing adverse conditions in the economies of countries that are important export markets for Korea, such as the United States, Japan and China, or in emerging market economies in Asia or elsewhere; |
66
Table of Contents
| • | further decreases in the market prices of Korean real estate; |
| • | increasing delinquencies and credit defaults by consumer and small- and medium-sized enterprise borrowers; |
| • | declines in consumer confidence and a slowdown in consumer spending; |
| • | the continued emergence of the Chinese economy, to the extent its benefits (such as increased exports to China) are outweighed by its costs (such as competition in export markets or for foreign investment and the relocation of the manufacturing base from Korea to China); |
| • | social and labor unrest; |
| • | a decrease in tax revenues and a substantial increase in the Korean government’s expenditures for fiscal stimulus measures, unemployment compensation and other economic and social programs that, together, would lead to an increased Korean government budget deficit; |
| • | financial problems or lack of progress in the restructuring of large troubled companies, their suppliers or the financial sector; |
| • | loss of investor confidence arising from corporate accounting irregularities or corporate governance issues at certain Korean companies; |
| • | the economic impact of any pending or future free trade agreements; |
| • | geo-political uncertainty and risk of further attacks by terrorist groups around the world; |
| • | the occurrence of severe health epidemics in Korea or other parts of the world; |
| • | deterioration in economic or diplomatic relations between Korea and its trading partners or allies, including deterioration resulting from territorial or trade disputes or disagreements in foreign policy; |
| • | political uncertainty or increasing strife among or within political parties in Korea; |
| • | natural disasters that have a significant adverse economic or other impact on Korea or its major trading partners; |
| • | hostilities or political or social tensions involving oil producing countries in the Middle East or North Africa and any material disruption in the supply of oil or increase in the price of oil; and |
| • | an increase in the level of tensions or an outbreak of hostilities between North Korea and Korea or the United States. |
Escalations in tensions with North Korea could have an adverse effect on us.
Relations between Korea and North Korea have been tense throughout Korea’s modern history. The level of tension between the two Koreas has fluctuated and may increase abruptly as a result of future events. In particular, since the death of Kim Jong-il in December 2011, there has been increased uncertainty with respect to the future of North Korea’s political leadership and concern regarding its implications for political and economic stability in the region. Although Kim Jong-il’s third son, Kim Jong-eun, has assumed power as his father’s designated successor, the long-term outcome of such leadership transition remains uncertain.
In addition, there have been heightened security concerns in recent years stemming from North Korea’s nuclear weapon and long-range missile programs as well as its hostile military actions against Korea. Some of the significant incidents in recent years include the following:
| • | In early April 2013, North Korea blocked access to the inter-Korean industrial complex in its border city of Gaeseong to South Koreans, while the U.S. deployed nuclear-capable stealth bombers and destroyers to Korean air and sea space; |
67
Table of Contents
| • | In late March 2013, North Korea stated that it had entered “a state of war” with Korea, declaring the 1953 armistice invalid, and put its artillery at the highest level of combat readiness to protest the Korea-United States allies’ military drills and additional sanctions imposed on North Korea for its missile and nuclear tests; |
| • | North Korea renounced its obligations under the Nuclear Non-Proliferation Treaty in January 2003 and conducted three rounds of nuclear tests between October 2006 to February 2013, which increased tensions in the region and elicited strong objections worldwide. In response, the United Nations Security Council unanimously passed resolutions that condemned North Korea for the nuclear tests and expanded sanctions against North Korea, most recently in March 2013; |
| • | In December 2012, North Korea launched a satellite into orbit using a long-range rocket, despite concerns in the international community that such a launch would be in violation of the agreement with the United States as well as United Nations Security Council resolutions that prohibit North Korea from conducting launches that use ballistic missile technology; and |
| • | In March 2010, a Korean naval vessel was destroyed by an underwater explosion, killing many of the crewmen on board. The Government formally accused North Korea of causing the sinking, while North Korea denied responsibility. Moreover, in November 2010, North Korea fired more than one hundred artillery shells that hit Korea’s Yeonpyeong Island near the Northern Limit Line, which acts as the de facto maritime boundary between Korea and North Korea on the west coast of the Korean peninsula, causing casualties and significant property damage. The Government condemned North Korea for the attack and vowed stern retaliation should there be further provocation. |
North Korea’s economy also faces severe challenges. For example, in November 2009, the North Korean government redenominated its currency at a ratio of 100 to 1 as part of a currency reform undertaken in an attempt to control inflation and reduce income gaps. In tandem with the currency redenomination, the North Korean government banned the use or possession of foreign currency by its residents and closed down privately run markets, which led to severe inflation and food shortages. Such developments may further aggravate social and political tensions within North Korea.
There can be no assurance that the level of tension on the Korean peninsula will not escalate in the future. Any further increase in tensions, which may occur, for example, if North Korea experiences a leadership crisis, high level contacts between Korea and North Korea break down or military hostilities occur, could have a material adverse effect on our business, results of operations and financial condition.
68
Table of Contents
 |  |
Report of Independent Auditors
To the Board of Directors and Shareholders of
KT Corporation
We have audited the accompanying consolidated statements of financial position of KT Corporation (the “Company”) and its subsidiaries as of December 31, 2012 and 2011, and the related consolidated statements of income, comprehensive income, changes in equity and cash flows for the years then ended, expressed in Korean won. These financial statements are the responsibility of the Company’s management. Our responsibility is to express an opinion on these financial statements based on our audits.
We conducted our audits in accordance with auditing standards generally accepted in the Republic of Korea. Those standards require that we plan and perform the audit to obtain reasonable assurance about whether the financial statements are free of material misstatement. An audit includes examining, on a test basis, evidence supporting the amounts and disclosures in the financial statements. An audit also includes assessing the accounting principles used and significant estimates made by management, as well as evaluating the overall financial statement presentation. We believe that our audits provide a reasonable basis for our opinion.
In our opinion, the consolidated financial statements, referred to above, present fairly, in all material respects, the financial position of KT Corporation and its subsidiaries as of December 31, 2012 and 2011, and their financial performance and cash flows for the years then ended, in accordance with International Financial Reporting Standards as adopted by the Republic of Korea (“Korean IFRS”).
Samil PricewaterhouseCoopers, LS Yongsan Tower, 191, Hangangno 2-ga, Yongsan-gu,
Seoul 140-702, Korea (Yongsan P.O Box 266, 140-600),www.samil.com
Table of Contents
| |
Auditing standards and their application in practice vary among countries. The procedures and practices used in the Republic of Korea to audit such financial statements may differ from those generally accepted and applied in other countries. Accordingly, this report is for use by those who are informed about Korean auditing standards and their application in practice.
/s/ SAMIL PRICEWATERHOUSECOOPERS
Seoul, Korea
March 7, 2013
This report is effective as of March 7, 2013, the audit report date. Certain subsequent events or circumstances, which may occur between the audit report date and the time of reading this report, could have a material impact on the accompanying consolidated financial statements and notes thereto. Accordingly, the readers of the audit report should understand that there is a possibility that the above audit report may have to be revised to reflect the impact of such subsequent events or circumstances, if any.
2
Table of Contents
KT Corporation and Subsidiaries
Consolidated Statements of Financial Position
December 31, 2012 and 2011
| (in millions of Korean won) | Notes | 2012 | 2011 | |||||||
Assets | ||||||||||
Current assets | ||||||||||
Cash and cash equivalents | 4, 5 | ₩ | 2,054,696 | ₩ | 1,445,169 | |||||
Trade and other receivables | 4, 6 | 5,877,523 | 6,158,914 | |||||||
Short-term loans | 4, 7 | 668,113 | 698,030 | |||||||
Current finance lease receivables | 4, 20 | 339,860 | 248,703 | |||||||
Other financial assets | 4, 8 | 244,979 | 253,625 | |||||||
Current income tax assets | 862 | 838 | ||||||||
Inventories, net | 9 | 934,870 | 674,727 | |||||||
Other current assets | 10 | 361,942 | 310,653 | |||||||
|
|
|
| |||||||
Total current assets | 10,482,845 | 9,790,659 | ||||||||
|
|
|
| |||||||
Non-current assets | ||||||||||
Trade and other receivables, net | 4, 6 | 1,071,116 | 1,723,415 | |||||||
Long-term loans, net | 4, 7 | 512,587 | 491,301 | |||||||
Non-current finance lease receivables | 4, 20 | 521,820 | 487,957 | |||||||
Other financial assets | 4, 8 | 672,182 | 621,699 | |||||||
Property and equipment | 11, 20 | 15,734,420 | 14,022,695 | |||||||
Investment property | 12 | 1,155,213 | 1,159,105 | |||||||
Intangible assets | 13 | 3,212,593 | 2,643,485 | |||||||
Investments in jointly controlled entities and associates | 14 | 410,783 | 529,184 | |||||||
Deferred income tax assets | 30 | 610,762 | 529,856 | |||||||
Other non-current assets | 10 | 95,178 | 86,053 | |||||||
|
|
|
| |||||||
Total non-current assets | 23,996,654 | 22,294,750 | ||||||||
|
|
|
| |||||||
Total assets | ₩ | 34,479,499 | ₩ | 32,085,409 | ||||||
|
|
|
| |||||||
3
Table of Contents
KT Corporation and Subsidiaries
Consolidated Statements of Financial Position
December 31, 2012 and 2011
| (in millions of Korean won) | Notes | 2012 | 2011 | |||||||
Liabilities and Equity | ||||||||||
Current liabilities | ||||||||||
Trade and other payables | 4, 15 | ₩ | 7,216,304 | ₩ | 5,890,425 | |||||
Current finance lease liabilities | 4, 20 | 14,033 | 46,155 | |||||||
Borrowings | 4, 16 | 3,186,643 | 2,112,438 | |||||||
Other financial liabilities | 4, 8, 19 | 71,983 | 8,287 | |||||||
Current income tax liabilities | 142,969 | 187,070 | ||||||||
Provisions | 17 | 205,512 | 122,585 | |||||||
Deferred revenue | 170,682 | 167,907 | ||||||||
Other current liabilities | 10 | 239,188 | 210,258 | |||||||
|
|
|
| |||||||
Total current liabilities | 11,247,314 | 8,745,125 | ||||||||
|
|
|
| |||||||
Non-current liabilities | ||||||||||
Trade and other payables | 4, 15 | 701,360 | 651,713 | |||||||
Non-current finance lease liabilities, net | 4, 20 | 27,613 | 90,042 | |||||||
Borrowings | 4, 16 | 8,236,734 | 8,886,114 | |||||||
Other financial liabilities | 4, 8, 19 | 69,813 | 288,473 | |||||||
Retirement benefit liabilities | 18 | 548,621 | 425,712 | |||||||
Provisions | 17 | 149,731 | 142,965 | |||||||
Deferred revenue | 157,395 | 160,981 | ||||||||
Deferred income tax liabilities | 30 | 134,978 | 124,437 | |||||||
Other non-current liabilities | 10 | 41,428 | 32,038 | |||||||
|
|
|
| |||||||
Total non-current liabilities | 10,067,673 | 10,802,475 | ||||||||
|
|
|
| |||||||
Total liabilities | 21,314,987 | 19,547,600 | ||||||||
|
|
|
| |||||||
Equity attributable to owners of the Parent Company | ||||||||||
Capital stock | 21 | 1,564,499 | 1,564,499 | |||||||
Share premium | 1,440,258 | 1,440,258 | ||||||||
Retained earnings | 22 | 10,646,383 | 10,219,633 | |||||||
Accumulated other comprehensive income | 23 | 1,325 | (22,865 | ) | ||||||
Other components of equity | 23, 24 | (1,343,286 | ) | (1,497,289 | ) | |||||
|
|
|
| |||||||
| 12,309,179 | 11,704,236 | |||||||||
|
|
|
| |||||||
Non-controlling interest | 855,333 | 833,573 | ||||||||
|
|
|
| |||||||
Total equity | 13,164,512 | 12,537,809 | ||||||||
|
|
|
| |||||||
Total liabilities and shareholders’ equity | ₩ | 34,479,499 | ₩ | 32,085,409 | ||||||
|
|
|
| |||||||
The accompanying notes are an integral part of these consolidated financial statements.
4
Table of Contents
KT Corporation and Subsidiaries
Consolidated Statements of Income
Years ended December 31, 2012 and 2011
(in millions of Korean won, except per share amounts)
| Notes | 2012 | 2011 | ||||||||
Continuing Operations | ||||||||||
Operating revenue | 4, 14, 25, 26 | ₩ | 23,790,359 | ₩ | 21,272,033 | |||||
Operating expenses | 4, 14, 27 | 22,576,479 | 19,523,624 | |||||||
|
|
|
| |||||||
Operating profit | 1,213,880 | 1,748,409 | ||||||||
Other income | 28 | 787,350 | 775,632 | |||||||
Other expenses | 28 | (316,297 | ) | (546,256 | ) | |||||
Finance income | 29 | 496,366 | 266,030 | |||||||
Finance costs | 29 | (779,812 | ) | (637,406 | ) | |||||
Income (loss) from jointly controlled entities and associates | 14 | 21,015 | (3,038 | ) | ||||||
|
|
|
| |||||||
Profit from continuing operations before income tax | 1,422,502 | 1,603,371 | ||||||||
Income tax expense | 30 | 279,518 | 315,946 | |||||||
|
|
|
| |||||||
Profit for the period from the continuing operations | 1,142,984 | 1,287,425 | ||||||||
|
|
|
| |||||||
Discontinued Operations | ||||||||||
Profit from discontinued operations | 38 | (31,534 | ) | 164,594 | ||||||
|
|
|
| |||||||
Profit for the period | ₩ | 1,111,450 | ₩ | 1,452,019 | ||||||
|
|
|
| |||||||
Profit for the period attributable to: | ||||||||||
Equity holders of the Parent Company | ₩ | 1,057,047 | ₩ | 1,446,551 | ||||||
Profit from continuing operations | 1,086,734 | 1,280,876 | ||||||||
Profit from discontinued operations | (29,687 | ) | 165,675 | |||||||
Non-controlling interest | ₩ | 54,403 | ₩ | 5,468 | ||||||
Profit from continuing operations | 56,250 | 6,549 | ||||||||
Profit from discontinued operations | (1,847 | ) | (1,081 | ) | ||||||
Earnings (loss) per share attributable to the equity holders of the Parent Company during the year (in won): | ||||||||||
Basic earnings (loss) per share | 31 | ₩ | 4,341 | ₩ | 5,947 | |||||
From continuing operations | 4,463 | 5,266 | ||||||||
From discontinued operations | (122 | ) | 681 | |||||||
Diluted earnings (loss) per share | 31 | ₩ | 4,340 | ₩ | 5,946 | |||||
From continuing operations | 4,462 | 5,265 | ||||||||
From discontinued operations | (122 | ) | 681 | |||||||
The accompanying notes are an integral part of these consolidated financial statements.
5
Table of Contents
KT Corporation and Subsidiaries
Consolidated Statements of Comprehensive Income
Years ended December 31, 2012 and 2011
(in millions of Korean won)
| Notes | 2012 | 2011 | ||||||||
Profit for the year | ₩ | 1,111,450 | ₩ | 1,452,019 | ||||||
Other comprehensive income | ||||||||||
Changes in value of available-for-sale financial assets | 4, 8 | 23,952 | 60,834 | |||||||
Net reclassification adjustment for realized losses of available-for-sale financial assets | 4 | (4,865 | ) | (1,376 | ) | |||||
Actuarial loss on retirement benefit liabilities | 18 | (141,699 | ) | (108,065 | ) | |||||
Net gains(losses) on cashflow hedges | 4, 8 | (129,290 | ) | 16,459 | ||||||
Net reclassification adjustment for cashflow hedges | 4 | 154,867 | 11,712 | |||||||
Shares of other comprehensive income (expense) from jointly controlled entities and associates | (9,109 | ) | (2,633 | ) | ||||||
Net reclassification to income for jointly controlled entities and associates | 379 | (2,055 | ) | |||||||
Shares of actuarial gain (loss) of jointly controlled entities and associates | (1,082 | ) | (1,918 | ) | ||||||
Currency translation differences | (6,645 | ) | 12,029 | |||||||
Net reclassification adjustment for currency translation differences | — | 22,661 | ||||||||
|
|
|
| |||||||
Total comprehensive income for the year | ₩ | 997,958 | ₩ | 1,459,667 | ||||||
|
|
|
| |||||||
Comprehensive income for the year attributable to: | ||||||||||
Equity holders of the Parent Company | 937,542 | 1,396,415 | ||||||||
Non-controlling interest | 60,416 | 63,252 | ||||||||
The accompanying notes are an integral part of these consolidated financial statements.
6
Table of Contents
KT Corporation and Subsidiaries
Consolidated Statements of Changes in Equity
Years ended December 31, 2012 and 2011
| Attributable to equity holders of the Parent Company | ||||||||||||||||||||||||||||||||||
| (in millions of Korean won) | Notes | Capital stock | Share premium | Retained earnings | Accumulated Other Comprehensive income (loss) | Other Components of equity | Total | Non-controlling interest | Total equity | |||||||||||||||||||||||||
Balance at January 1, 2011 | ₩ | 1,564,499 | ₩ | 1,440,258 | ₩ | 9,466,168 | ₩ | (79,370 | ) | ₩ | (1,258,293 | ) | ₩ | 11,133,262 | ₩ | 220,793 | ₩ | 11,354,055 | ||||||||||||||||
Comprehensive income | ||||||||||||||||||||||||||||||||||
Profit for the year | — | — | 1,446,551 | — | — | 1,446,551 | 5,468 | 1,452,019 | ||||||||||||||||||||||||||
Changes in value of available-for-sale financial assets | 4 | — | — | — | 5,090 | — | 5,090 | 54,368 | 59,458 | |||||||||||||||||||||||||
Actuarial loss on retirement benefit liabilities | 18 | — | — | (104,723 | ) | — | — | (104,723 | ) | (3,342 | ) | (108,065 | ) | |||||||||||||||||||||
Net gains on cashflow hedge | 4 | — | — | — | 28,178 | — | 28,178 | (7 | ) | 28,171 | ||||||||||||||||||||||||
Shares of other comprehensive income of jointly controlled entities and associates | — | — | — | (5,283 | ) | — | (5,283 | ) | 595 | (4,688 | ) | |||||||||||||||||||||||
Shares of actuarial gain of jointly controlled entities and associates | — | — | (1,918 | ) | — | — | (1,918 | ) | — | (1,918 | ) | |||||||||||||||||||||||
Currency translation differences | — | — | — | 28,520 | — | 28,520 | 6,170 | 34,690 | ||||||||||||||||||||||||||
Transactions with equity holders | ||||||||||||||||||||||||||||||||||
Dividends | 32 | — | — | (586,150 | ) | — | — | (586,150 | ) | (9,050 | ) | (595,200 | ) | |||||||||||||||||||||
Appropriations of loss on disposal of treasury stock | — | — | (295 | ) | — | 295 | — | — | — | |||||||||||||||||||||||||
Changes in consolidation scope | — | — | — | — | — | — | 503,588 | 503,588 | ||||||||||||||||||||||||||
Change in ownership interest in subsidiaries | — | — | — | — | (253,445 | ) | (253,445 | ) | 36,457 | (216,988 | ) | |||||||||||||||||||||||
Others | — | — | — | — | 14,154 | 14,154 | 18,533 | 32,687 | ||||||||||||||||||||||||||
|
|
|
|
|
|
|
|
|
|
|
|
|
|
|
| |||||||||||||||||||
Balance at December 31, 2011 | ₩ | 1,564,499 | ₩ | 1,440,258 | ₩ | 10,219,633 | ₩ | (22,865 | ) | ₩ | (1,497,289 | ) | ₩ | 11,704,236 | ₩ | 833,573 | ₩ | 12,537,809 | ||||||||||||||||
|
|
|
|
|
|
|
|
|
|
|
|
|
|
|
| |||||||||||||||||||
Balance at January 1, 2012 | ₩ | 1,564,499 | ₩ | 1,440,258 | ₩ | 10,219,633 | ₩ | (22,865 | ) | ₩ | (1,497,289 | ) | ₩ | 11,704,236 | ₩ | 833,573 | ₩ | 12,537,809 | ||||||||||||||||
Comprehensive income | ||||||||||||||||||||||||||||||||||
Profit for the year | — | — | 1,057,047 | — | — | 1,057,047 | 54,403 | 1,111,450 | ||||||||||||||||||||||||||
Changes in value of available-for-sale financial assets | 4 | — | — | — | 12,019 | — | 12,019 | 7,068 | 19,087 | |||||||||||||||||||||||||
Actuarial loss on retirement benefit liabilities | 18 | — | — | (142,613 | ) | — | — | (142,613 | ) | 914 | (141,699 | ) | ||||||||||||||||||||||
Net gains(losses) on cashflow hedge | 4 | — | — | — | 25,628 | — | 25,628 | (51 | ) | 25,577 | ||||||||||||||||||||||||
Shares of other comprehensive income of jointly controlled entities and associates | — | — | — | (8,440 | ) | — | (8,440 | ) | (290 | ) | (8,730 | ) | ||||||||||||||||||||||
Shares of actuarial gain of jointly controlled entities and associates | — | — | (1,082 | ) | — | — | (1,082 | ) | — | (1,082 | ) | |||||||||||||||||||||||
Currency translation differences | — | — | — | (5,017 | ) | — | (5,017 | ) | (1,628 | ) | (6,645 | ) | ||||||||||||||||||||||
Transactions with equity holders | ||||||||||||||||||||||||||||||||||
Dividends | 32 | — | — | (486,602 | ) | — | — | (486,602 | ) | (10,158 | ) | (496,760 | ) | |||||||||||||||||||||
Appropriations of loss on disposal of treasury stock | — | — | — | — | 13,353 | 13,353 | — | 13,353 | ||||||||||||||||||||||||||
Changes in consolidation scope | — | — | — | — | — | — | 133,767 | 133,767 | ||||||||||||||||||||||||||
Change in ownership interest in subsidiaries | — | — | — | — | 141,303 | 141,303 | (163,404 | ) | (22,101 | ) | ||||||||||||||||||||||||
Others | — | — | — | — | (653 | ) | (653 | ) | 1,139 | 486 | ||||||||||||||||||||||||
|
|
|
|
|
|
|
|
|
|
|
|
|
|
|
| |||||||||||||||||||
Balance at December 31, 2012 | ₩ | 1,564,499 | ₩ | 1,440,258 | ₩ | 10,646,383 | ₩ | 1,325 | ₩ | (1,343,286 | ) | ₩ | 12,309,179 | ₩ | 855,333 | ₩ | 13,164,512 | |||||||||||||||||
|
|
|
|
|
|
|
|
|
|
|
|
|
|
|
| |||||||||||||||||||
The accompanying notes are an integral part of these consolidated financial statements.
7
Table of Contents
KT Corporation and Subsidiaries
Consolidated Statements of Cash Flows
Years ended December 31, 2012 and 2011
(in millions of Korean won)
| Notes | 2012 | 2011 | ||||||||
Cash flows from operating activities | ||||||||||
Cash generated from operations | 33 | ₩ | 6,434,672 | ₩ | 2,905,037 | |||||
Interest paid | (560,909 | ) | (512,643 | ) | ||||||
Interest received | 208,207 | 156,932 | ||||||||
Dividends received | 18,499 | 15,330 | ||||||||
Income tax paid | (379,644 | ) | (414,631 | ) | ||||||
Income tax refund received | 573 | 284 | ||||||||
|
|
|
| |||||||
Net cash generated from operating activities | 5,721,398 | 2,150,309 | ||||||||
|
|
|
| |||||||
Cash flows from investing activities | ||||||||||
Collection of loans | 106,872 | 66,713 | ||||||||
Origination of loans | (130,396 | ) | (71,450 | ) | ||||||
Disposal of available-for-sale financial assets | 113,068 | 65,760 | ||||||||
Acquisition of available-for-sale financial assets | (86,622 | ) | (188,752 | ) | ||||||
Disposal of investments in jointly controlled entities and associates | 21,818 | 102,563 | ||||||||
Acquisition of investments in jointly controlled entities and associates | (59,464 | ) | (65,055 | ) | ||||||
Disposal of current and non-current financial instruments | 341,876 | 240,779 | ||||||||
Acquisition of current and non-current financial instruments | (1,024,036 | ) | (257,619 | ) | ||||||
Disposal of property, equipment and investment property | 1,676,248 | 594,250 | ||||||||
Acquisition of property and equipment | (4,278,232 | ) | (3,208,337 | ) | ||||||
Disposal of intangible assets | 7,061 | 14,763 | ||||||||
Acquisition of intangible assets | (526,843 | ) | (476,888 | ) | ||||||
Acquisition of subsidiaries, net of cash acquired | (5,779 | ) | 208,752 | |||||||
Cash inflow from changes in scope of consolidation | 48 | 326,524 | ||||||||
|
|
|
| |||||||
Net cash used in investing activities | (3,844,381 | ) | (2,647,997 | ) | ||||||
|
|
|
| |||||||
Cash flows from financing activities | ||||||||||
Proceeds from borrowings and bonds | 4,255,963 | 7,224,666 | ||||||||
Repayments of borrowings and bonds | (4,577,543 | ) | (6,025,054 | ) | ||||||
Settlement of derivative assets and liabilities, net | 35,162 | 130,119 | ||||||||
Disposal of treasury stock | 11,369 | — | ||||||||
Cash inflow from consolidated capital transaction | 7,232 | 83,855 | ||||||||
Cash outflow from consolidated capital transaction | (315,356 | ) | (2,213 | ) | ||||||
Dividends paid to shareholders | (486,602 | ) | (586,150 | ) | ||||||
Dividends paid to non-controlling interest | (10,158 | ) | (9,050 | ) | ||||||
Decrease in finance leases liabilities | (190,380 | ) | (47,701 | ) | ||||||
Cash inflow from other financing activities | 3,839 | — | ||||||||
|
|
|
| |||||||
Net cash provided by (used in) financing activities | (1,266,474 | ) | 768,472 | |||||||
|
|
|
| |||||||
Effect of exchange rate change on cash and cash equivalents | (1,016 | ) | 12,744 | |||||||
|
|
|
| |||||||
Net increase in cash and cash equivalents | 609,527 | 283,528 | ||||||||
Cash and cash equivalents | ||||||||||
Beginning of the year | 5 | 1,445,169 | 1,161,641 | |||||||
|
|
|
| |||||||
End of the year | 5 | ₩ | 2,054,696 | ₩ | 1,445,169 | |||||
|
|
|
| |||||||
The accompanying notes are an integral part of these consolidated financial statements.
8
Table of Contents
KT Corporation and Subsidiaries
Notes to Consolidated Financial Statements
December 31, 2012 and 2011
| 1. | General Information |
The consolidated financial statements include the accounts of KT Corporation, which is the controlling company as defined under Korean IFRS 1027,Consolidated and Separate Financial Statements, and its 60 controlled subsidiaries as described in Note 1.2 (collectively referred to as the “Company”).
The Controlling Company
KT Corporation (the “Controlling Company”) commenced operations on January 1, 1982, when it spun off from the Korea Communications Commission (formerly the Korean Ministry of Information and Communications) to provide telephone services and to engage in the development of advanced communications services under the Act of Telecommunications of Korea. The headquarters are located in Seongnam City, Gyeonggi Province, Republic of Korea, and the address of its registered head office is 206, Jungja-dong, Bundang-gu, Seongnam City, Gyeonggi Province.
On October 1, 1997, upon the announcement of the Government-Investment Enterprises Management Basic Act and the Privatization Law, the Controlling Company became a government-funded institution under the Commercial Code of Korea.
On December 23, 1998, the Controlling Company’s shares were listed on the Korea Exchange.
On May 29, 1999, the Controlling Company issued 24,282,195 additional shares and issued American Depository Shares (ADS), representing new shares and government-owned shares, at the New York Stock Exchange and the London Stock Exchange. On July 2, 2001, the additional ADS representing 55,502,161 government-owned shares were issued at the New York Stock Exchange and London Stock Exchange.
In 2002, the Controlling Company acquired 60,294,575 government-owned shares in accordance with the Korean Government’s privatization plan. As of December 31, 2011, the Korean Government does not own any share in the Controlling Company.
9
Table of Contents
KT Corporation and Subsidiaries
Notes to Consolidated Financial Statements
December 31, 2012 and 2011
Consolidated Subsidiaries
The consolidated subsidiaries as of December 31, 2012, are as follows:
| (in millions of Korean won) | Type of Business | Location | Percentage of ownership (%)1 | Financial year end | ||||||||
| Subsidiary | ||||||||||||
KT Powertel Co., Ltd.2 | Trunk radio system business | Domestic | 44.8 | % | 12.31 | |||||||
KT Networks Corporation | Group telephone management | Domestic | 100.0 | % | 12.31 | |||||||
KT Linkus Co., Ltd. | Public telephone maintenance | Domestic | 93.8 | % | 12.31 | |||||||
KT Telecop Co., Ltd. | Security service | Domestic | 86.8 | % | 12.31 | |||||||
KT Hitel Co., Ltd. | Data communication | Domestic | 65.9 | % | 12.31 | |||||||
KT Commerce Inc. | B2C, B2B service | Domestic | 100.0 | % | 12.31 | |||||||
KT Tech, Inc. | PCS handset development | Domestic | 93.8 | % | 12.31 | |||||||
KT Capital Co., Ltd. | Financing service | Domestic | 100.0 | % | 12.31 | |||||||
KT New Business Fund No.1 | Investment fund | Domestic | 100.0 | % | 12.31 | |||||||
Gyeonggi-KT Green Growth Fund | Venture investment of Green Growth Business | Domestic | 56.5 | % | 12.31 | |||||||
KTC Media Contents Fund 2 | New technology investment fund | Domestic | 64.3 | % | 12.31 | |||||||
KT Strategic Investment Fund No.1 | Investment fund | Domestic | 100.0 | % | 12.31 | |||||||
KT Strategic Investment Fund No.2 | Investment fund | Domestic | 100.0 | % | 12.31 | |||||||
BC card Co., Ltd. | Credit card business | Domestic | 69.5 | % | 12.31 | |||||||
VP Inc. | Payment security service for credit card and etc. | Domestic | 50.9 | % | 12.31 | |||||||
H&C Network | Call centre for financial sectors | Domestic | 100.0 | % | 12.31 | |||||||
BC card China Co., Ltd. | Research and development of calculation system and software | Domestic | 100.0 | % | 12.31 | |||||||
U Payment Co., Ltd. | Transportation card issuance and operations | Domestic | 99.1 | % | 12.31 | |||||||
INITECH Co., Ltd. | Internet banking ASP and security solutions | Domestic | 57.0 | % | 12.31 | |||||||
Initech Smartro Holdings Co., Ltd. | Holdings company | Domestic | 100.0 | % | 12.31 | |||||||
Smartro Co., Ltd. | VAN(Value Added Network) business | Domestic | 81.1 | % | 12.31 | |||||||
Sidus FNH Corporation | Movie production | Domestic | 72.4 | % | 12.31 | |||||||
Nasmedia, Inc. | Online advertisement | Domestic | 51.4 | % | 12.31 | |||||||
Sofnics, Inc. | Software development and sales | Domestic | 80.6 | % | 12.31 | |||||||
KTDS Co., Ltd. | System integration and maintenance | Domestic | 95.3 | % | 12.31 | |||||||
KT M Hows Co., Ltd. | Mobile marketing | Domestic | 51.0 | % | 12.31 | |||||||
KT M&S Co., Ltd. | PCS distribution | Domestic | 100.0 | % | 12.31 | |||||||
KT Music Corporation | Online music production and distribution | Domestic | 57.8 | % | 12.31 | |||||||
KMP Holdings Co. Ltd. | Music production and distribution | Domestic | 100.0 | % | 12.31 | |||||||
KT Innotz Inc. | Software and solution related cloud computing | Domestic | 100.0 | % | 12.31 | |||||||
KT Skylife Co., Ltd. | Satellite broadcasting business | Domestic | 50.2 | % | 12.31 | |||||||
Korea HD Broadcasting Corp. | TV contents provider | Domestic | 92.6 | % | 12.31 | |||||||
KT Estate Inc. | Residential Building Development and Supply | Domestic | 100.0 | % | 12.31 | |||||||
KT AMC Co., Ltd. | Asset management and consulting services | Domestic | 100.0 | % | 12.31 | |||||||
NEXR Co., Ltd. | Cloud system implementation | Domestic | 99.8 | % | 12.31 | |||||||
KTSB Data service | Data center development and related service | Domestic | 51.0 | % | 12.31 | |||||||
KT Cloudware Corporation | Development of cloud computing operation | Domestic | 86.2 | % | 12.31 | |||||||
Centios Co., Ltd. | U-City solution business | Domestic | 82.8 | % | 12.31 | |||||||
Centios Philippines, Inc. | Smart space business | Philippines | 100.0 | % | 12.31 | |||||||
Enswers Inc.3 | Video-clip searching service | Domestic | 45.2 | % | 12.31 | |||||||
Revlix Inc. | Development of mobile SNS application | Domestic | 100.0 | % | 12.31 | |||||||
Soompi USA, LLC | Operation service for “soompi.com” | USA | 100.0 | % | 12.31 | |||||||
KT OIC Korea Co., Ltd. | Development and distribution of education contents and software | Domestic | 79.2 | % | 12.31 | |||||||
Ustream Inc. | Live video-streaming service business | Domestic | 51.0 | % | 12.31 | |||||||
Incheonucity Co., Ltd. | U-City development and operation agent | Domestic | 51.4 | % | 12.31 | |||||||
KT Innoedu Co., Ltd. | E-learning business | Domestic | 48.4 | % | 12.31 | |||||||
KT Rental | Car rental and general rental business | Domestic | 58.0 | % | 12.31 | |||||||
KT Auto Lease Corporation | Car rental business | Domestic | 100.0 | % | 12.31 | |||||||
Kumho Rent-a-car Co., Ltd. | Car rental business | Domestic | 100.0 | % | 12.31 | |||||||
Kumho Rent-a-car (Vietnam) Co., Ltd | Car rental business | Vietnam | 100.0 | % | 12.31 | |||||||
KT Sat Co., Ltd. | Satellite communication business | Domestic | 100.0 | % | 12.31 | |||||||
KT Media Hub Co. Ltd. | Media contents development and distribution | Domestic | 100.0 | % | 12.31 | |||||||
Best Partners Co., Ltd. | Outsourcing service for HR, administration, and accounting service | Domestic | 100.0 | % | 12.31 | |||||||
Korea Telecom Japan Co., Ltd. | Foreign telecommunication business | Japan | 100.0 | % | 12.31 | |||||||
Korea Telecom China Co., Ltd. | Foreign telecommunication business | China | 100.0 | % | 12.31 | |||||||
KTSC Investment Management B.V | Management of Investment in Super iMax and East Telecom | Netherlands | 60.0 | % | 12.31 | |||||||
Super iMax | Wireless high speed internet business | Uzbekistan | 100.0 | % | 12.31 | |||||||
East Telecom | Fixed line telecommunication business | Uzbekistan | 91.0 | % | 12.31 | |||||||
Korea Telecom America, Inc. | Foreign telecommunication business | USA | 100.0 | % | 12.31 | |||||||
PT. KT Indonesia | Foreign telecommunication business | Indonesia | 99.0 | % | 12.31 | |||||||
10
Table of Contents
KT Corporation and Subsidiaries
Notes to Consolidated Financial Statements
December 31, 2012 and 2011
| 1 | Sum of the ownership interests owned by the Controlling Company and subsidiaries. |
| 2 | Even though the Controlling Company has less than 50% ownership in KT Powertel Co., Ltd.(44.8%), this entity is consolidated in consideration of the dispersion of the non-controlling interests and historical voting pattern at the shareholders’ meetings. |
| 3 | Even though the Controlling Company has less than 50% ownership in these subsidiaries (Enswers Inc.: 45.2%, KT Innoedu Co., Ltd.(Cyber MBA): 48.4%), these entities are consolidated as the Controlling Company holds the majority of voting right by agreement with other investors. |
Changes in scope of consolidation in 2012 are as follows:
| Changes | Location | Subsidiaries | Reason | |||
| Included | Domestic | Ustream Inc. | Newly incorporated | |||
Incheonucity Co., Ltd | ||||||
KT Innoedu Co., Ltd.(Cyber MBA) | Acquisition of ownership interest | |||||
KT Sat Co., Ltd. | Newly incorporated | |||||
KT Media Hub Co. Ltd. | ||||||
Best Partners Co., Ltd. | ||||||
KMP Holdings Co. Ltd. | Acquisition of ownership interest | |||||
KT Strategic Investment Fund No.2 | Newly incorporated | |||||
KT Rental, KT Auto Lease Corporation, Kumho Rent-a-car Co., Ltd. | Acquisition of control by agreement4 | |||||
| Vietnam | KUMHO RENT A CAR CO.,LTD. | |||||
| Philippines | Centios Philippines, Inc. | Newly incorporated | ||||
| Excluded | Domestic | KT Edui Co., Ltd | Disposal of ownership interest | |||
KT Capital Media Contents Fund No.1 | Liquidation | |||||
Soompi Media, LLC | Liquidation | |||||
Pay N Mobile Co., Ltd. | Liquidation | |||||
| 4 | As explained by Note 37, these entities are consolidated as the Controlling Company has obtained control in 2012. |
11
Table of Contents
KT Corporation and Subsidiaries
Notes to Consolidated Financial Statements
December 31, 2012 and 2011
A summary of financial data of the major consolidated subsidiaries as of and for the years ended December 31, 2012 and 2011, are as follows:
| (in millions of Korean won) | 2012 | |||||||||||||||
| Total assets | Total liabilities | Operating revenue | Net income(loss) | |||||||||||||
KT Powertel Co., Ltd. | ₩ | 175,862 | ₩ | 55,613 | ₩ | 124,936 | ₩ | 12,532 | ||||||||
KT Networks Corporation | 258,430 | 201,076 | 500,555 | 4,670 | ||||||||||||
KT Linkus Co., Ltd. | 68,260 | 62,686 | 81,564 | 2,302 | ||||||||||||
KT Telecop Co., Ltd. | 180,870 | 130,719 | 296,180 | 2,730 | ||||||||||||
KT Hitel Co.,Ltd.1 | 249,231 | 79,511 | 443,431 | (8,877 | ) | |||||||||||
KT Tech, Inc. | 13,190 | 42,562 | 175,861 | 2,731 | ||||||||||||
KT Capital Co., Ltd.1 | 5,058,883 | 4,519,485 | 3,348,952 | 98,478 | ||||||||||||
H&C Network1 | 244,031 | 119,086 | 199,143 | 8,745 | ||||||||||||
Sidus FNH Corporation | 9,534 | 1,921 | 2,066 | 209 | ||||||||||||
Nasmedia, Inc. | 90,675 | 47,053 | 23,463 | 6,531 | ||||||||||||
Sofnics, Inc. | 1,564 | 207 | 782 | (279 | ) | |||||||||||
KTDS Co., Ltd. | 171,546 | 115,994 | 570,703 | 17,308 | ||||||||||||
KT M Hows Co., Ltd. | 26,498 | 16,511 | 28,874 | 1,934 | ||||||||||||
KT M&S Co., Ltd. | 257,809 | 224,430 | 1,009,331 | (78,241 | ) | |||||||||||
KT Music Corporation1 | 73,050 | 33,086 | 31,393 | (2,124 | ) | |||||||||||
KT Innotz Inc. | 3,012 | 344 | 2,609 | (1,411 | ) | |||||||||||
KT Skylife Co., Ltd.1 | 641,564 | 292,649 | 574,829 | 55,575 | ||||||||||||
KT Estate Inc.1 | 1,460,511 | 145,885 | 24,861 | 3,124 | ||||||||||||
NEXR Co., Ltd. | 2,305 | 1,964 | 2,651 | (1,787 | ) | |||||||||||
KTSB Dataservice | 32,733 | 265 | 439 | (4,383 | ) | |||||||||||
KT Cloudware Corporation1 | 21,345 | 2,321 | 3,878 | (5,397 | ) | |||||||||||
Centios Co., Ltd1 | 32,848 | 9,259 | 171 | (3,163 | ) | |||||||||||
Enswers Inc.1 | 13,966 | 18,330 | 4,896 | (3,010 | ) | |||||||||||
KT OIC Korea Co., Ltd. | 3,968 | 406 | 325 | (1,569 | ) | |||||||||||
Ustream Inc. | 3,171 | 858 | 321 | (2,683 | ) | |||||||||||
KT Innoedu Co., Ltd. | 10,561 | 5,218 | 10,522 | 308 | ||||||||||||
KT Rental1 | 1,694,021 | 1,426,484 | 368,228 | 11,072 | ||||||||||||
KT Media Hub Co., Ltd. | 95,703 | 13,679 | 14,381 | 2,237 | ||||||||||||
KT Sat Co., Ltd. | 417,886 | 16,269 | 10,310 | 1,739 | ||||||||||||
Best Partners Co., Ltd. | 1,526 | 79 | 15 | (57 | ) | |||||||||||
Korea Telecom Japan Co., Ltd. | 8,284 | 3,955 | 14,458 | (324 | ) | |||||||||||
Korea Telecom China Co., Ltd. | 1,895 | 38 | 1,863 | (675 | ) | |||||||||||
KTSC Investment Management B.V.1 | 47,277 | 14,748 | 12,086 | (9,837 | ) | |||||||||||
Korea Telecom America, Inc. | 5,850 | 1,904 | 13,392 | (31 | ) | |||||||||||
PT. KT Indonesia | 38 | — | — | (6 | ) | |||||||||||
12
Table of Contents
KT Corporation and Subsidiaries
Notes to Consolidated Financial Statements
December 31, 2012 and 2011
| (in millions of Korean won) | 2011 | |||||||||||||||
| Total assets | Total liabilities | Operating revenue | Net income(loss) | |||||||||||||
KT Powertel Co., Ltd. | ₩ | 167,075 | ₩ | 59,061 | ₩ | 126,354 | ₩ | 14,569 | ||||||||
KT Networks Corporation | 212,867 | 161,864 | 374,518 | 389 | ||||||||||||
KT Linkus Co., Ltd. | 67,419 | 64,081 | 77,523 | (6,667 | ) | |||||||||||
KT Telecop Co., Ltd. | 156,479 | 106,836 | 259,468 | 7,075 | ||||||||||||
KT Hitel Co.,Ltd.1 | 249,730 | 69,376 | 463,032 | (2,002 | ) | |||||||||||
KT Tech, Inc. | 110,923 | 139,873 | 246,948 | 641 | ||||||||||||
KT Capital Co.,Ltd.1 | 4,454,475 | 4,043,072 | 1,010,503 | 25,195 | ||||||||||||
H&C Network1 | 197,726 | 81,351 | 44,892 | 1,124 | ||||||||||||
Sidus FNH Corporation | 9,838 | 5,824 | 6,904 | (2,975 | ) | |||||||||||
Nasmedia, Inc. | 92,384 | 53,744 | 21,656 | 6,004 | ||||||||||||
Sofnics, Inc. | 970 | 521 | 626 | (481 | ) | |||||||||||
KTDS Co., Ltd. | 146,236 | 106,006 | 497,925 | 10,298 | ||||||||||||
KT M Hows Co., Ltd. | 15,148 | 7,078 | 34,933 | 1,092 | ||||||||||||
KT M&S Co., Ltd. | 249,280 | 226,651 | 917,176 | (3,256 | ) | |||||||||||
KT Music Corporation | 27,840 | 7,691 | 31,279 | (2,385 | ) | |||||||||||
KT Edui Co., Ltd. | 1,119 | 1,589 | 3,986 | (2,366 | ) | |||||||||||
KT Innotz Inc. | 5,520 | 1,727 | 3,795 | (4,623 | ) | |||||||||||
KT Skylife Co., Ltd.1 | 550,443 | 258,231 | 480,468 | 26,649 | ||||||||||||
KT Estate Inc.1 | 33,382 | 3,175 | 7,838 | 1,337 | ||||||||||||
NEXR Co., Ltd. | 3,887 | 1,726 | 3,359 | 756 | ||||||||||||
KTSB Dataservice | 58,755 | 21,904 | — | (149 | ) | |||||||||||
KT Cloudware Corporation | 916 | 81 | — | (165 | ) | |||||||||||
Centios Co., Ltd. | 25,493 | 357 | — | (377 | ) | |||||||||||
Enswers Inc.1 | 16,543 | 18,185 | 759 | (331 | ) | |||||||||||
OIC Korea Co., Ltd. | 5,201 | 68 | 30 | (396 | ) | |||||||||||
Korea Telecom Japan Co., Ltd. | 15,359 | 9,813 | 33,113 | 731 | ||||||||||||
Korea Telecom China Co., Ltd. | 2,804 | 128 | 3,419 | 111 | ||||||||||||
KTSC Investment Management B.V1 | 65,587 | 18,458 | 17,014 | (5,026 | ) | |||||||||||
Korea Telecom America, Inc. | 6,368 | 2,069 | 11,134 | 149 | ||||||||||||
PT. KT Indonesia | 52 | 1 | — | (8 | ) | |||||||||||
| 1 | These companies are the intermediate parent companies of other subsidiaries and the above financial information is from their consolidated financial statements. |
13
Table of Contents
KT Corporation and Subsidiaries
Notes to Consolidated Financial Statements
December 31, 2012 and 2011
| 2. | Significant Accounting Policies |
The following is a summary of significant accounting policies followed by the Company in the preparation of its financial statements. These policies have been consistently applied to all the periods presented, unless otherwise stated.
| 2.1 | Basis of Preparation |
The Company maintains its accounting records in Korean won and prepares statutory financial statements in the Korean language (Hangul) in accordance with the International Financial Reporting Standards as adopted by the Republic of Korea (“Korean IFRS”). The accompanying consolidated financial statements have been condensed, restructured and translated into English from the Korean language financial statements.
Certain information attached to the Korean language financial statements, but not required for a fair presentation of the Company’s financial position, financial performance or cash flows, is not presented in the accompanying consolidated financial statements.
The Company’s financial statements for the annual period beginning on January 1, 2011, have been prepared in accordance with Korean IFRS. These are the standards, subsequent amendments and related interpretations issued by the International Accounting Standards Board (“IASB”) that have been adopted by the Republic of Korea.
The preparation of the consolidated financial statements requires the use of certain critical accounting estimates. It also requires management to exercise judgment in the process of applying the Company’s accounting policies. The areas involving a higher degree of judgment or complexity, or areas where assumptions and estimates are significant to the consolidated financial statements are disclosed in Note 3.
| 2.1.1 | Changes in Accounting Policy and Disclosures |
| (1) | New standards and amendments adopted by the Company |
In accordance with the amendment to Korean IFRS 1001, Presentation of Financial Statements, the Company changed its accounting policy to present the operating profit as an amount of revenues from its main business operation less cost of sales, and selling and administrative expenses.
The Company has applied retroactively the changed accounting policy for operating profit in accordance with the amendments, and the prior year statement of the income, is revised by reflecting adjustments resulting from the retroactive application. As a result of the changes in the accounting policy, other income and expenses of ₩787,350 million and ₩316,297 million, respectively, for the year ended December 31, 2012 (2011: ₩775,632 million and ₩546,256 million), which were from other activities such as disposal of property and equipment, and included in operating profit under the previous standard, were excluded from operating profit. Consequently, operating income for the years ended December 31, 2012 and 2011, was lower by ₩471,053 million and by ₩229,376 million, respectively, as compared to the operating profit under the previous standard. However, there is no impact on net income and earnings per share for the years ended December 31, 2012 and 2011.
14
Table of Contents
KT Corporation and Subsidiaries
Notes to Consolidated Financial Statements
December 31, 2012 and 2011
| (2) | New standards, amendments and interpretations not yet adopted |
New standards, amendments and interpretations issued but not effective for the financial year beginning January 1, 2012, and not early adopted by the Company are as follows
| • | Amendment of Korean IFRS 1001, Presentation of Financial Statements |
Korean IFRS 1001, Presentation of Financial Statements, requires other comprehensive income items to be presented into two groups on the basis of whether they are potentially reclassifiable to profit or loss subsequently. This is effective for annual periods beginning on or after July 1, 2012, with early adoption permitted. The Company expects that the application of this amendment would not have a material impact on its financial statements.
| • | Amendments to Korean IFRS 1019,Employee Benefits |
According to the amendments to Korean IFRS 1019,Employee Benefits, use of a ‘corridor’ approach is no longer permitted, and therefore all actuarial gains and losses incurred are immediately recognized in other comprehensive income. All past service costs incurred from changes in pension plan are immediately recognized, and expected returns on interest costs and plan assets that used to be separately calculated are now changed to calculating net interest expense (income) by applying discount rate used in measuring defined benefit obligation in net defined benefit liabilities (assets). This amendment will be effective for the Company as of January 1, 2013, and the Company is assessing the impact of application of the amended Korean IFRS 1019 on its consolidated financial statements as of the report date.
| • | Enactment of Korean IFRS 1113,Fair value measurement |
Korean IFRS 1113,Fair value measurement, aims to improve consistency and reduce complexity by providing a precise definition of fair value and a single source of fair value measurement and disclosure requirements for use across Korean IFRS. Korean IFRS 1113 does not extend the use of fair value accounting but provides guidance on how it should be applied where its use is already required or permitted by other standards within Korean IFRS. This amendment will be effective for the Company as of January 1, 2013, and the Company expects that it would not have a material impact on the consolidated financial statements.
15
Table of Contents
KT Corporation and Subsidiaries
Notes to Consolidated Financial Statements
December 31, 2012 and 2011
| • | Enactment of Korean IFRS 1110,Consolidated Financial Statements |
Korean IFRS 1110, Consolidated Financial Statements, builds on existing principles by identifying the concept of control as the determining factor in whether an entity should be included in the consolidated financial statements of the Parent Company. An investor controls an investee when it is exposed, or has rights, to variable returns from its involvement with the investee and has the ability to affect those returns through its power over the investee. The standard provides additional guidance to assist in the determination of control where this is difficult to assess. This amendment will be effective for annual periods beginning on or after January 1, 2013, and the Company is reviewing the impact of the amended Korean IFRS 1110.
| • | Enactment of Korean IFRS 1111,Joint Arrangements |
Korean IFRS 1111,Joint Arrangements, aims to reflect the substance of joint arrangements by focusing on the contractual rights and obligations that each party to the arrangement has rather than its legal form. Joint arrangements are classified as either joint operations or joint ventures. A joint operation is when joint operators have rights to the assets and obligations for the liabilities, and account for the assets, liabilities, revenues and expenses, while parties to the joint venture have rights to the net assets of the arrangement and account for their interest in the joint venture using the equity method. This amendment will be effective for annual periods beginning on or after January 1, 2013, and the Company is reviewing the impact of the amended Korean IFRS 1111.
| • | Enactment of Korean IFRS 1112,Disclosures of Interests in Other Entities |
Korean IFRS 1112,Disclosures of Interests in Other Entities, provides the disclosure requirements for all forms of interests in other entities, including a subsidiary, a joint arrangement, an associate, a consolidated structured entity and an unconsolidated structured entity. This amendment will be effective for annual periods beginning on or after January 1, 2013, and the Company is reviewing the impact of the amended Korean IFRS 1112.
| 2.2 | Consolidation |
The Company’s consolidated financial statements are prepared in accordance with Korean IFRS 1027,Consolidated and Separate Financial Statements.
| (1) | Subsidiaries |
Subsidiaries are all entities over which the Company has the power to govern the financial and operating policies, generally which have more than half of the voting rights. The existence and effect of potential voting rights that are currently exercisable or convertible are considered when assessing whether the Company controls another entity. The Company also assesses existence of control where it does not have more than 50% of the voting power but is able to govern the financial and operating policies by virtue of de-facto control. De-facto control may arise in circumstances where the size of the Company’s voting rights relative to the size and dispersion of holdings of other shareholders give the company the power to govern the financial and operating policies and others.
16
Table of Contents
KT Corporation and Subsidiaries
Notes to Consolidated Financial Statements
December 31, 2012 and 2011
Subsidiaries are fully consolidated from the date on which control is transferred to the Company. Subsidiaries are de-consolidated from the date that control ceases.
The Company uses the acquisition method to account for business combinations. The consideration transferred for the acquisition of subsidiary is the fair value of the assets transferred, equity interests issued and liabilities incurred or assumed at the date of acquisition. The consideration transferred includes the fair value of any assets or liability resulting from a contingent consideration arrangement. Identifiable assets acquired, liabilities and contingent liabilities assumed in a business combination are measured initially at their fair values at the acquisition date. The Company measures any non-controlling interests in the acquiree on an acquisition-by-acquisition basis, either at fair value or at the non-controlling interests’ proportionate share in the recognized amounts of the acquiree’s identifiable net assets in the event of liquidation. Other non-controlling interests are measured at the fair value unless otherwise required by other standards.
Acquisition-related costs are expensed as incurred. If a business combination is achieved in stages, the acquirer’s previously held ownership of the acquire is re-measured at the fair value at the acquisition date and the resulting gain or loss is recognized as the profit and loss.
Any contingent consideration to be transferred by the Company is recognized at fair value at the acquisition date. Subsequent changes to the fair value of the contingent consideration that is deemed to be an asset or liability is recognized in accordance with Korean IFRS 1039, either in profit or loss or as a change to other comprehensive income. Contingent consideration that is classified as equity is not remeasured, and its subsequent settlement is accounted for within equity.
The excess of the consideration transferred the amount of any non-controlling interest in the acquiree and the acquisition-date fair value of any previous equity interest in the acquiree over the fair value of the Company’s share of the identifiable net assets acquired is recorded as goodwill. If this is less than the fair value of the net assets of the subsidiary acquired in case of a bargain purchase, the difference is recognized directly in the statement of income.
Intercompany transactions, balances and unrealized gains and losses on transactions between consolidated companies are eliminated after considering impairment of the asset transferred. Unrealized gains and losses are eliminated after recognizing impairment of transferred assets, accounting policies of subsidiaries have been changed where necessary to ensure consistency with the policies adopted by the Company.
17
Table of Contents
KT Corporation and Subsidiaries
Notes to Consolidated Financial Statements
December 31, 2012 and 2011
| (2) | Changes in ownership interests in subsidiaries without change of control |
Transactions with non-controlling interests that do not result in loss of control are accounted for as equity transactions; that is, as transactions with the owners in their capacity as owners. The difference between fair value of any consideration paid and the relevant share acquired of the carrying value of net assets of the subsidiary is recorded in equity. Gains or losses on disposals to non-controlling interests are also recorded in equity.
| (3) | Disposal of subsidiaries |
When the Company ceases to have control any retained interest in the entity is re-measured to its fair value at the date when control is lost, with the change in carrying amount recognized in profit or loss. The fair value is the initial carrying amount for the purposes of subsequently accounting for the retained interest as an associate, joint venture or financial asset. In addition, any amounts previously recognized in other comprehensive income in respect of that entity are accounted for as if the Company had directly disposed of the related assets or liabilities. This may mean that amounts previously recognized in other comprehensive income are reclassified to profit or loss.
| (4) | Associates |
Associates are all entities over which the Company has significant influence but not control, generally holding of between 20% and 50% of the voting rights. Investments in associates are accounted for using the equity method and are initially recognized at cost. The Company’s investment in associates includes goodwill identified on acquisition, net of any accumulated impairment loss.
If the ownership interest in an associate is reduced but significant influence is retained, only a proportionate share of the amounts previously recognized in other comprehensive income is reclassified to profit or loss where appropriate.
The Company’s share of its associates’ post-acquisition profits or losses is recognized in the statement of income, and its share of post-acquisition movements in other reserves is recognized in reserves. The cumulative post-acquisition movements are adjusted against the carrying amount of the investment. When the Company’s share of losses of an associate equals or exceeds its interest in the associate, including any unsecured receivables, the Company does not recognize further losses, unless it has incurred obligations or made payments on behalf of the associate.
The Company should assess at the end of each reporting period whether there is any objective evidence that an investment in associates is impaired. If any such evidence exists, the Company should recognize difference between recoverable amount and carrying amount of the associates as impairment loss.
18
Table of Contents
KT Corporation and Subsidiaries
Notes to Consolidated Financial Statements
December 31, 2012 and 2011
��
Unrealized gains on transactions between the Company and its associates are eliminated to the extent of the Company’s interest in the associates. Unrealized losses are also eliminated unless the transaction provides evidence of an impairment of the asset transferred. Accounting policies of associates have been changed, where necessary, to ensure consistency with the policies adopted by the Company. Dilution gains and losses arising from investments in associates are recognized in the statement of income.
| (5) | Jointly controlled entities |
A joint venture is a contractual arrangement whereby two or more parties (ventures) undertake an economic activity that is subject to joint control. As with associates, investments in jointly controlled entities are accounted for using the equity method and are initially recognized at cost. The Company’s investment in jointly controlled entities includes goodwill identified on acquisition, net of any accumulated impairment loss. The Company does not recognize its share of profits or losses from the joint venture that result from the Company’s purchase of assets from the joint venture until it re-sells the assets to an independent party. However, a loss on the transaction is recognized immediately if the loss provides evidence of a reduction in the net realizable value of current assets, or an impairment loss
| 2.3 | Segment Reporting |
Operating segments are reported in a manner consistent with the internal reporting provided to the chief operating decision-maker (Note 34). The chief operating decision-maker is responsible for making strategic decisions on resource allocation and performance assessment of the operating segments.
| 2.4 | Foreign Currency Translation |
| (1) | Functional and presentation currency |
Items included in the financial statements of each of the consolidated companies are measured using the currency of the primary economic environment in which the entity operates (“the functional currency”). The consolidated financial statements are presented in ‘Korean won’, which is the Controlling Company’s functional and presentation currency.
| (2) | Transactions and balances |
Foreign currency transactions are translated into the functional currency using the exchange rates prevailing at the dates of the transactions or valuation where items are re-measured. Foreign exchange gains and losses resulting from the settlement of such transactions and from the translation at year-end exchange rates of monetary assets and liabilities denominated in foreign currencies are recognized in the statement of income, except when deferred in other comprehensive income as qualifying cash flow hedges.
19
Table of Contents
KT Corporation and Subsidiaries
Notes to Consolidated Financial Statements
December 31, 2012 and 2011
Changes in the fair value of monetary securities denominated in foreign currency classified as available-for-sale are analyzed between translation differences resulting from changes in the amortized cost of the security and other changes in the carrying amount of the security. Translation differences related to changes in amortized cost are recognized in profit or loss, and other changes in carrying amount are recognized in other comprehensive income.
Foreign currency translation differences on non-monetary financial assets and liabilities are recognized as a part of the fair value gain or loss. Translation differences on equity instruments classified as available-for-sale are included in other comprehensive income, while translation differences on equity instruments classified as financial assets and liabilities at fair value through profit or loss are included in the statement of income.
| (3) | Overseas subsidiaries |
The functional currency of all overseas subsidiaries is the local currency of the countries where the subsidiaries are located. The results and financial position of all consolidated companies whose functional currency is different from the presentation currency are translated into the presentation currency as follows:
| • | Assets and liabilities are translated at the closing rate at the end of the reporting period; |
| • | Income and expenses are translated at an average rate for the period. However, if exchange rates fluctuate significantly, the actual rate at the date of the transaction is used; and |
| • | All resulting exchange differences are recognized in other comprehensive income. |
When the Company ceases to have control, exchange differences that were recorded in equity are recognized in profit and loss on disposal of the investment.
Goodwill and fair value adjustments arising from the acquisition of a foreign entity are treated as assets and liabilities of the foreign entity. These are presented in functional currency of the foreign entity, and translated at the closing rate.
| 2.5 | Cash and Cash Equivalents |
Cash and cash equivalents include cash on hand, deposits held at call with banks, and other short-term highly liquid investments with original maturities of less than three months.
20
Table of Contents
KT Corporation and Subsidiaries
Notes to Consolidated Financial Statements
December 31, 2012 and 2011
| 2.6 | Financial Assets and Liabilities |
| (1) | Classification |
The Company classifies its financial instruments in the following categories: financial assets and liabilities at fair value through profit or loss, loans and receivables, available-for-sale financial assets, held-to-maturity investments and financial liabilities measured at amortized cost. Management determines the classification of financial instruments at initial recognition.
| 1) | Financial assets and liabilities at fair value through profit or loss |
This category comprises two sub-categories: financial assets and liabilities classified as held for trading, and financial assets and liabilities designated by the Company as at fair value through profit or loss upon initial recognition.
A financial asset and liability is classified as held for trading if either:
| • | It is acquired or incurred principally for the purpose of selling or reacquisition in the short term, or |
| • | It is derivatives that are not subject to hedge accounting or a financial instrument that contains embedded derivative. |
The Company may designate certain financial assets and liabilities, other than held for trading, upon initial recognition as at fair value through profit or loss when one of the following conditions is met:
| • | It eliminates or significantly reduces a measurement or recognition inconsistency (sometimes referred to as ‘an accounting mismatch’) that would otherwise arise from measuring assets or liabilities or recognizing the gains and losses on them on different bases. |
| • | A group of financial assets is managed and its performance is evaluated on a fair value basis, in accordance with a documented risk management or investment strategy, and information about the group is provided internally on that basis to the Company’s key management personnel. |
| • | A contract contains one or more embedded derivatives; the Company may designate the entire hybrid (combined) contract as a financial asset at fair value through profit or loss if allowed by Korean IFRS 1039,Financial Instruments: Recognition and measurement. |
Financial assets and liabilities at fair value through profit or loss are classified as current assets and current liabilities, respectively.
21
Table of Contents
KT Corporation and Subsidiaries
Notes to Consolidated Financial Statements
December 31, 2012 and 2011
| 2) | Loans and receivables |
Loans and receivables are non-derivative financial assets with fixed or determinable payments that are not quoted in an active market. They are included in current assets, except for maturities greater than 12 months after the end of the reporting period, which are classified as non-current assets. The Company’s loans and receivables are classified as ‘cash and cash equivalents’, ‘trade and other receivables’, ‘loans receivable’, ‘finance lease receivables’ and ‘other financial assets’ in the financial statements.
| 3) | Available-for-sale financial assets |
Available-for-sale financial assets are non-derivatives that are either designated in this category or not classified in any of the other categories. They are included in non-current assets unless the investment matures or management intends to dispose of it within 12 months of the end of the reporting period. The available-for-sale financial assets of the Company are classified to the ‘other financial assets’ in the financial statements.
| 4) | Held-to-maturity investments |
Held-to-maturity financial assets are non-derivative financial assets with fixed or determinable payments and fixed maturities that the Company’s management has the positive intention and ability to hold to maturity and are categorized in ‘other financial assets’ in the financial statements. If the Company were to sell other than an insignificant amount of held-to-maturity financial assets, the whole category would be tainted and reclassified as available-for-sale financial assets. Held-to-maturity financial assets are included in non-current assets, except for those with maturities of less than 12 months of the end of the reporting period which are classified as current assets.
| 5) | Financial liabilities measured at amortized cost |
The Company classifies non-derivative financial liabilities as financial liabilities measured at amortized cost, except for financial liabilities at fair value through profit or loss or for financial liabilities that arise when a transfer of a financial asset does not qualify for derecognition. The Company’s financial liabilities measured at amortized cost are classified as ‘trade and other payables’, ‘borrowings’ and ‘other financial liabilities’ in the financial statements. For cases not qualifying for derecognition, the transferred asset continues to be recognized and a financial liability is measured as the consideration received. Financial liabilities measured at amortized cost are included in non-current liabilities, except for liabilities with maturities of less than 12 months as of the end of the reporting period, which are classified as current liabilities.
22
Table of Contents
KT Corporation and Subsidiaries
Notes to Consolidated Financial Statements
December 31, 2012 and 2011
| (2) | Recognition and measurement |
Regular purchases and sales of financial assets are recognized on the trade date (the date on which the Company commits to purchase or sell the assets). Investments are initially recognized at fair value plus transaction costs for all financial assets not carried at fair value through profit or loss. Financial assets carried at fair value through profit or loss are initially recognized at fair value, and transaction costs are expensed in the statement of income. Available-for-sale financial assets and financial assets at fair value through profit or loss are subsequently carried at fair value. Loans and receivables are subsequently carried at amortized cost using the effective interest rate method.
Gains or losses arising from changes in the fair value of the financial assets and liabilities at fair value through profit or loss are presented in the statement of income within ‘finance income (costs)’ in the period in which they arise. The Company recognizes a dividend income from financial assets at fair value through profit or loss in the statement of income when the Company’s right to receive payments is established.
Investments in equity instruments that do not have a quoted market price in an active market and whose fair value cannot be reliably measured are recognized at cost. Other than these investments, all available-for-sale financial assets are measured at fair value.
Changes in the fair value of monetary and non-monetary securities classified as available-for-sale are recognized in other comprehensive income. When securities classified as available-for-sale are sold or impaired, the accumulated fair value adjustments recognized in equity are reported in the statement of income as ‘finance income(costs)’. However, in case a subsidiary is engaged in the financial industry, the accumulated fair value adjustments recognized in equity are recognized as ‘operating income.’
Interest on available-for-sale financial assets calculated using the effective interest method is recognized in the statement of income as part of ‘finance income’. Dividends on available-for-sale equity instruments are recognized in the statement of income as part of ‘finance income’ when the Company’s right to receive payments is established. However, in case a subsidiary is engaged in the financial industry, the realized accumulated fair value adjustment, interest and dividends on available-for-sale are recognized as ‘operating income and expense’ in the statement of income.
| (3) | Offsetting financial instruments |
Financial assets and liabilities are offset and the net amount reported in the consolidated statement of financial position when there is a legally enforceable right to offset the recognized amounts and there is an intention to settle on a net basis, or realize the asset and settle the liability simultaneously.
23
Table of Contents
KT Corporation and Subsidiaries
Notes to Consolidated Financial Statements
December 31, 2012 and 2011
| (4) | Derecognition of financial assets |
Financial assets are derecognized when the contractual rights to receive cash from the investments have expired or have been transferred, and the Company has substantially transferred all risks and rewards of ownership or when the risk and rewards of ownership of transferred assets have not been substantially retained or transferred and the Company has not retained control over these assets.
| 2.7 | Impairment of Financial Assets |
| (1) | Assets carried at amortized cost |
The Company assesses at the end of each reporting period whether there is objective evidence that a financial asset or a group of financial assets is impaired. A financial asset or a group of financial assets is impaired and impairment losses are incurred only if there is objective evidence of impairment as a result of one or more events that occurred after the initial recognition of the asset (a ‘loss event’) and that loss event (or events) has an impact on the estimated future cash flows of the financial asset or a group of financial assets that can be reliably estimated.
The criteria that the Company uses to determine that there is objective evidence of an impairment loss include:
| • | Significant financial difficulty of the issuer or obligor; |
| • | A breach of contract, such as a default or delinquency in interest or principal payments; |
| • | The Company, for economic or legal reasons relating to the borrower’s financial difficulty, granting to the borrower a concession that the lender would not otherwise consider; |
| • | It becomes probable that the borrower will enter bankruptcy or other financial reorganisation; |
| • | The disappearance of an active market for that financial asset because of financial difficulties; or |
| • | Observable data indicating that there is a measurable decrease in the estimated future cash flows from a portfolio of financial assets since the initial recognition of those assets, although the decrease cannot yet be identified with the individual financial assets in the portfolio, including: |
| • | Adverse changes in the payment status of borrowers in the portfolio; |
| • | National or local economic conditions that correlate with defaults on the assets in the portfolio. |
The amount of the loss is measured as the difference between the asset’s carrying amount and the present value of estimated future cash flows (excluding future credit losses that have not been incurred) discounted at the financial asset’s original effective interest rate. The carrying amount of the asset is reduced and the amount of the loss is recognized in the statement of income. If a financial asset has a variable interest rate, the discount rate for measuring any impairment loss is the current effective interest rate determined under the contract. The Company may measure impairment of the financial instruments on the basis of an instrument’s fair value using an observable market price.
24
Table of Contents
KT Corporation and Subsidiaries
Notes to Consolidated Financial Statements
December 31, 2012 and 2011
If, in a subsequent period, the amount of the impairment loss decreases and the decrease can be related objectively to an event occurring after the impairment was recognized (such as an improvement in the debtor’s credit rating), the reversal of the previously recognized impairment loss is recognized in the statement of income.
| (2) | Assets classified as available-for-sale |
The Company assesses at the end of each reporting period whether there is objective evidence that a financial asset or a group of financial assets is impaired. For debt securities, the Company uses the criteria referred to (1) above. In the case of equity investments classified as available-for-sale, a significant or prolonged decline in the fair value of the security below its cost is also evidence that the asset is impaired. If any such evidence exists for available-for-sale financial assets, the cumulative loss – measured as the difference between the acquisition cost and the current fair value, less any impairment loss on that financial asset previously recognized in profit or loss – is removed from equity and recognized in the statement of income. Impairment losses recognized in the statement of income on equity instruments are not reversed through the statement of income. The fair value of a debt instrument classified as available-for-sale increases and the increase can be objectively related to an event occurring after the impairment loss was recognized in profit or loss, the impairment loss is reversed through the statement of income.
| 2.8 | Derivative Financial Instruments |
Derivatives are initially recognized at fair value on the date a derivative contract is entered into and are subsequently re-measured at their fair value. The method of recognizing the resulting gain or loss depends on whether the derivative is designated as a hedging instrument, and if so, the nature of the item being hedged. The gain or loss relating to derivative financial instruments which are classified as financial instruments at fair value through profit or loss is recognized as finance income (costs) in the statement of income.
If the Company uses a valuation technique that incorporates data not obtained from observable markets for the fair value at initial recognition of the financial instrument, there may be a difference between the transaction price and the amount determined using that valuation technique (Day 1 profit and loss). In these circumstances, the fair value of the financial instrument is recognized as the transaction price and the difference is amortized by using the straight-line method over the life of the financial instrument. If the fair value of the financial instrument is subsequently determined using observable market inputs, the remaining deferred amount is recognized in profit or loss in the statement of income.
25
Table of Contents
KT Corporation and Subsidiaries
Notes to Consolidated Financial Statements
December 31, 2012 and 2011
The Company designates certain derivatives as either:
| • | Hedges of the fair value of a recognised asset or liability or a firm commitment (fair value hedge); or |
| • | Hedges of a particular risk associated with a recognized asset or liability on a highly probable forecast transaction (cash flow hedge) |
The Company documents at the inception of the transaction, the relationship between hedging instruments and hedged items, as well as its risk management objectives and strategy for undertaking various hedging transactions. The Company also documents its assessment, both at hedge inception and on an ongoing basis, of whether the derivatives that are used in hedging transactions are highly effective in offsetting changes on fair values or cash flows of hedged items.
The fair value and changes in the fair value of derivatives for hedge recorded as other comprehensive income are described in Note 8.
The full fair value of a hedging item is more than 12 months, and as a current asset or liability when the remaining maturity of the hedged item is less than 12 months. Trading derivatives are classified as a current asset or liability.
| (1) | Fair value hedge. |
Changes in the fair value of derivatives that are designated and qualify as fair value hedges are recorded as ‘finance income(costs)’ in the income statement, together with any changes in the fair value of the hedged asset or liability that are attributable to the hedged risk.
If the hedge no longer meets the criteria for hedge accounting, the adjustment to the carrying amount of a hedged item for which the effective interest method is used is amortized to profit or loss over the period to maturity.
| (2) | Cash flow hedge |
The effective portion of changes in the fair value of derivatives that are designated and qualify as cash flow hedges is hedges is recognized in other comprehensive income. The gain of loss relating to the ineffective portion is recognized immediately as finance income (costs) in the statement of income.
26
Table of Contents
KT Corporation and Subsidiaries
Notes to Consolidated Financial Statements
December 31, 2012 and 2011
Amounts accumulated in equity are reclassified to profit or loss in the periods when the hedged item affects profit or loss (for example, when the forecast sale that is hedged takes place). The gain or loss relating to the effective portion of interest rate swaps hedging variable rate foreign borrowings is recognized in other comprehensive income. The gain or loss relating to the ineffective portion is recognized as financial income in the statement of income.
When a hedging instrument expires or is sold, or when a hedge no longer meets the criteria for hedge accounting, any cumulative gain or loss existing in equity at that time remains in equity and is recognized when the forecast transaction is ultimately recognized in the income statement. When a forecast transaction is no longer expected to occur, the cumulative gain or loss that was reported in equity is immediately reclassified as finance income (costs) in the statement of income.
| 2.9 | Trade Receivables |
Trade receivables are amounts due from customers for merchandise sold or services performed in the ordinary course of business. If collection is expected in one year or less, they are classified as current assets. If not, they are presented as non-current assets. Trade receivables are recognized initially at fair value and subsequently measured at amortized cost using the effective interest method, less allowance for doubtful accounts.
| 2.10 | Inventories |
Inventories are stated at the lower of cost and net realizable value. Cost is determined using the weighted-average method, except for inventories in-transit which is determined using the specific identification method. Net realizable value is the estimated selling price in the ordinary course of business, less applicable selling expenses.
| 2.11 | Property and Equipment |
All property and equipment are stated at historical cost less depreciation. Historical cost includes expenditure that is directly attributed to the acquisition of the items. However, in accordance with Korean IFRS 1101,First-time Adoption of IFRS, the Company measured certain buildings and telecommunications equipment at fair value at the date of transition to IFRS and the fair value is used as their deemed cost at that date.
Subsequent costs are included in the asset’s carrying amount or recognized as a separate asset, as appropriate, only when it is probable that future economic benefits associated with the item will flow to the Company and the cost of the item can be measured reliably. The carrying amount of the replaced part is derecognized. All other repairs and maintenance are charged to the statement of income during the financial period in which they are incurred.
27
Table of Contents
KT Corporation and Subsidiaries
Notes to Consolidated Financial Statements
December 31, 2012 and 2011
Land is not depreciated. Depreciation on other assets is calculated using the straight-line method to allocate their cost to their residual values over their estimated useful lives, as follows:
| Estimated Useful Lives | ||
Buildings | 5 – 40 years | |
Structures | 5 – 40 years | |
Machinery and equipment | 3 – 40 years | |
(Telecommunications equipment and others) | ||
Others | ||
Vehicles | 4 – 6 years | |
Tools | 4 – 6 years | |
Office equipment | 4 – 6 years |
The assets’ residual values and useful lives are reviewed, and adjusted if appropriate, at the end of each reporting period. An asset’s carrying amount is written down immediately to its recoverable amount if the asset’s carrying amount is greater than its estimated recoverable amount. Gains and losses on disposals are determined by comparing the proceeds with the carrying amount and are recognized within ‘other income (expenses)’ in the statement of income.
| 2.12 | Investment Property |
Investment property is held to earn rentals or for capital appreciation or both. Investment property is measured initially at its cost including transaction costs incurred in acquiring the asset. After recognition as an asset, investment property is carried at its cost less any accumulated depreciation and impairment losses.
Subsequent costs are included in the asset’s carrying amount or recognized as a separate asset, as appropriate, only when it is probable that future economic benefits associated with the item will flow to the Company and the cost of the item can be measured reliably. The carrying amount of the replaced part is derecognized. All other repairs and maintenance are charged to the statement of income during the financial period in which they are incurred.
Land held for investment is not depreciated. Investment property, except for land, is depreciated using the straight-line method over their estimated useful lives.
The depreciation method, the residual value and the useful life of an asset are reviewed at least at the end of each reporting period and, if management judges that previous estimates should be adjusted, the change is accounted for as a change in an accounting estimate.
28
Table of Contents
KT Corporation and Subsidiaries
Notes to Consolidated Financial Statements
December 31, 2012 and 2011
| 2.13 | Intangible Assets |
| (1) | Goodwill |
Goodwill is measured as explained in Note 2.2 (1) and goodwill arising from acquisition of subsidiaries and business are included in intangible assets. Goodwill is tested annually for impairment and carried at cost less accumulated impairment losses. Impairment losses on goodwill are not reversed. The calculation of the gains and losses on the disposal of an entity include the carrying amount of goodwill relating to the entity sold.
For the purpose of impairment testing, goodwill acquired in a business combination is allocated to each of the acquirer’s cash-generating units, or groups of cash-generating units (“CGU”), that is expected to benefit from the synergies of the combination. Goodwill is monitored at the operating segment level.
Goodwill impairment reviews are undertaken annually or more frequently if events or changes in circumstances indicate a potential impairment. The carrying value of goodwill is compared to the recoverable amount, which is the higher of value in use and the fair value less costs to sell. Any impairment is recognized immediately as an expense and is not subsequently reversed.
| (2) | Intangible assets except goodwill |
Separately acquired Intangible assets except for goodwill are shown at historical cost. These assets have definite useful lives and are carried at historical cost less accumulated amortization. Amortization is calculated using the straight-line method to allocate the cost of assets over their estimated useful lives. However, facility usage rights (condominium membership and golf membership) and broadcast license are regarded as intangible assets with indefinite useful life and not amortized, because there is no foreseeable limit to the period over which the asset is expected to generate net cash inflows for the Company.
The useful life of an asset with indefinite useful life is reviewed each period to determine whether events and circumstances continue to support the indefinite useful life assessment for that asset. If management judges that previous estimates should be adjusted, the change is accounted for as a change in an accounting estimate. The depreciation method and useful life of an asset with definite useful life are reviewed at the end of each reporting period.
29
Table of Contents
KT Corporation and Subsidiaries
Notes to Consolidated Financial Statements
December 31, 2012 and 2011
The estimated useful life used for amortizing intangible assets is as follows:
| Estimated Useful Lives | ||
Development costs | 5 – 6 years | |
Goodwill | Unlimited useful life | |
Software | 2 – 10 years | |
Industrial property rights | 2 – 10 years | |
Frequency usage rights | 5.75 – 13 years | |
Others1 | 3 – 50 years |
| 1 | Facility usage rights (condominium membership and golf membership) and broadcast license included in others are classified as intangible assets with indefinite useful life. |
| (3) | Research and development costs |
Expenditure on research is recognized as an expense as incurred. If the expense as incurred that is identifiable and when the probable future economic benefits are expected, the cost for the new merchandises and technology is recognized as intangible assets when all the following criteria are met:
| • | It is technically feasible to complete the intangible asset so that it will be available for use; |
| • | Management intends to complete the intangible asset and use or sell it; |
| • | There is the ability to use or sell the intangible asset; |
| • | It can be demonstrated how the intangible asset will generate probable future economic benefits; |
| • | Adequate technical, financial and other resources to complete the development and to use or sell the intangible asset are available; and |
| • | The expenditure attributable to the intangible asset during its development can be reliably measured |
Other development expenditures that do not meet these criteria are recognized as expenses as incurred. Development costs previously recognized as an expense are not recognized as an asset in a subsequent period. Capitalized development costs, which are stated as intangible assets, are amortized using the straight-line method when the assets are available for use and are tested for impairment.
| 2.14 | Borrowing Costs |
General and specific borrowing costs directly attributable to the acquisition, construction or production of qualifying assets, which are assets that necessarily take a substantial period of time to get ready for their intended use or sale, are added to the cost of those assets, until such time as the assets are substantially ready for their intended use or sale. Investment income earned on the temporary investment of specific borrowings pending their expenditure on qualifying assets is deducted from the borrowing costs eligible for capitalization. All other borrowing costs are recognized in profit or loss in the period in which they are incurred.
30
Table of Contents
KT Corporation and Subsidiaries
Notes to Consolidated Financial Statements
December 31, 2012 and 2011
| 2.15 | Government Grants |
Grants from a government are recognized as other income at their fair value where there is a reasonable assurance that the grant will be received and the Company will comply with all attached conditions.
Government grants relating to costs are deferred and recognized in the statement of income over the period necessary to match them with the costs that they are intended to compensate. Government grants relating to property and equipment are deferred and are credited to the statement of income on a straight-line basis over the expected lives of the related assets.
| 2.16 | Impairment of Non-Financial Assets |
Assets that have an indefinite useful life such as goodwill are not subject to amortization and are tested annually for impairment. Assets that are subject to amortization are reviewed for impairment whenever events or changes in circumstances indicate that the carrying amount may not be recoverable. An impairment loss is recognized for the amount by which the asset’s carrying amount exceeds its recoverable amount. The recoverable amount is the higher of an asset’s fair value less costs to sell and its value in use. For the purposes of assessing impairment, assets are grouped at the lowest levels for which there are separately identifiable cash flows (cash-generating units). Non-financial assets other than goodwill that suffered impairment are reviewed for possible reversal of the impairment at each reporting date.
| 2.17 | Trade Payables |
Trade payables are obligations to pay for goods or services that have been acquired in the ordinary course of business from suppliers. Trade payables are classified as current liabilities if payment is due within one year. If not, they are presented as non-current liabilities. Trade payables are initially recognized at fair value and subsequently measured at amortized cost using the effective interest method.
| 2.18 | Financial guarantee contracts |
A financial guarantee contract is a contract that requires the issuer to make specified payments to reimburse the holder for a loss it incurs because a specified debtor fails to make payment when due in accordance with the original or modified terms of a debt instrument. Financial guarantee is initially measured at fair value on the date the guarantee was given. Subsequent to initial recognition, the Company’s liabilities under such guarantees are measured at the higher of the amounts below. Any increase in the liability relating to guarantees is reported as other financial liabilities:
| • | The amounts determined in accordance with Korean IFRS 1037Provisions Contingent Liabilities and Contingent Assets,or |
| • | The amounts initially recognized less the accumulated amortization accordance with Korean IFRS 1018Revenue |
31
Table of Contents
KT Corporation and Subsidiaries
Notes to Consolidated Financial Statements
December 31, 2012 and 2011
| 2.19 | Borrowings |
Borrowings are recognized initially at fair value, net of transaction costs incurred. Borrowings are subsequently carried at amortized cost; any difference between the proceeds (net of transaction costs) and the redemption value is recognized in the statement of income over the period of the borrowings using the effective interest method. However, in case a subsidiary is engaged in the financial industry, the interest expenses are recognized as operating expenses since it is considered as a main business activity of the subsidiary.
The Company classifies the liability as current when it does not have an unconditional right to defer its settlement for at least 12 months after the reporting date.
| 2.20 | Compound Financial Instruments |
Compound financial instruments issued by the Company consist of convertible bond that can be converted to share capital at the option of the holder, and the number of shares to be issued does not vary with changes in their fair value.
The liability component of a compound financial instrument is recognized initially at the fair value of a similar liability that does not have an equity conversion option. The equity component is recognized initially at the difference between the fair value of the compound financial instrument as a whole and the fair value of the liability component. Any directly attributable transaction costs are allocated to the liability and equity components in proportion to their initial carrying amounts.
Subsequent to initial recognition, the liability component of a compound financial instrument is measured at amortized cost using the effective interest method. The equity component of a compound financial instrument is not re-measured subsequent to initial recognition except on conversion or expiry.
| 2.21 | Employee Benefits |
| (1) | Retirement benefit liabilities |
The liability recognized in the statement of financial position in respect of the defined benefit pension plan is the present value of the defined benefit obligation at the end of the reporting period less the fair value of plan assets. The defined benefit obligation is calculated annually using the projected unit credit method. The present value of the defined benefit obligation is determined by discounting the estimated future cash outflows using interest rates of high-quality corporate bonds that are denominated in the currency in which the benefits will be paid, and that have terms to maturity approximating the terms of the related pension liability.
32
Table of Contents
KT Corporation and Subsidiaries
Notes to Consolidated Financial Statements
December 31, 2012 and 2011
Actuarial gains and losses arising from experience adjustments and changes in actuarial assumptions are charged or credited to equity in other comprehensive income in the period in which they arise. Past-service costs are recognized immediately in income, while costs are amortized over the vesting period.
| (2) | Defined contribution plan |
A defined contribution plan is a pension plan under which the Company pays fixed contributions into a separate entity. The Company has no legal or constructive obligations to pay further contributions if the fund does not hold sufficient assets to pay all employees the benefits relating to employee service in the current and prior periods. For defined contribution plans, the Company pays contributions to publicly or privately administered pension insurance plans on a mandatory, contractual or voluntary basis. The Company has no further payment obligations once the contributions have been paid. The contributions are recognized as employee benefit expense when they are due. Prepaid contributions are recognized as an asset to the extent that a cash refund or a reduction in the future payments is available.
| (3) | Termination benefits |
Termination benefits are payable when employment is terminated by the Company before the normal retirement date, or whenever an employee accepts voluntary redundancy in exchange for these benefits. The Company recognizes termination benefits when it is demonstrably committed to either: terminating the employment of current employees according to a detailed formal plan without possibility of withdrawal; or providing termination benefits as a result of an offer made to encourage voluntary redundancy.
| 2.22 | Share-based payments |
The Controlling Company operates share-based compensation plans, under which the Controlling Company receives services from employees as consideration for equity instruments (options) of the Controlling Company. The fair value of the employee services received in exchange for the grant of the options is recognized as a compensation expense in the statement of income over the vesting period.
33
Table of Contents
KT Corporation and Subsidiaries
Notes to Consolidated Financial Statements
December 31, 2012 and 2011
| 2.23 | Provisions |
Provisions are recognized when the Company has a present legal or constructive obligation as a result of past events and an outflow of resources required to settle the obligation is probable and can be reliably estimated. Provisions are not recognized for future operating losses.
Provisions are measured at the present value of the expenditures expected to be required to settle the obligation. The increase in the provisions due to passage of time is recognized as an interest expense.
| 2.24 | Leases |
A lease is an agreement, whereby the lessor conveys to the lessee, in return for a payment or series of payments, the right to use an asset for an agreed period of time
| (1) | The Company as the Lessee |
Leases in which a significant portion of the risks and rewards of ownership are retained by the lessor are classified as operating leases. Payments made under operating leases are charged to the statement of income on a straight-line basis over the period of the lease.
Lease of property and equipment where the lessee has substantially all the risks and rewards of ownership are classified as finance leases. Finance leases are capitalized at the lease’s commencement at the lower of the fair value of the leased property and the present value of the minimum lease payments. Each lease payment is allocated between the liability and finance charges so as to achieve a constant rate on the outstanding balance. The corresponding rental obligations, net of finance charges, are included in the finance lease liabilities.
The interest element of the finance cost is charged to the statement of income over the lease period so as to produce a constant periodic rate of interest on the remaining balance of the liability for each period. The property, plant and equipment acquired under finance leases are depreciated over the shorter of the useful life of the asset and the lease term.
| (2) | The Company as the Lessor |
For finance leases, lease receivables are recognized at the amount equivalent to the net investment in the lease asset. The Company recognizes interest income, which is calculated for net finance lease receivable based on effective interest rate. Lease income from operating leases shall be recognized on a straight-line basis over the lease term. Initial direct costs incurred by lessors in negotiating and arranging operating leases shall be added to the carrying amount of the lease asset and recognized as the expenses over the lease term corresponding to the lease income.
34
Table of Contents
KT Corporation and Subsidiaries
Notes to Consolidated Financial Statements
December 31, 2012 and 2011
| 2.25 | Dividend Distribution |
Dividend distribution to the Company’s shareholders is recognized as a liability in the financial statements in the period in which the dividends are approved by the Company’s shareholders.
| 2.26 | Capital Stock |
Common stocks are classified as equity.
Where the Controlling Company purchases its own equity share capital, the consideration paid, including any directly attributable incremental costs, is deducted from equity attributable to the Controlling Company’s equity holders until the stocks are cancelled or reissued. Where such shares are subsequently reissued, any consideration received is included in equity attributable to the Controlling Company’s equity holders.
| 2.27 | Revenue Recognition |
Revenue comprises the fair value of the consideration received or receivable for the sales of goods and services in the ordinary course of the Company’s activities. Revenue is shown net of value-added tax, returns, rebates and discounts and after eliminating sales within the Company.
The Company recognizes revenue when the amount of revenue can be reliably measured, it is probable that future economic benefits will flow to the entity and when specific criteria have been met for each of the Company’s activities as described below. The Company bases its estimates on historical results, taking into consideration the type of customer, the type of transaction and the specifics of each arrangement.
| (1) | Sales of Services |
When providing interconnection or telecommunications service to a customer based on service plans, the related revenue is recognized at the time service is provided. If the customer uses the telecommunications equipment according to the service plans, the related revenue is recognized on straight-line basis over the contract period. Revenue related to the other telecommunications services is recognized when the service is provided to the customer.
For other services, when the outcome of a transaction involving the rendering of services can be estimated reliably, revenue associated with such a transaction is recognized by reference to the stage of performance of the services. When the outcome of the transaction involving the rendering of services cannot be estimated reliably, revenue is recognized only to the extent of the expenses recognized that are recoverable.
35
Table of Contents
KT Corporation and Subsidiaries
Notes to Consolidated Financial Statements
December 31, 2012 and 2011
Total consideration for combined services is allocated to each service in proportion to its fair value and the allocated amount is recognized as revenue according to revenue recognition policy for the service.
| (2) | Sales of goods |
Sales of goods such as selling handsets are recognized when the Company has delivered products to the customer. Delivery does not occur until the products have been shipped to the specified location, the risks of obsolescence and loss have been transferred to the customer, and either the customer has accepted the products in accordance with the sales contract, the acceptance provisions have lapsed, or the Company has objective evidence that all criteria for acceptance have been satisfied.
| (3) | Interest income |
Interest income is recognized using the effective interest method. When a loan and receivable is impaired, the Company reduces the carrying amount to its recoverable amount and continues unwinding the discount as interest income. Interest income on impaired receivables is recognized using the original effective interest rate.
| (4) | Commission fees. |
Commission fees related to credit card business recognized when it is probable that future economic benefits will flow to the entity and these benefits can be reliably measured. Revenues from acquiree fee, agent fee, optional service fees, member service fees and credit card service charge are measured at the fair value of the consideration received and recognized on a accrual basis.
| (5) | Royalty income |
Royalty income is recognized on an accrual basis in accordance with the substance of the relevant agreements.
| (6) | Dividend income |
Dividend income is recognized when the right to receive payment is established.
| (7) | Customer loyalty programme |
The Company operates a customer loyalty programme in which customers are granted rewards points. The granted reward is recognized as a separately identifiable component of the sale transaction (initial sale transaction) that grants the reward. The fair value of consideration to give or given for the initial sale is allocated to the reward points and remaining of initial sale, and the consideration allocated to the reward points is measured based on the fair value of reward in exchange of reward points, which is the fair value of reward points considered the proportion of reward points that are not expected to be redeemed. Revenue from the award credits is recognized when it is redeemed.
36
Table of Contents
KT Corporation and Subsidiaries
Notes to Consolidated Financial Statements
December 31, 2012 and 2011
| 2.28 | Current and Deferred Income Tax |
The tax expense for the period consists of current and deferred tax. Tax is recognized in the statement of income, except to the extent that it relates to items recognized in other comprehensive income or directly in equity. In this exception, the tax is also recognized in other comprehensive income or directly in equity, respectively.
The current income tax charge is calculated on the basis of the tax laws enacted or substantially enacted at the reporting date in the countries where the Company operates and generates taxable income. Management periodically evaluates positions taken in tax returns with respect to situations in which applicable tax regulation is subject to interpretation. It establishes provisions where appropriate on the basis of amounts expected to be paid to the tax authorities.
Deferred income tax is recognized, using the liability method, on temporary differences arising between the tax bases of assets and liabilities and their carrying amounts in the financial statements. However, the deferred income tax is not accounted for if it arises from initial recognition of an asset or liability in a transaction other than a business combination that at the time of the transaction affects neither accounting nor taxable profit nor loss. Deferred income tax is determined using tax rates and laws that have been enacted or substantially enacted by the end of the reporting period and are expected to apply when the related deferred income tax asset is realized or the deferred income tax liability is settled.
Deferred income tax assets are recognized only to the extent that it is probable that future taxable profit will be available against which the temporary differences can be utilized.
Deferred income tax liabilities are provided on temporary differences arising on investments in subsidiaries and associates, except where the timing of the reversal of the temporary difference is controlled by the Company and it is probable that the temporary difference will not reverse in the foreseeable future. Deferred income tax is recognized only to the extent that it is probable that the temporary difference will reverse in the foreseeable future and taxable profit will be available against which the temporary difference can be utilised.
Deferred income tax assets and liabilities are offset when there is a legally enforceable right to offset current tax assets against current tax liabilities and when the deferred income taxes assets and liabilities relate to income taxes levied by the same taxation authority on either the same taxable entity or different taxable entities.
37
Table of Contents
KT Corporation and Subsidiaries
Notes to Consolidated Financial Statements
December 31, 2012 and 2011
| 2.29 | Deferred Loan Fees and Costs |
Loan origination fees in relation to loan origination process such as upfront fee, are deferred and amortized over the life of the loan as an adjustment to the yield of the loan using the effective interest rate method. Loan origination costs, which relates to loan origination activities such as commissions to brokers, are deferred and amortized over the life of the loan as an adjustment to the yield of the loan, using the effective interest rate method, if the future economic benefit related costs incurred can be matched with each loan.
In addition, the amortizations of the deferred loan origination fees on costs are offset and the net amounts are presented in the consolidated statement of financial position.
| 2.30 | Non-current Assets Held for Sale and Discontinued Operations |
Non-current assets (or disposal groups) are classified as ‘assets and liabilities classified as held for sale’ (or ‘groups classified as held for sale’) when their carrying amount is to be recovered principally through a sale transaction and a sale is considered highly probable. They are stated at the lower of carrying amount or fair value less costs to sell.
When a component of the Company representing a separate major line of business or geographical area of operation has been disposed of, or is subject to a sale plan involving loss of control of a subsidiary, the Company discloses in the statement of income the post-tax profit or loss of discontinued operations and the post-tax gain or loss recognized on the measurement to fair value less costs to sell or on the disposal of the assets or group to be sold constituting the discontinued operation. The net cash flows attributable to the operating, investing and financing activities of discontinued operations are presented in the notes to the financial statements (Note 38).
| 2.31 | Approval of Issuance of the Financial Statements |
The issuance of the Company’s consolidated financial statements was approved by the Board of Directors on February 14, 2013.
| 3. | Critical Accounting Estimates and Assumptions |
The Company makes estimates and assumptions concerning the future. Estimates and assumptions are continually evaluated and are based on historical experience and other factors, including expectations of future events that are believed to be reasonable under the circumstances. The resulting accounting estimates will, by definition, seldom equal the related actual results. The estimates and assumptions that have a significant risk of causing a material adjustment to the carrying amounts of assets and liabilities within the next financial year are addressed below.
38
Table of Contents
KT Corporation and Subsidiaries
Notes to Consolidated Financial Statements
December 31, 2012 and 2011
| 3.1 | Estimated Impairment of Goodwill |
The Company tests annually whether goodwill has suffered any impairment in accordance with the accounting policy stated in Note 2.13. The recoverable amounts of cash-generating units have been determined based on value-in-use calculations. These calculations require the use of estimates (Note 13).
| 3.2 | Income Taxes |
Current and deferred income tax are determined using tax rates and laws that have been enacted or substantially enacted by the end of the reporting period and are expected to apply when the related deferred income tax asset is realized or the deferred income tax liability is settled. Where the final tax outcome of these matters is different from the amounts that were initially recorded, such differences will impact the current and deferred income tax assets and liabilities in the period in which such determination is made.
| 3.3 | Fair Value of Financial Instruments |
The fair value of financial instruments that are not traded in an active market is determined by using valuation techniques. The Company uses its judgment to select a variety of methods and makes assumptions that are mainly based on market conditions existing at the end of each reporting period.
| 3.4 | Allowance for Doubtful Accounts |
The Company recognizes provisions for accounting of estimated loss in customers’ insolvency. When the allowance for doubtful accounts is estimated, it is based on the aging analysis of trade receivables balances, incurred loss experience, customers’ credit rates and changes of payment terms. If the customer’s financial position becomes worse, the actual loss amount will be increased more than the estimated.
| 3.5 | Post-employment Benefit Liabilities |
The present value of the post-employment benefit liabilities depends on a number of factors that are determined on an actuarial basis using a number of assumptions. The assumptions used in determining the defined benefit obligation include the discount rate. Any changes in these assumptions will impact the carrying amount of the defined benefit obligation.
The Company determines the appropriate discount rate at the end of each reporting period. This is the interest rate that is used to determine the present value of estimated future cash outflows expected to be required to settle the defined benefit obligation. In determining the appropriate discount rate, the Company considers the interest rates of high-quality corporate bonds that are denominated in the currency in which the benefits will be paid, and that have terms to maturity approximating the terms of the related liability. Other key assumptions for defined benefit obligation are based in part on current market conditions. The related information is disclosed in Note 18.
39
Table of Contents
KT Corporation and Subsidiaries
Notes to Consolidated Financial Statements
December 31, 2012 and 2011
| 3.6 | Deferred Revenue |
Service installation fees and initial subscription fees related to activation of service are deferred and recognized as revenue over the expected terms of customer relationships. The estimate of expected terms of customer relationship is based on the historical rate. If management’s estimation is amended, it may cause significant differences in the timing of revenue recognition and amount recognized.
| 3.7 | Provisions |
As described in Note 17, the Company records provisions for litigation and assets retirement obligations as of the end of the reporting period. The provisions are estimated based on the factors such as the historical experiences.
| 3.8 | Useful lives of Property and Equipment |
Depreciation on the property and equipment excluding land, condominium memberships, golf club memberships, and broadcasting concession is calculated using the straight-line method over their useful lives. The estimated useful lives are determined based on expected usage of the assets and the estimates can be materially affected by technical changes and other factors. The Company will increase depreciation if the useful lives are considered shorter than the previously estimated useful lives.
40
Table of Contents
KT Corporation and Subsidiaries
Notes to Consolidated Financial Statements
December 31, 2012 and 2011
| 4. | Financial Instruments by category |
Financial instruments by category as of December 31, 2012 and 2011, are as follows:
| (In millions of Korean won) | 2012 | |||||||||||||||||||||||
| Financial assets | Loans and receivables | Assets at fair and loss | Derivatives used for hedge | Available- for-sale | Held-to- Maturity | Total | ||||||||||||||||||
Cash and cash equivalents | ₩ | 2,054,696 | ₩ | — | ₩ | — | ₩ | — | ₩ | — | ₩ | 2,054,696 | ||||||||||||
Trade and other receivables | 6,948,639 | — | — | — | — | 6,948,639 | ||||||||||||||||||
Loans receivable | 1,180,700 | — | — | — | — | 1,180,700 | ||||||||||||||||||
Finance lease receivables | 861,680 | — | — | — | — | 861,680 | ||||||||||||||||||
Other financial assets | 373,017 | 92,782 | 21,348 | 429,606 | 408 | 917,161 | ||||||||||||||||||
| (In millions of Korean won) | 2012 | |||||||||||||||||||
| Financial liabilities | Liabilities at fair value through the profit and loss | Derivatives used for | Financial liabilities at amortized cost | Other liabilities | Total | |||||||||||||||
Trade and other payables | ₩ | — | ₩ | — | ₩ | 7,917,664 | ₩ | — | ₩ | 7,917,664 | ||||||||||
Finance lease liabilities | — | — | 41,646 | — | 41,646 | |||||||||||||||
Borrowings | — | — | 11,423,377 | — | 11,423,377 | |||||||||||||||
Other financial liabilities | 3,216 | 112,603 | 16,649 | 9,328 | 141,796 | |||||||||||||||
41
Table of Contents
KT Corporation and Subsidiaries
Notes to Consolidated Financial Statements
December 31, 2012 and 2011
| (In millions of Korean won) | 2011 | |||||||||||||||||||||||
| Financial assets | Loans and receivables | Assets at fair and loss | Derivatives used for hedge | Available- for-sale | Held-to- Maturity | Total | ||||||||||||||||||
Cash and cash equivalents | ₩ | 1,445,169 | ₩ | — | ₩ | — | ₩ | — | ₩ | — | ₩ | 1,445,169 | ||||||||||||
Trade and other receivables | 7,882,329 | — | — | — | — | 7,882,329 | ||||||||||||||||||
Loans receivable | 1,189,331 | — | — | — | — | 1,189,331 | ||||||||||||||||||
Finance lease receivables | 736,660 | — | — | — | — | 736,660 | ||||||||||||||||||
Other financial assets | 202,236 | 130,454 | 113,831 | 428,796 | 7 | 875,324 | ||||||||||||||||||
| (In millions of Korean won) | 2011 | |||||||||||||||||||
| Financial liabilities | Liabilities at fair value through the profit and loss | Derivatives used for | Financial liabilities at amortized cost | Other liabilities | Total | |||||||||||||||
Trade and other payables | ₩ | — | ₩ | — | ₩ | 6,542,138 | ₩ | — | ₩ | 6,542,138 | ||||||||||
Finance lease liabilities | — | — | 136,197 | — | 136,197 | |||||||||||||||
Borrowings | — | — | 10,998,552 | — | 10,998,552 | |||||||||||||||
Other financial liabilities | 2,596 | 6,210 | 285,124 | 2,830 | 296,760 | |||||||||||||||
42
Table of Contents
KT Corporation and Subsidiaries
Notes to Consolidated Financial Statements
December 31, 2012 and 2011
Income or expense (gain or loss) by financial instruments category for the years ended December 31, 2012 and 2011, are as follows:
| (In millions of Korean won) | 2012 | 2011 | ||||||
Loans and receivables | ||||||||
Interest income1 | ₩ | 380,556 | ₩ | 313,829 | ||||
Loss on valuation | (150,389 | ) | (146,177 | ) | ||||
Foreign currency transaction gain(loss) | (562 | ) | 6,100 | |||||
Foreign currency translation gain(loss) | (2,692 | ) | 4,646 | |||||
Loss on disposal | (15,809 | ) | (3,807 | ) | ||||
Assets at fair value through the profit and loss | ||||||||
Interest income1 | 6,305 | 10,684 | ||||||
Dividend income | — | 13 | ||||||
Foreign currency transaction gain(loss) | (168 | ) | 8 | |||||
Foreign currency translation gain(loss) | (636 | ) | 116 | |||||
Loss on disposal | (4 | ) | (1,120 | ) | ||||
Gain(loss) on valuation | (7,449 | ) | 10,263 | |||||
Derivatives used for hedging | ||||||||
Transaction loss | (4,023 | ) | (26,882 | ) | ||||
Gain(loss) on valuation | (43,880 | ) | 43,755 | |||||
Other comprehensive income2 | (12,410 | ) | 69,147 | |||||
Reclassified to profit or loss from other comprehensive income2,3 | 22,977 | (48,385 | ) | |||||
Available-for-sale | ||||||||
Interest income1 | 142 | 389 | ||||||
Dividend income | 5,155 | 7,810 | ||||||
Gain on disposal | 7,991 | 6,724 | ||||||
Impairment loss | (3,401 | ) | (4,727 | ) | ||||
Other comprehensive income2 | 31,599 | 80,521 | ||||||
Reclassified to profit or loss from other comprehensive income2 | (6,327 | ) | (1,765 | ) | ||||
Liabilities at fair value through the profit and loss | ||||||||
Interest expense1 | (27,167 | ) | (11,777 | ) | ||||
Foreign currency transaction loss | (218 | ) | — | |||||
Foreign currency translation gain | 531 | — | ||||||
Gain(loss) on disposal | (78 | ) | 40 | |||||
Gain(loss) on valuation | 341 | (142 | ) | |||||
Derivatives used for hedging | ||||||||
Gain on disposal | 2,352 | — | ||||||
Gain(loss) on valuation | (197,476 | ) | 1,041 | |||||
Other comprehensive income2 | (158,157 | ) | 14,235 | |||||
Reclassified to profit or loss from other comprehensive income2,3 | 181,332 | (6,030 | ) | |||||
Financial liabilities at amortized cost | ||||||||
Interest expense1,4 | (562,134 | ) | (574,682 | ) | ||||
Foreign currency transaction gain | 3,601 | 4,063 | ||||||
Foreign currency translation gain(loss) | 262,051 | (84,124 | ) | |||||
Other liabilities | ||||||||
Financial guarantee gain or loss | (11,216 | ) | (4,973 | ) | ||||
|
|
|
| |||||
Total | ₩ | (299,263 | ) | ₩ | (341,207 | ) | ||
|
|
|
| |||||
43
Table of Contents
KT Corporation and Subsidiaries
Notes to Consolidated Financial Statements
December 31, 2012 and 2011
| 1 | KT Capital Co., Ltd. and KT Rental, a subsidiary of the Company, recognizes interest income and expense as operating revenue and expense. Interest income recognized as operating revenue is ₩184,183 million (2011: ₩173,740 million) and interest expense recognized as operating expense is ₩116,810 million (2011: ₩106,951 million) for the year ended December 31, 2012. |
| 2 | The amounts directly reflected in equity before adjustments of deferred income tax. |
| 3 | During the period, the certain derivatives of the Company were settled and the related gain or loss on valuation of cash flow hedge in other comprehensive income was reclassified to profit or loss for the period. |
| 4 | The amounts reflected as interest expense arising from derivatives. |
| 5. | Cash and Cash Equivalents |
Cash and cash equivalents as of December 31, 2012 and 2011, are as follows:
| (In millions of Korean won) | 2012 | 2011 | ||||||
Cash on hand | ₩ | 24,454 | ₩ | 11,330 | ||||
Cash in banks | 839,529 | 652,374 | ||||||
Money market trust | 619,840 | 464,000 | ||||||
Other financial instruments | 570,873 | 317,465 | ||||||
|
|
|
| |||||
Total | ₩ | 2,054,696 | ₩ | 1,445,169 | ||||
|
|
|
| |||||
Cash and cash equivalents in the statement of financial position equal cash and cash equivalents in the statements of cash flows.
Restricted cash and cash equivalents as of December 31, 2012 and 2011, are as follows:
| (In millions of Korean won) | Type | 2012 | 2011 | Description | ||||||||
Cash and cash equivalents | Restricted deposit | ₩ | 6,690 | ₩ | 8,707 | Deposit restricted for governmental project | ||||||
44
Table of Contents
KT Corporation and Subsidiaries
Notes to Consolidated Financial Statements
December 31, 2012 and 2011
| 6. | Trade and Other Receivables |
Trade and other receivables as of December 31, 2012 and 2011, are as follows:
| 2012 | ||||||||||||||||
| (in millions of Korean won) | Total amounts | Allowance for doubtful accounts | Present value discount | Carrying value | ||||||||||||
Current assets | ||||||||||||||||
Trade receivables | ₩ | 4,456,213 | ₩ | (464,046 | ) | ₩ | (30,906 | ) | ₩ | 3,961,261 | ||||||
Other receivables | 2,083,276 | (166,163 | ) | (851 | ) | 1,916,262 | ||||||||||
|
|
|
|
|
|
|
| |||||||||
Total | ₩ | 6,539,489 | ₩ | (630,209 | ) | ₩ | (31,757 | ) | ₩ | 5,877,523 | ||||||
|
|
|
|
|
|
|
| |||||||||
Non-current assets | ||||||||||||||||
Trade receivables | ₩ | 688,303 | ₩ | (3,992 | ) | ₩ | (52,252 | ) | ₩ | 632,059 | ||||||
Other receivables | 492,643 | (9,736 | ) | (43,850 | ) | 439,057 | ||||||||||
|
|
|
|
|
|
|
| |||||||||
Total | ₩ | 1,180,946 | ₩ | (13,728 | ) | ₩ | (96,102 | ) | ₩ | 1,071,116 | ||||||
|
|
|
|
|
|
|
| |||||||||
| 2011 | ||||||||||||||||
| (in millions of Korean won) | Total amounts | Allowance for doubtful accounts | Present value discount | Carrying value | ||||||||||||
Current assets | ||||||||||||||||
Trade receivables | ₩ | 5,318,171 | ₩ | (462,502 | ) | ₩ | (64,229 | ) | ₩ | 4,791,440 | ||||||
Other receivables | 1,536,616 | (169,042 | ) | (100 | ) | 1,367,474 | ||||||||||
|
|
|
|
|
|
|
| |||||||||
Total | ₩ | 6,854,787 | ₩ | (631,544 | ) | ₩ | (64,329 | ) | ₩ | 6,158,914 | ||||||
|
|
|
|
|
|
|
| |||||||||
Non-current assets | ||||||||||||||||
Trade receivables | ₩ | 1,452,685 | ₩ | (10,716 | ) | ₩ | (115,171 | ) | ₩ | 1,326,798 | ||||||
Other receivables | 442,640 | (97 | ) | (45,926 | ) | 396,617 | ||||||||||
|
|
|
|
|
|
|
| |||||||||
Total | ₩ | 1,895,325 | ₩ | (10,813 | ) | ₩ | (161,097 | ) | ₩ | 1,723,415 | ||||||
|
|
|
|
|
|
|
| |||||||||
The fair values of trade and other receivables with original maturities less than one year equal their carrying values because the discounting effect is immaterial. The fair value of trade and other receivables with original maturities longer than one year, which are mainly from sales of goods, is determined discounting the expected future cash flow at the weighted average borrowing rate.
45
Table of Contents
KT Corporation and Subsidiaries
Notes to Consolidated Financial Statements
December 31, 2012 and 2011
Details of changes in allowance for doubtful accounts for the years ended December 31, 2012 and 2011, are as follows:
| 2012 | 2011 | |||||||||||||||
| (in millions of Korean won) | Trade receivables | Other receivables | Trade receivables | Other receivables | ||||||||||||
Beginning balance | ₩ | 473,218 | ₩ | 169,139 | ₩ | 502,248 | ₩ | 144,715 | ||||||||
Provision | 99,037 | 14,771 | 109,034 | 24,408 | ||||||||||||
Reversal or written-off | (117,554 | ) | (9,638 | ) | (160,173 | ) | (7,183 | ) | ||||||||
Changes in the scope of consolidation | 10,487 | 1,632 | 21,954 | 5,016 | ||||||||||||
Others | 2,850 | (5 | ) | 155 | 2,183 | |||||||||||
|
|
|
|
|
|
|
| |||||||||
Ending balance | ₩ | 468,038 | ₩ | 175,899 | ₩ | 473,218 | ₩ | 169,139 | ||||||||
|
|
|
|
|
|
|
| |||||||||
Provisions for doubtful trade and other receivables are recognized as operating expenses, other expenses, or finance costs.
Details of aging analysis of trade receivables as of December 31, 2012 and 2011, are as follows:
| (in millions of Korean won) | 2012 | 2011 | ||||||
Neither past due nor impaired | ₩ | 3,862,344 | ₩ | 5,337,797 | ||||
|
|
|
| |||||
Past due and impaired | ||||||||
Up to six months | 700,683 | 754,103 | ||||||
Six months to twelve months | 131,848 | 162,911 | ||||||
Over twelve months | 366,483 | 336,645 | ||||||
|
|
|
| |||||
Subtotal | 1,199,014 | 1,253,659 | ||||||
Allowance for doubtful accounts | (468,038 | ) | (473,218 | ) | ||||
|
|
|
| |||||
Total | ₩ | 4,593,320 | ₩ | 6,118,238 | ||||
|
|
|
| |||||
The detail of other receivables as of December 31, 2012 and 2011, are as follows:
| (in millions of Korean won) | 2012 | 2011 | ||||||
Loans | ₩ | 131,319 | ₩ | 100,251 | ||||
Receivables1 | 2,011,792 | 1,489,040 | ||||||
Accrued income | 24,611 | 17,651 | ||||||
Refundable deposits | 362,389 | 325,603 | ||||||
Others | 1,107 | 685 | ||||||
Allowance | (175,899 | ) | (169,139 | ) | ||||
|
|
|
| |||||
Total | ₩ | 2,355,319 | ₩ | 1,764,091 | ||||
|
|
|
| |||||
Current | 1,916,262 | 1,367,474 | ||||||
Non-current | 439,057 | 396,617 | ||||||
| 1 | The settlement receivables of BC Card Co., Ltd. of ₩1,343,564 million (2011: ₩863,853 million) included, as of December 31, 2012 and 2011. |
46
Table of Contents
KT Corporation and Subsidiaries
Notes to Consolidated Financial Statements
December 31, 2012 and 2011
Details of aging analysis of other receivables as of December 31, 2012 and 2011, are as follows:
| (in millions of Korean won) | 2012 | 2011 | ||||||
Neither past due nor impaired | ₩ | 2,270,434 | ₩ | 1,712,284 | ||||
|
|
|
| |||||
Past due and impaired | ||||||||
Up to six months | 193,559 | 160,612 | ||||||
Six months to twelve months | 21,041 | 12,322 | ||||||
Over twelve months | 46,184 | 48,012 | ||||||
|
|
|
| |||||
Subtotal | 260,784 | 220,946 | ||||||
Allowance for doubtful accounts | (175,899 | ) | (169,139 | ) | ||||
|
|
|
| |||||
Total | ₩ | 2,355,319 | ₩ | 1,764,091 | ||||
|
|
|
| |||||
The maximum exposure of trade and other receivables to credit risk is carrying value of each class of receivables mentioned above as of December 31, 2012. As of December 31, 2012, the Company is provided with guarantees of ₩892,106 million by Seoul Guarantee Insurance related to the collection of certain accounts receivable arising from the handset sales.
47
Table of Contents
KT Corporation and Subsidiaries
Notes to Consolidated Financial Statements
December 31, 2012 and 2011
| 7. | Loans Receivable |
Loans receivable as of December 31, 2012 and 2011, are as follows:
Current
| (in millions of Korean won) | 2012 | 2011 | ||||||||||||||||||||||
Original amount | Allowance accounts | Carrying Value | Original amount | Allowance accounts | Carrying Value | |||||||||||||||||||
Factoring receivables | ₩ | 71,293 | ₩ | — | ₩ | 71,293 | ₩ | 47,201 | ₩ | (1,012 | ) | ₩ | 46,189 | |||||||||||
Loans | 581,351 | (33,256 | ) | 548,095 | 640,580 | (22,352 | ) | 618,228 | ||||||||||||||||
Accounts receivable-loans | — | — | — | 3,084 | (221 | ) | 2,863 | |||||||||||||||||
Loans for installment credit | 49,205 | (1,235 | ) | 47,970 | 31,044 | (655 | ) | 30,389 | ||||||||||||||||
Deferred loan origination costs | 755 | — | 755 | — | — | — | ||||||||||||||||||
Accounts receivable-loans for installment credit | — | — | — | 393 | (32 | ) | 361 | |||||||||||||||||
|
|
|
|
|
|
|
|
|
|
|
| |||||||||||||
Total | ₩ | 702,604 | ₩ | (34,491 | ) | ₩ | 668,113 | ₩ | 722,302 | ₩ | (24,272 | ) | ₩ | 698,030 | ||||||||||
|
|
|
|
|
|
|
|
|
|
|
| |||||||||||||
Non-Current
| (in millions of Korean won) | 2012 | 2011 | ||||||||||||||||||||||
Original amount | Allowance accounts | Carrying Value | Original amount | Allowance accounts | Carrying Value | |||||||||||||||||||
Factoring receivables | ₩ | 6,051 | ₩ | (1,599 | ) | ₩ | 4,452 | ₩ | 23,948 | ₩ | (513 | ) | ₩ | 23,435 | ||||||||||
Loans | 406,410 | (15,161 | ) | 391,249 | 388,870 | (11,474 | ) | 377,396 | ||||||||||||||||
Loans for installment credit | 66,517 | (1,935 | ) | 64,582 | 45,358 | (954 | ) | 44,404 | ||||||||||||||||
Deferred loan origination costs | 2,336 | — | 2,336 | 470 | — | 470 | ||||||||||||||||||
New technology financial investment assets | 6,788 | (2,433 | ) | 4,355 | 10,241 | (3,668 | ) | 6,573 | ||||||||||||||||
New technology financial loans | 55,190 | (9,577 | ) | 45,613 | 41,729 | (2,706 | ) | 39,023 | ||||||||||||||||
|
|
|
|
|
|
|
|
|
|
|
| |||||||||||||
Total | ₩ | 543,292 | ₩ | (30,705 | ) | ₩ | 512,587 | ₩ | 510,616 | ₩ | (19,315 | ) | ₩ | 491,301 | ||||||||||
|
|
|
|
|
|
|
|
|
|
|
| |||||||||||||
The fair values of trade and other receivables with maturities less than one year equal their carrying values because the discounting effect is immaterial. The fair value of loans receivables is determined discounting the future cash flow at the weighted average borrowing rate.
48
Table of Contents
KT Corporation and Subsidiaries
Notes to Consolidated Financial Statements
December 31, 2012 and 2011
Details of changes in allowance for doubtful accounts for the years ended December 31, 2012 and 2011, are as follows:
| (in millions of Korean won) | 2012 | 2011 | ||||||
Beginning | ₩ | 43,587 | ₩ | 35,583 | ||||
Provision | 32,914 | 30,808 | ||||||
Reversal or written-off | (12,210 | ) | (22,804 | ) | ||||
Others | 905 | — | ||||||
|
|
|
| |||||
Ending | ₩ | 65,196 | ₩ | 43,587 | ||||
|
|
|
| |||||
Provisions for doubtful loans receivable are recognized as operating expenses.
Details of aging analysis of loans receivables as of December 31, 2012 and 2011, are as follows:
| (in millions of Korean won) | 2012 | 2011 | ||||||
Neither past due nor impaired | ₩ | 1,155,838 | ₩ | 1,150,452 | ||||
|
|
|
| |||||
Past due and impaired | ||||||||
Up to six months | 75,942 | 71,101 | ||||||
Six months to twelve months | 3,767 | 10,586 | ||||||
Over twelve months | 10,349 | 779 | ||||||
|
|
|
| |||||
| 90,058 | 82,466 | |||||||
Allowance for doubtful accounts | (65,196 | ) | (43,587 | ) | ||||
|
|
|
| |||||
| 24,862 | 38,879 | |||||||
|
|
|
| |||||
Total | ₩ | 1,180,700 | ₩ | 1,189,331 | ||||
|
|
|
| |||||
The maximum exposure of loans receivables to credit risk is carrying value as of December 31, 2012.
49
Table of Contents
KT Corporation and Subsidiaries
Notes to Consolidated Financial Statements
December 31, 2012 and 2011
| 8. | Other Financial Assets and Liabilities |
Other financial assets and liabilities as of December 31, 2012 and 2011, are as follows:
| (In millions of Korean won) | 2012 | 2011 | ||||||
Other financial assets | ||||||||
Assets at fair value through the profit and loss | ₩ | 6,407 | ₩ | 51,990 | ||||
Derivatives used for hedge | 21,348 | 113,831 | ||||||
Financial instruments1 | 459,792 | 288,241 | ||||||
Available-for-sale financial assets | 429,606 | 421,255 | ||||||
Held-to-maturity investments | 8 | 7 | ||||||
Less: Non-current | (672,182 | ) | (621,699 | ) | ||||
|
|
|
| |||||
Current | ₩ | 244,979 | ₩ | 253,625 | ||||
|
|
|
| |||||
Other financial liabilities | ||||||||
Liabilities at fair value through the profit and loss | ₩ | 3,216 | ₩ | 2,596 | ||||
Derivatives used for hedge | 112,603 | 6,210 | ||||||
Financial guarantee liabilities | 9,328 | 2,830 | ||||||
Other financial liabilities2 | 16,649 | 285,124 | ||||||
Less: Non-current | (69,813 | ) | (288,473 | ) | ||||
|
|
|
| |||||
Current | ₩ | 71,983 | ₩ | 8,287 | ||||
|
|
|
| |||||
| 1 | Financial assets amounting to ₩20,834 million (2011: ₩22,900 million) and ₩77 million (2011: ₩123 million) are collaterals pledged against the investee’s debt and checking account deposit, which are subject to withdrawal restrictions. |
| 2 | As of December 31, 2012, the Company has funding obligation to Smart Channel Co., Ltd. The related financial guarantee liabilities of ₩5,393 million are recognized. |
Financial instruments at fair value through the profit and loss as of December 31, 2012 and 2011, are as follows:
| 2012 | 2011 | |||||||||||||||
| (in millions of Korean won) | Assets | Liabilities | Assets | Liabilities | ||||||||||||
Financial instruments held for trading | ₩ | 6,407 | ₩ | 63 | ₩ | 50,604 | ₩ | 2,596 | ||||||||
Financial instruments at fair value through the profit and loss | — | 3,153 | 1,386 | — | ||||||||||||
|
|
|
|
|
|
|
| |||||||||
Total | ₩ | 6,407 | ₩ | 3,216 | ₩ | 51,990 | ₩ | 2,596 | ||||||||
|
|
|
|
|
|
|
| |||||||||
50
Table of Contents
KT Corporation and Subsidiaries
Notes to Consolidated Financial Statements
December 31, 2012 and 2011
The valuation gains and losses on financial instruments held for trading for the years ended December 31, 2012 and 2011, are as follows:
| 2012 | 2011 | |||||||||||||||
| (in millions of Korean won) | Valuation gain | Valuation loss | Valuation gain | Valuation loss | ||||||||||||
Interest rate swap | ₩ | — | ₩ | 2 | ₩ | 3 | ₩ | 45 | ||||||||
Currency swap | — | — | 10,229 | — | ||||||||||||
Currency forward | 118 | — | 294 | 180 | ||||||||||||
Other derivatives | — | — | 2,271 | 36 | ||||||||||||
|
|
|
|
|
|
|
| |||||||||
Total | ₩ | 118 | ₩ | 2 | ₩ | 12,797 | ₩ | 261 | ||||||||
|
|
|
|
|
|
|
| |||||||||
The valuation gains and losses on financial instruments at fair value through the profit and loss for the years ended December 31, 2012 and 2011, are as follows:
| (In millions of Korean won) | 2012 | 2011 | ||||||
Interest expense | ₩ | 38 | ₩ | — | ||||
Foreign currency translation gain | 199 | — | ||||||
Gain on transactions | 547 | — | ||||||
Gain on valuations | 97 | 282 | ||||||
|
|
|
| |||||
Total | ₩ | 881 | ₩ | 282 | ||||
|
|
|
| |||||
The maximum exposure of debt securities of financial instruments at fair value through the profit and loss to credit risk is carrying value as of December 31, 2012.
Derivatives used for hedge as of December 31, 2012 and 2011, are as follows:
| 2012 | 2011 | |||||||||||||||
| (in millions of Korean won) | Assets | Liabilities | Assets | Liabilities | ||||||||||||
Interest rate swap1 | ₩ | — | ₩ | 1,340 | ₩ | — | ₩ | 134 | ||||||||
Currency swap2 | 21,348 | 111,263 | 113,831 | 6,076 | ||||||||||||
|
|
|
|
|
|
|
| |||||||||
Total | 21,348 | 112,603 | 113,831 | 6,210 | ||||||||||||
|
|
|
|
|
|
|
| |||||||||
Less: non-current | ||||||||||||||||
Interest rate swap | — | — | — | — | ||||||||||||
Currency swap | (21,348 | ) | (50,032 | ) | (64,349 | ) | (1,076 | ) | ||||||||
|
|
|
|
|
|
|
| |||||||||
Sub-total | (21,348 | ) | (50,032 | ) | (64,349 | ) | (1,076 | ) | ||||||||
|
|
|
|
|
|
|
| |||||||||
Current | ₩ | — | ₩ | 62,571 | ₩ | 49,482 | ₩ | 5,134 | ||||||||
|
|
|
|
|
|
|
| |||||||||
| 1 | The interest rate swap contract is to hedge the risk of variability in future fair value of the bond. |
| 2 | The currency swap contract is to hedge the risk of variability in cash flow from the bond. In applying the cash flow hedge accounting, the Company hedges its exposures to cash flow fluctuation until September 7, 2034. |
51
Table of Contents
KT Corporation and Subsidiaries
Notes to Consolidated Financial Statements
December 31, 2012 and 2011
The full value of a hedging derivative is classified as a non-current asset or liability if the remaining maturity of the hedged item is more than 12 months and, as a current asset or liability, if the maturity of the hedged item is less than 12 months.
The valuation gains and losses on the derivatives contracts for the years ended December 31, 2012 and 2011, are as follows:
| (in millions of Korean won) | 2012 | 2011 | ||||||||||||||||||||||
| Type of Transaction | Valuation gain | Valuation loss | Accumulated comprehensive | Valuation gain | Valuation loss | Accumulated comprehensive | ||||||||||||||||||
Interest rate swap | ₩ | — | ₩ | — | ₩ | (1,206 | ) | ₩ | — | ₩ | — | ₩ | (135 | ) | ||||||||||
Currency swap | — | 241,356 | (169,361 | ) | 53,727 | 8,931 | 83,517 | |||||||||||||||||
|
|
|
|
|
|
|
|
|
|
|
| |||||||||||||
Total | ₩ | — | ₩ | 241,356 | ₩ | (170,567 | ) | ₩ | 53,727 | ₩ | 8,931 | ₩ | 83,382 | |||||||||||
|
|
|
|
|
|
|
|
|
|
|
| |||||||||||||
| 1 | The amounts before adjustments of deferred income tax directly reflected in equity and allocation to the non-controlling interest. |
The ineffective portion recognized in profit or loss on the cash flow hedge is valuation loss of ₩29,183 million for the current period (2011: valuation gain of ₩2,714 million).
Details of available-for-sale financial assets as of December 31, 2012 and 2011, are as follows:
| (In millions of Korean won) | 2012 | 2011 | ||||||
Marketable equity securities | ₩ | 49,156 | ₩ | 47,959 | ||||
Non-marketable equity securities | 369,497 | 347,467 | ||||||
Marketable debt securities | 4,935 | 18,400 | ||||||
Non-marketable debt securities | 6,018 | 7,429 | ||||||
Others | — | 7,541 | ||||||
|
|
|
| |||||
Total | 429,606 | 428,796 | ||||||
Less: non-current | (429,606 | ) | (421,255 | ) | ||||
|
|
|
| |||||
Current | ₩ | — | ₩ | 7,541 | ||||
|
|
|
| |||||
52
Table of Contents
KT Corporation and Subsidiaries
Notes to Consolidated Financial Statements
December 31, 2012 and 2011
Changes of available-for-sale financial assets for the years ended December 31, 2012 and 2011, are as follows:
| (In millions of Korean won) | 2012 | 2011 | ||||||
Beginning | ₩ | 428,796 | ₩ | 178,609 | ||||
Acquisition | 86,622 | 168,060 | ||||||
Disposal | (114,956 | ) | (21,216 | ) | ||||
Valuation1 | 31,599 | 80,521 | ||||||
Impairment | (3,401 | ) | (4,727 | ) | ||||
Changes in scope of consolidation | 1,056 | 14,094 | ||||||
Others | (110 | ) | 13,455 | |||||
|
|
|
| |||||
Ending | ₩ | 429,606 | ₩ | 428,796 | ||||
|
|
|
| |||||
| 1 | The amount before adjustment of deferred income tax directly reflected in equity and allocation to the non-controlling interest. |
The maximum exposure of debt securities of available-for-sale financial assets to credit risk is carrying value as of December 31, 2012.
Available-for-sale financial assets are measured at fair value. However, non-marketable equity securities that do not have quoted market prices in an active market and the fair value of which cannot be reliably measured are recognized at cost and the impairment loss is recognized if any.
As of December 31, 2012, the below equity security owned by the Company has been pledged for the borrowings of invested company.
| (In millions of Korean won) | Investee | 2012 | ||||
Available-for-sale financial assets | Econhill Development Asset Management Co., Ltd. | ₩ | 6,000 | |||
53
Table of Contents
KT Corporation and Subsidiaries
Notes to Consolidated Financial Statements
December 31, 2012 and 2011
| 9. | Inventories |
Inventories as of December 31, 2012 and 2011, are as follows:
| 2012 | 2011 | |||||||||||||||||||||||
| (in millions of Korean won) | Acquisition cost | Valuation allowance | Book Value | Acquisition cost | Valuation allowance | Book Value | ||||||||||||||||||
Merchandise | ₩ | 702,249 | ₩ | (33,988 | ) | ₩ | 668,261 | ₩ | 622,196 | ₩ | (29,002 | ) | ₩ | 593,194 | ||||||||||
Goods in transit | 193,720 | — | 193,720 | — | — | — | ||||||||||||||||||
Others | 72,954 | (65 | ) | 72,889 | 82,670 | (1,137 | ) | 81,533 | ||||||||||||||||
|
|
|
|
|
|
|
|
|
|
|
| |||||||||||||
Total | ₩ | 968,923 | ₩ | (34,053 | ) | ₩ | 934,870 | ₩ | 704,866 | ₩ | (30,139 | ) | ₩ | 674,727 | ||||||||||
|
|
|
|
|
|
|
|
|
|
|
| |||||||||||||
Valuation loss on inventory write-downs recognized as expenses amount to ₩23,931 million during the current period (2011: ₩23,877 million).
| 10. | Other Assets and Liabilities |
Other assets and liabilities as of December 31, 2012 and 2011, are as follows:
| (In millions of Korean won) | 2012 | 2011 | ||||||
Other assets | ||||||||
Advance payments | ₩ | 128,756 | ₩ | 136,172 | ||||
Prepaid expenses | 244,337 | 218,638 | ||||||
Others | 84,027 | 41,896 | ||||||
Less: Non-current | (95,178 | ) | (86,053 | ) | ||||
|
|
|
| |||||
Current | ₩ | 361,942 | ₩ | 310,653 | ||||
|
|
|
| |||||
Other liabilities | ||||||||
Advances received | ₩ | 143,614 | ₩ | 117,178 | ||||
Withholdings | 93,757 | 52,995 | ||||||
Unearned revenue | 42,208 | 71,290 | ||||||
Others | 1,037 | 833 | ||||||
Less: Non-current | (41,428 | ) | (32,038 | ) | ||||
|
|
|
| |||||
Current | ₩ | 239,188 | ₩ | 210,258 | ||||
|
|
|
| |||||
54
Table of Contents
KT Corporation and Subsidiaries
Notes to Consolidated Financial Statements
December 31, 2012 and 2011
| 11. | Property and Equipment |
The changes in property and equipment for the years ended December 31, 2012 and 2011, are as follows:
| 2012 | ||||||||||||||||||||||||
| (in millions of Korean won) | Land | Buildings and structures | Machinery and equipment | Others | Construction- in-progress | Total | ||||||||||||||||||
Acquisition cost | ₩ | 1,201,142 | ₩ | 3,570,608 | ₩ | 33,455,278 | ₩ | 1,944,129 | ₩ | 754,648 | ₩ | 40,925,805 | ||||||||||||
Accumulated depreciation (including accumulated impairment loss and others) | (132 | ) | (1,215,198 | ) | (24,233,927 | ) | (1,426,967 | ) | (26,886 | ) | (26,903,110 | ) | ||||||||||||
|
|
|
|
|
|
|
|
|
|
|
| |||||||||||||
Balance at 2012.1.1 | 1,201,010 | 2,355,410 | 9,221,351 | 517,162 | 727,762 | 14,022,695 | ||||||||||||||||||
Acquisition | 9,554 | 4,582 | 149,606 | 447,487 | 3,244,792 | 3,856,021 | ||||||||||||||||||
Disposal1 | (17,200 | ) | (42,335 | ) | (65,727 | ) | (156,694 | ) | (12,065 | ) | (294,021 | ) | ||||||||||||
Depreciation | — | (134,382 | ) | (2,384,508 | ) | (351,087 | ) | — | (2,869,977 | ) | ||||||||||||||
Transfer in (out) | 16,049 | 82,227 | 2,911,203 | 121,214 | (3,130,693 | ) | — | |||||||||||||||||
Inclusion in scope of consolidation | 13,097 | 5,565 | 81 | 967,914 | 1,524 | 988,181 | ||||||||||||||||||
Exclusion from scope of consolidation | — | — | (63 | ) | (18 | ) | — | (81 | ) | |||||||||||||||
Others | 14,683 | (89,708 | ) | 8,837 | 76,128 | 21,662 | 31,602 | |||||||||||||||||
|
|
|
|
|
|
|
|
|
|
|
| |||||||||||||
Balance at 2012.12.31 | ₩ | 1,237,193 | ₩ | 2,181,359 | ₩ | 9,840,780 | ₩ | 1,622,106 | ₩ | 852,982 | ₩ | 15,734,420 | ||||||||||||
|
|
|
|
|
|
|
|
|
|
|
| |||||||||||||
Acquisition cost | ₩ | 1,237,325 | ₩ | 3,255,925 | ₩ | 32,144,952 | ₩ | 3,561,622 | ₩ | 867,799 | ₩ | 41,067,623 | ||||||||||||
Accumulated depreciation (including accumulated impairment loss and others) | (132 | ) | (1,074,566 | ) | (22,304,172 | ) | (1,939,516 | ) | (14,817 | ) | (25,333,203 | ) | ||||||||||||
| 1 | Land and buildings disposed of in connection with the sale and leaseback transactions with AJU-KTM private funding real-estate investment trust No. 1 and K-REALTY CR-REIT 2 were included (Note 28). |
| 2 | Operating lease of ₩959,056 million with KT Rental is included in changes in scope of consolidation. |
55
Table of Contents
KT Corporation and Subsidiaries
Notes to Consolidated Financial Statements
December 31, 2012 and 2011
| 2011 | ||||||||||||||||||||||||
| (in millions of Korean won) | Land | Buildings and structures | Machinery and equipment | Others | Construction- in-progress | Total | ||||||||||||||||||
Acquisition cost | ₩ | 1,127,774 | ₩ | 3,675,370 | ₩ | 31,441,259 | ₩ | 1,806,746 | ₩ | 822,637 | ₩ | 38,873,786 | ||||||||||||
Accumulated depreciation (including accumulated impairment loss and others) | (132 | ) | (1,167,811 | ) | (22,898,387 | ) | (1,370,264 | ) | (38,920 | ) | (25,475,514 | ) | ||||||||||||
|
|
|
|
|
|
|
|
|
|
|
| |||||||||||||
Balance at 2011.1.1 | 1,127,642 | 2,507,559 | 8,542,872 | 436,482 | 783,717 | 13,398,272 | ||||||||||||||||||
Acquisition | 5 | 3,541 | 48,258 | 35,901 | 3,158,247 | 3,245,952 | ||||||||||||||||||
Disposal1 | (35,475 | ) | (104,079 | ) | (108,415 | ) | (56,414 | ) | (363 | ) | (304,746 | ) | ||||||||||||
Depreciation | — | (146,096 | ) | (2,313,287 | ) | (165,254 | ) | — | (2,624,637 | ) | ||||||||||||||
Transfer in (out) | 3,802 | 94,763 | 3,048,999 | 132,114 | (3,279,678 | ) | — | |||||||||||||||||
Inclusion in scope of consolidation2 | 115,978 | 46,445 | 180,245 | 29,868 | 48,560 | 421,096 | ||||||||||||||||||
Exclusion from scope of consolidation | — | (6,626 | ) | (100,554 | ) | (5,862 | ) | (30,742 | ) | (143,784 | ) | |||||||||||||
Others | (10,942 | ) | (40,097 | ) | (76,767 | ) | 110,327 | 48,021 | 30,542 | |||||||||||||||
|
|
|
|
|
|
|
|
|
|
|
| |||||||||||||
Balance at 2011.12.31 | ₩ | 1,201,010 | ₩ | 2,355,410 | ₩ | 9,221,351 | ₩ | 517,162 | ₩ | 727,762 | ₩ | 14,022,695 | ||||||||||||
|
|
|
|
|
|
|
|
|
|
|
| |||||||||||||
Acquisition cost | ₩ | 1,201,142 | ₩ | 3,570,608 | ₩ | 33,455,278 | ₩ | 1,944,129 | ₩ | 754,648 | ₩ | 40,925,805 | ||||||||||||
Accumulated depreciation (including accumulated impairment loss and others) | (132 | ) | (1,215,198 | ) | (24,233,927 | ) | (1,426,967 | ) | (26,886 | ) | (26,903,110 | ) | ||||||||||||
| 1 | Land and buildings disposed of in connection with the sale and leaseback transactions with K-REALTY CR-REIT 1 were included (Note 28). |
Certain land and buildings are pledged as collaterals for borrowings of up to ₩9,740 million as of December 31, 2012 (2011: ₩1,940 million).
The borrowing costs capitalized for qualifying assets amount to ₩12,126 million (2011: ₩14,675 million) in 2012. The interest rate applied to calculate the capitalized borrowing costs in 2012 is 4.46% to 4.89%. (2011: 5.23% to 6.83%)
| 12. | Investment Property |
The changes in investment property for years ended December 31, 2012 and 2011, are as follows:
| (in millions of Korean won) | 2012 | 2011 | ||||||||||||||||||||||
| Land | Buildings | Total | Land | Buildings | Total | |||||||||||||||||||
Acquisition cost | ₩ | 325,158 | ₩ | 1,195,175 | ₩ | 1,520,333 | ₩ | 320,739 | ₩ | 1,158,558 | ₩ | 1,479,297 | ||||||||||||
Accumulated depreciation (including accumulated impairment loss and others) | — | (361,228 | ) | (361,228 | ) | — | (333,047 | ) | (333,047 | ) | ||||||||||||||
|
|
|
|
|
|
|
|
|
|
|
| |||||||||||||
Beginning | ₩ | 325,158 | ₩ | 833,947 | ₩ | 1,159,105 | ₩ | 320,739 | ₩ | 825,511 | ₩ | 1,146,250 | ||||||||||||
Disposal1,2 | (2,619 | ) | (70,024 | ) | (72,643 | ) | (10,660 | ) | (27,023 | ) | (37,683 | ) | ||||||||||||
Depreciation | — | (49,006 | ) | (49,006 | ) | — | (47,221 | ) | (47,221 | ) | ||||||||||||||
Transfer | 12,908 | 104,849 | 117,757 | 15,079 | 82,680 | 97,759 | ||||||||||||||||||
|
|
|
|
|
|
|
|
|
|
|
| |||||||||||||
Ending | ₩ | 335,447 | ₩ | 819,766 | ₩ | 1,155,213 | ₩ | 325,158 | ₩ | 833,947 | ₩ | 1,159,105 | ||||||||||||
|
|
|
|
|
|
|
|
|
|
|
| |||||||||||||
Acquisition cost | ₩ | 335,447 | ₩ | 1,022,454 | ₩ | 1,357,901 | ₩ | 325,158 | ₩ | 1,195,175 | ₩ | 1,520,333 | ||||||||||||
Accumulated depreciation (including accumulated impairment loss and others) | — | (202,688 | ) | (202,688 | ) | — | (361,228 | ) | (361,228 | ) | ||||||||||||||
56
Table of Contents
KT Corporation and Subsidiaries
Notes to Consolidated Financial Statements
December 31, 2012 and 2011
| 1 | Land and buildings disposed of in connection with the sale and leaseback transactions with Aju-KTM private funding real estate investment trust No.1 and K-REALTY CR-REIT 2 were included (Note 28). |
| 2 | Land and buildings disposed of in connection with the sale and leaseback transactions with K-REALTY CR-REIT 1 were included (Note 28). |
The buildings mentioned above are depreciated over 10 to 40 years using the straight-line method.
The fair value of investment property is ₩2,335,642 million as of December 31, 2012 (2011: ₩2,524,039 million). The fair value of investment property is estimated based on the expected cash flow.
Rental income from investment property is ₩99,527 million in 2012 (2011: ₩150,752 million) and direct operating expenses (including repairs and maintenance) arising from investment property that generated rental income during the period are recognized as operating expenses.
Certain land and buildings are pledged as collateral related to the rental contracts for up to ₩46,389 million as of December 31, 2012 (2011: ₩70,317 million).
| 13. | Intangible Assets |
The changes in intangible assets for the years ended December 31, 2012 and 2011, are as follows:
| 2012 | ||||||||||||||||||||||||
| (in millions of Korean won) | Goodwill | Development costs | Software | Frequency usage rights | Others1 | Total | ||||||||||||||||||
Acquisition cost | ₩ | 457,144 | ₩ | 1,069,158 | ₩ | 555,154 | ₩ | 1,783,508 | ₩ | 885,994 | ₩ | 4,750,958 | ||||||||||||
Accumulated amortization (including accumulated impairment loss and others) | (7,749 | ) | (642,530 | ) | (330,835 | ) | (887,811 | ) | (238,548 | ) | (2,107,473 | ) | ||||||||||||
|
|
|
|
|
|
|
|
|
|
|
| |||||||||||||
Balance at 2012.1.1 | ₩ | 449,395 | ₩ | 426,628 | ₩ | 224,319 | ₩ | 895,697 | ₩ | 647,446 | ₩ | 2,643,485 | ||||||||||||
Acquisition | — | 322,350 | 72,398 | 267,161 | 68,572 | 730,481 | ||||||||||||||||||
Disposal | (1,705 | ) | (612 | ) | (1,142 | ) | — | (4,412 | ) | (7,871 | ) | |||||||||||||
Amortization | — | (127,237 | ) | (59,831 | ) | (118,500 | ) | (82,995 | ) | (388,563 | ) | |||||||||||||
Inclusion in scope of consolidation2 | 150,337 | 9,341 | 1,176 | — | 77,035 | 237,889 | ||||||||||||||||||
Exclusion in scope of consolidation | — | — | (234 | ) | — | — | (234 | ) | ||||||||||||||||
Others | — | (1,807 | ) | 3,084 | — | (3,871 | ) | (2,594 | ) | |||||||||||||||
|
|
|
|
|
|
|
|
|
|
|
| |||||||||||||
Balance at 2012.12.31 | ₩ | 598,027 | ₩ | 628,663 | ₩ | 239,770 | ₩ | 1,044,358 | ₩ | 701,775 | ₩ | 3,212,593 | ||||||||||||
|
|
|
|
|
|
|
|
|
|
|
| |||||||||||||
Acquisition cost | ₩ | 605,776 | ₩ | 1,393,088 | ₩ | 613,380 | ₩ | 1,924,869 | ₩ | 1,012,256 | ₩ | 5,549,369 | ||||||||||||
Accumulated amortization (including accumulated impairment loss and others) | (7,749 | ) | (764,425 | ) | (373,610 | ) | (880,511 | ) | (310,481 | ) | (2,336,776 | ) | ||||||||||||
| 1 | Industrial rights are included in others. |
| 2 | As a result of additional acquisition of ownership interest in KT Rental, intangible assets such as the customer base measured at fair value in accordance with Korean IFRS 1103, “Business Combination”,are included (Note 37). These intangible assets were not recorded in the statements of financial position of KT Rental. |
57
Table of Contents
KT Corporation and Subsidiaries
Notes to Consolidated Financial Statements
December 31, 2012 and 2011
| 2011 | ||||||||||||||||||||||||
| (in millions of Korean won) | Goodwill | Development costs | Software | Frequency usage rights | Others1 | Total | ||||||||||||||||||
Acquisition cost | ₩ | 91,513 | ₩ | 947,053 | ₩ | 438,302 | ₩ | 1,342,023 | ₩ | 376,470 | ₩ | 3,195,361 | ||||||||||||
Accumulated amortization (including accumulated impairment loss and others) | (7,749 | ) | (562,051 | ) | (269,509 | ) | (762,812 | ) | (174,320 | ) | (1,776,441 | ) | ||||||||||||
|
|
|
|
|
|
|
|
|
|
|
| |||||||||||||
Balance at 2011.1.1 | ₩ | 83,764 | ₩ | 385,002 | ₩ | 168,793 | ₩ | 579,211 | ₩ | 202,150 | ₩ | 1,418,920 | ||||||||||||
Acquisition | — | 156,114 | 100,870 | 441,485 | 30,284 | 728,753 | ||||||||||||||||||
Disposal | — | (1,849 | ) | (105 | ) | — | (9,935 | ) | (11,889 | ) | ||||||||||||||
Amortization | — | (102,805 | ) | (54,976 | ) | (124,999 | ) | (37,095 | ) | (319,875 | ) | |||||||||||||
Inclusion in scope of consolidation2 | 366,858 | 257 | 11,467 | — | 472,436 | 851,018 | ||||||||||||||||||
Exclusion in scope of consolidation | — | — | — | — | (6,178 | ) | (6,178 | ) | ||||||||||||||||
Others | (1,227 | ) | (10,091 | ) | (1,730 | ) | — | (4,216 | ) | (17,264 | ) | |||||||||||||
|
|
|
|
|
|
|
|
|
|
|
| |||||||||||||
Balance at 2011.12.31 | ₩ | 449,395 | ₩ | 426,628 | ₩ | 224,319 | ₩ | 895,697 | ₩ | 647,446 | ₩ | 2,643,485 | ||||||||||||
|
|
|
|
|
|
|
|
|
|
|
| |||||||||||||
Acquisition cost | ₩ | 457,144 | ₩ | 1,069,158 | ₩ | 555,154 | ₩ | 1,783,508 | ₩ | 885,994 | ₩ | 4,750,958 | ||||||||||||
Accumulated amortization (including accumulated impairment loss and others) | (7,749 | ) | (642,530 | ) | (330,835 | ) | (887,811 | ) | (238,548 | ) | (2,107,473 | ) | ||||||||||||
| 1 | Industrial right and facility usage right are included in others. |
| 2 | As a result of acquisition of control of KT Skylife Co., Ltd. and BC Card Co., Ltd., intangible assets such as the customer base measured at fair value in accordance with Korean IFRS 1103, “Business Combination”,are included (Note 37). These intangible assets were not recorded in the statements of financial position of KT Skylife Co., Ltd. and BC Card Co., Ltd. |
The carrying value of facility usage rights with indefinite useful life not subject to amortization is ₩159,510 million (2011: ₩153,797 million) as of December 31, 2012.
Goodwill is allocated to the Company’s cash-generating unit which is identified by operating segments. As of December 31, 2012, goodwill allocated to each cash-generation unit is as follows:
| (in millions of Korean won) | ||||
Telecom wireless business & Convergence/Customer1 | ₩ | 65,057 | ||
Finance and Rental | ||||
KT Rental2 | 131,426 | |||
BC Card Co., Ltd.3 | 41,234 | |||
Others | ||||
KT Skylife Co., Ltd.4 | 306,303 | |||
KT Powertel Co., Ltd. and others | 54,007 | |||
|
| |||
Total | ₩ | 598,027 | ||
|
| |||
58
Table of Contents
KT Corporation and Subsidiaries
Notes to Consolidated Financial Statements
December 31, 2012 and 2011
| 1 | The wireless business was classified as ‘Personal Customer Group’ segment in 2011. However, due to changes in the reporting segment in 2012, wireless business became a part of ‘Telecom & Convergence /Customer’ segment. The recoverable amounts of mobile business are calculated based on value-in-use calculations. These calculations use pre-tax cash flow projections for the next four years based on financial budgets approved by management with 1.5% of perpetual growth rate and 4.7% of discount rate. The Company estimated its revenue growth rate based on past performance and its expectation of market development. The applied growth rate is consistent with the growth rate included in the industry analysis report. As a result of the impairment test, there is no impairment loss on goodwill allocated to the mobile business as of December 31, 2012. |
| 2 | The recoverable amounts of KT Rental are calculated based on value-in-use calculations. These calculations use pre-tax cash flow projections for the next five years based on financial budgets approved by management with 0% of perpetual growth rate and 9.3% of discount rate. The Company estimated its revenue growth rate based on past performance and its expectation of market development. The applied growth rate is consistent with the growth rate included in the industry analysis report. As a result of the impairment test, there is no impairment loss on goodwill allocated to KT Rental as of December 31, 2012. |
| 3 | The recoverable amounts of BC Card are calculated based on value-in-use calculations. These calculations use pre-tax cash flow projections for the next five years based on financial budgets approved by management with 0% of perpetual growth rate and 14.0% of discount rate. The Company estimated its revenue growth rate based on past performance and its expectation of market development. The applied growth rate is consistent with the growth rate included in the industry analysis report. As a result of the impairment test, there is no impairment loss on goodwill allocated to BC Card as of December 31, 2012. |
| 4 | The recoverable amounts of KT Skylife Co., Ltd. are determined based on fair value of KT Skylife less costs to sell. As a result of the impairment test based on the determined recoverable amounts, there is no impairment loss on goodwill allocated to KT Skylife as of December 31, 2012. |
As a result of the impairment test, the Company recognized the impairment losses of ₩1,705 million on goodwill allocated to KT Cloudware Corporation as other expenses in the statement of the consolidated income. The Company considers that the carrying value of cash generating units does not exceed the recoverable amount of the CGUs other than KT Cloudware Corporation.
| 14. | Investments in Jointly Controlled Entities and Associates |
The changes in investments in jointly controlled entities and associates for the years ended December 31, 2012 and 2011, are as follows:
| 2012 | ||||||||||||||||||||||||
| (in millions of Korean won) | Beginning | Acquisition (Disposal) | Reclassification | Interest in jointly controlled entities and associates1 | Others | Ending | ||||||||||||||||||
KT Submarine Co., Ltd. | ₩ | 29,187 | ₩ | — | ₩ | — | ₩ | 2,101 | ₩ | — | ₩ | 31,288 | ||||||||||||
KT Rental2 | 175,235 | — | (179,719 | ) | 9,370 | (4,886 | ) | — | ||||||||||||||||
KTCS Corporation | 20,327 | — | — | 1,456 | 1 | 21,784 | ||||||||||||||||||
KTIS Corporation | 21,088 | — | — | 782 | — | 21,870 | ||||||||||||||||||
Korea Information & Technology Fund | 119,492 | — | — | 1,621 | — | 121,113 | ||||||||||||||||||
KT-SB Venture Investment | 12,643 | — | — | (258 | ) | — | 12,385 | |||||||||||||||||
Company K Movie Asset Fund No.1 | 9,593 | — | — | 1,336 | — | 10,929 | ||||||||||||||||||
Boston Global Film & Contents Fund L.P | 7,535 | — | — | (633 | ) | — | 6,902 | |||||||||||||||||
Mongoolian Telecommunications | 11,232 | — | — | 232 | (1,465 | ) | 9,999 | |||||||||||||||||
Metropol Property LLC | 1,746 | — | — | 37 | — | 1,738 | ||||||||||||||||||
KT Wibro Infra Co., Ltd. | 66,206 | — | — | 534 | 1 | 66,741 | ||||||||||||||||||
SMART CHANNEL Co., Ltd. | 2,748 | — | — | (2,748 | ) | — | — | |||||||||||||||||
Kan Communications Co., Ltd. | 2,816 | — | — | (778 | ) | (1 | ) | 2,037 | ||||||||||||||||
KTF-CJ Music Contents Investment Fund | 7,535 | — | — | (633 | ) | — | 6,902 | |||||||||||||||||
QTT Global(Group) Company Limited | — | 12,746 | — | 203 | — | 12,949 | ||||||||||||||||||
Others | 41,801 | 38,540 | — | 14,622 | (10,862 | ) | 84,101 | |||||||||||||||||
|
|
|
|
|
|
|
|
|
|
|
| |||||||||||||
Total | ₩ | 529,184 | ₩ | 51,286 | ₩ | (179,719 | ) | ₩ | 27,244 | ₩ | (17,212 | ) | ₩ | 410,783 | ||||||||||
|
|
|
|
|
|
|
|
|
|
|
| |||||||||||||
59
Table of Contents
KT Corporation and Subsidiaries
Notes to Consolidated Financial Statements
December 31, 2012 and 2011
| 2011 | ||||||||||||||||||||||||
| (in millions of Korean won) | Beginning | Acquisition (Disposal) | Reclassification | Interest in jointly controlled entities and associates3 | Others | Ending | ||||||||||||||||||
KT Submarine Co., Ltd. | ₩ | 26,828 | ₩ | — | ₩ | — | ₩ | 2,365 | ₩ | (6 | ) | ₩ | 29,187 | |||||||||||
KT Rental2 | 171,554 | (15,849 | ) | — | 21,817 | (2,287 | ) | 175,235 | ||||||||||||||||
KT Skylife Co., Ltd.3 | 93,758 | — | (93,315 | ) | — | (443 | ) | — | ||||||||||||||||
KTCS Corporation | 19,135 | — | — | 3,350 | (2,158 | ) | 20,327 | |||||||||||||||||
KTIS Corporation | 19,048 | — | — | 3,473 | (1,433 | ) | 21,088 | |||||||||||||||||
Korea Information & Technology Fund | 122,042 | — | — | 1,556 | (4,106 | ) | 119,492 | |||||||||||||||||
KT-SB Venture Investment | 12,662 | — | — | (19 | ) | — | 12,643 | |||||||||||||||||
Company K Movie Asset Fund No.1 | 9,362 | — | — | 231 | — | 9,593 | ||||||||||||||||||
Boston Global Film & Contents Fund L.P | 8,822 | — | — | (1,287 | ) | — | 7,535 | |||||||||||||||||
Mongolian Telecommunications | 12,312 | — | — | 409 | (1,489 | ) | 11,232 | |||||||||||||||||
Metropol Property LLC | 1,671 | — | — | 137 | (62 | ) | 1,746 | |||||||||||||||||
KT Wibro Infra Co., Ltd. | 65,502 | — | — | 704 | — | 66,206 | ||||||||||||||||||
SMART CHANNEL Co., Ltd. | — | 6,000 | 500 | (3,752 | ) | — | 2,748 | |||||||||||||||||
Kan Communications Co., Ltd. | — | 3,000 | — | (184 | ) | — | 2,816 | |||||||||||||||||
KTF-CJ Music Contents Investment Fund | 8,823 | — | — | (1,288 | ) | — | 7,535 | |||||||||||||||||
Others | 66,542 | (14,787 | ) | 32,632 | (27,985 | ) | (14,601 | ) | 41,801 | |||||||||||||||
|
|
|
|
|
|
|
|
|
|
|
| |||||||||||||
Total | ₩ | 638,061 | ₩ | (21,636 | ) | ₩ | (60,183 | ) | ₩ | (473 | ) | ₩ | (26,585 | ) | ₩ | 529,184 | ||||||||
|
|
|
|
|
|
|
|
|
|
|
| |||||||||||||
| 1 | KT Capital Co., Ltd., a subsidiary of the Company, recognizes its share in income (loss) from jointly controlled entities and associates as operating revenue and expense. These include its share in income from jointly controlled entities and associates of ₩6,591 million (2011: ₩2,701 million) recognized as operating revenue and the share in loss from jointly controlled entities and associates of ₩362 million (2011: ₩136 million) recognized as operating expense. |
| 2 | As of December 31, 2011, the Company had classified the entity as a joint venture due to the exercise of joint control under the arrangement of shareholders. However, since the Company obtained control during 2012, this entity was consolidated. |
| 3 | As of December 31, 2011, the entity was consolidated since the Company acquired control over KT Skylife Co., Ltd. as a result of acquisition of additional ownership interest. |
60
Table of Contents
KT Corporation and Subsidiaries
Notes to Consolidated Financial Statements
December 31, 2012 and 2011
The summary of financial information of joint ventures and associates as of and for the years ended December 31, 2012 and 2011, follows:
| (In millions of Korean won) | 2012 | |||||||||||||||||||||
| Location | % of ownership interest | Assets | Liabilities | Operating revenue | Net profit (loss) | |||||||||||||||||
KT Submarine Co., Ltd. | Domestic | 36.92 | % | ₩ | 109,787 | ₩ | 25,037 | ₩ | 68,900 | ₩ | 7,952 | |||||||||||
KTCS Corporation1 | Domestic | 17.80 | % | 179,840 | 57,310 | 384,165 | 17,714 | |||||||||||||||
KTIS Corporation1 | Domestic | 17.80 | % | 178,710 | 55,674 | 388,370 | 17,535 | |||||||||||||||
Korea Information & Technology Fund | Domestic | 33.33 | % | 363,346 | 6 | 19,444 | 5,820 | |||||||||||||||
KT-SB Venture Investment2 | Domestic | 50.00 | % | 25,309 | 538 | 141 | (384 | ) | ||||||||||||||
Company K Movie Asset Fund No.13 | Domestic | 60.00 | % | 18,262 | 46 | 3,988 | 2,226 | |||||||||||||||
Boston Global Film & Contents Fund L.P. | Domestic | 27.69 | % | 24,929 | 6 | 762 | (2,284 | ) | ||||||||||||||
Mongolian Telecommunications | Mongolia | 40.00 | % | 32,382 | 7,383 | 17,058 | 342 | |||||||||||||||
Metropol Property LLC | Uzbekistan | 34.00 | % | 2,665 | 491 | 747 | 224 | |||||||||||||||
KT Wibro Infra Co., Ltd | Domestic | 26.22 | % | 259,365 | 4,802 | 2,084 | 2,700 | |||||||||||||||
SMART CHANNEL Co., Ltd4 | Domestic | 65.00 | % | 78,889 | 100,238 | 15,542 | (14,426 | ) | ||||||||||||||
KTF-CJ Music Contents Investment Fund | Domestic | 27.69 | % | 24,929 | 6 | 762 | (2,284 | ) | ||||||||||||||
KT-DoCoMo Mobile Investment Fund | Domestic | 45.00 | % | 5,273 | (1,263 | ) | 2,620 | 2,512 | ||||||||||||||
QTT Global(Group) Company Limited | China | 25.00 | % | 17,605 | 1,860 | 13,165 | 1,856 | |||||||||||||||
Others | 810,423 | 387,352 | 428,092 | 19,573 | ||||||||||||||||||
|
|
|
|
|
|
|
| |||||||||||||||
Total | ₩ | 2,131,714 | ₩ | 639,486 | ₩ | 1,345,840 | ₩ | 59,076 | ||||||||||||||
|
|
|
|
|
|
|
| |||||||||||||||
61
Table of Contents
KT Corporation and Subsidiaries
Notes to Consolidated Financial Statements
December 31, 2012 and 2011
| (In millions of Korean won) | 2011 | |||||||||||||||||||||
| Location | % of ownership interest | Assets | Liabilities | Operating revenue | Net profit (loss) | |||||||||||||||||
KT Submarine Co., Ltd. | Domestic | 36.92 | % | ₩ | 127,063 | ₩ | 48,004 | ₩ | 111,453 | ₩ | 6,700 | |||||||||||
KT Rental | Domestic | 58.00 | % | 1,419,392 | 1,167,454 | 657,971 | 27,321 | |||||||||||||||
KTCS Corporation1 | Domestic | 17.49 | % | 172,268 | 56,072 | 380,506 | 19,923 | |||||||||||||||
KTIS Corporation1 | Domestic | 17.80 | % | 174,460 | 56,013 | 373,397 | 21,078 | |||||||||||||||
Korea Information & Technology Fund | Domestic | 33.33 | % | 358,475 | — | 15,630 | 2,880 | |||||||||||||||
KT-SB Venture Investment2 | Domestic | 50.00 | % | 25,823 | 536 | — | (38 | ) | ||||||||||||||
Company K Movie Asset Fund No.13 | Domestic | 60.00 | % | 15,997 | 8 | 2,751 | 385 | |||||||||||||||
Boston Global Film & Contents Fund L.P. | Domestic | 27.69 | % | 27,411 | 204 | 933 | (4,643 | ) | ||||||||||||||
Mongolian Telecommunications | Mongolia | 40.00 | % | 28,081 | — | 20,747 | 780 | |||||||||||||||
Metropol Property LLC | Uzbekistan | 34.00 | % | 4,075 | 846 | 1,512 | 486 | |||||||||||||||
KT Wibro Infra Co., Ltd | Domestic | 26.22 | % | 257,744 | 5,220 | 2,294 | 2,863 | |||||||||||||||
SMART CHANNEL Co., Ltd4 | Domestic | 65.00 | % | 91,383 | 98,306 | 9,785 | (9,471 | ) | ||||||||||||||
KTF-CJ Music Contents Investment Fund | Domestic | 50.00 | % | 10,076 | — | 318 | 173 | |||||||||||||||
KT-DoCoMo Mobile Investment Fund | Domestic | 45.00 | % | 9,286 | 162 | 92 | (26 | ) | ||||||||||||||
Others | - | — | 1,444,343 | 621,230 | 802,454 | 43,111 | ||||||||||||||||
|
|
|
|
|
|
|
| |||||||||||||||
Total | ₩ | 4,165,877 | ₩ | 2,054,055 | ₩ | 2,379,843 | ₩ | 111,522 | ||||||||||||||
|
|
|
|
|
|
|
| |||||||||||||||
| 1 | At the end of the reporting period, even though the Company having less than 20% ownership, the equity method of accounting has been applied as it is considered that the Company has the significant influence over the operating and financial policies of these entities. |
| 2 | As of December 31, 2012, even though the Company having 50% ownership, the equity method of accounting has been applied as the Company, which is a limited partner of investment fund, cannot participate in determining the operating and financial policies. |
| 3 | At the end of the reporting period, even though the Company having more than 50% ownership, the equity method accounting has been applied as it the Company, which is a limited partner of investment fund, cannot participate in determining the operating and financial policies. |
| 4 | At the end of the reporting period, even though the Company having 65% ownership, the Company has the significant influence but no control due to the agreement among the shareholders. The entity was classified as an associate and the equity method of accounting has been applied. |
62
Table of Contents
KT Corporation and Subsidiaries
Notes to Consolidated Financial Statements
December 31, 2012 and 2011
Marketable investments in joint ventures and associates as of December 31, 2012 and 2011, are as follows:
| 2012 | ||||||||||||
| Number of shares | Book Value (In millions of Korean won) | Fair Value (In millions of Korean won) | ||||||||||
KT Submarine Co., Ltd. | 1,617,000 | ₩ | 31,288 | ₩ | 21,344 | |||||||
KTCS Corporation | 8,132,130 | 21,784 | 18,623 | |||||||||
KTIS Corporation | 6,196,190 | 21,870 | 19,518 | |||||||||
Mongolian Telecommunications | 10,348,111 | 9,999 | 14,741 | |||||||||
| 2011 | ||||||||||||
| Number of shares | Book Value (In millions of Korean won) | Fair Value (In millions of Korean won) | ||||||||||
KT Submarine Co., Ltd. | 1,617,000 | ₩ | 29,186 | ₩ | 21,344 | |||||||
KTCS Corporation | 8,132,130 | 20,327 | 16,834 | |||||||||
KTIS Corporation | 6,196,190 | 21,088 | 17,349 | |||||||||
Mongolian Telecommunications | 10,348,111 | 11,232 | 23,470 | |||||||||
The Company has not recognized loss from jointly controlled entities and associates of ₩7,308 million for the year (2011: ₩5,633 million). The accumulated comprehensive loss of joint ventures and associates as of December 31, 2012, which was not recognized by the Company is ₩22,143 million (2011: ₩15,490 million).
The following equity securities owned by the Company are pledged as collaterals for the investees’ borrowings.
| (In millions of Korean won) | Investee | Amount | ||||
Investments in associate | Smart Channel Co., Ltd. | ₩ | 6,500 | |||
63
Table of Contents
KT Corporation and Subsidiaries
Notes to Consolidated Financial Statements
December 31, 2012 and 2011
| 15. | Trade and other payables |
The Company’s trade and other payables as of December 31, 2012 and 2011, are as follows:
| (In millions of Korean won) | 2012 | 2011 | ||||||
Current liabilities | ||||||||
Trade payables | ₩ | 1,822,895 | ₩ | 1,635,361 | ||||
Other payables | 5,393,409 | 4,255,064 | ||||||
|
|
|
| |||||
Total | ₩ | 7,216,304 | ₩ | 5,890,425 | ||||
|
|
|
| |||||
Non-current liabilities | ||||||||
Trade payables | ₩ | 10,696 | ₩ | 24,222 | ||||
Other payables | 690,664 | 627,491 | ||||||
|
|
|
| |||||
Total | ₩ | 701,360 | ₩ | 651,713 | ||||
|
|
|
| |||||
Details of other payables as of December 31, 2012 and 2011, are as follows:
| (In millions of Korean won) | 2012 | 2011 | ||||||
Non-trade payables1 | ₩ | 3,966,451 | ₩ | 3,214,585 | ||||
Accrued expenses | 769,629 | 543,972 | ||||||
Operating deposits | 880,895 | 764,660 | ||||||
Others | 467,098 | 359,338 | ||||||
Less: non-current | (690,664 | ) | (627,491 | ) | ||||
|
|
|
| |||||
Current | ₩ | 5,393,409 | ₩ | 4,255,064 | ||||
|
|
|
| |||||
| 1 | Settlement payables of BC card Co., Ltd. of ₩1,519,242 million related to credit card transaction included as of December 31, 2012 (2011: ₩997,915 million). |
64
Table of Contents
KT Corporation and Subsidiaries
Notes to Consolidated Financial Statements
December 31, 2012 and 2011
| 16. | Bonds Payable and Borrowings |
Details of bonds payable and borrowings as of December 31, 2012 and 2011, are as follows:
Bonds Payable
(in millions of Korean won and thousands of foreign currencies) | 2012 | 2011 | ||||||||||||||||||||||
| Type | Maturity | Annual interest rates | Foreign currency | Korean won | Foreign currency | Korean won | ||||||||||||||||||
MTNP notes1 | 2014.06.24 | 5.88 | % | USD | 600,000 | ₩ | 642,660 | USD | 600,000 | ₩ | 691,980 | |||||||||||||
MTNP notes1 | 2034.09.07 | 6.50 | % | USD | 100,000 | 107,110 | USD | 100,000 | 115,330 | |||||||||||||||
MTNP notes1 | 2015.07.14 | 4.88 | % | USD | 400,000 | 428,440 | USD | 400,000 | 461,320 | |||||||||||||||
MTNP notes1 | 2016.05.03 | 5.88 | % | USD | 200,000 | 214,220 | USD | 200,000 | 230,660 | |||||||||||||||
Euro bonds | 2012.04.11 | — | — | — | USD | 200,000 | 230,660 | |||||||||||||||||
Reg S bonds | 2017.01.20 | 3.88 | % | USD | 350,000 | 374,885 | — | — | ||||||||||||||||
FR notes2 | 2013.09.11 |
| LIBOR(3M) +1.50 | % | USD | 200,000 | 214,220 | USD | 200,000 | 230,660 | ||||||||||||||
FR notes2 | 2013.04.09 |
| LIBOR(3M) +0.47 | % | USD | 100,000 | 107,110 | USD | 100,000 | 115,330 | ||||||||||||||
Japanese yen bonds | 2013.01.25 | 1.58 | % | JPY | 35,000,000 | 436,625 | JPY | 35,000,000 | 519,806 | |||||||||||||||
The 159th Public bond | 2013.10.27 | 5.39 | % | — | 300,000 | — | 300,000 | |||||||||||||||||
The 163rd Public bond | 2014.03.30 | 5.51 | % | — | 170,000 | — | 170,000 | |||||||||||||||||
The 165-2nd Public bond | 2014.08.26 | 4.44 | % | — | 140,000 | — | 140,000 | |||||||||||||||||
The 166-2nd Public bond | 2012.03.21 | — | — | — | — | 100,000 | ||||||||||||||||||
The 167-1st Public bond | 2012.04.20 | — | — | — | — | 100,000 | ||||||||||||||||||
The 167-2nd Public bond | 2015.04.20 | 4.84 | % | — | 100,000 | — | 100,000 | |||||||||||||||||
The 168-1st Public bond | 2012.06.21 | — | — | — | — | 240,000 | ||||||||||||||||||
The 168-2nd Public bond | 2015.06.21 | 4.66 | % | — | 90,000 | — | 90,000 | |||||||||||||||||
The 169th Public bond | 2012.04.03 | — | — | — | — | 140,000 | ||||||||||||||||||
The 171st Public bond | 2013.02.28 | 5.41 | % | — | 100,000 | — | 100,000 | |||||||||||||||||
The 172-2nd Public bond | 2012.04.02 | — | — | — | USD | 110,000 | 126,863 | |||||||||||||||||
The 173-1st Public bond | 2013.08.06 | 6.49 | % | — | 100,000 | — | 100,000 | |||||||||||||||||
The 173-2nd Public bond | 2018.08.06 | 6.62 | % | — | 100,000 | — | 100,000 | |||||||||||||||||
The 175-1st Public bond | 2012.02.27 | — | — | — | — | 40,000 | ||||||||||||||||||
The 175-2nd Public bond | 2014.02.27 | 5.47 | % | — | 360,000 | — | 360,000 | |||||||||||||||||
The 176-1st Public bond | 2012.05.28 | — | — | — | — | 100,000 | ||||||||||||||||||
The 176-2nd Public bond | 2014.05.28 | 5.06 | % | — | 170,000 | — | 170,000 | |||||||||||||||||
The 176-3rd Public bond | 2016.05.28 | 5.24 | % | — | 260,000 | — | 260,000 | |||||||||||||||||
The 177-1st Public bond | 2013.02.09 | 4.86 | % | — | 240,000 | — | �� | 240,000 | ||||||||||||||||
The 177-2nd Public bond | 2015.02.09 | 5.26 | % | — | 190,000 | — | 190,000 | |||||||||||||||||
The 177-3rd Public bond | 2017.02.09 | 5.38 | % | — | 170,000 | — | 170,000 | |||||||||||||||||
The 178-1st Public bond2 | 2013.01.18 |
| LIBOR(3M) +1.00 | % | USD | 100,000 | 107,110 | USD | 100,000 | 115,330 | ||||||||||||||
The 178-2nd Public bond2 | 2014.01.17 |
| LIBOR(3M) +1.05 | % | USD | 100,000 | 107,110 | USD | 100,000 | 115,330 | ||||||||||||||
The 179th Public bond | 2018.03.29 | 4.47 | % | — | 260,000 | — | 260,000 | |||||||||||||||||
The 180-1st Public bond | 2016.04.26 | 4.35 | % | — | 210,000 | — | 210,000 | |||||||||||||||||
The 180-2nd Public bond | 2021.04.26 | 4.71 | % | — | 380,000 | — | 380,000 | |||||||||||||||||
The 181-1st Public bond | 2016.08.26 | 3.94 | % | — | 260,000 | — | 260,000 | |||||||||||||||||
The 181-2nd Public bond | 2018.08.26 | 3.99 | % | — | 90,000 | — | 90,000 | |||||||||||||||||
The 181-3rd Public bond | 2021.08.26 | 4.09 | % | — | 250,000 | — | 250,000 | |||||||||||||||||
The 182-1st Public bond | 2016.10.28 | 4.11 | % | — | 320,000 | — | 320,000 | |||||||||||||||||
The182-2nd Public bond | 2021.10.28 | 4.31 | % | — | 100,000 | — | 100,000 | |||||||||||||||||
The 183-1st Public bond | 2016.12.22 | 3.81 | % | — | 50,000 | — | 50,000 | |||||||||||||||||
The 183-2nd Public bond | 2021.12.22 | 4.09 | % | — | 90,000 | — | 90,000 | |||||||||||||||||
The 183-3rd Public bond | 2031.12.22 | 4.27 | % | — | 160,000 | — | 160,000 | |||||||||||||||||
The 51-2nd Public bond | 2013.06.20 | 6.41 | % | — | 70,000 | — | 70,000 | |||||||||||||||||
The 52-2nd Public bond | 2013.08.04 | 6.64 | % | — | 100,000 | — | 100,000 | |||||||||||||||||
The 26th Public bond | 2013.04.19 | 5.15 | % | — | 10,000 | — | 10,000 | |||||||||||||||||
The 27th Public bond | 2014.07.25 | 5.04 | % | — | 5,000 | — | 5,000 | |||||||||||||||||
The 17-2nd Public bond | 2013.03.11 | 5.45 | % | — | 30,000 | — | — | |||||||||||||||||
The 27-2nd Public bond | 2013.04.09 | 5.04 | % | — | 70,000 | — | — | |||||||||||||||||
The 28-1st Public bond | 2014.04.05 | 4.61 | % | — | 50,000 | — | — | |||||||||||||||||
The 28-2nd Public bond | 2016.04.05 | 5.25 | % | — | 65,000 | — | — | |||||||||||||||||
The 29th Public bond | 2016.09.05 | 4.85 | % | — | 45,000 | — | — | |||||||||||||||||
The 30th Public bond | 2014.10.31 | 4.50 | % | — | 90,000 | — | — | |||||||||||||||||
The 31-1st Public bond | 2015.06.15 | 3.73 | % | — | 100,000 | — | — | |||||||||||||||||
The 31-2nd Public bond | 2017.06.15 | 3.97 | % | — | 100,000 | — | — | |||||||||||||||||
The 32-1st Public bond | 2015.11.20 | 3.19 | % | — | 100,000 | — | — | |||||||||||||||||
The 32-2nd Public bond | 2017.11.20 | 3.33 | % | — | 100,000 | — | — | |||||||||||||||||
The 17-3rd Public bond | 2013.05.30 | 7.14 | % | — | 50,000 | — | 50,000 | |||||||||||||||||
The 18-4th Public bond | 2013.06.23 | 7.55 | % | — | 10,000 | — | 10,000 | |||||||||||||||||
The 22-3rd Public bond | 2012.01.23 | — | — | — | — | 25,000 | ||||||||||||||||||
The 24th Public bond | 2012.06.29 | — | — | — | — | 30,000 | ||||||||||||||||||
The 25-2nd Public bond | 2012.07.30 | — | — | — | — | 25,000 | ||||||||||||||||||
The 26th Public bond | 2012.08.27 | — | — | — | — | 50,000 | ||||||||||||||||||
The 27th Private bond | 2012.09.04 | — | — | — | — | 10,000 | ||||||||||||||||||
The 28-2nd Public bond | 2012.11.12 | — | — | — | — | 30,000 | ||||||||||||||||||
The 29-2nd Public bond | 2012.11.30 | — | — | — | — | 40,000 | ||||||||||||||||||
The 30-3rd Public bond | 2012.12.23 | — | — | — | — | 10,000 | ||||||||||||||||||
The 31st Public bond | 2012.12.31 | — | — | — | — | 10,000 | ||||||||||||||||||
The 32-1st Public bond | 2012.01.22 | — | — | — | — | 10,000 | ||||||||||||||||||
The 32-2nd Public bond | 2013.01.22 | 5.95 | % | — | 50,000 | — | 50,000 | |||||||||||||||||
The 32-3rd Public bond | 2015.01.22 | 6.70 | % | — | 30,000 | — | 30,000 | |||||||||||||||||
The 33rd Public bond | 2015.02.11 | 6.45 | % | — | 50,000 | — | 50,000 | |||||||||||||||||
The 34-1st Public bond | 2012.02.26 | — | — | — | — | 30,000 | ||||||||||||||||||
The 34-2nd Public bond | 2013.02.26 | 5.60 | % | — | 10,000 | — | 10,000 | |||||||||||||||||
The 35-1st Public bond | 2012.03.22 | — | — | — | — | 20,000 | ||||||||||||||||||
The 35-2nd Public bond | 2013.03.22 | 5.05 | % | — | 30,000 | — | 30,000 | |||||||||||||||||
The 36-1st Public bond | 2012.04.30 | — | — | — | — | 20,000 | ||||||||||||||||||
The 36-2nd Public bond | 2013.04.30 | 4.75 | % | — | 30,000 | — | 30,000 | |||||||||||||||||
The 36-3rd Public bond | 2015.04.30 | 5.65 | % | — | 20,000 | — | 20,000 | |||||||||||||||||
The 37-2nd Public bond | 2012.06.30 | — | — | — | — | 10,000 | ||||||||||||||||||
The 37-3rd Public bond | 2013.06.30 | 5.45 | % | — | 20,000 | — | 20,000 | |||||||||||||||||
The 37-4th Public bond | 2014.06.30 | 5.85 | % | — | 10,000 | — | 10,000 | |||||||||||||||||
The 38-1st Public bond | 2012.01.19 | — | — | — | — | 30,000 | ||||||||||||||||||
The 38-2nd Public bond | 2012.07.19 | — | — | — | — | 30,000 | ||||||||||||||||||
The 38-3rd Public bond | 2014.07.19 | 5.85 | % | — | 10,000 | — | 10,000 | |||||||||||||||||
The 39th Public bond | 2013.07.30 | 5.35 | % | — | 30,000 | — | 30,000 | |||||||||||||||||
The 40-1st Public bond | 2012.05.10 | — | — | — | — | 40,000 | ||||||||||||||||||
The 40-2nd Public bond | 2013.08.10 | 5.33 | % | — | 20,000 | — | 20,000 | |||||||||||||||||
The 40-3rd Public bond | 2015.08.10 | 5.95 | % | — | 20,000 | — | 20,000 | |||||||||||||||||
The 41-1st Public bond | 2012.09.17 | — | — | — | — | 30,000 | ||||||||||||||||||
The 41-2nd Public bond | 2013.09.17 | 4.63 | % | — | 20,000 | — | 20,000 | |||||||||||||||||
The 41-3rd Public bond | 2014.09.17 | 5.10 | % | — | 10,000 | — | 10,000 | |||||||||||||||||
The 42-1st Public bond | 2013.11.22 | 4.62 | % | — | 30,000 | — | 30,000 | |||||||||||||||||
The 42-2nd Public bond | 2014.11.22 | 5.10 | % | — | 20,000 | — | 20,000 | |||||||||||||||||
The 42-3rd Public bond | 2015.11.22 | 5.44 | % | — | 10,000 | — | 10,000 | |||||||||||||||||
The 43-1st Public bond | 2014.01.28 | 5.05 | % | — | 40,000 | — | 40,000 | |||||||||||||||||
The 43-2nd Public bond | 2015.01.28 | 5.32 | % | — | 10,000 | — | 10,000 | |||||||||||||||||
The 43-3rd Public bond | 2016.01.28 | 5.75 | % | — | 30,000 | — | 30,000 | |||||||||||||||||
The 44-1st Public bond | 2012.10.28 | — | — | — | — | 30,000 | ||||||||||||||||||
The 44-2nd Public bond | 2013.04.28 | 4.53 | % | — | 30,000 | — | 30,000 | |||||||||||||||||
The 44-3rd Public bond | 2013.10.28 | 4.76 | % | — | 20,000 | — | 20,000 | |||||||||||||||||
The 45th Private bond | 2014.05.18 | 4.80 | % | — | 30,000 | — | 30,000 | |||||||||||||||||
The 46-1st Public bond | 2013.02.26 | 4.10 | % | — | 20,000 | — | 20,000 | |||||||||||||||||
The 46-2nd Public bond | 2014.05.26 | 4.50 | % | — | 40,000 | — | 40,000 | |||||||||||||||||
The 46-3rd Public bond | 2015.05.26 | 4.71 | % | — | 20,000 | — | 20,000 | |||||||||||||||||
The 46-4th Public bond | 2016.05.26 | 4.90 | % | — | 20,000 | — | 20,000 | |||||||||||||||||
The 47th Public bond | 2014.06.23 | 4.50 | % | — | 30,000 | — | 30,000 | |||||||||||||||||
The 48th Public bond | 2016.08.11 | 4.71 | % | — | 10,000 | — | 10,000 | |||||||||||||||||
The 49th Public bond2 | 2014.08.23 |
| CD(91D) +0.93 | % | — | 20,000 | — | 20,000 | ||||||||||||||||
The 50-1st Public bond | 2013.03.21 | 4.30 | % | — | 20,000 | — | 20,000 | |||||||||||||||||
The 50-2nd Public bond | 2016.09.21 | 4.87 | % | — | 5,000 | — | 5,000 | |||||||||||||||||
The 51-1st Public bond | 2014.09.30 | 4.69 | % | — | 10,000 | — | 10,000 | |||||||||||||||||
The 51-2nd Public bond | 2016.09.30 | 4.92 | % | — | 20,000 | — | 20,000 | |||||||||||||||||
The 52-1st Public bond | 2013.10.11 | 4.49 | % | — | 10,000 | — | 10,000 | |||||||||||||||||
The 52-2nd Public bond2 | 2014.10.11 |
| CD(91D) +1.10 | % | — | 10,000 | — | 10,000 | ||||||||||||||||
The 53rd Public bond | 2013.10.17 | 4.39 | % | — | 20,000 | — | 20,000 | |||||||||||||||||
The 54th Public bond | 2014.10.28 | 4.64 | % | — | 10,000 | — | 10,000 | |||||||||||||||||
The 55-1st Public bond | 2014.11.16 | 4.46 | % | — | 40,000 | — | 40,000 | |||||||||||||||||
The 55-2nd Public bond | 2015.11.16 | 4.56 | % | — | 20,000 | — | 20,000 | |||||||||||||||||
The 55-3rd Public bond | 2016.11.16 | 4.74 | % | — | 5,000 | — | 5,000 | |||||||||||||||||
The 56th Public bond | 2014.12.13 | 4.18 | % | — | 35,000 | — | 35,000 | |||||||||||||||||
The 57-1st Public bond2 | 2014.10.05 |
| CD(91D) +0.87 | % | — | 50,000 | — | — | ||||||||||||||||
The 57-2nd Public bond | 2016.01.05 | 4.44 | % | — | 20,000 | — | — | |||||||||||||||||
The 57-3rd Public bond | 2017.01.05 | 4.61 | % | — | 30,000 | — | — | |||||||||||||||||
The 58-1st Public bond | 2014.07.10 | 4.27 | % | — | 30,000 | — | — | |||||||||||||||||
The 58-2nd Public bond | 2015.07.10 | 4.37 | % | — | 20,000 | — | — | |||||||||||||||||
The 59-1st Public bond | 2015.05.25 | 3.78 | % | — | 20,000 | — | — | |||||||||||||||||
The 59-2nd Public bond | 2016.05.25 | 3.87 | % | — | 20,000 | — | — | |||||||||||||||||
The 59-3rd Public bond | 2017.05.25 | 4.03 | % | — | 40,000 | — | — | |||||||||||||||||
The 60th Public bond2 | 2015.07.13 |
| CD(91D) +0.39 | % | — | 40,000 | — | — | ||||||||||||||||
The 61st Public bond | 2017.09.22 | 3.65 | % | — | 45,000 | — | — | |||||||||||||||||
The 62-1st Public bond | 2015.08.27 | 3.19 | % | — | 20,000 | — | — | |||||||||||||||||
The 62-2nd Public bond | 2017.10.11 | 3.43 | % | — | 50,000 | — | — | |||||||||||||||||
The 63rd Public bond | 2017.09.27 | 3.44 | % | — | 40,000 | — | — | |||||||||||||||||
The 64-1st Public bond | 2015.10.29 | 3.26 | % | — | 20,000 | — | — | |||||||||||||||||
The 64-2nd Public bond | 2017.12.21 | 3.46 | % | — | 50,000 | — | — | |||||||||||||||||
The 65th Public bond | 2018.03.22 | 3.47 | % | — | 55,000 | — | — | |||||||||||||||||
The 66th Public bond | 2018.04.02 | 3.52 | % | — | 54,000 | — | — | |||||||||||||||||
Unsecured private convertible bond3 | 2016.01.20 | 2.00 | % | — | 15,000 | — | 15,000 | |||||||||||||||||
The 14-2nd unsecured bond | 2012.05.22 | — | — | — | — | 50,000 | ||||||||||||||||||
The 15th unsecured bond | 2012.06.22 | — | — | — | — | 50,000 | ||||||||||||||||||
The 16th unsecured bond | 2015.04.23 | 3.80 | % | — | 80,000 | — | — | |||||||||||||||||
The 1st unsecured convertible bond3 | 2014.12.30 | 3.00 | % | — | 2,000 | — | 2,000 | |||||||||||||||||
The 8th unsecured convertible bond3 | 2015.11.26 | — | — | 19,052 | — | — | ||||||||||||||||||
|
|
|
| |||||||||||||||||||||
Total | 10,059,542 | 10,120,269 | ||||||||||||||||||||||
Less: Current portion | (2,305,065 | ) | (1,657,524 | ) | ||||||||||||||||||||
Discount on bonds | (26,600 | ) | (31,104 | ) | ||||||||||||||||||||
Conversion right adjustment | (5,800 | ) | (3,026 | ) | ||||||||||||||||||||
Premium on bonds redemption | 3,517 | 1,750 | ||||||||||||||||||||||
|
|
|
| |||||||||||||||||||||
Net | ₩ | 7,725,594 | ₩ | 8,430,365 | ||||||||||||||||||||
|
|
|
| |||||||||||||||||||||
| 1 | As of December 31, 2012, the outstanding notes issued by the Company amount to USD 1,300 million with fixed interest rates under Medium Term Note Program (“MTNP”) listed in the Singapore Stock Exchange, which allowed issuance of notes of up to USD 2,000 million. However, this MTN Program has not been valid since 2007. |
| 2 | Libor (3M) and CD (91D) are approximately 0.31 % and 2.89 %, respectively, as of December 31, 2012. |
65
Table of Contents
KT Corporation and Subsidiaries
Notes to Consolidated Financial Statements
December 31, 2012 and 2011
| 3 | As of the end of the reporting period, the terms and conditions of the convertible bonds are as follows: |
| Type | Issued by | |||||
| KT Telecop Co.,Ltd. | Korea HD Broadcasting Corp. | KT Music Corporation | ||||
Issue date | 2011.1.20 | 2010.4.30 | 2012.11.26 | |||
Issue price | ₩15,000 million | ₩2,000 million | ₩19,052 million | |||
Coupon rate | 2% | 3% | — | |||
Guaranteed margin ratio | 4% | 3% | 3% | |||
Conversion Period | From one year after the issue date to 2015.12.20 | From one year after the issue date to bond maturity | From one year after the issue date to 2015.11.19 | |||
Conversion Price | ₩26,000 | ₩500 | ₩3,380 | |||
Short-term borrowings
(in millions of Korean won and thousands of foreign currencies) | 2012 | 2011 | ||||||||||||||||||
| Financial institution | Type | Annual interest rates | Foreign Currency | Korean won | Foreign Currency | Korean Won | ||||||||||||||
Shinhan Bank | Commercial papers | — | — | ₩ | — | — | ₩ | 10,000 | ||||||||||||
| General loan1 | 4.45~financial bonds(6M) +2.87% | — | 93,200 | — | 73,500 | |||||||||||||||
| Usance(USD) | — | — | — | USD | 1,671 | 2,036 | ||||||||||||||
| Usance(JPY) | — | — | — | JPY | 7,354 | |||||||||||||||
Samsung Securities | Commercial papers | 2.94~4.02% | — | 90,000 | — | 20,000 | ||||||||||||||
Meritz Securities | Commercial papers | — | — | — | — | 25,000 | ||||||||||||||
Woori Bank | Commercial papers | — | — | — | — | 18,000 | ||||||||||||||
| General loans1 | KO-RIBOR(3M) +1.21~5.92% | — | 14,500 | — | — | |||||||||||||||
| Usance(USD) | — | — | — | USD | 2,192 | 2,527 | ||||||||||||||
Korea Exchange Bank | Commercial papers | 3.42% | — | 20,000 | — | 10,000 | ||||||||||||||
| Usance(EUR) | — | — | — | EUR | 1,740 | 2,600 | ||||||||||||||
Kookmin Bank | General loans | 4.99% | — | 2,000 | — | 3,103 | ||||||||||||||
Citibank | General loans1 | CD(91D)+1.20% | — | 10,000 | — | — | ||||||||||||||
Woori Investment & Securities | Commercial papers | — | — | — | — | 5,000 | ||||||||||||||
KTB Investment & Securities | Commercial papers | 2.93~4.02% | — | 70,000 | — | 20,000 | ||||||||||||||
Hanyang Securities | Commercial papers | 2.96~4.02% | — | 50,000 | — | 10,000 | ||||||||||||||
Standard Chartered Securities | Commercial papers | — | — | — | — | 10,000 | ||||||||||||||
SK Securities | Commercial papers | 3.06~3.15% | — | 20,000 | — | 40,000 | ||||||||||||||
Shinyoung Securities | Commercial papers | — | — | — | — | 10,000 | ||||||||||||||
Korea Development Bank | General loans1 | Financial bonds(1Y) | — | 5,000 | USD | 3,973 | 4,583 | |||||||||||||
Hana Bank | General loans | 4.45~4.95% | — | 22,500 | — | 22,500 | ||||||||||||||
| Usance(USD)1 | — | — | — | USD | 2,442 | 2,816 | ||||||||||||||
IBK Bank | Commercial papers | — | — | — | — | 2,342 | ||||||||||||||
| General loans | 5.85~5.89% | — | 7,000 | — | — | |||||||||||||||
Daegu Bank | Commercial papers | 5.54~5.93% | — | 11,932 | — | 10,000 | ||||||||||||||
DGB Capital | Commercial papers | 5.80% | — | 5,000 | — | — | ||||||||||||||
NH Investment & Securities | Commercial papers | 2.91~3.04% | — | 20,000 | — | — | ||||||||||||||
HYUNDAI Securities | Commercial papers | 3.10% | — | 30,000 | — | — | ||||||||||||||
Others2 | General loans | — | 79,869 | — | 88,716 | |||||||||||||||
|
|
|
| |||||||||||||||||
Total | ₩ | 551,001 | ₩ | 392,723 | ||||||||||||||||
|
|
|
| |||||||||||||||||
| 1 | KO-RIBOR(3M), CD(91D), Financial Bond(1Y), and Financial Bond(6M, AAA) are approximately 2.87%, 2.89%, 2.87%, and 3.10%, respectively, as of December 31, 2012. |
| 2 | As of December 31, 2012, KT Networks Corporation, a subsidiary of the Company, accounted for the transferred accounts receivable of ₩17,276 million (2011: ₩19,294 million), which do not qualify as derecognition, as secured borrowings. |
66
Table of Contents
KT Corporation and Subsidiaries
Notes to Consolidated Financial Statements
December 31, 2012 and 2011
Long-term borrowings
(in millions of Korean won and thousands of foreign currencies) | 2012 | 2011 | ||||||||||||||||||
| Financial institution | Type | Annual interest rates | Foreign currency | Korean won | Foreign currency | Korean won | ||||||||||||||
Kookmin Bank | Informatization promotion funds1 | 3.04% | — | ₩ | 911 | — | ₩ | 5,541 | ||||||||||||
| Loans for operation | — | — | — | — | 10,000 | |||||||||||||||
| General loans | 6.30% | — | 10,000 | — | 30,000 | |||||||||||||||
| Facility loans | 4.56~4.98% | — | 80,000 | — | 60,000 | |||||||||||||||
Shinhan Bank | Informatization promotion funds1 | 3.04% | — | 11,985 | — | 16,383 | ||||||||||||||
| Loans for operation | — | — | — | — | 14,000 | |||||||||||||||
| General loans2 | Financial bond (6M) +0.8~5.76% | — | 37,560 | — | 47,000 | |||||||||||||||
| Mortgage loan | 4.00% | — | 358 | — | 517 | |||||||||||||||
| Facility loans2 | 3.06~5.23% | — | 67,723 | — | 40,878 | |||||||||||||||
Export-Import Bank of Korea | Inter-Korean Cooperation Fund1 | 2.00% | — | 6,415 | — | 6,415 | ||||||||||||||
Korea Exchange Bank | General loans | — | — | — | — | 45,000 | ||||||||||||||
Woori Bank | General loans2 | CD(91D) +1.39~5.98% | — | 45,000 | — | — | ||||||||||||||
National Federation of Fisheries Cooperatives | General loans | 4.63% | — | 50,000 | — | — | ||||||||||||||
NH Bank | General loans | 5.80~6.00% | — | 50,000 | — | 50,000 | ||||||||||||||
| Facility loans | 4.32~5.20% | — | 187,500 | — | 50,000 | |||||||||||||||
Korea Development Bank | Facility loans | 4.32~4.91% | — | 88,750 | — | 20,000 | ||||||||||||||
Industrial Bank of Korea | Facility loans | 3.06% | — | 1,500 | — | 2,000 | ||||||||||||||
Samsung Securities | Commercial papers | 3.08% | — | 60,000 | — | 10,000 | ||||||||||||||
Dongbu Securities | Commercial papers | 4.12% | — | 20,000 | — | 20,000 | ||||||||||||||
SK Securities | Commercial papers | 4.12% | — | 10,000 | — | 10,000 | ||||||||||||||
Hanyang Securities | Commercial papers | — | — | — | — | 10,000 | ||||||||||||||
KTB Investment & Securities | Commercial papers | — | — | — | — | 20,000 | ||||||||||||||
Cardnet | General loans | 6.50% | — | 348 | — | — | ||||||||||||||
HYUNDAI Securities | General loans | 3.08% | — | 49,947 | — | — | ||||||||||||||
Others | Redeemable convertible preferred stock3 | — | — | 51,044 | — | 35,196 | ||||||||||||||
Others | - | — | — | 7,465 | — | 2,577 | ||||||||||||||
|
|
|
| |||||||||||||||||
Total | 836,506 | 505,507 | ||||||||||||||||||
Less: Current portion | (325,366 | ) | (63,256 | ) | ||||||||||||||||
|
|
|
| |||||||||||||||||
Net | ₩ | 511,140 | ₩ | 442,251 | ||||||||||||||||
|
|
|
| |||||||||||||||||
67
Table of Contents
KT Corporation and Subsidiaries
Notes to Consolidated Financial Statements
December 31, 2012 and 2011
| 1 | The above Informatization Promotion Funds are repayable in installments over three years after a two-year grace period, while Inter-Korean Cooperation Fund is repayable in installments over 13 years after a seven-year grace period. |
| 2 | The CD (91D) and financial bonds(6M, AAA) interest rates are approximately 2.89% and 3.10%, respectively, as of December 31, 2012. |
| 3 | As of the end of the reporting period, the terms and conditions of the redeemable convertible preferred stocks are as follows: |
| Type | Issued by | |||||||||
| Enswers Inc. | Korea HD Broadcasting Corp. | KT Telecop Co., Ltd. | ||||||||
| The A Redeemable convertible preferred stock | The B Redeemable convertible preferred stock | The C Redeemable convertible preferred stock | Redeemable convertible preferred stock | Redeemable convertible preferred stock | ||||||
Issue date | 2008.08.14 | 2009.11.24 | 2011.11.30 | 2010.12.21 | 2011.1.20 | |||||
Issue price (per share) | ₩ 272,000 | ₩ 408,400 | ₩ 893,400 | ₩ 500 | ₩ 5,000 | |||||
Number of share issued | 5,875 | 1,225 | 11,194 | 1,900,000 | 1,346,154 | |||||
Conversion price (per share) | ₩ 272,000 | ₩ 408,400 | ₩ 893,400 | ₩ 500 | ₩ 26,000 | |||||
Exercisable date of conversion rights | From the issue date to 2018.08.14 | From the issue date to 2019.11.24 | From the issue date to 2021.11.30 | From the issue date to 2013.12.21 | From the issue date to 2012.1.20 | |||||
Redemption price | Issue price + 5% compound annual interest | Issue price + 5% compound annual interest | Issue price + 5% compound annual interest | Issue price + 1% compound annual interest | Issue price of preferred stock not converted less dividends | |||||
Exercisable date of redemption Rights | From three years after the issue date to 2018.08.14 | From three years after the issue date to 2019.11.24 | From three years after the issue date to 2021.11.30 | From two years after the issue date to 2013.12.21 | From five years(2016.01. 20) after the issue date up to 3 months | |||||
68
Table of Contents
KT Corporation and Subsidiaries
Notes to Consolidated Financial Statements
December 31, 2012 and 2011
Repayment schedule of the Company’s bonds payable and borrowings including the portion of current liabilities as of December 31, 2012, is as follows:
| (in millions of Korean won) | ||||||||||||||||||||||||||||
| Bonds | Borrowings | Total | ||||||||||||||||||||||||||
| In local currency | In foreign currency | Sub- total | In local currency | In foreign currency | Sub- total | |||||||||||||||||||||||
2013 | ₩ | 1,440,000 | ₩ | 865,065 | ₩ | 2,305,065 | ₩ | 871,067 | ₩ | 5,300 | ₩ | 876,367 | ₩ | 3,181,432 | ||||||||||||||
2014 | 1,382,000 | 749,770 | 2,131,770 | 191,929 | 4,527 | 196,456 | 2,328,226 | |||||||||||||||||||||
2015 | 979,052 | 428,440 | 1,407,492 | 252,346 | — | 252,346 | 1,659,838 | |||||||||||||||||||||
2016 | 1,355,000 | 214,220 | 1,569,220 | 40,717 | — | 40,717 | 1,609,937 | |||||||||||||||||||||
Thereafter | 2,164,000 | 481,995 | 2,645,995 | 21,621 | — | 21,621 | 2,667,616 | |||||||||||||||||||||
|
|
|
|
|
|
|
|
|
|
|
|
|
| |||||||||||||||
Total | ₩ | 7,320,052 | ₩ | 2,739,490 | ₩ | 10,059,542 | ₩ | 1,377,680 | ₩ | 9,827 | ₩ | 1,387,507 | ₩ | 11,447,049 | ||||||||||||||
|
|
|
|
|
|
|
|
|
|
|
|
|
| |||||||||||||||
Book value and fair value of the Company’s bonds payable and borrowings as of December 31, 2012 and 2011, are as follows:
| (in millions of Korean won) | 2012.12.31 | 2011.12.31 | ||||||||||||||
| Type | Book Value | Fair Value | Book Value | Fair Value | ||||||||||||
Bonds payable | ₩ | 10,035,870 | ₩ | 10,191,819 | ₩ | 10,100,322 | ₩ | 10,253,221 | ||||||||
Long-term borrowings (Including current borrowings) | 836,506 | 820,849 | 505,507 | 481,086 | ||||||||||||
Short-term borrowings | 551,001 | 551,001 | 392,723 | 392,723 | ||||||||||||
|
|
|
|
|
|
|
| |||||||||
Total | ₩ | 11,423,377 | ₩ | 11,563,669 | ₩ | 10,998,552 | ₩ | 11,127,030 | ||||||||
|
|
|
|
|
|
|
| |||||||||
The fair values of bonds payable and long-term borrowings are calculated by discounting the expected future cash flows at weighted average borrowing rate. The weighted average borrowing rate is approximately 4.56% as of December 31, 2012 (2011: 4.64%).
69
Table of Contents
KT Corporation and Subsidiaries
Notes to Consolidated Financial Statements
December 31, 2012 and 2011
| 17. | Provisions |
The changes in provisions during the years ended December 31, 2012 and 2011, are as follows:
| 2012 | ||||||||||||||||
| (in millions of Korean won) | Litigation | Asset retirement obligation | Others | Total | ||||||||||||
Balance at 2012.1.1 | ₩ | 28,915 | ₩ | 108,651 | ₩ | 127,984 | ₩ | 265,550 | ||||||||
Increase | 9,610 | 12,533 | 195,840 | 217,983 | ||||||||||||
Usage | (492 | ) | (2,470 | ) | (107,964 | ) | (110,926 | ) | ||||||||
Reversal | (747 | ) | (9,124 | ) | (7,501 | ) | (17,372 | ) | ||||||||
Changes in scope of consolidation | — | 8 | — | 8 | ||||||||||||
|
|
|
|
|
|
|
| |||||||||
Balance at 2012.12.31 | ₩ | 37,286 | ₩ | 109,598 | ₩ | 208,359 | ₩ | 355,243 | ||||||||
|
|
|
|
|
|
|
| |||||||||
Current portion | 33,678 | 54 | 171,780 | 205,512 | ||||||||||||
Non-current portion | 3,608 | 109,544 | 36,579 | 149,731 | ||||||||||||
| 1 | The Company has commitments to pay the subsidies to the customers relating to the handset sales, and the payment commitments are accounted for as deduction from receivables. The Company disposed of its trade receivables arising from handset sales to special purpose entities for securitization and the related payment commitments are accounted for as other provisions. |
| 2011 | ||||||||||||||||
| (in millions of Korean won) | Litigation | Asset retirement obligation | Others | Total | ||||||||||||
Balance at 2011.1.1 | ₩ | 23,560 | ₩ | 109,399 | ₩ | 35,918 | ₩ | 168,877 | ||||||||
Increase | 5,377 | 5,444 | 104,940 | 115,761 | ||||||||||||
Usage | (2,499 | ) | (2,962 | ) | (11,822 | ) | (17,283 | ) | ||||||||
Reversal | (936 | ) | (3,285 | ) | (1,128 | ) | (5,349 | ) | ||||||||
Changes in scope of consolidation | 3,413 | — | — | 3,413 | ||||||||||||
Others | — | 55 | 76 | 131 | ||||||||||||
|
|
|
|
|
|
|
| |||||||||
Balance at 2011.12.31 | ₩ | 28,915 | ₩ | 108,651 | ₩ | 127,984 | ₩ | 265,550 | ||||||||
|
|
|
|
|
|
|
| |||||||||
Current portion | 25,502 | 19 | 97,064 | 122,585 | ||||||||||||
Non-current portion | 3,413 | 108,632 | 30,920 | 142,965 | ||||||||||||
70
Table of Contents
KT Corporation and Subsidiaries
Notes to Consolidated Financial Statements
December 31, 2012 and 2011
| 18. | Retirement Benefit Obligation |
The amounts recognized in the statements of financial position are determined as follows:
| (in millions of Korean won) | 2012 | 2011 | ||||||
Present value of defined benefit obligations | ₩ | 1,721,890 | ₩ | 1,472,723 | ||||
Fair value of plan assets | (1,173,269 | ) | (1,047,011 | ) | ||||
|
|
|
| |||||
Liabilities | ₩ | 548,621 | ₩ | 425,712 | ||||
|
|
|
| |||||
The changes in the defined benefit obligations for the years ended December 31, 2012 and 2011, are as follows:
| (in millions of Korean won) | 2012 | 2011 | ||||||
Beginning | ₩ | 1,472,723 | ₩ | 1,129,912 | ||||
Current service cost | 205,833 | 174,089 | ||||||
Interest expense | 57,089 | 53,257 | ||||||
Benefit paid | (78,334 | ) | (71,255 | ) | ||||
Gains on settlements of plan1 | (3,630 | ) | — | |||||
Changes due to settlements of plan1 | (125,540 | ) | — | |||||
Actuarial losses | 183,136 | 144,856 | ||||||
Changes in scope of Consolidation | 10,613 | 41,864 | ||||||
|
|
|
| |||||
Ending | ₩ | 1,721,890 | ₩ | 1,472,723 | ||||
|
|
|
| |||||
| 1 | The Company has operated both defined contribution plans and defined benefit plans from December 2012. The employees are entitled to choose either defined contribution plans and defined benefit plans. |
Changes in the fair value of plan assets for the years ended December 31, 2012 and 2011, are as follows:
| (in millions of Korean won) | 2012 | 2011 | ||||||
Beginning | ₩ | 1,047,011 | ₩ | 865,934 | ||||
Expected return on plan assets | 55,268 | 41,146 | ||||||
Employer contributions | 214,731 | 149,992 | ||||||
Benefits paid | (44,447 | ) | (34,393 | ) | ||||
Changes due to settlements of plan1 | (99,853 | ) | — | |||||
Actuarial gains (losses) | (5,741 | ) | 2,142 | |||||
Changes in scope of consolidation | 6,300 | 22,190 | ||||||
|
|
|
| |||||
Ending | ₩ | 1,173,269 | ₩ | 1,047,011 | ||||
|
|
|
| |||||
71
Table of Contents
KT Corporation and Subsidiaries
Notes to Consolidated Financial Statements
December 31, 2012 and 2011
| 1 | The Company has operated both defined contribution plans and defined benefit plans from December 2012. The employees are entitled to choose either defined contribution plans and defined benefit plans. |
Amounts recognized in the statement of income for the years ended December 31, 2012 and 2011, are as follows:
| (in millions of Korean won) | 2012 | 2011 | ||||||
Current service cost | ₩ | 205,833 | ₩ | 174,089 | ||||
Interest cost | 57,089 | 53,257 | ||||||
Expected return on plan assets | (55,268 | ) | (41,146 | ) | ||||
Costs(gains) on settlements | (3,630 | ) | — | |||||
Transfer out | (8,763 | ) | (4,028 | ) | ||||
|
|
|
| |||||
Total expenses | ₩ | 195,261 | ₩ | 182,172 | ||||
|
|
|
| |||||
Principal actuarial assumptions used are as follows:
| 2012.12.31 | 2011.12.31 | |||
Discount rate | 3.13% ~ 4.10% | 4.00% ~ 4.80% | ||
Expected rate of return | 4.10% ~ 5.80% | 3.30% ~ 5.80% | ||
Future salary increase | 3.00% ~ 8.10% | 2.00% ~ 9.30% |
Details of plan assets as of December 31, 2012 and 2011, are as follows:
| (in millions of Korean won) | 2012 | 2011 | ||||||
Pension deposits | ₩ | 1,141,865 | ₩ | 1,019,757 | ||||
Severance insurance deposits | 31,404 | 27,254 | ||||||
|
|
|
| |||||
Total | ₩ | 1,173,269 | ₩ | 1,047,011 | ||||
|
|
|
| |||||
Actual return on plan assets for the years ended December 31, 2012 and 2011, are as follows:
| (in millions of Korean won) | 2012 | 2011 | ||||||
Actual return on plan assets | ₩ | 49,527 | ₩ | 43,288 | ||||
Details of adjustments for the differences between initial assumptions and actual figures as of December 31, 2012, 2011 and 2010, and January 1, 2010, are as follows:
| (in millions of Korean won) | 2012.12.31 | 2011.12.31 | 2010.12.31 | 2010.1.1 | ||||||||||||
Present value of the defined benefit obligations | ₩ | 1,721,890 | ₩ | 1,472,723 | ₩ | 1,129,912 | ₩ | 1,235,683 | ||||||||
Fair value of plan assets | (1,173,269 | ) | (1,047,011 | ) | (865,934 | ) | (1,149,657 | ) | ||||||||
Deficit in the plan | 548,621 | 425,712 | 263,978 | 86,026 | ||||||||||||
Experience adjustments on defined benefit liabilities | 33,377 | (2,900 | ) | (60,691 | ) | — | ||||||||||
Experience adjustments on plan assets | (5,741 | ) | 2,142 | (10,215 | ) | — | ||||||||||
72
Table of Contents
KT Corporation and Subsidiaries
Notes to Consolidated Financial Statements
December 31, 2012 and 2011
| 19. | Commitments and Contingencies |
As of December 31, 2012, major commitments with local financial institutions are as follows:
(in millions of Korean won and thousands of foreign currencies) | Financial institution | Currency | Limit | Used amount | ||||||||
Bank overdraft | Kookmin Bank and others | KRW | 1,741,600 | — | ||||||||
Commercial papers factoring | Korea Exchange Bank | KRW | 240,000 | — | ||||||||
Loan on information and communications fund | Shinhan Bank and others | KRW | 12,896 | 12,896 | ||||||||
Collateralized loan on accounts receivable-trade | Kookmin Bank and others | KRW | 722,000 | 24,243 | ||||||||
Collection for foreign currency denominated checks | Korea Exchange Bank | USD | 1,000 | — | ||||||||
Comprehensive credit line | Korea Development Bank and others | KRW | 15,000 | — | ||||||||
Credit line for call loan | Tongyang Securities Inc. | KRW | 120,000 | — | ||||||||
Letter of credit | Kookmin Bank and others | USD | 92,500 | 7,033 | ||||||||
Foreign currency transaction | HSBC | USD | 80,000 | — | ||||||||
As of December 31, 2012, guarantees received from financial institutions are as follows:
| (in millions of Korean won and thousands of foreign currencies) | ||||||||
| Financial institution | Currency | Limit | ||||||
Performance guarantee for construction | Seoul Guarantee Insurance | KRW | 26,191 | |||||
Performance guarantee | Export-Import Bank of Korea | USD | 975 | |||||
| SAR1 | 735 | |||||||
| DZD2 | 25,863 | |||||||
| KRW | 2,715 | |||||||
| Seoul Guarantee Insurance | KRW | 19,710 | ||||||
Bid guarantee | Korea Software Financial Cooperative | KRW | 23,084 | |||||
Advances received guarantee | Export-Import Bank of Korea | USD | 2,925 | |||||
| DZD2 | 77,589 | |||||||
| KRW | 4,093 | |||||||
Guarantees for accounts receivable from the handset sales | Seoul Guarantee Insurance | KRW | 892,106 | |||||
Prepayment guarantee | Korea Software Financial Cooperative | KRW | 103,221 | |||||
Performance guarantee /Warranty guarantee | Korea Software Financial Cooperative | KRW | 209,069 | |||||
Currency guarantee | Korea Exchange Bank | KRW | 3,600 | |||||
| Woori Bank | KRW | 50,000 | ||||||
Foreign currency guarantee | Kookmin Bank | USD | 5,195 | |||||
| Shinhan Bank | USD | 5,000 | ||||||
| Korea Exchange Bank | USD | 5,000 | ||||||
Guarantee deposit | Seoul Guarantee Insurance | KRW | 24,297 | |||||
Guarantee for import letters of credit | Korea Exchange Bank | USD | 5,000 | |||||
Guarantee for domestic letters of credit | Shinhan Bank | USD | 8 | |||||
| 1 | Saudi Riyal. |
| 2 | Algerian Dinar. |
73
Table of Contents
KT Corporation and Subsidiaries
Notes to Consolidated Financial Statements
December 31, 2012 and 2011
Details of collaterals that KT Capital Co., Ltd., a subsidiary of KT Corporation, is provided with by third parties as of December 31, 2012, are as follows:
| (In millions of Korean won) | Details | Amounts | ||||
Credits | Movables, real-estate, financial collateral | ₩ | 943,279 | |||
As of December 31, 2012, guarantees provided by the Company for a third party, are as follows:
| (in millions of Korean won) | Creditor | Limit | ||||
Individuals with the right of ownership of Yeongdeungpo apartment-type factory | Woori Bank and others | ₩ | 26,000 | |||
Individuals with the right of ownership of Gimhae apartment | Shinhan Bank | 108,500 | ||||
Incheon International Airport Corporation and others | Seoul Guarantee Insurance and others | 14,490 | ||||
Other Project Financing1 | NH Investment & Securities and others | 94,054 | ||||
| 1 | As of December 31, 2012, guarantee liabilities of ₩3,706 million (2011: ₩2,839 million) in relation to guarantees for PF loan are recorded as ‘other financial liabilities’ in the statement of financial position. |
74
Table of Contents
KT Corporation and Subsidiaries
Notes to Consolidated Financial Statements
December 31, 2012 and 2011
As of December 31, 2012, based on the investors’ agreement, the Company has an obligation to provide fund to Smart Channel Co., Ltd. if Smart Channel Co, Ltd. is unable to fulfill its obligation. The Company pledged investment securities in Smart Channel Co., Ltd. as collateral (Note 14). Furthermore, the Company provided allowance for doubtful receivables of ₩49,362 million against other receivables related to Smart Channel Co., Ltd.
The Company is jointly and severally obligated with KT Sat Co., Ltd. to reimburse KT Sat Co., Ltd.’s liabilities prior to spin-off. As of December 31, 2012, the Company and KT Sat Co., Ltd. are jointly and severally liable for reimbursement of ₩9,646 million.
During the current period, the Company made agreements with the Securitization Specialty Companies Olleh KT First Securitization Specialty Co., Ltd., Olleh KT Second Securitization Specialty Co., Ltd., Olleh KT Third Securitization Specialty Co., Ltd., Olleh KT Fourth Securitization Specialty Co., Ltd., Olleh KT Fifth Securitization Specialty Co., Ltd., and Olleh KT Sixth Securitization Specialty Co., Ltd., and disposed of its trade receivables related to handset sales. The Company also made asset management agreements with each securitization specialty company and will receive the related management fees.
As of December 31, 2012, the Company is a defendant in 218 lawsuits, with an aggregate amount of ₩96,602 million. As of December 31, 2012, litigation provisions of ₩37,286 million for various pending lawsuits and unasserted claims are recorded as liabilities for potential loss in the ordinary course of business. The final outcome of these cases cannot yet be predicted.
According to the financial and other covenants included in certain bonds and borrowings, the Company is required to maintain certain financial ratios such as debt/equity ratio, use the funds for the designated purpose and report to the creditors periodically. The covenant also contains restriction on provision of additional collaterals and disposal of certain assets. As of December 31, 2012, the Company is compliance with the related covenants.
75
Table of Contents
KT Corporation and Subsidiaries
Notes to Consolidated Financial Statements
December 31, 2012 and 2011
| 20. | Lease |
The Company’s non-cancellable lease arrangements are as follows:
The Company as the Lessee
Finance Lease
Details of finance lease assets as of December 31, 2012 and 2011, are as follows:
| (in millions of Korean won) | 2012 | 2011 | ||||||
Acquisition costs | ₩ | 55,477 | ₩ | 203,468 | ||||
Accumulated depreciation | (15,282 | ) | (74,684 | ) | ||||
|
|
|
| |||||
Net balance | ₩ | 40,195 | ₩ | 128,784 | ||||
|
|
|
| |||||
As of December 31, 2012, the Company recognizes financial lease assets as other property and equipment.
Details of future minimum lease payments as of December 31, 2012 and 2011, under finance lease contracts are summarized below:
| (in millions of Korean won) | 2012 | 2011 | ||||||
Within one year | ₩ | 15,826 | ₩ | 66,635 | ||||
From one year to five years | 29,474 | 116,594 | ||||||
Thereafter | — | 33 | ||||||
|
|
|
| |||||
Total | ₩ | 45,300 | ₩ | 183,262 | ||||
|
|
|
| |||||
Operating Lease
Details of future minimum lease payments as of December 31, 2012 and 2011, under operating lease contracts are summarized below:
| (in millions of Korean won) | 2012 | 2011 | ||||||
Within one year | ₩ | 67,571 | ₩ | 52,053 | ||||
From one year to five years | 279,906 | 158,560 | ||||||
Thereafter | 312,778 | 217,115 | ||||||
|
|
|
| |||||
Total | ₩ | 660,255 | ₩ | 427,728 | ||||
|
|
|
| |||||
Operating lease expenses incurred for the years ended December 31, 2012 and 2011, amounted to ₩61,201 million, and ₩41,499 million, respectively.
76
Table of Contents
KT Corporation and Subsidiaries
Notes to Consolidated Financial Statements
December 31, 2012 and 2011
The Company as the Lessor
Finance Lease
Details of finance lease assets as of December 31, 2012, are as follows:
| (in millions of Korean won) | Minimum lease payments | Gross investment in the lease | Unaccrued interest | Net investment in the lease | ||||||||||||
Within one year | ₩ | 382,835 | ₩ | 382,835 | ₩ | (35,663 | ) | ₩ | 347,172 | |||||||
From one year to five years | 550,930 | 550,930 | (25,063 | ) | 525,867 | |||||||||||
Thereafter | 11,848 | 11,848 | (1,273 | ) | 10,575 | |||||||||||
|
|
|
|
|
|
|
| |||||||||
Total | ₩ | 945,613 | ₩ | 945,613 | ₩ | (61,999 | ) | ₩ | 883,614 | |||||||
|
|
|
|
|
|
|
| |||||||||
Details of finance lease assets as of December 31, 2011, are as follows:
| (in millions of Korean won) | Minimum lease payments | Gross investment in the lease | Unaccrued interest | Net investment in the lease | ||||||||||||
Within one year | ₩ | 290,511 | ₩ | 290,511 | ₩ | (39,066 | ) | ₩ | 251,445 | |||||||
From one year to five years | 514,243 | 514,243 | (42,951 | ) | 471,292 | |||||||||||
Thereafter | 25,960 | 25,960 | (3,171 | ) | 22,789 | |||||||||||
|
|
|
|
|
|
|
| |||||||||
Total | ₩ | 830,714 | ₩ | 830,714 | ₩ | (85,188 | ) | ₩ | 745,526 | |||||||
|
|
|
|
|
|
|
| |||||||||
Details of bad debts allowance for finance lease receivables as of December 31, 2012 and 2011, are as follows:
| (in millions of Korean won) | 2012 | 2011 | ||||||
Within one year | ₩ | 7,312 | ₩ | 2,742 | ||||
From one year to five years | 14,414 | 5,842 | ||||||
Thereafter | 208 | 282 | ||||||
|
|
|
| |||||
Total | ₩ | 21,934 | ₩ | 8,866 | ||||
|
|
|
| |||||
Operating Lease
Details of operating lease assets as of December 31, 2012 and 2011, are as follows:
| (in millions of Korean won) | 2012 | 2011 | ||||||
Acquisition costs | ₩ | 1,556,762 | ₩ | 24,866 | ||||
Accumulated depreciation | (488,514 | ) | (6,614 | ) | ||||
|
|
|
| |||||
Net balance | ₩ | 1,068,248 | ₩ | 18,252 | ||||
|
|
|
| |||||
77
Table of Contents
KT Corporation and Subsidiaries
Notes to Consolidated Financial Statements
December 31, 2012 and 2011
Details of future minimum lease payments as of December 31, 2012 and 2011, under operating lease contracts are summarized below:
| (in millions of Korean won) | 2012 | 2011 | ||||||
Within one year | ₩ | 364,404 | ₩ | 7,381 | ||||
From one year to five years | 347,364 | 7,153 | ||||||
|
|
|
| |||||
Total | ₩ | 711,768 | ₩ | 14,534 | ||||
|
|
|
| |||||
| 21. | Capital Stock |
As of December 31, 2012 and 2011, the Company’s number of authorized shares is one billion.
| 2012 | 2011 | |||||||||||||||||||||||
Number of outstanding | Par value per share (Korean won) | Common (in millions of Korean won) | Number of outstanding | Par value per share (Korean won) | Common (in millions of Korean won) | |||||||||||||||||||
Common stock1 | 261,111,808 | ₩ | 5,000 | ₩ | 1,564,499 | 261,111,808 | ₩ | 5,000 | ₩ | 1,564,499 | ||||||||||||||
| 1 | The Company retired 51,787,959 treasury shares against retained earnings. Therefore, the common stock amount differs from the amount resulting from multiplying the number of shares issued by ₩5,000 par value per share of common stock. |
| 22. | Retained Earnings |
Details of retained earnings as of December 31, 2012 and 2011, are as follows:
| (in millions of Korean won) | 2012 | 2011 | ||||||
Legal reserve1 | ₩ | 782,249 | ₩ | 782,249 | ||||
Voluntary reserves | 4,911,362 | 4,911,362 | ||||||
Unappropriated retained earnings | 4,952,772 | 4,526,022 | ||||||
|
|
|
| |||||
Total | ₩ | 10,646,383 | ₩ | 10,219,633 | ||||
|
|
|
| |||||
| 1 | The Commercial Code of the Republic of Korea requires the Company to appropriate, as a legal reserve, an amount equal to a minimum of 10% of cash dividends paid until such reserve equals 50% of its issued capital stock. The reserve is not available for the payment of cash dividends, but may be transferred to capital stock with the approval of the Company’s Board of Directors or used to reduce accumulated deficit, if any, with the ratification of the Company’s majority shareholders. |
78
Table of Contents
KT Corporation and Subsidiaries
Notes to Consolidated Financial Statements
December 31, 2012 and 2011
| 23. | Accumulated Other Comprehensive Income and Other Components of Equity |
As of December 31, 2012 and 2011, the details of the Controlling Company’s accumulated other comprehensive income are as follows:
| (in millions of Korean won) | 2012 | 2011 | ||||||
Investments in associates and joint ventures | ₩ | (15,251) | ₩ | (6,811) | ||||
Gain or loss on derivatives | (4,626 | ) | (30,254 | ) | ||||
Available-for-sale | 23,738 | 11,719 | ||||||
Foreign currency translation adjustment | (2,536 | ) | 2,481 | |||||
|
|
|
| |||||
Total | ₩ | 1,325 | ₩ | (22,865) | ||||
|
|
|
| |||||
Changes in accumulated other comprehensive income for the years ended December 31, 2012 and 2011, are as follows:
| 2012 | ||||||||||||||||
| (in millions of Korean won) | Beginning | Increase /decrease | Reclassification as gain or loss | Ending | ||||||||||||
Investments in associates and joint ventures | ₩ | (6,811) | ₩ | (8,819) | ₩ | 379 | ₩ | (15,251) | ||||||||
Gain or loss on derivatives | (30,254 | ) | (129,239 | ) | 154,867 | (4,626 | ) | |||||||||
Available-for-sale | 11,719 | 15,543 | (3,524 | ) | 23,738 | |||||||||||
Foreign currency translation adjustment | 2,481 | (5,017 | ) | — | (2,536 | ) | ||||||||||
|
|
|
|
|
|
|
| |||||||||
Total | ₩ | (22,865) | ₩ | (127,532) | ₩ | 151,722 | ₩ | 1,325 | ||||||||
|
|
|
|
|
|
|
| |||||||||
| 2011 | ||||||||||||||||
| (in millions of Korean won) | Beginning | Increase /decrease | Reclassification as gain or loss | Ending | ||||||||||||
Investments in associates and joint ventures | ₩ | (1,528 | ) | ₩ | (3,228 | ) | ₩ | (2,055 | ) | ₩ | (6,811 | ) | ||||
Gain or loss on derivatives | (58,432 | ) | 63,211 | (35,033 | ) | (30,254 | ) | |||||||||
Available-for-sale | 6,629 | 6,358 | (1,268 | ) | 11,719 | |||||||||||
Foreign currency translation adjustment | (26,039 | ) | 10,399 | 18,121 | 2,481 | |||||||||||
|
|
|
|
|
|
|
| |||||||||
Total | ₩ | (79,370 | ) | ₩ | 76,740 | ₩ | (20,235 | ) | ₩ | (22,865 | ) | |||||
|
|
|
|
|
|
|
| |||||||||
79
Table of Contents
KT Corporation and Subsidiaries
Notes to Consolidated Financial Statements
December 31, 2012 and 2011
As of December 31, 2012 and 2011, the Company’s other components of equity are as follows:
| (in millions of Korean won) | 2012 | 2011 | ||||||
Treasury stock1 | ₩ | (931,132 | ) | ₩ | (953,608 | ) | ||
Gain(loss) on disposal of treasury stock2 | (6,797 | ) | 23 | |||||
Share-based payments | 3,912 | 7,455 | ||||||
Others3 | (409,269 | ) | (551,159 | ) | ||||
|
|
|
| |||||
Total | ₩ | (1,343,286 | ) | ₩ | (1,497,289 | ) | ||
|
|
|
| |||||
| 1 | During the current period, the Company disposed of 361,353 shares of treasury stock. |
| 2 | The amounts directly reflected in equity is ₩2,170 million (2011: (-) ₩7 million) as of December 31, 2012. |
| 3 | Gain (loss) from transactions with non-controlling shareholders and changes in interest in subsidiaries are included. |
As of and December 31, 2012 and 2011, the details of treasury stock are as follows:
| 2012 | 2011 | |||||||
Number of shares | 17,476,002 | 17,897,147 | ||||||
Amounts(In millions of Korean won) | ₩ | 931,132 | ₩ | 953,608 | ||||
Treasury stock is expected to be used for the stock compensation for the Company’s directors and employees and other purposes.
80
Table of Contents
KT Corporation and Subsidiaries
Notes to Consolidated Financial Statements
December 31, 2012 and 2011
| 24. | Share-Based Payments |
The details of other share-based payments as of December 31, 2012, are as follows:
Stock Options
Upon exercise, the controlling Company can elect one of the following settlement methods: issuance of new shares, issuance of treasury stock or cash settlement, subject to certain circumstances.
The changes in the number of stock options and the weighted-average exercise price, as of December 31, 2012 and 2011, are as follows:
| 2012 | ||||||||||||||||||||
| Beginning | Expired | Exercised | Ending | Number of shares exercisable | ||||||||||||||||
4th grant | 43,153 | 43,153 | — | — | — | |||||||||||||||
KTF-4th | 45,749 | 45,749 | — | — | — | |||||||||||||||
Total | 88,902 | 88,902 | — | — | — | |||||||||||||||
Weighted-average exercise price (in Korean won) | 48,468 | 48,468 | — | — | — | |||||||||||||||
| 2011 | ||||||||||||||||||||
| Beginning | Expired | Exercised | Ending | Number of shares exercisable | ||||||||||||||||
4th grant | 43,153 | — | — | 43,153 | 43,153 | |||||||||||||||
KTF-4th | 45,749 | — | — | 45,749 | 45,749 | |||||||||||||||
Total | 88,902 | — | — | 88,902 | 88,902 | |||||||||||||||
Weighted-average exercise price (in Korean won) | 48,468 | — | — | 48,468 | — | |||||||||||||||
Other share-based compensation
The details of stocks grants as of December 31, 2012 and 2011, are as follows:
| 6th grant | ||
Grant date | 2012.05.03 | |
Grantee | CEO, inside directors, outside directors, executives | |
Estimated number of shares granted at grant date | 255,110 shares | |
Estimated number of shares granted as of December 31, 2011 | 255,110 shares | |
Vesting conditions | Service condition: 1 year Non-market performance condition: achievement of performance | |
Fair value per option (in Korean won) | ₩29,300 | |
Total compensation costs (in Korean won) | ₩3,912 million | |
Estimated exercise date (exercise date) | During 2013 | |
Valuation method | Fair value method |
81
Table of Contents
KT Corporation and Subsidiaries
Notes to Consolidated Financial Statements
December 31, 2012 and 2011
Changes of the number of other share-based payments, as of December 31, 2012 and 2011, are as follows:
| 2012 | ||||||||||||||||||||||||
| Beginning | Grant | Expired | Exercised1 | Ending | Number of shares exercisable | |||||||||||||||||||
5th grant | 190,658 | — | 90,869 | 99,789 | — | — | ||||||||||||||||||
6th grant | — | 255,110 | — | — | 255,110 | — | ||||||||||||||||||
Total | 190,658 | 255,110 | 90,869 | 99,789 | 255,110 | — | ||||||||||||||||||
| 2011 | ||||||||||||||||||||||||
| Beginning | Grant | Expired | Exercised1 | Ending | Number of shares exercisable | |||||||||||||||||||
4th grant | 142,436 | — | 11,924 | 130,512 | — | — | ||||||||||||||||||
5th grant | — | 190,658 | — | — | 190,658 | — | ||||||||||||||||||
Total | 142,436 | 190,658 | 11,924 | 130,512 | 190,658 | — | ||||||||||||||||||
| 1 | The weighted average price of common stock at the time of exercise during 2012 was ₩28,700 (2011: ₩38,500). |
82
Table of Contents
KT Corporation and Subsidiaries
Notes to Consolidated Financial Statements
December 31, 2012 and 2011
| 25. | Operating Revenues |
Operating revenues for the years ended December 31, 2012 and 2011, are as follows:
| (in millions of Korean won) | 2012 | 2011 | ||||||
Sales of services | ₩ | 19,200,444 | ₩ | 16,832,349 | ||||
Sale of goods1 | 4,589,915 | 4,439,684 | ||||||
|
|
|
| |||||
Operating revenues | ₩ | 23,790,359 | ₩ | 21,272,033 | ||||
|
|
|
| |||||
| 1 | Includes revenue from Construction commitment recognized using percentage completion method. |
| 26. | Construction Commitments |
The changes in construction contracts as of December 31, 2012, are as follows:
| (in millions of Korean won) | Beginning | Increase (decrease) | Gain(loss) from construction | Ending | ||||||||||||
Kimhae apartment | ₩ | — | ₩ | 140,657 | ₩ | 45,010 | ₩ | 95,467 | ||||||||
Dajeoun Building | — | 23,299 | 887 | 22,412 | ||||||||||||
|
|
|
|
|
|
|
| |||||||||
Total | ₩ | — | ₩ | 163,956 | ₩ | 45,897 | ₩ | 118,059 | ||||||||
|
|
|
|
|
|
|
| |||||||||
Gains or losses from construction in progress as of December 31, 2012, are as follows:
| (in millions of Korean won) | Cumulative construction revenue | Cumulative construction cost | Cumulative gain or loss from construction | Cumulative advance payments | ||||||||||||
Kimhae apartment | ₩ | 45,010 | ₩ | 32,835 | ₩ | 12,175 | ₩ | 45,747 | ||||||||
Dajeoun Building | 887 | 791 | 96 | 2,150 | ||||||||||||
|
|
|
|
|
|
|
| |||||||||
Total | ₩ | 45,897 | ₩ | 33,626 | ₩ | 12,271 | ₩ | 47,897 | ||||||||
|
|
|
|
|
|
|
| |||||||||
Amounts due from and to customers for contract work as of December 31, 2012, are as follows:
| (in millions of Korean won) | Amount due from customers for contract work | Amount due to customers for contract work1 | ||||||
Kimhae apartment | ₩ | — | ₩ | 737 | ||||
Dajeoun Building | — | 1,263 | ||||||
|
|
|
| |||||
Total | ₩ | — | ₩ | 2,000 | ||||
|
|
|
| |||||
| 1 | Recorded as advances received in the statements of financial position. |
83
Table of Contents
KT Corporation and Subsidiaries
Notes to Consolidated Financial Statements
December 31, 2012 and 2011
| 27. | Operating Expenses |
Operating expenses for the years ended December 31, 2012 and 2011, are as follows:
| (in millions of Korean won) | 2012 | 2011 | ||||||
Salaries and wages | ₩ | 3,075,751 | ₩ | 2,847,388 | ||||
Depreciation | 2,888,213 | 2,643,127 | ||||||
Amortization of intangible assets | 379,578 | 312,620 | ||||||
Commissions | 1,417,684 | 1,441,945 | ||||||
Interconnection charges | 901,314 | 1,115,792 | ||||||
Purchase of handsets | 4,592,654 | 4,088,517 | ||||||
Changes of inventories | (260,143 | ) | 35,890 | |||||
Sales commission | 2,229,542 | 1,865,208 | ||||||
Utilities | 271,071 | 262,317 | ||||||
Taxes and Dues | 299,491 | 219,138 | ||||||
Rent | 368,036 | 322,814 | ||||||
Advertising expenses | 150,376 | 172,160 | ||||||
Research and development expenses | 153,150 | 159,935 | ||||||
Others | 6,109,762 | 4,036,773 | ||||||
|
|
|
| |||||
Total | ₩ | 22,576,479 | ₩ | 19,523,624 | ||||
|
|
|
| |||||
Details of salaries and wages for the years ended December 31, 2012 and 2011, are as follows:
| (in millions of Korean won) | 2012 | 2011 | ||||||
Short-term employee benefits | ₩ | 2,849,113 | ₩ | 2,593,424 | ||||
Post-employment benefits | 222,726 | 247,238 | ||||||
Share-based payment | 3,912 | 6,726 | ||||||
|
|
|
| |||||
Total | ₩ | 3,075,751 | ₩ | 2,847,388 | ||||
|
|
|
| |||||
84
Table of Contents
KT Corporation and Subsidiaries
Notes to Consolidated Financial Statements
December 31, 2012 and 2011
| 28. | Other income and other expenses |
Other income as of December 31, 2012 and 2011, consists of:
| (in millions of Korean won) | 2012 | 2011 | ||||||
Gains on disposal of property and equipment1, 2, 3 | ₩ | 474,384 | ₩ | 398,216 | ||||
Gains on disposal of intangible assets | 2,414 | 3,999 | ||||||
Gains on disposal of investments in associates and joint ventures | 126,357 | 191,209 | ||||||
Gains on contribution of assets | 13,554 | 15,240 | ||||||
Dividend | 1,214 | 16 | ||||||
Others | 169,427 | 166,952 | ||||||
|
|
|
| |||||
Total | ₩ | 787,350 | ₩ | 775,632 | ||||
|
|
|
| |||||
| 1 | Disposed land and building (carrying amount: ₩93,250 million) for ₩232,000 million to AJU-KTM private funding real-estate investment trust No.1 and leased them in September 2012. The Company recognized gain on disposal of property and equipment of ₩138,750 million and accounted for this as an operating lease. |
| 2 | Disposed land and building (carrying amount: ₩32,232 million) for ₩144,100 million to K-REALTY CR-REIT 2 and leased them in November 2012. The Company recognized gain on disposal of property and equipment of ₩111,868 million and accounted for this as an operating lease. |
| 3 | Disposed land and building (carrying amount: ₩171,989 million) for ₩470,347 million K-REALTY CR-REIT 1 and leased them. The Company recognized gain on disposal of property and equipment ₩298,358 million and accounted for this as an operating lease. |
Other expense as of December 31, 2012 and 2011, are as follows:
| (in millions of Korean won) | 2012 | 2011 | ||||||
Loss on disposal of property and equipment | ₩ | 67,070 | ₩ | 110,288 | ||||
Impairment loss on property and equipment | 15,254 | 18,595 | ||||||
Loss on disposal of intangible asset | 1,012 | 2,471 | ||||||
Loss on disposal of investments in associates and joint ventures | 603 | 577 | ||||||
Impairment loss on investments in associates and joint ventures | — | 25,107 | ||||||
Donation | 98,995 | 101,264 | ||||||
Others | 133,363 | 287,954 | ||||||
|
|
|
| |||||
Total | ₩ | 316,297 | ₩ | 546,256 | ||||
|
|
|
| |||||
85
Table of Contents
KT Corporation and Subsidiaries
Notes to Consolidated Financial Statements
December 31, 2012 and 2011
| 29. | Financial Income and Expenses |
Details of financial income for the years ended December 31, 2012 and 2011, are as follows:
| (in millions of Korean won) | 2012 | 2011 | ||||||
Interest income | ₩ | 202,820 | ₩ | 151,162 | ||||
Foreign currency transaction gain | 19,549 | 43,151 | ||||||
Foreign currency translation gain | 265,822 | 5,847 | ||||||
Gain on settlement of derivatives | 2,352 | 389 | ||||||
Gain on valuation of derivatives | 118 | 63,959 | ||||||
Others | 5,705 | 1,522 | ||||||
|
|
|
| |||||
Total | ₩ | 496,366 | ₩ | 266,030 | ||||
|
|
|
| |||||
Details of financial expenses for the years ended December 31, 2012 and 2011, are as follows:
| (in millions of Korean won) | 2012 | 2011 | ||||||
Interest expenses | ₩ | 472,491 | ₩ | 479,508 | ||||
Foreign currency transaction loss | 16,899 | 32,980 | ||||||
Foreign currency translation loss | 6,568 | 85,209 | ||||||
Loss on settlement of derivatives | 7,804 | 27,055 | ||||||
Loss on valuation of derivatives | 241,358 | 9,147 | ||||||
Loss on disposal of trade receivables | 15,809 | — | ||||||
Others1 | 18,883 | 3,507 | ||||||
|
|
|
| |||||
Total | ₩ | 779,812 | ₩ | 637,406 | ||||
|
|
|
| |||||
| 1 | The Company recognized funding obligation to Smart Channel Co., Ltd. as financial liabilities and recognized ₩5,393 million as an expense. |
86
Table of Contents
KT Corporation and Subsidiaries
Notes to Consolidated Financial Statements
December 31, 2012 and 2011
| 30. | Deferred Income Tax and Income Tax Expense |
The analyses of deferred tax assets and deferred tax liabilities as of December 31, 2012 and 2011, are as follows:
| (in millions of Korean won) | 2012 | 2011 | ||||||
Deferred tax assets | ||||||||
Deferred tax assets to be recovered within 12 months | ₩ | 260,647 | ₩ | 237,586 | ||||
Deferred tax assets to be recovered after more than 12 months | 764,450 | 787,639 | ||||||
|
|
|
| |||||
| 1,025,097 | 1,025,225 | |||||||
|
|
|
| |||||
Deferred tax liabilities | ||||||||
Deferred tax liability to be recovered within 12 months | (913 | ) | (846 | ) | ||||
Deferred tax liability to be recovered after more than 12 months | (548,400 | ) | (618,960 | ) | ||||
|
|
|
| |||||
| (549,313 | ) | (619,806 | ) | |||||
|
|
|
| |||||
Deferred tax assets (liabilities), net | ₩ | 475,784 | ₩ | 405,419 | ||||
|
|
|
| |||||
The gross movements on the deferred income tax account for the years ended December 31, 2012 and 2011, are calculated as follows:
| (in millions of Korean won) | 2012 | 2011 | ||||||
Beginning | ₩ | 405,419 | ₩ | 560,880 | ||||
Charged(credited) to the income statement | 65,641 | (142,012 | ) | |||||
Charged(credited) to other1comprehensive income | (7,462 | ) | 36,233 | |||||
Changes in scope of consolidation | 12,186 | (49,682 | ) | |||||
|
|
|
| |||||
Ending | ₩ | 475,784 | ₩ | 405,419 | ||||
|
|
|
| |||||
| 1 | Only portion from equity attributable to owners of the Parent company is considered. |
87
Table of Contents
KT Corporation and Subsidiaries
Notes to Consolidated Financial Statements
December 31, 2012 and 2011
The movement in deferred income tax assets and liabilities during the year, without taking into consideration the offsetting of balances within the same tax jurisdiction, is as follows:
| (in millions of Korean won) | 2012 | |||||||||||||||||||
| Beginning | Income statement | Other comprehensive income1 | Changes in scope of consolidation | Ending | ||||||||||||||||
Deferred tax liabilities | ||||||||||||||||||||
Derivative financial assets | ₩ | (37,861 | ) | ₩ | 37,294 | ₩ | 270 | ₩ | — | ₩ | (297 | ) | ||||||||
Available-for-sale financial assets | (12,945 | ) | (90 | ) | 1,728 | 638 | (10,669 | ) | ||||||||||||
Investment in joint venture and associates | (200 | ) | (826 | ) | (669 | ) | 43 | (1,652 | ) | |||||||||||
Depreciation | (82,508 | ) | 45,773 | 6,646 | 1,118 | (28,971 | ) | |||||||||||||
Deposits for severance benefits | (271,233 | ) | (23,268 | ) | (1,319 | ) | (1,339 | ) | (297,159 | ) | ||||||||||
Accrued income | (1,836 | ) | 243 | — | (61 | ) | (1,654 | ) | ||||||||||||
Prepaid expenses | (325 | ) | 220 | — | — | (105 | ) | |||||||||||||
Reserve for technology and human resource development | (63,491 | ) | (1,079 | ) | — | — | (64,570 | ) | ||||||||||||
Others | (149,407 | ) | 34,516 | (26,893 | ) | (2,452 | ) | (144,236 | ) | |||||||||||
|
|
|
|
|
|
|
|
|
| |||||||||||
| (619,806 | ) | 92,783 | (20,237 | ) | (2,053 | ) | (549,313 | ) | ||||||||||||
|
|
|
|
|
|
|
|
|
| |||||||||||
Deferred tax assets | ||||||||||||||||||||
Derivatives | — | 30,176 | (8,457 | ) | — | 21,719 | ||||||||||||||
Allowance for doubtful accounts | 112,203 | 18,836 | 5,129 | 3,108 | 139,276 | |||||||||||||||
Inventory valuation | 594 | (292 | ) | — | — | 302 | ||||||||||||||
Contribution for construction | 29,301 | (2,169 | ) | — | — | 27,132 | ||||||||||||||
Accrued expenses | 24,408 | 272 | 3,022 | — | 27,702 | |||||||||||||||
Provisions | 55,238 | 8,815 | (1,741 | ) | 321 | 62,633 | ||||||||||||||
Defined benefit liabilities | 257,248 | 16,170 | 45,733 | 1,758 | 320,909 | |||||||||||||||
Withholding of facilities expenses | 9,389 | (528 | ) | — | — | 8,861 | ||||||||||||||
Accrued payroll expenses | 28,670 | 3,193 | — | 322 | 32,185 | |||||||||||||||
Deduction of installment receivables | 78,880 | (67,347 | ) | (9 | ) | — | 11,524 | |||||||||||||
Present value discount | 34,176 | (19,276 | ) | — | — | 14,900 | ||||||||||||||
Assets retirement obligation | 16,283 | 2,478 | — | — | 18,761 | |||||||||||||||
Gain or loss foreign currency translation | 97,632 | (77,315 | ) | — | — | 20,317 | ||||||||||||||
Deferred revenue | 51,183 | 15,645 | — | — | 66,828 | |||||||||||||||
Real-estate sales | 6,456 | (5,762 | ) | — | — | 694 | ||||||||||||||
Tax credit carryforwards | 80,854 | 69,480 | — | — | 150,334 | |||||||||||||||
Others | 142,710 | (19,518 | ) | (30,902 | ) | 8,730 | 101,020 | |||||||||||||
|
|
|
|
|
|
|
|
|
| |||||||||||
| 1,025,225 | (27,142 | ) | 12,775 | 14,239 | 1,025,097 | |||||||||||||||
|
|
|
|
|
|
|
|
|
| |||||||||||
Net balance2 | ₩ | 405,419 | ₩ | 65,641 | ₩ | (7,462 | ) | ₩ | 12,186 | ₩ | 475,784 | |||||||||
|
|
|
|
|
|
|
|
|
| |||||||||||
88
Table of Contents
KT Corporation and Subsidiaries
Notes to Consolidated Financial Statements
December 31, 2012 and 2011
| (in millions of Korean won) | 2011 | |||||||||||||||||||
| Beginning | Income statement | Other comprehensive income1 | Changes in scope of consolidation | Ending | ||||||||||||||||
Deferred tax liabilities | ||||||||||||||||||||
Derivative financial assets | ₩ | (30,854 | ) | ₩ | (6,178 | ) | ₩ | (829 | ) | ₩ | — | ₩ | (37,861 | ) | ||||||
Available-for-sale financial assets | 12,987 | (27,472 | ) | (648 | ) | 2,188 | (12,945 | ) | ||||||||||||
Investment in joint venture and associates | (46,995 | ) | 46,083 | 1,076 | (364 | ) | (200 | ) | ||||||||||||
Depreciation | (6,229 | ) | (73,284 | ) | — | (2,995 | ) | (82,508 | ) | |||||||||||
Deposits for severance benefits | (189,993 | ) | (83,396 | ) | 502 | 1,654 | (271,233 | ) | ||||||||||||
Accrued income | (702 | ) | (1,105 | ) | — | (29 | ) | (1,836 | ) | |||||||||||
Prepaid Expense | (118 | ) | (206 | ) | — | (1 | ) | (325 | ) | |||||||||||
Reserve for technology and human resource development | — | (63,491 | ) | — | — | (63,491 | ) | |||||||||||||
Others | (30,048 | ) | (60,717 | ) | — | (58,642 | ) | (149,407 | ) | |||||||||||
|
|
|
|
|
|
|
|
|
| |||||||||||
| (291,952 | ) | (269,766 | ) | 101 | (58,189 | ) | (619,806 | ) | ||||||||||||
|
|
|
|
|
|
|
|
|
| |||||||||||
Deferred tax assets | ||||||||||||||||||||
Allowance for doubtful accounts | 128,040 | (20,556 | ) | 106 | 4,613 | 112,203 | ||||||||||||||
Inventory valuation | 680 | (508 | ) | — | 422 | 594 | ||||||||||||||
Contribution for construction | 31,188 | (1,887 | ) | — | — | 29,301 | ||||||||||||||
Accrued expenses | 28,607 | (4,199 | ) | — | — | 24,408 | ||||||||||||||
Provisions | 18,249 | 36,248 | — | 741 | 55,238 | |||||||||||||||
Defined benefit liabilities | 160,564 | 58,518 | 37,418 | 748 | 257,248 | |||||||||||||||
Withholding of facilities expenses | 9,283 | 106 | — | — | 9,389 | |||||||||||||||
Accrued payroll expenses | 49,755 | (21,085 | ) | — | — | 28,670 | ||||||||||||||
Deduction of installment receivables | 72,171 | 6,709 | — | — | 78,880 | |||||||||||||||
Present value discount | 23,967 | 10,208 | — | 1 | 34,176 | |||||||||||||||
Assets retirement obligation | 15,285 | 998 | — | — | 16,283 | |||||||||||||||
Gain or loss foreign currency translation | 81,111 | 16,524 | — | (3 | ) | 97,632 | ||||||||||||||
Deferred revenue | 53,812 | (2,629 | ) | — | — | 51,183 | ||||||||||||||
Real-estate sales | 2,940 | 3,516 | — | — | 6,456 | |||||||||||||||
Tax credit carryforwards | 89,386 | (8,532 | ) | — | — | 80,854 | ||||||||||||||
Others | 87,794 | 54,323 | (1,392 | ) | 1,985 | 142,710 | ||||||||||||||
|
|
|
|
|
|
|
|
|
| |||||||||||
| 852,832 | 127,754 | 36,132 | 8,507 | 1,025,225 | ||||||||||||||||
|
|
|
|
|
|
|
|
|
| |||||||||||
Net balance2 | ₩ | 560,880 | ₩ | (142,012 | ) | ₩ | 36,233 | ₩ | (49,682 | ) | ₩ | 405,419 | ||||||||
|
|
|
|
|
|
|
|
|
| |||||||||||
| 1 | Only the portion from equity attributable to owners of the parent company is considered. |
| 2 | Deferred tax liabilities, amounting to ₩43,693 million (2011: Deferred tax liabilities of ₩18,711 million) that are related to the tax receivable of certain subsidiaries’ undistributed profit, are not recognized as of December 31, 2012. This undistributed profit is permanently reinvested. As of December 31, 2012, temporary difference of unrecognized deferred tax liabilities is ₩399,339 million (2011: ₩157,263 million). |
89
Table of Contents
KT Corporation and Subsidiaries
Notes to Consolidated Financial Statements
December 31, 2012 and 2011
The tax impacts directly to equity as of December 31, 2012 and 2011, are as follows:
| 2012 | 2011 | |||||||||||||||||||||||
| (in millions of Korean won) | Before recognition | Tax effect | After recognition | Before recognition | Tax effect | After recognition | ||||||||||||||||||
Available-for-sale valuation gain (loss) | ₩ | 31,433 | ₩ | (7,695 | ) | ₩ | 23,738 | ₩ | 12,126 | ₩ | (407 | ) | ₩ | 11,719 | ||||||||||
Hedge instruments valuation gain (loss) | (6,121 | ) | 1,495 | (4,626 | ) | (39,883 | ) | 9,629 | (30,254 | ) | ||||||||||||||
Actuarial gain (loss) | (510,520 | ) | 117,754 | (392,766 | ) | (324,160 | ) | 74,007 | (250,153 | ) | ||||||||||||||
Shares of other comprehensive gain(loss) of joint ventures and associates | (15,479 | ) | 228 | (15,251 | ) | (6,983 | ) | 172 | (6,811 | ) | ||||||||||||||
Shares of actuarial gain (loss) of joint ventures and associates | (4,328 | ) | 523 | (3,805 | ) | (250,176 | ) | 23 | (250,153 | ) | ||||||||||||||
Others | (320,911 | ) | 1,323 | (319,588 | ) | (317,577 | ) | 37,666 | (279,911 | ) | ||||||||||||||
|
|
|
|
|
|
|
|
|
|
|
| |||||||||||||
Total | ₩ | (825,926 | ) | ₩ | 113,628 | ₩ | (712,298 | ) | ₩ | (926,653 | ) | ₩ | 121,090 | ₩ | (805,563 | ) | ||||||||
|
|
|
|
|
|
|
|
|
|
|
| |||||||||||||
| 1 | Only portion from equity attributable to owners of the parent company is considered. |
Details of income tax expenses for the years ended December 31, 2012 and 2011, are calculated as follows:
| (in millions of Korean won) | 2012 | 2011 | ||||||
Current income tax expenses | ₩ | 281,613 | ₩ | 229,861 | ||||
Adjustments of the current income tax expenses of prior year | 59,775 | — | ||||||
Impact of change in temporary difference | (65,641 | ) | 160,126 | |||||
Impact of change in tax rate | — | (18,114 | ) | |||||
|
|
|
| |||||
Total income tax expense | ₩ | 275,727 | ₩ | 371,873 | ||||
|
|
|
| |||||
Income tax expense from continued operations | 279,518 | 315,946 | ||||||
Income tax expense for discontinued operations | (3,791 | ) | 55,927 | |||||
90
Table of Contents
KT Corporation and Subsidiaries
Notes to Consolidated Financial Statements
December 31, 2012 and 2011
The tax on the Company’s profit before tax differs from the theoretical amount that would arise using the weighted average tax rate applicable to profits of the consolidated entities as follows:
| (in millions of Korean won) | 2012 | 2011 | ||||||
Profit before continuing operations before income tax expenses | ₩ | 1,422,502 | ₩ | 1,603,371 | ||||
|
|
|
| |||||
Expected tax expense at statutory tax rate | ₩ | 312,530 | ₩ | 311,557 | ||||
Tax effects of | ||||||||
Income not subject to tax | (1,407 | ) | (394,462 | ) | ||||
Expenses not deductible for tax purposes | 39,136 | 396,673 | ||||||
Tax credit carryforwards and deductions | (83,311 | ) | (169,057 | ) | ||||
Supplementary pay of corporation tax | 59,755 | — | ||||||
Changes in unrealizable deferred tax assets | (55,006 | ) | 10,188 | |||||
Deferred tax effects due to changes in tax rates and others | (17,656 | ) | 85,146 | |||||
Others | 25,477 | 75,901 | ||||||
|
|
|
| |||||
Income tax expenses for continuing operations | ₩ | 279,518 | ₩ | 315,946 | ||||
|
|
|
| |||||
Average effective tax rate | 19.65 | % | 19.71 | % | ||||
| 31. | Earnings Per Share |
Calculation of earnings per share for the years ended December 31, 2012 and 2011, is as follows:
Basic earnings per share from continuing operations is calculated by dividing the profit from continuing operations attributable to equity holders of the Company by the weighted average number of common stocks outstanding during the period, excluding common stocks purchased by the Company and held as treasury stock (Note 23).
Basic earnings per share from continuing operations for the years ended December 31, 2012 and 2011, is calculated as follows:
| 2012 | 2011 | |||||||
Profit from continuing operations attributable to common stock(in millions of Korean won) | ₩ | 1,086,734 | ₩ | 1,280,876 | ||||
Weighted average number of common stock outstanding | 243,517,103 | 243,247,651 | ||||||
Basic earnings per share from continuing operations(in Korean won) | ₩ | 4,463 | ₩ | 5,266 | ||||
Basic earnings per share from discontinued operations is calculated by dividing the profit from discontinued operations attributable to equity holders of the Company by the weighted average number of common stocks outstanding during the period, excluding common stocks purchased by the Company and held as treasury stock (Note 23).
91
Table of Contents
KT Corporation and Subsidiaries
Notes to Consolidated Financial Statements
December 31, 2012 and 2011
Basic earnings per share from discontinued operations for the years ended December 31, 2012 and 2011, is calculated as follows:
| 2012 | 2011 | |||||||
Profit (loss) from discontinued operations attributable to common stock(in millions of Korean won) | ₩ | (29,687 | ) | ₩ | 165,675 | |||
Weighted average number of common stock outstanding | 243,517,103 | 243,247,651 | ||||||
Basic earnings (loss) per share from discontinued operations(in Korean won) | ₩ | (122 | ) | ₩ | 681 | |||
Basic earnings per share is calculated by dividing the profit attributable to equity holders of the Company by the weighted average number of common stocks outstanding during the year, excluding common stocks purchased by the Company and held as treasury stock (Note 23).
Basic earnings per share for the years ended December 31, 2012 and 2011, is calculated as follows:
| 2012 | 2011 | |||||||
Net income attributable to common stock(in millions of Korean won) | ₩ | 1,057,047 | ₩ | 1,446,551 | ||||
Weighted average number of common stock outstanding | 243,517,103 | 243,247,651 | ||||||
Basic earnings per share(in Korean won) | ₩ | 4,341 | ₩ | 5,947 | ||||
Diluted earnings per share from continuing operations is calculated by adjusting the weighted average number of common stocks outstanding to assume conversion of all dilutive potential common stocks. The Company has dilutive potential common stocks from stock options.
Diluted earnings per share from continuing operations for the years ended December 31, 2012 and 2011, is calculated as follows:
| 2012 | 2011 | |||||||
Profit from continuing operations attributable to common stock(in millions of Korean won) | ₩ | 1,086,734 | ₩ | 1,280,876 | ||||
Adjusted profit from continuing operations attributable to common stock(in millions of Korean won) | 1,086,734 | 1,280,876 | ||||||
Number of dilutive potential common shares outstanding | 23,851 | 32,960 | ||||||
Weighted-average number of common shares outstanding and dilutive common shares | 243,540,954 | 243,280,611 | ||||||
Diluted earnings per share from continuing operations(in Korean won) | ₩ | 4,462 | ₩ | 5,265 | ||||
92
Table of Contents
KT Corporation and Subsidiaries
Notes to Consolidated Financial Statements
December 31, 2012 and 2011
Diluted earnings per share from continuing operations is calculated by dividing adjusted profit from continuing operations attributable to equity holders of the Company by the sum of the number of common stocks and dilutive potential common stocks. Certain other share-based payments have no dilutive effect and are excluded from the calculation of diluted earnings per share from continuing operations.
Diluted earnings per share from discontinued operations is calculated by adjusting the weighted average number of common stocks outstanding to assume conversion of all dilutive potential common stocks. The Company has dilutive potential common stocks from stock options.
Diluted earnings per share from discontinued operations for the years ended December 31, 2012 and 2011, is calculated as follows:
| 2012 | 2011 | |||||||
Profit from discontinued operations attributable to common stock(in millions of Korean won) | ₩ | (29,687 | ) | ₩ | 165,675 | |||
Adjusted profit from discontinued operations attributable to common stock(in millions of Korean won) | (29,687 | ) | 165,675 | |||||
Number of dilutive potential common shares outstanding | 23,851 | 32,960 | ||||||
Weighted-average number of common shares outstanding and dilutive common shares | 243,540,954 | 243,280,611 | ||||||
Diluted earnings per share from discontinued operations(in Korean won) | ₩ | (122 | ) | ₩ | 681 | |||
Diluted earnings per share from discontinued operations is calculated by dividing adjusted profit from discontinued operations attributable to equity holders of the Company by the sum of the number of common stocks and dilutive potential common stocks. Certain other share-based payments have no dilutive effect and are excluded from the calculation of diluted earnings per share from discontinued operations.
Diluted earnings per share is calculated by adjusting the weighted average number of common stocks outstanding to assume conversion of all dilutive potential common stocks. The Company has dilutive potential common stocks from stock options.
Diluted earnings per share for the years ended December 31, 2012 and 2011, is calculated as follows:
| 2012 | 2011 | |||||||
Net income attributable to common stock(in millions of Korean won) | ₩ | 1,057,047 | ₩ | 1,446,551 | ||||
Adjusted net income attributable to common stock(in millions of Korean won) | 1,057,047 | 1,446,551 | ||||||
Number of dilutive potential common shares outstanding | 23,851 | 32,960 | ||||||
Weighted-average number of common shares outstanding and dilutive common shares | 243,540,954 | 243,280,611 | ||||||
Diluted earnings per share(in Korean won) | ₩ | 4,340 | ₩ | 5,946 | ||||
93
Table of Contents
KT Corporation and Subsidiaries
Notes to Consolidated Financial Statements
December 31, 2012 and 2011
Diluted earnings per share is calculated by dividing adjusted net income attributable to equity holders of the Company by the sum of the number of common stocks and dilutive potential common stocks. Certain other share-based payments have no dilutive effect and are excluded from the calculation of diluted earnings per share.
| 32. | Dividends |
The dividends paid by the Controlling Company in 2011 and 2012 were ₩586,150 million (₩2,410 per share) and ₩486,602 million (₩2,000 per share), respectively. A dividend in respect of the year ended December 31, 2012, of ₩2,000 per share, amounting to a total dividend of ₩487,445 million, was approved at the shareholders’ meeting on March 15, 2013. These consolidated financial statements do not reflect this dividend payable.
| 33. | Cash Generated from Operations |
Cash flows from operating activities for the years ended December 31, 2012 and 2011 are as follows:
| (in millions of Korean won) | 2012 | 2011 | ||||||
1. Profit for the year | ₩ | 1,111,450 | ₩ | 1,452,019 | ||||
2. Adjustments to reconcile net income | ||||||||
Income tax expenses | 279,518 | 315,946 | ||||||
Interest income | (387,003 | ) | (325,028 | ) | ||||
Interest expense | 589,301 | 588,366 | ||||||
Depreciation | 2,918,983 | 2,671,858 | ||||||
Amortization of intangible assets | 388,563 | 319,875 | ||||||
Provision for severance benefits | 218,255 | 250,576 | ||||||
Bad debt expenses | 150,544 | 168,096 | ||||||
Income or losses from jointly controlled entities and associates | (27,244 | ) | 473 | |||||
Gain or loss on disposal of jointly controlled entities and associates | (125,754 | ) | (190,631 | ) | ||||
Impairment loss on jointly controlled entities and associates | 3,202 | 5,107 | ||||||
Gain or loss on disposal of property and equipment | (407,314 | ) | (287,928 | ) | ||||
Foreign currency translation gain(loss) | (259,254 | ) | 79,189 | |||||
Gain or loss on valuation of derivatives | 246,692 | (28,146 | ) | |||||
Recognition of deferred revenue | (151,853 | ) | (168,071 | ) | ||||
Others | 35,996 | 20,926 | ||||||
3. Changes in operating assets and liabilities | ||||||||
Decrease(increase) in trade receivables | 1,839,725 | (1,412,493 | ) | |||||
Decrease(increase) in other receivables | (528,187 | ) | 879,746 | |||||
Decrease(increase) in loans receivables | 47,990 | (152,497 | ) | |||||
Decrease(increase) in finance lease receivables | 131,012 | (183,669 | ) | |||||
Increase in other assets | (86,957 | ) | (79,175 | ) | ||||
Decrease(increase) in inventories | (287,579 | ) | 32,113 | |||||
Increase in trade payables | 177,577 | 98,761 | ||||||
Increase(decrease) in other payables | 961,495 | (1,077,806 | ) | |||||
Increase(decrease) in other liabilities | (194,033 | ) | 62,579 | |||||
Increase(decrease) in provisions | (86,901 | ) | 29,365 | |||||
Increase in deferred revenue | 153,038 | 196,507 | ||||||
Payment of severance benefits | (276,590 | ) | (361,021 | ) | ||||
|
|
|
| |||||
4. Net cash provided by operating activities (1+2+3) | ₩ | 6,434,672 | ₩ | 2,905,037 | ||||
|
|
|
| |||||
94
Table of Contents
The Company entered into agreements with securitization specialty companies and disposed of its trade receivables related to handset sales (Note 19). Cash flows from the disposals are presented as cash generated from operations.
Significant transactions not affecting cash flows for the years ended December 31, 2012 and 2011, are as follows:
| (in millions of Korean won) | 2012 | 2011 | ||||||
Reclassification of the current portion of bonds payable | ₩ | 1,893,777 | ₩ | 1,080,549 | ||||
Reclassification of construction-in-progress to property and equipment | 3,001,026 | 3,165,808 | ||||||
Reclassification of provision | 183,806 | — | ||||||
95
Table of Contents
KT Corporation and Subsidiaries
Notes to Consolidated Financial Statements
December 31, 2012 and 2011
| 34. | Segment Information |
The Company’s operating segments are as follows:
Details | Business service | |
| Telecom & Convergence Customer Group | Telecommunication service to mass customers and convergence business | |
| Global & Enterprise Group | Telecommunication service to global market and enterprise customers and data service | |
| Finance / Rental Business Group | Credit card, loan, lease and others | |
| Others | Security service, and others |
Details of each segment for the years ended December 31, 2012 and 2011, are as follows:
| 2012 | ||||||||||||
| (in millions of Korean won) | Operating revenues | Operating income(loss) | Depreciation and Amortization | |||||||||
Telecom & Convergence/Customer | ₩ | 14,145,590 | ₩ | 442,074 | ₩ | 2,220,725 | ||||||
Global & Enterprise | 5,365,215 | 994,575 | 704,880 | |||||||||
Finance/Rental | 3,717,180 | 185,220 | 181,904 | |||||||||
Others | 4,671,796 | 74,711 | 151,499 | |||||||||
|
|
|
|
|
| |||||||
| 27,899,781 | 1,696,580 | 3,259,008 | ||||||||||
Elimination1 | (4,109,422 | ) | (482,700 | ) | 8,783 | |||||||
|
|
|
|
|
| |||||||
Consolidated amount | ₩ | 23,790,359 | ₩ | 1,213,880 | ₩ | 3,267,791 | ||||||
|
|
|
|
|
| |||||||
| 2011 | ||||||||||||
| (in millions of Korean won) | Operating revenues | Operating income(loss) | Depreciation and Amortization | |||||||||
Telecom & Convergence/Customer | ₩ | 14,580,205 | ₩ | 736,905 | ₩ | 2,104,118 | ||||||
Global & Enterprise | 5,586,612 | 1,289,020 | 733,643 | |||||||||
Finance/Rental | 1,010,502 | 36,937 | 16,988 | |||||||||
Others | 4,091,073 | 107,773 | 116,847 | |||||||||
|
|
|
|
|
| |||||||
| 25,268,392 | 2,170,635 | 2,971,596 | ||||||||||
Elimination1 | (3,996,359 | ) | (422,226 | ) | (15,849 | ) | ||||||
|
|
|
|
|
| |||||||
Consolidated amount | ₩ | 21,272,033 | ₩ | 1,748,409 | ₩ | 2,955,747 | ||||||
|
|
|
|
|
| |||||||
| 1 | These include the consolidation adjustments and adjustments for other income and expenses which are included in the operating revenue and operating income reported to the management. |
96
Table of Contents
KT Corporation and Subsidiaries
Notes to Consolidated Financial Statements
December 31, 2012 and 2011
The regional segment information provided to the management for the reportable segments as of December 31, 2012 and 2011, and for the years ended December 31, 2012 and 2011, are as follows:
| (in millions of Korean won) | Operating revenues | Non-current assets1 | ||||||||||||||
| Location | 2012 | 2011 | 2012.12.31 | 2011.12.31 | ||||||||||||
Domestic | ₩ | 23,755,832 | ₩ | 21,216,966 | ₩ | 19,462,674 | ₩ | 17,325,954 | ||||||||
Overseas | 34,527 | 55,067 | 41,525 | 49,936 | ||||||||||||
|
|
|
|
|
|
|
| |||||||||
Total | ₩ | 23,790,359 | ₩ | 21,272,033 | ₩ | 19,504,199 | ₩ | 17,375,890 | ||||||||
|
|
|
|
|
|
|
| |||||||||
| 1 | Non-current assets include fixed assets, intangible assets (excluding goodwill) and investment property. |
Assets and liabilities of each segments as of December 2011 and 2012, are as follows:
| 2012 | ||||||||||||||||||||
| (in millions of Korean won) | Non-finance | Finance /Rental | Total | Adjustment | Consolidated amount | |||||||||||||||
Assets | ||||||||||||||||||||
Current | ₩ | 7,928,347 | ₩ | 3,363,384 | ₩ | 11,291,731 | ₩ | (808,886 | ) | ₩ | 10,482,845 | |||||||||
Trade and other receivables | 4,770,573 | 1,620,451 | 6,391,024 | (513,501 | ) | 5,877,523 | ||||||||||||||
Short-term loans | — | 777,095 | 777,095 | (108,982 | ) | 668,113 | ||||||||||||||
Inventories | 933,217 | 30,434 | 963,651 | (28,781 | ) | 934,870 | ||||||||||||||
Other assets | 2,224,557 | 935,404 | 3,159,961 | (157,622 | ) | 3,002,339 | ||||||||||||||
Non-current | 23,236,905 | 3,389,522 | 26,626,427 | (2,629,773 | ) | 23,996,654 | ||||||||||||||
Trade and other receivables | 1,049,004 | 51,075 | 1,100,079 | (28,963 | ) | 1,071,116 | ||||||||||||||
Short-term loans | — | 520,604 | 520,604 | (8,017 | ) | 512,587 | ||||||||||||||
Property, equipment and intangible assets (including investment property) | 17,968,132 | 1,518,492 | 19,486,624 | 615,602 | 20,102,226 | |||||||||||||||
Other assets | 4,219,769 | 1,299,351 | 5,519,120 | (3,208,395 | ) | 2,310,725 | ||||||||||||||
|
|
|
|
|
|
|
|
|
| |||||||||||
Total assets | ₩ | 31,165,252 | ₩ | 6,752,906 | ₩ | 37,918,158 | ₩ | (3,438,659 | ) | ₩ | 34,479,499 | |||||||||
|
|
|
|
|
|
|
|
|
| |||||||||||
Liabilities | ||||||||||||||||||||
Current | ₩ | 8,636,281 | ₩ | 3,324,814 | ₩ | 11,961,095 | ₩ | (713,781 | ) | ₩ | 11,247,314 | |||||||||
Trade and other payables | 5,768,899 | 2,064,282 | 7,833,181 | (616,877 | ) | 7,216,304 | ||||||||||||||
Borrowings | 2,061,754 | 1,123,754 | 3,185,508 | 1,135 | 3,186,643 | |||||||||||||||
Other liabilities | 805,628 | 136,778 | 942,406 | (98,039 | ) | 844,367 | ||||||||||||||
Non-current | 7,686,406 | 2,621,157 | 10,307,563 | (239,890 | ) | 10,067,673 | ||||||||||||||
Trade and other payables | 547,830 | 168,589 | 716,419 | (15,059 | ) | 701,360 | ||||||||||||||
Borrowings | 6,008,152 | 2,274,466 | 8,282,618 | (45,884 | ) | 8,236,734 | ||||||||||||||
Other liabilities | 1,130,424 | 178,102 | 1,308,526 | (178,947 | ) | 1,129,579 | ||||||||||||||
|
|
|
|
|
|
|
|
|
| |||||||||||
Total liabilities | ₩ | 16,322,687 | ₩ | 5,945,971 | ₩ | 22,268,658 | ₩ | (953,671 | ) | ₩ | 21,314,987 | |||||||||
|
|
|
|
|
|
|
|
|
| |||||||||||
97
Table of Contents
KT Corporation and Subsidiaries
Notes to Consolidated Financial Statements
December 31, 2012 and 2011
| 2011 | ||||||||||||||||||||
| (in millions of Korean won) | Non-finance | Finance /Rental | Total | Adjustment | Consolidated amount | |||||||||||||||
Assets | ||||||||||||||||||||
Current | ₩ | 7,881,779 | ₩ | 2,528,026 | ₩ | 10,409,805 | ₩ | (619,146 | ) | ₩ | 9,790,659 | |||||||||
Trade and other receivables | 5,578,384 | 1,018,734 | 6,597,118 | (438,204 | ) | 6,158,914 | ||||||||||||||
Short-term loans | — | 774,737 | 774,737 | (76,707 | ) | 698,030 | ||||||||||||||
Inventories | 674,819 | 18,834 | 693,653 | (18,926 | ) | 674,727 | ||||||||||||||
Other assets | 1,628,576 | 715,721 | 2,344,297 | (85,309 | ) | 2,258,988 | ||||||||||||||
Non-current | 21,107,577 | 1,926,449 | 23,034,026 | (739,276 | ) | 22,294,750 | ||||||||||||||
Trade and other receivables | 1,725,299 | 17,307 | 1,742,606 | (19,191 | ) | 1,723,415 | ||||||||||||||
Short-term loans | — | 505,508 | 505,508 | (14,207 | ) | 491,301 | ||||||||||||||
Property, equipment and intangible assets (including investment property) | 16,908,299 | 426,605 | 17,334,904 | 490,381 | 17,825,285 | |||||||||||||||
Other assets | 2,473,979 | 977,029 | 3,451,008 | (1,196,259 | ) | 2,254,749 | ||||||||||||||
|
|
|
|
|
|
|
|
|
| |||||||||||
Total assets | ₩ | 28,989,356 | ₩ | 4,454,475 | ₩ | 33,443,831 | ₩ | (1,358,422 | ) | ₩ | 32,085,409 | |||||||||
|
|
|
|
|
|
|
|
|
| |||||||||||
Liabilities | ||||||||||||||||||||
Current | ₩ | 7,216,398 | ₩ | 2,104,464 | ₩ | 9,320,862 | ₩ | (575,737 | ) | ₩ | 8,745,125 | |||||||||
Trade and other payables | 5,073,663 | 1,346,855 | 6,420,518 | (530,093 | ) | 5,890,425 | ||||||||||||||
Borrowings | 1,424,182 | 669,361 | 2,093,543 | 18,895 | 2,112,438 | |||||||||||||||
Other liabilities | 718,553 | 88,248 | 806,801 | (64,539 | ) | 742,262 | ||||||||||||||
Non-current | 8,957,066 | 1,938,607 | 10,895,673 | (93,198 | ) | 10,802,475 | ||||||||||||||
Trade and other payables | 492,446 | 159,655 | 652,101 | (388 | ) | 651,713 | ||||||||||||||
Borrowings | 7,559,451 | 1,358,663 | 8,918,114 | (32,000 | ) | 8,886,114 | ||||||||||||||
Other liabilities | 905,169 | 420,289 | 1,325,458 | (60,810 | ) | 1,264,648 | ||||||||||||||
|
|
|
|
|
|
|
|
|
| |||||||||||
Total liabilities | ₩ | 16,173,464 | ₩ | 4,043,071 | ₩ | 20,216,535 | ₩ | (668,935 | ) | ₩ | 19,547,600 | |||||||||
|
|
|
|
|
|
|
|
|
| |||||||||||
98
Table of Contents
KT Corporation and Subsidiaries
Notes to Consolidated Financial Statements
December 31, 2012 and 2011
| 35. | Related Party Transactions |
The list of subsidiaries of the Company as of December 31, 2012, is described in Note 1.
The related receivables and payables as of December 31, 2012 and 2011, are as follows:
| (in millions of Korean won) | 2012 | 2011 | ||||||||||||||
| Receivables | Payables | Receivables | Payables | |||||||||||||
Associates | ₩ | 102,023 | ₩ | 304,299 | ₩ | 96,638 | ₩ | 344,298 | ||||||||
Joint Ventures | — | — | 2,321 | 154,523 | ||||||||||||
|
|
|
|
|
|
|
| |||||||||
Total | ₩ | 102,023 | ₩ | 304,299 | ₩ | 98,959 | ₩ | 498,821 | ||||||||
|
|
|
|
|
|
|
| |||||||||
Significant transactions with related parties for the years ended December 31, 2012 and 2011, are as follows:
| (in millions of Korean won) | 2012 | 2011 | ||||||||||||||
| Operating revenue | Operating Expenses | Operating revenue | Operating Expenses | |||||||||||||
Associates | ₩ | 111,341 | ₩ | 857,506 | ₩ | 76,419 | ₩ | 870,681 | ||||||||
Joint Ventures | 10,486 | 32,647 | 13,531 | 55,787 | ||||||||||||
|
|
|
|
|
|
|
| |||||||||
Total | ₩ | 121,827 | ₩ | 890,153 | ₩ | 89,950 | ₩ | 926,468 | ||||||||
|
|
|
|
|
|
|
| |||||||||
Key management compensation for the years ended December 31, 2012 and 2011, consists of:
| (in millions of Korean won) | 2012 | 2011 | ||||||
Salaries and other short-term benefits | ₩ | 3,166 | ₩ | 3,153 | ||||
Provision for severance benefits | 274 | 270 | ||||||
Stock-based compensation | 1,078 | 1,990 | ||||||
|
|
|
| |||||
Total | ₩ | 4,518 | ₩ | 5,413 | ||||
|
|
|
| |||||
99
Table of Contents
KT Corporation and Subsidiaries
Notes to Consolidated Financial Statements
December 31, 2012 and 2011
| 36. | Financial risk management |
(1) Financial risk factors
The Company’s activities expose itself to a variety of financial risks such as changes in foreign exchange rates, interest rates and market prices arising from future commercial transactions and recognized assets and liabilities. The Company’s financial risk management is focused on controlling these risks in its operating and financing activities. The Company uses derivatives to hedge certain financial risk exposures such as fair value risk and cash flow risk.
The Company’s financial policy is set up in the long-term perspective and annually reported to the Board of Directors. The financial risk management is carried out by the Value Management Office, which identifies, evaluates and hedges financial risks. The treasury department in the Value Management Office considers various market conditions to estimate the effect from the market changes.
1) Market risk
The Company’s market risk management focuses on controlling the extent of exposure to the risk in order to minimize revenue volatility. Market risk is a risk that decreases value or profit of the Company’s portfolio due to changes in market interest rate, foreign exchange rate and other factors.
(i) Sensitivity analysis
Sensitivity analysis is performed for each type of market risk to which the Company is exposed. Reasonably possible changes in the relevant risk variable such as prevailing market interest rates, currency rates, equity prices or commodity prices are estimated and if the rate of change in the underlying risk variable is stable, the Company does not alter the chosen reasonably possible change in the risk variable. The reasonably possible change does not include remote or ‘worst case’ scenarios or ‘stress tests’.
(ii) Foreign exchange risk
The Company is exposed to foreign exchange risk arising from operating, investing and financing activities. Foreign exchange risk is managed within the range of the possible effect on the Company’s cash flows. Foreign exchange risk unaffecting the Company’s cash flows is not hedged but can be hedged at a particular situation.
100
Table of Contents
KT Corporation and Subsidiaries
Notes to Consolidated Financial Statements
December 31, 2012 and 2011
As of December 31, 2012 and 2011, if the foreign exchange rate had strengthened/weakened by 10% with all other variables held constant, the effects on profit before income tax and shareholders’ equity would have been as follows:
| (in millions of Korean won) | Fluctuation of foreign exchange rate | Income before tax | Shareholders’ equity | |||||||
2012.12.31 | +10% | ₩ | (65,189 | ) | ₩ | (52,646 | ) | |||
| –10% | 65,189 | 52,646 | ||||||||
2011.12.31 | +10% | ₩ | (57,174 | ) | ₩ | (50,471 | ) | |||
| –10% | 57,174 | 50,471 | ||||||||
The above analysis is a simple sensitivity analysis which assumes that all the variables other than foreign exchange rates are held constant. Therefore, the analysis does not reflect any correlation between foreign exchange rates and other variables, nor the management’s decision to decrease the risk.
Details of foreign assets and liabilities of the Company as of December 31, 2012 and 2011, are as follows:
| (in thousands of foreign currencies) | 2012 | 2011 | ||||||||||||||
| Financial assets | Financial liabilities | Financial assets | Financial liabilities | |||||||||||||
USD | 203,509 | 2,367,298 | 209,742 | 2,299,644 | ||||||||||||
SDR | 494 | 1,130 | 1,160 | 744 | ||||||||||||
JPY | 657,110 | 35,102,765 | 1,080,392 | 35,446,361 | ||||||||||||
GBP | 1 | — | 7 | 108 | ||||||||||||
EUR | 5,395 | 2,614 | 1,239 | 3,357 | ||||||||||||
DZD | 3,770 | — | 18,714 | — | ||||||||||||
CNY | 10,236 | 197 | 14,495 | 700 | ||||||||||||
UZS | 7,920,825 | 38,727,985 | 13,534,203 | 44,788,561 | ||||||||||||
IDR | 347,447 | — | 411,687 | 10,000 | ||||||||||||
(iii) Price risk
As of December 31, 2012 and 2011, the Company is exposed to equity securities price risk because the securities held by the Company are traded in active markets. If the market prices had increased/decreased by 10% with all other variables held constant, the effects on profit before income tax and shareholders’ equity would have been as follows:
| (in millions of Korean won) | Fluctuation of price | Income before tax | Shareholders’ equity | |||||||
2012.12.31 | +10% | ₩ | — | ₩ | 4,916 | |||||
| –10% | — | (4,916 | ) | |||||||
2011.12.31 | +10% | ₩ | — | ₩ | 10,118 | |||||
| –10% | — | (10,118 | ) | |||||||
The analysis is based on the assumption that the equity index had increased/decreased by 10% with all other variables held constant and all the Company’s marketable equity instruments had moved according to the historical correlation with the index.
101
Table of Contents
KT Corporation and Subsidiaries
Notes to Consolidated Financial Statements
December 31, 2012 and 2011
(iv) Cash flow and fair value interest rate risk
The Company’s interest rate risk arises from liabilities in foreign currency such as foreign currency bonds payable. Bonds payable in foreign currency issued at variable rates expose the Company to cash flow interest rate risk which is partially offset by swap transactions. Bonds payable and borrowings issued at fixed rates expose the Company to fair value interest rate risk. The Company sets the policy and operates to minimize the uncertainty of the changes in interest rates and financial costs.
As of December 31, 2012 and 2011, if the market interest rate had increased/decreased by 100bp with other variables held constant, the effects on profit before income tax and shareholders’ equity would be as follows:
| (In millions of Korean won) | Fluctuation of interest rate | Income before tax | Shareholders’ equity | |||||||
2012.12.31 | + 100 bp | ₩ | (458 | ) | ₩ | (264 | ) | |||
| – 100 bp | (5,204 | ) | (5,465 | ) | ||||||
2011.12.31 | + 100 bp | (1,488 | ) | (345 | ) | |||||
| – 100 bp | (13,108 | ) | (14,445 | ) | ||||||
The above analysis is a simple sensitivity analysis which assumes that all the variables other than market interest rates are held constant. Therefore, the analysis does not reflect any correlation between market interest rates and other variables, nor the management’s decision to decrease the risk.
2) Credit risk
Credit risk is managed on the Company basis with the purpose of minimizing financial loss. Credit risk arises from the normal transactions and investing activities, where clients or other party fails to discharge an obligation on contract conditions. To manage credit risk, the Company considers the counterparty’s credit based on the counterparty’s financial conditions, default history and other important factors.
Credit risk arises from cash and cash equivalents, derivative financial instruments and deposits with banks and financial institutions, as well as outstanding receivables. To minimize such risk, only the financial institutions with strong credit ratings are accepted.
102
Table of Contents
KT Corporation and Subsidiaries
Notes to Consolidated Financial Statements
December 31, 2012 and 2011
As of December 31, 2012 and 2011, maximum exposure to credit risk that are not considered of value of collateral held regarding financial instrument are as follows.
| (In millions of Korean won) | 2012 | 2011 | ||||||
Cash equivalents(except cash on hand) | ₩ | 2,030,242 | ₩ | 1,433,839 | ||||
Trade and other receivables1 | 6,948,639 | 7,882,329 | ||||||
Loans receivable | 1,180,700 | 1,189,331 | ||||||
Finance lease receivables | 861,680 | 736,660 | ||||||
Other financial assets | ||||||||
Financial assets at fair value through the profit or loss | 6,407 | 51,990 | ||||||
Derivative used for hedging | 21,348 | 113,831 | ||||||
Financial instrument | 459,792 | 288,241 | ||||||
Available-for-sale financial assets | 10,953 | 25,829 | ||||||
Held-to-maturity financial assets | 8 | 7 | ||||||
Financial guarantee contracts2 | 213,947 | 57,369 | ||||||
Performance guarantee contracts2 | 14,490 | 910 | ||||||
|
|
|
| |||||
Total | ₩ | 11,748,206 | ₩ | 11,780,336 | ||||
|
|
|
| |||||
| 1 | As of December 31, 2012, the Company is provided with a payment guarantee of ₩892,106 million from Seoul Guarantee Insurance related to the sale of certain accounts receivable arising from the handset sales. |
| 2 | Total amounts guaranteed by the Company according to the guarantee contracts |
3) Liquidity risk
The Company manages its liquidity risk by liquidity strategy and plans. The Company considers the maturity of financial assets and financial liabilities and the estimated cash flows from operations.
The table below analyzes the Company’s liabilities into relevant maturity groups based on the remaining period at the date of the end of each reporting period to the contractual maturity date. These amounts are contractual undiscounted cash flows.
| 2012.12.31 | ||||||||||||||||
| (in millions of Korean won) | Less than 1 year | 1-5 years | More than 5 years | Total | ||||||||||||
Trade and other payables | ₩ | 7,247,955 | ₩ | 686,700 | ₩ | 104,857 | ₩ | 8,039,512 | ||||||||
Finance lease payables | 15,826 | 29,474 | — | 45,300 | ||||||||||||
Borrowings(including bond payables) | 3,620,910 | 7,575,906 | 1,878,606 | 13,075,422 | ||||||||||||
Other non-derivative financial liabilities | — | 80,752 | — | 80,752 | ||||||||||||
Financial guarantee contracts1 | 213,947 | — | — | 213,947 | ||||||||||||
Performance guarantee contracts1 | 14,490 | — | — | 14,490 | ||||||||||||
|
|
|
|
|
|
|
| |||||||||
Total | ₩ | 11,113,128 | ₩ | 8,372,832 | ₩ | 1,983,463 | ₩ | 21,469,423 | ||||||||
|
|
|
|
|
|
|
| |||||||||
103
Table of Contents
KT Corporation and Subsidiaries
Notes to Consolidated Financial Statements
December 31, 2012 and 2011
| 2011.12.31 | ||||||||||||||||
| (in millions of Korean won) | Less than 1 year | 1-5 years | More than 5 years | Total | ||||||||||||
Trade and other payables | ₩ | 5,902,031 | ₩ | 662,505 | ₩ | 23,487 | ₩ | 6,588,023 | ||||||||
Finance lease payables | 66,635 | 116,627 | — | 183,262 | ||||||||||||
Borrowings(including bond payables) | 2,546,855 | 8,144,611 | 2,139,458 | 12,830,924 | ||||||||||||
Other non-derivative financial liabilities | — | 331,170 | — | 331,170 | ||||||||||||
Financial guarantee contracts1 | 57,369 | — | — | 57,369 | ||||||||||||
Performance guarantee contracts1 | 910 | — | — | 910 | ||||||||||||
|
|
|
|
|
|
|
| |||||||||
Total | ₩ | 8,573,800 | ₩ | 9,254,913 | ₩ | 2,162,945 | ₩ | 19,991,658 | ||||||||
|
|
|
|
|
|
|
| |||||||||
| 1 | Total amount guaranteed by the Company according to guarantee contracts. Cash flow from financial guarantee contracts is classified as the maturity group in the earliest period when the financial guarantee contracts can be executed |
Cash outflow and inflow of derivatives settled gross or net are undiscounted contractual cash flow and can differ from the amount in the financial statements.
| 2012.12.31 | ||||||||||||||||
| (in millions of Korean won) | Less than 1 year | 1-5 years | More than 5 years | Total | ||||||||||||
Outflow | ₩ | 1,020,494 | ₩ | 1,507,287 | ₩ | 41,292 | ₩ | 2,569,073 | ||||||||
Inflow | 949,921 | 1,550,822 | 45,093 | 2,545,836 | ||||||||||||
| 2011.12.31 | ||||||||||||||||
| (in millions of Korean won) | Less than 1 year | 1-5 years | More than 5 years | Total | ||||||||||||
Outflow | ₩ | 414,646 | ₩ | 1,949,253 | ₩ | 42,541 | ₩ | 2,406,440 | ||||||||
Inflow | 436,469 | 2,038,288 | 50,053 | 2,524,810 | ||||||||||||
(2) Disclosure of capital management
The Company’s objectives when managing capital are to safeguard the Company’s ability to continue as a going concern in order to provide returns for shareholders and benefits for other shareholders and to maintain an optimal capital structure to reduce the cost of capital.
The Company’s capital structure consists of liabilities including borrowings, cash and cash equivalents, and shareholders’ equity. The treasury department monitors the Company’s capital structure and considers cost of capital and risks related each capital component.
104
Table of Contents
KT Corporation and Subsidiaries
Notes to Consolidated Financial Statements
December 31, 2012 and 2011
The debt-to-equity ratios as of December 31, 2012 and 2011, are as follows:
| (in millions of Korean won) | 2012 | 2011 | ||||||
Total liabilities | ₩ | 21,314,987 | ₩ | 19,547,600 | ||||
Total equity | 13,164,512 | 12,537,809 | ||||||
Debt-to-equity ratio | 162 | % | 156 | % | ||||
The Company manages capital on the basis of the gearing ratio. This ratio is calculated as net debt divided by total capital. Net debt is calculated as total borrowings less cash and cash equivalents. Total capital is calculated as ‘equity’ in the statement of financial position plus net debt.
The gearing ratios as of December 31, 2012 and 2011, are as follows:
| (in millions of Korean won, %) | 2012 | 2011 | ||||||
Total borrowings | ₩ | 11,423,377 | ₩ | 10,998,552 | ||||
Less: cash and cash equivalents | (2,054,696 | ) | (1,445,169 | ) | ||||
Net debt | 9,368,681 | 9,553,383 | ||||||
Total equity | 13,164,512 | 12,537,809 | ||||||
Total capital | 22,533,193 | 22,091,192 | ||||||
Gearing ratio | 42 | % | 43 | % | ||||
(3) Fair value estimation
The table below analyzes financial instruments carried at fair value, by valuation method. The different levels have been defined as follows:
| • | Quoted prices (unadjusted) in active markets for identical assets or liabilities (level 1) |
| • | Inputs other than quoted prices included within level 1 that are observable for the asset or liability, either directly (that is, as prices) or indirectly (that is, derived from prices) (level 2) |
| • | Inputs for the asset or liability that are not based on observable market data (that is, unobservable inputs) (level 3) |
105
Table of Contents
KT Corporation and Subsidiaries
Notes to Consolidated Financial Statements
December 31, 2012 and 2011
The following table presents the Company’s assets and liabilities that are measured at fair value as of December 31, 2012 and 2011:
| 2012 | ||||||||||||||||
| (in millions of Korean won) | Level 1 | Level 2 | Level 3 | Total | ||||||||||||
Assets | ||||||||||||||||
Assets at fair value through the profit and loss | ₩ | — | ₩ | 119 | ₩ | — | ₩ | 119 | ||||||||
Available-for-sale | 49,156 | 35,361 | 201,729 | 286,246 | ||||||||||||
Derivative used for hedging | — | 21,348 | — | 21,348 | ||||||||||||
|
|
|
|
|
|
|
| |||||||||
Total | ₩ | 49,156 | ₩ | 56,828 | ₩ | 201,729 | ₩ | 307,713 | ||||||||
|
|
|
|
|
|
|
| |||||||||
Liabilities | ||||||||||||||||
Liabilities at fair value through the profit and loss | ₩ | — | ₩ | 63 | ₩ | 3,153 | ₩ | 3,216 | ||||||||
Derivative financial liabilities | — | 112,603 | — | 112,603 | ||||||||||||
|
|
|
|
|
|
|
| |||||||||
Total | ₩ | — | ₩ | 112,666 | ₩ | 3,153 | ₩ | 115,819 | ||||||||
|
|
|
|
|
|
|
| |||||||||
| 2011 | ||||||||||||||||
| (in millions of Korean won) | Level 1 | Level 2 | Level 3 | Total | ||||||||||||
Assets | ||||||||||||||||
Assets at fair value through the profit and loss | ₩ | — | ₩ | 51,990 | ₩ | — | ₩ | 51,990 | ||||||||
Available-for-sale | 101,183 | 25,829 | 134,346 | 261,358 | ||||||||||||
Derivative used for hedging | — | 113,831 | — | 113,831 | ||||||||||||
|
|
|
|
|
|
|
| |||||||||
Total | ₩ | 101,183 | ₩ | 191,650 | ₩ | 134,346 | ₩ | 427,179 | ||||||||
|
|
|
|
|
|
|
| |||||||||
Liabilities | ||||||||||||||||
Liabilities at fair value through the profit and loss | ₩ | — | ₩ | 338 | ₩ | — | ₩ | 338 | ||||||||
Derivative financial liabilities | — | 6,210 | 2,258 | 8,468 | ||||||||||||
|
|
|
|
|
|
|
| |||||||||
Total | ₩ | — | ₩ | 6,548 | ₩ | 2,258 | ₩ | 8,806 | ||||||||
|
|
|
|
|
|
|
| |||||||||
The fair value of financial instruments traded in active markets is based on quoted market prices at the date of the end of reporting period. A market is regarded as active if quoted prices are readily and regularly available from an exchange, dealer, broker, an entity within the same industry, pricing service, or regulatory agency, and those represent actual and regularly occurring market transactions on an arm’s length basis. The quoted market price used for financial assets held by the Company is the bid price. These instruments are included in level 1. Instruments included in level 1 comprise listed equity investments classified as available-for-sale.
The fair value of financial instruments that are not traded in an active market (for example, over-the-counter derivatives) is determined by using valuation techniques. These valuation techniques maximize the use of observable market data where it is available and rely as little as possible on entity specific estimates. If all significant inputs required to fair value of an instrument are observable, the instrument is included in level 2.
If one or more of the significant inputs are not based on observable market data, the instrument is included in level 3.
106
Table of Contents
KT Corporation and Subsidiaries
Notes to Consolidated Financial Statements
December 31, 2012 and 2011
The changes of the financial instrument included in Level 3 for the year ended December 31, 2012, are as follows:
| (in millions of Korean won) | Available-for-sale financial assets | Derivative financial liabilities | Financial liability at fair value through profit or loss | |||||||||
Beginning | ₩ | 134,346 | ₩ | 2,258 | ₩ | — | ||||||
Acquisition | 9,677 | — | 3,410 | |||||||||
Disposal | �� | (8,104 | ) | (2,258 | ) | — | ||||||
Total profit | ||||||||||||
Income for the year | (1,122 | ) | — | (257 | ) | |||||||
Other comprehensive income | 33,679 | — | — | |||||||||
Transfer into Level 3 from the cost method | 33,253 | — | — | |||||||||
|
|
|
|
|
| |||||||
Ending | ₩ | 201,729 | ₩ | — | ₩ | 3,153 | ||||||
|
|
|
|
|
| |||||||
The details of equity securities measured at historical cost as of December 31, 2012 and 2011, are as follows:
| (in millions of Korean won) | 2012 | 2011 | ||||||
SBSKTSP | ₩ | 25,000 | ₩ | 25,000 | ||||
IBK-AUCTUS Green Growth Private Equity Fund | 14,319 | 10,340 | ||||||
Ustream INC. | 11,295 | — | ||||||
MBCKTSPC | 11,000 | 11,000 | ||||||
KBSKTSPC | 11,000 | 11,000 | ||||||
Enterprise DB Corp. | 3,013 | 3,013 | ||||||
Others | 67,733 | 99,544 | ||||||
|
|
|
| |||||
Total | ₩ | 143,360 | ₩ | 159,897 | ||||
|
|
|
| |||||
The range of cashflow estimates is significant and the probabilities of the various estimates cannot be reasonably assessed and therefore these instruments are measured at cost.
The Company does not have any plans to dispose of the above-mentioned equities instruments in the near future. These instruments will be measured at fair value when the Company can develop a reliable estimate of the fair value.
107
Table of Contents
KT Corporation and Subsidiaries
Notes to Consolidated Financial Statements
December 31, 2012 and 2011
| 37. | Business Combination |
(1) KT Rental Co., Ltd.
On July, 2012, the restriction on controlling power of the Controlling Company under the shareholders’ agreement between the Controlling Company and KRI was resolved, and KT rental was included in the consolidated subsidiaries. These transactions were accounted for in accordance with Korean IFRS 1103,Business Combinations. As a result of applying acquisition method, the Company recognized goodwill of ₩131,426 million.
Details of the consideration transferred, fair value of the acquired identifiable assets and liabilities and goodwill at the acquisition date are as follows:
| (in millions of Korean won) | ||||
Fair value of existing shares before business combination | ₩ | 305,730 | ||
|
| |||
Consideration transferred (a) | ₩ | 305,730 | ||
|
| |||
Recognized amounts of assets acquired and liabilities assumed1 | ||||
Cash and cash equivalents | ₩ | 23,160 | ||
Trade and other receivables | 120,964 | |||
Loans receivable | 49,805 | |||
Financial lease receivables | 254,264 | |||
Other financial assets | 1,983 | |||
Inventories | 779 | |||
Tangible assets (rental vehicle, others) | 992,516 | |||
Intangible assets (orders on hand, customer relationship, others) | 69,866 | |||
Other assets | 34,031 | |||
Trade and other payables | (195,933 | ) | ||
Borrowings | (985,790 | ) | ||
Current income tax liabilities | (5,138 | ) | ||
Retirement benefit obligation | (4,065 | ) | ||
Deferred income tax liabilities | (9,151 | ) | ||
Other liabilities | (46,759 | ) | ||
|
| |||
The net of total amounts of identifiable assets and liabilities measured at fair value (b) | ₩ | 300,532 | ||
Non-controlling interests2 (c) | 126,228 | |||
|
| |||
Goodwill (a-b+c) | ₩ | 131,426 | ||
|
| |||
| 1 | The assets acquired and liabilities assumed are measured at fair value in accordance with Korean IFRS 1103,Business Combination. |
| 2 | At the date of acquisition, the Company measures any non-controlling interest in KT Rental Co., Ltd. at the non-controlling interest’s proportionate share of the acquiree’s identifiable net assets. |
108
Table of Contents
KT Corporation and Subsidiaries
Notes to Consolidated Financial Statements
December 31, 2012 and 2011
As described in Note 14, the previously held interest in KT Rental Co., Ltd. was measured at fair value, and the Company recognized other income of ₩126,011 million arising from the value measurement on acquisition.
After the acquisition date, the operating revenue and net income for consolidation of KT Rental Co., Ltd. before the elimination of related party transactions with its subsidiaries are ₩368,228 million and ₩11,072 million, respectively. If KT Rental Co., Ltd. was consolidated on January 1, 2012, the operating revenue and net income included in consolidated income statement would have been ₩715,604 million and ₩25,995 million, respectively.
The fair value of trade accounts receivable and others acquired from KT Rental Co., Ltd. is ₩120,964 million, but the full contract value is ₩132,915 million. The uncollectible amounts from these receivables are expected to be ₩11,951 million.
(2) KT Skylife Co., Ltd.
Due to the trend of convergence in the telecommunications and broadcasting market, the Controlling Company needed to obtain control over a broadcasting company to enhance the synergy effects of the resources within the consolidated subsidiaries. On January 27, 2011, the Controlling Company acquired from Dutch Savings Holdings B.V. 5,600,000 of redeemable convertible preferred stock with voting rights and the bonds convertible into 5,600,000 of common stock of KT Skylife Co., Ltd. (formerly “Korea Digital Satellite Broadcasting Co., Ltd.”) for ₩246,400 million, which is engaged in the satellite broadcasting business. Including the potential voting rights, the Controlling Company’s ownership in KT Skylife Co., Ltd. has increased to 53.05% and accordingly, the Controlling Company has control over KT Skylife Co., Ltd. On March 10, 2011, the Controlling Company exercised the conversion right of both redeemable convertible preferred stocks and convertible bonds.
As a result of applying the acquisition method, the Company recognized goodwill of ₩306,303 million, which is the excess of total consideration transferred over the fair value of the net assets at the acquisition date. The fair value of the net assets at the acquisition date includes the identifiable intangible assets such as customer relationship, which was not previously recognized in the subsidiary’s financial statements.
109
Table of Contents
KT Corporation and Subsidiaries
Notes to Consolidated Financial Statements
December 31, 2012 and 2011
Details of the consideration transferred, fair value of the acquired identifiable assets and liabilities, and goodwill at the acquisition date are as follows:
| (in millions of Korean won) | Amounts | |||
Consideration transferred (cash and cash equivalents) | ₩ | 246,400 | ||
The acquisition-date fair value of the acquirer’s previously held equity interest | 280,773 | |||
|
| |||
Total transfer price | ₩ | 527,173 | ||
|
| |||
The recognized amounts of assets acquired and liabilities assumed1 | ||||
Cash and cash equivalents | ₩ | 78,730 | ||
Other financial assets | 88,176 | |||
Trade and other accounts receivable | 140,180 | |||
Inventories | 5,715 | |||
Fixed assets including broadcast equipment and satellite communication facilities | 142,641 | |||
Intangible assets including broadcast license and customer relationship | 305,564 | |||
Investments in associates | 5,716 | |||
Other assets | 36,104 | |||
Trade and other accounts payable | (130,758 | ) | ||
Borrowings | (164,572 | ) | ||
Provisions for severance benefits | (11,256 | ) | ||
Accrued provisions | (919 | ) | ||
Deferred income tax liabilities | (51,171 | ) | ||
Other liabilities | (26,178 | ) | ||
|
| |||
The net of total amounts of identifiable assets and liabilities measured at fair value (b) | ₩ | 417,972 | ||
|
| |||
Non-controlling interests2(c) | 197,102 | |||
|
| |||
Goodwill3(a-b+c) | ₩ | 306,303 | ||
|
| |||
| 1 | The assets acquired and liabilities assumed are measured at fair value in accordance with Korean IFRS 1103,Business Combination. |
| 2 | At the date of acquisition, the Company measures any non-controlling interest in KT Skylife Co., Ltd. at the non-controlling interest’s proportionate share of the acquiree’s identifiable net assets. The amounts include non-controlling interest in Korea HD Broadcasting Corp., the subsidiary of KT Skylife. |
The previously held interest in KT Skylife Co., Ltd. was measured at fair value, and the Company recognized other income of ₩187,458 million arising from the fair value measurement on acquisition.
After the acquisition date, the revenue and net income for consolidation of KT Skylife Co., Ltd. before the elimination of intercompany transactions with its subsidiaries are ₩480,468 and ₩26,649 million, respectively. The difference between its revenue and net income from the acquisition date and the revenue and net income if KT Skylife Co., Ltd. had been consolidated from January 1, 2011, included in consolidation is insignificant.
The fair value of trade accounts receivable and other receivables acquired from KT Skylife Co., Ltd. is ₩140,180 million, while the full contract value is ₩168,693 million. The uncollectible amounts from these receivables are expected to be ₩28,513 million.
110
Table of Contents
KT Corporation and Subsidiaries
Notes to Consolidated Financial Statements
December 31, 2012 and 2011
(3) BC Card Co., Ltd.
KT Capital Co., Ltd., which is a subsidiary of the Controlling Company, acquired common shares with voting right at ₩252,302 million from Woori Bank on October 6, 2011, in order to secure stable management control of BC Card Co., Ltd. and strengthen synergies between the two firms, based on the Board of Directors’ meetings on February 11 and February 23, 2011. By this acquisition, the company’s ownership interests of BC Card Co., Ltd. increased to 38.86%, including ownership which were previously acquired from Citibank. Also, the Company entered into shareholders’ agreement to exercise voting right of 1,349,920 registered common shares of BC Card Co., Ltd. (30.68% of total BC Card Co., Ltd. shares) owned by Vogo-BCC Investment Holdings Co., Ltd. and KGF-BCC LIMITED on March 25, 2011. Based on the shareholders’ agreement and the acquisition of common shares described above, the Company has control of BC Card Co., Ltd. from October 6, 2011(acquisition date).
As a result of applying the acquisition method, the Company recognized goodwill of ₩41,234 million, which is the excess of total consideration transferred over the fair value of the net assets at the acquisition date. The fair value of the net assets at the acquisition date includes the identifiable intangible assets such as customer relationship, which was not previously recognized in the subsidiary’s financial statements.
Details of the consideration transferred, the fair value of the acquired identifiable assets and liabilities, and goodwill at the acquisition date are as follows:
| (in millions of Korean won) | Amounts | |||
Consideration transferred (cash and cash equivalents) | ₩ | 257,137 | ||
Commitment for dividends payable1 | 39,220 | |||
The acquisition-date fair value of the acquirer’s previously held equity interest | 8,712 | |||
|
| |||
Total consideration transferred (a) | ₩ | 305,069 | ||
|
| |||
The recognized amounts of assets acquired and liabilities assumed2 | ||||
Cash and cash equivalents | 657,956 | |||
Other financial assets | 2,046,522 | |||
Trade and other accounts receivable | 1,307 | |||
Fixed assets | 242,411 | |||
Investment properties | 2,845 | |||
Intangible assets including customer relationship | 165,916 | |||
Available-for-sale financial assets | 108,170 | |||
Other assets | 60,942 | |||
Trade and other accounts payable | (1,890,937 | ) | ||
Borrowings | (58,000 | ) | ||
Current tax liabilities | (30,942 | ) | ||
Privisions | (25,674 | ) | ||
Provisions for severance benefits | (7,861 | ) | ||
Deferred income tax liabilities | (46,176 | ) | ||
Other liabilities | (568,028 | ) | ||
|
| |||
The net of total amounts of identifiable assets and liabilities measured at fair value (b) | ₩ | 658,451 | ||
|
| |||
Non-controlling interests3 (c) | 394,616 | |||
|
| |||
Goodwill (a-b+c) | ₩ | 41,234 | ||
|
| |||
111
Table of Contents
KT Corporation and Subsidiaries
Notes to Consolidated Financial Statements
December 31, 2012 and 2011
| 1 | On June 23, 2010, the Korean Commercial Arbitration Board concluded that BC Card should pay the proceeds from the disposal of the shares of Visa Card to the member banks. Accordingly, the Company recorded the related proceeds to be paid to the member banks as other financial liabilities in the financial statements at the acquisition date. |
| 2 | Assets and liabilities acquired were measured at fair value in accordance with Korean IFRS 1103‘Business Combinations’ |
| 3 | Non-controlling interests in the acquiree on acquisition are measured at the non-controlling interests’ proportionate share in the recognized amounts of the acquiree’s identifiable net assets in the event of liquidation. |
After the acquisition date, the revenue and net income for consolidation of BC Card Co,. Ltd. before the elimination of inter-company transactions with its subsidiaries are ₩782,853million and ₩945 million, respectively. If BC Card Co., Ltd. had been consolidated from January 1, 2011, the revenue and net income included in consolidation would have been ₩3,376,113 million and ₩102,459 million, respectively.
| 38. | Assets Held for Sale and Discontinued Operations |
As approved by the Controlling Company’s Board of Directors on August 9, 2012, the Controlling Company decided to sell KT Tech, Inc., its subsidiary, and discontinued the operations related to handset development. The prior period financial statements presented for comparative purposes have been restated in accordance with Korean IFRS 1105,Non-current Assets Held for Sale and Discontinued Operations. Profit or loss arising from net fair value measurement and related income tax effect is reflected in profit or loss from discontinued operations.
As approved by the Controlling Company’s Board of Directors on May 4, 2011, the Controlling Company decided to sell 5,309,189 shares (79.96%) of New Telephone Company, Inc. to Vimpel-Communication and the Controlling Company lost its control of New Telephone Company. Profit or loss arising from net fair value measurement and related income tax effect is reflected in profit or loss from discontinued operations.
112
Table of Contents
KT Corporation and Subsidiaries
Notes to Consolidated Financial Statements
December 31, 2012 and 2011
Income and loss from discontinued operations for the years ended December 31, 2012 and 2011, are as follows:
| (in millions of Korean won) | 2012 | 2011 | ||||||
Revenue | ₩ | 431 | ₩ | 32,281 | ||||
Expense | (35,756 | ) | (31,936 | ) | ||||
Income (loss) from discontinued operations before income taxes | (35,325 | ) | 345 | |||||
Income tax expense for discontinued operations | 3,791 | (2,625 | ) | |||||
Income (loss) from discontinued operations | (31,534 | ) | (2,280 | ) | ||||
Gain on disposal and fair valuation before income taxes | — | 220,176 | ||||||
Income tax expense | — | (53,302 | ) | |||||
Gain on disposal and fair valuation after tax | — | 166,874 | ||||||
Income (loss) from discontinued operations | ₩ | (31,534 | ) | ₩ | 164,594 | |||
Cash flows from discontinued operations for the years ended December 31, 2012 and 2011, are as follows:
| (in millions of Korean won) | 2012 | 2011 | ||||||
Cash flows from operating activities | ₩ | 40,017 | ₩ | (4,325 | ) | |||
Cash flows from investing activities | (3,609 | ) | (16,704 | ) | ||||
Cash flows from financing activities | (28,243 | ) | (24,615 | ) | ||||
Changes in foreign exchange rates | (6 | ) | 8,365 | |||||
|
|
|
| |||||
Total cash flows | ₩ | 8,159 | ₩ | (37,279 | ) | |||
|
|
|
| |||||
| 39. | Satellite Business |
As approved by the Company’s Board of Directors on December 1, 2012, the Company established KT Sat Co., Ltd. (the “Spun-off company”) through the simple vertical spin-off. The plan for this spin-off was approved by the Board of Directors on November 23, 2012.
All the related assets, liabilities, other rights and obligations, and employment and legal contracts are transferred to the new satellite business, and both the Company and the spun-off company are jointly and severally liable for the liabilities transferred to the spun-off company.
Assets and liabilities transferred to the spun-off company amount to ₩402,915 million and ₩12,385 million, respectively.
| 40. | Subsequent Events |
The Controlling Company entered into agreements with Olleh KT Seventh Securitization Specialty Co., Ltd. on February 18, 2013, and disposed of its accounts receivable related to handsets.
113
Table of Contents
KT Corporation and Subsidiaries
Notes to Consolidated Financial Statements
December 31, 2012 and 2011
As approved by the Company’s Board of Directors on December 1, 2012, the Company established KT Media Hub Co., Ltd. (“the New Company”). The Company will transfer its assets and liabilities to the New Company in 2013.
As approved by the Board of Directors and Shareholders of KT Rental, a consolidated subsidiary on December 27, 2012, and December 17, 2012, KT Rental spun-off its vehicle maintenance business.
Subsequent to December 31, 2012, the Company has issued the unsecured public bonds, as follows:
| (in millions of Korean won and thousands of Japanese yen) | Issue date | Face value of bond | Interest rate | Maturity date | Repayment method | |||||||||||||
KT Telecop Co., Ltd. The 1st unsecured private bond | 2013.01.24 | ₩ | 30,000 | 3.43 | % | 2016.01.24 | Lump sum payment at maturity | |||||||||||
2013 Samurai Bond | 2013.01.29 | JPY | 5,000,000 | 0.59 | % | 2015.01.29 | ||||||||||||
2013 Samurai Bond | 2013.01.29 | JPY | 18,200,000 | 0.70 | % | 2016.01.29 | ||||||||||||
2013 Samurai Bond | 2013.01.29 | JPY | 6,800,000 | 0.86 | % | 2018.01.29 | ||||||||||||
114