SECURITIES AND EXCHANGE COMMISSION
Washington, D.C. 20549
Form6-K
REPORT OF FOREIGN PRIVATE ISSUER
PURSUANT TO RULE13a-16 OR15d-16 OF
THE SECURITIES EXCHANGE ACT OF 1934
For the month of August 2013
Commission File Number1-14926
KT Corporation
(Translation of registrant’s name into English)
206 Jeongja-dong
Bundang-gu,Seongnam-si
Gyeonggi-do
463-711
Korea
(Address of principal executive offices)
Indicate by check mark whether the registrant files or will file annual reports under cover of Form20-F or Form40-F:
Form20-F þ Form40-F ¨
Indicate by check mark if the registrant is submitting the Form6-K in paper as permitted by RegulationS-T Rule 101(b)(1): ¨
Indicate by check mark if the registrant is submitting the Form6-K in paper as permitted by RegulationS-T Rule 101(b)(7): ¨
Indicate by check mark whether by furnishing the information contained in this Form, the registrant is also thereby furnishing the information to the Commission pursuant to Rule 12g3-2(b) under the Securities Exchange Act of 1934.
Yes ¨ No þ
If “Yes” is marked, indicate below the file number assigned to the registrant in connection with Rule 12g3-2(b):82-
SIGNATURES
Pursuant to the requirements of the Securities Exchange Act of 1934, the registrant has duly caused this report to be signed on its behalf by the undersigned, thereunto duly authorized.
Dated: August 5, 2013 | ||
KT Corporation | ||
By: | /s/ YOUNGWOO KIM | |
| Name: | Youngwoo Kim | |
| Title: | Vice President | |
By: | /s/ JUNGSUP JUNG | |
| Name: | Jungsup Jung | |
| Title: | Team Leader | |
kt 2Q13
Earnings Release
kt, global ICT convergence leader
Investor Relations 2013. 8. 2 kt
Disclaimer
This presentation has been prepared by KT Corp. (“the Company”). This presentation contains forward-looking statements, which are subject to risks, uncertainties, and assumptions. This presentation is being presented solely for your information and is subject to change without notice. No representation or warranty, expressed or implied, is made and no reliance should be placed on the accuracy, actuality, fairness, or completeness of the information presented.
Please be informed that items included in our operating income have been prepared in accordance with K-IFRS 1001 released on October 17, 2012, which was revised to coincide with the Korean Accounting Standards for Non-Public Entities (“KAS-NPEs”). As such, our disposal gains from real estates and others have been excluded from our operating income.
The Company, its affiliates or representatives accept no liability whatsoever for any losses arising from any information contained in the presentation. This presentation does not constitute an offer or invitation to purchase or subscribe for any shares of the Company, and no part of this presentation shall form the Basis of or be relied upon in connection with any contract or commitment.
Any decision to purchase shares of the Company should be made solely on the Basis of information, which has been publicly filed with the Securities and Exchange Commission or the Korea Stock Exchange and distributed to all investors.
The contents of this presentation may not be reproduced, redistributed or passed on, directly or indirectly, to any other person or published, in whole or in part, for any purpose.
1
Contents
1 Financial Highlights
2 Business Overview
3 Q&A
4 Appendix
2
K-IFRS / Consolidated
1-1 Financial Highlights
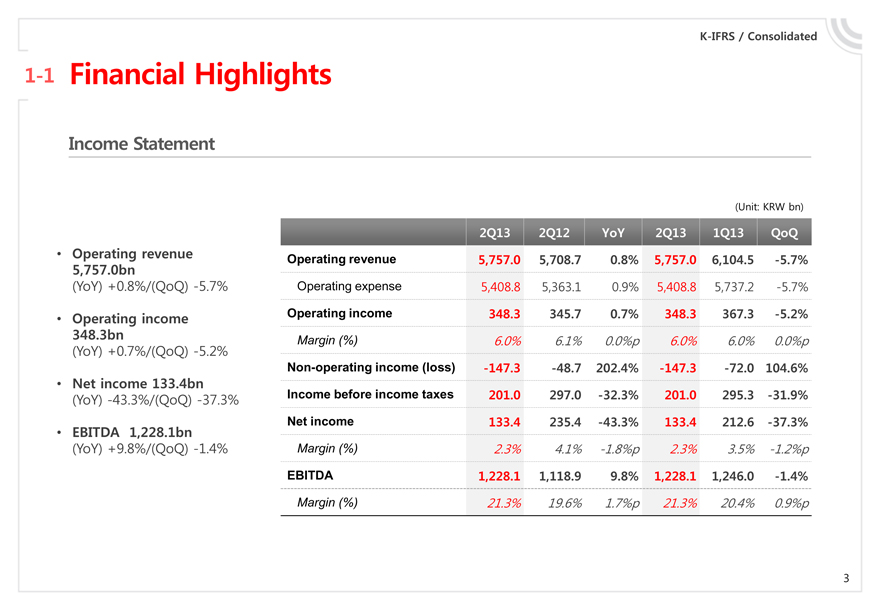
Income Statement
Operating revenue 5,757.0bn
(YoY) +0.8%/(QoQ) -5.7%
Operating income 348.3bn
(YoY) +0.7%/(QoQ) -5.2%
Net income 133.4bn
(YoY) -43.3%/(QoQ) -37.3%
EBITDA 1,228.1bn
(YoY) +9.8%/(QoQ) -1.4%
(Unit: KRW bn) 2Q13 2Q12 YoY 2Q13 1Q13 QoQ
Operating revenue 5,757.0 5,708.7 0.8% 5,757.0 6,104.5 -5.7%
Operating expense 5,408.8 5,363.1 0.9% 5,408.8 5,737.2 -5.7%
Operating income 348.3 345.7 0.7% 348.3 367.3 -5.2%
Margin (%) 6.0% 6.1% 0.0%p 6.0% 6.0% 0.0%p
Non-operating income (loss) -147.3 -48.7 202.4% -147.3 -72.0 104.6%
Income before income taxes 201.0 297.0 -32.3% 201.0 295.3 -31.9%
Net income 133.4 235.4 -43.3% 133.4 212.6 -37.3%
Margin (%) 2.3% 4.1% -1.8%p 2.3% 3.5% -1.2%p
EBITDA 1,228.1 1,118.9 9.8% 1,228.1 1,246.0 -1.4%
Margin (%) 21.3 19.6% 1.7%p 21.3% 20.4% 0.9%p
3
K-IFRS / Consolidated
1-2 Financial Highlights
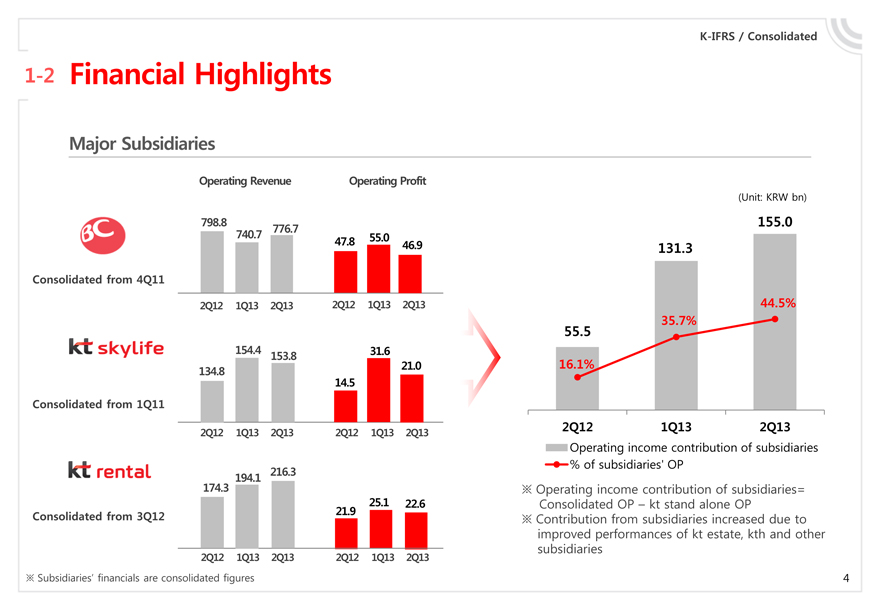
Major Subsidiaries
Consolidated from 4Q11
Operating Revenue
Operating Profit
798.8 740.7 776.7 47.8 55.0 46.9
2Q12 1Q13 2Q13
2Q12 1Q13 2Q13
Consolidated from 1Q11
134.8 154.4 153.8 14.5 31.6 21.0
2Q12 1Q13 2Q13
2Q12 1Q13 2Q13
Consolidated from 3Q12
174.3 194.1 216.3 21.9 25.1 22.6
2Q12 1Q13 2Q13
2Q12 1Q13 2Q13
(Unit: KRW bn)
55.5 131.3 155.0
44.5% 35.7% 16.1%
2Q12 1Q13 2Q13
Operating income contribution of subsidiaries
% of subsidiaries’ OP
Operating income contribution of subsidiaries=
Consolidated OP – kt stand alone OP
Contribution from subsidiaries increased due to improved performances of kt estate, kth and other subsidiaries
Subsidiaries’ financials are consolidated figures
4
K-IFRS / Consolidated
1-3 Financial Highlights
Operating Revenue
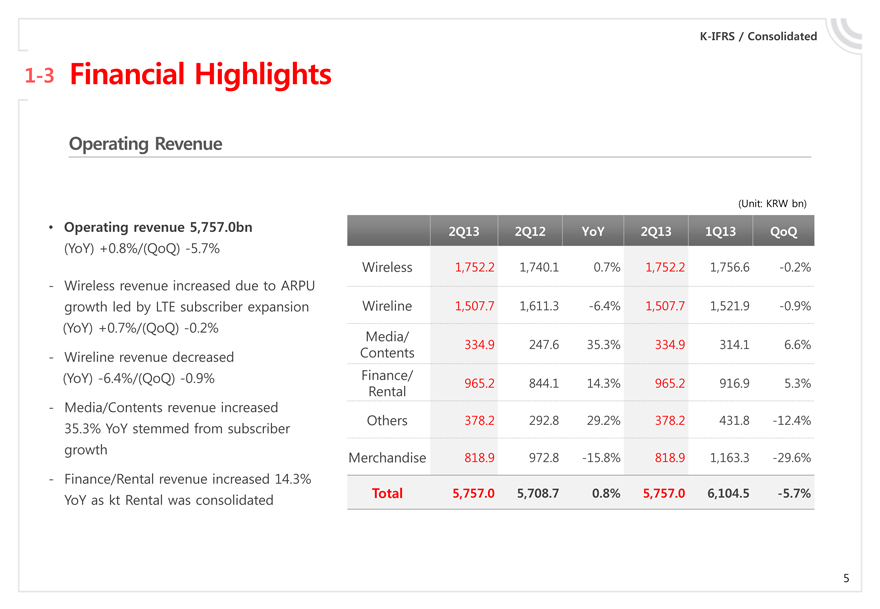
• Operating revenue 5,757.0bn
(YoY) +0.8%/(QoQ) -5.7%
- Wireless revenue increased due to ARPU growth led by LTE subscriber expansion (YoY) +0.7%/(QoQ) -0.2%
- Wireline revenue decreased (YoY) -6.4%/(QoQ) -0.9%
- Media/Contents revenue increased
35.3% YoY stemmed from subscriber growth
- Finance/Rental revenue increased 14.3% YoY as kt Rental was consolidated
(Unit: KRW bn)
2Q13 2Q12 YoY 2Q13 1Q13 QoQ
Wireless 1,752.2 1,740.1 0.7% 1,752.2 1,756.6 -0.2%
Wireline 1,507.7 1,611.3 -6.4% 1,507.7 1,521.9 -0.9%
Media/Contents 334.9 247.6 35.3% 334.9 314.1 6.6%
Finance/Rental 965.2 844.1 14.3% 965.2 916.9 5.3%
Others 378.2 292.8 29.2% 378.2 431.8 -12.4%
Merchandise 818.9 972.8 -15.8% 818.9 1,163.3 -29.6%
Total 5,757.0 5,708.7 0.8% 5,757.0 6,104.5 -5.7%
5
K-IFRS / Consolidated
1-4 Financial Highlights
Operating Expenses
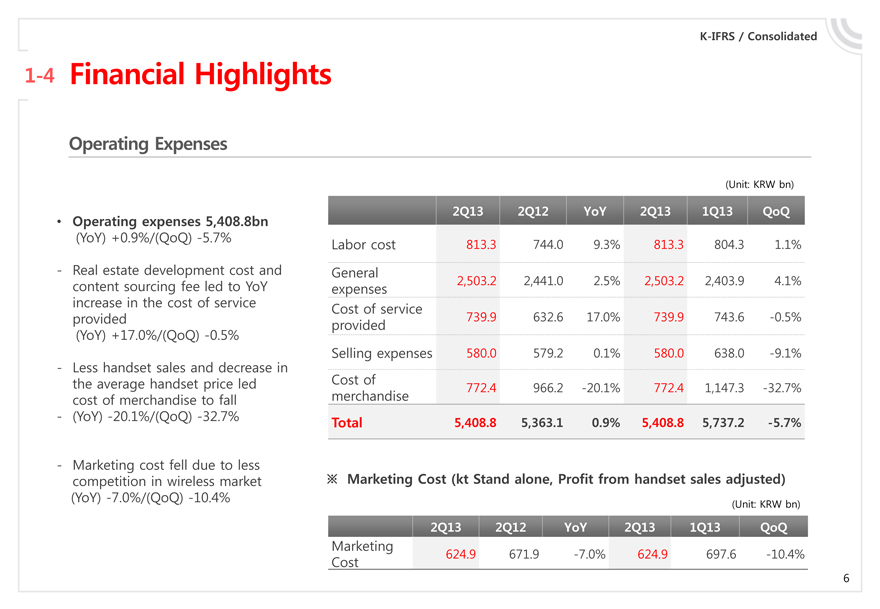
‰ Operating expenses 5,408.8bn (YoY) +0.9%/(QoQ) -5.7%
- Real estate development cost and content sourcing fee led to YoY increase in the cost of service provided (YoY) +17.0%/(QoQ) -0.5%
- Less handset sales and decrease in the average handset price led cost of merchandise to fall
- (YoY) -20.1%/(QoQ) -32.7%
- Marketing cost fell due to less competition in wireless market (YoY) -7.0%/(QoQ) -10.4%
(Unit: KRW bn)
2Q13 2Q12 YoY 2Q13 1Q13 QoQ
Labor cost 813.3 744.0 9.3% 813.3 804.3 1.1%
General expenses 2,503.2 2,441.0 2.5% 2,503.2 2,403.9 4.1%
Cost of service provided 739.9 632.6 17.0% 739.9 743.6 -0.5%
Selling expenses 580.0 579.2 0.1% 580.0 638.0 -9.1%
Cost of merchandise 772.4 966.2 -20.1% 772.4 1,147.3 -32.7%
Total 5,408.8 5,363.1 0.9% 5,408.8 5,737.2 -5.7%
Marketing Cost (kt Stand alone, Profit from handset sales adjusted)
(Unit: KRW bn)
2Q13 2Q12 YoY 2Q13 1Q13 QoQ
Marketing Cost
624.9 671.9 -7.0% 624.9 697.6 -10.4%
6
K-IFRS / Consolidated
1-5 Financial Highlights
Financial Position
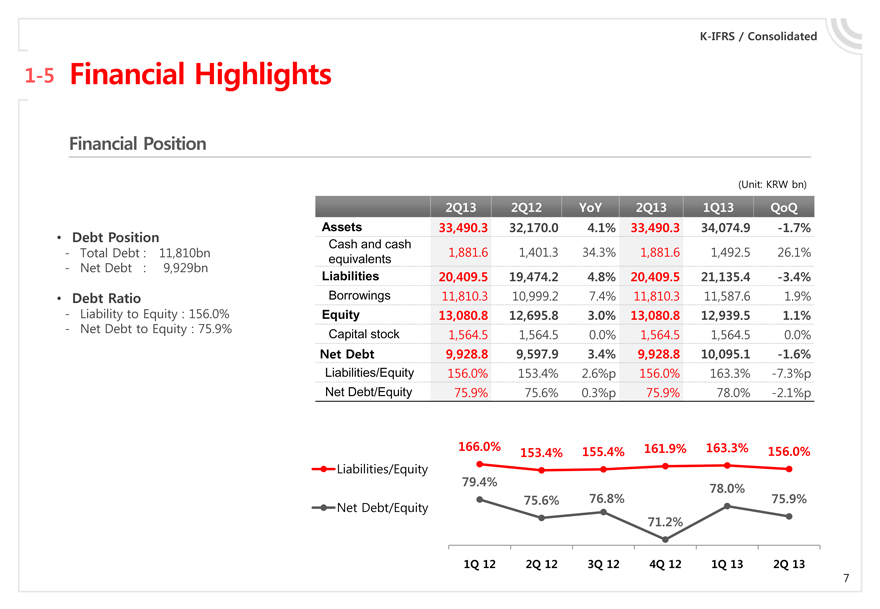
‰ Debt Position
- Total Debt : 11,810bn
- Net Debt : 9,929bn
‰ Debt Ratio
- Liability to Equity : 156.0%
- Net Debt to Equity : 75.9%
(Unit: KRW bn)
2Q13 2Q12 YoY 2Q13 1Q13 QoQ
Assets 33,490.3 32,170.0 4.1% 33,490.3 34,074.9 -1.7%
Cash and cash 1,881.6 1,401.3 34.3% 1,881.6 1,492.5 26.1%
equivalents
Liabilities 20,409.5 19,474.2 4.8% 20,409.5 21,135.4 -3.4%
Borrowings 11,810.3 10,999.2 7.4% 11,810.3 11,587.6 1.9%
Equity 13,080.8 12,695.8 3.0% 13,080.8 12,939.5 1.1%
Capital stock 1,564.5 1,564.5 0.0% 1,564.5 1,564.5 0.0%
Net Debt 9,928.8 9,597.9 3.4% 9,928.8 10,095.1 -1.6%
Liabilities/Equity 156.0% 153.4% 2.6%p 156.0% 163.3% -7.3%p
Net Debt/Equity 75.9% 75.6% 0.3%p 75.9% 78.0% -2.1%p
166.0% 153.4% 155.4% 161.9% 163.3% 156.0%
Liabilities/Equity 79.4% 78.0%
Net Debt/Equity 75.6% 76.8% 75.9% 71.2%
1Q 12 2Q 12 3Q 12 4Q 12 1Q 13 2Q 13
7

K-IFRS / kt Stand Alone
1-6 Financial Highlights
CAPEX
‰ Total Capex
- 2Q13 : 603.7bn
(YoY) -39.5%/(QoQ) 15.9%
- FY2013 Guidance : KRW 3.5 tn
‰ Wireline Capex
- 2Q13 : 228.1 bn
- FY 2013 Guidance : KRW 1.2 tn
‰ Wireless CAPEX
- 2Q13 : 182.2bn
- FY 2013 Guidance : KRW 1.6 tn
Overhead
Wireless
Wireline
998.5
149.6
560.4
288.5
2Q 12
521.1
136.0
247.1
138.0
1Q 13
(Unit: KRW bn)
603.7
193.4
182.2
228.1
2Q 13
8
1 Financial Highlights
2 Business Overview
3 Q&A
4 Appendix
9
K-IFRS / Consolidated
2-1 Business Overview
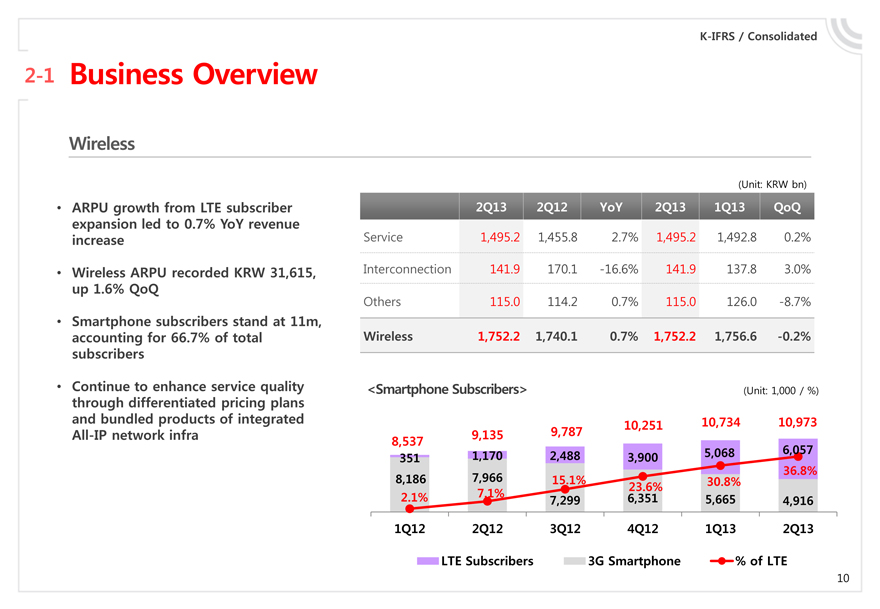
Wireless
ARPU growth from LTE subscriber expansion led to 0.7% YoY revenue increase
Wireless ARPU recorded KRW 31,615, up 1.6% QoQ
Smartphone subscribers stand at 11m, accounting for 66.7% of total subscribers
Continue to enhance service quality through differentiated pricing plans and bundled products of integrated All-IP network infra
(Unit: KRW bn)
2Q13 2Q12 YoY 2Q13 1Q13 QoQ
Service 1,495.2 1,455.8 2.7% 1,495.2 1,492.8 0.2%
Interconnection 141.9 170.1 -16.6% 141.9 137.8 3.0%
Others 115.0 114.2 0.7% 115.0 126.0 -8.7%
Wireless 1,752.2 1,740.1 0.7% 1,752.2 1,756.6 -0.2%
<Smartphone Subscribers> (Unit: 1,000 / %)
8,537 9,135 9,787 10,251 10,734 10,973
351 1,170 2,488 3,900 5,068 6,057
8,186 7,966 15.1% 30.8% 36.8%
2.1% 7.1% 7,299 6,351 23.6% 5,665 4,916
1Q12 2Q12 3Q12 4Q12 1Q13 2Q13
LTE Subscribers 3G Smartphone % of LTE
10
K-IFRS / Consolidated
2-2 Business Overview
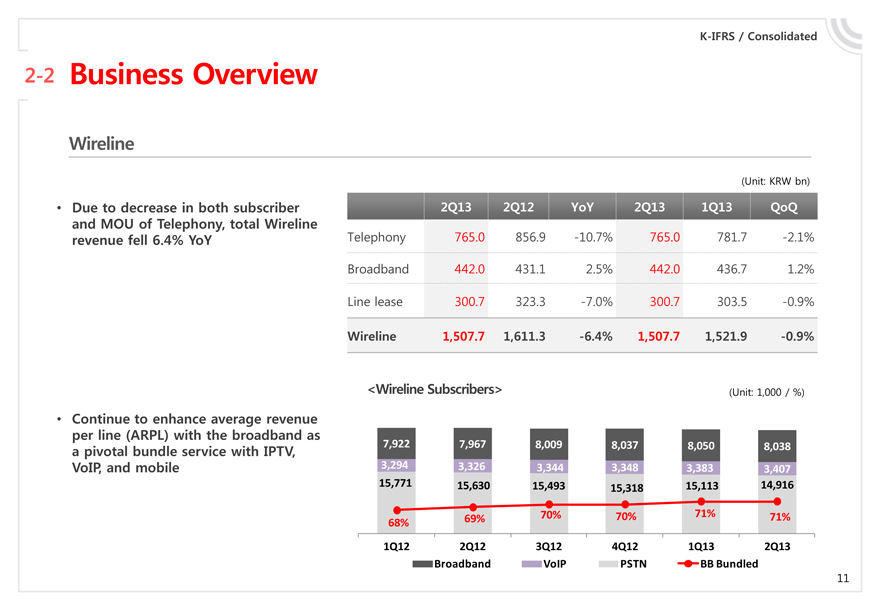
Wireline
Due to decrease in both subscriber and MOU of Telephony, total Wireline revenue fell 6.4% YoY
(Unit: KRW bn)
2Q13 2Q12 YoY 2Q13 1Q13 QoQ
Telephony 765.0 856.9 -10.7% 765.0 781.7 -2.1%
Broadband 442.0 431.1 2.5% 442.0 436.7 1.2%
Line lease 300.7 323.3 -7.0% 300.7 303.5 -0.9%
Wireline 1,507.7 1,611.3 -6.4% 1,507.7 1,521.9 -0.9%
Continue to enhance average revenue per line (ARPL) with the broadband as a pivotal bundle service with IPTV, VoIP, and mobile
<Wireline Subscribers> (Unit: 1,000 / %)
7,922 7,967 8,009 8,037 8,050 8,038
3,294 3,326 3,344 3,348 3,383 3,407
15,771 15,630 15,493 15,318 15,113 14,916
69% 70% 70% 71% 71% 68%
1Q12 2Q12 3Q12 4Q12 1Q13 2Q13
Broadband VoIP PSTN BB Bundled
11
K-IFRS / Consolidated
2-3 Business Overview
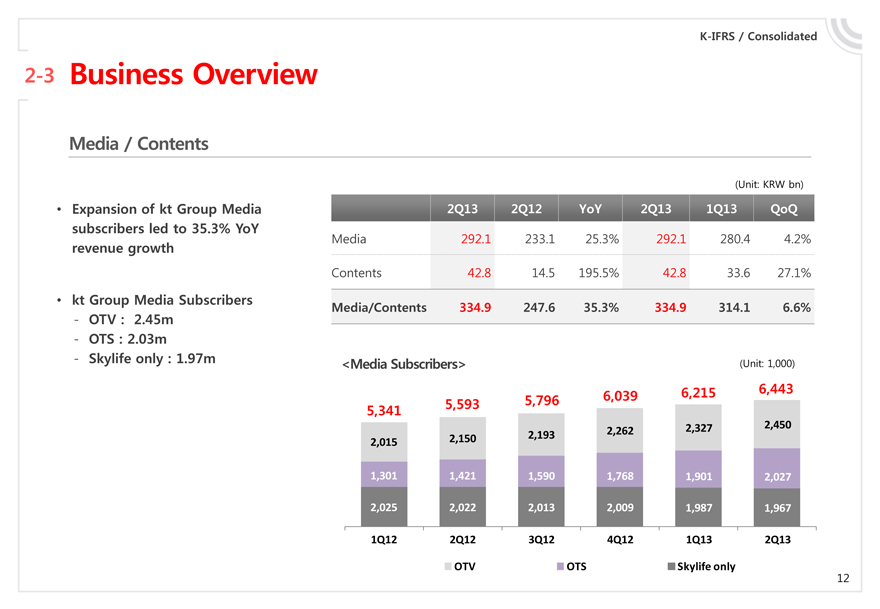
Media / Contents
Expansion of kt Group Media subscribers led to 35.3% YoY revenue growth
kt Group Media Subscribers
OTV : 2.45m
OTS : 2.03m
Skylife only : 1.97m
(Unit: KRW bn)
2Q13 2Q12 YoY 2Q13 1Q13 QoQ
Media 292.1 233.1 25.3% 292.1 280.4 4.2%
Contents 42.8 14.5 195.5% 42.8 33.6 27.1%
Media/Contents 334.9 247.6 35.3% 334.9 314.1 6.6%
<Media Subscribers> (Unit: 1,000)
5,341 5,593 5,796 6,039 6,215 6,443
2,262 2,327 2,450
2,150 2,193 2,015
1,301 1,421 1,590 1,768 1,901 2,027
2,025 2,022 2,013 2,009 1,987 1,967
1Q12 2Q12 3Q12 4Q12 1Q13 2Q13
OTV OTS Skylife only
12
K-IFRS / Consolidated
2-4 Business Overview
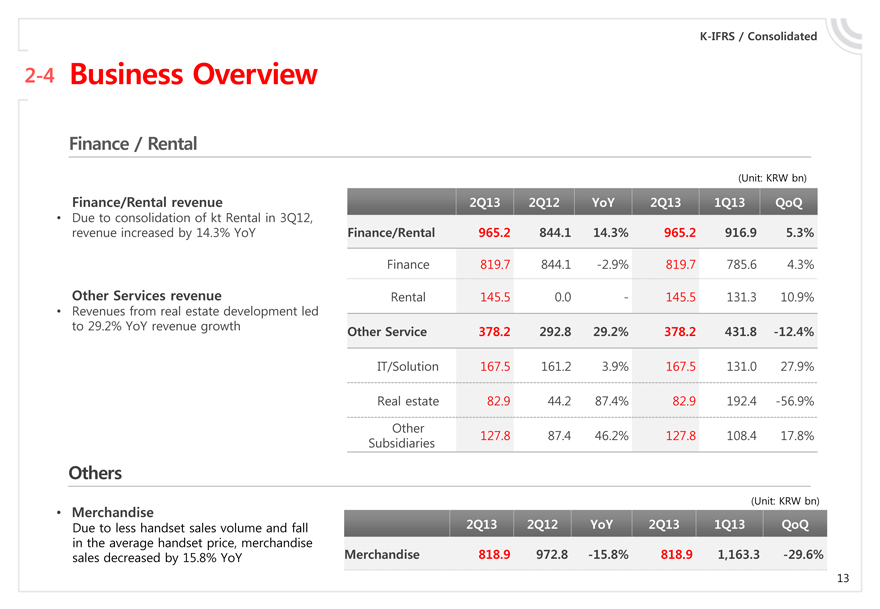
Finance / Rental
Finance/Rental revenue
Due to consolidation of kt Rental in 3Q12, revenue increased by 14.3% YoY
Other Services revenue
Revenues from real estate development led to 29.2% YoY revenue growth
(Unit: KRW bn)
2Q13 2Q12 YoY 2Q13 1Q13 QoQ
Finance/Rental 965.2 844.1 14.3% 965.2 916.9 5.3%
Finance 819.7 844.1 -2.9% 819.7 785.6 4.3%
Rental 145.5 0.0 - 145.5 131.3 10.9%
Other Service 378.2 292.8 29.2% 378.2 431.8 -12.4%
IT/Solution 167.5 161.2 3.9% 167.5 131.0 27.9%
Real estate 82.9 44.2 87.4% 82.9 192.4 -56.9%
Other Subsidiaries 127.8 87.4 46.2% 127.8 108.4 17.8%
Others
Merchandise
Due to less handset sales volume and fall in the average handset price, merchandise sales decreased by 15.8% YoY
(Unit: KRW bn)
2Q13 2Q12 YoY 2Q13 1Q13 QoQ
Merchandise 818.9 972.8 -15.8% 818.9 1,163.3 -29.6%
13
Q & A
1 Financial Highlights
2 Business Overview
3 Q&A
4 Appendix
14
1 Financial Highlights
2 Business Overview
3 Q&A
4 Appendix
15
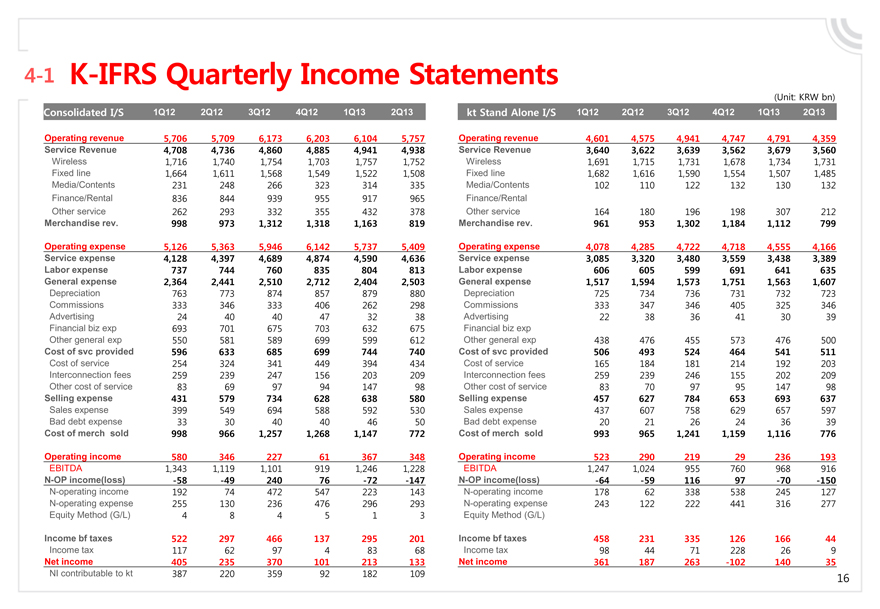
4-1 K-IFRS Quarterly Income Statements
(Unit: KRW bn)
Consolidated I/S 1Q12 2Q12 3Q12 4Q12 1Q13 2Q13
Operating revenue 5,706 5,709 6,173 6,203 6,104 5,757
Service Revenue 4,708 4,736 4,860 4,885 4,941 4,938
Wireless 1,716 1,740 1,754 1,703 1,757 1,752
Fixed line 1,664 1,611 1,568 1,549 1,522 1,508
Media/Contents 231 248 266 323 314 335
Finance/Rental 836 844 939 955 917 965
Other service 262 293 332 355 432 378
Merchandise rev. 998 973 1,312 1,318 1,163 819
Operating expense 5,126 5,363 5,946 6,142 5,737 5,409
Service expense 4,128 4,397 4,689 4,874 4,590 4,636
Labor expense 737 744 760 835 804 813
General expense 2,364 2,441 2,510 2,712 2,404 2,503
Depreciation 763 773 874 857 879 880
Commissions 333 346 333 406 262 298
Advertising 24 40 40 47 32 38
Financial biz exp 693 701 675 703 632 675
Other general exp 550 581 589 699 599 612
Cost of svc provided 596 633 685 699 744 740
Cost of service 254 324 341 449 394 434
Interconnection fees 259 239 247 156 203 209
Other cost of service 83 69 97 94 147 98
Selling expense 431 579 734 628 638 580
Sales expense 399 549 694 588 592 530
Bad debt expense 33 30 40 40 46 50
Cost of merch sold 998 966 1,257 1,268 1,147 772
Operating income 580 346 227 61 367 348
EBITDA 1,343 1,119 1,101 919 1,246 1,228
N-OP income(loss) -58 -49 240 76 -72 -147
N-operating income 192 74 472 547 223 143
N-operating expense 255 130 236 476 296 293
Equity Method (G/L) 4 8 4 5 1 3
Income bf taxes 522 297 466 137 295 201
Income tax 117 62 97 4 83 68
Net income 405 235 370 101 213 133
NI contributable to kt 387 220 359 92 182 109
kt Stand Alone I/S 1Q12 2Q12 3Q12 4Q12 1Q13 2Q13
Operating revenue 4,601 4,575 4,941 4,747 4,791 4,359
Service Revenue 3,640 3,622 3,639 3,562 3,679 3,560
Wireless 1,691 1,715 1,731 1,678 1,734 1,731
Fixed line 1,682 1,616 1,590 1,554 1,507 1,485
Media/Contents 102 110 122 132 130 132
Finance/Rental
Other service 164 180 196 198 307 212
Merchandise rev. 961 953 1,302 1,184 1,112 799
Operating expense 4,078 4,285 4,722 4,718 4,555 4,166
Service expense 3,085 3,320 3,480 3,559 3,438 3,389
Labor expense 606 605 599 691 641 635
General expense 1,517 1,594 1,573 1,751 1,563 1,607
Depreciation 725 734 736 731 732 723
Commissions 333 347 346 405 325 346
Advertising 22 38 36 41 30 39
Financial biz exp
Other general exp 438 476 455 573 476 500
Cost of svc provided 506 493 524 464 541 511
Cost of service 165 184 181 214 192 203
Interconnection fees 259 239 246 155 202 209
Other cost of service 83 70 97 95 147 98
Selling expense 457 627 784 653 693 637
Sales expense 437 607 758 629 657 597
Bad debt expense 20 21 26 24 36 39
Cost of merch sold 993 965 1,241 1,159 1,116 776
Operating income 523 290 219 29 236 193
EBITDA 1,247 1,024 955 760 968 916
N-OP income(loss) -64 -59 116 97 -70 -150
N-operating income 178 62 338 538 245 127
N-operating expense 243 122 222 441 316 277
Equity Method (G/L)
Income bf taxes 458 231 335 126 166 44
Income tax 98 44 71 228 26 9
Net income 361 187 263 -102 140 35
16
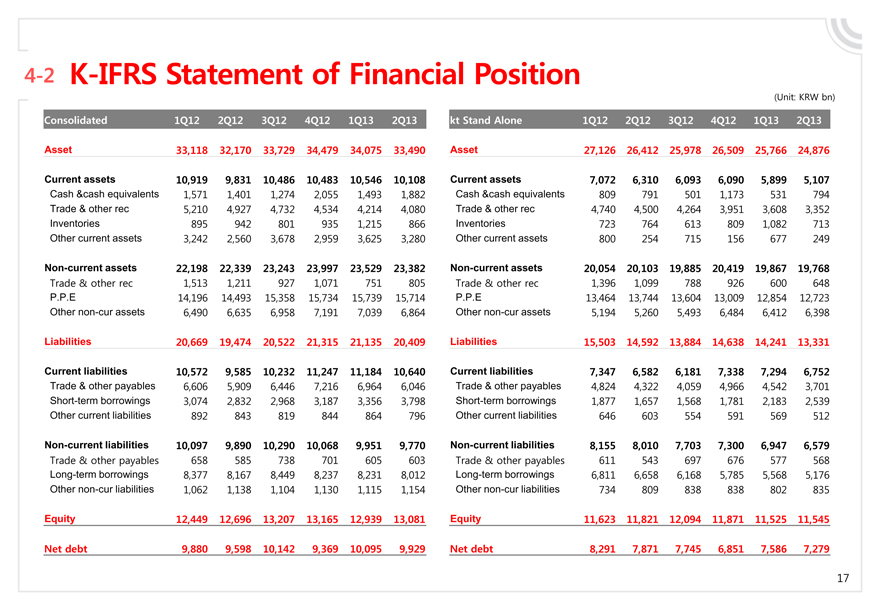
4-2 K-IFRS Statement of Financial Position
(Unit: KRW bn)
Consolidated 1Q12 2Q12 3Q12 4Q12 1Q13 2Q13
Asset 33,118 32,170 33,729 34,479 34,075 33,490
Current assets 10,919 9,831 10,486 10,483 10,546 10,108
Cash & cash equivalents 1,571 1,401 1,274 2,055 1,493 1,882
Trade & other rec 5,210 4,927 4,732 4,534 4,214 4,080
Inventories 895 942 801 935 1,215 866
Other current assets 3,242 2,560 3,678 2,959 3,625 3,280
Non-current assets 22,198 22,339 23,243 23,997 23,529 23,382
Trade & other rec 1,513 1,211 927 1,071 751 805
P.P.E 14,196 14,493 15,358 15,734 15,739 15,714
Other non-cur assets 6,490 6,635 6,958 7,191 7,039 6,864
Liabilities 20,669 19,474 20,522 21,315 21,135 20,409
Current liabilities 10,572 9,585 10,232 11,247 11,184 10,640
Trade & other payables 6,606 5,909 6,446 7,216 6,964 6,046
Short-term borrowings 3,074 2,832 2,968 3,187 3,356 3,798
Other current liabilities 892 843 819 844 864 796
Non-current liabilities 10,097 9,890 10,290 10,068 9,951 9,770
Trade & other payables 658 585 738 701 605 603
Long-term borrowings 8,377 8,167 8,449 8,237 8,231 8,012
Other non-cur liabilities 1,062 1,138 1,104 1,130 1,115 1,154
Equity 12,449 12,696 13,207 13,165 12,939 13,081
Net debt 9,880 9,598 10,142 9,369 10,095 9,929
kt Stand Alone 1Q12 2Q12 3Q12 4Q12 1Q13 2Q13
Asset 27,126 26,412 25,978 26,509 25,766 24,876
Current assets 7,072 6,310 6,093 6,090 5,899 5,107
Cash & cash equivalents 809 791 501 1,173 531 794
Trade & other rec 4,740 4,500 4,264 3,951 3,608 3,352
Inventories 723 764 613 809 1,082 713
Other current assets 800 254 715 156 677 249
Non-current assets 20,054 20,103 19,885 20,419 19,867 19,768
Trade & other rec 1,396 1,099 788 926 600 648
P.P.E 13,464 13,744 13,604 13,009 12,854 12,723
Other non-cur assets 5,194 5,260 5,493 6,484 6,412 6,398
Liabilities 15,503 14,592 13,884 14,638 14,241 13,331
Current liabilities 7,347 6,582 6,181 7,338 7,294 6,752
Trade & other payables 4,824 4,322 4,059 4,966 4,542 3,701
Short-term borrowings 1,877 1,657 1,568 1,781 2,183 2,539
Other current liabilities 646 603 554 591 569 512
Non-current liabilities 8,155 8,010 7,703 7,300 6,947 6,579
Trade & other payables 611 543 697 676 577 568
Long-term borrowings 6,811 6,658 6,168 5,785 5,568 5,176
Other non-cur liabilities 734 809 838 838 802 835
Equity 11,623 11,821 12,094 11,871 11,525 11,545
Net debt 8,291 7,871 7,745 6,851 7,586 7,279
17
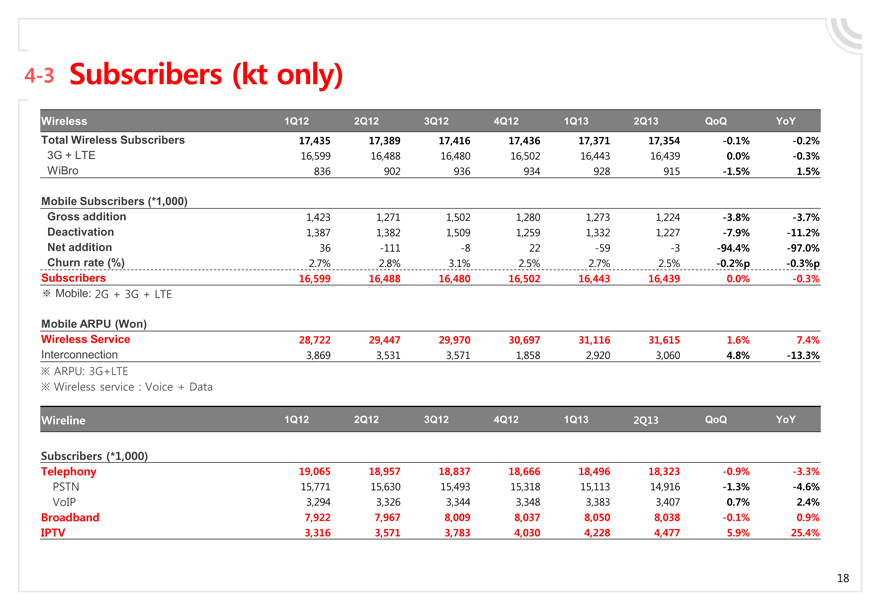
4-3 Subscribers (kt only)
Wireless 1Q12 2Q12 3Q12 4Q12 1Q13 2Q13 QoQ YoY
Total Wireless Subscribers 17,435 17,389 17,416 17,436 17,371 17,354 -0.1% -0.2%
3G + LTE 16,599 16,488 16,480 16,502 16,443 16,439 0.0% -0.3%
WiBro 836 902 936 934 928 915 -1.5% 1.5%
Mobile Subscribers (*1,000)
Gross addition 1,423 1,271 1,502 1,280 1,273 1,224 -3.8% -3.7%
Deactivation 1,387 1,382 1,509 1,259 1,332 1,227 -7.9% -11.2%
Net addition 36 -111 -8 22 -59 -3 -94.4% -97.0%
Churn rate (%) 2.7% 2.8% 3.1% 2.5% 2.7% 2.5% -0.2%p -0.3%p
Subscribers 16,599 16,488 16,480 16,502 16,443 16,439 0.0% -0.3%
Mobile: 2G + 3G + LTE
Mobile ARPU (Won)
Wireless Service 28,722 29,447 29,970 30,697 31,116 31,615 1.6% 7.4%
Interconnection 3,869 3,531 3,571 1,858 2,920 3,060 4.8% -13.3%
ARPU: 3G+LTE
Wireless service : Voice + Data
Wireline 1Q12 2Q12 3Q12 4Q12 1Q13 2Q13 QoQ YoY
Subscribers (*1,000)
Telephony 19,065 18,957 18,837 18,666 18,496 18,323 -0.9% -3.3%
PSTN 15,771 15,630 15,493 15,318 15,113 14,916 -1.3% -4.6%
VoIP 3,294 3,326 3,344 3,348 3,383 3,407 0.7% 2.4%
Broadband 7,922 7,967 8,009 8,037 8,050 8,038 -0.1% 0.9%
IPTV 3,316 3,571 3,783 4,030 4,228 4,477 5.9% 25.4%
18

Thank you kt