SECURITIES AND EXCHANGE COMMISSION
Washington, D.C. 20549
Form 6-K
REPORT OF FOREIGN PRIVATE ISSUER
PURSUANT TO RULE 13a-16 OR 15d-16
OF THE SECURITIES EXCHANGE ACT OF 1934
For the month of July 2014
Commission File Number 1-14926
KT Corporation
(Translation of registrant’s name into English)
90, Buljeong-ro,
Bundang-gu, Seongnam-si,
Gyeonggi-do,
Korea
(Address of principal executive offices)
Indicate by check mark whether the registrant files or will file annual reports under cover of Form 20-F or Form 40-F:
Form 20-F x Form 40-F ¨
Indicate by check mark if the registrant is submitting the Form 6-K in paper as permitted by Regulation S-T Rule 101(b)(1): ¨
Indicate by check mark if the registrant is submitting the Form 6-K in paper as permitted by Regulation S-T Rule 101(b)(7): ¨
Indicate by check mark whether by furnishing the information contained in this Form, the registrant is also thereby furnishing the information to the Commission pursuant to Rule 12g3-2(b) under the Securities Exchange Act of 1934.
Yes ¨ No x
If “Yes” is marked, indicate below the file number assigned to the registrant in connection with Rule 12g3-2(b): 82-
SIGNATURES
Pursuant to the requirements of the Securities Exchange Act of 1934, the registrant has duly caused this report to be signed on its behalf by the undersigned, thereunto duly authorized.
| Dated: July 29, 2014 | ||
| KT Corporation | ||
| By: | /s/ Youngwoo Kim | |
| Name: | Youngwoo Kim | |
| Title: | Vice President | |
| By: | /s/ Jungsup Jung | |
| Name: | Jungsup Jung | |
| Title: | Team Leader | |

KT 2Q14
Earnings Release
Global No. 1 KT
Investor Relations 2014. 7. 29
kt
Disclaimer
This presentation has been prepared by KT Corp. (“the Company”). This presentation contains forward-looking statements, which are subject to risks, uncertainties, and assumptions. This presentation is being presented solely for your information and is subject to change without notice. No representation or warranty, expressed or implied, is made and no reliance should be placed on the accuracy, actuality, fairness, or completeness of the information presented.
Please be informed that items included in our operating income have been prepared in accordance with K-IFRS 1001 released on October 17, 2012, which was revised to coincide with the Korean Accounting Standards for Non-Public Entities (“KAS-NPEs”). As such, our disposal gains from real estates and others have been excluded from our operating income.
The Company, its affiliates or representatives accept no liability whatsoever for any losses arising from any information contained in the presentation. This presentation does not constitute an offer or invitation to purchase or subscribe for any shares of the Company, and no part of this presentation shall form the Basis of or be relied upon in connection with any contract or commitment.
Any decision to purchase shares of the Company should be made solely on the Basis of information, which has been publicly filed with the Securities and Exchange Commission or the Korea Stock Exchange and distributed to all investors.
The contents of this presentation may not be reproduced, redistributed or passed on, directly or indirectly, to any other person or published, in whole or in part, for any purpose.
If you have any related questions to this material, please contact IR department. Tel : 82-2-3495-3557, 3564, 5529, 5343, 5344
Fax : 82-2-3495-5914
1
Contents
1 Financial Highlights
2 Business Overview
3 Q&A
4 Appendix
2
K-IFRS / Consolidated
1-1 Financial Highlights
Income Statement
(Unit: KRW bn)
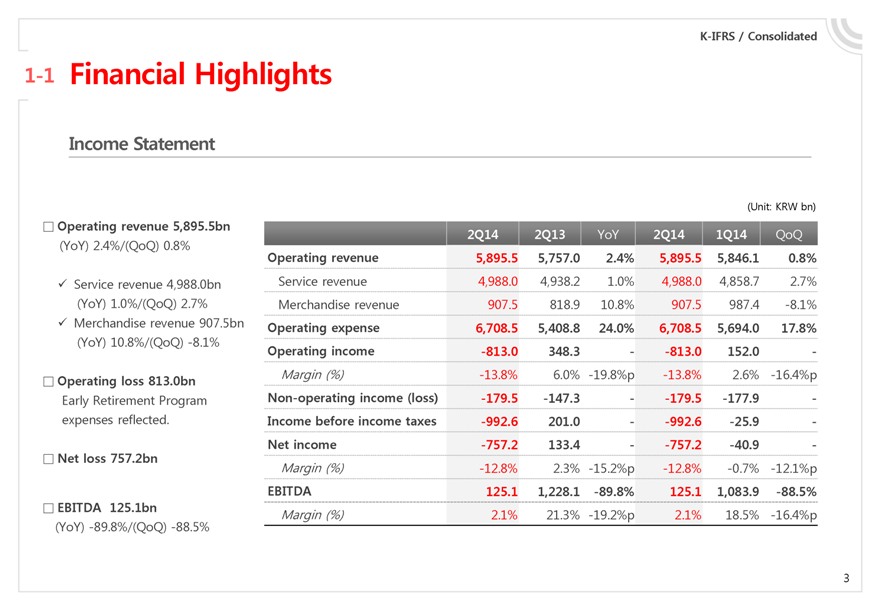
Operating revenue 5,895.5bn
(YoY) 2.4%/(QoQ) 0.8% 2Q14 2Q13 YoY 2Q14 1Q14 QoQ
Operating revenue 5,895.5 5,757.0 2.4% 5,895.5 5,846.1 0.8%
Service revenue 4,988.0bn Service revenue 4,988.0 4,938.2 1.0% 4,988.0 4,858.7 2.7%
(YoY) 1.0%/(QoQ) 2.7% Merchandise revenue 907.5 818.9 10.8% 907.5 987.4 -8.1%
Merchandise revenue 907.5bn Operating expense 6,708.5 5,408.8 24.0% 6,708.5 5,694.0 17.8%
(YoY) 10.8%/(QoQ) -8.1% Operating income -813.0 348.3 - -813.0 152.0 -
Operating loss 813.0bn Margin (%) -13.8% 6.0% -19.8%p -13.8% 2.6% -16.4%p
Early Retirement Program Non-operating income (loss) -179.5 -147.3 - -179.5 -177.9 -
expenses reflected. Income before income taxes -992.6 201.0 - -992.6 -25.9 -
Net loss 757.2bn
Net income -757.2 133.4 - -757.2 -40.9 -
Margin (%) -12.8% 2.3% -15.2%p -12.8% -0.7% -12.1%p
EBITDA 125.1bn EBITDA 125.1 1,228.1 -89.8% 125.1 1,083.9 -88.5%
(YoY) -89.8%/(QoQ) -88.5% Margin (%) 2.1% 21.3% -19.2%p 2.1% 18.5% -16.4%p
3
K-IFRS / Consolidated
1-2 Financial Highlights
Major Subsidiaries
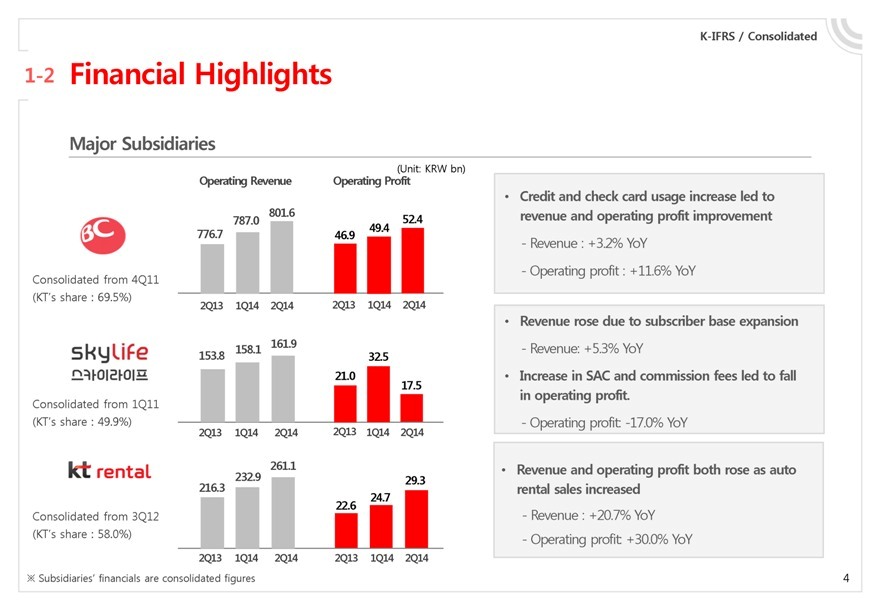
BC
Consolidated from 4Q11
(KT’s share : 69.5%)
skylife
Consolidated from 1Q11
(KT’s share : 49.9%)
kt rental
Consolidated from 3Q12
(KT’s share : 58.0%)
(Unit: KRW bn)
Operating Revenue
776.7 787.0 801.6
2Q13 1Q14 2Q14
153.8 158.1 161.9
2Q13 1Q14 2Q14
216.3 232.9 261.1
2Q13 1Q14 2Q14
Operating Profit
46.9 49.4 52.4
2Q13 1Q14 2Q14
21.0 32.5 17.5
2Q13 1Q14 2Q14
22.6 24.7 29.3
2Q13 1Q14 2Q14
Credit and check card usage increase led to revenue and operating profit improvement
- Revenue : +3.2% YoY
- Operating profit : +11.6% YoY
Revenue rose due to subscriber base expansion
- Revenue: +5.3% YoY
Increase in SAC and commission fees led to fall in operating profit.
- Operating profit: -17.0% YoY
Revenue and operating profit both rose as auto rental sales increased
- Revenue : +20.7% YoY
- Operating profit: +30.0% YoY
Subsidiaries’ financials are consolidated figures
4
K-IFRS / Consolidated
1-3 Financial Highlights
Operating Revenue
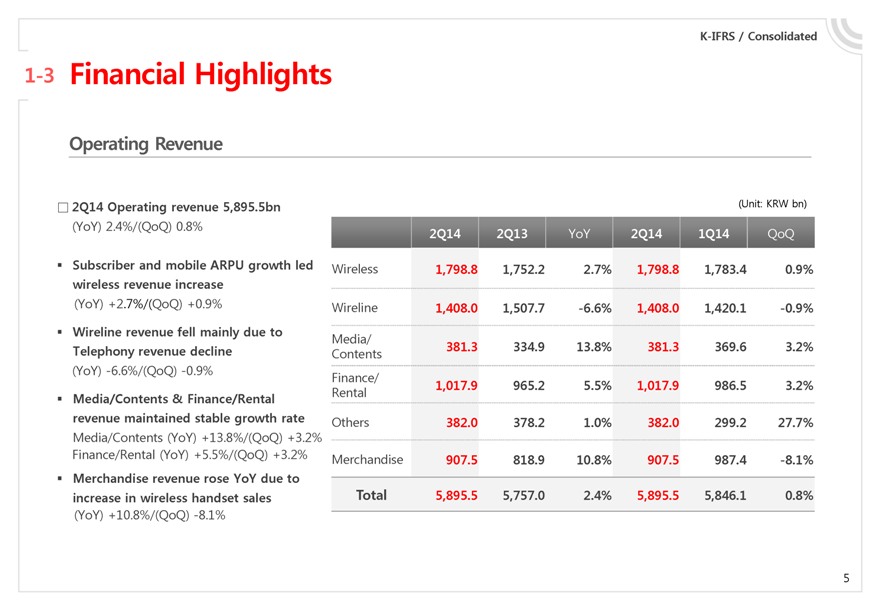
2Q14 Operating revenue 5,895.5bn
(YoY) 2.4%/(QoQ) 0.8%
Subscriber and mobile ARPU growth led wireless revenue increase
(YoY) +2.7%/(QoQ) +0.9%
Wireline revenue fell mainly due to Telephony revenue decline
(YoY) -6.6%/(QoQ) -0.9%
Media/Contents & Finance/Rental revenue maintained stable growth rate
Media/Contents (YoY) +13.8%/(QoQ) +3.2%
Finance/Rental (YoY) +5.5%/(QoQ) +3.2%
Merchandise revenue rose YoY due to increase in wireless handset sales
(YoY) +10.8%/(QoQ) -8.1%
(Unit: KRW bn)
2Q14 2Q13 YoY 2Q14 1Q14 QoQ
Wireless 1,798.8 1,752.2 2.7% 1,798.8 1,783.4 0.9%
Wireline 1,408.0 1,507.7 -6.6% 1,408.0 1,420.1 -0.9%
Media/
Contents 381.3 334.9 13.8% 381.3 369.6 3.2%
Finance/ 1,017.9 965.2 5.5% 1,017.9 986.5 3.2%
Rental
Others 382.0 378.2 1.0% 382.0 299.2 27.7%
Merchandise 907.5 818.9 10.8% 907.5 987.4 -8.1%
Total 5,895.5 5,757.0 2.4% 5,895.5 5,846.1 0.8%
5
K-IFRS / Consolidated
1-4 Financial Highlights
Operating Expenses
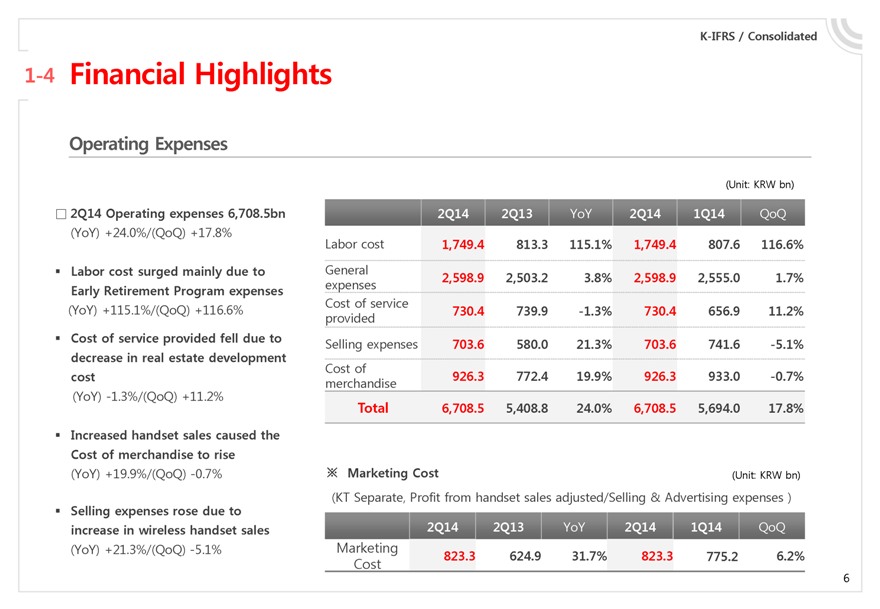
2Q14 Operating expenses 6,708.5bn
(YoY) +24.0%/(QoQ) +17.8%
Labor cost surged mainly due to Early Retirement Program expenses
(YoY) +115.1%/(QoQ) +116.6%
Cost of service provided fell due to decrease in real estate development cost
(YoY) -1.3%/(QoQ) +11.2%
Increased handset sales caused the Cost of merchandise to rise
(YoY) +19.9%/(QoQ) -0.7%
Selling expenses rose due to increase in wireless handset sales
(YoY) +21.3%/(QoQ) -5.1%
(Unit: KRW bn)
2Q14 2Q13 YoY 2Q14 1Q14 QoQ
Labor cost 1,749.4 813.3 115.1% 1,749.4 807.6 116.6%
General expenses 2,598.9 2,503.2 3.8% 2,598.9 2,555.0 1.7%
Cost of service provided 730.4 739.9 -1.3% 730.4 656.9 11.2%
Selling expenses 703.6 580.0 21.3% 703.6 741.6 -5.1%
Cost of merchandise 926.3 772.4 19.9% 926.3 933.0 -0.7%
Total 6,708.5 5,408.8 24.0% 6,708.5 5,694.0 17.8%
Marketing Cost
(Unit: KRW bn)
(KT Separate, Profit from handset sales adjusted/Selling & Advertising expenses)
2Q14 2Q13 YoY 2Q14 1Q14 QoQ
Marketing Cost 823.3 624.9 31.7% 823.3 775.2 6.2%
6
K-IFRS / Consolidated
1-5 Financial Highlights
Financial Position
(Unit: KRW bn)
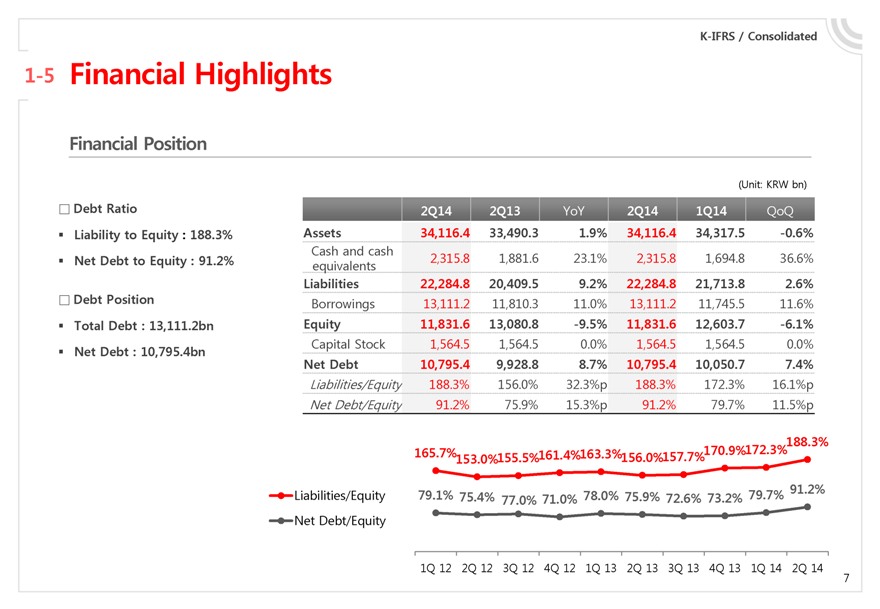
Debt Ratio
Liability to Equity : 188.3%
Net Debt to Equity : 91.2%
Debt Position
Total Debt : 13,111.2bn
Net Debt : 10,795.4bn
2Q14 2Q13 YoY 2Q14 1Q14 QoQ
Assets 34,116.4 33,490.3 1.9% 34,116.4 34,317.5 -0.6%
Cash and cash equivalents 2,315.8 1,881.6 23.1% 2,315.8 1,694.8 36.6%
Liabilities 22,284.8 20,409.5 9.2% 22,284.8 21,713.8 2.6%
Borrowings 13,111.2 11,810.3 11.0% 13,111.2 11,745.5 11.6%
Equity 11,831.6 13,080.8 -9.5% 11,831.6 12,603.7 -6.1%
Capital Stock 1,564.5 1,564.5 0.0% 1,564.5 1,564.5 0.0%
Net Debt 10,795.4 9,928.8 8.7% 10,795.4 10,050.7 7.4%
Liabilities/Equity 188.3% 156.0% 32.3%p 188.3% 172.3% 16.1%p
Net Debt/Equity 91.2% 75.9% 15.3%p 91.2% 79.7% 11.5%p
165.7% 153.0% 155.5% 161.4% 163.3% 156.0% 157.7% 170.9% 172.3% 188.3%
Liabilities/Equity
79.1% 75.4% 77.0% 71.0% 78.0% 75.9% 72.6% 73.2% 79.7% 91.2%
Net Debt/Equity
1Q 12 2Q 12 3Q 12 4Q 12 1Q 13 2Q 13 3Q 13 4Q 13 1Q 14 2Q 14
7
K-IFRS / KT Separate
1-6 Financial Highlights
CAPEX
(Unit: KRW bn)
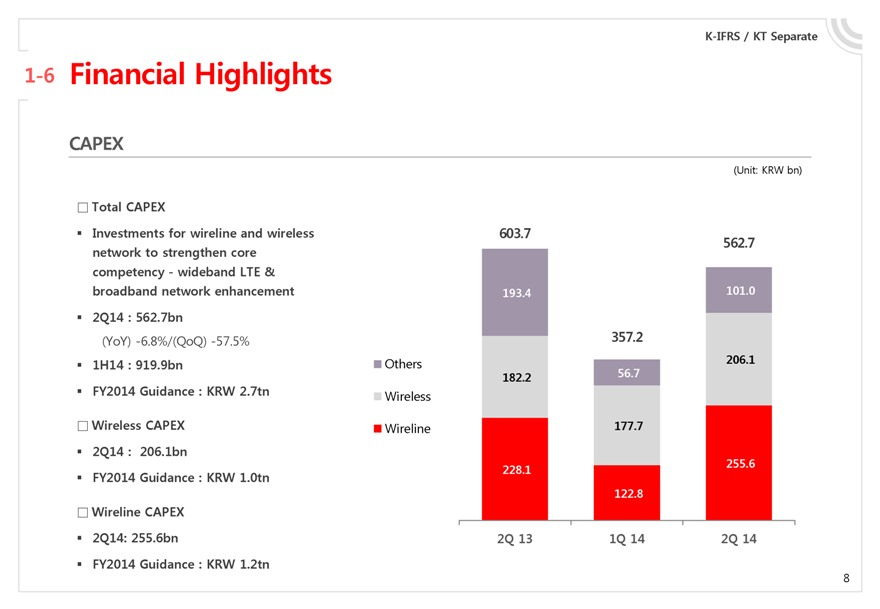
Total CAPEX
Investments for wireline and wireless network to strengthen core competency - wideband LTE & broadband network enhancement
2Q14 : 562.7bn
(YoY) -6.8%/(QoQ) -57.5%
1H14 : 919.9bn
FY2014 Guidance : KRW 2.7tn
Wireless CAPEX
2Q14 : 206.1bn
FY2014 Guidance : KRW 1.0tn
Wireline CAPEX
2Q14: 255.6bn
FY2014 Guidance : KRW 1.2tn
Others
Wireless
Wireline
603.7 193.4 182.2 228.1 2Q 13
357.2 56.7 177.7 122.8 1Q 14
562.7 101.0 206.1 255.6 2Q 14
8
1 Financial Highlights
2 Business Overview
3 Q&A
4 Appendix
9
K-IFRS / Consolidated
2-1 Business Overview
Wireless
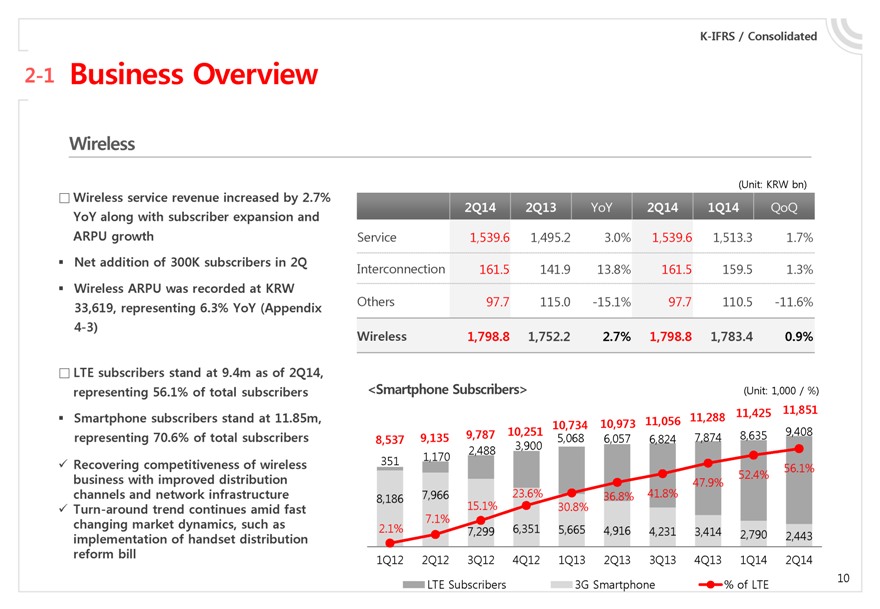
Wireless service revenue increased by 2.7% YoY along with subscriber expansion and ARPU growth
Net addition of 300K subscribers in 2Q
Wireless ARPU was recorded at KRW 33,619, representing 6.3% YoY (Appendix 4-3)
LTE subscribers stand at 9.4m as of 2Q14, representing 56.1% of total subscribers
Smartphone subscribers stand at 11.85m, representing 70.6% of total subscribers
Recovering competitiveness of wireless business with improved distribution channels and network infrastructure
Turn-around trend continues amid fast changing market dynamics, such as implementation of handset distribution reform bill
(Unit: KRW bn)
2Q14 2Q13 YoY 2Q14 1Q14 QoQ
Service 1,539.6 1,495.2 3.0% 1,539.6 1,513.3 1.7%
Interconnection 161.5 141.9 13.8% 161.5 159.5 1.3%
Others 97.7 115.0 -15.1% 97.7 110.5 -11.6%
Wireless 1,798.8 1,752.2 2.7% 1,798.8 1,783.4 0.9%
<Smartphone Subscribers>
(Unit: 1,000 / %)
8,537 9,135 9,787 10,251 10,734 10,973 11,056 11,288 11,425 11,851
351 1,170 2,488 3,900 5,068 6,057 6,824 7,874 8,635 9,408
8,186 7,966
2.1% 7.1% 15.1% 23.6% 30.8% 36.8% 41.8% 47.9% 52.4% 56.1%
7,299 6,351 5,665 4,916 4,231 3,414 2,790 2,443
1Q12 2Q12 3Q12 4Q12 1Q13 2Q13 3Q13 4Q13 1Q14 2Q14
LTE Subscribers
3G Smartphone
% of LTE
10
K-IFRS / Consolidated
2-2 Business Overview
Wireline
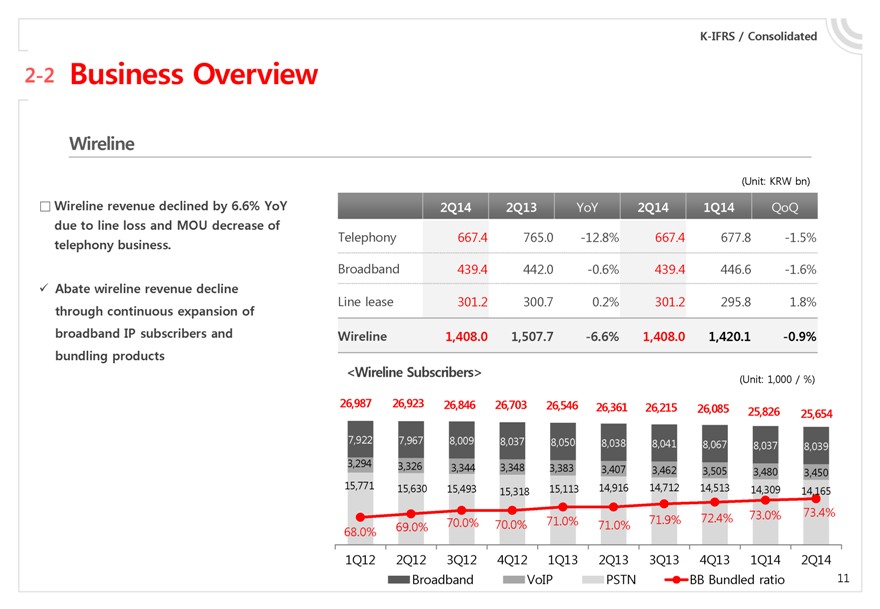
Wireline revenue declined by 6.6% YoY due to line loss and MOU decrease of telephony business.
Abate wireline revenue decline through continuous expansion of broadband IP subscribers and bundling products
(Unit: KRW bn)
2Q14 2Q13 YoY 2Q14 1Q14 QoQ
Telephony 667.4 765.0 -12.8% 667.4 677.8 -1.5%
Broadband 439.4 442.0 -0.6% 439.4 446.6 -1.6%
Line lease 301.2 300.7 0.2% 301.2 295.8 1.8%
Wireline 1,408.0 1,507.7 -6.6% 1,408.0 1,420.1 -0.9%
<Wireline Subscribers>
(Unit: 1,000 / %)
26,987 26,923 26,846 26,703 26,546 26,361 26,215 26,085 25,826 25,654
7,922 7,967 8,009 8,037 8,050 8,038 8,041 8,067 8,037 8,039
3,294 3,326 3,344 3,348 3,383 3,407 3,462 3,505 3,480 3,450
15,771 15,630 15,493 15,318 15,113 14,916 14,712 14,513 14,309 14,165
68.0% 69.0% 70.0% 70.0% 71.0% 71.0% 71.9% 72.4% 73.0% 73.4%
1Q12 2Q12 3Q12 4Q12 1Q13 2Q13 3Q13 4Q13 1Q14 2Q14
Broadband
VoIP
PSTN
BB Bundled ratio
11
K-IFRS / Consolidated
2-3 Business Overview
Media / Contents
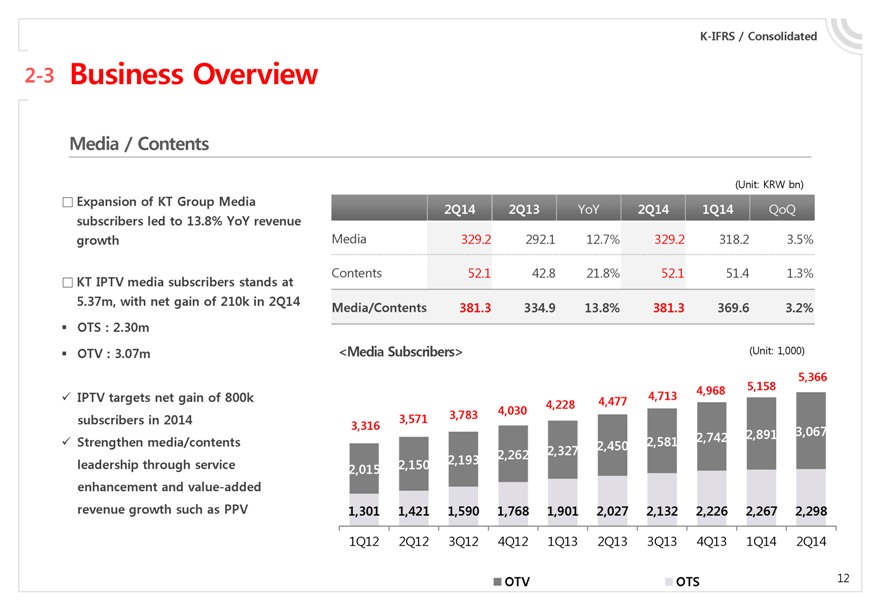
Expansion of KT Group Media subscribers led to 13.8% YoY revenue growth
KT IPTV media subscribers stands at 5.37m, with net gain of 210k in 2Q14
OTS : 2.30m
OTV : 3.07m
IPTV targets net gain of 800k subscribers in 2014
Strengthen media/contents leadership through service enhancement and value-added revenue growth such as PPV
(Unit: KRW bn)
2Q14 2Q13 YoY 2Q14 1Q14 QoQ
Media 329.2 292.1 12.7% 329.2 318.2 3.5%
Contents 52.1 42.8 21.8% 52.1 51.4 1.3%
Media/Contents 381.3 334.9 13.8% 381.3 369.6 3.2%
<Media Subscribers>
(Unit: 1,000)
3,316 3,571 3,783 4,030 4,228 4,477 4,713 4,968 5,158 5,366
2,015 2,150 2,193 2,262 2,327 2,450 2,581 2,742 2,891 3,067
1,301 1,421 1,590 1,768 1,901 2,027 2,132 2,226 2,267 2,298
1Q12 2Q12 3Q12 4Q12 1Q13 2Q13 3Q13 4Q13 1Q14 2Q14
OTV
OTS
12
K-IFRS / Consolidated
2-4 Business Overview
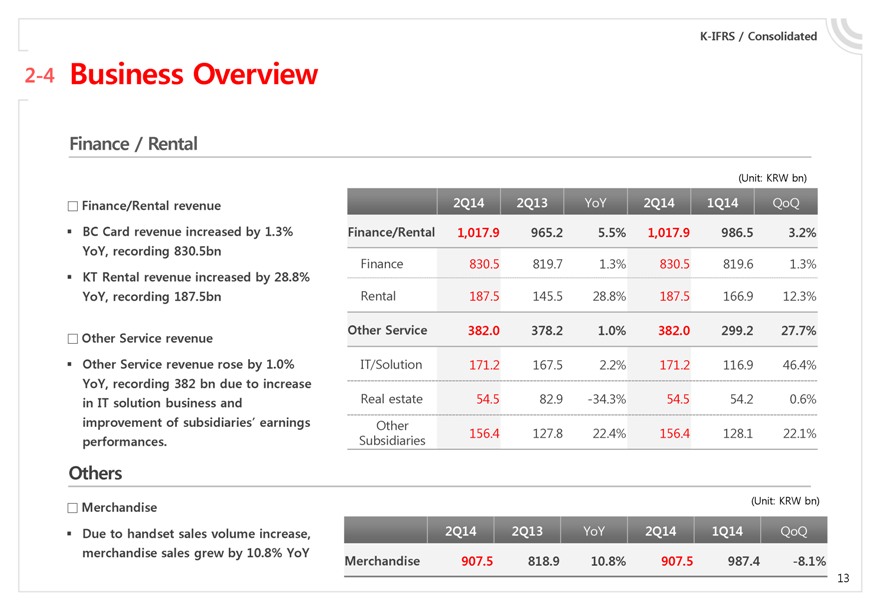
Finance / Rental
Finance/Rental revenue
BC Card revenue increased by 1.3% YoY, recording 830.5bn
KT Rental revenue increased by 28.8% YoY, recording 187.5bn
Other Service revenue
Other Service revenue rose by 1.0% YoY, recording 382 bn due to increase in IT solution business and improvement of subsidiaries’ earnings performances.
Others
Merchandise
Due to handset sales volume increase, merchandise sales grew by 10.8% YoY
(Unit: KRW bn)
2Q14 2Q13 YoY 2Q14 1Q14 QoQ
Finance/Rental 1,017.9 965.2 5.5% 1,017.9 986.5 3.2%
Finance 830.5 819.7 1.3% 830.5 819.6 1.3%
Rental 187.5 145.5 28.8% 187.5 166.9 12.3%
Other Service 382.0 378.2 1.0% 382.0 299.2 27.7%
IT/Solution 171.2 167.5 2.2% 171.2 116.9 46.4%
Real estate 54.5 82.9 -34.3% 54.5 54.2 0.6%
Other Subsidiaries 156.4 127.8 22.4% 156.4 128.1 22.1%
(Unit: KRW bn)
2Q14 2Q13 YoY 2Q14 1Q14 QoQ
Merchandise 907.5 818.9 10.8% 907.5 987.4 -8.1%
13
Q&A
1 Financial Highlights
2 Business Overview
3 Q&A
4 Appendix
14
1 Financial Highlights
2 Business Overview
3 Q&A
4 Appendix
15
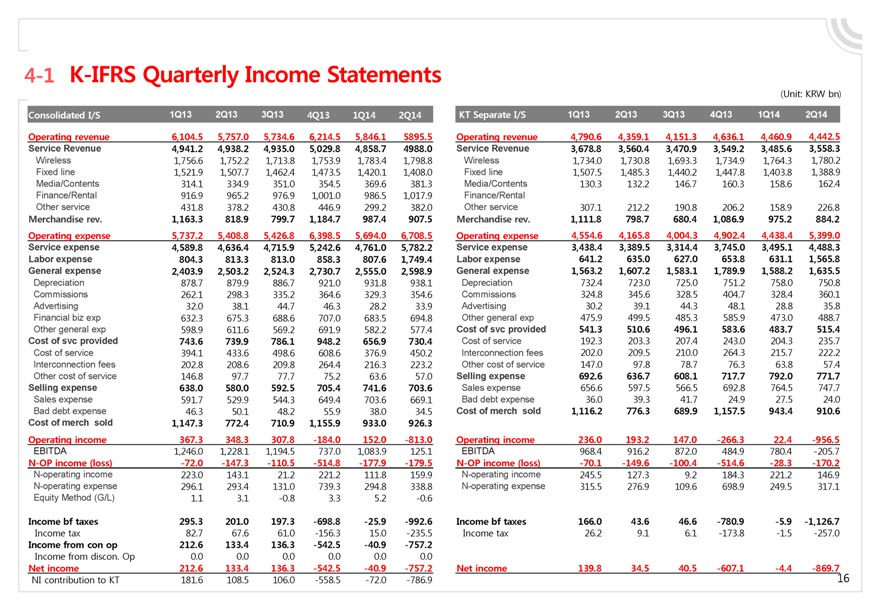
4-1 K-IFRS Quarterly Income Statements
Consolidated I/S 1Q13 2Q13 3Q13 4Q13 1Q14 2Q14
Operating revenue 6,104.5 5,757.0 5,734.6 6,214.5 5,846.1 5895.5
Service Revenue 4,941.2 4,938.2 4,935.0 5,029.8 4,858.7 4988.0
Wireless 1,756.6 1,752.2 1,713.8 1,753.9 1,783.4 1,798.8
Fixed line 1,521.9 1,507.7 1,462.4 1,473.5 1,420.1 1,408.0
Media/Contents 314.1 334.9 351.0 354.5 369.6 381.3
Finance/Rental 916.9 965.2 976.9 1,001.0 986.5 1,017.9
Other service 431.8 378.2 430.8 446.9 299.2 382.0
Merchandise rev. 1,163.3 818.9 799.7 1,184.7 987.4 907.5
Operating expense 5,737.2 5,408.8 5,426.8 6,398.5 5,694.0 6,708.5
Service expense 4,589.8 4,636.4 4,715.9 5,242.6 4,761.0 5,782.2
Labor expense 804.3 813.3 813.0 858.3 807.6 1,749.4
General expense 2,403.9 2,503.2 2,524.3 2,730.7 2,555.0 2,598.9
Depreciation 878.7 879.9 886.7 921.0 931.8 938.1
Commissions 262.1 298.3 335.2 364.6 329.3 354.6
Advertising 32.0 38.1 44.7 46.3 28.2 33.9
Financial biz exp 632.3 675.3 688.6 707.0 683.5 694.8
Other general exp 598.9 611.6 569.2 691.9 582.2 577.4
Cost of svc provided 743.6 739.9 786.1 948.2 656.9 730.4
Cost of service 394.1 433.6 498.6 608.6 376.9 450.2
Interconnection fees 202.8 208.6 209.8 264.4 216.3 223.2
Other cost of service 146.8 97.7 77.7 75.2 63.6 57.0
Selling expense 638.0 580.0 592.5 705.4 741.6 703.6
Sales expense 591.7 529.9 544.3 649.4 703.6 669.1
Bad debt expense 46.3 50.1 48.2 55.9 38.0 34.5
Cost of merch sold 1,147.3 772.4 710.9 1,155.9 933.0 926.3
Operating income 367.3 348.3 307.8 -184.0 152.0 -813.0
EBITDA 1,246.0 1,228.1 1,194.5 737.0 1,083.9 125.1
N-OP income (loss) -72.0 -147.3 -110.5 -514.8 -177.9 -179.5
N-operating income 223.0 143.1 21.2 221.2 111.8 159.9
N-operating expense 296.1 293.4 131.0 739.3 294.8 338.8
Equity Method (G/L) 1.1 3.1 -0.8 3.3 5.2 -0.6
Income bf taxes 295.3 201.0 197.3 -698.8 -25.9 -992.6
Income tax 82.7 67.6 61.0 -156.3 15.0 -235.5
Income from con op 212.6 133.4 136.3 -542.5 -40.9 -757.2
Income from discon. Op 0.0 0.0 0.0 0.0 0.0 0.0
Net income 212.6 133.4 136.3 -542.5 -40.9 -757.2
NI contribution to KT 181.6 108.5 106.0 -558.5 -72.0 -786.9
(Unit: KRW bn)
KT Separate I/S 1Q13 2Q13 3Q13 4Q13 1Q14 2Q14
Operating revenue 4,790.6 4,359.1 4,151.3 4,636.1 4,460.9 4,442.5
Service Revenue 3,678.8 3,560.4 3,470.9 3,549.2 3,485.6 3,558.3
Wireless 1,734.0 1,730.8 1,693.3 1,734.9 1,764.3 1,780.2
Fixed line 1,507.5 1,485.3 1,440.2 1,447.8 1,403.8 1,388.9
Media/Contents 130.3 132.2 146.7 160.3 158.6 162.4
Finance/Rental
Other service 307.1 212.2 190.8 206.2 158.9 226.8
Merchandise rev. 1,111.8 798.7 680.4 1,086.9 975.2 884.2
Operating expense 4,554.6 4,165.8 4,004.3 4,902.4 4,438.4 5,399.0
Service expense 3,438.4 3,389.5 3,314.4 3,745.0 3,495.1 4,488.3
Labor expense 641.2 635.0 627.0 653.8 631.1 1,565.8
General expense 1,563.2 1,607.2 1,583.1 1,789.9 1,588.2 1,635.5
Depreciation 732.4 723.0 725.0 751.2 758.0 750.8
Commissions 324.8 345.6 328.5 404.7 328.4 360.1
Advertising 30.2 39.1 44.3 48.1 28.8 35.8
Other general exp 475.9 499.5 485.3 585.9 473.0 488.7
Cost of svc provided 541.3 510.6 496.1 583.6 483.7 515.4
Cost of service 192.3 203.3 207.4 243.0 204.3 235.7
Interconnection fees 202.0 209.5 210.0 264.3 215.7 222.2
Other cost of service 147.0 97.8 78.7 76.3 63.8 57.4
Selling expense 692.6 636.7 608.1 717.7 792.0 771.7
Sales expense 656.6 597.5 566.5 692.8 764.5 747.7
Bad debt expense 36.0 39.3 41.7 24.9 27.5 24.0
Cost of merch sold 1,116.2 776.3 689.9 1,157.5 943.4 910.6
Operating income 236.0 193.2 147.0 -266.3 22.4 -956.5
EBITDA 968.4 916.2 872.0 484.9 780.4 -205.7
N-OP income (loss) -70.1 -149.6 -100.4 -514.6 -28.3 -170.2
N-operating income 245.5 127.3 9.2 184.3 221.2 146.9
N-operating expense 315.5 276.9 109.6 698.9 249.5 317.1
Income bf taxes 166.0 43.6 46.6 -780.9 -5.9 -1,126.7
Income tax 26.2 9.1 6.1 -173.8 -1.5 -257.0
Net income 139.8 34.5 40.5 -607.1 -4.4 -869.7
16
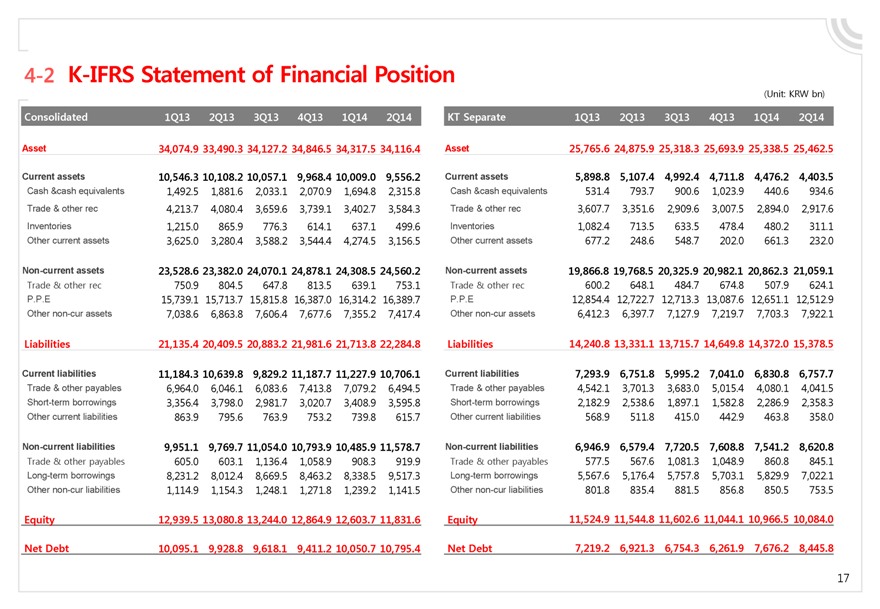
4-2 K-IFRS Statement of Financial Position
Consolidated 1Q13 2Q13 3Q13 4Q13 1Q14 2Q14
Asset 34,074.9 33,490.3 34,127.2 34,846.5 34,317.5 34,116.4
Current assets 10,546.3 10,108.2 10,057.1 9,968.4 10,009.0 9,556.2
Cash &cash equivalents 1,492.5 1,881.6 2,033.1 2,070.9 1,694.8 2,315.8
Trade & other rec 4,213.7 4,080.4 3,659.6 3,739.1 3,402.7 3,584.3
Inventories 1,215.0 865.9 776.3 614.1 637.1 499.6
Other current assets 3,625.0 3,280.4 3,588.2 3,544.4 4,274.5 3,156.5
Non-current assets 23,528.6 23,382.0 24,070.1 24,878.1 24,308.5 24,560.2
Trade & other rec 750.9 804.5 647.8 813.5 639.1 753.1
P.P.E 15,739.1 15,713.7 15,815.8 16,387.0 16,314.2 16,389.7
Other non-cur assets 7,038.6 6,863.8 7,606.4 7,677.6 7,355.2 7,417.4
Liabilities 21,135.4 20,409.5 20,883.2 21,981.6 21,713.8 22,284.8
Current liabilities 11,184.3 10,639.8 9,829.2 11,187.7 11,227.9 10,706.1
Trade & other payables 6,964.0 6,046.1 6,083.6 7,413.8 7,079.2 6,494.5
Short-term borrowings 3,356.4 3,798.0 2,981.7 3,020.7 3,408.9 3,595.8
Other current liabilities 863.9 795.6 763.9 753.2 739.8 615.7
Non-current liabilities 9,951.1 9,769.7 11,054.0 10,793.9 10,485.9 11,578.7
Trade & other payables 605.0 603.1 1,136.4 1,058.9 908.3 919.9
Long-term borrowings 8,231.2 8,012.4 8,669.5 8,463.2 8,338.5 9,517.3
Other non-cur liabilities 1,114.9 1,154.3 1,248.1 1,271.8 1,239.2 1,141.5
Equity 12,939.5 13,080.8 13,244.0 12,864.9 12,603.7 11,831.6
Net Debt 10,095.1 9,928.8 9,618.1 9,411.2 10,050.7 10,795.4
(Unit: KRW bn)
KT Separate 1Q13 2Q13 3Q13 4Q13 1Q14 2Q14
Asset 25,765.6 24,875.9 25,318.3 25,693.9 25,338.5 25,462.5
Current assets 5,898.8 5,107.4 4,992.4 4,711.8 4,476.2 4,403.5
Cash &cash equivalents 531.4 793.7 900.6 1,023.9 440.6 934.6
Trade & other rec 3,607.7 3,351.6 2,909.6 3,007.5 2,894.0 2,917.6
Inventories 1,082.4 713.5 633.5 478.4 480.2 311.1
Other current assets 677.2 248.6 548.7 202.0 661.3 232.0
Non-current assets 19,866.8 19,768.5 20,325.9 20,982.1 20,862.3 21,059.1
Trade & other rec 600.2 648.1 484.7 674.8 507.9 624.1
P.P.E 12,854.4 12,722.7 12,713.3 13,087.6 12,651.1 12,512.9
Other non-cur assets 6,412.3 6,397.7 7,127.9 7,219.7 7,703.3 7,922.1
Liabilities 14,240.8 13,331.1 13,715.7 14,649.8 14,372.0 15,378.5
Current liabilities 7,293.9 6,751.8 5,995.2 7,041.0 6,830.8 6,757.7
Trade & other payables 4,542.1 3,701.3 3,683.0 5,015.4 4,080.1 4,041.5
Short-term borrowings 2,182.9 2,538.6 1,897.1 1,582.8 2,286.9 2,358.3
Other current liabilities 568.9 511.8 415.0 442.9 463.8 358.0
Non-current liabilities 6,946.9 6,579.4 7,720.5 7,608.8 7,541.2 8,620.8
Trade & other payables 577.5 567.6 1,081.3 1,048.9 860.8 845.1
Long-term borrowings 5,567.6 5,176.4 5,757.8 5,703.1 5,829.9 7,022.1
Other non-cur liabilities 801.8 835.4 881.5 856.8 850.5 753.5
Equity 11,524.9 11,544.8 11,602.6 11,044.1 10,966.5 10,084.0
Net Debt 7,219.2 6,921.3 6,754.3 6,261.9 7,676.2 8,445.8
17
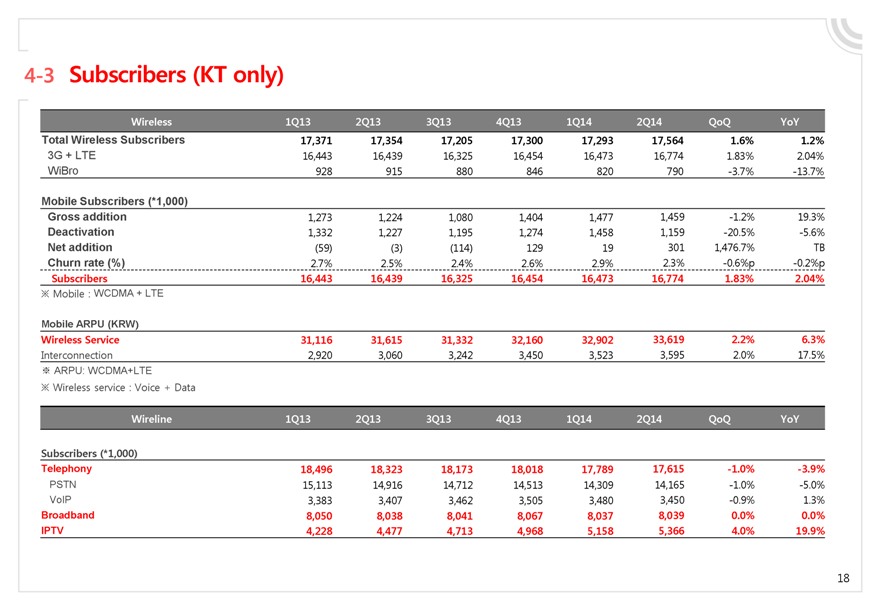
4-3 Subscribers (KT only)
Wireless 1Q13 2Q13 3Q13 4Q13 1Q14 2Q14 QoQ YoY
Total Wireless Subscribers 17,371 17,354 17,205 17,300 17,293 17,564 1.6% 1.2%
3G + LTE 16,443 16,439 16,325 16,454 16,473 16,774 1.83% 2.04%
WiBro 928 915 880 846 820 790 -3.7% -13.7%
Mobile Subscribers (*1,000)
Gross addition 1,273 1,224 1,080 1,404 1,477 1,459 -1.2% 19.3%
Deactivation 1,332 1,227 1,195 1,274 1,458 1,159 -20.5% -5.6%
Net addition (59) (3) (114) 129 19 301 1,476.7% TB
Churn rate (%) 2.7% 2.5% 2.4% 2.6% 2.9% 2.3% -0.6%p -0.2%p
Subscribers 16,443 16,439 16,325 16,454 16,473 16,774 1.83% 2.04%
Mobile : WCDMA + LTE
Mobile ARPU (KRW)
Wireless Service 31,116 31,615 31,332 32,160 32,902 33,619 2.2% 6.3%
Interconnection 2,920 3,060 3,242 3,450 3,523 3,595 2.0% 17.5%
ARPU: WCDMA+LTE
Wireless service : Voice + Data
Wireline 1Q13 2Q13 3Q13 4Q13 1Q14 2Q14 QoQ YoY
Subscribers (*1,000)
Telephony 18,496 18,323 18,173 18,018 17,789 17,615 -1.0% -3.9%
PSTN 15,113 14,916 14,712 14,513 14,309 14,165 -1.0% -5.0%
VoIP 3,383 3,407 3,462 3,505 3,480 3,450 -0.9% 1.3%
Broadband 8,050 8,038 8,041 8,067 8,037 8,039 0.0% 0.0%
IPTV 4,228 4,477 4,713 4,968 5,158 5,366 4.0% 19.9%
18
Thank you
kt