SECURITIES AND EXCHANGE COMMISSION
Washington, D.C. 20549
Form 6-K
REPORT OF FOREIGN PRIVATE ISSUER
PURSUANT TO RULE 13a-16 OR 15d-16 OF
THE SECURITIES EXCHANGE ACT OF 1934
For the month of October 2014
Commission File Number 1-14926
KT Corporation
(Translation of registrant’s name into English)
90, Buljeong-ro,
Bundang-gu, Seongnam-si,
Gyeonggi-do,
Korea
(Address of principal executive offices)
Indicate by check mark whether the registrant files or will file annual reports under cover of Form 20-F or Form 40-F:
Form 20-F x Form 40-F ¨
Indicate by check mark if the registrant is submitting the Form 6-K in paper as permitted by Regulation S-T Rule 101(b)(1): ¨
Indicate by check mark if the registrant is submitting the Form 6-K in paper as permitted by Regulation S-T Rule 101(b)(7): ¨
Indicate by check mark whether by furnishing the information contained in this Form, the registrant is also thereby furnishing the information to the Commission pursuant to Rule 12g3-2(b) under the Securities Exchange Act of 1934.
Yes ¨ No x
If “Yes” is marked, indicate below the file number assigned to the registrant in connection with Rule 12g3-2(b): 82- ¨
SIGNATURES
Pursuant to the requirements of the Securities Exchange Act of 1934, the registrant has duly caused this report to be signed on its behalf by the undersigned, thereunto duly authorized.
| Dated: Oct 31, 2014 | ||
| KT Corporation | ||
| By: | /s/ Youngwoo Kim | |
| Name: | Youngwoo Kim | |
| Title: | Vice President | |
| By: | /s/ Jungsup Jung | |
| Name: | Jungsup Jung | |
| Title: | Director | |
KT 3Q14 Earnings Release Investor Relations 2014. 10. 31
Disclaimer This presentation has been prepared by KT Corp. (“the Company”). This presentation contains forward-looking statements, which are subject to risks, uncertainties, and assumptions. This presentation is being presented solely for your information and is subject to change without notice. No representation or warranty, expressed or implied, is made and no reliance should be placed on the accuracy, actuality, fairness, or completeness of the information presented. Please be informed that items included in our operating income have been prepared in accordance with K-IFRS 1001 released on October 17, 2012, which was revised to coincide with the Korean Accounting Standards for Non-Public Entities (“KAS-NPEs”). As such, our disposal gains from real estates and others have been excluded from our operating income. The Company, its affiliates or representatives accept no liability whatsoever for any losses arising from any information contained in the presentation. This presentation does not constitute an offer or invitation to purchase or subscribe for any shares of the Company, and no part of this presentation shall form the Basis of or be relied upon in connection with any contract or commitment. Any decision to purchase shares of the Company should be made solely on the Basis of information, which has been publicly filed with the Securities and Exchange Commission or the Korea Stock Exchange and distributed to all investors. The contents of this presentation may not be reproduced, redistributed or passed on, directly or indirectly, to any other person or published, in whole or in part, for any purpose. If you have any related questions to this material, please contact IR department. Tel : 82-2-3495-3557, 3564, 5529, 5343, 5344 Fax : 82-2-3495-5914 2
Contents 1 Financial Highlights 2 Business Overview 3 Q&A 4 Appendix 3
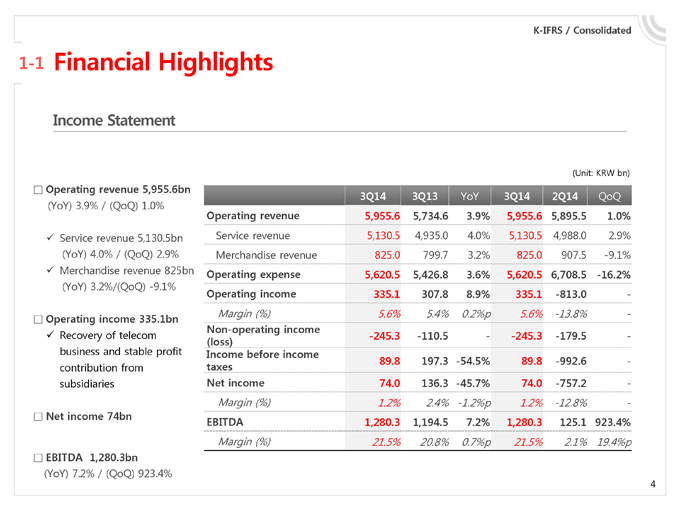
K-IFRS / Consolidated 1-1 Financial Highlights Income Statement (Unit: KRW bn) Operating revenue 5,955.6bn 3Q14 3Q13 YoY 3Q14 2Q14 QoQ (YoY) 3.9% / (QoQ) 1.0% Operating revenue 5,955.6 5,734.6 3.9% 5,955.6 5,895.5 1.0% ? Service revenue 5,130.5bn Service revenue 5,130.5 4,935.0 4.0% 5,130.5 4,988.0 2.9% (YoY) 4.0% / (QoQ) 2.9% Merchandise revenue 825.0 799.7 3.2% 825.0 907.5 -9.1% ? Merchandise revenue 825bn Operating expense 5,620.5 5,426.8 3.6% 5,620.5 6,708.5 -16.2% (YoY) 3.2%/(QoQ) -9.1% Operating income 335.1 307.8 8.9% 335.1 -813.0— Operating income 335.1bn Margin (%) 5.6% 5.4% 0.2%p 5.6% -13.8%—Non-operating income ? Recovery of telecom -245.3 -110.5 —245.3 -179.5 -(loss) business and stable profit Income before income 89.8 197.3 -54.5% 89.8 -992.6 -contribution from taxes subsidiaries Net income 74.0 136.3 -45.7% 74.0 -757.2—Margin (%) 1.2% 2.4% -1.2%p 1.2% -12.8%— Net income 74bn EBITDA 1,280.3 1,194.5 7.2% 1,280.3 125.1 923.4% Margin (%) 21.5% 20.8% 0.7%p 21.5% 2.1% 19.4%p EBITDA 1,280.3bn (YoY) 7.2% / (QoQ) 923.4% 4
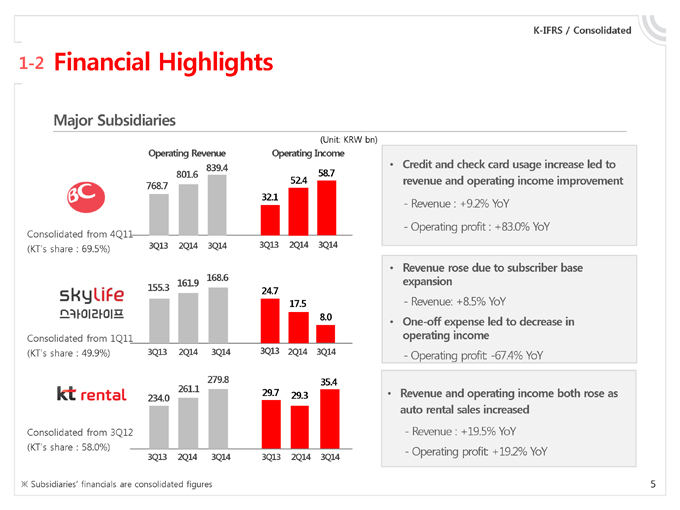
K-IFRS / Consolidated 1-2 Financial Highlights Major Subsidiaries (Unit: KRW bn) Operating Revenue Operating Income 839.4 • Credit and check card usage increase led to 801.6 58.7 52.4 revenue and operating income improvement 768.7 32.1—Revenue : +9.2% YoY—Operating profit : +83.0% YoY Consolidated from 4Q11 (KT’s share : 69.5%) 3Q13 2Q14 3Q14 3Q13 2Q14 3Q14 • Revenue rose due to subscriber base 168.6 expansion 155.3 161.9 24.7 17.5—Revenue: +8.5% YoY 8.0 One • -off expense led to decrease in Consolidated from 1Q11 operating income (KT’s share : 49.9%) 3Q13 2Q14 3Q14 3Q13 2Q14 3Q14—Operating profit: -67.4% YoY 279.8 35.4 261.1 29.7 • Revenue and operating income both rose as 234.0 29.3 auto rental sales increased Consolidated from 3Q12—Revenue : +19.5% YoY (KT’s share : 58.0%) 3Q13 2Q14 3Q14 3Q13 2Q14 3Q14—Operating profit: +19.2% YoY ? Subsidiaries’ financials are consolidated figures 5
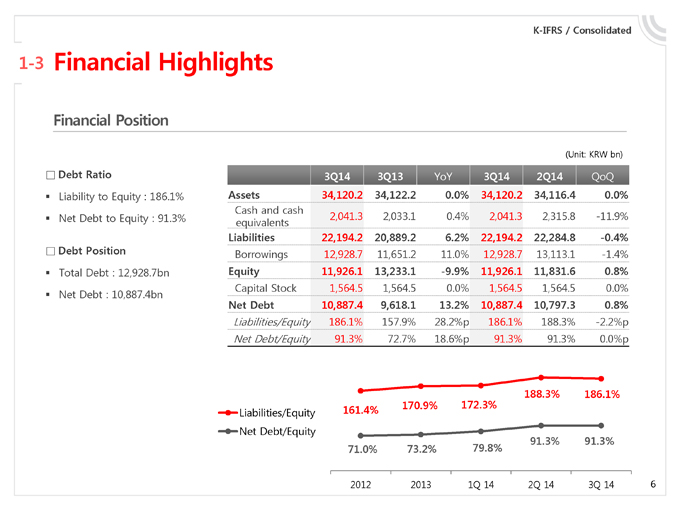
K-IFRS / Consolidated 1-3 Financial Highlights Financial Position (Unit: KRW bn) Debt Ratio 3Q14 3Q13 YoY 3Q14 2Q14 QoQ Liability to Equity : 186.1% Assets 34,120.2 34,122.2 0.0% 34,120.2 34,116.4 0.0% Cash and cash Net Debt to Equity : 91.3% 2,041.3 2,033.1 0.4% 2,041.3 2,315.8 -11.9% equivalents Liabilities 22,194.2 20,889.2 6.2% 22,194.2 22,284.8 -0.4% Debt Position Borrowings 12,928.7 11,651.2 11.0% 12,928.7 13,113.1 -1.4% Total Debt : 12,928.7bn Equity 11,926.1 13,233.1 -9.9% 11,926.1 11,831.6 0.8% Capital Stock 1,564.5 1,564.5 0.0% 1,564.5 1,564.5 0.0% Net Debt : 10,887.4bn Net Debt 10,887.4 9,618.1 13.2% 10,887.4 10,797.3 0.8% Liabilities/Equity 186.1% 157.9% 28.2%p 186.1% 188.3% -2.2%p Net Debt/Equity 91.3% 72.7% 18.6%p 91.3% 91.3% 0.0%p 188.3% 186.1% 161.4% 170.9% 172.3% Liabilities/Equity Net Debt/Equity 91.3% 91.3% 71.0% 73.2% 79.8% 2012 2013 1Q 14 2Q 14 3Q 14 6
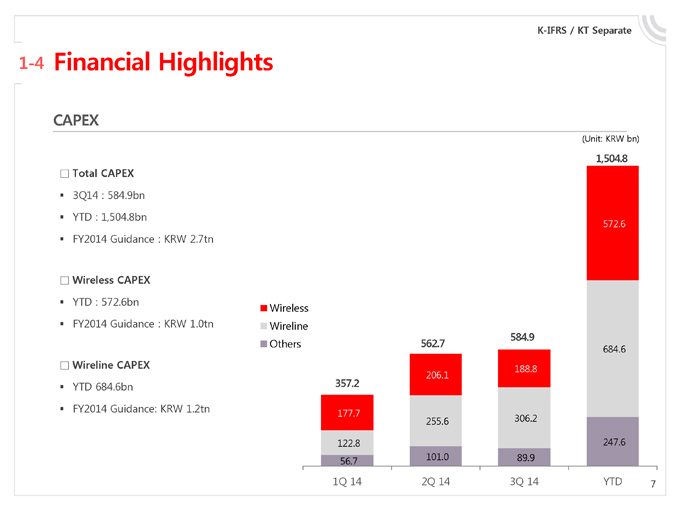
K-IFRS / KT Separate 1-4 Financial Highlights CAPEX (Unit: KRW bn) 1,504.8 Total CAPEX 3Q14 : 584.9bn YTD : 1,504.8bn 572.6 FY2014 Guidance : KRW 2.7tn Wireless CAPEX YTD : 572.6bn Wireless FY2014 Guidance : KRW 1.0tn Wireline 584.9 Others 562.7 684.6 Wireline CAPEX 206.1 188.8 YTD 684.6bn 357.2 FY2014 Guidance: KRW 1.2tn 177.7 255.6 306.2 122.8 247.6 56.7 101.0 89.9 1Q 14 2Q 14 3Q 14 YTD 7
1 Financial Highlights 2 Business Overview 3 Q&A 4 Appendix 8
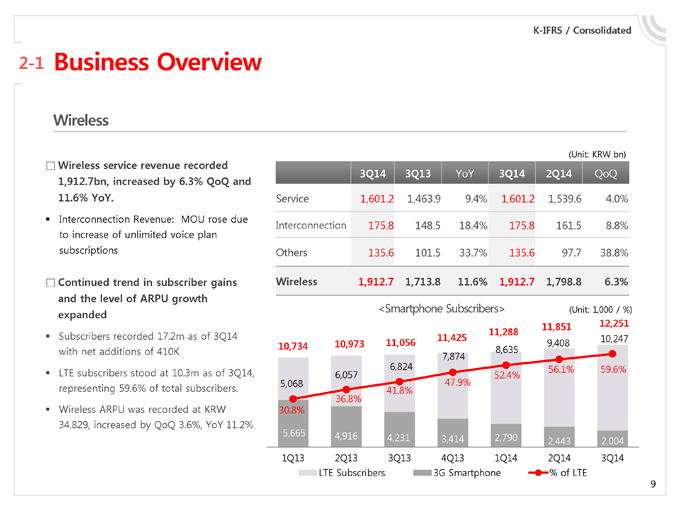
K-IFRS / Consolidated 2-1 Business Overview Wireless Wireless service revenue recorded (Unit: KRW bn) 3Q14 3Q13 YoY 3Q14 2Q14 QoQ 1,912.7bn, increased by 6.3% QoQ and 11.6% YoY. Service 1,601.2 1,463.9 9.4% 1,601.2 1,539.6 4.0% Interconnection Revenue: MOU rose due Interconnection 175.8 148.5 18.4% 175.8 161.5 8.8% to increase of unlimited voice plan subscriptions Others 135.6 101.5 33.7% 135.6 97.7 38.8% Continued trend in subscriber gains Wireless 1,912.7 1,713.8 11.6% 1,912.7 1,798.8 6.3% and the level of ARPU growth <Smartphone Subscribers> (Unit: 1,000 / %) expanded 11,851 12,251 Subscribers recorded 17.2m as of 3Q14 11,288 11,056 11,425 10,247 10,734 10,973 9,408 with net additions of 410K 8,635 6,824 7,874 LTE subscribers stood at 10.3m as of 3Q14, 56.1% 59.6% 6,057 52.4% 5,068 47.9% representing 59.6% of total subscribers. 36.8% 41.8% Wireless ARPU was recorded at KRW 30.8% 34,829, increased by QoQ 3.6%, YoY 11.2% 5,665 4,916 4,231 2,790 3,414 2,443 2,004 1Q13 2Q13 3Q13 4Q13 1Q14 2Q14 3Q14 LTE Subscribers 3G Smartphone % of LTE 9
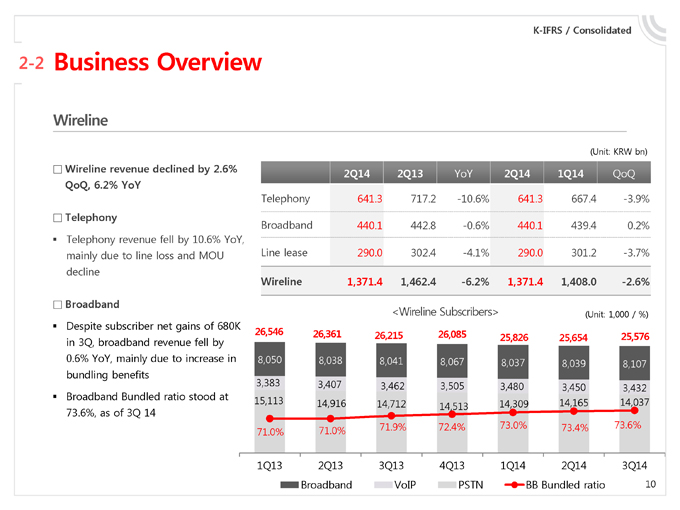
K-IFRS / Consolidated 2-2 Business Overview Wireline (Unit: KRW bn) Wireline revenue declined by 2.6% 2Q14 2Q13 YoY 2Q14 1Q14 QoQ QoQ, 6.2% YoY Telephony 641.3 717.2 -10.6% 641.3 667.4 -3.9% Telephony Broadband 440.1 442.8 -0.6% 440.1 439.4 0.2% Telephony revenue fell by 10.6% YoY, mainly due to line loss and MOU Line lease 290.0 302.4 -4.1% 290.0 301.2 -3.7% decline Wireline 1,371.4 1,462.4 -6.2% 1,371.4 1,408.0 -2.6% Broadband <Wireline Subscribers> (Unit: 1,000 / %) Despite subscriber net gains of 680K 26,546 26,361 26,215 26,085 25,826 25,654 25,576 in 3Q, broadband revenue fell by 0.6% YoY, mainly due to increase in 8,050 8,038 8,041 8,067 8,037 8,039 8,107 bundling benefits 3,383 3,407 3,462 3,505 3,480 3,450 3,432 Broadband Bundled ratio stood at 15,113 14,916 14,712 14,513 14,309 14,165 14,037 73.6%, as of 3Q 14 71.9% 72.4% 73.0% 73.4% 73.6% 71.0% 71.0% 1Q13 2Q13 3Q13 4Q13 1Q14 2Q14 3Q14 Broadband VoIP PSTN BB Bundled ratio 10
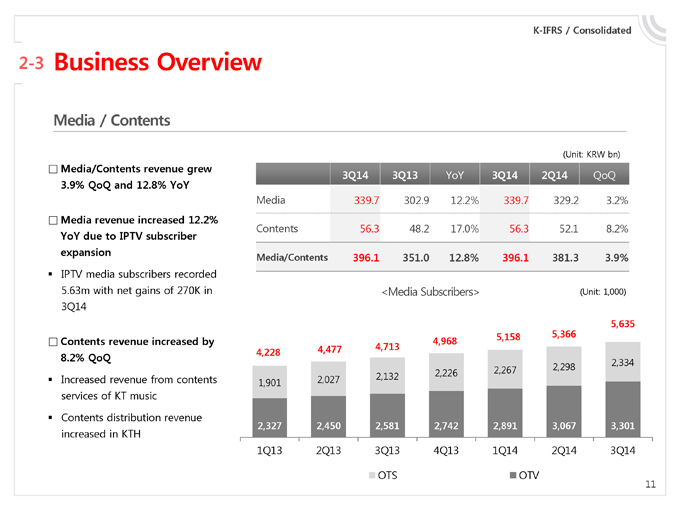
K-IFRS / Consolidated 2-3 Business Overview Media / Contents (Unit: KRW bn) Media/Contents revenue grew 3Q14 3Q13 YoY 3Q14 2Q14 QoQ 3.9% QoQ and 12.8% YoY Media 339.7 302.9 12.2% 339.7 329.2 3.2% Media revenue increased 12.2% Contents 56.3 48.2 17.0% 56.3 52.1 8.2% YoY due to IPTV subscriber expansion Media/Contents 396.1 351.0 12.8% 396.1 381.3 3.9% IPTV media subscribers recorded 5.63m with net gains of 270K in <Media Subscribers> (Unit: 1,000) 3Q14 5,366 5,635 Contents revenue increased by 4,968 5,158 4,477 4,713 8.2% QoQ 4,228 2,334 2,267 2,298 2,132 2,226 Increased revenue from contents 1,901 2,027 services of KT music Contents distribution revenue 2,327 2,450 2,581 2,742 2,891 3,067 3,301 increased in KTH 1Q13 2Q13 3Q13 4Q13 1Q14 2Q14 3Q14 OTS OTV 11
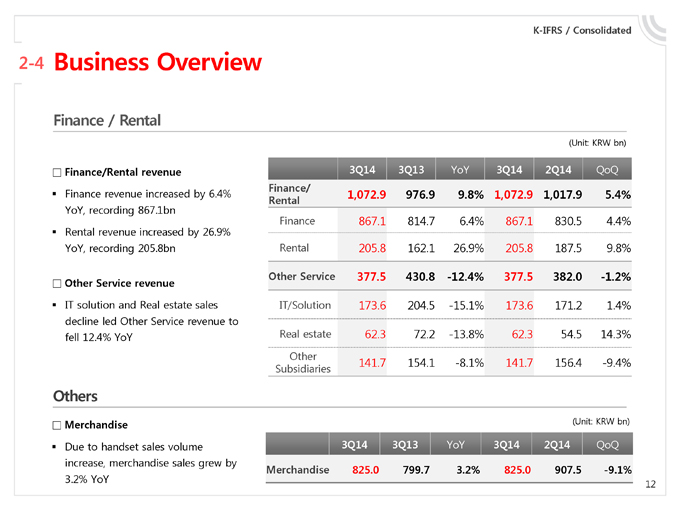
K-IFRS / Consolidated 2-4 Business Overview Finance / Rental (Unit: KRW bn) Finance/Rental revenue 3Q14 3Q13 YoY 3Q14 2Q14 QoQ Finance/ Finance revenue increased by 6.4% 1,072.9 976.9 9.8% 1,072.9 1,017.9 5.4% Rental YoY, recording 867.1bn Finance 867.1 814.7 6.4% 867.1 830.5 4.4% Rental revenue increased by 26.9% YoY, recording 205.8bn Rental 205.8 162.1 26.9% 205.8 187.5 9.8% Other Service 377.5 430.8 -12.4% 377.5 382.0 -1.2% Other Service revenue IT solution and Real estate sales IT/Solution 173.6 204.5 -15.1% 173.6 171.2 1.4% decline led Other Service revenue to fell 12.4% YoY Real estate 62.3 72.2 -13.8% 62.3 54.5 14.3% Other Subsidiaries 141.7 154.1 -8.1% 141.7 156.4 -9.4% Others Merchandise (Unit: KRW bn) Due to handset sales volume 3Q14 3Q13 YoY 3Q14 2Q14 QoQ increase, merchandise sales grew by Merchandise 825.0 799.7 3.2% 825.0 907.5 -9.1% 3.2% YoY 12
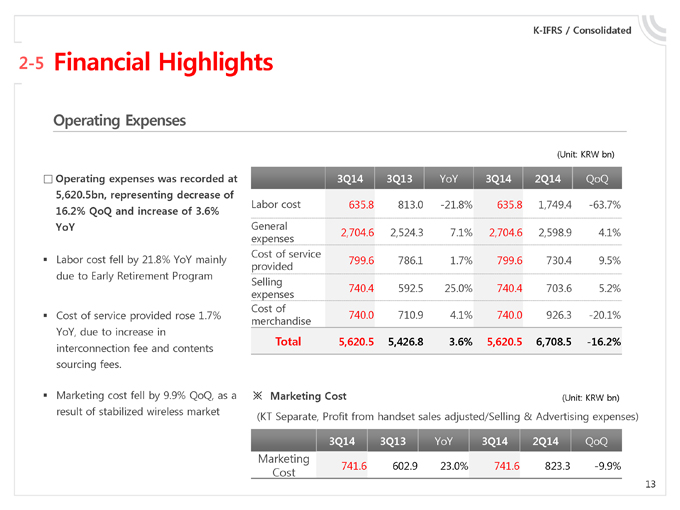
K-IFRS / Consolidated 2-5 Financial Highlights Operating Expenses (Unit: KRW bn) Operating expenses was recorded at 3Q14 3Q13 YoY 3Q14 2Q14 QoQ 5,620.5bn, representing decrease of Labor cost 635.8 813.0 -21.8% 635.8 1,749.4 -63.7% 16.2% QoQ and increase of 3.6% YoY General 2,704.6 2,524.3 7.1% 2,704.6 2,598.9 4.1% expenses Cost of service Labor cost fell by 21.8% YoY mainly 799.6 786.1 1.7% 799.6 730.4 9.5% provided due to Early Retirement Program Selling 740.4 592.5 25.0% 740.4 703.6 5.2% expenses Cost of Cost of service provided rose 1.7% 740.0 710.9 4.1% 740.0 926.3 -20.1% merchandise YoY, due to increase in Total 5,620.5 5,426.8 3.6% 5,620.5 6,708.5 -16.2% interconnection fee and contents sourcing fees. Marketing cost fell by 9.9% QoQ, as a ? Marketing Cost (Unit: KRW bn) result of stabilized wireless market (KT Separate, Profit from handset sales adjusted/Selling & Advertising expenses) 3Q14 3Q13 YoY 3Q14 2Q14 QoQ Marketing 741.6 602.9 23.0% 741.6 823.3 -9.9% Cost 13
1 Financial Highlights 2 Business Overview 3 Q&A 4 Appendix 14
1 Financial Highlights 2 Business Overview 3 Q&A 4 Appendix 15
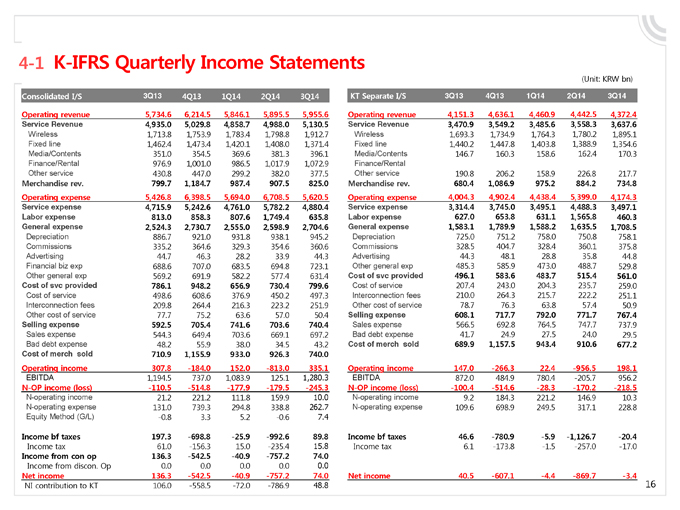
4-1 K-IFRS Quarterly Income Statements (Unit: KRW bn) Consolidated I/S 3Q13 4Q13 1Q14 2Q14 3Q14 KT Separate I/S 3Q13 4Q13 1Q14 2Q14 3Q14 Operating revenue 5,734.6 6,214.5 5,846.1 5,895.5 5,955.6 Operating revenue 4,151.3 4,636.1 4,460.9 4,442.5 4,372.4 Service Revenue 4,935.0 5,029.8 4,858.7 4,988.0 5,130.5 Service Revenue 3,470.9 3,549.2 3,485.6 3,558.3 3,637.6 Wireless 1,713.8 1,753.9 1,783.4 1,798.8 1,912.7 Wireless 1,693.3 1,734.9 1,764.3 1,780.2 1,895.1 Fixed line 1,462.4 1,473.4 1,420.1 1,408.0 1,371.4 Fixed line 1,440.2 1,447.8 1,403.8 1,388.9 1,354.6 Media/Contents 351.0 354.5 369.6 381.3 396.1 Media/Contents 146.7 160.3 158.6 162.4 170.3 Finance/Rental 976.9 1,001.0 986.5 1,017.9 1,072.9 Finance/Rental Other service 430.8 447.0 299.2 382.0 377.5 Other service 190.8 206.2 158.9 226.8 217.7 Merchandise rev. 799.7 1,184.7 987.4 907.5 825.0 Merchandise rev. 680.4 1,086.9 975.2 884.2 734.8 4,004.3 4,902.4 4,438.4 5,399.0 Operating expense 5,426.8 6,398.5 5,694.0 6,708.5 5,620.5 Operating expense 4,174.3 Service expense 4,715.9 5,242.6 4,761.0 5,782.2 4,880.4 Service expense 3,314.4 3,745.0 3,495.1 4,488.3 3,497.1 Labor expense 813.0 858.3 807.6 1,749.4 635.8 Labor expense 627.0 653.8 631.1 1,565.8 460.3 General expense 2,524.3 2,730.7 2,555.0 2,598.9 2,704.6 General expense 1,583.1 1,789.9 1,588.2 1,635.5 1,708.5 Depreciation 886.7 921.0 931.8 938.1 945.2 Depreciation 725.0 751.2 758.0 750.8 758.1 Commissions 335.2 364.6 329.3 354.6 360.6 Commissions 328.5 404.7 328.4 360.1 375.8 Advertising 44.7 46.3 28.2 33.9 44.3 Advertising 44.3 48.1 28.8 35.8 44.8 Financial biz exp 688.6 707.0 683.5 694.8 723.1 Other general exp 485.3 585.9 473.0 488.7 529.8 Other general exp 569.2 691.9 582.2 577.4 631.4 Cost of svc provided 496.1 583.6 483.7 515.4 561.0 Cost of svc provided 786.1 948.2 656.9 730.4 799.6 Cost of service 207.4 243.0 204.3 235.7 259.0 Cost of service 498.6 608.6 376.9 450.2 497.3 Interconnection fees 210.0 264.3 215.7 222.2 251.1 Interconnection fees 209.8 264.4 216.3 223.2 251.9 Other cost of service 78.7 76.3 63.8 57.4 50.9 Other cost of service 77.7 75.2 63.6 57.0 50.4 Selling expense 608.1 717.7 792.0 771.7 767.4 Selling expense 592.5 705.4 741.6 703.6 740.4 Sales expense 566.5 692.8 764.5 747.7 737.9 Sales expense 544.3 649.4 703.6 669.1 697.2 Bad debt expense 41.7 24.9 27.5 24.0 29.5 Bad debt expense 48.2 55.9 38.0 34.5 43.2 Cost of merch sold 689.9 1,157.5 943.4 910.6 677.2 Cost of merch sold 710.9 1,155.9 933.0 926.3 740.0 Operating income 307.8 -184.0 152.0 -813.0 335.1 Operating income 147.0 -266.3 22.4 -956.5 198.1 EBITDA 1,194.5 737.0 1,083.9 125.1 1,280.3 EBITDA 872.0 484.9 780.4 -205.7 956.2 N-OP income (loss) -110.5 -514.8 -177.9 -179.5 -245.3 N-OP income (loss) -100.4 -514.6 -28.3 -170.2 -218.5 N-operating income 21.2 221.2 111.8 159.9 10.0 N-operating income 9.2 184.3 221.2 146.9 10.3 N-operating expense 131.0 739.3 294.8 338.8 262.7 N-operating expense 109.6 698.9 249.5 317.1 228.8 Equity Method (G/L) -0.8 3.3 5.2 -0.6 7.4 Income bf taxes 197.3 -698.8 -25.9 -992.6 89.8 Income bf taxes 46.6 -780.9 -5.9 -1,126.7 -20.4 Income tax 61.0 -156.3 15.0 -235.4 15.8 Income tax 6.1 -173.8 -1.5 -257.0 -17.0 Income from con op 136.3 -542.5 -40.9 -757.2 74.0 Income from discon. Op 0.0 0.0 0.0 0.0 0.0 Net income 136.3 -542.5 -40.9 -757.2 74.0 Net income 40.5 -607.1 -4.4 -869.7 -3.4 NI contribution to KT 106.0 -558.5 -72.0 -786.9 48.8 16
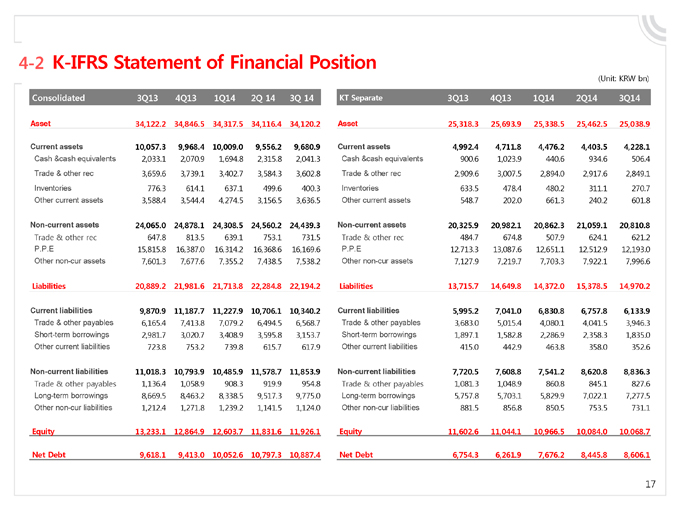
4-2 K-IFRS Statement of Financial Position (Unit: KRW bn) Consolidated 3Q13 4Q13 1Q14 2Q 14 3Q 14 KT Separate 3Q13 4Q13 1Q14 2Q14 3Q14 Asset 34,122.2 34,846.5 34,317.5 34,116.4 34,120.2 Asset 25,318.3 25,693.9 25,338.5 25,462.5 25,038.9 Current assets 10,057.3 9,968.4 10,009.0 9,556.2 9,680.9 Current assets 4,992.4 4,711.8 4,476.2 4,403.5 4,228.1 Cash &cash equivalents 2,033.1 2,070.9 1,694.8 2,315.8 2,041.3 Cash &cash equivalents 900.6 1,023.9 440.6 934.6 506.4 Trade & other rec 3,659.6 3,739.1 3,402.7 3,584.3 3,602.8 Trade & other rec 2,909.6 3,007.5 2,894.0 2,917.6 2,849.1 Inventories 776.3 614.1 637.1 499.6 400.3 Inventories 633.5 478.4 480.2 311.1 270.7 Other current assets 3,588.4 3,544.4 4,274.5 3,156.5 3,636.5 Other current assets 548.7 202.0 661.3 240.2 601.8 Non-current assets 24,065.0 24,878.1 24,308.5 24,560.2 24,439.3 Non-current assets 20,325.9 20,982.1 20,862.3 21,059.1 20,810.8 Trade & other rec 647.8 813.5 639.1 753.1 731.5 Trade & other rec 484.7 674.8 507.9 624.1 621.2 P.P.E 15,815.8 16,387.0 16,314.2 16,368.6 16,169.6 P.P.E 12,713.3 13,087.6 12,651.1 12,512.9 12,193.0 Other non-cur assets 7,601.3 7,677.6 7,355.2 7,438.5 7,538.2 Other non-cur assets 7,127.9 7,219.7 7,703.3 7,922.1 7,996.6 Liabilities 20,889.2 21,981.6 21,713.8 22,284.8 22,194.2 Liabilities 13,715.7 14,649.8 14,372.0 15,378.5 14,970.2 Current liabilities 9,870.9 11,187.7 11,227.9 10,706.1 10,340.2 Current liabilities 5,995.2 7,041.0 6,830.8 6,757.8 6,133.9 Trade & other payables 6,165.4 7,413.8 7,079.2 6,494.5 6,568.7 Trade & other payables 3,683.0 5,015.4 4,080.1 4,041.5 3,946.3 Short-term borrowings 2,981.7 3,020.7 3,408.9 3,595.8 3,153.7 Short-term borrowings 1,897.1 1,582.8 2,286.9 2,358.3 1,835.0 Other current liabilities 723.8 753.2 739.8 615.7 617.9 Other current liabilities 415.0 442.9 463.8 358.0 352.6 Non-current liabilities 11,018.3 10,793.9 10,485.9 11,578.7 11,853.9 Non-current liabilities 7,720.5 7,608.8 7,541.2 8,620.8 8,836.3 Trade & other payables 1,136.4 1,058.9 908.3 919.9 954.8 Trade & other payables 1,081.3 1,048.9 860.8 845.1 827.6 Long-term borrowings 8,669.5 8,463.2 8,338.5 9,517.3 9,775.0 Long-term borrowings 5,757.8 5,703.1 5,829.9 7,022.1 7,277.5 Other non-cur liabilities 1,212.4 1,271.8 1,239.2 1,141.5 1,124.0 Other non-cur liabilities 881.5 856.8 850.5 753.5 731.1 Equity 13,233.1 12,864.9 12,603.7 11,831.6 11,926.1 Equity 11,602.6 11,044.1 10,966.5 10,084.0 10,068.7 Net Debt 9,618.1 9,413.0 10,052.6 10,797.3 10,887.4 Net Debt 6,754.3 6,261.9 7,676.2 8,445.8 8,606.1 17
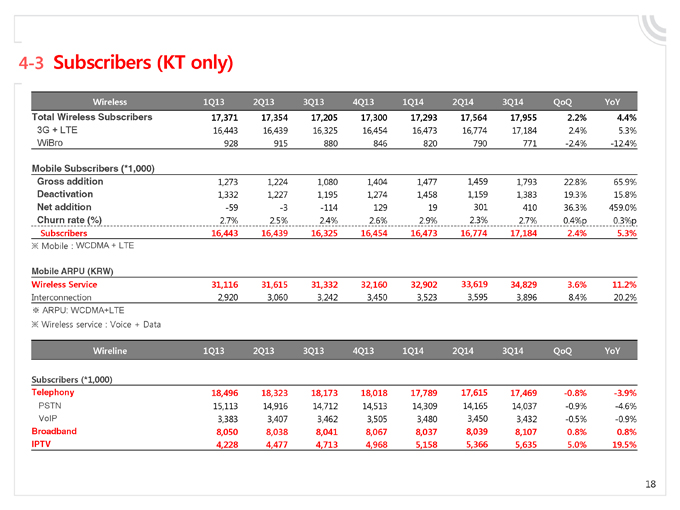
4-3 Subscribers (KT only) Wireless 1Q13 2Q13 3Q13 4Q13 1Q14 2Q14 3Q14 QoQ YoY Total Wireless Subscribers 17,371 17,354 17,205 17,300 17,293 17,564 17,955 2.2% 4.4% 3G + LTE 16,443 16,439 16,325 16,454 16,473 16,774 17,184 2.4% 5.3% WiBro 928 915 880 846 820 790 771 -2.4% -12.4% Mobile Subscribers (*1,000) Gross addition 1,273 1,224 1,080 1,404 1,477 1,459 1,793 22.8% 65.9% Deactivation 1,332 1,227 1,195 1,274 1,458 1,159 1,383 19.3% 15.8% Net addition -59 -3 -114 129 19 301 410 36.3% 459.0% Churn rate (%) 2.7% 2.5% 2.4% 2.6% 2.9% 2.3% 2.7% 0.4%p 0.3%p Subscribers 16,443 16,439 16,325 16,454 16,473 16,774 17,184 2.4% 5.3% Mobile : WCDMA + LTE Mobile ARPU (KRW) Wireless Service 31,116 31,615 31,332 32,160 32,902 33,619 34,829 3.6% 11.2% Interconnection 2,920 3,060 3,242 3,450 3,523 3,595 3,896 8.4% 20.2% ARPU: WCDMA+LTE Wireless service : Voice + Data Wireline 1Q13 2Q13 3Q13 4Q13 1Q14 2Q14 3Q14 QoQ YoY Subscribers (*1,000) Telephony 18,496 18,323 18,173 18,018 17,789 17,615 17,469 -0.8% -3.9% PSTN 15,113 14,916 14,712 14,513 14,309 14,165 14,037 -0.9% -4.6% VoIP 3,383 3,407 3,462 3,505 3,480 3,450 3,432 -0.5% -0.9% Broadband 8,050 8,038 8,041 8,067 8,037 8,039 8,107 0.8% 0.8% IPTV 4,228 4,477 4,713 4,968 5,158 5,366 5,635 5.0% 19.5% 18

Thank you