SECURITIES AND EXCHANGE COMMISSION
Washington, D.C. 20549
Form6-K
REPORT OF FOREIGN PRIVATE ISSUER
PURSUANT TO RULE13a-16 OR15d-16 OF
THE SECURITIES EXCHANGE ACT OF 1934
For the month of July 2017
Commission File Number1-14926
KT Corporation
(Translation of registrant’s name into English)
KT Gwanghwamun Building East
33, Jongno 3-gil,Jongno-gu
03155 Seoul, Korea
(Address of principal executive offices)
Indicate by check mark whether the registrant files or will file annual reports under cover of Form20-F or Form40-F:
Form20-F ☒ Form40-F ☐
Indicate by check mark if the registrant is submitting the Form6-K in paper as permitted by RegulationS-T Rule 101(b)(1): ☐
Indicate by check mark if the registrant is submitting the Form6-K in paper as permitted by RegulationS-T Rule 101(b)(7): ☐
Indicate by check mark whether by furnishing the information contained in this Form, the registrant is also thereby furnishing the information to the Commission pursuant to Rule12g3-2(b) under the Securities Exchange Act of 1934.
Yes ☐ No ☒
If “Yes” is marked, indicate below the file number assigned to the registrant in connection with Rule12g3-2(b):82-
SIGNATURES
Pursuant to the requirements of the Securities Exchange Act of 1934, the registrant has duly caused this report to be signed on its behalf by the undersigned, thereunto duly authorized.
| Dated: July 28, 2017 | ||
| KT Corporation | ||
| By: | /s/ Youngwoo Kim | |
| Name: | Youngwoo Kim | |
| Title: | Vice President | |
| By: | /s/ Jungsup Jung | |
| Name: | Jungsup Jung | |
| Title: | Director | |
 |
KT 2Q17 Earnings Release
Global No. 1 KT
Investor Relations| 2017. 7. 28.
 |
Disclaimer
This presentation has been prepared by KT Corp.(the Company”). This presentation contains forward-looking statements, which are subject to risks, uncertainties, and assumptions. This presentation is being presented solely for your information and is subject to change without notice. No presentation or warranty, expressed or implied, is made and no reliance should be placed on the accuracy, actuality, fairness, or completeness of the information presented.
Please be informed that items included in our operating income have been prepared in accordance withK-IFRS 1001 released on October 17, 2012, which was revised to coincide with the Korean Accounting Standards forNon-Public Entities(“KAS-NPEs”).
The Company, its affiliates or representatives accept no liability whatsoever for any losses arising from any information contained in the presentation. This presentation does not constitute an offer or invitation to purchase or subscribe for any shares of the Company, and no part of this presentation shall form the Basis of or be relied upon in connection with any contract or commitment.
Any decision to purchase shares of the Company could be made solely on the Basis of information, which has been publicly filed with the Securities and Exchange Commission or the Korea Stock Exchange and distributed to all investors.
The contents of this presentation may not be reproduced, redistributed or passed on, directly or indirectly, to any other person or published, in whole or in part, for any purpose.
If you have any related questions to this material, please contact IR department.
Tel :82-2-3495-3557, 3558, 3564, 5529, 5343, 5344
Fax :82-2-3495-5917
 |
Contents
| 1 | Financial Highlights |
| 2 | Business Overview |
| 3 | Q&A |
| 4 | Appendix |
 |
K-IFRS / Consolidated
1-1 Financial Highlights
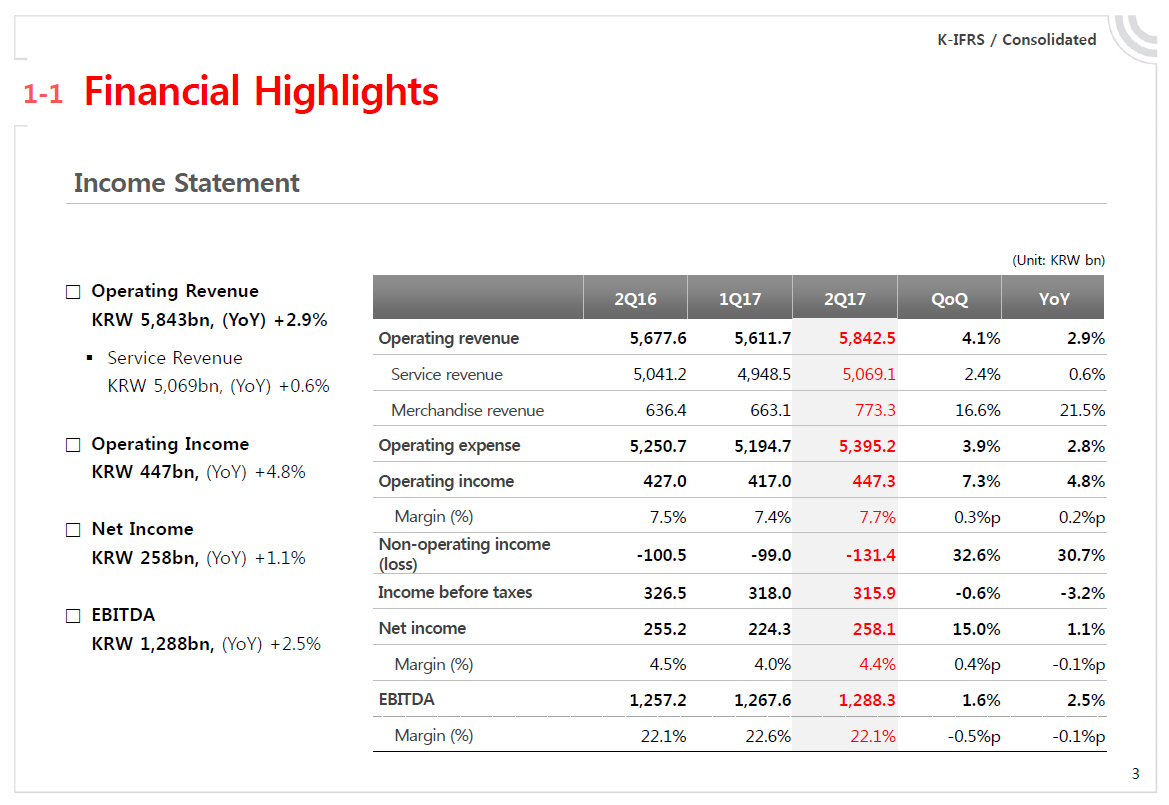
Income Statement (Unit: KRW bn) ? Operating Revenue 2Q16 1Q17 2Q17 QoQ YoY KRW 5,843bn, (YoY) +2.9% Operating revenue 5,677.6 5,611.7 5,842.5 4.1% 2.9% ◾ Service Revenue KRW 5,069bn, (YoY) +0.6% Service revenue 5,041.2 4,948.5 5,069.1 2.4% 0.6% Merchandise revenue 636.4 663.1 773.3 16.6% 21.5% ? Operating Income Operating expense 5,250.7 5,194.7 5,395.2 3.9% 2.8% KRW 447bn, (YoY) +4.8% Operating income 427.0 417.0 447.3 7.3% 4.8% ? Net Income Margin (%) 7.5% 7.4% 7.7% 0.3%p 0.2%pNon-operating income KRW 258bn, (YoY) +1.1% (loss) -100.5 -99.0 -131.4 32.6% 30.7% Income before taxes 326.5 318.0 315.9 -0.6% -3.2% ? EBITDA Net income 255.2 224.3 258.1 15.0% 1.1% KRW 1,288bn, (YoY) +2.5% Margin (%) 4.5% 4.0% 4.4% 0.4%p -0.1%p EBITDA 1,257.2 1,267.6 1,288.3 1.6% 2.5% Margin (%) 22.1% 22.6% 22.1% -0.5%p -0.1%p
 |
K-IFRS / Consolidated
1-2 Financial Highlights
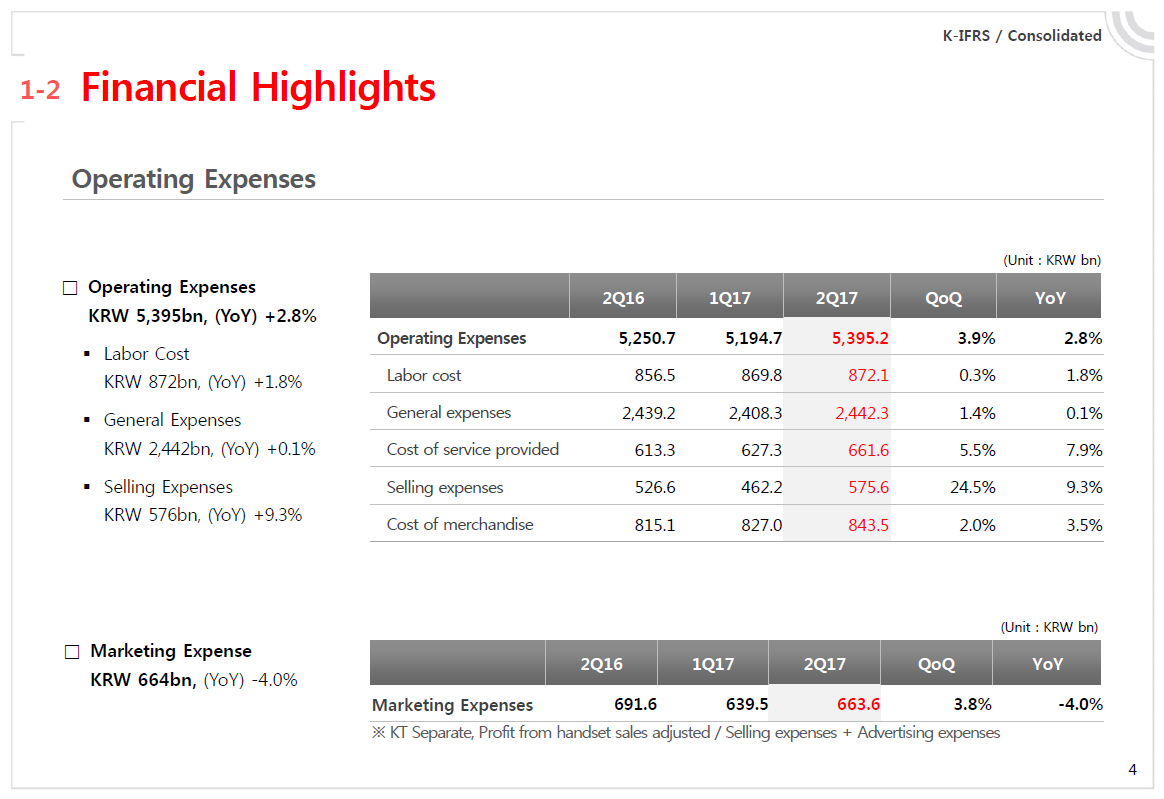
Operating Expenses Operating Expenses KRW 5,395bn, (YoY) +2.8% Labor Cost KRW 872bn, (YoY) +1.8% General Expenses KRW 2,442bn, (YoY) +0.1% Selling Expenses KRW 576bn, (YoY) +9.3% (Unit : KRW bn) 2Q16 1Q17 2Q17 QoQ YoY Operating Expenses 5,250.7 5,194.7 5,395.2 3.9% 2.8% Labor cost 856.5 869.8 872.1 0.3% 1.8% General expenses 2,439.2 2,408.3 2,442.3 1.4% 0.1% Cost of service provided 613.3 627.3 661.6 5.5% 7.9% Selling expenses 526.6 462.2 575.6 24.5% 9.3% Cost of merchandise 815.1 827.0 843.5 2.0% 3.5% Marketing Expense KRW 664bn, (YoY)-4.0% (Unit : KRW bn) 2Q16 1Q17 2Q17 QoQ YoY Marketing Expenses 691.6 639.5 663.6 3.8% -4.0% ? KT Separate, Profit from handset sales adjusted / Selling expenses + Advertising expenses
 |
K-IFRS / Consolidated
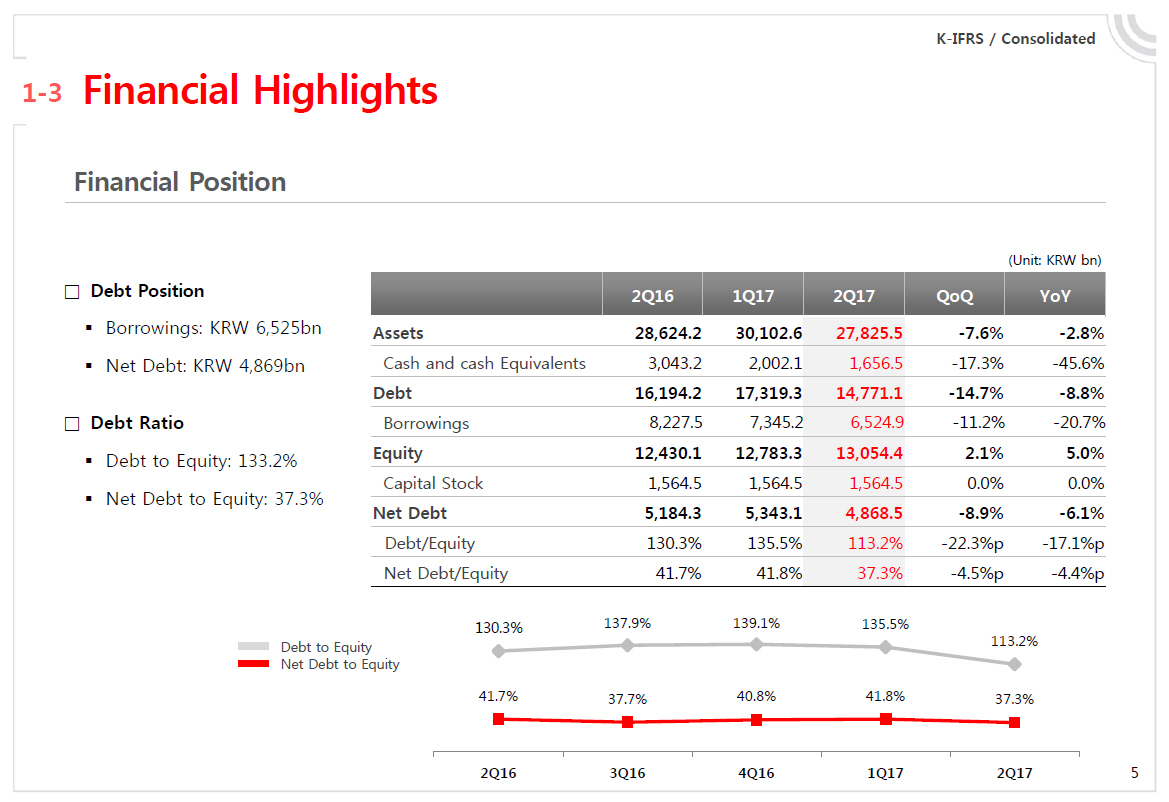
1-3 Financial Highlights
Financial Position Debt Position Borrowings: KRW 6,525bn Net Debt: KRW 4,869bn Debt Ratio Debt to Equity: 133.2% Net Debt to Equity: 37.3% (Unit: KRW bn) 2Q16 1Q17 2Q17 QoQ YoY Assets 28,624.2 30,102.6 27,825.5 -7.6% -2.8% Cash and cash Equivalents 3,043.2 2,002.1 1,656.5 -17.3% -45.6% Debt 16,194.2 17,319.3 14,771.1 -14.7% -8.8% Borrowings 8,227.5 7,345.2 6,524.9 -11.2% -20.7% Equity 12,430.1 12,783.3 13,054.4 2.1% 5.0% Capital Stock 1,564.5 1,564.5 1,564.5 0.0% 0.0% Net Debt 5,184.3 5,343.1 4,868.5 -8.9% -6.1% Debt/Equity 130.3% 135.5% 113.2% -22.3%p -17.1%p Net Debt/Equity 41.7% 41.8% 37.3% -4.5%p -4.4%p
 |
K-IFRS / KT Separate
1-4 Financial Highlights
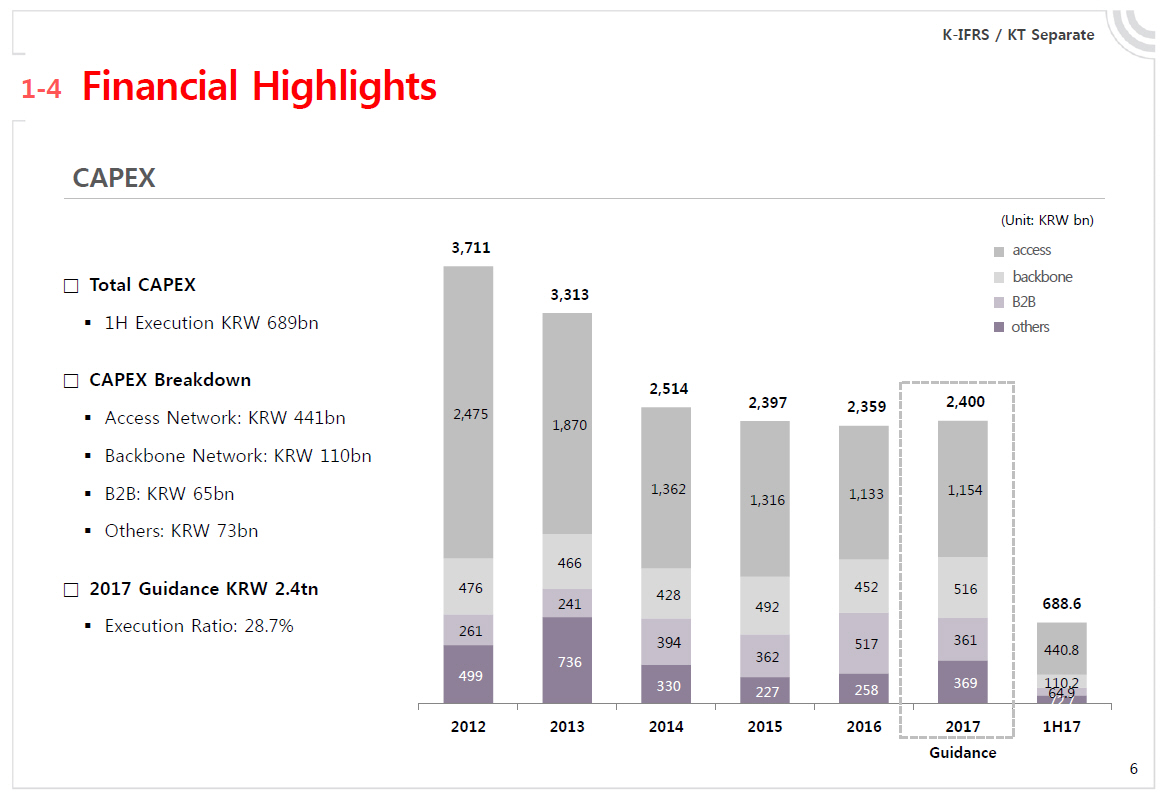
CAPEX
| • |
| Total CAPEX |
| • |
| 1H Execution KRW 689bn |
| • |
| CAPEX Breakdown |
| • |
| Access Network: KRW 441bn |
| • |
| Backbone Network: KRW 110bn |
| • |
| B2B: KRW 65bn |
| • |
| Others: KRW 73bn |
| • |
| 2017 Guidance KRW 2.4tn |
| • |
| Execution Ratio: 28.7% |
(Unit: KRW bn)
access
backbone
B2B
others
 |
1 Financial Highlights
| 2 | Business Overview |
| 3 | Q&A |
| 4 | Appendix |
 |
K-IFRS / Consolidated
2-1 Business Overview
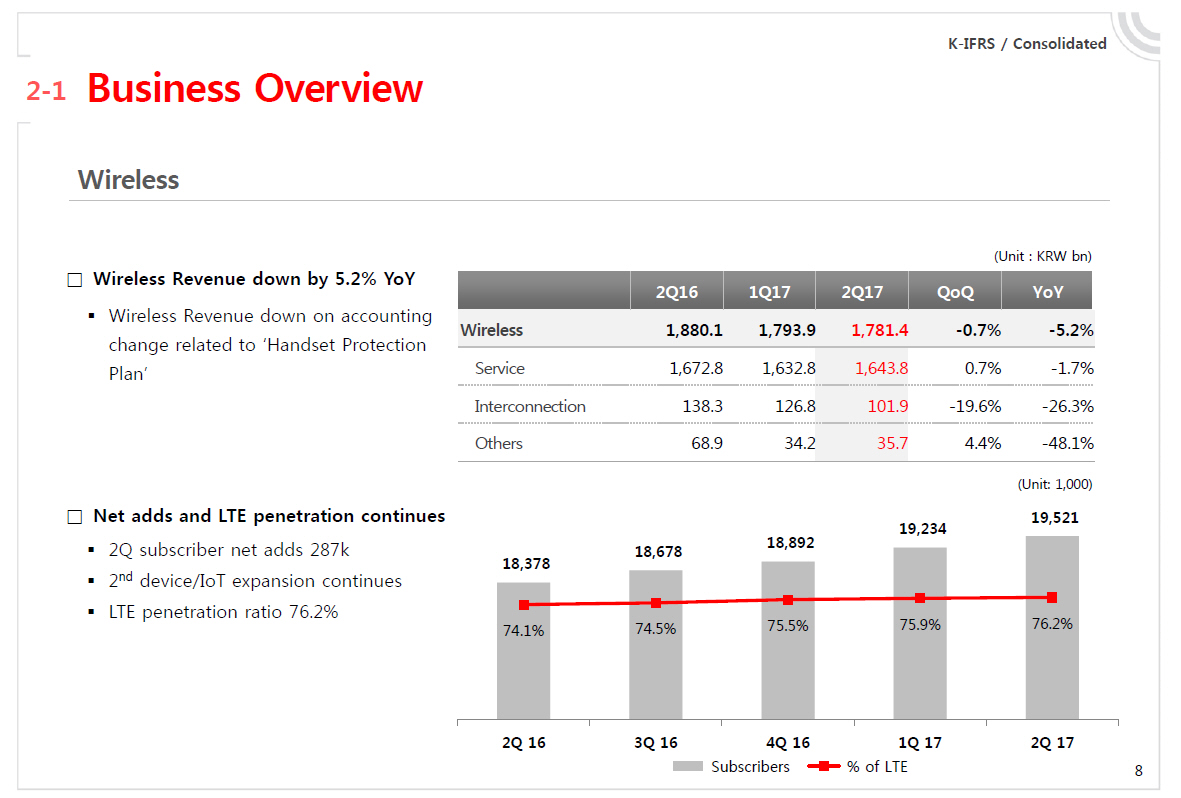
Wireless Wireless Revenue down by 5.2% YoY Wireless Revenue down on accounting change related to ‘Handset Protection Plan’
(Unit : KRW bn) 2Q16 1Q17 2Q17 QoQ YoY Wireless 1,880.1 1,793.9 1,781.4 -0.7% -5.2% Service 1,672.8 1,632.8 1,643.8 0.7% -1.7% Interconnection 138.3 126.8 101.9 -19.6% -26.3% Others 68.9 34.2 35.7 4.4% -48.1%
| • |
| Net adds and LTE penetration continues 2Q subscriber net adds 287k 2nd device/IoT expansion continues LTE penetration ratio 76.2% (Unit: 1,000) |
 |
2-2 Business Overview
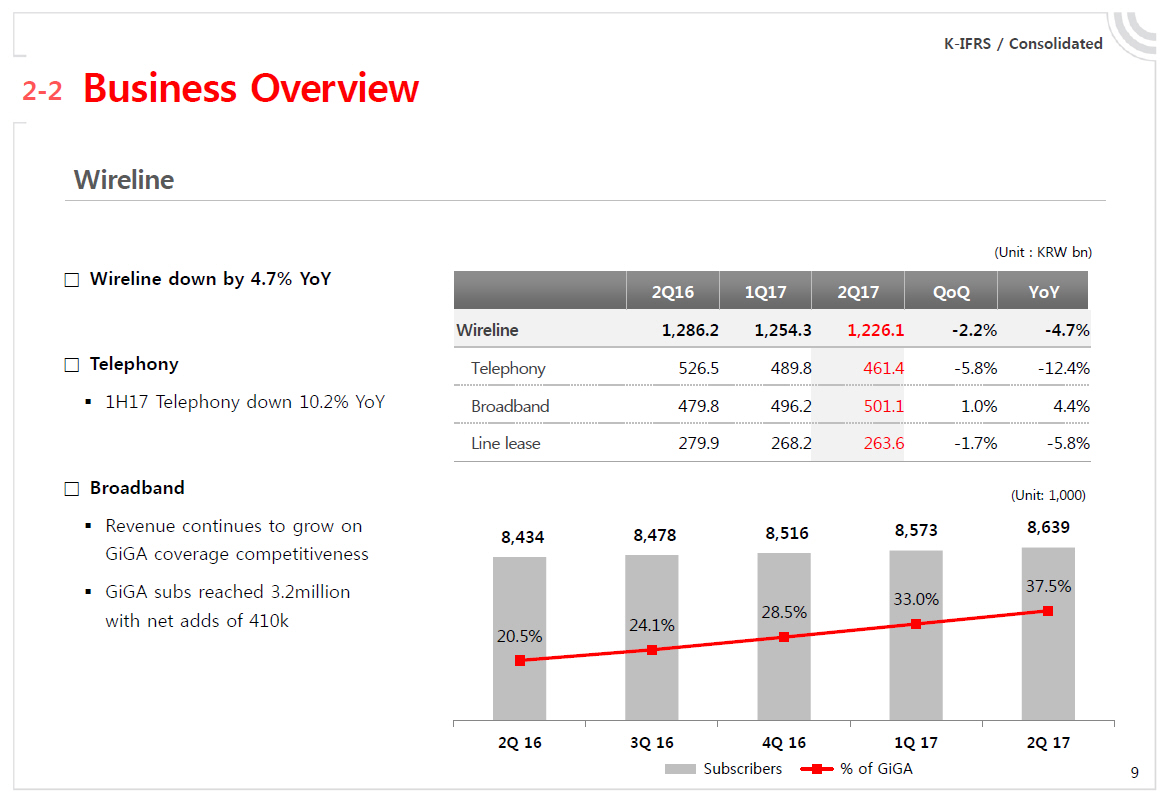
Wireline Wireline down by 4.7% YoY Telephony ◾ 1H17 Telephony down 10.2% YoY
(Unit : KRW bn) 2Q16 1Q17 2Q17 QoQ YoY Wireline 1,286.2 1,254.3 1,226.1 -2.2% -4.7% Telephony 526.5 489.8 461.4 -5.8% -12.4% Broadband 479.8 496.2 501.1 1.0% 4.4% Line lease 279.9 268.2 263.6 -1.7% -5.8%
| • |
| Broadband Revenue continues to grow on GiGA coverage competitiveness GiGA subs reached 3.2million with net adds of 410k (Unit: 1,000) |
 |
K-IFRS / Consolidated
2-3 Business Overview Media / Contents Media/Contents up by 19.2% YoY Media Revenue up by 11.2% YoY on subscriber quality enhancement and platform revenue expansion IPTV subs reached 7.2million
(Unit : KRW bn) 2Q16 1Q17 2Q17 QoQ YoY Media/Contents 470.9 519.7 561.4 8.0% 19.2%
Media 411.1 424.3 457.1 7.7% 11.2% Contents 59.8 95.4 104.3 9.4% 74.4%
| • |
| Contents (Nasmedia) Increased backlog in digital broadcasting/mobile and NSM acquisition drove strong growth Uplifted KTHT-Commerce sales and Genie Music subscribers number (Unit : 1,000, OTV+OTS) Number of IPTV subscribers differ from MSIP’s release that applies “Combined Market Share Regulation” under the IPTV law. (KT’saverage(6-month average) pay TV subscribers as of 2H16 are 5,777,175) |
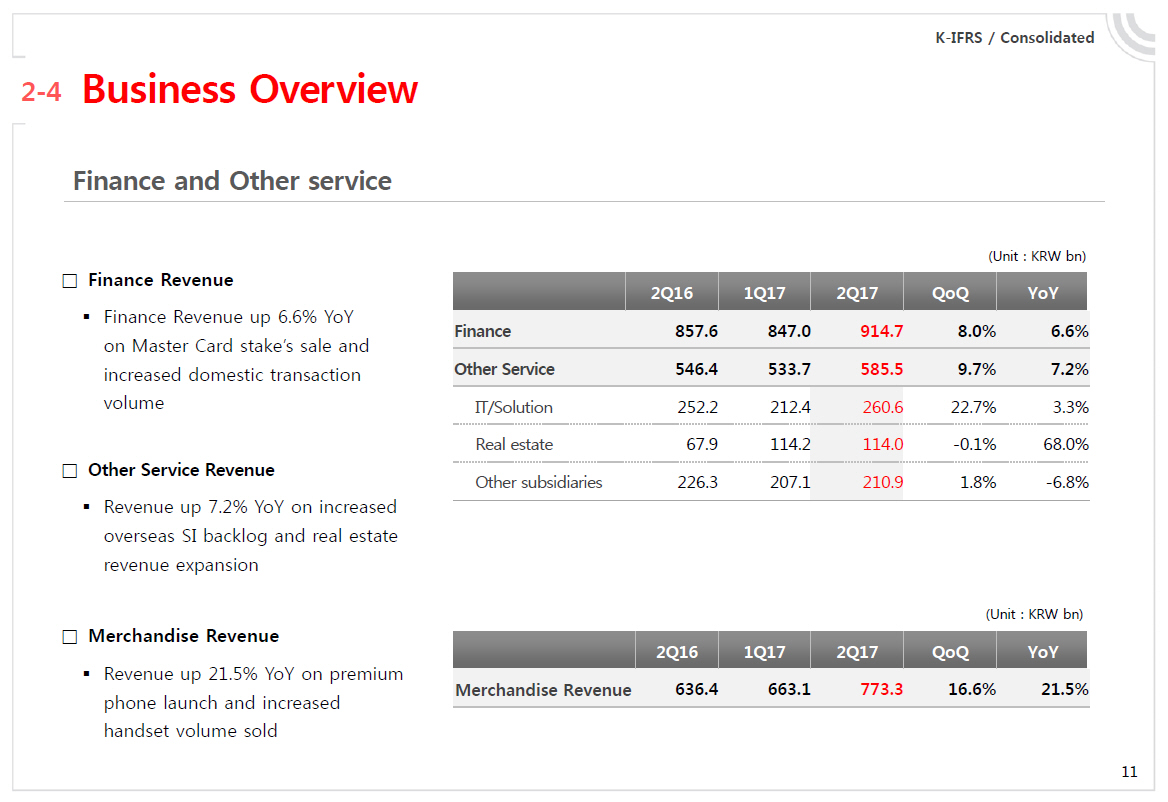 |
K-IFRS / Consolidated
2-4 Business Overview Finance and Other service Finance Revenue Finance Revenue up 6.6% YoY on Master Card stake’s sale and increased domestic transaction volume Other Service Revenue Revenue up 7.2% YoY on increased overseas SI backlog and real estate revenue expansion (Unit : KRW bn) 2Q16 1Q17 2Q17 QoQ YoY Finance 857.6 847.0 914.7 8.0% 6.6% Other Service 546.4 533.7 585.5 9.7% 7.2% IT/Solution 252.2 212.4 260.6 22.7% 3.3% Real estate 67.9 114.2 114.0 -0.1% 68.0% Other subsidiaries 226.3 207.1 210.9 1.8% -6.8% Merchandise Revenue Revenue up 21.5% YoY on premium phone launch and increased handset volume sold (Unit : KRW bn) 2Q16 1Q17 2Q17 QoQ YoY Merchandise Revenue 636.4 663.1 773.3 16.6% 21.5%
 |
| 1 | Financial Highlights |
| 2 | Business Overview |
| 3 | Q&A |
| 4 | Appendix |
 |
| 1 | Financial Highlights |
| 2 | Business Overview |
| 3 | Q&A |
| 4 | Appendix |
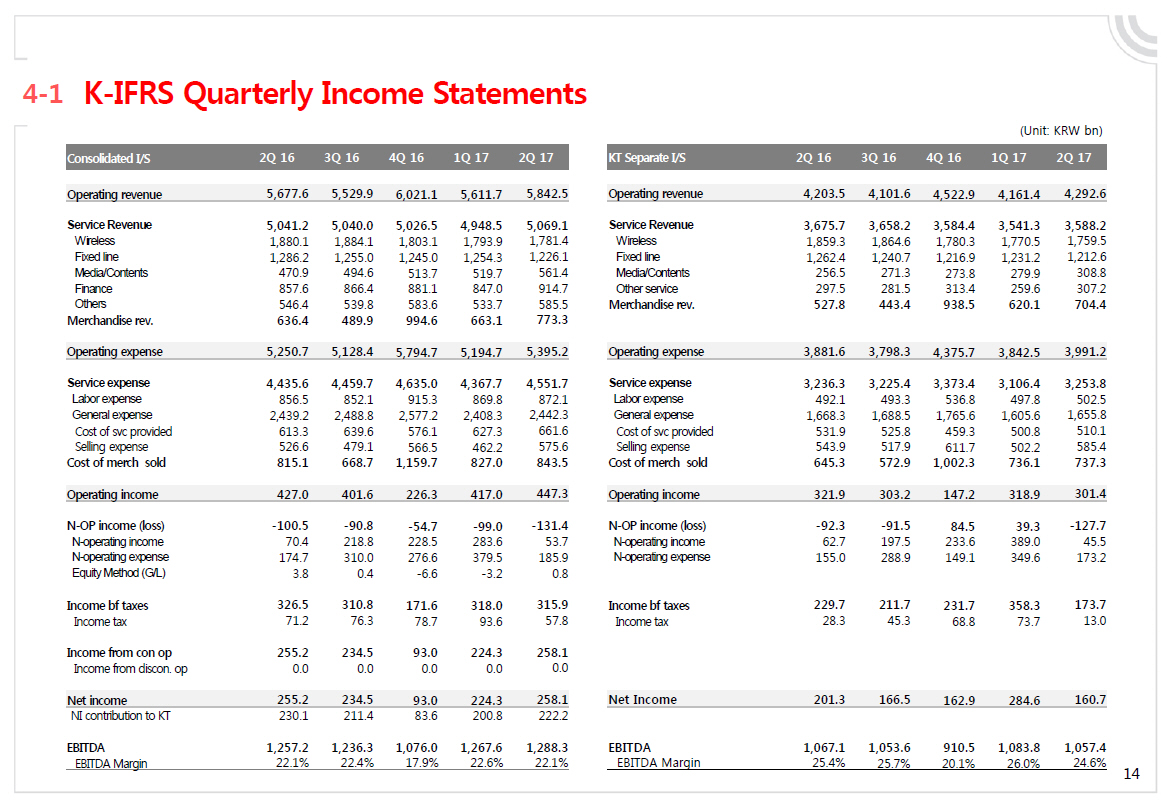 |
4-1K-IFRS Quarterly Income Statements Consolidated I/S 2Q 16 3Q 16 4Q 16 1Q 17 2Q 17 Operating revenue 5,677.6 5,529.9 6,021.1 5,611.7 5,842.5 Service Revenue 5,041.2 5,040.0 5,026.5 4,948.5 5,069.1 Wireless 1,880.1 1,884.1 1,803.1 1,793.9 1,781.4 Fixed line 1,286.2 1,255.0 1,245.0 1,254.3 1,226.1 Media/Contents 470.9 494.6 513.7 519.7 561.4 Finance 857.6 866.4 881.1 847.0 914.7 Others 546.4 539.8 583.6 533.7 585.5 Merchandise rev. 636.4 489.9 994.6 663.1 773.3 Operating expense 5,250.7 5,128.4 5,794.7 5,194.7 5,395.2 Service expense 4,435.6 4,459.7 4,635.0 4,367.7 4,551.7 Labor expense 856.5 852.1 915.3 869.8 872.1 General expense 2,439.2 2,488.8 2,577.2 2,408.3 2,442.3 Cost of svc provided 613.3 639.6 576.1 627.3 661.6 Selling expense 526.6 479.1 566.5 462.2 575.6 Cost of merch sold 815.1 668.7 1,159.7 827.0 843.5 Operating income 427.0 401.6 226.3 417.0 447.3N-OP income (loss) -100.5 -90.8 -54.7 —99.0 -131.4N-operating income 70.4 218.8 228.5 283.6 53.7N-operating expense 174.7 310.0 276.6 379.5 185.9 Equity Method (G/L) 3.8 0.4 -6.6 -3.2 0.8 Income bf taxes 326.5 310.8 171.6 318.0 315.9 Income tax 71.2 76.3 78.7 93.6 57.8 Income from con op 255.2 234.5 93.0 224.3 258.1 Income from discon. op 0.0 0.0 0.0 0.0 0.0 Net income 255.2 234.5 93.0 224.3 258.1 NI contribution to KT 230.1 211.4 83.6 200.8 222.2 EBITDA 1,257.2 1,236.3 1,076.0 1,267.6 1,288.3 EBITDA Margin 22.1% 22.4% 17.9% 22.6% 22.1% (Unit: KRW bn) KT Separate I/S 2Q 16 3Q 16 4Q 16 1Q 17 2Q 17 Operating revenue 4,203.5 4,101.6 4,522.9 4,161.4 4,292.6 Service Revenue 3,675.7 3,658.2 3,584.4 3,541.3 3,588.2 Wireless 1,859.3 1,864.6 1,780.3 1,770.5 1,759.5 Fixed line 1,262.4 1,240.7 1,216.9 1,231.2 1,212.6 Media/Contents 256.5 271.3 273.8 279.9 308.8 Other service 297.5 281.5 313.4 259.6 307.2 Merchandise rev. 527.8 443.4 938.5 620.1 704.4 Operating expense 3,881.6 3,798.3 4,375.7 3,842.5 3,991.2 Service expense 3,236.3 3,225.4 3,373.4 3,106.4 3,253.8 Labor expense 492.1 493.3 536.8 497.8 502.5 General expense 1,668.3 1,688.5 1,765.6 1,605.6 1,655.8 Cost of svc provided 531.9 525.8 459.3 500.8 510.1 Selling expense 543.9 517.9 611.7 502.2 585.4 Cost of merch sold 645.3 572.9 1,002.3 736.1 737.3 Operating income 321.9 303.2 147.2 318.9 301.4N-OP income (loss) -92.3 -91.5 84.5 39.3 —127.7N-operating income 62.7 197.5 233.6 389.0 45.5N-operating expense 155.0 288.9 149.1 349.6 173.2 Income bf taxes 229.7 211.7 231.7 358.3 173.7 Income tax 28.3 45.3 68.8 73.7 13.0 Net Income 201.3 166.5 162.9 284.6 160.7 EBITDA 1,067.1 1,053.6 910.5 1,083.8 1,057.4 EBITDA Margin 25.4% 25.7% 20.1% 26.0% 24.6%
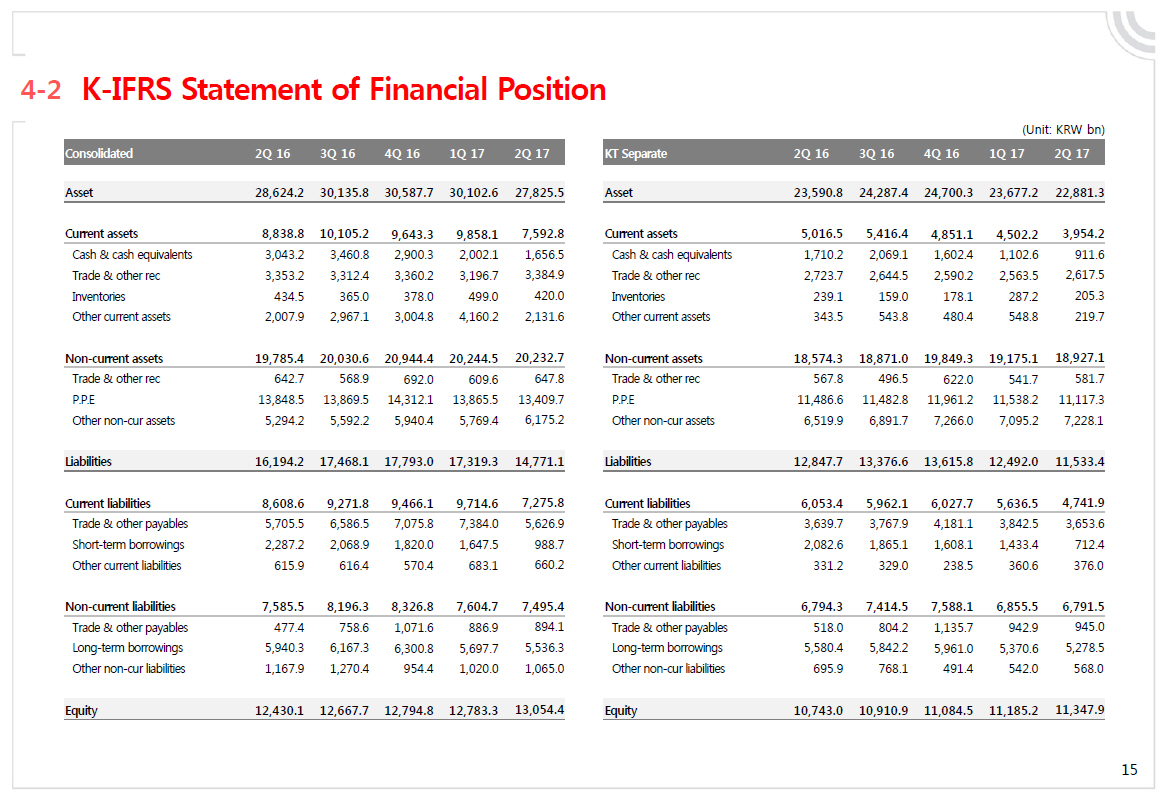 |
4-2K-IFRS Statement of Financial Position Consolidated 2Q 16 3Q 16 4Q 16 1Q 17 2Q 17 Asset 28,624.2 30,135.8 30,587.7 30,102.6 27,825.5 Current assets 8,838.8 10,105.2 9,643.3 9,858.1 7,592.8 Cash & cash equivalents 3,043.2 3,460.8 2,900.3 2,002.1 1,656.5 Trade & other rec 3,353.2 3,312.4 3,360.2 3,196.7 3,384.9 Inventories 434.5 365.0 378.0 499.0 420.0 Other current assets 2,007.9 2,967.1 3,004.8 4,160.2 2,131.6Non-current assets 19,785.4 20,030.6 20,944.4 20,244.5 20,232.7 Trade & other rec 642.7 568.9 692.0 609.6 647.8 P.P.E 13,848.5 13,869.5 14,312.1 13,865.5 13,409.7 Othernon-cur assets 5,294.2 5,592.2 5,940.4 5,769.4 6,175.2 Liabilities 16,194.2 17,468.1 17,793.0 17,319.3 14,771.1 Current liabilities 8,608.6 9,271.8 9,466.1 9,714.6 7,275.8 Trade & other payables 5,705.5 6,586.5 7,075.8 7,384.0 5,626.9 Short-term borrowings 2,287.2 2,068.9 1,820.0 1,647.5 988.7 Other current liabilities 615.9 616.4 570.4 683.1 660.2Non-current liabilities 7,585.5 8,196.3 8,326.8 7,604.7 7,495.4 Trade & other payables 477.4 758.6 1,071.6 886.9 894.1 Long-term borrowings 5,940.3 6,167.3 6,300.8 5,697.7 5,536.3 Othernon-cur liabilities 1,167.9 1,270.4 954.4 1,020.0 1,065.0 Equity 12,430.1 12,667.7 12,794.8 12,783.3 13,054.4 (Unit: KRW bn) KT Separate 2Q 16 3Q 16 4Q 16 1Q 17 2Q 17 Asset 23,590.8 24,287.4 24,700.3 23,677.2 22,881.3
Current assets 5,016.5 5,416.4 4,851.1 4,502.2 3,954.2 Cash & cash equivalents 1,710.2 2,069.1 1,602.4 1,102.6 911.6 Trade & other rec 2,723.7 2,644.5 2,590.2 2,563.5 2,617.5 Inventories 239.1 159.0 178.1 287.2 205.3 Other current assets 343.5 543.8 480.4 548.8 219.7Non-current assets 18,574.3 18,871.0 19,849.3 19,175.1 18,927.1 Trade & other rec 567.8 496.5 622.0 541.7 581.7 P.P.E 11,486.6 11,482.8 11,961.2 11,538.2 11,117.3 Othernon-cur assets 6,519.9 6,891.7 7,266.0 7,095.2 7,228.1 Liabilities 12,847.7 13,376.6 13,615.8 12,492.0 11,533.4 Current liabilities 6,053.4 5,962.1 6,027.7 5,636.5 4,741.9 Trade & other payables 3,639.7 3,767.9 4,181.1 3,842.5 3,653.6 Short-term borrowings 2,082.6 1,865.1 1,608.1 1,433.4 712.4 Other current liabilities 331.2 329.0 238.5 360.6 376.0Non-current liabilities 6,794.3 7,414.5 7,588.1 6,855.5 6,791.5 Trade & other payables 518.0 804.2 1,135.7 942.9 945.0 Long-term borrowings 5,580.4 5,842.2 5,961.0 5,370.6 5,278.5 Othernon-cur liabilities 695.9 768.1 491.4 542.0 568.0 Equity 10,743.0 10,910.9 11,084.5 11,185.2 11,347.9
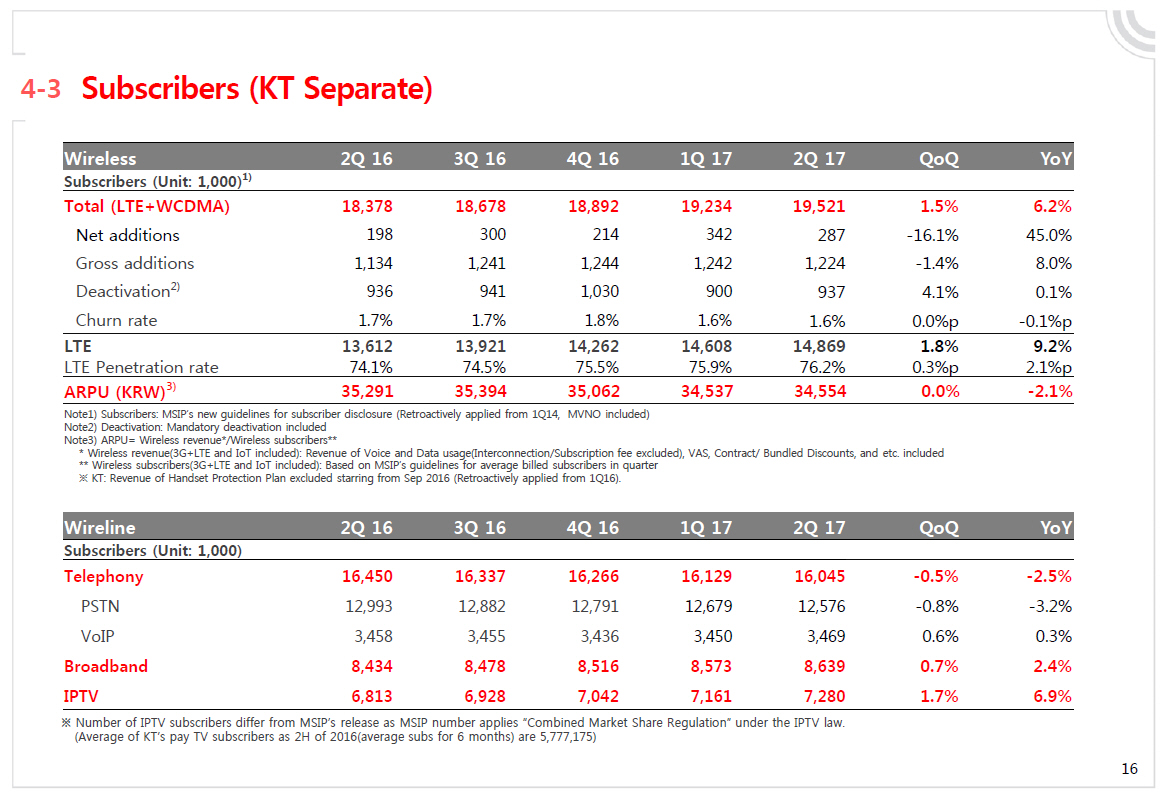 |
4-3 Subscribers (KT Separate) Wireless 2Q 16 3Q 16 4Q 16 1Q 17 2Q 17 QoQ YoY Subscribers (Unit: 1,000)1) Total (LTE+WCDMA) 18,378 18,678 18,892 19,234 19,521 1.5% 6.2% Net additions 198 300 214 342 287 -16.1% 45.0% Gross additions 1,134 1,241 1,244 1,242 1,224 -1.4% 8.0% Deactivation2) 936 941 1,030 900 937 4.1% 0.1% Churn rate 1.7% 1.7% 1.8% 1.6% 1.6% 0.0%p -0.1%p LTE 13,612 13,921 14,262 14,608 14,869 1.8% 9.2% LTE Penetration rate 74.1% 74.5% 75.5% 75.9% 76.2% 0.3%p 2.1%p ARPU (KRW)3) 35,291 35,394 35,062 34,537 34,554 0.0% -2.1%
Note1) Subscribers: MSIP’s new guidelines for subscriber disclosure (Retroactively applied from 1Q14, MVNO included) Note2) Deactivation: Mandatory deactivation included Note3) ARPU= Wireless revenue*/Wireless subscribers**
* Wireless revenue(3G+LTE and IoT included): Revenue of Voice and Data usage(Interconnection/Subscription fee excluded), VAS, Contract/ Bundled Discounts, and etc. included
** Wireless subscribers(3G+LTE and IoT included): Based on MSIP’s guidelines for average billed subscribers in quarter
? KT: Revenue of Handset Protection Plan excluded starring from Sep 2016 (Retroactively applied from 1Q16).
Wireline 2Q 16 3Q 16 4Q 16 1Q 17 2Q 17 QoQ YoY Subscribers (Unit: 1,000) Telephony 16,450 16,337 16,266 16,129 16,045 -0.5% -2.5% PSTN 12,993 12,882 12,791 12,679 12,576 -0.8% -3.2% VoIP 3,458 3,455 3,436 3,450 3,469 0.6% 0.3% Broadband 8,434 8,478 8,516 8,573 8,639 0.7% 2.4% IPTV 6,813 6,928 7,042 7,161 7,280 1.7% 6.9%
? Number of IPTV subscribers differ from MSIP’s release as MSIP number applies “Combined Market Share Regulation” under the IPTV law.
(Average of KT’s pay TV subscribers as 2H of 2016(average subs for 6 months) are 5,777,175)
 |