SECURITIES AND EXCHANGE COMMISSION
Washington, D.C. 20549
Form6-K
REPORT OF FOREIGN PRIVATE ISSUER
PURSUANT TO RULE13a-16 OR15d-16 OF
THE SECURITIES EXCHANGE ACT OF 1934
For the month of November 2017
Commission File Number1-14926
KT Corporation
(Translation of registrant’s name into English)
KT Gwanghwamun Building East
33, Jongno 3-gil,Jongno-gu
03155 Seoul, Korea
(Address of principal executive offices)
Indicate by check mark whether the registrant files or will file annual reports under cover of Form20-F or Form40-F:
Form20-F ☒ Form40-F ☐
Indicate by check mark if the registrant is submitting the Form6-K in paper as permitted by RegulationS-T Rule 101(b)(1): ☐
Indicate by check mark if the registrant is submitting the Form6-K in paper as permitted by RegulationS-T Rule 101(b)(7): ☐
Indicate by check mark whether by furnishing the information contained in this Form, the registrant is also thereby furnishing the information to the Commission pursuant to Rule12g3-2(b) under the Securities Exchange Act of 1934.
Yes ☐ No ☒
If “Yes” is marked, indicate below the file number assigned to the registrant in connection with Rule12g3-2(b):82-
SIGNATURES
Pursuant to the requirements of the Securities Exchange Act of 1934, the registrant has duly caused this report to be signed on its behalf by the undersigned, thereunto duly authorized.
| Dated: November 1, 2017 | ||
| KT Corporation | ||
| By: | /s/ Youngwoo Kim | |
| Name: Youngwoo Kim | ||
| Title: Vice President | ||
| By: | /s/ Jungsup Jung | |
| Name: Jungsup Jung | ||
| Title: Director | ||
 |
KT 3Q17 Earnings Release Investor Relations 2017. 11. 01.
 |
Disclaimer This presentation has been prepared by KT Corp.(the Company”). This presentation contains forward-looking statements, which are subject to risks, uncertainties, and assumptions. This presentation is being presented solely for your information and is subject to change without notice. No presentation or warranty, expressed or implied, is made and no reliance should be placed on the accuracy, actuality, fairness, or completeness of the information presented. Please be informed that items included in our operating income have been prepared in accordance with K-IFRS 1001 released on October 17, 2012, which was revised to coincide with the Korean Accounting Standards for Non-Public Entities (“KAS-NPEs”). The Company, its affiliates or representatives accept no liability whatsoever for any losses arising from any information contained in the presentation. This presentation does not constitute an offer or invitation to purchase or subscribe for any shares of the Company, and no part of this presentation shall form the Basis of or be relied upon in connection with any contract or commitment. Any decision to purchase shares of the Company could be made solely on the Basis of information, which has been publicly filed with the Securities and Exchange Commission or the Korea Stock Exchange and distributed to all investors. The contents of this presentation may not be reproduced, redistributed or passed on, directly or indirectly, to any other person or published, in whole or in part, for any purpose. If you have any related questions to this material, please contact IR department. Tel : 82-2-3495-3557, 3558, 3564, 5529, 5343, 5344 Fax : 82-2-3495-5917
 |
Contents
1 Financial Highlights
2 Business Overview
3 Q&A
4 Appendix
 |
K-IFRS / Consolidated
1-1 Financial Highlights
Income Statement
(Unit: KRW bn)
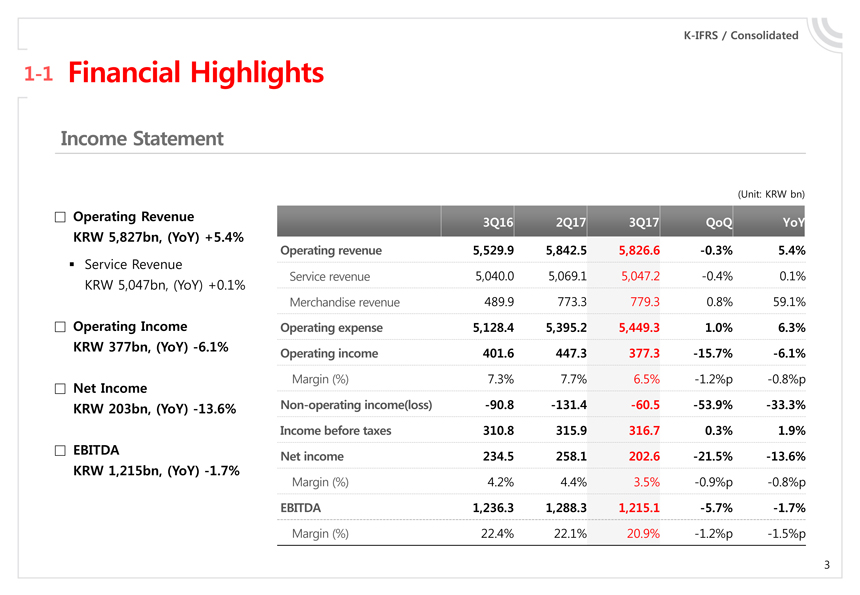
Operating Revenue 3Q16 2Q17 3Q17 QoQ YoY KRW 5,827bn, (YoY) +5.4% Operating revenue 5,529.9 5,842.5 5,826.6 -0.3% 5.4%
Service Revenue
Service revenue 5,040.0 5,069.1 5,047.2 -0.4% 0.1%
KRW 5,047bn, (YoY) +0.1%
Merchandise revenue 489.9 773.3 779.3 0.8% 59.1%
Operating Income Operating expense 5,128.4 5,395.2 5,449.3 1.0% 6.3% KRW 377bn, (YoY) -6.1% Operating income 401.6 447.3 377.3 -15.7% -6.1%
Margin (%) 7.3% 7.7% 6.5% -1.2%p -0.8%p
Net Income
KRW 203bn, (YoY) -13.6% Non-operating income(loss) -90.8 -131.4 -60.5 -53.9% -33.3% Income before taxes 310.8 315.9 316.7 0.3% 1.9%
EBITDA Net income 234.5 258.1 202.6 -21.5% -13.6%
KRW 1,215bn, (YoY) -1.7%
Margin (%) 4.2% 4.4% 3.5% -0.9%p -0.8%p
EBITDA 1,236.3 1,288.3 1,215.1 -5.7% -1.7%
Margin (%) 22.4% 22.1% 20.9% -1.2%p -1.5%p
 |
K-IFRS / Consolidated
1-2 Financial Highlights
Operating Expenses
(Unit : KRW bn)
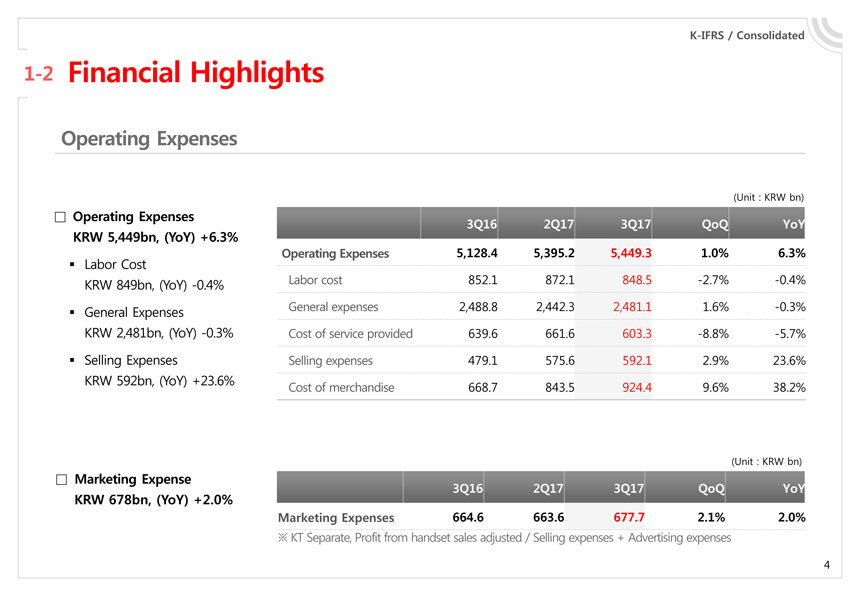
Operating Expenses
3Q16 2Q17 3Q17 QoQ YoY
KRW 5,449bn, (YoY) +6.3%
Operating Expenses 5,128.4 5,395.2 5,449.3 1.0% 6.3%
Labor Cost
KRW 849bn, (YoY) -0.4% Labor cost 852.1 872.1 848.5 -2.7% -0.4% General Expenses General expenses 2,488.8 2,442.3 2,481.1 1.6% -0.3% KRW 2,481bn, (YoY) -0.3% Cost of service provided 639.6 661.6 603.3 -8.8% -5.7% Selling Expenses Selling expenses 479.1 575.6 592.1 2.9% 23.6% KRW 592bn, (YoY) +23.6% Cost of merchandise 668.7 843.5 924.4 9.6% 38.2%
(Unit : KRW bn)
Marketing Expense
3Q16 2Q17 3Q17 QoQ YoY
KRW 678bn, (YoY) +2.0%
Marketing Expenses 664.6 663.6 677.7 2.1% 2.0%
KT Separate, Profit from handset sales adjusted / Selling expenses + Advertising expenses
 |
K-IFRS / Consolidated
1-3 Financial Highlights
Financial Position
(Unit: KRW bn)
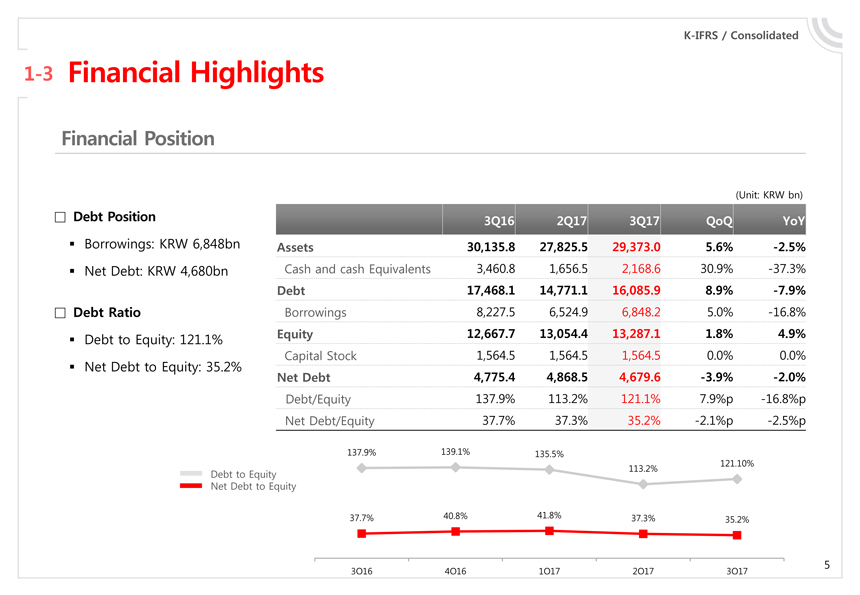
Debt Position 3Q16 2Q17 3Q17 QoQ YoY Borrowings: KRW 6,848bn Assets 30,135.8 27,825.5 29,373.0 5.6% -2.5%
Net Debt: KRW 4,680bn Cash and cash Equivalents 3,460.8 1,656.5 2,168.6 30.9% -37.3%
Debt 17,468.1 14,771.1 16,085.9 8.9% -7.9%
Debt Ratio Borrowings 8,227.5 6,524.9 6,848.2 5.0% -16.8%
Debt to Equity: 121.1% Equity 12,667.7 13,054.4 13,287.1 1.8% 4.9%
Capital Stock 1,564.5 1,564.5 1,564.5 0.0% 0.0%
Net Debt to Equity: 35.2%
Net Debt 4,775.4 4,868.5 4,679.6 -3.9% -2.0%
Debt/Equity 137.9% 113.2% 121.1% 7.9%p -16.8%p Net Debt/Equity 37.7% 37.3% 35.2% -2.1%p -2.5%p
137.9% 139.1% 135.5%
121.10% 113.2%
Debt to Equity Net Debt to Equity
37.7% 40.8% 41.8% 37.3% 35.2%
3Q16 4Q16 1Q17 2Q17 3Q17
 |
K-IFRS / KT Separate
1-4 Financial Highlights
CAPEX
(Unit: KRW bn)
Access 3,711 Backbone
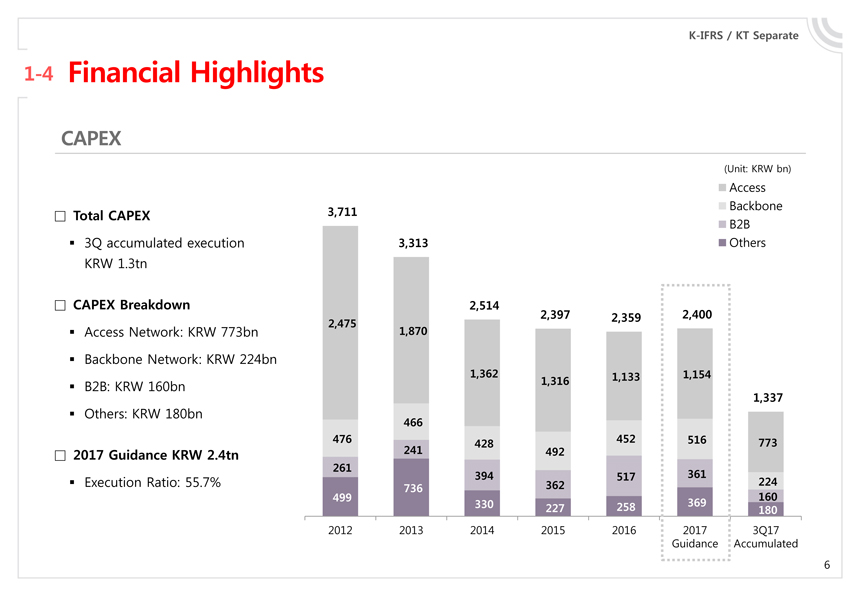
Total CAPEX
B2B
3Q accumulated execution 3,313 Others KRW 1.3tn
CAPEX Breakdown 2,514
2,397 2,359 2,400
2,475
Access Network: KRW 773bn 1,870 Backbone Network: KRW 224bn
1,362 1,133 1,154
B2B: KRW 160bn 1,316
1,337
Others: KRW 180bn
466
476 428 452 516 773
2017 Guidance KRW 2.4tn 241 492
261
394 517 361
Execution Ratio: 55.7% 362 224
736
499 369 160 330 227 258 180
2012 2013 2014 2015 2016 2017 3Q17 Guidance Accumulated
 |
1 Financial Highlights
2 Business Overview
3 Q&A
4 Appendix
 |
K-IFRS / Consolidated
2-1 Business Overview
Wireless
(Unit : KRW bn)
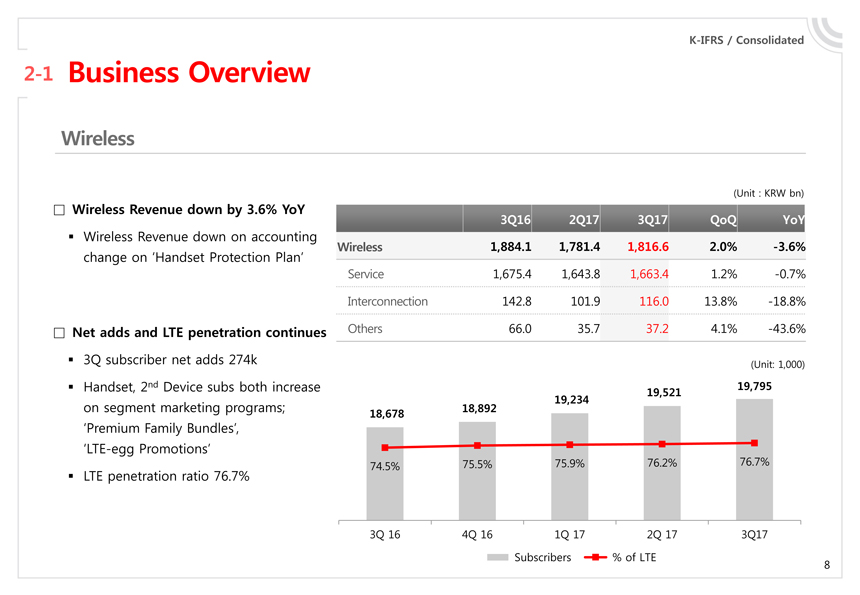
Wireless Revenue down by 3.6% YoY
3Q16 2Q17 3Q17 QoQ YoY
Wireless Revenue down on accounting
Wireless 1,884.1 1,781.4 1,816.6 2.0% -3.6% change on ‘Handset Protection Plan’
Service 1,675.4 1,643.8 1,663.4 1.2% -0.7% Interconnection 142.8 101.9 116.0 13.8% -18.8%
Net adds and LTE penetration continues Others 66.0 35.7 37.2 4.1% -43.6%
3Q subscriber net adds 274k (Unit: 1,000) Handset, 2nd Device subs both increase 19,795
19,521 19,234
on segment marketing programs; 18,678 18,892
‘Premium Family Bundles’,
‘LTE-egg Promotions’ 76.7%
LTE penetration ratio 74.5% 75.5% 75.9% 76.2% 76.7%
3Q 16 4Q 16 1Q 17 2Q 17 3Q17 Subscribers % of LTE
 |
K-IFRS / Consolidated
2-2 Business Overview
Wireline
(Unit : KRW bn)
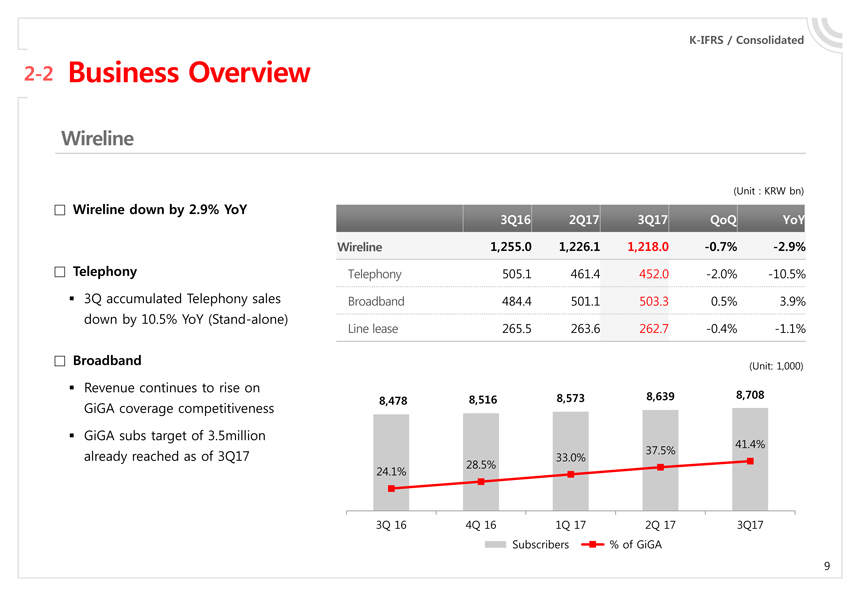
Wireline down by 2.9% YoY
3Q16 2Q17 3Q17 QoQ YoY
Wireline 1,255.0 1,226.1 1,218.0 -0.7% -2.9%
Telephony Telephony 505.1 461.4 452.0 -2.0% -10.5%
3Q accumulated Telephony sales Broadband 484.4 501.1 503.3 0.5% 3.9%
down by 10.5% YoY (Stand-alone)
Line lease 265.5 263.6 262.7 -0.4% -1.1%
Broadband (Unit: 1,000)
Revenue continues to rise on
8,516 8,573 8,639 8,708
GiGA coverage competitiveness 8,478
GiGA subs target of 3.5million
41.4%
already reached as of 3Q17 37.5%
33.0%
28.5%
24.1%
3Q 16 4Q 16 1Q 17 2Q 17 3Q17
Subscribers % of GiGA
 |
K-IFRS / Consolidated
2-3 Business Overview
Media / Contents
(Unit : KRW bn)
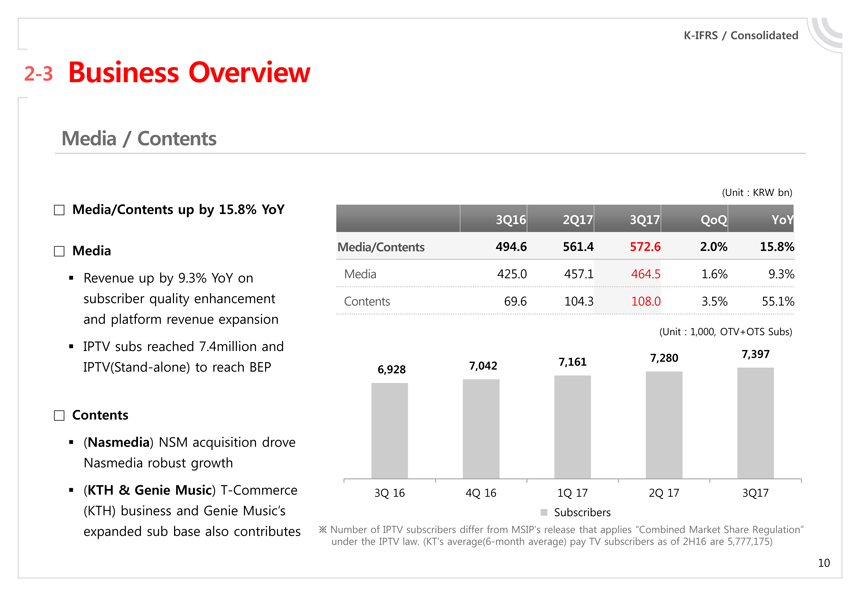
Media/Contents up by 15.8% YoY
3Q16 2Q17 3Q17 QoQ YoY
Media Media/Contents 494.6 561.4 572.6 2.0% 15.8%
Revenue up by 9.3% YoY on Media 425.0 457.1 464.5 1.6% 9.3% subscriber quality enhancement Contents 69.6 104.3 108.0 3.5% 55.1% and platform revenue expansion
(Unit : 1,000, OTV+OTS Subs)
IPTV subs reached 7.4million and
7,280 7,397
IPTV(Stand-alone) to reach BEP 7,042 7,161
6,928
Contents
(Nasmedia) NSM acquisition drove Nasmedia robust growth
(KTH & Genie Music) T-Commerce 3Q 16 4Q 16 1Q 17 2Q 17 3Q17
(KTH) business and Genie Music’s Subscribers
expanded sub base also contributes Number of IPTV subscribers differ from MSIP’s release that applies “Combined Market Share Regulation” under the IPTV law. (KT’s average(6-month average) pay TV subscribers as of 2H16 are 5,777,175)
 |
K-IFRS / Consolidated
2-4 Business Overview
Finance and Other service
(Unit : KRW bn)
Finance Revenue
3Q16 2Q17 3Q17 QoQ YoY
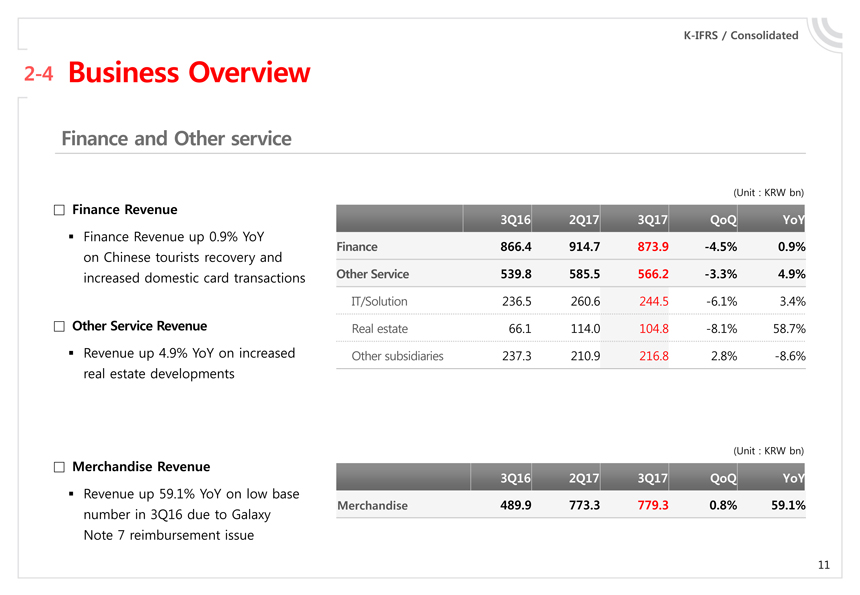
Finance Revenue up 0.9% YoY
Finance 866.4 914.7 873.9 -4.5% 0.9% on Chinese tourists recovery and increased domestic card transactions Other Service 539.8 585.5 566.2 -3.3% 4.9%
IT/Solution 236.5 260.6 244.5 -6.1% 3.4%
Other Service Revenue Real estate 66.1 114.0 104.8 -8.1% 58.7% Revenue up 4.9% YoY on increased Other subsidiaries 237.3 210.9 216.8 2.8% -8.6% real estate developments
(Unit : KRW bn)
Merchandise Revenue
3Q16 2Q17 3Q17 QoQ YoY
Revenue up 59.1% YoY on low base
Merchandise 489.9 773.3 779.3 0.8% 59.1% number in 3Q16 due to Galaxy Note 7 reimbursement issue
 |
1 Financial Highlights
2 Business Overview
3 Q&A
4 Appendix
 |
1 Financial Highlights
2 Business Overview
3 Q&A
4 Appendix
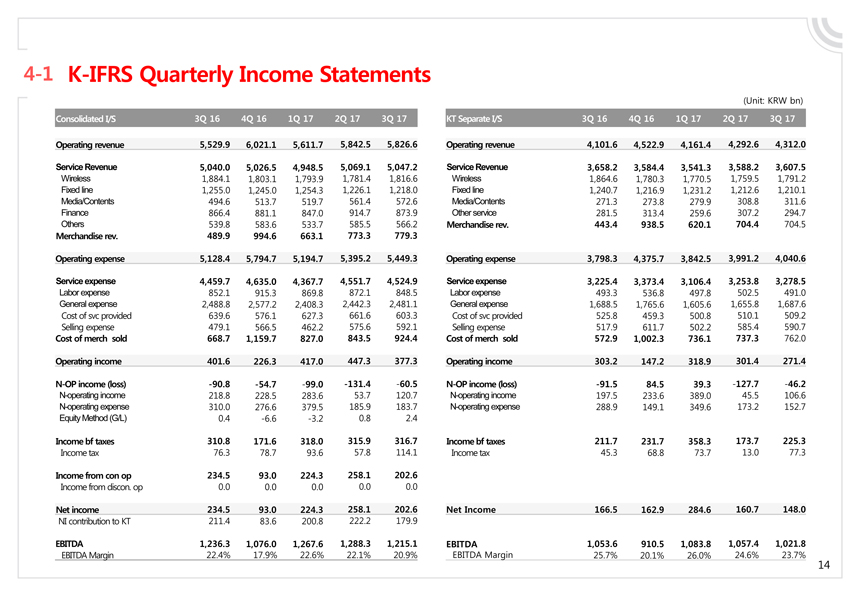 |
4-1 K-IFRS Quarterly Income Statements
(Unit: KRW bn)
Consolidated I/S 3Q 16 4Q 16 1Q 17 2Q 17 3Q 17 KT Separate I/S 3Q 16 4Q 16 1Q 17 2Q 17 3Q 17
Operating revenue 5,529.9 6,021.1 5,611.7 5,842.5 5,826.6 Operating revenue 4,101.6 4,522.9 4,161.4 4,292.6 4,312.0
Service Revenue 5,040.0 5,026.5 4,948.5 5,069.1 5,047.2 Service Revenue 3,658.2 3,584.4 3,541.3 3,588.2 3,607.5
Wireless 1,884.1 1,803.1 1,793.9 1,781.4 1,816.6 Wireless 1,864.6 1,780.3 1,770.5 1,759.5 1,791.2 Fixed line 1,255.0 1,245.0 1,254.3 1,226.1 1,218.0 Fixed line 1,240.7 1,216.9 1,231.2 1,212.6 1,210.1 Media/Contents 494.6 513.7 519.7 561.4 572.6 Media/Contents 271.3 273.8 279.9 308.8 311.6 Finance 866.4 881.1 847.0 914.7 873.9 Other service 281.5 313.4 259.6 307.2 294.7
Others 539.8 583.6 533.7 585.5 566.2 Merchandise rev. 443.4 938.5 620.1 704.4 704.5 Merchandise rev. 489.9 994.6 663.1 773.3 779.3
Operating expense 5,128.4 5,794.7 5,194.7 5,395.2 5,449.3 Operating expense 3,798.3 4,375.7 3,842.5 3,991.2 4,040.6
Service expense 4,459.7 4,635.0 4,367.7 4,551.7 4,524.9 Service expense 3,225.4 3,373.4 3,106.4 3,253.8 3,278.5
Labor expense 852.1 915.3 869.8 872.1 848.5 Labor expense 493.3 536.8 497.8 502.5 491.0 General expense 2,488.8 2,577.2 2,408.3 2,442.3 2,481.1 General expense 1,688.5 1,765.6 1,605.6 1,655.8 1,687.6 Cost of svc provided 639.6 576.1 627.3 661.6 603.3 Cost of svc provided 525.8 459.3 500.8 510.1 509.2 Selling expense 479.1 566.5 462.2 575.6 592.1 Selling expense 517.9 611.7 502.2 585.4 590.7
Cost of merch sold 668.7 1,159.7 827.0 843.5 924.4 Cost of merch sold 572.9 1,002.3 736.1 737.3 762.0
Operating income 401.6 226.3 417.0 447.3 377.3 Operating income 303.2 147.2 318.9 301.4 271.4
N-OP income (loss) -90.8 -54.7 -99.0 -131.4 -60.5 N-OP income (loss) -91.5 84.5 39.3 -127.7 -46.2
N-operating income 218.8 228.5 283.6 53.7 120.7 N-operating income 197.5 233.6 389.0 45.5 106.6 N-operating expense 310.0 276.6 379.5 185.9 183.7 N-operating expense 288.9 149.1 349.6 173.2 152.7
Equity Method (G/L) 0.4 -6.6 -3.2 0.8 2.4
Income bf taxes 310.8 171.6 318.0 315.9 316.7 Income bf taxes 211.7 231.7 358.3 173.7 225.3
Income tax 76.3 78.7 93.6 57.8 114.1 Income tax 45.3 68.8 73.7 13.0 77.3
Income from con op 234.5 93.0 224.3 258.1 202.6
Income from discon. op 0.0 0.0 0.0 0.0 0.0
Net income 234.5 93.0 224.3 258.1 202.6 Net Income 166.5 162.9 284.6 160.7 148.0
NI contribution to KT 211.4 83.6 200.8 222.2 179.9
EBITDA 1,236.3 1,076.0 1,267.6 1,288.3 1,215.1 EBITDA 1,053.6 910.5 1,083.8 1,057.4 1,021.8
EBITDA Margin 22.4% 17.9% 22.6% 22.1% 20.9% EBITDA Margin 25.7% 20.1% 26.0% 24.6% 23.7%
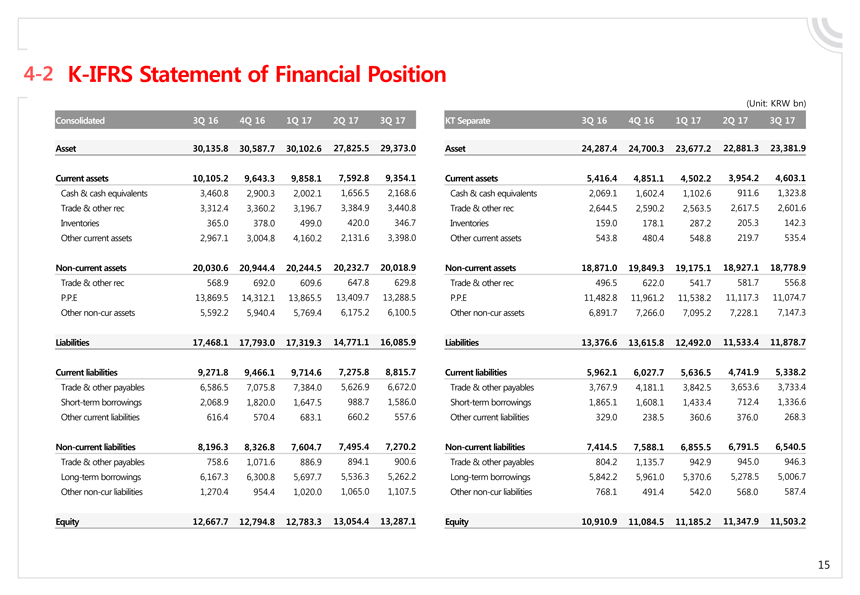 |
4-2 K-IFRS Statement of Financial Position
(Unit: KRW bn)
Consolidated 3Q 16 4Q 16 1Q 17 2Q 17 3Q 17 KT Separate 3Q 16 4Q 16 1Q 17 2Q 17 3Q 17
Asset 30,135.8 30,587.7 30,102.6 27,825.5 29,373.0 Asset 24,287.4 24,700.3 23,677.2 22,881.3 23,381.9
Current assets 10,105.2 9,643.3 9,858.1 7,592.8 9,354.1 Current assets 5,416.4 4,851.1 4,502.2 3,954.2 4,603.1
Cash & cash equivalents 3,460.8 2,900.3 2,002.1 1,656.5 2,168.6 Cash & cash equivalents 2,069.1 1,602.4 1,102.6 911.6 1,323.8 Trade & other rec 3,312.4 3,360.2 3,196.7 3,384.9 3,440.8 Trade & other rec 2,644.5 2,590.2 2,563.5 2,617.5 2,601.6 Inventories 365.0 378.0 499.0 420.0 346.7 Inventories 159.0 178.1 287.2 205.3 142.3 Other current assets 2,967.1 3,004.8 4,160.2 2,131.6 3,398.0 Other current assets 543.8 480.4 548.8 219.7 535.4
Non-current assets 20,030.6 20,944.4 20,244.5 20,232.7 20,018.9 Non-current assets 18,871.0 19,849.3 19,175.1 18,927.1 18,778.9
Trade & other rec 568.9 692.0 609.6 647.8 629.8 Trade & other rec 496.5 622.0 541.7 581.7 556.8 P.P.E 13,869.5 14,312.1 13,865.5 13,409.7 13,288.5 P.P.E 11,482.8 11,961.2 11,538.2 11,117.3 11,074.7 Other non-cur assets 5,592.2 5,940.4 5,769.4 6,175.2 6,100.5 Other non-cur assets 6,891.7 7,266.0 7,095.2 7,228.1 7,147.3
Liabilities 17,468.1 17,793.0 17,319.3 14,771.1 16,085.9 Liabilities 13,376.6 13,615.8 12,492.0 11,533.4 11,878.7
Current liabilities 9,271.8 9,466.1 9,714.6 7,275.8 8,815.7 Current liabilities 5,962.1 6,027.7 5,636.5 4,741.9 5,338.2
Trade & other payables 6,586.5 7,075.8 7,384.0 5,626.9 6,672.0 Trade & other payables 3,767.9 4,181.1 3,842.5 3,653.6 3,733.4 Short-term borrowings 2,068.9 1,820.0 1,647.5 988.7 1,586.0 Short-term borrowings 1,865.1 1,608.1 1,433.4 712.4 1,336.6 Other current liabilities 616.4 570.4 683.1 660.2 557.6 Other current liabilities 329.0 238.5 360.6 376.0 268.3
Non-current liabilities 8,196.3 8,326.8 7,604.7 7,495.4 7,270.2 Non-current liabilities 7,414.5 7,588.1 6,855.5 6,791.5 6,540.5
Trade & other payables 758.6 1,071.6 886.9 894.1 900.6 Trade & other payables 804.2 1,135.7 942.9 945.0 946.3 Long-term borrowings 6,167.3 6,300.8 5,697.7 5,536.3 5,262.2 Long-term borrowings 5,842.2 5,961.0 5,370.6 5,278.5 5,006.7 Other non-cur liabilities 1,270.4 954.4 1,020.0 1,065.0 1,107.5 Other non-cur liabilities 768.1 491.4 542.0 568.0 587.4
Equity 12,667.7 12,794.8 12,783.3 13,054.4 13,287.1 Equity 10,910.9 11,084.5 11,185.2 11,347.9 11,503.2
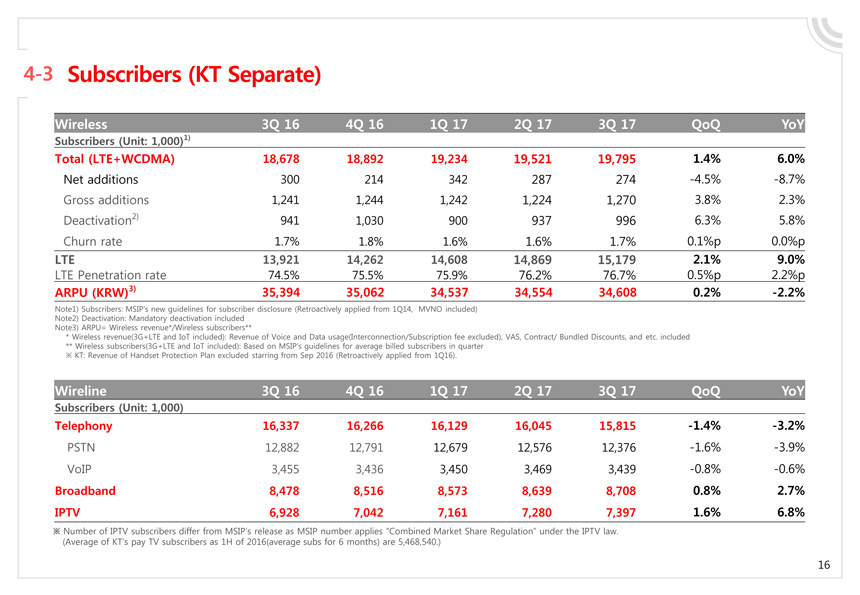 |
4-3 Subscribers (KT Separate)
Wireless 3Q 16 4Q 16 1Q 17 2Q 17 3Q 17 QoQ YoY
Subscribers (Unit: 1,000)1)
Total (LTE+WCDMA) 18,678 18,892 19,234 19,521 19,795 1.4% 6.0%
Net additions 300 214 342 287 274 -4.5% -8.7% Gross additions 1,241 1,244 1,242 1,224 1,270 3.8% 2.3% Deactivation2) 941 1,030 900 937 996 6.3% 5.8% Churn rate 1.7% 1.8% 1.6% 1.6% 1.7% 0.1%p 0.0%p
LTE 13,921 14,262 14,608 14,869 15,179 2.1% 9.0%
LTE Penetration rate 74.5% 75.5% 75.9% 76.2% 76.7% 0.5%p 2.2%p
ARPU (KRW)3) 35,394 35,062 34,537 34,554 34,608 0.2% -2.2%
Note1) Subscribers: MSIP’s new guidelines for subscriber disclosure (Retroactively applied from 1Q14, MVNO included) Note2) Deactivation: Mandatory deactivation included Note3) ARPU= Wireless revenue*/Wireless subscribers**
* Wireless revenue(3G+LTE and IoT included): Revenue of Voice and Data usage(Interconnection/Subscription fee excluded), VAS, Contract/ Bundled Discounts, and etc. included
** Wireless subscribers(3G+LTE and IoT included): Based on MSIP’s guidelines for average billed subscribers in quarter
KT: Revenue of Handset Protection Plan excluded starring from Sep 2016 (Retroactively applied from 1Q16).
Wireline 3Q 16 4Q 16 1Q 17 2Q 17 3Q 17 QoQ YoY
Subscribers (Unit: 1,000)
Telephony 16,337 16,266 16,129 16,045 15,815 -1.4% -3.2%
PSTN 12,882 12,791 12,679 12,576 12,376 -1.6% -3.9% VoIP 3,455 3,436 3,450 3,469 3,439 -0.8% -0.6%
Broadband 8,478 8,516 8,573 8,639 8,708 0.8% 2.7% IPTV 6,928 7,042 7,161 7,280 7,397 1.6% 6.8%
Number of IPTV subscribers differ from MSIP’s release as MSIP number applies “Combined Market Share Regulation” under the IPTV law. (Average of KT’s pay TV subscribers as 1H of 2016(average subs for 6 months) are 5,468,540.)
 |
Thank you KT