SECURITIES AND EXCHANGE COMMISSION
Washington, D.C. 20549
Form6-K
REPORT OF FOREIGN PRIVATE ISSUER
PURSUANT TO RULE13a-16 OR15d-16 OF
THE SECURITIES EXCHANGE ACT OF 1934
For the month of February 2018
Commission File Number1-14926
KT Corporation
(Translation of registrant’s name into English)
90,Buljeong-ro,
Bundang-gu,Seongnam-si,
Gyeonggi-do,
Korea
(Address of principal executive offices)
Indicate by check mark whether the registrant files or will file annual reports under cover of Form20-F or Form40-F:
Form20-F ☒ Form40-F ☐
Indicate by check mark if the registrant is submitting the Form6-K in paper as permitted by RegulationS-T Rule 101(b)(1): ☐
Indicate by check mark if the registrant is submitting the Form6-K in paper as permitted by RegulationS-T Rule 101(b)(7): ☐
Indicate by check mark whether by furnishing the information contained in this Form, the registrant is also thereby furnishing the information to the Commission pursuant to Rule12g3-2(b) under the Securities Exchange Act of 1934.
Yes ☐ No ☒
If “Yes” is marked, indicate below the file number assigned to the registrant in connection with Rule12g3-2(b):82-
SIGNATURES
Pursuant to the requirements of the Securities Exchange Act of 1934, the registrant has duly caused this report to be signed on its behalf by the undersigned, thereunto duly authorized.
| Dated: Feb 6, 2018 | ||
| KT Corporation | ||
| By: | /s/ Seunghoon Chi | |
| Name: | Seunghoon Chi | |
| Title: | Vice President | |
| By: | /s/ Youngkyoon Yun | |
| Name: | Youngkyoon Yun | |
| Title: | Director | |

KT 2017 Earnings Release
Disclaimer This presentation has been prepared by KT Corp.(the Company”). This presentation contains forward-looking statements, which are subject to risks, uncertainties, and assumptions. This presentation is being presented solely for your information and is subject to change without notice. No presentation or warranty, expressed or implied, is made and no reliance should be placed on the accuracy, actuality, fairness, or completeness of the information presented. Please be informed that items included in our operating income have been prepared in accordance withK-IFRS 1001 released on October 17, 2012, which was revised to coincide with the Korean Accounting Standards forNon-Public Entities(“KAS-NPEs”). The Company, its affiliates or representatives accept no liability whatsoever for any losses arising from any information contained in the presentation. This presentation does not constitute an offer or invitation to purchase or subscribe for any shares of the Company, and no part of this presentation shall form the Basis of or be relied upon in connection with any contract or commitment. Any decision to purchase shares of the Company could be made solely on the Basis of information, which has been publicly filed with the Securities and Exchange Commission or the Korea Stock Exchange and distributed to all investors. The contents of this presentation may not be reproduced, redistributed or passed on, directly or indirectly, to any other person or published, in whole or in part, for any purpose. If you have any related questions to this material, please contact IR department. Tel :82-2-3495-3557, 3558, 3564, 5529, 5343, 5344 Fax :82-2-3495-5917 1
Contents 1 Financial Highlights 2 Business Overview 3 Q&A 4 Appendix
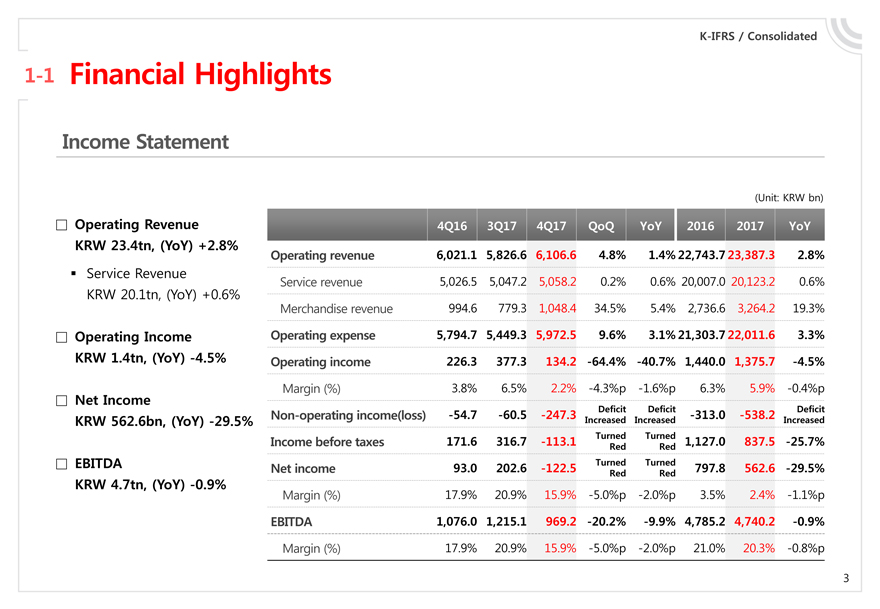
K-IFRS / Consolidated1-1 Financial Highlights Income Statement (Unit: KRW bn) Operating Revenue 4Q16 3Q17 4Q17 QoQ YoY 2016 2017 YoY KRW 23.4tn, (YoY) +2.8% Operating revenue 6,021.1 5,826.6 6,106.6 4.8% 1.4% 22,743.7 23,387.3 2.8% Service Revenue Service revenue 5,026.5 5,047.2 5,058.2 0.2% 0.6% 20,007.0 20,123.2 0.6% KRW 20.1tn, (YoY) +0.6% Merchandise revenue 994.6 779.3 1,048.4 34.5% 5.4% 2,736.6 3,264.2 19.3% Operating Income Operating expense 5,794.7 5,449.3 5,972.5 9.6% 3.1% 21,303.7 22,011.6 3.3% KRW 1.4tn, (YoY)-4.5% Operating income 226.3 377.3 134.2-64.4%-40.7% 1,440.0 1,375.7-4.5% Margin (%) 3.8% 6.5% 2.2%-4.3%p-1.6%p 6.3% 5.9%-0.4%p Net IncomeNon-operating income(loss)-54.7-60.5-247.3 Deficit Deficit-313.0-538.2 Deficit KRW 562.6bn, (YoY)-29.5% Increased Increased Increased Income before taxes 171.6 316.7-113.1 Turned Turned 1,127.0 837.5-25.7% Red Red EBITDA Net income 93.0 202.6-122.5 Turned Red Turned Red 797.8 562.6-29.5% KRW 4.7tn, (YoY)-0.9% Margin (%) 17.9% 20.9% 15.9%-5.0%p-2.0%p 3.5% 2.4%-1.1%p EBITDA 1,076.0 1,215.1 969.2-20.2%-9.9% 4,785.2 4,740.2-0.9% Margin (%) 17.9% 20.9% 15.9%-5.0%p-2.0%p 21.0% 20.3%-0.8%p 3
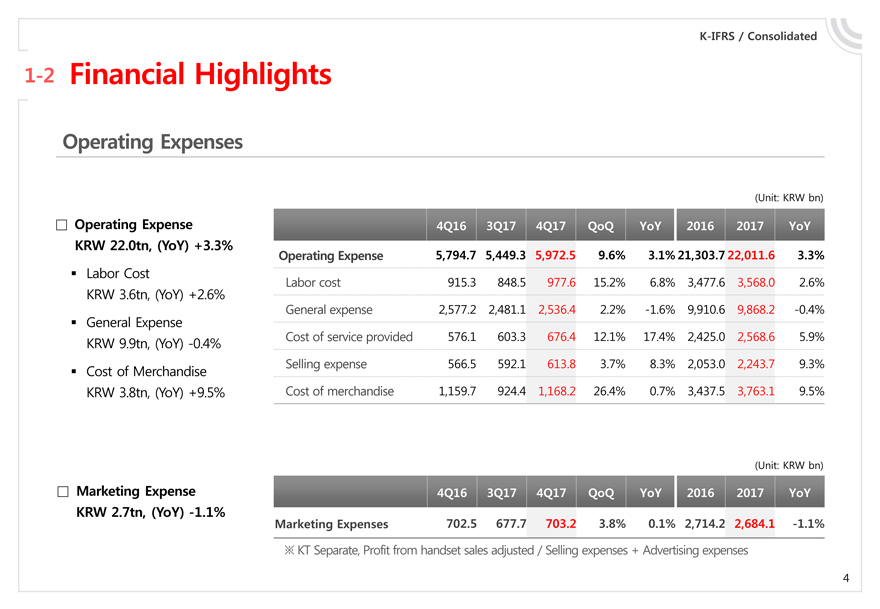
K-IFRS / Consolidated1-2 Financial Highlights Operating Expenses (Unit: KRW bn) Operating Expense 4Q16 3Q17 4Q17 QoQ YoY 2016 2017 YoY KRW 22.0tn, (YoY) +3.3% Operating Expense 5,794.7 5,449.3 5,972.5 9.6% 3.1% 21,303.7 22,011.6 3.3% Labor Cost Labor cost 915.3 848.5 977.6 15.2% 6.8% 3,477.6 3,568.0 2.6% KRW 3.6tn, (YoY) +2.6% General expense 2,577.2 2,481.1 2,536.4 2.2%-1.6% 9,910.6 9,868.2-0.4% General Expense KRW 9.9tn, (YoY)-0.4% Cost of service provided 576.1 603.3 676.4 12.1% 17.4% 2,425.0 2,568.6 5.9% Cost of Merchandise Selling expense 566.5 592.1 613.8 3.7% 8.3% 2,053.0 2,243.7 9.3% KRW 3.8tn, (YoY) +9.5% Cost of merchandise 1,159.7 924.4 1,168.2 26.4% 0.7% 3,437.5 3,763.1 9.5% (Unit: KRW bn) Marketing Expense 4Q16 3Q17 4Q17 QoQ YoY 2016 2017 YoY KRW 2.7tn, (YoY)-1.1% Marketing Expenses 702.5 677.7 703.2 3.8% 0.1% 2,714.2 2,684.1-1.1% KT Separate, Profit from handset sales adjusted / Selling expenses + Advertising expenses 4
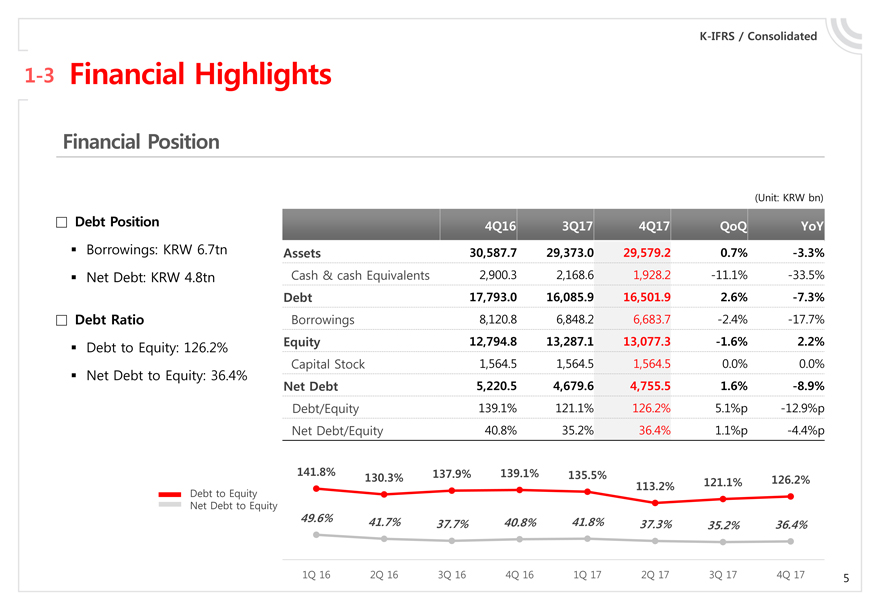
K-IFRS / Consolidated1-3 Financial Highlights Financial Position (Unit: KRW bn) Debt Position 4Q16 3Q17 4Q17 QoQ YoY Borrowings: KRW 6.7tn Assets 30,587.7 29,373.0 29,579.2 0.7%-3.3% Net Debt: KRW 4.8tn Cash & cash Equivalents 2,900.3 2,168.6 1,928.2-11.1%-33.5% Debt 17,793.0 16,085.9 16,501.9 2.6%-7.3% Debt Ratio Borrowings 8,120.8 6,848.2 6,683.7-2.4%-17.7% Debt to Equity: 126.2% Equity 12,794.8 13,287.1 13,077.3-1.6% 2.2% Capital Stock 1,564.5 1,564.5 1,564.5 0.0% 0.0% Net Debt to Equity: 36.4% Net Debt 5,220.5 4,679.6 4,755.5 1.6%-8.9% Debt/Equity 139.1% 121.1% 126.2% 5.1%p-12.9%p Net Debt/Equity 40.8% 35.2% 36.4% 1.1%p-4.4%p 141.8% 130.3% 137.9% 139.1% 135.5% 126.2% Debt to Equity 113.2% 121.1% Net Debt to Equity 49.6% 41.7% 37.7% 40.8% 41.8% 37.3% 35.2% 36.4% 1Q 16 2Q 16 3Q 16 4Q 16 1Q 17 2Q 17 3Q 17 4Q 17 5
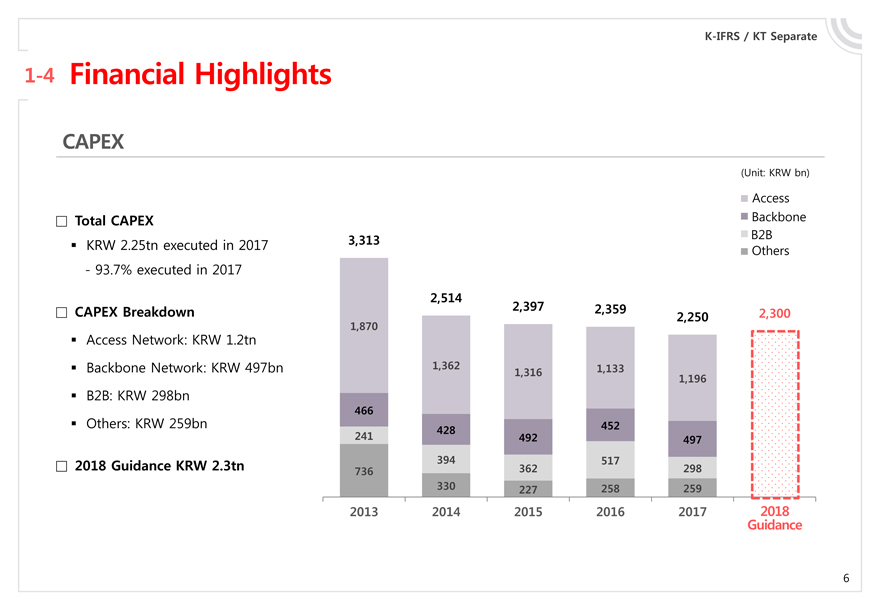
K-IFRS / KT Separate1-4 Financial Highlights CAPEX (Unit: KRW bn) Access Total CAPEX Backbone B2B KRW 2.25tn executed in 2017 3,313 Others —93.7% executed in 2017 2,514 2,397 CAPEX Breakdown 2,359 2,250 2,300 1,870 Access Network: KRW 1.2tn Backbone Network: KRW 497bn 1,362 1,316 1,133 1,196 B2B: KRW 298bn 466 Others: KRW 259bn 428 452 241 492 497 2018 Guidance KRW 2.3tn 736 394 362 517 298 330 227 258 259 2013 2014 2015 2016 2017 2018 Guidance 6
1 Financial Highlights 2 Business Overview 3 Q&A 4 Appendix
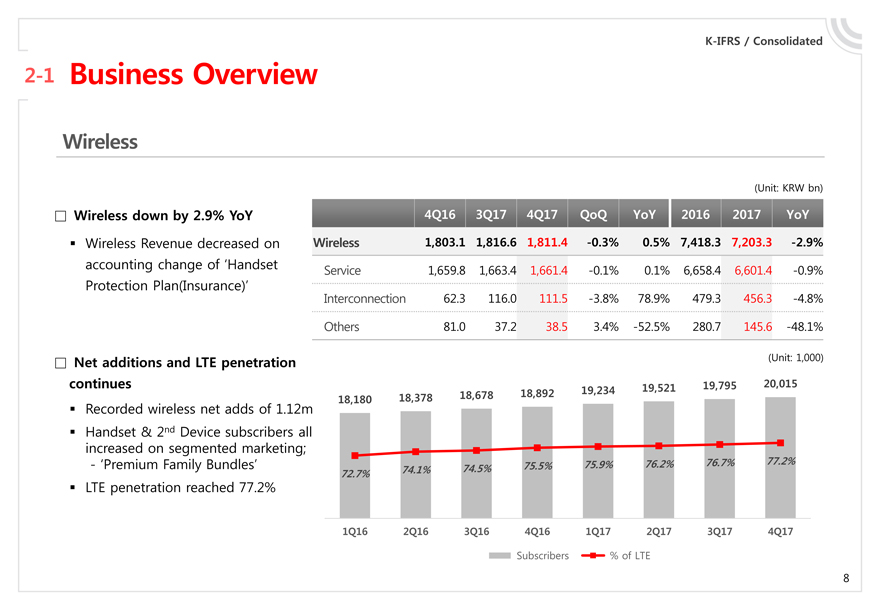
2-1 Business Overview Wireless Wireless down by 2.9% YoY Wireless Revenue decreased on accounting change of ‘Handset Protection Plan(Insurance)’ Net additions and LTE penetration continues Recorded wireless net adds of 1.12m Handset & 2nd Device subscribers all increased on segmented marketing; —‘Premium Family Bundles’ LTE penetration reached 77.2%K-IFRS / Consolidated 4Q16 3Q17 4Q17 QoQ YoY 2016 2017 YoY Wireless 1,803.1 1,816.6 1,811.4-0.3% 0.5% 7,418.3 7,203.3-2.9% Service 1,659.8 1,663.4 1,661.4-0.1% 0.1% 6,658.4 6,601.4-0.9% Interconnection 62.3 116.0 111.5-3.8% 78.9% 479.3 456.3-4.8% Others 81.0 37.2 38.5 3.4%-52.5% 280.7 145.6-48.1% (Unit: 1,000) 18,180 18,378 18,678 18,892 19,234 19,521 19,795 20,015 72.7% 74.1% 74.5% 75.5% 75.9% 76.2% 76.7% 77.2% 1Q16 2Q16 3Q16 4Q16 1Q17 2Q17 3Q17 4Q17 Subscribers % of LTE 8
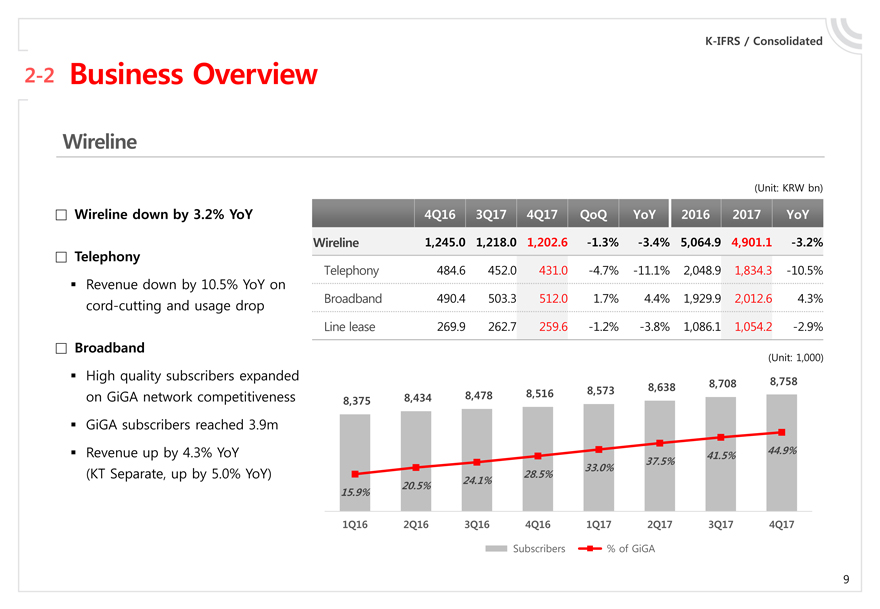
K-IFRS / Consolidated2-2 Business Overview Wireline (Unit: KRW bn) Wireline down by 3.2% YoY 4Q16 3Q17 4Q17 QoQ YoY 2016 2017 YoY Wireline 1,245.0 1,218.0 1,202.6-1.3%-3.4% 5,064.9 4,901.1-3.2% Telephony Telephony 484.6 452.0 431.0-4.7%-11.1% 2,048.9 1,834.3-10.5% Revenue down by 10.5% YoY on cord-cutting and usage drop Broadband 490.4 503.3 512.0 1.7% 4.4% 1,929.9 2,012.6 4.3% Line lease 269.9 262.7 259.6-1.2%-3.8% 1,086.1 1,054.2-2.9% Broadband (Unit: 1,000) High quality subscribers expanded on GiGA network competitiveness 8,375 8,434 8,478 8,516 8,573 8,638 8,708 8,758 GiGA subscribers reached 3.9m Revenue up by 4.3% YoY 41.5% 44.9% (KT Separate, up by 5.0% YoY) 28.5% 33.0% 37.5% 20.5% 24.1% 15.9% 1Q16 2Q16 3Q16 4Q16 1Q17 2Q17 3Q17 4Q17 Subscribers % of GiGA 9
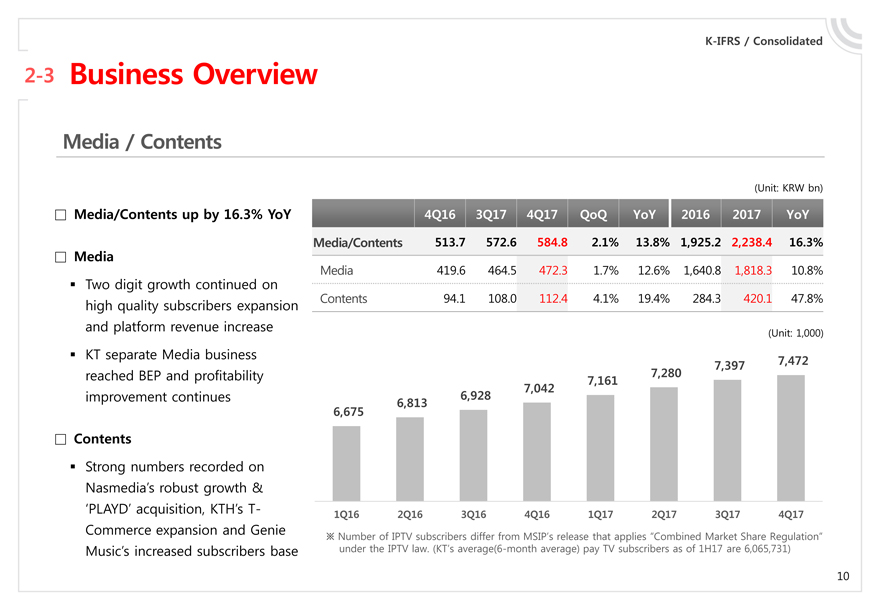
K-IFRS / Consolidated2-3 Business Overview Media / Contents (Unit: KRW bn) Media/Contents up by 16.3% YoY 4Q16 3Q17 4Q17 QoQ YoY 2016 2017 YoY Media/Contents 513.7 572.6 584.8 2.1% 13.8% 1,925.2 2,238.4 16.3% Media Media 419.6 464.5 472.3 1.7% 12.6% 1,640.8 1,818.3 10.8% Two digit growth continued on high quality subscribers expansion Contents 94.1 108.0 112.4 4.1% 19.4% 284.3 420.1 47.8% and platform revenue increase (Unit: 1,000) KT separate Media business reached BEP and profitability 7,280 7,397 7,472 7,161 improvement continues 6,813 6,928 7,042 6,675 Contents Strong numbers recorded on Nasmedia’s robust growth & ‘PLAYD’ acquisition, KTH’sT- 1Q16 2Q16 3Q16 4Q16 1Q17 2Q17 3Q17 4Q17 Commerce expansion and Genie Number of IPTV subscribers differ from MSIP’s release that applies “Combined Market Share Regulation” Music’s increased subscribers base under the IPTV law. (KT’saverage(6-month average) pay TV subscribers as of 1H17 are 6,065,731) 10
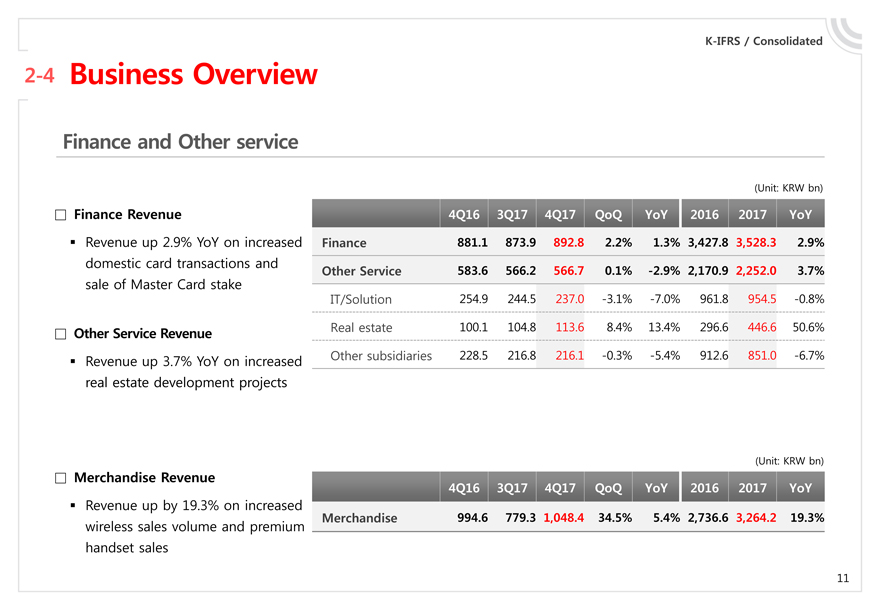
K-IFRS / Consolidated2-4 Business Overview Finance and Other service (Unit: KRW bn) Finance Revenue 4Q16 3Q17 4Q17 QoQ YoY 2016 2017 YoY Revenue up 2.9% YoY on increased Finance 881.1 873.9 892.8 2.2% 1.3% 3,427.8 3,528.3 2.9% domestic card transactions and Other Service 583.6 566.2 566.7 0.1%-2.9% 2,170.9 2,252.0 3.7% sale of Master Card stake IT/Solution 254.9 244.5 237.0-3.1%-7.0% 961.8 954.5-0.8% Other Service Revenue Real estate 100.1 104.8 113.6 8.4% 13.4% 296.6 446.6 50.6% Revenue up 3.7% YoY on increased Other subsidiaries 228.5 216.8 216.1-0.3%-5.4% 912.6 851.0-6.7% real estate development projects (Unit: KRW bn) Merchandise Revenue 4Q16 3Q17 4Q17 QoQ YoY 2016 2017 YoY Revenue up by 19.3% on increased wireless sales volume and premium Merchandise 994.6 779.3 1,048.4 34.5% 5.4% 2,736.6 3,264.2 19.3% handset sales 11
1 Financial Highlights 2 Business Overview 3 Q&A 4 Appendix 12
1 Financial Highlights 2 Business Overview 3 Q&A 4 Appendix 13
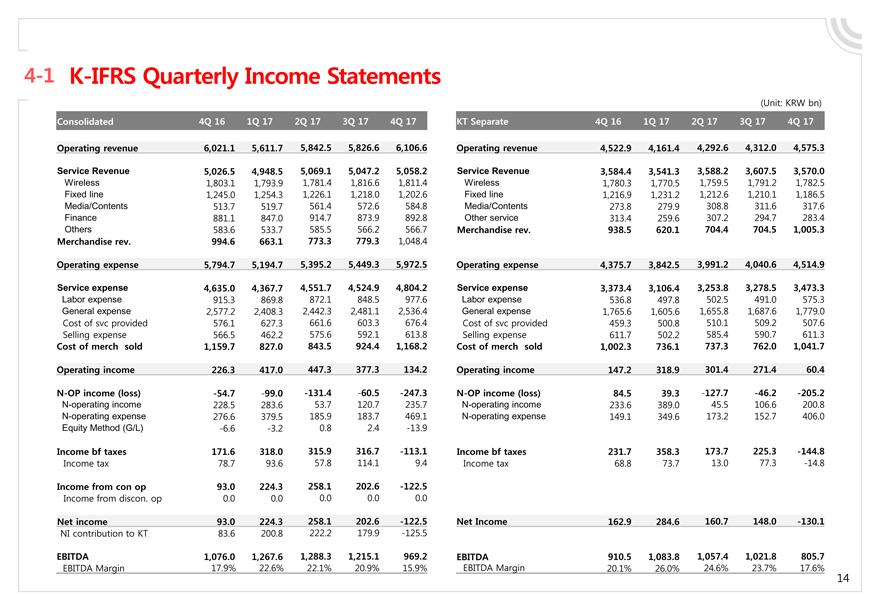
4-1K-IFRS Quarterly Income Statements (Unit: KRW bn) Consolidated 4Q 16 1Q 17 2Q 17 3Q 17 4Q 17 KT Separate 4Q 16 1Q 17 2Q 17 3Q 17 4Q 17 Operating revenue 6,021.1 5,611.7 5,842.5 5,826.6 6,106.6 Operating revenue 4,522.9 4,161.4 4,292.6 4,312.0 4,575.3 Service Revenue 5,026.5 4,948.5 5,069.1 5,047.2 5,058.2 Service Revenue 3,584.4 3,541.3 3,588.2 3,607.5 3,570.0 Wireless 1,803.1 1,793.9 1,781.4 1,816.6 1,811.4 Wireless 1,780.3 1,770.5 1,759.5 1,791.2 1,782.5 Fixed line 1,245.0 1,254.3 1,226.1 1,218.0 1,202.6 Fixed line 1,216.9 1,231.2 1,212.6 1,210.1 1,186.5 Media/Contents 513.7 519.7 561.4 572.6 584.8 Media/Contents 273.8 279.9 308.8 311.6 317.6 Finance 881.1 847.0 914.7 873.9 892.8 Other service 313.4 259.6 307.2 294.7 283.4 Others 583.6 533.7 585.5 566.2 566.7 Merchandise rev. 938.5 620.1 704.4 704.5 1,005.3 Merchandise rev. 994.6 663.1 773.3 779.3 1,048.4 Operating expense 5,794.7 5,194.7 5,395.2 5,449.3 5,972.5 Operating expense 4,375.7 3,842.5 3,991.2 4,040.6 4,514.9 Service expense 4,635.0 4,367.7 4,551.7 4,524.9 4,804.2 Service expense 3,373.4 3,106.4 3,253.8 3,278.5 3,473.3 Labor expense 915.3 869.8 872.1 848.5 977.6 Labor expense 536.8 497.8 502.5 491.0 575.3 General expense 2,577.2 2,408.3 2,442.3 2,481.1 2,536.4 General expense 1,765.6 1,605.6 1,655.8 1,687.6 1,779.0 Cost of svc provided 576.1 627.3 661.6 603.3 676.4 Cost of svc provided 459.3 500.8 510.1 509.2 507.6 Selling expense 566.5 462.2 575.6 592.1 613.8 Selling expense 611.7 502.2 585.4 590.7 611.3 Cost of merch sold 1,159.7 827.0 843.5 924.4 1,168.2 Cost of merch sold 1,002.3 736.1 737.3 762.0 1,041.7 Operating income 226.3 417.0 447.3 377.3 134.2 Operating income 147.2 318.9 301.4 271.4 60.4N-OP income (loss)-54.7-99.0-131.4-60.5-247.3N-OP income (loss) 84.5 39.3-127.7-46.2-205.2N-operating income 228.5 283.6 53.7 120.7 235.7N-operating income 233.6 389.0 45.5 106.6 200.8N-operating expense 276.6 379.5 185.9 183.7 469.1N-operating expense 149.1 349.6 173.2 152.7 406.0 Equity Method (G/L)-6.6-3.2 0.8 2.4-13.9 Income bf taxes 171.6 318.0 315.9 316.7-113.1 Income bf taxes 231.7 358.3 173.7 225.3-144.8 Income tax 78.7 93.6 57.8 114.1 9.4 Income tax 68.8 73.7 13.0 77.3-14.8 Income from con op 93.0 224.3 258.1 202.6-122.5 Income from discon. op 0.0 0.0 0.0 0.0 0.0 Net income 93.0 224.3 258.1 202.6-122.5 Net Income 162.9 284.6 160.7 148.0-130.1 NI contribution to KT 83.6 200.8 222.2 179.9-125.5 EBITDA 1,076.0 1,267.6 1,288.3 1,215.1 969.2 EBITDA 910.5 1,083.8 1,057.4 1,021.8 805.7 EBITDA Margin 17.9% 22.6% 22.1% 20.9% 15.9% EBITDA Margin 20.1% 26.0% 24.6% 23.7% 17.6% 14
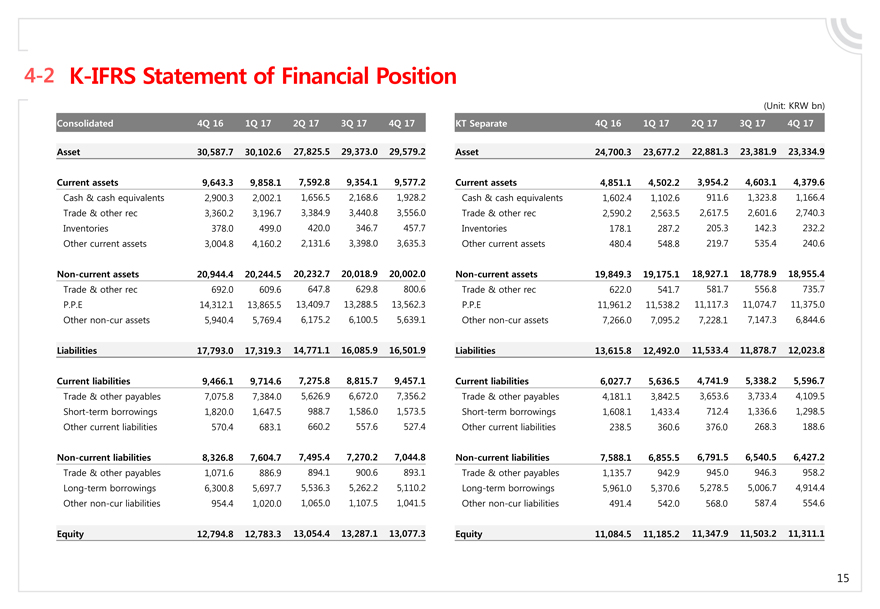
4-2K-IFRS Statement of Financial Position (Unit: KRW bn) Consolidated 4Q 16 1Q 17 2Q 17 3Q 17 4Q 17 KT Separate 4Q 16 1Q 17 2Q 17 3Q 17 4Q 17 Asset 30,587.7 30,102.6 27,825.5 29,373.0 29,579.2 Asset 24,700.3 23,677.2 22,881.3 23,381.9 23,334.9 Current assets 9,643.3 9,858.1 7,592.8 9,354.1 9,577.2 Current assets 4,851.1 4,502.2 3,954.2 4,603.1 4,379.6 Cash & cash equivalents 2,900.3 2,002.1 1,656.5 2,168.6 1,928.2 Cash & cash equivalents 1,602.4 1,102.6 911.6 1,323.8 1,166.4 Trade & other rec 3,360.2 3,196.7 3,384.9 3,440.8 3,556.0 Trade & other rec 2,590.2 2,563.5 2,617.5 2,601.6 2,740.3 Inventories 378.0 499.0 420.0 346.7 457.7 Inventories 178.1 287.2 205.3 142.3 232.2 Other current assets 3,004.8 4,160.2 2,131.6 3,398.0 3,635.3 Other current assets 480.4 548.8 219.7 535.4 240.6Non-current assets 20,944.4 20,244.5 20,232.7 20,018.9 20,002.0Non-current assets 19,849.3 19,175.1 18,927.1 18,778.9 18,955.4 Trade & other rec 692.0 609.6 647.8 629.8 800.6 Trade & other rec 622.0 541.7 581.7 556.8 735.7 P.P.E 14,312.1 13,865.5 13,409.7 13,288.5 13,562.3 P.P.E 11,961.2 11,538.2 11,117.3 11,074.7 11,375.0 Othernon-cur assets 5,940.4 5,769.4 6,175.2 6,100.5 5,639.1 Othernon-cur assets 7,266.0 7,095.2 7,228.1 7,147.3 6,844.6 Liabilities 17,793.0 17,319.3 14,771.1 16,085.9 16,501.9 Liabilities 13,615.8 12,492.0 11,533.4 11,878.7 12,023.8 Current liabilities 9,466.1 9,714.6 7,275.8 8,815.7 9,457.1 Current liabilities 6,027.7 5,636.5 4,741.9 5,338.2 5,596.7 Trade & other payables 7,075.8 7,384.0 5,626.9 6,672.0 7,356.2 Trade & other payables 4,181.1 3,842.5 3,653.6 3,733.4 4,109.5 Short-term borrowings 1,820.0 1,647.5 988.7 1,586.0 1,573.5 Short-term borrowings 1,608.1 1,433.4 712.4 1,336.6 1,298.5 Other current liabilities 570.4 683.1 660.2 557.6 527.4 Other current liabilities 238.5 360.6 376.0 268.3 188.6Non-current liabilities 8,326.8 7,604.7 7,495.4 7,270.2 7,044.8Non-current liabilities 7,588.1 6,855.5 6,791.5 6,540.5 6,427.2 Trade & other payables 1,071.6 886.9 894.1 900.6 893.1 Trade & other payables 1,135.7 942.9 945.0 946.3 958.2 Long-term borrowings 6,300.8 5,697.7 5,536.3 5,262.2 5,110.2 Long-term borrowings 5,961.0 5,370.6 5,278.5 5,006.7 4,914.4 Othernon-cur liabilities 954.4 1,020.0 1,065.0 1,107.5 1,041.5 Othernon-cur liabilities 491.4 542.0 568.0 587.4 554.6 Equity 12,794.8 12,783.3 13,054.4 13,287.1 13,077.3 Equity 11,084.5 11,185.2 11,347.9 11,503.2 11,311.1 15
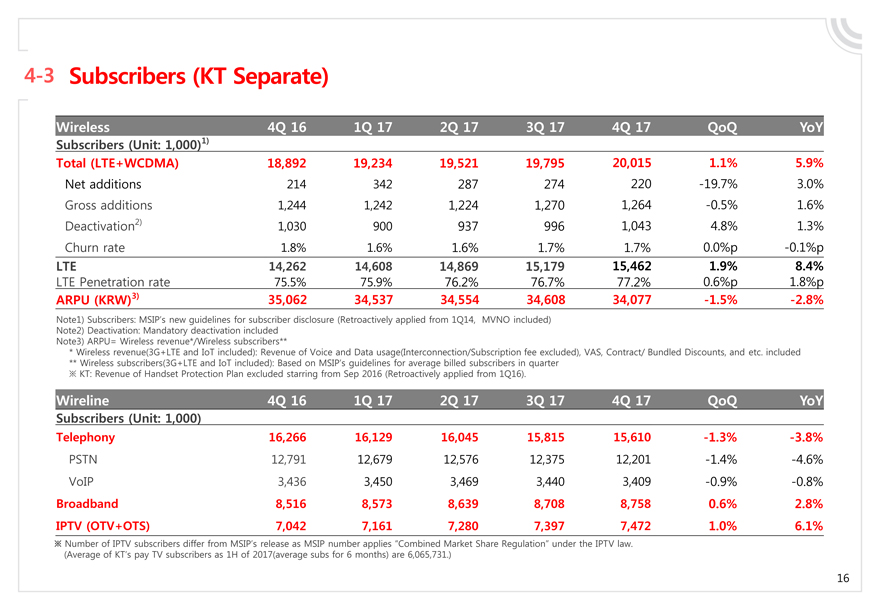
4-3 Subscribers (KT Separate) Wireless 4Q 16 1Q 17 2Q 17 3Q 17 4Q 17 QoQ YoY Subscribers (Unit: 1,000)1) Total (LTE+WCDMA) 18,892 19,234 19,521 19,795 20,015 1.1% 5.9% Net additions 214 342 287 274 220-19.7% 3.0% Gross additions 1,244 1,242 1,224 1,270 1,264-0.5% 1.6% Deactivation2) 1,030 900 937 996 1,043 4.8% 1.3% Churn rate 1.8% 1.6% 1.6% 1.7% 1.7% 0.0%p-0.1%p LTE 14,262 14,608 14,869 15,179 15,462 1.9% 8.4% LTE Penetration rate 75.5% 75.9% 76.2% 76.7% 77.2% 0.6%p 1.8%p ARPU (KRW)3) 35,062 34,537 34,554 34,608 34,077-1.5%-2.8% Note1) Subscribers: MSIP’s new guidelines for subscriber disclosure (Retroactively applied from 1Q14, MVNO included) Note2) Deactivation: Mandatory deactivation included Note3) ARPU= Wireless revenue*/Wireless subscribers** * Wireless revenue(3G+LTE and IoT included): Revenue of Voice and Data usage(Interconnection/Subscription fee excluded), VAS, Contract/ Bundled Discounts, and etc. included ** Wireless subscribers(3G+LTE and IoT included): Based on MSIP’s guidelines for average billed subscribers in quarter KT: Revenue of Handset Protection Plan excluded starring from Sep 2016 (Retroactively applied from 1Q16). Wireline 4Q 16 1Q 17 2Q 17 3Q 17 4Q 17 QoQ YoY Subscribers (Unit: 1,000) Telephony 16,266 16,129 16,045 15,815 15,610-1.3%-3.8% PSTN 12,791 12,679 12,576 12,375 12,201-1.4%-4.6% VoIP 3,436 3,450 3,469 3,440 3,409-0.9%-0.8% Broadband 8,516 8,573 8,639 8,708 8,758 0.6% 2.8% IPTV (OTV+OTS) 7,042 7,161 7,280 7,397 7,472 1.0% 6.1% Number of IPTV subscribers differ from MSIP’s release as MSIP number applies “Combined Market Share Regulation” under the IPTV law. (Average of KT’s pay TV subscribers as 1H of 2017(average subs for 6 months) are 6,065,731.) 16

Thank you kt