Note 1 — Organization
SunAmerica Series Trust (the “Trust”), a Massachusetts business trust, is registered with the Securities and Exchange Commission (the “SEC”) under the Investment Company Act of 1940, as amended (the “1940 Act”) as an open-end management investment company. The Trust is currently comprised of 61 portfolios (each, a “Portfolio,” and collectively, the “Portfolios”), 3 of which are included in this report. The SunAmerica Asset Management, LLC (“SAAMCo” or the “Adviser”), an indirect wholly owned subsidiary of Corebridge Financial, Inc. (“Corebridge”), serves as investment adviser for all the Portfolios of the Trust. For purposes of the Investment Advisers Act and the Investment Company Act, American International Group, Inc.’s (“AIG”) share ownership of Corebridge, the publicly-traded parent company of SAAMCo, and the rights granted to AIG by Corebridge as part of a separation agreement between AIG and Corebridge, provide AIG with control over Corebridge’s corporate and business activities.
Shares of the Portfolios are issued and redeemed in connection with investments in and payments under variable annuity contracts and variable life policies (collectively, the “Variable Contracts”) offered by life insurance companies affiliated with the Adviser and Nassau Life Insurance Company, an unaffiliated life insurance company (the “Life Companies”), and are also offered to certain affiliated mutual funds. All shares may be purchased or redeemed at net asset value without any sales or redemption charges.
Class 1 shares, Class 2 shares and Class 3 shares of each Portfolio may be offered in connection with certain variable contracts. Class 2 and 3 shares of a given Portfolio are identical in all respects to Class 1 shares of the same Portfolio, except that (i) each class may bear differing amounts of certain class-specific expenses; (ii) Class 2 shares and Class 3 shares are subject to service fees while Class 1 shares are not; and (iii) Class 2 shares and Class 3 shares have voting rights on matters that pertain to the Rule 12b-1 plan adopted with respect to Class 2 shares and Class 3 shares. Class 2 and Class 3 shares of each Portfolio pay service fees at an annual rate of 0.15% and 0.25%, respectively, of each class’s average daily net assets. The Board of Trustees may establish additional portfolios or classes in the future.
Each Portfolio is diversified as defined by the 1940 Act.
The investment goal for each Portfolio is as follows:
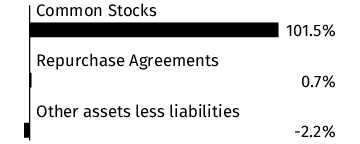
The SA Wellington Capital Appreciation Portfolio seeks long-term capital appreciation. Its strategy is to invest in growth equity securities across a wide range of industries and companies, using a wide-ranging and flexible stock selection approach.
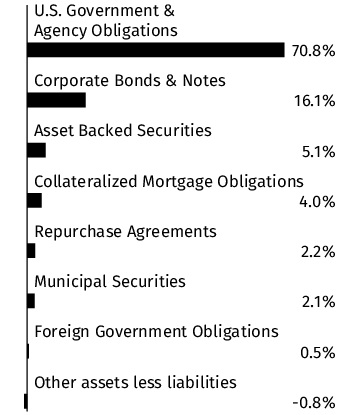
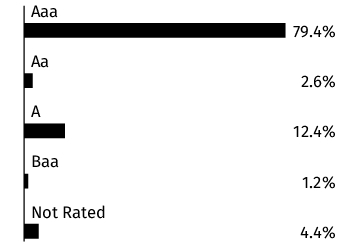
The SA Wellington Government and Quality Bond Portfolio seeks relatively high current income, liquidity and security of principal. Its strategy is to invest, under normal circumstances, at least 80% of net assets in obligations issued, guaranteed or insured by the U.S. Government, its agencies or instrumentalities and in high quality corporate fixed income securities (rated AA– or better by S&P Global (Ratings) or Aa3 or better by Moody’s Investor Services, Inc. or its equivalent by any other nationally recognized statistical rating organization).
The SA Wellington Strategic Multi-Asset Portfolio seeks high long-term total investment return. Its strategy is to invest the Portfolio’s assets among global equity and global fixed income securities to achieve total investment return.
Indemnifications: The Trust's organizational documents provide current and former officers and trustees with a limited indemnification against liabilities arising out of the performance of their duties to the Trust. In addition, pursuant to Indemnification Agreements between the Trust and each of the current (and certain former) trustees who is not an “interested person,” as defined in Section 2(a)(19) of the 1940 Act, of the Trust (collectively, the “Disinterested Trustees”), the Trust provides the Disinterested Trustees with a limited indemnification against liabilities arising out of the performance of their duties to the Trust, whether such liabilities are asserted during or after their service as trustees. In addition, in the normal course of business the Trust enters into contracts that contain the obligation to indemnify others. The Trust's maximum exposure under these arrangements is unknown. Currently, however, the Trust expects the risk of loss to be remote.
Note 2 — Significant Accounting Policies
The preparation of financial statements in accordance with U.S. generally accepted accounting principles (“GAAP”) requires management to make estimates and assumptions that affect the reported amounts and disclosures in the financial statements. Actual results could differ from those estimates and those differences could be significant. The Portfolios are considered investment companies under U.S. GAAP and follow the accounting and reporting guidance applicable to investment companies. The following is a summary of significant accounting policies consistently followed by the Trust, in the preparation of its financial statements:
Security Valuation: In accordance with the authoritative guidance on fair value measurements and disclosures under GAAP, the Portfolios disclose the fair value of their investments in a hierarchy that prioritizes the inputs to valuation techniques used to measure the fair value. In accordance with GAAP, fair value is defined as the price that the Portfolios would receive upon selling an asset or transferring a liability in a timely transaction to an independent third party in the principal or most advantageous market. GAAP establishes a three-tier hierarchy to provide more transparency around the inputs used to measure fair value and to establish classification of fair value measurements for disclosure purposes. Inputs refer broadly to the assumptions that market participants would use in pricing the asset or liability, including assumptions about risk. Inputs may be observable or unobservable. Observable inputs are inputs that reflect the assumptions market participants would use in pricing the asset or liability developed based on market data obtained from sources independent of the reporting entity. Unobservable inputs are inputs that reflect the reporting entity’s own assumptions about the assumptions market participants would use in pricing the asset or liability developed based on the best information available in the circumstances. The three-tiers are as follows:
Level 1 — Unadjusted quoted prices in active markets for identical securities
Level 2 — Other significant observable inputs (including quoted prices for similar securities, interest rates, prepayment speeds, credit risk, referenced indices, quoted prices in inactive markets, adjusted quoted prices in active markets, adjusted quoted prices on foreign equity securities that were adjusted in accordance with pricing procedures adopted by the Board of Trustees (the “Board”), etc.)
Level 3 — Significant unobservable inputs (includes inputs that reflect the Portfolios’ own assumptions about the assumptions market participants would use in pricing the security, developed based on the best information available under the circumstances)